Structural Health Monitoring of Walking Dragline Excavator ...
15
applied sciences Article Structural Health Monitoring of Walking Dragline Excavator Using Acoustic Emission Vera Barat 1,2 , Artem Marchenkov 1, * , Dmitry Kritskiy 3 , Vladimir Bardakov 1,2 , Marina Karpova 1 , Mikhail Kuznetsov 1 , Anastasia Zaprudnova 1 , Sergey Ushanov 1,2 and Sergey Elizarov 2 Citation: Barat, V.; Marchenkov, A.; Kritskiy, D.; Bardakov, V.; Karpova, M.; Kuznetsov, M.; Zaprudnova, A.; Ushanov, S.; Elizarov, S. Structural Health Monitoring of Walking Dragline Excavator Using Acoustic Emission. Appl. Sci. 2021, 11, 3420. https://doi.org/10.3390/app11083420 Academic Editor: Giuseppe Lacidogna Received: 10 March 2021 Accepted: 7 April 2021 Published: 11 April 2021 Publisher’s Note: MDPI stays neutral with regard to jurisdictional claims in published maps and institutional affil- iations. Copyright: © 2021 by the authors. Licensee MDPI, Basel, Switzerland. This article is an open access article distributed under the terms and conditions of the Creative Commons Attribution (CC BY) license (https:// creativecommons.org/licenses/by/ 4.0/). 1 Moscow Power Engineering Institute, 14, Krasnokazarmennaya Str., 111250 Moscow, Russia; [email protected] (V.B.); [email protected] (V.B.); [email protected] (M.K.); [email protected] (M.K.); [email protected] (A.Z.); [email protected] (S.U.) 2 LLC “Interunis-IT”, 20b, Entuziastov Sh., 111024 Moscow, Russia; [email protected] 3 JSC “SUEK”: 20b, Lenin Str., 660049 Krasnoyarsk, Russia; [email protected] * Correspondence: [email protected] Abstract: The article is devoted to the organization of the structural health monitoring of a walking dragline excavator using the acoustic emission (AE) method. Since the dragline excavator under study is a large and noisy industrial facility, preliminary prospecting researches were carried out to conduct effective control by the AE method, including the study of AE sources, AE waveguide, and noise parameters analysis. In addition, AE filtering methods were improved. It is shown that application of the developed filtering algorithms allows to detect AE impulses from cracks and defects against a background noise exceeding the useful signal in amplitude and intensity. Using the proposed solutions in the monitoring of a real dragline excavator during its operation made it possible to identify a crack in one of its elements (weld joint in a dragline back leg). Keywords: acoustic emission; structure health monitoring; walking excavator; AE impulse detection 1. Introduction The dragline excavator is a widely known type of heavy equipment used in civil engineering and surface mining industry. Commonly, a system of a dragline consists of a large bucket that is suspended from a boom with wire ropes (Figure 1). The hoist rope is usually driven by diesel or electric motors. Its main function is to support the dragline bucket and hoist-coupler assembly from the boom. The dragrope is generally applied to move the bucket horizontally. Unlike conventional types of excavators, dragline digs by dragging the bucket only in one direction—towards the excavator [1]. Currently, most dragline systems are operated in the open pit mining industry to process blasted rocks located both above and below the horizon level of the dragline excavator. Moreover, draglines have large dimensions—the boom length may reach 90 m, the total height can constitute up to 100 m, and the bucket capacity may achieve 20 tons. Nowadays, the design of draglines is favorable due to a short working cycle and high performance. Currently, more than 500 walking dragline excavators are in operation in the world, of which more than 200 are in Russia. Leading dragline manufacturers are Caterpillar, Liebherr, Uralmash, Bucyrus, and others. Draglines operate all year-round in detrimental weather conditions: significant tem- perature fluctuations, great levels of humidity, and even regions with increased seismic activity. Both the influence of external weather conditions and constant cyclic loadings can lead to the formation of fatigue fracture-initiating defects in the metal elements of the dragline structure. Such defects can reduce the operation life of the equipment due to premature destruction. The breakdown basically causes considerable financial costs associated with equipment downtime, repair costs, and terrible accidents [2]. The most common type of dragline excavator damage is cracks in the back legs; for the period from Appl. Sci. 2021, 11, 3420. https://doi.org/10.3390/app11083420 https://www.mdpi.com/journal/applsci
-
Upload
khangminh22 -
Category
Documents
-
view
1 -
download
0
Transcript of Structural Health Monitoring of Walking Dragline Excavator ...

applied sciences
Article
Structural Health Monitoring of Walking Dragline ExcavatorUsing Acoustic Emission
Vera Barat 1,2, Artem Marchenkov 1,* , Dmitry Kritskiy 3, Vladimir Bardakov 1,2, Marina Karpova 1,Mikhail Kuznetsov 1, Anastasia Zaprudnova 1, Sergey Ushanov 1,2 and Sergey Elizarov 2
�����������������
Citation: Barat, V.; Marchenkov, A.;
Kritskiy, D.; Bardakov, V.; Karpova,
M.; Kuznetsov, M.; Zaprudnova, A.;
Ushanov, S.; Elizarov, S. Structural
Health Monitoring of Walking
Dragline Excavator Using Acoustic
Emission. Appl. Sci. 2021, 11, 3420.
https://doi.org/10.3390/app11083420
Academic Editor:
Giuseppe Lacidogna
Received: 10 March 2021
Accepted: 7 April 2021
Published: 11 April 2021
Publisher’s Note: MDPI stays neutral
with regard to jurisdictional claims in
published maps and institutional affil-
iations.
Copyright: © 2021 by the authors.
Licensee MDPI, Basel, Switzerland.
This article is an open access article
distributed under the terms and
conditions of the Creative Commons
Attribution (CC BY) license (https://
creativecommons.org/licenses/by/
4.0/).
1 Moscow Power Engineering Institute, 14, Krasnokazarmennaya Str., 111250 Moscow, Russia;[email protected] (V.B.); [email protected] (V.B.); [email protected] (M.K.);[email protected] (M.K.); [email protected] (A.Z.); [email protected] (S.U.)
2 LLC “Interunis-IT”, 20b, Entuziastov Sh., 111024 Moscow, Russia; [email protected] JSC “SUEK”: 20b, Lenin Str., 660049 Krasnoyarsk, Russia; [email protected]* Correspondence: [email protected]
Abstract: The article is devoted to the organization of the structural health monitoring of a walkingdragline excavator using the acoustic emission (AE) method. Since the dragline excavator understudy is a large and noisy industrial facility, preliminary prospecting researches were carried outto conduct effective control by the AE method, including the study of AE sources, AE waveguide,and noise parameters analysis. In addition, AE filtering methods were improved. It is shown thatapplication of the developed filtering algorithms allows to detect AE impulses from cracks anddefects against a background noise exceeding the useful signal in amplitude and intensity. Usingthe proposed solutions in the monitoring of a real dragline excavator during its operation made itpossible to identify a crack in one of its elements (weld joint in a dragline back leg).
Keywords: acoustic emission; structure health monitoring; walking excavator; AE impulse detection
1. Introduction
The dragline excavator is a widely known type of heavy equipment used in civilengineering and surface mining industry. Commonly, a system of a dragline consists ofa large bucket that is suspended from a boom with wire ropes (Figure 1). The hoist ropeis usually driven by diesel or electric motors. Its main function is to support the draglinebucket and hoist-coupler assembly from the boom. The dragrope is generally applied tomove the bucket horizontally. Unlike conventional types of excavators, dragline digs bydragging the bucket only in one direction—towards the excavator [1].
Currently, most dragline systems are operated in the open pit mining industry toprocess blasted rocks located both above and below the horizon level of the draglineexcavator. Moreover, draglines have large dimensions—the boom length may reach90 m, the total height can constitute up to 100 m, and the bucket capacity may achieve20 tons. Nowadays, the design of draglines is favorable due to a short working cycle andhigh performance. Currently, more than 500 walking dragline excavators are in operationin the world, of which more than 200 are in Russia. Leading dragline manufacturers areCaterpillar, Liebherr, Uralmash, Bucyrus, and others.
Draglines operate all year-round in detrimental weather conditions: significant tem-perature fluctuations, great levels of humidity, and even regions with increased seismicactivity. Both the influence of external weather conditions and constant cyclic loadingscan lead to the formation of fatigue fracture-initiating defects in the metal elements ofthe dragline structure. Such defects can reduce the operation life of the equipment dueto premature destruction. The breakdown basically causes considerable financial costsassociated with equipment downtime, repair costs, and terrible accidents [2]. The mostcommon type of dragline excavator damage is cracks in the back legs; for the period from
Appl. Sci. 2021, 11, 3420. https://doi.org/10.3390/app11083420 https://www.mdpi.com/journal/applsci

Appl. Sci. 2021, 11, 3420 2 of 15
2015 to 2020, 15 accidents caused by breakage of back legs and five accidents caused bybreakage of the dragline boom were registered in Russia.
Appl. Sci. 2021, 11, x FOR PEER REVIEW 2 of 15
premature destruction. The breakdown basically causes considerable financial costs asso-ciated with equipment downtime, repair costs, and terrible accidents [2]. The most com-mon type of dragline excavator damage is cracks in the back legs; for the period from 2015 to 2020, 15 accidents caused by breakage of back legs and five accidents caused by break-age of the dragline boom were registered in Russia.
The most widely spread non-destructive testing (NDT) of dragline structural compo-nents is ultrasonic testing, which is carried out in the welded joints of an excavator twice a year. However, this method does not allow detect abrupt changes in the stress–strain state. Furthermore, it is extremely time-consuming and leads to long-lasting downtime. Draglines are commonly equipped with a structural health monitoring system with video supervision systems and an electrical equipment diagnostics system, but operational monitoring of the metal structures conditions is usually not performed.
Figure 1. Basic components of a dragline ESH-20.90: 1—back legs, 2—boom, 3—hoist rope, 4—mast, 5—bucket, 6—dragrope.
In this paper, the possibility of using the acoustic emission (AE) method to detect defects in the dragline metal structures is discussed.
AE is a non-destructive testing (NDT) method based on the physical phenomenon of elastic waves emission when a material undergoes irreversible changes in its internal structure, for example, because of crack formation. The AE method has a high sensitivity to crack detection and is used to detect cracks at early stages of their growth. An important advantage of the AE method is the ability to detect defects located at a great distance from the control point; cracks and other defects emit AE waves, which propagate over the test-ing structure and can be detected by the AE sensors at about 10 m from the defect. The AE method is passive, it does not require probing action, which allows it to be effectively used in structural health monitoring systems for monitoring loaded structures in the operating mode without decommissioning.
AE testing provides low noise immunity, therefore, such experiments are tradition-ally carried out for equipment when the operation of equipment is suspended. Recently, the technology of AE monitoring which requires the use of specific methods for detecting AE signals against a noise background has become more popular [3–5]. AE monitoring is performed for both statically and dynamically loaded equipment. Most widespread ap-plication of AE testing in the operating mode is testing of bearings, compressors, and pumps [6–8]. The various defects have a specific AE signature with a certain periodicity connected with a rotation frequency. The periodicity analysis allows to recognize the AE activity against the noise process. Some of the most complicated structures for AE struc-tural health monitoring are railways and roads bridges [9,10]. The complicity consists of the fact that trains and cars are oftentimes a noise source and a load excitation, and the
Figure 1. Basic components of a dragline ESH-20.90: 1—back legs, 2—boom, 3—hoist rope, 4—mast, 5—bucket, 6—dragrope.
The most widely spread non-destructive testing (NDT) of dragline structural compo-nents is ultrasonic testing, which is carried out in the welded joints of an excavator twicea year. However, this method does not allow detect abrupt changes in the stress–strainstate. Furthermore, it is extremely time-consuming and leads to long-lasting downtime.Draglines are commonly equipped with a structural health monitoring system with videosupervision systems and an electrical equipment diagnostics system, but operational moni-toring of the metal structures conditions is usually not performed.
In this paper, the possibility of using the acoustic emission (AE) method to detectdefects in the dragline metal structures is discussed.
AE is a non-destructive testing (NDT) method based on the physical phenomenonof elastic waves emission when a material undergoes irreversible changes in its internalstructure, for example, because of crack formation. The AE method has a high sensitivityto crack detection and is used to detect cracks at early stages of their growth. An importantadvantage of the AE method is the ability to detect defects located at a great distance fromthe control point; cracks and other defects emit AE waves, which propagate over the testingstructure and can be detected by the AE sensors at about 10 m from the defect. The AEmethod is passive, it does not require probing action, which allows it to be effectively usedin structural health monitoring systems for monitoring loaded structures in the operatingmode without decommissioning.
AE testing provides low noise immunity, therefore, such experiments are traditionallycarried out for equipment when the operation of equipment is suspended. Recently, thetechnology of AE monitoring which requires the use of specific methods for detectingAE signals against a noise background has become more popular [3–5]. AE monitoringis performed for both statically and dynamically loaded equipment. Most widespreadapplication of AE testing in the operating mode is testing of bearings, compressors, andpumps [6–8]. The various defects have a specific AE signature with a certain periodicityconnected with a rotation frequency. The periodicity analysis allows to recognize the AEactivity against the noise process. Some of the most complicated structures for AE structuralhealth monitoring are railways and roads bridges [9,10]. The complicity consists of the factthat trains and cars are oftentimes a noise source and a load excitation, and the moment ofpassage of vehicles is simultaneously the moment of the most probable occurrence of AEactivity. Solving of this problem is achieved by reducing the distance between AE sensors,

Appl. Sci. 2021, 11, 3420 3 of 15
high-frequency filtration, and using additional strain gauges or vibration measurements.Another way to detect the AE activity of a defect during the testing of the noisy structureis to design a scaled model of the testing structure. This method is successfully usedfor the AE testing of the various chemical reactors, absorbers, and crystallizers [11,12].Investigation of the scaled model of the test structure allows obtaining a pattern of acousticnoise, in this case the appearance of a defect can be detected as a change of regularity inthe parameters of the reference noise signal. If it is impossible to design a model, the studyof noise is carried out on the operating equipment. There are some papers devoted tothe AE testing of handling equipment: cranes, lifts, and excavators [13–17]. However, asa rule, the testing of handling equipment involves a special low-speed loading programwhich provides a low noisy level. AE testing of a walking dragline excavator is a ratherdifficult problem, since it involves the testing of a large-sized structure in difficult weatherconditions and at an extremely high noise level.
This paper describes a method of design of a walking dragline excavator monitoringsystem based on the application of the AE method. A simplified block diagram of themonitoring system is shown in Figure 2. It consists of hardware part and software parts,the software parts in turn are divided into acquisition system and data analysis system.
Appl. Sci. 2021, 11, x FOR PEER REVIEW 3 of 15
moment of passage of vehicles is simultaneously the moment of the most probable occur-rence of AE activity. Solving of this problem is achieved by reducing the distance between AE sensors, high-frequency filtration, and using additional strain gauges or vibration measurements. Another way to detect the AE activity of a defect during the testing of the noisy structure is to design a scaled model of the testing structure. This method is success-fully used for the AE testing of the various chemical reactors, absorbers, and crystallizers [11,12]. Investigation of the scaled model of the test structure allows obtaining a pattern of acoustic noise, in this case the appearance of a defect can be detected as a change of regularity in the parameters of the reference noise signal. If it is impossible to design a model, the study of noise is carried out on the operating equipment. There are some pa-pers devoted to the AE testing of handling equipment: cranes, lifts, and excavators [13–17]. However, as a rule, the testing of handling equipment involves a special low-speed loading program which provides a low noisy level. AE testing of a walking dragline ex-cavator is a rather difficult problem, since it involves the testing of a large-sized structure in difficult weather conditions and at an extremely high noise level.
This paper describes a method of design of a walking dragline excavator monitoring system based on the application of the AE method. A simplified block diagram of the monitoring system is shown in Figure 2. It consists of hardware part and software parts, the software parts in turn are divided into acquisition system and data analysis system.
Figure 2. Block diagram of the structure health monitoring system.
The hardware equipment is represented by a digital measuring system A-Line 32D DDM (produced by Interunis-IT company). Its main feature consists of subsequential con-nection of the measuring channels. A data acquisition system provides the traditional AE impulse threshold detection, calculation of AE parameters, and location of AE sources based on the determination of the difference in the time of arrival of AE impulses to neigh-boring sensors. The data analysis algorithm provides intelligent processing of AE data for detection of the defects against the background of high-intensity technological noise.
In a preliminary analysis, the possibility of carrying out AE monitoring to assess the strain–stress state of the dragline components was studied by identification of favorable and adverse factors. The most unfavorable factor is a high level of noise in the dragline operating cycle. In most cases it is caused by the movement of the dragrope and hoisting ropes. Therefore, the high-intensity acoustic noise can reach 75 dB in the 100–400 kHz range. Despite this critical level, monitoring still can be performed because the sources of noise, as a rule, are not localized at certain points in the structure and are not identified on the diagram. The favorable factor is the waveguide form. The dragline structural com-ponents usually obtain the form of hollow pipelines and could be interpreted as a one-layered cylindric waveguide. In the absence of multiple reflections and scattering, the AE
Figure 2. Block diagram of the structure health monitoring system.
The hardware equipment is represented by a digital measuring system A-Line 32DDDM (produced by Interunis-IT company). Its main feature consists of subsequentialconnection of the measuring channels. A data acquisition system provides the traditionalAE impulse threshold detection, calculation of AE parameters, and location of AE sourcesbased on the determination of the difference in the time of arrival of AE impulses toneighboring sensors. The data analysis algorithm provides intelligent processing of AEdata for detection of the defects against the background of high-intensity technologicalnoise.
In a preliminary analysis, the possibility of carrying out AE monitoring to assess thestrain–stress state of the dragline components was studied by identification of favorableand adverse factors. The most unfavorable factor is a high level of noise in the draglineoperating cycle. In most cases it is caused by the movement of the dragrope and hoistingropes. Therefore, the high-intensity acoustic noise can reach 75 dB in the 100–400 kHzrange. Despite this critical level, monitoring still can be performed because the sources ofnoise, as a rule, are not localized at certain points in the structure and are not identifiedon the diagram. The favorable factor is the waveguide form. The dragline structuralcomponents usually obtain the form of hollow pipelines and could be interpreted as aone-layered cylindric waveguide. In the absence of multiple reflections and scattering, theAE impulses have a relatively short rise time and duration, while providing a significantdifference in the waveform of the useful and noise data.

Appl. Sci. 2021, 11, 3420 4 of 15
2. Materials and Methods
This section represents methods for analyzing various factors which impact on the AEstructural health monitoring technology and collecting information about the AE source,waveguide properties, and the features of the structure loading in the operating cycle, aswell as the parameters of noise.
2.1. AE Source Characterization
Mechanical tests were carried out on specimens made of the same steel as the draglineback legs to determine the AE parameters of a fatigue crack. Specimens were producedfrom 16G low-alloyed steel (marked in accordance with Russian state standard) sheetsusing laser cutting. The chemical composition of the studied steels is presented in Table 1.
Table 1. The chemical composition of the 16G low-alloyed steel.
The Content of Chemical Elements (% wt.)
C Mn Si Cr Ni Al Mo S P
0.14–0.18 1.0–1.2 0.15–0.3 ≤0.2 ≤0.3 0.02–0.05 ≤0.8 ≤0.02 ≤0.025
The shape and overall dimensions of the specimens (Figure 3a) were selected on thebasis of Russian state standard GOST 25.506-85. Thus, a series of rectangular specimenswith a thickness of 5 mm and with an edge notch were prepared. The width is equal tob = 50 mm, and the length l = 350 mm was chosen due to the condition of l ≥ 2b andtaking into account the distance between the grips. The notch width e also should meet therequirement (e ≤ 0.06b) and was selected as e = 4 mm, the opening angle Θ correspondedto (30◦ ≤ Θ ≤ 60◦) and was Θ = 45◦, and the notch depth h = 10 mm.
Appl. Sci. 2021, 11, x FOR PEER REVIEW 4 of 15
impulses have a relatively short rise time and duration, while providing a significant dif-ference in the waveform of the useful and noise data.
2. Materials and Methods This section represents methods for analyzing various factors which impact on the
AE structural health monitoring technology and collecting information about the AE source, waveguide properties, and the features of the structure loading in the operating cycle, as well as the parameters of noise.
2.1. AE Source Characterization Mechanical tests were carried out on specimens made of the same steel as the drag-
line back legs to determine the AE parameters of a fatigue crack. Specimens were pro-duced from 16G low-alloyed steel (marked in accordance with Russian state standard) sheets using laser cutting. The chemical composition of the studied steels is presented in Table 1.
Table 1. The chemical composition of the 16G low-alloyed steel.
The Content of Chemical Elements (% wt.) C Mn Si Cr Ni Al Mo S P
0.14–0.18 1.0–1.2 0.15–0.3 ≤0.2 ≤0.3 0.02–0.05 ≤0.8 ≤0.02 ≤0.025
The shape and overall dimensions of the specimens (Figure 3a) were selected on the basis of Russian state standard GOST 25.506-85. Thus, a series of rectangular specimens with a thickness of 5 mm and with an edge notch were prepared. The width is equal to b = 50 mm, and the length l = 350 mm was chosen due to the condition of l ≥ 2b and taking into account the distance between the grips. The notch width e also should meet the re-quirement (e ≤ 0.06b) and was selected as e = 4 mm, the opening angle Θ corresponded to (30° ≤ Θ ≤ 60°) and was Θ = 45°, and the notch depth h = 10 mm.
(a) (b)
Figure 3. The design of the test specimen: (a) scheme of the specimen; (b) diagram of the loading cycle.
A fatigue crack was grown on each specimen by cyclic tensile loading using the pul-sation cycle (cycle asymmetry coefficient Rc = 0) with a frequency of 5 Hz and a maximum cycle load of σmax ≈ 0.6·σy, where σy is a yield stress. The number of loading cycles was chosen so that the fatigue crack developing under cyclic loading in the lateral notch region would reach a certain length. Nominal crack lengths ranged from 3 to 15 mm. Thus, the total length of the notch and crack was approximately 15–28 mm depending on the spec-
Figure 3. The design of the test specimen: (a) scheme of the specimen; (b) diagram of the loading cycle.
A fatigue crack was grown on each specimen by cyclic tensile loading using thepulsation cycle (cycle asymmetry coefficient Rc = 0) with a frequency of 5 Hz and amaximum cycle load of σmax ≈ 0.6·σy, where σy is a yield stress. The number of loadingcycles was chosen so that the fatigue crack developing under cyclic loading in the lateralnotch region would reach a certain length. Nominal crack lengths ranged from 3 to 15 mm.Thus, the total length of the notch and crack was approximately 15–28 mm dependingon the specimen. After the crack growth, the specimens were tested under static tensionusing a loading scheme adopted during industrial AE testing (Figure 3b) [18]. A series ofexperiments was done for 10 specimens with identical parameters.

Appl. Sci. 2021, 11, 3420 5 of 15
The A-Line 32D AE system (LLC “Interunis-IT”) was chosen during the experiment.It was equipped with four measuring channels including the PAEF-014 preamplifier andGT200 resonant sensor (LLC “GlobalTest”, resonant frequency 180 kHz). The intrinsic noiseof the equipment, preamplifier, and AE sensor was 26 dB. The discrimination thresholdwas selected as 45 dB (6 dB higher than the noise level of the testing machine).
Figure 4 presents the dependence of the cumulative AE hits depending on the currentstress and time. Cumulative AE hits have a power-law dependence of the σ/σy relationwhich is typical for the crack presence. The number of AE hits registered during theloading of the specimens varied in the range from 118 to 240 with an average value about ofN∑ = 185. The number of AE hits depends on the loading stress. For more objectiveevaluation of the material emissivity the Palmer–Heald model was implemented.
Appl. Sci. 2021, 11, x FOR PEER REVIEW 5 of 15
imen. After the crack growth, the specimens were tested under static tension using a load-
ing scheme adopted during industrial AE testing (Figure 3b) [18]. A series of experiments
was done for 10 specimens with identical parameters.
The A-Line 32D AE system (LLC “Interunis-IT”) was chosen during the experiment.
It was equipped with four measuring channels including the PAEF-014 preamplifier and
GT200 resonant sensor (LLC “GlobalTest”, resonant frequency 180 kHz). The intrinsic
noise of the equipment, preamplifier, and AE sensor was 26 dB. The discrimination thresh-
old was selected as 45 dB (6 dB higher than the noise level of the testing machine).
Figure 4 presents the dependence of the cumulative AE hits depending on the current
stress and time. Cumulative AE hits have a power-law dependence of the σ/σy relation
which is typical for the crack presence. The number of AE hits registered during the load-
ing of the specimens varied in the range from 118 to 240 with an average value about of
N∑ = 185. The number of AE hits depends on the loading stress. For more objective evalu-
ation of the material emissivity the Palmer–Heald model was implemented.
(a) (b)
Figure 4. Cumulative acoustic emission (AE) hits NΣ relations: (a) cumulative AE hits NΣ vs. current stress σ/σy and its
Palmer–Heald approximation; (b) cumulative AE hits NΣ and loading force P vs. time t.
According to the Palmer–Heald model,
𝑁Σ = 𝐷 ∙ 𝑎 ∙ (𝑠𝑒𝑐 (𝜋
2
𝜎
𝜎𝑦) − 1) (1)
where is the actual stress; y—yield stress; a is half the length of the crack; D—dimen-
sional coefficient of the model (1/mm), depending on the characteristics of the material,
temperature, and type of stress–strain state.
It is presented in [19] that the multiplicative coefficient of the Palmer–Heald model
D can be considered as parameters that may be applied to describe the material AE emis-
sivity independent of loading conditions, crack length, and stress intensity factor. De-
pendence of cumulative AE hits vs. time was approximated using the Palmer–Heald
equation for the data obtained after testing of each 10 specimens in the series. An example
of such an approximation is given in Figure 4b. For each dependence, the values of the
parameter D, the error δD, and the coefficient of determination R2 were determined and
presented in the Table 2. The parameter D was calculated based on the values presented
in Table 2 and constituted 151.1 ± 8.4 (1/mm).
0
50
100
150
200
250
300
350
0 0.2 0.4 0.6 0.8
Cu
mm
ula
tiv
e A
E h
its
σ/σy
experiment approximation
Figure 4. Cumulative acoustic emission (AE) hits NΣ relations: (a) cumulative AE hits NΣ vs. current stress σ/σy and itsPalmer–Heald approximation; (b) cumulative AE hits NΣ and loading force P vs. time t.
According to the Palmer–Heald model,
NΣ = D·a·(
sec(
π
2σ
σy
)− 1
)(1)
where σ is the actual stress; σy—yield stress; a is half the length of the crack; D—dimensionalcoefficient of the model (1/mm), depending on the characteristics of the material, tempera-ture, and type of stress–strain state.
It is presented in [19] that the multiplicative coefficient of the Palmer–Heald model Dcan be considered as parameters that may be applied to describe the material AE emissivityindependent of loading conditions, crack length, and stress intensity factor. Dependenceof cumulative AE hits vs. time was approximated using the Palmer–Heald equation forthe data obtained after testing of each 10 specimens in the series. An example of such anapproximation is given in Figure 4b. For each dependence, the values of the parameter D,the error δD, and the coefficient of determination R2 were determined and presented inthe Table 2. The parameter D was calculated based on the values presented in Table 2 andconstituted 151.1 ± 8.4 (1/mm).

Appl. Sci. 2021, 11, 3420 6 of 15
Table 2. AE emissivity estimation—the Palmer–Heald model parameters.
D, 1/mm δD, % R2
137.5 0.93 0.97149.6 0.87 0.96144.9 1.4 0.92152.3 0.82 0.98151.4 0.93 0.96155.3 1.4 0.99165.1 3.1 0.95160.5 1.5 0.94153.2 1.3 0.98141.3 2.1 0.97144.9 1.4 0.92
Since the maximum load in the operation cycle of the dragline is approximately 0.6σy, theapproximately number of AE hits related to crack length is N∑/a = D (sec(0.3π) − 1) ≈ 106.
Figure 5 shows the dependence of the amplitudes of AE impulses emitted by the crackdepending on time (Figure 5a) and the AE impulse amplitudes probability distribution indouble logarithmic axes (Figure 5b). The amplitudes of the AE impulses emitted by thecrack do not exceed 72 dB, and the amplitude distribution corresponds to the Weibull lawwith the parameters k = 1.17, λ = 6.13.
Appl. Sci. 2021, 11, x FOR PEER REVIEW 6 of 15
Table 2. AE emissivity estimation—the Palmer–Heald model parameters.
D, 1/mm δD, % R2 137.5 0.93 0.97 149.6 0.87 0.96 144.9 1.4 0.92 152.3 0.82 0.98 151.4 0.93 0.96 155.3 1.4 0.99 165.1 3.1 0.95 160.5 1.5 0.94 153.2 1.3 0.98 141.3 2.1 0.97 144.9 1.4 0.92
Since the maximum load in the operation cycle of the dragline is approximately 0.6σy, the approximately number of AE hits related to crack length is N∑/a = D (sec(0.3π) − 1) ≈ 106 .
Figure 5 shows the dependence of the amplitudes of AE impulses emitted by the crack depending on time (Figure 5a) and the AE impulse amplitudes probability distribu-tion in double logarithmic axes (Figure 5b). The amplitudes of the AE impulses emitted by the crack do not exceed 72 dB, and the amplitude distribution corresponds to the Weibull law with the parameters k = 1.17, λ = 6.13.
(a) (b)
Figure 5. Amplitudes of AE impulses: (a) AE impulse amplitudes A and loading force P vs. time t; (b) AE impulse ampli-tudes distribution.
Assessment of the AE emissivity and determination of the range of AE impulse am-plitudes emitted by the crack are used to determine the parameters of the AE structural health monitoring system and estimate the reliability of AE impulse detection against background noise.
2.2. AE Waveguide Characterization In the previous section, the source of AE is characterized. However, to detect AE sig-
nal impulses effectively against a background of noise, it is necessary to assess how AE parameters vary during propagation along the waveguide. Traditionally, the investiga-tion of the waveguide of the testing objects is carried out mainly empirically by measuring the Hsu-Nielsen lead break response at various points of the structure. In this study an analytical approach is implemented due to limited access to the dragline constructive el-ements. Load-bearing metal structures of dragline such as back legs and booms represent
Figure 5. Amplitudes of AE impulses: (a) AE impulse amplitudes A and loading force P vs. time t; (b) AE impulseamplitudes distribution.
Assessment of the AE emissivity and determination of the range of AE impulseamplitudes emitted by the crack are used to determine the parameters of the AE structuralhealth monitoring system and estimate the reliability of AE impulse detection againstbackground noise.
2.2. AE Waveguide Characterization
In the previous section, the source of AE is characterized. However, to detect AEsignal impulses effectively against a background of noise, it is necessary to assess how AEparameters vary during propagation along the waveguide. Traditionally, the investigationof the waveguide of the testing objects is carried out mainly empirically by measuringthe Hsu-Nielsen lead break response at various points of the structure. In this study ananalytical approach is implemented due to limited access to the dragline constructiveelements. Load-bearing metal structures of dragline such as back legs and booms representhollow tubes with a diameter of 20 inches which could be considered as a single-layercylindrical waveguide. Ordinary form of the waveguide allows to calculate AE signalpropagation analytically using modal analysis [20].

Appl. Sci. 2021, 11, 3420 7 of 15
Modal analysis is a common method for the waveguide calculating based on theproperties of orthogonality and completeness of normal waves. It allows to calculatein Fourier space the displacement of the testing structure at the point z caused by theaction of a point source with the waveform u(0,t). The result signal is determined usingthe expression
u(z, f ) = u(0, f )·ap(z, f ) (2)
where u(0,t) is the signal emitted by the AE source located in the point z = 0, andu(0,f ) = F[u(0,t)] is its Fourier transform. It was shown in [21] that when the externalforce is a point source, the coefficients ap(z) can be determined using the simplified formula:
ap(z) = ejkpz/4 (3)
where kp = (2πf )/cph(f ) is the wave number; cph(f ) is the phase velocity of the normal wave,f —frequency.
In the case of a cylindrical waveguide with a large radius of curvature, Lamb wavescan be considered as the main type of normal waves.
One of the main aspects related to the influence of the waveguide is attenuation.The attenuation effect is a difficult problem from the point of view of interpreting the AEdata, since different wave modes and different frequency components are characterizedby different attenuation coefficients, which has a significant effect on the waveform ofAE impulse. The attenuation coefficients of the Lamb waves modes γS0 and γA0 are alinear combination of the attenuation coefficients of the longitudinal wave α and transversewave β: {
γS0 = AS0α + BS0βγA0 = AA0α + BA0β
(4)
where AS0, BS0, AA0, BA0—coefficients that are determined by the type of Lamb wave,relative plate thickness, and Poisson’s ratio.
Analytical expressions of the coefficients are given in [22], their values depend onfrequency f and thickness of the testing structure h. The analytical method based on themodal analysis, supplemented by analytical consideration of the attenuation coefficientand the impulse response of AE sensor, allows simulating AE signals of a realistic form [23].Figure 6 represents the calculated signal (Figure 6a) and experimental signal obtained usingthe Hsu-Nielsen simulator (Figure 6b) for wall thickness 20 mm at 4 m from the AE sensor.
Appl. Sci. 2021, 11, x FOR PEER REVIEW 8 of 15
(a) (b)
Figure 6. Comparison of the modelled and experimental AE signals U for a waveguide length of 4 m and a thickness of 20 mm: (a) the simulated signal, (b) the measured signal.
Based on the analytical method, a parametric model of the AE impulse can be de-signed. It presents the dependence of the AE parameters (rise time (RT), rise angle (RA), and duration) on propagation distance. The RA parameter represents the value inverse to slow rate and can be calculated with the equation
RA = RT/A, (5)
where A is the amplitude of the AE impulse. In the case of one-layered metallic waveguide, the AE impulse characterizes, as a
rule, with some specific parameters, values such as a small RA and a short RT. The deter-mination of the expected priory parameters of the AE impulse in advance makes it possi-ble to identify them effectively against the background of noises, whose impulse compo-nents correspond to a larger time scale. Figure 7 shows RT and RA versus propagation distance L, which determine the expected values of AE parameters for a given distance between the AE source and sensor. These dependences can be interpreted as a parametric model of the AE impulse, based on which the identification of AE impulses against the background of noise will be carried out.
(a) (b)
Figure 7. Dependence of AE parameters versus propagation distance L: (a) rise angle (RA) vs. distance L, (b) rise time (RT) vs. distance L.
0
50
100
150
200
250
300
0 5 10 15
RT, m
s
L, m
Figure 6. Comparison of the modelled and experimental AE signals U for a waveguide length of 4 m and a thickness of20 mm: (a) the simulated signal, (b) the measured signal.

Appl. Sci. 2021, 11, 3420 8 of 15
Based on the analytical method, a parametric model of the AE impulse can be designed.It presents the dependence of the AE parameters (rise time (RT), rise angle (RA), andduration) on propagation distance. The RA parameter represents the value inverse to slowrate and can be calculated with the equation
RA = RT/A, (5)
where A is the amplitude of the AE impulse.In the case of one-layered metallic waveguide, the AE impulse characterizes, as a rule,
with some specific parameters, values such as a small RA and a short RT. The determinationof the expected priory parameters of the AE impulse in advance makes it possible to identifythem effectively against the background of noises, whose impulse components correspondto a larger time scale. Figure 7 shows RT and RA versus propagation distance L, whichdetermine the expected values of AE parameters for a given distance between the AEsource and sensor. These dependences can be interpreted as a parametric model of the AEimpulse, based on which the identification of AE impulses against the background of noisewill be carried out.
Appl. Sci. 2021, 11, x FOR PEER REVIEW 8 of 15
(a) (b)
Figure 6. Comparison of the modelled and experimental AE signals U for a waveguide length of 4 m and a thickness of 20 mm: (a) the simulated signal, (b) the measured signal.
Based on the analytical method, a parametric model of the AE impulse can be de-signed. It presents the dependence of the AE parameters (rise time (RT), rise angle (RA), and duration) on propagation distance. The RA parameter represents the value inverse to slow rate and can be calculated with the equation
RA = RT/A, (5)
where A is the amplitude of the AE impulse. In the case of one-layered metallic waveguide, the AE impulse characterizes, as a
rule, with some specific parameters, values such as a small RA and a short RT. The deter-mination of the expected priory parameters of the AE impulse in advance makes it possi-ble to identify them effectively against the background of noises, whose impulse compo-nents correspond to a larger time scale. Figure 7 shows RT and RA versus propagation distance L, which determine the expected values of AE parameters for a given distance between the AE source and sensor. These dependences can be interpreted as a parametric model of the AE impulse, based on which the identification of AE impulses against the background of noise will be carried out.
(a) (b)
Figure 7. Dependence of AE parameters versus propagation distance L: (a) rise angle (RA) vs. distance L, (b) rise time (RT) vs. distance L.
0
50
100
150
200
250
300
0 5 10 15
RT, m
s
L, m
Figure 7. Dependence of AE parameters versus propagation distance L: (a) rise angle (RA) vs. distance L, (b) rise time (RT)vs. distance L.
RA varies exponentially with the distance, while RT increases linearly. Both parametershave rather low values; at 15 m, the RA does not exceed 50 ms/V, when the RT of theleading edge of the AE signal pulse for the same distance turns out to be less than 300 µs.
2.3. Noise Parameters
The main source of acoustic noise measured during the AE testing of walking draglineexcavator is friction and vibration generated by the movement of the hoist ropes anddragropes that control the bucket position. The noise has a stochastic non-stationarynature, its intensity turned out to be different for AE sensors installed on various draglineconstructive parts. The lower the noise intensity, the greater is the distance of the structuralcomponent from the moving ropes. Figure 8 shows the empirical probability function ofthe noise long-time realization measured with a different sensor located on the structuralcomponents above and below the boom, and on the side frame—back legs and a mast. Thehighest noise level was observed along the measuring channel installed in the lower partof the mast near the dragropes, while the lowest level was detected along the channelsinstalled on the lower part of the boom. It can be explained by the fact that they are placedfar away from the trajectory of the ropes.

Appl. Sci. 2021, 11, 3420 9 of 15
Appl. Sci. 2021, 11, x FOR PEER REVIEW 9 of 15
RA varies exponentially with the distance, while RT increases linearly. Both parame-ters have rather low values; at 15 m, the RA does not exceed 50 ms/V, when the RT of the leading edge of the AE signal pulse for the same distance turns out to be less than 300 μs.
2.3. Noise Parameters The main source of acoustic noise measured during the AE testing of walking drag-
line excavator is friction and vibration generated by the movement of the hoist ropes and dragropes that control the bucket position. The noise has a stochastic non-stationary na-ture, its intensity turned out to be different for AE sensors installed on various dragline constructive parts. The lower the noise intensity, the greater is the distance of the struc-tural component from the moving ropes. Figure 8 shows the empirical probability func-tion of the noise long-time realization measured with a different sensor located on the structural components above and below the boom, and on the side frame—back legs and a mast. The highest noise level was observed along the measuring channel installed in the lower part of the mast near the dragropes, while the lowest level was detected along the channels installed on the lower part of the boom. It can be explained by the fact that they are placed far away from the trajectory of the ropes.
Figure 8. Empirical probability distribution of acoustic noise for a various dragline component.
It can be inferred from Figure 8 that there is a high level of noise with a standard deviation of 40–45 dB. The maximum values typical for a set of 108 samples (that corre-spond to 100 s with a sampling frequency equal to 1 MHz) are 50–65 dB. The noise is non-stationary because it is caused by the uneven movement of the ropes in different phases of the dragline operation cycle. For instance, when the bucket is loaded, the dragrope is pulled. When there is a stage of unloading, both the dragrope and hoist rope are weak-ened and moved. When the platform turns, no movement of the ropes is visible, and the intensity of noise is dramatically reduced. Figure 9a presents the longtime noise wave-form; its peak corresponds to 68 dB, and in the low-intensity phase ~ 40–45 dB. A favorable factor is that the impulse noise components differ from the AE signal impulses by greater values of the RT and RA parameters. Figure 9b shows the empirical distribution of the RA parameter corresponding to noise impulse components. The distribution mode equaled the value RA = 900 ms/V, which is significantly higher than the values of the RA parameter for AE impulses emitted by a defect.
Figure 8. Empirical probability distribution of acoustic noise for a various dragline component.
It can be inferred from Figure 8 that there is a high level of noise with a standarddeviation of 40–45 dB. The maximum values typical for a set of 108 samples (that correspondto 100 s with a sampling frequency equal to 1 MHz) are 50–65 dB. The noise is non-stationary because it is caused by the uneven movement of the ropes in different phasesof the dragline operation cycle. For instance, when the bucket is loaded, the dragrope ispulled. When there is a stage of unloading, both the dragrope and hoist rope are weakenedand moved. When the platform turns, no movement of the ropes is visible, and the intensityof noise is dramatically reduced. Figure 9a presents the longtime noise waveform; its peakcorresponds to 68 dB, and in the low-intensity phase ~ 40–45 dB. A favorable factor is thatthe impulse noise components differ from the AE signal impulses by greater values of theRT and RA parameters. Figure 9b shows the empirical distribution of the RA parametercorresponding to noise impulse components. The distribution mode equaled the valueRA = 900 ms/V, which is significantly higher than the values of the RA parameter for AEimpulses emitted by a defect.
Appl. Sci. 2021, 11, x FOR PEER REVIEW 10 of 15
(a) (b)
Figure 9. Parameters of the noise process: (a) noise waveform longtime realization, (b) distribution of RA parameter for the noise impulse components.
2.4. Filtering Method Conventionally, the detection of AE impulses is carried out by the threshold method,
in accordance with AE, impulses are detected during the threshold crossing. This method is highly effective and convenient in a case when a noise has a stationary character and can be rejected with the nonlinear threshold filtering. However, in the case of nonstation-ary impulse noise, the use of the threshold method is not acceptable. According to the AE non-destructive testing method, the threshold is set in such a way that no more than one false hit detection is recorded in 100 s. According to the probability distribution of noise samples (Figure 8), the amplitude discrimination threshold should be set between 55 and 65 dB for different locations. Such an increase in the amplitude discrimination threshold leads to a significant increase in the probability of missing a defect. A preliminary analysis of the AE source shows that at a value of the amplitude discrimination threshold of 45 dB, the average emissivity of the material is about 105 AE hits per 1 mm of crack growth. However, it can be extrapolated that with an increase in the discrimination threshold from 45 to 60 dB, the number of AE hits drastically decreases by about 94% due to the exponen-tial distribution of the AE pulse amplitudes (Figure 4b). The emissivity in this case will be on the order of 5–7 AE hits per 1 mm of crack growth.
A special method was developed to increase the accuracy of crack detection in the dragline load-bearing metal structures. In accordance with this method, the amplitude discrimination level is set below the noise level to allow recording both the AE process and the noise technological process during the dragline operation. In this case, a type II error associated with the defect missing is minimized by increasing the probability of a type I error connected with false detection of a defect due to erroneous noise impulse location. Since the noise intensity is significantly higher than the AE hits count rate, special filtering is developed to increase the reliability of the testing. Filtering is effective and specific since it is based on the parametric model of AE impulse, representing a set of characteristic values of the AE parameters corresponding to a certain distance between the AE sensor and the defect.
A spatial parametric filter is proposed for detecting AE impulses from nonstationary impulse noise. This filter excludes from the location schemes those AE events whose pa-rameters are more consistent with the noise process and are not typical for AE impulses caused by a defect. Since the tested elements of the dragline are long pipelines (the length significantly exceeds the diameter), a linear circuit with an antenna formed by two sensors is used to determine the location of the defect.
Figure 9. Parameters of the noise process: (a) noise waveform longtime realization, (b) distribution of RA parameter for thenoise impulse components.

Appl. Sci. 2021, 11, 3420 10 of 15
2.4. Filtering Method
Conventionally, the detection of AE impulses is carried out by the threshold method,in accordance with AE, impulses are detected during the threshold crossing. This methodis highly effective and convenient in a case when a noise has a stationary character and canbe rejected with the nonlinear threshold filtering. However, in the case of nonstationaryimpulse noise, the use of the threshold method is not acceptable. According to the AEnon-destructive testing method, the threshold is set in such a way that no more than onefalse hit detection is recorded in 100 s. According to the probability distribution of noisesamples (Figure 8), the amplitude discrimination threshold should be set between 55 and65 dB for different locations. Such an increase in the amplitude discrimination thresholdleads to a significant increase in the probability of missing a defect. A preliminary analysisof the AE source shows that at a value of the amplitude discrimination threshold of45 dB, the average emissivity of the material is about 105 AE hits per 1 mm of crack growth.However, it can be extrapolated that with an increase in the discrimination thresholdfrom 45 to 60 dB, the number of AE hits drastically decreases by about 94% due to theexponential distribution of the AE pulse amplitudes (Figure 4b). The emissivity in this casewill be on the order of 5–7 AE hits per 1 mm of crack growth.
A special method was developed to increase the accuracy of crack detection in thedragline load-bearing metal structures. In accordance with this method, the amplitudediscrimination level is set below the noise level to allow recording both the AE process andthe noise technological process during the dragline operation. In this case, a type II errorassociated with the defect missing is minimized by increasing the probability of a type Ierror connected with false detection of a defect due to erroneous noise impulse location.Since the noise intensity is significantly higher than the AE hits count rate, special filteringis developed to increase the reliability of the testing. Filtering is effective and specific sinceit is based on the parametric model of AE impulse, representing a set of characteristicvalues of the AE parameters corresponding to a certain distance between the AE sensorand the defect.
A spatial parametric filter is proposed for detecting AE impulses from nonstationaryimpulse noise. This filter excludes from the location schemes those AE events whoseparameters are more consistent with the noise process and are not typical for AE impulsescaused by a defect. Since the tested elements of the dragline are long pipelines (the lengthsignificantly exceeds the diameter), a linear circuit with an antenna formed by two sensorsis used to determine the location of the defect.
The filtering algorithm assumes that the waveform of AE impulse is determinedprimarily by the parameters of the acoustic waveguide. The acoustic emission impulsesemitted by the AE source are stochastic and characterized by a short duration, on theorder of nanoseconds. Since the propagation of the AE signals has a dispersive character,when propagating from the emission point to the AE sensor, the signal duration increasesand reaches 100–1000 µs at a distance about 10 meters, and the signal waveform is alsodetermined mainly by the phases of different frequency components of the Lamb modes.In this case, the AE impulse, which is initially stochastic in nature, becomes principallydeterministic, and its waveform and spectrum are mainly determined by the parameters ofthe waveguide.
Based on the above, the following filtering method is applicable: for all located AEevents, two RT parameters (RT1 for sensor 1 and RT2 for sensor 2) and two RA parameters(RA1 for sensor 1 and RA2 for sensor 2) are evaluated. Then, the correspondence betweenthe values of the RA, RT parameters and a defect distance are determined. If the AE event islocated at the distance x from the 1st sensor, the parameters RT1 and RA1 would correspondto the distance x, and RT2 and RA2 would correspond to distance (L–x), where L is thedistance between the sensors and x is the estimated distance between the AE source andthe sensor. An AE event is considered as corresponding to the propagation of a defect if, inaddition to the standard location criteria associated with the discrepancy of the location

Appl. Sci. 2021, 11, 3420 11 of 15
amplitude, RA and RT parameters estimated for AE impulses measured with both AEchannels correspond to the reference value with an error less than 30%.
RA and RT parameters reference values vs. distance for both measuring channels areshown in Figure 10.
Appl. Sci. 2021, 11, x FOR PEER REVIEW 11 of 15
The filtering algorithm assumes that the waveform of AE impulse is determined pri-marily by the parameters of the acoustic waveguide. The acoustic emission impulses emit-ted by the AE source are stochastic and characterized by a short duration, on the order of nanoseconds. Since the propagation of the AE signals has a dispersive character, when propagating from the emission point to the AE sensor, the signal duration increases and at about meters reaches 100–1000 μs at a distance about 10 meters, and the signal wave-form is also determined mainly by the phases of different frequency components of the Lamb modes. In this case, the AE impulse, which is initially stochastic in nature, becomes principally deterministic, and its waveform and spectrum are mainly determined by the parameters of the waveguide.
Based on the above, the following filtering method is applicable: for all located AE events, two RT parameters (RT1 for sensor 1 and RT2 for sensor 2) and two RA parameters (RA1 for sensor 1 and RA2 for sensor 2) are evaluated. Then, the correspondence between the values of the RA, RT parameters and a defect distance are determined. If the AE event is located at the distance x from the 1st sensor, the parameters RT1 and RA1 would corre-spond to the distance x, and RT2 and RA2 would correspond to distance (L–x), where L is the distance between the sensors and x is the estimated distance between the AE source and the sensor. An AE event is considered as corresponding to the propagation of a defect if, in addition to the standard location criteria associated with the discrepancy of the loca-tion amplitude, RA and RT parameters estimated for AE impulses measured with both AE channels correspond to the reference value with an error less than 30%.
RA and RT parameters reference values vs. distance for both measuring channels are shown in Figure 10.
(a) (b)
Figure 10. Parametrical model of AE impulse: (a) RA depending on the coordinate of AE source, (b) RT depending on the coordinate of AE source.
3. Results The approaches proposed in this work were tested during structural health monitor-
ing of an ESH 20.90 walking dragline excavator. The reason for the AE testing was a pre-vious damage to the left dragline back legs (a crack in the weld). For data acquisition, the INTERUNIS-IT A-Line 32D DDM system was used, equipped with 30 measuring chan-nels, each of which was connected to resonant sensors (AE GT200) with a bandwidth of 140–200 kHz and a resonance frequency of 180 kHz. The measurement was carried out in the frequency range from 100 to 400 kHz, which ensures a low intensity of the noise envi-ronment. AE sensors were installed on the main metal structural dragline components: three sensors for the left and three for the right back legs, eight for the upper boom, four
Figure 10. Parametrical model of AE impulse: (a) RA depending on the coordinate of AE source, (b) RT depending on thecoordinate of AE source.
3. Results
The approaches proposed in this work were tested during structural health moni-toring of an ESH 20.90 walking dragline excavator. The reason for the AE testing was aprevious damage to the left dragline back legs (a crack in the weld). For data acquisition,the INTERUNIS-IT A-Line 32D DDM system was used, equipped with 30 measuring chan-nels, each of which was connected to resonant sensors (AE GT200) with a bandwidth of140–200 kHz and a resonance frequency of 180 kHz. The measurement was carried outin the frequency range from 100 to 400 kHz, which ensures a low intensity of the noiseenvironment. AE sensors were installed on the main metal structural dragline components:three sensors for the left and three for the right back legs, eight for the upper boom, four forthe lower boom, four for the lower back legs and three for the mast. The distance betweenthe AE sensors varied between 5 and 11 m. Figure 11 shows the location of AE sensors ona dragline boom.
Appl. Sci. 2021, 11, x FOR PEER REVIEW 12 of 15
for the lower boom, four for the lower back legs and three for the mast. The distance be-tween the AE sensors varied between 5 and 11 m. Figure 11 shows the location of AE sensors on a dragline boom.
Figure 11. Location of AE sensors on a dragline boom.
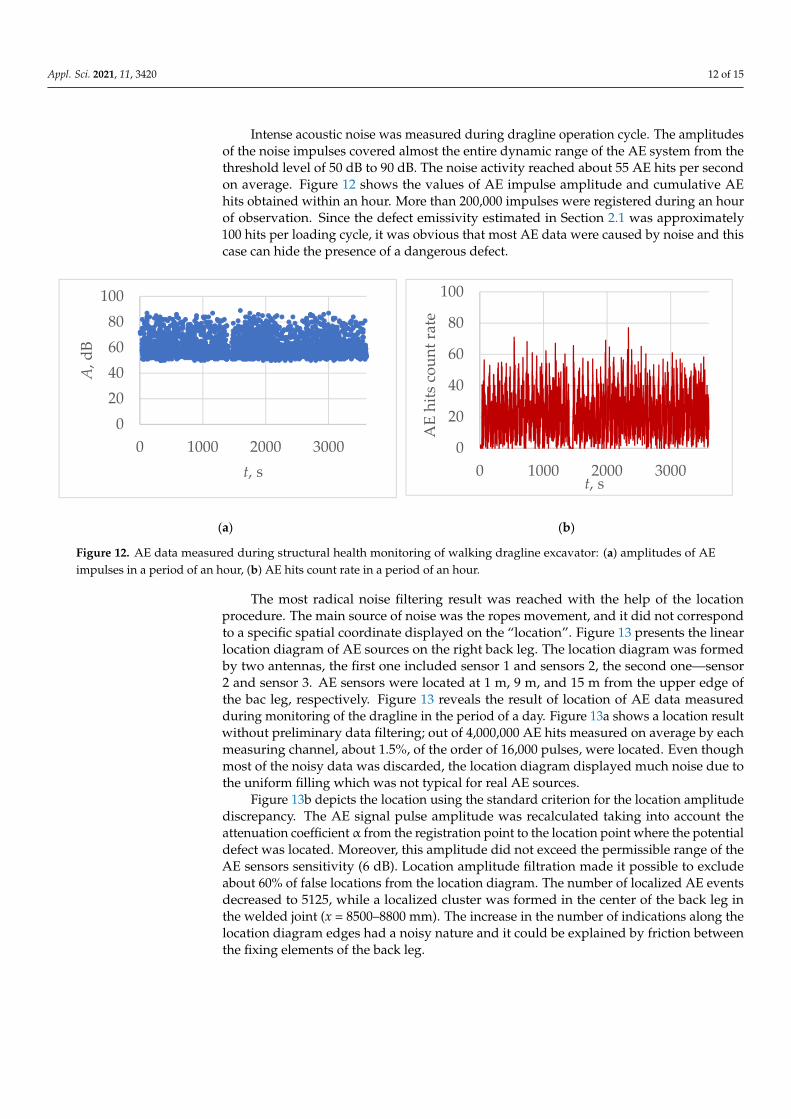
Intense acoustic noise was measured during dragline operation cycle. The ampli-tudes of the noise impulses covered almost the entire dynamic range of the AE system from the threshold level of 50 dB to 90 dB. The noise activity reached about 55 AE hits per second on average. Figure 12 shows the values of AE impulse amplitude and cumulative AE hits obtained within an hour. More than 200,000 impulses were registered during an hour of observation. Since the defect emissivity estimated in Section 2.1 was approxi-mately 100 hits per loading cycle, it was obvious that most AE data were caused by noise and this case can hide the presence of a dangerous defect.
(a) (b)
Figure 12. AE data measured during structural health monitoring of walking dragline excavator: (a) amplitudes of AE impulses in a period of an hour, (b) AE hits count rate in a period of an hour.
The most radical noise filtering result was reached with the help of the location pro-cedure. The main source of noise was the ropes movement, and it did not correspond to a specific spatial coordinate displayed on the “location”. Figure 13 presents the linear loca-tion diagram of AE sources on the right back leg. The location diagram was formed by two antennas, the first one included sensor 1 and sensors 2, the second one—sensor 2 and sensor 3. AE sensors were located at 1 m, 9 m, and 15 m from the upper edge of the bac
020406080
100
0 1000 2000 3000
A, d
B
t, s0
20
40
60
80
100
0 1000 2000 3000
AE
hits
cou
nt ra
te
t, s
Figure 11. Location of AE sensors on a dragline boom.
Appl. Sci. 2021, 11, 3420 12 of 15
Intense acoustic noise was measured during dragline operation cycle. The amplitudesof the noise impulses covered almost the entire dynamic range of the AE system from thethreshold level of 50 dB to 90 dB. The noise activity reached about 55 AE hits per secondon average. Figure 12 shows the values of AE impulse amplitude and cumulative AEhits obtained within an hour. More than 200,000 impulses were registered during an hourof observation. Since the defect emissivity estimated in Section 2.1 was approximately100 hits per loading cycle, it was obvious that most AE data were caused by noise and thiscase can hide the presence of a dangerous defect.
Appl. Sci. 2021, 11, x FOR PEER REVIEW 12 of 15
for the lower boom, four for the lower back legs and three for the mast. The distance be-tween the AE sensors varied between 5 and 11 m. Figure 11 shows the location of AE sensors on a dragline boom.
Figure 11. Location of AE sensors on a dragline boom.
Intense acoustic noise was measured during dragline operation cycle. The ampli-tudes of the noise impulses covered almost the entire dynamic range of the AE system from the threshold level of 50 dB to 90 dB. The noise activity reached about 55 AE hits per second on average. Figure 12 shows the values of AE impulse amplitude and cumulative AE hits obtained within an hour. More than 200,000 impulses were registered during an hour of observation. Since the defect emissivity estimated in Section 2.1 was approxi-mately 100 hits per loading cycle, it was obvious that most AE data were caused by noise and this case can hide the presence of a dangerous defect.
(a) (b)
Figure 12. AE data measured during structural health monitoring of walking dragline excavator: (a) amplitudes of AE impulses in a period of an hour, (b) AE hits count rate in a period of an hour.
The most radical noise filtering result was reached with the help of the location pro-cedure. The main source of noise was the ropes movement, and it did not correspond to a specific spatial coordinate displayed on the “location”. Figure 13 presents the linear loca-tion diagram of AE sources on the right back leg. The location diagram was formed by two antennas, the first one included sensor 1 and sensors 2, the second one—sensor 2 and sensor 3. AE sensors were located at 1 m, 9 m, and 15 m from the upper edge of the bac
020406080
100
0 1000 2000 3000
A, d
B
t, s0
20
40
60
80
100
0 1000 2000 3000
AE
hits
cou
nt ra
te
t, s
Figure 12. AE data measured during structural health monitoring of walking dragline excavator: (a) amplitudes of AEimpulses in a period of an hour, (b) AE hits count rate in a period of an hour.
The most radical noise filtering result was reached with the help of the locationprocedure. The main source of noise was the ropes movement, and it did not correspondto a specific spatial coordinate displayed on the “location”. Figure 13 presents the linearlocation diagram of AE sources on the right back leg. The location diagram was formedby two antennas, the first one included sensor 1 and sensors 2, the second one—sensor2 and sensor 3. AE sensors were located at 1 m, 9 m, and 15 m from the upper edge ofthe bac leg, respectively. Figure 13 reveals the result of location of AE data measuredduring monitoring of the dragline in the period of a day. Figure 13a shows a location resultwithout preliminary data filtering; out of 4,000,000 AE hits measured on average by eachmeasuring channel, about 1.5%, of the order of 16,000 pulses, were located. Even thoughmost of the noisy data was discarded, the location diagram displayed much noise due tothe uniform filling which was not typical for real AE sources.
Figure 13b depicts the location using the standard criterion for the location amplitudediscrepancy. The AE signal pulse amplitude was recalculated taking into account theattenuation coefficient α from the registration point to the location point where the potentialdefect was located. Moreover, this amplitude did not exceed the permissible range of theAE sensors sensitivity (6 dB). Location amplitude filtration made it possible to excludeabout 60% of false locations from the location diagram. The number of localized AE eventsdecreased to 5125, while a localized cluster was formed in the center of the back leg inthe welded joint (x = 8500–8800 mm). The increase in the number of indications along thelocation diagram edges had a noisy nature and it could be explained by friction betweenthe fixing elements of the back leg.

Appl. Sci. 2021, 11, 3420 13 of 15
Appl. Sci. 2021, 11, x FOR PEER REVIEW 13 of 15
leg, respectively. Figure 13 reveals the result of location of AE data measured during mon-itoring of the dragline in the period of a day. Figure 13a shows a location result without preliminary data filtering; out of 4,000,000 AE hits measured on average by each measur-ing channel, about 1.5%, of the order of 16,000 pulses, were located. Even though most of the noisy data was discarded, the location diagram displayed much noise due to the uni-form filling which was not typical for real AE sources.
(a) (b) (c)
Figure 13. Results of AE event location on a right back leg of a dragline: (a) without filtering, (b) result of the amplitude filtering, (c) result of the spatial parametric filtering.
Figure 13b depicts the location using the standard criterion for the location amplitude discrepancy. The AE signal pulse amplitude was recalculated taking into account the at-tenuation coefficient α from the registration point to the location point where the potential defect was located. Moreover, this amplitude did not exceed the permissible range of the AE sensors sensitivity (6 dB). Location amplitude filtration made it possible to exclude about 60% of false locations from the location diagram. The number of localized AE events decreased to 5125, while a localized cluster was formed in the center of the back leg in the welded joint (x = 8500–8800 mm). The increase in the number of indications along the location diagram edges had a noisy nature and it could be explained by friction between the fixing elements of the back leg.
Parametric filtering turned out to be the most considerable approach to noise dis-posal. The result of its application is represented in Figure 13c. The number of localized AE events decreased to 1517, while both uniform background noise and false clusters at the location diagram edges were removed from the diagram. However, the number of events that in the location cluster in the area of x ≈ 8800 mm did not change.
To verify the reliability of the obtained results, ultrasonic testing was carried out in the area of the identified location (i.e., in the welded joint of the right back leg). As a result of the control, a crack in the welded joint with a length of 27 mm was revealed. It formed due to the lack of root penetration.
4. Discussion Within the framework of this study, the possibility of the AE structural health moni-
toring of a dragline excavator was confirmed, and a method for interpreting diagnostic data was developed. This method allows to identify AE signal pulses which are responsi-ble for a defect presence despite the background of intense noise.
The distinctive feature of this study, compared with other approaches to AE moni-toring of objects with a high noise level, is that a priori information was widely used in the construction of data processing algorithms. At the preliminary stage of the work, a detailed analysis of all AE monitoring technology components was performed: the AE
Figure 13. Results of AE event location on a right back leg of a dragline: (a) without filtering, (b) result of the amplitudefiltering, (c) result of the spatial parametric filtering.
Parametric filtering turned out to be the most considerable approach to noise disposal.The result of its application is represented in Figure 13c. The number of localized AE eventsdecreased to 1517, while both uniform background noise and false clusters at the locationdiagram edges were removed from the diagram. However, the number of events that inthe location cluster in the area of x ≈ 8800 mm did not change.
To verify the reliability of the obtained results, ultrasonic testing was carried out inthe area of the identified location (i.e., in the welded joint of the right back leg). As a resultof the control, a crack in the welded joint with a length of 27 mm was revealed. It formeddue to the lack of root penetration.
4. Discussion
Within the framework of this study, the possibility of the AE structural health monitor-ing of a dragline excavator was confirmed, and a method for interpreting diagnostic datawas developed. This method allows to identify AE signal pulses which are responsible fora defect presence despite the background of intense noise.
The distinctive feature of this study, compared with other approaches to AE moni-toring of objects with a high noise level, is that a priori information was widely used inthe construction of data processing algorithms. At the preliminary stage of the work, adetailed analysis of all AE monitoring technology components was performed: the AEsource parameters, the acoustic path characteristics, and the noise features. The cumulativeanalysis of a priori information showed that the average noise level was several timeshigher than the average level of the AE pulse amplitudes. In addition, the intensity of thenoise exceeds the AE activity by more than an order of magnitude. This is a significantobstacle for monitoring; however, the analysis of longtime noisy impact showed that itsmaximum level is about 80 dB. It also has an impulsive nature with quiet periods up to40–45 dB, which is at least 50% of the time signal realization. Since the phase of the lownoise level corresponds to the phase of loading the dragline bucket, it is possible to detectAE signal pulses against the background of noise.
The AE diagnostics is based both on setting the threshold value of the amplitudediscrimination below the noise level and on identification of the AE signal pulses byclassification of the signal pulses and noise impulse components. The classification isdone with the use of an acoustic waveguide parametric model. Classification criteria arespecific and allow to remove up to 97% of noise data that differ in parameters from the AEsignal pulses.
The main advantage of the proposed approach is that the whole extended structurecan be controlled due to the low discrimination threshold. At this time, AE monitoringsystems are now commonly used only for the monitoring of the regions with the existing

Appl. Sci. 2021, 11, 3420 14 of 15
defects. The reliability of the obtained results is confirmed by the fact that a defect in theweld of the dragline back leg was determined based on the AE monitoring data.
The results obtained in the study have an applied character and a certain practicalsignificance. They are useful for application in the control or monitoring of the draglinemetal components during operation.
Within the framework of the research, four dragline excavators “E-Sh-20.90”, producedat the “Uralmash” plant from 1985 to 1994, were examined. For each of them, similarparameters of the noise process and close values of the acoustic waveguide parameterswere observed. Despite the fact that defects were detected only in one of the monitoredobjects, the noise filtering procedure was effective in each case under consideration.
5. Conclusions
In this paper, a new technique for detecting defects in metal structures of a draglinewalking excavator in operating mode is proposed. The technique was implemented us-ing the structural health monitoring system based on the AE method application. Themain advantage of the proposed approach is the intelligent processing of diagnostic databased on the results of a preliminary study of defect parameters, acoustic waveguidecharacteristics, and noise process parameters. Taking into account this information madeit possible to design a technique capable of detecting AE pulses corresponding to de-fects against a background of high-intensity noise. The effectiveness of the proposedapproach is confirmed by the detection of a defect in the back leg weld of an “ESH-20.90”dragline excavator.
Author Contributions: Conceptualization, V.B. (Vera Barat) and S.E.; methodology, V.B. (Vera Barat)and V.B. (Vladimir Bardakov); software, V.B. (Vladimir Bardakov); validation, V.B. (Vera Barat)and D.K.; formal analysis, S.U.; investigation, V.B. (Vladimir Bardakov) and D.K.; resources, D.K.and S.E.; data curation, V.B. (Vera Barat), M.K. (Marina Karpova), M.K. (Mikhail Kuznetsov), andA.Z.; writing—original draft preparation, V.B. (Vera Barat); writing—review and editing, A.M.;visualization, S.U.; supervision, S.E.; project administration, D.K. and S.E.; funding acquisition, V.B.(Vera Barat). All authors have read and agreed to the published version of the manuscript.
Funding: The research was carried out within the framework of the project “Diagnostics of dissimilarwelded joints of pearlitic and austenitic steels by the acoustic emission” with the support of a grantfrom NRU “MPEI” for implementation of scientific research programs “Energy”, “Electronics, RadioEngineering and IT”, and “Industry 4.0, Technologies for Industry and Robotics” in 2020–2022 (projectNo. 20/22-0000028/44).
Institutional Review Board Statement: Not applicable.
Informed Consent Statement: Not applicable.
Data Availability Statement: The data presented in this study are available on request from thecorresponding author.
Conflicts of Interest: The authors declare no conflict of interest.
References1. Guericke, B.L.; Abramov, I.L.; Guericke, P.B. The strategy of preventive maintenance of mining machines based on the recognition
of their actual technical condition. Min. J. 2008, 7, 70–80.2. Dorosheev, Y.S.; Kirichuk, A.S. Problems of increasing the technological reliability of mining equipment. Min. Inf. Anal. Bull.
2010, 3, 176–182.3. Chiementin, X.; Mba, D.; Charnley, B.; Lignon, S.; Dron, J.P. Effect of the denoising on acoustic emission signals. J. Vib. Acoust.
2010, 132, 310091–310099. [CrossRef]4. Rastegaev, A.; Linderov, M.L.; Merson, D.L.; Afanasyev, M.A.; Danyuk, A.V. Monitoring of fracture of welded joints in hazardous
facilities by acoustic emission under static and cyclic loadings. Indian J. Sci. Technol. 2015, 8, 1–7. [CrossRef]5. Elizarov, S.V.; Barat, V.A.; Terentyev, D.A.; Kostenko, P.P.; Bardakov, V.V.; Alyakritsky, A.L.; Koltsov, V.G.; Trofimov, P.N. Acoustic
Emission Monitoring of Industrial Facilities under Static and Cyclic Loading. Appl. Sci. 2018, 8, 1228. [CrossRef]6. Cockerill, A.; Clarke, A.; Pullin, R.; Bradshaw, T.; Cole, P.; Holford, K.M. Determination of rolling element bearing condition via
acoustic emission. J. Eng. Tribol. 2016, 230, 1377–1388. [CrossRef]

Appl. Sci. 2021, 11, 3420 15 of 15
7. Beale, C.; Niezrecki, C.; Inalpolat, M. An adaptive wavelet packet denoising algorithm for enhanced active acoustic damagedetection from wind turbine blades. Mech. Syst. Signal Process. 2020, 142, 106754. [CrossRef]
8. Bejger, A.; Drzewieniecki, J.B. The use of acoustic emission to diagnosis of fuel injection pumps of marine diesel engines. Energies2019, 12, 4661. [CrossRef]
9. Johnson, M.; Ozevin, D.; Washer, G.; Ono, K.; Gostautas, R.; Tamutus, T. Acoustic emission method for real-time detection of steelfatigue crack in eyebar. Transp. Res. Rec. J. Transp. Res. Board 2012, 2313, 72–79. [CrossRef]
10. Nowak, M.; Lyasota, I.; Kisała, D. Testing the Node of a Railway Steel Bridge Using an Acoustic Emission Method. Advances inAcoustic Emission Technology. In Advances in Acoustic Emission Technology; Springer Proceedings in Physics; Springer: Cham,Switzerland, 2017; pp. 265–275.
11. Wang, H.; Huang, Z.; Liao, Z.; Jiang, B.; Wang, J.; Yang, Y.; Yang, B. From noise to information: A new technology of olefinpolymerization fluidized bed reactor based on acoustic emission. J. Zhejiang Univ. Sci. A 2017, 18, 245–255. [CrossRef]
12. Anastasopoulos, A.; Kourousis, D.; Botten, S.; Wang, G. Acoustic emission monitoring for detecting structural defects in vesselsand offshore structures. Ships Offshore Struct. 2009, 4, 363–372. [CrossRef]
13. Niccolini, G.; Lacidogna, G.; Carpinteri, A. Structural stability assessment of double girder crane by acoustic emission technique.In Proceedings of the ICF 2017—14th International Conference on Fracture, Rhodes, Greece, 18–23 June 2017; pp. 503–504.
14. Wu, Z.; Shen, G.; Zhang, J.; Tao, X.; Ni, D. Investigation of acoustic emission characteristics on harbor portal crane. In Advances inAcoustic Emission Technology; Springer Proceedings in Physics; Springer: Cham, Switzerland, 2017; pp. 243–250.
15. Xu, B.; Wu, Q. Stress fatigue crack propagation analysis of crane structure based on acoustic emission. Eng. Fail. Anal. 2020, 109,104206. [CrossRef]
16. Nasonov, M.Y.; Lykov, Y.V.; Trong, D.D. The study of the resource and durability of metal structures of excavators after theexpiration of the service life. Ugol 2020, 1127, 13–17. [CrossRef]
17. Muravin, G.; Muravin, B.; Lezvinsky, L. Acoustic emission non-destructive inspection method for cranes. Weld. World 2008, 52,211–215.
18. PB 03-593-03. Regulations on Organization and Execution for Acoustic-Emission Inspection of Vessels, Boilers, Apparatus and ProcessPiping; Regulatory Document; PIO OBT Publishing: Moscow, Russia, 2003. (In Russian)
19. Barat, V.; Marchenkov, A.; Elizarov, S. Estimation of Fatigue Crack AE Emissivity Based on the Palmer–Heald Model. Appl. Sci.2019, 9, 4851. [CrossRef]
20. Li, J.; Rose, J.L. Excitation and propagation of non-axisymmetric guided waves in a hollow cylinder. J. Acoust. Soc. Am. 2001, 109,457–464. [CrossRef] [PubMed]
21. Seco, F.; Jiménez, A.R. Modelling the generation and propagation of ultrasonic signals in cylindrical waveguides. In UltrasonicWaves; State University of Campinas: Campinas, Brazil, 2012; pp. 1–28.
22. Viktorov, I. Rayleigh and Lamb Waves. Physical Theory and Applications, 1st ed.; Springer: Hawthorne, CA, USA, 1967; p. 154.23. Barat, V.; Terentyev, D.; Bardakov, V.; Elizarov, S. Analytical Modeling of Acoustic Emission Signals in Thin-Walled Objects. Appl.
Sci. 2020, 10, 279. [CrossRef]