Structural geometry, microstructural and strain analyses of L-tectonites from Paleoproterozoic...
20
Structural geometry, microstructural and strain analyses of L-tectonites from Paleoproterozoic orthogneiss: Insights into local transport-parallel constrictional strain in the Sikkim Himalayan fold thrust belt Kathakali Bhattacharyya ⇑ , Harsh Vardhan Dwivedi, Jyoti Prasad Das, Sagar Damania Department of Earth Sciences, Indian Institute of Science Education and Research Kolkata (IISERK), Mohanpur 741246, West Bengal, India article info Article history: Received 8 December 2014 Received in revised form 12 April 2015 Accepted 24 April 2015 Available online 9 May 2015 Keywords: L tectonites Darjeeling Sikkim Himalayan fold thrust belt Lingtse orthogneiss Strain analysis Lateral ramp Flinn plot Shear zones Mylonites Structural geology abstract Paleoproterozoic Lingtse orthogneiss shows three dominant structural associations in the Sikkim Himalayan fold thrust belt (FTB): (a) these rocks locally define the Pelling thrust (PT) zone that lies in the footwall of the Main Central thrust (MCT), (b) they occur as linear, almost N–S trending imbricates within the PT sheet, and (c) they form a N–S trending 13.5 km long, 2 km wide discontinuous linear mylonitic klippen within the Daling Formation of the lower Lesser Himalayan Sequence (LHS) that lie east of the N–S trending Teesta valley. The klippe records N–S trending, strong L-tectonites that are spatially associated with LS and SL tectonites; the stretching lineations are oriented along the transport direction. These rocks are exposed along three mylonite zones. From north to south these are the Phodong mylonite zone, the Tumin Eingee mylonite zone and the Rumtek mylonite zone. All the three mylonite zones are overall folded along gently plunging, transport-parallel, N–S trending synform with the strongest L fabric developed along the hinge zone, and its dominance decreases pro- gressively toward the eastern and western structural contacts of the klippen. The highest constrictional strain is recorded in Phodong and Tumin-Eingee mylonite zones and decreases south toward Rumtek mylonite zone. The long axes (X) of the quartz strain ellipsoids show N–S trend and gentle plunge that agrees with the stretching lineations observed in the field. Additionally, the XY plane of the generated ellipsoids overall agree with the observed variation of the mylonitic foliation planes in the field from all the three locations. Microstructural analysis from the mylonite klippe suggests that quartz and feldspar have undergone 35% and 76% grain size reduction with respect to the protolith. Dislocation creep and microfracturing are the dominant deformation mechanisms in quartz and feldspar, respectively. The grain-size reduction is more prominent near the eastern and the western boundaries as they mark structural contacts between the L tectonites and the Daling phyllites. Strain is partitioned between quartz and feldspar in the mylonite zones with quartz recording constrictional strain while feldspar records flattening strain. We explain this variation due to their different deformation mechanisms. Shear-sense analysis of feldspar porphyroclasts suggest dominantly transport-parallel flow along with a component of transport- perpendicular flow in the mylonite zones. Existing models on mechanism of L tectonite formation and transport-parallel folds do not completely explain our observations. We propose the possible existence of a lateral ramp beneath the PT sheet to explain the generation of L tectonites and transport-parallel fold in the study area. Ó 2015 Elsevier Ltd. All rights reserved. 1. Introduction Paleoproterozoic felsic orthogneiss is an integral component of the Lesser Himalayan fold thrust belt (FTB). The nature of the con- tact between these rocks and the adjacent rocks of the lower Lesser Himalayan sequence (LHS) varies from gradational contact (Le Fort, 1975; Le Fort and Raï, 1999), to thrust contact (Gansser, 1964; Yin, 2006; Yin et al., 2009), to intrusive igneous rocks (Decelles et al., 2000), and finally to porphyric extrusive contact (Le Fort, 1975; Le Fort and Raï, 1999) in different parts of the Himalayan orogen. Additionally, these rocks have been described as part of the Indian cratonic basement (Gansser, 1964; Yin, 2006; Yin et al., 2009) or as part of a Paleoproterozoic arc on the northern margin of the Indian plate (Kohn et al., 2010). http://dx.doi.org/10.1016/j.jseaes.2015.04.038 1367-9120/Ó 2015 Elsevier Ltd. All rights reserved. ⇑ Corresponding author. E-mail address: [email protected] (K. Bhattacharyya). Journal of Asian Earth Sciences 107 (2015) 212–231 Contents lists available at ScienceDirect Journal of Asian Earth Sciences journal homepage: www.elsevier.com/locate/jseaes
Transcript of Structural geometry, microstructural and strain analyses of L-tectonites from Paleoproterozoic...

Journal of Asian Earth Sciences 107 (2015) 212–231
Contents lists available at ScienceDirect
Journal of Asian Earth Sciences
journal homepage: www.elsevier .com/locate / jseaes
Structural geometry, microstructural and strain analyses of L-tectonitesfrom Paleoproterozoic orthogneiss: Insights into local transport-parallelconstrictional strain in the Sikkim Himalayan fold thrust belt
http://dx.doi.org/10.1016/j.jseaes.2015.04.0381367-9120/� 2015 Elsevier Ltd. All rights reserved.
⇑ Corresponding author.E-mail address: [email protected] (K. Bhattacharyya).
Kathakali Bhattacharyya ⇑, Harsh Vardhan Dwivedi, Jyoti Prasad Das, Sagar DamaniaDepartment of Earth Sciences, Indian Institute of Science Education and Research Kolkata (IISERK), Mohanpur 741246, West Bengal, India
a r t i c l e i n f o
Article history:Received 8 December 2014Received in revised form 12 April 2015Accepted 24 April 2015Available online 9 May 2015
Keywords:L tectonitesDarjeeling Sikkim Himalayan fold thrustbeltLingtse orthogneissStrain analysisLateral rampFlinn plotShear zonesMylonitesStructural geology
a b s t r a c t
Paleoproterozoic Lingtse orthogneiss shows three dominant structural associations in the SikkimHimalayan fold thrust belt (FTB): (a) these rocks locally define the Pelling thrust (PT) zone that lies inthe footwall of the Main Central thrust (MCT), (b) they occur as linear, almost N–S trending imbricateswithin the PT sheet, and (c) they form a N–S trending �13.5 km long, �2 km wide discontinuous linearmylonitic klippen within the Daling Formation of the lower Lesser Himalayan Sequence (LHS) that lie eastof the N–S trending Teesta valley. The klippe records N–S trending, strong L-tectonites that are spatiallyassociated with LS and SL tectonites; the stretching lineations are oriented along the transport direction.These rocks are exposed along three mylonite zones. From north to south these are the Phodong mylonitezone, the Tumin Eingee mylonite zone and the Rumtek mylonite zone.
All the three mylonite zones are overall folded along gently plunging, transport-parallel, N–S trendingsynform with the strongest L fabric developed along the hinge zone, and its dominance decreases pro-gressively toward the eastern and western structural contacts of the klippen. The highest constrictionalstrain is recorded in Phodong and Tumin-Eingee mylonite zones and decreases south toward Rumtekmylonite zone. The long axes (X) of the quartz strain ellipsoids show �N–S trend and gentle plunge thatagrees with the stretching lineations observed in the field. Additionally, the XY plane of the generatedellipsoids overall agree with the observed variation of the mylonitic foliation planes in the field fromall the three locations.
Microstructural analysis from the mylonite klippe suggests that quartz and feldspar have undergone�35% and �76% grain size reduction with respect to the protolith. Dislocation creep and microfracturingare the dominant deformation mechanisms in quartz and feldspar, respectively. The grain-size reductionis more prominent near the eastern and the western boundaries as they mark structural contactsbetween the L tectonites and the Daling phyllites. Strain is partitioned between quartz and feldspar inthe mylonite zones with quartz recording constrictional strain while feldspar records flattening strain.We explain this variation due to their different deformation mechanisms. Shear-sense analysis of feldsparporphyroclasts suggest dominantly transport-parallel flow along with a component of transport-perpendicular flow in the mylonite zones.
Existing models on mechanism of L tectonite formation and transport-parallel folds do not completelyexplain our observations. We propose the possible existence of a lateral ramp beneath the PT sheet toexplain the generation of L tectonites and transport-parallel fold in the study area.
� 2015 Elsevier Ltd. All rights reserved.
1. Introduction
Paleoproterozoic felsic orthogneiss is an integral component ofthe Lesser Himalayan fold thrust belt (FTB). The nature of the con-tact between these rocks and the adjacent rocks of the lower Lesser
Himalayan sequence (LHS) varies from gradational contact (Le Fort,1975; Le Fort and Raï, 1999), to thrust contact (Gansser, 1964; Yin,2006; Yin et al., 2009), to intrusive igneous rocks (Decelles et al.,2000), and finally to porphyric extrusive contact (Le Fort, 1975;Le Fort and Raï, 1999) in different parts of the Himalayan orogen.Additionally, these rocks have been described as part of theIndian cratonic basement (Gansser, 1964; Yin, 2006; Yin et al.,2009) or as part of a Paleoproterozoic arc on the northern marginof the Indian plate (Kohn et al., 2010).

K. Bhattacharyya et al. / Journal of Asian Earth Sciences 107 (2015) 212–231 213
In the Darjeeling–Sikkim Himalaya, the Paleoproterozoicorthogneiss is called the Lingtse gneiss (Fig. 1), and these rocksshow a consistent structural contact with its adjacent lower LHSrocks (Schwan, 1980; Bhattacharyya and Mitra, 2009, 2011,2014; Bhattacharyya et al., 2013). The Lingtse gneiss, along withlower amphibolite facies paragneiss, Paro Formation, forms thePelling thrust (PT) sheet that lies in the footwall of the MainCentral thrust (MCT) (Figs. 1 and 2). The PT has been previouslydescribed as the MCT2 of the Darjeeling–Sikkim Himalaya(Bhattacharyya and Mitra, 2011, 2014). In terms of its structuralposition it is equivalent to the Munsiari thrust of the KumaonHimalaya (Valdiya, 1980; Srivastava and Mitra, 1994). The gran-ulite facies Kanchenjunga/Darjeeling gneiss forms the structurallyoverlying MCT sheet. Both the MCT and PT sheets are folded bythe underlying Lesser Himalayan duplex (Fig. 2, Bhattacharyyaand Mitra, 2009; Mitra and Bhattacharyya, 2011). Erosion throughthe MCT and PT sheets has formed a half-window, the Teesta halfwindow (Fig. 1), exposing the footwall rocks of the LHS.
In this region, the Lingtse gneiss shows three dominant struc-tural associations (Fig. 1): (a) these rocks locally define the PT faultzone and the immediately overlying parts of the PT sheet
Fig. 1. Regional map of the Darjeeling–Sikkim Himalayan fold thrust belt (FTB) sho(Bhattacharyya and Mitra, 2009). Paleoproterozoic Lingtse orthogneiss and Paro paragnCentral thrust (MCT). Lingtse orthogneiss shows three dominant structural associationslinear, almost N–S trending imbricates within the PT sheet, and (c) they form a N–S treDaling Formation of the lower Lesser Himalayan Sequence (LHS). The L tectonites are exp(TI) and Rumtek mylonite zone (Ru). The number of Lingtse imbricates are higher in the1:25,000, along three transects: (i) Gangtok–Mangan Highway, (ii) Gangtok–Rakdong roaLocation of Fig. 6 is marked as a box. MFT – Main Frontal Thrust; MBT – Main Boundargranites Towns shown are: C – Chungthang; Dj – Darjeeling; Di – Dikchu; G – Gangtok; J–
(Bhattacharyya and Mitra, 2011), (b) more commonly, they occuras imbricates within the PT sheet that form linear, almost N–Strending outcrop belts on the flanks of the Teesta half-window(Bhattacharyya, 2010), and (c) they also form linear, discontinuousklippen overlying the lower LHS rocks that lie 4–8 km east of theN–S trending Teesta valley (Fig. 1). Interestingly, the Lingtse gneissshows variation in its deformation fabric depending on the struc-tural associations. These rocks generally record a prominent gneis-sic foliation with characteristic feldspar augen (Fig. 3) in the firsttwo structural associations. However, in the third case they forma N–S trending, prominent L-tectonite zone that shows spatial vari-ations with both L > S and S > L tectonite fabrics (Fig. 4); thestretching lineation is oriented along the transport-parallel direc-tion (N–S). We refer to this suite of rocks as L tectonites throughoutthe rest of the paper. These rocks form discontinuous klippen alonga �13.5 km long, linear, N–S transect with �2 km outcrop width.
Presence of L tectonites signifies constrictional strain (Flinn,1965) that is relatively rare in nature (Pfiffner and Ramsay, 1982;Sullivan, 2009, 2013). Generally in FTB settings existence of frontalramps lead to transport-perpendicular shortening structures(Boyer and Elliot, 1982; Mookerjee and Mitra, 2009). The presence
wing the major litho-tectonic units that are separated by folded thrust faultseiss form the Pelling thrust (PT) sheet which is the footwall imbricate of the Mainin the region: (a) they locally define the Pelling thrust (PT) zone (b) they occur as
nding �13.5 km long, �2 km wide discontinuous narrow linear klippen within theosed along three klippen: Phodong mylonite zone (Ph), Tumin Eingee Mylonite zoneeastern PT sheet than in the west. We carried out detailed mapping at the scale of
d, and (iii) Gangtok to Rumtek road. The main faults are labeled (see text for details).y Thrust; RT – Ramgarh Thrust; STDS: South Tibetan Detachment System MioceneM – Mangan; My – Mayangchu; Pe – Pelling; Ru – Rumtek; K: Kathmandu; D: Delhi.

Fig. 2. The regional balanced cross-section from Darjeeling–Sikkim Himalaya (Bhattacharyya and Mitra, 2011) showing that the MCT and PT sheets are folded in an antiform–synform pair by the growth of the Lesser Himalayan Duplex (Bhattacharyya and Mitra, 2009).
Fig. 3. Lingtse gneiss exposed within the PT sheet showing the well developedgneissic foliation defined by shape-preferred alignment of feldspar and quartzalternating with biotite and muscovite.
Fig. 4. Lingtse gneiss exposed in the Phodong Mylonite zone forming an L tectonite(looking N). Stretched quartz, biotite and feldspar grains define the strong L fabricalong the transport direction, and is absent in the transport-perpendicular section.Pencil for scale.
214 K. Bhattacharyya et al. / Journal of Asian Earth Sciences 107 (2015) 212–231
of transport-parallel constrictional strain in FTB is less common,and therefore, requires attention. In this paper, our objectives arefivefold. First, we constrain the structural geometry of the exposed
L-tectonite zones from the three klippen in the eastern SikkimHimalayan FTB, based on field observations. Second, usingmicrostructural analysis, we decipher the operative deformationmechanisms within this zone. Third, we quantify the constrictionalstrain in this zone, and examine how it varies laterally and alongthe transport direction within the L-tectonite zone. Fourth, weexamine how the strain is partitioned between quartz and feldsparwithin the L tectonite zone. Fifth, we integrate our results, andevaluate the existing kinematic models on L tectonite formation(Sullivan, 2009, 2013) to propose a new mechanism that canexplain the formation of these L-tectonites in the study area. Thisis the first study from the L-tectonites of the Himalayan FTB.
2. Background
2.1. Regional geology
The lithotectonic units in the Himalayan FTB are separated bymajor folded thrust systems. From north to south, these units arethe Greater Himalayan sequence (GHS), the Lesser Himalayansequence (LHS), and the Sub Himalayan sequence (SHS) (Fig. 1).The corresponding separating thrusts are the Main Central thrust(MCT), the Main Boundary thrust (MBT), and the Main Frontalthrust (MFT). Additionally, the sub-MCT, Pelling thrust (PT), theRamgarh thrust (RT) and the Lesser Himalayan duplex (LHD) areprominent structural entities that accommodate a significant pro-portion of the Lesser Himalayan shortening in the FTB (Mitra et al.,2010).
In the Sikkim Himalaya, the LHS is structurally divided into anupper level, bounded by the MCT (Imamura et al., 2011;Bhattacharyya and Ghosh, 2014) above and the PT below(Bhattacharyya et al., in review), and a lower LHS, bounded bythe PT above and the MBT below (Fig. 5). Upper greenschist toamphibolite facies paragneiss of Paro Formation and the Lingtseorthogneiss form the structurally higher LHS. The lower green-schist facies phyllites and quartzites of Daling Group, carbonatesand slates of Buxa Formation, and the slates and sandstones ofGondwana Group constitute the structurally lower LHS in the area(Fig. 5). This study focuses on the geometry and kinematics of the Ltectonites recorded within the Lingtse orthogneiss from the struc-turally higher LHS klippen in the eastern Sikkim Himalayan FTB(Fig. 1).
2.2. Review of existing models on L tectonite formation
Due to the generally rare occurrence of constrictional strain innature, studies on the mechanisms of L tectonites was somewhat
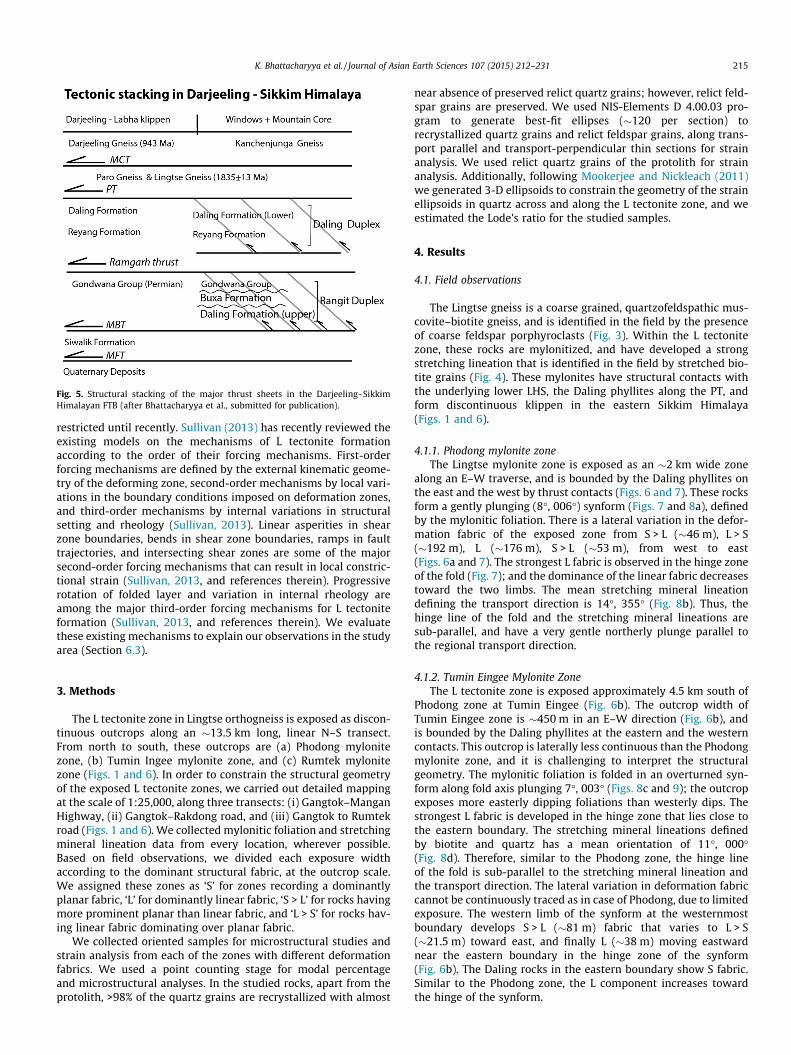
Fig. 5. Structural stacking of the major thrust sheets in the Darjeeling–SikkimHimalayan FTB (after Bhattacharyya et al., submitted for publication).
K. Bhattacharyya et al. / Journal of Asian Earth Sciences 107 (2015) 212–231 215
restricted until recently. Sullivan (2013) has recently reviewed theexisting models on the mechanisms of L tectonite formationaccording to the order of their forcing mechanisms. First-orderforcing mechanisms are defined by the external kinematic geome-try of the deforming zone, second-order mechanisms by local vari-ations in the boundary conditions imposed on deformation zones,and third-order mechanisms by internal variations in structuralsetting and rheology (Sullivan, 2013). Linear asperities in shearzone boundaries, bends in shear zone boundaries, ramps in faulttrajectories, and intersecting shear zones are some of the majorsecond-order forcing mechanisms that can result in local constric-tional strain (Sullivan, 2013, and references therein). Progressiverotation of folded layer and variation in internal rheology areamong the major third-order forcing mechanisms for L tectoniteformation (Sullivan, 2013, and references therein). We evaluatethese existing mechanisms to explain our observations in the studyarea (Section 6.3).
3. Methods
The L tectonite zone in Lingtse orthogneiss is exposed as discon-tinuous outcrops along an �13.5 km long, linear N–S transect.From north to south, these outcrops are (a) Phodong mylonitezone, (b) Tumin Ingee mylonite zone, and (c) Rumtek mylonitezone (Figs. 1 and 6). In order to constrain the structural geometryof the exposed L tectonite zones, we carried out detailed mappingat the scale of 1:25,000, along three transects: (i) Gangtok–ManganHighway, (ii) Gangtok–Rakdong road, and (iii) Gangtok to Rumtekroad (Figs. 1 and 6). We collected mylonitic foliation and stretchingmineral lineation data from every location, wherever possible.Based on field observations, we divided each exposure widthaccording to the dominant structural fabric, at the outcrop scale.We assigned these zones as ‘S’ for zones recording a dominantlyplanar fabric, ‘L’ for dominantly linear fabric, ‘S > L’ for rocks havingmore prominent planar than linear fabric, and ‘L > S’ for rocks hav-ing linear fabric dominating over planar fabric.
We collected oriented samples for microstructural studies andstrain analysis from each of the zones with different deformationfabrics. We used a point counting stage for modal percentageand microstructural analyses. In the studied rocks, apart from theprotolith, >98% of the quartz grains are recrystallized with almost
near absence of preserved relict quartz grains; however, relict feld-spar grains are preserved. We used NIS-Elements D 4.00.03 pro-gram to generate best-fit ellipses (�120 per section) torecrystallized quartz grains and relict feldspar grains, along trans-port parallel and transport-perpendicular thin sections for strainanalysis. We used relict quartz grains of the protolith for strainanalysis. Additionally, following Mookerjee and Nickleach (2011)we generated 3-D ellipsoids to constrain the geometry of the strainellipsoids in quartz across and along the L tectonite zone, and weestimated the Lode’s ratio for the studied samples.
4. Results
4.1. Field observations
The Lingtse gneiss is a coarse grained, quartzofeldspathic mus-covite–biotite gneiss, and is identified in the field by the presenceof coarse feldspar porphyroclasts (Fig. 3). Within the L tectonitezone, these rocks are mylonitized, and have developed a strongstretching lineation that is identified in the field by stretched bio-tite grains (Fig. 4). These mylonites have structural contacts withthe underlying lower LHS, the Daling phyllites along the PT, andform discontinuous klippen in the eastern Sikkim Himalaya(Figs. 1 and 6).
4.1.1. Phodong mylonite zoneThe Lingtse mylonite zone is exposed as an �2 km wide zone
along an E–W traverse, and is bounded by the Daling phyllites onthe east and the west by thrust contacts (Figs. 6 and 7). These rocksform a gently plunging (8�, 006�) synform (Figs. 7 and 8a), definedby the mylonitic foliation. There is a lateral variation in the defor-mation fabric of the exposed zone from S > L (�46 m), L > S(�192 m), L (�176 m), S > L (�53 m), from west to east(Figs. 6a and 7). The strongest L fabric is observed in the hinge zoneof the fold (Fig. 7); and the dominance of the linear fabric decreasestoward the two limbs. The mean stretching mineral lineationdefining the transport direction is 14�, 355� (Fig. 8b). Thus, thehinge line of the fold and the stretching mineral lineations aresub-parallel, and have a very gentle northerly plunge parallel tothe regional transport direction.
4.1.2. Tumin Eingee Mylonite ZoneThe L tectonite zone is exposed approximately 4.5 km south of
Phodong zone at Tumin Eingee (Fig. 6b). The outcrop width ofTumin Eingee zone is �450 m in an E–W direction (Fig. 6b), andis bounded by the Daling phyllites at the eastern and the westerncontacts. This outcrop is laterally less continuous than the Phodongmylonite zone, and it is challenging to interpret the structuralgeometry. The mylonitic foliation is folded in an overturned syn-form along fold axis plunging 7�, 003� (Figs. 8c and 9); the outcropexposes more easterly dipping foliations than westerly dips. Thestrongest L fabric is developed in the hinge zone that lies close tothe eastern boundary. The stretching mineral lineations definedby biotite and quartz has a mean orientation of 11�, 000�(Fig. 8d). Therefore, similar to the Phodong zone, the hinge lineof the fold is sub-parallel to the stretching mineral lineation andthe transport direction. The lateral variation in deformation fabriccannot be continuously traced as in case of Phodong, due to limitedexposure. The western limb of the synform at the westernmostboundary develops S > L (�81 m) fabric that varies to L > S(�21.5 m) toward east, and finally L (�38 m) moving eastwardnear the eastern boundary in the hinge zone of the synform(Fig. 6b). The Daling rocks in the eastern boundary show S fabric.Similar to the Phodong zone, the L component increases towardthe hinge of the synform.

Fig. 6. Detailed maps of the Lingtse mylonite zones from Phodong, Tumin Eingee and Rumtek zones from north to south. The Lingtse mylonite zone is bounded by the Dalingphyllites on the east and the west by thrust contacts. Based on relative dominance of L and S fabric, we have divided the exposures into different deformation fabric zones (seetext), and have represented them by different colors. The strongest L fabric is localized near the hinge zone, and decreases progressively toward the structural boundaries.
216 K. Bhattacharyya et al. / Journal of Asian Earth Sciences 107 (2015) 212–231
4.1.3. Rumtek mylonite zoneThe same L-tectonite zone is exposed �9 km south in the trans-
port direction, near Rumtek, along an �1.5 km wide E–W transect
(Fig. 6c). The outcrop dominantly exposes the easterly dipping mylo-nitic foliations. Similar to the northern outcrop of Tumin Eingee, thezone is folded in an overturned synform along a hinge line plunging

Fig. 7. Cross section of the Phodong mylonite zone constructed perpendicular to the lineation (transport) direction showing that the zone is folded along a gently plunging(8�, 006�) synform. The spatial variation in deformation fabrics is shown by different colors. The strongest L fabric is localized along the hinge zone. Strain ellipsoids ofdeformed quartz grains from different deformation zones are shown in the cross section (please see text). The ellipsoid geometries from different deformation zones agreewith our field observations. The long axis (X) of the quartz ellipsoids show �N–S trend and gentle plunge that agrees with the stretching lineations observed in the field. TheXY plane of the generated ellipsoids overall agree with the observed variation of the mylonitic foliation planes in the field. Relative proportions of various microstructures asmeasured in quartz and feldspar from various deformation zones are shown (please see text); the numbers indicate the percentages of the various microstructures. (Forinterpretation of the references to colour in this figure legend, the reader is referred to the web version of this article.)
K. Bhattacharyya et al. / Journal of Asian Earth Sciences 107 (2015) 212–231 217
9�, 351� (Figs. 8e and 10). Biotite and quartz define a stretching min-eral lineation with a mean orientation of 11�, 003� (Fig. 8f). The lat-eral variation in the deformation fabric is similar to the Phodongmylonitic zone. Daling phyllites, immediately west of the westerncontact, shows S fabric. Within the Lingtse mylonite zone, the fabricvaries from S > L (�305 m), L > S (�70 m), L (�47 m) and to S > L(�188 m) zone from west to east (Fig. 6c). The strongest L tectonitezone coincides with the hinge zone of the fold.
4.2. Microstructures
4.2.1. ProtolithIn order to evaluate the operative deformation mechanisms
within the L tectonite zone, we have studied the microstructuresfrom a Lingtse gneiss protolith from outside the L tectonite zone,as a reference point. This sample is located within the PT sheet,�9 km east of the Phodong mylonite zone (Fig. 1).
The protolith is a medium grained quartz–feldspar–muscovite–biotite bearing orthogneiss (Fig. 11a). The rock has a well devel-oped gneissic foliation with �1.5 mm thick quartzofeldspathicbands alternating with �0.1 mm thick muscovite–biotite bands.The protolith preserves relict igneous textures such as myrmekitictextures (Fig. 11a). The modal percentages of the dominant miner-als in the protolith are quartz (�52%), feldspar (�27%), muscovite(�17%) and biotite (�4%) (Fig. 12a). The average grain sizes ofquartz and feldspar are �184 and �218 lm, respectively (Fig. 13a).
The most dominant microstructure in quartz is unduloseextinction as recorded in �94% of the total quartz grain (Fig. 14),followed by subgrain formation (�26%), intragranular fractures(�25%), deformation lamellae (�5%), and deformation band(�2.5%). Feldspar shows lesser abundance of microstructures withundulose extinction and intragranular fracturing each recorded in�7% of the total feldspar grains (Fig. 14).
4.2.2. Lingtse mylonite klippe4.2.2.1. Phodong mylonite zone. We have studied representativethin sections from all the zones with different deformation
fabrics. The Lingtse orthogneiss protolith has undergone promi-nent grain size reduction, and change in composition withinthe L tectonite zone. It is exposed as a fine to medium grainedquartz–muscovite–biotite–feldspar bearing mylonite. In thetransport (and lineation) parallel section, the mylonitic foliationis defined by shape-preferred orientations of recrystallizedquartz, feldspar porphyroclasts, muscovite and biotite(Fig. 11b). In the transport (and lineation) perpendicular sec-tions, this shape-preferred orientation is absent. Additionally,the quartzo-feldspathic domain is completely encircled by ran-domly oriented muscovite grains (Fig. 11c) suggesting their ori-gin by constrictional deformation (Sullivan, 2013). In themylonite zone there are a few asymmetric feldspar porphyro-clasts present that we used as shear-sense indicators (Fig. 11d,Section 4.3).
There is a variation in the modal percentages of the constituentminerals within the Phodong mylonite zone (Fig. 12a). The L tec-tonite from the hinge zone (L19, Fig. 12a) is composed of quartz(�53%), muscovite (�21.5%), biotite (�14%) and feldspar(�11.5%). The composition changes to quartz (�70%), muscovite(�13%), biotite (�10%) and feldspar (�7%) within the western limbin the S > L tectonite (L1, Fig. 12a), near the western contact.Within the L > S tectonite zone (L4, Fig. 12a) that lies immediatelywest of the L tectonite in the hinge zone, the modal percentages ofthe dominant minerals are quartz (�57%), biotite (�19.5%), mus-covite (�16.5%) and feldspar (�7%). Near the eastern boundary ofthe mylonite zone, within the L > S tectonite in the eastern limb(L22, Fig. 12a), the composition changes to quartz (�48%), biotite(�27%), feldspar (�16%), and muscovite (�9%). Therefore, the pro-tolith has dominantly undergone feldspar reduction within themylonite zone. At a first order, there is also a greater reductionin feldspar closer to the western boundary than in the middle ofthe mylonite zone. We note that the easternmost sample of thisstudy (L22, Fig. 7) lies at the L-L > S boundary and does not repre-sent the structural easternmost contact, and therefore, the feldsparreduction could not be examined for the eastern structural contactof the zone.

Fig. 8. Equal area projection of poles to mylonitic foliation and stretching lineation data from the three studied mylonite zones; the contour interval is 1% area. (a) Myloniticfoliation data from Phodong mylonite zone suggest that it is folded along 8�, 006�. (b) Mylonitic foliation data from Tumin Eingee suggest it is folded along 7�, 003�. (c) Poles tothe mylonitic foliation data is gently folded along 9�, 351�. (d) The stretching lineation data from Phodong mylonite zone show a mean of 14�, 355�. (e) The mean of themineral lineation data at Tumin Eingee is 11�, 360�. (f) The mean stretching lineation data is 11�, 003� at Rumtek mylonite zone.
218 K. Bhattacharyya et al. / Journal of Asian Earth Sciences 107 (2015) 212–231
Although there is a lateral variation in grain sizes, quartz andfeldspar record �76% and �23% grain size reduction, respectively,as compared to the protolith (Fig. 13a). The grain size reduction ismore prominent at the two boundaries of the klippe with the SLzone recording �78% and �32% grain size reduction in quartzand feldspar, respectively.
There is also a lateral variation in the microstructures recordedin quartz and feldspar within the Phodong mylonite zone. Therecrystallized quartz continue to show undulose extinction sug-gesting dynamic recrystallization within the mylonite zone. The Ltectonite from the hinge zone (L19, Fig. 7) shows that �97% ofthe quartz records undulose extinction, followed by subgrain for-mation (�46%), intragranular (�22%) and transgranular (�7%) frac-tures, deformation lamellae (�5%), and deformation band (�2%).The S > L zone in the western limb (L1, Fig. 7) has �96% of the
quartz recording undulose extinction, followed by subgrain forma-tion (�38%), intragranular (�9%) and transgranular (�2%) frac-tures, and deformation band (�3%). East of this zone, within theL > S tectonite of the western limb (L4, Fig. 7) the differentmicrostructures recorded in total number of quartz are unduloseextinction (�95%), subgrain formation (�52%), intragranular frac-ture (�64%), and transgranular fracture (�2%). Within the L > Szone (L22, Fig. 7) in the eastern limb of the fold, close to the easternboundary, �92% of all quartz shows undulose extinction, followedby subgrain formation (�41%), intragranular fracture (�15%) anddeformation band (�4%).
Feldspar records similar lateral variation in the microstructureswithin the zone. The L tectonite zone at the hinge (L19, Fig. 7) has�95% of feldspar showing undulose extinction, followed by intra-granular fracture (�85%), deformation lamellae (�53%), subgrain

Fig. 9. Cross section of Tumin Eingee mylonite zone constructed perpendicular to the lineation (transport) direction; the spatial variation in deformation fabrics is shown bydifferent colors. The outcrops are laterally lesser continuous than the Phodong mylonite zone, and provides a challenge to reconstruct the entire geometry. Based on theexposed outcrops, we reconstruct the geometry as a gently plunging (7�, 003�), overturned synform with the hinge localizing the strongest L fabric. Strain ellipsoids ofdeformed quartz grains from different deformation zones are shown in the cross section (please see text). The ellipsoid geometries from different deformation zones generallyagree with our field observations. The long axis (X) of the quartz ellipsoids show �N–S trend and gentle plunge that agrees with the stretching lineations observed in the field.The XY plane of the generated ellipsoids overall agree with the observed variation of the mylonitic foliation planes in the field. Relative proportions of various microstructuresas measured in quartz and feldspar from various deformation zones are shown (please see text); the numbers indicate the percentages of the various microstructures. (Forinterpretation of the references to colour in this figure legend, the reader is referred to the web version of this article.)
Fig. 10. Cross section of Rumtek mylonite zone constructed perpendicular to the lineation (transport) direction. The spatial variation in deformation fabrics is shown bydifferent colors. The southernmost outcrop at Rumtek mylonite zone defines an overturned synform along 9�, 351�. The linear component increases as one moves from thestructural boundaries toward the hinge zone. Strain ellipsoids of deformed quartz grains from different deformation zones are shown in the cross section (please see text). Theellipsoid geometries from different deformation zones generally agree with our field observations. The long axis (X) of the quartz ellipsoids show �N–S trend and gentleplunge that agrees with the stretching lineations observed in the field. The XY plane of the generated ellipsoids overall agree with the observed variation of the myloniticfoliation planes in the field. Relative proportions of various microstructures as measured in quartz and feldspar from various deformation zones are shown (please see text);the numbers indicate the percentages of the various microstructures. (For interpretation of the references to colour in this figure legend, the reader is referred to the webversion of this article.)
K. Bhattacharyya et al. / Journal of Asian Earth Sciences 107 (2015) 212–231 219
formation (�15%), transgranular fracture (�18%); �82% of feldspargrains show sericitization. The S > L zone of the western limb (L1,Fig. 7) has �84% of feldspar recording undulose extinction, �40%
intragranular fracture and sericitization each, �25% subgrain for-mation, and �24% deformation band. Moving eastward, withinthe L > S zone (L4, Fig. 7), all the feldspar show undulose extinction,

Fig. 11. (a) Photomicrograph of the medium grained Lingtse gneiss protolith showing well developed gneissic foliation, and preserving relict igneous textures, i.e.,myrmekitic texture (Myr). (b) LS mylonite from Phodong mylonite zone showing development of mylonitic foliation defined by shape-preferred alignment of recrystallizedquartz, feldspar, muscovite and biotite, along transport parallel direction. (c) The shape-preferred mylonitic foliation is absent in transport-perpendicular direction and thequartzo-feldspathic domain (QF) is completely encircled by randomly oriented muscovite grains (Ms) suggesting their origin by constrictional deformation (Sullivan, 2013).(d) Asymmetric feldspar porphyroclasts (Kfs) defining the mylonitic foliation in SL zone and have been used as shear-sense indicators.
220 K. Bhattacharyya et al. / Journal of Asian Earth Sciences 107 (2015) 212–231
followed by subgrain formation (�86%), intragranular fracture(�86%), sericitization (�71%), transgranular fracture (�18%), anddeformation lamellae (�2%). Closer to the eastern boundary inthe L > S zone of the eastern limb (L22, Fig. 7), �32% of feldsparrecord undulose extinction, �26% subgrain formation and intra-granular fracture each; sericitization is recorded in �26% of thefeldspar (Fig. 7).
Therefore, compared to the protolith, there is more evidence ofplastic and cataclastic deformation microstructures in both quartzand feldspar within the mylonite zone. Additionally, feldsparrecords more fracturing, and sericitization within the hinges zone(L tectonite zone) and near the western contact of the mylonitezone.
4.2.3. Tumin Eingee mylonite zoneSimilar to the Phodong mylonite zone in the north, the myloni-
tic foliation is defined by recrystallized quartz, along with feldsparporphyroclasts, muscovite and biotite. The shape-preferred fabricis developed in the transport (lineation) parallel section, and isabsent in the transport-perpendicular section. Unlike thePhodong mylonite zone, the strongest L tectonite zone lies closeto the eastern boundary of the zone (Fig. 9) which coincides withthe hinge of the synform. At the western boundary, within theS > L zone (L-4C, Fig. 12b) modal percentages of constituent miner-als are quartz (�30.5%), muscovite (�42.5%), feldspar (�16%), andbiotite (�11%). Moving eastward, within the L > S zone (TI-29,Fig. 12b), the proportion of quartz and feldspar increase to �40%
and �24%, respectively; muscovite decreases to �15%, and biotiteincreases to �21%. Farther east within the L tectonite zone (TI59, Fig. 12b) the modal percentages are quartz (�63%), feldspar(�24%), biotite (�8%) and muscovite (�5%). Therefore, there is aninverse relationship between feldspar and muscovite near thewestern boundary of the mylonite zone suggesting sericitizationof feldspar in the presence of fluids.
Quartz and feldspar of the SL zone near the western boundary ofthe western limb of the synform record �75% and �50% grain sizereduction, with respect to the protolith (Fig. 13b). The grain sizeincreases in the middle in the LS zone where the reduction is�15% and �7%, respectively. Both quartz and feldspar record grainsize reduction in the L tectonite zone in the eastern boundary ofthe synformal hinge zone with �65% and �37%, respectively(Fig. 13b). The average grain size of quartz and feldspar grainshas reduced to �25% and 76%, respectively, as compared to theLingtse protolith.
There is also a lateral variation in the quartz and feldsparmicrostructures within the mylonite zone. At the western bound-ary, within the S > L zone, quartz shows undulose extinction(�89%), subgrain formation (�35%), intragranular (�14%) anddeformation band (�6%) (L4c, Fig. 9). Moving eastward, withinthe L > S zone, microstructures in quartz are undulose extinction(�100%), subgrain formation (�62%), intragranular (�9%) andtransgranular fracturing (�4%) (TI29, Fig. 9). Near the easternboundary, �98% of the total quartz from the L tectonite zone showundulose extinction followed by subgrain formation (�58%),
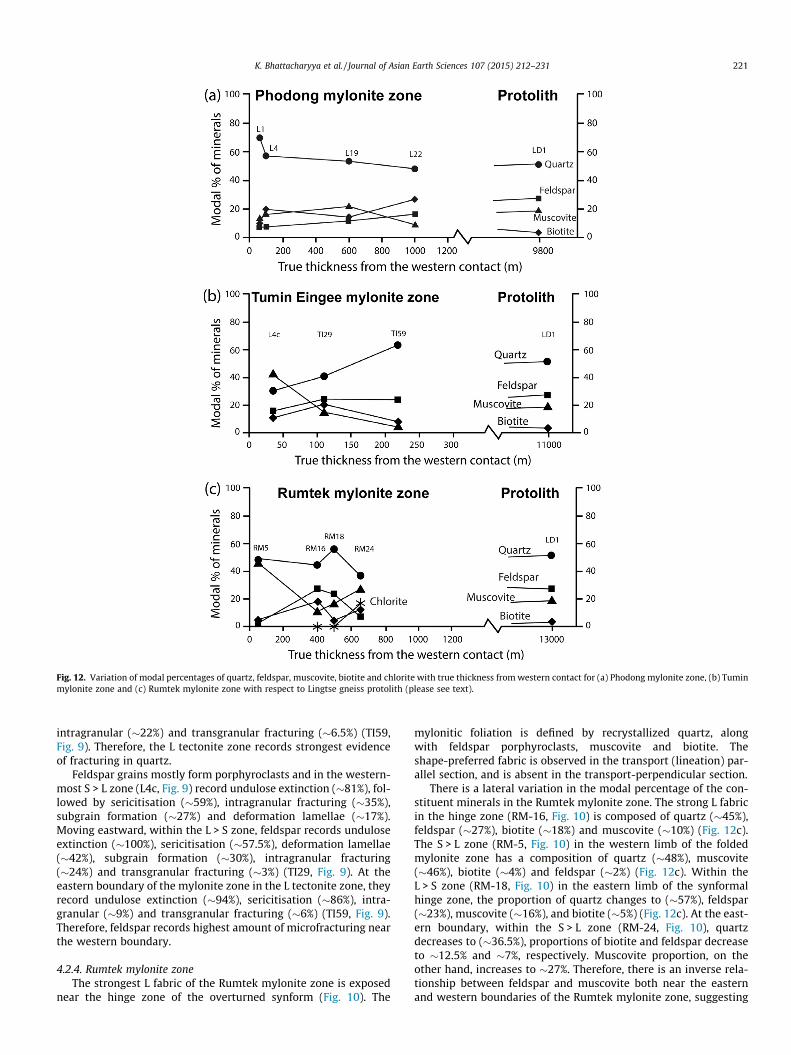
Fig. 12. Variation of modal percentages of quartz, feldspar, muscovite, biotite and chlorite with true thickness from western contact for (a) Phodong mylonite zone, (b) Tuminmylonite zone and (c) Rumtek mylonite zone with respect to Lingtse gneiss protolith (please see text).
K. Bhattacharyya et al. / Journal of Asian Earth Sciences 107 (2015) 212–231 221
intragranular (�22%) and transgranular fracturing (�6.5%) (TI59,Fig. 9). Therefore, the L tectonite zone records strongest evidenceof fracturing in quartz.
Feldspar grains mostly form porphyroclasts and in the western-most S > L zone (L4c, Fig. 9) record undulose extinction (�81%), fol-lowed by sericitisation (�59%), intragranular fracturing (�35%),subgrain formation (�27%) and deformation lamellae (�17%).Moving eastward, within the L > S zone, feldspar records unduloseextinction (�100%), sericitisation (�57.5%), deformation lamellae(�42%), subgrain formation (�30%), intragranular fracturing(�24%) and transgranular fracturing (�3%) (TI29, Fig. 9). At theeastern boundary of the mylonite zone in the L tectonite zone, theyrecord undulose extinction (�94%), sericitisation (�86%), intra-granular (�9%) and transgranular fracturing (�6%) (TI59, Fig. 9).Therefore, feldspar records highest amount of microfracturing nearthe western boundary.
4.2.4. Rumtek mylonite zoneThe strongest L fabric of the Rumtek mylonite zone is exposed
near the hinge zone of the overturned synform (Fig. 10). The
mylonitic foliation is defined by recrystallized quartz, alongwith feldspar porphyroclasts, muscovite and biotite. Theshape-preferred fabric is observed in the transport (lineation) par-allel section, and is absent in the transport-perpendicular section.
There is a lateral variation in the modal percentage of the con-stituent minerals in the Rumtek mylonite zone. The strong L fabricin the hinge zone (RM-16, Fig. 10) is composed of quartz (�45%),feldspar (�27%), biotite (�18%) and muscovite (�10%) (Fig. 12c).The S > L zone (RM-5, Fig. 10) in the western limb of the foldedmylonite zone has a composition of quartz (�48%), muscovite(�46%), biotite (�4%) and feldspar (�2%) (Fig. 12c). Within theL > S zone (RM-18, Fig. 10) in the eastern limb of the synformalhinge zone, the proportion of quartz changes to (�57%), feldspar(�23%), muscovite (�16%), and biotite (�5%) (Fig. 12c). At the east-ern boundary, within the S > L zone (RM-24, Fig. 10), quartzdecreases to (�36.5%), proportions of biotite and feldspar decreaseto �12.5% and �7%, respectively. Muscovite proportion, on theother hand, increases to �27%. Therefore, there is an inverse rela-tionship between feldspar and muscovite both near the easternand western boundaries of the Rumtek mylonite zone, suggesting

Fig. 13. Variation in mean grain-sizes of quartz and feldspar in (a) Phodong mylonite zone, (b) Tumin mylonite zone, (c) Rumtek mylonite zone with respect to Lingtse gneissprotolith (please see text).
222 K. Bhattacharyya et al. / Journal of Asian Earth Sciences 107 (2015) 212–231
the dominance of sericitization of feldspar at these two structuralcontacts.
With respect to the protolith, quartz and feldspar record �67%and �49% grain size reduction in the hinge zone of the folded L tec-tonite zone (Fig. 13c). In the western limb within the SL zone,quartz and feldspar record �87% and �8% grain size reduction,respectively. Within the LS zone in the eastern limb, there is�76% and �59% grain size reduction in quartz and feldspar. Nearthe eastern boundary of the eastern limb, in the SL zone, bothquartz and feldspar record a grain size reduction of �66% and�70%, respectively. Therefore, as compared to the protolith, quartzand feldspar have recorded an average grain size reduction of�74%and �46%, respectively, within the Rumtek mylonite zone.
There is also a lateral variation in the quartz and feldsparmicrostructures within the mylonite zone. Approximately 96% ofthe total quartz from the L tectonite zone (RM-16, Fig. 10) showundulose extinction followed by subgrain formation (�69%), intra-granular (�6%) and transgranular fracturing (�4%) (Fig. 10). TheS > L zone (RM-5, Fig. 10) in the western limb record differentmicrostructures in quartz with (�98%) showing undulose extinc-tion, followed by subgrain formation (�87%) and intragranular
fracturing (�12.5%). Within the L > S zone (RM-18, Fig. 10) on theeastern limb of the L tectonite, microstructures in quartz are undu-lose extinction (�100%), subgrain formation (�63%), intragranular(�7%) and transgranular fracturing (�1.5%) (Fig. 10). At the easternboundary, within the S > L zone (RM-24, Fig. 10), quartz showsundulose extinction (�97.5%), subgrain formation (�77%), intra-granular fracturing (�4%) (Fig. 10).
In the L tectonite zone, feldspar mainly forms porphyroclastsand dominantly records undulose extinction (�83.3%), sericitisa-tion (�83.3%), followed by subgrain formation, intragranular frac-turing, deformation lamellae (�33.3%) each and transgranularfracturing (�13%) (RM16, Fig. 10). The S > L zone in the westernlimb has undulose extinction (�63%), subgrain formation (�38%)and intragranular fracturing (�13%) (RM5, Fig. 10). In the L > Szone of the eastern limb (RM18, Fig. 10) feldspar shows unduloseextinction (�98%), sericitisation (�84.5%), deformation lamellae(�81%), subgrain formation (�63%), intragranular fracturing(�43%) and transgranular fracturing (�2%). The easternmost S > Lzone records undulose extinction (�90%), followed by intragranu-lar fracturing (�59%), deformation lamellae (�44%), sericitisation(�37.5%) and subgrain formation (�11%) (RM24, Fig. 10).

Fig. 14. Relative percentages of various microstructures recorded in quartz and feldspar grains of the Lingtse gneiss protolith.
K. Bhattacharyya et al. / Journal of Asian Earth Sciences 107 (2015) 212–231 223
Therefore, feldspar records highest amount of microfracturing nearthe eastern structural boundary of the mylonite zone.
Therefore, dislocation creep and microfracturing are the domi-nant deformation mechanisms in quartz and feldspar, respectively,that have resulted in considerable grain size reduction within themylonite zones as compared to the Lingtse gneiss protolith(Fig. 13). The grain size reduction is more prominent near theboundary of the klippe as they mark the structural contactbetween the Daling phyllites and the Lingtse gneiss rocks.
4.3. Shear-sense analysis from feldspar porphyroclasts
The L tectonites preserve several asymmetric feldspar porphy-roclasts (Fig. 11d) that we analyzed in order to estimate the dom-inant shear-sense within the zone. We studied bothtransport-parallel as well as transport-perpendicular sections,and the asymmetric porphyroclasts are better developed in the for-mer. The feldspar porphyroclasts with X > 0.2 mm were used forthis analysis. We first present data from the transport-parallel sec-tions. For Phodong mylonite zone, we analyzed 34 asymmetric por-phyroclasts from different deformation zones and found that 15show top-to-the-north, while 19 record top-to-the-south sense ofshearing (Fig. 15a). For Tumin-Eingee, six representative samplesfrom different deformation zones were analyzed that included 23asymmetric porphyroclasts; 7 record top-to-the-north, while 16record top-to-the-south shear-sense (Fig. 15b). In the southern-most exposure at Rumtek 35 porphyroclasts were analyzed; 15record top-to-the-north while 20 record top-to-the-south sense
of shearing (Fig. 15c). Therefore, overall the porphyroclasts indi-cate a dominance of top-to-the-south shear sense that is in accor-dance with the regional transport direction of the thrust sheets.
Additionally, to examine the existence of an out-of-plane, i.e.,transport-perpendicular flow, we analyzed transport-perpendicularsections. The number of asymmetric porphyroclasts were far lesserin these sections, as expected, and were seen closer to the easternand western structural contacts of the klippen. In Phodong mylonitezone we found 6 asymmetric porphyroclasts close to the structuralcontacts and they record top-to-the-east shear sense (Fig. 15d). InTumin Eingee zone there were seven asymmetric porphyroclaststhat dominantly show top-to-the-east shear-sense (Fig. 15e). InRumtek zone the effect of asymmetry in such sections is least,and there were only four asymmetric porphyroclasts recordingdominantly a top-to-the-west shear sense (Fig. 15f). Thus, theL tectonites record a combination of transport-parallel andtransport-perpendicular flows, with the latter being less dominant.This observation is one of our major constraints for proposing amechanism for development of these rocks (Section 6.4).
5. Variations in strain along and across the L tectonite myloniteklippen
In order to examine how strain varied within the Lingtse gneissas a function of its structural association, we have carried outstrain analysis on the samples from the PT sheet protolith, and alsotransport-parallel and transport-perpendicular sections of the Ltectonite zone. Additionally, we used both quartz and feldspar to

Fig. 15. Shear-sense analysis using asymmetric feldspar porphyroclasts from transport parallel (a–c) and transport perpendicular sections (d–f) for Phodong, Tumin Eingeeand Rumtek mylonite zones, respectively. We plot the number of asymmetric feldspar porphyroclasts with respect to the azimuth of their shear direction. Note that there arecomponents of both transport-parallel and transport-perpendicular flow in these rocks with the former dominating the latter.
224 K. Bhattacharyya et al. / Journal of Asian Earth Sciences 107 (2015) 212–231
examine how strain was partitioned within the L tectonite klippeas a function of variation in mineralogy and deformation mecha-nisms. In the following sections we present our results.
5.1. Strain analysis from quartz grains
The protolith preserves relict quartz grains that are not recrys-tallized. We estimated plastic strain from these relict quartz grains
of the protolith (Fig. 1) as a reference. It records strong flatteningstrain as seen on the Flinn diagram with k = 0.18. (Fig. 16a) andX:Z = 2.76 (Table 1). The same protolith records various strain asa function of their structural positions within the klippen, and asa result occupy different domains on the Flinn plot (Fig. 16a).
As most of the quartz grains (>98%) are recrystallized within themylonite zone, there are very few preserved relict quartz grains toestimate strain. We conducted strain analysis on recrystallized

K. Bhattacharyya et al. / Journal of Asian Earth Sciences 107 (2015) 212–231 225
quartz grains, and therefore, there is an underestimation of thetotal strain from these quartz grains. In the northernmost L tec-tonite zone at Phodong the strongest L-fabric is observed nearthe hinge zone of the northerly plunging synform where the rockrecords a constrictional strain with k = 2.8 (L8, Figs. 16a, 7 andTable 1), and X:Z = 4.73. The k-values in Phodong mylonite zonedecreases on both sides of the strong L-fabric zone. The samplesfrom L > S zone (L4, Figs. 16a, 7 and Table 1) and S > L zone (L1,Figs. 16a, 7 and Table 1) that lie in the western limb show a lowerk value of 0.75 (X:Z = 2.68) and 0.58 (X:Z = 2.58), respectively, andplot in the flattening domain (Fig. 16a). The Lode’s ratio, as calcu-lated from Mookerjee’s 3D strain analysis program (Mookerjee andNickleach, 2011), for S > L zone (L1) is 0.21, and is shown on a Hsuplot (Fig. 16c and Table 1). As the distance from the hinge zoneincreases toward the eastern boundary (L25, Figs. 16a and 7) thek value decreases to 2.39 (Fig. 16a and Table 1) with X:Z = 4.40,and Lode’s ratio = �0.30 (Fig. 16c and Table 1). Farther east withinthe L > S zone, k decreases further to 1.77 (X:Z = 3.91) and Lode’sratio is �0.20 (L22, Fig. 16c and Table 1), and plots close to theplane strain in the flattening field. Thus, as the distance from theL tectonite hinge zone increases, the rocks record variation instrain domain and plot in the near plane strain and flatteningdomains.
As the Flinn plot does not indicate the orientation of the strainellipsoids, we generated strain ellipsoids following Mookerjee’s 3Dstrain analysis program (Mookerjee and Nickleach, 2011) for vari-ous representative samples by analyzing strain from three planesper sample; these were generated both along-strike andacross-strike of the three exposed L tectonite klippen. We presentthese strain ellipsoids with corresponding locations and orienta-tions on the three cross sections (Figs. 7, 9 and 10); we also presentthe representative ellipsoids from the L zones on atransport-parallel (N–S) cross section (Fig. 17) to demonstrate theirprolate shapes. In the Phodong mylonite zone, the L zone (L22, L25,Figs. 7, 17 and 18a) at the hinge zone of the synform records a pro-late ellipsoid with the long axis of the ellipsoids (X) plunging 6�,170� and 6�, 342� (Table 1), respectively. In the western limb,within the S > L zone (L1, Figs. 7 and 18a), X plunges 9�, 032�(Table 1) and the ellipsoid changes geometry to oblate in the flat-tening field. The footwall Daling phyllites east of the klippe(Figs. 7 and 18a) shows an oblate shape with X plunging 3�, 008�(Table 1).
South of the Phodong mylonite zone, within the Tumin Eingeemylonite zone, the L component increases from the western con-tact toward the LS zone in the east, and is strongest near the
Fig. 16. Flinn plot showing the variation in strain from the mylonite zones and the protquartz grains show a variation in strain, and samples from hinge zone record strongest cothe flattening domain. These data agree with our field observations. (b) Relict feldspar grvariation due to the varying deformation mechanisms as recorded in quartz and feldspa
eastern contact (Fig. 9). Strain from the S > L zone in the western-most boundary (TI-L4C, TI-L3, Figs. 9 and 16a) plot in the flatteningdomain with lower k values of 0.34 (X:Z = 3.34) and 0.53(X:Z = 2.09), respectively (Table 1). Lode’s ratio for sample TI-L4Cis 0.38 (Fig. 16c). Within the L > S zone (TI10, TI29, TI23, Fig. 9)lying east of this zone, the k value becomes 1.11 (X:Z = 3.21),0.44 (X:Z = 2.07) and 0.62 (X:Z = 3.19) respectively (Table 1).Lode’s ratio for TI23 is estimated to be 0.17. Samples from the Ltectonite zone near the eastern boundary (TI-45, TI53, TI 59,Figs. 9 and 17) record the strongest constrictional strain (k = 6.42,3.16, 3.27; X:Z = 2.86, 3.43, 4.03), with the highest strain recordedin the easternmost sample with Lode’s ratio at TI-53 is �0.41(Fig. 16a and Table 1). Therefore, as the distance from the L tec-tonite zone increases westward, the effect of the constrictionalstrain decreases on these rocks. The strain ellipsoids record a slightvariation in the orientation of X as a function of its structural posi-tion (Figs. 9 and 18b). In the L zone (TI53, Figs. 9 and 18b), Xplunges 2�, 014� (Table 1). The plunge changes to 4, 011� withinthe L > S zone (TI23, Figs. 8 and 18b) and finally increases to 17�,168� in the westernmost contact within the S > L zone (TI-L4c,Figs. 9, 18b and Table 1).
In the southernmost exposure of the L tectonite klippe atRumtek mylonite zone a similar pattern is observed in terms ofstrain distribution. The hinge zone with strongest L fabric (RM17, Figs. 10, 16a and 17) records k = 3.51 (X:Z = 4.18) and Lode’sratio = �0.42 (Fig. 16c and Table 1), the highest constrictionalstrain in this zone. Near the western boundary in the S > L domain(RM8) the rocks record k = 0.77 (X:Z = 2.40), and therefore plotsclose to the plane strain in the flattening domain. The L > S domain,lying toward east (RM 12, RM 13; Figs. 10, 16a and Table 1), recordk at 0.86 (X:Z = 2.70) and 1.36 (X:Z = 2.49), respectively, with RM13 lying closer to the L tectonite zone. East of the L tectonite zone,in the S > L zone (RM 24, Figs. 10 and 16a), k decreases to 0.44(X:Z = 3.54), and plots in the flattening domain. The Lode’s ratiofor RM 24 is 0.29 (Fig. 16c and Table 1). Therefore, the L tectonitein the hinge of the fold records the strongest constrictional strainwith the highest k value, and the value decreases progressivelytoward the structural boundaries in the east and west. The strainellipsoid is prolate in the L zone (RM17, Figs. 9, 17 and 18c) withX plunging 3�, 165�. The ellipsoid shape changes to oblate withinthe S > L zone (RM24, Figs. 9 and 18c) with X plunging 0�, 354� nearthe eastern contact (Table 1).
Therefore, the strongest L fabric is developed within the hingezone of the fold in all the three locations. The highest constrictionalstrain is recorded in Phodong and Tumin-Eingee mylonite zones,
olith. We have followed the same indices as the map (Fig. 6). (a) Deformed plasticnstrictional strain. Both hanging wall protolith (HW) and footwall (FW) rocks plot inains show flattening strain irrespective of their structural positions. We explain thisr (see text). (c) Hsu plot showing Lode’s ratio of deformed quartz grains.

Table 1Trends and plunges of the three principle axes of 3-D strain ellipsoids of deformed quartz grains from three studied klippen, along with X:Z, k-values and Lode’s ratio.
Locations Long axis (X) Intermediate axis (Y) Short axis (Z) XZ
k-value Lode’s ratio
Plunge (�) Trend (�) Plunge (�) Trend (�) Plunge (�) Trend (�)
PhodongL1 (S > L) 9 032 18 299 70 148 2.58 0.58 0.21L4 (L > S) 2.68 0.75L8 (L) 4.73 2.87L25 (L) 6 342 1 072 84 175 4.40 2.39 �0.30L22 (L) 6 170 18 078 71 277 3.91 1.77 �0.20L11 (S) 3 008 3 098 86 229 2.46 0.98 0.005
Tumin EingeeTI-L3 (S > L) 2.09 0.53TI-L4C (S > L) 17 168 3 077 73 336 3.34 0.34 0.38TI-29 (L > S) 2.07 0.44TI-10 (L > S) 3.21 1.11TI-23 (L > S) 4 011 5 281 84 140 3.19 0.62 0.17TI-45 (L) 2.86 6.42TI-53 (L) 2 014 3 104 87 253 3.43 3.16 �0.41TI-59 (L) 4.03 3.27
RumtekRM-8 (S < L) 2.40 0.77RM-12 (L > S) 2.70 0.86RM-13 (L > S) 2.49 1.36RM-17 (L) 3 165 1 255 87 001 4.18 3.51 �0.42RM-18 (L > S) 2.23 1.12RM-24 (S > L) 0 354 5 264 85 089 3.54 0.44 0.29
Fig. 17. Cross section along the transport direction (N–S) showing locations of the three L tectonite klippen in the studied area. The prolate strain ellipsoids of the L tectonites,along with X:Z, are also shown. PT: Pelling thrust.
226 K. Bhattacharyya et al. / Journal of Asian Earth Sciences 107 (2015) 212–231
and decreases south toward Rumtek mylonite zone. Also, the mea-sured strain data from the various deformation zones support theway in which we divided the three outcrops into various deforma-tion zones based on field observation of relative dominance of Sand L fabric. The generated strain ellipsoids of quartz grains showthat overall the X axes of the ellipsoids agree with the stretchinglineations as are observed in the field with similar gentle, northerlyor southerly plunge (Fig. 17). Additionally, the XY plane of the gen-erated ellipsoids overall agree with the observed variation of thefoliation planes in the field in all the three locations.
5.2. Strain analysis from relict feldspar grains
In order to understand how strain is partitioned between quartzand feldspar grain, we analyzed the relict feldspar grains from thethree mylonite zones.
In the Phodong mylonite zone feldspar from the L zone in thehinge of the antiform (L22, L25, Figs. 7 and 16b) record k = 0.84(X:Z = 2.70) and 0.68 (X:Z = 2.90), respectively; they lie close tothe plane strain in the flattening domain. The S > L zone in thewestern limb (L1, Figs. 7 and 16b) records k of 0.08 (X:Z = 2.06),and plot in the flattening domain. The footwall protolith (L11,Figs. 7 and 16b) from the eastern end of the klippe records k of0.09 (X:Z = 2.14). In the Tumin Ingee mylonite zone the L, L > Sand S > L zone (TI53, TI29, TIL4C; Figs. 9 and 16b), moving from
east to west, record k-values of 0.22 (X:Z = 2.35), 0.008(X:Z = 2.14) and 0.04 (X:Z = 2.54), respectively. Similarly forRumtek mylonite zone, the L zone (RM17, Figs. 10 and 16b) recordsa k-value of 0.26 (X:Z = 2.55), and the S > L zone (RM24,Figs. 10 and 16b) near the eastern contact records k = 0.06(X:Z = 2.41) (Table 2).
Interestingly, unlike the quartz grains, all the feldspar grainsrecord flattening strain irrespective of their positions from the var-ious deformation zones. We explain this variation as being a resultof strain partitioning between quartz and feldspar as a function oftheir deformation mechanisms. Most of the relict feldspar deformby microfracturing, and therefore, do not record the constrictionalstrain, whereas the quartz grains deform by dislocation creep andtherefore record the constrictional strain.
6. Discussions
6.1. Variation of structural geometry of the mylonite klippen alongstrike
The Lingtse gneiss protolith has undergone a prominent grainsize reduction to form L-tectonite mylonite that is spatially associ-ated with LS and SL tectonites, resulting in three narrow, discontin-uous klippen, that are exposed over �13 km in a transport-paralleldirection and �2 km transverse width in the Darjeeling–Sikkim
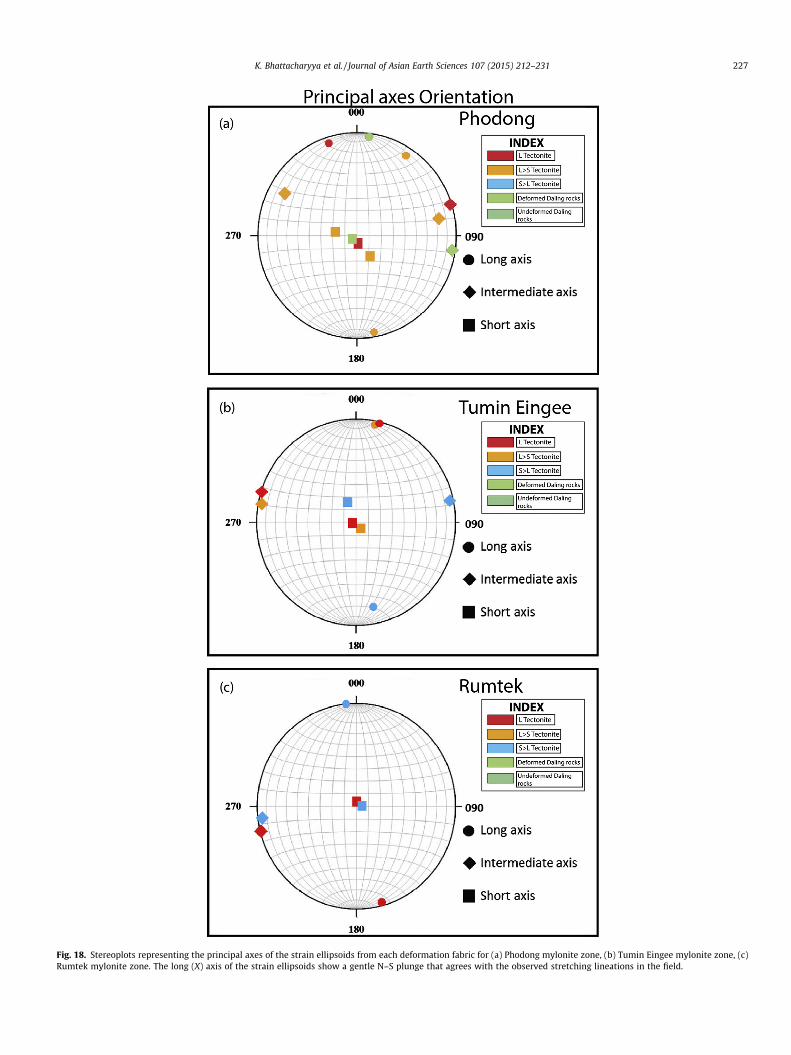
Fig. 18. Stereoplots representing the principal axes of the strain ellipsoids from each deformation fabric for (a) Phodong mylonite zone, (b) Tumin Eingee mylonite zone, (c)Rumtek mylonite zone. The long (X) axis of the strain ellipsoids show a gentle N–S plunge that agrees with the observed stretching lineations in the field.
K. Bhattacharyya et al. / Journal of Asian Earth Sciences 107 (2015) 212–231 227

228 K. Bhattacharyya et al. / Journal of Asian Earth Sciences 107 (2015) 212–231
Himalaya (Figs. 1 and 6). The mylonitic foliation is folded alongN–S trending fold axis, and the geometry of the folds vary spatiallyalong the transport direction. At the northernmost exposed loca-tion at Phodong mylonite zone the fold is a gently plunging (8�,006�), synform (Fig. 7) with the L tectonite zone exposed nearthe hinge zone in the middle. Farther south at Tumin Eingee mylo-nite zone the outcrops are laterally less continuous than thePhodong mylonite zone. Based on the exposed outcrops we recon-struct the geometry as a gently plunging (7�, 003�), overturnedsynform (Fig. 9). The width of the exposed outcrop (�305 m) isnarrower than at Phodong (�1.6 km). The southernmost outcropat Rumtek mylonite zone defines an overturned synform withthe fold axis plunging 9�, 351�. The exposed zone is �1.4 km widewith the L tectonite zone restricted along the hinge of the synform(Fig. 10). At each of these locations there is a gently northerlyplunging stretching mineral lineation defined by stretched quartzand biotite grains (Figs. 4 and 8). Therefore, Lingtse gneiss mylonitezone forms transport-parallel, overall dominantly a synformal foldwithin the klippen that varies in detailed geometry spatially alongthe transport direction. The Flinn plot suggests that the constric-tional strain is more dominant in the L-tectonite zones atPhodong and Tumin Eingee and decreases south toward Rumtek(Fig. 16a).
6.2. Evaluation of available models on formation of transport parallelfolds
In this section, we evaluate the existing models ontransport-parallel folds in FTBs for explaining the inferred foldgeometry from the Lingtse tectonite klippen. Generally in FTBstransport-perpendicular folds are commonly manifested asfault-bend folds, and/fault-propagation folds that are associatedwith frontal ramps of thrust faults. Transport-parallel folds asobserved in our study area are less common, and are generally seenat lateral ramps (Harris, 1970; Boyer, 1978).
Transport parallel folds in the Moine thrust zone have beenexplained by differential movement on the thrust sheets (Cowardand Kim, 1981; Coward, 1982). However, such folds are generallyassociated with other oblique folds where the trend of the hingeline varies from being transport perpendicular to transport paral-lel. In the study area we do not see other major folds that show avariation in trend of the hinge line. Therefore, differential move-ment of the PT sheet may not be the main mechanism for generat-ing the transport-parallel fold in the study area.
The growth of the Lesser Himalayan duplex resulted in a plungeculmination in this area with a transport parallel N–S trendinghinge line (Bhattacharyya and Mitra, 2009; Mitra andBhattacharyya, 2011). However, the northward hinge line lies west
Table 2Table showing k-values of deformed feldspar and X:Z from the three myloniticklippen.
Locations Feldspar
k-values X/Z
PhodongL1 (L > S) 0.08 2.06L25 (L) 0.68 2.90L22 (L) 0.84 2.70L11 (S) 0.09 2.14
Tumin EingeeTI-L4C (S > L) 0.03 2.54TI-29 (L > S) 0.008 2.14TI-53 (L) 0.22 2.35
RumtekRM-17 (L) 0.26 2.55RM-24 (S > L) 0.06 2.41
of the hinge line of the studied fold (Fig. 18a). Thus, although theplunge culmination explains the transport parallel fold in the mid-dle of the Teesta window, it does not explain the studied folds eastof it. Therefore, the existing models on transport parallel folds donot completely explain the occurrence of the studied foldedmylonites.
Transport-parallel folds are also seen in mylonite zones wheresheath folds are developed (e.g. Malavieille, 1987; Marshak andMitra, 1988). In the studied area, the transport-parallel folds areassociated with mylonite zones, transport-parallel stretching lin-eations, and are localized in nature, being restricted to the narrowklippen. Therefore, sheath folding on a large scale can be one of thepossibilities to explain the fold in our study area.
6.3. Evaluation of available models on formation of L tectonite
We evaluate the available models on L-tectonites in the contextof the studied geometry. Restraining bends in transpressionalshear zones can lead to formation of subvertical L tectonites trend-ing along the transport direction, as the material is extruded out ofthe restraining bend (Sullivan, 2013; Lin and Jiang, 2011).Similarly, at releasing bends in transtension shear zonestransport-parallel, subhorizontal L-tectonites may form as a resultof combined transport-parallel elongation and vertical shortening(Sullivan, 2013). However, the regional structural setting of thestudied rocks has a dominant N to S transport direction, associatedwith thrusting. These rocks do not record any strike-slip compo-nent, and hence the transtensional or transpressional structuralsetting does not explain the formation of the studied L tectonites.
Formation of linear fabric along hinge line of folds have beenexplained by progressive overprinting of early formed deformationfabric in bulk plane or flattening strain (Hudleston, 1977; Holst andFossen, 1987; Sullivan, 2013). This model predicts that the L tec-tonites will be preferentially formed and preserved within thehinge zones of the folds, and would decrease in intensity towardthe limbs. Although, the model agrees with the general fieldobservations of this study where the intensity of the linearfabric progressively decreases away from the hinge zones ofthe folds, the model requires a shortening component in thehinge-perpendicular direction. As the studied linear fabrics, alongwith the associated folds are transport-parallel, this model, atfirst-order, does not explain the formation of L-tectonites in thestudy area, unless the folds are rotated in their current orientationsdue to intense deformation. The open fold geometry at Phodongdoes not support rotation related to intense deformation rotation.
Alternatively, strain partitioning due to variation in rheology ofthe deforming rock can also lead to formation of L tectonites. Therheologically weaker rocks tend to accommodate the simple shearcomponent of general shear deformation, while the stronger rockstend to localize the nearly coaxial, constrictional strain resulting inthe formation of strong linear fabric (Lister and Williams, 1983;Jiang, 1994; Sullivan, 2008, 2013). This model agrees with our gen-eral observation that the L tectonites are preferentially developedwithin the rheologically stronger Lingtse gneiss as compared tothe weaker underlying Daling phyllites. However, ongoing workon vorticity analysis on the L tectonites indicate that these rocksrecord significant proportion of simple shear (�39–75%; Daset al., 2014). Therefore, this model is not viable to explain the L tec-tonites from our study area. Also, it does not explain the absence ofL tectonites from Lingtse gneiss–Daling phyllite contact (PT zone)in the western Sikkim Himalaya (Fig. 1). Additionally, it does notexplain the occurrence of the associated transport-parallel folds.
Presence of linear asperities in high strain zone boundaries canlocalize constrictional strain in bulk flattening deformation, if thewidth of the zone is less than the depth of the asperity (Flinn,1961; Sullivan, 2009, 2013). The linear asperity generates a flow

K. Bhattacharyya et al. / Journal of Asian Earth Sciences 107 (2015) 212–231 229
that has components of both transport-perpendicular shorteningand transport parallel elongation. Plane strain or constrictionaldeformation probably leads to convergent flow along the asperitiesproducing L-tectonites (Sullivan, 2009, 2013). The shear-sense datafrom the studied rocks suggest a combination of transport-paralleland transport-perpendicular flow (Fig. 15), with a dominance ofthe former over the latter. Ongoing work on vorticity analysis alsoindicate that these rocks record a combination of simple shear andpure shear with the relative proportion of simple shear decreasingfrom Phodong mylonite zone (�39–75%) in the north to Rumtekmylonite zone (�37–48%) in the south (Das et al., 2014) in thetransport perpendicular direction. There is a general increase insimple shear from west (�39–44%) to east (�51–75%). However,this model suggests that the L tectonites should be preferentiallylocalized along the antiformal hinges over synformal hinges. Inthe study area the L tectonites are exposed along the synformalhinges. Thus, this model does not completely explain the formationof the studied L tectonites. In the following section we propose analternative mechanism to explain the formation of the L tectonites,based on our general observations.
6.4. Proposed preliminary model
We integrate the various results from our study to propose a pre-liminary model to explain the formation of L tectonites in theSikkim Himalayan FTB. The L tectonites are spatially associatedwith LS and SL tectonites in the area with transport parallel orienta-tion. They form within the rheologically stronger Lingtse orthog-neiss that form a transport-parallel fold (Fig. 19a), exposed asdiscontinuous narrow linear klippen surrounded and underlain byDaling phyllites in the footwall; the klippen continue along thetransport direction over a N–S distance of�13.5 km and E–W widthof�2 km. The L tectonites are localized along the synformal hinge ofthis fold, and record constrictional strain that decreases from N–S(Section 5, Fig. 16). Shear sense indicators (Fig. 15) and ongoingvorticity analysis (Das et al., 2014) suggest that these rocksrecord a general deformation with a combination of dominanttransport-parallel and subsidiary transport-perpendicular flow.
Mookerjee and Mitra (2008), studied five different strain com-ponents of a deforming thrust wedge in a kinematic-based mathe-matical model: (a) thrust-parallel simple shear, (b) horizontal
Fig. 19. (a) Trace of the plunge culmination (black arrow) due to the growth of the Lessethe studied L tectonite klippe (red arrow) are shown on the regional map. These two tracto the growth of the duplex. (b) Proposed preliminary model suggesting the possible exitransport-parallel constrictional strain as seen in the studied area (please see text). Note tthe strain ellipsoids along the strike of the lateral ramp.
contractional strain, (c) thrust-normal reaction strain, (d) gravita-tional strain, and (e) lateral confining boundary condition. Theirresults show that increased lateral confining strain can generatetransport-parallel extension.
The orientation of a ramp of a thrust fault can vary from themore commonly observed high angle to the transport direction(frontal ramp) to a very low angle with respect to the transportdirection (lateral ramp). Presence of a lateral ramp can lead toincreasing lateral confining strain, thereby resulting intransport-parallel extension. Additionally, a lateral ramp can alsoresult in the formation of transport-parallel folds (Harris, 1970;Boyer, 1978).
Therefore, in order to explain the formation of bothtransport-parallel lineation and the associated transport-parallelfold in the study area, we propose the possible existence of a lateralramp beneath the PT sheet (Fig. 19b). The lateral ramp wouldincrease the lateral confining strain that can explain the observedstrain ellipsoid geometries in the study area with the long (X) axesaligned parallel to the transport direction as a result oftransport-parallel extension (Figs. 7, 9 and 10). As the ramp seg-ment causes localization of maximum stretch (Mookerjee andMitra, 2008, 2009), we can hypothesize the possible location ofthe lateral ramp to be beneath the strongest developed L tectonitezone. Movement of the PT sheet over the lateral ramp would causethe formation of a fold in the hanging wall (PT) sheet with hingeline parallel to the strike of the lateral ramp, i.e., along the trans-port direction (Fig. 19). This mechanism provides an explanationfor the strain ellipsoids, as well as the observed transport-parallel fold in the study area. Additionally, the lateral ramp couldlocalize the fold, if it resulted from large-scale sheath folding.Ongoing work (Das et al., 2014; Parui and Bhattacharyya, 2014;Bhattacharyya and Ghosh, 2014) is focused on deciphering thegeometry and kinematics of the PT and the eastern SikkimHimalayan FTB as a whole to examine the possible existence ofthe lateral ramp in this region.
Additionally, presence of a local linear asperity on the PT zonemay have enhanced the localization of L tectonites along the studyarea. The transport-parallel length of the zone of L tectonitesdefines the first-order extent of the linear asperity. We note thatthe asperity, if present, did not extend south of Rumtek mylonitezone. The overlying MCT sheet is not preserved in the study area,
r Himalayan duplex (Bhattacharyya and Mitra, 2009) and the hinge surface trace ofes are not coinciding indicating that the studied transport-parallel fold is not relatedstence of a lateral ramp beneath the PT sheet to explain transport-parallel fold andhat the ramp segment lies below the hinge zone and records maximum elongation of

230 K. Bhattacharyya et al. / Journal of Asian Earth Sciences 107 (2015) 212–231
and therefore, the effect of the lateral ramp and the linear asperityon the MCT sheet could not be examined.
7. Conclusions
Paleoproterozoic Lingtse orthogneiss shows three dominantstructural associations in the Sikkim Himalayan FTB: (a) theylocally define the PT zone (b) they occur as linear, N–S trendingimbricates within the PT sheet, and (c) they form N–S trending dis-continuous linear klippen �13.5 km long, �2 km wide overlyingthe Daling Formation of the lower LHS rocks; the klippen lie4–8 km east of the N–S trending Teesta valley. These rocks showa variation in the deformation fabric depending on their structuralassociation. The klippen record N–S trending, strong L-tectonitesthat are spatially associated with LS and SL tectonites in myloni-tized Lingtse gneiss; the stretching lineations are oriented alongthe transport direction (N–S). From north to south these klippenare exposed at Phodong, Tumin Eingee and Rumtek.
The mylonitic foliation is overall folded along gently plunging,N–S trending synform with the strongest L fabric developed alongthe hinge of the synform at the three studied locations, and itsdominance decreases progressively toward the eastern and west-ern structural contacts of the klippe. The highest constrictionalstrains are recorded in the mylonites at Phodong andTumin-Eingee, and the strain decreases south toward Rumtek.The measured strain data from the various deformation zones sup-port the way in which we divided the three exposures into variousdeformation zones based on field observation of relative domi-nance of S and L fabric. The generated strain ellipsoids of quartzgrains show that overall the X axes of the ellipsoids agree withthe stretching lineations, as are observed in the field with similargentle, northerly or southerly plunge. Additionally, the XY planeof the generated ellipsoids overall agree with the observed varia-tion of the mylonitic foliation planes in the field in all the threelocations.
Microstructural analysis from the mylonitic klippen suggeststhat quartz and feldspar have undergone�35% and�76% grain sizereduction as compared to the protolith. Dislocation creep andmicrofracturing are the dominant deformation mechanisms inquartz and feldspar, respectively. The grain size reduction is moreprominent near the boundary of the klippen as they mark thestructural contact between the Daling phyllites and the Lingtsegneiss rocks. Strain is partitioned differently in quartz and feldsparof the mylonite zones; quartz grains record constrictional strain inthe synformal hinge while feldspar grains show flattening strain.We explain this variation as being a result of their varying defor-mation mechanisms. Shear-sense analyses of the feldspar porphy-roclasts suggest dominantly transport-parallel flow with a minorcomponent of transport-perpendicular flow in the zone.
Existing models on mechanism of L tectonite formation andtransport-parallel folds do not completely explain our observa-tions. We propose the possible existence of a lateral ramp beneaththe PT sheet to explain the generation of L tectonites andtransport-parallel fold in the study area.
Acknowledgements
This work was supported by Startup Grant from Indian Instituteof Science Education Research Kolkata (IISER K), DST GrantSR/FTP/ES-15/2013, Academic Research Fund of IISERK to K.Bhattacharyya. We thank C. Parui and F. Ahmed for their able assis-tance in the field. We immensely benefitted from discussions withG. Mitra. Detailed and constructive reviews from S. Kwon and twoanonymous reviewers significantly improved the quality of thispaper. We thank the editor, M. Santosh, and M. Mookerjee for his
Mathematica program that we used for generating strain ellip-soids. We acknowledge R. Rakshit for preparing excellent thin sec-tions for this study.
References
Bhattacharyya, K., 2010. Geometry and Kinematics of the Fold-Thrust Belt andStructural Evolution of the Major Himalayan Fault zones in the Darjeeling-Sikkim Himalaya, India. Ph.D. Thesis, University of Rochester, pp. 1–263.
Bhattacharyya, K., Ghosh, P., 2014. Tracking the Main Central Thrust (MCT) Zonealong Transport Direction in the Darjeeling–Sikkim Himalayan Fold-Trust Belt:What can we Infer?. Rock Deformation and Structures (RDS-III) AbstractVolume, p. 29.
Bhattacharyya, K., Mitra, G., 2009. A new kinematic evolutionary model for thegrowth of a duplex – an example from the Rangit duplex, Sikkim Himalaya,India. Gondwana Res. 16, 697–715.
Bhattacharyya, K., Mitra, G., 2011. Strain softening along the MCT zone from theSikkim Himalaya: relative roles of Quartz and Micas. J. Struct. Geol. 33, 1105–1121.
Bhattacharyya, K., Mitra, G., 2014. Spatial variations in deformation mechanismsalong the Main Central thrust zone: implications for the evolution of the MCT inthe Darjeeling–Sikkim Himalaya. J. Asian Earth Sci. 96, 132–147.
Bhattacharyya, K., Damania, S., Sanyal, S., Das, J.P., Dwivedi, H.V., 2013. L-tectonitesfrom Lingtse Orthogneisses in the Sikkim Himalayan Fold-thrust Belt:Preliminary Observations. Geological Society of America Abstract, p. 255.
Bhattacharyya, K., Mitra, G., Kwon, S., in review. Geometry and Kinematics of theDarjeeling–Sikkim Himalaya, India: Implications for the Evolution of theHimalayan Fold-Thrust Belt.
Boyer, S.E., 1978. Structure and Origin of Grandfather Mountain Window, NorthCarolina. Unpub. Ph.D. Thesis, Johns Hopkins University.
Boyer, S.E., Elliot, D., 1982. Thrust systems. Am. Assoc. Pet. Geol. Bull. 66, 1196–1230.
Coward, M.P., 1982. Surge zones in the Moine thrust zone of NW Scotland. J. Struct.Geol. 4, 247–256.
Coward, M.P., Kim, J.H., 1981. Strain within Thrust Sheets. Geological Society,London, Special Publications 9, pp. 275–292.
Das, J.P., Dwivedi, H.V., Bhattacharyya, K., 2014. Structural Evolution of L-tectonitesfrom Eastern Sikkim Himalayan Fold Thrust Belt: Insights from KinematicAnalyses. Rock Deformation and Structures (RDS-III) Abstract, pp. 27–28.
DeCelles, P.G., Gehrels, G.E., Quade, J., LaReau, B., Spurlin, M., 2000. Tectonicimplications of U–Pb zircon ages of the Himalayan orogenic belt in Nepal.Science 288, 497–499.
Flinn, D., 1961. On deformation at thrust planes in Shetland and the Jotunheim areaof Norway. Geol. Mag. 98, 245–256.
Flinn, D., 1965. On the symmetry principle and the deformation ellipsoid. Geol. Mag.102, 36–45.
Gansser, A., 1964. The Geology of the Himalayas. Wiley Publishers, New York, pp. 1–289.
Harris, L.D., 1970. Details of thin-skinned tectonics in parts of Valley and Ridge andCumberland Plateau provinces of the southern Appalachians. In: Fisher, G.W.,Pettijohn, F.J., Reed, J.C., Weaver, K.N. (Eds.), Studies of Appalachian Geology:Central and Southern. Interscience, New York, pp. 161–173.
Holst, T.B., Fossen, H., 1987. Strain distribution in a fold in the West NorwegianCaledonides. J. Struct. Geol. 9, 915–924.
Hudleston, P.J., 1977. Similar folds, recumbent folds, and gravity tectonics in ice androcks. J. Geol. 85, 113–122.
Imamura, L., Bhattacharyya, K., Mitra, G., 2011. Microstructural evidence for strain-softening along the Main Central Thrust Zone in the Darjeeling–SikkimHimalaya. In: Geological Society of America Abstracts with Programs, vol. 43-1, p. 148.
Jiang, D., 1994. Flow variation in layered rocks subjected to bulk flow of variouskinematic vorticities: theory and geological implications. J. Struct. Geol. 16,1159–1172.
Kohn, M.J., Pau, S.K., Corrie, S.L., 2010. The lower Lesser Himalayan sequence: aPaleoproterozoic arc on the northern margin of the Indian plate. Geol. Soc. Am.Bull. 122, 323–335.
Le Fort, P., 1975. Himalayas: the collided range: present knowledge of thecontinental arc. Am. J. Sci. 275, 1–44.
Le Fort, P., Raï, S.M., 1999. Pre-Tertiary felsic magmatism of the Nepal Himalaya:recycling of continental crust. J. Asian Earth Sci. 17, 607–628.
Lin, S., Jiang, D., 2011. Deformation partitioning in transpressional shear zones withan along-strike stretch component: an example from the Superior BoundaryZone, Manitoba, Canada. J. Struct. Geol. 33, 192–202.
Lister, G.S., Williams, P.F., 1983. The partitioning of deformation in flowing rockmasses. Tectonophysics 92, 1–33.
Malavieille, J., 1987. Extensional shearing deformation and kilometer-scale ‘‘a’’-typefolds in a Cordilleran Metamorphic Core Complex (Raft River Mountains,northwestern Utah). Tectonics 6, 423–448.
Marshak, S., Mitra, G., 1988. Basic Methods of Structural Geology. Prentice-HallPublishers, pp. 1–448.
Mitra, G., Bhattacharyya, K., 2011. The use of cleavage-bedding relations andmesoscopic structures in interpreting complex duplex geometries in Fold-Thrust Belts: examples from the Rangit Duplex, Sikkim Himalaya. HimalayanGeol. 32, 25–42.

K. Bhattacharyya et al. / Journal of Asian Earth Sciences 107 (2015) 212–231 231
Mitra, G., Bhattacharyya, K., Mukul, M., 2010. The Lesser Himalayan duplex inSikkim: implications for variations in Himalayan shortening. J. Geol. Soc. India75, 289–301 (special issue).
Mookerjee, M., Mitra, G., 2008. Kinematics-based mathematical model fordeforming thrust wedges. Math. Geosci. 40, 249–275.
Mookerjee, M., Mitra, G., 2009. Understanding kinematic data from the Moinethrust zone in terms of a kinematics-based mathematical model of deformingthrust wedges. J. Struct. Geol. 31, 1556–1572.
Mookerjee, M., Nickleach, S., 2011. Three-dimensional strain analysis usingMathematica. J. Struct. Geol. 33, 1467–1476.
Parui, C., Bhattacharyya, K., 2014. Lateral Variation in the Structural Architecture ofDarjeeling Sikkim Himalayan Fold Thrust Belt: Preliminary Results. RockDeformation and Structures (RDS-III) Abstract, pp. 13–14.
Pfiffner, O.A., Ramsay, J.G., 1982. Constraints on geological strain rates: argumentsfrom finite strain states of naturally deformed rocks. J. Geophys. Res.: SolidEarth 87, 311–321.
Schwan, W., 1980. Shortening structures in eastern and north-western Himalayanrocks. In: Saklani, P.S. (Ed.), Today and Tomorrow’s Printers and Publishers, NewDelhi.
Srivastava, P., Mitra, G., 1994. Thrust geometries and deep structure of the outer andlesser Himalaya, Kumaon and Garhwal (India): implications for evolution of theHimalayan fold-and-thrust belt. Tectonics 13, 89–109.
Sullivan, W.A., 2008. Significance of transport-parallel strain variations in part of theRaft River shear zone, Raft River Mountains, Utah, USA. J. Struct. Geol. 30, 138–158.
Sullivan, W.A., 2009. Kinematic significance of L tectonites in the footwall of a majorterrane bounding thrust fault, Klamath Mountains, California. J. Struct. Geol. 31,1197–1211.
Sullivan, W.A., 2013. L tectonites. J. Struct. Geol. 50, 161–175.Valdiya, K.S., 1980. The two intracrustal boundary thrusts of the Himalaya.
Tectonophysics 66, 323–348.Yin, A., 2006. Tectonic evolution of the Himalayan orogen as constrained by along-
strike variation in structural geometry, exhumation history, and forelandsedimentation. Earth-Sci. Rev. 76, 1–131.
Yin, A., Dubey, C.S., Kelty, T.K., Webb, A.A.G., Harrison, T.M., Chou, C.Y., Célérier, J.,2009. Geologic correlation of the Himalayan orogen and Indian craton: Part 1.Structural geology, U–Pb zircon geochronology, and tectonic evolution of theShillong Plateau and its neighboring regions in NE India. Geol. Soc. Am. Bull.122, 336–359.