Structural Evolution of the Gold-rich Ashanti Belt, SW Ghana
243
HAL Id: tel-00772832 https://tel.archives-ouvertes.fr/tel-00772832 Submitted on 11 Jan 2013 HAL is a multi-disciplinary open access archive for the deposit and dissemination of sci- entific research documents, whether they are pub- lished or not. The documents may come from teaching and research institutions in France or abroad, or from public or private research centers. L’archive ouverte pluridisciplinaire HAL, est destinée au dépôt et à la diffusion de documents scientifiques de niveau recherche, publiés ou non, émanant des établissements d’enseignement et de recherche français ou étrangers, des laboratoires publics ou privés. Structural Evolution of the Gold-rich Ashanti Belt, SW Ghana Stephane Perrouty To cite this version: Stephane Perrouty. Structural Evolution of the Gold-rich Ashanti Belt, SW Ghana. Tectonics. Uni- versité Paul Sabatier - Toulouse III, 2012. English. tel-00772832
-
Upload
khangminh22 -
Category
Documents
-
view
1 -
download
0
Transcript of Structural Evolution of the Gold-rich Ashanti Belt, SW Ghana

HAL Id: tel-00772832https://tel.archives-ouvertes.fr/tel-00772832
Submitted on 11 Jan 2013
HAL is a multi-disciplinary open accessarchive for the deposit and dissemination of sci-entific research documents, whether they are pub-lished or not. The documents may come fromteaching and research institutions in France orabroad, or from public or private research centers.
L’archive ouverte pluridisciplinaire HAL, estdestinée au dépôt et à la diffusion de documentsscientifiques de niveau recherche, publiés ou non,émanant des établissements d’enseignement et derecherche français ou étrangers, des laboratoirespublics ou privés.
Structural Evolution of the Gold-rich Ashanti Belt, SWGhana
Stephane Perrouty
To cite this version:Stephane Perrouty. Structural Evolution of the Gold-rich Ashanti Belt, SW Ghana. Tectonics. Uni-versité Paul Sabatier - Toulouse III, 2012. English. �tel-00772832�

1

2

3
Remerciements
Les travaux de thèse présentés au cours de cet ouvrage ne furent rendus possibles que
grâce à la généreuse contribution de nombreux organismes et de personnes que je me devais de
remercier en ces premières pages.
Tout d’abord, je souhaite remercier le Ministère de l’Enseignement Supérieur et de la
Recherche pour le financement dont j’ai bénéficié durant ces années de thèse, l’Université de
Toulouse III, Paul Sabatier, et le Laboratoire des Mécanismes et Transferts en Géologie, devenu
Laboratoire de Géosciences, Environnement, Toulouse, pour leur accueil. Je remercie l’Institut
de Recherche pour le Développement (I.R.D.) et le projet WAXI (West African eXploration
Initiative) pour les nombreuses missions qui m’ont été accordées, ainsi que la compagnie minière
Golden Star, en particulier sa filiale d’exploration, pour le soutien logistique et financier apporté
à mes travaux.
Bien sûr, côté V.I.P., mes pensées vont en premier vers mes directeurs de thèse, Mark W.
Jessell, pour sa disponibilité exemplaire tout au long de mes travaux de recherche, et Laurent
Aillères, pour les nombreuses connaissances qu’il m’a apportées en géologie et en géophysique
structurale. Merci aux différentes personnes ayant accepté d’être membres de mon jury de thèse :
Jean-Luc Bouchez, Campbell McCuaig, Olivier Vanderhaeghe, Guillaume Martelet, Lenka
Baratoux et Yan Bourassa. Merci également à l’intégralité de mes co-auteurs pour leurs
participations à ces travaux : Jérome Ganne, Roland Martin, Michel Grégoire, Mathieu Benoit,
John Miller, Didier Béziat, Stefano Salvi, Luc Siebenaller, Germán Velásquez, Mark Lindsay,
Brenton Crawford, Sylvain Block et Daniel Apau.
Je suis également très reconnaissant à l’encontre des personnels des ateliers roches, MEB
et microsonde, en particulier, Philippe et Fabienne de Parseval, Jean-François Mena, Ludovic
Menjot, Thierry Aigouy et Sophie Gouy, pour leur excellente préparation des échantillons et leur
aide inestimable lors des analyses. Un grand merci à tout le personnel administratif pour
l’organisation de mes missions, notamment à Clare Desplats, Manuelle Rival, Pascale Dedieu,
Sabine Melezan et Salima Hachemi, ainsi qu’à Marie-Claude Cathala pour son accueil à l’école
doctorale.
Je remercie aussi John Agyei Duodu, Geoffrey Loh et Wolfgang Hirdes du Service
Géologique du Ghana, pour leurs bases de données, Barrie Bolton, de BHP pour ses cartes du
sud-ouest du Ghana, Jean David, pour ses suggestions de traitements des données géophysiques

4
et Philippe Olivier, Sonia Rousse, Nicolas Kagambega et Cécile Cournède pour leur assistance
lors des mesures de susceptibilités et de rémanences magnétiques.
Merci à Paul Asante, mon chauffeur, du Service Géologique du Ghana, pour son
excellente conduite, même lors des situations les plus compliquées, et pour sa connaissance
inégalable du terrain.
Finalement, je remercie mes collègues de bureau qui se sont succédé au cours de ces
dernières années, Aude Sturma, Jean Sébastien Moquet, Sébastien Fabre, Joceline Tapia,
Ekatarina Vasyukova et Laurent Truche, ainsi que l’ensemble de mes collègues moniteurs et
doctorants.
Pour terminer, un très grand merci à ma famille pour son soutien tout au long de mes
études … avec une pensée pour mes grands-parents qui n’auront pas eu la chance d’assister à
l’achèvement de cette thèse.

5
Abstract
The Paleoproterozoic Ashanti Belt hosts numerous world class gold deposits such as the
Obuasi deposit (60 million ounces) and the Tarkwa deposit (40 million ounces). Characterising
the regional structural and magmatic evolution provides new insight into the geotectonic context
forming these deposits. In this work, we build a new geologic and structural map of the area
using field observations and airborne geophysical data. This new map and series of
geophysically constrained cross-sections allowed construction of a three-dimensional model of
Birimian geology. The three-dimensional model highlights possible relationships between the
location of deposits, metabasalt layers and major shear zones. Both structural and geochemical
analyses have helped to clarify the geological evolution of the Ashanti belt during the Eburnean
Orogeny.
The Eburnean Orogeny in southwest Ghana is separated by two broad phases of
deformation and magmatism. The first, the Eoeburnean (2190 – 2140 Ma), formed strong
isoclinal F1 folds that deformed the Sefwi Group metavolcanic rocks in the southeast of the
Ashanti Belt. Simultaneously an early mineralisation event related to F1 folding occurred in the
vicinity of Wassa mine. The Eoeburnean phase developed subduction-related calc-alkaline
magmatism producing TTGs enriched in heavy rare earth elements. Kumasi group deposition
(2150 – 2125 Ma) followed D2 extension, facilitating Kumasi and Akyem basin formation with
regional structures such as the Ashanti Fault.
The second Eburnean phase (2130 – 2070 Ma) is characterised by Tarkwa Group
sedimentation and paleoplacer formation at the beginning of D3 NW-SE shortening. D3 events
formed major folds in the sedimentary basins of Kumasi, Akyem and Tarkwa. Regional scale
sinistral shearing reactivated the Ashanti Fault during D4, resulting in a remobilisation and
concentration of gold. F4 folds accommodating shearing induced displacement were formed at
Obuasi and Wassa. Later deformation events (D5 – D6) do not significantly affect regional
geological geometry. Several granite and granodiorite intrusions, depleted in heavy rare earth
elements, were formed during D3 to D6 by partial melting of previously thickened lower crust.

6

7
Résumé de la thèse
La ceinture Paléoprotérozoïque d’Ashanti, au sud-ouest du Ghana, est l’hôte de
nombreux gisements d’or, de classe mondiale, tels les gisements d’Obuasi (60 million d’onces)
et de Tarkwa (40 millions d’onces). La caractérisation de l’évolution structurale et magmatique
régionale permet d’éclaircir le contexte géotectonique de formation de ces gisements et ainsi
fournir des pistes pour de futures explorations. Ainsi, au cours de ces travaux de thèse, a été
réalisée une nouvelle carte géologique et structurale de la région, en accord avec les observations
de terrains et les données de géophysique aéroportée. Cette carte et une série de coupes
géologiques ont permis la construction d’un modèle tridimensionnel de la géologie Birimienne et
la mise en évidence de possibles relations entre la localisation des minéralisations et la présence
d’unités de métabasaltes à proximité des zones de cisaillement majeures. Les analyses
structurales et géochimiques ont permis de clarifier l’évolution géologique de la ceinture
d’Ashanti au cours de l’Orogénèse Éburnéenne.
L’Orogénèse Éburnéenne au sud-ouest du Ghana se divise en deux phases de déformation
et de magmatisme. La première phase, Éoéburnéenne (2190 – 2140 Ma), développa un intense
plissement isoclinal (D1) des roches à dominance métavolcanique du groupe de Sefwi, au sud-
est de la ceinture d’Ashanti. Dans un même temps, une minéralisation précoce associée aux plis
F1 apparut à la mine de Wassa. La phase Éoéburnéenne se caractérise également par un
magmatisme calco-alcalin de zone de subduction avec la production de TTGs enrichis en terres
rares lourdes. La sédimentation du groupe de Kumasi (2150 – 2125 Ma) est liée à une phase
d’extension (D2) contrôlant la formation des bassins de Kumasi et d’Akyem par l’activation des
failles majeures comme la Faille d’Ashanti.
La seconde phase, Éburnéenne (2130 – 2070 Ma), est marquée par la sédimentation du
groupe de Tarkwa et des paléoplacers, associés au début d’un raccourcissement NW-SE (D3).
Cette déformation forma les plis majeurs dans les bassins métasédimentaires de Kumasi, Akyem
et Tarkwa. La déformation suivante (D4) développa des zones de cisaillement d’échelle
régionale et réactiva la faille d’Ashanti en cisaillement sénestre, résultant en une remobilisation
et une concentration des minéralisations en or. Des plis F4, accommodant la déformation,
apparurent localement à Obuasi et à Wassa. Les déformations tardives (D5, D6) eurent peu
d’impact sur la géométrie régionale. Pendant ces déformations (D3 à D6), d’abondantes
intrusions de granites et granodiorites appauvris en terres rares lourdes se mirent en place, suite à
la fusion de la base de la croûte, épaissie par l’orogénèse.

8

9
Sommaire
1 Introduction 017
1.1 Le Ghana 017
1.2 La géologie du Ghana 018
1.2.1 Le craton Ouest Africain 019
1.2.2 Le bassin du Volta 019
1.2.3 La suture Panafricaine 020
1.3 La ceinture d’Ashanti 020
1.3.1 Le Birimien 023
1.3.1.1 Le groupe de Sefwi 023
1.3.1.2 Le groupe de Kumasi 024
1.3.2 Le Tarkwaien 024
1.3.3 Les granitoïdes 025
1.3.4 Les dykes de dolérite 026
1.3.5 Les sédiments Phanérozoïques 026
1.3.6 Les latérites 026
1.3.7 L’évolution géotectonique 027
1.3.8 Le métamorphisme 027
1.3.9 Les minéralisations en or 028
1.3.9.1 Les gisements Birimiens 028
1.3.9.2 Les gisements Tarkwaiens 028
1.4 Problématiques 029
1.4.1 Les déformations antérieures au bassin de Kumasi 029
1.4.2 Le contexte de formation du bassin de Tarkwa 029
1.4.3 La source de l’or alluvial du groupe de Tarkwa 030
1.4.4 L’évolution de magmatisme 030
1.5 Structure de la thèse 031
2 Chapitre I : Revised Eburnean geodynamic evolution of the gold-rich southern Ashanti
Belt, Ghana, with new field and geophysical evidence of pre-Tarkwaian deformations
2.1 Introduction 036
2.2 Geological setting 037
2.2.1 Eburnean Orogeny 040

10
2.2.2 Birimian Series 041
2.2.3 Tarkwaian Series 042
2.2.4 Granitoids 043
2.2.5 Dolerite dykes 043
2.2.6 Phanerozoic series 044
2.2.7 Metamorphism 044
2.2.8 Mineralisation 046
2.2.8.1 Birimian deposits 046
2.2.8.2 Tarkwaian deposits 046
2.3 Data used for mapping 047
2.3.1 Field data 047
2.3.2 Processing and interpretation of geophysical data 052
2.3.2.1 Aeromagnetic data 052
2.3.2.2 Radiometric (gamma-ray) data 052
2.3.2.3 Gravity data 052
2.3.2.4 Radar data 053
2.3.3 Petrophysics 053
2.4 Results 059
2.4.1 Birimian Stratigraphy 059
2.4.2 Structural Evolution of the Ashanti Belt 059
2.4.3 Revised Map 069
2.4.4 Sefwi Group D1 structures under the Tarkwa Basin 069
2.4.5 Forward Modelling 071
2.5 Discussion 073
2.5.1 Eoeburnean Phase (2187 – 2158 Ma) 073
2.5.2 Kumasi Group deposition (2154 – 2125 Ma) 077
2.5.3 Tarkwa Group deposition (2107 – 2097 Ma) 078
2.5.4 Eburnean Phase (2125 – 2000 ? Ma) 079
2.5.5 Implications for Au deposits 080
2.5.5.1 Timing of Gold Mineralisation and Metamorphism 080
2.5.5.2 Regional Distribution of the Mines 081
2.6 Conclusions 081
2.7 Résumé du chapitre I 082

11
3 Chapitre II : The tectonic context of the Eoeburnean Wassa gold mine - Implications for
relative timing of mineralising events in southwest Ghana
3.1 Introduction 088
3.2 Geological setting 089
3.2.1 Ashanti Belt 089
3.2.2 The Wassa gold mine 090
3.3 Field observations and geochemistry 095
3.3.1 Stratigraphy 095
3.3.2 Whole rock geochemistry 098
3.3.3 Structural observations 103
3.3.4 Mineralisations 107
3.4 Structural geophysics 108
3.4.1 Geophysical data 108
3.4.1 Petrophysical data 109
3.4.2 Interpretations 110
3.5 Discussion 116
3.5.1 Wassa-type mineralisations 116
3.5.2 Comparison with the Obuasi-type structures and mineralisations 119
3.5.3 Comparison with the Damang-type structures and mineralisations 120
3.5.4 Implications for mineralisation at the regional scale 121
3.5.4.1 Carbonate alteration 121
3.5.4.2 A Wassa-type deposit source of the gold for the placers 121
3.6 Conclusions 122
3.7 Résumé du chapitre II 122
4 Chapitre III : A new model of Paleoproterozoic crustal growth in southwest Ghana: an
Eoeburnean crustal source for the younger Eburnean granites
4.1 Introduction 128
4.2 Geological setting 132
4.2.1 Geodynamic context 132
4.2.2 Sefwi metavolcanic group 133
4.2.3 Kumasi metasedimentary group 134
4.2.4 Tarkwa metasedimentary group 134
4.2.5 Intrusive rocks 135
4.3 Samples 135

12
4.3.1 Intrusive rocks 136
4.3.1.1 Eoeburnean intrusions 136
4.3.1.2 Eburnean intrusions 136
4.3.2 Metavolcanics and metasediments 137
4.3.3 Analytical methods 137
4.4 Geochemical results 140
4.4.1 Metamorphism, hydrothermal alteration and weathering 140
4.3.2 Eoeburnean and Eburnean plutonism and volcanism 140
4.3.3 Metasediments 145
4.5 Pseudosection modelling 146
4.5.1 Methodology 146
4.5.2 Results 147
4.6 Discussion 151
4.6.1 Earliest Paleoproterozoic magmatism 151
4.6.2 Eoeburnean phase 151
4.6.3 Eburnean phase 152
4.7 Conclusions 154
4.8 Résumé du chapitre III 155
5 Chapitre IV : 3D Modelling of the Ashanti Belt, SouthWest Ghana, and Lithostructural
Control on Gold Occurrences within the Sefwi Group
5.1 Introduction 162
5.2 Geological setting 162
5.2.1 Stratigraphy 162
5.2.2 Mineralisations 163
5.3 Mapping of the Birimian beneath the Tarkwa metasedimentary basin 164
5.4 Geophysical datasets 164
5.4.1 Aeromagnetic data 164
5.4.2 Gravity data 167
5.4.3 Petrophysical data 167
5.5 3D modelling of the Ashanti Belt 168
5.5.1 Modelling packages 169
5.5.1.1 Geomodeller 169
5.5.1.2 Gocad 169
5.5.1.3 VPmg 169

13
5.5.2 Low resolution model of the Ashanti Belt 170
5.5.2.1 Geological modelling 170
5.5.2.2 Geophysical modelling 170
5.5.3 High resolution model of the Ashanti Belt 171
5.5.3.1 High resolution modelling 171
5.5.3.2 VPmg forward-modelling 172
5.6 Results 173
5.6.1 Geometry of the Tarkwa Basin 173
5.6.2 Gold deposit locations versus modelled lithologies 179
5.7 Discussion 185
5.7.1 Depth of the Tarkwa Basin 185
5.7.2 Possible lithostructural control on gold mineralisation 185
5.7.3 Limits of the Ashanti Belt 3D modelling 186
5.8 Conclusions 187
5.9 Résumé du chapitre IV 188
6 Conclusions et Perspectives 193
7 Références 201
8 Listes des Tables et des Figures 217
9 Annexes 233
9.1 Annexe 1 : Données d’affleurements et cartes
9.3 Annexe 2 : Métamorphisme, premiers résultats
9.4 Annexe 3 : Liste de publications associées à cette thèse

14

15
Introduction

16

17
Introduction
1.1 Le Ghana
Le Ghana, autrefois appelé Côte de l’Or, est un pays démocratique d’Afrique occidentale
subéquatoriale d’environ 238000 km². Avec la totalité du territoire située à moins de 800 m
d’altitude, sa topographie ne présente aucun relief majeur. La population approche les 25
millions d’habitants, principalement regroupés autour des principales agglomérations : Accra, la
capitale, au sud-est du pays sur la côte Atlantique, Kumasi, au centre-ouest et Tamale, au nord
(Fig. 1).
Le climat et la végétation sont très variables du nord au sud du pays. La partie sud du
Ghana possède un climat de type subéquatorial marqué par deux saisons des pluies : de mars à
juillet et de septembre à novembre. L’harmattan, vent d’origine subsaharienne, est omniprésent
durant la saison sèche. L’humidité ambiante est élevée (toujours supérieure à 60 %) et les
températures moyennes varient entre 25 et 30°C. Ces conditions climatiques favorisent
l’altération des sols et la croissance d’une végétation abondante, de type équatorial.
Le Ghana exporte principalement quatre ressources majeures que sont le cacao, l’or, le
bois et la bauxite. De récentes exploitations de pétrole dans le golfe de Guinée, ainsi que la
production de diamants alluviaux, contribuent aussi à l’économie. À elle seule, l’industrie
minière de l’or représente plus de 5 % du produit intérieur brut du Ghana, avec près de 80 tonnes
produites par an (Bermúdez-Lugo, 2009). L’essentiel des gisements d’or se situe dans les terrains
Paléoprotérozoïques du craton Ouest Africain, au sud-ouest du pays.
L’industrie de l’or ghanéen, l’une des plus anciennes au monde, a évolué pendant plus de
2500 ans. Durant plusieurs siècles, l’or du Ghana fut utilisé dans le cadre d’échanges
commerciaux avec les peuples d’Afrique du Nord. L’essentiel de la production était alors réalisé
selon des méthodes artisanales (Hilson, 2002), toujours utilisées de nos jours par certains
orpailleurs. L’arrivée des Européens au 15e siècle contribua à l’expansion significative du
marché de l’or en Afrique de l’Ouest et, en particulier, au Ghana, plaque tournante du commerce
d’or et d’esclaves (Buah, 1998). Pour cela, de nombreux forts de défense et d’échanges furent
construits sur la côte, dont celui d’Elmina, construit en 1482 par les portugais. Les arrivées des
Hollandais à la fin du 16e et surtout des Anglais au 17
e siècle développèrent la production
minière, et un début d’industrialisation s’installa dès la fin du 19e siècle. Les principaux

18
gisements tels Tarkwa et Obuasi commencèrent alors à être exploités à grande échelle par les
premières compagnies minières, motivant ainsi l’exploration géologique de la région d’Ashanti,
au sud-ouest du pays. Une première cartographie des terrains du bassin de Tarkwa fut ainsi
publiée dès 1904 par le service géologique de la Côte de l’Or (Whitelaw, 1904). Celle-ci fut
affinée et étendue par la suite, en plusieurs étapes, pour aboutir à une cartographie complète du
Ghana, révisée en 2009 par Agyei Duodu et al.
Figure 1 Carte géologique simplifiée du Ghana (d’après BRGM, SigAfrique, 2004), avec la
localisation de la zone d’étude (cadre rouge) ainsi que des principales
agglomérations. Le fond de carte utilisé correspond au modèle numérique de terrain
SRTM. L’image de droite est une projection de l’Afrique avec la localisation de la
zone d’étude (d’après Google Earth, 2012).
1.2 La géologie du Ghana
La géologie du Ghana se divise en trois ensembles principaux : la chaîne de suture
Panafricaine au sud-est, le bassin du Volta dans sa partie nord-est, et le craton Ouest Africain
pour le reste du territoire (Agyei Duodu et al., 2009). Ces trois ensembles témoignent de deux
évènements tectoniques bien distincts dans l’évolution géologique ghanéenne et ouest-africaine

19
(Bonhomme, 1962) : L’Orogénèse Éburnéenne, d’âge Paléoprotérozoïque (2.1 Ga) et
l’Orogénèse Panafricaine, d’âge Néoprotérozoïque (≈ 0.6 Ga).
1.2.1 Le craton Ouest Africain
Le craton LéoMan, formé de terrains Archéens et Paléoprotérozoïques, constitue la
majeure partie de l’Afrique de l’Ouest. Il est limité au sud et à l’ouest par la marge Atlantique et
par les bassins sédimentaires associés, au nord par la chaîne de l’Atlas et à l’est par la suture
Panafricaine (Ennih et Liégeois, 2008). De nombreux bassins sédimentaires (Taoudeni, Volta)
d’âges Néoprotérozoïques à Paléozoïques recouvrent certaines parties du craton sur plusieurs
kilomètres d’épaisseur.
Ce craton est composé d'un noyau Archéen dans sa partie sud-ouest, contre lequel se
juxtaposent des séries de ceintures de roches vertes Paléoprotérozoïques. Ces ceintures alternent
avec des bassins formés de métasédiments, au Ghana, ou de granitoïdes, au Mali et au Burkina
Faso (Metelka et al., 2011). Au sud-ouest du Ghana, quatre ceintures (Bui, Sefwi, Ashanti et
Kibi-Winneba) sont séparées par trois bassins sédimentaires (Sunyani, Kumasi et Akyem, aussi
appelé bassin de Cape Coast, Agyei Duodu et al., 2009). Ces ceintures de roches vertes et les
bassins associés ont été formés puis déformés en relation avec l’Orogénèse Éburnéenne
(Bonhomme, 1962).
En Amérique du Sud, le craton Guyanais est considéré comme un homologue du craton
Ouest Africain, duquel il fut séparé par l’ouverture de l’océan Atlantique (Caen-Vachette, 1988).
Cependant, des études récentes de paléomagnétisme suggèrent que ces deux cratons, assemblés
autour de 2000 Ma, pourraient avoir vécu une histoire antérieure bien différente (Nomade et al.,
2003). Le craton São Luís (Klein et al., 2005, 2008), au nord du Brésil, constitue un petit
fragment de la partie sud ghanéenne du craton d’Afrique de l’Ouest. Il est principalement
composé de granitoïdes d’âges et composition similaires à ceux du sud-ouest du Ghana.
1.2.2 Le bassin du Volta
Le bassin du Volta recouvre la partie ghanéenne du craton Ouest Africain et est bordé à
l’est par la chaîne des Dahomeyides (Fig. 1). Il se compose d’environ 5 km de sédiments d’âge
Néoprotérozoïque à Paléozoïque subdivisés en trois groupes (Kalsbeek et al., 2008) : le groupe
de Kwahu-Morago (ou Bombouaka), avec des sédiments déposés entre 1000 et 950 Ma (Agyei
Duodu et al., 2009), le groupe de Oti-Pendjari (635 Ma – 542 Ma) et le groupe d’Obosum, d’âge
Cambrien (542 Ma - 488 Ma). La présence d’un important volume de zircons détritiques datés

20
entre 2200 et 2000 Ma indique qu’une majeure partie des sédiments du bassin de Volta dérive de
l’érosion du craton Ouest Africain (Kalsbeek et al., 2008).
Selon Trompette (1994), les deux groupes sédimentaires basaux (Bombouaka et Oti)
pourraient être interprétés comme des dépôts de marge passive reliés à l’ouverture d’un océan
Panafricain. Sa fermeture aurait entrainé la formation de la chaîne des Dahomeyides et en
conséquence, des dépôts de molasses syn-orogéniques du groupe d’Obosum.
1.2.3 La suture Panafricaine
La chaîne des Dahomeyides, au sud-est du Ghana, représente une partie de la zone de
suture Panafricaine (Fig. 1). Cette chaîne, aussi appelée Trans-Saharienne ou Trans-Brésilienne,
correspond à l’assemblage final du supercontinent Gondwana au Néoprotérozoïque (Trompette,
1980, 1994). Elle s’étend sur plus de 2000 km de long pour 100 km de large, marquant la limite
orientale du craton Ouest Africain. Cette chaîne se compose d’une succession de nappes
déplacées d’est en ouest lors de la collision entre le bloc Paléoprotérozoïque d’Afrique de
l’Ouest et les assemblages protérozoïques du Togo, Benin et Nigéria (Attoh et al., 1997). Le
métamorphisme et les intrusions associées à l’Orogénèse Panafricaine lui donnent des âges aux
alentours de 600 Ma (Attoh et al., 2007).
1.3 La ceinture d’Ashanti
Parmi les ceintures de roches vertes du sud-ouest du Ghana, la ceinture d’Ashanti est
l’une des plus remarquables pour la variété de ses lithologies, pour sa complexité structurale et
pour son intérêt économique majeur dans la région. C’est en effet l’une des ceintures les plus
riches en gisements métalliques, principalement d’or et de manganèse, en Afrique de l’Ouest.
Les unités stratigraphiques « Birimien » et « Tarkwaien » regroupent l’essentiel des roches
observées à l’échelle du craton Ouest Africain et forment également la ceinture d’Ashanti et ses
bassins périphériques. Au cours de l’Orogénèse Éburnéenne, les déformations et les nombreuses
intrusions de granitoïdes ont contribuées à la mise en place des structures et des minéralisations
observées.

21
Figure 2 Les lithologies du sud-ouest du Ghana : (a) métabasaltes Birimiens, groupe de
Sefwi, (b) métavolcanosédiments Birimiens, groupe de Sefwi, (c) métaconglomérats
Tarkwaiens, (d) quartzites Tarkwaiennes, avec une stratification entrecroisée
marquée par des lits de magnétite, (e) phyllites Tarkwaiennes, (f) granitoïde
Éburnéen, (g) dolérite (dyke), (h) sédiments phanérozoïques.

22
Figure 3 Altération de la surface : (a) couche organique de sol, (b) niveau B2, à pisolithes, (c) niveau B3, zone tachetée, (d) niveau B4, saprolite.
L’épaisseur totale de ce profil d’altération approche 15 m.

23
1.3.1 Le Birimien
Le Birimien se compose de roches métavolcaniques et métasédimentaires (Fig. 2). Une
première description de cette unité stratigraphique majeure fut réalisée par Kitson (1918) dans la
rivière Birim située à 80 km à l’est de la ceinture d'Ashanti. Les géologues du début du 20e siècle
tels Kitson (1928), Whitelaw (1929) et Junner (1935, 1940) ont divisés le Birimien du Ghana en
deux sous-groupes : un Birimien Supérieur formé par les métavolcanites et un Birimien Inférieur
formé par les métasédiments. Leur stratigraphie fut ensuite conservée dans les études de
Hastings (1982), Ntiamoah-Agyakwa (1979), Kesse (1985) et Milési et al. (1992). D’autres
études ont pourtant souligné les incohérences de cette stratigraphie : Leube et al. (1990) et
Eisenlohr (1992) ont suggéré que les roches métavolcaniques et métasédimentaires du Birimien
pourraient avoir été synchrones. Finalement, ce débat fut interrompu par les premières datations
absolues, suggérant des métasédiments plus jeunes que les métavolcanites (analyses Sm/Nd,
Taylor et al., 1992). Cette nouvelle stratigraphie fut confirmée par des datations U/Pb sur zircons
donnant des âges variant entre 2142 ± 24 Ma et 2266 ± 2 Ma pour les métavolcanites (U/Pb sur
zircons, Adadey et al., 2009, Loh et al., 1999) et inférieurs à 2154 ± 2 Ma pour les
métasédiments du bassin de Kumasi (U/Pb sur zircon détritiques, Oberthür et al., 1998).
Récemment, Adadey et al. (2009) proposent une nouvelle stratigraphie du Birimien avec un
groupe de Sefwi (2195-2170 Ma), composé de micaschistes et de métavolcanites et un groupe de
Kumasi, déposé après 2150 Ma et formé par des métasédiments.
1.3.1.1 Le groupe de Sefwi
Selon Adadey et al. (2009), le groupe de Sefwi se compose principalement de
métabasaltes, métaandésites, métagabbros et de micaschistes qui alternent avec des niveaux de
phyllites et de métasédiments volcanoclastiques. Ce groupe occupe les parties sud et sud-est de
la ceinture d'Ashanti et se prolonge probablement sous les sédiments du bassin de Tarkwa.
La carte géologique du Ghana (Agyei Duodu et al., 2009) indique trois ensembles
majeurs de roches métavolcaniques qui affleurent le long de la côte, à Dixcove (plage de Butre),
Cape Three Point et Axim. Selon Loh et al. (1999) les métabasaltes en coussins observés à
Dixcove (à l’est) seraient à la base de la stratigraphie du groupe de Sefwi et par conséquent plus
anciens que les métabasaltes et métaandésites d’Axim (à l’ouest). Une autre hypothèse, proposée
par Sylvester et Attoh (1992) et réutilisée dans les études de Dampare et al. (2008) et Attoh et al.
(2006), considère un groupe de Sefwi formé d’une unique série volcanique avec près de 3500 m
de basaltes massifs recouvrant un socle de gabbros et de roches ultrabasiques.

24
L’étude géochimique, par Dampare et al (2008), des métabasaltes et métaandésites des
secteurs de Cape Three Point et d’Axim ont mis en évidence deux types de métavolcanites, de
composition et de sources différentes, évoluant d’est en ouest. Leurs basaltes de type I,
échantillonnés dans la région de Cape Three Point, présentent une composition en majorité
tholéiitique issue de la fusion d’un manteau appauvri, avec des caractéristiques géochimiques
proches de celles des basaltes de dorsales océaniques. D’après Dampare et al. (2008), les
métabasaltes et métaandésites du secteur d’Axim représenteraient un second type de
métavolcanites (type II), de composition calco-alcaline, formées le long d’arcs volcaniques dans
un contexte de subduction. La présence de rhyolites dans le secteur d’Axim, mentionnées par
Loh et al. (1999), illustre toute une série de cristallisation fractionnée dans le secteur d’Axim
allant des basaltes aux rhyolites.
Au nord-ouest de Cape Three Point, Loh et al. (1999) et Agyei Duodu et al. (2009) ont
cartographié une bande de roches ultrabasiques (péridotite, pyroxénite, harzburgite et dunite).
Selon Attoh et al. (2006), ces roches correspondraient à une série ophiolitique mise en place au
tout début de l’histoire Éoéburnéenne. La présence de sédiments volcanoclastiques, de basaltes
en coussins et de roches ultrabasiques indiquerait que le groupe de Sefwi pourrait consister en un
fragment d’une croûte océanique ou d’un plateau océanique d’âge pré-Éoéburnéen (> 2190 Ma).
1.3.1.2 Le groupe de Kumasi
Les bassins d'Akyem et de Kumasi, situés de part et d’autre de la ceinture d’Ashanti,
consistent en une alternance entre des niveaux de phyllites, de métasédiments volcanoclastiques
et de rares lits d’andésites (Adadey et al., 2009). L’analyse géochimique des métasédiments du
bassin d'Akyem (Birim Diamondfield, Asiedu et al., 2004) et du bassin de Kumasi (la région de
Konongo, Asiedu et al., 2009) indique une concentration en éléments ferromagnésiens plus
importante que la moyenne de la croûte Paléoprotérozoïque, ce qui suggère une source dominée
par des roches basiques. Asiedu et al. (2004) proposent que les sédiments du groupe de Kumasi
dérivent de l’altération d’un socle métavolcanique (groupe de Sefwi) et de granitoïdes.
1.3.2 Le Tarkwaien
Le groupe de Tarkwa (Kitson, 1928, Whitelaw, 1929, Junner, 1940) est une succession de
quatre unités métasédimentaires (Fig. 2) : Le groupe de Kawere, à la base des sédiments
Tarkwaien, est composé de conglomérats et de grès. Son épaisseur varie entre 250 m et 700 m. Il
est recouvert par les 600 m de la formation de Banket consistant en des lits de conglomérats en
alternance avec des grès. Ces derniers présentent une stratification entrecroisée marquée par de

25
fins niveaux de magnétite. Les conglomérats sont principalement composés de galets de quartz
(> 90%) et de roches basiques Birimiennes (Hirdes et Nunoo, 1994). Ils hébergent le gisement
d’or alluvial de Tarkwa. La série du Tarkwaien se continue par 400 m de phyllites (Tarkwa
Phyllites) puis par les quartzites du groupe de Huni, entrecoupés de quelques niveaux de
phyllites sur plus de 1300 m.
L’âge des dépôts sédimentaires du bassin de Tarkwa est peu connu. Les datations U/Pb et
Pb/Pb, sur zircons détritiques, de Davis et al. (1994) et Hirdes et Nunoo (1994) indiquent un âge
maximum de dépôt de 2132 ± 2,8 Ma pour le groupe de Kawere et de 2132,6 ± 3,4 Ma pour la
formation de Banket. Cependant, ces âges sont contradictoires avec la présence de zircons
détritiques plus jeunes identifiés dans l’étude de Pigois et al. (2003). La formation de sills de
métagabbros / dolérites à 2102 ± 13 Ma (U/Pb sur zircon, Adadey et al., 2009) et des intrusions
de granitoïdes à 2097 ± 2 Ma (U/Pb sur zircon, Oberthür et al., 1998) délimitent la fin de la
sédimentation du groupe de Tarkwa. Bien qu’aucune analyse géochimique n’ait encore été
publiée sur les sédiments du bassin de Tarkwa, il est généralement admis qu’ils dérivent de
l’érosion des métavolcanites du groupe de Sefwi et des granitoïdes associés (Kesse, 1985).
1.3.3 Les granitoïdes
Tous les groupes précédemment décrits ont été pénétrés par des granitoïdes (Fig. 2) au
cours de l’Orogénèse Éburnéenne. Ces intrusions se sont déroulées en deux phases au sud-ouest
du Ghana : entre 2190 - 2150 Ma (phase Éoéburnéenne) et 2130 - 2000 Ma (phase Éburnéenne).
Le craton São Luís, en Amérique du Sud, semble avoir une évolution magmatique similaire
(Klein et al., 2005, 2008). La plupart des plutons correspond à des TTG (Tonalite, Trondhjemite,
Granodiorite) bien que certaines intrusions soient très basiques, comme le gabbro de Mpohor, ou
très acides, comme le granite d’Anibel. Mauer (1990) et Loh et al. (1999) ont classifié ces
granitoïdes en deux catégories selon leur mise en place dans la ceinture métavolcanique
d’Ashanti (G2 ou belt-type) ou dans les bassins sédimentaires environnants (G1 ou basin-type).
Les trois principales intrusions dans la partie sud de la ceinture sont les plutons de
Prince’s Town, Dixcove et de Sekondi (Ketan). Leurs datations U/Pb sur zircon donnent
respectivement des âges à 2158,9 ± 3,6 Ma (Attoh et al., 2006), 2171 ± 2 Ma (Hirdes et al.,
1992) et 2174 ± 2 Ma (Oberthür et al., 1998) pour ces trois plutons. De type-I, leur composition
est relativement basique (tonalites). Dampare et al. (2008), proposent qu’une fusion partielle de
métabasaltes dans un contexte d’arc volcanique est à la source de ces granitoïdes. Au contraire,
pour Mauer (1990), ils proviennent de la fusion partielle du manteau.

26
Les granitoïdes de type bassin affleurent principalement dans les bassins d’Akyem et de
Kumasi. Ils ont une composition de granodiorite et granite, souvent riches en feldspath
potassique pour les plus jeunes intrusions. Leurs caractéristiques de type-S (Loh et al., 1999)
indiquent une formation in situ par fusion partielle des métasédiments ou une contamination lors
de la mise en place (Mauer, 1990). Les âges des granitoïdes des bassins s’échelonnent de 2136 ±
19 Ma (âge U/Pb sur zircon, Adadey et al., 2009) à 1973 ± 75 Ma (âge Pb/Pb sur roche totale,
Taylor et al., 1992).
1.3.4 Les dykes de dolérite
De nombreux dykes de dolérite (Fig. 2) parcourent le Craton Ouest Africain sur plusieurs
centaines de kilomètres pour moins de 200 m d’épaisseur. Ils recoupent l’ensemble de structures
et lithologies Éburnéennes. Ces dykes sont clairement visibles sur les cartes magnétiques ainsi
que sur la nouvelle carte du Ghana (Agyei Duodu et al., 2009). Deux principales familles,
orientées N-S et ENE-OSO existent au sud-ouest du Ghana. Plus au nord, les dykes sont
recouverts par le bassin du Volta, ce qui indique un âge de mise en place avant 950 Ma
(Kalsbeek et al., 2008).
Des sills et dykes de dolérite (ou métagabbros) datés à 2102 ± 13 Ma (U/Pb sur zircon,
Adadey et al., 2009) dans le bassin de Tarkwa furent déformés lors de la phase Éburnéenne et, de
ce fait, ne présentent aucun lien avec les dykes d’échelle régionale.
1.3.5 Les sédiments Phanérozoïques :
Les terrains consolidés les plus récents au sud de la ceinture d’Ashanti correspondent à
des grès et marnes phanérozoïques (Fig. 2). Ceux-ci affleurent le long de la côte du golfe de
Guinée, principalement entre Cape Coast et Takoradi, mais aussi à l'ouest d'Axim. Loh et al.
(1999) ont référencé deux groupes principaux avec des âges qui s’étendent du Dévonien au
Carbonifère (416 Ma à 299 Ma, Crow, 1952, Mensah, 1973, Chaloner et al., 1974, Baer and
Riegel, 1980) et au Crétacé (145 Ma à 65 Ma, Tevendale, 1950).
1.3.6 Les latérites
Au sud-ouest du Ghana, le terme « latérite » désigne la couche d’altération météorique
séparant le sol du saprolite et de la roche fraîche (Fig. 3). Les conditions climatiques chaudes et
humides favorisent sa formation (Bourman, 1993). Les latérites se composent de plusieurs
niveaux correspondant à des degrés d’altération différents pour une épaisseur totale variant entre
5 et 15 m environ selon les situations. Le premier niveau, d’une épaisseur d’environ 0,5 m,

27
correspond à la couche organique du sol (Hong et al., 2009). Le second niveau, aussi appelé B2,
est caractérisé par la présence de nodules de fer (pisolithes) dans une matrice argileuse, sur une
épaisseur de l’ordre de 1,5 m. Le niveau suivant, B3, correspond à la zone tachetée (3 m). Enfin,
le B4, appelé saprolite correspond à la partie la moins altérée de la latérite. Son épaisseur est
difficile à estimer en raison d’une transition progressive jusqu'à la roche fraîche.
Les latérites sont un réel problème sur le terrain. Elles sont omniprésentes au sud-ouest
du Ghana, excepté au fond de certains cours d’eau, sur la côte et, bien sûr, dans les sites miniers.
L’épaisseur de latérite reste relativement constante, au contraire de celle du saprolite qui varie
fortement en fonction de la lithologie concernée. Ainsi, les affleurements de granitoïde sont plus
fréquents que ceux de métasédiment et de métavolcanite. La lithologie initiale, de même que les
structurales principales (S0, S1), commencent à être identifiables à partir du B2, tandis que les
structures secondaires ne sont visibles que dans les parties les moins altérées du saprolite.
1.3.7 L’évolution géotectonique
Plusieurs auteurs comme Allibone et al. (2002a), Feybesse et al. (2006) ou De Kock et al.
(2011) suggèrent une évolution tectonique en deux phases. La première (Éoéburnéenne, 2190 -
2150 Ma) développe un volcanisme et un magmatisme associés à la formation du groupe de
Sefwi. Elle se termine par l’ouverture du bassin de Kumasi. Pour ces auteurs, la seconde phase
(Orogénèse Éburnéenne, 2125 Ma - 1980 Ma) correspond à une tectonique transpressive senestre
dans un contexte de raccourcissement NO-SE (Feybesse et al., 2006). Les déformations
associées affectent à la fois les groupes Birimien et Tarkwaien avec le développement de plis
ouverts à isoclinaux et de failles subverticales. Ces failles, notamment la faille d’Ashanti,
subirent ensuite un mouvement cisaillant sénestre, contemporain du développement d’une
nouvelle génération de plis et d’abondantes minéralisations en or (Allibone et al., 2002a).
L’Orogénèse Éburnéenne se termine par les déformations tardives observées dans la région de
Damang (Tunks et al., 2004).
1.3.8 Le métamorphisme
Les groupes stratigraphiques Birimien et Tarkwaien sont affectés par un métamorphisme
régional dont l’intensité ne dépasse pas le faciès des schistes verts. Les études sur assemblage
amphibole / plagioclase suggèrent des conditions maximales de température et de pression
autour de 500-650°C, 5-6 kbar (John et al. 1999) et 520°C, 5,4 kbar (Schmidt Mumm et al.,
1997). Ce maximum métamorphique est estimé à 2092 ± 3 Ma (U/Pb sur titanite
métamorphique, Oberthür et al., 1998).

28
La présence de grenats dans la mine de manganèse de Nsuta (Nyame et al., 1998,
Kleinschrot et al., 1993, 1994), de grenat et de staurotide autour de la mine d'or de Damang
(Pigois et al., 2003), suggèrent des conditions environnementales similaires pour leur formation,
bien que les grenats riches en manganèse puissent être stables à de plus basses pressions et
températures (Mahar et al., 2004).
1.3.9 Les minéralisations en or
La ceinture d'Ashanti, au sud-ouest du Ghana, est réputée pour son intérêt économique
majeur en Afrique de l’Ouest. De nombreuses mines d’or d’échelle mondiale parsèment la
région, avec notamment, les gisements géants d’Obuasi (hydrothermal, 60 millions d’onces) et
de Tarkwa (placer, 40 millions d’onces).
1.3.9.1 Les gisements Birimiens
Les minéralisations portées par les lithologies Birimiennes sont d’origine hydrothermale.
La plupart des gisements sont localisés le long de la faille d’Ashanti et des autres zones de
cisaillement majeures ou le long du contact entre le socle Birimien et le bassin de Tarkwa.
Oberthür et al. (1994, 1997), Blenkinsop et al. (1994) et Allibone et al. (2002a)
montrèrent que les minéralisations principales dans la mine d'Obuasi sont associées à la
réactivation en cisaillement senestre (D4) de la faille d’Ashanti. Ces cisaillements sont
contemporains de l’altération en carbonates des basaltes et des phyllites graphitiques présents le
long de la faille d’Ashanti (Mumin and Fleet, 1995). Ceci s’applique également aux mines de
Bogoso et Prestea où Mumin et al. (1994) observent que la minéralisation en or résulte d’une
remobilisation de particules d’or antérieures. De nombreux sulfures, notamment de
l’arsénopyrite, sont associés aux minéralisations Birimiennes de la ceinture d’Ashanti (Milési et
al., 1991).
1.3.9.2 Les gisements Tarkwaien
Deux styles de minéralisations en or affectent le groupe de Tarkwa, représentés par les
gisements de types Damang et Tarkwa. Le gisement de Damang résulte de minéralisations
hydrothermales localisées le long du contact entre les métasédiments Tarkwaien et le socle
Birimien. L’or y est associé à de la pyrite formée à proximité des fractures ou incluses dans des
veines de quartz correspondant aux dernières phases de déformation de l’Orogénèse Éburnéenne
(Tunks et al. 2004). Un âge de 2063 ± 9 Ma fut obtenu par datations U/Pb sur xénotimes
hydrothermaux (Pigois et al., 2003).

29
Le gisement d’or de Tarkwa est localisé dans la formation de Banket et consiste en des
dépôts alluviaux (placers). Les particules d'or sont associées aux niveaux conglomératiques
riches en hématite, au fond de paléo-chenaux. La présence de galets ainsi que les concentrations
variables d’or suivant la stratigraphie illustrent l’origine sédimentaire de ce gisement (Sestini
1973).
1.4 Problématiques
Bien que la ceinture d’Ashanti fût grandement étudiée au cours du 20e siècle comme en
témoignent les nombreuses études précédemment citées, de nombreuses interrogations persistent.
Les études menées le long de cette thèse auront pour objectif principal d’éclaircir certains de ces
points et ainsi contribuer à une compréhension plus globale de l’évolution Paléoprotérozoïque du
sud-ouest du Ghana, et, dans une moindre mesure de celle du craton Ouest Africain.
1.4.1 Les déformations antérieures au bassin de Kumasi
Allibone et al. (2002a) et Feybesse et al. (2006) proposent un évènement de magmatisme
et métamorphisme précédant la sédimentation dans les bassins de Kumasi et de Tarkwa, mais
restent vagues sur son contexte tectonique et sur les déformations qui lui sont associées.
Pourtant, la compréhension de la situation géologique Éoéburnéenne est fondamentale pour
l’interprétation géotectonique des structures observées dans les différentes mines et leurs
corrélations régionales. Ainsi, l’origine de plusieurs failles secondaires actives lors de la phase
Éburnéenne, comme celles décrites par Allibone et al. (2002a) à la mine d’Obuasi, pourrait être
liée à la géométrie antérieure du socle Birimien, formée par le groupe de Sefwi.
1.4.2 Le contexte de formation du bassin de Tarkwa
Le bassin de Tarkwa recouvre les métavolcanites du groupe de Sefwi tout le long de la
ceinture d’Ashanti. Son âge et le contexte de sa formation ne sont pas complètement identifiés.
En accord avec les études précédentes de Davis et al. (1994) et Hirdes et Nunoo (1994), Pigois et
al. (2003) proposent un âge maximal de 2133 Ma ± 4 Ma (U/Pb) alors qu’un tiers de leurs
zircons détritiques sont plus jeunes. De même, l’âge minimal, déterminé par une possible
intrusion de granitoïdes à 2097 ± 2 Ma (U/Pb sur zircon, Oberthür et al., 1998) reste incertain en
l’absence d’observations claires du contact entre les métasédiments Tarkwaien et cette intrusion.
Allibone et al. (2002a) ont suggéré que la sédimentation du bassin de Tarkwa s’était
produite avant les déformations Éburnéennes majeures et, en conséquence, avant les

30
minéralisations d’Obuasi. À l’opposé, Leube et al. (1990) proposent que l’essentiel des
déformations Birimiennes et des minéralisations en or soient antérieures au bassin de Tarkwa.
Pour eux, les plis observés dans les métasédiments Tarkwaiens correspondent à de la
déformation gravitaire tardive. Pour Ledru et al. (1994), le bassin de Tarkwa se développa en
réponse à la déformation qui eu lieu pendant les étapes finales de l'Orogénèse Éburnéenne.
L’hypothèse d’une formation du groupe de Tarkwa au début du raccourcissement fut émise par
Feybesse et al. (2006) et Adadey et al. (2009). Ces derniers montrèrent qu’une première
déformation affecta le groupe de Kumasi avant la formation du groupe de Tarkwa. Ces deux
bassins sédimentaires ont ensuite été affectés conjointement par la majeure partie des
déformations Éburnéennes.
1.4.3 La source de l’or alluvial du groupe de Tarkwa
Le bassin de Tarkwa est l’hôte de plusieurs gisements d’or alluvial. Avant les premières
estimations de l’âge des métasédiments Tarkwaiens, l’or contenu dans ces gisements était
considéré comme étant dérivé des dépôts hydrothermaux Birimiens tels que ceux localisés le
long de la faille d’Ashanti (Kesse, 1985). Cela semblait en accord avec les analyses d’inclusions
fluides dans les galets de quartz des unités conglomératiques, suggérant des conditions
d’homogénéisation similaires à celles des veines de quartz observées dans les gisements
hydrothermaux de la faille d’Ashanti (Klemd et al., 1993). Toutefois, quelques auteurs comme
Milési et al. (1991) observèrent quelques contradictions comme, par exemple, l’absence de trace
d’arsénopyrite associée à l’or dans les conglomérats Tarkwaiens, alors que celle-ci est pourtant
observée en abondance dans les gisements Birimiens de Prestea, Bogoso et Obuasi.
Les études structurales récentes (Milési et al., 1992, Allibone et al., 2002a, 2002b)
montrent clairement que les gisements d’or de la faille d’Ashanti sont postérieurs à la formation
du bassin de Tarkwa. En conséquence, l’or alluvial ne peut en aucun cas provenir de ces
gisements. Ceci suggère un évènement de minéralisation plus ancien, non-référencé, peut-être
contemporain du magmatisme Éoéburnéen et des possibles déformations associées.
1.4.4 L’évolution du magmatisme
Les granitoïdes du sud-ouest du Ghana furent classés par Mauer (1990) et Loh et al
(1999) en deux groupes suivant leur localisation dans la ceinture métavolcanique ou dans les
bassins métasédimentaires. Cependant, cette classification ne prend pas en compte les âges de
ces granitoïdes, qui indiquent deux séquences de magmatisme séparées par plusieurs dizaines de
millions d’années : Éoéburnéen et Éburnéen (De Kock et al., 2011). Les études de Klein et al.

31
(2005, 2008) sur le craton São Luís, au nord du Brésil, semblent pourtant mettre en évidence un
changement de la composition en éléments traces entre les granitoïdes de ces deux phases. La
faible superficie couverte par ce petit fragment du craton d’Afrique de l’Ouest limite toutefois
les interprétations.
Au Ghana, bien que de nombreuses analyses géochimiques des granitoïdes aient été
conduites (John et al., 1999, Yao et Robb, 2000, Dampare et al., 2005, Adadey et al., 2009), les
sources et l’évolution du magmatisme restent peu interprétées. Pourtant, les phases de
magmatisme pourraient avoir joué un rôle non négligeable dans la genèse et le transport des
fluides minéralisateurs, deux des paramètres clés pour la formation d’un gisement.
1.5 Structure de la thèse
Les études précédentes menées sur la ceinture d’Ashanti soulèvent quatre interrogations
majeures pour la compréhension de l’évolution Éburnéenne de la ceinture d’Ashanti et la
formation des abondants gisements d’or. Pour répondre à ces questions, nous commencerons par
la révision de la carte régionale du sud de la ceinture d’Ashanti et réinterprèterons l’évolution
géotectonique de la région, via l’analyse de nouvelles données de terrains et des levés de
géophysique aéroportée. Cette première étude mettra en évidence une phase de déformation
précoce, n’affectant que le groupe de Sefwi, et caractérisée par des plis isoclinaux d’échelle
kilométrique au sud-est de la ceinture d’Ashanti, formés sous l’effet d’un raccourcissement N-S.
Nous réinterprèterons également les âges U/Pb de Pigois et al. (2003) pour préciser l’âge des
sédiments Tarkwaiens et discuter leur contexte tectonique.
Dans un second temps, nous nous intéresserons plus particulièrement à la mine de Wassa,
située en terrains Birimiens et dont les minéralisations seraient très précoces par rapport aux
déformations principales, selon les géologues de la compagnie minière Golden Star exploitant le
site (Bourassa, 2003). Ce travail fournira une première carte et analyse structurale du secteur de
Wassa et montrera que l’or contenu dans ce gisement a effectivement une origine plus ancienne
que tous les autres gisements connus en terrains Birimiens. Cette étude démontrera donc
l’existence de gisements d’or formés avant les métasédiments du bassin de Tarkwa, possibles
sources de l’or des gisements alluviaux.
Dans une troisième partie, nous interprèterons les résultats d’analyses géochimiques des
granitoïdes, dans le but de mieux cerner les processus magmatiques ayant cours durant les phases
Éoéburnéenne et Éburnéenne. Ces analyses seront complétées par des datations U/Pb sur zircon

32
et permettront de discriminer deux tendances de compositions, en fonction de l’âge des
granitoïdes. Ainsi, il sera proposé que les intrusions Éoéburnéennes proviennent de la fusion
partielle du manteau en contexte de subduction. Les granitoïdes Éburnéens pourraient, eux,
trouver leur source à la base d’une croûte préalablement épaissie.
Finalement, nous terminerons cette étude par une cartographie 3D de la région basée sur
les interprétations précédentes et sur les données géophysiques. Les modèles ainsi établis, puis
inversés, donneront un meilleur aperçu des volumes occupés par chaque unité stratigraphique
ainsi qu’une estimation des imprécisions entre notre vision de la géologie de la ceinture
d’Ashanti, les limites de la modélisation et les contraintes géophysiques. La modélisation 3D
permettra également une cartographie du socle Birimien sous le bassin de Tarkwa et la mise en
évidence de possibles corrélations entre des unités métavolcaniques du groupe de Sefwi et les
emplacements des minéralisations en or au sud-est de la ceinture d’Ashanti.

33
Chapitre I

34

35
Chapitre I
Revised Eburnean geodynamic evolution of the gold-rich southern Ashanti Belt, Ghana,
with new field and geophysical evidence of pre-Tarkwaian deformations
Abstract
Integration of regional geophysical datasets and detailed field observations provides new
insights into the Paleoproterozoic structural evolution of southwestern Ghana. The study area is
dominated by three metavolcanic and metasedimentary packages known as the Sefwi Group, the
Kumasi Group (Birimian) and the Tarkwa Group (Tarkwaian) that were intruded by abundant
TTG granitoids during the Eoeburnean and Eburnean phases of an event termed the “Eburnean
Orogeny”. This study identifies an Eoeburnean (pre-Tarkwaian) deformation event (D1) that
produced significant deformation in the Sefwi Group metavolcanics. D1 is associated with N-S
shortening manifested as regional scale folding in the southern Ashanti Belt. D1 synorogenic
granitoids were intruded between 2187 Ma and 2158 Ma under greenschist metamorphic
condition. Syn-D1 gold mineralisation associated with quartz veining could be the original
source of Tarkwaian paleo-placers and/or remobilised gold concentrations along major shear
zones.
D2 represents an extensional phase associated with the Kumasi Group sedimentation
(2154 – 2125 Ma) which could be related to activation of major structures such as the Ashanti
Fault as low angle detachments that controlled the deposition of the Kumasi Group and the
opening of the Kumasi and Akyem Basin. The Tarkwa Group (2107 – 2097 Ma) unconformably
overlies the Birimian Supergroups and was deposited in response to D3 shortening. D3 resulted
in the inversion of syn-D2 detachments faults within the Ashanti Belt. NW-SE D3 shortening
produced regional scale folding within the Birimian and the Tarkwaian metasediments. D4
deformation corresponds with sinistral reactivation of D3 thrust faults, and is locally associated
with macro-scale folding at Obuasi and Wassa gold mines. By the end of D4, the regional scale
architecture was built and was only slightly modified by the two last events. D5 postdates the
Eburnean metamorphic peak and corresponds to open recumbent folds associated with a
subhorizontal crenulation cleavage. D6 is present as a subvertical crenulation cleavage and
reverse faults associated with NE-SW shortening.

36
2.1 Introduction
The Ashanti greenstone belt in the Western Region of Ghana hosts numerous
hydrothermal gold deposits (e.g. Obuasi, 60 Moz) and older placer deposits (e.g. Tarkwa,
41 Moz) that were created and deformed during the Eburnean Orogeny (Bonhomme, 1962). The
presence of massive gold placers that predate all known hydrothermal deposits, suggests an early
phase of gold mineralisation and synchronous deformation in the Ashanti Belt. Characterising
this early event is essential for understanding the tectonic evolution and geological context for
gold mineralisation in the southwest Ghana. This region is composed primarily of
paleoproterozoic metavolcanic and metasedimentary rocks that are divided into the Birimian
Supergroup (Sefwi and Kumasi Groups) and the Tarkwa Group, that are both intruded by
abundant granitoids (Fig. I-1).
Allibone et al. (2002a) separated the Paleoproterozoic Eburnean Orogeny into two
distinct phases known as Eburnean I and II. Their Eburnean I event predates the deposition of
Tarkwaian sediments and is associated with a major period of magmatism and metamorphism in
the Sefwi Group basement. Their Eburnean II event is associated with significant post-
Tarkwaian deformation that affected both the Birimian Supergroup and overlying Tarkwaian
sediments. This second phase of the Eburnean Orogeny is relatively well known in the study area
and is described at the mine scale (Blenkinsop et al., 1994, in Obuasi; Allibone et al., 2002a, in
Obuasi and, 2002b, in Bogoso; Kutu, 2003, in Konongo; Tunks et al., 2004, in Damang) and at a
regional scale (Eisenlohr, 1992; Milési et al., 1992; Ledru et al., 1994; Barritt and Kuma, 1998;
Feybesse et al., 2006).
Eburnean I events have been described along the West African Craton and called
Eoeburnean in northern Ghana (De Kock et al., 2011) or Tangaean in Burkina Faso
(Tshibubudze et al., 2009; Hein, 2010), but are relatively poorly resolved in southwestern
Ghana. This study presents an integrated interpretation based on new field data, geophysical
surveys and previous structural studies and maps (Loh et al., 1999, Agyei Duodu et al., 2009)
that provides a new structural context to the Eoeburnean phase and clarifies the subsequent
tectonic evolution of the Ashanti greenstone belt.

37
2.2 Geological setting
The southern part of the West African Craton, known as the Leo-Man craton, is
composed of an Archean nucleus that is tectonically juxtaposed against Paleoproterozoic
granitoid-greenstone assemblages to the north and east (Fig. I-1). In southwest Ghana, four NE-
SW greenstone belts occur, known as the Bui, Sefwi, Ashanti and Kibi-Winneba belts from west
to east, respectively. These belts are separated by three sedimentary basins namely the Sunyani,
the Kumasi and the Akyem Basins (or Cape Coast Basin, Agyei Duodu et al., 2009). These
greenstone belts and dividing sedimentary basins were formed and deformed during the
Eburnean Orogeny (Bonhomme, 1962).
Figure I-1 (A) The West African Craton (modified after Milési et al., 2004, BRGM
SIGAfrique) is composed of an Archean nucleus in the southwest bounded by series
of paleoproterozoic greenstone belts and voluminous granitoids in the northwest to
the east. (B) Simplified geology map of the Ashanti Belt (modified after Agyei Duodu
et al., 2009) showing the locations of Figures I-6, I-14 and I-16 (AA’ and BB’).

38
Table I-1 Comparison between the tectonic evolution presented in this work with other recent studies in southwestern Ghana.

39
Figure I-2 Compilation of histograms presenting radiometric age data and the number of zircons / samples for the three main stratigraphic
sequences and on granitoids in the study area (after Taylor et al., 1992; Hirdes et al. 1992; Davis et al., 1994; Oberthür et al., 1998, Loh
et al., 1999; Pigois et al., 2003; Attoh et al., 2006; Feybesse et al., 2006; Adadey et al., 2009; Agyei Duodu et al., 2009). The age
distribution in granitoids shows two distinct peaks that correspond to the Eoeburnean and Eburnean phases. Dots represent dated samples
for igneous rocks or detrital zircons ages for sedimentary rocks and their associated error bars.

40
2.2.1 Eburnean Orogeny
Feybesse et al. (2006) proposed an early Eburnean phase between 2135 Ma and 2100 Ma
corresponding to magmatic accretion and plutonism that terminated with development of the
Kumasi Basin. The synchronous Eburnean Orogeny (2130-1980 Ma) corresponds to thrust
tectonism dominated by sinistral transcurrent deformation in the Ashanti Belt. Allibone et al.
(2002a) suggests an alternative two phase Eburnean evolution, divided into the Eburnean I
(2200-2150 Ma) and Eburnean II (2116-2088 Ma), that are separated by deposition of the
Birimian and Tarkwaian units. In northern Ghana De Kock et al. (2011) called these two phases
Eoeburnean and Eburnean, respectively. This nomenclature is referred to in the text, based on the
correlation with published zircon geochronology (Fig. I-2A).
Allibone et al. (2002a) suggest that the Eburnean I (Eoeburnean) event was associated
with a period of magmatism and metamorphism responsible for the Sefwi Group metavolcanics
and TTG granitoid emplacement (Table I-1) that correlates with the pre-Eburnean of Feybesse et
al. (2006).
The second phase of the Eburnean Orogeny affects both the Tarkwa Group and the
Birimian Supergroup. The Eburnean II (Eburnean) event is associated with major NW-SE
shortening (D2 of Allibone et al., 2002(a), 2002(b); D1 of Tunks et al., 2004) that developed
major thrust faults - including the Ashanti Fault - along with isoclinal folds in Birimian
metasediments and regional scale open folds in the Tarkwaian sediments. These features are
overprinted by thrusts that were reactivated during a phase of sinistral transpression that utilised
the existing thrust architecture (D2 of Tunks et al., 2004; D3 of Milési et al., 1992; D3 of
Feybesse et al., 2006). At the Obuasi mine, 100 m scale folds described by Allibone et al.
(2002a) may have developed during (his D4-D5) shearing. This phase of the Eburnean Orogeny
is associated with most of the hydrothermal gold deposits in the region. Late Eburnean
deformation has been observed in the Damang mine, where it is characterised by very open
folding and minor brittle faulting (Tunks et al. 2004). The D3 of Tunks et al. (2004) corresponds
to ESE-WNW shortening associated with folds, quartz veins and a shallow dipping crenulation
cleavage that overprints D2 reactivated thrust faults. In Damang, Tunks et al. (2004) observed a
conjugate system of faults that strike NW-SE and cross-cut all previous structures. These
features may correlate with more regionally extensive NW-SE faults recognised in existing maps
of southwestern Ghana.
The relationship and timing between Eburnean deformation and Tarkwaian deposition are
contentious and not fully understood. Allibone et al. (2002a) suggested Tarkwaian sedimentation

41
occurred before major Eburnean deformation and mineralisation. Leube et al. (1990) played
down the significance of post-Tarkwaian deformation suggesting “tension-related folding by
gravity” (Stage V of Leube et al., 1990, page 157) was responsible for Tarkwaian structures,
requiring earlier events to have controlled the regional structural architecture and the distribution
of gold mineralisation. Other workers propose an intermediate position with Feybesse et al.
(2006) suggesting Tarkwaian sedimentation developed in response to Eburnean shortening
following a phase of tectonic accretion and magmatism. Further, Ledru et al. (1994) considered
the Tarkwa Basin to have initiated as a foreland basin during the final stages of the Eburnean
Orogeny.
2.2.2 Birimian series
The Birimian series was first described by Kitson (1918) in the Birim River (around
80 km east of the Ashanti Belt). Since this early interpretation, the Birimian stratigraphic column
has been revised significantly, including more than one complete reversal. Before the application
of absolute geochronology, workers described an Upper Birimian composed by metavolcanics
on top of a Lower Birimian corresponding to metasediments (Kitson, 1928; Whitelaw, 1929;
Junner, 1935, 1940; Hastings, 1982; Ntiamoah-Agyakwa, 1979; Kesse, 1985; Milési et al.,
1992). Leube et al. (1990) and Eisenlohr (1992) suggested that Birimian metavolcanics and
metasediments were synchronous. Sm/Nd analyses conducted by Taylor et al. (1992) required a
reversal of the stratigraphy with the younger metasediments overlying the older metavolcanics.
This relationship was confirmed by Loh et al. (1999) with U/Pb zircon ages varying between
2162 ± 6 Ma and 2266 ± 2 Ma for the metavolcanics. Detrital zircons in the metasediments
indicate the initiation of their deposition around 2154 ± 2 Ma in the Obuasi mine (Oberthür et al.,
1998). Similar ages have been found in the Kumasi Basin (northwest of the Ashanti Belt) by
Davis et al. (1994). Adadey et al. (2009) proposed a new stratigraphy of the Birimian
Supergroup with the Sefwi Group (2195-2170 Ma) composed of micaschists and metavolcanics
and the Kumasi Group, deposited after 2150 Ma, with metasediments and intercalated andesitic
beds dated at 2142 ± 24 Ma (U/Pb on zircon). The Kumasi Group was intruded by the late
sedimentary Suhuma granodiorite at 2136 ± 19 Ma (U/Pb on zircon, Adadey et al., 2009).

42
Table I-2 Division of Tarkwaian sedimentary sequences and estimated thicknesses.
2.2.3 Tarkwaian series
The Tarkwa Group (Kitson, 1928) is a succession of four sedimentary units (Whitelaw,
1929; Junner, 1940; Kesse, 1985, Pigois et al., 2003) (Table I-2). The Kawere Group, at the base
of the Tarkwaian sediments is composed of conglomerates and sandstones. Its thickness varies
between 250 m and 700 m and is stratigraphically overlain by the Banket Formation made up of
conglomerates with interbedded local cross-bedded sandstones layers. The conglomerates are
principally composed of Birimian quartz pebbles (> 90%) and volcanic clasts (Hirdes and
Nunoo, 1994) that host the Tarkwa Placer deposit. Gold within the conglomerate forms a zone
that is less than 100 m thick, while the maximum thickness of the Banket sequence is estimated
to be 600 m. Approximately 400 m of Tarkwa Phyllites overly the Banket sequence. The
uppermost unit of the Tarkwa Group is the Huni Sandstone, comprised of alternating beds of
quartzite and phyllite intruded by minor dolerite sills that form a package up to 1300 m thick
(Pigois et al., 2003).
U/Pb and Pb/Pb dating of a few detrital zircons provide a maximum depositional age of
2132 ± 2.8 Ma for the Kawere formation and 2132.6 ± 3.4 Ma for the Banket formation (Davis et
al., 1994, Hirdes and Nunoo, 1994). These ages agree with the study by Pigois et al. (2003), that
yielded maximum depositional age of 2133 ± 4 Ma from 71 concordant zircons from the Banket
Formation. However 39 of their zircons are younger and contradict this value. According to all

43
concordant zircons histogram (161 grains) and their uncertainties (Fig. I-2D), a reasonable
estimation for the start of the Tarkwaian sedimentation could be as young as 2107 Ma although
two zircons may be younger at 2090 ± 17 Ma and at 2095 ± 17 Ma (Pigois et al., 2003).
Tarkwaian deposition is also constrained by intrusions of metagabbro sills within the Tarkwaian
series at 2102 ± 13 Ma (Adadey et al., 2009) and by granitoids at 2097 ± 2 Ma (Oberthür et al.,
1998).
2.2.4 Granitoids
Abundant granites and granitoids intruded the Birimian and Tarkwaian units during the
Paleoproterozoic. Eburnean plutonism in southwest Ghana can be divided into two phases
between 2180-2150 Ma (Eoeburnean) and 2130-2070 Ma (Eburnean) that is supported by the
current database of U/Pb and Pb/Pb zircon ages (Fig. I-2A). Most of the granitoids intruded
during both phases correspond to typical tonalite-trondhjemite-granodiorite (TTG) suites.
However, in the southern part of the Ashanti Belt, intrusions within the Mpohor complex have
granodioritic, dioritic and gabbroic compositions. Along with this compositional heterogeneity,
granitic rocks in the southern Ashanti Belt also appear to have been emplaced under different
tectonic regimes. The Sekondi granodiorite on the eastern margin of the southern Ashanti Belt
exhibits a magmatic foliation (Loh et al., 1999), suggesting syntectonic emplacement at around
2174 ± 2 Ma (U/Pb on zircon, Oberthür et al., 1998). In contrast, tonalites at Dixcove and
Prince’s Town are unfoliated and were dated at 2171 ± 2 Ma (Hirdes et al., 1992) and 2159 ± 2
Ma (Attoh et al., 2006).
Granitoids from the Eburnean phase sometimes show a magmatic mineral alignment
(biotite and/or feldspar) but are generally unfoliated. Late Eburnean granitoids are often
K-feldspar rich and are mainly found in the Akyem, Kumasi and southern Sunyani basins where
they cross-cut all major regional structures.
Similar ages and characteristics have been observed in granitoid intrusions in the small
fragment of the Ghanaian craton in northern Brazil (the Sao Luis Craton, Klein et al., 2005,
2008). This fragment covers a small area mostly composed by granitoids. As a consequence,
correlation between the Ghanain and the Sao Luis cratons can only be performed via granitoid
ages and geochemistry analyses.
2.2.5 Dolerite dykes
Dolerite dykes are abundant across the West African craton where they cross-cut Archean
and Paleoproterozoic basement. In southwestern Ghana these dykes are well defined in magnetic

44
data where they are characterised by strong magnetic susceptibility and remanence. The recently
compiled regional 1M map of Ghana (Agyei Duodu et al., 2009) shows two families of dykes
that are oriented N-S and ENE-WSW that are generally less than 100 m in thickness. In the
northern Ashanti Belt these dykes are overlain by the Volta basin. Dolerite dykes are observed to
cross-cut undeformed K-feldspar rich granites that formed during the late Eburnean, and are
overlain by Volta basin sediments with a maximum depositional age of 950 Ma (Kalsbeek et al.,
2008). These relationships constrain dyke emplacement to between 2000 Ma and 950 Ma. In
contrast some older dolerite / gabbro dykes and sills were deformed during the Eburnean
Orogeny and are dated at 2102 ± 13 Ma (U/Pb on zircon, Adadey et al., 2009).
2.2.6 Phanerozoic series
The youngest lithologies in the study area correspond to Phanerozoic sandstones and
shales. These can be found along the coast, mainly between Cape Coast and Takoradi but also to
the west of Axim. Loh et al. (1999) distinguished two groups with ages ranging from Devonian
to Carboniferous (Crow, 1952, Mensah, 1973; Chaloner et al., 1974; Baer and Riegel, 1980) and
Cretaceous (Tevendale, 1950).
2.2.7 Metamorphism
With the exception of some late Eburnean granitoids, dolerite dykes and Phanerozoic
sediments, all other lithologies have undergone metamorphism that generally does not exceed
upper greenschist facies. Studies on amphibole/plagioclase assemblages suggest the peak
temperature and pressure was 500-650°C and 5-6 kbar (John et al. 1999), dated at 2092 ± 3 Ma
(Oberthür et al.,1998). These results are similar to those obtained by Schmidt Mumm et al.
(1997) who estimated peak metamorphic conditions along the Ashanti Fault system to 520°C
and 5.4 kbar. These conditions are in agreement with the occurrence of garnet in the Nsuta
manganese deposit (Nyame et al. 1998; Kleinschrot et al. 1993, 1994) and garnet-staurolite
assemblages at the Damang gold mine (Pigois et al., 2003), although these manganese-rich
garnet assemblages can be stable to lower pressure and temperature conditions (Mahar et al.,
2004). Occurrences of kyanite and sillimanite assemblages have also been reported from the
Bonsa diamond field (Kesse, 1985).

45
Table I-3 Synthesis of structural and fluid inclusion studies for major gold deposits of southwestern Ghana. P-T data correspond to the
homogenization temperature and pressure of aqueous-carbonic inclusions in quartz veins and pebbles.

46
2.2.8 Mineralisation
The Ashanti Belt of southwest Ghana hosts a gold district that contains a significant
number of world class hydrothermal gold deposits and the giant Obuasi deposit that hosts over
60 million ounces of gold. These deposits are spatially associated with the Ashanti Fault and
other major shear zones in the Birimian Supergroup or along the contact between the Birimian
and Tarkwaian units. The overlying Tarkwa Basin is also host to the Tarkwa paleoplacer that
contains over 40 million ounces of gold.
2.2.8.1 Birimian deposits
Deposits found along the Ashanti Fault are associated with arsenopyrite and lesser other
sulphides. According to Oberthür et al. (1994, 1997) and Allibone et al. (2002a) the main
mineralisation in the Obuasi mine is associated with ductile shearing along the Ashanti Fault.
They also described secondary gold mineralisation that developed within quartz veins and
carbonate-alteration in basalts. In the Bogoso and Prestea deposits, Mumin et al. (1994) showed
that gold mineralisation resulted from the remobilisation of pre-existing gold along the Ashanti
Fault. The source of initial gold mineralisation has not been clearly identified.
Birimian mineralisations are often hosted within shear zones that transect sediments,
mafics or granitoids (Table I-3, after Bowell et al., 1990; Schwartz et al., 1992; Klemd et al.,
1993; Mumin and Fleet, 1995, Mumin et al., 1996; Schmidt Mumm et al., 1997; Yao and Robb,
2000; Yao et al., 2001; Allibone et al., 2002a, 2002b; Griffis et al., 2002; Pigois et al., 2003;
Tunks et al., 2004; Wille and Klemd, 2004). Fluid inclusions studies propose low temperature
(≈ 250°C) and pressure (≈ 2 kbar) homogenisation conditions for fluid trapped in mineralised
Birimian quartz veins and pebbles (Schmidt Mumm et al., 1997).
Few radiometric ages have been acquired from the Birimian deposits. Near Ayanfuri,
mineralisation is associated with granitoids dated at 2105 ± 3 Ma for the intrusion (U/Pb on
zircon, Oberthür et al. 1998) and 2084 ± 2 Ma (Pb/Pb) for rutile/galena crystallisation from
hydrothermal fluids (Oberthür et al., 1998).
2.2.8.2 Tarkwaian deposits
Two styles of gold mineralisation are present in the Tarkwa Group. Hydrothermal
deposits occur along the contact between the Birimian and Tarkwaian units (e.g. Damang Mine),
and paleoplacers occur within the Tarkwa Basin (e.g. Tarkwa Mine). In Damang, gold
mineralisation was found to be associated with pyrite in brittle fractures and tensional quartz

47
veins that are correlated with the last deformation phase of the Eburnean Orogeny (Tunks et al.
2004). The late timing of mineralised structures was supported by a xenotime age of 2063 ± 9
Ma (U/Pb, Pigois et al., 2003). Fluid inclusions within quartz veins associated with
mineralisation formed at low temperature (153-278°C) and pressure (1-2.2 kbar) homogenisation
conditions in the Abosso-Damang deposits (Schmidt Mumm et al. 1997).
Tarkwaian sediments also host paleoplacers such as the Tarkwa deposit. Gold grade
distribution within the deposit is parallel to bedding, supporting a sedimentary origin (Sestini
1973). Gold is generally found within paleochannels, along conglomerates and proximal to
hematite rich areas within the Banket formation (Table I-2). Fluid inclusions studies of
mineralised quartz pebbles suggest formation under greenschist facies conditions (250-400°C
and 0.5-3 kbar, Klemd et al., 1993). These values are similar to those obtained for Kumasi Group
quartz veins fluid inclusions along the Ashanti Belt, and may explain why the source of the
Tarkwa placer has been initially described as a Birimian type hydrothermal deposit (Klemd et
al., 1993, Hünken et al., 1994).
2.3 Data used for mapping
2.3.1 Field data
In order to ground truth and constrain the geophysical interpretation, petrophysical,
structural and lithological data were collected across the southern Ashanti Belt. These data were
then combined with pre-existing observations and outcrop maps from Loh et al. (1999) and
company data from explorers within Ghana (BHP and Golden Star).
Despite collecting data from most of the accessible outcrops in the study area, the
presence of a thick lateritic blanket restricts the use of traditional mapping and only allowed for
the sparse collection of geological data. In general, the weathered cover sequence presents as 6-
15 m of laterite underlain by 40 m of saprolite.
In order to complement the previous regional mapping, geophysical data were used to
extrapolate the structures between the isolated outcrop observations and petrophysical data were
used to constrain the geophysical modelling.

48
Figure I-3 The reduced to pole image of the total magnetic intensity draped over the shaded
first vertical derivative. The reduced to the pole data was the basis for all subsequent
processing and is shown with some of the main significant regional faults. Pixel size
is 100m. The colour look up table is histogram equalised.

49
Figure I-4 Image of the gamma-ray data draped over a shaded digital elevation model. This
image shows the relative proportion of potassium, thorium and uranium as an RGB
image, and their correlation with the topography. Pixel size is 100 m. U and Th rich
areas with high topography correspond to Sefwi Group metavolcanics as around
Cape Three Points and proximal to the Ashanti Fault. K-rich granitoids are well
defined in the eastern part of the area.

50
Figure I-5 Bouguer gravity map over the study area overlain with the regional fault
architecture. As a consequence of the low resolution of the grid (5 km per pixels),
only long wavelength features are observed, these features are interpreted to be
sourced from the major, deep-seated structures.

51
Figure I-6 ALOS PALSAR radar image consisting of three colour bands: red = HH radar
polarization, blue = HV, and green for the mean of both bands. Sefwi Group bedding
highlighted by volcanoclastic layers in this image is folded by E-W trending F1 folds
that are refolded by N-S trending F3 folds. See Figure I-1 for location.

52
2.3.2 Processing and interpretation of geophysical data
Magnetic and radiometric data were acquired between 1994 and 1996 by the Geological Survey
of Ghana. The flight altitude of the survey is 80 m above ground, along lines striking 135° and
separated by 200 m. The total magnetic intensity (TMI) was gridded with a resolution of 100 m.
2.3.2.1 Aeromagnetic data: The data were reduced to the pole (D = -6.5°, I = -14.5°) (RTP,
Fig. I-3) in order to bring anomalies directly over their causative sources. The reduction to the
pole was applied without amplitude correction (minor N-S artefacts appears) or with amplitude
correction (no artefacts and similar resulting image but different magnetic intensity values). The
RTP with amplitude correction was used preferentially for visual interpretation of structures as
the absolute values of anomalies are less important than their geometry. Both the RTP and the
analytic signal grids (which produce similar images as the RTP, MacLeod et al., 1993) were then
filtered to produce further interpretable images that highlighted specific elements of the geology.
The first and second vertical derivative and amplitude normalisation (Automatic Gain Control,
AGC) and the tilt derivative (Verduzco et al., 2004; Lahti and Karinen, 2010) were also used to
highlight structural information (Gunn et al., 1997; Milligan and Gunn, 1997), and upward
continuation was applied to highlight the ‘deeper’ magnetic anomalies.
2.3.2.2 Radiometric (gamma-ray) data: U, Th and K bands have been gridded separately at 100
m resolution. These bands were then combined in a ternary RGB image and draped over a digital
elevation model (90 m resolution; Shuttle Radar Topographic Mission, 2000) (Fig. I-4). The
combination of radiometric data and the digital elevation model helped delineate lithological
domains and structures (Dickson and Scott, 1997).
Due to the relatively subdued topography in the study area (between sea level and 460
m), the variation in elevation corresponds to differential erosion of resistant lithologies. For
example, topographic relief along the Ashanti and Akropong faults and near Cape Three Points
corresponds to rich Th and U areas. Similar mapping in Burkina Faso (Metelka et al., 2011)
shows that these Th and U rich areas correlate with regolith cover. In contrast in SW Ghana
these areas correspond to mafic rocks with strong magnetic signatures that are imaged in the
aeromagnetic data and confirmed on the field. Using the methodology of Metelka et al. (2011),
we help to identify some lithological units and structures by comparison between magnetic,
radiometric and topography data (Table I-4).
2.3.2.3 Gravity data have been sourced from the International Gravimetric Bureau
(http://bgi.omp.obs-mip.fr/) as Free Air and Bouguer anomalies grids. Fig. I-5 shows the

53
Bouguer anomaly map calculated using density values of 2.67 g/cm3 for the Bouguer correction
that were gridded at 5 km. These gravity data can only be used to broadly differentiate regional
rock packages and image the continuity of the major structures at depth.
2.3.2.4 ALOS PALSAR data (Advanced Land Observing Satellite; Phased Array type L-band
Synthetic Aperture Radar) high-resolution data collected in 2009 were used to image structure
within lithological packages. Two polarisation channels (HH and HV) (available from-
http://www.eorc.jaxa.jp/ALOS/en/) were gridded with a resolution of 50 m. A ternary RGB
image was then produced (Fig. I-6), where red, green, blue colours correspond respectively to
the HH, HV and (HH+HV/2) polarisations. These radar data are able to image structural details
within sedimentary units such as bedding, with better resolution than the combined radiometric
and digital elevation model.
2.3.3 Petrophysics
Petrophysical data were collected during regional reconnaissance, resulting in a database
of over 300 susceptibility measurements of the major lithologies encountered in the Ashanti
region. The data provided quantitative information on the magnetic susceptibility of the Birimian
and Tarkwaian units and intrusives that were used to constrain the regional magnetic
interpretation and subsequent geophysical modelling. These susceptibility data are consistent
with common susceptibility range proposed by Clark (1997) and with values measured by
Metelka et al. (2011) in Burkina Faso.
The histograms in Fig. I-7 show the range of measured magnetic susceptibilities for the
lithologies seen in the study area using a Geofyzika KT-5 Kappameter hand held susceptibility
meter. To ensure high quality measurements, some representative samples were re-measured
using a Kappabridge KLY-3 magnetic susceptibility meter and no statistically significant
differences were found. Natural remanent magnetisation (NRM) of the dolerite dykes was
measured using AGICO JR5A spinner magnetometer, mounted within Helmholtz coil systems.
Paleomagnetic laboratory experiments were carried out at the GET Magnetism Laboratory
(Toulouse).
Density data were acquired for 26 samples taken from all of the outcropping regional
units. Calculated values derived from sample weighing in air and water (Table I-5) agree with
measurements made by Hasting (1978, unpublished report referenced in Barritt and Kuma, 1998)
and with equivalent samples from Burkina Faso (Baratoux et al., 2011).

54
Table I-4A

55
Table I-4B Summary table of the lithologies, associated petrophysics properties and
geophysical signatures (modified after Metelka et al., 2011). The magnetic image is
composed of the RTP draped over the shaded first vertical derivative. The
radiometric image is draped over the shaded digital elevation model. Whole rock
geochemical analyses were conducted by A.L.S. Mineral Laboratory, Sevilla, Spain.
ank. ankerite, bt. biotite, cal. calcite, chl. chlorite, cpx. clinopyroxène, dol. dolomite,
ep. epidote, gph. graphite, gt. garnet, hbl. hornblende, mgt. magnetite, ms.
muscovite, ol. olivine, opx. orthopyroxene, pl. plagioclase, qz. quartz, ser. sericite, st.
staurolite.

56
Figure I-7 Histograms showing the range of measured susceptibility for each rock type found
in the area. Several samples were remeasured under laboratory condition to confirm
the field based data. The susceptibility of sediments is commonly ten times lower
than volcanic rocks. Granitoid susceptibilities are variable with the highest values
obtained from dioritic composition. Late doleritic dykes display high magnetic
susceptibility values.
Table I-5 Ranges of density values measured on 26 samples of the main lithologies in
Ghana (this study) and in Burkina Faso (Baratoux et al., 2011).

57
Figure I-8 New stratigraphy for the southwest of Ghana based on new data from this study
(mapping) and previous studies (Whitelaw, 1929; Junner, 1940; Kesse, 1985; Pigois
et al., 2003; Adadey et al., 2009). Unit thicknesses are estimated from the map
(Figure I-13). For clarity stratigraphic layers are labelled by their dominant
lithology but could be subdivided into several sub-units.

58
Figure I-9 Photographs showing syn-sedimentary normal faults within Sefwi Group
volcanoclastic sediments. Some of these faults do not affect the youngest layers.
Others faults show post-depositional reverse movement that could reflect the start of
D1. The compass indicates both the north (in red) and the perspective.

59
2.4 Results
2.4.1 Birimian stratigraphy
Based on the lithologies encountered in the field, the stratigraphy of the Birimian
Supergroup has been redefined in agreement with Adadey et al. (2009) nomenclature. Although
individual units could be further subdivided into many thin individual layers, for clarity we have
grouped these into the relatively schematic stratigraphy presented in Fig. I-8.
The Sefwi Group is composed of alternating micaschists, metavolcanics and intrusive
rocks (Fig. I-8). Micaschists are mainly composed of quartz-muscovite-biotite, rare garnet that
dominate the southeast of the Ashanti Belt (Fig. I-1). Metavolcanics consist of basalts
(sometimes pillow-lavas, as near Butre village, east of Cape Three Point, Fig. I-1), andesites,
gabbros and diorites that are found in the south of the Ashanti Belt proximal to major faults or
shear zones. These metavolcanics are locally altered by quartz-sericite-carbonate hydrothermal
alteration.
The Kumasi Group contains metasediments, volcanoclastics and phyllites that are locally
rich in graphite. This group is found in two major areas corresponding to the Kumasi Basin and
to the Akyem Basin (Fig. I-1).
2.4.2 Structural evolution of the Ashanti Belt
We have been able to distinguish six discrete deformation events which affected the
Ashanti Belt during the Paleoproterozoic Eburnean Orogeny. These six events are defined on the
basis of detailed structural analysis at the outcrop scale, and geophysical interpretation at the
regional scale. These methods allow the correlation of structure across the study area, and can
image overprinting relationships between successive deformation events.
The Sefwi Group represents a “basement” composed by a series of basalts and
volcanoclastic sediments intruded by gabbros. To the west of the Benso gold mine, a
volcanoclastic unit in the Sefwi Group displays syn-sedimentary normal faulting (Fig. I-9). Two
thrust faults observed at this locality (Fig. I-9) may reflect reactivation of these syn-sedimentary
normal faults during the early Eoeburnean phase.

60
Figure I-10A Stereo-plot diagrams representing measurement distribution on equal area
diagram (lower hemisphere), with density contours, for the three main rocks groups.
Distribution of the Kumasi Group and Tarkwaian sediments bedding poles are in
good agreement with the F3 folding (and S3 cleavage orientations). In contrast the
Sefwi Group bedding poles plots shows a wider dispersion resulting from the
interference of multiple fold generations (mostly F1 and F3). Stereo-plots of poles to
S1 confirm the presence of the earlier event (D1) affecting only the Sefwi Group.

61
Figure I-10B Stereo-plot diagrams representing measurement distribution on equal area
diagram (lower hemisphere), with density contours, for the three main rocks groups.
D4 data are predominantly from the Wassa mine (Sefwi Group), although the S4
cleavage is also observed in the Kumasi Group and in the Tarkwa Group along the
Ashanti Fault. S5 is sub-horizontal and consistent across each group. S6
corresponds to subvertical crenulation cleavage striking NW-SE.

62
2.4.2.1 D1 (Eoeburnean)
Our D1 corresponds to N-S shortening that produced kilometric scale folds within the
Sefwi Group. Near Shama village in the SE of the Ashanti Belt, rare field evidence of D1
deformation exists as highly deformed micaschists that alternate with basaltic layers. The
relatively competent basalts are strongly boudinaged and define a bedding parallel S1 foliation.
In other regions, S1 is oriented approximately E-W (Fig. I-10A) and is defined by the alignment
of biotite (Fig. I-11A). Large-scale F1 folds are imaged using high-resolution radar revealing
major F1 folds within volcanoclastic units (S0) of the Sefwi Group that are refolded by F3 folds
(Fig. I-6).
Two discrete generations of quartz veins and pegmatite intrusions are distinguished.
Early veins and intrusions are sub-parallel to bedding and often strongly boudinaged. According
to their extension direction (subvertical at the time of formation for veins parallel to bedding),
they should have formed pre or syn-D1. Second generation veins and pegmatites cross-cut this
composite S0-S1 fabric and were developed during D1. Both generations are refolded during
subsequent D3 shortening.
D1 deforms only the Sefwi Group basement, and is not observed in the overlying Kumasi
and Tarkwa groups. This relationship suggests that these younger sedimentary packages were
deposited after D1 and before subsequent deformation events (D3-D6).
2.4.2.2 D2
D2 corresponds to an extensional phase associated with the opening of the Kumasi and
Akyem basins into which the Kumasi Group was deposited (Fig. I-1). On the western side of the
Ashanti Belt at the Prestea and Bogoso mines, the west-dipping Ashanti Fault marks the contact
between Sefwi Group basement and Kumasi Group sediments. The early history of this fault
contact is obscured by significant thrust and shear reactivation during D3 and D4.
On the eastern side of the belt, in Damang, the Sefwi/Tarkwa Group contact has been
faulted and sheared during later deformation. This sheared contact is represented by a 2 cm thick
anastomosed fabric that was probably created during D3/D4 shear reactivation of an original
sedimentary contact (erosion surface), or by reactivation of an existing faulted contact that was
controlling the development of the Tarkwa Basin in the eastern Ashanti Belt. As a consequence
of a strong overprinting of the original sedimentary contacts during Eburnean deformation, the
tectonic context of the Tarkwa Group deposition remains unclear.

63
Figure I-11 Interpreted photographs showing examples of D3 deformation. (A) In the Sefwi
Group, the S1 foliation defined by the alignment of biotite is partially transposed
along the S3 cleavage. (B) Series of F3 ptygmatic folds at the same location. These
F3 are folding a composite S0 / S1 foliation and some quartz veins. (C) On the
western side of the belt, F3 folds correspond to the first folding generation affecting
the Kumasi Group sediments. (D) Parasitic open folds in the hinge of the Damang
anticline in the Tarkwa Group. In all cases, S3 corresponds to a subvertical
crenulation cleavage resulting from a NW-SE shortening. The compass indicates
both the north (in red) and the perspective.

64
Figure I-12 Interpreted photographs showing the Ashanti Fault in Buesichem Pit (Bogoso
mine). The dark area in the middle corresponds to an approximately 20 m wide shear
zone. This major structure separates the Kumasi Group phyllites from the Sefwi
Group basalts. This shear zone operated as a thrust during D3 and was reactivated
with a sinistral shear movement during D4. In the footwall, carbonatization of the
basalts (light green band) is synchronous with gold mineralisation. The compass
indicates both the north (in red) and the perspectives view. Photographs of
lithologies are not oriented.

65
2.4.2.3 D3 (Eburnean)
D3 deformation is conspicuous within both the Birimian and Tarkwaian units in the study
area. NW-SE shortening produced km scale folds and a strong sub vertical crenulation cleavage
within the Birimian and Tarkwaian units (striking around N040; I-10A). Stereonets of bedding
from the Kumasi Group and Tarkwa Group define a single major folding event associated with
NW-SE shortening. However, the orientation of bedding within the Sefwi Group reflects the
interference between D1 and D3 folds (Fig. I-10A). The overprinting between F1 and F3 fold
occurs across the region at multiple scales. In the Sefwi Group near Shama village, a composite
S0-S1 foliation is crenulated and partially transposed along the S3 cleavage (Fig. I-11A).
Ptygmatic F3 folds are also found where they affect both the S0-S1 and syn-D1 quartz veins and
pegmatite intrusions (Fig. I-11B). Radar data images bedding in the Sefwi Group that is folded
by E-W trending F1 folds that are refolded by N-S trending F3 folds (Fig. I-6).
The Kumasi Group phyllites in the Prestea, Bogoso and Pampe gold mines host isoclinal
F3 folds from cm to m scale (Fig. I-11C) that deform the bedding and a bedding parallel
cleavage (S1). Quartz veins that are folded by F3 often show strongly boudinaged fold limbs.
In the Tarkwa Group, D3 is characterised by regional scale folds that deform relatively
resistant lithological layers (S0) that are imaged by the combined digital elevation model and
radiometric data (Fig. I-4). At the outcrop scale, abundant parasitic F3 folds are observed with
increases in frequency and amplitude toward major F3 closures such as the Damang mines
anticline (Fig. I-11D). Major F3 folds are often open and low amplitude with NE-SW fold axis
(Fig. I-10A). In this region, subvertical S3 cleavages strike NE-SW parallel to the main regional
Ashanti thrust fault.
2.4.2.4 D4
In the Bogoso gold mine on the western side of the Ashanti Belt, many small scale shear
zones cross-cut F3 folds. Most of these shear zones show sinistral displacements and are
interpreted to have formed in response to a later phase of deformation that we identify as D4.
Major splays of the Ashanti Fault were also likely reactivated during sinistral shearing associated
with D4. At Bogoso, one of these main Ashanti structures is mineralised within a 20 to 30 m
thick band of graphitic phyllites and quartz breccias that separate Kumasi Group phyllites from
the Sefwi Group basalts (Fig. I-12). At the regional scale, magnetic images show at least two
syn-D4 shear zone generations. The first one is oriented N030 and could correspond to the
reactivation of D3 thrusts faults, such as the Ashanti Fault. The second is oriented N050 and
cross-cuts earlier N030 shears, the F3 folds and the D3 thrusts within the Tarkwa Basin.

66
In the Wassa gold mine, within the Sefwi Group on the eastern border of the Tarkwaian
sediments, a km scale F4 fold and associated parasitic folds overprint D3 faults and folds. F4
folds have only been observed at Wassa, although a subvertical S4 crenulation cleavage was
found in many locations on both sides of the Tarkwa Basin. Intersection lineations between S3
and S4 cleavages and F4 folds axis give a plunge approximately 60° toward 260° (Fig. I-10B).
These characteristics correspond to a NNW-SSE shortening event that could be compatible with
a sinistral shear reactivation of existing D3 regional thrust faults.
2.4.2.5 D5
The regional architecture of the Ashanti region was largely built during D1-D4 but has
been modified by two subsequent deformation events that are observed to overprint D4
structures within the Sefwi, Kumasi and Tarkwa groups.
D5 is characterised by recumbent folds associated with a subhorizontal crenulation
cleavage (Fig. I-10B). These symmetrical open to tight folds have a wavelength varying between
5 m and 1 cm in the outcrops we studied. We note a great variability of amplitude between
outcrops, varying with the lithology and orientation of previous structures. F5 folds were mainly
observed in Wassa mine, in the NW of the belt (Pampe gold mine) and in the Tarkwaian
sediments around Bogoso mine. In Damang mine, many quartz veins were subhorizontal and
parallel to the S5 cleavage and formed either during or after D5.
2.4.2.6 D6
The final deformation event observed in the study area presents as a subvertical
crenulation cleavage (S6) that defines open folds that affects subhorizontal S5 crenulation
cleavage. S6 was observed in Tarkwaian sediments, in the Kumasi Group near the Akropong
fault and in the Wassa gold mine. S6 is subvertical and NW-SE trending (Fig. I-10B)
approximately parallel to a series of reverse faults oriented NW-SE identified from the magnetic
data. These faults cross-cut all Paleoproterozoic lithologies and earlier fault and cleavages. They
were observed in the field at the Mpohor and Damang gold mines. The absence of observed
overprinting of S6, and its relatively constant orientation, suggest that this D6 event was likely
the last significant deformation event to affect the area.

67
Figure I-13A

68
Figure I-13B New lithological (A) and structural (B) interpretation based on the integration of
new field observation, geophysical data and previous work. F1 folds built the
regional geometries of the Sefwi Group metavolcanics. F3 folds are dominant in the
Kumasi Group and Tarkwa Group sediments. D4 corresponds with a series of
sinistral shear zones outlining the edge of the Tarkwaian sequence and cross-cutting
it. S4 cleavage planes are oriented NE-SW and are observed around Bogoso/Prestea
and Wassa. D5 is a minor event and is not represented as it is a subhorizontal
cleavage. D6 is characterized by reverse faults oriented NW-SE.

69
2.4.3 Map
Field observations, combined with geophysical and radar data have allowed the
construction of a new structural and geological model of the region (Fig. I-13). This model
describes the complex series of deformation events that affected the Sefwi Group basement and
overlying Kumasi and Tarkwa groups during the Eburnean Orogeny.
2.4.4 Sefwi Group D1 structures under the Tarkwa Basin
During the regional geophysical interpretation several significant differences between
features observed in the digital elevation model, radiometric and radar data (which reflect near
surface lithologies and structures, Dickson and Scott, 1997) compared to the aeromagnetic data
over the Tarkwa Basin were observed. Orientation of regional magnetic trends are inconsistent
with observations made in the field (Tarkwaian bedding, S3 cleavage) and features imaged in the
radiometric / radar data (e.g. F3 regional folds imaged in the combined radiometric / radar image
do not appear in the magnetic data, Fig. I-14).
Figure I-14 Detailed comparison of radiometric (over HH radar polarization) and magnetic
data (RTP, first vertical derivative after automatic gain control). The magnetic
trends do not correlate with bedding (S0) or S3 orientations observed in the Tarkwa
Group that are well imaged in the radiometric data. These trends may correspond to
older Sefwi Group lineaments (related to D1) beneath the Tarkwaian sediments. See
Figure I-1 for location.

70
Figure I-15 Test of susceptibility impact of deep units on magnetic RTP image. These tests
were conducted using Noddy software assuming a 3000 m maximum depth for the
Tarkwa Basin with various susceptibility contrasts between the Sefwi Group (BS)
and the Tarkwa Group (TS) susceptibilities. We note that the Sefwi Group structures
(folds in this example) are imaged beneath the Tarkwa Basin when the Sefwi Group
is at least 5 times more susceptible than the overlying Tarkwa Basin.
Previous studies (Table I-2) have estimated the total thickness of Tarkwaian sedimentary
layers from 1000 to 3000 m. Assuming a maximum 3000 m depth for the Tarkwa Basin, several
tests (Fig. I-15) with various susceptibility contrasts were conducted using Noddy software
(Jessell, 1981, 2001, Jessell and Valenta, 1996). The models suggest that in order to image
structure in the buried Birimian basement, the Birimian must contain lithologies with
approximately 5 times greater susceptibility than the overlying Tarkwa Group. Measurements of
magnetic susceptibility within the Tarkwaian sediments show values that are indeed significantly

71
lower (10 times or more) than the underlying Sefwi Group metavolcanics, with the exception of
the few conglomerate layers. It is therefore possible that the magnetic data are not imaging
structures within the Tarkwa Group but rather the structures in the underlying relatively
magnetic Sefwi Group metasediments and metavolcanics. With this in mind we can interpret
trends in the magnetic images as D1 structures in the Sefwi Group that formed prior to the
deposition of the Tarkwaian sediments.
2.4.5 Forward modelling
Forward-modelled geological cross-sections (Fig. I-16) across the Ashanti Belt and
Tarkwa Basin were constructed in order to understand and illustrate the structural relationship
between the Birimian and Tarkwaian units produced during D1 and D3 shortening events. These
sections are geologically consistent with the regional interpretation and the field observations.
Forward-modelling was performed to ensure that geological cross-sections were also
geophysically consistent with aeromagnetic, gravity and petrophysical data. Not all features
within these models produce a perceptible geophysical contrast but are otherwise in agreement
with the geological observations made within the study area.
Modelling was performed using Oasis Montaj GM-SYS software that utilises the
algorithm of Talwani et al. (1959) and Talwani and Heirtzler (1964) to calculate the gravity and
magnetic response of two-dimensional polygons. Construction of these integrated geological and
geophysical models involved creating a traditional geological cross-section that was assigned
values of magnetic susceptibility and density. The different fold trends in the Birimian and
Tarkwaian units are represented in 2D by different fold wavelengths, amplitudes and positions of
fold axes as they occur in the plane of the section. The geophysical response of this model was
then calculated and compared to the observed aeromagnetic and gravity anomalies. The
geometry and magnetic susceptibility/density values assigned to each rock package were then
manipulated within geologically reasonable limits to improve the agreement between the model
response and the observed response.
Magnetic susceptibility ranges for the modelled rock packages were based on field and
laboratory susceptibility measurements (Fig. I-7). The Kumasi Group metasediments
(volcanoclastics and phyllites) show low susceptibility values (less than 10-3
SI) an order of
magnitude lower than the Sefwi Group metavolcanics rocks (10-2
for basalts and gabbros) with
anisotropies below 20%. High magnetic susceptibilities were mainly related to hydrothermal
magnetite-rich layers within metasediments.

72
The Tarkwaian quartzite and phyllite display low susceptibilities (around 10-4
SI) related
to rare detrital magnetite and biotite. However, some sandstone layers showed sedimentary
structures that were defined by magnetite grains, resulting in local but important increases in
magnetic susceptibility. Anisotropies within these Tarkwaian sediments were up to 56%.
Magnetic variability observed within Tarkwaian conglomerates is likely caused by the presence
of magnetic pebbles derived from the Sefwi Group metavolcanics rocks or granitoids. An
average value of 10-3
SI has been used for modelling.
Granitoids displayed large ranges of magnetic susceptibility varying between 10-4
SI for
the granites and 10-1
SI for the diorites. We assumed a mean value of 5 x 10⁻³
SI in the models.
Generally, more mafic units had higher magnetic susceptibilities. Anisotropy maxima are 8% for
undeformed granitoids and 23% for the deformed granitoids.
Doleritic dykes correspond to one of the most magnetic lithologies in SW Ghana. They
are magnetically isotropic (3%) with an average susceptibility approaching 2*10-2
SI. These
dykes show strong remanent magnetisation of around 3 A/m, with declination of 59° and
inclination of -18°.
The dominant magnetic response of the study area is located over the Tarkwa Basin
where a complex series of high amplitude (≈100 nT), linear anomalies that trend approximately
parallel to the Ashanti Belt are imaged. These anomalies are predominantly produced by
magnetic dolerite sills within the Tarkwa Group along with major faults within and along the
margins of the Tarkwa Basin that host hydrothermal magnetite. In contrast, faults hosted entirely
within the Birimian Supergroup such as the Akropong or the Twifo Praso faults do not produce
significant magnetic anomalies. The strongest magnetic anomalies in the region lie to the east of
the Tarkwa Basin within highly magnetic Sefwi Group metavolcanics (Fig. I-3). These rocks
produce very high amplitude (≈400 nT) broad anomalies over an area of 30 km2 around Wassa
mine. Other dominant magnetic features include NNW trending dolerite dykes that present as
high amplitude (≈100 nT) moderately remnant irregular linear anomalies.
The geometry and distribution of the magnetic lithologies were built into the forward-
models based on the regional geophysical interpretation (Fig. I-13), field observations, magnetic
susceptibility data (Fig. I-7) and gravity data (Table I-5). Significant differences exist between
the observed and calculated magnetic anomalies. These differences consist of low amplitude
(< 30 nT), short wavelenght anomalies that were not able to be modelled using the previously
described magnetic lithologies. Field observations indicate the presence of a 20 m to 80 m thick
weathered layer at the surface. This unit corresponds to thick lateritic successions that blanket

73
most of the study area and contains highly variable magnetic susceptibilities related to the initial
lithology and the degree of alteration and weathering. This lateritic horizon was modelled as a 50
m thick homogenous layer. It does not have any influence on the wavelengths at the scale of our
modelling but it does reduce the amplitude of near-surface features. Given that we see this layer
in the field it would be worse to ignore it altogether, even though we acknowledge that the
thickness variations are unknown. Residual magnetic anomalies reflect mostly the variations of
susceptibility and thickness within this weathered layer.
Poor gravity coverage over the study area meant these data were only able to broadly
constrain the depth of the relatively dense Sefwi Group basement. Density values (Table I-5)
used during the gravity modelling spanned the range proposed by Baritt et al. (1998) and Hasting
et al. (1982), using 3.0 g/cm3 for gabbros, 2.9 g/cm
3 for basalts and dolerites, 2.8 g/cm
3 for
Eoeburnean granitoids, 2.7 g/cm3 for both volcanoclastics, phyllites and Eburnean granitoids and
2.65 g/cm3 for the micaschists. The surficial weathered layer was given a density of 2.6 g/cm
3.
Gravity anomalies are dominantly controlled by the distribution of the relatively dense
metavolcanic group (Sefwi Group) and the less dense metasedimentary groups (Kumasi and
Tarkwa groups). The small differences between the observed and modelled gravity anomalies are
difficult to determine given the model resolution is higher than the gravity data.
2.5 Discussion
2.5.1 Eoeburnean phase (2187 – 2158 Ma)
Paleoproterozoic rocks of the southern Ashanti Belt were strongly deformed, mineralised
and intruded by granitoids during the “Eburnean Orogeny” (Fig. I-17). Previous interpretations
of the regional tectonic evolution (e.g. Allibone et al., 2002a; Feybesse et al., 2006) suggest the
Eburnean Orogeny initiated during the first phase of volcanic accretion and subduction that
could correlate to D1 deformation. This hypothesis is in agreement with the interpretation of
Sefwi Group mafic and ultramafic rocks as an ophiolitic suite (Attoh et al., 2006; Dampare et al.,
2008). Our structural interpretation gives this accretionary phase a structural context whereby
N-S shortening during D1 produced regional scale E-W trending folds within the Sefwi Group
along with the intrusion of syn-tectonic granitoids (Fig. I-13).

74
Figure I-16A

75
Figure I-16B Forward-modelled cross-sections across the Ashanti Belt. See Figure I-1 for
location of these sections. These models highlight the mineralised
Birimian/Tarkwaian contacts. Sefwi Group metavolcanics were highly deformed
during the D1 and contrast with the more open syn-D3 folding in the Tarkwa Basin.
Kumasi Group sediments on the western side of the Ashanti Fault were also
deformed by D3. Major gold deposits have been geometrically projected onto their
structural position.

76
Figure I-17 Correlations between stratigraphic sequences, magmatism, deformations and mineralisations in southwest Ghana. The Cape Coast
micaschists are not constrained by absolute or relative ages.

77
D1 occurred across southeastern part of the Ashanti belt (Fig. I-13) and below the Tarkwa
Basin (Fig. I-14). In Obuasi, Allibone et al. (2002a) described transfer faults and lineaments
oriented E-W that were attributed to their NW-SE D2 shortening (our D3). The Obuasi deposit is
mainly hosted within Kumasi Group metasediments. However, minor exposures of
metavolcanics indicate the presence of the Sefwi Group basement at shallow depths. It is
therefore possible that D1 deformation also affect this basement, developing E-W trending
structures under a regional N-S shortening regime. Some existing D1 structures may have been
reactivated during D3 (NW-SE shortening) and initiated as transfer faults such as those observed
in the Obuasi mine. D1 deformation also explains the presence of the E-W lineaments reported
by Allibone et al. (2002a, fig. 5, p. 72).
Deformed granitoids such as those found in Sekondi (Loh et al., 1999), help constrain the
timing of this Eoeburnean deformation phase (D1). Linear magnetic anomalies in this granitoid
are sub-parallel to the dominant S1 in the Birimian micaschist. Consequently, we suggest that
this intrusion, dated at 2174 ± 2 Ma (Oberthür et al., 1998), is contemporaneous with D1. The
undeformed Dixcove tonalite suggests that peak D1 deformation occurred before 2171 ± 2 Ma
(Hirdes et al., 1992).
2.5.2 Kumasi Group deposition (2154 – 2125 Ma)
Eoeburnean tectonism produced magmatism between approximately 2187 and 2158 Ma
and deformation that occurred before 2171 Ma. The Eoeburnean event predates deposition of the
Kumasi Group sediments, and was only observed within the Sefwi Group basement. This places
the deposition and lithification of the Kumasi Group between D1 and D3.
The Kumasi Group within the Kumasi and the Akyem Basins (Fig. I-1) formed under an
extensional regime during D2 (Stage 4 of Feybesse et al., 2006), where major faults (e.g.
Ashanti, Akropong faults) behaved as primary basin forming structures and possible detachment
surfaces prior to reactivation as D3 thrust faults. Direct evidence for an extensional origin for the
Ashanti Fault is obscured by the strong overprinting (D3 thrust and D4 strike-slip movement,
Allibone et al., 2002a). However, the opening of the Kumasi Basin required the generation of an
extensional fault architecture that have been favourably orientated to undergo reactivation during
D3 shortening.
The strong magnetic and gravity contrasts across the Ashanti Fault (Fig. I-5, I-16)
suggests large amounts of vertical displacement have juxtaposed rocks with contrasting
petrophysical properties. The absence of metamorphic gradient across the Ashanti Fault is not

78
consistent with significant vertical thrust movement during D3 shortening. Consequently, we
propose the Ashanti Fault was initiated as a half-graben during D2 deformation. Evidence of a
widespread D2 extensional phase has also been identified in northwest Ghana, where De Kock et
al. (2011) proposed a significant period of rifting between 2148 Ma and 2125 Ma. This timing is
consistent with the deposition of the Kumasi Group between 2154 ± 2 Ma (youngest U/Pb age
on zircon found by Oberthür et al., 1998) and 2136 ± 19 Ma (Granitoid intrusion, U/Pb on
zircon, Adadey et al., 2009.
Adadey et al. (2009, p. 80) reported an early deformation in the Kumasi Group that was
interpreted as pre-diagenetic slumping. This deformation is characterised by rare isoclinal fold-
like structures that are coaxial with deformation that affected both the Birimian and Tarkwaian
units (our D3). These folds could have resulted from Eburnean D3 deformation that intitiated
after the deposition of the Kumasi Group and before the Tarkwaian sedimentation. This
hypothesis is also consistent with observations of an early bedding parallel cleavage in the
Kumasi Group by Allibone et al. (2002a). This layer parallel fabric is interpreted it as resulting
from bedding-parallel shearing (their D1, our D3) during the early Eburnean Orogeny that is
absent in the Tarkwa Group.
2.5.3 Tarkwa Group deposition (2107 – 2097 Ma)
The Tarkwa Group occurs as a synclinal erosional remnant overlying the metavolcanic
Sefwi Group in the Ashanti Belt. The timing and nature of the contact between the Tarkwa
Group and the Birimian Supergroup is not clear, but probably represents an unconformity or
faulted contact. Both margins of the preserved Tarkwa Basin are represented by major faults.
These faults may have been important during the early evolution of the Tarkwa Basin; however,
strong reactivation obscures their early history.
The presence of early deformation in the Kumasi Group metasediments is an indicator of
the initiation of the Eburnean Orogeny before the Tarkwaian deposition. However, the majority
of Eburnean deformation occured after the Tarkwaian deposition and after intrusions of
metagabbro sills within the Tarkwa Group at 2102 ± 13 Ma (U/Pb on zircon, Adadey et al.,
2009). It is therefore possible that the major D3 transcurrent structures such as the Ashanti Fault
initiated before the Tarkwa Group sedimentation. Reactivation of the D2 Ashanti detachment
fault with transcurrent movement may occur at the start of Eburnean D3 shortening and would
have controlled the Tarkwaian deposition on its western side. Similar faults should exist on the
eastern side of the basin, but are not observed due to intense overprinting.

79
This hypothesis of a Tarkwa Basin bordered by two major transcurrent faults is consistent
with the presence of conglomerate and sandstones beds that alternate in the first 1000 meters of
the Tarkwa Group. This syn-orogenic molasse and the presence of placer deposits along
paleochannels (Sestini, 1973) suggest short transport distances in a shallow water environment
that has also been proposed by Baratoux et al. (2011) in Burkina Faso and in the Abitibi or
Yilgarn cratons within similar intra-orogenic basins (Eriksson et al., 1994).
2.5.4 Eburnean phase (2125 – 1980 Ma)
The post-Tarkwaian Eburnean event is clearly visible and well preserved in the field. D3
deformed the entire crustal pile made up of the Birimian Supergroup and the Tarkwa Group.
Regional mapping shows a series of kilometric scale F3 folds in both the Kumasi and Tarkwa
groups metasediments related to NW-SE shortening (Fig. I-13). D3 deformation in the Sefwi
Group is associated with regional folding of the S1 foliation. An example of this relationship is
found at Shama beach, where F3 ptygmatic folds affect bedding and a melt rich S1 foliation (Fig.
I-11B). According to Milési et al. (1992) and Feybesse et al. (2006) D3 shortening was
responsible for creating many of the major thrust faults as well as regional folding (e.g. the
Ashanti and Akropong faults). The distribution of these thrusts is probably related to reactivation
of the existing D2 extensional architecture. D3 thrusting along the Ashanti Fault is related to the
metamorphic peak (550 °C and 5 kbar; John et al., 1999), dated at 2092 ± 3 Ma (Oberthür et al.,
1998). D3 spans from approximately 2125 Ma to over 2092 Ma with major folding occurring
after the Tarkwaian deposition at around 2097 Ma.
Observations along the Ashanti Fault zone around Prestea and Bogoso gold mines show
an increase in the intensity of F3 folding on the western sides of fault contacts between Kumasi
Group phyllites (west) and Tarkwa Group phyllites (east) (Fig. I-12C, I-12D). This asymmetry
suggests strain was being preferentially partitioned into the Kumasi Group phyllites. On the
other side of the belt, an angular unconformity between the Kumasi and Tarkwa groups
sediments is imaged in the geophysical data. This unconformity suggests that Tarkwaian
sediments may have been displaced eastward during D3 accommodated by a low angle thrust or
decollement at depth.
Our mapping shows syn-D4 shear zones that both bound and cross-cut Tarkwaian
sediments. Some of these structures overprint regional F3 folds. D4 structures including the
Ashanti and Akropong faults, along with other syn-D3 thrust faults were reactivated via sinistral
strike-slip movement during D4 (Allibone et al., 2002b). Two major F4 folds observed in the
Wassa and Obuasi gold mines could have been developed during shearing (Allibone et al.,

80
2002a). By the end of the D4 (NNE-SSW shortening) the regional architecture was created and
only weakly modified by successive events. D5 is characterised by small scale recumbent folds,
resulting from a WNW -ESE shortening (Tunks et al. 2004). The final D6 event is associated
with NW-SE oriented reverse faults identified in the field and in the geophysical data to
overprint all earlier generation structures. D4, D5 and D6 deformation occurred approximately
from 2092 Ma to 2063 Ma (estimated age of the mineralisation in Damang, Pigois et al., 2003)
Timing of the Eburnean Orogeny plutonism could be constrained by granitoid intrusion at
2136 ± 19 Ma (Adadey et al., 2009) and at 2116 ± 2 Ma (Hirdes et al., 1992) for its beginning,
post or syn-sedimentation into the Kumasi Group, pre-sedimentation in the Tarkwa Group. Some
undeformed potassium rich granitoid intrusions that overprint all previous structures could be
related with the late stages of the Eburnean Orogeny. However, their ages have not been
determined precisely yet (1973 ± 75 Ma, Pb/Pb date on whole rock, Taylor et al., 1992 and 1978
± 37 Ma, Ar/Ar date on amphibole, Feybesse et al. 2006).
2.5.5 Implications for Au deposits
2.5.5.1 Timing of gold mineralisation and metamorphism
Gold mineralisation in the southwest of Ghana is divided in to two main hydrothermal
events. The first period corresponds to the major gold deposits found along the Ashanti Fault
(Prestea, Bogoso, Obuasi, Fig. I-1) and the Akropong fault (Ayanfuri, Pampe, Obuasi, Fig. I-1).
Fluid inclusion studies on mineralised quartz veins suggest low temperature and pressure
homogenisation conditions for all major deposits. These factors suggest that mineralisation
occurred after the metamorphic peak (related to D3) and probably synchronously with D4
shearing (Oberthür et al., 1994, 1997).
The second hydrothermal event is associated with mineralisation along the Sefwi/Tarkwa
groups contact on the eastern side of the belt (Abosso-Damang Mine, Fig. I-1) during D6. This
mineralisation is dated at 2063 ± 9 Ma (U/Pb on xenotime) by Pigois et al. (2003) and represents
the youngest known deposit in the region. The greenschist conditions for its formation are
equivalent to the deposits found along the Ashanti Fault.
An additional mineralisation event is required to explain the origin of the Tarkwaian
paleoplacer. This placer was developed during Tarkwaian deposition at the start of D3 and has
long been considered to be sourced from aforementioned Sefwi Group gold deposits. This
correlation is based on similar fluid inclusion chemistry between Tarkwaian quartz pebbles and
Birimian (Sefwi Group) quartz veins (Klemd et al., 1993). However, the maximum depositional

81
age of the Tarkwaian sediments (2107 Ma) and their deformation during D3 is inconsistent, with
placer deposits derived from mineralisation hosted in the Sefwi Group that formed during D4-D6
(Milési et al., 1991; Eisenlohr and Hirdes, 1992; Hirdes and Nunoo, 1994). The Tarkwaian
paleo-placer therefore needs to be derived from earlier sources of gold.
As shown by our study, the Sefwi Group, in the southeast of the belt, displays strong pre-
Tarkwaian deformation associated with significant plutonism. Although no syn-D1 deposits have
been described in southwestern Ghana, they may represent early sources of gold that supplied the
Tarkwaian Paleoplacer along with gold that was remobilised in shear zones during the Eburnean
II orogenic phase. Possible Eoeburnean mineralised quartz veins have been suggested by Sestini
(1973) and Kesse (1985). An Eoeburnean gold source is also in agreement with paleoflow
indicators that suggest the Banket conglomerates were sourced from Birimian schist and
volcano-sedimentary rocks to the east of the Ashanti Belt.
2.5.5.2 Regional distribution of the mines
If we look at the distribution of gold mines in the study area (Fig. I-13, I-16A), several
deposits are located at or close to the margin of the Tarkwaian sediments. Prestea, Bogoso and
Obuasi on the western side are located along a 500 m thick faulted and sheared area lying the
contact (Ashanti Fault). On the eastern side of the belt, the Abosso-Damang deposits appear to
lie directly on the Sefwi/Tarkwa groups contact.
In accordance with Feybesse et al. (2006), we suggest that D3 shortening lead to the
development of a low angle decollement beneath the Tarkwa Basin that was responsible for
transporting the Tarkwa Group to the east. Such a structure would be favourable for gold
mineralisation (barrier for fluid flow), and would explain the distribution of many major gold
deposits that are located on the margins of the Tarkwaian sediments. Further, gold along this
structure would also be a possible source of gold for shear zone hosted deposits remobilised
during D4.
2.6 Conclusions
This paper presents a new structural interpretation of the southern Ashanti Belt in
southwestern Ghana. Utilising field observations, magnetic, radiometric, gravity and radar data,
we distinguish at least 6 distinct deformation events that occurred in two phases (Eoeburnean
and Eburnean) during the Paleoproterozoic (Fig. I-17). We also establish a new stratigraphy

82
(Fig. I-8) for the Birimian Supergroup (Sefwi Group and Kumasi Group). Our map (Fig. I-13)
and sections (Fig. I-16) display a series of tight F1 folds that only affected the Sefwi Group
basement. This group was overlain by the Kumasi Group during D2 extension and by the
Tarkwa Basin that developed at the start of D3 shortening controlled by major transcurrent faults
such as the Ashanti Fault.
Significant gold mineralisation may have occurred during both Eoeburnean and Eburnean
phases. Quartz veins that formed during the early phase (Eoeburnean) may also represent the
source of the gold rich quartz pebbles found in the Tarkwa paleoplacer. We suggest that many
hydrothermal gold deposits in the Ashanti region were formed by remobilisation and
concentration of syn-D1 gold along D4 shear-zones and the contact zones between the Birimian
and Tarkwaian units during the Eburnean Orogeny.
2.7 Résumé du chapitre I
2.7.1 Introduction
Ce premier chapitre présente une nouvelle interprétation de l’évolution géodynamique du
sud de la ceinture d’Ashanti, via une cartographie détaillée basée sur les observations de terrains
et l’interprétation des données géophysiques. Les études de Feybesse et al. (2006) et d’Allibone
(2002a) divisent l’Orogénèse Éburnéenne, définie par Bonhomme (1962), en deux phases de
déformations (Éoéburnéenne et Éburnéenne, De Kock et al., 2011). Cependant, seule la seconde
est décrite à l’échelle régionale. L’un des principaux objectifs de cette première étude sera donc
de donner un contexte structural à la phase Éoéburnéenne, puis de préciser l’évolution
géotectonique régionale.
2.7.2 Géologie du sud-ouest Ghana
Comme cela a été vu précédemment, la géologie du sud-ouest du Ghana se compose de
trois unités stratigraphiques (Adadey et al., 2009), formées de roches métavolcaniques et
métasédimentaires, qui sont les groupes de Sefwi (Birimien), de Kumasi (Birimien) et de Tarkwa
(Tarkwaien). Cette stratigraphie Paléoprotérozoïque fut intensément déformée durant
l’Orogénèse Éburnéenne (Bonhomme, 1962) et pénétrée par d’abondantes intrusions de
granitoïdes TTGs (Tonalite, Trondhjemite, Granodiorite). La mise en place de dykes de dolérite
et d’une couverture sédimentaire le long de la côte, au Protérozoïque et au Phanérozoïque, a
achevé de construire la géologie régionale.

83
2.7.3 Données géophysiques
Les données géophysiques utilisées pour la cartographie correspondent à des données
magnétiques et radiométriques aéroportées (acquises pour le Service Géologique du Ghana et
maillées avec une résolution de 100 m), à des données de gravité (fournies par le Bureau
Gravimétrique International, interpolées à 2,5 min d’arc, soit approximativement 4,6 km), à des
données d’altimétrie radar (SRTM) et à des données radar (Palsar). Le traitement de ces données
a permis la réalisation d’une série d’images interprétables pour l’identification des lithologies et
des structures.
2.7.4 Résultats
L’interprétation des données géophysiques, couplée avec les observations de terrain ont
permis la révision de la carte géologique régionale, avec notamment la mise en évidence de
grands plis F1 affectant les roches métavolcaniques au sud-est de la ceinture d’Ashanti. La
cartographie a également aidé à définir une nouvelle stratigraphie du groupe de Sefwi. L’étude
structurale a montré la présence de six déformations significatives à l’échelle régionale, reliées
aux deux phases de l’Orogénèse Éburnéenne.
L’observation des linéaments magnétiques non corrélés aux observations de surface dans
le bassin de Tarkwa conduisit à leur interprétation en tant que structures Birimiennes enfouies
sous le bassin de Tarkwa. Cette hypothèse fut testée par la réalisation de modèles Noddy (Jessell,
1981, 2001 ; Jessell et Valenta, 1996) suggérant que les structures enfouies sous un bassin sont
observables si l’on considère une épaisseur de bassin inférieure à 3000 m pour un contraste de
susceptibilité d’au moins 5 fois.
Finalement, la cartographie et les nombreuses données pétrophysiques collectées sur le
terrain (susceptibilité magnétique, densité) permirent la construction de deux coupes géologiques
en accord avec les données géophysiques.
2.7.5 Discussion
Cette étude identifie un premier évènement de déformation (D1), antérieur à la
sédimentation des bassins de Kumasi et Tarkwa et donc par conséquent, associé à la phase
Éoéburnéenne. Ce D1 se caractérise par un raccourcissement N-S développant une série de plis
isoclinaux d’échelle kilométrique dans les roches métavolcaniques du groupe de Sefwi, au sud-
est de la ceinture d'Ashanti. Les intrusions de TTGs de la phase Éoéburnéenne furent datés entre
2187 Ma et 2158 Ma. Il a été suggéré que de possibles minéralisations en or formées au cours de

84
cet évènement D1 pourraient être à la source des paléoplacers du bassin de Tarkwa. Ces
minéralisations précoces auraient également pu être remobilisées et concentrées le long de zones
de cisaillement majeures lors de la phase Éburnéenne.
La seconde déformation (D2) correspond à une phase d’extension reliée à la
sédimentation du groupe de Kumasi (2154 – 2125 Ma). L’activation de structures majeures,
comme la Faille d'Ashanti, sous forme de détachements, a pu contrôler la formation des bassins
sédimentaires de Kumasi et d’Akyem.
Le début de la phase Éburnéenne (2125 - 1980 Ma), marqué par un raccourcissement
NW-SE (D3), eut pour résultat la réactivation inverse de la Faille d’Ashanti, contrôlant, côté est,
la formation du groupe de Tarkwa (2107 – 2097 Ma), et, côté ouest, un début de plissement des
sédiments du bassin de Kumasi. La poursuite du raccourcissement D3 produisit le
développement de plis majeurs dans l’ensemble des unités stratigraphiques Birimiennes et
Tarkwaiennes. Le maximum métamorphique estimé autour de 5 kbar, 550°C (Schmidt Mumm et
al., 1997, John et al., 1999) et daté à 2092 ± 3 Ma (Oberthür et al. 1998) est corrélé avec la
déformation D3.
La déformation D4 (raccourcissement NNW-SSE) permis la réactivation en cisaillement
sénestre des failles formées lors de D3 (orientées N30-N40). De nouvelles zones de cisaillement
apparurent (orientées N50-N60), recoupant les structures antérieures. Une intense crénulation S4
du clivage S3 se développa sur l’ensemble de la région. L’intégralité des gisements d’or connus
le long des failles d’Ashanti (Prestea, Bogoso, Obuasi), d’Akropong (Pampe) et d’Asankragwa
se mirent en place pendant les cisaillements D4 (Allibone et al., 2002a).
L'architecture géologique régionale établie à la fin de l’évènement D4 ne fut que
légèrement modifiée par les deux déformations postérieures. D5 forma régionalement des plis de
faible amplitude (à l’exception du site de Wassa), couchés, et associés à une crénulation sub-
horizontale. D6 se caractérise surtout par la formation tardive de très nombreuses failles inverses
orientées NW-SE.

85
Chapitre II

86

87
Chapitre II
The tectonic context of the Eoeburnean Wassa gold mine - Implications for relative timing
of mineralising events in southwest Ghana
Abstract
The Ashanti greenstone belt in southwest Ghana hosts many hydrothermal gold deposits
distinguished by their differing ages and structural contexts. The Wassa gold mine is hosted by
the Sefwi group in the eastern part of the SW Ashanti belt. This study investigates the tectonic
and hydrothermal evolution of this gold deposit by integrating field and geophysical
observations. We believe that Wassa represents the oldest known gold mineralisation in
southwest Ghana and discuss implications for the regional evolution of the area.
At least six deformation, associated with gold mineralisation and remobilisation and
developed in two phases (Eoeburnean and Eburnean), have been identified in the Wassa mine
and at the regional scale. D1 deformation developed a series of isoclinal F1 folds and a strong
S0-S1 fabric marked by chlorites, ankerite, rare calcite and gold-bearing elongated and stretched
pyrite. Numerous quartz and ankerite veins result from alteration of surrounding metabasalts
during D1. Eoeburnean age of this early-D1 mineralisation and local high gold grade suggests
that it may be one of the potential sources of gold for the Tarkwa paleoplacer.
The Eburnean orogenic phase starts in the Wassa mine with D3 NW-SE shortening
developing both kilometre-scale open folds and non-mineralised QV3 quartz veins in all
paleoproterozoic lithologies. D4 corresponds to a NNW-SSE shortening event and is the second
most intense deformation in the Wassa mine area with a series of sinistral shear zones controlling
large scale folding and a subvertical S4 crenulation cleavage. A kilometre-scale F4 synform
centred on the Wassa mine refolds the mineralised isoclinal F1. Late D5 folding and D6 events
overprint the D4 structures and are associated with euhedral pyrite, rare chalcopyrite and minor
gold remobilisation associated with QV5 quartz veins.

88
3.1 Introduction
In the West African Craton, a series of paleoproterozoic greenstone belts host numerous
hydrothermal gold deposits and rare paleoplacers, particularly in southwest Ghana (Fig. II-1).
Hydrothermal Au mineralisations from the southern Ashanti Belt have been relatively well
studied including studies on Obuasi (≈ 60 Moz, Blenkinsop et al.,1994; Allibone et al., 2002a);
Bogoso-Prestea (≈ 15 Moz, Allibone et al., 2002b); Konongo (≈ 3 Moz, Kutu et al., 2003); and
Damang (≈ 8 Moz, Tunks et al., 2004). Mineralisation events for all of these deposits are
correlated with the late deformation events of the Eburnean Orogeny (Bonhomme, 1962,
Feybesse et al., 2006). In contrast, early Eburnean gold mineralisation has only been mentioned
in a few geology reports of recently discovered gold deposits. In the Wassa mine, Bourassa
(2003) highlighted the possibility of hydrothermal gold mineralisation associated with early
Eburnean quartz vein generation and suggested that this style of mineralisation could be the
source of gold for the Tarkwa paleoplacer (≈ 41 Moz, Milesi et al., 1991).
The origin of gold for paleoplacer deposit in southwest Ghana has long been debated
(Sestini, 1973; Milési et al., 1991). Before robust age constraints were available (Davis et al.,
1994), these paleoplacers were thought to be derived from Birimian type deposits such as those
along the Ashanti Fault (e.g. Obuasi). However, authors including Milési et al. (1991) pointed
out some inconsistencies with this model: gold rich Tarkwaian conglomerates do not exhibit
traces of the arsenopyrite found in the Ashanti fault deposits. These authors proposed that all of
the deposits along the Ashanti Fault have been formed post-Tarkwaian during the Eburnean
stage (Allibone et al., 2002a). Consequently, pre-Tarkwaian deposits that constitute possible
source of gold for the placers remains unrecognised yet.
Investigating the Wassa gold deposit, which seems to be older than other locations in
southwest Ghana, could be a great contribution to our understanding of the mineralising events
succession and their relationships during the Eburnean Orogeny.
Our objectives here are to characterise the structural evolution of the Wassa mine area,
constrained by field and geophysical observations, and to compare the Wassa deformation
sequence and gold timing with other deposits in order to put the hydrothermal mineralising
sequences into the context of the regional tectonic evolution.

89
3.2 Geological Setting
3.2.1 Ashanti Belt
The Ashanti greenstone belt in southwest Ghana (Fig. II-1) principally consists of three
metasedimentary and metavolcanic rock groups known as the Sefwi Group, the Kumasi Group
and the Tarkwa Group (Adadey et al., 2009). The Sefwi Group is mainly composed of
metabasalts which alternate with metavolcanosedimentary layers, dated as being older than 2162
± 6 Ma (U/Pb on zircons, Loh et al., 1999). The Kumasi Group corresponds to phyllites and
volcanoclastic sediments, deposited in the Kumasi Basin and in the Akyem Basin after 2154 ±
2 Ma (U/Pb on zircons, Oberthür et al., 1998). The Tarkwa Group corresponds to a
metasedimentary basin overlying the Birimian Supergroup (Sefwi and Kumasi groups) and
deposited between around 2107 Ma (Perrouty et al., 2012, reinterpretation of detrital zircons
U/Pb analyses of Pigois et al., 2003) and 2097 ± 2 Ma (granitoid intrusion, U/Pb on zircons,
Oberthur et al., 1998). Many tonalite, granodiorite, granite and leucogranite intruded these
groups during the Eburnean Orogeny. According to Adadey et al. (2009) and to Perrouty et al.
(2012) this plutonism occurred in two stages correlated with deformation events. The first
deformation (Eoeburnean, De Kock et al., 2011) affected only the Sefwi metavolcanic Group
and was followed by Kumasi Group and Tarkwa Group deposition. The second one (Eburnean)
corresponds to the major deformation period around 2092 ± 3 Ma (estimated age for the peak of
metamorphism by Oberthür et al., 1998).
Perrouty et al. (2012) described six deformation events in the Ashanti Region. Their
nomenclature is used throughout the paper. The D1 event, which correlates with the Eoeburnean
phase, is characterised by a north-south shortening developing regional scale folds within the
Sefwi Group only. Their D2 correspond to a regional scale extension with the deposition of the
Kumasi Group sediments in both the Kumasi Basin and the Akyem Basin, as it was already
proposed by Feybesse et al. (2006). D3 and D4 major events affected the Sefwi, Kumasi and
Tarkwa groups and were characterised by NW-SE shortening (D3) developing kilometric scale
folds and thrust faults, followed by a NNW-SSE shortening (D4) associated with sinistral shear
zones that sometimes reactivate the D3 thrust faults such as the Ashanti Fault (Fig. II-1). The D5
and D6 events correspond to minor shortening phase at regional scale with crenulation cleavages
and open folds.
Both the Birimian and the Tarkwaian units host Eburnean gold deposits in southwest
Ghana. Except for a few paleoplacers in Tarkwaian metasediments (including the Tarkwa gold
mine), all the deposits are results of hydrothermal activities and are mainly located close to the

90
Sefwi / Tarkwa groups contact for the Abosso-Damang deposits and along the Kumasi / Tarkwa
groups sheared contact from Konongo to Prestea (Ashanti fault, Fig. II-1). All of these deposits
formed under greenschist facies conditions during the last stages of the Eburnean Orogeny
(Mumin et al., 1996). In contrast, the Wassa gold deposit is the only known site in southwest
Ghana to be hosted entirely within the Sefwi Group and not directly related with the Tarkwa
Basin or with a major shear zone.
3.2.3 The Wassa gold mine
The Wassa gold deposit is located 40 km northeast of Tarkwa town on the eastern side of
the Ashanti Belt near Akyempim village (Fig. II-1). It is mostly a low grade gold deposit (0.5 to
3.0 g/t) that has produced more than one million ounces of gold since industrial mining started in
1998. As a consequence of a strong overprinting of folding events, structural orientations are
highly variable within the mine area and are not reported in the following paragraph.
In contrast to the other major deposits in southwest Ghana, no literature has been
published including data on the Wassa mine. However, several company reports are available,
with descriptions of lithologies and structures (Bourassa 2003; MacCandlish, 2003). The first
deformation event (D1) described in these reports consists of rare asymmetrical isoclinal folds
associated with a subvertical penetrative foliation. However, MacCandlish (2003) proposed the
existence of an older foliation that may be parallel to bedding. For Bourassa (2003) and
MacCandlish (2003), the major folding event in the Wassa mine consists of a kilometre-scale
tight synformal fold (F4) centred on the mine (Fig. II-2). These authors found numerous parasitic
folds in the hinge of this kilometre-scale fold and an associated subvertical crenulation cleavage.
Bourassa (2003) identified another event characterised by a flat-lying crenulation cleavage (S5)
and shallow plunging open folds. He also correlates this deformation with a major fault zone
thrusting the Tarkwaian metasediments over the Sefwi Group on the western side of the Wassa
mine. Finally, both authors distinguish late stage Eburnean brittle structures in the Wassa mine
represented by a series of east-west faults.

91
Figure II-1 Map and section of the southern Ashanti belt. The major hydrothermal gold mines and the Tarkwa paleoplacer are shown. Our study
area (black rectangle) is located on the eastern border of the Tarkwa Basin.

92
Figure II-2 Geology of the Wassa mine (modified after Bourassa, 2003) draped over pit maps
(thin black lines). Projection is WGS84 / UTM zone 30N. All the lithologies have
been reoriented along a major F4 fold. Locations of the stereoplots of the S0-S1
fabric shown in Figure II-6 and of the photograph shown in Figure II-7 and are
marked.

93
Figure II-3 Photograph showing the five dominant lithologies found in the Wassa mine (after Bourassa, 2003), drillcore samples. Macroscopic
differences between the “mafic volcanic”, the “felsic volcanic” and the phyllites are mostly a result of variable volume of quartz and
ankerite veins (see Figure II-4 for the mineralogy).

94
Figure II-4 Thin-sections photographs of the dominant lithologies sampled in the mine.
Plane-polarised light on the left image. Crossed polarised light on the righ image.
chl: chlorite, cal: calcite, ank: ankerite, qtz: quartz, pl: plagioclase feldspar, ms:
muscovite. A) The “Mafic volcanic, JM013)” show strong chlorite and carbonates
alignment that define the S1. The “felsic volcanic (JM017)” and the “phyllites
(JM015)” display equivalent mineralogy. B) The “metadiorite (JM016)” shows
similar mineral assemblages with large ankerite porphyroblasts up to 2 mm size that
are also observed on Figure II-3. C) The “felsic porphyry” contains plagioclase
feldspar, quartz, muscovites and rare ankerite.

95
These company reports also mention at least three kinds of quartz veins related to
different deformation events. According to Bourassa (2003), the first vein generation exhibits a
smoky to translucent quartz associated with tourmaline, sericite and sulphides. These veins host
the highest gold grade found in the area (≈ 5 g/t, but locally up to 70 g/t). These veins have been
deformed by isoclinal F1 folds and are boudinaged in the fold limb. In contrast, the second-
generation veins have not been folded by D1 and contain few traces of remobilised gold
(MacCandlish, 2003). Bourassa (2003) observed that these veins are mostly located parallel to
the subvertical crenulation cleavage associated with the kilometre-scale fold (F4). The third and
last quartz veining event corresponds to milky, pinkish quartz veins hosting low gold grades.
They are sub-parallel to the horizontal crenulation cleavage and cross-cut all previous folds
(Bourassa, 2003).
3.3 Field observations and geochemistry
3.3.1 Stratigraphy
Lithologies (Fig. II-3) in the mine area belong to the Sefwi Group and consist of an
alternation of “mafic volcanic”, “felsic volcanic”, “phyllites” and few black shale layers
(Bourassa, 2003). Multiple ankerite, calcite and quartz veins subparallel to bedding (or to the S0-
S1 fabric) are also observed in these rocks. Eoeburnean intrusions were mapped as “diorite” and
“felsic porphyry (granodiorite)” units (Fig. II-2, Fig. II-3). Magnetite enrichment has been
observed in some phyllitic layers called the Banded Magnetic Unit (BMU). These layers seem to
be bedding parallel and present a variable thickness between 1 to 8 metres (Bourassa, 2003).
In contrast with their macroscopic appearances (Fig. II-3), thin section analysis (Fig. II-4)
allowed to distinguish three major lithologies: (1) The “mafic volcanic”, “felsic volcanic”, and
“phyllites” display similar mineral assemblages with variable proportions of quartz, chlorite,
ankerite and calcite. (2) The “metadiorite” is characterised by quartz, chlorites, ankerite
porphyroblasts and muscovite. (3) The “felsic porphyry” is less affected by metamorphism and
hydrothermal alteration and presents quartz, plagioclase feldspar, muscovite and rare ankerite.
With the partial exception of the “felsic porphyry”, the initial mineralogy of the analysed
samples was totally metamorphosed and/or hydrothermally altered.

96
Table II-1 Geochemical analyses of the five dominant lithologies found in the Wassa mine.
All samples have been taken from drillcore. The “mafic volcanic”, “felsic volcanic”,
“metadiorite” and “phyllites” display similar whole rock compositions.

97
Figure II-5 A) Extended trace elements profiles normalised to primitive mantle (Sun and
McDonough, 1989) of the “five lithologies” observed in the field (Figure II-3). *
Average composition of the Axim suite basalts as defined by Dampare et al., 2008. B)
Volcanic rock classification using Zr/TiO2 versus Nb/Y ratios (modified after
Winchester and Floyd, 1977). With the exception of the “felsic porphyry” intrusive
rocks (JM012), all lithologies of the Wassa mine display similar trace element
profiles. They correspond to enriched basalt signatures (enriched in light trace
elements and depleted in heavy rare earth elements) typical of the type-II basalts of
Dampare et al., 2008.

98
3.3.2 Whole rock geochemistry
Geochemical analyses were conducted on representative samples of the dominant
lithologies of the Wassa mine area: the “mafic volcanic” (JM013), the “felsic volcanic” (JM017),
the “metadiorite” (JM016), the “felsic porphyry” (JM012) and the “phyllites” (JM015). These
samples were sent after pulverising to A.L.S. Mineral laboratory, Sevilla, Spain. Whole rock
measurements (Table II-1) were done using ICP-AES for major elements and base metals and
using ICP-MS for trace elements and REE. These analyses are characterised by high loss on
ignition (LOI, Table II-1) values explained by the presence of carbonates in all rocks.
Major element geochemical analyses indicate that the “mafic volcanic”, the “felsic
volcanic”, the “phyllites” and the “metadiorite” have equivalent major elements (Table II-1) and
trace elements whole rock proportions (Fig. II-5A). This geochemistry agrees with thin section
observations (Fig. II-4A) that also show similar mineralogy. These samples display extended
trace element profile after normalisation to primitive mantle (Sun and McDonough, 1989)
corresponding to enriched basalts signature (enriched in light trace elements and depleted in
heavy rare earth elements) typical of the Axim Suite type-II basalts of Dampare et al. (2008).
Negative Rb and K anomalies for the “mafic volcanic” suggest that they may have been initially
less differentiated than the “felsic volcanic” and the “metadiorite”. Considering the High Field
Strength Elements (HFSE), considered to be less affected by alteration, all of these “lithologies”
plot in the andesitic / basaltic domain using the volcanic rock classification of Winchester and
Floyd (1977), based on Zr/TiO2 versus Nb/Y ratios (Fig. II-5B).
In contrast, the “felsic porphyry” (JM012) shows lower LOI, and higher light trace
element proportion. Its geochemistry displays high SiO2, low Fe2O3, low MgO, high Na2O and
high K2O proportions (Table II-1) that agree with its mineralogy corresponding mostly to quartz,
plagioclase feldspar and muscovite assemblages (Fig. II-4C). They may correspond to the most
differentiated Eoeburnean intrusions (Fig. II-5B) that intruded the mafic lithologies in the Wassa
mine.
The initial environment of the Wassa mine may correspond to a package of volcanism-
related rocks with basalts more or less mafic, volcano-sedimentary layers and a few diorite
intrusions. These rocks have been further intruded by the “felsic porphyry” and entirely
recrystallised and modified to metamorphic assemblages by hydrothermal alteration (carbonates,
pyrites, quartz) and by veining (quartz, carbonates).

99
Figure II-6 Stereoplots. A,B,C) The S0-S1 foliation orientation varies from the south
(N38/subvertical) to the north (N064/47) of the Wassa mine area. These variations
define a major fold with a hinge centred on the mine site, related to D4 deformation.
D) Axial plane of this F4 correspond to the S4 crenulation cleavage
(N062/subvertical). E) The late D5 deformation is characterised by a subhorizontal
crenulation cleavage.

100
Figure II-7 Interpreted photographs of Eburnean deformations events found in the Wassa
mine. Locations are shown in Figure II-2. A) Metre-scale QV1 quartz vein folded by
isoclinal F1. This fold axial plane is parallel to the chlorite alignments that define
the S1 cleavage. B) This S0-S1 foliation was significantly deformed by F4 parasitic
fold and crenulated by the S4 cleavage. Rare (F3?) folds have also been observed
associated with quartz veins (white arrows in the bottom left corner). C) QV4 quartz
veins cross-cutting the major F4 folds and deformed by further D5 event. D) F5 open
to close recumbent folds. Fractures and QV5 quartz veins were often observed along
the axial surface of these folds, with late euhedral pyrite mineralisation.

101
Figure II-8 Thin-section observations of early-D1 structures, veins and mineralisation. A) Transmitted light photograph of mineralised “mafic
volcanic”. Chlorite alignment carbonates and quartz-veins defined an S0 foliation folded by small scale F1. B) Scanning Electron
Microscope (SEM) mosaic image showing that pyrite are mostly located and deformed within the S0-S1 ductile fabric. C) Reflected light
photograph. These pyrites strongly deformed during D1 do not show any fractures and host some visible gold particles.

102
Figure II-9 A) Drill-core photograph showing small scale parasitic F4 fold with
concentration of D1-deformed pyrites in the hinge of the F4 (white arrows). B) Field
photograph of euhedral pyrite (up to 0.5 mm size) overprinting the S4 crenulation
cleavage. These late pyrite may have been formed during our D5 or D6 events.
Figure II-10 Schematic 3D diagram summarizing the three main folding events (D1, D4 and
D5) in Wassa mine, using Noddy software (Jessell, 1981, 2001; Jessell and Valenta,
1996). Map shown on Figure II-2 is approximately located on this model. Scaling is
not respected considering the F5 meter-size folds.

103
3.3.3 Structural observations
3.3.3.1 D1 (Eoeburnean)
The observations from the Wassa mine show a main S0-S1 foliation present as a slaty
penetrative cleavage in the metavolcanics, phyllites and intrusive bodies (Sefwi Group). An
associated lineation is defined by chlorite and magnetite alignments. S0-S1 foliation is
subvertical and oriented NE-SW in the south of the Wassa mine whereas it is dipping at around
45° to the SSE in the northwest of the mine (Fig. II-6). The bedding-parallel Banded Magnetic
Units (BMU), early-D1 (or pre-D1?) smoky-quartz veins (QV1) and carbonate veins are folded
together by isoclinal F1 folds with short wavelengths and high amplitudes at all scales
(Fig. II-7A, Fig. II-8). However, bedding is often folded at larger scale than the quartz veins and
most of the observed F1 fold hinges are only seen deforming the veins. A strong boudinage of
these smoky-quartz veins is also observed, subparallel to the S1 foliations.
Thin-section observations show that chlorite, magnetite, carbonates and pyrite can be
used as markers of the S0 (bedding or earlier foliation?). However, these minerals are elongated
parallel to the S1 and also folded by F1 (Fig. II-8). As a consequence, they must have been
formed at the early stage of the D1 deformation or pre-D1. In particular, the first mineralisation
observed in Wassa mine developed pyrites showing ductile deformation, characterised by an
elongation parallel to the S1 fabric and by the absence of fractures. These pyrites host visible
gold particles (Fig. II-8C) and together form the major gold mineralisation assemblage.
3.3.3.2 D2
Two metasedimentary groups overlay the Sefwi Group in the Wassa mine area. They
correspond to the Kumasi Group in the northeast (Akyem Basin) and to the Tarkwa group in the
west. These metasediments do not exhibit the previously described D1 deformation. Deposition
of the Akyem Basin (Kumasi Group) may be related to regional scale D2 extension according to
Feybesse et al. (2006) and Perrouty et al. (2012). However, such D2 related extensional
structures could not be identified in the Wassa mine area.
3.3.3.3 D3 (Eburnean)
The D3 deformation event is marked by a series of NE-SW oriented fold axes and a
subvertical crenulation cleavage in both the Kumasi Group (Akyem Basin and the Tarkwa
Group). In the Sefwi Group domain, the lack of outcrop outside of the Wassa mine means that
the D3 structures are mostly interpreted at large scale from geophysical images. Rare small-scale

104
folds were observed in the southern part of the mine area and may be related to the D3
deformation stage (Fig. II-7B).
The second quartz vein generation (termed QV3 as they are D3-related) observed in the
field occurs in both the Birimian and the Tarkwa groups and is not associated with
mineralisation. These QV3 veins cross-cut the S1 cleavage and are subsequently folded by D4.
3.3.3.4 D4
The S0-S1 foliation varies from approximately NE-SW in the south of the mine to E-W
further north (Fig. II-6). This variation of the S0-S1 direction suggests the presence of a
kilometre scale F4 synform with a hinge centred on the Wassa mine, oriented ENE-WSW
(Fig. II-6D). Numerous small scale F4 folds (< 1 m) can be observed (Fig. II-7B) throughout the
mine. The fold axes plunge steeply to the SW with a plunge of around 60°. The folds have a
subvertical axial surface, defined by crenulations of the earlier cleavages.
A third quartz veining event occurred during D4. Syn- to late-D4 veins (QV4) are
composed of white quartz associated with rare sulphides. These veins are subvertical, slightly
deformed and cross-cut the regional F4 folds (Fig. II-7C). During D4, earlier sulphides (and gold
mineralisation) have been concentrated in the hinges of the small scale F4 folds by mechanical
thickening of the hinges (Fig. II-9A).
3.3.3.5 D5 and D6
D5 deformation event shows a sub-horizontal crenulation cleavage associated with a
series of symmetrical recumbent F5 folds with wavelength between 0.1 m and 1 m and variable
amplitudes. F5 folds mostly affect the southern part of the mine area where the orientations of
the S0-S1 fabric (subvertical, Fig. II-6B, Fig. II-6C) show favourable initial geometries to
develop recumbent folds (Fig. II-7C, II-7D). In contrast, S0-S1 in the north of the mine presents
intermediate dips (Fig. II-6A) that is less able to develop F5 fold although the S5 cleavage is
clearly found. Some sulphides and thin quartz veins organised parallel to the S5 cleavage are
observed in particular in the axial surface of those F5 folds with the largest amplitudes. The S5 is
itself overprinted by a faint S6 subvertical crenulation (oriented NW-SE) sometimes re-working
the S4 cleavage. Variations of about 40° of the F5 axis dip direction in the middle of the mine
(F-shoot) suggest the presence of low amplitude F6 open folds. However, uncertainties on these
measurements are large as a result of the shallow F5 fold axis plunge (< 15°, Fig. II-6E). Other
evidence for a low amplitude F6 fold is suggested by an undulation of the S5 surface (or F5 axial
surface).

105
Figure II-11 Examples of mineralisation at the Wassa mine. A) Intensely foliated and mineralised “mafic volcanic” with foliation parallel veins and
later folding. Drill hole NSADD006, 157-158m, 1.36 g/t Au. B) Isoclinal F1 folds defined by earlier foliation in contact with porphyry unit.
Drill hole SED0027. C) Intensely foliated and mineralized “mafic volcanic” unit and early QV1 veins boundinaged along the foliation, a
later stage thicker quartz carbonate vein is located at right hand side of figure (inferred QV4 vein set). Both veins sets are folded. Drill
hole NSADD009 214-215m, 3.38 g/t Au. D) Mineralized and boudinaged QV1 veins with adjacent disseminated pyrite. The enlarged
section highlights the pyrite is deformed within the S1 foliation and is therefore pre- to syn-D1. Drill hole NSADD009 212-213m 2.48 g/t
Au. E) Disseminated pyrite adjacent to QV1 veins. Drill hole BSDD090.

106
Figure II-12 Examples of veins with visible gold at the Wassa mine. A) Folded QV1 quartz vein with visible gold. Note the folding increases the
thickness of the vein. Drill hole 242DD029 180.6-181.6 66.8 g/t Au. B) QV5 quartz carbonate vein axial planar to an F4 fold - the figure
shows a photograph of both sides of the drill core (i.e. the same vein is shown in top and bottom photograph). Visible gold is within black
circle drawn onto drill core. The gold-bearing vein clearly cross cuts the S4 foliation (note top photograph). Drill hole SEDD025 164.7-
165.3m 11.6 g/t Au.

107
3.3.4 Mineralisations
The gold mineralisation within the Wassa deposit occurs within highly strained rocks
within a sheared area that is hundreds of metres wide. It has been refolded several times with 5
phases of shortening recognized with three main phases of folding (D1, D4 and D5, summarized
in Fig. II-10) and two main phases of crenulation (D4 and D5). This deposit setting is reflected in
outcrop and drill core relationships with mineralisation occurring in intensely deformed rocks
that have a strong foliation (termed S4) with boudinaged veins (Fig. II-11A). Earlier isoclinal F1
folds occur and indicate that a transposition of the stratigraphy may have occurred (Fig. II-11B).
Later F4 and F5 folding of the dominant foliation occurs throughout the ore body (Fig. II-11A,
Fig. II-11C).
The first hydrothermal event (QV1) linked to gold emplacement occurred during the first
deformational phase (D1) and is inferred to be the main gold mineralising event, although gold is
also associated with the later deformation events. This phase of mineralisation is associated with
early QV1 veins that are commonly characterised by smoky to translucent quartz (Fig. II-11C,
Fig. II-11D) with ankerite-calcite-pyrite alteration assemblages associated with local
silicification and occasional tourmaline within the host rock. Other foliation-parallel veins are
quartz-ankerite. Pyrite associated with the QV1 quartz veins is fine grained and stretched along
the S4 foliation providing evidence for a pre to syn D4 emplacement of the sulphides
(Fig. II-11D). In some areas the rocks are hightly pyritized adjacent to QV1 veins (Fig. II-11E).
The boudinage, folding and transposition of the QV1 veins along the dominant S4 foliation
affects the continuity of the individual QV1 veins along strike (this is also evidence in the grade
distribution delineated from gold assays of drill core). F4 folding has also resulted in thickening
of the QV1 veins at fold hinges (Fig. II-12A).
Mineralisation is also associated with quartz-carbonate veins (locally termed QV5 veins)
that are milky-white to pinkish-white in color, associated with ankeritic, chloritic and potassic
alteration assemblages within the host rock. Some QV5 veins are sub-parallel to the S5
crenulation and located in the axial plane of the F5 folds (Fig. II-12B), crosscutting S1 and S4
foliations (Fig. II-12B) as well as older QV1 and QV4 veins. A minor remobilisation of the main
mineralisation associated with the late QV5 quartz veins in the Wassa mine is suspected to have
occurred during D5 or D6. Euhedral pyrite and few chalcopyrite grains have been observed
overprinting the S0-S1 and S4 cleavages (Fig. II-9B).
The gold distribution within the Wassa deposit is highly variable and visible gold is
spatially associated with early QV1 veins (e.g. folded example in Fig. II-12A) and also later

108
QV5 veins which clearly cross cut the dominant foliation (Fig. II-12B). Assays of 1 to 3 g/t are
common within rocks dominated by the ductile fabric (e.g. Fig. II-11A, Fig. II-11C, Fig. II-11D).
However, there is not always a direct correlation between quartz and gold grade within a given
drill hole intercept. This is inferred to not only reflect an original nuggetty grade distribution, but
also the effects of subsequent boudinage and folding post the emplacement of the QV1 veins that
affect grade continuity. This markedly complicates the resource modelling of the deposit. In the
original 2003 feasibility study Wassa was assigned a reserve of 23 million tonnes at 1.4 g/t for
over 1 million ounces of gold (Bourassa, 2003). However, in spite of the low grade assigned, the
Wassa deposit has many areas with veins that assay in excess of an ounce gold (e.g. Fig. II-12A)
and visible gold is a relatively common occurrence.
3.4 Structural geophysics
3.4.1 Geophysical data
Our field observations have mainly been carried out around the mine site where we got an
excellent overview of the structures. Outside of the mined area, the thickness of the lateritic
weathered layer approaches 15 meters, and the saprolite unit extends down to 50 m. Fresh rocks
are only exposed in the open pits. As a consequence, to create a geological and structural map of
the Wassa mine area, extensive use of geophysical data was required to extrapolate the mine
observation and interpretation to a larger scale.
Geophysical data were acquired in 2004 in two separate helicopter surveys, for the
northern and southern parts of the mine. Flight lines trending N135° were acquired with 75 m
and 50 m spacing, respectively, for the two surveys (Fugro logistics report, 2004). The data were
stitched and gridded together using a resolution of 25 m for both the radiometric and magnetic
data.
The total magnetic intensity (TMI) grid was created and reduced to the pole (RTP) using
Geosoft Oasis Montaj. The RTP was calculated using an amplitude correction to minimise visual
artefacts (Fig. II-13A). Other filtering and processing techniques included the analytic signal
(McLeod et al., 1993) which has been found to be particularly useful at low magnetic latitudes.
The resulting grids were further processed to enhance high intensity magnetic bodies and
structures, and to estimate the continuity of the structures at depth. The filters applied include the
first vertical derivative (Fig. II-14) Gunn et al., 1997; Milligan et al., 1997), upward

109
continuation, vertical integration (Fig. II-13B) and tilt derivative (Fig. II-13C, Verduzco et al.,
2004; Lahti et al., 2010)
The high resolution survey of the Wassa mine area also collected radiometric and radar
topography data. Radiometric data are composed of four bands representing K, Th, U and total
count proportions within the first half-meter of the ground. A ternary RGB image was produced
by combining these three channels (Fig. II-15).
Using the different signals available including the RTP magnetic grid, the radiometric
grids (K, Th, U and total count) and the digital elevation model, Principal Component Analysis
(PCA) images (Richards et al., 1999) were produced using Envi-IDL. They show different
homogenous domains and are interpreted to reflect lithological variations. The Wassa mine
provides a very strong signature on all input data because of the exposure of fresh rocks, a highly
varying topography and of course the mining equipment.
3.4.2 Petrophysical data
Magnetic susceptibility data were acquired during a regional study of Perrouty et al.
(2012) to help to constrain the magnetic data interpretation. Magnetic susceptibilities within the
Wassa mine have also been measured using a Geofyzika KT-5 Kappameter hand held
susceptibility meter and a Kappabridge KLY-3 susceptibility meter. Susceptibility values show
two distinct ranges (Fig. II-16): the first range with low susceptibility values corresponds to the
phyllites and felsic porphyry units. The second one is related to highly susceptible diorite and
metavolcanic rocks. The strongest magnetic response in the study area is found within the
metavolcanic Sefwi group hosting the Wassa mine and corresponds to the BMU which exhibits
magnetic susceptibility values 5 to 10 times higher than the host rocks with a mean value of
0.279 SI and anisotropies of up to 75 %. Bourassa et al, 2003 suggested that the magnetite could
have an exhalative or chemical origin which is consistent with the observation that most if not all
of the BMU occurrences seems to be parallel to bedding in the Wassa mine. This is confirmed by
thin-section observations of BMU showing that the magnetite marks the S0-S1 fabric. The BMU
was used as a marker horizon in the magnetic signal to interpret geology and structures from the
processed magnetic data.

110
3.4.3 Interpretations
The magnetic, radiometric and Principal Component Analysis (PCA) images were used
to constrain our interpretation of the main rock packages and to map out their boundaries.
Aeromagnetic images show magnetic domains and sub-linear features. The magnetic domains
are relatively homogenous areas in terms of magnetic intensity and texture. They are interpreted
as corresponding to specific lithologies or groups of lithologies. Linear features are defined
either by linear magnetic trends (e.g. BMU, dolerite dykes) or by discontinuities in the alignment
of magnetic trends corresponding to the presence of faults or shear zones that control fluid flow
leading to magnetite formation or destruction. Linear features can also have a sedimentary origin
and reflect the magnetic stratigraphy. This mapping methodology was also used by Metelka et al.
(2011) and Perrouty et al. (2012). Fig. II-17 is an interpretative map of both the lithologies and
the structures in the Wassa mine area.
The area with the highest magnetic response in the middle of the magnetic survey is
interpreted as the metavolcanic Sefwi group hosting the Wassa deposit (Fig. II-13). The low to
moderate intensity magnetic zone in the western part of the images correlates with potassium
poor Tarkwaian sandstones on the radiometric ternary image (Fig. II-15). In the south eastern
part of the area, the potassium rich domain with a weak thorium and uranium signal correlates
with a low response, uniform magnetic area. This is interpreted as a granodiorite intrusion which
was observed at two outcrops. The contact between the granodiorite and the Sefwi Group is seen
in the reduced to pole (RTP) image (Fig. II-13A). In contrast this contact cannot be clearly
identified on the vertical integration image (Fig. II-13B) which shows a low and decreasing
magnetic intensity towards the southeast. This suggests a possible very shallow dipping contact
between the Sefwi Group and the granodiorite (Fig. II-14B).
From the magnetic data a few high magnetic intensity dykes are interpreted, cross-cutting
all existing lithologies. The main N-S dyke observed on the eastern part of the magnetic maps
(Fig. II-13) seems to intrude along an existing fault or shear zones as suggested by a kilometre of
apparent displacement of the units across the dyke. According to previous regional mapping
(Agyei Duodu et al., 2009), these dykes have a dolerite composition, extend over hundreds of
kilometres and are less than 100 meters thick.

111
Figure II-13 Examples of processed magnetic data. Pixel size is 25 metres. Rectangle shows the location of Figure II-14 and of the Wassa mine. A)
Reduced to pole image (RTP) of the total magnetic intensity draped over the shaded first vertical derivative. B) Vertical Integration image
calculated from the analytic signal. C) Tilt derivative calculated from the RTP image. Apart from the dolerite dykes, the strongest magnetic
response in the middle of these images corresponds to the Sefwi Group hosting the Wassa deposit.

112
Figure II-14 Detailed magnetic lineament interpretation in the Sefwi Group. The area is located on Figure II-13. A) The left image is the first vertical
derivative after automatic gain control draped over the magnetic RTP image. This combination highlights subtle magnetic features and
keeps an overview of the magnetic field amplitude. Black lines are interpreted faults. B) The middle image show our interpretation with the
bedding folded by F1 and then refolded by F4 during D4 sinistral shearing. Brown dashed line on the south of the image represent the
contact (dipping southeast) between the Sefwi Group metavolcanics and a granodiorite intrusion. C) The right image is a schematic
interpretation of the D4 deformation in the Wassa mine area characterised by a NNW-SSE shortening. Kilometre-scale F4 folds in the
Wassa mine area could have been formed to accommodate sinistral large scale shearing along the Sefwi Group/Tarkwa Group eastern
contact.

113
Figure II-15 This image shows a combination of the K, Th and U bands as an RGB ternary draped over the shaded digital elevation model. The
potassium-poor area in the western part of the image correlates with Tarkwaian metasediments. In contrast the potassium-rich domain in
the southeast corresponds to a granodiorite intrusion. The Birimian supergroup from the northeast (Kumasi Group) to the south (Sefwi
Group) shows intermediate K, Th and U proportions. Pixel size is 25 metres.

114
Figure II-16 Histograms showing measured susceptibilities for each dominant lithology found in the Wassa mine area. The “Mafic volcanic”, “felsic
volcanic” and “metadiorite” display high susceptibility values. The “Phyllites” (excepting the BMU) and the “Felsic porphyry” are low
susceptible.

115
Figure II-17 Lithological and structural interpretation of the Wassa mine region based on interpretation of airborne geophysical data and mine
observations.

116
In the Sefwi Group hosting the Wassa mine, the highly magnetic trends are interpreted to
represent the orientation of the BMU layers with orientation assumed as equivalent to the S0-S1
cleavage. These highly magnetic BMU layers are deformed by large (100 m) scale F1 isoclinal
folds that can be identified on the first vertical derivative image after Automatic Gain Control
processing (AGC, Fig. II-14). The trace of these F1 folds axial surface are folded by a kilometre-
scale F4 as observed in the magnetic image. The D4 shortening event also developed multiple
sinistral strike-slip shear zones mostly located along the contact between the Birimian
Supergroup and the Tarkwa Group. These shear zones are interpreted from the magnetic data and
are evidenced by truncations with or without apparent displacement of magnetic trends
(Fig. II-14) The magnetic gradients observed at the location of the shear zones suggest that they
are sub-vertical or steeply dipping to the west.
3.5 Discussion
The structural interpretations integrating field observation and geophysical data around
the Wassa mine mirror the regional Ashanti Belt Paleoproterozoic evolution (Perrouty et al.,
2012). Although all of the regional deformation events have been identified, the D1, D4 and D5
events correspond to the most significant deformation events in the mine area (Table II-2). The
Wassa mine appears to be a particular deposit in southwest Ghana in terms of Eoeburnean
(2190 – 2140 Ma) timing for the main hydrothermal event. In contrast, the giant Obuasi gold
deposit (60 million ounces) and the Damang deposit (8 million ounces) developed during the
Eburnean phase (2130 – 2070 Ma). These three major deposits represent distinct examples of the
different structural contexts of hydrothermal gold mineralisations in the southern Ashanti Belt.
Their comparison (Table II-3) infers the relationship between deformation and mineralisation
during the Eburnean Orogeny.
3.5.1 Wassa-type mineralisations
Deformation at Wassa was associated with formation of quartz veins (Fig. II-6, II-7, II-8),
carbonates (ankerite and rare calcite) and sulphides (pyrite and rare chalcopyrite). The main
hydrothermal event resulted in mostly low-grade gold mineralisation (Table II-2), characterised
by gold-bearing pyrites elongated within the S0-S1 fabrics (Fig. II-8), folded by isoclinal F1
folds and then partially concentrated in F4 hinges (Fig. II-9A). 3D visualisation of Au assay data
illustrates the distribution of mineralised horizons in the Wassa mine area (Fig. II-18). Gold
mineralised layers follow a series of F1 folds refolded by the D4 event. These observations

117
suggest that the main hydrothermal event in the Wassa mine was associated with the early stage
of the Eoeburnean D1 deformation, maybe in the form of bedding parallel veins, as has been
reported in other fold related vein systems (Jessell et al., 1994).
Figure II-18 Spatial distribution of Au Assay data. A) Geological map of the Wassa mine
(modified after Bourassa, 2003). B) 3D distribution of Au assays data viewed from
above with gold grade > 0.5 g/t. Red color represent the highest gold grade, blue the
lowest. The highest gold grade outlines specific horizons which have been
preferentially mineralised and then folded by F1 and refolded around the large F4
fold hinge.

118
Table II-2 Summary of Wassa mine structural and hydrothermal evolution.
Table II-3 Summary of Wassa mine interpretation and its correlation with Allibone et al.
(2002a) study in Obuasi mine and Tunks et al (2004) in Damang mine. Shaded cells
indicate the main mineralisation events.

119
3.5.2 Comparison with the Obuasi-type structures and mineralisations (Ashanti Belt)
The Obuasi mine is located along the Ashanti fault close to the contact between the
Kumasi Group and the Tarkwa Group on the western side of the Ashanti Belt. According to
Allibone et al. (2002a) five successive events deformed the Obuasi mine area during Eburnean
stage (Table II-3). The D3 event (nomenclature of Perrouty et al., 2012) at Obuasi mine
corresponds to the development of the Ashanti thrust fault and to a series of folds resulting from
NW-SE shortening. These characteristics are in good agreement with F3 folding in the north
(Kumasi Group metasediments in the Akyem Basin) and in the west (Tarkwa Group) of the
Wassa mine and by a major fault marking the contact between these post-Eoeburnean
metasedimentary groups.
The most significant structural correlation between the Wassa and Obuasi mines can be
made for the D4 event. Allibone et al. (2002a) described hectometre scale F4 folds and a series
of sinistral strike-slip shear zones. Most of these shear zones have been formed before the D4
event but are not folded by F4. They explain this contradiction with a possible continuing
deformation developing both the folds and the shear zones. We interpret a similar relationship
between folding and shearing at Wassa mine: the D4 event produces a series of sinistral shear
zones in the Sefwi Group and along the eastern border of the Tarkwa Basin. This was followed
by kilometric-scale folding resulting in NNW-SSE shortening. This shortening direction is in
good agreement with a sinistral movement along the shear zones. We propose that the macro-
scale F4 folding in the Wassa mine formed synchronously with sinistral shearing where drag
folds developed locally to accommodate the displacement produced by the shear zones
(Fig. II-12C).The Obuasi and Wassa mines are the two sites in the southern Ashanti Belt where
F4 folding has been clearly identified, although D4 is expressed in numerous places as an S4
crenulation cleavage (Perrouty et al., 2012). The hypothesis of a local F4 folding event
accommodating sinistral shearing is able to explain both the presence of these rare and isolated
folds and their asymmetrical disposition, always on the east side of the shear zones in Wassa
(Fig. II-12C).
Three major generations of quartz veins were observed in Obuasi mine by Allibone et al.
(2002a). The first generation is bedding parallel, strongly boudinaged and has been produced
early during the regional kilometre scale F3 folding. Allibone et al. (2002a) proposed that no
major mineralisation was associated with these early veins. This first vein generation in Obuasi
mine is contemporaneous of the non-mineralised QV3 quartz veins that have been observed
around Wassa mine. The second quartz veins generation in Obuasi mine contains high grade of

120
gold and occurred in dilatant fractures in hectometre scale F4 folds during shearing. They
correspond to the major gold and sulphide (mainly arsenopyrite) bearing hydrothermal event at
Obuasi mine (Table II-3). In contrast, contemporaneous QV4 veins in Wassa mine are not linked
with a major mineralisation event. The third generation of quartz veins presents only small
amounts of gold and sulphides which could result from a late remobilisation of the pre-existing
mineralisation in Obuasi mine (Allibone et al., 2002a). This last event could be synchronous with
QV5 veining and with euhedral pyrite and chalcopyrite mineralisations overprinting S4
crenulation cleavage in Wassa mine.
3.5.3 Comparison with the Damang-type structures and mineralisations
The Damang mine is located on the eastern side of the Ashanti Belt close to the contact
with the Sefwi group, and is entirely hosted in the Tarkwa metasedimentary group.
Consequently, as for the Obuasi deposit, the host rocks of the Damang mine have been deformed
only during the Eburnean stage. All of the corresponding deformation events found in the Wassa
region are also expressed at the Damang mine (Table II-3). According to Tunks et al. (2004), the
Damang major structures correspond to kilometre scale open to close folds resulting from a
NW-SE shortening similar to our F3 folds observed in Kumasi and Tarkwa groups around Wassa
mine. The next event in Damang mine (our D4) developed minor folds and faults under a NNW-
SSE shortening.
Late deformation in Damang (our D5) is characterised by metre-scale open folds
associated with a sub-horizontal crenulation cleavage, with NNE-SSW lineations and fold axis
and with thrust faults oriented NNE-SSW (Table II-3). Tunks et al. (2004) described two quartz
veins generations that have developed during and after this event. Their first set of veins is
shallowly dipping and related to thrust fault development. They are associated with pyrite and
main gold mineralisation. The second generation does not contain much mineralisation and
cross-cuts the previous thrust faults.
The late timing of the mineralisation in the Damang mine contrasts with the other
hydrothermal gold deposits of the Ashanti Belt. However, Tunks et al. (2004) proposed that the
Damang mineralisation may consist of a remobilisation of gold and sulphides from an older
hydrothermal source or from placers. Observation of late quartz veins that are also associated
with a remobilisation of the main mineralisation, in the Obuasi mine (Table II-3, Allibone et al.,
2002a) and in Wassa mine (QV5 veins and euhedral pyrite and chalcopyrite), suggest that these
late Eburnean “remobilisations” occurred contemporaneously during D5 in many place in
southwest Ghana.

121
3.5.4 Implications for mineralisation at the regional scale
The southern Ashanti Belt has been deformed during two main phases (Eoeburnean and
Eburnean) associated with magmatism and with multiple mineralisation events, characterised by
the Wassa-type (Eoeburnean age, hydrothermal), the Tarkwa-type (placer), the Obuasi-type
(Eburnean age, hydrothermal) and the Damang-type (late Eburnean age, hydrothermal).
Table II-3 summarizes the relative timing of deformation and of main mineralisation for the
three hydrothermal type gold deposits. The major mineralisations occurred at different timing
and structural context for these deposits and were always followed by some remobilisation
during late deformation event.
3.5.4.1 Carbonate alteration
All of the hydrothermal deposits in southwest Ghana are associated with carbonate
alteration of their host rocks. In the Wassa mine, a hydrothermal ankerite-calcite alteration is
related to early quartz vein formation and primary gold mineralisation. Numerous ankerite veins
stretched and boudinaged within the S1 foliation have also formed during this event. Mumin et
al. (1995, 1996) correlate the carbonate alteration of the basalt with the sinistral strike-slip
reactivation of the Ashanti fault (D4) followed by gold mineralisation in the Prestea and Bogoso
mines or in the Obuasi mine (Allibone et al., 2002a). Damang syn-D5 mineralisation is also
associated with sericite-calcite assemblages and with quartz veining (Tunks et al., 2004). These
studies show that the systematic presence of important carbonate alterations of the host rocks
developed in relation with the main gold mineralisations whatever the considered deposit in the
Ashanti Belt.
3.5.4.2 A Wassa-type deposit source of the gold for the placers
The Eoeburnean Wassa-type gold mineralisation is a possible candidate for the source of
the gold contained in the Tarkwa paleoplacer (over 40 Moz). (1) As deducted from field and
thin-section observations the main gold mineralisation in Wassa mine formed very early in the
tectonic evolution of the Ashanti Belt (Table II-2). (2) Sefwi Group lithologies at Wassa mine
are characterised by chlorite, carbonates, magnetite (in the BMU), tourmaline and pyrite and by
numerous quartz-ankerite veins. This mineral assemblage is consistent with studies by Sestini
(1973) and Hirdes et al. (1994) that described the presence of tourmaline, carbonates, hematite,
pyrite and chloritoids associated with the Tarkwaian quartz pebbles. Tarkwaian phyllites also
show intense cross-bedding marked by magnetite. (3) The Wassa mine is considered to be a low
gold grade deposit that is not usually favourable to make a source for placer. However, gold

122
distribution is very heterogeneous and some visible gold grain are present (nuggetty grade
distribution of gold as shown on Fig. II-12A).
Considering the relative ages, mineral assemblages and gold grades observed in the
hydrothermal Wassa deposit and in the Tarkwa placer, the Wassa-type Eoeburnean deposits
hosted by the Sefwi Group could be a potential source of gold of the Tarkwa group placers.
3.6 Conclusions
This paper represents the first published structural interpretation integrating field
observations and geophysical data of a major Eoeburnean gold deposit in southwest Ghana
(Table II-2). The Wassa mine exhibits multiple deformation events which are consistent with
those reported by Perrouty et al. (2012) at the regional scale. These deformation events are
associated with multiple hydrothermal events that characterise the Wassa-type, the Obusai-type
and the Damang-type quartz and carbonates veins, sulphide and gold mineralisation.
The Wassa Eoeburnean mineralisation is unusual in southwest Ghana as it developed
very early in the structural evolution of the belt. Gold-bearing pyrites observed in the S0-S1
fabric were strongly deformed during D1 macro-scale folding (pre-Tarkwaian). By its early-
timing and its associated mineral assemblage, this style of mineralisation constitutes a reasonable
candidate for the source of the Tarkwa placer gold.
Mineralisation that occurred during the Eburnean phase was regionally controlled by
major faults and shear zones with timing varying from syn-D4 in Obuasi to syn-D5 in Damang.
In the Wassa mine these deformation events were associated with late quartz veins generations
showing little mineralisation that may represent local remobilisation of earlier mineralisation.
3.7 Résumé du chapitre II
3.7.1 Introduction
La ceinture d’Ashanti héberge de nombreux gisements d’or hydrothermaux et de placers.
Comme l’ont mentionné de précédentes études (Allibone et al., 2002a), la plupart des gisements
hydrothermaux sont contemporains des grands cisaillements senestres (e.g. Faille d’Ashanti,
gisements de Prestea, Bogoso, Obuasi) de la seconde phase de l’Orogénèse Éburnéenne de
Bonhomme (1962). Toutefois, la présence de gisements de placers dans le bassin de Tarkwa,

123
plus anciens, nécessite la présence de minéralisations en or antérieures, d’âge Éoéburnéen.
Bourassa (2003) suggère que les minéralisations comme celles observées dans le gisement de
Wassa, potentiellement précoces, pourraient être à la source de l’or contenu dans les placers. Ce
second chapitre a pour but de caractériser les événements de minéralisations à la mine de Wassa,
de les inclure dans l’évolution structurale précédemment établie (cf. chapitre I) et d’établir des
corrélations avec les autres gisements connus tel Obuasi (60 millions d’onces).
3.7.2 La mine de Wassa
La mine d'or de Wassa se situe à 30 km au nord-est de la ville de Tarkwa, à l’est de la
ceinture d’Ashanti, dans le groupe de Sefwi. Au contraire de tous les autres gisements
hydrothermaux connus le long de la ceinture d’Ashanti, celui de Wassa ne semble pas être
localisé le long d’une zone de cisaillement majeure. Bourassa (2003) et McCandlish (2003)
décrivent un contexte structural complexe, avec notamment un pli d’échelle hectométrique, dont
la charnière est centrée sur la mine de Wassa. Ils mentionnent également la présence de plusieurs
épisodes de minéralisations associés à la formation de veines de quartz et à la précipitation de
sulfures.
3.7.3 Observations de terrain
Plusieurs lithologies peuvent être distinguées dans la mine de Wassa : des métabasaltes,
des métaandésites, des métavolcanosédiments (phyllites) et des métadiorites. L’analyse
minéralogique de ces lithologies indique des assemblages de quartz, de chlorite, de carbonates
(ankerite et calcite) et de rares feldspaths plagioclases avec des proportions légèrement variables
selon la roche considérée. De même, l’analyse géochimique montre une certaine similitude de
composition, en éléments majeurs et traces, entre ces lithologies. Le site de Wassa est également
parcouru de niveaux très enrichis en magnétite, appelés BMU (Banded Magnetic Unit). Ces
niveaux semblent être subparallèles à la foliation S0 – S1.
Les observations structurales conduisent à l’identification des phases de déformations
décrites à l’échelle régionale (cf. chapitre I). Les déformations dominantes à Wassa sont reliées
aux évènements D1, avec le développement de grands plis isoclinaux, D4 avec un plissement
majeur, de nombreux plis parasites, et une crénulation intense de la foliation S0 – S1, et D5,
marqué par une crénulation subhorizontale du clivage S4 et par la mise en place de plis couchés
d’amplitude et de longueur d’onde très variables suivant l’orientation des précédentes structures.
L’hydrothermalisme associé au début de la phase D1 (Éoéburnéenne) conduit à la
formation de pyrite et d’or, au contact des veines de quartz. Ces veines et ces pyrites sont

124
transposées, boudinées et plissées le long de la foliation S0 – S1. Les minéralisations plus
tardives, Éburnéennes, sont représentées par des pyrites et de rares chalcopyrites automorphes
recoupant la crénulation S4. Cet évènement tardif dérive d’une possible remobilisation de la
minéralisation principale à la mine de Wassa.
3.7.4 Géophysique structurale
L’interprétation des données géophysiques héliportées montrent clairement les relations
entre les déformations D1 et D4. Notamment, les données magnétiques mettent en évidence les
niveaux de BMU, supposés parallèles à la foliation S0 – S1. Ceux-ci sont plissés une première
fois par les plis isoclinaux F1 puis replissés par le pli F4. Plusieurs zones de cisaillements D4
parcourent également la région de Wassa. La formation du pli F4 majeur observé à Wassa
pourrait ainsi avoir été contrôlée par ces zones de cisaillement, pour accommoder le
déplacement.
3.7.5 Discussion
Cette étude met en évidence un troisième épisode hydrothermal au sud-ouest du Ghana,
caractérisé par le gisement d’or de Wassa. La minéralisation principale est associée à des veines
de quartz formées au tout début de la déformation D1, avec des concentrations en or qui
semblent être distribuées le long des plis isoclinaux F1. Il est suggéré que des minéralisations de
type Wassa, développées durant la phase Éoéburnéenne, pourraient, de par leur précocité, avoir
fourni l’or aux placers du bassin de Tarkwa. Les phases de minéralisations tardives sont
représentées par les gisements de type Obuasi (Allibone et al., 2002a, 2002b) et de type Damang
(Tunks et al., 2004). Les contextes structuraux de ces minéralisations Éburnéennes s’observent
également à la mine de Wassa où ils sont associés avec des remobilisations locales de l’or
précoce.

125
Chapitre III

126

127
Chapitre III
A new model for Paleoproterozoic crustal growth in southwest Ghana: an Eoeburnean
crustal source for the younger Eburnean granites
Abstract
New whole rock geochemical data were acquired on samples of igneous and sedimentary
rocks from the southern Ashanti Belt in southwest Ghana. Previously published dating and
overprinting relationships permit us to establish the chronology of the analysed granitoid
intrusions. New and published geochemical results supported by age data clearly show that two
distinct magmatic episodes (Eoeburnean, 2190 - 2140 Ma, Eburnean, 2130 - 2070 Ma) occurred
in southwest Ghana during the Eburnean Orogeny.
The first phase (Eoeburnean) produced calc-alkaline volcanism and numerous
Paleoproterozoic TTGs (mostly tonalite and granodiorite) within the Birimian Sefwi Group. Rare
Earth Element profiles show enrichment in LREE (high La/Sm and La/Yb ratios) and flat
profiles for the HREE (Gd/Yb ratio close to 1). Positive Ba anomalies and negative Ta, Nb and
Th anomalies are also observed. The second phase (Eburnean) formed more differentiated
intrusions, with granodiorite, granite and leucogranite compositions, that are hosted by the entire
Ashanti Belt (Sefwi, Kumasi and Tarkwa groups). These Eburnean granitoids contrast with the
Eoeburnean intrusions by their strong depletion in HREE (high Gd/Yb ratio).
Our proposed geodynamic model starts with a first Eoeburnean magmatic phase in a
subduction-related context (as has already been suggested by previous studies in West Africa)
that was associated with a significant deformation of the Sefwi Group, according to ages and
overprinting relationships. This magmatism and deformation caused thickening of the
Eoeburnean crust and metamorphism at depth. Thermodynamic modelling shows that partial
melting of garnet-bearing metamorphosed rocks with the composition of the Eoeburnean crust
can produce melts depleted in HREE with Eburnean granitoid major element geochemistry. This
mechanism of partial melting of a garnet-bearing metamorphosed lower crust may play an
important role in the generation of Archean / Paleoproterozoic granitoid intrusions.

128
4.1 Introduction
The Paleoproterozoic Birimian and Tarkwaian units that comprise the Ashanti greenstone
belt in southwest Ghana were deformed during the Eburnean Orogeny (≈ 2.1 Ga, Bonhomme,
1962) and are intruded by numerous granitoids. The geochemistry of Birimian rock assemblages
has been investigated by Dampare et al. (2008) in the Sefwi Group basalts, by Attoh et al. (2006)
in ultramafic rocks and by Asiedu et al. (2004, 2009) in the Kumasi Group metasediments. Many
studies performed geochemical analyses of the granitoids (Mauer, 1990, Loh et al.; 1999, John et
al., 1999; Yao et al., 2000). Mauer (1990) and Loh et al. (1999) integrate their geochemical data
into a regional scale interpretation and distinguish two types of granitoids: the belt-I-type and the
basin-S-type, depending on their location and geochemical characteristics. Klein et al. (2005,
2008) highlight two phases of magmatism based on age correlations with the South American
São Luís Craton (believed to be a small fragment of the West African Craton in northern Brazil).
A classification based on geochemical and petrological evolution of granitoids with time rather
than on the location within the belts or basins seems to be more appropriate according to the
histogram of ages (Perrouty et al., 2012) that clearly indicates two phases of plutonism.
Most of the previous studies in southwest Ghana described the belt-type tonalites and
granodiorites as Archean TTG analogue. However, although these Paleoproterozoic TTG display
a mineralogy similar to the Archean TTG (Moyen and Martin, 2012), they also display different
trace elements geochemistry patterns that clearly suggests a different geotectonic context for
their formation. This paper characterises the geochemical signature of the two phases of
granitoid magmatism, contributing to a better understanding of the magmatic evolution of the
Ashanti Belt during the Eburnean Orogeny and possible mechanisms of the Paleoproterozoic
continental crustal growth in West Africa.
Whole rock major and trace elements of various intrusions and their host lithologies were
analysed in southwest Ghana. Ages of all the analysed samples of intrusive rocks are constrained
by previously published geochronology as well as by the relative geochronology based on
overprinting relationships. The new data combined with previously published data show that
both the Eoeburnean and Eburnean (De Kock et al., 2011) phases of the Eburnean Orogeny of
Bonhomme (1962) developed magmatism specific to their respective tectonic contexts.

129
Figure III-1 Map of the southern Ashanti Belt. Eoeburnean granitoids intruded the Sefwi Group in the south and southeast of the Ashanti Belt.
Eburnean intrusions are found across the area with numerous intrusions found within the metasedimentary basins. Samples collected in the
study are reported on the map.

130
Figure III-2 Summary of granitoid ages, metavolcanic rock ages and deformation phases in
the southern Ashanti Belt.

131
Figure III-3 Photographs of granitoid outcrops: investigated granitoids were preferentially sampled in quarry (a) (c), along the coast (b) or in large
scale outcrops (d). Samples from mine sites were collected as far as possible from the main mineralised zone. (a) GH127B Granite with
tonalitic aureole and hosting numerous mafic xenoliths, overprint the D1 deformation of the Sefwi Group, Anibel village. (b) GH101
Granodiorite veins emplaced within the S3 foliation of the hosting garnet-bearing micaschist, east of Cape Coast. (c) GH118B Foliated
granodiorite, northwest of Cape Coast. (d) GH237 Leuco-granite, any visible deformation, west of Twifo-Praso.

132
4.2 Geological setting
4.2.1 Geodynamic context
The southwest of Ghana, in the southeastern West African Craton consists of a series of
greenstone belts oriented NE-SW separated by metasedimentary basins. These paleoproterozoic
terrains were strongly deformed and metamorphosed during the Eburnean Orogeny (2250 - 2050
Ma according to John et al., 1999, Ledru et al., 1994, Milesi et al., 1992, Bonhomme, 1962). The
Ashanti Belt and the bordering Kumasi and Akyem basins (Fig. III-1) consist of three major
stratigraphic groups known as the Sefwi, Kumasi and Tarkwa groups (Adadey et al., 2009).
Major lithologies correspond to gabbros, basalts, andesites, volcanosediments, micaschists,
phyllites, conglomerates and sandstones which have been intruded by numerous granitoids. The
Sefwi and Kumasi groups form the Birimian Supergroup (Kitson, 1928).
Both the structural study in the Obuasi mine by Allibone et al. (2002) and the regional
interpretation of Perrouty et al. (2012) separate the deformation events of the Eburnean Orogeny
of Bonhomme (1962) into two broad phases at 2190-2150 Ma (Eoeburnean) and 2130-2070 Ma
(Eburnean). These deformation phases correlate with two magmatic episodes as shown by the
granitoid age distribution (Fig. 2, Taylor et al., 1992; Hirdes et al. 1992, 1994, 1998; Davis et al.,
1994; Oberthür et al., 1998; Loh et al., 1999; Attoh et al., 2006; Feybesse et al., 2006; Agyei
Duodu et al., 2009). A similar evolution was also identified in northern Ghana by De Kock et al.
(2011).
The Eoeburnean and Eburnean phases correspond to six regional deformation (two
Eoeburnean and four Eburnean) and developed minimum of four gold mineralisation events
(Perrouty et al., 2012). The first deformation phase corresponds to a N-S shortening affecting
only rocks of the Sefwi Group, developing a series of isoclinal F1 folds with a subvertical S1
cleavage defined by mica alignment. Only a few Eoeburnean granitoids were intruded during the
D1 deformation (Loh et al. 1999).
The Kumasi Group sediments deposited during D2 extensional event related to a rifting
phase in northwest Ghana between 2148 and 2125 Ma (De Kock et al., 2011). The Tarkwa
Group sediments formed in response to the onset of D3 Eburnean shortening as proposed by
Feybesse et al. (2006).
Eburnean deformation affected both the Birimian and Tarkwaian Groups. D3 corresponds
to a NW-SE shortening event that developed large scale open folds with a subvertical crenulation
cleavage and major thrust faults including the Ashanti Fault (Milési et al., 1992; Feybesse et al.,

133
2006). The peak of metamorphism occurred during the D3 deformation at 2092 ± 3 Ma
(Oberthür et al., 1998) with temperature and pressure conditions reaching 500-650°C and
5-6 kbar, respectively (John et al., 1999; Schmidt Mumm et al., 1997). A second major Eburnean
deformation event reactivated previous thrusts with a sinistral strike-slip movement (e.g. Ashanti
Fault). This D4 shearing is associated with the development of hectometre scale folds (Allibone
et al., 2002). These folds may locally accommodate the displacement induced by the shear zone.
Most mineralisation takes place during D4 with a concentration of highest gold grade along the
shear zones, such as along the Ashanti Fault. Perrouty et al. (2012) also described two late
Eburnean deformation events, D5 and D6, which do not significantly affect the regional
geometries.
4.2.1 Sefwi metavolcanic group
The southern and southeastern parts of the Ashanti Belt are dominated by the Sefwi
Group (Adadey et al., 2009) and are composed of metavolcanic / metaplutonic rocks (basalts,
andesites and gabbros) and of micaschists, alternating with phyllites and volcanosedimentary
layers (Fig. III-2).
Dampare et al. (2008) and Attoh et al. (2006) geochemical studies agree with the
stratigraphy proposed by Sylvester et al. (1992), corresponding to a unique thick volcanic
sequence (3500 m of massive basalts with pillow lavas at the base) that overlay gabbros and
ultramafic rocks. Two types of volcanic rocks can be distinguished in the southern Ashanti Belt.
According to Dampare et al. (2008), type I basalts, found close to Cape Three Point, have a
tholeiitic affinity close to the calc-alkaline field. They are derived from a depleted mantle
melting and display Rare Earth Elements (REE) patterns enriched in light elements compared to
those of the Mid-Ocean Ridge Basalt (MORB). Pillow basalts observed near Dixcove (Butre
Beach, Loh et al., 1999) could also correspond to this type I. Type II volcanics consist of a calc-
alkaline fractional crystallisation suite producing basalts and andesites in an Intra-Oceanic Island
Arc context (Dampare et al., 2008). A few rhyolite occurrences mentioned by Loh et al. (1999)
illustrate a relatively high degree of fractional crystallisation. Dampare et al. (2008) proposed
that type I magma progressively evolved into type II from the east (Cape Three Point) to the west
(Axim). The available U/Pb zircon ages of metavolcanic rocks range from 2266 ± 1 Ma (Loh et
al., 1999) for the tholeiitic series to 2142 ± 24 Ma (Adadey et al., 2009) for the calco-alcaline
series. Consequently, the Sefwi Group “type I” tholeiitic volcanism is anterior to the first
plutonic phase identified in southwest Ghana (Eoeburnean) while the “type II” calco-alcaline
volcanism seems to be synchronous.

134
Rare ultramafic Sefwi Group rocks (peridotite, pyroxenite, harzburgite, dunite) have been
found in the northwest of Cape Three Point. This proposed ophiolitic suite was formed during
Eoeburnean deformation (Attoh et al., 2006). The Sefwi Group stratigraphy with ultramafic
rocks, gabbros, pillow basalts and volcanosediments may correspond to a pre-Eoeburnean
oceanic crust or to an oceanic plateau fragment (Attoh et al., 2006).
4.2.2 Kumasi metasedimentary group
The Kumasi Group is composed of alternating phyllites and volcanosediments that were
deposited within the Kumasi and the Akyem basins, either side of the Ashanti Belt. This
metasedimentary group corresponds to the Lower Birimian series of Junner (1940) and Milési et
al. (1992). U/Pb ages on detrital zircons indicate a maximum deposition age at 2154 ± 2 Ma
(Oberthür et al., 1998) for the Kumasi Group. The end of Kumasi Group deposition is
constrained by intrusions of Eburnean granitoids at 2136 ± 19 Ma (Adadey et al., 2009).
Geochemical analyses of the Kumasi Group metasediments from the Akyem Basin
(Birim Diamond field, Asiedu et al., 2004) and the Kumasi Basin (Konongo region, Asiedu et
al., 2009) have been conducted. These sediments are characterised by a ferromagnesian content
higher than average Paleoproterozoic crust indicating an important mafic component in their
source. Asiedu et al. (2004) suggest a local provenance for these sediments that probably derived
from both the Sefwi Group metavolcanic rocks and the Eoeburnean granitoids that intrude the
greenstone belts. Asiedu et al. (2004) also showed that the Kumasi Group have trace elements
features typical of the Archean sedimentary rock (low Th/Sc ratios, high Cr/Sc ratios). They
suggest that the Eoeburnean crust (Paleoproterozoic) of southwest Ghana which constitutes the
source of these sediments displays significant similarities with the Archean crust.
4.2.3 Tarkwa metasedimentary group
The Tarkwaian metasediments are composed of conglomerates, sandstones and phyllites
organised in four successive units known as the Kawere Group, the Banket Formation, the
Tarkwa Phyllites and the Huni Sandstones (Whitelaw, 1929; Junner, 1940; Kesse, 1985) with a
total thickness of more than 3000 metres. The Tarkwa Group is considered to have derived from
surrounding Birimian rocks as suggested by Birimian quartz and metavolcanic pebbles found in
the conglomerates (Hirdes et al., 1994). U/Pb and Pb/Pb ages obtained on detrital zircons (Davis
et al., 1994, Hirdes et al., 1994, Pigois et al., 2003) give maximum deposition age around 2107
Ma after re-examination of all available zircon data (Perrouty et al., 2012). The minimum

135
estimated age for the Tarkwaian deposition is constrained by Eburnean granitoid intrusions at
2097 ± 2 Ma (Oberthür et al., 1998).
4.2.4 Intrusive rocks
Many granitoids intruded both the metavolcanic and the metasedimentary groups during
the Eoeburnean and Eburnean orogenic phases (Fig. III-2). Their composition varies from
gabbro/diorites to K-rich granites, although most of them correspond to tonalite and granodiorite.
They commonly contain xenoliths of mafic rocks from the Sefwi Group.
Loh et al. (1999) classified these granitoids in two main categories called belt-type and
basin-type, which are also called G2 and G1 respectively by Mauer (1990). The belt-type group
includes the Prince’s Town, Dixcove and Ketan (Sekondi) I-type plutons, located in the southern
part of the Ashanti Belt. Dampare et al. (2005) suggested that these granitoids may have derived
from partial melting of the Sefwi Group metamafic rocks in a volcanic arc context. In contrast,
Mauer (1990) suggested a mantle source. Zircon dating give U/Pb ages around 2158.9 ± 3.6 Ma
(Attoh et al., 2006), 2171 ± 2 Ma (Hirdes et al., 1992) and 2174 ± 2 Ma (Oberthür et al., 1998)
for the three above mentioned plutons, respectively. According to Loh et al. (1999), the Ketan
pluton displays a penetrative foliation, unlike the Dixcove and Prince’s Town plutons, devoid of
any visible deformation. All of them intruded the Sefwi Group metavolcanic rocks (explaining
their initial ‘belt-type’ nomenclature) and are representative of Eoeburnean stage plutonism.
The basin-type granitoids mainly occurred in the Kumasi and Akyem basins. They
display S-type characteristics (Loh et al., 1999). They are less mafic than the belt-type granitoids
and display granodioritic and granitic compositions. The youngest intrusions are sometimes K-
rich. Mauer (1990) proposed two formation models: (1) a formation in situ by partial melting of
surrounding metasedimentary rocks, or (2) a formation by melting of metamafic rocks with
significant contamination by the upper crustal metasediments. The ages of the basin-type
granitoids correspond to the Eburnean orogenic episode, varying between 2136 ± 19 Ma (U/Pb
age on zircon, Adadey et al., 2009) and 2072 ± 1 Ma (U/Pb age on zircon, Agyei Duodu et al.,
2009).
4.3 Samples
Geochemical analyses were carried out on 21 samples of representative lithologies from
the southeastern part of the Ashanti Belt (Fig. III-1, Fig. III-3).

136
4.3.1 Intrusive rocks
The intrusive rocks samples represent various compositions ranging from gabbro / diorite
to leucogranite. They are related to both the Eoeburnean and Eburnean phases according to
previous dating and overprinting relationships.
4.3.1.1 Eoeburnean intrusions
Seven samples of Eoeburnean intrusive rocks were analysed. The mineralogy of
Eoeburnean granitoids consists of quartz, plagioclase, biotite, amphibole and rare clinopyroxene.
Chlorite, epidote and few muscovites were found in deformed and metamorphosed samples
(orthogneisses). GH517B is a small granodiorite intrusion located in the south of the Wassa
mine. It shows a penetrative foliation sub-parallel to the S1 cleavage of the surrounding host
rocks that attests to the Eoeburnean age of this intrusion. Many similar granodiorites and
tonalites have been reported along the coast by Loh et al. (1999), John et al. (1999) and Dampare
et al. (2005). GH502 occurs in the Sefwi Group micaschists, 15 kilometres south of Twifo-
Praso. It is a foliated orthogneiss with mica alignment (S1) related to D1 deformation event
(Perrouty et al., 2012). GH148 and GH134 correspond to the Dixcove tonalite dated at 2171.6 ±
1.9 Ma (U/Pb on zircon, Hirdes et al., 1992) and to the Prince’s Town granodiorite dated at
2158.9 ± 3.9 Ma (U/Pb on zircon, Attoh et al., 2006), respectively.
Sample GH127B is a granite found in the Biamankor Quarry, near Anibel village
(Fig. III-1, Fig. III-3a). This granite is undeformed and has a tonalitic aureole overlain in the
north by the Tarkwaian sediments. The Anibel granite cross-cuts the F1 folds and S1 cleavage
and could correspond to a late Eoeburnean / early Eburnean intrusion (Perrouty et al., 2012).
4.3.1.2 Eburnean intrusions
Eburnean granitoids are abundant in the sedimentary basins of Kumasi and Akyem but
only a few of them intruded the Sefwi Group metavolcanics. The three sampled Eburnean
granitoids are hosted by the Sefwi Group “Cape Coast” micaschists. Their mineralogy is mostly
quartz, plagioclase, K-feldspar, biotite and muscovite. The GH101A and GH118B granodiorites
(Fig. III-3b, Fig. III-3c) were found to the east and to the northwest of Cape Coast. They
correspond to massive granitoid veins and plutons crosscutting the S3 foliation (Perrouty et al.,
2012) and slightly boudinaged. Similar granodiorites in Cape Coast area have been dated at
2072 Ma ± 1 (U/Pb on zircon, Agyei Duodu et al., 2009). GH237 is a small (leuco)-granitic
intrusion located 10 kilometres west of Twifo-Praso (Fig. III-3d). It does not display any visible

137
deformation and crosscuts the main S3 foliation of the hosting micaschists. This intrusion has not
yet been dated but is likely to have a post-D3 Eburnean age.
4.3.2 Metavolcanics and metasediments
Two samples of metavolcanic rocks have been analysed. The mineralogy of these meta-
andesites is mostly chlorite, biotite, amphibole, rare pyroxene and quartz. GH503 has been
sampled 10 kilometres west of Benso. It corresponds to an andesitic layer interbedded within
Sefwi Group volcano-sediments. GH245 is a 100m-scale xenolith of strongly deformed andesite
in an undeformed Eburnean granodiorite intrusion hosted by the Kumasi Group metasediments
of the Akyem Basin overlying the Sefwi Group 5 kilometres north of Twifo-Praso.
Sefwi Group metasediments were sampled in four locations in the southeast of the
Ashanti Belt. GH101B is a garnet-bearing micaschist intruded by Eburnean granitoid and
collected near Cape Coast. GH504 and GH515 correspond to volcano-sediments composed
mostly of quartz, chlorite, biotite and scarce muscovite (Phyllites). Sample GH504 is weakly
deformed and affected by syn-sedimentary normal faults. It is located 15 kilometres west of
Benso. Sample GH515 was collected in the Damang mine.
Five samples of metasediments were collected in the Tarkwa Basin. GH297, GH397 and
GH511 correspond to phyllitic layers with cross-bedding marked by magnetite concentrations.
GH397 and GH511 come from the Damang gold mine. They were affected by contact
metamorphism due to dolerite sill and dyke intrusions and are composed of quartz, staurolite,
garnet, chlorite, biotite and muscovite mineral assemblage. In contrast, GH297 found near
Tarkwa Town contains only quartz, chlorite, biotite and muscovite. GH079 and GH512 are
sandstone samples taken in the Banket Formation near Tarkwa town and Damang mine,
respectively.
4.3.3 Analytical methods
Geochemical compositions of the previously described rock samples were analysed at the
A.L.S. Mineral laboratory, Sevilla, Spain. Analytical methods and detection limits are described
on their website (www.alsglobal.com): whole rock measurements were performed using ICP-
AES for major elements (ME-ICP06 and OA- GRA05 methods, ALS Minerals, 2006a) and base
metal (ME-4ACD81, ALS Minerals, 2009); trace elements including Rare Earth Elements
composition were measured by ICP-MS (ME-MS81 and ME-MS42 methods, ALS Minerals,
2009, 2006b). All geochemical data are presented in Table III-1.

138
Table III-1A

139
Table III-1B Geochemical data for (A) granitoid and (B) metavolcanic and metasedimentary
samples from the southern Ashanti Belt.

140
4.4 Geochemical results
4.4.1 Metamorphism, hydrothermal alteration and weathering
The Ashanti greenstone belt is known to have been significantly metamorphosed
(greenschist facies, John et al., 1999) and hydrothermally altered. The intensity of this alteration
is variable depending of the initial mineralogy (e.g. the alteration of our samples seems to mostly
affect the mineralogy of the meta-andesites and of the metasediments while that of the granitoids
has been less modified). The most altered rock samples present high loss-on-ignition (LOI)
values (sometimes up to 20%) mostly caused by the presence of carbonates and hydrated
minerals, such as chlorite. The focus of this study being the magmatic evolution of the
investigated samples, we selected only samples with the lowest LOI proportion, thought to be the
less altered. For this reason, we do not assess in the present work the effect of metamorphism
and late (hydrothermal) alteration process on the investigated samples.
All southwest Ghana lithologies were affected by intense weathering resulting from warm
and wet climatic conditions in the area. Samples used in this study were preferentially collected
in mines (as far as possible from the main mineralisation zones), in quarries, in rivers or along
the coast to minimize this alteration.
4.4.2 Eoeburnean and Eburnean plutonism and volcanism
Major element geochemistry indicates that the Eoeburnean plutonic rocks present
heterogeneous compositions with SiO2 varying from 49 wt. % to 76 wt. % (average value of
67 wt. %, Table III-2A, Fig. III-4) while the Eburnean intrusions are overall more acidic with
SiO2 range from 65 wt. % to 79 wt. % (average value of 71 wt. %). The more mafic Eoeburnean
intrusions display whole rock geochemical compositions similar to those of the contemporaneous
andesitic volcanism. Eoeburnean and Eburnean plutonism display either S-type (Peraluminous)
or I-type (Metaluminous) characteristics on Shand’s diagram (1943), irrespective of their ages or
location within the southern Ashanti Belt (Fig III-5A).
The Eoeburnean intrusions vary from dioritic / tonalitic to granodioritic compositions.
They show a decrease of Fe2O3, MgO, CaO, TiO2 and P2O5 content with increasing SiO2 content
(Fig. III-4). Al2O3 versus SiO2 proportions show a smaller decrease. Na2O is not affected by
SiO2 variation while K2O content seems to increase.

141
Figure III-4 Major elements versus SiO2 diagrams for all southwest Ghanaian Eoeburnean
and Eburnean igneous rock analyses from this study (large symbols) and from
published data (small symbols) of John et al. (1999), Loh et al. (1999), Yao et al.
(2000), Dampare et al. (2005, 2008), Attoh et al. (2006) and Adadey et al. (2009).
Eoeburnean intrusions show differentiation series from diorite / tonalite to
granodiorite end-members (see text for details). Eburnean granitoids are more
homogenous with granodiorite, granite and leucogranite compositions.

142
Figure III-5 (A) A/NK versus A/CNK diagram of Shand (1943). Both Eoeburnean TTG and Eburnean granitoids present S-type and I-type
characteristics. (B) Sr/Y versus Y diagram (Martin, 1999). Eoeburnean TTGs Sr and Y proportions are consistent with actual granitoid
values while Eburnean granitoids are closely similar to the Adakite and Archean TTG with high Sr/Y ratios. C) Na2O, K2O, CaO ternary
diagrams. Eoeburnean TTGs seem to follow a typical calc-alkaline trend (Barker and Arth, 1976) while most of the Eburnean granitoids
are located in the TTG domain of Martin (1994).

143
Figure III-6 Trace element profiles for (A) the Eoeburnean TTGs and (B) the Eburnean
granitoids normalised to primitive mantle (Sun and McDonough, 1989). * Analyses
from Adadey et al. (2009), ** Analyses from Grenholm (2011), remainder of
analyses from this study. Radiometric ages from Hirdes et al. (1992), Attoh et al.
(2006), Oberthur et al. (1998), Adadey et al. (2009) and Scherstén (unpublished data
referenced in Grenholm, 2011).

144
Figure III-7 Metasediment geochemistry. (A) Plot of the K2O / Na2O ratio versus SiO2 /
Al2O3 ratio for Sefwi, Kumasi and Tarkwa group metasediments. * Average ratios.
(B) Trace elements profiles for the Sefwi Group and Tarkwa Group phyllites
normalised to the Early Proterozoic Crust (Condie, 1993). * Kumasi Group
metasediments profile is an average calculated from geochemical analyses of Asiedu
et al. (2004, 2009).

145
Eburnean granitoids (Fig. 4) have more homogeneous compositions corresponding to
granodiorite, granite and leucogranite which are very similar to those of the most differentiated
Eoeburnean intrusions. However, they display different trace element compositions.
Primitive-Mantle-normalised (Sun and McDonough, 1989) multi-element profiles are
useful to discriminate between the two groups of intrusions (Fig. III-6). The Eoeburnean TTGs
and andesites are characterised by HREE (Heavy Rare Earth Element) flat profiles with
enrichment levels depending on rock type (tonalites are less enriched than granodiorites) while
the Eburnean granitoids are strongly depleted and fractionated in HREE. Both Eoeburnean and
Eburnean granitoids are enriched in Light Rare Earth Elements (LREE) and display positive Ba
anomalies and negative Ta, Nb, Th and Cs anomalies. The Sr anomalies do not seem to be linked
with a specific phase of plutonism or with a specific granitoid composition.
The Sr/Y versus Y diagram (Fig. III-5B) is used to distinguish adakites and Archean
TTGs from post-2.5 Ga granitoids (Martin, 1999, Moyen and Martin, 2012). Adakites and
Archean TTGs usually present high Sr/Y values while the granitoids have lower Sr/Y ratios. In
contrast, analysed Paleoproterozoic samples from SW Ghana display opposite trend, with low
Sr/Y ratios for Eoeburnean TTGs and high ratios for the Eburnean granitoids. For our samples, a
similar variation (not shown here) is also observed on a La/Yb versus Yb diagram (Martin, 1999,
Moyen and Martin, 2012). On a K2O-Na2O-CaO diagram (Fig. III-5C), the Eoeburnean TTGs
seem to follow a typical calc-alkaline trend (Barker and Arth, 1976) while most of the Eburnean
granitoids are located in the TTG’s domain of Martin (1994).
4.4.3 Metasediments
Metasedimentary rocks in southwest Ghana belong to the Sefwi, Kumasi and Tarkwa
groups according to the stratigraphy of Adadey et al. (2009). Major element ratios show an
evolution from a Na-rich / K-poor composition for the oldest (Sefwi Group) to a Na-poor /
K-rich composition for the youngest (Tarkwa Group) metasedimentary groups (Fig. III-7A).
The multi-element profiles of these metasediments also show a compositional evolution
(Fig. III-7B). Sefwi Group phyllites are depleted in the most imcompatible trace elements while
the Tarkwa Group phyllites have composition more or less equivalent to the Early Proterozoic
Crust (2.5 – 1.8 Ga) of Condie (1993). Kumasi Group metasediments (Asiedu et al., 2004, 2009)
show intermediate composition. Sefwi Group phyllites are characterised by positive Ba, Sr and
Ti anomalies. These peaks are also typical of the Sefwi Group metavolcanic rocks corroborating
they might be the source of these sediments. In contrast these anomalies are less marked or even

146
inexistent in the younger Kumasi and Tarkwa groups. A more heterogeneous source needs to be
considered for them (perhaps both the Sefwi Group rocks and the Eoeburnean TTGs).
4.5 Pseudosection modelling
4.5.1 Methodology
Pseudosections of rocks from the different terrains of the southwest Ghana were
constructed using the Perple X software version 2007 (Connolly and Kerrick, 1987; Connolly,
2005, 2009), in the Na2O–CaO–K2O–FeO–MgO–MnO–Al2O3–TiO2–SiO2–H2O system, and
using the thermodynamic database hp04 of Holland and Powell (1998, revised 2004). For solid
solutions, we have used the internally consistent thermodynamic dataset termed solut_09.dat
(available at www.perplex.ethz.ch/).The solution models used for the pseudosections are as
follows: Bio(TCC) for biotite (Tajcmanová et al., 2009), Chl(HP) for chlorite (Holland et al,
1998), St(HP) for staurolite (Powell et al, 1998), Ctd(HP) for chloritoid (Holland and Powell,
1998), GlTrTsPg for amphibole (White et al, 2003 ; Wei et al, 2003), Gt(HP) for garnet (Holland
and Powell, 1998), Ilm(WPH) for ilmenite (White et al., 2000), hCrd for cordierite, Pheng(HP)
for phengite (Holland and Powell, 1998), MuPa for white micas (Chatterjee and Froese,
1975),melt(HP) (Holland and Powell, 2001), Pl(h) for plagioclase feldspar (Newton et al., 1980),
Kf for potassic feldspar (Waldbaum and Thompson, 1968), Opx(HP) for orthopyroxene (Holland
and Powell, 1996), Cpx(HP) for clinopyroxene (Holland and Powell, 1996), O(HP) for olivine
(Holland and Powell, 1998) and MF for magnesioferrite/magnetite. Pseudosections were built
using the bulk rock composition of each sample (Table III-2A) for H2O saturation conditions
corresponding to the LOI (loss on ignition) values.
Pseudosections built with fixed bulk rock compositions are widely used to estimate peak
pressure-temperature conditions where equilibrium can be assumed. However, this condition is
not fully achieved in metamorphic rocks undergoing phase fractionation during their prograde or
retrograde evolution. To solve this problem, it is useful to compute the initial stable assemblage
for the specified bulk composition [Start : 300°C] and increment the system's conditions along
the pressure and temperature path (Connolly, 2009). After each increment the program adapts the
composition of the system to simulate fractionation by removing the newly crystallised phases
and recalculates the new stable phase assemblage [Peak: 900°C]. The absolute molar
composition (mol) output at 900°C is particularly useful in fractionation calculations because the
difference between the final and initial compositions specified for the problem gives the

147
integrated composition of the fractionated phase. Such fractionation calculations are relevant
where the extraction of melt during burial of partially molten rocks is thought to have taken
place.
Here we propose to characterize the composition of melt produced by rocks at 900°C, the
temperature at which we expect a reasonable degree of partial melting of each considered
lithology regardless of the depth). The composition of melt corresponds to the sum of melt
increments released by the partially molten rocks, from the solidus up to 900°C. The melt
fractionation was depicted as a function of depth increase along two contrasted geothermal
gradients of 15 and 25°C/Km that would correspond to subduction and crustal thickening
environments, respectively (Table III-2B). A lithostatic pressure of 3.5-3.6 km per kilobar
(Spear, 1993) was used, accounting for the mafic and felsic composition of the Birimian crust,
and rocks of differing compositions were considered (i.e. sediment, granitoid, basalt and gabbro).
4.5.2 Modelling results
Fig. III-8 show the modal distribution of garnet for each Eoeburnean lithology depicted
as a function of pressure and temperature. This pseudosection modelling shows that all
Eoeburnean rock compositions can contain garnet before the start of partial melting considering
the probable range of geothermal gradients (< 30°C/Km). Consequently, melts produced from
each of these lithologies will be depleted in HREE (Martin, 1994).
Calculation of the major elements compositions of these melts (Table III-2B) indicates
that partial melting of any one of the Eoeburnean lithologies results in melt compositions unable
to fit those of the Eburnean granitoids (e.g. melts produced from gabbros and basalts are
deficient in K2O, those from granitoids in CaO and those from sediments in MgO, compared to
the Eburnean granitoids composition, Table III-2). Consequently, mixing between melts sourced
from all of these Eoeburnean lithologies need to be considered.
Melting of the metamorphosed Eoeburnean lithologies produced a large proportion of
H2O (more than 25 %, see hydrous melts calculated composition, Table III-2B). H2O is the most
“incompatible element” which may have been exsolved from the melt and then have percolated
through the rocks during the early stage of melting. Removing a large amount of this water from
the system during melting process, or before cooling and granite crystallisation, is a necessary
condition to get reasonable magma composition and to approach the composition (close to
anhydrous melt, Table III-2B) of the Eburnean intrusions (Table III-2A).

148
Table III-2A
Table III-2B (A) Average values of major element compositions for the Sefwi Group
metagabbros, metabasalts, metasediments and Eoeburnean TTGs. (B) Global melt
compositions extracted at 900°C for these lithologies (See text for details). *Best mix
to produce melts with the composition of the Eburnean granitoids.

149
Figure III-8 Evolution of garnet proportion in different lithologies as a function of pressure
and temperature (blue lines, wt. %). Pseudosections were computed on typical (A)
foliated granitoid (TTGs), (B) gabbro, (C) sediments and (D) basalt sampled in the
southern Ashanti belt region (Ghana). This diagram shows that all of the analysed
Eoeburnean lithologies can form garnet before reaching the solidus (thick red line)
whatever the considered geothermal gradient. Thin red lines represent the
percentage of melt. Calculations are for a CaTiMnNKFMAS system and for H2O
saturation conditions corresponding to the LOI (loss on ignition) values. See text for
details of model parameters.

150
Figure III-9 Schematic model of the evolution of the Paleoproterozoic crust in southwest Ghana. (A) During the first phase (Eoeburnean), the initial
basement (that may consist of an oceanic plateau) was deformed and intruded by the Eoeburnean granitoids in a subduction context.
Synchronous calc-alkaline volcanism built the upper layers of the Sefwi Group stratigraphy. (B) During the second phase (Eburnean), this
thickened crust was deformed and intruded by numerous granitoids. According to our geochemical analyses, these granitoids may results
from partial melting of a metamorphosed lower crust that is composed of both the mafic rocks and the Eoeburnean intrusions.

151
4.6 Discussion
Previous structural mapping (Perrouty et al., 2012) described two distinct phases of
deformation during the Eburnean Orogeny defined by Bonhomme (1962). These two phases can
be correlated with the Eoeburnean and Eburnean phases of magmatism (De Kock et al., 2011).
Compilation of a range of granitoid geochemical data from southwest Ghana (John et al., 1999,
Loh et al., 1999, Yao et al., 2000, Dampare et al., 2005, Adadey et al., 2009, Grenholm, 2011)
suggests that the belt-I-type and basin-S-type classification of Loh et al (1999) is not appropriate
to discuss the magmatic evolution of the intrusive lithologies (Fig. III-5A). This nomenclature
could be also confusing because of the occurrence of ‘basin’ S-type intrusions within the belts.
Interpretation and correlation of granitoid whole rock geochemistry as a function of their ages
provide new insights into the possible magmatic evolution of the Ashanti Belt.
4.6.1 Earliest Paleoproterozoic magmatism
The metamorphosed mafic series forming the base of the Sefwi Group are composed of
ultramafic rocks (the ophiolite suite of Attoh et al., 2006), gabbros and basalts. According to
Dampare et al. (2008) this series (their type I) corresponds to tholeiitic magmatism in a back-arc
basin setting resulting from the partial melting of a depleted mantle. This early magmatism could
equally have initiated growing as an oceanic plateau as proposed by Abouchami et al. (1990) and
Boher et al. (1992).
4.6.2 Eoeburnean phase
The Eoeburnean intrusions show a large range of major elements compositions (Fig. 4).
Their Fe2O3, MgO and CaO versus SiO2 ratios are typical of differentiation series from diorite /
tonalite to granodiorite end-members. However, these variations can also be explained by
different degrees of partial melting at the source of the intrusions. The associated decrease of
TiO2 and P2O5 along the differentiation suite can be explained by early crystallisation of ilmenite
and apatite minerals in the melt (Duchesne, 1999). A shallow decreasing trend (Fig. III-4C) is
observed for Al2O3 which could result from a possible accumulation of plagioclase. Plagioclase
crystallisation can also explain the lack of correlation between Na2O and K2O contents
(Fig. III-4G, III-4H) for the Eoeburnean TTGs.
Considering their trace elements profiles (Fig. III-6), the Sr/Y versus Y diagram
(Fig. III-5B) and the K2O-Na2O-CaO diagram (Fig. III-5C), the Eoeburnean TTGs clearly
presents different characteristics, and therefore formation context, compared to actual adakites
(Martin, 1999) and to Archean TTGs (Moyen and Martin, 2012).

152
Eoeburnean TTGs show calc-alkaline characteristics already identified for the
Eoeburnean Prince’s Town granodiorite by Dampare et al. (2005) who proposed a Cordilleran-
type origin for this intrusion. Trace element concentration (Fig. III-6A) displays positive Ba
anomalies and negative Ta, Nb and Th anomalies in both intrusions and coeval andesitic vocanic
rocks that also is consistent with subduction-related calc-alkaline magmatism (Wilson, 1989).
Similar granitoid ages and compositions were observed in the São Luís Craton in northern
Brazil. According to Klein et al. (2005, 2008) the calc-alkaline Tromaí intrusive suite are highly
enriched in LREE and HREE compared to the primitive mantle and their zircon ages vary
between 2168 ± 4 Ma and 2149 ± 4 Ma. These geochronological and geochemical characteristics
are remarkably similar to those identified in the Eoeburnean intrusive suites of southern Ghana.
A possible geodynamic context for the Eoeburnean plutonism would be a subduction
zone interacting with oceanic crust/plateau segments leading to the progressive growth and
accretion of volcanic island arcs (Fig. III-9A) as already suggested by several previous studies
(Sylvester et al., 1992; Feybesse et al., 2006, Baratoux et al., 2011). The expected magma
composition generated in this model, with partial melting of the mantle wedge above the
subducted plate, is consistent with the calc-alkaline signature of the Eoeburnean magmatism.
Similar major and trace element compositions of calc-alkaline metabasalt and meta-andesites
(type II) of Dampare et al. (2008) and the less differentiated members of the Eoeburnean
granitoids illustrate a possible similar origin (Fig. III-4).
According to the magmatic rock ages (Fig. III-2), the subduction zone may have been
active from approximately 2190 Ma to 2140 Ma (andesite units within the Kumasi Group
sediments dated at 2142 ± 24 Ma, U/Pb on zircon, Adadey et al., 2009), corresponding to the D1
deformation phase (Fig. III-2). During this D1 deformation phase, the Eoeburnean plutonism, the
contemporaneous volcanism and a significant degree of shortening (oriented N-S according to
Perrouty et al., 2012) led to thickening of the original oceanic lithosphere. By the end of the
Eoeburnean stage, a thickened proto-continental crust was built. It represents the Sefwi Group
basement for overlying Kumasi and Tarkwa basin formation. Asiedu et al. (2004, 2009) suggest
that these sedimentary basins formed by the erosion of the Sefwi Group. The volume of
Eoeburnean TTGs that reached the surface and was eroded increased with time, resulting in
higher K proportions in the later adjacent sediments (Kumasi and Tarkwa groups, Fig. III-7).
4.6.3 Eburnean phase
Eburnean intrusions correspond to granodiorite and granite batholiths that intrude both
the metasedimentary basins and the greenstone belts in southwest Ghana. Their major element

153
geochemistry do not show significant evidence of a differentiation series (Fig. III-4). Trace
element geochemistry shows a strong depletion in HREE (Fig. III-6B) that suggests a derivation
from partial melting of a garnet-bearing source (Martin, 1994). The Negra Velha granite that
intruded the Tromaí suite in the São Luís Craton around 2070 Ma displays similar patterns with
strong depletion in HREE (Klein et al., 2008). High Sr/Y ratios (Fig III-5B) usually characterise
adakites and Archean TTGs (Martin, 1999). The context of the formation of such rocks is still a
matter of debate. Some authors (Martin, 2005, Moyen, 2011) argue that most of the adakites and
Archean TTGs derive from partial melting of a subducted oceanic crust (Hypothesis 1, see
below). Other authors such as Smithies (2000), propose that Archean TTGs could be produced
by partial melting of a garnet-bearing lower metamafic crust previously thickened by orogenic
processes (Hypothesis 2, see below). These two hypotheses have also been proposed for Andean
adakites (Kay et al., 2002). In southern Tibet, Chung et al. (2003) show that adakites were
formed after melting of eclogites or garnet-amphibolites at the base of the continental crust.
Based on the steep HREE profiles of the Eburnean granitoids, partial melting of their
source must occur under metamorphic conditions where garnet was stable. Eoeburnean
lithologies in southwest Ghana correspond to metabasalts, metagabbros, metasediments of the
Sefwi Group and TTG intrusions. Their average compositions are given in Table III-2A. All of
these lithologies may have been buried during the late Eoeburnean or early Eburnean phases and
thus could constitute the lower crust of the Eburnean Orogeny. The modal distribution of garnet
within these chemically contrasted lithologies was first depicted as a function of pressure and
temperature, using pseudosection calculations (Fig. III-8). These P-T diagrams show that all of
these compositions produce garnet before the start of partial melting at geothermal gradients
varying between 15°C/km and 25°C/km. These gradients were obtained by P-T thermodynamic
modelling on Birimian metasediments in Ghana (Schmidt Mumm et al., 1997, John et al., 1999)
Burkina Faso, Niger and Senegal (Ganne et al., 2012) and are thus considered to be
representative of the Paleoproterozoic domain of the Leo-Man Craton. Table III-2B shows
possible melt compositions extracted from these lithologies at 900°C along geothermal gradient
at 15°C/km (that characterised subduction context) and at 25°C/km (that characterise melting of
thickened crust).
Hypothesis 1: subducted oceanic plate melting. In the case of subduction (geothermal
gradient of 15°C/km), the calculated melts at 900°C (Table III-2B) are highly deficient in iron
whatever the composition of the subducted crust. Other element proportions agree with the
composition of the Eburnean granitoids, including the potassium proportion assuming the
subducted slab is composed of 10 % metasediments. A subducted crust composed of

154
metagabbros, metabasalts and sparse metasediments is not able to produce average composition
of Eburnean granitoids.
Hypothesis 2: lower continental Eoeburnean crust melting (Fig. III-9B). Calculated melts
using geothermal gradients of 25°C/km show compositions that agree with the Eburnean
granitoids assuming mixing of melts derived from different lithologies. Magnesium and calcium
were provided by metagabbro melting, iron by both the Eoeburnean TTGs and the metabasalts
and potassium by Eoeburnean granitoids and metasediments. The best estimate of bulk melt
composition obtained by magma mixing corresponds to 50% of melt issued from metagabbro,
30% from Eoeburnean TTGs, 10% from metabasalts and 10% from metasediments
(Table III-2B). According to the percentage of partial melt at 900°C for each modelled lithology
(Fig. III-8), the source rock of this melt would have approximately the following composition:
67% of metagabbro, 20% of Eoeburnean TTGs, 9% of metabasalts and 4% of metasediments.
These proportions are consistent with the composition of the Eoeburnean deformed crust that
was mainly composed of metafragments of the older tholeiitic oceanic crust (or oceanic plateau),
of Eoeburnean TTG intrusions overlain by calc-alkaline metavolcanic rocks and of Birimian
metasediments.
Consequently, partial melting of the garnet-bearing base of the thickened Eoeburnean
lower crust could generate magma depleted in HREE with the composition of the Eburnean
granitoids. In that case, the positive Ba anomalies and negative Ta, Nb and Th anomalies, typical
of subduction context, could be inherited from the previous Eoeburnean magmatism. Melting
temperatures of 900°C before extraction of melt corresponds to a depth of 30-40 km for a
geothermal gradient of 25°C/km. These minimum depth values for lower crustal melting are
slightly lower than the minimum of 50 km proposed for adakites in southern Tibet (Chung et al.,
2003) and comparable to the 40 km for adakites in northern China (Xu et al., 2002).
4.7 Conclusions
According to new and previously published geochemical analyses, magmatism of the
southern Ashanti Belt evolved in two phases associated with previously defined deformation
events (Perrouty et al., 2012). The Eoeburnean TTGs and contemporaneous volcanic rocks
displays trace elements concentrations (normalised to primitive mantle) characterised by
significant enrichment in LREE, flat HREE profiles, positive Ba anomalies and negative Ta, Nb
and Th anomalies suggesting subduction-related calc-alkaline magmatism (Wilson, 1989).

155
The Eburnean phase formed numerous intrusions of granodiorite and granite depleted in
HREE with primitive mantle-normalised geochemical patterns characteristic of subduction,
possibly inherited from Eoeburnean magmatism. They also have fractionated normalised HREE
patterns and high Sr/Y ratios. This geochemistry is consistent with residual garnet in the source
(Martin, 1999). Thermodynamic modelling shows that partial melting of an Eoeburnean
thickened crust, composed mainly of metamafic rocks and Eoeburnean TTGs, could produce
melts with a geochemical composition corresponding to those observed for the Eburnean
intrusions.
Sediment composition varies from low-K composition for the Sefwi Group to medium
and high K for the Kumasi and Tarkwa groups. The enrichment in potassium reflects changes in
the Eoeburnean crust with increasing amounts of granitoid rocks exposed and eroded into the
sedimentary basins with time.
4.8 Résumé du chapitre III
4.8.1 Introduction
Les granitoïdes du sud-ouest du Ghana furent longtemps classés en deux groupes : type-I-
ceinture et type-S-bassin (Mauer, 1990, Loh et al., 1999) suivant leur localisation, sans prise en
compte des âges de ces intrusions. Les études de Klein et al. (2008) menées sur des granitoïdes
du craton de São Luís, au nord du Brésil (qui est supposé être un fragment du craton du Ghana)
semblent mettre en évidence une variation de la composition des intrusions en fonction de leur
âge. L’objectif de ce troisième chapitre est de caractériser les phases de magmatisme
Éoéburnéenne et Éburnéenne (De Kock et al., 2011) via la collection de nouvelles données
géochimiques complétées par les analyses et datations disponibles dans la bibliographie. Cette
étude propose un nouveau mécanisme de construction de la croûte continentale
Paléoprotérozoïque par la compréhension de l’évolution magmatique du sud-ouest du Ghana au
cours de l’Orogénèse Éburnéenne (Bonhomme, 1962).
4.8.2 Contexte géologique
La géologie du sud-ouest du Ghana se compose de trois groupes stratigraphiques d’âge
Paléoprotérozoïque (Sefwi, Kumasi et Tarkwa), formés de roches métavolcaniques et
métasédimentaires pénétrées par d’abondants granitoïdes. Cette stratigraphie fut intensément

156
déformée en six évènements développant des plis d’échelle régionale et des zones de
cisaillement le long desquelles se concentrent les minéralisations (cf. chapitre I).
4.8.3 Échantillons
21 échantillons de roche représentatifs de la diversité présente au sud-ouest du Ghana
furent analysés : 10 granitoïdes, 2 métaandésites, 4 métasédiments du groupe de Sefwi et 5
métasédiments du groupe de Tarkwa. Les compositions en éléments majeurs et en éléments
traces ont, toutes deux, été mesurées.
4.8.5 Résultats
Les granitoïdes reliés à la phase Éoéburnéenne, d’une composition de type TTG
(Tonalite, Trondhjemite, Granodiorite) présentent des spectres enrichis en terres rares légères
(LREE) et des spectres plats pour les éléments lourds (HREE), après normalisation par rapport
au manteau primitif. Bien qu’ils montrent également un enrichissement en terres rares légères,
les granodiorites et granites de la phase Éburnéenne sont caractérisés par des spectres très
appauvris en éléments lourds (HREE) et par de forts rapports Sr/Y. Granitoïdes et roches
métavolcaniques possèdent également des anomalies positives en Ba et négatives en Ta, Nb et
Th.
L’analyse géochimique des métasédiments montre une évolution de la proportion de
potassium au cours du temps, avec de faibles teneurs pour les métasédiments du groupe de Sefwi
contrastant avec de plus fortes valeurs pour les métasédiments Tarkwaiens. Les métasédiments
du groupe de Kumasi, affichent des teneurs en potassium (et des âges) intermédiaires.
4.8.4 Modélisation thermodynamique
Basées sur les compositions moyennes des lithologies caractéristiques de la croûte
Éoéburnéenne, plusieurs pseudo-sections furent calculées afin de mettre en évidence l’apparition
du grenat en fonction des conditions de température et de pression. Considérant des gradients
géothermiques raisonnables (15°/km et 25°/km), les compositions de magmas produits lors de la
fusion partielle de ces lithologies, à 900°C, ont été calculées afin d’estimer quelles seraient les
proportions respectives en éléments majeurs pour un granitoïde produit.
4.8.6 Discussion
Les nouveaux résultats associés aux données de la littérature montrent que les deux
phases de l’Orogénèse Éburnéenne ont formé un magmatisme distinct au sud-ouest du Ghana. La

157
première phase correspond à un magmatisme calco-alcalin typique des zones de subduction
(Wilson 1989) avec un volcanisme intense en surface et de nombreuses intrusions de TTGs,
entre approximativement 2190 Ma et 2140 Ma. Ce magmatisme, associé à une déformation
majeure au sud de la ceinture d’Ashanti, a contribué à un épaississement significatif de la croûte
Éoéburnéenne et a entraîné la formation de grenat dans les lithologies profondes comme le
montre la modélisation thermodynamique.
La fusion partielle de la base de cette croûte préalablement épaissie et métamorphisée
peut donc générer des magmas fortement appauvris en terres rares lourdes (Martin, 1999), avec
un héritage des signatures de subduction (Wilson, 1989). Les magmas produits sont de
composition similaire à celle des granitoïdes Éburnéens, si l’on considère un gradient
géothermique de 25°/km, en accord avec une croûte continentale épaissie et avec les données
métamorphiques du sud-ouest du Ghana. Ce mécanisme de fusion de la base de la croûte a pu
jouer un rôle important dans la génération de granitoïdes, à l’Archéen et au Paléoprotérozoïque,
contribuant ainsi à la croissance des croûtes continentales.

158

159
Chapitre IV

160

161
Chapitre IV
3D modelling of the Ashanti Belt, southwest Ghana, and lithostructural control on gold
occurrences within the Sefwi Group
Abstract
A new 3D model of the southern Ashanti belt was build using Geomodeller and Gocad
software and inverted by VPmg. This hybrid method allows to preserve the advantage of each
software: Geomodeller helps us to build a 3D geological model based on stratigraphic
relationships and bedding orientations, Gocad allows to easily enhance and complete the
Geomodeller-modelled surfaces, and VPmg allows us to invert for basin depth. Input data for
modelling include regional geological and structural map, geophysically constrained cross-
sections and petrophysical data (Perrouty et al., 2012).
The calculated base of the Tarkwa Basin displays an asymmetric profile being the deepest
close to the contact with the Ashanti Fault and most shallow on the eastern side of the syncline.
The north of the basin is also deeper than the south, a feature corroborated by field observations
and mapping. The average depth of the basin is around 3400 m, significantly deeper than
previous estimates.
The 3D modelling also highlights the lithostructural control on the location of gold
mineralisation within the Sefwi Group in the southeastern part of the Ashanti Belt. 85 % of the
gold mineralisation in this area is located less than 1500 m from one specific tholeiitic
metabasalt horizon in the stratigraphy which itself represents only 10 % of the Sefwi Group by
volume. All of the gold occurrences in the area are simultaneously located close (with an average
of 4 km) to a major fault (defined as being more than 50 km long). This 300 m thick metabasaltic
layer, more competent than the surrounding metasediments, may have controlled secondary
fracturing and acted as a focus for gold mineralisation near the major faults along which the
mineralising fluid were transported.

162
5.1 Introduction
The Ashanti greenstone belt in the southwest of Ghana is of significant economic interest
as it hosts numerous gold mines. These deposits formed during the Eburnean Orogeny
(Bonhomme, 1962): a major tectonic event affecting the West African Craton during the
Paleoproterozoic. Gold deposits are mainly located along faulted or sheared contacts between the
major stratigraphic groups (Birimian Sefwi and Kumasi groups, Tarkwa Group), such as the
Ashanti Fault that hosts the Obuasi giant gold deposit (over 60 million ounces of gold).
The base of the Tarkwa metasedimentary basin may be the focus of mineralisation as
suggested by observations of mineralisation on both sides. Knowledge of the shape and depth of
the base of this basin could present a significant economic importance in southwest Ghana.
Hasting (1982) and Barritt and Kuma (1998) estimate Tarkwa Basin thicknesses between 1500 m
and 2500 m depending on the location of their profiles. However, in their model they considered
the old and inverse stratigraphy of the Birimian Supergroup that disagrees with modern dating
and structural relationships (Adadey et al., 2009). Specifically they modelled a low density
metasedimentary group (Lower Birimian) below high density metavolcanics (Upper Birimian).
As a consequence, they may underestimate the depth of the Tarkwaian basin and some granitoids
geometries.
Many gold occurrences (and several deposits, Griffis et al., 2002) have been described in
the southeastern part of the Belt, within the Birimian Sefwi Group (Adadey et al., 2009). This
area where recently studied by Perrouty et al. (2012) who proposed a new stratigraphy of the
Sefwi Group. Using their new map, structural measurements and petrophysical data, we have
built a new three-dimensional model of the southern Ashanti Belt that was refined by inversions
based on both the gravity and the aeromagnetic data using the package VPmg (Fullagar et al,
2000, 2008). 3D modelling provides a means of exploring the sub-surface geometries of the
gold-rich faulted contacts and represents an aid to mineral exploration.
5.2 Geological setting
5.2.1 Stratigraphy
The Ashanti Belt is composed of three Paleoproterozoic stratigraphic groups and by
granitoids intrusions that are overlaid along the coast by Phanerozoic sediments. The Sefwi
Group (Adadey et al., 2009) consists of metamorphosed Birimian volcanics rocks interbedded

163
with volcanosediments, phyllites and micaschists. The Kumasi Group corresponds to Birimian
metasedimentary rocks (mainly phyllites) deposited in the Kumasi and Akyem Basins
(Fig. IV-1). The Tarkwa Basin is a metasedimentary sequence located on top of the Sefwi Group
and represents the bulk of the Ashanti Belt. It is composed of four sub-units known as the
Kawere Group, the Banket Formation, the Tarkwa Phyllites and the Huni Sandstones (Junner,
1940). Granitoids intrusions occurred in two stages called Eoeburnean (2200 - 2150 Ma, De
Kock et al., 2011) and Eburnean (2130 - 2000 Ma). These two sequences related to the Eburnean
Orogeny (Bonhomme, 1962) were linked with significant deformation of the host rocks.
Granitoids have mafic to felsic compositions varying from typical tonalite trondhjemite
granodiorite suites to granite. In the southern part of the belt, the Mpohor Intrusive Complex is
characterised by a gabbro/diorite/granodiorite assemblage related to the end of the Eoeburnean
magmatism.
5.2.2 Mineralisations
Over a hundred gold occurrences and deposits are hosted by the Paleoproterozoic rocks
that form the southern Ashanti Belt (Fig. IV-1). Most of the hydrothermal mineralisation is
located along the major Akropong and Ashanti faults to the northwest of the Tarkwaian
metasediments and are related to a sinistral strike-slip shear reactivation of the faults (Allibone et
al., 2002). Others, such as the hydrothermal deposits of Damang (Tunks et al., 2004), are located
along the eastern margin of the Tarkwa Basin. Perrouty et al. (2012) suggested that the whole
contact at the base of this basin may be mineralised. The Tarkwa Group also hosts some gold
placer deposits such as the Tarkwa placer (over 40 million ounces of gold).
Both structural and geochemical controls on gold mineralisation have been suggested for
deposits located along the Ashanti Fault (Prestea, Bogoso and Obuasi gold mines). These
deposits are hosted by the Birimian Kumasi Group phyllites and by the Birimian Sefwi Group
metabasalts. The initial modifications of the host lithologies correspond to greenschist facies
metamorphism related to the D3 shortening of Perrouty et al. (2102). Further circulation of
hydrothermal CO2 rich fluids along the Ashanti Fault and changes in the pressure-temperature
conditions are thought to have resulted in the formation of carbonate in the host rocks (Mumin et
al., 1996). Geochemical reaction occurred between sulphur form transported by these fluids and
Fe rich mineral in the host rock resulting in precipitation of pyrite and arsenopyrite. At the same
time, the loss in sulphur in the fluids caused a decrease of Au solubility (William-Jones et al.,
2009) resulting in precipitation of primary “invisible” gold (Mumin et al., 1994). A further D4
deformation event produce significant fracturing allowing remobilisation of the gold particles

164
and their further concentration. According to Allibone et al. (2002), D4 shear zones are the major
structures controlling the gold mineralisation localised along dilatational jogs at the Obuasi gold
mine.
5.3 Mapping of the Birimian geology beneath the Tarkwa metasedimentary basin
The recent structural study of Perrouty et al. (2012) produced a new stratigraphy of the
Birimian Sefwi Group. These units were affected by significant deformation before the Tarkwa
Group deposition. This previous work highlighted some buried structures observed in this Sefwi
Group, below the Tarkwa basin. Adding possible geological constraints at depth is a great aid in
building deeper 3D models of the Birimian and of the overlying Tarkwa Basin. Consequently, a
new map of the possible buried geology of the Sefwi Group has been produced (Fig. IV-1C).
The mapping methodology is similar to that used in Metelka et al. (2011) and Perrouty et al.
(2012), however, only magnetic images were used for mapping. Mapped “magnetic
susceptibility domains” were linked with geology away from the Tarkwa Basin by correlation
with regional geology mapping.
Several 3D modelling tests were conducted using the Noddy package (Jessell, 1981,
2001; Jessell and Valenta, 1996) which showed that the Sefwi Group structures below the basin
can be mapped using magnetic data assuming a reasonable (5 times) increase in susceptibility
between the basement lithologies and the Tarkwa Basin metasediments (Perrouty et al., 2012).
5.4 Geophysical datasets
5.4.1 Aeromagnetic data
Aeromagnetic data were acquired between 1994 and 1996 for the Geological Survey of
Ghana. The flight height of the survey is 80 m above ground, striking 135° with 200 meters line
spacing. The total magnetic intensity (TMI) data used for modelling and inversion was gridded
with a resolution of 100 meters. The Earth's magnetic intensity at the time of the survey was
around 31699 nT with inclination of -14.5° and declination of -6.5°. These values were used to
reduce the data to the pole (RTP) using amplitude correction to avoid artefacts and to produce
interpretable image for mapping. Multiple processing of the magnetic RTP grid such as the low
pass filtering and upward continuation were performed to highlight deep structures and to help
mapping of the Sefwi Group geology below the Tarkwa Basin.

165
Figure IV-1 A) West African Craton with the location of the study area. B) Map of the southern Ashanti Belt with the location of the major faults and
of the gold deposits. Black line outlines deposits hosted by the Sefwi Group that are detailed on Figure IV-8 and on Table IV-4. C) New
map of the Sefwi Group geology beneath the Tarkwa Basin.

166
Figure IV-2 Images of the free air gravity anomalies and of the total magnetic intensity data of the southern Ashanti Belt. A) The observed free air
gravity image (A) has a resolution of 2.5 arc minute per pixel (4.6 km). B) Total magnetic intensity image were gridded with a resolution of
100 m. Coordinates are in UTM (WGS 84), zone 30N.

167
The TMI image displays two major magnetic domains (Fig. IV-2B). The metasediments
from the Kumasi Basin on the northwest and the Sefwi Group micaschists on the southeast
present low intensity features with long wavelength variations. In contrast, the Ashanti Belt (the
Sefwi Group metavolcanics and the Tarkwa Basin) is characterised by intense magnetic
variations. Other significant magnetic objects are the NS dolerite dykes that extend across the
image and the Mpohor Mafic Complex in the south.
5.4.2 Gravity data
Gravity data have been sourced from the International Gravimetric Bureau (BGI,
http://bgi.omp.obs-mip.fr/) as a Free Air anomaly grid. This grid had already been processed
using the Pavlis et al. (2008) and Fullea et al. (2008) computation methods by the BGI. The
spatial resolution is 2.5 arc-minutes (approximately 4.6 km) per pixel. Many datasets were
combined to build this grid including Getech ground gravity data (African Gravity Project 1986-
1988, http://www.getech.com/history.htm), BGI ground and marine gravity data and satellite
data.
The Free Air anomaly image (Fig. IV-2A) show two main domains: the strong positive
anomaly on the centre to the northeast of the map correlates with the presence of thick high-
density metavolcanic units (Sefwi Group) in the Ashanti Belt. The homogenous area without
anomaly in the northwest part of the map correlates with the presence of Kumasi Basin
metasediments. The major gravity gradient between these zones coincides with the Ashanti Fault
marking the western border of the Ashanti Belt. The remarkable density contrast between the
two sides of the fault has been previously modelled in 2D sections by Barritt and Kuma (1998).
Hasting (1982) suggested the presence of a tectonic contact with massive post-sedimentation
vertical movement to explain this gravity contrast. However, kilometric scale movement along
the Ashanti Fault is contradicted by the absence of a jump in metamorphic grade between the
two sides of the fault (Allibone et al., 2002). Consequently, the depositional context can more
easily explain the regional geometry of the Kumasi Group than deformation can.
5.4.3 Petrophysical data
Previous studies published petrophysical measurements of density, magnetic
susceptibility and remanence for southwest Ghanaian lithologies (Perrouty et al., 2012; Hasting,
1978). We make use of magnetic susceptibility values acquired in the field using a Geofyzika
KT-5 Kappameter hand-held susceptibility meter resulting in a database of over 300 analyses
(Perrouty et al. 2012). Natural remanent magnetization (NRM) was measured on two samples of

168
dolerite using an AGICO JR5A spinner magnetometer, mounted within Helmholtz coil systems,
at the GET Magnetism Laboratory (Toulouse). Density values were measured on 26 small
(≈ 5 cm3) samples representative of rocks from the Ashanti Region after weighing in air and in
water at 24.5°C (Perrouty et al., 2012). Their resulting density are in good agreement with ranges
get in southwest Ghana (Hasting, 1978, on 150 kg of rocks), in Burkina Faso (Baratoux et al.,
2011) and with usual standard values established for equivalent lithologies (Milsom, 2003).
Figure IV-3 Schematic diagram showing the different steps used for the 3D modelling of the
Ashanti Belt (see text for details).
5.5 3D modelling of the Ashanti Belt
The geological 3D model of the southern Ashanti Belt was built in several steps
(Fig. IV-3): (1) an initial low resolution (LR) model representing each stratigraphic unit was
built and was inverted using gravity data to estimate the approximate geometry of the Tarkwa
Basin. (2) The new map of the possible Birimian geology beneath the Tarkwa Basin was
projected down onto the newly calculated base of the Tarkwa Basin. (3) The projected
lithologies contacts were used to build a new model with higher resolution (HR) that includes all

169
the layers mapped in the Sefwi Group and the dolerite dykes. (4) This HR model was then
inverted using gravity data.
The forward 3D model of the Ashanti Belt is an hybrid model built using two modelling
systems: Geomodeller (www.geomodeller.com) and Gocad (http://www.pdgm.com).
Gravity/magnetic inversions of the base of the Tarkwa Basin were run using VPmg
(http://www.mirageoscience.com).
5.5.1 Modelling packages
5.5.1.1 Geomodeller
The potential field method is used by 3D Geomodeller to calculate geological interfaces
as implicit surfaces (Lajaunie et al., 1997). This method determines what the potential is of a
point in the model volume belonging to a specific geological unit. Geological interfaces can be
determined by finding where the potential for one unit exceeds that of another, forming the
contact between the geological units (Calcagno et al. 2008). Three sources of geological
information are required before model calculation can take place: the location of geological
contacts for the units being modelled; strike and dip measurements describing the orientation of
the geological interface and a stratigraphic column. Faults can be calculated using the potential
field method if contact and orientation information are provided. Each modelled fault can be
attributed to stop on, or to cross-cut other faults and geological units.
5.5.1.2 Gocad
Gocad uses the discrete smooth interpolation method (DSI, Mallet, 1992). Each explicitly
modelled surface is determined by node locations with a resolution depending on the number of
these nodes. The surfaces are displayed by triangular facets linking neighbour nodes. Input data
to build a Gocad model can be: surfaces already created by other modelling software (e.g.
Geomodeller); point sets (e.g. elevation data) or curves (e.g. trace of dolerite dykes) interpolated
to make surface. Surfaces bordering geological regions were used to define the 3D model.
Geological/Geophysical properties were then assigned to each modelled volume. In this work we
used Gocad to enhance the model by adding some geological details that haven’t been modelled
in Geomodeller.
5.5.1.3 VPmg
The VPmg model is based on previously calculated Gocad modelled volumes that are
discretised into vertical rectangular prisms matching the topography on their top faces (Fullagar,

170
2000, 2008). The size of the prisms depends on the resolution of the model. Each prism preserve
the geophysical (density or susceptibility and remanence) properties of the Gocad volume.
VPmg proposes two mode of inversion to minimise the difference between observed and
calculated geophysical data (Fullagar, 2008). The first style inverts the petrophysical properties
of the modelled rectangular prisms (heterogenous inversion) or to the whole model (homogenous
inversion) keeping their respective geometry. The second style of inversion affects the size of
each prism (along Z axis) preserving the petrophysical properties within the prism.
Consequently, this geometry inversion modifies the shape of the surfaces defined by the base and
the top of each modelled geological prism.
5.5.2 Low resolution model of the Ashanti Belt
5.5.2.1 Geological modelling
The LR geological model of the Ashanti Belt covers an area of 160 by 160 kilometres to
a depth of 14 kilometres. Input data for Geomodeller are lithological contacts from the recent
mapping of the area (Perrouty et al., 2012) and bedding orientation measurements acquired in the
field. The general modelling methodology is described in Calcagno et al. (2008).
Surfaces representing the base of each modelled stratigraphic unit and granitoids were
imported into Gocad and used as input data to build a voxet model of the same area with a voxel
size of 1000 metres for the X and Y axes and 200 metres in the Z direction. Voxels from the
upper surface (from 0 to -200 m) were prolonged to fit the topography. The topography used is a
digital elevation model at 90 m resolution from the SRTM (Shuttle Radar Topographic Mission).
It has been re-gridded to match the model resolution. In southwest Ghana, the topography varies
between 0 and 470 m with less than 3 % of the area above 200 m.
5.5.2.2 Geophysical modelling
Input density values were calculating from samples density measurements of Perrouty et
al. (2012), Hasting (1978) and Baratoux et al. (2011). A homogenous mean density value was
assign to each modelled stratigraphic unit. These input densities were then refined by a first
inversion sequence using VPmg (Fullagar et al., 2008). Both homogenous and heterogeneous
density inversions were run for each modelled unit. This confirmed that the input ranges of
density were consistent with the values needed to fit the gravity data assuming constant initial
model geometry.

171
Table IV-1 Input and Calculated density values for the low resolution (LR) model compared
to the published density ranges of Perrouty et al. (2012) and Hasting (1978,
*unpublished report referenced in Barritt and Kuma, 1998).
Resulting gravity values and ranges of density calculated after inversion show some
correlations with the ranges of measured values (Table IV-1). However, significant differences
are observed for the Sefwi Group. The Cape Coast micaschists show higher density estimation
than the input value. Densities for this unit were based on only one measurement that may not be
representative of the mean density of the whole area covered by this lithology. Therefore, the
value calculated by homogenous inversion was assumed to be a more accurate estimation of the
density of this unit and was used for further inversions. Heterogeneous density calculations in the
Sefwi Group (metavolcanic) suggests the presence of a minimum of 3 lithologies with following
distribution: 4% below 2.7 g/cm3, 5% above 3 g/cm
3 and the rest around 2.78 g/cm
3 (peak of
density histogram). This distribution agrees with the regional mapping of the Sefwi Group
(Perrouty et al., 200) that found many metabasalts layers that alternate with volcanosediments,
rare phyllites layers (lower density) and gabbros bodies (higher density).
Using homogenous-inverted density values as the new input petrophysical data, a
geometry inversion of the LR model was run using VPmg to refine the shape of the base of the
Tarkwa Basin.
5.5.3 High resolution model of the Ashanti Belt
5.5.3.1 High resolution modelling
The HR model was built by adding the detailed geology of the Sefwi Group and highly
magnetic dolerite dykes to the LR model, and taking into account the new shape of the base of

172
the Tarkwa Basin. The new interpretation of the Sefwi Group beneath the Tarkwa Basin was also
use as input data for modelling. Mapped lithological contacts in the Sefwi group (Fig. IV-1) were
sampled with one point each 1000 meters and then geometrically projected on the inverted
surface defining the base of the Tarkwa Basin. Geometry inversion of the LR model using
gravity data indicates mean depths of the Tarkwa Basin around 2100 m which is compatible with
the modelling of the Sefwi Group structures. However, a few areas are deeper. Based on tests
using Noddy (Perrouty et al., 2012), mapping of the Sefwi Group is possible at 3000 m depth
assuming magnetic susceptibility contrast of 5 times or more between the Tarkwa Group and the
Sefwi Group lithologies. Only contacts projected at less than 3000 m depth were taking into
account and imported as 3D data into Geomodeller software.
After model computation using Geomodeller and importing of the modelled surfaces into
Gocad, a voxet model was created using a cubic voxel size of 200 metres for the X, Y and Z
axes. This HR model covered the same area as the LR one (160 per 160 km for a depth of
14 km). The use of Gocad allows us to significantly enhance the resolution of the voxel model
by faster calculation processes than Geomodeller and as a consequence, to be able to add some
thin geological bodies including dolerite dykes (assuming a thickness close to 200 m). We
wanted to include these dolerite dykes in the model because of their very strong signature in the
aeromagnetic data. Forward calculation or inversion of magnetic data is not possible without
taking the dykes into account. In contrast with regards to the low resolution of the gravity data
(5 km) the 200 m dykes thickness makes them negligible for gravity calculations using the LR
model.
5.5.3.2 VPmg forward-modelling
Petrophysical data has been added to this model using previously calculated homogenous
values for the large modelled units and measured mean densities for the different modelled
layers of the Sefwi Group and dolerite dykes. Susceptibility was added using measured mean
values for each lithology. We also take into account the magnetic remanence of the dolerite
dykes (measured in Perrouty et al., 2012). Table IV-2 summarizes the petrophysical data used in
the HR model. The geometry of the HR model was then inverted using gravity data. The final
inverted HR model of the Ashanti Belt is shown in Fig. IV-4. Fig. IV-5 displays horizontal
sections of the model at depth of 0, 1000, 2000 and 5000 m. These images show that some parts
of the Tarkwa Basin are still present at 5000 m depth. The geometry of the Sefwi group is mostly
constrained by bedding orientation data close to the surface and by gravity data inversions at
depth.

173
RMS errors between this final model and the gravity data were calculated over a square
of 140 km centred on the model area. The surface area was cropped by 10 km to avoid border
artefacts. Gravity modelling presents RMS of 5.41 mgal. The calculated gravity signature of the
model gives intensity of Free Air anomalies comparable to the data (Fig. IV-6). However, the
low resolution of the data (2.5 arc minute) can’t reproduce the short-wavelength gravity signal.
The Free Air gravity image calculated from the model displays some correlation with the
topography (that also correlates with lithologies in southwest Ghana). For more effective
comparison, the calculated gravity map was re-sampled at the location of ground gravity data
and then re-gridded to the resolution of the BGI map (Fig. IV-6). The total magnetic intensity of
the model was also calculated and compared to the data (Fig IV-7).
5.6 Results
5.6.1 Geometry of the Tarkwa Basin
The LR initial 3D model was built assuming a mean depth of 1700 m for the Tarkwa
Basin in agreement with previous estimations. Geometry inversion suggests a mean depth of
2100 m for the LR model which increases to 3400 m for the HR model. The 2D gravity-
constrained cross-sections of Barritt and Kuma (1998) suggest that the Tarkwa Basin geometry
correspond to an approximately “half-cylinder”. This hypothesis was also used for the LR
density model building. In contrast, the modelled surface after inversion, which represents the
base of the Tarkwaian basin, displays an asymmetric profile which is deeper close to the contact
with the Ashanti Fault and shallower on the eastern side (Fig. IV-5). Minimum depths are
observed to the south of the Tarkwa town where the Kawere conglomerates (the basal unit of the
Tarkwaian metasediments) are outcropping. Conversely the deeper areas correlate with the
presence of the Huni Sandstones (the upper Tarkwaian metasedimentary unit, Junner, 1940) on
the surface, even though the different sub-units of the Tarkwa Group haven't been modelled. The
highly mineralised Damang antiform and Epieso synform folds areas show maximum depths less
than 1500 m in a perimeter of more than 3 km from the Tarkwa Group / Sefwi Group contact. A
possible shift of around 1000 m height seems to be correlated with the Bogoso non-mineralised
shear zone striking N45 and cross-cutting the whole Tarkwa Basin. The Tarkwa Basin shows
depths that generally increase from the south to the north and from the east to the west over the
whole study area.

174
Table IV-2 Petrophysical data used in the high resolution (HR) model. S.G., Sefwi Group
(Birimian). * remanence data of the Neoproterozoic dolerite dykes oriented NS were
also includes in the model with remanence value of 3 A/m, inclination of -18° and
declination of 59°.

175
Figure IV-4 High resolution (HR) three dimensional model of the studied area after gravity inversions and recalculation using Geomodeller. Only
the Sefwi Group, the intrusive rocks and the major faults (grey) are shown. Eo. Eoeburnean granitoids, Eb. Eburnean granitoids, A.
Ashanti Fault, B. Benso Fault, C. Cape Three Point Fault. Coordinates are in UTM (WGS 84), zone 30N.
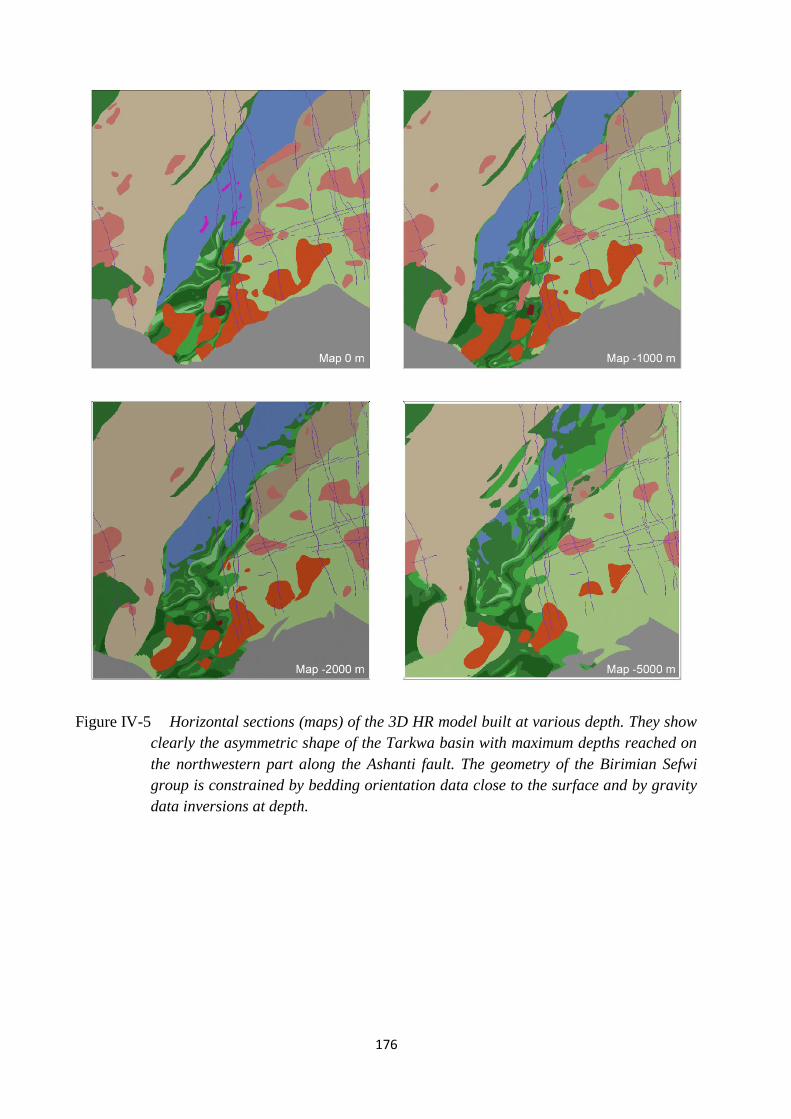
176
Figure IV-5 Horizontal sections (maps) of the 3D HR model built at various depth. They show
clearly the asymmetric shape of the Tarkwa basin with maximum depths reached on
the northwestern part along the Ashanti fault. The geometry of the Birimian Sefwi
group is constrained by bedding orientation data close to the surface and by gravity
data inversions at depth.

177
Figure IV-6 Observed (A), Calculated (B) and Residual (C) free air gravity map calculated after inversion of the 3D HR model. Lower images
represent Free Air gravity after sampling of the grids at the location of the ground gravity data point (BGI). These images show that the
HR model is geophysically consistent with the gravity data.

178
Figure IV-7 Observed (A), Calculated (B) and Residual (C) total magnetic intensity map calculated from the 3D HR model. The absence of
remanence data for the intrusive rocks (with the exception of the dolerite dykes) explains most of the difference between the observed and
the calculated images. However, most of the residual anomalies represent less than 10 % (< 100 nT) of the intensity range (≈ 1000 nT).

179
5.6.2 Correlation between the gold deposit locations and the modelled lithologies
The HR model includes all lithological details of the Sefwi Group on the southeast of the
Tarkwa Basin, using the stratigraphy proposed by Perrouty et al. (2012). The fault network in
this part of the belt is composed by three major interconnected strike-slip faults: the Ashanti
(over 200 km long); the Benso and the Cape Three Point faults (over 50 km long). Numerous
secondary faults were also developed in this highly deformed area. 21 hydrothermal gold
occurrences hosted by the Sefwi Group are referenced (Griffis et al., 2002) in the southeast of
the Ashanti Belt (Fig. IV-1, Fig. IV-8).
Using Gocad, we measured the shortest distance between each gold occurrence and each
of the modelled surfaces, both stratigraphic contacts and the major faults, in order to characterise
their spatial relationships. Over 85 % of the gold occurrence and deposits can be correlated with
the presence at short distance (< 1500 m) of the modelled location of a specific metabasalt
horizon which represents only 10 % by volume of the Sefwi Group (Fig. IV-8, Table IV-3). This
layer (called BV1) is one of the deepest units of the Sefwi Group according to Perrouty et al.
(2012) stratigraphy. Average distance between the gold occurrences and this BV1 layer is 550 m
considering the 85 % of occurrences in a radius of 1500 m. This average distance increases to
1090 m considering all of the gold occurrences in the area (Table IV-4). These gold occurrences
are also located at an average distance of 4300 m from one of the major regional-scale faults.
Proportion of gold deposits related to each modelled unit is shown on Fig. IV-9 and on
Table IV-3. A peak (18/21) is marked for the BV1 metabasalts and the number of deposits
decreases progressively for the upper layers of the stratigraphic pile. The modelled units located
deeper than the BV1 metabasalts do not host any gold deposits.

180
Table IV-3 Correlations between the Sefwi Group modelled geologynd the gold occurrences
in the southeast of the Ashanti Belt. The BV1 layer (shaded line) represents 10 % of
the volume and 7 % of the thickness of the Sefwi Group. More than 85 % of the gold
occurrences are located at less than 1500 m of this BV1 layer.

181
Figure IV-8 3D view of the BV1 layer (tholeiitic metabasalts) and major faults with the location of the gold occurrence in the southeast of the
Ashanti Belt. The BV1 layer is displayed down to 5000 m depth. Coordinates are in UTM (WGS 84), zone 30N. All deposits listed in
Table IV-4 are located on this figure.

182
Figure IV-9 Proportion of gold deposit at distance < 1500m from each modelled units. 18/21
gold deposits are located at short distance from the BV1 metabasalts layer. This
proportion decreases progressively for the upper stratigraphic layers.
Figure IV-10 Map of the distance between the topography and the BV1 metabasaltic layer. This
distance is displayed up to 3000 m.

183
Table IV-4

184
Table IV-4 List of the 21 gold occurrences and deposits known to be hosted by the Sefwi Group in the southeast of Ashanti Belt (after Griffis et al.,
2002). See Figure IV-8 for their location. Structural context and the distance to the BV1 metabasaltic layer are also shown.

185
5.7 Discussion
5.7.1 Depth of the Tarkwa Basin
The geometry of the Tarkwa basin calculated by inversion indicates that the depth of the
Tarkwa basin may locally be much deeper than the published estimations from field observation
(Whitelaw, 1929, Junner, 1940, Kesse, 1985, Pigois 2003) which suggest depths between
2000 m and 3000 m and estimation from 2D geophysical modelling (Hasting, 1982, Barritt and
Kuma, 1998) giving depths between 1500 m and 2500 m. At the location of their profiles, our
3D inversions indicate depths to the base of Tarkwa Basin are twice as deep. These authors
underestimate the depth of the Tarkwaian basin by modelling a low density metasedimentary
group (Lower Birimian) below high density metavolcanics (Upper Birimian), considering the old
and inverse stratigraphy of the Birimian Supergroup. The constrained cross-section of Perrouty
et al. (2012) also displays depth around 2500m. However their profiles are located in the
southern part of the Tarkwa Basin where it is less deep according to our 3D modelling
(Fig. IV-5).
5.7.2 Possible lithostructural control on gold mineralisation
The BV1 layer is composed by tholeiitic metabasalts from the Dixcove suite (Loh et al.,
1999) that alternate with rare and thin volcanosedimentary layers. Sometime pillow-lavas were
observed within this layer as on the Butre beach. The origin of the metavolcanics tholeiitic rocks
in southeastern Ghana is still debate. Some authors (Sylvester and Attoh, 1992, Feybesse et al.,
2006) argue that the metavolcanics results from volcanic arc accretion that precedes the
Eburnean Orogeny. Other Abouchami et al. (1990) and Boher et al. (1992) suggest that most of
the metavolcanics rocks derived from ancient oceanic plateau that collide during the Eburnean
Orogeny. Attoh et al (2006) proposed that the metavolcanic rocks from southwest Ghana
represent a fragment of an old oceanic lithosphere. Many studies (Groves, 2003) shown that
metavolcanic rocks are often hosting gold deposits in Archean and in Paleoproterozoic terranes.
As shown on Table IV-4, most of the gold deposits hosted by the Sefwi Group are located
within metabasaltic layers and were developed in relation with shear zones. The apparent
correlation between the location of the gold occurrence and the BV1 layer suggests that both the
tholeiitic BV1 metabasalt layer and the major faults have controlled the location of the gold
mineralisation in the southeastern part of the Ashanti Belt. This control may consist (1) in a
source of gold or (2) in a trap for mineralisations or both.

186
(1) The BV1 layer can be a source of gold that have been then mineralised within upper
stratigraphic layers. This hypothesis help to explain the distribution of the gold deposits within
the stratigraphy with a peak at short distance to the BV1 metabasalts, the absence of deposits for
the lower stratigraphic layers and the progressive decreasing of the gold deposit proportion for
the upper ones (Fig. IV-9) considering reasonable upward fluid transport.
(2) The BV1 layer could also be a trap for gold mineralisation. This thin (300 m)
tholeiitic metabasalt layer bordered by metavolcanosediments, that are less competent, could
give both a structural control on the mineralisation by developing secondary faults and a
chemical control as was proposed at the Ashanti Fault contact between metabasalts and
metasediments (Mumin et al, 1996). Higher proportion of gold deposit related with this BV1
layer may result from its location, close to the basement of the Sefwi Group stratigraphy (the
deepest metabasaltic unit according to Perrrouty et al., 2012).
Assuming that the BV1 metabasalts effectively control the location of the gold
mineralisation within the Sefwi Group, a predictive map of the distance between actual
topography and the BV1 layer can be built (Fig. IV-10). Areas closer to the BV1 layer may
present higher probability to host gold deposits.
5.7.3 Limits of the Ashanti Belt 3D modelling
The 3D models built in this study are based on regional mapping and structural
measurements and geophysically constrained cross-sections (Perrouty et al., 2012). Complex
geology modelling using Geomodeller is strongly limited by the software calculation process.
Geomodeller software on our systems had a maximum limit to the number of nodes it could
account for, and generating models with resolution above 3 million nodes was not possible. This
represents a spatial resolution of 500 meters for the southern Ashanti Belt HR model with 320
nodes along X and Y axis and 30 nodes along Z axis). For this reason, Geomodeller surfaces
were built in several stages and imported into Gocad to create the whole model. In addition,
some details of the 3D model that were not modelled using Geomodeller were added to the HR
model using Gocad such as the dolerite dykes.
The Geomodeller model generating process is an implicit system which places
restrictions on the amount of data that can be sensibly used, based on the frequency content
defined by the spatial resolution of the model. Particularly structural data in a given area are
often simplified and only one mean orientation is kept. Bedding orientations in southwest Ghana
depends on numerous folds generation and the use of mean orientation is often not the best way

187
to model these complex geology. It was necessary to delete some of the field data to keep
bedding orientations that defines only the major structures. At the same time, the addition of
artificial structural data at the border of the model was needed to force the model in some areas
and to avoid unconstrained artefact bodies that don't reflect the observed geometries.
Gravity inversions of the Tarkwa Basin suggest depths that are much deeper than
previous 2D modelling (Hasting, 1982, Barritt and Kuma, 1998). According to Junner (1940) the
base of the Tarkwaian stratigraphy is formed by more than 300 m of conglomerates from the
Kawere Group that are composed of granitoid, Birimian rock and quartz pebbles (average size
around 5 cm, Hirdes and Nunoo, 1994). Density of the conglomerates bodies hasn’t been
measured for evident problem of sampling. It is possible that the conglomerates density could be
lower or higher than the rest of the Tarkwaian units. The modelled base of the Tarkwa Basin also
displays greater depths, up to 9000 m close to the Ashanti fault. More than 20% of the Tarkwa
Group is below 5000 m depth after geometric inversion of the HR model. Possible Tarkwaian
lithologies and density at these deep areas are unknown. Consequently, Tarkwaian depth
estimations may be assumed to have error bars of ± 1000 m (15 %) assuming reasonable density
ranges.
The calculated Total Magnetic Intensity map calculated displays some significant
differences with the data although general overview of the image is similar (Fig. IV-7). This is
mostly caused by the presence of magnetic remanence in most of the model units that are not be
take into account for this modelling work (with the exception of the intense remanence values of
the dolerite dyke). High to medium remanence values probably need to be considered for some
of the Eburnean granitoids intrusions in the Cape Coast micaschists. Other major differences are
observed in the Kumasi Basin where magnetic properties are also less constrained. These areas
displays thick weathered cover and no major gold mine that limit the possibility of oriented
sampling of fresh rocks, needed for remanence measurements.
5.8 Conclusion
Based on regional geological mapping (Perrouty et al., 2012), on geophysically
constrained cross-section and on new mapping of Birimian geology beneath the Tarkwa Basin
(Fig. IV-1), a 3D model of the southern Ashanti Belt have been build using Geomodeller and
Gocad software. Multiple gravity inversions using VPmg were run to enhance the model
geometry. The final model (Fig. IV-5, IV-6) shows that the Tarkwa Basin could be locally twice

188
as deep as the previous estimation of Junner (1940) and of Barritt and Kuma (1998). The
thicknesses of the Tarkwa Group increase from the east to the west with deepest areas located
close to the contact with the Ashanti fault in the northwestern part of the study area.
The 3D modelling allows us to establish a correlation between the location of gold
occurrences in the southeast of the Ashanti Belt and a specific metabasaltic layer in the lower
part of the Sefwi Group. The 300 m thick BV1 layer and the major faults may have determined
the location of gold mineralisation as suggested by the presence of 79 % of the gold
mineralisation at less than 1500 m of the layer with an average distance of 565 m. This tholeiitic
metabasalt layer is probably more competent than the metavolcanosediments located on its both
side. Consequently it may have preferentially controlled secondary fracturing and gold
mineralisation with the major faults acting as the primary conduits of the transportation of
mineralising fluids.
5.9 Résumé du chapitre IV
5.9.1 Introduction
Ce dernier chapitre présente un modèle tridimensionnel du sud de la ceinture d’Ashanti,
réalisé de manière hybride au moyen des logiciels Geomodeller et Gocad, puis affiné par VPmg,
via l’inversion des données de gravité.
La cartographie régionale (cf. chapitre I) indique une répartition des gisements d’or le
long des contacts entre le bassin de Tarkwa et son socle Birimien. Il est supposé que l’ensemble
de la base des métasédiments Tarkwaiens pourrait être minéralisé (cf. chapitre I), d’où l’intérêt
de connaître sa géométrie. Les études précédentes montrent que le groupe de Sefwi consiste en
une stratigraphie complexe et déformée le long de la phase Éburnéenne. Plusieurs sites
minéralisés y sont référencés (Griffis et al., 2002). Établir des corrélations entre la localisation de
ces minéralisations, les lithologies du groupe de Sefwi et les emplacements des failles majeures,
via leur modélisation, représenterait une aide capitale pour de futures explorations.
5.9.2 Contrôles sur les minéralisations Éburnéennes
Parmi les nombreux gisements hydrothermaux du sud-ouest du Ghana, seuls ceux
localisés le long de la Faille d’Ashanti furent étudiés de manière approfondie (Allibone et al.,
2002A). Ces travaux montrent que des contrôles chimiques et structuraux ont permis leur
formation. Les fluides minéralisateurs circulant le long des failles majeures ont réagi avec

189
l’encaissant métabasaltique, résultant en la précipitation de sulfures et d’or primaire (Mumin et
al., 1994, 1996), qui fut remobilisé et concentré dans les fractures secondaires formées suite aux
grands cisaillements D4 (Allibone et al., 2002a).
5.9.3 Cartographie du Groupe de Sefwi sous le Bassin de Tarkwa
Il a précédemment été montré que la cartographie géologique du Birimien sous le bassin
de Tarkwa était possible, considérant une épaisseur de bassin inférieure à 3000 m pour un
contraste de susceptibilité d’au moins 5 fois, en accord avec les données pétrophysiques (cf.
chapitre I). Basée sur les données magnétiques aéroportées, après traitements pour faire
apparaître les structures profondes, de grande longueur d’onde, une carte de ces lithologies
enfouies a été réalisée afin d’apporter des informations complémentaires utiles à la modélisation
du groupe de Sefwi.
5.9.4 Données géophysiques
Des données de gravité (fournies par le Bureau Gravimétrique International) et des
données aéromagnétiques (acquises pour le Service Géologique du Ghana) furent utilisées lors
de cette étude pour la cartographie et les inversions des modèles.
5.9.5 Modélisation
La modélisation s’est effectuée en plusieurs étapes, via les logiciels Geomodeller, Gocad
et VPmg. La méthodologie utilisée par ces logiciels est décrite par Lajaunie et al. (1997) et
Calcagno et al. (2008) pour Geomodeller, Mallet (1992) pour Gocad et Fullagar (2000, 2008)
pour VPmg.
Le modèle 3D du sud de la ceinture d’Ashanti fut réalisé en plusieurs étapes. Dans un
premier temps, un modèle basse résolution (LR 1000 m par voxel), formé des principaux
groupes stratigraphiques et des granitoïdes a été construit, puis inversé au moyen des données de
gravité, afin d’obtenir une approximation de la forme de la base du bassin de Tarkwa. Dans un
second temps, la nouvelle carte du Birimien fut projetée sur cette surface basale (à l’exception
des parties à plus de 3000 m de profondeur), puis importée dans Geomodeller, pour être ajoutée
aux autres données géologiques et structurales. Les interfaces générées entre unités géologiques
furent exportées vers Gocad, et complétées par l’ajout des dykes de dolérites, afin de construire
un nouveau modèle 3D haute résolution (HR, 200 m par voxel), intégrant la stratigraphie
détaillée du groupe de Sefwi. La géométrie de ce modèle HR fut finalement améliorée par
inversion des données de gravité, sous VPmg.

190
5.9.6 Résultats
La surface calculée de la base du bassin de Tarkwa affiche un profil asymétrique avec de
fortes profondeurs à proximité du contact avec la Faille d’Ashanti et de faibles profondeurs sur
sa partie est. Le secteur nord du Bassin est aussi plus profond que la partie sud, comme cela est
aussi suggéré par les observations de terrain et la stratigraphie (Junner, 1940). La profondeur
moyenne du bassin est autour de 3400 m, soit près de deux fois plus profond que les hypothèses
des études antérieures (Hasting, 1982 ; Barritt et Kuma, 1998).
La modélisation 3D souligne un possible contrôle lithostructural sur la localisation des
minéralisations en or dans le groupe de Sefwi, au sud-est de la Ceinture d'Ashanti : 85 % des
minéralisations en or dans ce secteur sont localisés à moins de 1500 m (moyenne de 550 m)
d'une des couches modélisées. Celle-ci se compose de métabasaltes tholéiitiques sur une
épaisseur d’environ 300 m et ne représente que 10 % du volume modélisé du groupe de Sefwi.
Chacun de ces sites minéralisés se situe à proximité (moyenne de 4 km) de l’une des trois failles
majeures (de plus de 50 km long) mises en évidence par la cartographie. Il est proposé que ce fin
niveau de métabasaltes, plus compétent que les métasédiments environnants, pourrait avoir
contrôlé la formation d’une fracturation secondaire pendant la déformation et, ainsi, la formation
de minéralisations en or à faible distance des failles majeures, le long desquelles les fluides
furent transportés.
5.9.7 Limites de la modélisation
Les données géologiques et structurales collectées à l’échelle régionale ainsi que les
cartes et coupes réalisées (cf. chapitre I) furent utilisées pour la modélisation avec Geomodeller.
Cependant, les processus de calculs utilisés par ce logiciel ne permettent pas la prise en compte
de l’intégralité des données (notamment les mesures structurales autres que celles relatives au
litage S0) et limitent la résolution des modèles générés. Pour s’affranchir du problème de
résolution, les interfaces entres unités modélisées furent générées séparément et ensuite
assemblées avec Gocad.
L’inversion VPmg des données de gravité suggère que le bassin de Tarkwa est
localement plus profond que ce qui était préalablement estimé. Les lithologies Tarkwaiennes
profondes et leur densité sont inconnues, ce qui entraine une incertitude de l’ordre de 1000 m
(15 %) sur la profondeur maximale du bassin, si l’on considère une gamme de densités
raisonnables pour des métasédiments.

191
Bien que la signature magnétique du modèle ait pu être calculée, l’inversion VPmg des
données magnétiques n’a pas été possible, suite à l’absence d’information sur les propriétés de
rémanence des roches intrusives et en raison de temps de calculs par itération trop élevés.

192

193
Conclusions et Perspectives

194

195
Conclusions
Malgré de nombreuses précédentes études de la géologie sud-ouest du Ghana, certains
aspects de l’évolution Paléoprotérozoïque de la ceinture minéralisée d’Ashanti demeuraient
obscurs, en dépit de leur importance fondamentale pour la compréhension de la genèse des
gisements aurifères de cette région. Notamment, les déformations antérieures au bassin de
Tarkwa, et les possibles gisements d’or qui leur sont associés, ne furent jamais caractérisées par
les études antérieures, bien qu’ils fussent mentionnés par plusieurs auteurs comme éventuelle
source de l’or des placers Tarkwaiens.
Au cours de ce travail, il a été montré que l’Orogénèse Éburnéenne telle que décrite par
Bonhomme (1962) ne se limite pas à une simple phase orogénique s’étendant sur près de 200 Ma
mais peut être subdivisée en deux phases, Éoéburnéenne et Éburnéenne (De Kock et al., 2011).
L’étude structurale du sud de la ceinture d’Ashanti a mis en évidence 6 événements de
déformation distincts, via les observations de terrains et l’interprétation des données
géophysiques : aéromagnétiques, aéroradiométriques, gravité et radar. La première phase de
déformation identifiée (D1) s’est produite avant la formation des bassins Birimiens de Kumasi et
Akyem. Caractérisée par un raccourcissement N-S, elle développa des plis d’échelle
kilométrique dans le groupe de Sefwi (Adadey et al, 2009). Ce groupe principalement composé
de roches métavolcaniques Birimiennes, a ensuite été partiellement recouvert par le groupe de
Kumasi pendant la phase d’extension D2 et par le bassin de Tarkwa, formé au début du
raccourcissement D3 (NW-SE). La formation de ces bassins fut contrôlée par les failles majeures
telle la Faille d'Ashanti. Suite à la réinterprétations des âges des zircons détritiques du bassin de
Tarkwa (Pigois et al., 2003), l’âge de celui-ci a été précisé à 2107 – 2097 Ma. L’étude de terrain
a également permis une redéfinition de la stratigraphie du Groupe de Sefwi, mettant en évidence
une alternance des niveaux de métabasaltes et de métavolcanosédiments.
À une échelle plus locale, l’analyse des déformations et des minéralisations à la mine de
Wassa indique que ces événements de déformation régionaux sont associés à plusieurs
événements hydrothermaux majeurs caractérisés par la formation de veines à quartz et la
précipitation d’arséniosulfures, de sulfures et d’or dans les roches hôtes. La principale phase de
minéralisation à la mine de Wassa se développa au début de la déformation D1 (Éoéburnéenne).
L’étude de terrain ainsi que la répartition des concentrations en or montrent que les
minéralisations se répartissent majoritairement le long des plis isoclinaux F1, avec lesquels elles

196
sont associées. De par leur précocité, les gisements de type Wassa, formés dans le groupe de
Sefwi puis érodés, pourraient avoir fourni l’or contenu dans les placers du bassin de Tarkwa. Les
phases suivantes de minéralisation, d’âge Éburnéen, furent largement étudiées par le passé
(Allibone et al., 2002a). Certaines sont régionalement contrôlées par les zones de cisaillements
majeurs comme la Faille d’Ashanti, le long desquelles elles sont mises en place durant la
déformation D4 (Mines de Prestea, Bogoso, Obuasi, etc.). D’autres sont reliées à des
déformations tardives (D5-D6) comme à la mine de Damang (Tunks et al., 2004). À la mine de
Wassa, ces minéralisations Éburnéennes, bien qu’observées, ne présentent que des
concentrations mineures en or et résultent d’une remobilisation de la minéralisation
Éoéburnéenne.
Les phases Éoéburnéenne et Éburnéenne précédemment mentionnées sont toutes deux
associées à un magmatisme intense au sud-ouest du Ghana. Les campagnes de terrain ont permis
un échantillonnage précis des différents plutons, datés par de précédentes études, pour analyses
géochimiques des éléments majeurs et traces. Les TTGs Éoéburnéens sont caractérisés par un
important enrichissement en terres rares légères (LREE) et par des spectres plats pour les terres
rares lourdes (HREE). Les anomalies positives en Ba et négatives en Ta, Nb et Th observées à la
fois pour ces TTGs et pour les roches volcaniques contemporaines suggèrent un magmatisme
calco-alcalin de zone de subduction (Wilson, 1989). Les intrusions de granodiorites et de
granites Éburnéens montrent un appauvrissement en éléments lourds (HREE) et des rapports
Sr/Y élevés, typiques des magmas adakitiques et des TTGs archéens (Martin, 1999). Cette
géochimie indique la présence de grenat dans les roches sources de ces granitoïdes. La
modélisation thermodynamique de la formation de grenats dans une croûte de composition
Éoéburnéenne montre que ceux-ci apparaissent avant le franchissement du solidus, quelle que
soit la lithologie, si l’on considère un gradient géothermique raisonnable de 25°/km. Ainsi, il a
été montré que la fusion partielle des roches métamafiques et des TTGs Éoéburnéens en base de
croûte pouvait produire des magmas de composition similaire à celle des granitoïdes Éburnéen,
avec un héritage de la signature géochimique de subduction.
Pour terminer cette étude, l’ensemble des données collectées au cours des campagnes de
terrain a permis la réalisation d’un modèle tridimensionnel du sud de la ceinture d’Ashanti, et,
plus particulièrement, du groupe de Sefwi. Ce modèle 3D, basé sur la cartographie géologique et
structurale régionale (Perrouty et al., 2012), sur l’interprétation de structures Birimiennes
enfouies sous le bassin de Tarkwa et sur des coupes géologiques en accord avec les données de
géophysique, a été réalisé via l’utilisation des logiciels de modélisation Geomodeller et Gocad et
d’inversion VPmg. La modélisation du bassin de Tarkwa, dont la base serait entièrement

197
minéralisée, montre qu’il pourrait être localement près de deux fois plus profond que cela ne fut
estimé par les études stratigraphiques de Junner (1940). En ce qui concerne le groupe de Sefwi,
la modélisation suggère une possible corrélation entre la localisation des gisements d’or au sud-
est de la ceinture d’Ashanti et une unité de métabasaltes tholéiitiques, avec 85 % des sites
minéralisés localisés à moins de 1500 m de cette couche, pour une distance moyenne de 550 m.
Ce niveau de métabasaltes de 300 m d’épaisseur, plus compétent que les métavolcanosédiments
situés de part et d’autre, aurait pu contrôler la formation de fracturation secondaire et la
formation des minéralisations à partir des fluides transportés le long des failles majeures.

198

199
Perspectives
L’analyse structurale ainsi que l’identification des phases de magmatisme au sud-ouest du
Ghana a permis de répondre à de nombreuses questions concernant l’évolution
Paléoprotérozoïque de la ceinture d’Ashanti. Dans un même temps, cette étude a mis en évidence
d’autres points à éclaircir pour une compréhension plus globale de la géotectonique
précambrienne du craton d’Afrique de l’Ouest.
Ainsi, si l’évolution du magmatisme illustre de possibles mécanismes de construction de
la croûte continentale, les interprétations de cette étude restent limitées au sud-ouest du Ghana.
Étendre l’analyse géochimique des granitoïdes à la partie Paléoprotérozoïque du Ghana, puis à
l’ensemble du craton d’Afrique de l’Ouest permettrait de vérifier si ces interprétations locales
s’appliquent également à grande échelle, avec de nouvelles implications pour la genèse des
croûtes continentales Précambriennes.
Un autre point intéressant à élucider concerne la couche de métabasaltes tholéiitiques,
dans le groupe de Sefwi, dont le possible lien avec la localisation des minéralisations a été mis
en évidence par la modélisation 3D. Une étude plus approfondie de cette unité, via sa
cartographie précise et son échantillonnage, confirmerait ou infirmerait son contrôle sur les
minéralisations de cette région. La compréhension des relations structurales (et chimiques) entre
ce niveau de métabasaltes, les failles majeures et les minéralisations, fournirait une piste
intéressante pour de futures explorations.
Parallèlement à cette étude, un échantillonnage des différentes lithologies à
l’affleurement a été réalisé afin d’apporter de nouvelles informations sur l’évolution du
métamorphisme régional durant la phase Éburnéenne. Les assemblages chlorites / micas blancs
suggèrent des conditions maximales de pressions de l’ordre de 5 kbar pour l’ensemble des
échantillons analysés (cf. annexe 2). Les assemblages staurotide / grenat indiquent des conditions
de pression similaires mais des températures plus élevées. Ces valeurs sont en accord avec les
précédentes études métamorphiques (Schmidt Mumm et al., 1997 ; John et al., 1999). En
conséquence, il semblerait que le pic de pression soit uniforme sur l’ensemble de la région, avec
de locales variations de température suite aux intrusions de granitoïdes Éburnéens. Ceci implique
l’absence de mouvement vertical significatif le long des failles (supérieur à 1.5 km, soit 0.5 kbar
d’incertitude sur les analyses) après le maximum de métamorphisme (à 2092 ± 3 Ma selon
Oberthur et al. 1998). Les données d’inclusions fluides indiquent des conditions

200
d’homogénéisation autour de 200°C, 2 kbar lors des minéralisations de Damang (Schmidt
Mumm et al., 1997), datées autour de 2063 ± 9 Ma (Pigois et al., 2003). Il semblerait donc que
l’ensemble du sud-ouest Ghana se soit soulevé de manière homogène d’environ 10 à 12 km
(3 kbar) en 30 Ma, puis très peu au cours des 2 milliards d’années suivantes. Ces premiers
résultats de l’étude métamorphique suggèrent que les déformations Éburnéennes du Ghana sont
principalement exprimées par des grandes zones de cisaillements (e.g. Ashanti Fault) avec des
mouvements verticaux réduits.

201
Références

202

203
Références
Abouchami, W., Boher, M., Michard, A., Albarède, F., 1990, "A major 2.1 Ga event of mafic
magmatism in West Africa, an early stage of crustal accretion", Journal of Geophysical
Research, B, Solid Earth and Planets, 95, 17605-17629
Adadey, K., Clarke, B., Théveniaut, H., Urien, P., Delor, C., Roig, J.Y., Feybesse, J.L., 2009,
Geological map explanation - Map sheet 0503 B (1:100 000), CGS/BRGM/Geoman, Geological
Survey Department of Ghana (GSD). No MSSP/2005/GSD/5a
Agyei Duodu, J., Loh, G.K., Boamah, K.O., Baba, M., Hirdes, W., Toloczyki, M., Davis, D.W.,
2009, Geological Map of Ghana 1:1,000,000, Geological Survey of Ghana, Map 1:1M
Allibone, A., MacCuaig, T.C., Harris, D., Etheridge, M., Munroe, S., Byrne, D., 2002, Structural
Controls on Gold Mineralization at the Ashanti Gold Deposit, Obuasi, Ghana, Society of
Economic Geologists, Special Publication, 9, 65-93
Allibone, A., Teasdale, J., Cameron, G., Etheridge, M., Uttley, P., Soboh, A., Appiah-Kubi, J.,
Adanu, A., Arthur, R., Mamphey, J., Odoom, B., Zuta, J., Tsikata, A., Pataye, F., Famiyeh, S.,
Lamb, E., 2002, Timing and Structural Controls on Gold Mineralization at the Bogoso Gold
Mine, Ghana, West Africa, Economic Geology, 97, 949-969
ALS Minerals, 2006a, ME-ICP06 and OA-GRA05 Analysis of Major Oxides by ICP- AES
Method, www.alsglobal.com, 2p.
ALS Minerals, 2006b, MEMS41 Aqua Regia ICP AES ICPMS Multielement Method,
www.alsglobal.com, 2p.
ALS Minerals, 2009, ME-MS81 Lithium Metaborate fusion-ICP-MS Multi-element Method,
www.alsglobal.com, 3p.
Asiedu, D.K., Dampare, S.B., Asamoah Sakyi, P., Banoeng-Yakubo, B., Osae, S., Nyarko,
B.J.B., Manu, J., 2004, Geochemistry of Paleoproterozoic metasedimentary rocks from the Birim
diamondiferous field, southern Ghana: Implications for provenance and crustal evolution at the
Archean-Proterozoic boundary, Geochemical Journal, 38, 215-228

204
Asiedu, D.K., Kutu, J.M., Manu, J., Hayford, E.K., 2009, Geochemistry and provenance of
metagreywackes from the Konongo Area, Southwestern Ghana, African Journal of Science and
Technology (AJST), Science and Engineering Series, 10 (1), 37-44
Attoh, K., Corfu, F., Nudec, P.M., 2007, U-Pb zircon age of deformed carbonatite and alkaline
rocks in the Pan-African Dahomeyide suture zone, West Africa, Precambrian Research, 155,
251-260
Attoh, K., Dallmeyer, R.D., Affaton, P., 1997, Chronology of nappe assembly in the Pan-African
Dahomeyide orogen: evidence from 40Ar/39Ar mineral ages, Precambrian Research, 82, 153-
171
Attoh, K., Evans, M.J., Bickford, M.E., 2006, Geochemistry of an ultramafic-rodingite rock
association in the Paleoproterozoic Dixcove greenstone belt, southwestern Ghana, Journal of
African Earth Sciences, 45, 333-346
Baer, P., Riegel, W., 1980, Les microflores des séries Paléozoiques du Ghana (Afrique
occidentale) et leurs relations paléofloristiques, Bulletin Sciences Géologiques, 27, 39-58
Baratoux, L., Metelka, V., Naba, S., Jessell, M.W., Gregoire, M., Ganne, J., 2011, Juvenile
Paleoproterozoic crust evolution during the Eburnean orogeny (?2.2–2.0 Ga), western Burkina
Faso, Precambrian Research, 191, 18-45
Barker, F., Arth, J.G., 1979, Generation of trondhjemitic-tonalitic liquids and Archean bimodal
trondhjemite-basalt suites, Geology, 4, 596-600
Barritt, S.D., Kuma, J.S., 1998, Constrained gravity models and structural evolution of the
Ashanti Belt, southwest Ghana, Journal of African Earth Sciences, 26 (4), 539-550
Batchelor, R.A., Bowden, P., 1985, Petrogenetic Interpretation of Granitoid Rock Series Using
Multicationic Parameters, Chemical Geology, 48, 43-55
Bermúdez-Lugo, O., 2008, The Mineral Industry of Ghana, Mineral Yearbook, 2006, U.S.
Geological Survey, 5 p.
Blenkinsop, T.G., Schmidt Mumm, A., Kumi, R., Sangmor, S., 1994, Structural Geology of the
Ashanti Gold Mine, Geologisches Jahrbuch, D 100, 131-153
Boher, M., Abouchami, W., Michard, A., Albarède, F., Arndt, N.T., 1992, Crustal growth in
West Africa at 2.1 Ga, Journal of Geophysical Research, B, Solid Earth and Planets, 97, 345-369

205
Bonhomme, M., 1962, Contribution à l’étude géochronologique de la plate-forme de l’Ouest
Africain, Annales de la Faculté des Sciences, Université de Clermont-Ferrand, Géologie,
Minéralogie, 5, 62 p.
Bourassa, Y., 2003, Wassa Geology Report, Golden Star Resources Ltd, 34p.
Bourman, R.P., 1993, Perennial problems in the study of laterite: A review, Australian Journal of
Earth Sciences, 40, 387-401
Bowell, R.J., Foster, R.P., Stanley, C.J., 1990, Telluride mineralization at Ashanti gold mine,
Ghana, Mineralogical Magazine, 54, 617-627
Buah, F.K., 1998, A History of Ghana, Revised and Updated, MacMillan Education, Oxford,
259 p.
Caen-Vachette, M., Vialette, Y., Bassot, J.P., Vidal, P., 1988, Apport de la géochronologie
isotopique à la connaissance de la géologie gabonaise, Chronique Recherche Minière, 491, 35-
54.
Calcagno, P., Chilès, J.P., Courrioux, G., Guillen, A., 2008, Geological modelling from field
data and geological knowledge, Part I – Modelling method coupling 3D potential-field
interpolation and geological rules, Physics of the Earth and Planetary Interiors, 171, 147-157
Chaloner, W.G., Mensah, M.K., Crane, M.D., 1974, Non-vascular land plants from the Devonian
of Ghana, Palaeontology, 17 (4), 925–947
Chatterjee, N. D., Froese, E. , 1975, A thermodynamic study of the pseudobinary join muscovite-
paragonite in the system KAlSi3O8-NaAlSi3O8-Al2O3-SiO2-H2O, American Mineralogist, 60,
985-993
Chung, S.L., Liu, D., Ji, J., Chu, M.F., Lee, H.Y., Wen, D.J., Lo, C.H., Lee, T.Y., Qian, Q.,
Zhang, Q., 2003, Adakites from continental collision zones: Melting of thickened lower crust
beneath southern Tibet, Geology, 31 (11), 1021-1024
Clark, D.A., 1997, Magnetic petrophysics and magnetic petrology: aids to geological
interpretation of magnetic surveys, AGSO Journal of Australian Geology & Geophysics, 17 (2),
83-103
Condie, K.C., 1993, Chemical composition and evolution of the upper continental crust:
contrasting results from surface samples and shales, Chememical Geology, 104, 1-37

206
Condie, K.C., 2005, High field strength element ratios in Archean basalts: a window to evolving
sources of mantle plumes, Lithos, 79, 491-504
Connolly, J.A.D., 2005, Computation of phase equilibria by linear programming. A tool for
geodynamic modeling and its application to subduction zone decarbonation, Earth and Planetary
Science Letters, 236, 524-541.
Connolly, J.A.D., 2009, The geodynamic equation of state: what and how, Geochemistry,
Geophysics, Geosystems, 10, Q10014
Connolly, J.A.D., Kerrick, D.M., 1987, An algorithm and computer program for calculating
composition phase diagrams, CALPHAD, 11, 1-55
Crow, A.T., 1952, The rocks of the Sekondi Series of the Gold Coast, Gold Coast Geological
Survey, Bulletin, 18, 68 p.
Dampare, S., Shibata, T., Asiedu, D., Osae, H., 2005, Major-element geochemistry of
Proterozoic Prince’s Town granitoid from the southern Ashanti volcanic belt, Ghana, Earth
Science Report, 12, 15-30
Dampare, S.B., Shibata, T., Asiedu, D.K., Osae, S., Banoeng-Yakubo, B., 2008, Geochemistry
of Paleoproterozoic metavolcanic rocks from the southern Ashanti volcanic belt, Ghana:
Petrogenetic and tectonic setting implications, Precambrian Research, 162, 403-423
Davis, D.W., Hirdes, W., Schaltegger, U., Nunoo, E.A., 1994, U-Pb age constraints on
deposition and provenance of Birimian and gold-bearing Tarkwaian sediments in Ghana, West
Africa, Precambrian Research, 67, 89-107
De Kock, G.S., Armstrong, R.A., Siegfried, H.P., Thomas, E., 2011, Geochronology of the Birim
Supergroup of the West African craton in the Wa-Bolé region of west-central Ghana:
Implications for the stratigraphic framework, Journal of African Earth Sciences, 59, 1-40
Dickson, B.L., Scott, K.M., 1997, Interpretation of aerial gamma-ray surveys - adding the
geochemical factors, AGSO Journal of Australian Geology & Geophysics, 17 (2), 187-200
Duchesne, J.C., 1999, Fe-Ti deposits in Rogaland anorthosites (South Norway): geochemical
characteristics and problems of interpretation, Mineralium Deposita, 34, 182-198

207
Eisenlohr, B.N., 1992, Conflicting evidence on the timing of mesothermal and paleoplacer gold
mineralisation in early Proterozoic rocks from southwest Ghana, West Africa, Mineralium
Deposita, 27, 23-29
Eisenlohr, B.N., Hirdes, W., 1992, The structural development of the early Proterozoic Birimian
and Tarkwaian rocks of southwest Ghana, West Africa, Journal of African Earth Sciences, 14
(3), 313-325
Ennih, N., Liégeois, J.-P, 2008, The boundaries of the West African craton, with special
reference to the basement of the Moroccan metacratonic Anti-Atlas belt, In: Ennih, N., Liégeois,
J.-P. (Eds.), The Boundaries of the West African Craton, Special Publications, Geological
Society, London, 297, 1-17.
Eriksson, K.A., Krapez, B., Fralick, P.W., 1994, "Sedimentology of Archean greenstone belts,
signatures of tectonic evolution", Earth-Science Reviews, 37, 1-88
Feybesse, JL., Billa, M., Guerrot, C., Duguey, E., Lescuyer, JL., Milési, JP., Bouchot, V., 2006,
The paleoproterozoic Ghanaian province: Geodynamic model and ore controls, including
regional stress modeling, Precambrian Research, 149, 149-196
FUGRO Logistics Report, 2004, Helicopter Borne Magnetic Horizontal Gradient (MIDAS™)
And Radiometric Geophysical Survey over the Wassa Project Area, Damang, Ghana, Golden
Star Resources Ltd, 89 p.
Fullagar, P.K., Hughes, N.A., Paine, J., 2000, Drilling constrained 3D gravity inversion,
Exploration Geophysics, 31, 17-23
Fullagar, P.K., Pears, G., MacMonnies, B., 2008, Constrained inversion of geologic surfaces -
pushing the boundaries, The Leading Edge, 27 (1), 98-105
Fullea, J., Fernandez, M., Zeyen, H., 2008, FA2BOUG - A FORTRAN 90 code to compute
Bouguer gravity anomalies from gridded free-air anomalies: Application to the Atlantic-
Mediterranean transition zone, Computers & Geosciences, 34 (12), 1665-1681
Ganne, J., De Andrade, V., Weinberg, R., Vidal, O., Dubacq, B., Kagambega, N., Naba, S.,
Baratoux, L., Jessell, M.W., Allibon J., 2011, Modern-style plate subduction preserved in the
PalaeoproterozoicWest African craton, Nature Geoscience, 5, 60-65
Grenholm, M., 2011, Petrology of Birimian granitoids in southern Ghana - petrography and
petrogenesis, Bachelor thesis, Lund University, 41 p.

208
Griffis, R.J., Barning, K., Agezo, F.L., Akosah, F.K., 2002, Gold Deposits of Ghana, Minerals
Commission, Accra, Ghana, 438 p
Groves, D.I. , Goldfarb, R.J. , Robert, F., Hart, C.J.R., 2003, Gold Deposits in Metamorphic
Belts: Overview of Current Understanding, Outstanding Problems, Future Research, and
Exploration Significance, Economic Geology, 98, 1-29
Gunn, P.J., Maidment, D., Milligan, P.R., 1997, Interpreting aeromagnetic data in areas of
limited outcrop, AGSO Journal of Australian Geology & Geophysics, 17 (2), 175-185
Hastings, D.A., 1978, The southwest Ghana gravity survey, with West African regional
correlations and implications, Ghana Geological Survey, Unpublished Report, 202 p.
Hastings, D.A., 1982, On the tectonics and metallogenesis of West Africa: A model
incorporating new geophysical data, Geoexploration, 20, 295-327
Hein, K.A.A., 2010, Succession of structural events in the Goren greenstone belt (Burkina Faso):
Implications for West African tectonics, Journal of African Earth Sciences, 86, 77-89
Hilson, G., 2002, Harvesting mineral riches: 1000 years of gold mining in Ghana, Resources
Policy, 28, 13-26
Hirdes, W., Davis, D.W., 1998, First U-Pb zircon age of extrusive volcanism in the Birimian
Supergroup of Ghana/West Africa, Journal of African Earth Sciences, 27 (2), 291-294
Hirdes, W., Davis, D.W., Eisenlohr, B.N., 1992, Reassessment of Proterozoic granitoid ages in
Ghana on the basis of U/Pb zircon and monazite dating, Precambrian Research, 56, 89-96
Hirdes, W., Nunoo, B., 1994, The Proterozoic Paleoplacers at Tarkwa Gold Mine, SW Ghana:
Sedimentology, Mineralogy, and Precise Age Dating of the Main Reef and West Reef, and
Bearing of the Investigations on Source Area Aspects, Geologisches Jahrbuch, D 100, 247-311
Holland, T., Baker, J., Powell, R., 1998, Mixing properties and activity–composition
relationships of chlorites in the system MgO–FeO–Al2O3–SiO2–H2O, European Journal of
Mineralogy, 10, 395-406
Holland, T., Powell, R, 1996, Thermodynamics of order-disorder in minerals. 2. Symmetric
formalism applied to solid solutions, American Mineralogist, 81, 1425-1437
Holland, T., Powell, R., 2001, Calculation of phase relations involving haplogranitic melts using
an internally consistent thermodynamic dataset, Journal of Petrology, 42, 673-683

209
Holland, T.J.B., Powell, R., 1998, An internally consistent thermodynamic data set for phases of
petrological interest, Journal of Metamorphic Geology, 16, 309-343
Hong, H., Li, Z., Xiao, P., 2009, Clay mineralogy along the laterite profile in Hubei, South
China: mineral evolution and evidence for eolian origin, Clays and Clay Minerals, 57 (5), 602-
615
Hünken, U., Klemd, R., Olesch, M., 1994, Fluid Inclusions in Quartz-Pebbles of Proterozoic
Tarkwaian Conglomerates in Ghana, Geologisches Jahrbuch, D 100, 313-341
Jessell, M.W., 1981, Noddy - an interactive map creation package, M.Sc. Thesis, University of
London, England, 49 p.
Jessell, M.W., 2001, Three-dimensional geological modelling of potential-field data, Computers
& Geosciences, 27, 147-157
Jessell, M.W., Valenta, R.K., 1996, Structural geophysics: integrated stuctural and geophysical
mapping, In: DePaor, D. (Ed.), Structural Geology and Personal Computers, Elsevier, Oxford,
303-324
Jessell, M.W., Willman, C.E., Gray, D.R., 1994, Bedding parallel veins and their relationship to
folding, Journal of Structural Geology 16 (6), 753-767
John, T., Klemb, R., Hirdes, W., Loh, G., 1999, The metamorphic evolution of the
Paleoproterozoic (Birimian) volcanic Ashanti belt (Ghana, West Africa), Precambrian Research,
98, 11-30
Junner, N.R., 1935, Gold in the Gold Coast, Gold Coast Geological Survey, Memoir 4, 76 p.
Junner, N.R., 1940, Geology of the Gold Coast and Western Togoland, Gold Coast Geological
Survey, Memoir 11, 40 p.
Kalsbeek, F., Frei, D., Affaton, P., 2008, Constraints on provenance, stratigraphic correlation and
structural context of the Volta basin, Ghana, from detrital zircon geochronology: An Amazonian
connection?, Sedimentary Geology, 212, 86-95
Kay, R.W., Kay, S.M., 2002, Andean adakites: Three ways to make them, Acta Petrologica
Sinica, 18, 303-311
Kesse, G.O., 1985, The Mineral and Rock Resources of Ghana, A.A. Balkema Publishers, Book,
610 p.

210
Kitson, A.E., 1918, Annual Report for 1916/17, Gold Coast Geological Survey, Accra, Ghana
Kitson, A.E., 1928, Provisional geological map of the Gold Coast and Western Togoland, with
brief descriptive notes thereon, Gold Coast Geological Survey, Bulletin 2
Klein, E.L., Luzardo, R., Moura, C.A.V., Armstrong, R., 2008, Geochemistry and zircon
geochronology of paleoproterozoic granitoids: Further evidence on the magmatic and crustal
evolution of the São Luís cratonic fragment, Brazil, Precambrian Research, 165, 221-242
Klein, E.L., Moura, C.A.V., Pinheiro, B.L.S., 2005, Paleoproterozoic Crustal Evolution of the
Sao Luis Craton, Brazil: Evidence from Zircon Geochronology and Sm-Nd Isotopes, Gondwana
Research, 8 (2), 177-186
Kleinschrot, D., Klemd, R., Brocker, M., Okrusch, M., Franz, L., Schmidt, K., 1993, The Nsuta
manganese deposit, Ghana: geological setting, ore-forming process and metamorphic evolution,
Zeitschfirt fuer Angewandte Geologie, 39, 135-155
Kleinschrot, D., Klemd, R., Brocker, M., Okrusch, M., Franz, L., Schmidt, K., 1994, Protores
and country rocks of the Nsuta manganese deposit, Neues Jahrbuch Mineral, 168, 67-108
Klemd, R., Hirdes, W., Olesch, M., Oberthür, T., 1993, Fluid inclusions in quartz-pebbles of the
gold-bearing Tarkwaian conglomerates of Ghana as guides to their provenance area, Mineralium
Deposita, 28, 334-343
Kutu, J.M., 2003, Structure, Deformation and Mineralization of Konongo Mines in the Ashanti
Gold Belt of Ghana, PhD. Thesis, Univeristy of Ghana
Lahti, I., Karinen, T., 2010, Tilt derivative multiscale edges of magnetic data, The Leading Edge,
23 (2), 116-118
Lajaunie, C., Courrioux, G., Manuel, L., 1997, Foliation Fields and 3D Cartography in Geology:
Principles of a Method Based on PotentialInterpolation, Mathematical Geology, 29 (4), 571-584
Ledru, P., Johan, V., Milési, J.P., Tegyey, M., 1994, Markers of the last stages of the
Palaeoproterozoic collision: evidence for a 2 Ga continent involving circum-South Atlantic
provinces, Precambrian Research, 69, 169-191
Leube, A., Hirdes, W., Mauer, R., Kesse, G.O., 1990, The Early Proterozoic Birimian
Supergroup of Ghana and Some Aspects of its Associated Gold Mineralization, Precambrian
Research, 46, 139-165

211
Loh, G., Hirdes, W., Anani, C., Davis, D.W., Vetter, U., 1999, Explanatory Notes for the
Geological Map of Southwest Ghana 1 : 100,000, Geologisches Jahrbuch, Reihe B, Heft 93, 150
p.
MacCandlish, K., 2003, Qualifying Report for the First Disclosure of a Resource Estimate on a
Material Property Wassa Mine, Southwest Ghana, Golden Star Resources Ltd, 54 p.
MacLeod, I.N., Jones, K., Fan Dai, T., 1993, 3-D Analytic Signal in the Interpretation of Total
Magnetic Field Data at Low Magnetic Latitudes, Exploration Geophysics, 24, 679-688
Mahar, E.M., Baker, J.M., Powell, R., Holland, T.J.B., Howell, N., 1997, The effect of Mn on
mineral stability in metapelites, Journal of Metamorphic Geology, 15, 223–238
Mallet, J.L., 1992, Discrete smooth interpolation in geometric modelling, Computer Aided
Design, 24 (4), 178-191
Martin, H., 1994, The Archean grey gneisses and the genesis of continental crust, Precambrian
Geology, 11, 205-259
Martin, H., 1999, The adakites: modern analogs of Archaean granitoids, Lithos, 46, 411-429
Martin, H., Smithies, R.H., Rapp, R., Moyen, J.F., Champion, D.C., 2005, An overview of
adakite, tonalite–trondhjemite–granodiorite (TTG), and sanukitoid: relationships and some
implications for crustal evolution, Lithos, 79, 1-24
Mauer, R., 1990, Petrographische und geochemische Untersuchungen tier präkambrischen
(Birimian) Granitoide Ghana, Dissertation, Technische Universität Berlin, 202 p.Mensah, M.,
1973, On the question of the age of the Sekondi Series, Upper Devonian or Lower Carboniferous
rocks of Ghana, Ghana Journal of Sciences, 13, 134–139
Metelka, V., Baratoux, L., Naba, S., Jessell, M.W., 2011, A geophysically constrained litho-
structural analysis of the Eburnean greenstone belts and associated granitoid domains, Burkina
Faso, West Africa, Precambrian Research, 190, 48-69
Milesi, J.P., Ledru, P., Ankrah, P., Johan, V., Marcoux, E., Vinchon, C., 1991, The metallogenic
relationship between Birimian and Tarkwaian gold deposits in Ghana, Mineralium Deposita, 26,
228-238

212
Milési, J.P., Ledru, P., Feybesse, JL., Dommanget, A., Marcoux, E., 1992, Early Proterozoic ore
deposits and tectonics of the Birimian orogenic belt, West Africa, Precambrian Research, 58,
305-344
Milligan, P.R., Gunn, P.J., 1997, Enhancement and presentation of airborne geophysical data,
AGSO Journal of Australian Geology & Geophysics, 17 (2), 63-75
Milsom, J., 2003, Field Geophysics, The geological field guide series, Third edition, J. Wiley,
249 p.
Moyen, J.F., 2011, The composite Archaean grey gneisses: Petrological significance, and
evidence for a non-unique tectonic setting for Archaean crustal growth, Lithos, 123, 21-36
Moyen, J.F., Martin, H, 2012, Forty years of TTG research, Lithos 148, 312-336
Mumin, A.H., Fleet, M.E., 1995, Evolution of gold mineralization in the Ashanti Gold Belt,
Ghana: evidence from carbonate compositions and parageneses, Mineralogy and Petrology, 55,
265-280
Mumin, A.H., Fleet, M.E., Chryssoulis, S.L., 1994, "Gold mineralization in As-rich mesothermal
gold ores of the Bogosu-Prestea mining distric of the Ashanti Gold Belt, Ghana: remobilization
of ""invisible"" gold", Mineralium Deposita, 29, 445-460
Mumin, A.H., Fleet, M.E., Longstaffe, F.J., 1996, Evolution of Hydrothermal Fluids in the
Ashanti Gold Belt, Ghana: Stable Isotope Geochemistry of Carbonates, Graphite, and Quartz,
Economic Geology, 91, 135-148
Newton, R.C., Charlu, T.V., Kleppa, O.J., 1980, Thermochemistry of the high structural state
plagioclases, Geochimica et Cosmochimica Acta, 44 (7), 933-941
Nomade, S., Che, Y., Pouclet, A., Féraud, G., Théveniaut, H., Daouda, B.Y., Vidal, M., Rigolet,
C., 2003, The Guiana and theWest African Shield Palaeoproterozoic grouping: new
palaeomagnetic data for French Guiana and the Ivory Coast, Geophysical Journal International,
154, 1-18
Ntiamoah-Agyakwa, Y., 1979, Relationship between gold and manganese mineralizations in the
Birimian of Ghana, West Africa, Geological Magazine, 116, 345-352
Nyame, F.K., Kase, K., Yamamoto, M., 1998, Spessartine Garnets in a Manganiferous
Carbonate Formation from Nsuta, Ghana, Resource Geology, 48 (1), 13-22

213
Oberthür, T., Vetter, U., Davis, D.W., Amanor, J.A., 1998, Age constraints on gold
mineralization and Paleoproterozoic crustal evolution in the Ashanti belt of southern Ghana,
Precambrian Research, 89, 129-143
Oberthür, T., Vetter, U., Schmidt Mumm, A., Weiser, T., Amanor, J.A., Gyapong, W.A., Kumi,
R., Blenkinsop, T.G., 1994, The Ashanti Gold Mine at Obuasi, Ghana: Mineralogical,
Geochemical, Stable Isotope and Fluid Inclusion Studies on the Metallogenesis of the Deposit,
Geologisches Jahrbuch, D 100, 31-129
Oberthür, T., Weiser, T., Amanor, J.A., Chryssoulis, S.L., 1997, Mineralogical siting and
distribution of gold in quartz veins and sulfide ores of the Ashanti mine and other deposits in the
Ashanti belt of Ghana: genetic implications, Mineralium Deposita, 32, 2-15
Pavlis, N.K., Holmes, S.A., Kenyon, S.C., Factor J.K., 2008, An Earth Gravitational Model to
Degree 2160: EGM2008, EGU General Assembly 2008, Vienna, Austria
Perrouty S., Aillères L., Jessell M., Baratoux L., Bourassa Y., Crawford B., 2012, New Field and
Geophysical Evidence of Pre-Tarkwaian Deformation in the Southern Ashanti Belt, Ghana –
Implications for Gold Mineralisation, Precambrian Research, 204-205, 12-39
Pigois, J.P., Groves, D.I., Fletcher, I.R., MacNaughton, N.J., Snee, L.W., 2003, Age constraints
on Tarkwaian palaeoplacer and lode-gold formation in the Tarkwa-Damang district, SW Ghana,
Mineralium Deposita, 38, 695-714
Powell, R., Holland, T.J.B., Worley, B., 1998, Calculating phase diagrams involving solid
solutions via non-linear equations, with examples using THERMOCALC, Journal of
Metamorphic Geology, 16, 577-588
Schmidt Mumm, A., Oberthür, T., Vetter, U., Blenkinsop, T.G., 1997, High CO2 content of fluid
inclusions in gold mineralisations in the Ashanti Belt, Ghana: a new category of ore forming
fluids ?, Mineralium Deposita, 32, 107-118
Schwartz, M.O., Oberthür, T., Amanor, J., Gyapong, W.A., 1992, Fluid inclusion re-
equilibration and P-T-X constraints on fluid evolution in the Ashanti gold deposit, Ghana,
European Journal of Mineralogy, 4, 1017-1033
Sestini, G., 1973, Sedimentology of a Paleoplacer: The Gold-bearning Tarkwaian of Ghana, Ores
in Sediments, International Union of Geological Sciences, Series A, 3, 275-305

214
Shand, S.J., 1943, Eruptive rocks. Their genesis, composition, classification, and their relations
to ore-deposits, Wiley, New York, 444 p.
Smithies, R.H., 2000, The Archaean tonalite-trondhjemite-granodiorite (TTG) series is not an
analogue of Cenozoic adakite, Earth and Planetary Science Letters, 182, 115-125
Spear, F.S., 1993, Metamorphic Phase Equilibria and Pressure-Temperature-Time Paths,
Mineralogical Society of America, Washington, D. C., 799 p.
Sun, S.S., MacDonough, W.F., 1989, Chemical and isotopic systematics of oceanic basalts:
implication for mantle composition and processes, In: Saunders, A.D., Norry, M.J. (Eds.),
Magmatism in Ocean Basins, 42, Geological Society of London Special Publication, 313-345
Sylvester, P.J., Attoh, K., 1992, Lithostratigraphy and composition of 2.1 Ga greenstone belts of
the West African Craton and their bearing on crustal evolution and the Archean-Proterozoic
boundary, Journal of Geology, 100, 377-393
Tajcmanová, L., Connolly, J.A.D., Cesare, B., 2009, A thermodynamic model for titanium and
ferric iron solution in biotite, Journal of Metamorphic Geology, 27, 153-164
Talwani, M.,Worzel, J.L., Landisman, M., 1959, Rapid gravity computations for twodimensional
bodies with application to the Mendochino submarine fracture zone, Journal of Geophysical
Research, 64, 49-59
Talwani. M., Heirtzler, J. R., 1964, Computation of magnetic anomalies caused by two-
dimensional bodies of arbitrary shape, In Parks. G. A., Ed., Computers in the mineral industries,
Part 1: Stanford Univ. Pub., Geological Sciences, 9, 464-480.
Taylor, P.N., Moorbath, S., Leube, A., Hirdes, W., 1992, Early Proterozoic crustal evolution in
the Birimian of Ghana: constraints from geochronology and isotope geochemistry, Precambrian
Research, 56, 97-111
Tevendale, W. B., 1950, Annual Report 1948-49, Gold Coast Geol. Survey, 32 p.
Thompson, J.B., Waldbaum, D.R., 1968, Mixing properties of sanidine crystalline solutions. 2.
Calculations based on volume data, American Mineralogist, 53, 811-838
Trompette, R., 1980, La chaîne panafricaine des Dahomeyides et le Bassin des Volta (bordure
sud-est du craton ouest-africain), In: Bessoles, B., Trompette, R. (Eds.), Géologie de l'Afrique.
Mémoires du Bureau de Recherches Géologiques et Minières, 92, 9-62

215
Trompette, R., 1994, Geology of Western Gondwana (2000–500 Ma) Panafrican-Brasiliano
Aggregation of South America and Africa, Balkema, Rotterdam, 366 p.
Tshibubudze, A., Hein, K.A.A., Marquis, P., 2009, The Markoye Shear Zone in NE Burkina
Faso, Journal of African Earth Sciences, 55, 245-256
Tunks, A.J., Selley, D., Rogers, J.R., Brabham, G., 2004, Vein mineralization at the Damang
Gold Mine, Ghana: controls on mineralization, Journal of Structural Geology, 26, 1257-1273
Verduzco, B., Fairhead, J.D., Green, C.M., 2004, New insights into magnetic derivatives for
structural mapping, The Leading Edge, 29 (1), 24-29
Wei, C.J., Powell, R., Zhang, L.F., 2003, Eclogites from the south Tianshan, NW China:
petrological characteristic and calculated mineral equilibria in the Na2O-CaO-FeO-MgO-
Al2O3-SiO2-H2O system, Journal of Metamorphic Geology, 21, 163-180.
White, R.W., Powell, R., Holland, T.J.B., Worley, B.A., 2000, The effect of TiO2 and Fe2O3 on
metapelitic assemblages at greenschist and amphibolites facies conditions: mineral equilibria
calculations in the system K2O–FeO–MgO–Al2O3–SiO2–H2O–TiO2–Fe2O3., Journal of
Metamorphic Geology, 18, 497-511
White, R.W., Powell, R., Phillips, G. N., 2003, A mineral equilibria study of hydrothermal
alteration in mafic greenschist facies rock at Kalgoorlie, Western Australia, Journal of
Metamorphic Geology, 21, 455-468
Whitelaw O.A.L., 1904, Geological map of the Tarkwa-Abosso goldfield, 1:50000, Gold Coast
Geological Survey, Memoir 1
Whitelaw, O.A.L., 1929, The Geological and Mining Features of the Tarkwa-Abosso Goldfield,
Gold Coast Geological Survey, Memoir 1, 46 p.
Wille, S.E., Klemd, R., 2004, Fluid inclusion studies of the Abawso gold prospect, near the
Ashanti Belt, Ghana, Mineralium Deposita, 39, 31-45
Williams-Jones, A.E., Bowell, R.J., Migdisov, A.A., 2009, Gold in Solution, Elements, 5, 281-
287
Wilson, M., 1989, Igneous Petrogenesis, Unwin Hyman, London, 457 p.
Winchester, J.A., Floyd, P.A., 1977. Geochemical discrimination of different magma series and
their differentiation products using immobile elements. Chemical Geology 20, 325-343.

216
Xu, J.F., Shinjo, R., Defant, M.J., Wang, Q., Rapp, R.P., 2002, Origin of Mesozoic adakitic
intrusive rocks in the Ningzhen area of east China: Partial melting of delaminated lower
continental crust?, Geology, 30 (12), 1111-1114
Yao, Y., Murphy, P.J., Robb, L.J., 2001, Fluid Characteristics of Granitoid-Hosted Gold
Deposits in the Birimian Terrane of Ghana: A fluid Inclusion Microthermometric and Raman
Spectroscopic Study, Economic Geology, 96, 1611-1643
Yao, Y., Robb, L.J., 2000, Gold mineralization in Palaeoproterozoic granitoids at Obuasi,
Ashanti region, Ghana: Ore geology, geochemistry and fluid characteristics, South African
Journal of Geology, 103, 255-278

217
Listes des Tables et des Figures

218

219
Liste des Tables
Table I-1 Comparison between the tectonic evolution presented in this work with other
recent studies in southwestern Ghana. 038
Table I-2 Division of Tarkwaian sedimentary sequences and estimated thicknesses. 042
Table I-3 Synthesis of structural and fluid inclusion studies for major gold deposits of
southwestern Ghana. P-T data correspond to the homogenization temperature and
pressure of aqueous-carbonic inclusions in quartz veins and pebbles. 045
Table I-4 Summary table of the lithologies, associated petrophysics properties and
geophysical signatures (modified after Metelka et al., 2011). The magnetic image is
composed of the RTP draped over the shaded first vertical derivative. The
radiometric image is draped over the shaded digital elevation model. Whole rock
geochemical analyses were conducted by A.L.S. Mineral Laboratory, Sevilla, Spain.
ank. ankerite, bt. biotite, cal. calcite, chl. chlorite, cpx. clinopyroxène, dol. dolomite,
ep. epidote, gph. graphite, gt. garnet, hbl. hornblende, mgt. magnetite, ms.
muscovite, ol. olivine, opx. orthopyroxene, pl. plagioclase, qz. quartz, ser. sericite, st.
staurolite. 054
Table I-5 Ranges of density values measured on 26 samples of the main lithologies in
Ghana (this study) and in Burkina Faso (Baratoux et al., 2011). 056
---------------------------------------------------------------------------------------------------------------------
Table II-1 Geochemical analyses of the five dominant lithologies found in the Wassa mine.
All samples have been taken from drillcore. The “mafic volcanic”, “felsic volcanic”,
“metadiorite” and “phyllites” display similar whole rock compositions. 096
Table II-2 Summary of Wassa mine structural and hydrothermal evolution. 118
Table II-3 Summary of Wassa mine interpretation and its correlation with Allibone et al.
(2002a) study in Obuasi mine and Tunks et al (2004) in Damang mine. Shaded cells
indicate the main mineralisation events. 118
---------------------------------------------------------------------------------------------------------------------

220
Table III-1 Geochemical data for (A) granitoid and (B) metavolcanic and metasedimentary
samples from the southern Ashanti Belt. 139
Table III-2 (A) Average values of major element compositions for the Sefwi Group
metagabbros, metabasalts, metasediments and Eoeburnean TTGs. (B) Global melt
compositions extracted at 900°C for these lithologies (See text for details). *Best mix
to produce melts with the composition of the Eburnean granitoids. 148
---------------------------------------------------------------------------------------------------------------------
Table IV-1 Input and Calculated density values for the low resolution (LR) model compared
to the published density ranges of Perrouty et al. (2012) and Hasting (1978,
*unpublished report referenced in Barritt and Kuma, 1998). 171
Table IV-2 Petrophysical data used in the high resolution (HR) model. S.G., Sefwi Group
(Birimian). * remanence data of the Neoproterozoic dolerite dykes oriented NS were
also includes in the model with remanence value of 3 A/m, inclination of -18° and
declination of 59°. 174
Table IV-3 Correlations between the Sefwi Group modelled geologynd the gold occurrences
in the southeast of the Ashanti Belt. The BV1 layer (shaded line) represents 10 % of
the volume and 7 % of the thickness of the Sefwi Group. More than 85 % of the gold
occurrences are located at less than 1500 m of this BV1 layer. 180
Table IV-4 List of the 21 gold occurrences and deposits known to be hosted by the Sefwi
Group in the southeast of Ashanti Belt (after Griffis et al., 2002). See Figure IV-8 for
their location. Structural context and the distance to the BV1 metabasaltic layer are
also shown. 183

221
Liste des Figures
Figure 1 Carte géologique simplifiée du Ghana (d’après BRGM, SigAfrique, 2004), avec la
localisation de la zone d’étude (cadre rouge) ainsi que des principales
agglomérations. Le fond de carte utilisé correspond au modèle numérique de terrain
SRTM. L’image de droite est une projection de l’Afrique avec la localisation de la
zone d’étude (d’après Google Earth, 2012). 018
Figure 2 Les lithologies du sud-ouest du Ghana : (a) métabasaltes Birimiens, groupe de
Sefwi, (b) métavolcanosédiments Birimiens, groupe de Sefwi, (c) métaconglomérats
Tarkwaiens, (d) quartzites Tarkwaiennes, avec une stratification entrecroisée
marquée par des lits de magnétite, (e) phyllites Tarkwaiennes, (f) granitoïde
Éburnéen, (g) dolérite (dyke), (h) sédiments phanérozoïques. 021
Figure 3 Altération de la surface : (a) couche organique de sol, (b) niveau B2, à pisolithes,
(c) niveau B3, zone tachetée, (d) niveau B4, saprolite. L’épaisseur totale de ce profil
d’altération approche 15 m. 022
---------------------------------------------------------------------------------------------------------------------
Figure I-1 (A) The West African Craton (modified after Milési et al., 2004, BRGM
SIGAfrique) is composed of an Archean nucleus in the southwest bounded by series
of paleoproterozoic greenstone belts and voluminous granitoids in the northwest to
the east. (B) Simplified geology map of the Ashanti Belt (modified after Agyei Duodu
et al., 2009) showing the locations of Figures I-6, I-14 and I-16 (AA’ and BB’).
037
Figure I-2 Compilation of histograms presenting radiometric age data and the number of
zircons / samples for the three main stratigraphic sequences and on granitoids in the
study area (after Taylor et al., 1992; Hirdes et al. 1992; Davis et al., 1994; Oberthür
et al., 1998, Loh et al., 1999; Pigois et al., 2003; Attoh et al., 2006; Feybesse et al.,
2006; Adadey et al., 2009; Agyei Duodu et al., 2009). The age distribution in
granitoids shows two distinct peaks that correspond to the Eoeburnean and
Eburnean phases. Dots represent dated samples for igneous rocks or detrital zircons
ages for sedimentary rocks and their associated error bars. 039

222
Figure I-3 The reduced to pole image of the total magnetic intensity draped over the shaded
first vertical derivative. The reduced to the pole data was the basis for all subsequent
processing and is shown with some of the main significant regional faults. Pixel size
is 100m. The colour look up table is histogram equalised. 048
Figure I-4 Image of the gamma-ray data draped over a shaded digital elevation model. This
image shows the relative proportion of potassium, thorium and uranium as an RGB
image, and their correlation with the topography. Pixel size is 100 m. U and Th rich
areas with high topography correspond to Sefwi Group metavolcanics as around
Cape Three Points and proximal to the Ashanti Fault. K-rich granitoids are well
defined in the eastern part of the area. 049
Figure I-5 Bouguer gravity map over the study area overlain with the regional fault
architecture. As a consequence of the low resolution of the grid (5 km per pixels),
only long wavelength features are observed, these features are interpreted to be
sourced from the major, deep-seated structures. 050
Figure I-6 ALOS PALSAR radar image consisting of three colour bands: red = HH radar
polarization, blue = HV, and green for the mean of both bands. Sefwi Group bedding
highlighted by volcanoclastic layers in this image is folded by E-W trending F1 folds
that are refolded by N-S trending F3 folds. See Figure I-1 for location. 051
Figure I-7 Histograms showing the range of measured susceptibility for each rock type found
in the area. Several samples were remeasured under laboratory condition to confirm
the field based data. The susceptibility of sediments is commonly ten times lower
than volcanic rocks. Granitoid susceptibilities are variable with the highest values
obtained from dioritic composition. Late doleritic dykes display high magnetic
susceptibility values. 056
Figure I-8 New stratigraphy for the southwest of Ghana based on new data from this study
(mapping) and previous studies (Whitelaw, 1929; Junner, 1940; Kesse, 1985; Pigois
et al., 2003; Adadey et al., 2009). Unit thicknesses are estimated from the map
(Figure I-13). For clarity stratigraphic layers are labelled by their dominant
lithology but could be subdivided into several sub-units. 057
Figure I-9 Photographs showing syn-sedimentary normal faults within Sefwi Group
volcanoclastic sediments. Some of these faults do not affect the youngest layers.

223
Others faults show post-depositional reverse movement that could reflect the start of
D1. The compass indicates both the north (in red) and the perspective. 058
Figure I-10 Stereo-plot diagrams representing measurement distribution on equal area
diagram (lower hemisphere), with density contours, for the three main rocks groups.
A) Distribution of the Kumasi Group and Tarkwaian sediments bedding poles are
in good agreement with the F3 folding (and S3 cleavage orientations). In contrast
the Sefwi Group bedding poles plots shows a wider dispersion resulting from the
interference of multiple fold generations (mostly F1 and F3). Stereo-plots of poles to
S1 confirm the presence of the earlier event (D1) affecting only the Sefwi Group.
B) D4 data are predominantly from the Wassa mine (Sefwi Group), although the
S4 cleavage is also observed in the Kumasi Group and in the Tarkwa Group along
the Ashanti Fault. S5 is sub-horizontal and consistent across each group. S6
corresponds to subvertical crenulation cleavage striking NW-SE. 060
Figure I-11 Interpreted photographs showing examples of D3 deformation. (A) In the Sefwi
Group, the S1 foliation defined by the alignment of biotite is partially transposed
along the S3 cleavage. (B) Series of F3 ptygmatic folds at the same location. These
F3 are folding a composite S0 / S1 foliation and some quartz veins. (C) On the
western side of the belt, F3 folds correspond to the first folding generation affecting
the Kumasi Group sediments. (D) Parasitic open folds in the hinge of the Damang
anticline in the Tarkwa Group. In all cases, S3 corresponds to a subvertical
crenulation cleavage resulting from a NW-SE shortening. The compass indicates
both the north (in red) and the perspective. 063
Figure I-12 Interpreted photographs showing the Ashanti Fault in Buesichem Pit (Bogoso
mine). The dark area in the middle corresponds to an approximately 20 m wide shear
zone. This major structure separates the Kumasi Group phyllites from the Sefwi
Group basalts. This shear zone operated as a thrust during D3 and was reactivated
with a sinistral shear movement during D4. In the footwall, carbonatization of the
basalts (light green band) is synchronous with gold mineralisation. The compass
indicates both the north (in red) and the perspectives view. Photographs of
lithologies are not oriented. 064
Figure I-13 New lithological (A) and structural (B) interpretation based on the integration of
new field observation, geophysical data and previous work. F1 folds built the
regional geometries of the Sefwi Group metavolcanics. F3 folds are dominant in the

224
Kumasi Group and Tarkwa Group sediments. D4 corresponds with a series of
sinistral shear zones outlining the edge of the Tarkwaian sequence and cross-cutting
it. S4 cleavage planes are oriented NE-SW and are observed around Bogoso/Prestea
and Wassa. D5 is a minor event and is not represented as it is a subhorizontal
cleavage. D6 is characterized by reverse faults oriented NW-SE. 067
Figure I-14 Detailed comparison of radiometric (over HH radar polarization) and magnetic
data (RTP, first vertical derivative after automatic gain control). The magnetic
trends do not correlate with bedding (S0) or S3 orientations observed in the Tarkwa
Group that are well imaged in the radiometric data. These trends may correspond to
older Sefwi Group lineaments (related to D1) beneath the Tarkwaian sediments. See
Figure I-1 for location. 069
Figure I-15 Test of susceptibility impact of deep units on magnetic RTP image. These tests
were conducted using Noddy software assuming a 3000 m maximum depth for the
Tarkwa Basin with various susceptibility contrasts between the Sefwi Group (BS)
and the Tarkwa Group (TS) susceptibilities. We note that the Sefwi Group structures
(folds in this example) are imaged beneath the Tarkwa Basin when the Sefwi Group
is at least 5 times more susceptible than the overlying Tarkwa Basin. 070
Figure I-16 Forward-modelled cross-sections across the Ashanti Belt. See Figure I-1 for
location of these sections. These models highlight the mineralised
Birimian/Tarkwaian contacts. Sefwi Group metavolcanics were highly deformed
during the D1 and contrast with the more open syn-D3 folding in the Tarkwa Basin.
Kumasi Group sediments on the western side of the Ashanti Fault were also
deformed by D3. Major gold deposits have been geometrically projected onto their
structural position. 075
Figure I-17 Correlations between stratigraphic sequences, magmatism, deformations and
mineralisations in southwest Ghana. The Cape Coast micaschists are not
constrained by absolute or relative ages. 076
---------------------------------------------------------------------------------------------------------------------
Figure II-1 Map and section of the southern Ashanti belt. The major hydrothermal gold mines
and the Tarkwa paleoplacer are shown. Our study area (black rectangle) is located
on the eastern border of the Tarkwa Basin. 091

225
Figure II-2 Geology of the Wassa mine (modified after Bourassa, 2003) draped over pit maps
(thin black lines). Projection is WGS84 / UTM zone 30N. All the lithologies have
been reoriented along a major F4 fold. Locations of the stereoplots of the S0-S1
fabric shown in Figure II-6 and of the photograph shown in Figure II-7 and are
marked. 092
Figure II-3 Photograph showing the five dominant lithologies found in the Wassa mine (after
Bourassa, 2003), drillcore samples. Macroscopic differences between the “mafic
volcanic”, the “felsic volcanic” and the phyllites are mostly a result of variable
volume of quartz and ankerite veins (see Figure II-4 for the mineralogy). 093
Figure II-4 Thin-sections photographs of the dominant lithologies sampled in the mine.
Plane-polarised light on the left image. Crossed polarised light on the righ image.
chl: chlorite, cal: calcite, ank: ankerite, qtz: quartz, pl: plagioclase feldspar, ms:
muscovite. A) The “Mafic volcanic, JM013)” show strong chlorite and carbonates
alignment that define the S1. The “felsic volcanic (JM017)” and the “phyllites
(JM015)” display equivalent mineralogy. B) The “metadiorite (JM016)” shows
similar mineral assemblages with large ankerite porphyroblasts up to 2 mm size that
are also observed on Figure II-3. C) The “felsic porphyry” contains plagioclase
feldspar, quartz, muscovites and rare ankerite. 094
Figure II-5 A) Extended trace elements profiles normalised to primitive mantle (Sun and
McDonough, 1989) of the “five lithologies” observed in the field (Figure II-3). *
Average composition of the Axim suite basalts as defined by Dampare et al., 2008. B)
Volcanic rock classification using Zr/TiO2 versus Nb/Y ratios (modified after
Winchester and Floyd, 1977). With the exception of the “felsic porphyry” intrusive
rocks (JM012), all lithologies of the Wassa mine display similar trace element
profiles. They correspond to enriched basalt signatures (enriched in light trace
elements and depleted in heavy rare earth elements) typical of the type-II basalts of
Dampare et al., 2008. 097
Figure II-6 Stereoplots. A,B,C) The S0-S1 foliation orientation varies from the south
(N38/subvertical) to the north (N064/47) of the Wassa mine area. These variations
define a major fold with a hinge centred on the mine site, related to D4 deformation.
D) Axial plane of this F4 correspond to the S4 crenulation cleavage
(N062/subvertical). E) The late D5 deformation is characterised by a subhorizontal
crenulation cleavage. 099

226
Figure II-7 Interpreted photographs of Eburnean deformations events found in the Wassa
mine. Locations are shown in Figure II-2. A) Metre-scale QV1 quartz vein folded by
isoclinal F1. This fold axial plane is parallel to the chlorite alignments that define
the S1 cleavage. B) This S0-S1 foliation was significantly deformed by F4 parasitic
fold and crenulated by the S4 cleavage. Rare (F3?) folds have also been observed
associated with quartz veins (white arrows in the bottom left corner). C) QV4 quartz
veins cross-cutting the major F4 folds and deformed by further D5 event. D) F5 open
to close recumbent folds. Fractures and QV5 quartz veins were often observed along
the axial surface of these folds, with late euhedral pyrite mineralisation. 100
Figure II-8 Thin-section observations of early-D1 structures, veins and mineralisation. A)
Transmitted light photograph of mineralised “mafic volcanic”. Chlorite alignment
carbonates and quartz-veins defined an S0 foliation folded by small scale F1. B)
Scanning Electron Microscope (SEM) mosaic image showing that pyrite are mostly
located and deformed within the S0-S1 ductile fabric. C) Reflected light photograph.
These pyrites strongly deformed during D1 do not show any fractures and host some
visible gold particles. 101
Figure II-9 A) Drill-core photograph showing small scale parasitic F4 fold with
concentration of D1-deformed pyrites in the hinge of the F4 (white arrows). B) Field
photograph of euhedral pyrite (up to 0.5 mm size) overprinting the S4 crenulation
cleavage. These late pyrite may have been formed during our D5 or D6 events.
102
Figure II-10 Schematic 3D diagram summarizing the three main folding events (D1, D4 and
D5) in Wassa mine, using Noddy software (Jessell, 1981, 2001; Jessell and Valenta,
1996). Map shown on Figure II-2 is approximately located on this model. Scaling is
not respected considering the F5 meter-size folds. 102
Figure II-11 Examples of mineralisation at the Wassa mine. A) Intensely foliated and
mineralised “mafic volcanic” with foliation parallel veins and later folding. Drill
hole NSADD006, 157-158m, 1.36 g/t Au. B) Isoclinal F1 folds defined by earlier
foliation in contact with porphyry unit. Drill hole SED0027. C) Intensely foliated and
mineralized “mafic volcanic” unit and early QV1 veins boundinaged along the
foliation, a later stage thicker quartz carbonate vein is located at right hand side of
figure (inferred QV4 vein set). Both veins sets are folded. Drill hole NSADD009 214-
215m, 3.38 g/t Au. D) Mineralized and boudinaged QV1 veins with adjacent

227
disseminated pyrite. The enlarged section highlights the pyrite is deformed within the
S1 foliation and is therefore pre- to syn-D1. Drill hole NSADD009 212-213m 2.48
g/t Au. E) Disseminated pyrite adjacent to QV1 veins. Drill hole BSDD090. 105
Figure II-12 Examples of veins with visible gold at the Wassa mine. A) Folded QV1 quartz vein
with visible gold. Note the folding increases the thickness of the vein. Drill hole
242DD029 180.6-181.6 66.8 g/t Au. B) QV5 quartz carbonate vein axial planar to an
F4 fold - the figure shows a photograph of both sides of the drill core (i.e. the same
vein is shown in top and bottom photograph). Visible gold is within black circle
drawn onto drill core. The gold-bearing vein clearly cross cuts the S4 foliation (note
top photograph). Drill hole SEDD025 164.7-165.3m 11.6 g/t Au. 106
Figure II-13 Examples of processed magnetic data. Pixel size is 25 metres. Rectangle shows
the location of Figure II-14 and of the Wassa mine. A) Reduced to pole image (RTP)
of the total magnetic intensity draped over the shaded first vertical derivative. B)
Vertical Integration image calculated from the analytic signal. C) Tilt derivative
calculated from the RTP image. Apart from the dolerite dykes, the strongest
magnetic response in the middle of these images corresponds to the Sefwi Group
hosting the Wassa deposit. 111
Figure II-14 Detailed magnetic lineament interpretation in the Sefwi Group. The area is
located on Figure II-13. A) The left image is the first vertical derivative after
automatic gain control draped over the magnetic RTP image. This combination
highlights subtle magnetic features and keeps an overview of the magnetic field
amplitude. Black lines are interpreted faults. B) The middle image show our
interpretation with the bedding folded by F1 and then refolded by F4 during D4
sinistral shearing. Brown dashed line on the south of the image represent the contact
(dipping southeast) between the Sefwi Group metavolcanics and a granodiorite
intrusion. C) The right image is a schematic interpretation of the D4 deformation in
the Wassa mine area characterised by a NNW-SSE shortening. Kilometre-scale F4
folds in the Wassa mine area could have been formed to accommodate sinistral large
scale shearing along the Sefwi Group/Tarkwa Group eastern contact. 112
Figure II-15 This image shows a combination of the K, Th and U bands as an RGB ternary
draped over the shaded digital elevation model. The potassium-poor area in the
western part of the image correlates with Tarkwaian metasediments. In contrast the
potassium-rich domain in the southeast corresponds to a granodiorite intrusion. The

228
Birimian supergroup from the northeast (Kumasi Group) to the south (Sefwi Group)
shows intermediate K, Th and U proportions. Pixel size is 25 metres. 113
Figure II-16 Histograms showing measured susceptibilities for each dominant lithology found
in the Wassa mine area. The “Mafic volcanic”, “felsic volcanic” and “metadiorite”
display high susceptibility values. The “Phyllites” (excepting the BMU) and the
“Felsic porphyry” are low susceptible. 114
Figure II-17 Lithological and structural interpretation of the Wassa mine region based on
interpretation of airborne geophysical data and mine observations. 115
Figure II-18 Spatial distribution of Au Assay data. A) Geological map of the Wassa mine
(modified after Bourassa, 2003). B) 3D distribution of Au assays data viewed from
above with gold grade > 0.5 g/t. Red color represent the highest gold grade, blue the
lowest. The highest gold grade outlines specific horizons which have been
preferentially mineralised and then folded by F1 and refolded around the large F4
fold hinge. 117
---------------------------------------------------------------------------------------------------------------------
Figure III-1 Map of the southern Ashanti Belt. Eoeburnean granitoids intruded the Sefwi
Group in the south and southeast of the Ashanti Belt. Eburnean intrusions are found
across the area with numerous intrusions found within the metasedimentary basins.
Samples collected in the study are reported on the map. 129
Figure III-2 Summary of granitoid ages, metavolcanic rock ages and deformation phases in
the southern Ashanti Belt. 130
Figure III-3 Photographs of granitoid outcrops: investigated granitoids were preferentially
sampled in quarry (a) (c), along the coast (b) or in large scale outcrops (d). Samples
from mine sites were collected as far as possible from the main mineralised zone. (a)
GH127B Granite with tonalitic aureole and hosting numerous mafic xenoliths,
overprint the D1 deformation of the Sefwi Group, Anibel village. (b) GH101
Granodiorite veins emplaced within the S3 foliation of the hosting garnet-bearing
micaschist, east of Cape Coast. (c) GH118B Foliated granodiorite, northwest of
Cape Coast. (d) GH237 Leuco-granite, any visible deformation, west of Twifo-Praso.
131

229
Figure III-4 Major elements versus SiO2 diagrams for all southwest Ghanaian Eoeburnean
and Eburnean igneous rock analyses from this study (large symbols) and from
published data (small symbols) of John et al. (1999), Loh et al. (1999), Yao et al.
(2000), Dampare et al. (2005, 2008), Attoh et al. (2006) and Adadey et al. (2009).
Eoeburnean intrusions show differentiation series from diorite / tonalite to
granodiorite end-members (see text for details). Eburnean granitoids are more
homogenous with granodiorite, granite and leucogranite compositions. 141
Figure III-5 (A) A/NK versus A/CNK diagram of Shand (1943). Both Eoeburnean TTG and
Eburnean granitoids present S-type and I-type characteristics. (B) Sr/Y versus Y
diagram (Martin, 1999). Eoeburnean TTGs Sr and Y proportions are consistent with
actual granitoid values while Eburnean granitoids are closely similar to the Adakite
and Archean TTG with high Sr/Y ratios. C) Na2O, K2O, CaO ternary diagrams.
Eoeburnean TTGs seem to follow a typical calc-alkaline trend (Barker and Arth,
1976) while most of the Eburnean granitoids are located in the TTG domain of
Martin (1994). 142
Figure III-6 Trace element profiles for (A) the Eoeburnean TTGs and (B) the Eburnean
granitoids normalised to primitive mantle (Sun and McDonough, 1989). * Analyses
from Adadey et al. (2009), ** Analyses from Grenholm (2011), remainder of
analyses from this study. Radiometric ages from Hirdes et al. (1992), Attoh et al.
(2006), Oberthur et al. (1998), Adadey et al. (2009) and Scherstén (unpublished data
referenced in Grenholm, 2011). 143
Figure III-7 Metasediment geochemistry. (A) Plot of the K2O / Na2O ratio versus SiO2 /
Al2O3 ratio for Sefwi, Kumasi and Tarkwa group metasediments. * Average ratios.
(B) Trace elements profiles for the Sefwi Group and Tarkwa Group phyllites
normalised to the Early Proterozoic Crust (Condie, 1993). * Kumasi Group
metasediments profile is an average calculated from geochemical analyses of Asiedu
et al. (2004, 2009). 144
Figure III-8 Evolution of garnet proportion in different lithologies as a function of pressure
and temperature (blue lines, wt. %). Pseudosections were computed on typical (A)
foliated granitoid (TTGs), (B) gabbro, (C) sediments and (D) basalt sampled in the
southern Ashanti belt region (Ghana). This diagram shows that all of the analysed
Eoeburnean lithologies can form garnet before reaching the solidus (thick red line)
whatever the considered geothermal gradient. Thin red lines represent the

230
percentage of melt. Calculations are for a CaTiMnNKFMAS system and for H2O
saturation conditions corresponding to the LOI (loss on ignition) values. See text for
details of model parameters. 149
Figure III-9 Schematic model of the evolution of the Paleoproterozoic crust in southwest
Ghana. (A) During the first phase (Eoeburnean), the initial basement (that may
consist of an oceanic plateau) was deformed and intruded by the Eoeburnean
granitoids in a subduction context. Synchronous calc-alkaline volcanism built the
upper layers of the Sefwi Group stratigraphy. (B) During the second phase
(Eburnean), this thickened crust was deformed and intruded by numerous granitoids.
According to our geochemical analyses, these granitoids may results from partial
melting of a metamorphosed lower crust that is composed of both the mafic rocks
and the Eoeburnean intrusions. 150
---------------------------------------------------------------------------------------------------------------------
Figure IV-1 A) West African Craton with the location of the study area. B) Map of the
southern Ashanti Belt with the location of the major faults and of the gold deposits.
Black line outlines deposits hosted by the Sefwi Group that are detailed on Figure
IV-8 and on Table IV-4. C) New map of the Sefwi Group geology beneath the Tarkwa
Basin. 165
Figure IV-2 Images of the free air gravity anomalies and of the total magnetic intensity data of
the southern Ashanti Belt. A) The observed free air gravity image (A) has a
resolution of 2.5 arc minute per pixel (4.6 km). B) Total magnetic intensity image
were gridded with a resolution of 100 m. Coordinates are in UTM (WGS 84), zone
30N. 166
Figure IV-3 Schematic diagram showing the different steps used for the 3D modelling of the
Ashanti Belt (see text for details). 168
Figure IV-4 High resolution (HR) three dimensional model of the studied area after gravity
inversions and recalculation using Geomodeller. Only the Sefwi Group, the intrusive
rocks and the major faults (grey) are shown. Eo. Eoeburnean granitoids, Eb.
Eburnean granitoids, A. Ashanti Fault, B. Benso Fault, C. Cape Three Point Fault.
Coordinates are in UTM (WGS 84), zone 30N. 175

231
Figure IV-5 Horizontal sections (maps) of the 3D HR model built at various depth. They show
clearly the asymmetric shape of the Tarkwa basin with maximum depths reached on
the northwestern part along the Ashanti fault. The geometry of the Birimian Sefwi
group is constrained by bedding orientation data close to the surface and by gravity
data inversions at depth. 176
Figure IV-6 Observed (A), Calculated (B) and Residual (C) free air gravity map calculated
after inversion of the 3D HR model. Lower images represent Free Air gravity after
sampling of the grids at the location of the ground gravity data point (BGI). These
images show that the HR model is geophysically consistent with the gravity data.
177
Figure IV-7 Observed (A), Calculated (B) and Residual (C) total magnetic intensity map
calculated from the 3D HR model. The absence of remanence data for the intrusive
rocks (with the exception of the dolerite dykes) explains most of the difference
between the observed and the calculated images. However, most of the residual
anomalies represent less than 10 % (< 100 nT) of the intensity range (≈ 1000 nT).
178
Figure IV-8 3D view of the BV1 layer (tholeiitic metabasalts) and major faults with the
location of the gold occurrence in the southeast of the Ashanti Belt. The BV1 layer is
displayed down to 5000 m depth. Coordinates are in UTM (WGS 84), zone 30N. All
deposits listed in Table IV-4 are located on this figure. 181
Figure IV-9 Proportion of gold deposit at distance < 1500m from each modelled units. 18/21
gold deposits are located at short distance from the BV1 metabasalts layer. This
proportion decreases progressively for the upper stratigraphic layers. 182
Figure IV-10 Map of the distance between the topography and the BV1 metabasaltic layer. This
distance is displayed up to 3000 m. 182

232

233
Annexes

234

235
Annexe 1 : Données d’affleurements et cartes
Les données d’affleurements (localisations, mesures structurales, numéros
d’échantillons), les mesures de susceptibilité magnétique, les mesures de densité, les analyses
géochimiques, la liste des lames minces, ainsi que les cartes et modèles géoréférencés produits
durant ces travaux de recherche, sont disponibles en format numérique (cf. DVD ci-joint).

236

237
Annexe 2 : Métamorphisme, premiers résultats
Chemins pression-température obtenus, pour différents échantillons du sud-ouest
du Ghana, par analyse des assemblages Chlorites / Micas Blancs (JM09, phyllites
Birimiennes, groupe de Kumasi, mine de Pampe, GH36, phyllites Birimiennes,
groupe de Kumasi, mine de Bogoso, GH512, quartzites Tarkwaiennes, mine de
Damang, GH517, phyllites Birimiennes, groupe de Sefwi, mine de Wassa) et des
assemblages Staurotides / Grenats (GH101B, paragneiss, groupe de Sefwi, Cape
Coast, GH397, phyllites Tarkwaiennes, mine de Damang). Ces échantillons, ainsi
que les analyses de la littérature (Ledru et al., 1994, John et al., 1999 Kleinschrot et
al., 1994), suggèrent tous des pressions maximales autour de 5 kbar et des
températures très variables, probablement controlées par les intrusions de
granitoïdes Éburnéens.

238

239
Annexe 3 : Liste de publications associées à cette thèse
Revised Eburnean geodynamic evolution of the gold-rich southern Ashanti Belt,
Ghana, with new field and geophysical evidence of pre-Tarkwaian deformations, Stéphane
Perrouty, Laurent Aillères, Mark W. Jessell, Lenka Baratoux, Yan Bourassa, Brenton Crawford,
Precambrian Research, 2012, 204-205, 12-39, http://dx.doi.org/10.1016/j.precamres.2012.01.003
The tectonic context of the Eoeburnean Wassa gold mine - Implications for relative
timing of mineralising events in southwest Ghana, Stéphane Perrouty, Mark W. Jessell, John
Miller, Yan Bourassa, Daniel Apau, Luc Siebenaller, Germán Velásquez, Laurent Aillères,
Didier Beziat, Stefano Salvi, Lenka Baratoux, Submitted to Precambrian Research
A new model for Paleoproterozoic crustal growth in southwest Ghana: an
Eoeburnean crustal source for the younger Eburnean granites, Stéphane Perrouty, Lenka
Baratoux, Jérôme Ganne, Michel Grégoire, Mathieu Benoit, T. Campbell McCuaig, Mark W.
Jessell, Laurent Aillères, Submitted to Lithos
3D modelling of the Ashanti Belt, southwest Ghana, and lithostructural control on
gold occurrences within the Sefwi Group, Stéphane Perrouty, Mark D. Lindsay, Mark W.
Jessell, Laurent Aillères, Roland Martin, Yan Bourassa, In preparation

240

241

242
AUTEUR : Stéphane Perrouty
TITRE : Évolution Structurale de la Ceinture Minéralisée d’Ashanti, SO Ghana
DIRECTEUR DE THÈSE : Dr. Mark W. Jessell (I.R.D.), Dr. Laurent Aillères (Monash University)
LIEU ET DATE DE SOUTENANCE : Mardi 19 Juin 2012, Observatoire Midi-Pyrénées, Toulouse
---------------------------------------------------------------------------------------------------------------------
RESUMÉ EN FRANÇAIS :
La ceinture Paléoprotérozoïque d’Ashanti, au sud-ouest du Ghana, est l’hôte de
nombreux gisements d’or, de classe mondiale, tels les gisements d’Obuasi (60 million d’onces)
et de Tarkwa (40 millions d’onces). La caractérisation de l’évolution structurale et magmatique
régionale permet d’éclaircir le contexte géotectonique de formation de ces gisements et ainsi
fournir des pistes pour de futures explorations. Ainsi, au cours de ces travaux de thèse, ont été
réalisés : (1) une nouvelle carte géologique et structurale de la région, en accord avec les
observations de terrains et les données de géophysique aéroportée, (2) une étude détaillée du
gisement d’or précoce de la mine de Wassa, (3) une étude de l’évolution du magmatisme au
cours de l’Orogénèse Éburnéenne et (4) un modèle tridimensionnel de la ceinture d’Ashanti
mettant en évidence un possible contrôle litho-structural sur la localisation des minéralisations.
---------------------------------------------------------------------------------------------------------------------
MOTS-CLÉS : Afrique de l’Ouest, Ghana, Paléoprotérozoïque, Birimien, Tarkwaien, Éburnéen,
Minéralisations, Or, Granitoïdes, Interprétations Géophysiques, Modélisation 3D
---------------------------------------------------------------------------------------------------------------------
DISCIPLINE ADMINISTRATIVE : Sciences de la Terre et des Planètes Solides
---------------------------------------------------------------------------------------------------------------------
LABORATOIRE : Géosciences Environnement Toulouse (G.E.T.), UMR 5563, UR234
Obs. Midi-Pyrénées, 14 Av. Edouard Belin, 31400 Toulouse, France