
Stronger Together - Sagicor Life Insurance Company
318
Stronger Together 2020 ANNUAL REPORT
-
Upload
khangminh22 -
Category
Documents
-
view
1 -
download
0
Transcript of Stronger Together - Sagicor Life Insurance Company

Stronger Together2020 ANNUAL REPORT

Stronger Together | 2020 Annual Report
OUR VISIONTo be a great company committed to improving the lives of people in the communities in which we operate.

TABLE OF CONTENTS
FINANCIAL HIGHLIGHTS 2
SAGICOR GROUP CHAIRMAN’S REVIEW 5
SAGICOR GROUP PRESIDENT & CHIEF EXECUTIVE OFFICER’S MESSAGE 7
BOARD OF DIRECTORS 10
EXECUTIVE MANAGEMENT 16
GROUP ORGANISATIONAL CHART 22
CORPORATE & SOCIAL RESPONSIBILITY 24
HUMAN CAPITAL REPORT 39
INNOVATION & TECHNOLOGY 45
MANAGEMENT DISCUSSION & ANALYSIS 46
INDEX TO THE CONSOLIDATED FINANCIAL STATEMENTS 130
SHAREHOLDER INFORMATION 308
OFFICES 310
1

(4) 87 37 62 6020192 2018 2017 20162020
2019 2018 2017 20162020 2019 2018 2017 201620202019 2018 2017 20162020
2019 2018 2017 2016202020192 2018 2017 2016202033 15 15 15 14
7.59 7.81 8.50 8.83 7.66
9,266 8,729 7,308 6,805 6,532 7,136 6,461 5,700 5,464 5,3412,128 2,266 1,622 1,352 1,190
1 from continuing operations 2 before Alignvest Acquisition II Corporation transaction costs3 under the Alignvest transaction, Sagicor Financial Corporation Limited common shares not purchased for cash, were exchanged for common shares of Sagicor Financial Company Ltd on an exchange ratio of one Sagicor Financial Company Ltd. common share for 4.328 of Sagicor Financial Corporation Limited common shares (“Exchange Ratio”). This exchange ratio has been used to convert the 2018 and prior years outstanding shares to the Sagicor Financial Company Ltd equivalent.
NET INCOME 1 COMMON DIVIDENDS BOOK VALUE PER SHARE3
ASSETS 1 OPERATING LIABILITIES EQUITY & DEBT CAPITAL (TOTAL CAPITAL)
SHAREHOLDERS’ RETURNS
GROUP FINANCIAL POSITION
1 from continuing operations
2020 20192 2018 2017 2016 Basic earnings per share 3 (2.4¢) 57.5¢ 51.7¢ 88.7¢ 84.4 Return on shareholder’s equity 1,2 (0.3%) 10.50% 6.20% 11.30% 12.30
2020 2019 2018 2017 2016 Debt to Capital 22.2% 22.8% 30.2% 30.5% 33.2% MCCSR 252% 253% 234% 258% 249%
FINANCIAL HIGHLIGHTS2

(15) 147 96 106 108 1,878 1,867 1,386 1,219 1,1341,221 1,117 765 659 560
49 59 47 64 65 38 124 111 95 90(27) 35 18 13 10
20192 2018 2017 20162020
2019 2018 2017 20162020 2019 2018 2017 201620202019 2018 2017 20162020
2019 2018 2017 201620202019 2018 2017 20162020
NET INCOME 1 REVENUE BENEFITS
SAGICOR LIFE INC - NET INCOME 1 SAGICOR GROUP JAMAICA - NET INCOME 1 SAGICOR USA - NET INCOME 1
GROUP RESULTS 1
SEGMENT RESULTS
1 from continuing operations
2020 2019 2018 2017 2016 Revenue 523 533 340 421 411 Assets 2,279 2,116 2,008 1,953 1,928
2020 2019 2018 2017 2016 Revenue 632 735 586 590 524 Assets 3,455 3,482 3,104 2,836 2,674
2020 2019 2018 2017 2016 Revenue 679 562 421 159 149 Assets 3,383 2,842 2,293 1,982 1,901
1 from continuing operations 2 from continuing operations (before Alignvest Acquisition II Corporation transaction cost)
FINANCIAL HIGHLIGHTS 3

Timothy HodgsonSAGICOR GROUP CHAIRMAN
4

SAGICOR GROUP CHAIRMAN’S REVIEWDear Shareholders:
Our 2020 results have been dominated by COVID-19, one of modern history’s most challenging health and economic crises, and we expect the challenges to continue into 2021. The pandemic affected the tourism dependent Caribbean regions in which we operate, just as it impacted economies around the world. In the face of this unprecedented disruption, Sagicor remained steadfast in its objectives, and adaptive in its ways of doing business. Drawing upon 180 years of experience as a market-leading financial services provider with a strong capital position, Sagicor demonstrated its resilience, as well as its social responsibility.
The pandemic profoundly changed the way we interact with each other and how we do business. It forced us to adapt innovative strategies to accelerate business initiatives. Our customers depended on us and in response, we introduced new products, digital technologies for broader engagement, and simpler ways of doing business. Sagicor continues to use its broad platform to support its communities. We willingly shoulder our responsibility as a corporate leader in the Caribbean and as a leading indigenous financial institution.
The past year marked our first full year as a Toronto Stock Exchange (TSX) public company, and it was also my first year as Chair of the Board. I owe a debt of gratitude to my fellow Board members and the entire management team at Sagicor for their dedication and commitment during the burgeoning pandemic. Our open and transparent discussions, facilitated by a transition to virtual meetings, allowed us to quickly pivot, and continue providing the
critical oversight and strategic direction needed during such challenging times. During the year, the Board provided guidance on business initiatives, ever mindful of the need to balance shareholder value creation and capital allocation decisions.
As the pandemic’s impact became more quantifiable, we pursued digital business transformation strategies that could benefit our service offerings and enhance our workflows. We also encouraged leadership at all levels of the organisation to help develop strategies for helping our stakeholders to weather the pandemic storm – employees, customers policy holders, and the communities we serve. Sagicor used its financial strength in ways that not only supported stakeholders, but that could also position the company to be stronger once the pandemic is safely behind us.
As we looked forward, we embarked on a full multi-year strategic review and planning exercise with management. The decisions we adopted were driven by our strong risk culture, as well as our focus on profitable growth and sustainability. Our Governance and Nominating Committee conducted their annual review of executive compensation and succession plans to ensure we have the proper framework to attract and retain the talent needed to execute our strategic vision. On the matter of board diversity, we are a leader in terms of ethnic and geographic diversity on our board. At the same time, we are also committed to increasing the gender diversity on our board.
The Board experienced some changes to its directors during the year. The Board reappointed Mr. Monish Dutt, having served on the Board of Sagicor Financial
Corporation Limited for nearly a decade. We also welcomed Mr. Gil Palter and Mr. Jonathan Finkelstein to the Board. In September, we mourned the sad passing of Mr. John Shettle Jr., a board member since 2008. We deeply appreciated John’s years of service and significant contribution to Sagicor’s development, and especially his work on various committees.
On behalf of the Board of Directors, I would like to thank our policyholders, our customers, our employees, our advisors, our shareholders and our many business affiliates for the support, commitment and trust you have placed in Sagicor. We will continue to do our best to consistently and effectively serve your needs. To our Group President and Chief Executive Officer, Mr Dodridge Miller, and his executive team, the Board expresses its confidence in your tireless work to fulfill Sagicor’s ongoing purpose. To the Sagicor family, the Board is grateful for your continued commitment to assisting your communities, especially in the face of natural disasters and the ongoing COVID-19 pandemic.
I firmly believe we will come out of this crisis stronger together. Stay safe and stay well.
Yours truly
Timothy Hodgson
Chair of the Board of Directors
Stronger Together | 2020 Annual Report 5

Dodridge MillerGROUP PRESIDENT &
CHIEF EXECUTIVE OFFICER
6

SAGICOR GROUP PRESIDENT & CHIEF EXECUTIVE OFFICER’S MESSAGEDear Shareholders:
The year 2020 was a challenging one for the world as it was for Sagicor. A Global pandemic rocked the world from very early in the year and the social and economic upheaval quickly raced around the globe. At Sagicor, we successfully leveraged our more than 180 years of experience to ensure first the safety of our staff and customers, and secondly the maintenance of high-quality service to all of our stakeholders. We demonstrated flexibility and agility in our ability to efficiently pivot into a digital world, successfully transitioning and adapting our approach to doing business in each of our markets. The COVID-19 pandemic accelerated transformational shifts that fortunately, were already underway at Sagicor. I am extremely proud of the way Team Sagicor responded to the changing environment.
In our experience, people generally hold on to their insurance products during periods of economic uncertainty, and this was proven true as we weathered the unheralded challenges presented in 2020. While new business production was impacted during the second and third quarter; periods of lock-down and various “stay at home” restrictions, the fourth quarter of 2020 saw a reasonable return to normal business with production near previous year levels. Our existing business mostly remained intact as we accelerated several e-commerce initiatives across client portals, websites and branch locations. This served to make the organisation more efficient while also safeguarding the health and safety of employees and customers.
2020 in Review
Sagicor entered 2020 in a position of financial strength, following the capital raised from our December 2019 listing on the Toronto Stock Exchange. While it is still too early to assess the full impact, our new stock exchange listing exposed Sagicor to a more liquid equity capital market and brought in over $450 million of additional capital and new long-term investors to Sagicor. Going forward, we are committed to building our presence in these new markets and engaging new investors, while leveraging our brand leadership and reputation in our home markets, as we execute our purpose-driven strategy.
Our financially strong position helped us maintain and improve our credit ratings during the year, validating that others view Sagicor as resilient, well-capitalised and diversified across our many geographies and lines of business. At the Group level, support to our segments enabled them to be as efficient and financially profitable as possible, while positively influencing many lives in the markets we serve.
For financial year 2020, Sagicor earned total revenues of $1.9 billion, despite the challenging environment. After three quarters of slower new business, we were pleased to see some recovery of the business in the fourth quarter with stronger new business across all segments. We were also pleased that our fourth quarter returned to a pre-pandemic earnings pattern, delivering $29 million in net income to shareholders. Our fourth quarter benefited from normalisation of new business sales across all segments, and the
positive impact asset optimisation efforts in our Sagicor Life segment. However, overall, the Group recorded a loss for the year to shareholders of $4 million, driven by lower interest rates, strengthening of actuarial reserves for forward looking assumptions and increased credit losses. From a balance sheet perspective, we ended the year with assets of $9.3 billion, an increase of $500 million, as we continue to focus on growth and internal capital optimisation. We believe we are well positioned to execute our growth plans with a strong foundation of financial, operational and risk management strengths.
Key Business Segments:
With a committed workforce of over 4,500 team members and advisors in the Caribbean, Sagicor operates in 17 countries throughout the English speaking Caribbean and the Dutch countries of Curacao and Aruba. During the past year, Sagicor leveraged its market leading position, to enhance its offering of individual life and annuities, employee benefits, group health and life, group pension and asset management, commercial banking and general insurance.
While the pandemic ushered in much uncertainty and fear, our response was purposeful, and customer centered. Attention was paid to how and when to better service our customers in a swiftly evolving environment. We focused on product development and new technological solutions, and our Group Life and Health division launched products and services such as the Frontline Heroes and Healthcare Heroes plans, which catered to the medical fraternity
Stronger Together | 2020 Annual Report 7

and other frontline professionals. We also fast-tracked the acceptance of telemedicine claims and facilitated business interactions through the introduction of e-fillable applications and automatic underwriting solutions.
Utilising an extensive network of independent agents, Sagicor USA successfully offers annuities and life insurance to individuals. The outstanding performance of our automated underwriting technology, Accelewriting, contributed in part to Sagicor Life (USA) being recognised by the publication “Life Annuity Specialist” in June as one of the fastest growing US individual life insurers in 2020. We believe that our competitive pricing and product design, underpinned by top service, will continue to lead to opportunities in growing our life and annuity business in the US.
Sagicor Life (USA) has approximately 30% of cases submitted on Accelewriting, receiving an underwriting decision in less than 2 minutes. In addition, the average cycle time for term products submitted to Sagicor via a widely used industry platform was observed to be in the top quartile in 2020 relative to competition. We expect to achieve scale over time in this market.
Corporate and Social Responsibility
Sagicor’s guiding force during 2020 emanated from its corporate vision, “to be a great company, committed to improving the lives of people in the communities in which we operate”. We maintained our longstanding tradition of supporting worthwhile projects in the areas of health, education, community, youth development and sport. Helping communities and policyholders in good times and bad is a mindset that is well ingrained within Sagicor, and this is one of the main contributing factors to our long,
successful 180 years of history in the Caribbean, and our growing presence in the United States. I am proud of our peoples’ strong spirit, creativity and resolve to address community needs.
Market Environment and Outlook
The Caribbean took a proactive approach very early on in the pandemic and closed its borders in some regions and kept others open to varying degrees, while not hesitating to adjust where needed in response to the virus. Because Sagicor has the benefit of a diversified region with varying economic landscapes and dependencies, the full impact of the pandemic was somewhat mitigated. I am very proud of the role Sagicor has played throughout this crisis. As key private sector representatives, our executives actively participated in the development and coordination of the region’s response to the pandemic. While the near-term economic outlook for the Caribbean remains uncertain, the aggressive roll out of the vaccines regionally and globally should allow for a faster re-bound of the vital tourism sector, which should have a positive impact on Caribbean economies.
2021 and Beyond
At the end of year, Mr. Ravi Rambarran, President & CEO of Sagicor Life Inc. retired from the Sagicor Group. Ravi has been an important part of our growth and development for more than two decades. We wish him well in his retirement. Mr. Robert Trestrail was appointed as President and CEO of Sagicor Life Caribbean, succeeding Mr. Ravi Rambarran. Robert has been with Sagicor in various leadership roles since 2007, most recently being the head of our Trinidad & Tobago operations. Robert has the knowledge and experience to lead Sagicor Life through the next phase of its development.
As I look towards the future, I am confident that Sagicor is well-positioned to thrive in a post-COVID-19 environment. Our strong capital position and innovative customer focused operating mindset should support our strategy of profitable long-term growth.
I would like to express my gratitude to our Team Members, our customers, shareholders and business partners for their support this past year. I especially offer my heartfelt appreciation to our Board of Directors and to each of our 4500 plus team members for their hard work and ongoing commitment, which enabled us to navigate this past year so effectively and register yet another strong performance. Thank you for taking on new challenges and working together as a true Sagicor team – where, we are stronger together.
Yours sincerely
Dodridge D MillerSagicor Group President and Chief Executive Officer
Stronger Together | 2020 Annual Report8

We are stronger together.

BOARD OF DIRECTORS
STRONGER TOGETHER
10

BOARD OF DIRECTORSTIMOTHY HODGSON
Timothy Hodgson is Chair of the Board. He is a professional corporate director. He currently chairs the Investment Committee on the board of the Public Sector Pension Investment Board (PSP Investments) and is Chair of the board of directors of Hydro One Limited. Mr. Hodgson’s prior directorships include MEG Energy, the Global Risk Institute, KGS-Alpha Capital Markets, Next Canada, the Richard Ivey School of Business and Bridgepoint Health.
He was previously a Managing Partner with Alignvest Management Corporation (“AMC”), having served at the firm from 2012 to August 2019. Mr. Hodgson was the special advisor to Mr. Mark Carney, Governor of the Bank of Canada, from 2010 to 2012. From 1990 to 2010, he held various positions with Goldman Sachs in New York, London, Silicon Valley and Toronto, serving as Chief Executive Office of Goldman Sachs Canada from 2005 to 2010. He holds a Master of Business Administration degree from the Richard Ivey School of Business at Western University, and a Bachelor of Commerce degree from the University of Manitoba. He is a Fellow of the Institute of Chartered Professional Accountants and has earned the ICD.D designation from the Institute of Corporate Directors.
DODRIDGE MILLER
Dodridge D. Miller has been Group President and Chief Executive Officer of SFCL since July 2002 and has been a director since December 2002. Mr. Miller joined SFCL in 1989 and has more than 30 years’ experience in the banking, insurance, and financial services industries. He previously held the positions of Treasurer and Vice President - Finance and Investments, Deputy Chief Executive Officer and Chief Operating Officer. Mr. Miller is also a director of a number of subsidiaries within Sagicor. Mr. Miller is a Fellow of the Association of Chartered Certified Accountants (FCCA) and obtained his Master of Business Administration from the University of Wales and the Manchester Business School. He holds an LL.M in Corporate and Commercial Law from the University of the West Indies and in 2008 was conferred with an honorary Doctor of Laws degree by that institution.
SIR HILARY
Sir Hilary was elected an independent director of SFCL in 2005. He is the Vice-Chancellor of The University of the West Indies. He is currently Chairman of the Caribbean Examinations Council. He is also a founding member of the Science Advisory Board and Sustainable Development Secretary established by the Secretary-General of the United Nations and serves on the United Nations Development Programme’s Advisory Panel on the Caribbean Human Development Report, is Vice President of UNESCO’s Slave Route Project and is Vice President of the Commonwealth Ministers’ Advisory Board on Sport and Development. Sir Hilary is an Editor of the UNESCO General History of Africa Series, volume 9. Sir Hilary earned his PhD from Hull University, United Kingdom, from which he received an Honorary Doctorate of Letters in 2003. He also received honorary Doctorates of Letters from the University of Glasgow, Brock University in Canada, Kwame Nkrumah Science and Technology University in Ghana, and the University of the Virgin Islands. In 2007, he received a knighthood, Commander Knight of St. Andrew (KA), the highest national honour recognised in Barbados, “in recognition of his distinguished service in the fields of Education, Sports and the Arts”.
DR ARCHIBALD CAMPBELL
Dr. Archibald Campbell is a director of the Company. He is currently Chairman of JMMB and most of its subsidiaries. He is Chairman of the Board of Trustees of the JMMB Pension Fund and Trustee at the University of the West Indies Non-FSSU Staff Pension Scheme. Prior to this he served as a Director at the University Hospital of the West Indies, a member of the Sugar Industry Divestment negotiation team and also as director of several companies that included Hotels, Property Management, Banks and a number of non-profit organisations. He also served as Bursar of the UWI and Chief Financial Officer with responsibility for maintaining relations with the seventeen Contributing Caribbean countries with regard to funding. He is a Chartered Accountant and has served as an accounting expert in an arbitration. Archibald is a past president of the Institute of Chartered Accountants of Jamaica. He was awarded the honour of being the 2020 Distinguished Member. Archibald has a Doctorate in Business Administration (DBA) and a M.Sc. in Accounting from the University of the West Indies.
11

PETER CLARKE
Mr. Clarke is a director of the Company as well as certain of its subsidiaries. Mr. Clarke is a Financial Consultant who practiced as a Barrister-at-Law before embarking on a 22-year career in stockbroking. From 1984-2000, he was the Managing Director of Money Managers Limited, and served as the Chief Executive of West Indies Stockbrokers Limited from 2001 to 2005, when he retired. From 2002 to 2005, he was also a director of the Trinidad and Tobago Chamber of Industry and Commerce. From 1995 to 1999 he was Chairman of the Trinidad and Tobago Stock Exchange, and he is currently a director of that organisation. From 1992 to 1995, Mr. Clarke served as Deputy Chairman of the Trinidad and Tobago Free Zones Company, and he is currently the Chairman of Guardian Media Limited in Trinidad and Tobago, and a director of 14 other companies including the Trinidad and Tobago IFC Management Company Limited. Mr. Clarke is a member of the Finance Council of the Roman Catholic Archdiocese of Port of Spain. He obtained a Bachelor of Arts degree from Yale University and a law degree from Downing College, Cambridge University. Mr. Clarke was called to the Bar as a member of Gray’s Inn in London in 1979, and to the Bar of Trinidad and Tobago in 1980.
KEITH DUNCAN
Keith Duncan is a director of the Company. Since 2005 he has been the Chief Executive Officer of JMMB, with responsibility for the overall performance and charting the strategic direction of the business. Under his leadership, JMMB was conferred with the American Foundation for the University of the West Indies (AFUWI) Award for Excellence in Business Leadership in February 2020, and the ‘Best of Chamber Award’ from the Jamaica Chamber of Commerce in March 2011. From 2012 to 2014, he served as Vice President of the Private Sector Organisation of Jamaica and is currently the President of that organisation. Mr. Duncan is also a past president of the Jamaica Securities Dealers’ Association and currently chairs the Government of Jamaica’s Economic Programme Oversight Committee. Mr. Duncan obtained a Bachelor of Arts degree in Economics from the University of Western Ontario in Canada and holds the Chartered Financial Analyst accreditation.
STEPHEN FACEY
Stephen Facey is a director of the Company and Sagicor Group Jamaica Limited. He is the Chairman and Chief Executive Officer of PanJam Investment Ltd. and Chairman of a number of other organisations, including Jamaica Property Company Ltd., New Castle Group of Companies, Caribbean Policy Research Institute (CAPRI), Kingston Restoration Company Ltd, and the New Kingston Civic Association. Mr. Facey serves as Chairman of the C.B. Facey Foundation, the charitable arm of PanJam Investment Ltd. Mr. Facey is a Director of Chukka Caribbean Adventures and the National Gallery of Jamaica. An architect by training, he has over 40 years of experience in architecture, real estate development and management, and private equity investing. Mr. Facey holds a Bachelor’s degree in Architecture from Rice University and a Master’s degree in Architecture from the University of Pennsylvania.
MAHMOOD KHIMJI
Mahmood Khimji is a director of the Company. Mr. Khimji is a founding Principal of Highgate, a real estate investment and hospitality management company, and has been involved in all aspects of Highgate’s development since its founding in 1988. Prior to founding Highgate, Mr. Khimji practiced law at Paul, Weiss, Rifkind, Wharton & Garrison. Mr. Khimji is on the Board of Directors of Playa Hotels & Resorts and American Hotel Income Properties and is a member of the Young Presidents’ Organisation (YPO) and the Real Estate Forum. He previously held board positions at MeriStar Hospitality Corporation, Interstate Hotels, and Morgans Hotel Group. Mr. Khimji also serves on the National Committee of Aga Khan Foundation USA and on the boards of Aga Khan Museum, the Asia Society, and Trinity School. Additionally, Mr. Khimji serves on the Board of Visitors for Columbia Law School. He attended the University of British Columbia, holds a B.A., summa cum laude, from the University of Houston and a J.D. from Columbia Law School.
BOARD OF DIRECTORS
STRONGER TOGETHER
12

STEPHEN MCNAMARA
Stephen McNamara is Vice-Chair of the Board (the “Vice-Chair”) and is a director of Sagicor Group Jamaica Limited and serves on the board of a number of other subsidiaries within the Sagicor group of companies, including as Chairman of Sagicor’s main operating subsidiaries, Sagicor Life Inc., Sagicor USA and Sagicor Finance Inc. Mr. McNamara was also Chairman of SFCL between January 2010 and December 2019. The senior partner of McNamara & Company, Attorneys-at-Law of St. Lucia, Mr. McNamara was called to the Bar at Lincoln’s Inn and in St. Lucia in 1972. He specialises in the representation of foreign investors in St. Lucia in the tourism, manufacturing and banking sectors and served as Chairman of the St. Lucia Tourist Board for nine years. His St. Lucia-based service also includes the board of directors of St. Lucia Electricity Services Ltd. where he served as Chairman from 2015 until his retirement at the end of 2017, and as President of the St. Lucia Tennis Association. In the 2015 Queen’s Birthday Honours, Mr. McNamara was made a Commander of the Order of the British Empire for public service and services to the legal profession. Also, in 2015, he was awarded an honorary doctorate from the University of the West Indies for his outstanding achievements and contribution to the region in the areas of business, sport and general philanthropy for more than 40 years.
REZA SATCHU
Reza Satchu is a director of the Company. He is Managing Partner and co-founder of AMC, a private investment firm. Previously, Mr. Satchu was the President, Chief Executive Officer and a director of AQY, where he participated in sourcing, evaluating and executing the qualifying acquisition. He has co-founded, built and/or managed several operating businesses from inception, including AMC; SupplierMarket, a supply chain software company that was sold to Ariba Inc.; StorageNow, which became one of Canada’s largest self-storage companies prior to being sold to Instorage REIT; and KGS-Alpha Capital Markets L.P., a U.S. fixed income broker dealer, that was sold to BMO Financial Group. Previously, Mr. Satchu was a General Partner at Fenway Partners, a US$1.4 billion private equity firm focused on acquiring middle market companies and was also a Financial Analyst at Merrill Lynch in the High Yield Finance and Restructuring Group. He is the Founding Chairman of Next Canada, an entrepreneurship program for Canadian entrepreneurs. Currently on the board of directors of Trilogy International Partners Inc., Mr. Satchu previously served on the board of directors of the Toronto Hospital for Sick Children Foundation where he was Vice Chairman of the board of directors, and of KGS-Alpha Capital Markets. He has received Canada’s “Top 40 Under 40” Award and the 2011 Management Achievement Award from McGill University. Previously, Mr. Satchu was an Adjunct Professor at the University of Toronto and currently serves on the faculty at the Harvard Business School. Mr. Satchu has a Bachelor’s degree in economics from McGill University and a Master’s in Business Administration from Harvard University.
BOARD OF DIRECTORS
13

AVIVA SHNEIDER
Aviva Shneider is a director of the Company. She is a Principal and Operating Partner with CVC Capital Partners. Prior to joining CVC, she founded Bayes Ventures, a consulting firm. From 2015 to 2018, Ms. Shneider was a part of the private equity team at Caisse de Depot et Placement du Quebec (CDPQ), initially as an Operating Partner and subsequently as Co-Head of Direct Private Equity investments in the United States and Latin America. Prior to this, she spent ten years with Silver Point Capital, a credit and special situation focused hedge fund based in Greenwich, Connecticut, and has also worked at McKinsey & Company. She has previously served on the boards of AlixPartners, Alliant National Title Insurance Co, 2-10 Home Buyers Warranty, LifeCare Hospitals and Cyrus Re among others. Ms. Shneider is a trained actuary (ACAS, ASA), with a Bachelor’s degree in Math from the University of Waterloo and a Master in Business Administration degree from the Wharton School at the University of Pennsylvania.
JONATHAN FINKELSTEIN
Jonathan Finkelstein is a director of the Company. He is also a Principal at AMC, with ten years of high-level experience as an attorney, government official, investment banker and private equity investor. Since 2017, he has worked primarily in the firm’s private equity business. In that capacity, he spent two years working on the transaction between SFCL and AQY. Early in his career Mr. Finkelstein’s practice focused primarily on the tax aspects of public company mergers, acquisitions and corporate restructurings at the New York offices of Skadden, Arps, Slate, Meagher & Flom. He joined the office of Canadian Finance Minister Jim Flaherty in 2011 as Senior Policy Advisor responsible for Taxation. In that capacity, Mr. Finkelstein advised Minister Flaherty directly on tax measures contemplated by the Canadian Department of Finance, as well as industrial policy, pension policy and venture capital. In the latter capacity, he played a central role in designing Canada’s Venture Capital Action Plan – a programme that the current government recently renewed. Mr. Finkelstein joined the New York City office of Lazard Freres and Co. in 2015, where his practice focused on mergers and acquisitions of financial institutions, with emphasis on life insurance and banking. Mr. Finkelstein graduated from McGill University with a B.A. in Economics. He holds two law degrees, including an LL.M. in Taxation from New York University and a J.D. from Osgoode Hall Law School. He also holds an MBA from the Columbia Graduate School of Business.
BOARD OF DIRECTORS
STRONGER TOGETHER
14

GILBERT PALTER
Gilbert Palter is the Co-Founder and Chief Investment Officer of EdgeStone Capital Partners, an alternative asset management firm. He is also the Chairman and CEO of EGADS Group, which invests in public and private companies. Mr. Palter was the founding Chairman of Aurigen Capital Limited, a Bermuda-based life reinsurer, leading the $500 million initial funding. He is the former Chairman of Affinion Group Holdings Inc., which operated Affinion Benefits Group, LLC, a U.S. accidental death and dismemberment business. Over his 30-year career as a private equity investor he has served on numerous private company boards and, on behalf of EGDAS Group, on the public boards of Atlantic Power Corporation since 2015, cxLoyalty Group Inc. since 2017, and RPX Corporation from 2016-2018. In his early career Mr. Palter worked at Morgan Stanley, McKinsey & Company, Clairvest Group, and Smith Barney. Mr. Palter received a Master’s in Business Administration from Harvard Business School where he graduated as a Baker Scholar and the winner of the John L Loeb Fellowship in Finance, and he earned a B.Sc. degree in Computer Science and Economics at the University of Toronto, where he was the Gold Medalist in his class. He was a 2003 recipient of “Canada’s Top 40 Under 40” award, and a recipient of the Ernst & Young Entrepreneur of The Year® Award 2006.
MONISH DUTT
Monish Dutt has been an Independent Director of SFCL since 2012. He retired from the board of the Company on June 30, 2020 and rejoined in October 2020. He is also a director of Sagicor Bank. Currently a consultant on Emerging Markets, he serves on several boards in these markets as well as on the board of FINCA Microfinance Holdings. Mr Dutt is a seasoned investment professional who was employed with the IFC, a member of the World Bank Group, for 25 years. He held various positions with the IFC over the years, rising to the position of Chief Credit Officer for Global Financial Institutions and Private Equity Funds at the time of his departure from the organisation in 2011. He had also served as the Head of IFC’s Private Equity Advisory Group, Head of the Baltics, Central Europe, Turkey and Balkans Group, and as an Investment Officer for Africa, Latin America and Asia. Mr Dutt has also represented IFC on the boards of investee companies.
BOARD OF DIRECTORS
15

EXECUTIVE MANAGEMENT
STRONGER TOGETHER
16

DODRIDGE D MILLER, FCCA, MBA, LL.M, LL.D (Hon)Group President and Chief Executive Officer
• Appointed Group President and Chief Executive Officer in 2002, and has been a Director since December 2002.
• Fellow of the Association of Chartered Certified Accountants (FCCA), and obtained his MBA from the University of Wales and Manchester Business School.
• Holds an LL.M in Corporate and Commercial Law from the University of the West Indies and, he was conferred with an Honorary Doctor of Laws degree by the University of the West Indies, in October 2008.
• More than 30 years’ experience in the banking, insurance and financial services industries.
• Prior to his appointment as Group President and Chief Executive Officer, he held the positions of Treasurer and Executive Vice President – Finance and Investments, Deputy Chief Executive Officer and Chief Operating Officer.
• Joined the Group in 1989. He is a Director of Sagicor Life Inc, Sagicor USA, Sagicor Group Jamaica Limited, Sagicor Life Jamaica Limited, Sagicor Investments Jamaica Limited and other subsidiaries within the Group.
ANDRE MOUSSEAU, BA, MBAGroup Chief Financial Officer
• Appointed Group Chief Financial Officer in 2019, with oversight of and primary responsibility for the planning, implementation and management of the Group’s financial activities.
• His prior directorships also span the boards of Aurigen Reinsurance, a Bermuda- based life reinsurance provider, Impark Corp., one of North America’s largest parking management providers, and Premier Lotteries. He was also an alternate board member of Camelot Group PLC, the operator of UK National Lottery.
• Holds an undergraduate degree in Economics from McGill University, and an MBA from the Richard Ivey School of Business, University of Western Ontario.
• Has 20 years of experience in the financial services industry.• Formerly a Partner with Alignvest Private Capital, Portfolio
Manager for the Long-Term Equities Group at the Ontario Teachers’ Pension Plan (OTPP), and Principal at EdgeStone Capital Partners, a leading independent private equity manager in Canada.
DONALD S AUSTIN, FCCA, BSc, MBA Chief Executive Officer, Sagicor Life (Eastern Caribbean) lnc
• Appointed Chief Executive Officer, Sagicor Life (Eastern Caribbean) Inc. in 2015.
• Board Member of Sagicor Funds Inc and Sagicor Asset Management Inc.
• Former Chairman of the Board of Directors of LIME Grenada and LIME Dominica, and former Board Member of LIME Barbados.
• Holds a Bachelor of Science degree (Hons) in Electronic Engineering from the University of Bristol, a Master of Business Administration from Manchester Business School and he is a Fellow of the Association of Chartered Certified Accountants.
RONALD B BLITSTEIN, BA, MBAGroup Chief Information Officer
• Joined Sagicor Financial Corporation in 2013.• Holds both a BA in Political Science, and an MBA in Finance
from Syracuse University.• IT professional, with knowledge in all areas of information
technology and its application to driving improved business outcomes.
• Previously served as Director, Business Technology and Strategies Practice for a global advisory firm, supporting Fortune 500 clients, national governments and United Nations agencies.
• Held key executive leadership positions at Revlon, Pitney Bowes, BOC Group, and Xerox Corporation.
• Served as a Six Sigma Champion for firms pursuing enterprise operational excellence.
EXECUTIVE MANAGEMENT
17

BART F CATMULL, BSc, CPAPresident and Chief Operating Officer, Sagicor USA Inc
• Appointed President and Chief Operating Officer of Sagicor USA in 2013.
• Certified Public Accountant (CPA), and obtained his BSc in Accounting from Brigham Young University.
• More than 20 years’ experience in the insurance industry.• Prior to his appointment as President, he held the positions
of Chief Operating Officer, Chief Financial Officer, Treasurer and Chief Accounting Officer in the Company.
• Joined the Group in 2005, with the predecessor Company since 1999.
ANTHONY O CHANDLER, CPA, CGA, MBAGroup Chief Financial Controller
• Appointed Group Chief Financial Controller in 2013.• Member of the Chartered Professional Accountants of British
Columbia, Canada and holds an MBA from the University of Manchester.
• Prior to this, he served as Executive Vice President and Chief Financial Officer of Sagicor Life Inc from 2011.
• Joined Sagicor in 1995 as Financial Accountant, and was transferred to the Group subsidiary, Island Life Insurance Company Ltd in 2000.
• Has over 20 years of experience in the insurance industry.• In 2003 he joined the management of Life of Jamaica as
Head of its Internal Audit function, before returning to Barbados in the position of Vice President, Finance, of Sagicor Life Inc later in the same year.
• In 2006 he was promoted to Vice President and Chief Financial Officer of Sagicor Life Inc.
SAMANTHA CHEUNG, B.Sc.Eng, M.Sc.Eng, MBA, ICD.DExecutive Vice President, Investor Relations.
• Appointed Executive Vice-President, Investor Relations in September 2018.
• Holds both a B.Sc. (Engineering) and M.Sc. (Engineering) from Queen’s University (Kingston, Ontario)
• Holds an MBA and ICD.D. from the Rotman School of Management (Toronto) and Institute of Corporate Directors.
• Member and former board director of the Canadian Investor Relations Institute and Women in Capital Markets.
• Elected University Council member at Queen’s University• More than 20 years in banking, insurance and
financial services.• Previously served as Head of Investor Relations at two TSX
listed Canadian insurance companies.
J EDWARD CLARKE, FCCA, CIAExecutive Vice President and General Manager, Barbados (Retired June 30, 2020)• Appointed Chief Operating Officer, Sagicor Life Inc and
General Manager, Barbados in 2010.• Prior to 2010, he held the position of Group Internal Auditor.• Fellow of the Association of Chartered Certified Accountants
and is a Certified Internal Auditor.• More than 30 years’ experience in auditing and finance in
Barbados, Nigeria and the USA.• Prior to joining Sagicor, he served as Chief Financial Officer
of a major conglomerate in Barbados.• Director of Sagicor General Insurance Inc, Sagicor Funds
Inc, Barbados Farms Limited, past President of the Barbados Chamber of Commerce and Industry, Chairman of the Barbados Private Sector Association, and Co-Chair of The Barbados Economic Recovery and Transformation Programme (BERT).
EXECUTIVE MANAGEMENT
STRONGER TOGETHER
18

J. ANDREW GALLAGHER, FSA, FCIA, CERA, BMathGroup Chief Risk Officer, Chief Executive Officer, Sagicor Reinsurance Bermuda Ltd.• Appointed CEO, Sagicor Re Bermuda in December 2018.• Appointed Chief Risk Officer for the Group in 2007.• Joined Sagicor in 1997 as Resident Actuary.• Holds a Bachelor of Mathematics degree from the University
of Waterloo.• Fellow of Canadian Institute of Actuaries, Fellow of
the Society of Actuaries and a Chartered Enterprises Risk Analyst.
• Member of the Caribbean Actuarial Association.• More than 30 years in the insurance industry.
ALTHEA C HAZZARD, LL.B (Hons). LL.M (Cantab), FCG, FICAExecutive Vice President, General Counsel and Corporate Secretary• Appointed Executive Vice President, General Counsel and
Corporate Secretary of Sagicor Financial Corporation in 2014, having previously served in the positions of Vice President, Legal and Compliance of Sagicor Life Inc and Corporate Secretary of Life of Barbados Limited.
• An Attorney-at-Law, Chartered Secretary and Compliance Professional, Mrs. Hazzard joined the Group in 1997 after an eight-year attachment to a leading corporate law firm in Barbados, specialising in international business.
• Holds a Bachelor of Laws Honors Degree from the University of the West Indies and a Certificate in Legal Education from the Hugh Wooding Law School in Trinidad, and was called to the Bar in Barbados and Trinidad and Tobago in 1989. She obtained her Master of Laws degree from the University of Cambridge, United Kingdom, and also holds international diplomas in Compliance and Anti-money Laundering from the International Compliance Association in the United Kingdom and the Executive Diploma in Management from the Sagicor Cave Hill School of Business and Management.
• Fellow of the International Compliance Association and a Fellow of the Chartered Governance Institute of Canada (formerly the Institute of Chartered Secretaries and Administrators in Canada).
KESTON D HOWELL, BSc, (Hons), MBAPresident and Chief Executive Officer, Sagicor General Insurance Inc• Holds a BSc Management Studies from University of the
West Indies and an MBA from the University of London.• More than 32 years in the insurance and banking industries.• Joined Sagicor in April 2005 as Executive Vice-President
- Merchant Banking, responsible for the establishment of Sagicor Merchant Bank and overall Banking Strategy of the Group.
• Assumed executive responsibility for the life operations of Dutch Caribbean and Central America in April 2013.
• Appointed President and Chief Executive Officer of Sagicor General Insurance Inc. in October 2017.
R. PAUL INNISS, MBA, FCIP, CRMExecutive Vice President and General Manager – Sagicor Life Inc. Barbados• Joined Sagicor Life Inc on April 1, 2020.• More than 30 years of experience, both regionally and
internationally, in the insurance and banking industries.• Fellow, Chartered Insurance Professional, Insurance Institute
of Toronto• Holds a MBA from Heriot-Watt University, Edinburgh
Business School• Past President of the General Insurance Association
of Barbados.
NARI T PERSAD, BSc Actuarial Science, BSc Biochemistry, FSA, FCIAGroup Chief Actuary• Appointed Group Chief Actuary in August 2017.• Holds a BSc Specialist in Actuarial Science and Biochemistry
from the University of Toronto.• Fellow of the Canadian Institute of Actuaries, Fellow of the
Society of Actuaries.• Member of the Caribbean Actuarial Association.• Previously served as Partner – Canadian Life Actuarial
Practice Leader with Ernst & Young and Principal of Eckler Ltd.
• More than 30 years of experience in the insurance industry, including positions at Crown Life Insurance Company, Canada Life Assurance Company, Toronto Dominion Life Insurance Company, Swiss Re Life and Health and Dion Durrell + Associates.
EXECUTIVE MANAGEMENT
19

RAVI C RAMBARRAN, BSc, MSc, FIAPresident and Chief Executive Officer – Sagicor Life Inc(Retired December 31, 2020)• In January 2018 he was appointed Chief Operating
Officer with responsibility for Sagicor Life Inc, Southern Caribbean Operation.
• In January 2017 he assumed responsibility for group strategy, mergers and acquisitions, investor relations with rating agencies.
• Appointed President and Chief Executive Officer of Sagicor International in 2007.
• Joined the Group in 1997.• Awarded an Open Mathematics Scholarship by the
Government of Trinidad and Tobago, has a BSc (Hons) in Actuarial Science from City University, London, an MSc in Finance from the University of London, and is a Fellow of the Institute of Actuaries.
• More than 20 years of experience, both regionally and internationally, in the pensions, insurance and asset management industries.
• Director of Sagicor USA and Sagicor General.• Member of the Executive of the Caribbean Actuarial
Association and represents the Caribbean on the International Actuarial Association.
EXECUTIVE MANAGEMENTROBERT J L TRESTRAIL, BAPresident and Chief Executive Officer, Sagicor Life Inc• Appointed President and Chief Executive Officer, Sagicor
Life Inc in January 2021.• Prior to this, he served as Executive Vice President and
General Manager, Trinidad & Tobago since 2007.• Assumed executive responsibility for Dutch Caribbean and
Sagicor Life Aruba N.V. in 2017.• Graduate of the University of Toronto (Bachelor Arts -
Economics).• More than 20 years in the Insurance and Financial
Services Industry.• Board Member of Sagicor Investments Trinidad & Tobago
Limited, Nationwide Insurance Company Limited, RGM Limited and several of its subsidiaries.
• President of the Trinidad & Tobago Insurance Institute (TTII) Board of Governors.
• Former President of the Trinidad & Tobago Chamber of Industry and Commerce (TTCIC) 2015-2016, having served as a Board Member of the Trinidad & Tobago Chamber of Industry and Commerce (TTCIC) 2006-2018.
• Positions formerly held with the Trinidad & Tobago Chamber of Industry and Commerce include President (2015-2016) and Board Member (2006-2018).
STRONGER TOGETHER
20

CHRISTOPHER W ZACCA , CD, BSc, MBAPresident and Chief Executive Officer, Sagicor Group Jamaica Limited• Appointed President and CEO of Sagicor Group Jamaica
Limited in May 2017.• Holds a BSc in Engineering from the Massachusetts Institute
of Technology and an MBA from the University of Florida.• More than 30 years of experience in public and private sector
management, in particular, during the period 1982-2009 where he held various Senior Management positions in the private sector namely:-
• Vice President, Engineering - Desnoes & Geddes Limited (t/a Red Stripe), Brewers of Red Stripe Beer and Manufacturers of Soft Drinks.
• Managing Director - Caribrake Products Limited, Manufacturers and Distributors of Automotive Parts and Accessories.
• Managing Director - Appliance Traders Limited, Dealers in Air Conditioning, Appliance and Commercial Equipment.
• Chief Executive Officer - Air Jamaica Limited, former National Airline of Jamaica.
• Served as President of the Private Sector Organisation of Jamaica from December 2006 to June 2009, and from June 2012 to December 2014.
• Former Chairman of the Development Bank of Jamaica and the National Health Fund and has also served on numerous State boards, including the Factories Corporation, National Education Trust and JAMPRO.
• Served as special advisor to the Prime Minister of Jamaica from 2009 to 2011.
• In 2014, he was conferred with the National Honour of the Order of Distinction in the rank of Commander (CD) for his invaluable contribution to the private and public sectors in Jamaica.
EXECUTIVE MANAGEMENT
21

Stronger Together | 2020 Annual Report
GROUP ORGANISATIONAL CHART
22

23
SAGICOR FINANCIAL COMPANY LTD.(Bermuda)
(Publicly traded on the Toronto Stock Exchange)
Sagicor Financial Corporation Limited(Bermuda)
Sagicor USA, Inc.(Delaware, USA)
Sagicor Reinsurance Bermuda Ltd
(Bermuda)
Sagicor Life Inc.Southern Caribbean
(Barbados)
LOJ Holdings Ltd.(Jamaica)
Sagicor Group Jamaica Ltd.
(Jamaica)(Publicly Traded on the Jamaica Stock Exchange)
Sagicor Life Insurance Company
(Texas, USA)
100%
100%
32.45%
16.66%
100%

CORPORATE & SOCIAL RESPONSIBILITY, HUMAN CAPITAL REPORT, INNOVATION & TECHNOLOGY
24

CSR RESPONSE TO COVID-19
As COVID-19 was spreading globally and entering the Caribbean, Sagicor very early undertook a comprehensive response plan guided by the objectives of the safety of our people, business continuity for our customers and compassion for our communities. In March 2020, Sagicor Financial Company Limited committed US$1m to aid in the fight against COVID-19 in the Caribbean, with an emphasis on early detection programmes and the provision of equipment for the immediate care of those already infected.
The committed funds were used to support initiatives that would minimise risk and reduce the spread of the virus. This donation is consistent with Sagicor’s history of supporting the communities in which it operates. Each company within the Sagicor Group liaised directly with governments and other agencies to determine the level of financial support that was needed and contributed to local government discussions on country preparedness and responses.
SAGICOR LIFE INC SOUTHERN CARIBBEAN
The Ministry of People Empowerment and Elder AffairsCritical assistance in the form of care packages was provided to 3000 persons in Barbados who were identified by social service agencies as being vulnerable, especially amidst the pandemic. Sagicor’s support boosted efforts of the Ministry of People Empowerment and Elder Affairs to provide basic food and sanitary items to recipients, many of them elderly, disabled or families in need. The care packages were distributed prior to a 14-day shutdown ordered by
Government, realising that many would not have been in a position to visit supermarkets to stock up and prepare.
Barbados Alliance to End Homelessness (BAEH)Sagicor provided funds and food items to the Barbados Alliance to End Homelessness, supporting their initiative to provide three daily meals to 100 individuals for a period of four weeks. Sagicor’s relief efforts aimed to embrace the most vulnerable in society, including the homeless.
Barbados Welfare DepartmentIn its efforts to assist those negatively impacted by the COVID-19 pandemic, Sagicor partnered with the Barbados Welfare Department to ensure that help was offered to those who needed it the most. Dozens of families and households across all 11 parishes of Barbados received hampers containing groceries, personal care and household items, donated by Sagicor.
Media Workers Care BasketsSagicor General and Sagicor Life joined forces in May to provide care baskets to the night shift workers of major media houses across Barbados. Considered frontline workers, the media workers were appreciative of the light snacks, beverages and hand sanitising products in the baskets, and the sentiments behind the effort. The companies involved were Starcom, CBC, Nation, Advocate, Barbados Today and Loop News. Support for the project also came from WiFetch, a local shopping and delivery company.
Thermal Imaging ScannersIn July, Sagicor donated three full-body thermal imaging scanners, valued at approximately
US$150,000, to the Barbados Ministry of Health for use at the Queen Elizabeth Hospital (QEH) and the Grantley Adams International Airport. At the hospital, one of the scanners will be used at the main entrance to read the temperatures of those entering the facility, while the two assigned to the airport will be used to test passengers arriving into the island. The equipment was handed over by Executive Vice President and General manager of Sagicor Life Inc., Paul Inniss, during a small ceremony at the QEH.
Mother’s Day and International Nurses’ DayIn June, Sagicor made several donations to mothers and nurses working on the frontlines of the battle against the COVID-19 pandemic, in recognition of both Mother’s Day and International Nurses’ Day. To honour these two groups, Sagicor organised packages of groceries and items of indulgence, and had them delivered to mothers engaged in the various essential services, as well as nurses stationed at medical institutions and clinics across the island.
Father’s DaySagicor team members in Barbados, led by the Customer Experience Department, surprised a number of fathers with tokens of appreciation. Labelled as “superheroes”, the men were frontline workers, Sagicor clients and winners of the company’s “Best Dad” social media competition, and were presented with tailored gift baskets and other tokens of appreciation. The initiative coincided with Father’s Day, which was celebrated in June, and reflected Sagicor’s commitment to recognising the contribution of frontline and essential workers.
Barbados Fire ServiceSagicor Life donated five automated external
25

defibrillators to the Barbados Fire Service (BFS), enhancing fire officers’ ability to diagnose and treat life threatening cardiac arrhythmias, which can lead to a sudden cardiac arrest. The devices will be placed on emergency vehicles and at fire stations, and will go a long way in helping BFS to meet its goal of being well-equipped to be a first responder in those situations where urgent medical care is required.
Risk Expertz supports Tacarigua Ahlu Sunnah Wal JamaatUnderstanding the real-life financial impact of COVID-19, insurance agents for Sagicor General Insurance, Azard and Joan Mohammed of Risk Expertz, donated their $2,000 prize money for capturing the Agency Award of Top Agency of the Year GWP New and Renewals (Bronze category) to support the Tacarigua Ahlu Sunnah Wal Jamaat. This Muslim organisation, well known for its community service, used this contribution to purchase food hampers for the needy.
Prime General Insurance Limited Supports The ShelterIn September Sagicor General corporate agent, Prime General Insurance Limited, donated $5,000 to The Shelter for Battered Women and Children. Established in 1987 in response to a need to provide support and a safe house for victims of domestic violence in Trinidad and Tobago, the Shelter experienced intense pressure during the year, as the number of people they supported had increased, while the funds to provide vital assistance decreased drastically due to COVID-19. Prime General Insurance had been awarded the $5,000 as prize money for outstanding performance, but opted to once again donate the funds to The Shelter in 2020 just as it had done in 2019
Donation of Personal Protective Equipment to the Ministry of HealthSagicor supported the Trinidad and Tobago Ministry of Health’s fight against COVID-19 by donating 20,000 N95 masks and 1,000 face shields to essential workers in the healthcare system. It also assisted with the
procurement of COVID-19 educational brochures for distribution to the public and pledged further support via the procurement of 100,000 3-ply medical masks.
Sagicor Branches Support CommunitiesDuring 2020, Sagicor took steps not just to protect its team and clients, but also to support the members of the communities in which it operates. Sagicor also partnered with local broadcast media to deliver tutorials to assist children with their education; delivered essential food and hygiene supplies to homes for children and the elderly; donated handheld thermometers to the Port of Spain City Corporation; sponsored radio prevention tips on COVID-19 to the public; hosted an online camp on social media; and donated supplies and food to socially displaced persons.
Sagicor Collaborates with Sewa TTSagicor partnered with Sewa International TT (Sewa TT), a not-for-profit service organisation, to donate masks to the less fortunate. Having partnered with Sewa TT on several initiatives in the past, Sagicor engaged them in 2020 to coordinate the production of 20,000 reusable face masks for free distribution to those who are unable to afford them. Using a network of over 100 private seamstresses and volunteers, Sewa TT collected the finished masks, which were then taken to a single location for washing, packaging and labelling with care instructions by people who were self-isolating for that purpose. Sagicor also donated several hampers to the organisation for distribution to its members.
FEEL School ProgrammeRecognising the need for educators to have ample supplies of disinfectant and hand sanitiser products, Sagicor sought to arm the school community with these items through its donation to the Foundation for the Enhancement and Enrichment of Life (FEEL) School Programme. The donation was made at the start of the September school term, assisting FEEL with its ongoing efforts to provide 70 schools with a wide range of supplies on a quarterly basis.
261
2
3 4

1. Paul Innis, Executive Vice President and Barbados General Manager presented thermal imaging scanners to members of the Ministry of Health, Barbados at the Queen Elizabeth Hospital, and 2. automated external defibrillators to the Barbados Fire Service. 3. Brenton Hilaire, Agency Manager, Dominica presented funds to a representative from The Dominica Fire and Ambulances Association. 4. Azard Mohammed, part of the husband and wife team at Risk Expertz, handed over the hampers for distribution to Imam Junaid Ahmed of the Tacarigua Ahlu Sunnah Wal Jamaat. 5. FEEL CEO Elena Villafana Sylvester, left, received a cheque from Sagicor branch manager Christopher Gouveia. 6. Randall Croes, General Manager of Sagicor Aruba, centre, with Unit Manager Sonja Velthuizen, right, handed over the Arugas gas vouchers and funds to representatives of Aruba’s food bank FPNC. 7. Nurse from The Antigua and Barbuda Nurses Association received their personal protective equipment.
Rebirth HouseRebirth House, which provides a residential service for the rehabilitation of drug addicts, was given a donation of six handheld thermometers by Sagicor. Considered vital tools in the fight against COVID-19, the devices were welcomed by the not-for-profit agency, which currently has 80 clients at its three locations in St Ann’s, Carenage and Chaguaramas.
Sagicor Supports Frontline Associations Across the OECSCOVID-19 was declared an emergency in the Eastern Caribbean markets and in Belize in quick succession, prompting Sagicor Life Eastern Caribbean Inc (SLECI) to mobilise its support almost immediately. As an immediate action, US$20,000 or 50% of the cost of thermal-infrared thermometers for COVID-19 testing, was donated to the Organisation of Eastern Caribbean States (OECS), to assist in testing persons at ports of entries and other places during this period. Subsequently, Sagicor agencies made donations to frontline associations in their respective countries to support the purchase of protective gear and other equipment for policemen, firemen, medical and immigration personnel.
A donation of US$60,000 was allocated to a number of organisations across six Eastern Caribbean countries:
Antigua and Barbuda• The Antigua and Barbuda Nurses Association• The Orderlies of Mount St. John’s Medical Centre• National Vocational and Rehabilitation Centre for
Disabilities
Dominica• The Police Welfare Association• The Dominica Nurses Association• The Dominican Air and Sea Port Authority• The Dominica Fire and Ambulances Association.
Grenada• The Grenada Nurses Association• The Royal Grenada Police Force
St Kitts and Nevis• The Ministry of Health• The St Christopher and Nevis Police Force
St Lucia• Ministry of Health and Wellness
St Vincent and the Grenadines• Ministry of Health
Fundacion pa nos Comunidad (FPNC) -Sagicor Life Aruba donated to the Fundacion pa nos Comunidad (the Foundation for the Community), assisting in the provision of personal care items, personal protective equipment and food items. The Foundation manages Aruba’s official food bank and also focuses on fighting poverty and promoting well-being across the country. One beneficiary of the Foundation’s work is Casa Cuna, a home and support facility for children and young mothers. During COVID-19 “lock-down” periods, food packages were distributed to the wards of Casa Cuna, as many of the adults had lost their sources of income as a result of the pandemic.
ArugasSagicor partnered with propane gas manufacturer Arugas in Aruba to ensure that 125 needy families could prepare home-cooked meals using gas cylinders. These efforts were supplemented by Aruba’s food bank FPNC (Fundacion Pa Nos Comunidad), who provided the families with grocery items and also coordinated the distribution of the gas vouchers.
Imeldahof “Buddy System”Donations of personal care items, personal protective equipment, food items, medicine and refurbished computers were made to Imeldahof, a private foundation focusing on at-risk children and elderly persons. Using its team of 40 volunteers, Centro
5
6
3

Kibrahacha, facilitated the distribution through the creation of a “Buddy System”, thereby encouraging social isolation while providing vital services to the elderly.
Chromebook Computers for Online LearningSagicor Life Inc, Curacao donated 30 Chromebook computers to students who experienced difficulties with online classes and completion of assignments because they lacked the necessary equipment. Students benefitting from the donation attended the J.W.Th. Schotborgh School in Koralspecht and Scholengemeenschap Otrabanda in Otrabanda.
Sagicor Heroes Health PlanThe COVID-19 pandemic reinforced to the world the value of essential medical services. In May of 2020, Sagicor sought to recognise and reward the sacrifice and dedication of this group, by providing a life insurance plan built specifically for them. Such insurance coverage is typically unavailable to this group due to the associated risks attached to their professions, however, Sagicor showcased its commitment to recognising these heroes with a plan priced lower than what was available on the market. This was followed up a few months later with the introduction of the Frontline Heroes version of the plan, providing similar, discounted life insurance coverage to those in the protective services (Fire service, Police and Security Guards), other essential services (supermarket workers, ground transport and delivery services, Air Traffic controllers, Pilots and Immigration officers), along with other necessary support services (caretakers or care givers, welfare officers, charity associations, utility service providers, sanitation services, energy services, banking, insurance, media and telecommunications).
Small Business Owners’ WebinarSmall business owners across the Caribbean region gained an opportunity to acquire actionable tips on marketing and using social media to drive business during COVID-19 when Sagicor Life Inc Southern Caribbean, hosted a live webinar on the subject.
Driven by the topic “Marketing your small business in the new normal”, the webinar saw small business owners combining their real-life experiences with the industry knowledge of Sagicor’s Marketing, Communications and Brand Experience team.
Topics discussed included “Promoting your business using social media,” and “Marketing during COVID-19.” The importance of knowing one’s customer and gaining insights into their preferences also took centre stage with the topic “Using data to drive your business.” These and other areas of focus were presented by senior members of Sagicor’s Marketing team. Small business owners Julian Greig of JNL Traders and website kwikily.com as well as Lily Dash and Sophie Bannister of Wi-Fetch, also shared their perspective on successfully navigating a small business in a COVID-19 environment. Eric Watson, Social Media Specialist at Canadian Agency, Grey Advertising rounded off the day’s presenters.
SAGICOR USA
Feeding the FrontlinesSagicor team members partnered with Brooke Palmer Kuhl from RSBP Events and Forbici Modern Italian to deliver meals to 14 firefighters at Tampa’s Fire Rescue Station 14, and 85 members of AdventHealth’s Tampa Campus who worked with the COVID response team and in the maintenance department. The initiative was part of the #12DaysOfCovidChristmas programme organised by RSBP Events, with Sagicor sponsorship being applied to day 9.
SAGICOR GROUP JAMAICA
Throughout the year, Sagicor Group Jamaica remained committed to its corporate social responsibility (CSR) programmes, with a primary focus on the areas of health and education. The year was also an unprecedented one due to the COVID-19 pandemic, resulting in the unfortunate shelving of some initiatives.
1
2
3
4

challenges such as Down Syndrome, Autism, hearing, visual and cognitive impairments. Power Gen’s Annual Special Children’s Fun Day, held on March 18th, 2020, is a regional sporting event consisting of activities such as March Pass, track and field and sack races.
Social Sciences Department, University of the West Indies Cave HillSagicor was a notable contributor to the Social Sciences department at the University of the West Indies, Cave Hill. The organisation provided support to various initiatives, including a panel discussion with students and experts on varied subject areas, the Annual Inter Association Debate and Interdepartmental Sports.
SAGICOR USA
Hillsborough Education FoundationSagicor donated $10,000 to the Hillsborough Education Foundation (HEF) in Florida, which coordinates the donation of school supplies to teachers and provides technology and online access to students at risk of falling behind in today’s e-learning environment. Stocked with a wide range of critical school supplies, HEF’s Teaching Tools Resource Center serves teachers assigned to low-income areas of Tampa who are allowed to shop there at no cost. Sagicor Team volunteers also contributed many hours of service sorting and packaging items for the Center and organised fundraising events.
Adopt-A-Class ProgrammeIn spite of pandemic-related restrictions, the Tampa office organised its annual holiday party for 3rd graders at BT Washington Elementary. While an in-person celebration was not permissible, Sagicor nonetheless gifted students with a variety of toys and goodies, including glow-in-the-dark sticks for a virtual “Glow Party” held via Zoom. Four teachers, the principal and an assistant also received gift cards, compliments of Sagicor.
1. Curacao General Manager & Principal Representative Anneke Soedhoe, second from right, presented Gianward La Croes from Scholengemeenschap Otrabanda with computers for his school, as financial advisors Misheinou Winklaar, left, and Magaly Mingeel looked on. 2. Team Sagicor USA partnered with members and volunteers of RSBP Events and delivered meals to front line workers during the Feeding the Frontlines programme. 3. Members of the UWI Nursing Students’ Association, from left, Shannon Pike, Vice President and Aaron Lawrence, President, accepted PPE from Shelley Ebanks-McGregor, Project Manager, Sagicor Bank Jamaica and Sagicor Foundation Volunteer. 4. Sagicor Foundation Director, Mark Chisholm, right, presented a tablet to Damarie Thomas, centre, student of the Abilities Foundation, at the special education institution. Also pictured is Susan Nelson, Managing Director of the Abilities Foundation. 5. Volunteers from Sagicor USA sorted school supplies donated to the Hillsborough Education Foundation. 6. Elementary students from BT Washington School enjoyed their virtual Holiday Party supported by Sagicor USA Tampa’s Adopt-a-Class programme.
Once the first cases of COVID-19 were seen in Jamaica in March 2020, Sagicor joined national efforts and assisted the Jamaica Government with the purchase of ventilators and personal protective equipment to bolster the country’s health system. Some nursing students were also gifted with personal protective equipment and numerous hand wash stations were placed in the metropolitan areas of Kingston for the convenience of both vendors and shoppers, to encourage proper sanitization.
Online schooling became the norm for children across the island and this created a huge gap for children who either did not have access to, or could not afford the tools to learn remotely. Sagicor donations were given to EduFocal, the social learning website, to provide students with access to study materials, and to Ready TV in support of the national eHomeschool Network which provided live and recorded study programmes over the television and the internet. Some 50 tablets were also provided to various institutions and groups involved in improving student access to online learning materials.
Sagicor Group Jamaica’s investment towards COVID-19 support totaled USD $202,702.
EDUCATION
SAGICOR LIFE INC SOUTHERN CARIBBEAN
Secondary School DonationsSagicor continued its advocacy for youth and education in Barbados by giving support to two primary schools. In January, a donation was made to the Blackman and Gollop Primary School to assist with funding its graduation and a similar amount was contributed to the Grantley Prescod Memorial Primary School towards the purchase of educational supplies. The Erdiston Special School also received sponsorship for its participation in Power Gen’s Annual Special Children’s Fun Day, hosted by the Power Generation Company of Trinidad and Tobago. This school caters to students with various disabilities and learning
295
6

Members of the Scottsdale office organized their annual Adopt-a-Classroom event, treating a 2nd grade classroom at Wilson Elementary School in downtown Phoenix. Sagicor Team members shopped for the students’ “Wish List” items, and arranged for drive-thru deliveries by Santa and some of his elves who were appropriately outfitted with masks and gloves befitting the holiday season.
SAGICOR GROUP JAMAICA
Adopt-A-School ProgrammeRepresenting an investment of USD $121,621, Sagicor Foundation’s Adopt-A-School programme was executed for one school year, from September 2019 to July 2020. During the period, significant renovations were completed at three early childhood/basic schools: Petersville Early Childhood Institution (ECI) in Whitehouse, Westmoreland; Prime Time Early Childhood Institution in Denbigh, Clarendon; and St Peter Claver Infant School on Waltham Park Road in Kingston. By the end of the programme, all three schools had benefited from significant upgrades, and each received hand wash stations in support of sanitization protocols, as well as a computer and printer.
In March 2020 one health tour was carried out at Petersville Basic School, with students, teachers, parents, guardians and other stakeholders being engaged as well. However, health tours of the other two adopted schools were canceled due to the pandemic.
Scholarships & Educational Grant SupportSagicor Foundation’s annual scholarship programme provided scholarships to 71 students. Fifty tertiary school students received awards for their academic performance, community involvement, volunteerism, strong leadership potential and financial need, while 21 secondary-level students were rewarded for their exceptional performance in the Primary Exit Profile Examination (PEP). While the tertiary scholarships usually numbered 25, the number of awarded doubled this year in honour of Sagicor’s 50th anniversary.
The tertiary recipients have been accepted at some of Jamaica’s top universities, such as: The University of the West Indies; University of Technology Jamaica; Mico University College; the Caribbean Maritime University, Northern Caribbean University; and the Edna Manley College of the Visual and Performing Arts. The PEP scholarship recipients were children of Sagicor clients and team members stakeholders who had excelled in the national examination.
The Foundation also supported the 2020 Prime Minister’s Youth Awards for Excellence by providing grants of $100,000 to 30 recipients. Donations of book vouchers and school supplies were also made to a number of institutions and organisations during the back-to-school period.
Guided by its commitment to support the nation’s youth, Sagicor’s investment in education, scholarships and grants totaled USD $270,270.
HEALTH
SAGICOR LIFE INC SOUTHERN CARIBBEAN
Broadway to Barbados Charitable TrustTo help improve the quality of healthcare available to Barbadians, Sagicor joined with other corporate donors to support the Broadway to Barbados Charitable Trust. Funds raised by this registered charity provide financial support and equipment to the Queen Elizabeth Hospital.
Myeloma, Lymphoma and Leukemia Foundation of BarbadosSagicor support of the Myeloma, Lymphoma and Leukemia Foundation of Barbados helped to raise awareness about the three conditions, known collectively as the “blood cancers”. The Foundation’s main activities in 2020 included the inaugural “Walk for A Good Cause” which helped to mark World Cancer Day in February.
1
2
3
4

1. and 2. Sagicor Foundation Scholarship recipients Demetri Grant and Abigail Barnes were excited following their scholarship interviews. 3. Sagicor team member, Talia Simpson-Cox, left, was pleased to present a cheque to Abiola Baptiste, a registered nurse at The John Hayes Memorial Kidney Foundation, in honour of World Kidney Day. 4. Executive Vice President and General Manager Robert Trestrail, centre, with Sagicor advisor Carla James-Young presented a cheque to Dr Gregory Boyce, left, Deputy Director at the Medical Research Foundation, towards the Foundation’s Partnership for Youth programme on HIV awareness. 5. Team Curacao wore pink in support of Breast Cancer Awareness Month. 6. Executive Vice President and General Manager of Sagicor Life Inc, Robert Trestrail donated a $10,000 cheque which was received by Dr Asante Le Blanc, Chairman of the Board of the Vitas House Hospice.
John Hayes Foundation - World Kidney DaySagicor donated funds to the John Hayes Foundation in Trinidad in support of its Secondary Schools’ Kidney Health Caravan and Community Outreach Programme which helps raise awareness of chronic kidney disease and the harmful impact it can have on the quality of life of those afflicted. The events were held in March in observance of World Kidney Day under the theme, “Kidney Health for Everyone Everywhere; from Prevention to Detection and Equitable Access to Care.”
Medical Research Foundation (MRF) HIV AwarenessThe Medical Research Foundation (MRF) of Trinidad and Tobago received a Sagicor donation towards the expansion of its “Partnership for Youth” programme during 2020, through to 2023. MRF, one of the country’s largest organisations involved in the treatment of HIV, has developed initiatives for young people living with HIV/AIDS which provide them with training in life skills, psychological and behavioural counselling, and career counselling to better help them develop leadership skills and engage more meaningfully in their communities. Overall, the programme aims to work with 150 youths until such time as they are able to transition to adult HIV care.
Sagicor Pinktober ActivitiesWith October designated and recognised internationally as Breast Cancer Awareness Month, Sagicor branded the month as Pinktober, supporting a number of activities across the Caribbean to raise awareness and provide assistance for organisations dedicated to this important cause. Following the tradition of previous years, Sagicor’s team members again worked tirelessly to ensure that the public understood the importance of regular breast exams, early testing and early action even though adherence to the new pandemic-related health and safety protocols often challenged planning teams to devise new strategies.
In Barbados, Sagicor teams assisted the Breast Screening Programme of the Barbados Cancer Society by producing customised face masks carrying
the message “Fighting More Than COVID. Support The Fight Against Breast Cancer”. The masks were then offered to staff and the public in exchange for donations, generating much-needed proceeds for the Barbados Cancer Society whose overall funding had declined in 2020 due to the impact of COVID-19. Sagicor also promoted the importance of early detection, displaying signage at four of its offices which encouraged Barbadians to “Stop and Get Tested”.
In Trinidad, Sagicor team members offered pink branded masks for sale, with proceeds going towards the Vitas House Hospice which provides free care to all terminally ill cancer patients who have exhausted medical resources and have a life expectancy of six months or less. In November, Executive Vice President and General Manager of Sagicor Life Inc Robert Trestrail visited Vitas House to present a financial donation to Dr Asante Le Blanc, Chairman of the Board of the Hospice and the Trinidad and Tobago Cancer Society. Vitas House hopes to expand its services, post-COVID, to provide an environment which better caters to the family members of its patients.
Team members in Curacao wore pink during the month of October as a reminder that both men and women have breast tissue, and therefore everyone should have the necessary checkups to facilitate early detection. Through the actions of its passionate team members, Sagicor showed its whole-hearted support for cancer survivors, persons undergoing treatment, and individuals who had lost a family member or friend.
Teams across the territories covered by Sagicor Life (Eastern Caribbean) Inc and Belize showed their support of Pinktober by making donations totaling US$ 13,035 in their respective countries. The funds supported non-governmental organisations which manage facilities for those with breast cancer, also providing support for breast cancer survivors and their families.
315
6

Organisations supported during PinkTober
Antigua and Barbuda
Breast Friends (promotes awareness and provides support to survivors)
Belize Belize Cancer Society
Dominica Dominica Cancer Association
Grenada Grenada Cancer Society
St. Lucia St. Lucia Cancer Society, and Faces of Cancer
St. Kitts and Nevis Reach for Recovery Foundation, and Pink Lily Cancer Care Foundation
St. Vincent and the Grenadines
SVG Medical Foundation
In Antigua and Barbuda, a donation was made to the Breast Friends Antigua organization which promotes awareness of the disease and also provides support to survivors; donations in Belize were directed to the Belize Cancer Society; in Dominica support was given to the Dominica Cancer Association; In Grenada funds were donated to the Grenada Cancer Society; in St Lucia the St Lucia Cancer Society and Faces of Cancer were supported; in St Kitts and Nevis donations were made to the Reach for Recovery and the Pink Lily Foundations and in St Vincent and the Grenadines donations were made to the SVG Medical Foundation.
Sagicor Team members in Panamá actively participated in the promotion and sale of pink and blue masks for Pinktober, reminding clients of the importance of cancer care and prevention. The funds raised were donated to Fundación Pequeños Luchadores, an association that provides family support to children with cancer.
SAGICOR USA
Phoenix Children’s HospitalSagicor USA supports many worthy causes in its communities, including Phoenix Children’s Hospital
(PCH) in Arizona. Over the past several years, Sagicor has consistently donated to the facility, both financially and as well as through volunteer time.
The Hardship Fund - The Hardship Fund at PCH provided emergency relief for families facing financial adversity. Through this programme, the Social Work team at PCH identified patient families needing assistance, triggering help with rent, mortgage, utilities, gas, temporary housing, grocery cards, transportation and other basic needs. Sagicor’s $25,000 donation helped to provide stress-free emergency reprieve options to patients’ families so they could better focus on their children’s recovery.
The Child Life ZONE Network – Even though face-to-face volunteering opportunities were dramatically reduced due to the COVID-19 pandemic, Sagicor team spirit was still front and centre as support was channeled to the innovative Child Life Zone within the PCH. The Zone features a specially outfitted room that provides an escape for children coping with illness and hospitalization, and its special programmes include a closed-circuit TV station that broadcasts weekly trivia quizzes and other programming into all playrooms, infusion rooms and patients’ rooms. An educational video segment on Sagicor was aired over the closed-circuit network, and Sagicor volunteers helped to administer the quiz and to deliver prizes to winners’ rooms.
PCH Telethon and Radiothon – Each year, the hospital partners with television and radio stations to host high-profile fundraising events and Sagicor’s Arizona office once again joined the ranks of sponsors in 2020. Not only were funds donated to the PCH Telethon in April and the radio-based Thank-A-thon in August, but Sagicor team members from Arizona also helped in manning the phones to answer calls and take donations. Sagicor donated $5,000 each to the two events, plus an additional $5,000 to an initiative which saw special Christmas meals being provided for patients and their families.
321
2
3

1. Team members from Antigua wore pink for Breast cancer Awareness Month and presented a donation to Breast Friends, an organisation which provides support to cancer survivors 2. Sagicor Life St Lucia presented a donation to the St Lucia Cancer Society. 3. Sagicor USA’s team Arizona volunteered at the PCH telethon and Radiothon, as well as donated $5000 to each event. 4. The Pancreatic Cancer Action Network presented a floating billboard giving thanks to Sagicor USA and other sponsors. 5. Sagicor Executives and Sigma Run beneficiaries celebrated the $55.3 million raised. From left are: Sagicor Life Jamaica - Individual Life Division Executive Vice President, Mark Chisholm; Tanesia Tomlinson, Hospital Administrator, Savanna-la-mar Hospital; Claudette Marshall, Director of Mission and Ministry – Anglican Diocese – representing the Clifton Boys’ Home; Dr. Brian James, Head of Department for Anesthesiology and Critical Care, Bustamante Hospital for Children; and Christopher Zacca, President and CEO, Sagicor Group Jamaica.
Arthritis FoundationWalk to Cure Arthritis (Virtual) – Due to the COVID-19 pandemic, the Arthritis Foundation’s 12th Walk to Cure Arthritis became a virtual event, supported by Sagicor team members from Tampa who walked, ran or jogged along the three-mile course. Through their efforts, Team Sagicor raised $7,072 and was recognised by the Arthritis Foundation as a top corporate fundraising team for 2020. The annual Walk to Cure Arthritis takes place in cities across the United States in May of each year, raising funds to support the Foundation’s efforts to find better treatments and a cure for the disease, recognised as America’s leading cause of disability.
Jingle Bell Run (Virtual) – Sagicor Life continued its longstanding support of the Jingle Bell Run, an event that was successfully redesigned to enable virtual participation in the year 2020. Having set an initial fundraising goal of $1,000, Team Sagicor went on to raise $1,660. In one of its #ThankfulThursday social media posts, the Arthritis Foundation of Florida expressed appreciation to Sagicor with its heartwarming message, “Thank you Sagicor for all you do for the 54 million Americans living with arthritis!”
Pancreatic Cancer Action NetworkSagicor partnered with the Pancreatic Cancer Action Network (PanCAN) in their quest to end Pancreatic cancer, registering three team members in the PurpleStride 5K walk/run in March in St Petersburg, Florida. As a Silver Sponsor, Sagicor contributed $2,500 to this year’s donations which went on to total more than $287,000. PurpleStride has become PanCan’s most powerful vehicle for fundraising and awareness, with its proceeds helping to fund pancreatic cancer research and patient services.
SAGICOR GROUP JAMAICA
Sagicor Sigma Corporate RunThe Sagicor Foundation in Jamaica staged its annual charity road race, Sagicor Sigma Corporate Run, attracting over 26,000 participants and raising a record USD $373,648, or JMD $55.3 million. Held on
Sunday February 16, the year 2020 marked the 22nd consecutive Sigma Corporate Run.
The successful effort culminated with a symbolic cheque handover between Sagicor Executives and Sigma Run beneficiaries during a post-race ceremony at Emancipation Park. The three beneficiaries were The Bustamante Hospital for Children, Savanna-La-Mar Hospital, and the Clifton Boys’ Home.
Jamaica Cancer Society (Misc Donation)Sagicor supported the Jamaica Cancer Society during the year, including initiatives such as its Virtual Keeping Abreast Luncheon in October. Also sponsored in October was the Society’s “Pink Talk: A Conversation on Breast Cancer,” reflecting Sagicor Foundation’s longstanding commitment to promoting breast cancer awareness.
COMMUNITY & YOUTH DEVELOPMENT
SAGICOR LIFE INC SOUTHERN CARIBBEAN
Holetown FestivalThe Barbados Holetown Festival, one of the longest running National festivals in Barbados, received a $3,500 donation from Sagicor to assist with prizes and to help offset costs associated with the festival’s 5K Road Run. Now in its 43rd year, the Holetown Festival commemorates the island’s first English settlement with a full calendar of events and cultural displays each February.
Eden Lodge Charitable TrustSagicor donated $2000 to the Eden Lodge Charitable Trust in support of their efforts to provide daily lunches to children from less fortunate families, particularly secondary school students needing to purchase lunches from the school canteen. The Trust also supports children whose parents are unable to provide them with education, and aims to eradicate poverty in Barbados.
334
5

Caribbean Youth Environment Network (CYEN) Coastal Beach CleanupIn November, dozens of Sagicor team members showed their commitment to cleaning up the environment when they assisted the Caribbean Youth Environmental Network (CYEN) in cleaning the popular Browne’s Beach, collecting almost 1000 pounds of garbage in just three hours’ time. Speaking on behalf of Sagicor at the culmination of the activity, Unit Manager Wayne Alleyne reminded the gathering that, “Our beaches matter, and we must improve our efforts to keep them clean due to the impact this has on the health of marine life, as well as ourselves.”
Enterprise in Action Youth ProgrammeIn support of the Small Business Association of Barbados’ efforts to develop an entrepreneurial culture among young people, Sagicor donated $2,000 to the Enterprise in Action (EIA) Youth Programme which targets secondary students between the ages of 14-16, as well as a few primary school students in class 4. The programme helps equip young participants with leadership skills and encourages the creativity and innovation required to function in a globalised market.
This initiative, celebrating its 12th consecutive edition, is implemented over one academic year. Due to the COVID-19 pandemic and its associated restrictions at the schools, a hybrid approach was taken in 2020. The programme was delivered virtually using the participating schools’ Google Classroom platform and where this was not possible, face to face sessions continued with smaller groups as guided by the protocols.
Students were taught the fundamental theoretical principles of Team Building & Teamwork, Marketing, Financial Planning and the Legal & Administrative framework of starting a business. The next step of this process is the practical phase of developing and running a business within their schools. The process of adapting the programme to overcome the challenges of the pandemic was also a real-life example for the students on the importance of adjusting and
reengineering the way one does business in order to remain relevant.
Lions Club of Barbados SouthThe annual Christmas hampers project organised by the Lions Club of Barbados South received a $5,000 boost from Sagicor, further enabling the group to spread cheer to over sixty Barbadians. The donation helped to purchase items for the hampers and care packages, and Team members from Sagicor Life’s Gibson agency also assisted with the sorting and packing.
Carols by CandlelightThe annual Carols by Candelight family show staged by the Rotary Club of Barbados was supported by Sagicor in December with a donation of $5,000. The show took a creative approach in 2020, moving from its longstanding venue, Ilaro Court, to the Globe Drive-In where patrons viewed the entertainment from the confines of their vehicles. Out of consideration for COVID-19 restrictions, the event was also streamed before a virtual audience for the first time. Proceeds from the show aided in the installation of water tanks at secondary schools across the country.
Prison Fellowship Angel Tree ProgrammeIn December, Sagicor made donations to Prison Fellowship Barbados, assisting with the Angel Tree Programme which oversees the donation of gifts to the children of inmates. Sagicor team members from across the Group donated wrapped gifts to the non-profit organisation, handing them over just before Christmas at their Collymore Rock location. Sagicor Executive Vice President and General Manager Paul Inniss commended the response of the Sagicor team, linking it to the company’s Project Kindness initiative.
SAGICOR LIFE INC SOUTHERN CARIBBEAN
Government Industrial School, BarbadosSagicor encourages young girls not to let their past define them and to adopt a mindset of “I Can”, even when they feel that the deck is stacked against
1
2
3
4

1. and 2. Team members in Barbados convened at Browne’s Beach for the Caribbean Youth Environment Network Coastal Beach Cleanup. 3. Assistant Vice President, Human Resources, Michelle Bell-Sookhoo, left, discussed the impact of the Chosen Hands Art and Wellness Programme with its founder and creative director Anika Plowden-Corentin. 4. The manager of the Court Shamrock Shelter for the Socially Displaced, Gloria Coombs, looked on as Sagicor executives Robert Trestrail, left, and Keston Howell served a midday meal for the shelter’s residents on World Kindness Day. 5. Sagicor General Insurance team member, Sonia Gadar gives a flood-affected resident some supplies, as part of Sagicor’s flood relief collaboration with the Couva/Talparo Regional Corporation in the Gasparillo area. 6. and 7. Robert Trestrail, Executive Vice President and General Manager, and Ravi Rambarran, left, President & CEO of Sagicor Life Inc, served food for distribution to the needy who were supported by the Harry Persad Foundation.
them. The company shared this message during a visit with the female residents of the Government Industrial School, Barbados’ detention centre for at-risk youth, in observance of International Women’s Day in 2020. Highlights of the visit were an interactive motivational session which explored the importance of acknowledging and managing emotions on one’s journey towards developing strong self-esteem, and bonding over lunch with residents and staff of the institution.
St Jude’s Home for GirlsSagicor Life’s donation helped young women attached to the St Jude’s Home for Girls in Trinidad and Tobago to further their personal development while also honing their skills in art through a unique collaboration with the Chosen Hands Art and Wellness Programme. Chosen Hands uses art as a vehicle for personal development, healing and self-expression, and Sagicor’s support helped offset the cost of materials for sessions with ceramic artists attached to Veronica’s Pottery. This type of art therapy is often used as a holistic means of managing one’s emotional well-being and coping with physical illness or disability, and the skills learned can also lead to alternative income streams as the young participants age out of the school.
Court Shamrock ShelterOn World Kindness Day in November, Sagicor executives Robert Trestrail and Keston Howell visited the Court Shamrock Shelter for the Socially Displaced in San Fernando to distribute meals to the residents. The gesture was made during the 5-day festival of Divali, demonstrating their understanding of how Divali is more than just a celebration of the triumph of light over darkness; it is also about sharing those blessings with others. The 21-year old Court Shamrock Shelter for men supplements a government subvention with a number of in-house agricultural projects, such as raising chickens and rabbits and the establishment of a kitchen garden.
Gasparillo Flood Victims ReliefSagicor partnered with the Disaster Management Unit of the Couva/Tabaquite/Talparo Regional Corporation to distribute relief packages, food and cleaning supplies to residents in the Gasparillo area affected by heavy rains and flooding. Reflecting on his experience during the relief effort, Sagicor volunteer Rameshwar Mahadeo said, “It’s natural to me to help someone in need; everyone has a down time and it’s our responsibility to help them up…the joy on their faces knowing that they aren’t forgotten and someone is there to help made it more than worth it.”
Harry Persad Helping Hands FoundationThe saying that “Many hands make light work” reflects the relationship forged between Sagicor Life and the Harry Persad Helping Hands Foundation as both organisations continue their work in organising community-based events and assisting the vulnerable citizens of Trinidad and Tobago. Sagicor presented a token of appreciation to Harrinarine “Harry” Persad for the foundation’s support of the Sagicor-sponsored Indian Arrival Day, and also pledged to partner with the foundation every quarter as it continues to reach out to vulnerable citizens with its charitable projects.
World Environment DaySagicor Life Inc’s Customer Service departments marked World Environment Day on June 5th by distributing seedlings to clients, promoting the importance of growing one’s own food and creating a sustainable food system. In addition to customers receiving their choice of pigeon peas, cucumber, pak choi, basil, wax pepper, squash, sorrel and tomato seedlings, six lucky clients won fruit trees. Out of its commitment to protecting the environment, Sagicor has also implemented a number of “green” corporate initiatives through the years, particularly using digital applications versus paper applications, providing premium receipts via email, paying claim reimbursements through direct deposit, and the introduction of its CariCARE card, which allows clients to digitally settle claims immediately.
355
6
7

St. Vincent de Paul SocietyAdvisors from the Ralph Coutain Branch, distributed care packages to families in nearby Port of Spain districts in May, working alongside the St. Vincent de Paul Society and the St. Joseph Presbyterian Church. St. Vincent De Paul is an international voluntary organisation in the Catholic church dedicated to service of the poor.
Prinses Margriet SchoolIn Curaçao, Sagicor Life Inc assisted the Prinses Margriet School by donating a toaster oven, thereby making it possible for students to have a warm meal after school when awaiting pick-up by their parents. Children often use the time after school to complete homework, and the toaster oven is expected to make them more comfortable and therefore more productive.
Royal St Vincent and the Grenadines Police Force (RSVGPF) Training SchoolSagicor Life presented the Royal St Vincent and the Grenadines Police Force (RSVGPF) Training School with a portable projector screen for use during the delivery of lectures. Sagicor was represented by Syd Hazel, whose remarks during the handover encouraged other outstanding citizens and members of corporate society to partner with the Police Force as they strive to deliver an effective and efficient service.
Support Given To NGOs In St LuciaMany organisations who would normally support their operating costs via fundraising events and donation drives were unable to do so in 2020 as a result of pandemic-related restrictions on group activities. As such, Sagicor life Inc’s Team in St Lucia, donated a total of USD $60,000 to several non-governmental organisations to assist with their ongoing operating expenses. Those receiving the monetary contributions included the Marian Home, St. Lucy’s Home, Villa St. Joseph, Cornerstone Humanitarian Society and the St. Lucia Blind Welfare Society.
Back To School SupportDemonstrating how Sagicor’s commitment to improve the lives of people in the communities in which we operate permeates throughout the entire organisation, St Lucia Advisor Mrs. Minerva Charles David organised back-to-school gift bags full of school supplies for 25 families. According to Mrs David who has been an Advisor for 12 years, she developed relationships with her clients in the Soufriere and Choiseul areas that made her aware of the challenges being faced as they prepared their children for the new school year. The venture marked the first anniversary of her Soufriere office, and received support from Sagicor as well.
Hurricane Relief In BelizeThe Sagicor team in Belize worked diligently during November to assist military personnel and other first responders, as well as persons forced into shelters during the passing of Hurricanes Eta and Iota. Not only were warm meals provided, but hampers of food and cleaning supplies were donated as well to assist residents with getting their lives back to normal. Though the two hurricanes did not hit Belize directly, the associated flooding affected an estimated 50,000-60,000 residents, many of whom were already grappling with economic hardships resulting from COVID-19.
Patronato Nacional De NutriciónSagicor Panamá contributed to the Patronato Nacional de Nutrición (National Nutrition Service), a non-profit organisation that promotes the development and implementation of self-sustainable development and production farm programmes in that country. The financial contribution marked the fourth consecutive year of support, and in 2020 the funds supported food production initiatives for Farm Las Gaitas in the District of Capira and provided a day of fun and treats for children of the Farm.
361
2
3

1. Team members from Curacao supported the students of the Princess Margriet school by donating a toaster oven. 2. Team members in Belize provided warm meals to individuals and families who fled to shelters in the Cayo, and Stann Creek Districts, and to the military and other first responder personnel following the passage of Hurricane Eta. 3. Team Panama posed for a team photo at the cheque donation to the Patronato Nacional De Nutrión (National Nutrition Service). 4. Sagicor USA Arizona team members volunteered to package items for veterans for Operation: Military Matters. 5. Metropolitan Ministries’ Barrels of Hope received barrels of food items and a cash donation from Sagicor USA’s Tampa Office.
SAGICOR USA
SagicorNowSagicorNow.com, Sagicor USA’s fully digital platform, not only enables potential customers to conveniently purchase life insurance online in a matter of a few minutes, but also helps fund the company’s “Larger than Life” charitable initiative. Though not available in all states, when eligible customers purchase a policy using SagicorNow, Sagicor Life USA’s operating company donates $25 to their choice of one of four charities: the American Heart Association; Juvenile Diabetes Research Foundation; Operation: Military Matters; and Positive Coaching Alliance. Funds raised for the charities in 2020 totaled $3,375.
Operation: Military Matters (OMM)In addition to donations made through the SagicorNow initiative, Operation: Military Matters was supported in other ways as a result of team member activities in Arizona. As an additional incentive for their participation in a virtual fitness challenge organised by the Wellness Council of Arizona, team members’ registration fees were matched, resulting in a $520 donation to OMM which was applied to a “packing party” with veterans from MacDill’s Air Force Base. This initiative resulted in 230 packages being shipped to members of the military serving overseas.
Metropolitan MinistriesNovember Sagicor USA’s Tampa office collected food for the holidays as well as donated $10,000 for the “Barrels of Hope” initiative organised by Metropolitan Ministries. The charity’s mission is to care for the homeless and those at risk of being homeless in the Tampa Bay area, and while Sagicor volunteers were unable to help sort donations, pack boxes and clean the facilities due to COVID-19 restrictions, they participated in a holiday food drive and made additional monetary donations.
St. Mary’s Food BankEven during the pandemic, the month of May saw Arizona Team members helping to sort and organise
non-perishable food items at St. Mary’s Food Bank and bag produce for St. Mary’s Surprise Pantry. St. Mary’s mission is to combat food insecurity across the state, alleviating hunger through the gathering and distribution of food, while encouraging self-sufficiency, collaboration, advocacy and education. Team members from the Scottsdale office also teamed up with the Scottsdale Landings Property Management team to help with special holiday food drives in conjunction with the Feeding Arizona Food drive, collecting and also organising deliveries of the canned goods, earning Sagicor the distinction of being Feeding Arizona’s largest donor.
St. Vincent de Paul SocietyWater Drive - Sagicor USA’s support of the St. Vincent de Paul charity in the greater Phoenix area is an ongoing effort, and during the year a number of its programmes received support. A water drive during the summer mobilised team members to collaborate with area supermarkets and the ABC15 Arizona television statement to ensure that the charity’s resource centre and dining areas were sufficiently stocked to accommodate those seeking heat relief. An impressive Phone Bank day organised to fund the effort raised $167,424, equivalent to more than 1.3 million bottles of water, and also attracted donations of 21,248 physical bottles of water. Further underscoring its commitment, Sagicor matched dollar donations up to $10,000.
Feed the Need - St. Vincent de Paul’s Feed the Need meal programme received a boost from the Arizona team as team members donated over a ton of non-perishable food items to the cause. This initiative was especially welcomed, as it helped the charity to stock it shelves and continue serving an astounding 4,200 daily meals, even though the impact of COVID-19 restrictions had resulted in a plunge in the amount of food contributions normally seen.
Turkey Tuesday - During the Thanksgiving holiday period, a special donation drive helped St. Vincent de Paul prepare meals for families which could be
374
5

1. Mischa McLeod Hines, left, Assistant Vice President, Sagicor Investments, and Alicia Bogues, right, Head of Marketing and Regional Development, CB Foods, joined Debbie Dunn-Ferguson, Administrator for the Maxfield Park Children’s Home, during the presentation of educational supplies and personal care items from Sagicor Foundation. 2. Howard Smith, right, Manager, SME Business Banking, with, from left Dr. Makesha Archer-Gooding and Dr. Judian Peart of the Victoria Jubilee Hospital, standing in front a Sagicor donated Christmas tree. 3. Ramdeen Deosingh received his prize from Keston Howell, President and Chief Executive Officer, Sagicor General, at the prizegiving ceremony for the Brechin Castle Open Golf Tournament.
then taken to their homes for sharing with their families and friends. Sagicor came onboard as a sponsor, matching text-in and online donations up to $10,000. This donation drive saw an overall increase over the previous year’s donations, raising $98,540 and $138,529 from text-in and online donations respectively.
Boys & Girls Clubs of Tampa BaySagicor provided a helping hand to the “Great Futures Start with Us” virtual breakfast organised by the Boys & Girls Clubs of Tampa Bay, donating $2,500 to the cause. Held in December, the event showcased the Clubs’ activities over the years, and presented testimonials and stories of success from past Club members who had been positively impacted by the organisations, including celebrity alumni such as Denzil Washington, Martin Sheen, Shaquille O’neal and others. Because 2020 donations to the organisation were at a record low, Sagicor’s donation was especially welcomed.
SAGICOR GROUP JAMAICA
Sagicor Community Heroes AwardsAlso in honour of Sagicor’s 50th anniversary, the inaugural Sagicor Community Heroes Award was bestowed upon 50 extraordinary Jamaican citizens. Deemed “everyday heroes” for their qualities of volunteerism, charity, kindness and selflessness, the pool of recipients hailed from communities across the country and included an 11-year old awardee. The total value of the awards presented was USD $16,890.
Donations to the CommunitySagicor Foundation was one of several organisations supporting the inaugural Jamaica Food and Drink Cares initiative, designed to make a difference to those in need using food as a platform. Organised by the Jamaica Food and Drink Festival, the innovative programme involved a team of 70 chefs and resulted in the provision of over 200 meals and personal care items being provided to staff and wards of three children’s homes and a senior citizen facility.
Hear the Children Cry, the country’s leading advocacy organisation for the nurturing and protection of children, received a monetary donation in support of their various programmes and initiatives.
During the Christmas Season, Sagicor spread Christmas cheer at several hospitals and children’s home with the donation of a decorated Christmas trees.
In this category, Sagicor made donations totaling USD $40,540.
SPORT
SAGICOR LIFE INC SOUTHERN CARIBBEAN
Brechin Castle Golf TournamentSagicor General Insurance Company was the title sponsor of the two-day Brechin Castle Open Golf Tournament, held in January at the Sevilla Golf and Club House in Couva, Trinidad and Tobago. Speaking on behalf of Sagicor General, President and Chief Executive Officer Keston Howell expressed the company’s delight at being able to contribute to the event, giving golfers the opportunity to hone their skills before hitting the international stage as part of the national team.
SAGICOR USA
Positive Coaching AllianceThe Positive Coaching Alliance (PCA) Class of 2020 has expressed appreciation to Sagicor for its support of the Triple Impact Competitor Scholarship programme which saw 25 scholarships being awarded to Tampa Bay area student athletes to help meet college expenses, and 15 scholarships to those from Arizona, for a total of $65,000. PCA is an organisation dedicated to developing “Better Athletes, Better People”, by providing resources to youth and high school sports coaches, parents, administrators and student-athletes which help create a positive, character-building, youth sports culture at the high school level.
1
2
3

HUMAN CAPITAL REPORTEXECUTIVE CHANGES
SAGICOR LIFE INC – SOUTH CARIBBEAN
RetirementsMr Ravi Rambarran retired from his position as President & CEO of Sagicor Life Inc effective December 31st, 2020.
Mr J. Edward Clarke retired from the role of Executive Vice President and General Manager, Barbados Operations, Sagicor Life Inc on June 30th, 2020.
AppointmentsMr Robert Trestrail assumed the role of President & CEO of Sagicor Life Inc effective January 1, 2021. Robert has been a member of the Senior and Executive management team since 2001 and held the position of Executive Vice President and General Manager for the Trinidad & Tobago operations since 2007. He assumed responsibility for operations in the Dutch Caribbean in 2017 and currently serves as a Director on the Group’s subsidiaries in Trinidad & Tobago.
Mr Paul Inniss assumed the role of Executive Vice President and General Manager, Barbados Operations, Sagicor Life Inc effective July 1st, 2020. He previously led high-performance teams in the Property & Casualty and Life, Health, Pensions and Banking sectors. Paul has an MBA from the Edinburgh Business School of Heriot-Watt University, and a Fellowship in Risk Management from the Insurance Institute of Canada and University of Toronto.
SAGICOR GROUP JAMAICA LIMITED
RetirementIvan Carter retired from the post of Executive Vice President and Chief Financial Officer with Sagicor Group Jamaica Limited in April 2020.
AppointmentsAndre Ho-Lung was appointed to the post of Executive Vice President and Chief Financial Officer. Andre holds a B.Sc. and an M.Sc. in Accounting from the University of the West Indies and is a Fellow of the Association of Chartered Certified Accountants.
Sean Newman was appointed to the post of Executive Vice President & Chief Investments Officer – Sagicor Investments Jamaica Limited. Sean has a B.Sc. in Management & Accounting from the University of the West Indies and an MBA from Howard University.
COVID-19 Response
A multi-company COVID-19 strategy was deployed in February 2020, in response to news that a new strain of the Coronavirus had been detected in the USA and U.K. This strategy was developed ahead of the first COVID-19 patients being identified in the Caribbean and South America.
Executive management teams collaborated on policies, the procurement of personal protection equipment, and the roll-out of robust educational and communication programmes promoting new hygiene
protocols, including the use of masks and social distancing. Appropriate signage was erected to provide safety guidance for team members and customers, enabling the continuation of in-office services wherever possible.
During this period our Group team leaders demonstrated tremendous agility and responsive leadership, and by March 2020, temporary Work from Home strategies were being crafted in adherence to evolving directives from local government officials. Return-to-Office scenarios were also developed and approved by the Boards of Directors. Business continuity strategies were adjusted to maintain client services in all markets, benefitting from earlier investments in technology and digitisation projects. Regular Town Hall Meetings for Sagicor team members provided a solid platform for communicating the change management programmes, keeping the community engaged, informed and motivated.
Health and Safety Policies
In adjusting to COVID-19 conditions, our main priority was the safety of our staff, advisors and clients. This was reflected in all procedures introduced during the pandemic, from the preparation of our offices to determining which staff and advisors should be allowed in the offices. It governed interactions with our clients, guiding our Work-From-Office operations as well as our Return-to-Work Policies. The expert advice of occupational health and safety experts and medical practitioners was
sought as material changes in the environment evolved, helping to shape guidelines and ensure the safe return of team members back into their offices whenever restrictions were lifted.
We have very carefully managed our COVID-19 response to mitigate contact risks, team infection rates and team mortality rates. Sagicor Group companies aim to maintain this standard, and pledge to keep team members abreast of current scientific data and available vaccination options even as we move into the uncertain climate of 2021.
Change Management and Engagement activities
In Jamaica, the new year began on a high note with the annual company conference, themed “Beyond Gold” in 2020. Separate team meetings were later held for Sagicor Advisors and Administrative Staff to provide information on the past year’s performance and on strategies for the coming year. Hosted by senior members of management, these high energy meetings featured motivational speakers and ably set the tone for the new year. The release of the 2020 Sagicor Calendar, illustrated with striking human interest photographs of Sagicor team members and their families, was a quiet reminder of how much the company values its internal stakeholders.
39

Sagicor General Inc conducted quarterly Employee Experience Pulse Surveys, which revealed that the respondents awarded positive Employee Net Promoter Scores (eNPS) for all the quarters of 2020, in spite of the dramatic global and local changes they would have experienced.
In the Eastern Caribbean, weekly 20-minute sessions branded as “Sagicor Advisor Chat Sessions” not only aided peer development but also provided convenient opportunities for continuous learning. Mindset and behaviour shifts were encouraged in “Leading the SGI-Way Workshops”, as our people completed pre- and post-workshop assessments on the leadership principles being presented, and also received feedback from their direct reports.
Sagicor Group Jamaica Ltd launched its Pulse Survey in November of 2020 to check in with team members and also identify areas in need of strengthening. The survey captured feedback on engagement, leadership, and communication, and work from home support. It also provided an opportunity to lodge general concerns relating to the pandemic.
A full slate of fitness and other activities presented online served as mood and morale boosters, while corporate recognition events and regular team meetings encouraged productivity. Team members who found themselves grappling with the new normal ushered in by the COVID-19 pandemic were supported by the Employee Assistance programme,
and presentations were organised on physical and mental wellness, financial planning, and the complex issues of domestic abuse.
The popular “Lunch and Learn” programme transitioned seamlessly into a series of virtual classes and team events, which were well-attended. They provided convenient opportunities for team members to learn more about topics such as COVID-19, Pensions, Supplemental Health, Accessing NHT and mortgage benefits. Virtual wellness classes and team events like “The Don’t Rush Challenge” and “Fast Finger Fridays, the S.T.A.R.S Week of activities, Sage Live Morning Talk Show, Church Service, Battle of the Executives, Games Night, Benefit-a-thon Charity Event all provided variety and interest.
Sagicor USA conducted monthly interviews to monitor the level of engagement of our USA-based team members. Also in the USA, new legislation provided some measure of economic stability, including the Family’s First Coronavirus Response Act with provisions for paid sick leave and medical leave, and the Coronavirus, Aid, Relief and Economic Securities (CARES) Act, also known as the Economic Stimulus Bill.
Learning and Development
Our corporate value, “Timeless”, drives us to maintain a learning culture that supports “building a company for today…which will continue to be relevant for all times”. This is reflected in our performance management systems, which set learning goals
for team members and ensure that expectations are clearly defined, recorded, managed and tied to our annual rewards programmes.
2020 saw a significant transformation in how training was delivered as the concept of “anywhere and anytime training” was positively embraced across the Group. The new work environment combined to produce a rich curriculum of virtual training workshops for managers and supervisors to aid in the development of skills required to effectively manage remote teams. Other mandatory workshop topics included Preventing Workplace Harassment, Anti-Money Laundering, our Code of Business Conduct and Ethics, Information Security and Wellness.
Sales teams in Barbados were exposed to additional workshops on various categories of benefits, legal instruments, electronic workflow applications and sales strategies. In Trinidad, similar workshops for teams of sales advisors and managers were organised, along with opportunities to pursue the professional certificate in Strategy and Innovation with the Arthur Lok Jack School of Business. In the Eastern Caribbean, the Skillsoft Assignment Challenge competition was held, where team members recorded and shared via video their top three takeaways from the Skillsoft courses and how they have or will implement these new skills in their roles. Winners in each territory won Amazon gift card prizes.
1. and 2. Sagicor General Insurance Inc’s specially-outfitted space, stimulating creative thinking and group collaboration for team members to take part in “The Huddle”.
401
2

Hiring and Selection
Traditional talent fairs at local university campuses were fully transitioned to the virtual space through the increased use of LinkedIn, Caribbean Jobs and the resources of Executive Search companies. Psychometric tests and other skills-based testing further strengthened our talent selection and placement processes. The Recruitment module of the Sagicor Success platform was also instrumental in these areas.
New team members welcomed during the year were onboarded with programmes to help them understand the fundamentals of our business and rapidly changing technology, and they are required to complete LOMA 280 and LOMA 290 insurance courses. New sales managers in Barbados also completed the Supervisory Management course at the Barbados Institute of Management and Productivity. Notably, tuition assistance and support is available for the completion of professional designations for key occupations in our business.
Innovations
Collaboration & CommunicationSagicor General Inc launched “The Huddle”, to inspire teams to come together for the generation of innovative ideas and brainstorming. In Barbados, the concept was supported by a specially-outfitted space which stimulates creative thinking and group collaboration.
The launch of our SAP JAM platform in July 2020 enhanced collaboration and communication across Sagicor’s Southern Caribbean countries. Internally branded as “Jammin”, the SAP software tool replaced the previous intranet-based “Saginet”, and reduced the heavy reliance on company-wide emails for internal communication and feedback. It promotes real-time social collaboration by connecting customers, partners, and colleagues with information, applications, and processes to solve business critical problems and to drive results. Jammin’ integrates with our business applications and has been optimised for mobile devices as well.
Talent ManagementThe Success Factors Talent Management platform has been internally branded as “Sagicor Success” and over the last eleven years has increased the efficiency of several talent management processes. The newest module, “Onboarding”, was configured and tested during the year and is expected to go live in 2021. New hires can now sign off on and submit documents via the portal, while managers can pair new employees with “buddies” and set interim goals for them during their early months of employment. This paperless process has resulted in a more efficient and cost-effective way of onboarding our new recruits while enhancing their overall experience.
“Employee Central” proved invaluable as we transitioned to work-from-home arrangements in 2020 and were able to rely on it for the creation and
maintenance of employee records. A new feature added in 2020 facilitates requests for the extension of temporary employee contracts, allowing for easy tracking of short-term employment contracts and cost. The “Reporting” module can be used to generate customised employee reports, and is accessible by the HR team as well as other business units.
Other modules scheduled for completion during 2021 include the “Development” and “Succession” modules for documenting and tracking the personal goals of team members, and the “People Analytics” module which will use system data to generate rich analytical visual management reports.
Personal Social ResponsibilityDespite the challenges presented by COVID-19 conditions, we proceeded with our Personal Social Responsibility programme to encourage and facilitate team participation in community-building. These initiatives included corporate programmes as well as projects developed by team members to uplift their own communities.
Sagicor Group Jamaica recognised eight outstanding team members from the Mandeville Branch for their selfless acts in 2020. Whether for their collaboration on the delivery of food packages, masks and personal care items, or for their personal demonstrations of bravery and sacrifice, the following team members were awarded:
1. Sanjae Walker-Newman, Wealth Advisor – Sagicor Investments Jamaica Limited who with family and friends provided care packages to families in need.
2. Shameika Scarlett, Client Service Representative – Sagicor Bank Jamaica Limited who provided roadside first aid assistance to an elderly man who fell and was injured.
3. Erica Prendergast, Supervisor Claims Administration and Project Services - Sagicor Life Jamaica Limited who selflessly planned and participated in numerous COVID-19 relief activities including sponsoring an education assistance programme, providing care to an elderly neighbor, arranging prayer meetings and delivering care packages to those in need.
4. Monique Wilson, Business Development Advisor – Sagicor Investments Limited who produced masks and then used the proceeds from these sales to purchase food and care packages for the less fortunate within her community. She also donated masks to colleagues in the branches.
5. Reneika Thompson, Compliance Officer – ERM & Compliance – Sagicor Group whose goodwill and service at the community level has propelled her to serve on football associations at the parish and regional level. She
41

also assisted at-risk youth in her community by planning charity events to offset their educational expenses.
6. Shanakay Dyer, Account Maintenance Clerk – Sagicor Bank Jamaica Limited who founded the iBloom Foundation which provides mentorship and educational assistance to youth. iBloom has assisted 48 students across seven (7) parishes in Jamaica by supplying them with much-needed data packages to facilitate online learning. Its back-to-school drive assisted over 100 students with stationery supplies, masks, sanitisers, lunch kits and school bags, school uniforms and shoes.
7. Roger McKenzie, Assistant Vice President – Sagicor Investments Jamaica Limited whose various initiatives including sponsoring and assisting community outreach programmes, mentoring, coaching, developing and feeding the nation’s young minds, assisting over 100 youngsters in the process.
TOP PERFORMERS
SALES HONORS
Top Sales Performer Sagicor Life Inc Barbados
Janice Mullin- SargeantAt the 2020 annual awards, Janice Mullin-Sargeant added another outstanding year of performance to her eight-year streak of success. Janice received the highly coveted Platinum and 100 Club awards for a record-breaking nine and eight consecutive years, respectively, also receiving the D.W Allan Award for the
5th consecutive year, and the Anthony Kennedy Award for the fifth time in her tenure.
Top Sales Performer SLI Eastern Caribbean
Shameka DavidShameka David’s career with Sagicor began on May 1st, 2018. Described as bold, willing and competitive, her outstanding performance in 2020 followed two previous years of constant work and effort that moved her along the performance spectrum to record an exceptional performance in Sales for the year.
Top Sales Performer Belize
Marsha GillMarsha Gill had an exceptional sales performance in 2020, in spite of the many challenges she would have faced in doing business during the year. Ms. Gill’s commendable performance and perseverance belies the many obstacles faced, given the prolonged and repeated periods of COVID-19 lockdowns and the impact Hurricanes Eta and Nana had on Belize in the same year. She was previously awarded the coveted President’s trophy in 2018.
42

Top Sales Performer Trinidad and Tobago
Denzil SupersadDenzil Supersad is a top Sagicor advisor with 11 years industry experience. Previous achievements during his tenure include being named Top Agent of the Year on three occasions, as well as having received Centurion, Excalibur, Top Persistency, and the Highest Annual Premium Income (API) awards. Currently pursuing the Financial Services Certified Professional, programme, Denzil has qualified the Million Dollar Round Table for the past eight years and has never missed a Convention.
Top Sales Performer Sagicor Group Jamaica
Nicholene Taylor was not only the top sales performer of Sagicor Group Jamaica for 2020, but she also received the Pansy Ennevor Trophy for being the top female agent for Net Annualised Premium income (API) and setting a new API record for this group for 2020. Nicholene also achieved the elusive Top of Table qualification in MDRT and was President of the club of Top 30 Sagicor Advisors in Sagicor in Jamaica. She is the Chairperson of the Production Club and is ranked third among her peers in the highly competitive Century Club.
ADMINISTRATIVE HONORSContributor of the Year Sagicor Life Inc Barbados
André Scantlebury’s performance has been described as phenomenal. His reliability, persistence, calm approach and commitment to the work of the Corporate Secretarial and Legal and Compliance department saw him emerge as a keen team player and valuable contributor to the completion of several key projects associated with the Sagicor/Alignvest transaction. During 2020 he was nominated for trendsetter awards in Q2 and Q4.
Pioneer of the Year Sagicor Life Inc Barbados & the Sagicor Group of Companies
Nigel Pierre was responsible for the creation of the Risk Profiling Application, one of the tools used in our anti-money laundering and counter financing of terrorism (AML/CFT) efforts in the Southern Caribbean, Belize and Dutch Caribbean. Not only has the software application taken Sagicor’s effective AML/CFT risk-based approach and methodology and converted it to a software programme, but it has saved the company thousands of dollars in licensing fees. Nigel also contributes to the field of AML/CFT in Barbados, and is a founding Board Member of the Barbados Chapter of the Association of Anti-money Laundering Specialists.
43

Sagicor Spirit Employee of the Year & Sagicorian Employee of the Year Sagicor Life Inc
Tamara David is being recognized for her commitment to excellence and her desire to see Sagicor excel. She was integral to the success of several customer service initiatives in 2019, having been involved in customer experience training, leadership and staff development, the launch of the Contact Centre–Live Chat, as well as our customer loyalty initiatives. Tamara developed her own personal social responsibility project, “Hair 2 Care”, in which friends and family use their talents to style children’s hair while engaging them in wholesome conversations and delivering life-enhancing presentations. The programme also provides food to the less fortunate in needy Barbadian communities.
Sagicor Spirit Manager of the Year Sagicor Life Inc & Joint Sagicorian Manager of the Year
Kenrick Austin is being recognised for his leadership on several important projects during the year 2019, as his hands-on approach to leadership and willingness to go above and beyond the call of duty ensured success upon completion. Kenrick Austin is also a role model in the Policy Administration and Customer Service areas in SLI Southern Caribbean. He consistently exceeds expectations in his efforts to ensure the satisfaction of both internal and external customers, and he has been a keen resource in dealing with clients and regulators throughout the English and Dutch Caribbean.
Group Contributor of the Year Trinidad and Tobago
Sergio Smith is a top performer among our team in Trinidad and Tobago. Since being named Employee of the Year in 2016, he has continued to demonstrate his commitment to the company’s vision, values and business goals. He is a professional whose strong affinity for team work and collaboration has helped to create a positive culture for all those who interact with him.
Sagicorian Manager of the Year SUSA
Rohit Pagey has been an instrumental systems developer for the Sage Secure, MYGA, IUL, Peace Assured and Wealth Care Products that contributed to our record sales in 2019. He is being recognised as a great leader who does an amazing job inspiring his teams across the group, both onshore and offshore. Rohit epitomises the Sagicor Spirit through his dedication to work and to the community, as demonstrated through his active engagement with our partnering charity organisations.
44

INNOVATION & TECHNOLOGYTECHNOLOGY
Sagicor IT Response to COVID-19COVID-19 served as a catalyst for transformational shifts across our markets as well as our lines of business, prompting swift responses from Sagicor Information Technology Shared Services (Sagicor IT). Improving organisational velocity has long been a hallmark of Sagicor IT’s mission, and value was brought to both customers and internal business partners alike through the roll out of new technologies.
Working closely with business leadership, Sagicor IT pressed the accelerator on e-commerce initiatives, while successfully repositioning more than 4,000 team members across our network of countries to be able to work from home within a two-week window. This required deployment of next-generation collaboration tools, enhanced information security measures, user training and robust technical support services.
To support customer safety and meet social distancing requirements, mechanisms for accepting credit card payments were introduced and deployed across our websites, client portals, and at branch locations. Our range of electronic applications was extended to include more products, reducing the need for paper transactions and further minimising personal contact. Underwriting rules were automated to enable greater throughput, and internal processes
were adapted to enable the use of digital signatures.
A number of business processes were modified to assist consumers. Every effort was made to facilitate client payments, and both the website portal and the Sagicor Go! app proved to be convenient options. Following the company’s decision to offer payment moratoria to clients, changes were developed to ease policy lapse rules, as well as the lapse grace period. Additionally, processes and systems were revised to accept tele-medicine claims.
All these changes and innovations required tight coordination, fast cadence, and strong teamwork across IT members based in Barbados, Trinidad, Jamaica, and USA, as well as third party resources in India and North America.
Workflow Remains a FocusWorkflow tools underpin Sagicor’s virtual Branch Network, which allows customer-driven activities to start in their country of origin, but be processed in any other Sagicor jurisdiction. This approach to “cross-skilling” the branch and back-office workforce on new business and policy management activities allowed for better workload balancing, as non-peak tasks began to be addressed outside of peak volume periods. Analytics indicate that workflow technology was successfully leveraged during the
year, resulting in increased operational efficiency, reduced paperwork, and enhanced customer experience.
For Sagicor Investments Trinidad and Tobago Limited, IT process analysis teams worked closely with business users, third party vendors, internal software developers and integration specialists to create a highly automated production platform that initially removed almost 70% of manual tasks, with further streamlining expected.
Technology ReuseTechnology reuse continues to be an important pillar of Sagicor’s IT community, as seen in the evolution of the Client Experience Portal (CXP). A modular platform, the CXP was initially designed, developed, and deployed for the Employee Benefits Division in Jamaica to provide a client with consolidated view to an array of services. However, its modular design and flexibility allowed it to easily be adapted for Individual Life and Annuities, Individual Health, General Insurance, Mortgages and online motor claims. Other enhancements included the addition of electronic payment facilities, and the granting of permissions to Sagicor General partners (brokers, roadside assistance and police) which allowed them to access claims and insurance coverage details.
Sagicor USA AutomationIn the USA, there were significant
workflow changes as well as new features to our life administration platform. The validation of agent training for annuity apps was automated, and shortly after implementation, 1,120 Annuity e-apps were received, and work effort was reduced by 93 hours. Additionally, the processing time of e-apps was also accelerated. New tools were created to provide a better and more secure way for agents to upload documents and move them through all the stages of the application process. These tools were easily customised and placed on the Sagicor public website, client website, and producer website.
Measure What You ManageDynamic dashboards were created to monitor performance of the new
initiatives, such as tracking sales and daily production, as well as various customer metrics for key transactions.
45

MANAGEMENT DISCUSSION & ANALYSIS

47Introduction and Notice
This Management’s Discussion and Analysis (“MD&A”) contains important information about Sagicor’s business and its performance for the three-month period and year ended December 31, 2020 with comparative analysis for the corresponding periods ended December 31, 2019. This MD&A should be read in conjunction with the Company’s annual financial statements, prepared in accordance with International Financial Reporting Standards (IFRS), in effect on the date of such information.
The following discussion is based on the financial condition and results of operations of Sagicor, unless otherwise specified or indicated. Financial information is presented in millions of US dollars, unless otherwise indicated. Amounts for subtotals, totals and percentage variances included in tables in this MD&A may not sum or calculate using the numbers as they appear in the tables due to rounding.
Legal Constitution and General Information
Sagicor Financial Company Ltd. (“Sagicor”) (“the Company”) (TSX: SFC) is a leading financial services provider in the Caribbean, with over 180 years of history. Sagicor’s registered office is located at Clarendon House, 2 Church Street, Hamilton, HM 11, Bermuda, with its principal office located at Cecil F De Caires Building, Wildey, St. Michael, Barbados.
On November 27, 2018, Sagicor Financial Corporation Limited entered into a definitive arrangement agreement as amended on January 28, 2019 with Alignvest Acquisition II Corporation (“Alignvest”) pursuant to which on December 5, 2019, Alignvest acquired all the shares of Sagicor by way of a scheme of arrangement under the laws of Bermuda, where Sagicor is incorporated, and continued as Sagicor Financial Company Ltd.
The Company’s issued common shares are listed on the Toronto Stock Exchange.
Sagicor Financial Company Ltd. and its subsidiaries (“the Group”) operate across the Caribbean and in the United States of America (USA). Details of Sagicor’s holdings and operations are set out in notes 4 and 38 to the 2020 financial statements.
The principal activities of the Sagicor Group are as follows:
• Life and health insurance,• Annuities and pension administration services,• Banking and investment management services,
and its principal operating companies are as follows:
• Sagicor Life Inc. (Barbados and Trinidad & Tobago),• Sagicor Life Jamaica Limited (Jamaica),• Sagicor Bank Jamaica Limited (Jamaica),• Sagicor Life Insurance Company (USA).
The Group also underwrites property and casualty insurance and provides hospitality services.
Result of Operations
An understanding of Sagicor’s financial condition and the results and related risks of Sagicor’s operations for the periods discussed in this MD&A requires an understanding of Sagicor’s business. Accordingly, the following discussion should be read in conjunction with the discussion of these and related matters that appear elsewhere in this MD&A, including under the following headings: (i) Key Factors Affecting Results; (ii) Critical Accounting Estimates and Judgments; and (iii) Risk Management.
Non-IFRS Financial Information
Sagicor reports its financial results and statements in accordance with IFRS. It also publishes certain financial measures that are not based on IFRS (non-IFRS). A financial measure is considered a non-IFRS measure if it is presented other than in accordance with the generally accepted accounting principles used for the Group’s audited financial statements. These non-IFRS financial measures are often accompanied by and reconciled with IFRS financial measures. For certain non-IFRS financial measures, there are no directly comparable amounts under IFRS. The Group believes that these non-IFRS financial measures provide additional information to better understand the Group’s financial results and assess its growth and earnings potential. Since non-IFRS financial measures do not have standardised definitions and meanings, they may differ from the non-IFRS financial measures used by other institutions and should not be viewed as an alternative to measures of financial performance determined in accordance with IFRS. The Group strongly encourages investors to review its financial statements and other publicly filed reports in their entirety and not to rely on any single financial measure.

48Sagicor believes that certain non-IFRS measures described below are more reflective of its ongoing operating results and provide readers with a better understanding of management’s perspective on the Group’s performance. These measures enhance the comparability of the Group’s financial performance from period to period, as well as measure relative contribution to shareholder value.
The following represent non-IFRS financial measures:
1. Return on Shareholders’ Equity
IFRS does not prescribe the calculation of return on shareholders’ equity and therefore a comparable measure under IFRS is not available. To determine this measure, reported net income/(loss) attributable to shareholders is divided by the total weighted average common shareholders’ equity for the period. The quarterly return on shareholders’ equity is annualised.
2. Return on Total Equity
IFRS does not prescribe the calculation of return on total equity and therefore a comparable measure under IFRS is not available. To determine this measure, reported group net income/(loss) is divided by the weighted average total equity for the period. The quarterly return on total equity is annualised.
3. Return on Investments
IFRS does not prescribe the calculation of return on Investments therefore a comparable measure under IFRS is not available. Return on investments measures the return on the investments relative to the value of the investments for a period. To determine this measure, two times investment income is divided by the opening financial investments plus the closing financial investments minus the investment income for the period.
4. Book value per share
To determine the book value per share, shareholders’ equity is divided by the number of shares outstanding at the period end, net of any treasury shares.
5. Minimum Continuing Capital and Surplus Requirements (MCCSR)
The MCCSR is a capital adequacy measure for life insurance companies that was established by the Office of the Superintendent of Financial Institutions Canada (“OSFI”). It was used to monitor that insurers maintain adequate capital to meet their financial obligations with 150% being the minimum standard that was recommended by Canadian regulators when it was in effect; companies were
expected to establish and meet an internal target greater than 150%. Refer to note 46.2 to the 2020 audited financial statements, for details.
6. Debt to capital ratio
The debt to capital ratio is the ratio of notes and loans payable (refer to note 16 to the 2020 audited annual financial statements) to total capital (excluding Participating accounts), where capital is defined as the sum of notes and loans payable and total equity excluding Participating accounts. This ratio measures the proportion of debt a company uses to finance its operations as compared with its capital.
7. Debt to equity ratio
The debt to equity ratio is the ratio of notes and loans payable (refer to note 16 to the 2020 audited annual financial statements) to total equity (excluding Participating accounts). This ratio measures the proportion of debt a company uses to finance its operations as compared with its equity.
8. Dividend pay-out ratio
This is the ratio of dividends paid per share to basic earnings per common share.
9. Health claims ratio
This is the ratio of net health claims including the provision for incurred but not reported claims, divided by net health premiums revenue earned for the period under review. The ratio seeks to measure health claims as a percentage of premium income.
Cautionary Statement Regarding Forward-Looking Information
This MD&A includes “forward-looking information” and “forward-looking statements” (collectively “forward-looking information”) and assumptions about, among other things, Sagicor’s business, operations, and financial performance and condition, approved by the board of directors of Sagicor on the date of this MD&A.
This forward-looking information and these assumptions include, but are not limited to, statements about Group’s objectives and strategies to achieve those objectives, and about its beliefs, plans, expectations, anticipations, estimates, or intentions. Information included in this MD&A that is not a statement of historical fact is forward-looking information. When used in this MD&A, words such as “believes,” “may,” “will,” “estimate,” “should,” “shall,” “plans,” “assumes,”

49“continue,” “outlook,” “could,” “anticipates,” “intends,” “expects,” and words of similar import, are intended to identify statements containing forward-looking statements. These statements appear throughout this MD&A. Such forward-looking statements are based on Sagicor’s estimates, assumptions, strategies and projections and subject to known and unknown risks, uncertainties and other factors, all of which are difficult to predict and many of which are beyond its control and which may cause actual results, events or developments to be significantly different from any future results, events or developments expressed or implied by such forward-looking statements.
Risk factors include, but are not limited to, the following: fluctuations in the fixed income markets may adversely affect Sagicor’s profitability and financial condition; the success of Sagicor’s operations in the United States depends on Sagicor’s ability to grow its business; Sagicor’s financial targets may prove materially inaccurate or incorrect; Sagicor’s exposure to the credit risk of its counterparties could adversely affect its profitability; differences between actual claims experience and estimated claims at the time the product was priced may result in increased losses, and so Sagicor’s policy reserves may be insufficient to cover actual policy benefits; Sagicor could be forced to sell investments at a loss to cover policyholder withdrawals; Sagicor’s risk management policies and procedures could leave Sagicor exposed to unidentified or unanticipated risks, which could negatively affect Sagicor’s business or result in losses; illiquidity of certain investment assets may prevent Sagicor from selling investments at fair prices in a timely manner; Sagicor’s fiduciary relationship with certain counterparties could adversely affect its profitability; a prolonged labour dispute could hurt Sagicor’s business; disease outbreaks may negatively impact the performance of Sagicor and its subsidiaries; a failure to successfully integrate Sagicor’s acquisitions could adversely affect Sagicor’s operations and profitability; a failure to successfully execute current and future strategic acquisitions could adversely affect Sagicor’s profitability; Sagicor’s business is highly regulated and subject to numerous laws and regulations; litigation and regulatory proceedings outcomes could adversely affect Sagicor’s business; companies in the financial services industry are sometimes the target of law enforcement investigations and the focus of increased regulatory scrutiny; there may be adverse consequences if the status of Sagicor’s independent contractors is successfully challenged; failures to implement or comply with legally required anti-money laundering practices could subject Sagicor to sanctions and/or criminal and civil penalties; the amount of statutory capital that Sagicor’s insurance subsidiaries have and the amount of statutory capital that they must hold to maintain their financial strength and credit ratings and meet other requirements can vary significantly from time to time and are sensitive to factors outside of Sagicor’s control; a failure to maintain adequate levels of surplus capital may result in increased regulatory scrutiny or a downgrade by the private rating agencies; Sagicor’s financial condition may be adversely affected
by geopolitical events; Sagicor operates in a highly competitive industry; Sagicor faces significant competition mainly from national and regional insurance companies and from self-insurance, and Sagicor also faces competition from global companies – this competition could limit Sagicor’s ability to gain or maintain its position in the industry and could materially adversely affect its business, financial condition and results of operations; brokers that sell Sagicor’s products may sell insurance products of Sagicor’s competitors and such brokers may choose not to sell Sagicor’s products; computer viruses, network security breaches, disasters or other unanticipated events could affect Sagicor’s data processing systems or those of its business partners and could damage Sagicor’s business and adversely affect its financial condition and results of operations; a financial strength downgrade in Sagicor’s A.M. Best ratings or any other negative action by a rating agency may increase policy surrenders and withdrawals, adversely affect relationships with advisors and negatively affect Sagicor’s financial condition and results of operations; the unpredictable nature of the property and casualty insurance industry may cause fluctuations in Sagicor’s results; Sagicor may be unable to reinsure risks on terms that are commercially reasonable or satisfactory to Sagicor, or Sagicor’s reinsurers may fail to meet assumed obligations, increase rates, or be subject to adverse developments, negatively affecting Sagicor’s business, financial condition and result of operations; Sagicor’s business model depends on the performance of various third parties including actuarial consultants and other service providers; negative publicity in the insurance industry could adversely affect Sagicor; Sagicor depends on key personnel, and if they were to leave Sagicor, Sagicor might have an insufficient number of qualified employees; Sagicor is highly dependent upon economic, political and other conditions and developments in Barbados, Jamaica, Trinidad and Tobago, the United States and the other jurisdictions in which it operates; Sagicor’s financial condition and operating results may be adversely affected by foreign exchange fluctuations; foreign exchange controls may restrict Sagicor’s ability to receive distributions from its subsidiaries and any such distributions may be subject to foreign withholding taxes; catastrophes and weather-related events, such as hurricanes, may adversely affect Sagicor; disease outbreaks may negatively impact the performance of Sagicor and its subsidiaries; the performance of Sagicor’s group life insurance may be adversely affected by the characteristics of the employees insured or through unexpected catastrophic events such as natural disasters; Sagicor’s credit ratings may be reduced, which may adversely affect Sagicor; Sagicor may be subject to Bermuda tax; Bermuda’s compliance with the Organization for Economic Cooperation and Development international tax standards could subject Sagicor to additional taxes; legislation enacted in Bermuda in response to the European Union’s review of harmful tax competition could adversely affect Sagicor’s operations and financial condition; any additional taxes resulting from changes to tax regulations or the interpretation thereof in countries in which it does business could negatively impact Sagicor’s financial condition; Sagicor Financial Company

50Ltd. is a holding company and is dependent upon distributions from subsidiaries to pay taxes and other expenses.
Additional information about material risk factors that could cause actual results to differ materially from expectations and about material factors or assumptions applied in making forward-looking statements may be found in this MD&A under “Risk Management”, “Key Factors Affecting Results,” and “Critical Accounting Estimates and Judgements” and in the “Financial Risk” and “Insurance Risk” notes to the consolidated financial statements. The forward-looking statements in this document are, unless otherwise indicated, stated as of the date hereof and are presented for the purpose of assisting investors and others in understanding our financial position and results of operations, our future operations, as well as our objectives and strategic priorities, and may not be appropriate for other purposes. We do not undertake to update any forward-looking statements, except as required by law.
Additional Information
All documents related to the financial results of Sagicor Financial Company Ltd. are available on the Company’s website at Sagicor.com, in the Investor Relations section. Additional information about Sagicor may be found on the SEDAR website at sedar.com, as well as the Company’s Annual Information Form, which may be found on the Company’s website or the SEDAR website.
The Management’s Discussion and Analysis is dated March 30, 2021.
Table of Contents
Page
1. HIGHLIGHTS 51
2. PROFITABILITY 59
3. ANALYSIS BY BUSINESS SEGMENT 80
4. FINANCIAL POSITION 96
5. FINANCIAL INVESTMENTS 107
6. RISK MANAGEMENT 110
7. ADDITIONAL FINANCIAL INFORMATION 123
8. HISTORICAL FINANCIAL DISCLOSURES 127

511. HIGHLIGHTS
The Group’s financial results for the year ended December 31, 2020 were materially affected by COVID-19. On March 11, 2020 the World Health Organisation declared the emergence of COVID-19 coronavirus, a global pandemic. As a response to this public health emergency, governments around the world have made significant interventions in responding to this threat. Most Caribbean countries have experienced periods of shut down and periods of significantly reduced air and sea traffic. Similar procedures have also been implemented in the United States, Canada and elsewhere. In addition, Governments have implemented various forms of public lockdowns which have largely curtailed economic and social activity during the year. Companies have therefore implemented work from home policies in response to these restrictions. Sagicor, like other companies has had to focus on supporting our staff, customers and suppliers, while developing responses to the business disruption. The Group has made significant efforts to stabilize revenues while maintaining customer service levels. During the three-month period ended December 31, 2020 there have been attempts to modify and relax some of the restrictions implemented earlier in the year, however some countries experienced potential second wave of infections which reduced the ability to modify these restrictions. As a consequence, many of the restrictions have continued with a dampening impact on economic activity. The overall impact of COVID-19 is still evolving and there have been developments in research which have yielded new drugs to fight the pandemic. The ultimate success of the actions taken by Governments, businesses and communities and the ultimate outcomes may vary by country as new medical tools and drugs are developed.
Against this backdrop the Sagicor Group recorded net income of US $ 14.4 million for the three months ended December 31, 2020, compared to net income of US $24.5 million for the same period in 2019. Net income from continuing operations attributable to common shareholders was US $29.0 million compared to net income US $11.5 million, for the same period in the prior year. The main contributing factors to the financial performance during the three-month period were the normalisation of new business sales levels across all our geographies, and the positive impact of our asset optimisation efforts in our Sagicor Life segment which gave rise to a release in actuarial liabilities. These positive developments were offset by a further strengthening of reserves for forward-looking assumptions in our United States subsidiary, and group net income was affected by our share of net loss and impairment related to our associated company investment in Playa Hotels & Resorts due to the economic environment occasioned by the pandemic.
Sagicor Group recorded a net loss of US $15.1 million for the year ended December 31, 2020, compared to net income of US $104.1 million for the same
period in 2019. Net loss from continuing operations attributable to common shareholders was US $3.6 million compared to net income US $44.0 million, for the same period in the prior year. The main contributing factors to the net loss were slower new business sales in the first half of 2020, higher Expected Credit Losses (ECLs), the strengthening of our actuarial liabilities within our USA segment and in the case of Group net income, our share of net loss and impairment related to our associated company investment in Playa Hotels & Resorts, all due to the economic environment occasioned by the pandemic. The Group was also impacted by net mark-to-market losses as a result of the markets’ response to COVID-19 coupled with declines in fees and other revenues associated with the hospitality and banking businesses.
Group capital remains strong, with the Group closing 2020 with a Minimum Continuing Capital and Surplus Requirement (MCCSR) of 252%, well above our target capital standards.
About Sagicor
Established in 1840 as The Barbados Mutual Life Assurance Society, Sagicor is one of the oldest providers of insurance in the Americas. Sagicor offers a wide range of products and services including life and health insurance, annuities, pension administration, property and casualty insurance, asset management, investment and merchant banking, securities brokerage, mutual funds and real estate development, and commercial banking. Sagicor’s principal markets are Barbados, Jamaica, Trinidad and Tobago, and the United States of America. Sagicor demutualised in November 2002 and listed its shares on the Barbados Stock Exchange (BSE: SFC), with subsequent listings on the Trinidad and Tobago Stock Exchange (TTSE: SFC) and the London Stock Exchange (LSE: SFI). Sagicor Financial Corporation moved its corporate domicile from Barbados to Bermuda and continued as Sagicor Financial Corporation Limited (SFCL), an exempted company, on July 20, 2016.
As a result of its completed business combination with Alignvest Acquisition II Corporation (AQY) on December 5, 2019, the new Sagicor, known as Sagicor Financial Company Ltd., now trades on the Toronto Stock Exchange under the new symbols “SFC” and “SFC.WT”. With a listing on the Toronto Stock Exchange, Sagicor Financial Corporation Limited’s common shares, formerly listed on the London Stock Exchange, have ceased trading and have been delisted from the London Stock Exchange. Former listings on the Barbados and the Trinidad and Tobago Stock Exchanges have ceased trading and applications for delisting have been submitted.
Sagicor currently operates in 20 countries and maintains a strong market position in most of the markets where it operates.

52Sagicor operates its business primarily through its three reporting operating segments, namely Sagicor Life, Sagicor Jamaica, and Sagicor Life USA.
Sagicor’s objective is to be a leading insurance and financial services provider of world class products and services to better serve its customers and other stakeholders in its markets. Sagicor is expanding its banking and asset management business in the Caribbean, where it has strong brand recognition and market shares.
DECEMBER 2020 REVENUE: US $1,878.4M
Barbados - 10%
Jamaica - 31%
Trinidad & Tobago - 14%
Other Caribbean - 9%
USA - 36%
REVENUE BY GEOGRAPHICAL SEGMENTSFor the year ended December 31, 2020
Banking, investment management and other financial services - 9%
Property and casualty insurance - 4%
Life, health and annuity insurance issued to groups - 16%
Life, health and annuity insuranceissued to individuals 68%
Hospitality - 1%
Other - 2%
REVENUE BY LINE OF BUSINESSFor the year ended December 31, 2020
DECEMBER 2020 REVENUE: US $1,878.4M
Financial Summary
The summary consolidated financial data is derived from the audited annual financial statements, for each of the periods indicated on the following table.
On December 5, 2019 Sagicor and Alignvest announced they had completed the business combination involving the transfer of all issued and outstanding shares in Sagicor to Alignvest. This transaction raised over US $450 million in new capital for the Group. As a result of the completion of the transaction, all issued and outstanding shares in Sagicor were transferred to Alignvest, with former shareholders of Sagicor receiving cash or shares in Alignvest, which was renamed Sagicor Financial Company Ltd. and trades on the Toronto Stock Exchange under the symbol SFC.
Under the Alignvest transaction, Sagicor Financial Corporation Limited common shares (other than those purchased for cash), were exchanged for common shares of Sagicor Financial Company Ltd. on an exchange ratio of one Sagicor Financial Company Ltd. common share for 4.328 of Sagicor Financial Corporation Limited common shares (“Exchange Ratio”). This exchange ratio has been used to convert the 2019 outstanding shares to the Sagicor Financial Company Ltd. equivalent. All per share ratios for 2016 to 2019 have been adjusted to reflect the Exchange Ratio.

53Three months ended
December 31
(in millions of US $, unless otherwise noted) 2020 2019 Change
Profitability
Group net income 14.4 24.5 (41%)
Group net income (a) 14.4 24.5 (41%)
Group net income (a) (b) 14.4 67.9 (79%)
Net income (a) attributable to common shareholders 29.0 11.5 152%
Net income (a) (b) attributable to common shareholders 29.0 54.9 (47%)
Earnings per share:
Basic earnings(a) 19.8¢ 12.3¢ 61%
Basic earnings(a) (b) N/A 58.7¢ N/A
Fully diluted (a) 19.6¢ 10.9¢ 80%
Fully diluted (a) (b) N/A 51.9¢ N/A
Return on shareholders’ equity (a) 10.8% 6.2% 4.6 pts
Return on shareholders’ equity (a) (b) N/A 30.4% N/A
Growth
Revenue:
Individual life, health and annuity 512.6 288.5 78%
Group life, health and annuity 81.6 78.7 4%
Property and casualty insurance 18.3 23.5 (22%)
Banking and investment management 45.0 54.9 (18%)
Hospitality 4.4 11.3 (61%)
Farming and unallocated revenues 12.6 14.8 (15%)
Total revenue 674.5 471.7 43%
(a) From continuing operations. (b) Before listing expense and other transaction costs incurred in 2019.
Year ended December 31
(in millions of US $, unless otherwise noted) 2020 2019 Change
Profitability
Group net (loss)/income (15.1) 104.1 (115%)
Group net (loss)/income (a) (15.1) 103.6 (115%)
Group net (loss)/income (a) (b) (15.1) 147.0 (110%)
Net (loss)/income (a) attributable to common shareholders (3.6) 44.0 (108%)
Net (loss)/income (a) (b) attributable to common shareholders (3.6) 87.4 (104%)
Earnings per share:
Basic earnings(a) (2.4 ¢) 57.5¢ (104%)
Basic earnings(a) (b) N/A 114.3¢ N/A
Fully diluted (a) (2.4 ¢) 54.1¢ (104%)
Fully diluted (a) (b) N/A 107.5¢ N/A
Return on shareholders’ equity (a) (0.3%) 6.8% (7.1) pts
Return on shareholders’ equity (a) (b) N/A 14.0% N/A
Growth
Revenue:
Individual life, health and annuity 1,270.7 1,214.8 5%
Group life, health and annuity 304.8 317.9 (4%)
Property and casualty insurance 82.3 61.9 33%
Banking and investment management 171.2 192.2 (11%)
Hospitality 14.3 41.7 (66%)
Farming and unallocated revenues 35.1 38.8 (10%)
Total revenue 1,878.4 1,867.3 1%
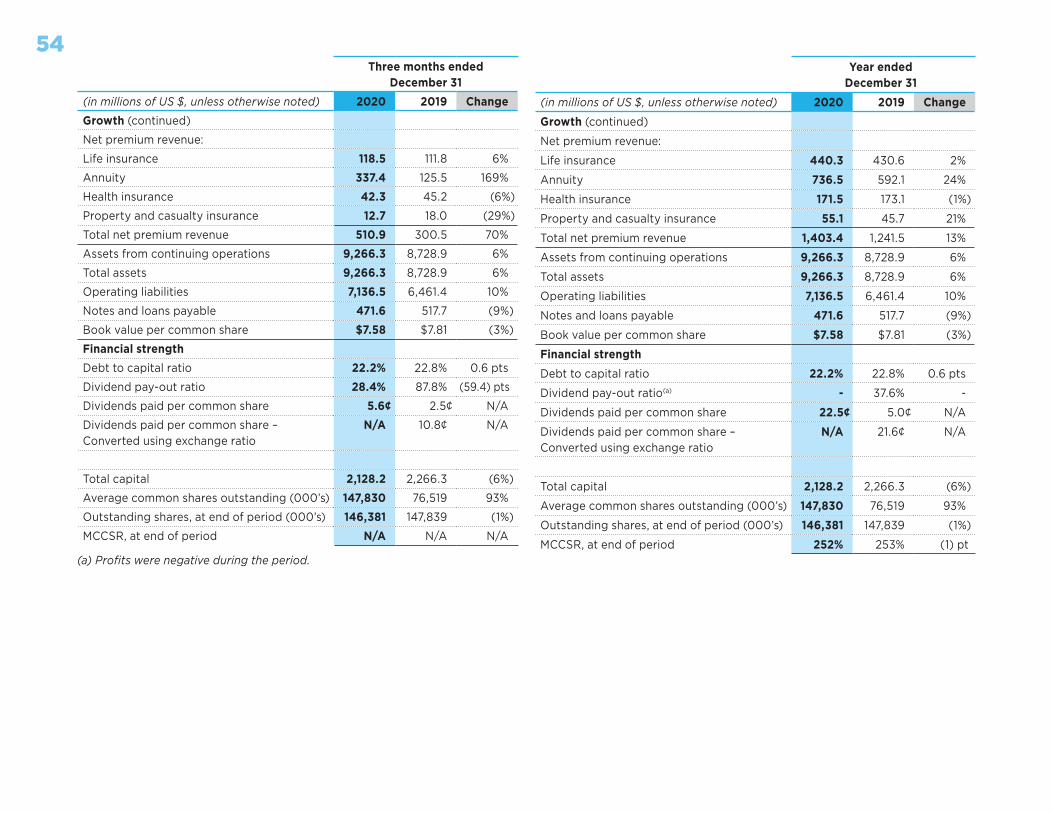
54Three months ended
December 31
(in millions of US $, unless otherwise noted) 2020 2019 Change
Growth (continued)
Net premium revenue:
Life insurance 118.5 111.8 6%
Annuity 337.4 125.5 169%
Health insurance 42.3 45.2 (6%)
Property and casualty insurance 12.7 18.0 (29%)
Total net premium revenue 510.9 300.5 70%
Assets from continuing operations 9,266.3 8,728.9 6%
Total assets 9,266.3 8,728.9 6%
Operating liabilities 7,136.5 6,461.4 10%
Notes and loans payable 471.6 517.7 (9%)
Book value per common share $7.58 $7.81 (3%)
Financial strength
Debt to capital ratio 22.2% 22.8% 0.6 pts
Dividend pay-out ratio 28.4% 87.8% (59.4) pts
Dividends paid per common share 5.6¢ 2.5¢ N/A
Dividends paid per common share – Converted using exchange ratio
N/A 10.8¢ N/A
Total capital 2,128.2 2,266.3 (6%)
Average common shares outstanding (000’s) 147,830 76,519 93%
Outstanding shares, at end of period (000’s) 146,381 147,839 (1%)
MCCSR, at end of period N/A N/A N/A
(a) Profits were negative during the period.
Year ended December 31
(in millions of US $, unless otherwise noted) 2020 2019 Change
Growth (continued)
Net premium revenue:
Life insurance 440.3 430.6 2%
Annuity 736.5 592.1 24%
Health insurance 171.5 173.1 (1%)
Property and casualty insurance 55.1 45.7 21%
Total net premium revenue 1,403.4 1,241.5 13%
Assets from continuing operations 9,266.3 8,728.9 6%
Total assets 9,266.3 8,728.9 6%
Operating liabilities 7,136.5 6,461.4 10%
Notes and loans payable 471.6 517.7 (9%)
Book value per common share $7.58 $7.81 (3%)
Financial strength
Debt to capital ratio 22.2% 22.8% 0.6 pts
Dividend pay-out ratio(a) - 37.6% -
Dividends paid per common share 22.5¢ 5.0¢ N/A
Dividends paid per common share – Converted using exchange ratio
N/A 21.6¢ N/A
Total capital 2,128.2 2,266.3 (6%)
Average common shares outstanding (000’s) 147,830 76,519 93%
Outstanding shares, at end of period (000’s) 146,381 147,839 (1%)
MCCSR, at end of period 252% 253% (1) pt

55Profitability
The Sagicor Group recorded a net loss of US $15.1 million for the year ended December 31, 2020, compared to net income before listing and other transaction costs of US $147.0 million reported for the same period in 2019. Net loss from continuing operations attributable to common shareholders, amounted to US $3.6 million compared to net income before listing expense and other transaction costs of US $87.4 million for the corresponding period in 2019. Both Group net income and income attributable to shareholders from continuing operations were adversely affected by the impact of the COVID-19 pandemic on the business. The main contributing factors to the net loss were slower than expected new business generation in the first half of 2020, higher Expected Credit Losses (ECLs), net mark-to-market losses, the strengthening of our actuarial liabilities within our USA segment, associated with its forward-looking assumptions and the long-term impact COVID-19 has had on the economic policy and outlook in the USA and, for Group net income our share of net loss and impairment related to our associated company investment in Playa Hotels & Resorts, all due to the economic environment occasioned by the pandemic. The Group was also impacted as a result of the markets’ response to COVID-19, as well as declines in fees and other revenues associated with the hospitality and banking businesses.
Earnings per share (basic) for the year ended December 31, 2020 was a loss of $0.024 per share compared to a profit of US $1.143 per share (before listing expense and other transaction costs), for the year December 31, 2019.
Refer to the Profitability section of this Management’s Discussion and Analysis for additional information on the Company’s profitability for the year 2020.
ProfitabilityThree months ended
December 31Year ended
December 31
(in millions of US $, unless otherwise noted) 2020 2019 Change 2020 2019 Change
Group net income/(loss) from continuing operations (a) 14.4 67.9 (79%) (15.1) 147.0 (110%)
Group net income/(loss) from continuing operations 14.4 24.5 (41%) (15.1) 103.6 (115%)
Net income/(loss) attributable to common shareholders from continuing operations (a) 29.0 54.9 (47%) (3.6) 87.4 (104%)
Listing expense and other transaction costs - (43.4) 100% - (43.4) 100%
Net income/(loss) attributable to common shareholders from continuing operations 29.0 11.5 152% (3.6) 44.0 (108%)
Earnings per common share (EPS) – (basic) $0.198 $0.123 61% ($0.024) $0.575 (104%)
Earnings per common share (EPS) – (basic) (a) N/A $0.587 N/A N/A $1.143 N/A
(a) Before listing expense and other transaction costs incurred in 2019
Business Growth
Net premiums showed growth for the year ended December 31, 2020, however, net investment income showed declines when compared to the same period in the prior year. Net premium revenue grew 13% when compared to 2019 financial year, due in part to a significant increase in premium revenue in our USA segment in the fourth quarter. Net investment income was impacted by mark-to-market declines on our financial assets. These declines have impacted our regional and our international portfolios and were largely a result of the capital markets reaction to the COVID-19 pandemic. As a result, the Group closed the year under review with total revenue growing by 1% when compared to the same period in 2019. Total revenue also includes Credit impairment losses of US $24.0 million for the year ended December 31, 2020 as the Group updated its credit impairment assumptions for the COVID-19 economic environment. The following table summarizes the revenue by operating segment.

56Total Revenue by Business Segment
Three months ended December 31
Year ended December 31
(in millions of US $, unless otherwise noted) 2020 2019 Change 2020 2019 Change
Sagicor Life 190.6 162.2 18% 523.3 533.3 (2%)
Sagicor Jamaica 177.1 194.2 (9%) 631.9 735.3 (14%)
Sagicor Life USA 295.0 103.0 186% 679.0 561.5 21%
Head office, Other and Adjustments 11.8 12.3 (4%) 44.2 37.2 19%
Total revenue 674.5 471.7 43% 1,878.4 1,867.3 1%
Refer to the sections that follow for more information on business growth.
Financial Strength
The consolidated Minimum Continuing Capital and Surplus Requirement (MCCSR - a Canadian risk-based assessment measure), for the life insurers of the Sagicor Group as of December 31, 2020 has been estimated at 252% (December 31, 2019 - 253%).
The debt to capital ratio was 22.2% as at December 31, 2020 compared 22.8% at December 31, 2019.
As of December 31, 2020, capital resources declined to US $2,128.2 million compared to US $2,266.3 million reported at the end of December 2019, a reduction of US $138.1 million. Capital resources, which comprises shareholder’s equity, notes and loans payable, and non-controlling interest, was largely driven by marked-to-market declines of our financial asset in response to the COVID-19 pandemic, coupled with declines in operating income being reported. During the year, the distribution of dividends to shareholders and a reduction to notes and loans payable also impacted capital resources. Non-controlling interests at December 31, 2020 were lower than reported in the prior year.
For detailed comments on financial strength, refer to the Financial Position section of the Management’s Discussion and Analysis.
Dividends
On February 3, 2020, the Board of Directors declared a dividend of US $0.05625 per share, on issued and outstanding common shares held by registered holders on record at the close of business on February 10, 2020. This dividend was paid on February 28, 2020.
On April 24, 2020, the Board of Directors declared a dividend of US $0.05625 per share, on issued and outstanding common shares held by registered holders on record at the close of business on May 5, 2020. The dividend was paid on May 29, 2020.
On August 14, 2020, the Board of Directors declared a dividend of US $0.05625 per share, on issued and outstanding common shares held by registered holders on record at the close of business on August 28, 2020. The dividend was paid on September 18, 2020.
On November 14, 2020, the Board of Directors declared a dividend of US $0.05625 per share, on issued and outstanding common shares held by registered holders on record at the close of business on November 25, 2020. The dividend was paid on December 16, 2020.
Quality of Investments
As of December 31, 2020, the Sagicor Group held US $7,238.6 million of diversified financial assets, compared to US $6,685.6 at December 31, 2019, an increase of US $553.0 million. The Group recorded net investment income of US $330.9 million for the year ended December 31, 2020 compared to US $419.8 million for the prior year. The annualized net investment return was 4.9% compared to 7.2% for the prior year, due to the impact of the market’s reaction to the COVID 19 pandemic. Since becoming a public company in 2002, Sagicor has had positive and stable investment portfolio performance. As at December 31, 2020, Sagicor held US $5,230.3 million in debts securities (72% of the total financial investments on hand). A summary of net investment income for the three-month periods and years ended December 31, 2020 and 2019, is shown below.
Investment Income Summary
Three months ended December 31
Year ended December 31
(in millions of US $, unless otherwise noted) 2020 2019 Change 2020 2019 Change
Interest income (AC) 45.7 44.3 3% 178.8 175.5 2%
Interest income (FVOCI) 34.5 35.7 (3%) 136.0 132.5 3%
Income from FVTPL investments 40.4 28.3 43% 18.7 112.8 (83%)
Other investment income 0.7 0.1 600% 4.0 7.9 (49%)
Investment expenses (1.0) (0.7) (43%) (6.6) (8.9) 26%
120.3 107.7 12% 330.9 419.8 (21%)

57Litigation or Other Matters
The Group is subject to various claims, disputes and legal proceedings, as part of the normal course of business. Provision is made for such matters when, in the opinion of management and its professional advisors, it is probable that a payment will be made by the Group, and the amount can be reasonably estimated.
In respect to claims asserted against the Group which, according to the principles outlined above, have not been provided for, management is of the opinion that such claims are either without merit, can be successfully defended, cannot be reasonably estimated or will result in exposure to the Group which is immaterial to both the financial position and the results of operations.
Significant matters are outlined below:
(i) Suit has been filed by a customer against one of the Group’s subsidiaries for breach of contract, and breach of trust in the amount of US $8.9 million being loss allegedly suffered as a result of what the claimants say is the unlawful withholding of insurance proceeds by the subsidiary. No provision was made in these financial statements for this claim as the outcome of this matter cannot be properly assessed until it has been heard.
(ii) Suit has been filed by an independent contractor against one of the Group’s subsidiaries for breach of contract arising from an alleged contractual agreement. The Claimant alleges that the company failed to pursue initiatives contemplated by the contract with a third party and that by not doing so, it caused the Claimant company significant losses which they have estimated at over US $300.0 million. No provision was made in these financial statements for this claim as the claim has been stayed to accommodate arbitration as required under the Agreement between the parties coupled with the assessment by the Group of a probable favourable outcome.
Board of Directors
The composition of the Board of Directors has been disclosed in the Group’s Management Discussion and Analysis for the year ended December 31, 2019. The composition of the Board of Directors was changed on June 30, 2020 as follows:
• Mr Monish Dutt and Mr Douglas (Rik) Parkhill resigned as directors of the Company.
• Mr Gilbert Palter and Mr Jonathan Finkelstein were elected as directors of the Company.
On October 30, 2020 the Board of Directors approved the re-appointment of Mr. Monish Dutt to the board to fill the vacancy created by the death of Director Mr. John Shettle. Mr. Dutt also serves as the chairman of the Audit Committee.
Changes to Accounting Policies in 2020
There were no new accounting standards adopted during the year ended December 31, 2020. Refer to note 2 of the 2020 annual consolidated financial statements included in pages 12 to 38.
Amendments to existing IFRS and IAS effective January 1, 2020
The Group has adopted the following amendments to IFRS and IAS:
• IFRS 3 – Definition of a business, effective January 1, 2020• IAS 1 and IAS 8 – The definition of material, effective January 1, 2020• Conceptual Framework for Financial Reporting, effective January 1, 2020• IFRS 9, IAS 39 and IFRS 7 – Interest Rate Benchmark Reform, effective
January 1, 2020
None of these amendments had a material effect on the Group’s financial statements. Refer to note 2.1 of the 2020 annual financial statements for further details on amendments to existing IFRS and IAS effective January 1, 2020.
Outlook for 2021
The Group’s outlook for 2021 continues to be clouded by the uncertain resolution to the pandemic that was declared in March 2020. The Group’s financial results in Q4 2020 continued to normalize with strong premium growth and further recovery of asset values. However, the economies in which we operate continue to be directly impacted by the lockdown in our markets and reduction in global economic activity, including tourism, which affects our Caribbean economies significantly. It is unclear when the pandemic will recede enough to fully open the economies in which we operate. As such, we will continue to monitor the situation and will resume providing specific guidance with respect to earnings targets when the timing of economic recovery becomes more certain.
Economic Environment
2020 was a challenging year for most developed and developing economies as the Coronavirus plagued nations, enforced stringent lockdown measures which constrained economic activity. Against this background, the International Monetary Fund (IMF) estimated global growth for 2020 contracted by 3.5%. Along this vein, the second estimates released by the Bureau of Economic

58Analysis indicated real GDP for the USA declined by 3.5% in 2020. In December 2020, the unemployment rate for the USA stood at 6.7% compared to 3.6% in December 2019 and 14.8% at the height of lockdown measures in April 2020. From March 2020, the Federal Open Market Committee switched into a dovish stance and implemented two interest rate cuts and continued to increase its holdings of Treasury and agency mortgage-backed securities in the effort to buffer the US economy from the ongoing pandemic. By the end of the year, the West Texas Intermediate oil prices declined to approximately US $48 per barrel from approximately US $61 per barrel at the end of 2019. However, during the year, oil prices experienced substantial volatility as the demand and supply of oil fluctuated significantly.
Despite economic activity in the Euro Area improving by 12.4% during the third quarter, this growth was preceded by declines of 11.7% and 3.7% in the second and first quarters, respectively. Economic activity in Japan also showed signs of recovery in the third quarter and increased by 5.3% compared to a decline of 8.3% in the second quarter of 2020. Furthermore, the IMF estimated real GDP in the Euro Area and Japan contracted by 7.2% and 5.1%, respectively in 2020. Like most Central Banks, the Bank of England dropped its short-term interest rate to 0.25% on March 11, 2020 and one week later imposed a further reduction to 0.1% where it was maintained for the remainder of the year. Japan’s short-term rates remained unchanged at its highly accommodative rate of -0.1% during 2020.
During the first half of the year, equity markets plummeted, and many investors sought safe haven assets. However, as Central Banks deployed accommodative strategies and the progression in vaccine trials and distributions continued, major international equity markets were buoyed and recovered these losses by the end of the year. In the US market, the S&P 500 Index was up 18.40% for the year. Similarly, the NASDAQ Composite Index and Dow Jones Industrial Average Index were up 44.92% and 9.72%, respectively for 2020 and the MSCI Emerging Market Index grew 18.31%. The 10-year treasury yield started 2020 at 1.88% and ended the year at 0.93%, maintaining its downward trend from 2019.
The most recent data from the Eastern Caribbean Central Bank (ECCB) projected the GDP for the Eastern Caribbean Currency Union (ECCU) was expected to decline within the range of 10% and 20% in 2020. Moreover, the IMF estimated GDP in the ECCU contracted by 16% in 2020. This double-digit decline in GDP was hinged on the projected 67.7% contraction in the tourism industry. Moreover, member governments of the ECCU recorded an aggregate decline of 16% in tax revenue during the first half of the year. According to the ECCB’s June 2020 Economic and Financial Review, the tourism industry for all members of the ECCU is expected to revert to normal levels by the end of 2023 or the first quarter of 2024.
Like most tourism dependent economies, economic growth in Barbados exhibited a sharp decline in 2020 as arrivals were reduced by 71% for the year. Preliminary estimates indicated real economic activity in Barbados contracted by 17.6% during 2020. Nonetheless, the agricultural output for Barbados during 2020 increased by 1.9% in comparison to the previous year. At the end of 2020, the international reserves for Barbados stood at BDS $2,661.9 million compared to BDS $1,481.0 million at the end of 2019, expanding the country’s import cover to 40.3 weeks. However, as the Government of Barbados acquired an aggregate of BDS $968 million in economic policy (fiscal stabilization) loans during 2020 and the acute reality of the country’s constricted GDP during the year became apparent, its previously downward trend of debt-to-GDP ratio was reversed. At the end of the year, the debt-to-GDP ratio was up to 144.4% from its 2019 position of 120.2%. The most recent Economic Review from the Central Bank of Barbados indicated the average unemployment rate in Barbados rose to 18.5% in 2020 from 10.1% in 2019. Moreover, inflation in Barbados trended downward to a recorded value of 3.5% in 2020 compared to 4.1% in 2019.
Real economic activity in Trinidad and Tobago was adversely impacted in 2020. The Ministry of Finance in Trinidad and Tobago indicated a widening of the government’s budget deficit to 11.2% of GDP in FY2019/20 compared to 2.6% in FY2018/19. Moreover, a deficit of TTD$ 1 billion was recorded for the first 3 months of FY2020/21 (October – December 2020) compared to TTD$ 386.8 million for the same period in FY2019/20. At the end of December 2020, Trinidad and Tobago’s headline inflation was subdued to 0.8%. At the end of December 2020, Trinidad and Tobago’s gross official reserves remained strong at approximately US $6,953.8 million, equivalent to 8.5 months of prospective imports of goods and services. The domestic stock market in Trinidad remained depressed for most of the year and the Composite Price Index declined by 9.9% for the year 2020.
In the quarter ended September 2020, the Jamaica economy contracted by 10.7% compared to contractions of 18.4% and 2.3% in the second and first quarters of 2020, respectively. The Bank of Jamaica’s latest forecasts of real economic activity for the fiscal year 2020/21 estimated a contraction within a range of 10 – 12%. From the onset of the pandemic, the Bank of Jamaica embarked on accommodative strategies including the provision of JMD $76 billion in liquidity support via bond-buying initiates and a reduction of the cash reserve requirements. Moreover, the Bank of Jamaica maintained its accommodative policy rate at 0.5% for the entirety of 2020. Inflation of 6.4% was recorded for the calendar year of 2020 in Jamaica. Jamaica’s unemployment rate rose by 3.5 percentage points to 10.7% as at October 2020, compared to the same period in 2019. The Jamaica Stock Exchange contracted 22.4% for 2020. The fixed income market yields continued their downwards trend as the GOJ 180-day Treasury Bill declined to 0.86% at the end of 2020 from 1.60% at the end of 2019.

592. PROFITABILITY
Highlights
The Sagicor Group recorded net loss attributable to common shareholders for the year ended December 31, 2020 of US $3.6 million, compared to net income of US $87.4 million (before listing expense and other transaction costs) reported for the same period in 2019, a decrease of US $91.0 million. Return on equity for the year 2020 was a loss of 0.3%, compared to 14.0% for 2019 (before listing expense and other transaction costs). The Earnings per Share (EPS - basic) moved similarly, closing at a loss of US $0.024 per share for the year compared to earnings of US $1.143 per share for the prior year (before listing expense and other transaction costs). These results have been largely driven by the impact of COVID-19 pandemic as the Group experienced mark-to-market losses on financial assets, credit impairment losses, declines in new business sales and strengthening of our actuarial liabilities.
Net (loss)/income attributable to Common shareholders from continuing operations Year ended December 31
(in millions of US $, unless otherwise noted) 2020 2019 Change
Sagicor Life 47.7 60.9 (22%)
Sagicor Jamaica 50.5 61.4 (18%)
Sagicor Life USA (27.1) 35.4 (177%)
Head office, Other and adjustments (74.7) (70.3) (6%)
Net (loss)/income before listing expense and other transaction costs (3.6) 87.4 (104%)
Listing expense and other transaction costs - (43.4) 100%
Net (loss)/income (3.6) 44.0 (108%)
Earnings per common share (EPS):
Basic (2.4¢) 57.5 ¢ (104%)
Basic – excluding listing expense and other transaction costs N/A 114.3 ¢ N/A
Diluted (2.4¢) 54.1 ¢ (104%)
Diluted – excluding listing expense and other transaction costs N/A 107.5 ¢ N/A
Return on common shareholders’ equity (ROE) (0.3%) 6.8% (7.1) pts
Return on common shareholders’ equity (ROE) – excluding listing expense and other transaction costs N/A 14.0% N/A
Group net (loss)/ income for the year ended December 31, 2020 and December 31, 2019.
The table below summarises Sagicor’s net (loss)/income for the year ended December 31, 2020 and 2019.
Year ended December 31,
(in millions of US $) 2020 2019 Change
Group net (loss)/income
Group net (loss)/income before listing expense and other transaction costs (15.1) 147.5 (110%)
Listing expense and other transaction costs - (43.4) 100%
Total (15.1) 104.1 (115%)
Net (loss)/ income is attributable to Common shareholders:
From continuing operations before listing expense and other transaction costs (3.6) 87.4 (104%)
Listing expense and other transaction costs - (43.4) 100%
From total continuing operations (3.6) 44.0 (108%)
From discontinued operation - 0.5 (100%)
(3.6) 44.5 (108%)
Participating policyholders 1.4 (1.9) 174%
Non-controlling interest (12.9) 61.5 (121%)
Group net (loss)/income (15.1) 104.1 (115%)
Group net losses amounted to US $15.1 million for the year ended December 31, 2020, compared to net income of US $147.5 million, excluding listing and other transaction costs, in the prior year.
Net loss from continuing operations attributable to common shareholders, closed the period at US $3.6 million compared to income of US $87.4 million (excluding listing and other transaction costs) for the year 2019. Both Group net loss and loss attributable to Shareholders from continuing operations, were impacted by significant mark-to-market losses and credit impairment losses, as capital markets responded adversely to the COVID-19 pandemic. In addition, during the year, the group strengthened the actuarial liabilities within our USA segment, associated with its forward-looking assumptions related to its policy liabilities and the long-term impact COVID-19 has had on the economic policy and outlook in the USA. An internal reinsurance transaction also resulted

60in a strengthening of reserves in our U.S. operation (US $13.4 million). The Group also experienced a positive impact from its asset optimisation efforts (US $27.6 million). Group net income was also impacted by our share of net loss and impairment related to our associated company investment in Playa Hotels and Resorts, all due to the economic environment occasioned by the pandemic.
Net income from discontinued operation was nil for the year ended December 31, 2020 compared to income of US $0.5 million for the same period in 2019. On February 12, 2019, The Group completed a review of the consideration related to the price adjustments to December 31, 2018 and entered into a Deed of Release to close off this exposure. The final settlement amount was received on February 26, 2019.
Group net (loss)/income from continuing operations
The table below summarises Sagicor’s net income from continuing operations for the year ended December 31, 2020 and 2019.
Year ended December 31
(in millions of US $) 2020 2019 Change
Group net income from continuing operations
Revenue 1,878.4 1,867.3 1%
Benefits (1,221.7) (1,116.5) (9%)
Expenses (561.1) (547.1) (3%)
Other (68.0) 3.0 (2,367%)
Income taxes (42.7) (59.7) 28%
Group net (losses)/income from continuing operations before listing expense and other transaction costs (15.1) 147.0 (110%)
Listing expense and other transaction costs - (43.4) 100%
Group net (losses)/income from continuing operations (15.1) 103.6 (115%)
Revenue
The following table summarises the main items of Sagicor’s revenue for the year ended December 31, 2020 and December 31, 2019.
Year ended December 31
(in millions of US $) 2020 2019 Change
Revenue
Net insurance premiums:
Life and annuity 1,176.8 1,022.7 15%
Health 171.5 173.1 (1%)
Property and casualty 55.1 45.7 21%
1,403.4 1,241.5 13%
Net investment income 330.9 419.8 (21%)
Gain on derecognition of amortised cost investments 8.9 12.9 (31%)
Gain on derecognition of assets carried at FVOCI 20.2 30.0 (33%)
Credit impairment losses (24.0) (4.9) (390%)
Fees and other revenue 139.0 168.0 (17%)
Total 1,878.4 1,867.3 1%
Total Revenue by Operating Segment
Sagicor Life 523.3 533.3 (2%)
Sagicor Jamaica 631.9 735.3 (14%)
Sagicor Life USA 679.0 561.5 21%
Head office, Other and Adjustments 44.2 37.2 19%
1,878.4 1,867.3 1%
Total revenue from continuing operations reached US $1,878.4 million for the year ended December 31, 2020, an increase of US $11.1 million (1%) from US $1,867.3 million reported for the same period in 2019.

61
Net insurance premium revenue represented 75% (December 2019 – 66%) of total revenue, and closed the year at US $1,403.4 million, US $161.9 million (13%) above the amount of US $1,241.5 million reported for the same period in 2019. Net premium revenue from the life and annuity insurance business totalled US $1,176.8 million for the year ended December 31, 2020, compared to US $1,022.7 million for the same period in 2019, an increase of US $154.1 million. Net premium revenue in our Sagicor Life USA segment grew US $152.4 million or 34% during the year and is consistent with our strategy to increase sales production in this segment. The Group was able to maintain reasonable sales of new insurance business notwithstanding the reduced economic activity occasioned by the COVID-19 pandemic. Our Sagicor Life segment also reported moderate growth however the impact was reduced by a moderate decline observed in our Jamaica segment due to the changing interest rate environment.
Net premium revenue from health insurance business totalled US $171.5 million for the year ended December 31, 2020, a modest decline from the US $173.1 million reported in 2019. Net premium revenue from property and casualty insurance totalled US $55.1 million for the year under review, a US $9.4 million or 21% increase from US $45.7 million for the same period in 2019. Net premium revenue from property and casualty insurance includes net premiums of US $18.4 million (2019 – US $8.0 million) related to the general insurance business - Advantage General Insurance Company Limited, acquired on September 30, 2019, in our Jamaica segment.
Both regional and international capital markets responded adversely to the uncertainty occasioned by the COVID-19 pandemic, resulting in net investment
REVENUE GROWTH BY OPERATING SEGMENT
$420.7$585.9$339.52018
$561.5$735.3$533.32019
$679.0$631.9$523.32020
US
$ m
illio
ns
Sagicor Jamaica
Sagicor Life USA
Sagicor Life
income of US $330.9 million for the year ended December 31, 2020 compared to US $419.8 million for the same period in 2019, a decrease of US $88.9 million. The Group experienced mark-to-market losses on its financial assets. Overall, the Group experienced realised and unrealised losses on financial assets categorised as FVTPL of US $4.6 million, during the year, which largely related to equities and equity indexed options in our USA and our Jamaica segments. In 2019, the Group benefitted from US $95.7 million in realised and unrealised gains on financial assets categorised as FVTPL.
The interest yields and returns achieved on financial investments are disclosed in the following table.
Year ended December 31
2020 2019
Interest yields
Debt securities 4.6% 5.1%
Mortgage loans 5.8% 6.0%
Policy loans 7.5% 7.3%
Finance loans and leases 11.2% 11.6%
Securities purchased for resale 2.4% 6.2%
Deposits 1.0% 1.6%
The Group generated Fees and other revenues of US $139.0 million for the year ended December 31, 2020, compared to US $168.0 million for the prior year, a decrease of US $29.0 million. The Group recorded lower hotel revenues (US $22.6 million), a direct consequence of the travel restrictions associated with the COVID-19 pandemic.
Benefits
Benefits totalled US $1,221.7 million in for the year ended December 31, 2020, a US $105.2 million or 9% increase from US $1,116.5 million reported in 2019. The increase in benefits (which include actuarial provisions for future benefits) reflects and is consistent with higher premium revenue in our Sagicor Life USA segment and was offset by a net reduction in actuarial provisions updated during the year in our Jamaica Segment coupled with reductions in actuarial provisions associated with asset optimisation efforts in our Sagicor Life segment.
The following table summarises the benefits provided by Sagicor to holders of insurance contracts, investment contracts and deposit and security liability contracts for the years ended December 31, 2020 and 2019.

62Year ended December 31,
(in millions of US $) 2020 2019 Change
Benefits
Net insurance benefits:
Life and annuity 1,017.7 900.0 (13%)
Health 132.9 135.3 2%
Property and casualty 28.2 27.0 (4%)
1,178.8 1,062.3 (11%)
Interest cost 42.9 54.2 21%
Total 1,221.7 1,116.5 (9%)
Life and annuity benefits totalled US $1,017.7 million for the year ended December 31, 2020 of which US $486.5 million related to current benefits and US $531.2 million related to future benefits. The amounts for the corresponding period in 2019 were a total of US $900.0 million, of which US $414.6 million related to current benefits and US $485.4 million related to future benefits. The change in provision for future benefits from 2019 to 2020 represented an increase of US $45.8 million.
The change in the future benefits for 2020 comprise primarily of the following:
(in millions of US $) 2020
Increase/(decrease)
New business - Sagicor Life USA 548.0
Update of Actuarial Assumptions - Sagicor Jamaica (43.0)
Impact of reinsurance agreement - Sagicor USA 13.4
Update of forward-looking assumptions - Sagicor USA 33.6
Impact of asset optimisation Sagicor Life (27.6)
Significant premium annuity – Sagicor Life 47.8
Other (41.0)
Total 531.2
Total health insurance benefits were US $132.9 million representing an overall claim to premium ratio of 77.5%. In 2019 the Group experienced health insurance benefits of US $135.3 million and an overall claim to premium ratio of 78.2%.
Property and casualty claims amounted to US $28.2 million in 2020, a US $1.2 million increase over the US $27.0 million incurred in 2019. The newly acquired subsidiary Advantage General Insurance, acquired on October 1, 2019 in our Jamaica segment, contributed additional benefits during the period under
review (US $7.5 million). Taking this into consideration there was an overall reduction in benefits of US $6.3 million. The improvement in general insurance claims was largely associated with a reduction in motor claims a direct impact of movement restrictions associated with the COVID-19 pandemic.
Interest expense totalled US $42.9 million for year ended December 31, 2020, a decrease from the US $54.2 million reported for the same period in 2019 and represented lower investment returns paid on contracts due to the current investment and economic environment.
The following table summarises the interest returns to holders of insurance contracts, investment contracts and deposit and security liability contracts.
Year ended December 31
2020 2019
Interest yields
Investment contracts 2.8% 2.6%
Other funding instruments 0.9% 2.3%
Customer deposits 1.2% 1.3%
Securities sold for repurchase loans and leases 2.3% 3.0%
Expenses and taxes
Expenses and taxes totalled US $603.8 million for the year ended December 31, 2020, down US $3.0 million from the amount reported for the same period in 2019 (before listing expense and other transaction costs). The table below summarises Sagicor’s expenses and taxes from continuing operations for the years ended December 31, 2020 and 2019.
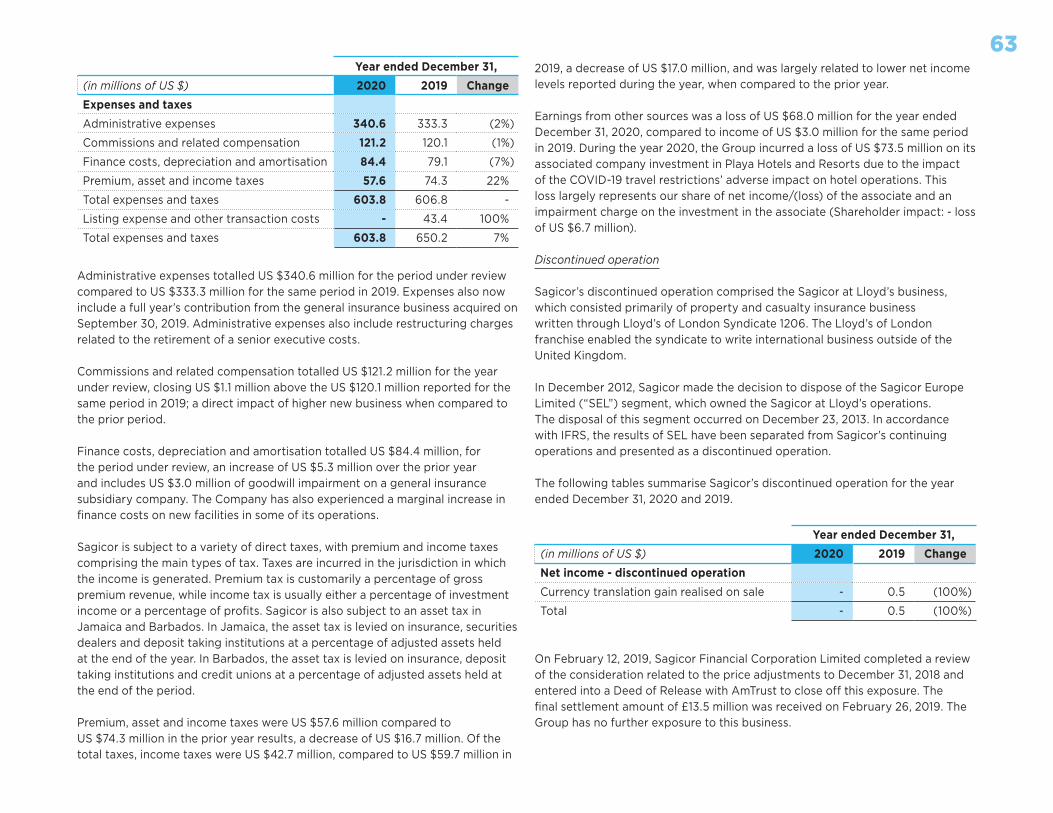
63Year ended December 31,
(in millions of US $) 2020 2019 Change
Expenses and taxes
Administrative expenses 340.6 333.3 (2%)
Commissions and related compensation 121.2 120.1 (1%)
Finance costs, depreciation and amortisation 84.4 79.1 (7%)
Premium, asset and income taxes 57.6 74.3 22%
Total expenses and taxes 603.8 606.8 -
Listing expense and other transaction costs - 43.4 100%
Total expenses and taxes 603.8 650.2 7%
Administrative expenses totalled US $340.6 million for the period under review compared to US $333.3 million for the same period in 2019. Expenses also now include a full year’s contribution from the general insurance business acquired on September 30, 2019. Administrative expenses also include restructuring charges related to the retirement of a senior executive costs.
Commissions and related compensation totalled US $121.2 million for the year under review, closing US $1.1 million above the US $120.1 million reported for the same period in 2019; a direct impact of higher new business when compared to the prior period.
Finance costs, depreciation and amortisation totalled US $84.4 million, for the period under review, an increase of US $5.3 million over the prior year and includes US $3.0 million of goodwill impairment on a general insurance subsidiary company. The Company has also experienced a marginal increase in finance costs on new facilities in some of its operations.
Sagicor is subject to a variety of direct taxes, with premium and income taxes comprising the main types of tax. Taxes are incurred in the jurisdiction in which the income is generated. Premium tax is customarily a percentage of gross premium revenue, while income tax is usually either a percentage of investment income or a percentage of profits. Sagicor is also subject to an asset tax in Jamaica and Barbados. In Jamaica, the asset tax is levied on insurance, securities dealers and deposit taking institutions at a percentage of adjusted assets held at the end of the year. In Barbados, the asset tax is levied on insurance, deposit taking institutions and credit unions at a percentage of adjusted assets held at the end of the period.
Premium, asset and income taxes were US $57.6 million compared to US $74.3 million in the prior year results, a decrease of US $16.7 million. Of the total taxes, income taxes were US $42.7 million, compared to US $59.7 million in
2019, a decrease of US $17.0 million, and was largely related to lower net income levels reported during the year, when compared to the prior year.
Earnings from other sources was a loss of US $68.0 million for the year ended December 31, 2020, compared to income of US $3.0 million for the same period in 2019. During the year 2020, the Group incurred a loss of US $73.5 million on its associated company investment in Playa Hotels and Resorts due to the impact of the COVID-19 travel restrictions’ adverse impact on hotel operations. This loss largely represents our share of net income/(loss) of the associate and an impairment charge on the investment in the associate (Shareholder impact: - loss of US $6.7 million).
Discontinued operation
Sagicor’s discontinued operation comprised the Sagicor at Lloyd’s business, which consisted primarily of property and casualty insurance business written through Lloyd’s of London Syndicate 1206. The Lloyd’s of London franchise enabled the syndicate to write international business outside of the United Kingdom.
In December 2012, Sagicor made the decision to dispose of the Sagicor Europe Limited (“SEL”) segment, which owned the Sagicor at Lloyd’s operations. The disposal of this segment occurred on December 23, 2013. In accordance with IFRS, the results of SEL have been separated from Sagicor’s continuing operations and presented as a discontinued operation.
The following tables summarise Sagicor’s discontinued operation for the year ended December 31, 2020 and 2019.
Year ended December 31,
(in millions of US $) 2020 2019 Change
Net income - discontinued operation
Currency translation gain realised on sale - 0.5 (100%)
Total - 0.5 (100%)
On February 12, 2019, Sagicor Financial Corporation Limited completed a review of the consideration related to the price adjustments to December 31, 2018 and entered into a Deed of Release with AmTrust to close off this exposure. The final settlement amount of £13.5 million was received on February 26, 2019. The Group has no further exposure to this business.

64Shareholder returns
Sagicor’s net income and comprehensive income are allocated to the equity owners of Sagicor’s respective Group companies in accordance with their results. As some Group companies have minority shareholders, particularly in the Sagicor Jamaica operating segment, the net income is allocated accordingly between holders of Sagicor common shares and the minority interest shareholders. There is also an allocation to Sagicor Life Inc.’s policyholders who hold participating policies, an arrangement which was established at the demutualization of the Barbados Mutual Life Assurance Society (now Sagicor Life), and of its amalgamation with Life of Barbados Limited.
The Group recorded a loss of US $3.6 million from continuing operations for the year ended December 31, 2020, allocated to the holders of Sagicor’s common shares. This corresponded to a loss per share for continuing operations of US $0.024. The comparative amount for the year ended December 31, 2019 was net income of US $87.4 million (before listing expense and other transaction costs), which corresponded to earnings per share of US $1.143. The respective annual returns on equity were a loss of 0.3% for December 2020 and income of 14.0% for December 2019.
The table below summarises Sagicor’s profitability, dividends and returns in respect of common shareholders for the years ended December 31, 2020 and 2019.
Year ended December 31,
Common shareholder returns 2020 2019
Net (loss)/income (a) attributable to common shareholders US ($3.6) million US $44.0 million
Net (loss)/income (a) (b) attributable to common shareholders US ($3.6) million US $87.4 million
Basic earnings (a) per share (2.4¢) 57.5¢
Basic earnings (a) (b) per share N/A 114.3¢
Fully diluted earnings (a) per share (2.4¢) 54.1¢
Fully diluted earnings (a) (b) per share N/A 107.5¢
Return (a) on shareholders’ equity (0.3%) 6.8%
Return (a) (b) on shareholders’ equity N/A 14.0%
Dividend pay-out ratio (a) (c) - 37.6%
Dividend pay-out ratio (a) (b) (c) - 18.9%
Dividends declared $ 33.2 million $15.3 million
Dividends paid per common share US $0.2250 US $0.2164
(a) From continuing operations. (b) Before listing expense and other transaction costs incurred in 2019. (c) Profits were negative during 2020.

65Comprehensive income
The table below summarises Sagicor’s total comprehensive income for the year ended December 31, 2020 and 2019.
Year ended December 31
(in millions of US $) 2020 2019 Change
Other comprehensive (loss)/income:
Items net of tax that may be reclassified subsequently to income:
Financial assets measured at fair value through other comprehensive income:
Gains on revaluation 97.3 168.7 (42%)
Gains transferred to income (16.6) (20.4) 19%
Net change in actuarial liabilities (52.1) (95.0) 45%
Cash flow hedges (0.7) (3.1) 77%
Other reserves - (0.1) 100%
Retranslation of foreign currency operations (38.2) (16.6) (130%)
(10.3) 33.5 (131%)
Items net of tax that will not be reclassified subsequently to income:
Losses arising on revaluation of ownership occupied property (14.9) (1.0) (1,390%)
Net losses on equity securities designated at fair value through other comprehensive income (0.1) - -
Losses on defined benefits plans 3.5 11.2 (69%)
(11.5) 10.2 (213%)
Other comprehensive (loss)/income from continuing operations (21.8) 43.7 (150%)
Year ended December 31
(in millions of US $) 2020 2019 Change
Total comprehensive (loss)/income attributable to:
Common shareholders:
From continuing operations before listing expense and other transaction costs (3.0) 124.1 (102%)
Listing expense and other transaction costs - (43.4) 100%
(3.0) 80.7 (104%)
From discontinued operation - 0.5 (100%)
(3.0) 81.2 (104%)
Participating policyholders 0.6 (2.7) 122%
Non-controlling interests (34.5) 69.3 (150%)
(36.9) 147.8 (125%)
Year ended December 31
(in millions of US $) 2020 2019 Change
Total comprehensive income
Group net (loss)/income before listing expense and other transaction costs (15.1) 147.5 (110%)
Other comprehensive (loss)/income (21.8) 43.7 (150%)
Total comprehensive (loss)/ income for the year, before listing expense and other transaction costs (36.9) 191.2 (119%)
Listing expense and other transaction costs - (43.4) 100%
Total comprehensive (loss)/income for the year (36.9) 147.8 (125%)
Items recorded within other comprehensive income arise primarily from gains and losses on employee defined benefit pension plans, from fair value changes of certain asset classes and from the related movements in actuarial liabilities, and from the retranslation of foreign currency operations.
Other comprehensive losses for year ended December 31, 2020 amounted to US $21.8 million, a significant decrease from the income of US $43.7 million reported for the prior year.
During the period, the Group reported net gains on financial assets totalling US $97.3 million compared to US $168.7 million in the prior year, a reduction of US $71.4 million resulting from mark-to-market increases on financial assets

66in our investment portfolios. The lower gains reported resulted from the impact of the capital markets’ adverse response to the uncertainties created by the COVID-19 pandemic. These gains were offset by a net change in actuarial liabilities reserve of US $52.1 million (2019 - US $95.0 million). Other comprehensive income for the period also included a loss of US $38.2 million on the retranslation of foreign currency operations and largely related to the impact of the depreciation of the Jamaican dollar when compared to the United States dollar.
Overall total comprehensive loss for the year amounted to US $36.9 million. Total comprehensive loss allocated to shareholders from continuing operations was US $3.0 million. Total comprehensive income of US $147.8 million was reported in the prior year.
Statement of financial position
The table below summarises Sagicor’s consolidated statement of financial position as at December 31, 2020 and December 31, 2019, respectively.
Statement of Financial Position As of December 31,
(in millions of US $) 2020 2019 Change
Sagicor Group
Financial investments 7,238.6 6,685.6 8%
Other assets 2,027.7 2,043.3 (1%)
Total assets 9,266.3 8,728.9 6%
Policy liabilities 4,883.0 4,316.0 13%
Other operating liabilities 2,253.5 2,145.4 5%
Borrowings 471.6 517.7 (9%)
Total liabilities 7,608.1 6,979.1 9%
Shareholders’ equity 1,109.8 1,154.1 (4%)
Participating accounts 1.6 1.2 33%
Non-controlling interests 546.8 594.5 (8%)
Total equity 1,658.2 1,749.8 (5%)
Total liabilities and equity 9,266.3 8,728.9 6%
Fourth Quarter 2020 Profitability
Group net (loss)/ income for the three-month periods ended December 31, 2020 and December 31, 2019.
The table below summarises Sagicor’s net (loss)/income for the three-month periods ended December 31, 2020 and 2019.
Three months ended December 31,
(in millions of US $) 2020 2019 Change
Group net income
From continuing operations before listing expense and other transaction cost 14.4 67.9 (79%)
Listing expense and other transaction cost - (43.4) 100%
Total 14.4 24.5 (41%)
Net income is attributable to Common shareholders:
From continuing operations before listing expense and other transaction cost 29.0 54.9 (47%)
Listing expense and other transaction cost - (43.4) 100%
29.0 11.5 152%
Participating policyholders 1.0 (1.2) 183%
Non-controlling interest (15.6) 14.2 (210%)
Group net income 14.4 24.5 (41%)
Group net income amounted to US 14.4 million for the three-months ended December 31, 2020, compared to net income of US $24.5 million in the same period in the prior year.

67Net (loss)/income attributable to Common shareholders from continuing operations
Three months ended December 31
(in millions of US $, unless otherwise noted) 2020 2019 Change
Sagicor Life 35.2 29.4 20%
Sagicor Jamaica 11.0 18.2 (40%)
Sagicor Life USA 8.8 16.5 (47%)
Head office, Other and Adjustments (26.0) (9.2) (183%)
Net income before listing expense and other transaction costs 29.0 54.9 (47%)
Listing expense and other transaction costs - (43.4) 100%
Net income 29.0 11.5 152%
Earnings per common share (EPS):
Basic 19.8¢ 12.3¢ 61%
Basic – before listing expense and other transaction costs N/A 58.7¢ N/A
Diluted 19.6¢ 10.9¢ 80%
Diluted – before listing expense and other transaction costs N/A 51.9¢ N/A
Return on common shareholders’ equity (ROE) 10.8% 6.2% 4.6 pts
Return on common shareholders’ equity (ROE) – before listing expense and other transaction costs N/A 30.4% N/A
Net income from continuing operations attributable to common shareholders closed the period at US $29.0 million compared to US $54.9 million (before listing expense and other transaction costs) for the December 2019 quarter. Both Group net income and income attributable to shareholders from continuing operations benefited from the positive impact of our asset optimisation efforts in our Sagicor Life segment which gave rise to a release in net change in actuarial liabilities. Our administrative expenses include restructuring charges related to the retirement of a senior executive. Group net income was also impacted by our share of net loss and impairment related to our associated company investment in Playa Hotels & Resorts, due to the economic environment occasioned by the pandemic.
Group net income from continuing operations
The table below summarises Sagicor’s net income from continuing operations for the three-month periods ended December 31, 2020 and 2019.
Three months ended December 31,
(in millions of US $) 2020 2019 Change
Group net income from continuing operations
Revenue 674.5 471.7 43%
Benefits (454.9) (228.5) (99%)
Expenses (157.9) (147.9) (7%)
Other (33.4) (5.4) (519%)
Income taxes (13.9) (22.0) 37%
Group net income from continuing operations before listing expense and other transaction costs 14.4 67.9 (79%)
Listing expense and other transaction costs - (43.4) 100%
14.4 24.5 (41%)

68Revenue
The following table summarises the main items of Sagicor’s revenue for the three-month periods ended December 31, 2020 and December 31, 2019.
Three months ended December 31,
(in millions of US $) 2020 2019 Change
Revenue
Net insurance premiums:
Life and annuity 455.9 237.3 92%
Health 42.3 45.2 (6%)
Property and casualty 12.7 18.0 (29%)
510.9 300.5 70%
Net investment income 120.3 107.7 12%
Gain on derecognition of amortised cost investments 3.6 10.0 (64%)
Gain on derecognition of assets carried at FVOCI 6.8 19.5 (65%)
Credit impairment losses 1.6 (10.4) (115%)
Fees and other revenue 31.3 44.4 (30%)
Total 674.5 471.7 43%
Total Revenue by Operating Segment
Sagicor Life 190.6 162.2 18%
Sagicor Jamaica 177.1 194.2 (9%)
Sagicor Life USA 295.0 103.0 186%
Head office, Other and Adjustments 11.8 12.3 (4%)
674.5 471.7 43%
Revenue from continuing operations reached US $674.5 million for the three-month period ended December 31, 2020, an increase of US $202.8 million (43%) from the US $471.7 million reported in 2019.
Net insurance premium revenue represented 76% (December 2019 – 64%) of total revenue, and closed the period at US $510.9 million, US $210.4 million (70%) above the amount of US $300.5 million reported for the same period in 2019.
Net insurance premiums from Life and annuity insurance business totalled US $455.9 million for the three-month period ended December 31, 2020, compared to US $237.3 million reported for the same period in 2019. During the
quarter, the Group benefited from an increase in life and annuity premium in our Sagicor Life USA segment amounting to US $184.5 million which is consistent with our strategy to increase sales production in this segment. The Sagicor Life segment also experienced an increase in premium income as the segment closed a new single premium policy with premiums of US $63.9 million.
Net premium revenue from health insurance business totalled US $42.3 million for the three-month period ended December 31, 2020 which was US $2.9 million below the US $45.2 million reported for the same period in 2019. Net premium revenue from property and casualty insurance totalled US $12.7 million for the December 2020 quarter, a decrease from US $18.0 million recorded for the same period in 2019. The decline in premiums was mainly observed in our Sagicor Jamaica segment (US $4.1 million), a direct result of the loss of a significant plan.
Net investment income for the three-month period ended December 31, 2020 totalled US $120.3 million, up US $12.6 million (12%) from the US $107.7 million reported for the three-month period ended December 31, 2019. During the three-month period the Group benefited from realised and unrealised gains of US $35.5 million on financial assets categorised as FVTPL, compared to gains of US $23.5 million reported in the same period in 2019, as capital markets experienced some reversal of the mark-to-market losses reported earlier in the 2020 financial year.
The Group generated Fees and other revenues of US $31.3 million for the three-month period ended December 31, 2020, compared to US $44.4 million for the same period in 2019, a decrease of US $13.1 million. Hotel revenues reported by our Jamaica segment declined by US $6.3 million when compared to the same period in 2019, as the tourism industry continues to be adversely impacted by travel restrictions associated with the COVID-19 pandemic. In addition, in 2019, the segment benefited from higher fee income from the banking business.
Benefits
Benefits totalled US $454.9 million in for the fourth quarter of 2020, a 99% increase from US $228.5 million reported for the same period in 2019.
The following table summarises the benefits provided by Sagicor to holders of insurance contracts, investment contracts and deposit and security liability contracts for the three-month periods ended December 31, 2020 and 2019.

69Three months ended
December 31,
(in millions of US $) 2020 2019 Change
Benefits
Net insurance benefits:
Life and annuity 400.2 174.0 (130%)
Health 37.0 33.4 (11%)
Property and casualty 6.5 8.4 23%
443.7 215.8 (106%)
Interest cost 11.2 12.7 12%
Total 454.9 228.5 (99%)
Life and annuity benefits totalled US $400.2 million for the three-month period ended December 31, 2020 of which US $124.8 million related to current benefits and US $275.4 million related to future benefits. The amounts for the corresponding period in 2019 were a total of US $174.0 million, of which US $108.0 million related to current benefits and US $66.0 million related to future benefits. The change in provision for future benefits from 2019 to 2020 represented an increase of US $209.4 million and was associated mainly with the significant new annuity business acquired by our Sagicor Life and Sagicor Life USA segments during the quarter. During the quarter the group benefited from better asset liability matching in its Sagicor Life segment, which resulted in a reduction in actuarial liabilities (US $27.6 million). This however was offset by the strengthening of actuarial liabilities associated with forward-looking assumptions surrounding policy liabilities in our Sagicor Life USA segment totalling US $18.1 million.
The change in the future benefits for Q4 2020 comprise primarily of the following:
(in millions of US $) 2020
Increase/(decrease)
New business - Sagicor Life USA 236.1
Update of forward-looking assumptions - Sagicor USA 18.1
Impact of asset optimisation - Sagicor Life (27.6)
Significant premium annuity – Sagicor Life 47.8
Other 1.0
Total 275.4
Total health insurance benefits were US $37.0 million representing an overall claim to premium ratio of 87.6%. In 2019 the Group experienced health insurance benefits of US $33.4 million and an overall claim to premium ratio of 74.0%.
Property and casualty claims amounted to US $6.5 million in 2020, a US $1.9 million decrease from US $8.4 million incurred in 2019. Benefits associated with motor vehicles were down during the period due to lower accidents occurring during the period; a direct impact of movement restrictions associated with the COVID-19 pandemic.
Interest expense totalled US $11.2 million for the three-month period ended December 31, 2020 and was slightly below that reported for the same period in 2019.
Expenses and taxes
Total expenses and taxes were US $171.8 million for the three-month period ended December 31, 2020, compared to US $169.9 million (before listing expense and other transaction costs) for the same period in 2019, an increase of US $1.9 million (1%).
The table below summarises Sagicor’s expenses and taxes from continuing operations for the three-month periods ended December 31, 2020 and 2019.
Three months ended December 31,
(in millions of US $) 2020 2019 Change
Expenses and taxes
Administrative expenses 97.4 91.1 (7%)
Commissions and related compensation 37.2 32.4 (15%)
Finance costs, depreciation and amortisation 20.8 22.1 6%
Premium, asset and income taxes 16.4 24.3 33%
Total expenses and taxes before listing expense and other transaction costs 171.8 169.9 (1%)
Listing expense and other transaction costs - 43.4 100%
Total expenses and taxes 171.8 213.3 19%
Administrative expenses totalled US $97.4 million for the period under review compared to US $91.1 million for the same period in 2019, an increase of

70US $6.3 million and includes restructuring charges related to the retirement of a senior executive.
Commissions and related compensation totalled US $37.2 million for the three-month period ended December 31, 2020 and was above the US $32.4 million reported for the same period in 2019, due mainly to increased new business generated.
Finance costs, depreciation and amortisation totalled US $ 20.8 million for the December 2020 quarter, and was marginally below the US $22.1 million reported for the December 2019 quarter.
Sagicor is subject to a variety of direct taxes, with premium and income taxes comprising the main types of tax. Taxes are incurred in the jurisdiction in which the income is generated. Premium tax is customarily a percentage of gross premium revenue, while income tax is usually either a percentage of investment income or a percentage of profits. Sagicor is also subject to an asset tax in Jamaica and Barbados. In Jamaica, the asset tax is levied on insurance, securities dealers and deposit taking institutions at a percentage of adjusted assets held at the end of the year. In Barbados, the asset tax is levied on insurance, deposit taking institutions and credit unions at a percentage of adjusted assets held at the end of the period.
Premium, asset and income taxes were US $16.4 million for the three-month period ended December 31, 2020, compared to US $24.3 million in the corresponding period in 2019, a decrease of US $7.9 million. Of the total taxes, income taxes were US 13.9 million, compared to US $22.0 million in 2019, a decrease of US $8.1 million, due to higher net income generated in Q4, 2019.
Earnings from other sources was a loss of US $33.4 million for the fourth quarter of 2020, compared to a loss of US $5.4 million for the same period in 2019. During the December 2020 quarter, the Group incurred a loss of US $34.6 million on its associated company investment in Playa Hotels and Resorts due to the impact of the COVID-19 travel restrictions on the hotel sector. This loss largely represents our share of net income/(loss) of the associate and an impairment charge on the investment in the associate (Shareholder impact: - loss of US $4.0 million).
Comprehensive income
The table below summarises Sagicor’s total comprehensive income for the three-month periods ended December 31, 2020 and 2019.
Three months ended December 31,
(in millions of US $) 2020 2019 Change
Other comprehensive (loss)/income:
Items net of tax that may be reclassified subsequently to income:
Financial assets measured at fair value through other comprehensive income:
Gains on revaluation 80.8 17.7 356%
Gains transferred to income (7.1) (13.7) (48%)
Net change in actuarial liabilities (42.2) (10.7) (294%)
Cash flow hedges (0.8) (3.1) 74%
Other reserves 1.2 (0.1) 1,300%
Retranslation of foreign currency operations (4.3) 4.6 (193%)
27.6 (5.3) 621%
Items net of tax that will not be reclassified subsequently to income:
Gains arising on revaluation of ownership occupied property 1.0 1.5 (33%)
Losses on equity securities designated as FVOCI (0.1) - -
Gains on defined benefit plans 3.7 11.2 (67%)
4.6 12.7 (64%)
Other comprehensive income from continuing operations 32.2 7.4 335%
Three months ended December 31,
(in millions of US $) 2020 2019 Change
Total comprehensive income
Group net income 14.4 67.9 (79%)
Other comprehensive income 32.2 7.4 335%
Total comprehensive income for the year 46.6 75.3 (38%)
Listing expense and other transaction costs - (43.4) 100%
46.6 31.9 46%

71Three months ended
December 31,
(in millions of US $) 2020 2019 Change
Total comprehensive (loss)/income attributable to:
Common shareholders:
From continuing operations before listing expense and other transaction costs 52.9 61.6 (14%)
Listing expense and other transaction costs - (43.4) 100%
From continuing operations 52.9 18.2 191%
Participating policyholders 0.6 (2.1) (129%)
Non-controlling interests (6.9) 15.8 (144%)
46.6 31.9 46%
Items recorded within other comprehensive income arise primarily from gains and losses on employee defined benefit pension plans, from fair value changes of certain asset classes and from the related movements in actuarial liabilities, and from the retranslation of foreign currency operations.
Other comprehensive income for three-month period ended December 31, 2020 totalled US $32.2 million, an increase from the of US $7.4 million reported for the December 2019 quarter.
During the quarter, the Group reported net gains on financial assets totalling US $80.8 million resulting from mark-to-market gains on financial assets in our investment portfolios. These gains reflect a partial reversal of losses reported earlier in the year resulting from the impact of the capital markets’ response to the COVID-19 pandemic. These gains were offset by a net change in actuarial liabilities reserve of US $42.2 million. Other comprehensive income for the period also included a loss of US $4.3 million on the retranslation of foreign currency operations and largely related to the impact of the depreciation of the Jamaican dollar when compared to the United States dollar.
Overall total comprehensive income for the three-month period ended December 31, 2020 amounted to US $46.6 million. Total comprehensive income allocated to shareholders from continuing operations was US $52.9 million. Total comprehensive income of US $31.9 million was reported for the same period in the prior year.

72Quarterly Financial Disclosures
The following table provides a summary of Sagicor’s results from continuing operations for the eight most recently completed quarters. A more complete discussion of our historical quarterly results can be found in our interim and annual MD&A for the relevant periods.
(in millions of US $, unless otherwise noted) Q4 2020 Q3 2020 Q2 2020 Q1 2020 Q4 2019 Q3 2019 Q2 2019 Q1 2019
Net premium revenue 510.9 264.9 310.0 317.7 300.5 263.3 312.7 365.1
Net investment and other income 163.6 137.3 148.5 25.5 171.2 148.2 155.7 150.7
Total revenue 674.5 402.2 458.5 343.2 471.7 411.5 468.4 515.8
Benefits and expenses (612.8) (373.7) (440.6) (355.8) (376.4) (379.3) (429.3) (478.7)
Other (33.4) (9.2) (19.7) (5.7) (5.4) - 0.6 7.7
Income(loss)/ before tax 28.3 19.3 (1.8) (18.3) 89.9 32.2 39.7 44.8
Income tax (13.9) (12.7) (9.3) (6.8) (22.0) (11.1) (14.2) (12.4)
Net (loss)/income before listing expense and other transaction costs 14.4 6.6 (11.1) (25.1) 67.9 21.1 25.5 32.4
Listing expense and other transaction costs transaction costs - - - - (43.4) - - -
Net income/(loss) 14.4 6.6 (11.1) (25.1) 24.5 21.1 25.5 32.4
(Loss)/income attributable to shareholders before listing expense and other transaction costs 29.0 (3.0) (0.3) (29.3) 54.9 6.3 11.1 15.1
(Loss)/income attributable to shareholders 29.0 (3.0) (0.3) (29.3) 11.5 6.3 11.1 15.1

73Quarterly Financial Disclosures, continued
(in millions of US $, unless otherwise noted) Q4 2020 Q3 2020 Q2 2020 Q1 2020 Q4 2019 Q3 2019 Q2 2019 Q1 2019
Basic EPS before listing expense and other transaction costs incurred in 2019 N/A N/A N/A N/A 58.7 ¢ N/A N/A N/A
Basic EPS 19.8¢ (2.0) ¢ (0.2) ¢ (19.7) ¢ 12.3 ¢ 8.9 ¢ 15.7 ¢ 21.3 ¢
Diluted EPS before listing expense and other transaction costs incurred in 2019 N/A N/A N/A N/A 51.9 ¢ N/A N/A N/A
Diluted EPS 19.6 ¢ (2.0) ¢ (0.2) ¢ (19.7) ¢ 10.9 ¢ 8.6 ¢ 15.3 ¢ 21.0 ¢
Annualised return on shareholders’ equity before listing expense and other transaction costs incurred in 2019 N/A N/A N/A N/A 30.4% N/A N/A N/A
Annualised return on shareholders’ equity 10.8% (1.1%) (0.1%) (10.5%) 6.2% 3.8% 6.9% 9.9%
Dividends paid per share 5.6 ¢ 5.6 ¢ 5.6 ¢ 5.6 ¢ 2.5 ¢ - 2.5 ¢ -
Total assets (a) 9,266.3 8,894.3 8,734.2 8,457.1 8,728.9 8,056.4 7,861.7 7,639.8
Total equity attributable to shareholders (a) 1,109.8 1,062.3 1,072.5 1,049.5 1,154.1 660.4 658.6 640.4
(Loss)/Income before listing expense and other transaction costs (incurred in Q4, 2019) attributable to shareholders by operating segment:
Sagicor Life 35.2 8.4 2.2 1.9 29.4 10.2 9.8 11.2
Sagicor Jamaica 11.0 21.3 9.1 9.1 18.2 18.4 14.3 10.4
Sagicor Life USA 8.8 (18.7) (2.9) (14.3) 16.5 6.0 6.0 6.9
Head office, other & inter-segment eliminations (26.0) (14.0) (8.7) (26.0) (9.2) (28.3) (19.0) (13.4)
Total 29.0 (3.0) (0.3) (29.3) 54.9 6.3 11.1 15.1
(a) From continuing operations.

74Quarterly Financial Disclosures (continued)
Under the Alignvest transaction, Sagicor Financial Corporation Limited common shares not purchased for cash, were exchanged for common shares of Sagicor Financial Company Ltd. on an exchange ratio of one Sagicor Financial Company Ltd. common share for 4.328 of Sagicor Financial Corporation Limited common shares (“Exchange Ratio”). This exchange ratio has been used to convert the 2018 and 2019 outstanding shares to the Sagicor Financial Company Ltd. equivalent. The earnings per share ratio for 2019 and 2018 has been adjusted to reflect the Exchange Ratio.
Third Quarter 2020
The Group’s financial results for the quarter ended September 30, 2020 continued to be affected by the COVID-19 pandemic.
Against this backdrop the Sagicor Group recorded a net loss from continuing operations attributable to common shareholders of US $3.0 million compared to net income US $6.3 million, for the same period in the prior year. The net loss was primarily related to significant strengthening of reserves in our U.S. operation associated with forward-looking assumptions.
Second Quarter 2020
The Group’s financial results for the quarter ended June 30, 2020 were materially affected by the COVID-19 pandemic. On March 11, 2020 the World Health Organisation declared the emergence of COVID-19 coronavirus, a global pandemic. As a response to this public health emergency, governments around the world made significant interventions in response to this threat. Most Caribbean countries shut down air and sea traffic. Similar procedures were also implemented in the United States, Canada and elsewhere. During the three-month period ended June 2020 attempts were made to modify and relax some of the restrictions implemented in the first quarter of the year, however these have yielded mixed results and therefore many of the restrictions continued with a continued slowdown in economic activity.
Against this backdrop the Sagicor Group recorded a net loss from continuing operations attributable to common shareholders of US $0.3 million compared to net income US $11.1 million, for the same period in the prior year. The net loss was primarily related to higher Expected Credit Losses (ECLs) losses due to the pandemic as well as an internal reinsurance transaction that resulted in a strengthening of reserves in our U.S. operation. The results also include impairment losses on an associated company.
First Quarter 2020
The Group’s financial results for the quarter ended March 31, 2020 were materially affected by the COVID-19 pandemic. On March 11, 2020 the World Health Organisation declared the emergence of COVID-19 coronavirus, a global pandemic. As a response to this public health emergency, governments around the world made significant interventions in response to this threat. Most Caribbean countries shut down air and sea traffic. Similar procedures were also implemented in the United States, Canada and elsewhere.
Against this backdrop the Sagicor Group recorded a net loss from continuing operations attributable to common shareholders of US $29.3 million compared to net income US $15.1 million, for the same period in the prior year. This result was primarily driven by mark-to-market changes in asset prices (net of corresponding reserve changes) and increased provisions for Expected Credit Losses (ECLs) in anticipation of a potential prolonged economic downturn, in the markets in which the Group operates.
Fourth Quarter 2019
On December 5, 2019 Sagicor and Alignvest announced they had completed the business combination involving the transfer of all issued and outstanding shares in Sagicor to Alignvest. This transaction raised over US $450 million in new capital for the Group. As a result of the completion of the transaction, all issued and outstanding shares in Sagicor were transferred to Alignvest, with former shareholders of Sagicor receiving cash or shares in Alignvest, which was renamed Sagicor Financial Company Ltd. and trades on the Toronto Stock Exchange under the symbol SFC. The Group incurred listing expense and other transaction costs of US $43.4 million relating to this exercise.
Net income from continuing operations attributable to shareholders for the fourth quarter of 2019 totalled US $54.9 million, excluding listing expense and other transaction costs, compared to US $8.0 million for the same period in 2018, an increase of US $46.9 million. During the last quarter of 2019, the Group benefited from a significant increase in mark to market changes on indexed options in our USA segment coupled with gains arising from the strong performance of the Jamaica stock market.
Third Quarter 2019
Results for third quarter of 2019 reflected moderate aggregate growth in our core operating segments, offset somewhat with the effect of Hurricane Dorian.

75Net income from continuing operations attributable to shareholders was US $6.3 million for the three-month period ended September 30, 2019, (three-month period end September 30, 2018 – US $7.0 million), a decrease of US $0.7 million. During Q3 2019, Sagicor took a provision of US $2.5 million, representing our maximum potential impact from Hurricane Dorian. During Q3 2018, the Group increased its provisions on the Government of Barbados (GoB) debt. The net impact on the net income was US $16.4 million. Net income in 2018, also benefitted from certain one-time positive earnings releases that did not recur in 2019.
Second Quarter 2019
Net income from continuing operations attributable to shareholders was US $11.1 million for the three-month period ended June 30, 2019, (three-month period end June 30, 2018 – US $2.0 million), an increase of US $9.1 million. The Group benefited from net premium growth in our USA segment. Benefits and expenses also grew over the prior year’s levels driven by business growth. In the June quarter of 2018 the Group also experienced the net impact of increased provisions for expected credit impairment losses on the Government of Barbados debt (US $19.8 million).
First Quarter 2019
Net income from continuing operations attributable to shareholders was $15.1 million for the three months ended March 31, 2019, (first quarter March 2018 – US $19.5 million). While the Group benefited from net premium growth through our USA segment, benefits and expenses also grew over the prior year-to-date levels and was consistent with premium growth due to the provisions for future benefits on new business. During the first quarter of 2019, the Group also benefited from increased investment income due to marked to market changes on equities and indexed options in our Jamaica and USA segments. During the first quarter of 2018 the results included a one-time gain of US $5.3 million on the acquisition of the British American insurance portfolio.
Fourth Quarter 2018
Net income from continuing operations attributable to shareholders was US $8.0 million for the three months ended December 31, 2018, compared to US $15.7 million for the three-month period ended December 31, 2017. The Group was impacted by lower realised gains on the sale of securities and lower interest rates in our Jamaica Segment in 2018. In addition, in 2017, the Group recognised a tax benefit in our Sagicor USA segment, arising from the 2017 US Federal tax law changes.
Key Factors Affecting Results
A variety of factors affect Sagicor’s results, including:(i) sales of core products and services;(ii) life insurance and annuity policy lapse experience;(iii) insurance claims experience;(iv) investment yields;(v) asset default;(vi) country inflation and taxes;(vii) Sensitivity arising from the valuation of actuarial liabilities;(viii) Sagicor’s expansion into new geographic markets (in the United States)
and product markets (in Jamaica) through portfolio and / or company acquisitions; and
(ix) the continuing availability of appropriately priced reinsurance treaties for life, health and property and casualty insurance.
Sales of core products and services
Growth in sales enables Sagicor to allocate its fixed operating expenses over larger revenues and subsequently increases its profitability. The impact is very significant for the Sagicor Life and Sagicor Jamaica operating segments which sell significant amounts of periodic premium life insurance and annuity policies. The pricing of such products is either fixed at the issue of each policy or may limit the extent of cost recovery over the duration of the policy which can extend over decades. Growth in sales enables Sagicor to contain the growth in unit policy operating expenses.
Lapse experience
With respect to periodic premium life insurance and annuity policies, lapse experience is a factor of profitability. Many of these polices have up-front commission, policy issue and medical underwriting costs which are only recovered in full if the policy is premium paying for the initial years of its duration. If the policy lapses during the initial years, Sagicor will not fully recover its up-front costs and incur a loss on that policy.
For the same reasons that the quantum of sales of insurance policies is an important factor in maintaining insurance policy unit costs of administration, the rates of lapse or termination of inforce policies impacts the policy unit costs incurred. The lower the lapse or termination rate, the more policies are inforce, enabling Sagicor to contain growth in unit policy administrative costs.

76Insurance claims experience
Across all lines of insurance, claims experience is a factor in profitability. In establishing rates of premium, Sagicor provides for appropriate levels of claims experience, be it rates of mortality for life insurance, rates of longevity for annuities, rates of morbidity for disability and health insurance, or rates of contingent losses for property and casualty insurance. Claims rates incurred in excess of pricing have adverse consequences for profitability, and conversely, claims rates incurred at levels below pricing impact profitability positively.
Investment yields
Across applicable lines of insurance and across financial contracts issued by Sagicor, investment yield is important to the profitability of the Group. Higher investment yields enable Sagicor to achieve higher interest margins (defined as the difference between interest earned and payable) on applicable insurance contracts and financial contracts. With lower investment yields, the interest margins are generally lower and may be eliminated if Sagicor is not able to earn a guaranteed rate of interest which is payable under the insurance or financial contract.
For long-term life insurance and annuity contracts, the Appointed Actuaries within the Group determine each segment’s actuarial liabilities at December 31 after factoring in rates of investment return on re-invested assets. These rates, including the ultimate rates of return, affect the quantum of actuarial liability determined, with higher re-investment rates resulting in a lower actuarial liability, and with lower re-investment rates resulting in a higher actuarial liability.
Asset default
The recognition of an un-anticipated default from an invested asset, may have immediate negative consequences for profitability. Sagicor maintains certain invested assets for which the full return (of capital and of interest) is borne by insurance and /or financial contract-holders. In such instances, Sagicor is generally not exposed to asset default risk. However, for other invested assets, for which Sagicor is exposed to default risk, the default risk may be entirely borne by Sagicor’s shareholders, or the risk is shared by Sagicor’s shareholders and insurance and /or financial contract-holders. In such instances, the impact on profitability will be negative.
For long-term life insurance and annuity contracts, the Appointed Actuaries within the Group determine each segment’s actuarial liabilities at December 31 after factoring in the expected rates of asset default. Should asset default rates over time be lower than expected, profitability is impacted positively.
Conversely, if asset default rates over time are higher than expected, profitability is impacted negatively.
Country inflation and taxes
As with other key factors affecting profitability, changes in the level of country inflation and taxes impact the operating costs of the Sagicor Group, immediately and in the longer term.
Actuaries within the Group determine each segment’s actuarial liabilities as of December 31 after factoring in expected levels of operating expenses. Higher inflation and taxation levels result is adverse consequences for profitability and lower inflation and taxation levels result in positive consequences for profitability.
Sensitivity arising from the valuation of actuarial liabilities
The estimation of actuarial liabilities is sensitive to the assumptions made. Changes in those assumptions could have a significant effect on the valuation results which are discussed below.
The valuation of actuarial liabilities of life insurance and annuity contracts is sensitive to:
• the economic scenario used,• the investments allocated to back the liabilities,• the underlying assumptions used, and• the margins for adverse deviations
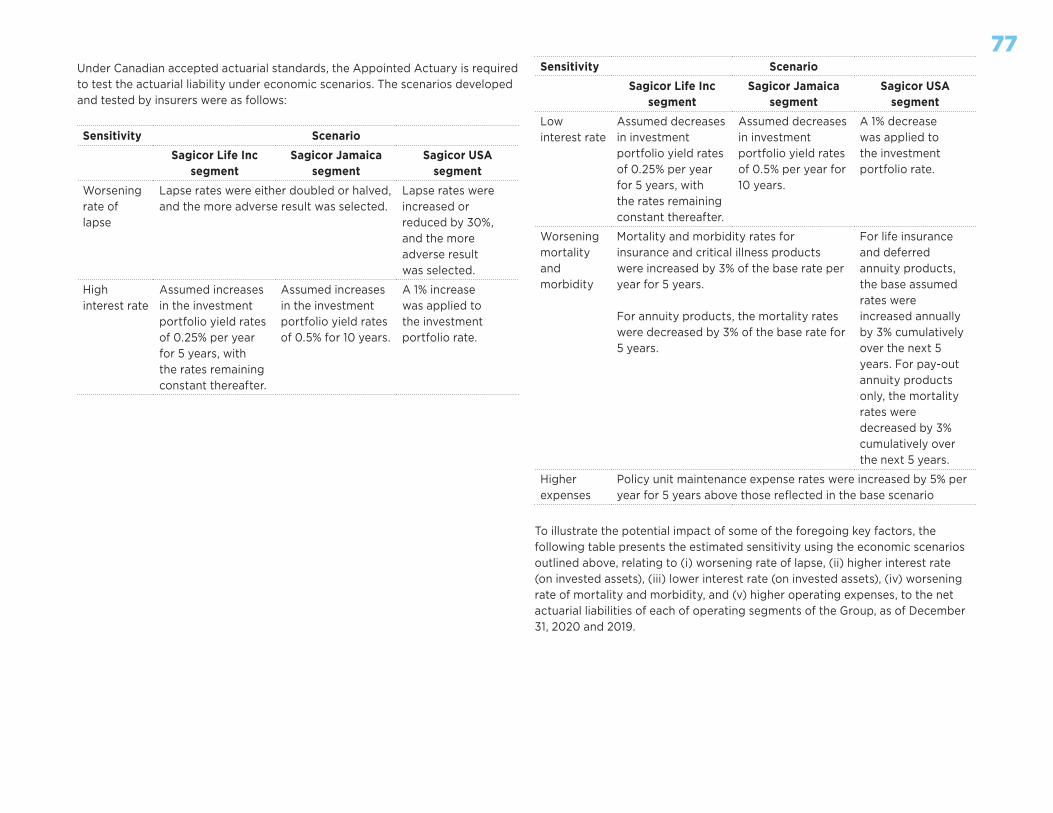
77Under Canadian accepted actuarial standards, the Appointed Actuary is required to test the actuarial liability under economic scenarios. The scenarios developed and tested by insurers were as follows:
Sensitivity Scenario
Sagicor Life Inc segment
Sagicor Jamaica segment
Sagicor USA segment
Worsening rate of lapse
Lapse rates were either doubled or halved, and the more adverse result was selected.
Lapse rates were increased or reduced by 30%, and the more adverse result was selected.
High interest rate
Assumed increases in the investment portfolio yield rates of 0.25% per year for 5 years, with the rates remaining constant thereafter.
Assumed increases in the investment portfolio yield rates of 0.5% for 10 years.
A 1% increase was applied to the investment portfolio rate.
Sensitivity Scenario
Sagicor Life Inc segment
Sagicor Jamaica segment
Sagicor USA segment
Low interest rate
Assumed decreases in investment portfolio yield rates of 0.25% per year for 5 years, with the rates remaining constant thereafter.
Assumed decreases in investment portfolio yield rates of 0.5% per year for 10 years.
A 1% decrease was applied to the investment portfolio rate.
Worseningmortality and morbidity
Mortality and morbidity rates for insurance and critical illness products were increased by 3% of the base rate per year for 5 years.
For annuity products, the mortality rates were decreased by 3% of the base rate for 5 years.
For life insurance and deferred annuity products, the base assumed rates were increased annually by 3% cumulatively over the next 5 years. For pay-out annuity products only, the mortality rates were decreased by 3% cumulatively over the next 5 years.
Higher expenses
Policy unit maintenance expense rates were increased by 5% per year for 5 years above those reflected in the base scenario
To illustrate the potential impact of some of the foregoing key factors, the following table presents the estimated sensitivity using the economic scenarios outlined above, relating to (i) worsening rate of lapse, (ii) higher interest rate (on invested assets), (iii) lower interest rate (on invested assets), (iv) worsening rate of mortality and morbidity, and (v) higher operating expenses, to the net actuarial liabilities of each of operating segments of the Group, as of December 31, 2020 and 2019.

78(in US $millions) 2020 2019
Sagicor Life Segment
Base net actuarial liability 1,136.5 1,038.7
ScenarioIncrease (decrease) in
actuarial liability
Worsening rate of lapse 202.9 177.6
Higher interest rate (94.9) (97.6)
Lower interest rate 199.4 163.3
Worsening mortality / morbidity 69.5 42.6
Higher expenses 39.2 20.4
Sagicor Jamaica Segment
Base net actuarial liability 345.4 360.0
ScenarioIncrease (decrease) in
actuarial liability
Worsening rate of lapse 88.0 78.5
High interest rate (112.5) (116.6)
Low interest rate 83.9 97.1
Worsening mortality / morbidity 48.9 56.9
Higher expenses 17.1 20.9
Sagicor Life USA Segment
Base net actuarial liability 1,734.8 1,212.2
ScenarioIncrease (decrease) in a
ctuarial liability
Worsening rate of lapse 25.5 18.4
High interest rate (99.5) (72.2)
Low interest rate 123.2 83.1
Worsening mortality / morbidity 16.3 17.0
Higher expenses 2.6 2.9
Expansion into new markets and company acquisitions
While Sagicor has endured for 180 years, its product offerings and geographic markets have evolved. Markets often have different preferences for certain products and any successful venture into new markets need to adapt to market
tastes. Sagicor only ventures into new markets or offers new products after extensive research and appraisal.
Company acquisitions has been a strategy employed by the Sagicor Group over the last twenty years. As a result of these acquisitions, Sagicor’s assets include goodwill and other intangibles acquired on company acquisitions. The goodwill carried by operating segments as of December 31, 2020 and 2019, respectively, is summarised in the following table
(in US $millions) 2020 2019
Goodwill
Sagicor Life segment 26.5 26.6
Sagicor Jamaica segment 29.2 31.0
Sagicor General Insurance 2.7 5.7
Total goodwill 58.4 63.3
Goodwill is subject to an annual impairment test, whereby the carrying value of the business unit including the associated goodwill is compared to the fair value of the business. As long as the fair value of the business exceeds the carrying value of the business and its associated goodwill, the goodwill is un-impaired. If it is not, the goodwill is impaired to the extent of the excess of the carrying value plus goodwill over its fair value, and the resulting impairment charge is recorded in the income statement.
In this test, fair value is defined as the higher of ‘value in use’ and ’fair value less costs to sell’. The computation of fair value includes the use of management prepared income and cash flow forecasts, and independently determined market discount and residual growth rates. For some life insurance elements of the carrying value, the Group uses an actuarially determined ‘embedded value’ to determine fair value, as this is an appropriate methodology to determine fair value of long-term insurance business.
As income and cash flow forecasts and market discount and residual factors vary from year to year, there is the possibility of a significant impairment charge. During the year, goodwill of US $3.0 million (2019 – US $nil) has been impaired relating to the Sagicor General Insurance Inc.
Reinsurance treaties
In order to offer useful insurance coverages to potential customers, the Group holds reinsurance coverages that allow potential policy benefits to exceed amounts which are prudent for Sagicor to undertake the claims risk. Reinsured

79amounts may be on a per policy basis, (i.e. in excess of a pre-determined insured amount) or may be based on the aggregation of the insured’s coverages (i.e. the insured has several policies and the amount reinsured is the aggregate exceeding a pre-determined amount).
The tables below illustrate the gross and net (of reinsurance) total life insurance coverages and annuity liabilities for individual and group polices as of December 31, 2020 and 2019, respectively.
(in US $millions) 2020 2019
Total life insurance coverage
Individual contracts - gross 35,710.5 33,486.9
Individual contracts - net 28,982.4 27,482.8
Group contracts – gross 12,542.8 12,350.6
Group contracts - net 12,037.8 11,853.5
(in US $millions) 2020 2019
Total actuarial liability for annuity contracts
Individual contracts - gross 2,561.9 2,016.2
Individual contracts - net 1,909.0 1,335.0
Group contracts – gross 436.6 428.1
Group contracts - net 423.7 414.2

803. ANALYSIS BY BUSINESS SEGMENT
Sagicor operates its business primarily through three reporting operating segments. These segments are: Sagicor Life, Sagicor Jamaica and Sagicor Life USA. A summary analysis of revenue and net income by operating segment are presented on a three-month quarterly basis and on a yearly basis for 2020 and 2019, as follows:
Fourth Quarter (three-month period) – December 2020
(in millions of US $) Sagicor LifeSagicor
JamaicaSagicor Life
USAHead office
& other Adjustments Total
Revenue
Net premium revenue 156.1 90.6 255.4 8.8 - 510.9
Gain on derecognition of amortised cost investments 0.6 3.0 - - - 3.6
Gain on derecognition of assets carried at FVOCI 1.7 3.6 1.5 - - 6.8
Interest income earned from financial assets measured at amortised costs and FVOCI 19.9 39.4 19.9 1.0 - 80.2
Other investment income 2.5 14.0 19.8 3.7 0.1 40.1
Credit impairment losses 0.9 0.6 0.1 - - 1.6
Fees and other revenues 3.1 25.9 (1.7) 4.4 (0.4) 31.3
Inter-segment revenues 5.8 - - 2.0 (7.8) -
Segment revenue 190.6 177.1 295.0 19.9 (8.1) 674.5
Benefits and expenses (151.5) (139.3) (282.7) (38.5) (0.8) (612.8)
Inter-segment expenses (0.6) (0.8) (1.5) (5.6) 8.5 -
Gain/(loss) arising on business combinations, acquisitions and divestitures - 1.5 - (1.5) - -
Loss on impairment of associates and joint ventures - (19.0) - - - (19.0)
Share of operating income of associates and joint ventures 0.3 (15.5) - 0.8 - (14.4)
Segment income before tax 38.8 4.0 10.8 (24.9) (0.4) 28.3
Income taxes (2.6) (8.7) (2.0) (0.1) (0.5) (13.9)
Segment net income/(loss) from continuing operations 36.2 (4.7) 8.8 (25.0) (0.9) 14.4
Net income attributable to shareholders 35.2 11.0 8.8 (25.1) (0.9) 29.0

81Fourth Quarter (three-month period) – December 2019
(in millions of US $) Sagicor Life Sagicor JamaicaSagicor Life
USAHead office &
other Adjustments Total
Revenue
Net premium revenue 126.0 93.7 70.9 9.9 - 300.5
Gain/(loss) on derecognition of amortised cost investments 0.5 10.3 - (0.8) - 10.0
Gain on derecognition of assets carried at FVOCI 2.9 15.1 1.5 - - 19.5
Interest income earned from financial assets measured at amortised costs and FVOCI 20.1 40.9 18.2 0.8 - 80.0
Other investment income 3.1 8.6 13.8 2.6 (0.3) 27.8
Credit impairment losses (0.4) (9.5) (0.5) - - (10.4)
Fees and other revenues 4.9 35.1 (0.9) 5.8 (0.6) 44.3
Inter-segment revenues 5.1 - - 18.5 (23.6) -
Segment revenue 162.2 194.2 103.0 36.8 (24.5) 471.7
Benefits and expenses (131.2) (139.8) (81.7) (22.3) (1.4) (376.4)
Inter-segment expenses (1.4) (0.9) (0.4) (5.0) 7.7 -
Gain/(loss) arising on business combinations, acquisitions and divestitures 0.1 - - (0.1) - -
Share of operating income of associates and joint ventures 0.3 (5.7) - - - (5.4)
Segment income before tax 30.0 47.8 20.9 9.4 (18.2) 89.9
Income taxes (1.8) (15.5) (4.4) (0.5) 0.2 (22.0)
Segment net income/(loss) from continuing before listing expense and other transaction costs 28.2 32.3 16.5 8.9 (18.0) 67.9
Listing expense and other transaction costs - - - (43.4) - (43.4)
Segment net income/(loss) from continuing operations 28.2 32.3 16.5 (34.5) (18.0) 24.5
Net income attributable to shareholders 29.4 18.2 16.5 (8.4) (44.2) 11.5
Net income attributable to shareholders before listing expense and other transaction costs 29.4 18.2 16.5 35.0 (44.2) 54.9

82Change December 2020 Quarter vs December 2019 Quarter (%)
Sagicor Life Sagicor JamaicaSagicor Life
USAHead office &
other Adjustments Total
Revenue
Net premium revenue 24% (3%) 260% (11%) - 70%
Gain/(loss) on derecognition of amortised cost investments 20% (71%) - 100% - (64%)
Gain on derecognition of assets carried at FVOCI (41%) (76%) - - - (65%)
Interest income earned from financial assets measured at amortised costs and FVOCI (1%) (4%) 9% 25% - -
Other investment income (19%) 63% 43% 42% 133% 44%
Credit impairment losses 325% 106% 120% - - 115%
Fees and other revenues (37%) (26%) (89%) (24%) 33% (29%)
Inter-segment revenues 14% - - (89%) 67% -
Segment revenue 18% (9%) 186% (46%) 67% 43%
Benefits and expenses (15%) - (246%) (73%) 43% (63%)
Inter-segment expenses 57% 11% (275%) (12%) 10% -
(Loss)/gain arising on business combinations, acquisitions and divestitures (100%) - - 1,400% - -
Share of operating income of associates and joint ventures - (172%) - - - (167%)
Segment income before tax 29% (92%) (48%) (365%) 98% (69%)
Income taxes (44%) 44% 55% 80% (350%) 37%
Segment net income/(loss) from continuing operations before listing expense and other transaction costs 28% (115%) (47%) (381%) 95% (79%)
Listing expense and other transaction costs - - - 100% - 100%
Segment net income/(loss) from continuing operations 28% (115%) (47%) 28% 95% (41%)
Net income attributable to shareholders 20% (40%) (47%) (199%) 98% 152%
Net income attributable to shareholders before listing expense and other transaction costs 20% (40%) (47%) (172%) 98% (47%)

83Year ended December 31, 2020
(in millions of US $) Sagicor Life Sagicor JamaicaSagicor Life
USAHead office &
other Adjustments Total
Revenue
Net premium revenue 414.2 355.4 597.1 36.7 - 1,403.4
Gain on derecognition of amortised cost investments 0.6 8.3 - - - 8.9
Gain/(loss) on derecognition of assets carried at FVOCI 2.9 21.7 (4.2) (0.2) - 20.2
Interest income earned from financial assets measured at amortised costs and FVOCI 74.8 160.5 74.8 4.7 - 314.8
Other investment income 4.1 (14.3) 18.9 7.4 - 16.1
Credit impairment losses (7.4) (12.1) (4.0) (0.5) - (24.0)
Fees and other revenues 11.4 112.4 (3.6) 19.3 (0.5) 139.0
Inter-segment revenues 22.7 - - 7.8 (30.5) -
Segment revenue 523.3 631.9 679.0 75.2 (31.0) 1,878.4
Benefits and expenses (465.0) (480.7) (709.3) (126.2) (1.6) (1,782.8)
Inter-segment expenses (4.1) (2.1) (4.3) (21.7) 32.2 -
Loss arising on business combinations, acquisitions and divestitures - (1.3) - - - (1.3)
Loss on impairment of associates and joint ventures - (31.8) - - - (31.8)
Share of operating income of associates and joint ventures 3.3 (38.2) - - - (34.9)
Segment income before tax 57.5 77.8 (34.6) (72.7) (0.4) 27.6
Income taxes (8.4) (40.0) 7.5 (1.4) (0.4) (42.7)
Segment net income/(loss) from continuing operations 49.1 37.8 (27.1) (74.1) (0.8) (15.1)
Net income attributable to shareholders 47.7 50.5 (27.1) (73.9) (0.8) (3.6)

84Year ended December 31, 2019
(in millions of US $) Sagicor Life Sagicor JamaicaSagicor Life
USAHead office &
other Adjustments Total
Revenue
Net premium revenue 409.2 350.1 444.7 37.5 - 1,241.5
Gain/(loss) on derecognition of amortised cost investments 0.5 13.3 - (0.9) - 12.9
Gain on derecognition of assets carried at FVOCI 6.2 21.3 2.5 - - 30.0
Interest income earned from financial assets measured at amortised costs and FVOCI 74.2 160.3 70.2 3.3 - 308.0
Other investment income 10.8 52.1 46.9 2.6 (0.6) 111.8
Credit impairment losses 1.4 (6.1) (0.4) 0.2 - (4.9)
Fees and other revenues 11.0 144.3 (2.4) 17.2 (2.1) 168.0
Inter-segment revenues 20.0 - - 41.7 (61.7) -
Segment revenue 533.3 735.3 561.5 101.6 (64.4) 1,867.3
Benefits and expenses (465.1) (568.2) (515.4) (107.0) (7.9) (1,663.6)
Inter-segment expenses (5.0) (2.5) (1.3) (19.3) 28.1 -
Loss arising on business combinations, acquisitions and divestitures (0.4) - - - - (0.4)
Share of operating income of associates and joint ventures 4.0 (0.6) - - - 3.4
Segment income before tax 66.8 164.0 44.8 (24.7) (44.2) 206.7
Income taxes (7.9) (40.4) (9.4) (2.2) 0.2 (59.7)
Segment net income/(loss) from continuing operations before listing expense and other transaction costs 58.9 123.6 35.4 (26.9) (44.0) 147.0
Listing expense and other transaction costs - - - (43.4) - (43.4)
Segment net income/(loss) from continuing operations 58.9 123.6 35.4 (70.3) (44.0) 103.6
Net income attributable to shareholders 60.9 61.4 35.4 (69.6) (44.1) 44.0
Net income attributable to shareholders before listing expense and other transaction costs 60.9 61.4 35.4 (26.2) (44.1) 87.4

85Change December 31, 2020 vs December 31, 2019 (%)
Sagicor Life Sagicor JamaicaSagicor Life
USAHead office &
other Adjustments Total
Revenue
Net premium revenue 1% 2% 34% (2%) - 13%
Gain/(loss) on derecognition of amortised cost investments 20% (38%) - 100% - (31%)
Gain/(loss) on derecognition of assets carried at FVOCI (53%) 2% (268%) - - (33%)
Interest income earned from financial assets measured at amortised costs and FVOCI 1% - 7% 42% - 2%
Other investment income (62%) (127%) (60%) 185% 100% (86%)
Credit impairment losses (629%) (98%) (900%) (350%) - (390%)
Fees and other revenues 4% (22%) (50%) 12% (76%) (17%)
Inter-segment revenues 14% - - (81%) 51% -
Segment revenue (2%) (14%) 21% (26%) 52% 1%
Benefits and expenses - 15% (38%) (18%) 80% (7%)
Inter-segment expenses 18% 16% (231%) (12%) 15% -
Loss arising on business combinations, acquisitions and divestitures (100%) - - - - (225%)
Share of operating income of associates and joint ventures (18%) (6,267%) - - - (1,126%)
Segment income before tax (14%) (53%) (177%) (194%) 99% (87%)
Income taxes (6%) 1% 180% 36% (300%) 28%
Segment net income/(loss) from continuing operations before listing expense and other transaction costs (17%) (69%) (177%) (175%) 98% (110%)
Listing expense and other transaction costs - - - 100% - 100%
Segment net income/(loss) from continuing operations (17%) (69%) (177%) (5%) 98% (115%)
Net income attributable to shareholders (22%) (18%) (177%) (6%) 98% (108%)
Net income attributable to shareholders before listing expense and other transaction costs (22%) (18%) (177%) (182%) 98% (104%)
The performance of these reporting segments for the three-month and twelve-month periods ended December 31, 2020 compared to the same period in 2019 is discussed in the following sections.

86Sagicor Life segment
The Sagicor Life segment conducts life, health insurance, property & casualty insurance, pensions, annuities, and asset management services in Barbados, Trinidad and Tobago, Eastern Caribbean, Dutch Caribbean, the Bahamas and Central America. Sagicor Life has a diversified customer base providing financial solutions to both individuals and corporations, mainly through a captive distribution network and local brokers. Sagicor Life’s strong corporate image, people, financial strength, and diverse insurance solutions has contributed to Sagicor Life’s leading position in the insurance market in the Caribbean. Sagicor Life has an “A-stable” rating from A.M. Best.
Sagicor Life Highlights
2020 2019 2018
Return on Total Equity 9.1% 12.2% 9.5%
Return on Shareholder’s Equity 8.8% 12.7% 8.1%
Return on Investments 5.4% 6.1% 5.9%
The following table summarises the results of the Sagicor Life segment for the three-month and year ended December 31, 2020 and 2019.
REVENUE GROWTH BY OPERATING SEGMENT
Net Premium Revenue Net Income
$320.52018
$409.22019
$414.22020
$47.12018
$58.92019
$49.12020
US
$ m
illio
ns
Three months ended December 31
Year ended December 31
(in millions of US $) 2020 2019 Change 2020 2019 Change
Sagicor Life segment
Net premium revenue 156.1 126.0 24% 414.2 409.2 1%
Gain on derecognition of amortised cost
investments 0.6 0.5 20% 0.6 0.5 20%
Gain on derecognition of assets carried at FVOCI 1.7 2.9 (41%) 2.9 6.2 (53%)
Interest income earned from financial assets measured at amortised costs and FVOCI 19.9 20.1 (1%) 74.8 74.2 1%
Other investment income 2.5 3.1 (19%) 4.1 10.8 (62%)
Credit impairment gains/(losses) 0.9 (0.4) 325% (7.4) 1.4 (629%)
Fees and other revenue 3.1 4.9 (37%) 11.4 11.0 4%
Inter-segment revenues 5.8 5.1 14% 22.7 20.0 14%
Total revenue 190.6 162.2 18% 523.3 533.3 (2%)
Benefits (112.8) (94.6) (19%) (330.4) (331.4) -
Expenses and taxes (35.3) (34.5) (2%) (125.7) (126.3) -
Depreciation and amortisation (3.4) (2.1) (62%) (8.9) (7.4) (20%)
Inter-segment expenses (0.6) (1.4) 57% (4.1) (5.0) 18%
Other 0.3 0.4 (25%) 3.3 3.6 (8%)
Segment income before taxes 38.8 30.0 29% 57.5 66.8 (14%)
Income taxes (2.6) (1.8) (44%) (8.4) (7.9) (6%)
Net segment income from continuing operations 36.2 28.2 28% 49.1 58.9 (17%)
Income attributable to shareholders 35.2 29.4 20% 47.7 60.9 (22%)
Return on Investments (annualised) 6.1% 6.6% (0.5) pts 5.4% 6.1% (0.7) pts
Return on Equity (annualised) 26.3% 22.0% 4.3 pts 9.1% 12.2% (3.1) pts
Return on Shareholder’s Equity (annualised) 25.7% 23.0% 2.7 pts 8.8% 12.7% (3.9) pts

87Fourth quarter (three-month period) results of the Sagicor Life Segment analysis
Notwithstanding the continued impact of the COVID-19 pandemic, the Sagicor Life segment demonstrated a strong performance for the three-month period ended December 31, 2020, with growth in its new business sales to individuals closing 13% over the previous quarter together with a significant new single premium annuity sale amounting to US $63.9 million during the quarter. Additionally, the segment was able to improve its asset liability matching by acquiring debt securities that better match its policy liability maturity profile at attractive yields, resulting in a reduction of its actuarial provisions.
The net income attributable to shareholders was US $35.2 million for the three-month period ended December 31, 2020, US $5.8 million above the US $29.4 million recorded for the same period in 2019.
The Sagicor Life segment generated total revenue of US $190.6 million for the three-month period, US $28.4 million (18%) above the US $162.2 million reported for the same period in the prior year. Net premium revenue was US $156.1 million compared to US $126.0 million for the same period in 2019, an increase of US $30.1 million, as the segment benefited from a new single premium annuity sale as mentioned above.
Net investment income including interest income, gains on derecognition of financial assets and other investment income totalled US $24.7 million for the three-month period ended December 31, 2020 and was marginally below the US $26.6 million reported for the same period in 2019. Interest income for the three-month period was US $19.9 million and was on par with that reported for the three-month period ended December 31, 2019. Other investment income was US $2.5 million, compared to US $3.1 million for Q4 2019, a decrease of US $0.6 million. During Q4 2020, the segment reported unrealised losses on investment property totalling US $1.3 million (Q4, 2019 – US $0.7 million).
Fees and other revenues decreased by US $1.8 million to close at US $3.1 million for the three-month period ended December 31, 2020, compared to US $4.9 million for the corresponding period in 2019.
Benefits incurred for the Sagicor Life segment totalled US $112.8 million for the three-month period ended December 31, 2020 compared to benefits incurred of US $94.6 million reported for the same period in the prior year an increase of US $18.2 million. Net policy benefits excluding the changes in actuarial reserves increased by US $8.1 million mainly due to higher benefits paid, driven by the impact of higher annuity business, along with the continued growth in the life insurance portfolio. In addition, net change in actuarial liabilities increased by US $9.3 million to close at US $43.9 million and includes the impact of the
single premium new annuity sale (US $47.8 million). The impact of a new single premium annuity sale was partially offset by better asset liability matching, the impact of which was a reduction in the actuarial liabilities of US $ 27.6 million.
Total expenses and taxes for the Sagicor Life segment totalled US $41.9 million for the three-month period ended December 31, 2020, US $2.1 million above the US $39.8 million reported for the same period in 2019. The increase in expenses was due to restructuring charges related to the retirement of a senior executive.
Year-to-date (twelve-month period) results of the Sagicor Life Segment analysis
The Sagicor Life segment was impacted by the COVID-19 pandemic during the year ended December 31, 2020. The impact is reflected primarily in higher expected credit losses and lower sales in our individual life and annuities lines of business versus the previous year. Despite these challenges this segment had a creditable performance and was buoyed by a new single premium annuity sale during 2020 with premium of US $63.9 million.
The net income attributable to shareholders was US $47.7 million for the year ended December 31, 2020, US $13.2 million below the US $60.9 million recorded for the same period in 2019.
The Sagicor Life segment generated total revenue of US $523.3 million, US $10.0 million (2%) lower than the US $533.3 million reported for the same period in the prior year. Net premium revenue was US $414.2 million compared to US $409.2 million for the same period in 2019, an increase of US $5.0 million. The segment was impacted by growth in net premium revenue for the life and annuity insurance business when compared to the prior year. The segment benefited from a new significant single premium policy in Q4 2020 amounting to US $63.9 million.
Net investment income including interest income, gains on derecognition of financial assets and other investment income totalled US $82.4 million, US $9.3 million below the US $91.7 million reported for the same period in 2019. Interest income for the year ended December 31, 2020 was US $74.8 million which was on par with the prior year’s levels. Other investment income totalled US $4.1 million, as the segment recorded realised and unrealised losses on financial assets categorised as FVTPL of US $2.9 million due to the impact of COVID-19 on capital markets. During the same period in 2019, the segment reported gains of US $3.8 million.
Credit impairment losses for the year 2020 totalled US $7.4 million, compared to impairment gains of US $1.4 million, for the corresponding period in 2019 and resulted from the update of credit assessment assumptions due to the impact of the pandemic.

88Fees and other revenues increased marginally, closing at US $11.4 million for the period under review.
Benefits incurred for the Sagicor Life segment totalled US $330.4 million for the year ended December 31, 2020 compared to benefits incurred of US $331.4 million reported for the same period in the prior year. Benefits include the impact of the single premium new annuity sale (US $47.8 million), offset by the reduction in actuarial liabilities relating to asset matching of US $ 27.6 million.
Total expenses and taxes for the Sagicor Life segment totalled US $147.1 million for the year ended December 31, 2020 and was slightly above the US $146.6 million reported for the same period in 2019.
The following table summarises the financial position of the Sagicor Life segment as of December 31, 2020 and December 31, 2019.
Statement of Financial Position As of December 31
(in millions of US $) 2020 2019 Change
Sagicor Life segment
Financial investments 1,551.0 1,438.6 8%
Other assets 337.6 341.4 (1%)
Inter-segment assets 390.6 335.8 16%
Total assets 2,279.2 2,115.8 8%
Policy liabilities 1,477.9 1,379.8 7%
Other liabilities 82.8 77.3 7%
Inter-segment liabilities 126.4 120.0 5%
Total liabilities 1,687.1 1,577.1 7%
Net assets 592.1 538.7 10%
Financial investments totalled US $1,551.0 million (December 31, 2019 - US $1,438.6 million) and comprised 68% (December 31, 2019 - 68%) of the segment’s total assets, and policy liabilities totalled US $1,477.9 million (December 31, 2019 - US $1,379.8 million) and comprised 88% (December 31, 2019 - 87%) of the segment’s total liabilities at the end of December 2020. Overall, net assets increased by 10% or US $53.4 million due to strong operating results.
New initiatives and developments
The COVID-19 virus has had a significant impact on all the territories in which we operate during 2020. In response, Sagicor implemented several initiatives to assist the communities in which we operate in these difficult times. We rolled
out our business continuity plan and moved to provide services to our clients remotely. New products were launched during the year targeted at the annuities market and the life insurance market. Additionally, we continue to be competitive in the single premium annuity market and were able to grow new business here in the fourth quarter.
Sagicor Jamaica segment
The Sagicor Jamaica segment offers life, health, annuity, property and casualty insurance, pension administration services, commercial banking, investment banking, hospitality and real estate investment services in the markets of Jamaica, Cayman Islands, Costa Rica and the United States of America. Sagicor Jamaica’s strong brand, together with its wide range of products and highly skilled work force, has allowed it to maintain a leading position in market segments in which it operates. Its commercial banking services are offered through a network of sixteen (16) branches. Sagicor Life Jamaica Limited, a life insurance subsidiary within the Sagicor Jamaica segment, currently holds a financial strength rating of B++ stable and an issuer credit rating of bbb+ stable, with A.M. Best.
Sagicor Jamaica Highlights
2020 2019 2018
Return on Total Equity 4.1% 15.1% 17.4%
Return on Shareholder’s Equity 14.3% 20.3% 18.9%
Return on Investments 5.6% 8.8% 7.6%
NET PREMIUM REVENUE AND NET INCOME GROWTH
Net Premium Revenue Net Income
$309.72018
$350.12019
$355.42020
$110.82018
$123.62019
$37.82020
US
$ m
illio
ns

89Three months ended
December 31Year ended
December 31
(in millions of US $) 2020 2019 Change 2020 2019 Change
Sagicor Jamaica segment
Net premium revenue 90.6 93.7 (3%) 355.4 350.1 2%
Gain on derecognition of amortised cost investments 3.0 10.3 (71%) 8.3 13.3 (38%)
Gain on derecognition of assets carried at FVOCI 3.6 15.1 (76%) 21.7 21.3 2%
Interest income earned from financial assets measured at amortised costs and FVOCI 39.4 40.9 (4%) 160.5 160.3 -
Other investment income /(expenses) 14.0 8.6 63% (14.3) 52.1 (127%)
Credit impairment gains/(losses) 0.6 (9.5) 106% (12.1) (6.1) (98%)
Fees and other revenue 25.9 35.1 (26%) 112.4 144.3 (22%)
Total revenue 177.1 194.2 (9%) 631.9 735.3 (14%)
Benefits (73.6) (65.0) (13%) (231.9) (308.9) 25%
Expenses and taxes (61.0) (69.3) 12% (228.6) (238.9) 4%
Depreciation, amortisation and impairments (4.7) (5.5) 15% (20.2) (20.4) 1%
Inter-segment expenses (0.8) (0.9) 11% (2.1) (2.5) 16%
Gain/(loss) arising on business combination, acquisitions and divestitures 1.5 - - (1.3) - -
Loss on impairment of associates and joint ventures (19.0) - - (31.8) - -
Share of operating losses from associates and joint ventures (15.5) (5.7) (172%) (38.2) (0.6) (6,267%)
Segment income before taxes c/fwd 4.0 47.8 (92%) 77.8 164.0 (53%)
Three months ended December 31
Year ended December 31
(in millions of US $) 2020 2019 Change 2020 2019 Change
Segment income before taxes b/fwd 4.0 47.8 (92%) 77.8 164.0 (53%)
Income taxes (8.7) (15.5) 44% (40.0) (40.4) 1%
Net segment income from continuing operations (4.7) 32.3 (115%) 37.8 123.6 (69%)
Income attributable to shareholders 11.0 18.2 (40%) 50.5 61.4 (18%)
Return on Investments(annualised) 8.0% 7.6% 0.4 pts 5.6% 8.8%
(3.2) pts
Return on Total Equity(annualised) (2.1%) 14.3% (16.4) pts 4.1% 15.1% (11.0) pts
Return on Shareholder’s Equity 11.5% 21.3% (9.8) pts 14.3% 20.3% (6.0) pts
Fourth quarter (three-month period) results of the Sagicor Jamaica Segment analysis
The Sagicor Jamaica segment reported a net loss of US $4.7 million for the three-month period ended December 31, 2020 (Q4 2019 – net income of US $32.3 million) which was impacted by our share of net losses on our Associate Playa Hotels and Resorts (US $14.8 million) coupled with impairment losses $19.0 million arising from investment in Associate (Playa Hotels and Resorts). Net income attributable to shareholders was US $11.0 million for the three-month period ended December 31, 2020 compared to US $18.2 million for the three-month period ended December 31, 2019.
This segment generated total revenue of US $177.1 million for the three-month period ended December 31, 2020, compared to US $194.2 million for the same period in the prior year. This represented a decrease of US $17.1 million or 9%.
Premium income closed at US $90.6 million for the fourth quarter of 2020 compared to US $93.7 million, for the same period in 2019, a decrease of US $3.1 million. While the Life, health and property and casualty insurance businesses observed declines, improvements were seen in the annuities business.
Interest income was US $39.4 million, for the three-month period ended December 31, 2020 compared to US $40.9 million in the corresponding prior period. Other investment income totalled US $14.0 million, for the period under review, compared to income of US $8.6 million for the same period in

90the prior year. Investment gains totalled US $11.9 million were higher than the US $6.9 million reported in the prior year and was affected by mark-to-market movements experienced in the local and international capital markets.
Credit impairment assessment resulted in a of gain totalled US $ 0.6 million for the three-month period ended December 31, 2020, compared to losses of US $9.5 million for the same period in 2019, a decrease in the impairment loss of US $10.1 million.
Fees and other revenue closed at US $25.9 million for the three-month period under review, compared to US $35.1 million for the same period in 2019, a decrease of US $9.2 million or 26%. During the period, the segment was impacted by lower hotel revenues of US $6.3 million, as the hotel business line continues to grapple with worldwide travel restrictions occasioned by the COVID-19 pandemic. In addition, in 2019, the segment of benefited from higher fee income from the banking business.
Benefits totalled US $73.6 million compared to US $65.0 million reported for the same period in 2019 an increase of US $8.6 million. The segment reported net change in actuarial liabilities increase of US $9.4 million compared to a release of US $0.1 million in 2019, an increase of US $9.5 million. The Individual Life reserve releases for assumption changes in Q4 2020 was lower than in Q4 2019 coupled with higher actuarial liabilities in Employee Benefits driven by higher annuities new business.
Expenses and taxes incurred amounted to US $75.2 million for the three-month period compared to US $91.2 million for the same period in 2019, a decrease of US $16.0 million. Depreciation, amortisation and impairment charges totalled US $4.7 million, a decrease of US $0.8 million when compared to that reported for the same period in 2019. Administrative expenses declined by US $9.0 million to close at US $43.8 million and was partially as a result to lower hotel expenses, as the tourism industry continued to grapple with restricted travel associated with the COVID-19 pandemic, coupled with declines in income taxes of US $6.8 million due to the lower net income levels in Q4 2010.
Earnings from other sources was a loss of US $33.0 million for the fourth quarter of 2020, compared to a loss of US $5.7 million for the same period in 2019. During the December 2020 quarter, our Jamaica segment incurred a loss of US $33.8 million (including US $19.0 million in impairment losses) on its associated company investment in Playa Hotels and Resorts due to the impact of the COVID-19 travel restrictions’ adverse impact on hotel operations. This loss largely represents our share of net income/(loss) of the associate and an impairment charge on the investment in the associate (Shareholder impact: - loss of US $3.3 million).
Year-to-date (twelve-month period) results of the Sagicor Jamaica Segment analysis
Net income for the Sagicor Jamaica segment for the year ended December 31, 2020 was US $37.8 million (2019 - US $123.6 million). The impact of the COVID-19 pandemic and the resulting travel restrictions adversely impacted our investments in hotel operations, caused recognition of a significant share of loss and impairment charges on the associated company investment, Playa Hotels and Resorts (US $73.5 million). Net income attributable to the shareholders was US $50.5 million compared to US $61.4 million in 2019, a decline of 18% (US $10.9 million).
This segment generated total revenue of US $631.9 million for the year period ended December 31, 2020, compared to US $735.3 million for the same period in the prior year. This represented a decrease of US $103.4 million or 14%.
Premium income totalled US $355.4 million for the year compared to US $350.1 million, for the same period in 2019, an increase of US $5.3 million. The segment’s acquisition of a 60% interest in Advantage General Insurance Company Limited (AGI) effective September 30, 2019, contributed US $18.4 million in net premiums income. However, this impact was reduced by declines in life and annuity premium revenue.
Interest income was US $160.5 million and was on par with the US $160.3 million reported for the same period in 2019. Other investment losses totalled US $14.3 million, for the year under review, compared to income of US $52.1 million for the prior year. Realised and unrealised losses on financial assets categorised as FVTPL totalled US $17.6 million for the year 2020, compared to gains of US $46.7 million for the same period in 2019. These investment losses resulted from the impact of mark-to-market declines in the local and international capital markets, as capital markets responded to the economic uncertainty created by the COVID-19 pandemic.
Credit impairment losses totalled US $12.1 million for the year ended December 31, 2020, compared to US $6.1 million for the same period in 2019, an increase in impairments losses of US $6.0 million, due to the continuing economic impact of the pandemic. Sagicor Jamaica strengthened the provisions on loans and investments, given the slow economic recovery projected.
Fees and other revenue closed at US $112.4 million for the year under review, compared to US $144.3 million for the same period in 2019, a decrease of US $31.9 million or 22%. During the period, the segment benefited from fees and other revenue generated in the property and casualty lines of business acquired effective September 30, 2019. Hotel revenues however, declined by

91US $22.6 million, as the industry continues to be negatively impacted by travel restrictions associated with the COVID-19 pandemic. Declines were also reported in fee income from the segment’s banking business, primarily from the slowing of consumer activity and the decline in corporate financing deals closed during the period.
Benefits totalled US $231.9 million compared to US $308.9 million reported for the same period in 2019, a decrease of US $77.0 million. Net change in actuarial liabilities was a release of US $26.3 million compared to an increase of US $59.3 million reported in 2019. During the year under review the change in actuarial liabilities was positively influenced by improvements in mortality, morbidity, lapse experience and other assumptions, which were updated during the period (US $70.1 million). The impact of the releases was reduced by an increase related to the strengthening of the actuarial liabilities as a result of a change in the yield curve (US $27.1 million).
Expenses and taxes incurred amounted to US $290.9 million for the year compared to US $302.2 million for the same period in 2019, a decrease of US $11.3 million over the prior year’s levels. Expenses excluding taxes decreased by US $10.9 million to close at US $250.9 million. While the segment incurred additional expenses of US $7.1 million in the newly acquired property and casualty business, this was offset by lower expenditure in the hotel business (US $16.8 million). Income taxes totalled US $40.0 million for the period under review, compared to US $40.4 million for the same period in 2019.
Earnings from other sources was a loss of US $71.3 million for the year ended December 31, 2020, compared to a loss of US $0.6 million for the same period in 2019. During the year, the segment incurred a loss of US $73.5 million on its associated company investment in Playa Hotels and Resorts due to the impact of the COVID-19 travel restrictions’ adverse impact on hotel operations. This loss largely represents our share of net income/(loss) of the associate and an impairment charge on the investment in the associate (Shareholder impact: - loss of US $6.7 million).
The following table summarises the financial position of the Sagicor Jamaica segment as of December 31, 2020 and December 31, 2019.
Statement of Financial Position As of December 31
(in millions of US $) 2020 2019 Change
Sagicor Jamaica segment
Financial investments 2,714.5 2,670.3 2%
Other assets 730.0 795.8 (8%)
Inter-segment assets 10.6 15.9 (33%)
Total assets 3,455.1 3,482.0 (1%)
Policy liabilities 824.5 865.9 (5%)
Other liabilities 1,690.4 1,673.1 1%
Inter-segment liabilities 12.9 6.1 111%
Total liabilities 2,527.8 2,545.1 (1%)
Net assets 927.3 936.9 (1%)
Financial investments totalled US $2,714.5 million (December 31, 2019 – US $2,670.3 million) and comprised 79% (December 31, 2019 - 77%) of the segment’s total assets. Total assets closed at US $3,455.1 million, a decrease of 1% (US $26.9 million). Policy liabilities totalled US $824.5 million (December 31, 2019 – US $865.9 million) and other liabilities totalled US $1,690.4 million (December 31, 2019 – US $1,673.1 million), representing 33% (December 31, 2019 - 34%) and 67% (December 31, 2019 - 66%) of the segment’s total liabilities at the end of December 31, 2020 and December 31, 2019.
Overall net assets declined by 1% from US $936.9 million as at December 31, 2019 to US $927.3 million at the end of December 2020, mainly due to the decline in the value of the Jamaican dollar relative to the US dollar, coupled with lower operating results.
New initiatives and developments
The COVID-19 virus had a significant impact on the Sagicor Jamaica segment. In response, Sagicor Jamaica Group implemented several initiatives to assist the communities in which we operate in these difficult times. Additionally, we rolled out our business continuity plan and moved to provide services to our clients remotely.

92Sagicor Life USA segment
Sagicor USA, Inc. and its operating entity, Sagicor Life Insurance Company, (collectively, Sagicor USA) operate in 45 states and the District of Columbia. Sagicor USA is focused on providing life and annuity products to middle market America through independent producers and direct-to-consumer platforms (SagicorNOW.com and PeaceAssured.com). Middle market America has been defined broadly as individuals and families with household incomes of $40,000 to $100,000 or retirees or near-retirees with retirement portfolios of $100,000 to $1,000,000.
Sagicor USA’s products can be broadly placed in three categories:
• Periodic premium – This would include products such as several variations of term insurance, non-participating whole life, indexed universal life and no-lapse universal life. All of these products usually allow the owner to pay premiums on a monthly, quarterly, or annual basis.
• Single premium life – This category includes two products developed to support an older demographic who are looking principally to provide a larger legacy upon their death, while having access to funds to assist if they need critical care. We offer a standard interest crediting whole life product as well as an indexed universal life product.
• Annuities – Currently all of Sagicor USA’s annuity offerings are single premium products including such products as multi-year guaranteed, fixed interest crediting, indexed crediting as well as immediate annuities. Most of the products are focused on helping the customer accumulate assets with little to no market risk to their initial premium.
Sagicor Life USA Highlights
2020 2019 2018
Return on Total Equity (9.2%) 14.0% 7.8%
Return on Shareholder’s Equity (9.2%) 14.0% 7.8%
Return on Investments 4.2% 6.8% 3.1%
The following table summarises the results of the Sagicor Life USA segment for the three-month periods and years ended December 31, 2020 and 2019.
NET PREMIUM REVENUE AND NET INCOME/LOSS
Net Premium Revenue Net Income/(loss)
$390.02018
$444.72019
$597.12020
$18.32018
$35.42019
($27.1)2020
US
$ m
illio
ns
(loss)
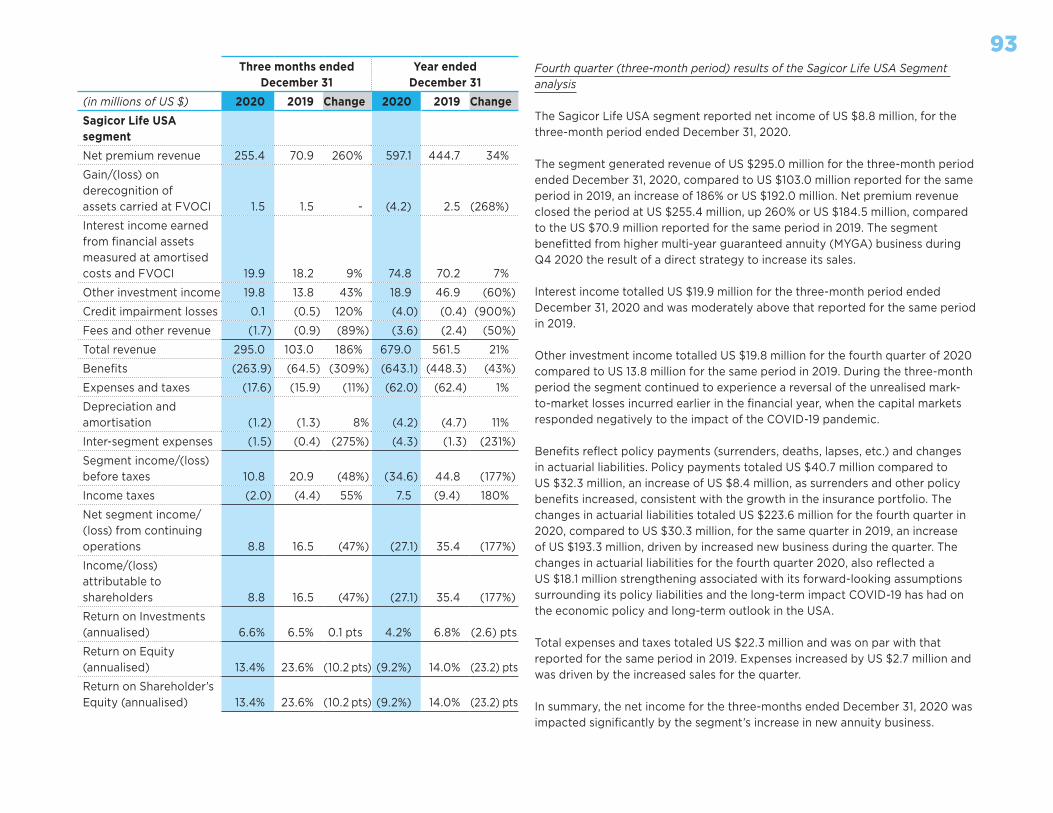
93Three months ended
December 31Year ended
December 31
(in millions of US $) 2020 2019 Change 2020 2019 Change
Sagicor Life USA segment
Net premium revenue 255.4 70.9 260% 597.1 444.7 34%
Gain/(loss) on derecognition ofassets carried at FVOCI 1.5 1.5 - (4.2) 2.5 (268%)
Interest income earned from financial assets measured at amortised costs and FVOCI 19.9 18.2 9% 74.8 70.2 7%
Other investment income 19.8 13.8 43% 18.9 46.9 (60%)
Credit impairment losses 0.1 (0.5) 120% (4.0) (0.4) (900%)
Fees and other revenue (1.7) (0.9) (89%) (3.6) (2.4) (50%)
Total revenue 295.0 103.0 186% 679.0 561.5 21%
Benefits (263.9) (64.5) (309%) (643.1) (448.3) (43%)
Expenses and taxes (17.6) (15.9) (11%) (62.0) (62.4) 1%
Depreciation and amortisation (1.2) (1.3) 8% (4.2) (4.7) 11%
Inter-segment expenses (1.5) (0.4) (275%) (4.3) (1.3) (231%)
Segment income/(loss) before taxes 10.8 20.9 (48%) (34.6) 44.8 (177%)
Income taxes (2.0) (4.4) 55% 7.5 (9.4) 180%
Net segment income/(loss) from continuing operations 8.8 16.5 (47%) (27.1) 35.4 (177%)
Income/(loss) attributable to shareholders 8.8 16.5 (47%) (27.1) 35.4 (177%)
Return on Investments (annualised) 6.6% 6.5% 0.1 pts 4.2% 6.8% (2.6) pts
Return on Equity (annualised) 13.4% 23.6% (10.2 pts) (9.2%) 14.0% (23.2) pts
Return on Shareholder’s Equity (annualised) 13.4% 23.6% (10.2 pts) (9.2%) 14.0% (23.2) pts
Fourth quarter (three-month period) results of the Sagicor Life USA Segment analysis
The Sagicor Life USA segment reported net income of US $8.8 million, for the three-month period ended December 31, 2020.
The segment generated revenue of US $295.0 million for the three-month period ended December 31, 2020, compared to US $103.0 million reported for the same period in 2019, an increase of 186% or US $192.0 million. Net premium revenue closed the period at US $255.4 million, up 260% or US $184.5 million, compared to the US $70.9 million reported for the same period in 2019. The segment benefitted from higher multi-year guaranteed annuity (MYGA) business during Q4 2020 the result of a direct strategy to increase its sales.
Interest income totalled US $19.9 million for the three-month period ended December 31, 2020 and was moderately above that reported for the same period in 2019.
Other investment income totalled US $19.8 million for the fourth quarter of 2020 compared to US 13.8 million for the same period in 2019. During the three-month period the segment continued to experience a reversal of the unrealised mark-to-market losses incurred earlier in the financial year, when the capital markets responded negatively to the impact of the COVID-19 pandemic.
Benefits reflect policy payments (surrenders, deaths, lapses, etc.) and changes in actuarial liabilities. Policy payments totaled US $40.7 million compared to US $32.3 million, an increase of US $8.4 million, as surrenders and other policy benefits increased, consistent with the growth in the insurance portfolio. The changes in actuarial liabilities totaled US $223.6 million for the fourth quarter in 2020, compared to US $30.3 million, for the same quarter in 2019, an increase of US $193.3 million, driven by increased new business during the quarter. The changes in actuarial liabilities for the fourth quarter 2020, also reflected a US $18.1 million strengthening associated with its forward-looking assumptions surrounding its policy liabilities and the long-term impact COVID-19 has had on the economic policy and long-term outlook in the USA.
Total expenses and taxes totaled US $22.3 million and was on par with that reported for the same period in 2019. Expenses increased by US $2.7 million and was driven by the increased sales for the quarter.
In summary, the net income for the three-months ended December 31, 2020 was impacted significantly by the segment’s increase in new annuity business.

94Year-to-date (twelve-month period) results of the Sagicor Life USA Segment analysis
The Sagicor Life USA segment incurred a loss of US 27.1 million, for the year ended December 31, 2020, as noted previously due to the significant ramifications of COVID-19 and the SRBL transaction (see below), representing a US $63.7 million decrease from the US $35.4 million net income reported for the same period in the prior year.
The Sagicor Life USA segment generated revenue of US $679.0 million for the year ended December 31, 2020, compared US $561.5 million reported for the same period in 2019, an increase of 21% or US $117.5 million. Net premium revenue closed the period at US $597.1 million, up 34% or US $152.4 million, compared to the US $444.7 million reported for the same period in 2019, due to the higher annuity sales.
The investment portfolio increase drove increased interest income totalling US $74.8 million, up US $4.6 million from the US $70.2 million reported for 2019.
Other investment income totalled US $18.9 million for the year ended December 31, 2020 compared to income of US $46.9 million for the same period in 2019 and includes market movements in the segment’s hedging portfolio which reflected a cumulative gain for the year 2020 of $7.7 million compared to a gain of US $32.9 million in the prior year. Additionally, the segment also reported realised and unrealised gain on financial assets categorised as FVTPL of US $4.1 million during the year ended December 31, 2020 compared to gains of US $9.1 million in the prior period, a reduction of US $5.0 million, as capital markets still experience significant volatility as a result of the COVID-19 pandemic.
Benefits totaled US $643.1 million for the year ended December 31, 2020 compared to US $448.3 million for the same period in 2019, an increase of US $194.8 million. Net policy benefits excluding changes in actuarial liabilities totaled US $177.2 million for the year, compared to US $115.2 million for the prior year, an increase of US $62.0 million and reflects expected increases in surrenders and other policy benefits, as the in-force business continues to grow.
Net changes in actuarial liabilities totaled US $463.4 million, compared to US $325.9 million, an increase of US $137.5 million due to the growth in business over the prior year. The segment also reflected in this increase US $33.6 million associated with its forward-looking assumptions surrounding its policy liabilities and the long-term impact COVID-19 has had on the economic policy and long-term outlook in the USA. In addition, during the June 2020 quarter, Sagicor Life USA completed a transaction whereby it transferred the insurance
risks associated with certain life products and US $195 million of financial instruments supporting those liabilities to Sagicor Reinsurance Bermuda Limited (SRBL), providing approximately US $26 million of regulatory capital relief to SLIC. However, this transaction did result in a strengthening of the associated policy liabilities recognized in the consolidated segment of approximately US $13.4 million.
Driven by lower income taxes, total expenses and taxes decreased by 19%. Commission and premium taxes are 5% higher than the same period a year ago due to higher new business. The segment recognized a tax credit of US $7.5 million compared to a tax charge of US $9.4 million in 2019, driven by the loss recorded for the year.
In summary, the net loss for year ended December 31, 2020 was impacted by the significant volatility of the capital markets as a result of the global pandemic and the associated impact of investment returns (both current and projected) on the actuarial liabilities.
Statement of Financial Position As of December 31
(in millions of US $) 2020 2019 Change
Sagicor Life USA segment
Financial investments 2,556.3 2,040.8 25%
Other assets 767.8 735.7 4%
Inter-segment assets 59.0 65.2 (10%)
Total assets 3,383.1 2,841.7 19%
Policy liabilities 2,507.8 1,997.4 26%
Other liabilities 452.6 437.9 3%
Inter-segment liabilities 152.8 110.8 38%
Total liabilities 3,113.2 2,546.1 22%
Net assets 269.9 295.6 (9%)
Consistent with prior reporting periods, Sagicor Life USA’s financial position is dominated by the liabilities it recognizes on its in force life and annuity policy obligations; 81% of total liabilities as of December 31, 2020 (December 31, 2019 – 78%) and the financial investments that support those liabilities (76% of total assets as of December 31, 2020 and 72% of total assets as of December 31, 2019).
Policy liabilities and the supporting financial investments grew during the twelve months ended December 31, 2020 as the company wrote approximately

95US $568.0 million of new single premium life and annuities while paying out approximately US $204.2 million in benefits and commissions.
Overall, the decrease in net assets from December 31, 2019 to December 31, 2020 of US $25.7 million (9%) was a direct result of the market impact of the COVID-19 pandemic coupled with increases in the actuarial assumptions for the policy liabilities, offsetting the growth noted above.
New initiatives and developments
Strategic initiatives for 2020 have been focused on continuing the segment’s long-standing initiatives on serving the middle-market consumer. While COVID-19 has disrupted the timing of some of these initiatives, the segment’s focus in prior periods on Accelewriting ® and SagicorNOW (the segment’s direct-to-consumer platform) has allowed for increased life insurance sales from the prior year and we are focusing on growing these platforms (allowing for contactless future sales). Also, the segment focused its attention on ”simple” annuity products, specifically its MYGA suite, offering the consumer a measure of certainty in an unsettled economic environment.

964. FINANCIAL POSITION
Capitalisation and Solvency
Capitalisation
The Group’s objectives when managing capital, which is a broader concept than equity in the statement of financial position, are:
• To comply with capital requirements established by insurance, banking and other financial intermediary regulatory authorities;
• To comply with internationally recognised capital requirements for insurance, where local regulations do not meet these international standards;
• To safeguard its ability as a going concern to continue to provide benefits and returns to policyholders, depositors, note-holders and shareholders;
• To provide adequate returns to shareholders; and• To maintain a strong capital base to support the future development of
Group operations.
Capital resources
The principal capital resources of the Group are as follows:
(in millions of US $) 2020 2019 20182017
Restated (i) 2016
Shareholders’ equity 1,109.8 1,154.1 600.9 624.6 537.1
Non-controlling interest 546.8 594.5 530.5 311.8 261.1
Notes and loans payable 471.6 517.7 490.3 413.8 395.2
Total financial statement capital resources 2,128.2 2,266.3 1,621.7 1,350.2 1,193.4
(i) For details of the restatement, refer to page 128.
The Group deploys its capital resources through its operating activities. These operating activities are carried out by subsidiary companies which are either insurance entities or provide other financial services. The capital is deployed in such a manner as to ensure that subsidiaries have adequate and sufficient capital resources to carry out their activities and to meet regulatory requirements.
At December 31, 2020, the Company’s capital totalled US $2,128.2 million, a decrease of US $138.1 million from the December 31, 2019 position (US $2,266.3 million). Capital resources’ decline during the year was largely driven by marked-to-market declines of our financial asset in response to the COVID-19 pandemic, coupled with declines in operating income being reported. During the year, the distribution of dividends to shareholders and a reduction to notes and loans payable also impacted capital resources. Non-controlling interests at December 31, 2020 were lower than reported in the prior year.
Financial Leverage
As of December 31, 2020, Sagicor had a debt to equity ratio of 28.5%, compared to 29.6% as of December 31, 2019, respectively. To determine the debt to equity ratio, loans and notes payable, as presented note 16 to the annual financial statements, is divided by total equity.
The Debt to Capital ratio was 22.2%, at December 30, 2020, compared to 22.8% as of December 31, 2019. To determine the debt to capital ratio, notes and loans payable as presented in note 16 to the annual financial statements, is divided by total capital, where capital is the summation of total equity excluding Participating accounts, (as presented in the Statement of Financial Position in the annual financial statements) and notes and loans payable, as at the reporting date.
Both the debt to equity ratio and the debt to capital ratio experienced improvements when compared to December 2019, due in part to a reduction in notes and loans payable (US $46.1 million) arising from repayments, coupled with declines in equity and by extension, capital, associated with the impact of COVID-19 on the financial results.
Debt Ratios
2020 2019 20182017
Restated (i) 2016
Debt ratios
Notes and Loans Payable/capital 22.2% 22.8% 30.2% 30.6% 33.1%
Notes and Loans Payable/equity 28.5% 29.6% 43.2% 44.2% 49.4%
(i) For details of the restatement, refer to page 128.

97Capital adequacy
Capital adequacy is managed at the operating company level. It is calculated by the company’s Appointed Actuary and reviewed by executive management, the audit committee and the board of directors of the company. In addition, the Group seeks to maintain internal capital adequacy at levels higher than the regulatory or internationally recognised requirements.
To assist in evaluating the current business and strategy opportunities, a risk-based capital approach is a core measure of financial performance. The risk-based assessment measure which has been adopted is the Canadian MCCSR standard. The minimum standard recommended by the Canadian regulators for companies is an MCCSR of 150.0%. A number of jurisdictions in the Caribbean region have no internationally recognised capital adequacy requirements, and in accordance with its objectives for managing capital, Sagicor has adopted the Canadian MCCSR standard. Jamaica and the United States have recognised capital adequacy standards.
Sagicor’s consolidated MCCSR as of December 31, 2020 has been estimated at 252%, compared to 253% at December 31, 2019. This is the principal standard of capital adequacy used to assess Sagicor’s overall strength. However, because of the variations in capital adequacy standards across jurisdictions, the consolidated result should be regarded as applicable to the life insurers of the Sagicor Group as a whole and not necessarily applicable to each individual segment, insurance subsidiary or insurance subsidiary branch.
Sagicor Life Jamaica Limited
Sagicor Life Jamaica is governed by the Jamaican MCCSR regime (based on Canadian standards in effect in 2001), which requires an insurer to maintain a minimum ratio of 150%. For the year ended December 31, 2019, this ratio was 179%. At December 31, 2020, the ratio was 183%.
Sagicor Life Insurance Company (USA)
A risk-based capital (RBC) formula and model have been adopted by the National Association of Insurance Commissioners (NAIC) of the United States. RBC is designed to assess minimum capital requirements and raise the level of protection that statutory surplus provides for policyholder obligations. The RBC formula for life insurance companies measures four major areas of risk: (i) underwriting, which encompasses the risk of adverse loss developments and property and casualty insurance product mix; (ii) declines in asset values arising from credit risk; (iii) declines in asset values arising from investment risks, including concentrations; and (iv) off-balance sheet risk arising from adverse
experience from non-controlled assets such as reinsurance guarantees for affiliates or other contingent liabilities and reserve and premium growth. If an insurer’s statutory surplus is lower than required by the RBC calculation, it will be subject to varying degrees of regulatory action, depending on the level of capital inadequacy.
The RBC methodology provides for four levels of regulatory action. The extent of regulatory intervention and action increases as the ratio of surplus to RBC falls. The least severe regulatory action is the “Company Action Level” (as defined by the NAIC) which requires an insurer to submit a plan of corrective actions to the regulator if surplus falls below 200% of the RBC amount.
Sagicor Life USA looks to maintain at least 300% of the risk-based capital amount and has maintained these ratios as of December 31, 2020 and December 31, 2019, respectively.
Sagicor Investments Jamaica Limited and Sagicor Bank Jamaica Limited
The capital adequacy and the use of regulatory capital are monitored monthly by management employing techniques based on the guidelines developed by the Financial Services Commission (FSC), the Bank of Jamaica (BOJ), Basel II and the Risk Management and Compliance Unit. The required information is filed with the respective regulatory authorities at stipulated intervals. The Bank of Jamaica and the FSC require each regulated entity to hold the minimum level of regulatory capital, and to maintain a minimum ratio of total regulatory capital to the risk-weighted assets.
The risk-weighted assets are measured by means of a hierarchy of five risk weights classified according to the nature of each asset and counterparty, taking into account, any eligible collateral or guarantees. A similar treatment is adopted for off financial statements exposure, with some adjustments to reflect the more contingent nature of the potential losses.
The following table summarises the capital adequacy ratios. During 2020 and the year 2019, all applicable externally imposed capital requirements were complied with.

982020 2019
Sagicor Investments
Actual capital base to risk weighted assets 15% 20%
Required capital base to risk weighted assets 10% 10%
Sagicor Bank
Actual capital base to risk weighted assets 14% 14%
Required capital base to risk weighted assets 10% 10%
Notes and Loans Payable
As of December 31, 2020, Sagicor had US $471.6 million in notes and loans payable compared to US $517.7 million as of December 31, 2019.
Summary details of carrying values and fair values of notes and loans payable as of December 31, 2020 and December 31, 2019, respectively are set out in the following tables.
December 31, 2020
December 31, 2019
(in millions of US $)Carrying
valueFair
valueCarrying
valueFair
value
Notes and loans payable
8.875% senior notes due 2022(a) 315.9 324.7 318.2 330.2
5.50% unsecured bond due 2022 (c) 32.0 32.8 - -
6.25% unsecured bond due 2022 (c) &(d) 27.0 28.5 - -
5.10% unsecured bond due 2020 (b) - - 33.7 34.3
5.95% unsecured bond due 2020 (c) - - 42.9 44.8
5.00% notes due 2020 (e) - - 16.9 17.3
6.75% notes due 2024 (e) 15.4 16.3 16.6 15.8
Mortgage loans 59.6 60.8 75.0 77.0
Bank loans & other funding
instruments (f) 21.7 21.7 14.4 14.4
Total 471.6 484.8 517.7 533.8
(a) Valuation of Call Option Embedded Derivative
As at December 31, 2020, the Group had US $318 million principal amount of senior unsecured notes (the “Notes”). The Notes are due August 11, 2022
and bear interest at an annual rate of 8.875%. Pursuant to the terms of the Notes, the Group may redeem the Notes under the scenario as summarised below and described in more detail herein:
Optional Redemption without an Applicable Premium - At any time on or after August 11, 2019, the Group may redeem the Notes in whole or in part at specified redemption prices, plus accrued and unpaid interest, if any, on the Notes redeemed, to the applicable date of redemption.
The Group has estimated the fair value of this embedded derivative at US $5.9 million as at December 31 (2019 – US $2.8 million).
(b) On September 18 and 26, 2019, Sagicor Financial Corporation Limited issued US $30.6 million and US $3.4 million notes respectively, carrying an annual rate of 5.10%. The notes matured October 26, 2020.
(c) On September 26, 2019, Sagicor Financial Corporation Limited issued a Jamaican $ bond in the amount of J$5,731,140,000 carrying an annual interest rate of 5.95% per annum. The bond matured October 26, 2020.
On October 27, 2020, Sagicor Financial Corporation Limited refinanced the above facility with the issue of a bond in two Tranches, Tranche A up to J$5,737,140,000 and Tranche B up to US $31,807,000, carrying annual interest rates of 6.25% and 5.50% respectively. Interest is payable quarterly commencing January 27, 2021. The Tranches mature on April 26, 2022, with an option for further extension.
(d) At December 31, 2020, Sagicor Investments Jamaica Limited held an investment of US $13.5 million in Tranche A above.
(e) On August 16, 2019, Sagicor Investments Jamaica Limited issued J$4.4 billion notes in two Tranches, Tranche A J$2.22 billion and Tranche B J$2.18 billion, carrying annual rates of 5.00% and 6.75% respectively. Tranche A matured on September 16, 2020 and Tranche B has a maturity date of August 16, 2024.
(f) Bank loans and other funding instruments include the following:
(i) On May 24, 2019, Sagicor General Insurance Inc entered into a US $12 million loan agreement. The interest rate is 3.50% per annum and the loan matures on July 31, 2024.
(ii) On October 1, 2020, The Estates (Residential Properties) Limited issued cumulative preference shares in the amount of US $9 million.
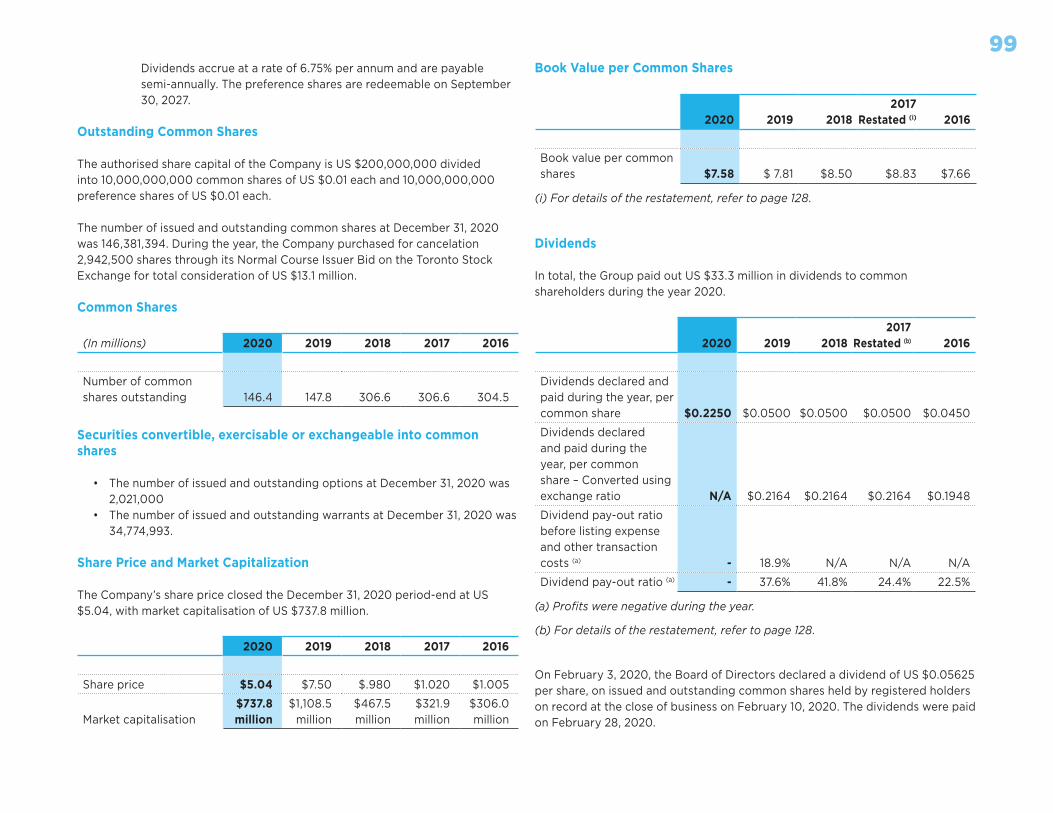
99Dividends accrue at a rate of 6.75% per annum and are payable semi-annually. The preference shares are redeemable on September 30, 2027.
Outstanding Common Shares
The authorised share capital of the Company is US $200,000,000 divided into 10,000,000,000 common shares of US $0.01 each and 10,000,000,000 preference shares of US $0.01 each.
The number of issued and outstanding common shares at December 31, 2020 was 146,381,394. During the year, the Company purchased for cancelation 2,942,500 shares through its Normal Course Issuer Bid on the Toronto Stock Exchange for total consideration of US $13.1 million.
Common Shares
(In millions) 2020 2019 2018 2017 2016
Number of common shares outstanding 146.4 147.8 306.6 306.6 304.5
Securities convertible, exercisable or exchangeable into common shares
• The number of issued and outstanding options at December 31, 2020 was 2,021,000
• The number of issued and outstanding warrants at December 31, 2020 was 34,774,993.
Share Price and Market Capitalization
The Company’s share price closed the December 31, 2020 period-end at US $5.04, with market capitalisation of US $737.8 million.
2020 2019 2018 2017 2016
Share price $5.04 $7.50 $.980 $1.020 $1.005
Market capitalisation$737.8 million
$1,108.5 million
$467.5 million
$321.9 million
$306.0 million
Book Value per Common Shares
2020 2019 20182017
Restated (i) 2016
Book value per common shares $7.58 $ 7.81 $8.50 $8.83 $7.66
(i) For details of the restatement, refer to page 128.
Dividends
In total, the Group paid out US $33.3 million in dividends to common shareholders during the year 2020.
2020 2019 20182017
Restated (b) 2016
Dividends declared and paid during the year, per common share $0.2250 $0.0500 $0.0500 $0.0500 $0.0450
Dividends declared and paid during the year, per common share – Converted using exchange ratio N/A $0.2164 $0.2164 $0.2164 $0.1948
Dividend pay-out ratio before listing expense and other transaction costs (a) - 18.9% N/A N/A N/A
Dividend pay-out ratio (a) - 37.6% 41.8% 24.4% 22.5%
(a) Profits were negative during the year.
(b) For details of the restatement, refer to page 128.
On February 3, 2020, the Board of Directors declared a dividend of US $0.05625 per share, on issued and outstanding common shares held by registered holders on record at the close of business on February 10, 2020. The dividends were paid on February 28, 2020.

100On April 24, 2020, the Board of Directors declared a dividend of US $0.05625 per share, on issued and outstanding common shares held by registered holders on record at the close of business on May 5, 2020. The dividend was paid on May 29, 2020.
On August 14, 2020, the Board of Directors declared a dividend of US $0.05625 per share, on issued and outstanding common shares held by registered holders on record at the close of business on August 28, 2020. The dividend was paid on September 18, 2020.
On November 14, 2020, the Board of Directors declared a dividend of US $0.05625 per share, on issued and outstanding common shares held by registered holders on record at the close of business on November 25, 2020. The dividend was paid on December 16, 2020.
Liquidity and Capital Resources
The following discussion is qualified by reference to the consolidated statement of cash flows and note 36 of the 2020 annual financial statements.
Liquidity sources immediately available to the Sagicor Group include: (i) existing cash and cash equivalents; (ii) the Group’s portfolio of highly rated, highly liquid investments; (iii) cash flow from operating activities which include net premiums receipts, fee income and investment income; and (iv) borrowing facilities. These funds are used primarily to pay current benefits and operating expenses, service the Group’s long-term debt, purchase investments to support future benefits and maturing obligations, and for distribution of dividends. Sagicor expects to have sufficient liquidity to fund its operations and to meet its current business plans. However, should the need arise, additional liquidity sources include further bank loans and new issuances of debt or shares in the private or public markets.
Cash flow
The following table summarise the Group’s cash flows for the three-month and twelve-month periods ended December 31, 2020 and December 31, 2019, respectively.
(in millions of US $)Three months ended
December 31Year ended
December 31
2020 2019 Change 2020 2019 Change
Net cash flows from continuing operations:
Operating activities 10.2 25.9 (61%) (99.1) 41.5 (339%)
Investing activities (5.6) (5.5) (2%) (24.4) (44.5) 45%
Financing activities (19.1) 438.5 (104%) (98.8) 443.8 (122%)
Effect of exchange rate changes (0.9) 2.5 (136%) (5.8) (4.9) (18%)
(15.4) 461.4 (103%) (228.1) 435.9 (152%)
Net cash flows from discontinued operation - - - - 17.8 (100%)
Cash and cash equivalents:
Beginning of period 562.6 313.9 79% 775.3 321.6 141%
End of period 547.2 775.3 (29%) 547.2 775.3 (29%)
Fourth quarter (three-month period) - Cash flows analysis
For the three-month period ended December 31, 2020, Sagicor’s net cash inflows associated with operating activities was US $10.2 million compared to US $25.9 million for the same period in 2019. Lower operating inflows were observed mainly in our USA segment as more funds were utilised during Q4 2020, to invest in securities.
Sagicor’s net cash used in investing activities was US $5.6 million compared to US 5.5 million for the same period in 2019, an increase of US $0.1 million.
Sagicor’s net cash used for financing activities totalled US $19.1 million during the December 2020 quarter, compared to inflows of US $438.5 million for the same period in 2019, an increase of US $457.6 million. The December 2020 quarter includes cash outflows of US $1.8 million associated with the repurchase of 354,500 shares under a share buyback program. During the year two unsecured

101bonds matured and were refinanced. Refer to the Notes and Loans Payable section for details.
In Q4 2019, Sagicor and Alignvest completed the business combination involving the transfer of all issued and outstanding shares in Sagicor to Alignvest. This transaction raised over US $450.0 million in new capital for the Group, which resulted in higher cash inflows from financing activities.
For the three-month period ended December 31, 2020, the effect of exchange rate changes was a loss of US $0.9 million compared to a gain of US $2.5 million for the corresponding period in 2019.
Year-to-date (twelve-month period) - Cash flows analysis
For the year ended December 31, 2020, Sagicor’s net cash outflows associated with operating activities were US $99.1 million compared to inflows of US $41.5 million for the same period in 2019, an increase in outflows of US $140.6 million. Funds obtained from the Alignvest transaction capital injection, which occurred during the last quarter of 2019, were invested in securities during the year 2020, the impact of this was however was reduced by increased inflows from operating activities across all business segments.
Sagicor’s net cash used in investing activities was US $24.4 million compared to US $44.5 million for the same period in 2019, a decrease of US $20.1 million. During the year Sagicor increased its outflows associated with the acquisition of property, plant and equipment when compared to the prior year. In addition, on June 15, 2020, the Company acquired a further 1,500,000 shares of our Associated Company, Playa, for a total of US $6.0 million. In 2019, our Jamaica Segment acquired a subsidiary Group, Advantage General Insurance Company Limited, for US $31.2 million.
Sagicor’s net cash used for financing activities totalled US $98.8 million during the year 2020, compared to inflows of US $443.8 million for the same period in 2019. The year 2020 includes cash outflows of US $13.1 million associated with the repurchase of 2,942,500 shares under a share buyback program. Dividends paid to common shareholders during 2020, increased by US $18.3 million to close at US $33.3 million for the year. During the year two unsecured bonds matured and were refinanced, while a loan totalling US $16.9 million was repaid. Mortgage repayments were also made during the year. Refer to the Notes and Loans Payable section for details. In 2019, the cash inflows mainly related to the Alignvest transaction which raised capital of over US $450.0 million.
For the year ended December 31, 2020, the effect of exchange rate changes was a loss of US $5.8 million compared to a loss of US $4.9 million for the corresponding period in 2019.
In February 2019, the Group received cash flows of US $17.8 million from the close-out of discontinued operations.

102Ratings
Sagicor Financial Corporation Limited, its principal operating subsidiaries, and its debt financing vehicle, have been rated by the rating agencies AM Best, Standard and Poor’s, or Fitch. The ratings as of the date of issue of this Management Discussion and Analysis are as follows.
AM Best Rating
Sagicor Life Inc(a)
Financial Strength A - Stable
Issuer Credit Rating a- Stable
Sagicor Life Jamaica Limited(a)
Financial Strength B++ Stable
Issuer Credit Rating bbb+ Stable
Sagicor Life Insurance Company (USA)(a)
Financial Strength A- Stable
Issuer Credit Rating a- Stable
Sagicor Financial Corporation Limited(a)
Issuer Credit Rating bbb- Stable
Sagicor Finance (2015) Limited(a)
Senior Unsecured bbb Stable
Sagicor General Insurance Inc(b)
Financial Strength A- Stable
Issuer Credit Rating a- Stable
(a) Updated September 11, 2020. (b) Updated October 14, 2020
S&P Rating (c)
Sagicor Financial Corporation Limited
Issuer Credit Rating BB+ (Stable)
Sagicor Finance (2015) Limited
Senior Unsecured BB+ (Stable)(c) Updated November 25, 2020
Fitch Rating (d)
Sagicor Financial Corporation Limited
Long-term Issuer Default Rating BB (Stable)
Sagicor Finance (2015) Limited
Senior Unsecured BB- (Stable)
(d) Updated June 8, 2020.
Critical Accounting Estimates and Judgments
Certain accounting estimates and judgements are recognised as critical because they require us to make particularly subjective or complex judgments about matters that are inherently uncertain and significantly different amounts could be reported under different conditions or using different assumptions.
These accounting estimates and judgements are discussed in the sections below. The notes to the annual financial statements outline the relevant accounting policies or give specific relevant disclosure to the matters identified in these sections. These notes are also referred to below.
1. Impairment of financial assets – IFRS 9 (note 2.9 of the financial statements)
In determining ECL (Expected Credit Losses), management is required to exercise judgement in defining what is considered a significant increase in credit risk and in making assumptions and estimates to incorporate relevant information about past events, current conditions and forecasts of economic conditions.
a) Establishing staging for debt securities and deposits
The Group’s internal credit rating model is a 10-point scale which allows for distinctions in risk characteristics and is referenced to the rating scale of international credit rating agencies.

103The scale is set out in the following table:
CategorySagicor
Risk Rating
Classification S&P Moody’s Fitch AM Best
No
n-d
efau
lt
Inve
stm
ent
gra
de
1 Minimal riskAAA, AA
Aaa, AaAAA, AA
aaa, aa
2 Low risk A A A a
3 Moderate risk BBB Baa BBB bbb
No
n-
inve
stm
ent
gra
de 4
Acceptable risk
BB Ba BB bb
5 Average risk B B B b
Wat
ch
6 Higher riskCCC, CC
Caa, CaCCC, CC
ccc, cc
7Special mention
C C C c
8 Substandard DDD
Default 9 Doubtful D C DD d
10 Loss D
The Group uses its internal credit rating model to determine which of the three stages an asset is to be categorized for the purposes of ECL.
Once the asset has experienced a significant increase in credit risk the investment will move from Stage 1 to Stage 2. Sagicor has assumed that the credit risk of a financial instrument has not increased significantly since initial recognition if the financial instrument is determined to have low credit risk at the reporting date. A financial asset that is investment grade or Sagicor risk rating of 1-3 is considered low credit risk.
Stage 1 investments are rated (i) investment grade, or (ii) below investment grade at origination and have not been downgraded more than 2 notches since origination. Stage 2 investments are assets which (i) have been downgraded from investment grade to below investment grade, or (ii) are rated below investment grade at origination and have been downgraded more than 2 notches since origination. Stage 3 investments are assets in default.
b) Establishing staging for other assets measured at amortised cost, lease receivables, loan commitments and financial guarantee contracts.
Exposures are considered to have resulted in a significant increase in credit risk and are moved to Stage 2 when:
Qualitative test
• accounts that meet the portfolio’s ‘high risk’ criteria and are subject to closer credit monitoring.
Backstop Criteria
• accounts that are 30 calendar days or more past due. The 30 days past due criteria is a backstop rather than a primary driver of moving exposures into stage 2.
c) Forward looking information
When management determines the macro-economic factors that impact the portfolios of financial assets, they first determine all readily available information within the relevant market. Portfolios of financial assets are segregated based on product type, historical performance and homogenous country exposures. There is often limited timely macro-economic data for Barbados, Eastern Caribbean, Trinidad and Jamaica. Management assesses data sources from local government, International Monetary Fund and other reliable data sources. A regression analysis is performed to determine which factors are most closely correlated with the credit losses for each portfolio. Where projections are available, these are used to look into the future up to three years and subsequently the expected performance is then used for the remaining life of the product. These projections are re-assessed on a quarterly basis.
2. Fair value of securities not quoted in an active market (note 41.8 of the financial statements)
The fair value of securities not quoted in an active market may be determined using reputable pricing sources (such as pricing agencies), indicative prices from bond/debt market makers or other valuation techniques. Broker quotes as obtained from the pricing sources may be indicative and not executable or binding. The Group exercises judgement on the quality of pricing sources used. Where no market data is available, the Group may value positions using its own models, which are usually based on valuation methods and techniques generally recognised as standard within the industry. The inputs into these models are primarily discounted cash flows.

104The models used to determine fair values are periodically reviewed by experienced personnel. The models used for debt securities are based on net present value of estimated future cash flows, adjusted as appropriate for liquidity, and credit and market risk factors.
3. Recognition and measurement of intangible assets (note 2.7 of the financial statements)
The recognition and measurement of intangible assets, other than goodwill, in a business combination involve the utilisation of valuation techniques which may be very sensitive to the underlying assumptions utilised. These intangibles may be marketing related, customer related, contract-based or technology based.
For significant amounts of intangibles arising from a business combination, the Group utilises independent professional advisors to assist management in determining the recognition and measurement of these assets.
4. Impairment of intangible assets (note 2.7 of the financial statements)
a) Goodwill
The assessment of goodwill impairment involves the determination of the value of the cash generating business units to which the goodwill has been allocated. Determination of the value involves the estimation of future cash flows or of income after tax of these business units and the expected returns to providers of capital to the business units and / or to the Group as a whole. For the Sagicor Life reporting segment, the Group uses the value in use methodology for testing goodwill impairment. For the Sagicor Jamaica operating segment, the Group uses the fair value less cost to sell methodology, and for Sagicor General Insurance Inc the value in use methodology.
The Group updates its business unit financial projections annually and applies discounted cash flow or earnings multiple models to these projections to determine if there is any impairment of goodwill. The assessment of whether goodwill is impaired can be highly sensitive to the inputs of cash flows, income after tax, discount rate, growth rate or capital multiple, which are used in the computation.
b) Other intangible assets
The assessment of impairment of other intangible assets involves the determination of the intangible’s fair value or value in use. In the absence of an active market for an intangible, its fair value may need to be estimated. In
determining an intangible’s value in use, estimates are required of future cash flows generated as a result of holding the asset.
5. Valuation of actuarial liabilities (note 2.15 of the financial statements)
a) Canadian Actuarial Standards
The objective of the valuation of policy liabilities is to determine the amount of the insurer’s assets that, in the opinion of the Appointed Actuary (AA) and taking into account the other pertinent items in the financial statements, will be sufficient without being excessive to provide for the policy liabilities over their respective terms. The amounts set aside for future benefits are dependent on the timing of future asset and liability cash flows.
The actuarial liabilities are determined as the present value of liability cash flows discounted at effective interest rates resulting in a value equivalent to the market value of assets supporting these policy liabilities under an adverse economic scenario, to which margins for adverse deviations are added.
The Appointed Actuary (AA) identifies a conservative economic scenario forecast, and together with the existing investment portfolio as at the date of the actuarial valuation and assumed reinvestment of net asset and policy liability cash flows, calculates the actuarial liabilities required at the date of valuation to ensure that sufficient monies are available to meet the liabilities as they become due in future years.
The methodology produces the total reserve requirement for each policy group fund. In general, the methodology is used to determine the net overall actuarial liabilities required by the insurer. Actuarial liabilities are computed by major group of policies and are used to determine the amount of reinsurance balances in the reserve, the distribution of the total reserve by country, and the distribution of the reserve by policy, and other individual components in the actuarial liabilities.
b) Best estimate reserve assumptions & provisions for adverse deviations
Actuarial liabilities include two major components: a best estimate reserve and a provision for adverse deviations. The latter provision is established in recognition of the uncertainty in computing best estimate reserves, to allow for possible deterioration in experience and to provide greater comfort that reserves are adequate to pay future benefits.

105For the respective reserve assumptions for mortality and morbidity, lapse, future investment yields, operating expenses and taxes, best estimate reserve assumptions are determined where appropriate. The assumption for operating expenses and taxes is in some instances split by universal life and unit linked business.
Provisions for adverse deviations are established in accordance with the risk profiles of the business, and are, as far as is practicable, standardised across geographical areas. Provisions are determined within a specific range established by Canadian standards of practice.
The principal assumptions and margins used in the determination of actuarial liabilities are summarised sub-sections c) to i) which follow. However, the liability resulting from the application of these assumptions can never be definitive as to the ultimate timing or the amount of benefits payable and is therefore subject to future re-assessment.
c) Process used to set actuarial assumptions and margins for adverse deviations
At each date for valuation of actuarial liabilities, the AA of each insurer reviews the assumptions made at the last valuation date. The AA reviews the validity of each assumption by referencing current data, and where appropriate, changes the assumptions for the current valuation. A similar process of review and assessment is conducted in the determination of margins for adverse deviations. Any changes in actuarial standards and practice are also incorporated in the current valuation.
d) Assumptions for mortality and morbidity
Mortality rates are related to the incidence of death in the insured population. Morbidity rates are related to the incidence of sickness and disability in the insured population. Annually, insurers update studies of recent mortality experience. The resulting experience is compared to external mortality studies including tables from the Canadian Institute of Actuaries (CIA). Appropriate modification factors are selected and applied to underwritten and non-underwritten business respectively. Annuitant mortality is determined by reference to CIA tables or to other established scales.
Assumptions for morbidity are determined after taking into account insurer and industry experience.
e) Assumptions for lapse
Policyholders may allow their policies to lapse prior to the maturity date either by choosing not to pay premiums or by surrendering their policy for its cash value. Lapse studies are updated annually by insurers to determine the persistency of the most recent period. Assumptions for lapse experience are generally based on moving averages.
f) Assumptions for investment yields
Returns on existing variable rate securities, shares, investment property and policy loans are linked to the current economic scenario. Yields on reinvested assets are also tied to the current economic scenario. Returns are, however, assumed to decrease and it is assumed that at the end of twenty years from the valuation date, all investments, except policy loans, are reinvested in long-term, default free government bonds.
g) Assumptions for operating expenses and taxes
Policy acquisition and policy maintenance expense costs for the long-term business of each insurer are measured and monitored using internal expense studies. Policy maintenance expense costs are reflected in the actuarial valuation after adjusting for expected inflation. Costs are updated annually and are applied on a per policy basis.
Taxes reflect assumptions for future premium taxes and income taxes levied directly on investment income. For income taxes levied on net income, actuarial liabilities are adjusted for policy-related recognised deferred tax assets and liabilities.
h) Asset default
The AA of each insurer includes a provision for asset default in the modelling of the cash flows. The provision is based on industry and Sagicor’s experience and includes specific margins, where appropriate, for assets backing the actuarial liabilities, e.g. for investment property, equity securities, debt securities, mortgage loans and deposits.
i) Margins for adverse deviations
Margins for adverse deviations are determined for the assumptions in the actuarial valuations. The application of these margins resulted in provisions for adverse deviations being included in the actuarial liabilities as set out in the following table:

106December 31
(in US $millions) 2020 2019
Provisions for adverse deviations
Mortality and morbidity 97.3 95.2
Lapse 90.7 76.4
Investment yield and asset default 69.9 66.0
Operating expenses and taxes 10.5 10.0
Other 14.9 13.9
Total 283.3 261.5
6. Investment in associate
As at October 1, 2018, Sagicor Group Jamaica (SGJ) had a shareholding in Playa of 15%, which increased to 16% on June 15, 2020 (see note 6.1 of the 2020 annual financial statements). From an accounting perspective, IAS 28 (Investments in Associate and Joint Ventures) paragraph 5, 6 and 8 guidance was considered as follows:
Where an entity holds 20% or more of the voting power (directly or through subsidiaries) in an investee, it will be presumed the investor has significant influence unless it can be clearly demonstrated that this is not the case. If the holding is less than 20%, the entity will be presumed not to have significant influence unless such influence can be clearly demonstrated. A substantial or majority ownership by another investor does not necessarily preclude an entity from having significant influence.
The existence of significant influence by an entity is usually evidenced in one or more of the following ways:
• representation on the board of directors or equivalent governing body of the investee;
• participation in the policy-making process, including participation in decisions about dividends or other distributions;
• material transactions between the entity and the investee;• interchange of managerial personnel; or• provision of essential technical information.
In assessing whether potential voting rights contribute to significant influence, the entity examines all facts and circumstances (including the terms of exercise of the potential voting rights and any other contractual arrangements whether considered individually or in combination) that affect potential rights, except the intentions of management and the financial ability to exercise or convert those
potential rights. Management has one representative out of eight on the Board of Playa.
Management has previously concluded, given its participation in the policy-making decisions, significant involvement in, and influence over strategic financial and operational decision-making of Playa, that it has significant influence over Playa and as such was of the view that SGJ’s strategic investment in Playa should be treated as an investment in associate in accordance with IAS 28, even though Sagicor owns less than 20% of Playa’s shares. Subsequent to the year end, SGJ has sold a portion of its investment as part of Playa’s secondary public offering and transferred the remaining shares to Sagicor Financial Corporation Limited (see note 50 of the 2020 annual financial statements). Management concluded that the investment in Playa did not meet the definition of held for sale as at December 31, 2020.

1075. FINANCIAL INVESTMENTS
Each principal operating entity within the Group has an investment policy that provides a framework of maximizing investment yield subject to the management of the Asset Liability Management (ALM) risks and the investment regulations of each country.
As of December 31, 2020, Sagicor had US $7.2 billion of diversified financial assets and experienced net investment income of US $330.9 million, a return on net investment of 4.9% for the year. Since becoming a public company in 2002, Sagicor has had positive and stable investment portfolio performance. This performance has been impacted by the stock market declines resulting from the COVID-19 pandemic.
Carrying Values
The table below shows the carrying value of Sagicor’s investment portfolio as of December 31, 2020 and December 31, 2019.
(in millions of US $, except percentages)
As of December 31, 2020
As of December 31, 2019
Analysis of Financial InvestmentsCarrying
value% of
TotalCarrying
value% of
Total
Investments at FVOCI:
Debt securities and money market funds 3,611.9 50% 3,673.5 55%
Equity securities 1.1 - 1.3 -
3,613.0 50% 3,674.8 55%
Investments at FVTPL:
Debt securities 348.9 5% 243.1 4%
Equity securities 659.5 9% 370.2 6%
Derivative financial instruments 37.2 1% 36.9 1%
Mortgage loans 26.1 - 28.9 -
1,071.7 15% 679.1 11%
Investments at amortised cost:
Debt securities 1,269.5 17% 1,148.7 17%
Mortgage loans 393.2 5% 362.5 5%
Policy loans 151.0 2% 151.5 2%
Finance loans 555.4 8% 595.3 9%
Securities purchased for re-sale 57.1 1% 10.9 -
Deposits 127.7 2% 62.8 1%
2,553.9 35% 2,331.7 34%
Total financial investments 7,238.6 100% 6,685.6 100%
Our debt security portfolios constitute the major asset class of the Group and are reflected in the statement of financial position as follows:
(in millions of US $)
As of December
31, 2020
As of December
31, 2019 Change
Debt securities and money market funds
Measured at fair value through other comprehensive income 3,611.9 3,673.5 (2%)
Measured at amortised cost 1,269.5 1,148.7 11%
Measured at fair value through income (FVTPL) 348.9 243.1 44%
Total 5,230.3 5,065.3 3%

108FVOCI debt securities are held to collect contractual cash flows and to sell periodically to collect gains. These securities primarily support our business in the USA and in Jamaica, where there is reasonable opportunity to realise investment gains.
Amortised cost debt securities are held to collect contractual cash flows and are sold infrequently. These securities primarily support our business in the southern and eastern Caribbean.
FVTPL debt securities are classified as such when the Group insurance or investment contract-holder is credited with the full return on the underlying asset. Debt securities held for trading are also classified as FVTPL.
The pie charts below represent a breakdown of the carrying value and risk exposure of Sagicor’s consolidated investments portfolio as of December 31, 2020.
A - 9%
BBB - 44%
BB - 6%
B - 31%
Un-rated and other - 1%
AAA/AA- 10%
Default- 0%
INVESTMENT PORTFOLIO RISK EXPOSUREAs at December 31, 2020
DECEMBER 2020 DEBT SECURITIES: US $5.2bn
Investments at amortised cost - 35%
Investments at FVTPL - 15%
INVESTMENT PORTFOLIO AS OF DECEMBER 31, 2020Carrying Value (As a % of Total Investment Portfolio)
Investments at FVOCI - 50%
DECEMBER 2020 FINANCIAL INVESTMENTS: US $7.2bn

109NET INVESTMENT INCOME
Three months ended December 31
Year ended December 31
(in millions of US $) 2020 2019 Change 2020 2019 Change
Income from financial investments
Interest income:
Debt securities 21.5 20.6 4% 83.8 81.7 3%
Mortgage loans 5.6 5.1 10% 21.1 20.5 3%
Policy loans 2.7 2.7 - 10.9 10.5 4%
Finance loans and finance leases 15.2 15.2 - 61.2 60.9 -
Securities purchased for resale 0.3 0.4 (25%) 0.8 0.5 60%
Deposits, cash and other items 0.4 0.3 33% 1.0 1.4 (29%)
45.7 44.3 3% 178.8 175.5 2%
Interest Income (FVOCI):
Debt securities and money market funds 34.5 35.7 (3%) 136.0 132.5 3%
Fair value changes and interest income (FVTPL Assets):
Debt securities 7.4 6.5 14% 16.5 25.3 (35%)
Equity securities 16.5 6.8 143% (9.2) 49.3 (119%)
Mortgage loans 0.2 0.5 (60%) 0.6 2.5 (76%)
Derivative financial instruments 16.3 14.5 12% 10.8 35.7 (70%)
40.4 28.3 43% 18.7 112.8 (83%)
Investment income:
Other income on financial investments 0.1 (0.2) 150% 0.5 0.3 67%
Investment property income and fair value (losses)/gains (0.3) 1.2 (125%) 1.8 7.9 (77%)
Other investment income 0.9 (0.9) 200% 1.7 (0.3) 667%
0.7 0.1 600% 4.0 7.9 (49%)
Gross Investment Income 121.3 108.4 12% 337.5 428.7 (21%)
Three months ended December 31
Year ended December 31
(in millions of US $) 2020 2019 Change 2020 2019 Change
Gross investment income 121.3 108.4 12% 337.5 428.7 (21%)
Investment expenses:
Direct operating expenses of investment property 0.5 (0.5) (200%) 4.1 6.3 35%
Other direct investment expenses 0.5 1.2 58% 2.5 2.6 4%
1.0 0.7 43% 6.6 8.9 26%
Net investment income 120.3 107.7 12% 330.9 419.8 (21%)
Return on Investments (annualised) 6.9% 6.8% 0.1 pt. 4.9% 7.2% (2.3 pts)
INSURANCE AND INVESTMENT CONTRACT LIABILITIES
The amount of liabilities held in respect of long-term or recurring insurance or investment contracts is a measure of the quantum of business held from such contracts. The liabilities of such contracts are summarised in the following table.
As of December 31
(in US $ millions) 2020 2019 Change
Principal insurance and investment contract liabilities
Actuarial liabilities of life, health, and annuity insurance contracts 4,152.7 3,604.7 15%
Deposit administration and other policy investment contracts 437.6 424.3 3%
Customer deposits of banking operations 861.7 808.1 7%
Securities sold for re-purchase contracts 575.6 512.9 12%
Other funding instruments 388.5 418.0 (7%)
Structured product contracts - 6.8 (100%)
Total 6,416.1 5,774.8 11%

1106. RISK MANAGEMENT
Sagicor is in the business of taking risks and must manage those risks effectively to generate profitable growth, safeguard its reputation and protect its solvency. In its management of risks, the Group seeks to optimize the relationship between risk and reward across the entire enterprise and to limit possible losses resulting from its risk exposure.
Enterprise Risk Management (ERM) at Sagicor has been ongoing for many years, having appointed its first Chief Risk Officer in 2005. For about a decade, a standardized risk taxonomy and dictionary has been utilized across the Group and group-wide exposures to key financial risks (credit, interest rate, liquidity and currency risks) have been aggregated and reported to the Board. Further, each of the Group’s major operating segments has implemented ERM appropriate to the nature, scale and complexity of their operations. Sagicor continues to evolve its ERM especially as it relates to strategic and operational risks.
The Group defines risk as an event that causes a deviation from its strategic plan. Risk is also viewed holistically recognizing that one risk event may cause downside deviations in several business segments but also simultaneously causes upside deviations in one or more other business segments or may also be highly correlated with a second risk event. Lastly, the Group considers risks defined by source (e.g., data breach) as opposed to intermediate (e.g., reputation damage) or ultimate (e.g., lower earnings) outcomes. This not only provides the necessary specific context for risk assessment but also facilitates complete assessment of any and all downstream outcomes resulting from the risks.
ERM Process
Sagicor’s ERM process is depicted graphically below:
Identified risks are categorized as illustrated in the table below and further classified as key risks or non-key risks.
FINANCIAL INSURANCE OPERATIONAL STRATEGIC
MARKET PRICING HUMAN RESOURCES
STRATEGY
CREDIT UNDERWRITING TECHNOLOGY EXECUTION
LIQUIDITY RESERVING LITIGATION COMPETITOR
ECONOMIC COMPLIANCE LEGISLATIVE/ REGULATORY
FRAUD SUPPLIER
DISASTERS GOVERNANCE
PROCESSES EXTERNAL RELATIONS
STRATEGIC RELATIONSHIPS
INTERNATIONAL
Non-key risks are monitored for any changes in likelihood and/or severity and, if warranted, elevated to key risk status.

111Risk are assessed both qualitatively and quantitatively. Credit risk exposures are tracked for each of the investment portfolio, the lending portfolio and the reinsurance portfolio. Credit concentration risk is also tracked by the ultimate parent of each counterparty. Liquidity risk exposures are tracked by both asset-liability maturity profile and 24-month cashflow projections. Interest rate risk exposures are tracked using asset and liability durations for each major yield curve exposure. Currency risk exposures are tracked by stress testing net currency positions for major currency exposure.
Risk information is regularly communicated to external stakeholders including regulators, rating agencies, and the public. The Group files an Own Risk Solvency Assessment (ORSA) Summary Report with the Texas Department of Insurance. It also meets regularly with rating agencies (S&P, Fitch and A.M. Best) providing them with a description of our ERM framework and key risk exposures. Sagicor also provides extensive risk disclosures in its Notes to the Financial Statements.
Roles and Responsibilities
Responsibility for ERM permeates the organization. Business and functional units are responsible for monitoring and managing risks within their respective areas. The Group’s Corporate ERM teams’ responsibilities include but are not limited to the key ERM tools and techniques, oversight over all key ERM activities, ensuring consistent ERM definitions, concepts, and terminology, acting as a central clearing house for coordinating ERM information, monitoring individual and enterprise risk exposures, and providing key ERM information to the Board Investment and Risk Committees (both Group and subsidiary level). The Board Investment and Risk Committees oversee key risks and exposures and approve key ERM decisions and policies. Internal audit provides independent verification of policies and procedures.
1. Credit risk
The Group takes on exposure to credit risk, which is the risk that a counterparty will be unable to pay amounts in full when due. Credit risks are primarily associated with financial investments and reinsurance contracts held. Credit risk is the possibility that counterparties may not be able to meet payment obligations when they become due. As premiums, deposits and other receivables are received, these funds are invested to pay for future policyholder and other obligations.
The Group in most, but not all, instances bears the risk for investment performance, i.e. return of principal and interest. Any credit defaults or other reductions in the value of debt securities, loans, deposits and receivables could
have a material adverse effect on Sagicor’s business, results of operations and financial condition.
The investment committees of Group operating companies establish policies to manage credit risk. Specific limits are set for concentration by asset class and issuer, in addition to minimum standards for asset quality. Further, Sagicor deals only with highly rated reinsurers to contain counterparty risk. The Group minimises credit risk from financial investments through holding a diversified portfolio of investments, purchasing securities and advancing loans only after careful assessment of borrowers, and placing deposits with financial institutions that have a strong capital base. Sagicor’s policy is to not invest more than 10% of the debt of a single borrower, unless security is held for the debt.
However, many jurisdictions mandate that the operating companies invest a portion of the assets supporting the policy liabilities in government instruments such as treasury bills and bonds.
The Group has significant concentrations of credit risk with respect to its holding of bonds and treasury bills issued by the governments of Jamaica, Barbados and Trinidad and Tobago. In the United States, Sagicor has significant exposure to United States Government issued and/or government-backed investments (including state and local governments), Guggenheim Partners reinsurance assets and Heritage Life Insurance reinsurance assets.
In Sagicor Jamaica’s banking business, the Group is exposed to credit risk in both its securities and lending activities. In connection with securities activities, Sagicor Investments trades on a “delivery versus payment” policy where Government of Jamaica securities are accepted on a mark-to-market basis with its counterparties. Exposure limits are also established and monitored. In its lending activities, Sagicor Bank seeks to adequately collateralise its loans, particularly where they exceed certain thresholds. Loan applicants undergo a thorough screening and credit analysis process.
The following table summarises credit exposure of the Group’s financial investments as of December 31, 2020. It shows the gross carrying value, the accumulated loss allowance and the net carrying value, analysed by expected credit loss (ECL) staging (see critical accounting estimates and judgements – 1. impairment of financial assets).

112Credit exposure – December 31, 2020
ECL Staging
(in US $millions) Stage 1 Stage 2 Stage 3 POCI (c) Total
FVOCI (b) debt securities:
Gross value 3,208.2 164.1 7.9 28.6 3,408.8
Loss allowance (2.6) (8.5) (6.2) - (17.3)
Net value 3,205.6 155.6 1.7 28.6 3,391.5
Debt securities (a)
Gross value 1,066.1 28.3 3.9 177.2 1,275.5
Loss allowance (2.4) (1.9) (1.4) (0.4) (6.1)
Net value 1,063.7 26.4 2.5 176.8 1,269.4
Policy loans(a)
Gross value 151.3 - - - 151.3
Loss allowance (0.3) - - - (0.3)
Net value 151.0 - - - 151.0
Credit exposure – December 31, 2020
ECL Staging
(in US $millions) Stage 1 Stage 2 Stage 3 POCI (c) Total
Mortgage loans(a)
Gross value 306.1 42.8 47.9 - 396.8
Loss allowance (1.3) (0.6) (1.8) - (3.7)
Net value 304.8 42.2 46.1 - 393.1
Finance loans (a)
Gross value 523.6 33.5 11.0 - 568.1
Loss allowance (5.2) (0.9) (6.6) - (12.7)
Net value 518.4 32.6 4.4 - 555.4
Securities purchased for re-sale (a)
Gross value 57.1 - - - 57.1
Loss allowance - - - - -
Net value 57.1 - - - 57.1
Deposits (a)
Gross value 117.8 11.5 - - 129.3
Loss allowance (0.3) (1.3) - - (1.6)
Net value 117.5 10.2 - - 127.7
(a) Financial investments carried at amortised cost.
(b) FVOCI – fair value through other comprehensive income classification.
(c) POCI - purchased or originated credit impaired.
2. Foreign exchange risk
The Group is exposed to foreign exchange risk as a result of fluctuations in exchange rates since Sagicor’s financial assets and liabilities are denominated in a number of different currencies. In order to manage the risk associated with movements in currency exchange rates, Sagicor seeks to maintain investments and cash in each operating currency sufficient to match liabilities denominated in the same currency. Sagicor also invests limited amounts in United States dollar assets, which are held to pay liabilities in operating currencies. Management believes that this strategy adequately meets Sagicor’s asset and liability

113management goals with respect to currencies and in the long-term is likely to either maintain capital value or provide satisfactory returns.
The Sagicor Group operates and issues contracts in the currencies prevailing in the countries where it conducts business. Currencies which are pegged to the United States dollar are converted at the pegged rates. Currencies which float are converted to the United States dollar by reference to the average of buying and selling rates quoted by the respective central banks. Exchange rates of the other principal operating currencies to the United States dollar are set out in the following table.
Currency exchange rate of US $1.00:2020
closing rate2019
closing rate
Barbados dollar 2.0000 2.0000
Eastern Caribbean dollar 2.7000 2.7000
Jamaica dollar 142.4534 132.5324
Trinidad & Tobago dollar 6.7612 6.7624
Currency exchange rate of US $1.00:2020
average rate2019
average rate
Barbados dollar 2.0000 2.0000
Eastern Caribbean dollar 2.7000 2.7000
Jamaica dollar 141.7506 132.8772
Trinidad & Tobago dollar 6.7462 6.7510

114The following tables show the Group’s significant foreign exchange exposure as of December 31, 2020 and 2019 by presenting assets and liabilities by the currency in which they are denominated for its continuing operations.
December 31, 2020 US $million equivalents of balances denominated in
(in US $millions) Barbados $ Jamaica $ Trinidad $Eastern
Caribbean $ US $Other
Currencies Total
ASSETS
Financial investments (1) 362.2 1,296.9 575.1 164.0 4,065.6 114.2 6,578.0
Reinsurance assets (1) 1.8 10.1 1.2 1.2 673.8 0.8 688.9
Receivables (1) 21.2 58.0 12.7 13.2 31.1 3.9 140.1
Cash resources 29.3 98.2 42.2 15.5 203.8 50.6 439.6
Total monetary assets 414.5 1,463.2 631.2 193.9 4,974.3 169.5 7,846.6
Other assets (2) 202.6 416.2 87.3 19.9 692.7 1.0 1,419.7
Total assets of continuing operations 617.1 1,879.4 718.5 213.8 5,667.0 170.5 9,266.3
LIABILITIES
Actuarial liabilities 441.9 330.9 456.7 82.6 2,713.7 126.9 4,152.7
Other insurance liabilities (1) 81.8 54.7 32.1 11.9 40.1 14.0 234.6
Investment contracts 30.4 74.8 175.5 56.0 91.3 9.6 437.6
Notes and loans payable 21.7 51.9 - - 398.0 - 471.6
Lease liabilities 0.4 19.5 0.4 - 18.5 0.8 39.6
Deposit and security liabilities - 694.0 19.3 15.2 1,080.5 17.8 1,826.8
Provisions 16.0 26.0 13.1 (0.1) 0.6 10.9 66.5
Accounts payable and accruals 45.5 88.4 19.1 4.4 87.4 5.7 250.5
Total monetary liabilities 637.7 1,340.2 716.2 170.0 4,430.1 185.7 7,479.9
Other liabilities (2) 20.2 45.7 14.2 5.0 35.8 2.3 123.2
Total liabilities of continuing operations 657.9 1,385.9 730.4 175.0 4,465.9 188.0 7,603.1
Net position (40.8) 493.5 (11.9) 38.8 1,201.1 (17.5) 1,663.2
(1) Monetary balances only (2) Non-monetary balances, income tax balances and retirement plan assets

115December 31, 2019 US $million equivalents of balances denominated in
(in US $millions) Barbados $ Jamaica $ Trinidad $Eastern
Caribbean $ US $Other
Currencies Total
ASSETS
Financial investments (1) 341.2 1,344.1 474.2 150.1 3,879.2 125.4 6,314.2
Reinsurance assets (1) 6.7 3.8 4.8 2.1 681.6 0.4 699.4
Receivables (1) 22.8 69.4 10.3 15.7 14.8 5.0 138.0
Cash resources 21.2 91.6 26.5 9.7 165.4 47.2 361.6
Total monetary assets 391.9 1,508.9 515.8 177.6 4,741.0 178.0 7,513.2
Other assets (2) 199.2 477.8 90.8 20.8 425.8 1.3 1,215.7
Total assets of continuing operations 591.1 1,986.7 606.6 198.4 5,166.8 179.3 8,728.9
LIABILITIES
Actuarial liabilities 438.5 411.4 366.1 79.4 2,194.7 114.6 3,604.7
Other insurance liabilities (1) 80.6 55.8 32.8 12.2 31.8 14.7 227.9
Investment contracts 31.6 81.8 182.9 53.4 65.3 9.3 424.3
Notes and loans payable 14.4 104.4 - - 398.9 - 517.7
Lease liabilities 2.7 23.4 2.3 0.1 6.4 0.8 35.7
Deposit and security liabilities 1.3 684.2 1.1 15.3 1,033.1 17.6 1,752.6
Provisions 11.9 25.2 12.9 - 2.3 7.5 59.8
Accounts payable and accruals 40.7 116.9 18.1 1.9 57.4 5.4 240.4
Total monetary liabilities 621.7 1,503.1 616.2 162.3 3,789.9 169.9 6,863.1
Other liabilities (2) 18.8 32.5 15.2 5.1 42.2 2.2 116.0
Total liabilities of continuing operations 640.5 1,535.6 631.4 167.4 3,832.1 172.1 6,979.1
Net position (49.4) 451.1 (24.8) 31.0 1,334.7 7.2 1,749.8
(1) Monetary balances only (2) Non-monetary balances, income tax balances and retirement plan assets

1163. Interest rate risk
Sagicor is exposed to interest rate risk, which arises when the returns earned from invested assets decrease.
The return on investments may be variable, fixed for a term or fixed to maturity. Upon reinvestment of a matured investment, the returns available on new investments may be significantly different from the returns formerly achieved. Sagicor guarantees minimum returns on the cash values of certain types of policies, for example universal life and annuity contracts, and decreased investment returns may be insufficient to pay these guaranteed returns.
Sagicor is thereby exposed to the effects of fluctuations in the prevailing levels of market interest rates on Sagicor’s financial position and cash flows. Interest margins may increase or decrease as a result of such changes. Interest rate changes may also result in losses if asset and liability cash flows are not closely matched with respect to timing and amount.
Movements in short-term and long-term interest rates affect the level and timing of recognition of gains and losses on securities Sagicor holds, and cause changes in realised and unrealised gains and losses. Generally, Sagicor’s investment income will be reduced during sustained periods of lower interest rates as higher yielding fixed income securities are called, mature, or are sold and the proceeds reinvested at lower rates. During periods of rising interest rates, the market value of Sagicor’s existing fixed income securities will generally decrease and Sagicor’s realised gains on fixed income securities will likely be reduced. Realised losses will be incurred following significant increases in interest rates only if the securities are sold; otherwise the losses will be unrealised as assets are fairly matched to similar duration liabilities and may be held to maturity. Conversely, declining interest rates result in unrealised gains in the value of fixed income securities Sagicor continues to hold, as well as realised gains to the extent the relevant securities are sold.
Sagicor’s primary interest rate exposures relate to Sagicor’s long-term insurance and annuities liabilities as well as funds on deposit. Sagicor may incur a loss on certain contracts where the investment return does not exceed the interest credited to the policyholder.
The tables following summarise the exposures to interest rates on the Group’s monetary insurance and financial liabilities (excluding actuarial liabilities), for the years ended December 31, 2020 and 2019. They set out liabilities at carrying amounts, categorised by the earlier of contractual re-pricing or maturity dates. Insurance liabilities are categorised by their expected maturities.
Interest exposure – December 31, 2020
(in US $millions)
Less than
1 year1 to 5 years
After 5 years
Not exposed
to interest Total
Other insurance liabilities 13.7 4.1 66.5 150.4 234.7
Investment contract liabilities 366.9 46.7 23.9 0.1 437.6
Notes and loans payable 15.3 445.7 9.9 0.7 471.6
Lease liabilities 7.7 20.5 10.3 1.1 39.6
Other funding instruments 352.3 20.3 15.7 0.2 388.5
Customer deposits 845.3 14.9 - 1.4 861.6
Securities sold for re-purchase 573.5 - - 2.1 575.6
Bank overdrafts 1.0 - - - 1.0
Accounts payable and accrued liabilities 0.8 1.1 - 248.5 250.4
Total 2,176.5 553.3 126.3 404.5 3,260.6

117Interest exposure – December 31, 2019
(in US $millions)
Less than
1 year1 to 5 years
After 5 years
Not exposed
to interest Total
Other insurance liabilities 8.1 3.9 49.3 166.6 227.9
Investment contract liabilities 346.2 60.4 17.7 0.1 424.4
Notes and loans payable 419.6 27.1 71.5 (0.4) 517.8
Lease liabilities 6.5 19.0 4.2 5.9 35.6
Other funding instruments 395.4 9.8 12.6 0.2 418.0
Customer deposits 804.9 0.2 - 3.0 808.1
Structured products 6.8 - - - 6.8
Securities sold for re-purchase 511.3 - - 1.5 512.8
Derivative liabilities - - - 0.3 0.3
Bank overdrafts 6.6 - - - 6.6
Accounts payable and accrued liabilities 1.1 1.1 - 238.2 240.4
Total 2,506.5 121.5 155.3 415.4 3,198.7
The tables following summarise the exposures to interest rate and reinvestment risks of the Group’s monetary insurance and financial assets, for the years ended December 31, 2020 and 2019. Assets are stated at carrying amounts, categorised by the earlier of contractual re-pricing or maturity dates. Reinsurance assets and policy loans are categorised by their expected maturities.
Interest exposure – December 31, 2020
(in US $millions)
Less than
1 year1 to 5 years
After 5 years
Not exposed
to interest Total
Debt securities 787.8 889.1 3,472.8 80.6 5,230.3
Equity securities - - - 660.6 660.6
Mortgage loans 93.7 65.8 256.4 3.4 419.3
Policy loans 3.9 13.4 127.8 5.9 151.0
Finance loans 528.9 15.3 6.2 5.0 555.4
Securities purchased for
re-sale 57.0 - - 0.1 57.1
Deposits 125.4 2.1 - 0.2 127.7
Derivative assets - - - 37.2 37.2
Reinsurance assets: other - - 0.2 48.9 49.1
Premiums receivable - - - 59.8 59.8
Other assets and receivables 0.9 1.1 - 77.4 79.4
Cash resources 84.2 - - 355.4 439.6
Total 1,681.8 986.8 3,863.4 1,334.5 7,866.5

118Interest exposure – December 31, 2019
(in US $millions)
Less than
1 year1 to 5 years
After 5 years
Not exposed
to interest Total
Debt securities 1,308.2 727.1 2,969.8 60.2 5,065.3
Equity securities - - - 371.5 371.5
Mortgage loans 77.7 30.3 281.2 2.3 391.5
Policy loans 4.4 14.1 131.8 1.2 151.5
Finance loans 572.4 15.6 5.7 1.6 595.3
Securities purchased for
re-sale 10.9 - - - 10.9
Deposits 57.9 2.7 1.8 0.3 62.7
Derivative assets 0.3 - - 36.6 36.9
Reinsurance assets: other 0.2 - 0.2 37.3 37.7
Premiums receivable 0.1 - - 57.5 57.6
Other assets and receivables 2.8 1.2 - 74.5 78.5
Cash resources 220.5 - - 141.0 361.5
Total 2,255.4 791.0 3,390.5 784.0 7,220.9
4. Liquidity risk
Liquidity risk is inherent in much of the Group’s business. Liquidity risk is risk stemming from a lack of marketability in Sagicor’s assets. Some liabilities may be surrendered at the call of the contract-holder, while some assets have low liquidity such as mortgage loans and real estate. In order to manage liquidity risks, the Group seeks to maintain levels of cash and short-term deposits in each of its operating currencies that can meet expected short-term obligations.
The Group is exposed to daily demands on its available cash resources for payment of policy benefits and withdrawals, operating expenses and taxes, loan drawdowns, repayment of borrowings, maturing deposit liabilities and other security obligations. The Group maintains cash resources to meet what it predicts it will have to pay as policy benefits. Demands on its cash resources may exceed the Group’s projections.
The Group diversifies its liability portfolio by limiting concentrations of liabilities in each market segment. Where practical, given the Group’s operating environment, Sagicor seeks to match maturities of assets and liabilities while
maintaining a portfolio of short-term, highly liquid securities to meet funding gaps. The Group monitors its daily, weekly and monthly liquidity risk and manages its maturing asset and liability portfolios.
The Group purchases custom options (hedges) that are selected to materially replicate the policy benefits that are associated with the equity indexed components of certain of its products. These options are appropriate to reduce or minimise the risk of movements in the equity market (market risk). The hedging transactions are accounted for as call options and are originally valued at the premium paid, with the statement carrying value being adjusted to fair value. To minimise potential counterparty risk from the purchase of these customised contracts from broker dealers, the Group only transacts with banks and brokers carrying an unsecured debt rating of at least A or P-1 by either Standard and Poor’s or Moody’s.
The Group’s monetary insurance liabilities mature in periods which are summarised in the following tables for the years ended December 31, 2020 and 2019. Amounts are stated at their carrying values recognised in the financial statements and are analysed by their expected due periods, which have been estimated by actuarial or other statistical methods.
December 31, 2020 Expected discounted cash flows
(in US $millions)
Maturing within 1 year
Maturing 1 to 5 Years
Maturing after
5 years Total
Actuarial liabilities 323.1 1,251.5 2,578.1 4,152.7
Other insurance liabilities 149.4 18.1 67.2 234.7
Total 472.5 1,269.6 2,645.3 4,387.4
December 31, 2019 Expected discounted cash flows
(in US $millions)
Maturing within 1 year
Maturing 1 to 5 Years
Maturing after
5 years Total
Actuarial liabilities 260.0 1,004.3 2,340.3 3,604.6
Other insurance liabilities 127.1 30.5 70.3 227.9
Total 387.1 1,034.8 2,410.6 3,832.5
Contractual cash flow obligations of the Group in respect of its financial liabilities and commitments are summarised in the following table. Amounts are analysed by their earliest contractual maturity dates and consist of the contractual

119un-discounted cash flows. Where the interest rate of an instrument for a future period has not been determined as of the date of the financial statements, it is assumed that the interest rate then prevailing continues until final maturity.
December 31, 2020 Contractual un-discounted cash flows
(in US $millions)
On demand
or within 1 year
1 to 5 years
After 5 years Total
Financial liabilities:
Investment contracts 372.3 56.5 21.1 449.9
Notes and loans payable 23.5 480.3 11.1 514.9
Lease liabilities 9.5 24.8 22.3 56.6
Other funding instruments 355.1 38.8 24.3 418.2
Customer deposits 852.8 17.1 - 869.9
Structured products - - - -
Securities sold for re-purchase 578.0 - - 578.0
Derivative liabilities - - - -
Bank overdrafts 1.0 - - 1.0
Accounts payable & accrued liabilities 248.2 1.9 0.4 250.5
Total liabilities 2,440.4 619.4 79.2 3,139.0
Off balance sheet commitments:
Loan commitments 63.8 0.3 0.6 64.7
Non-cancellable lease and rental payments 0.4 - - 0.4
Customer guarantees and letters of credit 20.1 5.4 9.6 35.1
Investments and Investment management fees 32.5 2.3 - 34.8
Capital commitments 15.3 - - 15.3
Total commitments 132.1 8.0 10.2 150.3
Total 2,572.5 627.4 89.4 3,289.3
December 31, 2019 Contractual un-discounted cash flows
(in US $millions)
On demand
or within 1 year
1 to 5 years
After 5 years Total
Financial liabilities:
Investment contracts 347.9 66.5 22.2 436.6
Notes and loans payable 445.9 45.3 68.3 559.5
Lease liabilities 8.3 25.6 13.2 47.1
Other funding instruments 397.1 14.1 19.9 431.1
Customer deposits 815.4 0.3 - 815.7
Structured products 6.8 - - 6.8
Securities sold for
re-purchase 514.6 - - 514.6
Derivative liabilities 0.3 - - 0.3
Bank overdrafts 6.6 - - 6.6
Accounts payable & accrued liabilities 238.6 1.3 0.4 240.3
Total liabilities 2,781.5 153.1 124.0 3,058.6
Off balance sheet commitments:
Loan commitments 66.6 11.0 1.1 78.7
Non-cancellable lease and rental payments 0.5 - - 0.5
Customer guarantees and letters of credit 14.4 9.0 11.4 34.8
Investments and Investment management fees 14.3 4.8 - 19.1
Capital commitments 17.9 - - 17.9
Total commitments 113.7 24.8 12.5 151.0
Total 2,895.2 177.9 136.5 3,209.6

120The contractual maturity periods of monetary financial assets and the expected maturity periods of monetary insurance assets are summarised in the following tables for the years ended December 31, 2020 and 2019. Amounts are stated at their carrying values recognised in the financial statements. For this table, monetary insurance assets comprise policy loans and reinsurance assets.
December 31, 2020 Contractual discounted or expected cash flows
(in US $millions)
Maturing within 1 year
Maturing 1 to 5 Years
Maturing after
5 years Total
Financial assets:
Debt securities 699.7 944.7 3,585.9 5,230.3
Mortgage loans 24.1 72.3 322.9 419.3
Policy loans 4.6 13.8 132.7 151.1
Finance loans and finance leases 161.0 207.2 187.2 555.4
Securities purchased for re-sale 57.1 - - 57.1
Deposits 127.6 0.2 - 127.8
Derivative assets 37.2 - - 37.2
Reinsurance assets: share of actuarial liabilities 67.2 291.1 281.4 639.7
Reinsurance assets: other 48.9 - 0.2 49.1
Premiums receivable 59.8 - - 59.8
Other assets and receivables 76.9 2.0 0.5 79.4
Cash resources 439.6 - - 439.6
Total 1,803.7 1,531.3 4,510.8 7,845.8
December 31, 2019 Contractual discounted or expected cash flows
(in US $millions)
Maturing within 1 year
Maturing 1 to 5 Years
Maturing after
5 years Total
Financial assets:
Debt securities 1,166.9 774.1 3,124.2 5,065.2
Mortgage loans 21.2 39.0 331.4 391.6
Policy loans 5.3 14.3 131.9 151.5
Finance loans and finance leases 184.4 286.6 124.3 595.3
Securities purchased for re-sale 10.9 - - 10.9
Deposits 58.3 2.7 1.8 62.8
Derivative assets 36.9 - - 36.9
Reinsurance assets: share of actuarial liabilities 70.6 279.5 311.7 661.8
Reinsurance assets: other 37.4 - 0.2 37.6
Premiums receivable 57.6 - - 57.6
Other assets and receivables 75.9 2.1 0.5 78.5
Cash resources 361.5 - - 361.5
Total 2,086.9 1,398.3 4,026.0 7,511.2
5. Insurance product design and pricing risk
Product design and pricing risk arises from poorly designed or inadequately priced contracts and can lead to both financial loss and reputational damage to the Group. In the discussion below, the term insurer refers to the Group subsidiary issuing insurance contracts.
Risks are priced to achieve an adequate return on capital on the insurer’s business. In determining the pricing of an insurance contract, the insurer considers the nature and amount of the risk assumed, and recent experience and industry statistics of the benefits payable. Pricing inadequacy may arise either from the use of inadequate experience and statistical data in deriving pricing factors, from insurance market softening conditions, or from future changes in the economic environment.
The underwriting process has established pricing guidelines; and may include specific enquiries which determine the insurer’s assessment of the risk. Insurers may also establish deductibles and coverage limits for property, casualty and

121health risks which will limit the potential claims incurred. The pricing of a contract therefore consists of establishing appropriate premium rates, deductibles and coverage limits. For long-term insurance contracts, Sagicor assesses the future cash flows attributable to the contract.
Sagicor carries significant underwriting risks concentrated in certain countries within the Caribbean, namely Antigua, Barbados, Cayman Islands, Curacao, Jamaica, St. Lucia and Trinidad and Tobago. In these countries, Sagicor insures a substantial proportion of the insured population (life, annuity, health).
6. Insurance claims risk
a) Life, annuity and health contracts
The principal claims risks for these contracts are mortality, longevity and morbidity risk. For long-term contracts, principal risks affecting claims and benefits also include lapse, expense and investment risk.
For long-term contracts in force, Sagicor invests in assets with cash flow characteristics that closely match the cash flow characteristics of the related policy liabilities. The primary purpose of this matching is to seek to ensure that cash flows from these assets are synchronised with the timing and the amounts of payments that must be paid to policyholders.
Policy benefits payable under long-term contracts may be triggered by an insurable event (such as a death, disability or critical illness claim) a specified time (such as for an annuity settlement or a policy maturity) or on the exercise of a surrender or withdrawal request by the policyholder. While settlement of these benefits is therefore expected over the remaining lives of the insureds and annuitants, Sagicor remains subject to uncertainty related to the timing of future benefit cash outflows.
For long-term insurance contracts, significant risks arise from mortality and morbidity experience. Worsening mortality and morbidity will increase the incidence of death and disability claims. Improving mortality (i.e. longevity) will lengthen the pay-out period of annuities.
Policy benefits payable under short-term contracts are generally triggered by an insurable event, i.e., a medical expense or a death claim. Settlement of these benefits is expected generally within a short period.
For Sagicor’s health insurance contracts, significant risk exposures arise from mortality and morbidity experience.
b) Property and casualty contracts
Claims payable under property and casualty contracts are triggered by an insurable event and may be categorised as:
• attritional losses, which are expected to be of reasonable frequency and are less than established threshold amounts;
• large losses, which are expected to be relatively infrequent and are greater than established threshold amounts;
• catastrophic losses, which are an aggregation of losses arising from one incident or proximate cause, affecting one or more classes of insurance. These losses are infrequent and are generally very substantial.
The insurer records claims based on submissions made by claimants. The insurer may also obtain additional information from loss adjustors, medical reports and other specialist sources. The initial claim recorded may only be an estimate, which is refined over time until final settlement occurs. In addition, from the pricing methodology used for risks, it is assumed that at any date, there are claims incurred but not reported (IBNR).
Claims risk is the risk that incurred claims may exceed expected losses. Claims risk may arise from
• invalid or fraudulent claim submissions;• the frequency of incurred claims;• the severity of incurred claims;• the development of incurred claims.
Claims risk may be concentrated in geographic locations, altering the risk profile of the insurer. The most significant exposure for this type of risk arises where a single event could result in very many claims. Concentration of risk is mitigated through risk selection, line sizes, event limits, quota share reinsurance and excess of loss reinsurance. The Group takes reinsurance cover to mitigate the geographic concentrations of its property risks.
7. Reinsurance risk
To limit Sagicor’s loss exposure on insurance policies, Sagicor may cede some risk to reinsurers that have well-established capability to meet their contractual obligations and that generally have high credit ratings, which ratings Sagicor monitors, or Sagicor requires that a trust account be maintained as collateral for the obligations.
Under reinsurance contracts, the Group retains some part of the risk (amounts below the “retention limit”) and coverage in excess of these limits is ceded

122to reinsurers. The retention programs used are summarised in notes 42.3 and 43.3 of the annual financial statements. Sagicor also maintains catastrophic reinsurance coverage whereby reinsurance coverage is obtained for multiple claims arising from one event or occurring within a specified time period.
8. Fiduciary risk
Sagicor provides investment management, insurance and pension administration, and corporate trust services to corporate customers. Investment management services requires the Group to make allocation, purchase and sale decisions in relation to a wide range of investments on behalf of these corporate customers. These services may expose Sagicor to claims for maladministration or underperformance of these investments. As of December 31, 2020, the Group administered US $3,520.7 million in assets on behalf of these corporate customers.

1237. ADDITIONAL FINANCIAL INFORMATION
1. Derivative Financial Instruments
The Group’s derivative activities give rise to open positions in portfolios of derivatives. These positions are managed to seek to ensure that they remain within acceptable risk levels, with matching deals being utilised to achieve this where necessary. When entering into derivative transactions, the Group employs its credit risk management procedures to assess and approve potential credit exposures.
Derivatives are carried at fair value and presented in the financial statements as separate assets and liabilities. Asset values represent the cost to the Group of replacing all transactions with a fair value in the Group’s favour assuming that all relevant counterparties default at the same time, and that transactions can be replaced instantaneously. Liability values represent the cost to the Group counterparties of replacing all their transactions with the Group with a fair value in their favour if the Group were to default. The contract or notional amounts of derivatives and their fair values are set out in the following table.
(in US $millions)Contract/ notional
Fair Value
Asset Liability
December 31, 2020:
Equity indexed options 756.6 37.2 -
December 31, 2019:
Equity indexed options 807.0 36.9 0.3
The Group has purchased equity indexed options in respect of structured products and in respect of life and annuity insurance contracts.
For certain structured product contracts with customers (note 17 of the 2020 annual financial statements), equity indexed options give the holder the ability to participate in the upward movement of an equity index while being protected from downward risk.
For certain universal life and annuity insurance contracts, an insurer has purchased custom call options that are selected to materially replicate the policy benefits that are associated with the equity indexed components within the policy contract. These options are appropriate to reduce or minimise the risk of movements in specific equity markets. Both the asset and the associated actuarial liability are valued at fair market value on a consistent basis, with
the change in values being reflected in the income statement. The valuations combine external valuations with internal calculations.
2. Related Party Transactions
Note 47 of the annual financial statements provides additional information on related party transactions.
Developments during the reporting period
COVID-19 Pandemic
On March 11, 2020, the World Health Organisation declared the emergence of COVID-19 coronavirus, a global pandemic. This pandemic has affected many countries and all levels of society and has affected our economic environment in significant ways. The COVID-19 situation continues to evolve and many of the markets in which Sagicor operates have implemented public health safety protocols. At various stages during the year, most Caribbean countries have shut down air and sea traffic. Similar procedures have also been applied in the United States, Canada and elsewhere. The COVID-19 pandemic has caused significant economic and financial turmoil and uncertainty, both in the U.S. and around the world, and has fuelled concerns that have led to a global recession.
The pandemic has also caused a contraction in the economies in which the Group operates. The spread of the virus, which resulted in widespread travel restrictions and cancellations, has had a significant, negative effect on global travel and the demand for entertainment and related products offered in key markets in which the Group holds investments. Declines in global demand for oil and gas impacted prices and also constrained the Group’s customers.
Investment portfolios have been impacted by the widening of credit spreads which resulted in significant fall-off in asset prices, causing significant reduction in investment income and portfolio management fee income. While international markets have largely recovered, those in the Caribbean remain depressed. Income has also been negatively affected by waivers and reduction of fees associated with loans, in addition to the decline in loan volumes due to contraction in economic activity.
The Group, on recognising that certain of its customers were experiencing financial difficulties, offered extensions of moratoriums, payment deferrals and other accommodative measures to several clients on a case by case basis. By offering some reprieve in these areas, the Group noted positive effects on the delinquency levels of its borrowing and insurance portfolios. Despite these measures, the Group has made significant adjustments to ECLs to recognise the

124increased credit risk associated with the fall-out in relation to its borrowing and investment portfolios, driven by the downturn in the economy.
In response to the changing, and increasingly uncertain, economic environment, the Sagicor Group has performed reviews and updated its assumptions, including those related to asset impairment, where necessary. Changes in the economic outlook data have been reported in note 41.3 on credit risk and impairment. As part of this process, goodwill was reviewed, and stress testing was performed on assessment assumptions. As a result of this exercise, goodwill has been impaired relating to the subsidiary, Sagicor General Insurance Inc (note 8.2 of the 2020 annual financial statements). Impairment related to the investment in Playa is detailed in note 6.2 of the 2020 annual financial statements and the Group has revalued downwards certain of its hotel properties. Management considered the potential impact of the pandemic on actuarial reserves but concluded that it had not had a significant impact on actuarial assumptions and the valuation of actuarial liabilities of the Group.
The Group continues to monitor the health crisis and the economic impact on its investments, actuarial reserves, customer and trading partners, and the effect on the industries in which it operates. While global vaccination programmes should allow the world, and more particularly the markets in which the Group operates, to gradually return to normal, this will take time. As a result, the pandemic may continue to negatively impact levels of new business and the level of policyholder lapses and surrenders, as well as loan and credit card delinquencies.
Share buyback programme
During the year, the Company repurchased 2,942,500 shares, at a total cost of US $13.1 million, which were subsequently cancelled. Share capital and share premium in equity have been reduced by the cost of the shares repurchased and commission paid on the transactions. The premium paid on the repurchase of shares has been recorded in retained earnings.
The cost of shares totaling US $0.006 million, which were repurchased at the year-end date but not cancelled, has been reflected in treasury shares.
Investment in Associate - Playa Hotels and Resorts
Changes in Subsidiary and Associate Holdings
On June 12, 2020, in addition to entering into certain financing transactions to support its ongoing operations, Playa sold 4,878,049 ordinary shares at a price of $20 million which resulted in a 0.6% dilution of Sagicor Group Jamaica Limited’s 15.4% shareholding, and ultimately the Sagicor Group’s ownership interest of 15.4%, in Playa.
On June 15, 2020, Sagicor Financial Corporation Limited, the intermediate parent company of SGJ, acquired a further 1,500,000 shares of Playa by a series of purchases, at a weighted average price of $3.9676 per share, for a total of $5,966.4 including commissions paid. This represented an increase of 1.1% in the Group’s shareholding, bringing the Group’s total shareholding in Playa to 16%.
The transactions gave rise to a net loss of $2.7 million on dilution of the shareholding (deemed disposal), and negative goodwill of $1.5 million on the acquisition of additional shares, as follows:
(i) Deemed disposal of 0.6% holding in associate:
The Group’s share of the carrying value of the investment in Playa on its balance sheet as at June 30, 2020 was compared to its share of the proceeds of $20 million received by Playa and adjusted for recycling of net unrealised foreign exchange gains and unrealised interest rate swap losses in OCI to income.

125(in US $millions) 2020
Group’s share of proceeds received by Playa on issuance of shares 3.0
Share of carrying value of investment in Playa as an associate on the balance sheet of SGJ as at June 30, 2020 (6.1)
(3.1)
Net unrealised gains recycled to income 0.4
Loss on deemed disposal of 0.6% holding in associate (2.7)
(ii) Acquisition of 1.1% holding in associate:
The Group compared its share of the net identifiable assets and liabilities of Playa, at fair value, to the purchase price paid. The resulting negative goodwill has been recorded in these financial statements.
(in US $millions) 2020
Share of net assets acquired 7.5
Purchase consideration (6.0)
Negative goodwill arising on acquisition 1.5
Negative goodwill arose as Playa’s shares have been trading below the company’s book value per share in response to depressed share prices which occurred as the hotel industry has been severely impacted by the effects of COVID-19 coronavirus on tour and hotel bookings, given widespread travel restrictions and cancellations.
Impairment
Following the emergence of COVID-19 coronavirus, which was declared a global pandemic by the World Health organisation on March 11, 2020, the Group considered that travel restrictions, the impact on tour and holiday bookings and cancellations have resulted in a downturn in revenues and profits, thereby negatively impacting the carrying value of this asset.
Assessments of the carrying value of this investment have been performed at each quarter end. A recoverable value was determined using the value-in-use method which is a discounted cash flow technique that utilises a significant amount of judgement in estimating key variables such as earnings before interest, taxes, depreciation and amortisation (EBITDA), terminal growth rates and a discount factor. Value-in-use calculations are very sensitive to changes in these estimates. In arriving at its estimates for EBITDA, management also considered the impact of the uncertainty surrounding the COVID-19 coronavirus and its impact on the tourism sector going forward. As a result of this exercise, the investment was written down by US $31.8 million as at the year-end date.
Reinsurance Agreement
During the year, Sagicor Reinsurance Bermuda Limited (“SRBL”), the Bermuda reinsurance subsidiary of Sagicor Financial Corporation Limited, executed a reinsurance arrangement with Sagicor Life Insurance Company (“SLIC”) through a segregated account of SRBL (see note 39 to the 2020 Annual Financial Statements). Through this arrangement, SLIC transferred the insurance risks associated with certain life products, and financial instruments supporting those liabilities, to SRBL for a ceding commission. This ceding commission will be used to continue the growth of business in the USA.
Commitments
Effective June 25, 2020, the Group entered into a letter of credit arrangement with a facility up to the amount of US $40 million, whereby an irrevocable standby letter of credit was issued on behalf of Sagicor Reinsurance Bermuda Ltd (SRBL) in favour of Sagicor Life Insurance Company (SLIC), USA, in support of a coinsurance agreement between the two parties (note 4(d)) to the 2020 Annual Financial Statements. The letter of credit facility is guaranteed by Sagicor Financial Corporation Limited and SRBL. It is due to expire on June 26, 2021 and is deemed to be automatically extended for one-year periods, subject to notice of the intention to terminate the facility being given sixty days prior to an expiration date.

126The Group is required to comply with the following covenant in respect of the facility:
COVENANT DESCRIPTION
Cash Collateralisation Event
(Under this requirement, the Group must fully collateralise the facility if the noted conditions are breached.)
The Group must maintain an aggregate MCCSR of at least 175% at the end of any fiscal quarter.
The Group must maintain a Fixed Charge Coverage Ratio, at the end of any fiscal quarter, of an excess of 2.00 to 1.00.
The ratio of Consolidated Total Indebtedness to Consolidated Total Capitalisation, at the end of any fiscal quarter, must not exceed 0.35 to 1.00.
The credit rating of the Group must not fall below a specific predetermined level.
The aggregate amount of unrestricted cash and cash equivalents held with the Bank, at any time, should not be less than US $25 million.
Event of Default Upon an Event of Default, the Bank may declare the obligations due and payable.
Subsequent Events
I. On January 15, 2021, Sagicor Group Jamaica (SGJ) completed the disposal of its 14.9% equity interest (20,000,000 ordinary shares) in Playa Hotels and Resorts for a net cash consideration of US $96 million. The sale of shares took place in a public offering of 11,499,000 ordinary shares held by the Group, concurrent to an underwritten public offering of 25,000,000 new shares by Playa Hotels and Resorts at a public offering price of US $5.00 per share. These transactions were simultaneous with an assignment of an additional 8,501,000 ordinary shares in Playa Hotels and Resorts held by SGJ to Sagicor Financial Corporation Limited, for cash consideration,
at a price equal to the price offered through the public offering, less commission expenses associated with the public offering.
Following this transaction, Sagicor Financial Corporation Limited holds 10,001,000 shares directly in Playa Hotels and Resorts and the Group’s reduced interest in Playa will result in the investment being designated as a FVTPL investment.
II. Subsequent to the year end, the Board of Directors of Sagicor Financial Company Ltd. approved and declared a quarterly dividend of US $0.05625 per common share payable on April 21, 2021 to the shareholders of record at the close of business on March 31, 2021.

1278. HISTORICAL FINANCIAL DISCLOSURES
The following table provides a summary of Sagicor’s results from continuing operations for the five most recently completed years.
In US $millions, unless otherwise noted 2020 2019 20182017
Restated 2016
Net premium revenue 1,403.4 1,241.5 1,054.1 745.6 664.0
Net investment and other income 475.0 625.8 332.5 463.2 464.7
Total revenue 1,878.4 1,867.3 1,386.6 1,208.8 1,128.7
Benefits and expenses (1,782.8) (1,663.6) (1,260.4) (1,095.8) (984.5)
Other (68.0) 3.0 20.3 12.1 5.4
Income before tax 27.6 206.7 146.5 125.1 149.6
Income tax (42.7) (59.7) (50.7) (19.3) (41.7)
Net (loss)/income before listing expense and other transaction costs (15.1) 147.0 95.8 105.8 107.9
Listing expense and other transaction costs - (43.4) - - -
Net (loss)/income (15.1) 103.6 95.8 105.8 107.9
Net (loss)/income attributable to common shareholders (3.6) 44.0 36.5 62.3 60.3
Basic EPS before listing expense and other transaction costs N/A ¢ 114.3¢ N/A N/A N/A
Basic EPS (a) (2.4 ¢) 57.5¢ 51.7¢ 88.7 ¢ 84.4¢
Diluted EPS before listing expense and other transaction costs N/A ¢ 107.5¢ N/A N/A N/A
Diluted EPS(a) (2.4 ¢) 54.1¢ 50.8¢ 86.6 ¢ 80.9¢
Annualised return on common shareholders’ equity before listing expense and other transaction costs N/A 14.0% N/A N/A N/A
Annualised return on common shareholders’ equity (0.3%) 6.8% 6.2% 11.3% 12.3%
Dividends paid per common share 22.5¢ 5.0 ¢ 5.0 ¢ 5.0 ¢ 4.5 ¢
Total assets 9,266.3 8,728.9 7,308.2 6,804.5 6,531.9
Total equity attributable to common shareholders 1,109.8 1,154.1 600.9 624.6 536.1

1288. HISTORICAL FINANCIAL DISCLOSURES, CONTINUED
In US $millions, unless otherwise noted 2020 2019 20182017
Restated 2016
Net income attributable to common shareholders by operating segment:
Sagicor Life 47.7 60.9 39.6 64.7 64.8
Sagicor Jamaica 50.5 61.4 55.7 46.6 44.3
Sagicor Life USA (27.1) 35.4 18.3 13.3 10.5
Head office, other & inter-segment eliminations (74.7) (113.7) (77.1) (62.3) (59.3)
Net income attributable to common shareholders (3.6) 44.0 36.5 62.3 60.3
Net income attributable to common shareholders before listing expense and other transaction costs (3.6) 87.4 36.5 62.3 60.3
Restatements of the Financial Statements (2017)
Effective January 1, 2018 the Group implemented a policy to harmonise its actuarial reserving practices across operational segments. This voluntary change in policy was reflected as a prior period adjustment in accordance with IAS 8. In addition, a detailed review of Sagicor USA’s actuarial model was completed and concluded that the model inputs were generally appropriate; however, certain items which were identified were treated as errors and prior periods were adjusted accordingly. These adjustments required a restatement for the 2017 financial year and impacted the Statement of Financial Position, Statement of Income and Statement of Comprehensive Income.
The information above in respect of the year 2016, has not been restated to include the prior year adjustments applied retrospectively to January 1, 2017. Management does not believe these adjustments are material to impact the ability of the users of the financial information, to assess the performance and/or the financial position of the Group. Effective January 1, 2018, the Group adopted IFRS 9 - Financial Instruments (IFRS 9). As a result of the application of the standard, the Group adopted new accounting policies for financial assets. As permitted by the transition provisions in IFRS 9, the Group elected not to restate comparative period results. Accordingly, the 2017 comparative information on financial assets is presented in accordance with IAS 39 – Financial Instruments – Recognition and Measurement. Adjustments to the carrying amounts of financial instruments as of January 1, 2018 were recognised in the statement of changes in equity.
Further, as allowed, on adoption of IFRS 15 – Revenue from Contracts with Customers, on January 1, 2018, comparative figures in prior years, have not been adjusted. On January 1, 2019, the Group adopted IFRS 16 – Leases using the modified retrospective method with no restatement of comparative information as allowed by the standard.

129Stronger Together | 2020 Annual Report
CONSOLIDATED FINANCIAL STATEMENTS

INDEX TO THE CONSOLIDATED FINANCIAL STATEMENTS
Appointed Actuary’s Report 132
Independent Auditor’s Report 133
Consolidated Statements of Financial Position 137
Consolidated Statements of Income 138
Consolidated Statements of Comprehensive Income 139
Consolidated Statements of Changes in Equity 140
Consolidated Statements of Cash Flows 142
Notes to the Consolidated Financial Statements
1 General Information 143
2 Accounting Policies 145
3 Critical Accounting Estimates and Judgements 172
4 Segments 176
5 Investment Property 187
6 Associates and Joint Ventures 188
7 Property, Plant and Equipment 195
8 Intangible Assets 196
9 Financial Investments 199
10 Reinsurance Assets 201
11 Income Tax Assets 201
12 Miscellaneous Assets and Receivables 201
13 Actuarial Liabilities 202
14 Other Policy Liabilities 205
15 Investment Contract Liabilities 206
16 Notes and Loans Payable 206
17 Deposit and Security Liabilities 208
18 Other Liabilities / Retirement Benefit Liabilities 209
19 Income Tax Liabilities 209
20 Accounts Payable and Accrued Liabilities 209
21 Common Shares 210
22 Reserves 212
23 Participating Accounts 214
24 Premium Revenue 214
25 Policy Benefits & Change in Actuarial Liabilities 214
26 Net Investment Income 215
27 Fees and Other Revenue 216
28 Interest and Finance Costs 217
29 Employee Costs 217
30 Equity Compensation Benefits 218
31 Employee Retirement Benefits 222
32 Income Taxes 228
33 Deferred Income Taxes 229
34 Earnings per Common Share 231
35 Other Comprehensive Income (OCI) 232
36 Cash Flows 233
37 Changes in Subsidiary and Associate Holdings 235
38 Discontinued Operation 238
39 Contingent Liabilities 238
40 Fair Value of Property 240
41 Financial Risk 240
42 Insurance Risk - Property & Casualty Contracts 289
43 Insurance Risk - Life, Annuity & Health Contracts 294
44 Fiduciary Risk 299
45 Statutory Restrictions on Assets 299
46 Capital Management 300
47 Related Party Transactions 305
48 Lease Liabilities 306
49 Developments during the Year 306
50 Subsequent Events 307
130

ACRONYMS
Certain acronyms have been used throughout the financial statements and notes thereto to substitute phrases.
The more frequent acronyms and associated phrases are set out below.
Acronym PhraseAA Appointed ActuaryEAD Exposure at DefaultECL Expected Credit LossesFVOCI Fair Value through Other Comprehensive IncomeFVTPL Fair Value through Profit and LossIAS International Accounting StandardsIASB International Accounting Standards BoardIFRS International Financial Reporting StandardsIFRS 9 International Financial Reporting Standard No.9 – Financial InstrumentsIFRS 16 International Financial Reporting Standard No.16 – LeasesLGD Loss Given DefaultMCCSR Minimum Continuing Capital and Surplus RequirementOCI Other Comprehensive IncomePD Probability of DefaultPOCI Purchased or Originated Credit-ImpairedSICR Significant Increase in Credit RiskSPPI Solely Payments of Principal and Interest
131

ACTUARY’S REPORT
132

AUDITOR’S REPORT
133

AUDITOR’S REPORT
134

AUDITOR’S REPORT
135

AUDITOR’S REPORT
136

4
Note 2020 2019
ASSETS Investment property 5 78,295 95,577 Property, plant and equipment 7 266,569 289,870
Associates and joint ventures 6 165,791 230,558
Intangible assets 8 95,872 106,864
Financial investments 9 6,626,839 6,080,758
Financial investments repledged 9 611,730 604,886
Reinsurance assets 10 715,739 724,237
Income tax assets 11 26,330 26,594
Miscellaneous assets and receivables 12 239,538 208,059 Cash 359,972 273,072 Restricted cash 79,638 88,396
Total assets 9,266,313 8,728,871
These financial statements have been approved for issue by the Board of Directors on March 30, 2021.
……………………………………………… ……………………………………………… Director Director
Note 2020 2019
LIABILITIES Actuarial liabilities 13 4,152,701 3,604,653 Other policy liabilities 14 292,676 286,960 Investment contract liabilities 15 437,604 424,340 Total policy liabilities 4,882,981 4,315,953 Notes and loans payable 16 471,622 517,732 Lease liabilities 48 39,609 35,700 Deposit and security liabilities 17 1,826,759 1,752,689 Other liabilities / retirement benefit liabilities 18 66,542 59,795 Income tax liabilities 19 65,128 56,889 Accounts payable and accrued liabilities 20 255,462 240,333
Total liabilities 7,608,103 6,979,091
EQUITY Share capital 21 1,463 1,477 Share premium 21 753,490 762,015 Reserves 22 (14,868) (9,023) Retained earnings 369,695 399,582
Total shareholders’ equity 1,109,780 1,154,051 Participating accounts 23 1,607 1,223 Non-controlling interests 4.4 546,823 594,506
Total equity 1,658,210 1,749,780
Total liabilities and equity 9,266,313 8,728,871
CONSOLIDATED STATEMENTS OF FINANCIAL POSITION SAGICOR FINANCIAL COMPANY Ltd. (formerly Sagicor Financial Corporation Limited) As of December 31, 2020 and December 31, 2019 Amounts expressed in US $000
137

5
Note 2020 2019
REVENUE Premium revenue 24 1,501,952 1,323,252 Reinsurance premium expense 24 (98,525) (81,708) Net premium revenue 1,403,427 1,241,544 Gain on derecognition of amortised cost investments 8,889 12,920 Gain on derecognition of assets carried at FVOCI 20,169 29,954 Interest income earned from financial assets measured at amortised cost and FVOCI 26 314,759 308,014 Other investment income 26 16,144 111,800 Credit impairment losses (23,997) (4,877) Fees and other revenue 27 138,976 167,971 Total revenue, net 1,878,367 1,867,326
BENEFITS Policy benefits and change in actuarial liabilities 25 1,269,184 1,169,640 Policy benefits and change in actuarial liabilities reinsured 25 (90,418) (107,308) Net policy benefits and change in actuarial liabilities 1,178,766 1,062,332 Interest costs 28.1 42,893 54,192 Total benefits 1,221,659 1,116,524
EXPENSES Administrative expenses 340,567 333,236 Commissions and related compensation 121,158 120,155 Premium and asset taxes 14,914 14,560 Finance costs 28.2 44,885 43,633 Depreciation and amortisation 39,559 35,506 Listing expense and other transaction costs 1 - 43,396Total expenses 561,083 590,486
Note 2020 2019 OTHER Loss arising on business combinations, acquisitions and divestitures
37 (1,262) (379)
Share of operating (loss) / income of associates and joint ventures
6.1 (34,957) 3,347
Loss on impairment of investment in associates and joint ventures
6.1 (31,804) -
Total other (loss) / income (68,023) 2,968 INCOME BEFORE TAXES FROM CONTINUING OPERATIONS
27,602 163,284
Income taxes 32 (42,732) (59,710) NET (LOSS) / INCOME FROM CONTINUING OPERATIONS
(15,130) 103,574
Net income from discontinued operation 38 - 517NET (LOSS) / INCOME FOR THE YEAR (15,130) 104,091 Net (loss) / income is attributable to: Common shareholders:
From continuing operations (3,605) 43,981 From discontinued operation - 517
(3,605) 44,498 Participating policyholders 1,359 (1,937) Non-controlling interests 4.1 (12,884) 61,530
(15,130) 104,091 Basic earnings per common share: 34
From continuing operations (2.4) cents 57.5 cents From discontinued operation 0.0 cents 0.7 cents
(2.4) cents 58.2 cents Fully diluted earnings per common share: 34
From continuing operations (2.4) cents 54.1 cents From discontinued operation 0.0 cents 0.6 cents
(2.4) cents 54.7 cents
CONSOLIDATED STATEMENTS OF INCOME SAGICOR FINANCIAL COMPANY Ltd. (formerly Sagicor Financial Corporation Limited)Year ended December 31, 2020 and December 31, 2019 Amounts expressed in US $000
138

6
OTHER COMPREHENSIVE INCOME Note 2020 2019
Items net of tax that may be reclassified subsequently to income:
35
Financial assets measured at FVOCI:
Gains on revaluation 97,266 168,707 Gains transferred to income (16,567) (20,374)
Net change in actuarial liabilities (51,973) (94,999)
Cash flow hedges (753) (3,086)
Retranslation of foreign currency operations (38,195) (16,641)
Other reserves (20) (126)
(10,242) 33,481
Items net of tax that will not be reclassified subsequently to income:
35
Losses on revaluation of owner-occupied and owner-managed property
(14,880) (971)
(Losses) / gains on equity securities designated at FVOCI (149) 18
Gains on defined benefit plans 3,474 11,198
(11,555) 10,245
OTHER COMPREHENSIVE (LOSS) / INCOME FROM CONTINUING OPERATIONS
(21,797) 43,726
TOTAL COMPREHENSIVE INCOME 2020 2019
Net (loss) / income (15,130) 104,091
Other comprehensive (loss) / income (21,797) 43,726
TOTAL COMPREHENSIVE (LOSS) / INCOME FOR THE YEAR
(36,927) 147,817
Total comprehensive (loss) / income is attributable to:
Common shareholders:
From continuing operations (3,045) 80,671
From discontinued operation - 517
(3,045) 81,188
Participating policyholders 577 (2,655)
Non-controlling interests (34,459) 69,284
(36,927) 147,817
CONSOLIDATED STATEMENTS OF COMPREHENSIVE INCOME SAGICOR FINANCIAL COMPANY Ltd. (formerly Sagicor Financial Corporation Limited)Year ended December 31, 2020 and December 31, 2019 Amounts expressed in US $000
139

7
Share Capital (note 21)
Share Premium (note 21)
Reserves (note 22)
Retained Earnings
Total Shareholders’
Equity
Participating
Accounts (note 23)
Non-controlling Interests
Total Equity
2020
Balance, December 31, 2019 1,477 762,015 (9,023) 399,582 1,154,051 1,223 594,506 1,749,780
Total comprehensive income from continuing operations - - (2,779) (266) (3,045) 577 (34,459) (36,927)
Transactions with holders of equity instruments:
Allotment of common shares 15 6,848 - - 6,863 - - 6,863
Repurchase of shares (note 21) (29) (15,367) - 2,095 (13,301) - - (13,301)
Movements in treasury shares - (6) - - (6) - - (6)
Changes in reserve for equity compensation benefits - - (3,921) 42 (3,879) - 64 (3,815)
Dividends declared (note 21) - - - (33,243) (33,243) - (13,664) (46,907)
Changes in ownership interest in subsidiaries - - - (70) (70) - (251) (321)
Acquisition/disposal of subsidiary and insurance business - - - - - - (108) (108)
Transfers and other movements - - 855 1,555 2,410 (193) 735 2,952
Balance, December 31, 2020 1,463 753,490 (14,868) 369,695 1,109,780 1,607 546,823 1,658,210
CONSOLIDATED STATEMENTS OF CHANGES IN EQUITY SAGICOR FINANCIAL COMPANY Ltd. (formerly Sagicor Financial Corporation Limited)Year ended December 31, 2020 and December 31, 2019 Amounts expressed in US $000
140

8
Share Capital (note 21)
Share Premium (note 21)
Reserves (note 22)
Retained Earnings
Total Shareholders’
Equity
Participating
Accounts (note 23)
Non-controlling Interests
Total Equity
2019
Balance, December 31, 2018 3,061 300,665 (76,995) 374,138 600,869 4,078 530,514 1,135,461
Total comprehensive income from continuing operations - - 28,030 52,641 80,671 (2,655) 69,284 147,300
Total comprehensive income from discontinued operation - - - 517 517 - - 517
Transactions with holders of equity instruments:
Exchange of shares (note 1) (2,270) 2,270 - - - - - -
Repurchase of shares (note 1) (116) (19,930) - - (20,046) - - (20,046)
New share issue (note 1) 798 478,818 - - 479,616 - - 479,616
Movements in treasury shares 4 192 - - 196 - - 196
Allocated to warrant reserve - - 20,062 - 20,062 - - 20,062
Changes in reserve for equity compensation benefits - - 9,187 (938) 8,249 - 24 8,273
Dividends declared (note 21) - - - (15,316) (15,316) - (21,539) (36,855)
Acquisition/disposal of subsidiary and insurance business - - - - - - 17,070 17,070
Transfers and other movements - - 10,693 (11,460) (767) (200) (847) (1,814)
Balance, December 31, 2019 1,477 762,015 (9,023) 399,582 1,154,051 1,223 594,506 1,749,780
CONSOLIDATED STATEMENTS OF CHANGES IN EQUITY SAGICOR FINANCIAL COMPANY Ltd. (formerly Sagicor Financial Corporation Limited)Year ended December 31, 2020 and December 31, 2019 Amounts expressed in US $000
141

9
Note 2020 2019
OPERATING ACTIVITIES
Income before taxes from continuing operations 27,602 163,284
Adjustments for non-cash items, interest and dividends 36.1 371,057 172,204
Interest and dividends received 329,337 318,564
Interest paid (84,672) (95,332)
Income taxes paid (39,610) (53,060)
Net change in investments and operating assets 36.1 (876,462) (582,684)
Net change in operating liabilities 36.1 173,640 118,499
Net cash flows - operating activities (99,108) 41,475
INVESTING ACTIVITIES
Property, plant and equipment, net 36.2 (14,993) (7,493)
Associates and joint ventures (5,951) -
Dividends received from associates and joint ventures 708 640
Purchase of intangible assets (3,840) (4,738) Changes in subsidiary holdings, net of cash and cash equivalents
(320) (32,779)
Net cash flows - investing activities (24,396) (44,370)
Note 2020 2019
FINANCING ACTIVITIES
Allotment of common shares - 474,906
Repurchase of common shares (13,301) (20,046)
Purchase of treasury shares (6) (371)
Redemption of preference shares (6) -
Shares issued to / (purchased from) non-controlling interests
455 (1,562)
Notes and loans payable, net 36.3 (41,269) 31,695
Lease liability principal paid 36.4 (5,697) (4,225)
Dividends paid to common shareholders (33,279) (15,003)
Dividends paid to preference shareholders (1) -
Dividends paid to non-controlling interests (5,746) (21,539)
Net cash flows - financing activities (98,850) 443,855
Effects of exchange rate changes (5,782) (4,933)
NET CHANGE IN CASH AND CASH EQUIVALENTS -CONTINUING OPERATIONS
(228,136) 436,027
Net change in cash and cash equivalents – discontinued operation
- 17,756
Cash and cash equivalents, beginning of year 775,344 321,561
CASH AND CASH EQUIVALENTS, END OF YEAR 36.5 547,208 775,344
CONSOLIDATED STATEMENTS OF CASH FLOWS SAGICOR FINANCIAL COMPANY Ltd. (formerly Sagicor Financial Corporation Limited)Year ended December 31, 2020 and December 31, 2019 Amounts expressed in US $000
142

10
1 GENERAL INFORMATION
Sagicor Financial Company Ltd. (TSX: SFC, "Sagicor" or the “Company”) is a leading financial services provider in the Caribbean, with over 180 years of history. SFC’s registered office is located at Clarendon House, 2 Church Street, Hamilton, HM 11, Bermuda, with its principal office located at Cecil F De Caires Building, Wildey, St. Michael, Barbados.
On November 27, 2018, Sagicor Financial Corporation Limited ("SFCL") entered into a definitive arrangement agreement as amended on January 28, 2019 with Alignvest Acquisition II Corporation (“Alignvest”), a special purpose acquisition company ("SPAC"), pursuant to which on December 5, 2019, Alignvest acquired all of the issued and outstanding shares of SFCL by way of an Ontario court approved plan of arrangement and a Bermuda court approved scheme of arrangement (the “Arrangement”). On closing, Alignvest changed its name to Sagicor Financial Company Ltd., whose operations continue as SFC, and owns 100% of the shares in the capital of SFCL.
As part of this transaction, subject to certain limitations, each of SFCL’s eligible previous shareholders (excluding the Company’s management team and continuing directors, all of whom elected to roll 100% of their equity into this transaction) had the option of tendering up to 10,000 shares for $1.75 of cash, up to a total cash share purchase of $205,000 less certain other amounts, as per the Arrangement. SFCL common shares not purchased for cash were exchanged for common shares of Sagicor on an exchange ratio of one Sagicor common share for 4.328 of SFCL common shares (“Exchange Ratio”).
On closing of the transaction, 11,548,327 common shares of SFCL were tendered for purchase by the previous shareholders of SFCL. Sagicor purchased 11,548,327 common shares of SFCL for total cash consideration of $20,046 and the remaining 295,007,317 common shares of SFCL were exchanged for 67,992,191 common shares of Sagicor in accordance with the Arrangement.
1 GENERAL INFORMATION (continued)
On closing, the common shares and warrants of Sagicor were listed on the Toronto Stock Exchange and are traded under the symbols “SFC” and “SFC.WT”, respectively. With a listing on the Toronto Stock Exchange, SFCL’s common shares, formerly listed on the Barbados Stock Exchange, the Trinidad and Tobago Stock Exchange and the London Stock Exchange, have ceased trading and are being delisted from these exchanges.
While Alignvest is the legal acquirer of SFCL, SFCL has been identified as the acquirer for accounting purposes. As Alignvest does not meet the definition of a business as defined in IFRS 3 - Business Combinations (“IFRS 3”), the acquisition is not within the scope of IFRS 3 and is accounted for as a share-based payment transaction in accordance with IFRS 2 – Share-based Payments (“IFRS 2”). These consolidated financial statements represent the continuance of SFCL and reflect the identifiable assets acquired and the liabilities assumed of Alignvest at fair value. Under IFRS 2, the transaction was measured at the fair value of the common shares, escrowed shares and warrants deemed to have been issued by SFCL, in order for the ownership interest in the combined entity to be the same as if the transaction had taken the legal form of SFCL acquiring 100% of Alignvest. Any difference between the fair value of the common shares, escrowed shares and warrants deemed to have been issued by SFCL and the fair value of Alignvest’s identifiable net assets acquired and liabilities assumed represents a listing expense.
As a result of this reverse asset acquisition, a listing expense of $18,777 has been recorded to reflect the difference between the estimated fair value of the common shares, escrowed shares and warrants deemed issued to the shareholders of Alignvest and the net fair value of the assets of Alignvest acquired. Transaction-related expenses of $24,619 were expensed as incurred. Transaction-related expenses were comprised of professional fees of $6,279, cash bonus and other contract benefits paid to executives of $2,736, common shares issued to executives of $5,994, arranger’s fee of $8,585 and other costs of $1,025.
Notes to the Financial Statements SAGICOR FINANCIAL COMPANY Ltd. (formerly Sagicor Financial Corporation Limited)Year ended December 31, 2020 and December 31, 2019 Amounts expressed in US $000
143

11
1 GENERAL INFORMATION (continued)
The details of the listing expense and transaction-related expenses are as follows:
The fair value of the consideration transferred to acquire Alignvest, under reverse takeover accounting, was $493,683 calculated as 72,433,368 common shares at $6.19 per common share, 6,444,877 escrowed common shares with fair value of $3.93 per escrowed common share and 34,774,993 warrants with fair value of $0.58 per warrant.
The fair value per common share was based on the fair value of SFCL common shares.
The fair value of escrowed common shares was determined using a probability-weighted model with an estimated fair value per common share of $6.19 resulting in total fair value of $25,328.
The fair value of warrants was determined based on the market closing price of $0.58 per warrant.
As a result of the closing of this transaction, 147,838,907 common shares of the Company were issued and outstanding immediately after the closing. At December 31, 2020, 146,381,394 common shares were outstanding.
1 GENERAL INFORMATION (continued)
Sagicor and its subsidiaries (“the Group”) operate across the Caribbean and in the United States of America (USA). There was a discontinued operation in the United Kingdom. Details of Sagicor’s holdings and operations are set out in notes 4 and 38.
The principal activities of the Sagicor Group are as follows: • Life and health insurance,• Annuities and pension administration services,• Banking and investment management services,
and its principal operating companies are as follows: • Sagicor Life Inc (Barbados and Trinidad & Tobago),• Sagicor Life Jamaica Limited (Jamaica),• Sagicor Bank Jamaica Limited (Jamaica),• Sagicor Life Insurance Company (USA).
The Group also underwrites property and casualty insurance and provides hospitality services.
For ease of reference, when the term “insurer” is used in the following notes, it refers to either one or more Group subsidiaries that engages in insurance activities.
These consolidated financial statements for the year ended December 31, 2020 have been approved by the Board of Directors on March 30, 2021. Neither the Company’s owners nor others have the power to amend the financial statements after issue.
2019 Fair Value of consideration transferred: Common shares Escrowed common shares Warrants Total fair value of consideration transferred
Fair value of net assets acquired and shares repurchased: Cash Cash for the repurchase of shares Total fair value of net assets acquired and shares repurchased
Listing expense Transaction-related expenses
Listing expense and other transaction costs
448,293 25,328 20,062
493,683
454,860 20,046
474,906
18,777 24,619 43,396
Notes to the Financial Statements SAGICOR FINANCIAL COMPANY Ltd. (formerly Sagicor Financial Corporation Limited)Year ended December 31, 2020 and December 31, 2019 Amounts expressed in US $000
144

12
2 ACCOUNTING POLICIES
The principal accounting policies adopted in the preparation of these consolidated financial statements are set out below. These policies have been consistently applied to the years presented, unless otherwise stated.
2.1 Basis of preparation
These consolidated financial statements are prepared in accordance with, and comply with, International Financial Reporting Standards (IFRS).
The Group has adopted accounting policies for the computation of actuarial liabilities of life insurance and annuity contracts using approaches consistent with the principles of the Canadian standards of practice. As no specific guidance is provided by IFRS for computing actuarial liabilities, management has judged that the Canadian standards of practice should continue to be applied. The adoption of IFRS 4 – Insurance Contracts, permits the Group to continue with this accounting policy, with the modification required by IFRS 4 that rights under reinsurance contracts are measured separately.
The consolidated financial statements are prepared under the historical cost convention except as modified by the revaluation of investment property, owner-occupied property, financial assets carried at fair value through other comprehensive income, financial asset and liabilities held at fair value through income, discontinued operations, actuarial liabilities and associated reinsurance assets.
The preparation of financial statements in conformity with IFRS requires the use of certain critical accounting estimates. It also requires management to exercise its judgement in the process of applying the Group’s accounting policies. The areas involving a higher degree of judgement or complexity, or areas when assumptions and estimates are significant to the consolidated financial statements, are disclosed in note 3.
All amounts in these financial statements are shown in thousands of United States dollars, unless otherwise stated.
2.1 Basis of preparation (continued)
Amendments to existing IFRS and IAS effective January 1, 2020
The Group has adopted the amendments to IFRS and IAS set out in the following tables. None of these amendments have a material effect on the Group’s financial statements.
Standard Description of amendment
IFRS 3 – Definition of a Business
This amendment revises the definition of a business. According to feedback received by the IASB, application of the current guidance is commonly thought to be too complex, and it results in too many transactions qualifying as business combinations.
IAS 1 and IAS 8 – The Definition of Material
These amendments to IAS 1, ‘Presentation of financial statements’, and IAS 8, ‘Accounting policies, changes in accounting estimates and errors’, and consequential amendments to other IFRSs: i) use a consistent definition of materiality throughout IFRSs and the Conceptual Framework for Financial Reporting; ii) clarify the explanation of the definition of material; and iii) incorporate some of the guidance is IAS 1 about immaterial information.
IFRS 9, IAS 39 and IFRS 7 – Interest Rate Benchmark Reform
These amendments provide certain reliefs in connection with interest rate benchmark reform. The reliefs relate to hedge accounting and have the effect that IBOR reform should not generally cause hedge accounting to terminate. However, any hedge ineffectiveness should continue to be recorded in the income statement. Given the pervasive nature of hedges involving IBOR-based contracts, the reliefs will affect companies in all industries.
Notes to the Financial Statements SAGICOR FINANCIAL COMPANY Ltd. (formerly Sagicor Financial Corporation Limited)Year ended December 31, 2020 and December 31, 2019 Amounts expressed in US $000
145

13
2.1 Basis of preparation (continued)
Amendments to existing IFRS and IAS effective January 1, 2020 (continued)
2.2 Basis of consolidation
(a) Subsidiaries
Subsidiaries are entities over which the Group has control. The Group has control over an entity when the Group is exposed to the variable returns from its ownership interest in the entity and when the Group can affect those returns through its power over the entity. Subsidiaries are consolidated from the date on which control is transferred to the Group, and subsidiaries are de-consolidated from the date on which control ceases.
All material intra-group balances, transactions and gains are eliminated on consolidation. Accounting policies of subsidiaries have been changed where necessary to ensure consistency with the accounting policies adopted by the Group.
The Group uses the acquisition method of accounting when control over entities and insurance businesses is obtained by the Group. The cost of an acquisition is measured as the fair value of the identifiable assets given, the equity instruments issued, and the liabilities incurred or assumed at the date of exchange. Identifiable assets acquired, and liabilities and contingent liabilities assumed in a business combination are measured initially at their fair values at the acquisition date irrespective of the extent of any non-controlling interest. Acquisition-related costs are expensed as incurred.
The excess of the cost of the acquisition, the non-controlling interest recognised and the fair value of any previously held equity interest in the acquiree, over the fair value of the net identifiable assets acquired is recorded as goodwill. If there is no excess and there is a shortfall, the Group reassesses the net identifiable assets acquired. If after reassessment, a shortfall remains, the acquisition is deemed to be a bargain purchase and the shortfall is recognised in income as a gain on acquisition.
Subsequent ownership changes in a subsidiary, without loss of control, are accounted for as transactions between owners in the statement of changes in equity.
Standard Description of amendment
Conceptual Framework for Financial Reporting
The Conceptual Framework was revised because important issues were not addressed, and some indications were outdated or unclear. This revised version includes, among other things, a new chapter on valuation, guidance on the presentation of financial performance and improved definitions of an asset and a liability and guidance in support of those definitions. The Conceptual Framework helps entities to develop their accounting method when no IFRS is applicable to a specific situation.
Notes to the Financial Statements SAGICOR FINANCIAL COMPANY Ltd. (formerly Sagicor Financial Corporation Limited)Year ended December 31, 2020 and December 31, 2019 Amounts expressed in US $000
146

14
2.2 Basis of consolidation (continued)
Non-controlling interest balances represent the equity in a subsidiary not attributable to Sagicor’s interest.
On an acquisition by acquisition basis, the Group recognises, at the date of acquisition, the components of any non-controlling interest in the acquiree either at fair value or at the proportionate share of the acquiree’s net identifiable assets. The latter option is only available if the non-controlling interest component is entitled to a proportionate share of net identifiable assets of the acquiree in the event of liquidation. For certain components of non-controlling interests, other IFRS may override the fair value option.
Non-controlling interest balances are subsequently re-measured by the non-controlling’s proportionate share of changes in equity after the date of acquisition.
(b) Discontinued operation
In December 2012, the Group agreed to sell Sagicor Europe Limited, its subsidiary Sagicor at Lloyd's Limited and its interest in Lloyd's of London syndicate 1206. The decision to sell resulted in the closure of the Sagicor Europe operating segment and therefore met the criteria of a discontinued operation. The sale was concluded in December 2013.
(c) Sale of subsidiaries
On the sale of or loss of control of a subsidiary, the Group derecognises the related assets, liabilities, non-controlling interest and associated goodwill of the subsidiary. The Group reclassifies its share of balances of the subsidiary previously recognised in other comprehensive income either to income or to retained earnings as appropriate. The gain (or loss) on sale recorded in income is the excess (or shortfall) of the fair value of the consideration received over the derecognised and reclassified balances.
2.2 Basis of consolidation (continued)
(d) Associates and joint ventures
The investments in associated companies, which are not majority-owned or controlled but where significant influence exists, are included in these consolidated financial statements under the equity method of accounting. Investments in companies are accounted for as associates in instances when significant influence exists even though the shareholding may be less than 20%.
Investments in associate and joint venture companies are originally recorded at cost and include intangible assets identified on acquisition.
Accounting policies of associates and joint ventures have been adjusted where necessary to ensure consistency with the accounting policies adopted by the Group. Assets of certain associates include significant proportions of investment property and financial instruments invested in investment property which are carried at fair value in accordance with the valuation procedures outlined in note 2.5.
The Group recognises in income its share of associate and joint venture companies’ post-acquisition income and its share of the amortisation and impairment of intangible assets which were identified on acquisition. Unrealised gains or losses on transactions between the Group and its associates and joint ventures are eliminated to the extent of the Group’s interest.
The Group recognises in other comprehensive income, its share of post-acquisition other comprehensive income. The Group recognises an impairment of its net investment in an associate or a joint venture when there is objective evidence that the carrying amount exceeds its recoverable amount. The recoverable amount is the higher of the associate’s or joint venture’s fair value less costs to sell and its value in use.
Notes to the Financial Statements SAGICOR FINANCIAL COMPANY Ltd. (formerly Sagicor Financial Corporation Limited)Year ended December 31, 2020 and December 31, 2019 Amounts expressed in US $000
147

15
2.2 Basis of consolidation (continued)
(e) Pension and investment funds
Insurers have issued deposit administration and unit linked contracts in which the full return of the assets supporting these contracts accrues directly to the contract-holders. As these contracts are not operated under separate legal trusts, they have been consolidated in these financial statements.
The Group manages segregated pension funds, mutual funds and unit trusts. These funds are segregated and investment returns on these funds accrue directly to unitholders. Consequently, the assets, liabilities and activity of these funds are not included in these consolidated financial statements unless the Group has a significant holding in the fund. Where a significant holding exists, the Group either consolidates the assets, liabilities and activity of the fund and accounts for any non-controlling interest as a financial liability or accounts for the fund as an associate.
(f) Employees share ownership plan (ESOP)
The Company has established an ESOP Trust, which either acquires Company shares on the open market, or is allotted new shares by the Company. The Trust holds the shares on behalf of employees until the employees’ retirement or termination from the Group. Until distribution to employees, shares held by the Trust are accounted for as treasury shares. All dividends received by the Trust are applied towards the future purchase of Company shares.
2.3 Foreign currency translation
(a) Functional and presentational currency
Items included in the financial statements of each reporting unit of the Group are measured using the currency of the primary economic environment in which the entity operates (the functional currency). A reporting unit may be an individual subsidiary, a branch of a subsidiary or an intermediate holding company group of subsidiaries.
The consolidated financial statements are presented in thousands of United States dollars, which is the Group’s presentational currency.
(b) Reporting units
The results and financial position of reporting units that have a functional currency other than the Group’s presentational currency are translated as follows: (i) Income, other comprehensive income, movements in equity and cash flows are translated at average exchange rates for the year. (ii) Assets and liabilities are translated at the exchange rates ruling on December 31. (iii) Resulting exchange differences are recognised in other comprehensive income.
Currencies which are pegged to the United States dollar are converted at the pegged rates. Currencies which float are converted to the United States dollar by reference to the average of buying and selling rates quoted by the respective central banks. Exchange rates of the other principal operating currencies to the United States dollar are set out in the following table.
2020 closing 2020 average 2019 closing 2019 average
Barbados dollar 2.0000 2.0000 2.0000 2.0000
Eastern Caribbean dollar 2.7000 2.7000 2.7000 2.7000
Jamaica dollar 142.4534 141.7506 132.5324 132.8772
Trinidad & Tobago dollar 6.7612 6.7462 6.7624 6.7510
Notes to the Financial Statements SAGICOR FINANCIAL COMPANY Ltd. (formerly Sagicor Financial Corporation Limited)Year ended December 31, 2020 and December 31, 2019 Amounts expressed in US $000
148

16
2.3 Foreign currency translation (continued)
On consolidation, exchange differences arising from the translation of the net investment in foreign entities are recorded in other comprehensive income. On the disposal or loss of control of a foreign entity, such exchange differences are transferred to income.
Goodwill and other intangible assets recognised on the acquisition of a foreign entity are treated as assets of the foreign entity and translated at the rate ruling on December 31.
(c) Transactions and balances
Foreign currency transactions are translated into the functional currency at the exchange rates prevailing at the dates of the transactions. Foreign exchange gains and losses, which result from the settlement of foreign currency transactions and from the retranslation of monetary assets and liabilities denominated in foreign currencies, are recognised in the income statement. Non-monetary assets and liabilities, primarily deferred policy acquisition costs and unearned premiums, are maintained at the transaction rates of exchange.
The foregoing exchange gains and losses which are recognised in the income statement are included in other revenue.
Exchange differences on the retranslation of the fair value of non-monetary items such as equities held at fair value through income are reported as part of the fair value gain or loss. Exchange differences on the retranslation of the fair value of non-monetary items such as equities held as FVOCI are reported as part of the fair value gain or loss in other comprehensive income.
2.4 Segments
Reportable operating segments have been defined in accordance with performance and resource allocation decisions of the Group’s Chief Executive Officer.
The
The
2.5 Investment property
Investment property consists of freehold lands and freehold properties which are held for rental income and/or capital appreciation. Investment property is recorded initially at cost. In subsequent financial years, investment property is recorded at fair values as determined by independent valuation, with the appreciation or depreciation in value being taken to investment income. Fair value represents the price (or estimates thereof) that would be agreed upon in an orderly transaction between market participants at the valuation date. Fair values are derived using the market value approach and the income capitalisation approach, which reference market-based evidence, using comparable prices adjusted for specific factors such as nature, location and condition of property.
Investment property includes property partially owned by the Group and held under joint operations with third parties for which the Group recognises its share of the joint operation's assets, liabilities, revenues, expenses and cash flows.
Transfers to or from investment property are recorded when there is a change in use of the property. Transfers to owner-occupied property or to real estate developed for resale are recorded at the fair value at the date of change in use. Transfers from owner-occupied property are recorded at their fair value and any difference with carrying value at the date of change in use is dealt with in accordance with note 2.6.
Investment property may include property of which a portion is held for rental to third parties and the other portion is occupied by the Group. In such circumstances, the property is accounted for as an investment property if the Group’s occupancy level is not significant in relation to the total available occupancy. Otherwise, it is accounted for as an owner-occupied property.
Rental income is recognised in accordance with note 2.10(a).
2.6 Property, plant and equipment
Property, plant and equipment are recorded initially at cost. Subsequent expenditure is capitalised when it will result in future economic benefits to the Group.
Notes to the Financial Statements SAGICOR FINANCIAL COMPANY Ltd. (formerly Sagicor Financial Corporation Limited)Year ended December 31, 2020 and December 31, 2019 Amounts expressed in US $000
149

17
2.6 Property, plant and equipment (continued)
Owner-occupied properties and owner-managed hotel properties are re-valued at least every three years to their fair value as determined by independent valuation. Fair value represents the price (or estimates thereof) that would be agreed upon in an orderly transaction between market participants at valuation date. Revaluation of a property may be conducted more frequently if circumstances indicate that a significant change in fair value has occurred. Movements in fair value are reported in other comprehensive income, unless there is a cumulative depreciation in respect of an individual property, which is then recorded in income. Accumulated depreciation at the date of revaluation is eliminated against the gross carrying amount of the asset.
Owner-occupied properties include property held under joint operations with third parties for which the Group recognises its share of the joint operation's assets, liabilities, revenues, expenses and cash flows. On the disposal of the property, the amount included in the fair value reserve is transferred to retained earnings.
The Group, as lessor, enters into operating leases with third parties to lease certain property, plant and equipment. Income from these activities is recognised in accordance with note 2.10(a) in accordance with IFRS 16 - Leases.
Depreciation is calculated on the straight-line method to write down the cost or fair value of property, plant and equipment to residual value over the estimated useful life. Estimated useful lives are reviewed annually and are as follows:
Lands are not depreciated.
2.6 Property, plant and equipment (continued)
An impairment loss is recognised for the amount by which an asset’s carrying amount exceeds its recoverable amount. The recoverable amount is the higher of an asset’s fair value less costs to sell and its value in use.
Gains or losses recognised in income on the disposal of property, plant and equipment are determined by comparing the net sale proceeds to the carrying value.
2.7 Intangible assets
(a) Goodwill
Goodwill (defined in note 2.2(a)) arising from an acquisition of a subsidiary or insurance business is allocated to appropriate cash generating units which are defined by the Group’s operating segments. Goodwill arising in a reportable operating segment is allocated to that segment. Goodwill arising in a Group entity, which is not within a reportable operating segment, is allocated to that entity’s own operations, or, if that entity is managed in conjunction with another Group entity, to their combined operations.
Goodwill arising from an investment in an associate is included in the carrying value of the investment.
Goodwill is tested annually for impairment and whenever there is an indication of impairment. Goodwill is carried at cost less accumulated impairment. An impairment loss is recognised for the amount by which the carrying amount of goodwill exceeds its recoverable amount. The recoverable amount is the higher of an operating segment's (or operation's) fair value less costs to sell and its value in use.
On the disposal of a subsidiary or insurance business, the associated goodwill is derecognised and is included in the gain or loss on disposal. On the disposal of a subsidiary or insurance business forming part of a reportable operating segment, the proportion of goodwill disposed is the proportion of the fair value of the asset disposed to the total fair value of the operating segment.
Asset Estimated useful life
Owner-occupied buildings 40 to 50 years
Owner-managed hotel buildings 40 to 50 years
Furnishings and leasehold improvements 2 to 10 years, or lease term
Computer and office equipment 1 to 10 years
Vehicles 4 to 5 years
Right-of-use assets 1.5 to 12 years
Notes to the Financial Statements SAGICOR FINANCIAL COMPANY Ltd. (formerly Sagicor Financial Corporation Limited)Year ended December 31, 2020 and December 31, 2019 Amounts expressed in US $000
150

18
2.7 Intangible assets (continued)
(b) Other intangible assets
Other intangible assets identified on acquisition are recognised only if future economic benefits attributable to the asset will flow to the Group and if the fair value of the asset can be measured reliably. In addition, for the purposes of recognition, the intangible asset must be separable from the business being acquired or must arise from contractual or legal rights. Intangible assets acquired in a business combination are initially recognised at their fair value.
Other intangible assets, which have been acquired directly, are recorded initially at cost.
On acquisition, the useful life of the asset is estimated. If the estimated useful life is definite, then the cost of the asset is amortised over its life, and the asset is tested for impairment when there is evidence of same. If the estimated useful life is indefinite, the asset is tested annually for impairment. An impairment loss is recognised for the amount by which the asset’s carrying amount exceeds its recoverable amount. The recoverable amount is the higher of an asset’s fair value less costs to sell and its value in use. The estimated useful lives of recognised intangible assets are as follows:
2.8 Real estate developed or held for resale
Lands being made ready for resale along with the cost of infrastructural works are classified as real estate held for resale and are stated at the lower of carrying value and fair value less costs to sell. Real estate acquired through foreclosure is classified as real estate held for resale and is stated at the lower of carrying value and fair value less costs to sell.
Gains and losses realised on the sale of real estate are included in revenue at the time of sale.
2.9 Financial investments
(a) Classification of financial assets
The Group utilises a principles-based approach to the classification of financial assets. Debt instruments, including hybrid contracts, are measured at fair value through profit or loss (“FVTPL”), fair value through other comprehensive income (“FVOCI”) or amortised cost based on the nature of the cash flows of these assets and the Group’s business model. Equity instruments are measured at FVTPL, unless they are not held for trading purposes, in which case an irrevocable election can be made on initial recognition to measure them at FVOCI with no subsequent reclassification to profit or loss.
Financial assets are measured on initial recognition at fair value and are classified as and subsequently measured either at amortised cost, at FVOCI or at FVTPL. Financial assets are recognised when the Group becomes a party to the contractual provision of the instrument. Regular way purchases and sales of financial assets are recognised on trade-date, the date on which the Group commits to purchase or sell the asset.
(b) Classification of debt instruments
Classification and subsequent measurement of debt instruments depend on: • the Group’s business model for managing the asset; and• the cash flow characteristics of the asset.
Based on these factors, the Group classifies its debt instruments into one of the following three measurement categories.
Measured at amortised cost
Debt instruments that are held to collect the contractual cash flows and that contain contractual terms that give rise on specified dates to cash flows that are solely payments of principal and interest, such as most loans and advances to banks and customers and some debt securities, are measured at amortised cost. In addition, most financial liabilities are measured at amortised cost. The carrying value of these financial assets at initial recognition includes any directly attributable transactions costs.
Class of intangible asset Asset Estimated useful lifereCustomer lationships - 20 5 years
Customer-related Broker relationships 10 yearsTrade Names 10 years
Contract-based Licences 15 yearsTechnology-based Software - 5 2 years
Notes to the Financial Statements SAGICOR FINANCIAL COMPANY Ltd. (formerly Sagicor Financial Corporation Limited)Year ended December 31, 2020 and December 31, 2019 Amounts expressed in US $000
151

19
2.9 Financial investments (continued)
Measured at fair value through other comprehensive income (FVOCI)
Debt instruments held for a business model that is achieved by both collecting contractual cash flows and selling and that contain contractual terms that give rise on specified dates to cash flows that are solely payments of principal and interest are measured at FVOCI. These comprise primarily debt securities and money market funds.
Measured at fair value through profit and loss (FVTPL)
Debt instruments are classified in this category if they meet one or more of the criteria set out below and are so designated irrevocably at inception: • the use of the designation removes or significantly reduces an accounting mismatch;• when the performance of a group of financial assets is evaluated on a fair value basis, in
accordance with a documented risk management or investment strategy;• when the debt instruments are held for trading and are acquired principally for the purpose of
selling in the short-term or if they form part of a portfolio of financial assets in which there is evidence of short-term profit-taking.
Business model assessment
Business models are determined at the level which best reflects how the Group manages portfolios of assets to achieve business objectives. Judgement is used in determining business models, which is supported by relevant, objective evidence including: • The nature of liabilities, if any, funding a portfolio of assets; • The nature of the market of the assets in the country of origination of a portfolio of assets;• How the Group intends to generate profits from holding a portfolio of assets;• The historical and future expectations of asset sales within a portfolio.
2.9 Financial investments (continued)
Solely payments of principal and interest (“SPPI”)
Where the business model is to hold assets to collect contractual cash flows or to collect contractual cash flows and sell, the Group assesses whether the financial instruments’ cash flows represent solely payments of principal and interest. In making this assessment, the Group considers whether the contractual cash flows are consistent with a basic lending arrangement. Where the contractual terms introduce exposure to risk or volatility that are inconsistent with a basic lending arrangement, the related financial assets are classified and measured at FVTPL.
(c) Unit linked funds fair value model
The Group’s liabilities include unit linked funds which are components of insurance contracts issued or unit linked investment contracts issued with terms that the full investment return earned on the backing assets accrue to the contract-holders. Where these liabilities are accounted for at FVTPL, the financial investments backing these liabilities are consequently classified as and measured at FVTPL. This is to eliminate any accounting mismatch.
(d) Impairment of financial assets measured at amortised cost and FVOCI
At initial recognition of a financial asset, allowance (or provision in the case of some loan commitments and financial guarantees) is required for Expected Credit Losses (ECL) resulting from default events that are possible within the next 12 months (or less, where the remaining life is less than 12 months) (’12-month ECL’).
Notes to the Financial Statements SAGICOR FINANCIAL COMPANY Ltd. (formerly Sagicor Financial Corporation Limited)Year ended December 31, 2020 and December 31, 2019 Amounts expressed in US $000
152

20
2.9 Financial investments (continued)
In the event of a significant increase in credit risk (SICR), an allowance (or provision) is required for ECL resulting from all possible default events over the expected life of the financial instrument (‘lifetime ECL’). Financial assets where 12-month ECL are recognised are defined as ‘Stage 1’; financial assets which are considered to have experienced a significant increase in credit risk are in ‘Stage 2’; and financial assets for which there is objective evidence of impairment are defined as being in default or otherwise credit-impaired are in ‘Stage 3’. Purchased or originated credit-impaired financial assets (“POCI”) are treated differently as set out below.
To determine whether the lifetime credit risk has increased significantly since initial recognition, the Group considers reasonable and supportable information that is available, including information from the past and forward-looking information. Factors, such as whether payments of principal and interest are in default, an adverse change in credit rating of the borrower and adverse changes in the borrower’s industry and economic environment, are considered in determining whether there has been a significant increase in the credit risk of the borrower.
(e) Purchased or originated credit-impaired assets (POCI)
Financial assets that are purchased or originated at a deep discount that reflects the incurred credit losses are considered to be POCI. These financial assets are credit-impaired on initial recognition. The Group calculates the credit-adjusted effective interest rate, which is calculated based on the fair value origination of the financial asset instead of its gross carrying amount and incorporates the impact of expected credit losses in estimated future cash flows. The ECL of these assets is always measured on a lifetime basis.
At each reporting date, the Group shall recognise in profit or loss the amount of the change in lifetime expected credit losses as an impairment gain or loss. The Group will recognise favourable changes in lifetime expected credit losses as an impairment gain, the gain occurs when the lifetime expected credit losses are less than the amount of expected credit losses that were included in the estimated cash flows on initial recognition.
2.9 Financial investments (continued)
(f) Definition of default
The Group determines that a financial instrument is credit-impaired and in Stage 3 by considering relevant objective evidence, primarily whether: • contractual payments of either principal or interest are past due for 90 days or more;• there are other indications that the borrower is unlikely to pay such as that a concession has been
granted to the borrower for economic or legal reasons relating to the borrower’s financial condition; and
• the financial asset is otherwise considered to be in default.If such unlikeliness to pay is not identified at an earlier stage, it is deemed to occur when an exposure is 90 days past due.
(g) Write-off
Financial assets (and the related impairment allowances) are normally written off, either partially or in full, when there is no realistic prospect of recovery. Where loans are secured, this is generally after receipt of any proceeds from the realisation of security. In circumstances where the net realisable value of any collateral has been determined and there is no reasonable expectation of further recovery, write-off may be earlier.
(h) The general approach to recognising and measuring ECL
The measurement of ECL reflects: • An unbiased and probability-weighted amount that is determined by evaluating a range of possible
outcomes;• The time value of money;• Reasonable and supportable information that is available without undue cost or effort, at the
reporting date, about past events, current conditions and forecasts of future economic conditions.
Notes to the Financial Statements SAGICOR FINANCIAL COMPANY Ltd. (formerly Sagicor Financial Corporation Limited)Year ended December 31, 2020 and December 31, 2019 Amounts expressed in US $000
153
21
2.9 Financial investments (continued)
Measurement
Expected credit losses are calculated by multiplying three main components, being the probability of default (“PD”), loss given default (“LGD”) and the exposure at default (“EAD”), discounted at the original effective interest rate. Management has calculated these inputs based on the historical experience of the portfolios adjusted for the current point in time. A simplified approach to calculating the ECL is applied to contract and other receivables which do not contain a significant financing component. Generally, these receivables are due within 12 months unless there are extenuating circumstances. Under this approach, an estimate is made of the lifetime ECL on initial recognition (i.e. Stage 3). For ECL provisions modelled on a collective basis, a grouping of exposures is performed on the basis of shared risk characteristics, such that risk exposures within a group are homogeneous.
The PD, LGD and EAD models which support these determinations are reviewed regularly in light of differences between loss estimates and actual loss experience; but given that IFRS 9 requirements have only been applied since January 1, 2018, the historical period for such review is limited. Therefore, the underlying models and their calibration, including how they react to forward-looking economic conditions, remain subject to review and refinement. This is particularly relevant for lifetime PDs, which have not been previously used in regulatory modelling, and for the incorporation of ‘downside scenarios’ which have not generally been subject to experience gained through stress testing. The exercise of judgement in making estimations requires the use of assumptions which are highly subjective and sensitive to the risk factors, and particularly to changes in economic and credit conditions across wide geographical areas. Many of the factors have a high degree of interdependency and there is no single factor to which loan impairment allowances are sensitive. Therefore, sensitivities are considered in relation to key portfolios which are particularly sensitive to a few factors and the results should not be further extrapolated.
The main difference between Stage 1 and Stage 2 expected credit losses is the respective PD horizon. Stage 1 estimates will use a maximum of a 12-month PD while Stage 2 estimates will use a lifetime PD. Stage 3 estimates will continue to leverage pre-January 1, 2018 processes for estimating losses on impaired loans; however, these processes will be updated as experience develops, including the requirement to consider multiple forward-looking scenarios. An expected credit loss estimate will be produced for each individual exposure, including amounts which are subject to a more simplified model for estimating expected credit losses.
2.9 Financial investments (continued)
The measurement of expected credit losses for each stage and the assessment of significant increases in credit risk must consider information about past events and current conditions as well as reasonable and supportable forecasts of future events and economic conditions. The estimation and application of forward-looking information will require significant judgment.
For a revolving commitment, the Group includes the current drawn balance plus any further amount that is expected to be drawn up to the current contractual limit by the time of default, should it occur.
For defaulted financial assets, based on management’s assessment of the borrower, a specific provision of expected lifetime losses which incorporates collateral recoveries, is calculated and recorded as the ECL. The resulting ECL is the difference between the carrying amount and the present value of expected cash flows discounted at the original effective interest rate.
Forward-looking information
The estimation and application of forward-looking information will require significant judgment. PD, LGD and EAD inputs used to estimate Stage 1 and Stage 2 credit loss allowances are modelled based on the macroeconomic variables (or changes in macroeconomic variables) that are most closely correlated with credit losses in the relevant portfolio.
Each macroeconomic scenario used in the expected credit loss calculation will have forecasts of the relevant macroeconomic variables – including, but not limited to, unemployment rates and gross domestic product, for a three-year period, subsequently reverting to long-run averages. Our estimation of expected credit losses in Stage 1 and Stage 2 will be a discounted probability-weighted estimate that considers a minimum of three future macroeconomic scenarios. Our base case scenario will be based on macroeconomic forecasts where available. Upside and downside scenarios will be set relative to our base case scenario based on reasonably possible alternative macroeconomic conditions.
Notes to the Financial Statements SAGICOR FINANCIAL COMPANY Ltd. (formerly Sagicor Financial Corporation Limited)Year ended December 31, 2020 and December 31, 2019 Amounts expressed in US $000
154

22
2.9 Financial investments (continued)
Scenario design, including the identification of additional downside scenarios will occur on at least an annual basis and more frequently if conditions warrant. Scenarios will be probability-weighted according to our best estimate of their relative likelihood based on historical frequency and current trends and conditions. Probability weights will be updated on a quarterly basis.
(i) Modification of loans
The Group sometimes renegotiates or otherwise modifies the contractual cash flows of loans to customers and debt instruments. When this happens, the Group assesses whether the new terms are substantially different from the original terms. The Group does this by considering, among others, the following factors: • If the borrower is in financial difficulty, whether the modification merely reduces the contractual
cash flow to amounts the borrower is expected to be able to pay.• Whether any substantial new terms are introduced, such as a profit-share/equity-based return
that substantially affects the risk profile of the loan.• Significant extension of the loan term when the borrower is not in financial difficulty. • Significant change in the interest rate. • Change in the currency in which the loan is denominated.• Insertion of collateral, other security or credit enhancements that significantly affect the credit
risk associated with the loan.
If the terms are substantially different, the Group derecognises the original financial investment and recognises a new investment at fair value and recalculates the new effective interest rate for the investment. The date of negotiation is consequently considered to the be the date of initial recognition for impairment calculation purposes and the purpose of determining if there has been a significant increase in credit risk.
(j) Reclassified balances
The Group reclassifies debt securities when and only where its business model for managing those investments changes. The reclassification takes place from the start of the first reporting period following the change. Such changes are expected to be very infrequent.
2.9 Financial investments (continued)
(k) Classification of equity instruments
The Group classifies and subsequently measures all equity investments at FVTPL, except where the Group’s management has elected, at initial recognition, to irrevocably designate an equity investment at FVOCI. The Group’s policy is to designate equity investments as FVOCI when those investments are held for purposes other than to generate investment returns.
(l) Embedded derivatives
The Group may hold debt securities and preferred equity securities which may contain embedded derivatives. The embedded derivative of a financial investment is classified in the same manner as the host contract.
(m) Presentation in the statements of income and other comprehensive income (OCI)
Financial instruments measured at FVTPL
Realised changes in fair value, unrealised changes in fair value, interest income and dividend income are included in other investment income.
Financial instruments at amortised cost
• Interest income is included in interest income earned from financial assets measured atamortised cost in the consolidated statement of income.
• Credit impairment losses are included in the consolidated statement of income.• Gain or loss on derecognition of debt securities is presented in the consolidated statement
of income.
Financial instruments measured at FVOCI
• Interest income is included in interest income earned from financial assets measured atFVOCI in the consolidated statement of income.
• Credit impairment losses are included in the consolidated statement of income.• Unrealised gains and losses arising from changes in fair value are presented in OCI.• On derecognition, the cumulative fair value gain or loss is transferred from OCI and is
presented in the consolidated statement of income.
Notes to the Financial Statements SAGICOR FINANCIAL COMPANY Ltd. (formerly Sagicor Financial Corporation Limited)Year ended December 31, 2020 and December 31, 2019 Amounts expressed in US $000
155

23
2.9 Financial investments (continued)
Equity securities measured at FVOCI
• Dividend income is included in other investment income.• Unrealised changes in fair value presented in OCI. Any impairment losses are included
with fair value changes.• On derecognition, the cumulative gain or loss in OCI remains in the fair value reserve
for FVOCI assets.
2.10 Leases
(a) Leases held as lessor
The Group holds finance leases with third parties to lease assets. Finance leases are leases in which the Group has transferred substantially the risks of ownership to the lessee. The finance lease, net of unearned finance income, is recorded as a receivable and the finance income is recognised over the term of the lease using the effective yield method. Impairment of finance lease receivables is measured in accordance with the requirements for amortised cost debt instruments.
The Group holds operating leases primarily for the rental of investment property and certain owner-occupied property. The Group recognises revenue from these activities on a straight-line basis or on another systematic basis if that basis is more representative of the pattern of use of the underlying asset.
(b) Leases held as lessee
At the inception of a rental contract for office space or a contract for the use of an asset, the Group assesses whether the contract contains a lease. A contract is, or contains, a lease if it conveys to the Group the right to control the use of the office space or asset for a time period in exchange for consideration. The Group has elected to use the exemption for lease periods with a term of 12 months or less, or those leases for which the underlying asset has a low value, in which case the lease payments are recognised in administrative expenses. Low value assets comprise IT equipment and small items of office furniture.
2.10 Leases (continued)
For a contract that contains a lease, the Group may account for the lease component separately from the non-lease component. As a practical expedient, the Group elected, by class of underlying asset, not to separate the non-lease and lease components, and instead account for the contract as a lease.
As of the date the asset is available for use by the Group (the commencement date), a right-of-use asset and a corresponding lease liability are recognised.
The cost of the right-of-use asset comprises:
(a) the amount of the initial measurement of the lease liability;(b) any lease payments made at or before the commencement date, less any lease incentives
received;(c) any initial direct costs incurred by the Group; and (d) restoration costs.
The Group recognises the costs described in paragraph (d) as part of the cost of the right-of-use asset when it incurs an obligation for those costs.
Right-of-use assets are presented within property, plant and equipment and are subsequently measured at cost less depreciation. Right-of-use assets are generally depreciated over the shorter of the asset's useful life and the lease term on a straight-line basis. If the Group is reasonably certain to exercise a purchase option, the right-of-use asset is depreciated over the underlying asset’s useful life.
At the commencement date, the Group measures the lease liability as the present value of the lease payments that are not paid at that date. The lease payments are discounted using the interest rate implicit in the lease, if that rate can be readily determined. If that rate cannot be readily determined, which is generally the case for leases in the Group, the lessee’s incremental borrowing rate is used, being the rate that the individual lessee would have to pay to borrow the funds necessary to obtain an asset of similar value to the right-of-use asset in a similar economic environment with similar terms, security and conditions.
Notes to the Financial Statements SAGICOR FINANCIAL COMPANY Ltd. (formerly Sagicor Financial Corporation Limited)Year ended December 31, 2020 and December 31, 2019 Amounts expressed in US $000
156

24
2.10 Leases (continued)
At the commencement date, the lease payments included in the measurement of the lease liability comprise the following payments for the right to use the underlying asset during the lease term that are not paid at the commencement date:
(a) fixed payments, less any lease incentives receivable;(b) amounts expected to be payable by the lessee under residual value guarantees; (c) payments of penalties for terminating the lease, if the lease term reflects the lessee exercising
an option to terminate the lease.
Extension and termination options are included in a number of property and equipment leases across the Group. These terms are used to maximise operational flexibility in terms of managing contracts. The extension and termination options need to be approved by the lessor. There are no variable lease payments and there were no residual value guarantees on leases.
Lease payments are allocated between principal and finance cost. The Group recognises interest on the lease liability in each accounting period during the lease term, which is the amount that produces a constant periodic rate of interest on the remaining balance of the lease liability.
After the commencement date, the lease liability is measured by:
(a) increasing the carrying amount to reflect interest on the lease liability;(b) reducing the carrying amount to reflect the principal portion of lease payments made; and (c) remeasuring the carrying amount to reflect reassessment or lease modifications, or to reflect
revised fixed lease payments.
Lease liabilities are included in lease liabilities in the statement of financial position. The associated interest is included in finance costs in the statement of income. Leases give rise to lease liability principal elements and interest elements in the statement of cash flows.
2.11 Financial liabilities
During the ordinary course of business, the Group issues investment contracts or otherwise assumes financial liabilities that expose the Group to financial risk.
Classification
Financial liabilities are measured at initial recognition at fair value and are classified as and subsequently measured either at amortised cost, or at fair value through profit and loss (FVTPL). Financial liabilities are recognised when the Group becomes a party to the contractual provision of the instrument.
Financial liabilities are derecognised when they are extinguished (i.e. when the obligation specified in the contract is discharged, cancelled or expires).
The financial liabilities described under the unit linked fair value model (note 2.9 (c)) are classified and measured at FVTPL as the Group is obligated to provide investment returns to the unit holder in direct proportion to the investment returns on a specific portfolio of assets, which are also carried at FVTPL. Derivative financial liabilities are carried at FVTPL (note 2.12). All other financial liabilities are carried at amortised cost. It is noted that the financial liabilities measured at FVTPL do not have a cumulative own credit adjustment gain or loss.
The recognition and measurement of the Group’s principal types of financial liabilities are disclosed in note 2.14(b) (vii) and in the following paragraphs.
(a) Securities sold for repurchase
Securities sold for repurchase are treated as collateralised financing transactions and are recorded at the amount at which the securities were sold. Securities sold subject to repurchase are not derecognised but are treated as pledged assets when the transferee has the right by contract or custom to sell or repledge the collateral. The difference between the sale and repurchase price is treated as interest and is accrued over the life of the agreements using the effective yield method.
The liability is extinguished when the obligation specified in the contract is discharged, assigned, cancelled or has expired.
Notes to the Financial Statements SAGICOR FINANCIAL COMPANY Ltd. (formerly Sagicor Financial Corporation Limited)Year ended December 31, 2020 and December 31, 2019 Amounts expressed in US $000
157

25
2.11 Financial liabilities (continued)
(b) Deposit liabilities
Deposits are recognised initially at fair value and are subsequently stated at amortised cost using the effective yield method.
(c) Loans and other debt obligations
Loans and other debt obligations are recognised initially at fair value, being their issue proceeds, net of transaction costs incurred. Subsequently, obligations are stated at amortised cost and any difference between net proceeds and the redemption value is recognised in the income statement over the period of the loan obligations using the effective yield method.
Obligations undertaken for the purposes of financing operations and capital support are classified as notes or loans payable. Loan obligations undertaken for the purposes of providing funds for on-lending, leasing or portfolio investments are classified as deposit and security liabilities.
(d) Fair value
Fair value amounts represent the price (or estimates thereof) that would be agreed upon in an orderly transaction between market participants at valuation date.
(e) Presentation in the statement of income
For notes and loans payable measured at amortised cost, the associated interest is included in finance costs.
For deposit and security liabilities measured at amortised cost, the associated interest expense is included within interest costs.
For financial liabilities measured at FVTPL, the associated interest and fair value changes are included within interest costs.
2.12 Derivative financial instruments and hedging activities
Derivatives are financial instruments that derive their value from the price of underlying items such as equities, bonds, interest rates, foreign exchange, credit spreads, commodities or other indices. Derivatives enable users to increase, reduce or alter exposure to credit or market risk. The Group transacts derivatives for three primary purposes: to create risk management solutions for customers, for proprietary trading purposes, and to manage its own exposure to credit and market risk.
Derivative financial instruments are initially recognised at fair value on the date a derivative contract is entered into, and subsequently are re-measured at their fair value at each financial statement date. The method of recognising the resulting gain or loss depends on whether the derivative is designated as a hedging instrument, and if so, the nature of the item being hedged. Fair values are obtained from quoted market prices, discounted cash flow models and option pricing models as appropriate.
The Group documents at the inception of the transaction the relationship between hedging instruments and hedged items, as well as risk management objectives and strategies for undertaking various hedging transactions. The Group also documents its assessments, both at hedge inception and on an ongoing basis, of whether the derivatives that are used in hedging transactions are highly effective in offsetting changes in fair values or cash flows of hedged items.
For cash flow hedges, gains and losses relating to the effective portion of changes in the fair value of derivatives are initially recognised in other comprehensive income; and are transferred to the statement of income when the forecast cash flows affect income. The gain or loss relating to the ineffective portion is recognised immediately in the statement of income.
Gains and losses from changes in the fair value of derivatives that do not qualify for hedge accounting are included in net investment income or interest expense.
2.13 Offsetting financial instruments
Financial assets and financial liabilities are offset and the net amount is reported in the statement of financial position when there is a legally enforceable right to offset and there is an intention to settle on a net basis or to realise the asset and settle the liability simultaneously.
Notes to the Financial Statements SAGICOR FINANCIAL COMPANY Ltd. (formerly Sagicor Financial Corporation Limited)Year ended December 31, 2020 and December 31, 2019 Amounts expressed in US $000
158
26
2.14 Policy contracts
(a) Classification
The Group issues policy contracts that transfer insurance risk and/or financial risk from the policyholder.
The Group defines insurance risk as an insured event that could cause an insurer to pay significant additional benefits in a scenario that has a discernible effect on the economics of the transaction.
Insurance contracts transfer insurance risk and may also transfer financial risk. Once a contract has been classified as an insurance contract, it remains an insurance contract for its duration, even if the insurance risk reduces significantly over time. Investment contracts transfer financial risk and no significant insurance risk. Financial risk includes credit risk, liquidity risk and market risk.
A reinsurance contract is an insurance contract in which an insurance entity cedes assumed risks to another insurance entity.
2.14 Policy contracts (continued)
Certain insurance contracts contain a discretionary participation feature. A discretionary participation feature entitles the holder to receive, supplementary to the main benefit, additional benefits or bonuses:
• that are likely to be a significant portion of the total contractual benefits;
• for which the amount or timing is contractually at the discretion of management; and
• that are contractually based on o the performance of a specified pool of contracts;o investment returns on a specified pool of assets held by the insurer; oro the profit or loss of a fund or insurer issuing the contract.
Policy bonuses and policy dividends constitute discretionary participation features which the Group classifies as liabilities.
Residual gains in the participating accounts constitute discretionary participation features which the Group classifies as equity (see also note 2.21).
(b) Recognition and measurement
(i) Property and casualty insurance contracts
Property and casualty insurance contracts are generally one-year renewable contracts issued by the insurer covering insurance risks over property, motor, accident and liability.
Property insurance contracts provide coverage for the risk of property damage or of loss of property. Commercial property, homeowners’ property, motor and certain marine property are common types of risks covered. For commercial policyholders, insurance may include coverage for loss of earnings arising from the inability to use property which has been damaged or lost.
Casualty insurance contracts provide coverage for the risk of causing physical harm or financial loss to third parties. Personal accident, employers’ liability, public liability, product liability and professional indemnity are common types of casualty insurance.
Notes to the Financial Statements SAGICOR FINANCIAL COMPANY Ltd. (formerly Sagicor Financial Corporation Limited)Year ended December 31, 2020 and December 31, 2019 Amounts expressed in US $000
159

27
2.14 Policy contracts (continued)
Premium revenue is recognised as earned on a pro-rated basis over the term of the respective policy coverage. If alternative insurance risk exposure patterns have been established over the term of the policy coverage, then premium revenue is recognised in accordance with the risk exposure. The provision for unearned premiums represents the portion of premiums written relating to the unexpired terms of coverage.
Claims and loss adjustment expenses are recorded as incurred. Claim reserves are established for both reported and unreported claims. Claim reserves represent estimates of future payments of claims and related expenses less anticipated recoveries with respect to insured events that have occurred up to the date of the financial statements.
An insurer may obtain reinsurance coverage for its property and casualty insurance risks. The reinsurance ceded premium is expensed on a pro-rata basis over the term of the respective policy coverage or of the reinsurance contract as appropriate. Reinsurance claim recoveries are established at the time of the recording of the claim liability and are computed on a basis which is consistent with the computation of the claim liability. Profit-sharing commission due to the Group is accrued as commission income when there is reasonable certainty of earned profit.
Commissions and premium taxes payable are recognised on the same basis as premiums earned. At the date of the financial statements, commissions and premium taxes attributable to unearned premiums are recorded as deferred policy acquisition costs. Profit-sharing commission payable by the Group arises from contracts between an insurer and a broker; it is accrued on an individual contract basis and recognised when the reinsurance premium is recorded.
(ii) Health insurance contracts
Health insurance contracts are generally one-year renewable contracts issued by the insurer covering insurance risks for medical expenses of insured persons.
Premium revenue is accrued when due for contracts where the premium is billed monthly. For contracts where the premium is billed annually or semi-annually, premium revenue is recognised as earned on a pro-rata basis over the term of the respective policy coverage. The provision for unearned premiums represents the portion of premiums written relating to the unexpired terms of coverage.
2.14 Policy contracts (continued)
Claims are recorded on settlement. Reserves are recorded as described in note 2.15.
An insurer may obtain reinsurance coverage for its health insurance risks. The reinsurance ceded premium is expensed on a pro-rata basis over the term of the respective policy coverage or of the reinsurance contract as appropriate.
Commissions and premium taxes payable are recognised on the same basis as premiums earned.
(iii) Long-term traditional insurance contracts
Long-term traditional insurance contracts are generally issued for fixed terms of five years or more, or for the remaining life of the insured. Benefits are typically a death, disability or critical illness benefit, a cash value on termination and/or a monthly annuity. Annuities are generally payable until the death of the beneficiaries with a proviso for a minimum number of payments. Some of these contracts have a discretionary participation feature in the form of regular bonuses or dividends. Other benefits such as disability and waiver of premium on disability may also be included in these contracts. Some contracts may allow for the advance of policy loans to the policyholder and may also allow for dividend withdrawals by the policyholder during the life of the contract.
Premium revenue is recognised when due. Typically, premiums are fixed and are required to be paid within the due period for payment. If premiums are unpaid, either the contract may terminate, an automatic premium loan may settle the premium, or the contract may continue at a reduced value.
Policy benefits are recognised on the notification of death, disability or critical illness, on the termination or maturity date of the contract, on the declaration of a cash bonus or dividend, or on the annuity payment date. Policy loans advanced are recorded as loans and receivables in the financial statements and are secured by the cash values of the respective policies. Policy bonuses may be “non-cash” and utilised to purchase additional amounts of insurance coverage. Accumulated cash bonuses and dividends are recorded as interest-bearing policy balances.
Reserves for future policy liabilities are recorded as described in note 2.15.
Notes to the Financial Statements SAGICOR FINANCIAL COMPANY Ltd. (formerly Sagicor Financial Corporation Limited)Year ended December 31, 2020 and December 31, 2019 Amounts expressed in US $000
160

28
2.14 Policy contracts (continued)
An insurer may obtain reinsurance coverage for death benefit insurance risks. Typically, coverage is obtained for individual coverage exceeding prescribed limits. The reinsurance premium is expensed when due, which generally coincides with when the policy premium is due. Reinsurance claim recoveries are established at the time of claim notification.
Commissions and premium taxes payable are recognised on the same basis as earned premiums.
(iv) Long-term universal life and unit linked insurance contracts
Universal life and unit linked insurance contracts are generally issued for fixed terms or for the remaining life of the insured. Benefits are typically a death, disability or critical illness benefit, a cash value on termination and/or a monthly annuity. Annuities are generally payable until the death of the beneficiaries with a proviso for a minimum number of payments. Benefits may include amounts for disability or waiver of premium on disability.
Universal life and unit linked contracts have either an interest-bearing investment account or unit linked investment accounts. Either gross premiums or gross premiums net of allowances are deposited to the investment accounts. Investment returns which are credited to the investment accounts and expenses, not included in the afore-mentioned allowances, are debited to the investment accounts. Interest-bearing investment accounts may include provisions for minimum guaranteed returns or returns based on specified investment indices. Allowances and expense charges are in respect of applicable commissions, cost of insurance, administrative expenses and premium taxes. Fund withdrawals may be permitted.
Premium revenue is recognised when received and consists of all monies received from the policyholders. Typically, premiums are fixed at the inception of the contract or periodically thereafter, but additional non-recurring premiums may be paid.
Policy benefits are recognised on the notification of death, disability or critical illness, on the receipt of a withdrawal request, on the termination or maturity date of the contract, or on the annuity payment date. Reserves for future policy liabilities are recorded as described in note 2.15.
2.14 Policy contracts (continued)
An insurer may obtain reinsurance coverage for death benefit insurance risks. Typically, coverage is obtained for individual coverage exceeding prescribed limits. The reinsurance premium is expensed when due, which generally coincides with when the policy premium is due. Reinsurance claims recoveries are established at the time of claim notification.
Commissions and premium taxes payable are generally recognised only on settlement of premiums.
(v) Reinsurance contracts assumed
Reinsurance contracts assumed by an insurer are accounted for in a similar manner as if the insurer has assumed the risk directly from a policyholder.
Reinsurance contracts assumed include blocks of life and annuity policies assumed from third party insurers. In some instances, the Group also administers these policies.
(vi) Reinsurance contracts held
As noted in sections (i) to (iv) above, an insurer may obtain reinsurance coverage for insurance risks underwritten. The Group cedes insurance premiums and risk in the normal course of business in order to limit the potential for losses arising from its exposures. Reinsurance does not relieve the originating insurer of its liability.
Reinsurance contracts held by an insurer are recognised and measured in a similar manner to the originating insurance contracts and in accordance with the contract terms. Reinsurance premium ceded and reinsurance recoveries on claims are offset against premium revenue and policy benefits in the income statement.
The benefits to which an insurer is entitled under its reinsurance contracts held are recognised as reinsurance assets or receivables. Reinsurance assets and receivables are assessed for impairment. If there is evidence that the asset or receivable is impaired, the impairment is recorded in the statement of income. The obligations of an insurer under reinsurance contracts held are included in accounts payable and accrued liabilities and in actuarial liabilities.
Reinsurance balances are measured consistently with the insurance liabilities to which they relate.
Notes to the Financial Statements SAGICOR FINANCIAL COMPANY Ltd. (formerly Sagicor Financial Corporation Limited)Year ended December 31, 2020 and December 31, 2019 Amounts expressed in US $000
161

29
2.14 Policy contracts (continued)
(vii) Deposit administration and other investment contracts
Deposit administration contracts are issued by an insurer to registered pension schemes for the deposit of pension plan assets with the insurer.
Deposit administration liabilities are recognised initially at fair value and are subsequently stated at: • amortised cost where the insurer is obligated to provide investment returns to the pension
scheme in the form of interest;• fair value through profit and loss (FVTPL) where the insurer is obligated to provide
investment returns to the pension scheme in direct proportion to the investment returns onspecified blocks of assets.
Deposit administration contributions are recorded directly as liabilities. Withdrawals are deducted directly from the liability. The interest or investment return provided is recorded as an interest expense.
In addition, the Group may provide pension administration services to the pension schemes. The Group earns fee income for both pension administration and investment services.
Other investment contracts are recognised initially at fair value and are subsequently stated at amortised cost and are accounted for in the same manner as deposit administration contracts which are similarly classified.
(c) Embedded derivatives
Certain insurance contracts contain embedded derivatives which are options for which value may vary in response to changes in interest rates or other market variables.
The Group does not separately measure embedded derivatives that are closely related to the host insurance contract or that meet the definition of an insurance contract. Options to surrender an insurance contract for a fixed amount are also not measured separately. In these cases, the entire contract liability is measured as set out in note 2.15.
2.14 Policy contracts (continued)
(d) Liability adequacy tests
At the date of the financial statements, liability adequacy tests are performed by each insurer to ensure the adequacy of insurance contract liabilities, using current estimates of the related expected future cash flows. If a test indicates that the carrying value of insurance contract liabilities is inadequate, then the liabilities are adjusted to correct the deficiency. The deficiency is included in the income statement under benefits.
2.15 Actuarial liabilities
(a) Life insurance and annuity contracts
The determination of actuarial liabilities of long-term insurance contracts has been done using approaches consistent with the principles of the Canadian standards of practice. These liabilities consist of the amounts that, together with future premiums and investment income, are required to provide for future policy benefits, expenses and taxes on insurance and annuity contracts. Canadian standards may change from time to time, but infrequently.
The process of calculating life insurance and annuity actuarial liabilities for future policy benefits necessarily involves the use of estimates concerning such factors as mortality and morbidity rates, future investment yields, future expense levels and persistency, including reasonable margins for adverse deviations. As experience unfolds, these resulting provisions for adverse deviations will be included in future income to the extent they are released when they are no longer required to cover adverse experience. Assumptions used to project benefits, expenses and taxes are based on insurer and industry experience and are updated annually.
Notes to the Financial Statements SAGICOR FINANCIAL COMPANY Ltd. (formerly Sagicor Financial Corporation Limited)Year ended December 31, 2020 and December 31, 2019 Amounts expressed in US $000
162

30
2.15 Actuarial liabilities (continued)
Net insurance contract liabilities represent the amount which, together with estimated future premiums and net investment income, will be sufficient to pay projected future benefits, policyholder dividends and refunds, taxes (other than income taxes) and expenses on policies in-force net of reinsurance premiums and recoveries.
The determination of net insurance liabilities is based on an explicit projection of cash flows using current assumptions plus a margin for adverse deviation for each material cash flow item. Investment returns are projected using the current asset portfolios and projected reinvestment yields. The period used for the projection of cash flows is the policy lifetime for most individual insurance contracts.
The Group segments assets to support liabilities by major product segment and geographic market and establishes investment strategies for each liability segment. Projected net cash flows from these assets and the policy liabilities being supported by these assets are combined with projected cash flows from future asset purchases to determine expected rates of return on these assets for future years. Investment strategies are based on the target investment policies for each segment and the reinvestment returns are derived from current and projected market rates for fixed income investments. Investment return assumptions for each asset class make provision for expected future asset credit losses, expected investment management expenses and a margin for adverse deviation.
Under this methodology, assets of each insurer are selected to back its actuarial liabilities. Changes in the carrying value of these assets may generate corresponding changes in the carrying amount of the associated actuarial liabilities. These assets include financial investments, for which unrealised gains or losses in fair value are recorded in other comprehensive income. The fair value reserve for actuarial liabilities has been established in the statement of changes in equity for the accumulation of changes in actuarial liabilities which are recorded in other comprehensive income and which arise from recognised unrealised gains or losses in FVOCI.
2.15 Actuarial liabilities (continued)
Certain life insurance policies issued by the insurer contain equity-linked policy side funds. The investment returns on these unitised funds accrue directly to the policies with the insurer assuming no credit risk. Investments held in these side funds are accounted for as financial assets at fair value through profit and loss and unit values of each fund are determined by dividing the value of the assets in the fund at the date of the financial statements by the number of units in the fund. The resulting liability is included in actuarial liabilities.
(b) Health insurance contracts
The actuarial liabilities of health insurance policies are estimated in respect of claims that have been incurred but not yet reported or settled.
2.16 Presentation of current and non-current assets and liabilities
In note 41.5, the maturity profiles of financial and insurance assets and liabilities are identified. For other assets and liabilities, balances presented in notes 5 to 8, 10 to 12, 14, 18, 19 and 33 are non-current unless otherwise stated in those notes.
Notes to the Financial Statements SAGICOR FINANCIAL COMPANY Ltd. (formerly Sagicor Financial Corporation Limited)Year ended December 31, 2020 and December 31, 2019 Amounts expressed in US $000
163

31
2.17 Employee benefits
(a) Pension benefits
Group companies have various pension schemes in place for their employees. Some schemes are defined benefit plans and others are defined contribution plans.
The liability in respect of defined benefit plans is the present value of the defined benefit obligation at December 31 less the fair value of plan assets. The defined benefit obligation is computed using the projected unit credit method. The present value of the defined benefit obligation is determined by the estimated future cash outflows using appropriate interest rates on government bonds for the maturity dates and currency of the related liability.
Actuarial gains and losses arising from experience adjustments and changes in actuarial assumptions are charged or credited to other comprehensive income and retained earnings or non-controlling interest in the period in which they arise. Past service costs are charged to income in the period in which they arise.
For defined contribution plans, the Group pays contributions to the pension schemes on a mandatory or contractual basis. Once paid, the Group has no further payment obligations. Contributions are recognised in income in the period in which they are due.
Where a minimum funding requirement exists, the Group assesses the obligation, to determine whether the additional contributions would affect the measurement of the defined benefit asset or liability.
(b) Other retirement benefits
Certain Group subsidiaries provide supplementary health and life insurance benefits to qualifying employees upon retirement. The entitlement to these benefits is usually based on the employee remaining in service up to retirement age and the completion of a minimum service period. The expected costs of these benefits are accrued over the period of employment, using an accounting methodology similar to that for defined benefit pension plans. Actuarial gains and losses arising from experience adjustments and changes in actuarial assumptions are charged or credited to other comprehensive income and retained earnings or non-controlling interest in the period in which they arise.
2.17 Employee benefits (continued)
(c) Profit-sharing and bonus plans
The Group recognises a liability and an expense for bonuses and profit-sharing, based on various profit and other objectives of the Group or of individual subsidiaries. An accrual is recognised where there are contractual obligations or where past practice has created a constructive obligation.
(d) Equity compensation benefits
The Group has a number of share-based compensation plans in place for administrative, sales and managerial staff.
(i) Equity-settled share-based transactions with staff
The services received in an equity-settled transaction with staff are measured at the fair value of the equity instruments granted. The fair value of those equity instruments is measured at grant date.
If the equity instruments granted vest immediately and the individual is not required to complete a further period of service before becoming entitled to those instruments, the services received are recognised in full on grant date in the income statement for the period, with a corresponding increase in equity.
Where the equity instruments do not vest until the individual has completed a further period of service, the services received are expensed in the income statement during the vesting period, with a corresponding increase in the reserve for equity compensation benefits or in non-controlling interest.
Non-market vesting conditions are included in assumptions about the number of instruments that are expected to vest. At each reporting financial statement date, the Group revises its estimates of the number of instruments that are expected to vest based on the non-marketing vesting conditions and adjusts the expense accordingly.
Amounts held in the reserve for equity compensation benefits are transferred to share capital or non-controlling interest either on the distribution of share grants or on the exercise of share options.
Notes to the Financial Statements SAGICOR FINANCIAL COMPANY Ltd. (formerly Sagicor Financial Corporation Limited)Year ended December 31, 2020 and December 31, 2019 Amounts expressed in US $000
164

32
2.17 Employee benefits (continued)
The grant by the Company of its equity instruments to employees of Group subsidiaries is treated as a capital contribution in the financial statements of the subsidiary. The full expense relating to the grant is recorded in the subsidiary’s income statement.
(ii) Cash-settled share-based transactions with staff
The services received in a cash-settled transaction with staff and the liability to pay for those services, are recognised at fair value as the individual renders service. Until the liability is settled, the fair value of the liability is re-measured at the date of the financial statements and at the date of settlement, with any changes in fair value recognised in income during that period.
(iii) Measurement of the fair value of equity instruments granted
The equity instruments granted consist either of grants of, or options to purchase, common shares of listed entities within the Group. For common shares granted, the listed price prevailing on the grant date determines the fair value. For options granted, the fair value is determined by reference to the Black-Scholes valuation model, which incorporates factors and assumptions that knowledgeable, willing market participants would consider in setting the price of the equity instruments.
(e) Termination benefits
Termination benefits are payable whenever an employee’s employment is terminated before the normal retirement date or whenever an employee accepts voluntary redundancy in exchange for these benefits. The Group recognises termination benefits when it is demonstrably committed to either terminate the employment of current employees according to a detailed formal plan without the possibility of withdrawal or to provide termination benefits as a result of an offer made to encourage voluntary redundancy. Benefits falling due more than twelve months after the date of the financial statements are discounted to present value.
2.18 Taxes
(a) Premium taxes
Insurers are subject to tax on premium revenues generated in certain jurisdictions. The principal rates of tax are summarised in the following table.
Premium tax is recognised gross in the statement of income.
(b) Asset tax
The Group is subject to an asset tax in Jamaica and Barbados. In Jamaica, the asset tax is levied on insurance, securities dealers and deposit-taking institutions, and is 0.25% of adjusted assets held at the end of the year. In Barbados, the asset tax is levied on insurance, deposit-taking institutions and credit unions and is 0.35% of adjusted assets held at the end of a period. Taxes are accrued monthly.
(c) Income taxes
The Group is subject to taxes on income in the jurisdictions in which business operations are conducted. Rates of taxation in the principal jurisdictions for the current year are set out in the next table.
.
Life insurance and non-registered
annuities
Property and Health
Premium tax rates casualty insurance
insurance
Barbados 3% - 6% 4% 3% - 5%
Jamaica Nil Nil Nil
Trinidad and Tobago Nil Nil Nil
United States of America 0.75% - 3.5% Nil Nil
Notes to the Financial Statements SAGICOR FINANCIAL COMPANY Ltd. (formerly Sagicor Financial Corporation Limited)Year ended December 31, 2020 and December 31, 2019 Amounts expressed in US $000
165

33
2.18 Taxes (continued)
(i) Current income taxes
Current tax is the expected tax payable on the taxable income for the year, using the tax rates in effect for the year. Adjustments to tax payable from prior years are also included in current tax.
(ii) Deferred income taxes
Deferred income tax is recognised, using the liability method, on temporary differences arising between the tax bases of assets and liabilities and their carrying amounts in the financial statements. Deferred income taxes are computed at tax rates that are enacted or substantially enacted by the end of the reporting period. Deferred tax assets are only recognised when it is probable that taxable profits will be available against which the asset may be utilised.
Deferred income tax assets and liabilities are offset when there is a legally enforceable right to do so and they relate to the same entity. Deferred tax, related to fair value re-measurement of FVOCI investments and cash flow hedges which are recorded in other comprehensive income, is recorded in other comprehensive income and is subsequently recognised in income together with the deferred gain or loss.
2.19 Other liabilities / Retirement benefit liabilities
Liabilities are recognised when the Group has a legal or constructive obligation, as a result of past events, if it is probable that an outflow of resources will be required to settle the obligation, and a reliable estimate of the amount can be made.
2.20 Common shares
In exchange for consideration received, the Company has issued common shares that are classified as equity. Incremental costs directly attributable to the issue of common shares are recorded in share capital as a deduction from the share issue proceeds.
Where a Group entity purchases the Company’s common shares, the consideration paid, including any directly attributable cost, is deducted from share capital and is recorded as treasury shares. Where such shares are subsequently sold to a third party, the deduction from share capital is reversed, and any difference with net consideration received is recorded in retained earnings.
On the declaration by the Company’s directors of common share dividends payable, the total value of the dividend is recorded as an appropriation of retained earnings.
2.21 Participating accounts
(a) “Closed” participating account
For participating policies of Sagicor Life Inc in force at de-mutualisation, Sagicor Life Inc established a closed participating account in order to protect the guaranteed benefits and future policy dividends, bonuses and other non-guaranteed benefits of the afore-mentioned policies. The rules of this account require that premiums, benefits, actuarial reserve movements, investment returns, expenses and taxes, attributable to the said policies, are recorded in a closed participating fund. Policy dividends and bonuses of the said policies are paid from the participating fund on a basis substantially the same as prior to de-mutualisation.
Life insurance and non-registered annuities
Registered Other lines of Income tax rates
annuities business
2% of profit 2% of profit before tax
Barbados 2% of profit before tax before tax
25% - 33.33 % of Jamaica 25% of profit before tax Nil
profit before tax
15% (deductions granted only in respect of expenses pertaining to long-term business investment income)
Trinidad and Tobago Nil 30% of net income
United States of 21% of profit 21% of net income Nil
America before tax
Notes to the Financial Statements SAGICOR FINANCIAL COMPANY Ltd. (formerly Sagicor Financial Corporation Limited)Year ended December 31, 2020 and December 31, 2019 Amounts expressed in US $000
166

34
2.21 Participating accounts (continued)
Distributable profits of the closed participating account are distributed to the participating policies in the form of declared bonuses and dividends. Undistributed profits remain in the participating account for the benefit of participating policyholders.
The participating account also includes an ancillary fund comprising the required provisions for adverse deviations as determined in the computation of actuarial liabilities of the said policies. Changes in the ancillary fund are not recorded in the participating account, but are borne by the general operations of Sagicor Life Inc.
(b) “Open” participating account
Sagicor Life Inc also established an open participating account for participating policies it issues after de-mutualisation. The rules of this account require that premiums, benefits, actuarial reserve movements, investment returns, expenses and taxes, attributable to the said policies are recorded in an open participating account.
The open participating account was established at de-mutualisation. On February 1, 2005, Sagicor Life Inc amalgamated with Life of Barbados Limited, and participating policies of the latter were transferred to the open participating account. Accordingly, the liabilities of these participating policies and matching assets were transferred to the open participating account. The liabilities transferred included an ancillary fund comprising the provisions for adverse deviations on the transferred policies. Changes in the ancillary fund are not recorded in the participating account, but are borne by the general operations of Sagicor Life Inc.
Additional assets to support the profit distribution to shareholders (see below) were also transferred to the account.
Distributable profits of the open participating account are shared between participating policies and shareholders in a ratio of 90:10. Profits are distributed to the participating policies in the form of declared bonuses and dividends. Profits which are distributed to shareholders are included in the allocation of Group net income to shareholders. Undistributed profits / (losses) remain in the participating account in equity.
2.21 Participating accounts (continued)
(c) Financial statement presentation
The assets and liabilities of the participating accounts are included but not presented separately in the financial statements. The revenues, benefits and expenses of the participating accounts are also included but not presented separately in the financial statements. However, the overall surplus of assets held in the participating funds over the associated liabilities is presented in equity as the participating accounts. The overall net income and other comprehensive income that are attributable to the participating funds are disclosed as allocations.
The initial allocation of additional assets to the participating funds is recognised in equity as a transfer from retained earnings to the participating accounts. Returns of additional assets from the participating funds are accounted for similarly.
2.22 Statutory reserves
Statutory reserves are established when regulatory accounting requirements result in lower distributable profits or when an appropriation of retained earnings is required or permitted by law to protect policyholders, insurance beneficiaries or depositors.
2.23 Premium / (discount) paid on repurchase of shares
The premium / (discount) paid on repurchase of shares is recorded directly in retained earnings.
2.24 Interest income and interest expense Interest income (expense) is computed by applying the effective interest rate to the gross carrying amount of a financial asset (liability), except for financial assets that are purchased, originated or subsequently become credit-impaired. For credit-impaired financial assets, the effective interest rate is applied to the net carrying amount of the financial asset (i.e. after deduction of the loss allowance). Interest includes coupon interest and accrued discount and premium on financial instruments. Dividend income is recorded when declared.
Notes to the Financial Statements SAGICOR FINANCIAL COMPANY Ltd. (formerly Sagicor Financial Corporation Limited)Year ended December 31, 2020 and December 31, 2019 Amounts expressed in US $000
167

35
2.25 Fees and other revenue
The Group earns fee income from: • the management and administration of third-party investment funds, pension plans and
insurance benefit plans (managed funds or administrative service only (ASO) benefitplans);
• hotel revenue from room services, and food and beverage sales;• certain of its insurance and investment contracts;• the provision of corporate finance, stockbroking, trust and related services.
Other revenue includes: • commission income on insurance contracts;• hotel revenue from other services and sale of goods; • rental income from owner-occupied property;• foreign exchange gains / (losses).
Service contract revenue
Revenues from service contracts include management and administrative fees and hotel revenue from guest reservations. These service contracts generally impose single-performance obligations, each consisting of a series of similar related services to the customer. The Group’s performance obligations within these service arrangements are generally satisfied over time as the customers simultaneously receive and consume contracted benefits.
Revenue from service contracts with customers is recognised when or as the Group satisfies the performance obligation. For obligations satisfied over time, revenue is recognised monthly or over the applicable period. For performance obligations satisfied at a point in time, service contract revenue is recognised at that point in time.
2.26 Cash flows
The following classifications apply to the cash flow statement.
Cash flows from operating activities consist of cash flows arising from revenues, benefits, expenses, taxes, operating assets and operating liabilities. Cash flows from investing activities consist of cash flows arising from long-term tangible and intangible assets to be utilised in the business and in respect of changes in subsidiary holdings, insurance businesses, and associated company and joint venture investments. Cash flows from financing activities consist of cash flows arising from the issue, redemption and exchange of equity instruments and notes and loans payable and from equity dividends payable to holders of such instruments.
Cash and cash equivalents comprise:
• cash balances,
• call deposits,
• money market funds,
• other liquid balances with maturities of three months or less from the acquisition date,
• less bank overdrafts which are repayable on demand.
Cash equivalents are subject to an insignificant risk of change in value and exclude restricted cash.
Notes to the Financial Statements SAGICOR FINANCIAL COMPANY Ltd. (formerly Sagicor Financial Corporation Limited)Year ended December 31, 2020 and December 31, 2019 Amounts expressed in US $000
168

(((
((
2.27 Future accounting developments and reporting changes
Certain new standards and amendments to existing standards have been issued but are not effective for the periods covered by these financial statements. The changes in standards and interpretations which may have a significant effect on future presentation, measurement or disclosure of the Group’s financial statements are summarised in the following tables.
2.27 Future accounting developments and reporting changes (continued)
Amendments to IFRS 7, IFRS 4 and IFRS 16 – Interest Rate Benchmark Reform, Phase 2, effective January 1, 2021
Subject / Comments
Amendment to IFRS 16 – Leases; COVID-19 related rent concessions, effective for annual periods beginning on or after June 1, 2020
The Phase 2 amendments address issues that arise from the implementation of the reforms, including the replacement of one benchmark with an alternative one.
This standard will have no material effect on the Group. Subject / Comments
As a result of the coronavirus (COVID-19) pandemic, rent concessions have been granted to lessees. Such concessions might take a variety of forms, including payment holidays and deferral of lease payments. On May 28, 2020, the IASB published an amendment to IFRS 16 that provides an optional practical expedient for lessees from assessing whether a rent concession related to COVID-19 is a lease modification. Lessees can elect to account for such rent concessions in the same way as they would if they were not lease modifications. In many cases, this will result in accounting for the concession as variable lease payments in the period(s) in which the event or condition that triggers the reduced payment occurs.
This standard has not yet been adopted and it will have no material effect on the Group.
Amendments to IAS 1 – Liabilities as current or non-current, effective January 1, 2022
Subject / Comments
In January 2020, the IASB made amendments to IAS 1 ‘Presentation of financial statements’ to clarify the criteria for classifying a liability as non-current. These are to be applied retroactively.
The impact of this standard on the Group is currently being analysed.
Amendments to IFRS 17 and IFRS 4 – Insurance contracts; deferral of IFRS 9, effective January 1, 2021!
Amendments to IFRS 3 – Business combinations, effective January 1, 2022
Subject / Comments Subject / Comments
These amendments update a reference in IFRS 3 to the Conceptual Framework for Financial Reporting without changing the accounting requirements for business combinations.
This standard will have no material effect on the Group.
These amendments defer the date of application of IFRS 17 by two years to January 1, 2023 and change the fixed date of the temporary exemption in IFRS 4 from applying IFRS 9 – Financial Instruments, until January 1, 2023.
The effect of these standards on the Group follows in this note in the section, “IFRS 17 – Insurance Contracts, effective January 1, 2023”.
36
Notes to the Financial Statements SAGICOR FINANCIAL COMPANY Ltd. (formerly Sagicor Financial Corporation Limited)Year ended December 31, 2020 and December 31, 2019 Amounts expressed in US $000
169

37
(((
(((
2.27 Future accounting developments and reporting chang es (continued) 2.27 Future accounting developments and reporting changes (continued)
Amendments to IAS 16 – Property, plant and equipment, effective January 1, 2022 IFRS 17 – Insurance Contracts, effective January 1, 2023 (continued) Subject / Comments
Subject / Comments
These amendments prohibit a company from deducting from the cost of property, plant and equipment, amounts received from selling items produced while the company is preparing the asset for its intended use. Instead, a company will recognise such sales proceeds and related cost in profit or loss.
This standard will have no material effect on the Group.
Contracts are measured using the building blocks of:
It allows a choice between recognising changes in discount rates either in the income statement or directly in other comprehensive income. The choice is likely to reflect how insurers account for their financial assets under IFRS 9.
An optional, simplified premium allocation approach is permitted for the liability for the remaining coverage for short duration contracts which are often written by non-life insurers.
There is a modification of the general measurement model called the ‘variable fee approach’ for certain contracts written by life insurers where policyholders share in the returns from underlying items. When applying the variable fee approach, the entity’s share of the fair value changes of the underlying items is included in the contractual service margin.
The new rules will affect the financial statements and key performance indicators of all entities that issue insurance contracts or investment contracts with discretionary participation features.
Sagicor has established a group-wide project for the implementation of this standard and has allocated substantial resources to this exercise. Project activities involve the establishment of various technical and oversight teams, and the evaluation and assessment of the Group’s business. The Group is carrying out internal training programmes, workshops and assessments of all areas affected by the standard as it works towards implementation. Project work is ongoing in all areas.
Amendments to IAS 37 – Provisions, contingent liabilities and contingent assets, effective January 1, 2022
Subject / Comments
These amendments specify which costs a company includes when assessing whether a contract will be loss-making.
This standard will have no material effect on the Group.
IFRS 17 – Insurance Contracts, effective January 1, 2023
Subject / Comments
IFRS 17 was issued in May 2017 as replacement for IFRS 4 - Insurance Contracts. A further exposure draft (ED) was issued in June 2019 and final amendments were published in June 2020. The amendments aim to help companies implement the standard and to make explanation of financial performance easier. The standard requires a current measurement model where estimates are re-measured each reporting period.
• discounted probability-weighted cash flows,• an explicit risk adjustment, and • a contractual service margin (“CSM”) representing the unearned profit of the contract
which is recognised as revenue over the coverage period.
Notes to the Financial Statements SAGICOR FINANCIAL COMPANY Ltd. (formerly Sagicor Financial Corporation Limited)Year ended December 31, 2020 and December 31, 2019 Amounts expressed in US $000
170

38
2.27 Future accounting developments and reporting changes (continued)
Annual Improvements to Standards
Description of amendment
IFRS 1 - First-time Adoption of International Financial Reporting Standards
To simplify the application of IFRS 1 by a subsidiary that becomes a first-time adopter of IFRSs after its parent company has already adopted them. The amendment relates to the measurement of cumulative translation differences.
IFRS 9 - Financial Instruments To clarify the fees a company includes in assessing the terms of a new or modified financial liability to determine whether to derecognise a financial liability.
Illustrative Examples accompanying IFRS 16 Leases
To remove the potential for confusion regarding lease incentives by amending an Illustrative Example accompanying IFRS 16.
IAS 41 - Agriculture To align the fair value measurement in IAS 41 with those in other IFRSs.
The annual improvements are effective January 1, 2022 and have not yet been applied.
Notes to the Financial Statements SAGICOR FINANCIAL COMPANY Ltd. (formerly Sagicor Financial Corporation Limited)Year ended December 31, 2020 and December 31, 2019 Amounts expressed in US $000
171
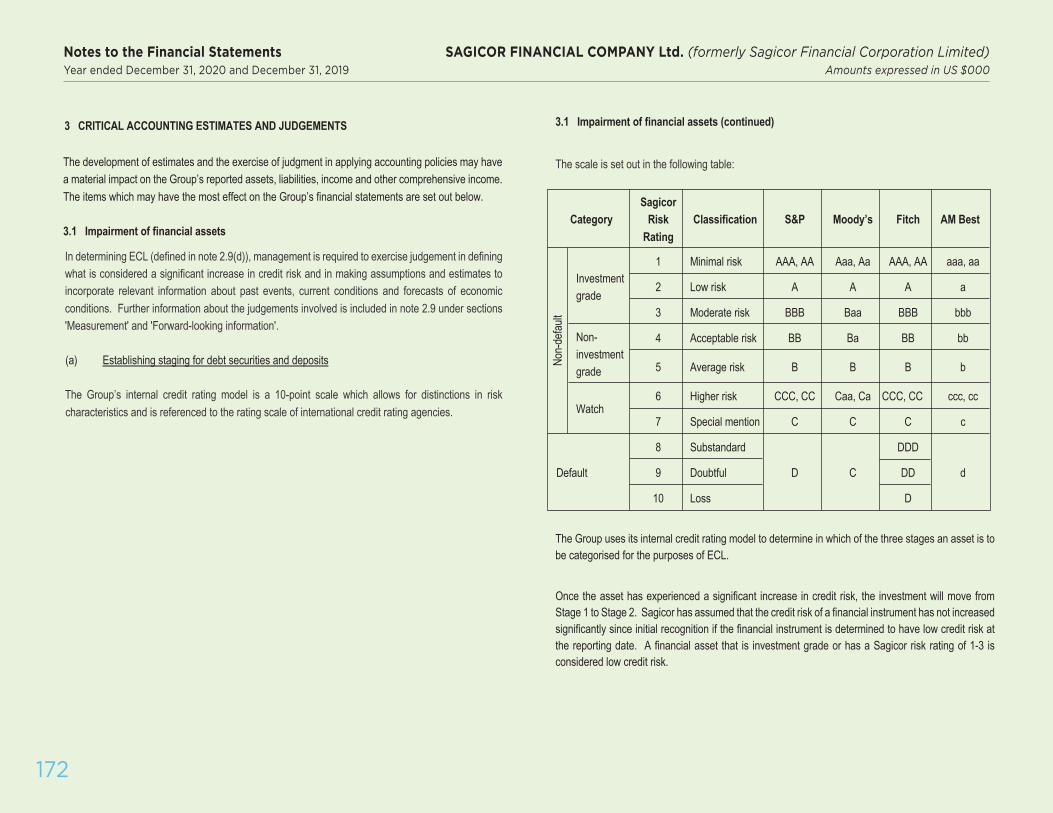
39
3.1 Impairment of financial assets (continued)
The scale is set out in the following table:
The Group uses its internal credit rating model to determine in which of the three stages an asset is to be categorised for the purposes of ECL.
Once the asset has experienced a significant increase in credit risk, the investment will move from Stage 1 to Stage 2. Sagicor has assumed that the credit risk of a financial instrument has not increased significantly since initial recognition if the financial instrument is determined to have low credit risk at the reporting date. A financial asset that is investment grade or has a Sagicor risk rating of 1-3 is considered low credit risk.
3 CRITICAL ACCOUNTING ESTIMATES AND JUDGEMENTS
The development of estimates and the exercise of judgment in applying accounting policies may have a material impact on the Group’s reported assets, liabilities, income and other comprehensive income. The items which may have the most effect on the Group’s financial statements are set out below.
3.1 Impairment of financial assets
In determining ECL (defined in note 2.9(d)), management is required to exercise judgement in defining what is considered a significant increase in credit risk and in making assumptions and estimates to incorporate relevant information about past events, current conditions and forecasts of economic conditions. Further information about the judgements involved is included in note 2.9 under sections 'Measurement' and 'Forward-looking information'.
(a) Establishing staging for debt securities and deposits
The Group’s internal credit rating model is a 10-point scale which allows for distinctions in risk characteristics and is referenced to the rating scale of international credit rating agencies.
Sagicor Category Risk Classification S&P Moody’s Fitch AM Best
Rating
1 Minimal risk AAA, AA Aaa, Aa AAA, AA aaa, aa Investment
2 Low risk A A A a grade
3 Moderate risk BBB Baa BBB bbb
Non- 4 Acceptable risk BB Ba BB bb investment grade 5 Average risk B B B b
6 Higher risk CCC, CC Caa, Ca CCC, CC ccc, cc Watch
7 Special mention C C C c
8 Substandard DDD
Default 9 Doubtful D C DD d
10 Loss D
Non-
defau
lt
Notes to the Financial Statements SAGICOR FINANCIAL COMPANY Ltd. (formerly Sagicor Financial Corporation Limited)Year ended December 31, 2020 and December 31, 2019 Amounts expressed in US $000
172

40
3.2 Fair value of securities not quoted in an active market
The fair value of securities not quoted in an active market may be determined using reputable pricing sources (such as pricing agencies), indicative prices from bond/debt market makers or other valuation techniques. Broker quotes as obtained from the pricing sources may be indicative and not executable or binding. The Group exercises judgement on the quality of pricing sources used. Where no market data is available, the Group may value positions using its own models, which are usually based on valuation methods and techniques generally recognised as standard within the industry. The inputs into these models are primarily discounted cash flows.
The models used to determine fair values are periodically reviewed by experienced personnel. The models used for debt securities are based on net present value of estimated future cash flows, adjusted as appropriate for liquidity, and credit and market risk factors.
3.3 Recognition and measurement of intangible assets
The recognition and measurement of intangible assets, other than goodwill, in a business combination involve the utilisation of valuation techniques which may be very sensitive to the underlying assumptions utilised. These intangibles may be marketing-related, customer-related, contract-based or technology-based.
For significant amounts of intangibles arising from a business combination, the Group utilises independent professional advisors to assist management in determining the recognition and measurement of these assets.
3.1 Impairment of financial assets (continued)
Stage 1 investments are rated (i) investment grade, or (ii) below investment grade at origination and have not been downgraded more than 2 notches since origination. Stage 2 investments are assets which (i) have been downgraded from investment grade to below investment grade, or (ii) are rated below investment grade at origination and have been downgraded more than 2 notches since origination. Stage 3 investments are assets in default.
(b) Establishing staging for other assets measured at amortised cost, finance lease receivables,loan commitments and financial guarantee contracts
Exposures are considered to have resulted in a significant increase in credit risk and are moved to stage 2 when:
Qualitative test • accounts that meet the portfolio’s ‘high risk’ criteria and are subject to closer credit
monitoring.
Backstop criteria • accounts that are 30 calendar days or more past due. The 30 days past due criteria is a
backstop rather than a primary driver of moving exposures into stage 2.
(c) Forward-looking information
When management determines the macro-economic factors that impact the portfolios of financial assets, they first determine all readily available information within the relevant market. Portfolios of financial assets are segregated based on product type, historical performance and homogenous country exposures. There is often limited timely macro-economic data for Barbados, Eastern Caribbean, Trinidad and Jamaica. Management assesses data sources from local government, International Monetary Fund (IMF) and other reputable data sources. A regression analysis is performed to determine which factors are most closely correlated with the credit losses for each portfolio. Where projections are available, these are used to look into the future up to three years and subsequently the expected performance is then used for the remaining life of the product. These projections are re-assessed on a quarterly basis.
(((
Notes to the Financial Statements SAGICOR FINANCIAL COMPANY Ltd. (formerly Sagicor Financial Corporation Limited)Year ended December 31, 2020 and December 31, 2019 Amounts expressed in US $000
173

41
3.5 Valuation of actuarial liabilities (continued)
The actuarial liabilities are determined as the present value of liability cash flows discounted at effective interest rates, resulting in a value equivalent to the market value of assets supporting these policy liabilities under an adverse economic scenario to which margins for adverse deviations are added.
The AA identifies a conservative economic scenario forecast, and together with the existing investment portfolio as at the date of the actuarial valuation and assumed reinvestment of net asset and policy liability cash flows, calculates the actuarial liabilities required at the date of valuation to ensure that sufficient monies are available to meet the liabilities as they become due in future years.
The methodology produces the total reserve requirement for each policy group fund. In general, the methodology is used to determine the net overall actuarial liabilities required by the insurer. Actuarial liabilities are computed by major group of policies and are used to determine the amount of reinsurance balances in the reserve, the distribution of the total reserve by country and the distribution of the reserve by policy, and other individual components in the actuarial liabilities.
Further details of the inputs used are set out in note 43.
(b) Best estimate reserve assumptions & provisions for adverse deviations
Actuarial liabilities include two major components: a best estimate reserve and a provision for adverse deviations. The latter provision is established in recognition of the uncertainty in computing best estimate reserves, to allow for possible deterioration in experience and to provide greater comfort that reserves are adequate to pay future benefits.
For the respective reserve assumptions for mortality and morbidity, lapse, future investment yields, operating expenses and taxes, best estimate reserve assumptions are determined where appropriate. The assumption for operating expenses and taxes is in some instances split by universal life and unit linked business.
Provisions for adverse deviations are established in accordance with the risk profiles of the business, and are, as far as is practicable, standardised across geographical areas. Provisions are determined within a specific range established by Canadian Standards of Practice.
The principal assumptions and margins used in the determination of actuarial liabilities are summarised in note 13.3. However, the liability resulting from the application of these assumptions can never be definitive as to the ultimate timing or the amount of benefits payable and is therefore subject to future reassessment.
3.4 Impairment of intangible assets
(a) Goodwill
The assessment of goodwill impairment involves the determination of the value of the cash- generating business units to which the goodwill has been allocated. Determination of the value involves the estimation of future cash flows or of income after tax of these business units and the expected returns to providers of capital to the business units and/or to the Group as a whole. For the Sagicor Life reporting segment, the Group uses the value in use methodology for testing goodwill impairment. For the Sagicor Jamaica operating segment, the Group uses the fair value less cost to sell methodology, and for Sagicor General Insurance Inc, the value in use methodology.
The Group updates its business unit financial projections annually and applies discounted cash flow or earnings multiple models to these projections to determine if there is any impairment of goodwill. The assessment of whether goodwill is impaired can be highly sensitive to the inputs of cash flows, income after tax, discount rate, growth rate or capital multiple, which are used in the computation. Further details of the inputs used are set out in note 8.2.
(b) Other intangible assets
The assessment of impairment of other intangible assets involves the determination of the intangible’s fair value or value in use. In the absence of an active market for an intangible, its fair value may need to be estimated. In determining an intangible’s value in use, estimates are required of future cash flows generated as a result of holding the asset.
3.5 Valuation of actuarial liabilities
(a) Canadian Actuarial Standards
The objective of the valuation of policy liabilities is to determine the amount of the insurer’s assets that, in the opinion of the Appointed Actuary (AA) and taking into account the other pertinent items in the financial statements, will be sufficient without being excessive to provide for the policy liabilities over their respective terms. The amounts set aside for future benefits are dependent on the timing of future asset and liability cash flows.
Notes to the Financial Statements SAGICOR FINANCIAL COMPANY Ltd. (formerly Sagicor Financial Corporation Limited)Year ended December 31, 2020 and December 31, 2019 Amounts expressed in US $000
174

42
3.6 Investment in associate
As at October 1, 2018, Sagicor Group Jamaica (SGJ) had a shareholding in Playa of 15%, which increased to 16% on June 15, 2020 (see note 6.1). From an accounting perspective, IAS 28 (Investments in Associate and Joint Ventures) paragraph 5, 6 and 8 guidance was considered as follows:
Where an entity holds 20% or more of the voting power (directly or through subsidiaries) in an investee, it will be presumed the investor has significant influence unless it can be clearly demonstrated that this is not the case. If the holding is less than 20%, the entity will be presumed not to have significant influence unless such influence can be clearly demonstrated. A substantial or majority ownership by another investor does not necessarily preclude an entity from having significant influence.
The existence of significant influence by an entity is usually evidenced in one or more of the following ways:
• representation on the board of directors or equivalent governing body of the investee; • participation in the policy-making process, including participation in decisions about dividends
or other distributions;• material transactions between the entity and the investee;• interchange of managerial personnel; or• provision of essential technical information.
In assessing whether potential voting rights contribute to significant influence, the entity examines all facts and circumstances (including the terms of exercise of the potential voting rights and any other contractual arrangements whether considered individually or in combination) that affect potential rights, except the intentions of management and the financial ability to exercise or convert those potential rights. Management has one representative out of eight on the Board of Playa.
Management has previously concluded, given its participation in the policy-making decisions, significant involvement in, and influence over strategic financial and operational decision-making of Playa, that it has significant influence over Playa and as such was of the view that SGJ’s strategic investment in Playa should be treated as an investment in associate in accordance with IAS 28, even though Sagicor owns less than 20% of Playa’s shares. Subsequent to the year end, SGJ has sold a portion of its investment as part of Playa’s secondary public offering and transferred the remaining shares to SFCL (see note 50). Management concluded that the investment in Playa did not meet the definition of held for sale as at December 31, 2020.
Notes to the Financial Statements SAGICOR FINANCIAL COMPANY Ltd. (formerly Sagicor Financial Corporation Limited)Year ended December 31, 2020 and December 31, 2019 Amounts expressed in US $000
175

43
4 SEGMENTS (continued)
.
4 SEGMENTS
The management structure of the Group consists of the parent company Board of Directors, the Group Chief Executive Officer (CEO), subsidiary company Boards of Directors and subsidiary company CEOs. For the parent company and principal subsidiaries, there are executive management committees made up of senior management who advise the respective CEOs. The principal subsidiaries have a full management governance structure, a consequence of them being regulated insurance and financial services entities, and of the range and diversity of their products and services.
The Group CEO serves as Board Chairman or as a Board Member of the principal subsidiaries and is the Group’s Chief Operating decision-maker. Through subsidiary company reporting, the Group CEO obtains details of Group performance and of resource allocation needs. Summarisation of planning
and results and prioritisation of resource allocation is done at the parent company level where strategic decisions are taken.
In accordance with the relevant financial reporting standard, the Group has determined that there are three principal subsidiary Groups which represent the reportable operating segments of Sagicor.
These segments and other Group companies are set out in the following sections.
Details of the discontinued operating segment are set out in note 38.
(a) Sagicor Life
This group comprises Sagicor Life Inc, its branches and associates, and certain of its subsidiaries in Barbados, Trinidad & Tobago, Eastern Caribbean, Dutch Caribbean, Bahamas and Central America.
The companies comprising this segment are set out in the following table.
Effective Sagicor Life Segment Companies
Country of Principal Activities Shareholders’
Incorporation Interest
Life and health insurance, annuities and pension administration services
Sagicor Life Inc Barbados 100%
Life and health insurance, annuities and pension administration services
Sagicor Life (Eastern Caribbean) Inc.(1)
St. Lucia 100%
Life and health insurance, annuities and pension administration services
Sagicor Life Aruba NV Aruba 100%
Capital Life Insurance Company Bahamas Limited
Life insurance The Bahamas 100%
Sagicor Panamá, SA Life and health insurance Panamá 100%
Nationwide Insurance Company Limited
Life insurance Trinidad & Tobago 100%
Sagicor International Management Services Inc
Investment management USA 100%
(1) Sagicor Life (Eastern Caribbean) Inc became a subsidiary of Sagicor Financial CorporationLimited on October 10, 2014 and a subsidiary of the Group on October 10, 2014. Thecompany commenced operations on May 31, 2019.
Associates
FamGuard Corporation Limited
Investment holding company The Bahamas 20%
Principal operating company: Family Guardian Insurance Company Limited
Life and health insurance and annuities The Bahamas 20%
Notes to the Financial Statements SAGICOR FINANCIAL COMPANY Ltd. (formerly Sagicor Financial Corporation Limited)Year ended December 31, 2020 and December 31, 2019 Amounts expressed in US $000
176

.
Effective Sagicor Jamaica Segment Companies (continued)
Country of Principal Activities Shareholders’
Incorporation Interest
Sagicor Insurance Managers Limited
Captive insurance management services
The Cayman 49.11%
Islands
Sagicor Property Services Limited Property management Jamaica 49.11%
Sagicor Investments Jamaica Limited
Investment banking Jamaica 49.11%
Sagicor Bank Jamaica Limited Commercial banking Jamaica 49.11%
Insurance holding LOJ Holdings Limited Jamaica 100%
company
Sagicor Securities Jamaica Limited Securities trading Jamaica 49.11%
Travel Cash Jamaica Limited Microfinance Jamaica 25.05%
Sagicor Real Estate X-Fund Limited
Investment in real St. Lucia 14.39%
estate activities Hospitality and real estate investment
X Fund Properties Limited Jamaica 14.39%
X Fund Properties LLC Hospitality USA 14.39%
Jamziv MoBay Jamaica Portfolio Limited
Holding Company Jamaica 8.75%
Phoenix Equity Holdings Limited (1) Holding Company Barbados 49.11% Advantage General Insurance Co. Limited (note 37)
Property and casualty insurance
Jamaica 29.47%
Real estate Bailey Williams Limited (note 37) Jamaica 34.38%
development Associate and joint venture Sagicor Costa Rica SCR, S.A. Life insurance Costa Rica 24.56% Playa Hotel & Resorts N.V. (note 6.1)
Hospitality Netherlands 2.41%
4 SEGMENTS (continued) 4 SEGMENTS (continued)
Associates Property ownership and management
RGM Limited Trinidad & Tobago 33%
Primo Holding Limited Property investment Barbados 38%
(b) Sagicor Jamaica
This segment comprises the Sagicor Jamaica Group of companies, which conduct life, health, annuity, property and casualty insurance business, pension administration services, banking and financial services, hospitality and real estate investment services in Jamaica, Cayman Islands Costa Rica and USA. The companies comprising this segment are as follows:
Effective Sagicor Jamaica Segment Companies
Country of Principal Activities Shareholders’
Incorporation Interest
Sagicor Group Jamaica Limited
Group holding company Jamaica 49.11%
Sagicor Life Jamaica Limited
Life and health insurance and annuities
Jamaica 49.11%
Sagicor Life of the Cayman Islands Limited
The Cayman Life insurance 49.11%
Islands Sagicor Investments Cayman Ltd.
The Cayman Investment services 49.11%
Islands Sagicor Pooled Investment Funds Limited
Pension fund management Jamaica 49.11%
Employee Benefits Administrator Limited
Pension administration services
Jamaica 49.11%
Sagicor Re Insurance Limited
Property and casualty insurance
The Cayman 49.11%
Islands Sagicor Insurance Brokers Limited
Insurance brokerage Jamaica 49.11%
Sagicor International Administrators Limited
Group insurance Jamaica 49.11%
administration
44
Notes to the Financial Statements SAGICOR FINANCIAL COMPANY Ltd. (formerly Sagicor Financial Corporation Limited)Year ended December 31, 2020 and December 31, 2019 Amounts expressed in US $000
177

(1)
4 SEGMENTS (continued) 4 SEGMENTS (continued) (d) Head office function and other operating companies
(b) Sagicor Jamaica (continued)Effective
Control of Sagicor Group Jamaica Limited is established through the following: Head office and other Group Companies
Country of Principal Activities Shareholders’
• The Group’s effective shareholder’s interest gives it the power to appoint the directors ofthe company and thereby direct relevant activities.The Group is exposed to the variable returns from its effective shareholder's interest.
Incorporation Interest
Sagicor Financial Company Ltd.(1) Group parent company Bermuda 100% •
Sagicor Financial Corporation Limited
Holding company Bermuda 100% !"# The company became a subsidiary of Sagicor Investments Jamaica Limited on July 19, 2019
and a subsidiary of the Group on July 19, 2019. Sagicor General Insurance Inc (2)
Property and casualty insurance
Barbados 99.30%
(c) Sagicor Life USA Loan and lease financing, and deposit- taking
Sagicor Finance Inc St. Lucia 70%
This segment comprises Sagicor’s life insurance operations in the USA and comprises the following: Sagicor Investments Trinidad & Tobago Limited(3) Effective Investment management Trinidad & Tobago 100%
Sagicor Life USA Segment Companies
Country of Principal Activities Shareholders’
Incorporation Sagicor Asset Management Inc. Investment management Barbados 100% Interest
Sagicor Asset Management (Eastern Caribbean) Limited
Investment management Barbados 100% Sagicor Life Insurance Company
Life insurance and annuities USA - Texas 100% Sagicor Special Opportunity Funds(4) Investment management Barbados 100%
Sagicor USA Inc Insurance holding company USA - Delaware 100% Farming and real estate development
Barbados Farms Limited Barbados 77%
Sage Distribution, LLC Life insurance and annuities USA - Delaware 100% Mutual fund holding company
Sagicor Funds Incorporated Barbados 100% Sage Partners, LLC Life insurance and annuities USA - Delaware 100%
Financial services Sagicor Financial Partners, LLC
The Mutual Financial Services Inc Barbados 73% Life insurance and annuities USA - Delaware 51% holding company
Sagicor Finance Limited Group financing vehicle The Cayman Islands 100% Sagicor Finance (2015) Limited Group financing vehicle The Cayman Islands 100%
45
• The Group has the ability to use the power to affect the amount of investor's returns.
(1) Sagicor Financial Company Ltd. formerly Alignvest Acquisition II Corporation effective December5, 2019, became a member of the Group.
(2) At December 31, 2019, the effective shareholders’ interest was 98%. Sagicor continues to acquireshares of Sagicor General Insurance Inc with a view to achieving an ownership interest of 100%.
(3) Sagicor Investments Trinidad & Tobago Limited, formerly Sagicor Asset Management (T&T) Limited.(4) Sagicor Special Opportunity Funds was formed during the year but is not yet operational.
Notes to the Financial Statements SAGICOR FINANCIAL COMPANY Ltd. (formerly Sagicor Financial Corporation Limited)Year ended December 31, 2020 and December 31, 2019 Amounts expressed in US $000
178

4 SEGMENTS (continued)
(d) Head office function and other operating companies
Effective Head office and other Group Companies
Country of Principal Activities Shareholders’
Incorporation Interest
Sagicor Reinsurance Bermuda Ltd (1)
Reinsurance Bermuda 100%
1222948 B.C. Ltd. (2) Corporate management Canada 100%
The Estates Group Holdings Limited
Holding company Barbados 100%
The Estates (Senior Care Services) Limited
Retirement Community Barbados 100%
The Estates (Senior Care Properties) Limited
Retirement Community Barbados 100%
The Estates (Residential Properties) Limited
Retirement Community Barbados 100%
The Estates (Management Services) Limited (3)
Retirement Community Barbados 100%
46
(1) Sagicor Reinsurance Bermuda became a subsidiary of Sagicor Financial Corporation Limited onOctober 4, 2017 and a subsidiary of the Group on October 4, 2017. During the period ended June30, 2020, SRBL executed a reinsurance arrangement with Sagicor Insurance Company (“SLIC”)through a segregated account of SRBL (see note 39). Through this arrangement, SLIC transferredthe insurance risks associated with certain life products, and financial instruments supporting thoseliabilities, to SRBL for a ceding commission. This ceding commission will be used to continue thegrowth of business in the USA. At the year end, the financial statements reflect the consolidatedassets and reserves of each of the subsidiaries and the inter-entity balances have been eliminated.
(2) 1222948 B.C. Ltd. became a subsidiary of Sagicor Financial Corporation Limited on September 11,2019.
(3) The Estates (Management Services) Limited became a subsidiary of The Estates Group HoldingsLimited on October 22, 2019.
Notes to the Financial Statements SAGICOR FINANCIAL COMPANY Ltd. (formerly Sagicor Financial Corporation Limited)Year ended December 31, 2020 and December 31, 2019 Amounts expressed in US $000
179

47
4.1 Statement of income by segment
2020 Sagicor Life Sagicor Jamaica
Sagicor Life USA
Head office and other Adjustments Total
Net premium revenue 414,240 355,406 597,068 36,713 - 1,403,427Gain on derecognition of amortised cost investments 623 8,271 (5) - - 8,889 Gain / (loss) on derecognition of assets carried at FVOCI 2,847 21,704 (4,204) (178) - 20,169
Interest income earned from financial assets measured at amortised cost and FVOCI 74,828 160,472 74,820 4,639 - 314,759 Other investment income 4,148 (14,266) 18,903 7,469 (110) 16,144 Credit impairment losses (7,450) (12,083) (4,002) (462) - (23,997)Fees and other revenue 11,374 112,446 (3,639) 19,344 (549) 138,976
Inter-segment revenue 22,713 - - 7,668 (30,381) -
Total revenue, net 523,323 631,950 678,941 75,193 (31,040) 1,878,367
Net policy benefits 220,707 231,006 177,244 15,643 - 644,600
Net change in actuarial liabilities 97,026 (26,298) 463,438 - - 534,166 Interest costs 12,663 27,239 2,463 528 - 42,893 Administrative expenses 80,732 166,594 33,981 57,634 1,626 340,567Commissions and premium and asset taxes 44,843 54,100 27,617 9,512 - 136,072
Finance costs 70 7,886 322 36,607 - 44,885 Depreciation and amortisation 8,945 20,249 4,247 6,118 - 39,559 Inter-segment expenses 4,118 2,072 4,271 21,822 (32,283) -
Total benefits and expenses 469,104 482,848 713,583 147,864 (30,657) 1,782,742 Loss arising on business combinations, acquisitions and divestitures - (1,262) - - - (1,262) Loss on impairment of associates and joint ventures - (31,804) - - - (31,804) Share of operating income / (loss) of associates and joint ventures 3,250 (38,207) - - - (34,957)
Segment income / (loss) before taxes 57,469 77,829 (34,642) (72,671) (383) 27,602 Income taxes (8,386) (40,034) 7,517 (1,426) (403) (42,732)
Segment net income / (loss) from continuing operations 49,083 37,795 (27,125) (74,097) (786) (15,130)
Net loss attributable to non-controlling interests - (12,726) - (158) - (12,884)
Total comprehensive income / (loss) attributable to shareholders - continuing operations 56,749 41,327 (25,664) (74,337) (1,120) (3,045)
Notes to the Financial Statements SAGICOR FINANCIAL COMPANY Ltd. (formerly Sagicor Financial Corporation Limited)Year ended December 31, 2020 and December 31, 2019 Amounts expressed in US $000
180

48
4.1 Statement of income by segment
2019 Sagicor Life Sagicor Jamaica
Sagicor Life USA
Head office and other Adjustments Total
Net premium revenue 409,161 350,054 444,697 37,632 - 1,241,544Gain on derecognition of amortised cost investments 455 13,285 (30) (790) - 12,920
Gain on derecognition of assets carried at FVOCI 6,158 21,299 2,497 - - 29,954Interest income earned from financial assets measured at amortised cost and FVOCI 74,164 160,322 70,201 3,327 - 308,014Other investment income 10,845 52,146 46,923 2,470 (584) 111,800Credit impairment losses 1,434 (6,089) (415) 193 - (4,877)
Fees and other revenue 11,027 144,293 (2,355) 17,152 (2,146) 167,971Inter-segment revenue 19,965 - - 41,692 (61,657) -
Total revenue, net 533,209 735,310 561,518 101,676 (64,387) 1,867,326
Net policy benefits 221,331 219,056 115,237 21,925 - 577,549Net change in actuarial liabilities 94,082 59,270 325,930 - 5,501 484,783Interest costs 15,951 30,611 7,121 509 - 54,192Administrative expenses 77,908 180,410 35,611 36,934 2,373 333,236
Commissions and premium and asset taxes 48,273 50,704 26,253 9,485 - 134,715Finance costs 57 7,806 518 35,252 - 43,633Depreciation and amortisation 7,394 20,385 4,730 2,997 - 35,506Listing expense and other transaction costs - - - 43,396 - 43,396
Inter-segment expenses 5,025 2,456 1,311 19,281 (28,073) -
Total benefits and expenses 470,021 570,698 516,711 169,779 (20,199) 1,707,010 Loss arising on business combinations, acquisitions and divestitures (379) - - - - (379) Share of operating income of associates and joint ventures 3,980 (633) - - - 3,347
Segment income / (loss) before taxes 66,789 163,979 44,807 (68,103) (44,188) 163,284 Income taxes (7,868) (40,426) (9,410) (2,170) 164 (59,710)
Segment net income / (loss) from continuing operations 58,921 123,553 35,397 (70,273) (44,024) 103,574
Net income / (loss) attributable to non-controlling interests - 62,184 - (654) - 61,530
Total comprehensive income / (loss) attributable to shareholders - continuing operations 68,734 74,568 48,259 (67,680) (43,210) 80,671
Notes to the Financial Statements SAGICOR FINANCIAL COMPANY Ltd. (formerly Sagicor Financial Corporation Limited)Year ended December 31, 2020 and December 31, 2019 Amounts expressed in US $000
181

49
4.2 Variations in segment income
Variations in segment income may arise from non-recurring or other significant factors. The most common factors contributing to variations in segment income are as follows:
(i) Credit impairment losses - financial investments
The determination of ECL involves judgement in establishing various assumptions based on economic conditions and historical trends. Changes in assumptions will impact the ECL allowances recorded in the income statement.
Significant changes in borrowers classified as Stage 3 will be triggered by changes affecting individual borrowers or groups of borrowers, leading to significant variations in losses recorded in the income statement.
(ii) Fair value gains / (losses) of financial investments
Significant gains and losses may be triggered by changes in market prices of assets carried at fair value.
For FVOCI investments, management may be able to time the disposal of such investments and consequently, impact the quantum of the realised gain or loss recognised in the statement of income.
For FVTPL investments, management may also able to time the disposal of such investments. However, since the majority of these assets fund unit linked liabilities, the impact to Group net income is mitigated by any increased return due to the holders of the unit linked liabilities.
4.2 Variations in segment income (continued)
(iii) Gains on acquisitions and divestitures
On acquisition of a business or portfolio, if the fair value of the net assets acquired exceeds the total consideration transferred, the difference is recognised directly in the statement of income. Similarly, on sale if the consideration received exceeds the carrying value of the business or portfolio a gain is recognised in the statement of income. As acquisitions and disposals occur infrequently and with no consistent trend, the gain or loss recorded in the income statement may vary significantly from year to year.
(iv) Foreign exchange gains and losses
Movements in foreign exchange rates may generate significant exchange gains or losses when the foreign currency denominated monetary assets and liabilities are retranslated to the relevant functional currency at the date of the financial statements.
(v) Movements in actuarial liabilities arising from changes in assumptions
The change in actuarial liabilities for the year includes the effects arising from changes in assumptions. The principal assumptions in computing the actuarial liabilities on life and annuity contracts relate to mortality and morbidity, lapse, investment yields, asset default and operating expenses and taxes. As the process of changes in assumptions is applied to all affected insurance contracts, changes in assumptions may have a significant effect in the period in which they are recorded.
(vi) Impairment of investments in associates and joint ventures
Losses on impairment of investments in associates and joint ventures may result when impairment assessments indicate that impairment of investments in associates and joint ventures has occurred. An impairment assessment is performed when an investment’s value, based on quoted market prices, is lower than its carrying value recorded by the Group, or when conditions impacting the associate or joint venture suggest that the Group’s investment in associate or joint venture may be impaired.
Notes to the Financial Statements SAGICOR FINANCIAL COMPANY Ltd. (formerly Sagicor Financial Corporation Limited)Year ended December 31, 2020 and December 31, 2019 Amounts expressed in US $000
182
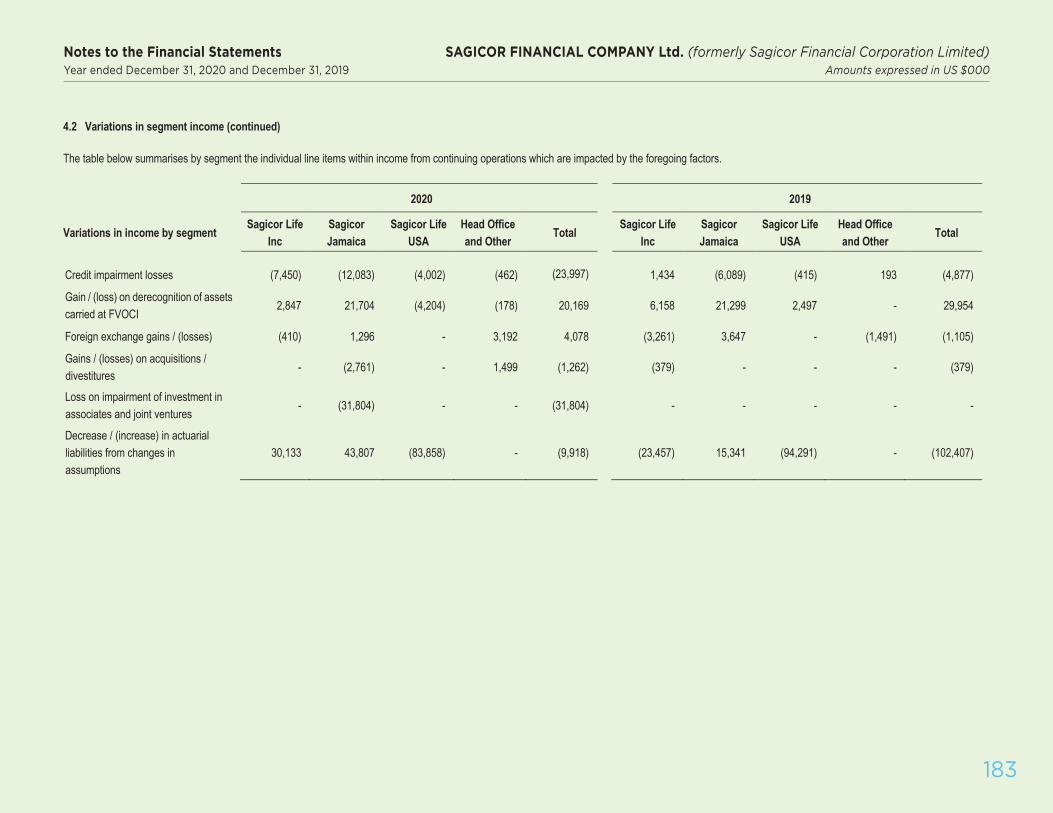
50
4.2 Variations in segment income (continued)
The table below summarises by segment the individual line items within income from continuing operations which are impacted by the foregoing factors.
2020 2019
Variations in income by segment Sagicor Life
Inc Sagicor Jamaica
Sagicor Life USA
Head Office and Other
Total Sagicor Life
Inc Sagicor Jamaica
Sagicor Life USA
Head Office and Other
Total
Credit impairment losses (7,450) (12,083) (4,002) (462) (23,997) 1,434 (6,089) (415) 193 (4,877)
Gain / (loss) on derecognition of assets carried at FVOCI
2,847 21,704 (4,204) (178) 20,169 6,158 21,299 2,497 - 29,954
Foreign exchange gains / (losses) (410) 1,296 - 3,192 4,078 (3,261) 3,647 - (1,491) (1,105)
Gains / (losses) on acquisitions / divestitures
- (2,761) - 1,499 (1,262) (379) - - - (379)
Loss on impairment of investment in associates and joint ventures
- (31,804) - - (31,804) - - - - -
Decrease / (increase) in actuarial liabilities from changes in assumptions
30,133 43,807 (83,858) - (9,918) (23,457) 15,341 (94,291) - (102,407)
Notes to the Financial Statements SAGICOR FINANCIAL COMPANY Ltd. (formerly Sagicor Financial Corporation Limited)Year ended December 31, 2020 and December 31, 2019 Amounts expressed in US $000
183

51
4.3 Other comprehensive income
Variations in other comprehensive income may arise also from non-recurring or other significant factors. The most common are as follows:
(i) Unrealised investment gains and losses
Fair value investment gains and losses are recognised on the revaluation of debt and equity securities classified as FVOCI. Therefore, significant gains and losses may be triggered by changes in market prices.
(ii) Changes in actuarial liabilities
Changes in unrealised investment gains identified in (i) above may also generate significant, but off-setting, changes in actuarial liabilities as a result of the use of asset liability matching in the liability estimation process.
4.3 Other comprehensive income (continued)
(iii) Foreign exchange gains and losses
Movements in foreign exchange rates may generate significant exchange gains or losses on the retranslation of the financial statements of foreign currency reporting units.
(iv) Defined benefit plans’ gains and losses
Experience adjustments and changes in actuarial assumptions gives rise to gains or losses on defined benefit plans.
The table below summarises by segment the individual line items within other comprehensive income from continuing operations which are impacted by the foregoing factors.
Variations in other comprehensive income by segment
Sagicor Life Sagicor Jamaica Sagicor Life USA
Head office and
other
Adjustments Total
2020 Unrealised investment gains 5,536 44,399 46,841 490 - 97,266
Changes in actuarial liabilities 2,421 (5,236) (49,158) - - (51,973)Retranslation of foreign currency operations (235) (37,703) - (57) (200) (38,195)Gains / (losses) on defined benefit plans 3,204 516 - (246) - 3,474
2019 Unrealised investment gains 28,630 66,127 73,026 924 - 168,707Changes in actuarial liabilities (22,513) (14,510) (57,976) - - (94,999)Retranslation of foreign currency operations 545 (17,889) - 407 296 (16,641)
Gains on defined benefit plans 6,624 4,304 - 270 - 11,198
Notes to the Financial Statements SAGICOR FINANCIAL COMPANY Ltd. (formerly Sagicor Financial Corporation Limited)Year ended December 31, 2020 and December 31, 2019 Amounts expressed in US $000
184

52
4.4 Statement of financial position by segment
Sagicor Life Sagicor Jamaica Sagicor Life USA Head office and other
Adjustments Total
2020 Financial investments 1,551,028 2,714,543 2,556,319 416,679 - 7,238,569
Other external assets 337,603 730,018 767,817 192,306 - 2,027,744 Inter-segment assets 390,589 10,572 58,950 185,232 (645,343) -
Total assets 2,279,220 3,455,133 3,383,086 794,217 (645,343) 9,266,313
Policy liabilities 1,477,944 824,538 2,507,838 72,661 - 4,882,981Other external liabilities 82,757 1,690,379 452,582 499,404 - 2,725,122Inter-segment liabilities 126,407 12,943 152,797 353,196 (645,343) -
Total liabilities 1,687,108 2,527,860 3,113,217 925,261 (645,343) 7,608,103
Net assets 592,112 927,273 269,869 (131,044) - 1,658,210Net assets attributable to non-controlling interests - 530,284 - 16,539 - 546,823
2019 Financial investments 1,438,618 2,670,339 2,040,771 535,916 - 6,685,644Other external assets 341,370 795,798 735,747 170,312 - 2,043,227Inter-segment assets 335,784 15,903 65,224 141,760 (558,671) - Total assets 2,115,772 3,482,040 2,841,742 847,988 (558,671) 8,728,871
Policy liabilities 1,379,761 865,914 1,997,405 72,873 - 4,315,953Other external liabilities 77,259 1,673,057 437,936 474,886 - 2,663,138Inter-segment liabilities 120,000 6,097 110,835 321,739 (558,671) -
Total liabilities 1,577,020 2,545,068 2,546,176 869,498 (558,671) 6,979,091
Net assets 538,752 936,972 295,566 (21,510) - 1,749,780
Net assets attributable to non-controlling interests - 577,429 - 17,077 - 594,506
Notes to the Financial Statements SAGICOR FINANCIAL COMPANY Ltd. (formerly Sagicor Financial Corporation Limited)Year ended December 31, 2020 and December 31, 2019 Amounts expressed in US $000
185

53
4.5 Segment cash flows
(a) Additions to non-current assets by segment
Segment operations include certain non-current assets comprising investment property, property, plant and equipment, investment in associated companies and intangible assets. Additions to these categories for the year are as follows:
2020 2019
Sagicor Life 8,139 5,771 Sagicor Jamaica 16,933 23,697 Sagicor Life USA 14,829 1,753 Head office and other 2,792 1,342
42,693 32,563
(b) Summarised cash flows of the Sagicor Jamaica segment
Set out below are the summarised cash flows of the Sagicor Jamaica segment which has material non-controlling interests.
2020 2019
Net cash flows: Operating activities 184,274 70,626 Investing activities (8,552) (37,024) Financing activities (39,223) (26,704)
Effects of exchange rate changes (4,930) (1,812) Net change in cash and cash equivalents for the year 131,569 5,086 Cash and cash equivalents, beginning of year 129,822 124,736 Cash and cash equivalents, end of year 261,391 129,822
4.6 Products and services
Total external revenues relating to the Group’s products and services are summarised as follows:
2020 2019
Life, health and annuity insurance contracts issued to individuals 1,270,678 1,214,656
Life, health and annuity insurance and pension administration contracts issued to groups
304,785 317,892
Property and casualty insurance 82,276 61,960 Banking, investment management and other financial services 171,192 192,246 Hospitality services 14,251 41,693 Unallocated revenues 35,185 38,879
1,878,367 1,867,326
4.7 Geographical areas
The Group operates in certain geographical areas which are determined by the location of the subsidiary or branch initiating the business. Group operations in geographical areas include certain non-current assets comprising investment property, property, plant and equipment, associates and intangible assets. Total external revenues and non-current assets by geographical area are summarised below.
External revenue Non-current assets
2020 2019 2020 2019
Barbados 185,631 178,959 171,889 179,905
Jamaica 576,118 657,191 111,902 141,973
Trinidad & Tobago 255,861 239,463 66,999 69,382
Other Caribbean 164,800 191,084 28,476 27,291
USA 695,957 600,629 227,261 304,318
1,878,367 1,867,326 606,527 722,869
Notes to the Financial Statements SAGICOR FINANCIAL COMPANY Ltd. (formerly Sagicor Financial Corporation Limited)Year ended December 31, 2020 and December 31, 2019 Amounts expressed in US $000
186

54
4.8 Revenues from fees recognised
The following table discloses revenue from fees recognised by reportable segment.
Fees recognised
Year ended December 31, 2020 - at a point
in time- over
timeTotal
Sagicor Life - 8,159 8,159
Sagicor Jamaica 40,680 50,086 90,766
Sagicor USA 148 - 148
Head office and other - 2,976 2,976
40,828 61,221 102,049
Fees recognised
Year ended December 31, 2019 - at a point
in time- over
timeTotal
Sagicor Life - 7,909 7,909
Sagicor Jamaica 57,164 74,933 132,097
Sagicor USA 224 - 224
Head office and other - 2,968 2,968
57,388 85,810 143,198
5 INVESTMENT PROPERTY
The movement in investment property for the year is as follows:
2020 2019 2018
Balance, beginning of year 95,577 93,494 80,816
Additions at cost 266 82 50
Amounts assumed on acquisition (note 37) - 5,530 16,444
Disposals (15,256) (2,238) (2,613)
Fair value changes recorded in net investment income (598) (566) (1,090)
Effects of exchange rate changes (1,694) (725) 12
Balance, end of year 78,295 95,577 93,494
Investment property includes $8,646 (2019 - $9,516) which represents the Group’s proportionate interest in joint operations summarised in the following table.
Pension Funds managed by the Group own the remaining 50% interest in freehold lands in Barbados, and a 33% interest in a freehold office building in Barbados.
Percentage Country Description of property ownership
recognised Freehold lands 50%
Barbados Freehold office buildings 25% - 33%
Trinidad & Tobago Freehold office building 60%
Notes to the Financial Statements SAGICOR FINANCIAL COMPANY Ltd. (formerly Sagicor Financial Corporation Limited)Year ended December 31, 2020 and December 31, 2019 Amounts expressed in US $000
187

55
6 ASSOCIATES AND JOINT VENTURES
6.1 Interests in Associates and Joint Ventures
Name of Entity Country of Incorporation % interest recognised Nature of
relationship Measurement Method
Carrying Amount 2020 2019 2020 2019
RGM Limited Trinidad & Tobago 33% 33% Associate Equity Method 26,092 25,315 FamGuard Corporation Limited (1) Bahamas 20% 20% Associate Equity Method 17,837 16,703 Primo Holding Limited Barbados 38% 38% Associate Equity Method 312 318 Sagicor Costa Rica SCR, S.A. Costa Rica 50% 50% Joint Venture Equity Method 4,795 3,293 Playa Hotels and Resorts N.V. (2) United States 16% 15% Associate Equity Method 116,755 184,929
165,791 230,558
(1) FamGuard Corporation Limited is listed on the Bahamas International Securities Exchange. The proportionate share of market value calculated on the basis of the year-end closing rate of $8.40 per share was $16,800 (2019 – $15,000).
(2) On October 1, 2018, Sagicor Group Jamaica (SGJ) obtained control over Sagicor Real Estate X-Fund Limited, which in turn controlled a shareholding of 15% in Playa Hotels and Resorts NV (Playa). The management of SGJ Jamaica has one representative (out of eight) on the Board of Playa. The management of SGJ has concluded that, given its participation in the policy-making decisions of Playa, SGJ has significant influence over Playa’s financial and operating results even though SGJ controls less than 20% of Playa.
On June 12, 2020, in addition to entering into certain financing transactions to support its ongoing operations, Playa sold ordinary shares which resulted in a 0.6% dilution of Sagicor Group Jamaica Limited’s 15.4% shareholding, and ultimately the Sagicor Group’s ownership interest of 15.4%, in Playa. On June 15, 2020, Sagicor Financial Corporation Limited, the intermediate parent company of SGJ, acquiredfurther shares of Playa. This represented an increase of 1.1% in the Group’s shareholding, bringing the Group’s total shareholding in Playa to 15.9%. See note 37.1.
Following the transactions, the effective interest in Playa attributable to the shareholders of Sagicor Financial Company Ltd. is 2.41%, representing 1.11% due to the acquisition of additional shares, in addition to the effective interest of 1.30% (2019 - 1.31%).
As at December 31, the book value of Playa Hotel and Resorts was $116,755 (2019 - $184,929). At this date, the proportionate share of market value of Playa, calculated based on quoted prices by the National Association of Securities Dealers Automated Quotation (NASDAQ), was $118,378 (2019 - $166,282).
Subsequent to year end, SGJ disposed of its interest in Playa (see note 50).
Notes to the Financial Statements SAGICOR FINANCIAL COMPANY Ltd. (formerly Sagicor Financial Corporation Limited)Year ended December 31, 2020 and December 31, 2019 Amounts expressed in US $000
188

56
6.1 Interests in Associates and Joint Ventures (continued)
The reconciliation of carrying amounts for the year of the investment in associates and joint ventures is as follows:
RGM Limited FamGuard Corporation Limited
Primo Holding Limited
Sagicor Costa Rica SCR, S.A.
Playa Hotels and Resort N.V.
2020 2019 2020 2019 2020 2019 2020 2019 2020 2019
Investment, beginning of year 25,315 23,497 16,703 15,332 318 324 3,293 2,596 184,929 194,383 Additions - - - - - - - - 5,951 - Negative goodwill arising on acquisition - - - - - - - - 1,499 - Dividends received (148) - (560) (640) - - - - - - Share of income / (loss) 1,441 2,290 1,815 1,696 (6) (6) 2,193 110 (40,400) (743) Loss on impairment of investment in associates and joint ventures
- - - - - - - - (31,804) -
Share of amortisation or impairment of intangible assets which were identified on acquisition
- - (10) (10) - - - - - -
Share of income taxes (515) (531) - - - - - - - - Share of OCI - - (111) 325 - - (453) 686 (2,840) (8,802) Disposal of interest - - - - - - - - (3,112) - Effects of exchange rate changes (1) 59 - - - - (238) (99) 2,532 91 Investment, end of year 26,092 25,315 17,837 16,703 312 318 4,795 3,293 116,755 184,929
Notes to the Financial Statements SAGICOR FINANCIAL COMPANY Ltd. (formerly Sagicor Financial Corporation Limited)Year ended December 31, 2020 and December 31, 2019 Amounts expressed in US $000
189

57
6.1 Interests in Associates and Joint Ventures (continued)
The reconciliation of the share of net assets based on the summarised financial information to carrying amounts of the investment in associates and joint ventures is as follows:
RGM Limited FamGuard Corporation Limited
Primo Holding Limited
Sagicor Costa Rica SCR, S.A.
Playa Hotels and Resort N.V.
2020 2019 2020 2019 2020 2019 2020 2019 2020 2019
Net Assets 78,276 75,945 93,992 88,270 823 838 9,591 6,587 560,864 803,214 % Interest 33% 33% 20% 20% 38% 38% 50% 50% 16% 15% Share of net assets 26,092 25,315 18,799 17,654 312 318 4,795 3,293 89,664 123,111 Goodwill arising from investment in associate
- - 38 49 - - - - 47,511 77,416
Goodwill arising from associate’s investment
- - - - - - - - (12,402) (11,989)
Movement in treasury shares - - - - - - - - (4,976) (535) Fair value adjustment on consolidation - - - - - - - - (3,042) (3,074) Preference shares - - (1,000) (1,000) - - - - - - Investment, end of year 26,092 25,315 17,837 16,703 312 318 4,795 3,293 116,755 184,929
6.2 Impairment
Interest in FamGuard Corporation Limited.
An impairment assessment of FamGuard Corporation Limited was performed at the end of the year as its value based on quoted market prices is lower than its carrying value recorded by the Group.
In conducting the impairment assessment, management determined a recoverable value for Famguard, using the value in use method. To determine the value in use, management used an actuarial embedded value technique which incorporates appropriate discount rates and solvency capital requirements to determine the present value of future distributable profits. Management’s value in use calculations did not identify any impairment.
Notes to the Financial Statements SAGICOR FINANCIAL COMPANY Ltd. (formerly Sagicor Financial Corporation Limited)Year ended December 31, 2020 and December 31, 2019 Amounts expressed in US $000
190

58
6.2 Impairment (continued)
Interest in Playa Hotels and Resorts N.V.
Following the emergence of COVID-19 coronavirus, which was declared a global pandemic by the World Health organisation on March 11, 2020, the Group considered that travel restrictions, the impact on tour and holiday bookings and cancellations have resulted in a downturn in revenues and profits, thereby negatively impacting the carrying value of this asset.
Assessments of the carrying value of this investment have been performed at each quarter end. A recoverable value was determined using the value-in-use method which is a discounted cash flow technique that utilises a significant amount of judgement in estimating key variables such as earnings before interest, taxes, depreciation and amortisation (EBITDA), terminal growth rates and a discount factor. Value-in-use calculations are very sensitive to changes in these estimates. In arriving at its estimates for EBITDA, management also considered the impact of the uncertainty surrounding the COVID-19 coronavirus and its impact on the tourism sector going forward. As a result of this exercise, the investment was written down by US$31.8 million as at the year-end date.
As part of its impairment assessment, management performed the following sensitivity analyses, using reasonably possible changes in EBITDA, terminal growth rates and discount factors. The sensitivity analyses were done individually, while holding all other variables constant. In practice, this is unlikely to occur as changes in one variable can impact the others.
6.3 Commitments and contingent liabilities
Other commitments at the year-end if called are $304 (2019 – $764) and contingent liabilities exist of $50 (2019 – Nil).
Variable Change in Estimate Indicator of Estimate of additional Impairment additional
Impairment EBITDA 5% reduction Yes US$16.8 million
EBITDA 15 – 20% reduction Yes US$55.0 million – US$74.3 million
Terminal Growth 0.5% reduction Yes US$10.2 million Rates Terminal Growth 0.5% increase No N/A Rates Discount factor 0.25% percentage point reduction No N/A Discount factor 0.25% percentage point increase Yes US$5.9 million
Notes to the Financial Statements SAGICOR FINANCIAL COMPANY Ltd. (formerly Sagicor Financial Corporation Limited)Year ended December 31, 2020 and December 31, 2019 Amounts expressed in US $000
191

59
6.4 Summarised Financial Information
Summarised financial information from the financial statements of associates and joint ventures is set out in the three tables which follow.
RGM Limited FamGuard Corporation Limited
Primo Holding Limited Sagicor Costa Rica SCR, S.A.
Playa Hotels and Resorts N.V.
2020 2019 2020 2019 2020 2019 2020 2019 2020 2019 ASSETS
Property, plant and equipment 751 461 36,911 39,086 - - 452 600 1,722,434 1,917,329 Financial investments - - 288,970 261,221 - - 14,987 11,705 - - Cash resources 6,132 4,727 18,832 20,415 - - 3,979 926 171,957 20,717 Other investments and assets 122,309 124,235 15,531 20,354 1,000 1,000 12,352 15,636 221,872 243,603 Total assets 129,192 129,423 360,244 341,076 1,000 1,000 31,770 28,867 2,116,263 2,181,649
LIABILITIES Policy liabilities - - 254,553 240,005 - - 9,249 13,600 - - Notes and loans payable - - - - - - 5,800 6,007 1,244,728 1,061,620 Other liabilities 50,916 53,478 11,699 12,801 177 162 7,130 2,673 310,671 316,815 Total liabilities 50,916 53,478 266,252 252,806 177 162 22,179 22,280 1,555,399 1,378,435
Net assets 78,276 75,945 93,992 88,270 823 838 9,591 6,587 560,864 803,214
Notes to the Financial Statements SAGICOR FINANCIAL COMPANY Ltd. (formerly Sagicor Financial Corporation Limited)Year ended December 31, 2020 and December 31, 2019 Amounts expressed in US $000
192

60
6.4 Summarised Financial Information (continued)
RGM Limited FamGuard Corporation Limited
Primo Holding Limited Sagicor Costa Rica SCR, S.A.
Playa Hotels and Resorts N.V.
2020 2019 2020 2019 2020 2019 2020 2019 2020 2019 WORKING CAPITAL
Current assets 10,651 8,287 33,814 40,769 - - 22,539 17,943 254,265 144,311 Current liabilities 5,351 5,518 11,286 12,801 44 43 17,084 16,834 246,835 273,715
Net current assets / (liabilities) 5,300 2,769 22,528 27,968 (44) (43) 5,455 1,109 7,430 (129,404)
Cash and cash equivalents included in current assets
6,132 4,727 18,832 20,415 - - 3,979 926 146,151 20,717
Current financial liabilities (excluding trade and other payables and provisions) included in current liabilities
2,415 2,319 549 - - - 1,908 1,059 111,604 77,752
NON-CURRENT ASSETS / LIABILITIES Non-current assets 118,541 121,136 326,430 300,307 1,000 1,000 9,231 10,924 1,861,998 2,037,338 Non-current liabilities 45,565 47,960 254,966 240,005 133 119 5,095 5,446 1,308,564 1,104,720 Non-current financial liabilities (excluding trade and other payables and provisions) included in non-current liabilities
45,565 47,960 254,553 238,840 - - 5,093 5,446 1,179,222 983,867
Notes to the Financial Statements SAGICOR FINANCIAL COMPANY Ltd. (formerly Sagicor Financial Corporation Limited)Year ended December 31, 2020 and December 31, 2019 Amounts expressed in US $000
193

61
6.4 Summarised Financial Information (continued)
RGM Limited FamGuard Corporation Limited
Primo Holding Limited Sagicor Costa Rica SCR, S.A.
Playa Hotels and Resort N.V.
2020 2019 2020 2019 2020 2019 2020 2019 2020 2019 REVENUE Net premium revenue - - 99,506 100,427 - - 22,567 17,702 - - Hotel revenue - - - - - - - - 346,499 635,510 Net investment and other income 25,607 26,209 26,353 31,887 - - 1,956 217 - - Total revenue 25,607 26,209 125,859 132,314 - - 24,523 17,919 346,499 635,510
BENEFITS AND EXPENSES Benefits - - 76,586 85,040 - - 5,229 8,294 - - Hotel expenses - - - - - - - - 509,896 610,333 Finance costs 3,808 3,975 - - - - 396 428 81,625 44,020 Depreciation and amortisation 233 243 2,269 1,592 - - 133 88 92 102 Other expenses 17,276 14,705 36,296 38,307 16 16 12,957 8,765 261 3,093 Total benefits and expenses 21,317 18,923 115,151 124,939 16 16 18,715 17,575 591,874 657,548
INCOME BEFORE TAXES FROM CONTINUING OPERATIONS
4,290 7,286 10,708 7,375 (16) (16) 5,808 344 (245,375) (22,038)
Income taxes (1,544) (1,593) - - - - (1,424) (125) 627 17,194
NET INCOME FOR THE YEAR 2,746 5,693 10,708 7,375 (16) (16) 4,384 219 (244,748) (4,844)
Other comprehensive income - - (1,102) 276 - - (1,410) 1,371 (6,321) (30,551)
Total comprehensive income 2,746 5,693 9,606 7,651 (16) (16) 2,974 1,590 (251,069) (35,395)
Interest income - - 13,475 13,071 - - 713 586 - -
Interest expense 3,808 3,975 - - - - - - - -
Notes to the Financial Statements SAGICOR FINANCIAL COMPANY Ltd. (formerly Sagicor Financial Corporation Limited)Year ended December 31, 2020 and December 31, 2019 Amounts expressed in US $000
194

62
7 PROPERTY, PLANT AND EQUIPMENT
2020 2019
Owner-occupied properties
Owner -managed hotel
properties
Office furnishings, equipment &
vehicles
Right-of-use assets
Total Owner-
occupied properties
Owner-managed
hotel properties
Office furnishings, equipment &
vehicles
Right-of-use assets
Total
Net book value, beginning of year 110,172 96,608 53,721 29,369 289,870 104,629 98,974 58,685 - 262,288Recognised on adoption of IFRS 16 - - - - - - - - 23,853 23,853Additions at cost 270 176 17,984 14,206 32,636 906 145 12,965 14,350 28,366Additions arising from acquisitions - - - - - 7,411 - 1,252 - 8,663Transfer to intangible assets (note 8) - - (3,388) - (3,388) - - (3,031) - (3,031)Other transfers - - - (81) (81) 1,375 - (1,183) - 192Disposals and divestures - - (1,907) (4,879) (6,786) (6,180) - (192) (2,247) (8,619)Fair value changes recorded in OCI 1,818 (18,963) - - (17,145) 3,580 545 - - 4,125Depreciation charge (2,206) (2,386) (14,379) (6,150) (25,121) (1,009) (2,506) (13,922) (6,644) (24,081)Effects of exchange rate changes (1,316) 589 (1,175) (1,514) (3,416) (540) (550) (853) 57 (1,886)Net book value, end of year 108,738 76,024 50,856 30,951 266,569 110,172 96,608 53,721 29,369 289,870
Represented by: Cost or valuation 111,073 85,957 161,705 42,582 401,317 112,465 104,120 165,285 36,024 417,894 Accumulated depreciation (2,335) (9,933) (110,849) (11,631) (134,748) (2,293) (7,512) (111,564) (6,655) (128,024)
108,738 76,024 50,856 30,951 266,569 110,172 96,608 53,721 29,369 289,870
Owner-occupied properties consist mainly of commercial offices but include lands of $35,245 (2019 – 35,636) utilised largely in farming operations.
Owner-occupied properties, equipment & vehicles include operating leases held as lessor.
Notes to the Financial Statements SAGICOR FINANCIAL COMPANY Ltd. (formerly Sagicor Financial Corporation Limited)Year ended December 31, 2020 and December 31, 2019 Amounts expressed in US $000
195

63
8 INTANGIBLE ASSETS
8.1 Analysis of intangible assets and changes for the year
2020 2019
Goodwill Customer &
broker relationships
Trade Names Software Total Goodwill Customer &
broker relationships
Trade Names
Software Total
Net book value, beginning of year 63,325 16,331 3,320 23,888 106,864 56,455 13,199 2,590 25,068 97,312
Additions at cost - - - 3,840 3,840 - - - 4,738 4,738 Transfer from property, plant and equipment (note 7) - - - 3,388 3,388 - - - 3,031 3,031 Identified on acquisition (note 37):
Advantage General Insurance Company Ltd 163 - - - 163 7,795 5,599 933 694 15,021
Subsidiary acquisitions and disposals - - - (2) (2) - - - - -
Amortisation/impairment charges (3,000) (2,118) (119) (9,191) (14,428) - (2,006) (127) (9,282) (11,415)
Effects of exchange rate changes (2,101) (1,041) (231) (580) (3,953) (925) (461) (76) (361) (1,823)
Net book value, end of year 58,387 13,172 2,970 21,343 95,872 63,325 16,331 3,320 23,888 106,864
Represented by: Cost or valuation 61,387 36,874 6,532 89,320 194,113 63,325 39,505 7,021 85,309 195,160
Accumulated depreciation and impairments (3,000) (23,702) (3,562) (67,977) (98,241) - (23,174) (3,701) (61,421) (88,296)
58,387 13,172 2,970 21,343 95,872 63,325 16,331 3,320 23,888 106,864
Notes to the Financial Statements SAGICOR FINANCIAL COMPANY Ltd. (formerly Sagicor Financial Corporation Limited)Year ended December 31, 2020 and December 31, 2019 Amounts expressed in US $000
196

64
8.2 Impairment of intangible assets
Goodwill arises from past acquisitions and is allocated to cash-generating units (CGUs). Goodwill is tested annually for impairment. The recoverable amount of a CGU is determined as the higher of its value in use or its fair value less costs to sell.
For those CGU’s where the fair value less costs of disposal methodology is used, financial projections are used as inputs to determine maintainable earnings over time to which is applied an appropriate earnings’ multiple. For those CGU's where the value in use methodology is used, cash flows are extracted from financial projections to which are applied appropriate discount factors and residual growth rates, or alternatively, the cash flows from the financial projections are extended to 50 years using an actuarial appraisal value technique which incorporates appropriate discount rates and solvency capital requirements. As disclosed in note 2.7(a), goodwill is allocated to the Group’s reportable operating segments.
The Group obtains independent professional advice in order to select the relevant discount factors, residual growth rates and earnings multiples.
The carrying values of goodwill and the impairment test factors used are considered in the following sections.
(a) Sagicor Life operating segment
2020 2019
Carrying value of goodwill 26,554 26,552
8.2 Impairment of intangible assets (continued)
(i) Years ended December 31, 2020 & 2019
An actuarial appraisal value technique was adopted to test goodwill impairment. The principal assumptions included the following:
• Discount rates of 10% (2019, 10%) for individual life and annuity in force business;• New individual life and annuity business was included for the seven-year period 2021 to
2027, (seven year period 2020 to 2026);• Annual growth rate for new individual life and annuity business were 8.0% - 51.0% for 2021
and 4.0% - 10.0 % from 2022 to 2027 (2019 - 10.0% - 47.0% for the year 2020 and 3.0% to 11.0% from 2021 to 2026);
• Discount rates of 14% (2019, 14%) for new individual life and annuity business;• Required Minimum Continuing Capital and Surplus Ratio (MCCSR) of 175% (2019 – 175%).
Sensitivity
The excess of the appraisal value over carrying value of the operating segment was also tested by varying the discount rates and capital ratios. The results are set out in the following tables.
Sagicor Life Inc Segment MCCSR target ratio
Low Mid High
Discount rate Inforce New business 150% 175% 200%
Low 8% 12% 361,006 353,634 346,085
Mid 10% 14% 179,869 167,736 155,311
High 12% 16% 45,025 29,783 14,206
Notes to the Financial Statements SAGICOR FINANCIAL COMPANY Ltd. (formerly Sagicor Financial Corporation Limited)Year ended December 31, 2020 and December 31, 2019 Amounts expressed in US $000
197

65
8.2 Impairment of intangible assets (continued)
(b) Sagicor Jamaica operating segment
2020 2019
Carrying value of goodwill 29,152 31,092
The fair value less costs of disposal methodology was adopted to test goodwill impairment in both years. The after-tax multiple used for the segment 11.0 (2019 – 11.2) was derived from a pre-tax factor of 8.1 (2019 – 8.4) using an iterative method.
Sensitivity
The possible impairment of goodwill is sensitive to changes in earnings multiples and after-tax earnings. This is illustrated in the following table.
2020 test
Scenario 1 Scenario 2 Scenario 3
After-tax earnings multiples 11.0 9.4 6.6
Reduction in forecast earnings n/a 10% 10%
Excess of recoverable amount (of 49.11% interest) 195,741 93,847 n/a
Impairment (of 49.11% interest) Nil Nil (44,405)
8.2 Impairment of intangible assets (continued)
(c) Sagicor General Insurance Inc
2020 2019
Carrying value of goodwill 2,681 5,681
The value in use methodology has been used to test goodwill impairment in both years. The pre-tax discount factor was 18.9% (2019 – 18.0%) which was derived from an after-tax factor of 15.0% (2019 – 14.0%) using an iterative method. The residual growth rate was 2.0% (2019 – 2.5%).
During the year, goodwill of US$3.0 million has been impaired relating to Sagicor General Insurance Inc. This amount is included within Depreciation and amortisation in the consolidated statement of income.
Sensitivity
The possible impairment of goodwill is sensitive to changes in the after-tax discount factor and residual growth rate. This is illustrated in the following table.
2020 test
Scenario 1 Scenario 2 Scenario 3
After-tax discount factor 15.0 14.5 16.5
Residual growth rate 2.0 2.0 1.5
Excess of recoverable amount 1,473 2,793 Nil
Impairment Nil Nil (2,028)
Notes to the Financial Statements SAGICOR FINANCIAL COMPANY Ltd. (formerly Sagicor Financial Corporation Limited)Year ended December 31, 2020 and December 31, 2019 Amounts expressed in US $000
198

66
9 FINANCIAL INVESTMENTS
9.1 Analysis of financial investments
2020 2019
Carrying value
Fair value
Carrying value
Fair value
Investments at FVOCI:
Debt securities and money market funds 3,611,917 3,611,917 3,673,421 3,673,421
Equity securities 1,054 1,054 1,291 1,291
3,612,971 3,612,971 3,674,712 3,674,712
Investments at FVTPL:
Debt securities 348,874 348,874 243,107 243,107
Equity securities 659,519 659,519 370,173 370,173
Derivative financial instruments 37,188 37,188 36,891 36,891
Mortgage loans 26,065 26,065 28,933 28,933
1,071,646 1,071,646 679,104 679,104
Investments at amortised cost:
Debt securities (note 41.5 (d)) 1,269,486 1,490,099 1,148,739 1,361,973
Mortgage loans 393,214 390,938 362,547 362,341
Policy loans 151,038 177,813 151,533 181,902
Finance loans 555,384 560,543 595,307 602,512
Securities purchased for resale 57,110 57,110 10,904 10,904
Deposits 127,720 127,720 62,798 62,798
2,553,952 2,804,223 2,331,828 2,582,430
Total financial investments 7,238,569 7,488,840 6,685,644 6,936,246
9.1 Analysis of financial investments (continued)
Non-derivative investments at FVTPL FVTPL
mandatory designation
FVTPL designation by election
Total
2020 Equity securities 580,919 78,600 659,519
Debt securities 201,797 147,077 348,874 Mortgage loans 34 26,031 26,065
782,750 251,708 1,034,458
2019 Equity securities 286,764 83,409 370,173 Debt securities 115,104 128,003 243,107
Mortgage loans - 28,933 28,933
401,868 240,345 642,213
2020 2019
Debt securities: Government and government-guaranteed debt securities 2,084,812 1,849,154 Collateralised mortgage obligations 545,411 572,128
Corporate debt securities 2,433,389 2,072,446 Money market funds and other securities 166,665 571,539
5,230,277 5,065,267
Included in financial investments are: Exchange-traded funds included in equity securities 301,732 23,290
Debt securities issued by associates 24,135 25,278
Mutual funds managed by the Group 175,704 217,170
Notes to the Financial Statements SAGICOR FINANCIAL COMPANY Ltd. (formerly Sagicor Financial Corporation Limited)Year ended December 31, 2020 and December 31, 2019 Amounts expressed in US $000
199

67
9.3 Collateral assets
Debt and equity securities include $2,806 (2019 - $20,644) as collateral for loans payable and other funding instruments.
Collateral for the obligation to the Federal Home Loan Bank of Dallas (FHLB) which is included in other funding instruments (note 17), consists of an equity holding in the FHLB with a market value of $17,261 (2019 - $16,114), and mortgages and mortgage backed securities having a total market value of $365,714 (2019 - $391,141).
9.4 Financial investments held under the unit linked fair value model
Financial investments include the following amounts for which the full income and capital returns accrue to the holders of unit linked insurance and investment contracts. These investments are measured at FVTPL and amortised cost for mortgages.
2020 2019
Debt securities 157,187 154,111
Equity securities 186,069 225,276
Mortgage loans 53,417 58,154
396,673 437,541
9.2 Financial investments repledged
Debt securities are pledged as collateral under repurchase agreements with customers and other financial institutions and for security relating to overdraft and other facilities with other financial institutions. Of the assets pledged as security, the following represents the total for those assets pledged for which the transferee has the right by contract or custom to sell or repledge the collateral.
2020 2019
Financial investments repledged 611,730 604,886
Balance sheet presentation Financial investments 6,626,839 6,080,758 Financial investments repledged 611,730 604,886
7,238,569 6,685,644
Analysis of financial investments repledged
2020 2019
Pledged value
Pledged value
Investments at FVOCI:
Debt securities and money market funds 610,684 602,288
Investments at amortised cost :
Debt securities 632 2,188
Securities purchased for resale 37 37
Deposits 377 373
1,046 2,598
Financial investments repledged 611,730 604,886
Notes to the Financial Statements SAGICOR FINANCIAL COMPANY Ltd. (formerly Sagicor Financial Corporation Limited)Year ended December 31, 2020 and December 31, 2019 Amounts expressed in US $000
200

68
10 REINSURANCE ASSETS
2020 2019
Reinsurers’ share of:
Actuarial liabilities (note 13.1) 639,797 661,811
Policy benefits payable (note 14.2) 34,708 28,700
Provision for unearned premiums (note 14.3) (i) 26,860 24,828
Other items 14,374 8,898
715,739 724,237
(i) Amount is expected to be realised within one year.
11 INCOME TAX ASSETS
2020 2019
Deferred income tax assets (note 33) 7,050 6,494
Income and withholding taxes recoverable 19,280 20,100
26,330 26,594
Income and withholding taxes recoverable are expected to be recovered within one year of the financial statements’ date.
12 MISCELLANEOUS ASSETS AND RECEIVABLES
2020 2019
Net defined benefit assets (note 31) 16,728 9,040 Real estate developed or held for resale 46,456 28,571 Prepaid and deferred expenses (i) 37,055 33,583 Premiums receivable 59,780 57,584 Legal claim (note 20) 1,126 1,073 Service contract receivables - 1,411Finance leases 822 768Other assets and accounts receivable 77,571 76,029
239,538 208,059
Amounts due from managed funds included in receivables 2,938 4,537 Amounts expected to be realised within one year included in real estate developed or held for resale
21,502 8,153
(i) Amounts are expected to be realised within one year.
Notes to the Financial Statements SAGICOR FINANCIAL COMPANY Ltd. (formerly Sagicor Financial Corporation Limited)Year ended December 31, 2020 and December 31, 2019 Amounts expressed in US $000
201

69
13 ACTUARIAL LIABILITIES
13.1 Analysis of actuarial liabilities
Gross liability Reinsurers’ share
2020 2019 2020 2019
Contracts issued to individuals:
Life insurance - participating policies 192,866 194,551 76 66
Life insurance and annuity - non-participating policies
3,160,834 2,590,528 626,361 647,417
Health insurance 8,741 12,511 192 236
Unit linked funds 253,229 288,504 - -
Reinsurance contracts held 40,767 32,585 - -
3,656,437 3,118,679 626,629 647,719
Contracts issued to groups:
Life insurance 27,541 28,862 104 107
Annuities 436,590 428,050 12,900 13,837
Health insurance 32,133 29,062 164 148
496.264 485,974 13,168 14,092
Total actuarial liabilities 4,152,701 3,604,653 639,797 661,811
The following notes are in respect of the foregoing table: • Life insurance includes coverage for disability and critical illness. • Actuarial liabilities include $80,331 (2019 - $77,391) in assumed reinsurance.• The liability for reinsurance contracts held occurs because the reinsurance premium costs
exceed the mortality costs assumed in determining the gross liability of a policy contract.
13.2 Movement in actuarial liabilities
Gross liability Reinsurers’ share
2020 2019 2020 2019
Balance, beginning of year 3,604,653 3,024,464 661,811 653,722 Changes in actuarial liabilities:
Recorded in income (note 25) 512,140 492,875 (22,026) 8,092 Recorded in OCI 65,039 110,409 - -
Derecognised on divestiture - (8,292) - (2)Other movements (1,057) 163 5 - Effect of exchange rate changes (28,074) (14,966) 7 (1)
Balance, end of year 4,152,701 3,604,653 639,797 661,811
Analysis of changes in actuarial liabilities
Arising from increments and decrements of inforce policies and from the issuance of new policies
589,905 453,393 (23,881) 2,719
Arising from changes in assumptions for mortality, lapse, expenses, partial withdrawal, universal life premium persistency, investment yields and asset default
9,918 102,407 187 1,093
Other changes: Actuarial modelling refinements and improvements
5,221 (1,560) 1,664 -
Changes in margins for adverse deviations
- 2,714 - -
Arising from fair value changes of Segregated Funds
(15,471) 55,891 - -
Other items (12,394) (9,561) 4 4,280
Total 577,179 603,284 (22,026) 8,092
Notes to the Financial Statements SAGICOR FINANCIAL COMPANY Ltd. (formerly Sagicor Financial Corporation Limited)Year ended December 31, 2020 and December 31, 2019 Amounts expressed in US $000
202

70
13.3 Assumptions – life insurance and annuity contracts
(a) Process used to set actuarial assumptions and margins for adverse deviations
At each date for valuation of actuarial liabilities, the Appointed Actuary (AA) of each insurer reviews the assumptions made at the last valuation date. The AA reviews the validity of each assumption by referencing current data, and where appropriate, changes the assumptions for the current valuation. A similar process of review and assessment is conducted in the determination of margins for adverse deviations.
Any changes in actuarial standards and practice are also incorporated in the current valuation.
(b) Assumptions for mortality and morbidity
Mortality rates are related to the incidence of death in the insured population. Morbidity rates are related to the incidence of sickness and disability in the insured population.
Annually, insurers update studies of recent mortality experience. The resulting experience is compared to external mortality studies including tables from the Canadian Institute of Actuaries. Appropriate modification factors are selected and applied to underwritten and non-underwritten business respectively. Annuitant mortality is determined by reference to CIA tables or to other established scales.
Assumptions for morbidity are determined after reflecting insurer and industry experience.
(c) Assumptions for lapse
Policyholders may allow their policies to lapse prior to the maturity date either by choosing not to pay premiums or by surrendering their policy for its cash value. Lapse studies are updated annually by insurers to determine the persistency of the most recent period. Assumptions for lapse experience are generally based on moving averages.
13.3 Assumptions – life insurance and annuity contracts (continued)
(d) Assumptions for investment yields
Returns on existing variable rate securities, shares, investment property and policy loans are linked to the current economic scenario. Yields on reinvested assets are also tied to the current economic scenario. Returns are however assumed to decrease over time, and it is assumed that at the end of twenty years from the valuation date, all investments, except policy loans, are reinvested in long-term, default-free government bonds.
The ultimate rate of return is the assumed rate that will ultimately be earned on long-term government bonds. It is established for each geographic area and is summarised in the following table.
Ultimate rate of return 2020 2019
Barbados 7.50% 7.50%
Jamaica 5.50% 5.50%
Trinidad & Tobago 5.00% 5.00%
Other Caribbean 4.50% - 7.50% 4.50% - 7.50%
USA 4.00% - 5.50% 3.90% - 5.40%
(e) Assumptions for operating expenses and taxes
Policy acquisition and policy maintenance expense costs for the long-term business of each insurer are measured and monitored using internal expense studies. Policy maintenance expense costs are reflected in the actuarial valuation after adjusting for expected inflation. Costs are updated annually and are applied on a per policy basis.
Taxes reflect assumptions for future premium taxes and income taxes levied directly on investment income. For income taxes levied on net income, actuarial liabilities are adjusted for policy-related recognised deferred tax assets and liabilities.
Notes to the Financial Statements SAGICOR FINANCIAL COMPANY Ltd. (formerly Sagicor Financial Corporation Limited)Year ended December 31, 2020 and December 31, 2019 Amounts expressed in US $000
203

71
13.3 Assumptions – life insurance and annuity contracts (continued)
(f) Asset defaults
The AA of each insurer includes a provision for asset default in the modelling of the cash flows. The provision is based on industry and Group experience and includes specific margins, where appropriate, for assets backing the actuarial liabilities, e.g. for investment property, equity securities, debt securities, mortgage loans and deposits.
(g) Margins for adverse deviations
Margins for adverse deviations are determined for the assumptions in the actuarial valuations. The application of these margins result in provisions for adverse deviations being included in the actuarial liabilities as set out in the following table.
Provisions for adverse deviations 2020 2019
Mortality and morbidity 97,305 95,203
Lapse 90,733 76,390
Investment yields and asset default 69,887 65,971
Operating expenses and taxes 10,495 10,019
Other 14,949 13,889
283,369 261,472
13.4 Assumptions – health insurance contracts
The outstanding liabilities for health insurance claims incurred but not yet reported and for claims reported but not yet paid are determined by statistical methods using expected loss ratios which have been derived from recent historical data. No significant claim settlements are anticipated after one year from the date of the financial statements.
Notes to the Financial Statements SAGICOR FINANCIAL COMPANY Ltd. (formerly Sagicor Financial Corporation Limited)Year ended December 31, 2020 and December 31, 2019 Amounts expressed in US $000
204

72
14 OTHER POLICY LIABILITIES
14.1 Analysis of other policy liabilities
2020 2019
Dividends on deposit and other policy balances 60,236 61,518
Policy benefits payable 174,375 166,350
Provision for unearned premiums 58,065 59,092
292,676 286,960
14.2 Policy benefits payable
Gross liability Reinsurers’ share
2020 2019 2020 2019
Analysis of policy benefits payable:
Life insurance and annuity benefits 111,231 97,364 17,415 16,916
Health claims 4,260 5,252 6,251 2,846
Property and casualty claims 58,884 63,734 11,042 8,938
174,375 166,350 34,708 28,700
14.2 Policy benefits payable (continued)
Gross liability Reinsurers’ share
2020 2019 2020 2019
Movement for the year:
Balance, beginning of year 166,350 140,163 28,700 39,085
Subsidiary and insurance portfolio acquisitions (1,771) 27,090 - 351
Policy benefits incurred 761,510 682,891 118,824 107,425
Policy benefits paid (748,079) (683,339) (112,420) (117,894)
Effect of exchange rate changes (3,635) (455) (396) (267)
Balance, end of year 174,375 166,350 34,708 28,700
14.3 Provision for unearned premiums
Gross liability Reinsurers’ share
2020 2019 2020 2019
Analysis of the provision:
Property and casualty insurance 56,119 56,986 26,860 24,828
Health insurance 1,946 2,106 - -
58,065 59,092 26,860 24,828
The provision for unearned premiums is expected to mature within a year of the financial statements’ date.
Notes to the Financial Statements SAGICOR FINANCIAL COMPANY Ltd. (formerly Sagicor Financial Corporation Limited)Year ended December 31, 2020 and December 31, 2019 Amounts expressed in US $000
205

73
16 NOTES AND LOANS PAYABLE
The following table presents the carrying values and estimated fair values of notes and loans payable.
Amounts in US $000 2020 2019
Carrying value
Fair value
Carrying value
Fair Value
Liabilities at amortised cost: 8.875% senior notes due 2022 (a) 315,938 324,704 318,227 330,197
5.10% unsecured bond due 2020 (b) - - 33,700 34,256 5.95% unsecured bond due 2020 (c) - - 42,904 44,826 5.50% unsecured bond due 2022 (c) 31,957 32,790 - - 6.25% unsecured bond due 2022 (c) & (d) 27,000 28,530 - -
5.00% notes due 2020 (e) - - 16,857 17,257 6.75% notes due 2024 (e) 15,434 16,275 16,589 15,845 Mortgage loans (g) 59,607 60,767 75,019 77,034 Bank loans and other funding instruments (f) 21,686 21,686 14,436 14,436
471,622 484,752 517,732 533,851
(a) Valuation of Call Option Embedded Derivative
As at December 31, 2020, the Group had US$318 million principal amount of senior unsecured notes (the “Notes”). The Notes are due August 11, 2022 and bear interest at an annual rate of 8.875%. Pursuant to the terms of the Notes, the Group may redeem the Notes under the scenario as summarised below and described in more detail herein:
Optional Redemption with an Applicable Premium - At any time on or after August 11, 2019, the Group may redeem the Notes in whole or in part at specified redemption prices, plusaccrued and unpaid interest, if any, on the Notes redeemed, to the applicable date of redemption.
The Group has estimated the fair value of this embedded derivative at US$5.9 million as at December 31 (2019 - US$2.8 million).
14.3 Provision for unearned premiums (continued)
Gross liability Reinsurers’ share
2020 2019 2020 2019
Movement for the year:
Balance, beginning of year 59,092 44,435 24,828 14,727
Subsidiary and insurance portfolio acquisitions
- 22,278 - 7,650
Premiums written 128,027 97,235 65,917 45,844
Premium revenue (127,661) (104,980) (63,210) (43,446)
Effect of exchange rate changes (1,393) 124 (675) 53
Balance, end of year 58,065 59,092 26,860 24,828
15 INVESTMENT CONTRACT LIABILITIES
2020 2019 Carrying
value Fair
value Carrying
Value Fair
value
Liabilities at amortised cost:
Deposit administration liabilities 117,046 117,046 113,767 113,767
Other investment contracts 166,116 169,002 148,188 149,928
283,162 286,048 261,955 263,695 Liabilities at FVTPL: Unit linked deposit administration liabilities 154,442 154,442 162,385 162,385
437,604 440,490 424,340 426,080
Notes to the Financial Statements SAGICOR FINANCIAL COMPANY Ltd. (formerly Sagicor Financial Corporation Limited)Year ended December 31, 2020 and December 31, 2019 Amounts expressed in US $000
206

74
16 NOTES AND LOANS PAYABLE (continued)
(b) On September 18 and 26, 2019, Sagicor Financial Corporation Limited issued US$30.6 million and US$3.4 million notes respectively, carrying an annual rate of 5.10%. The notesmatured October 26, 2020.
(c) On September 26, 2019, Sagicor Financial Corporation Limited issued a Jamaican $ bondin the amount of J$5,731,140,000 carrying an annual interest rate of 5.95% per annum. The bond matured October 26, 2020.
On October 27, 2020, Sagicor Financial Corporation Limited refinanced the above facility with the issue of a bond in two Tranches, Tranche A up to J$5,737,140,000 and Tranche B up to US$31,807,000, carrying annual interest rates of 6.25% and 5.50% respectively. Interest is payable quarterly commencing January 27, 2021. The Tranches mature on April26, 2022, with an option for further extension.
(d) At December 31, 2020, Sagicor Investments Jamaica Limited held an investment of US$13.5million in Tranche A above.
(e) On August 16, 2019, Sagicor Investments Jamaica Limited issued J$4.4 billion notes in two Tranches, Tranche A J$2.22 billion and Tranche B J$2.18 billion, carrying annual rates of 5.00% and 6.75% respectively. Tranche A matured on September 16, 2020 and Tranche B has a maturity date of August 16, 2024.
(f) Bank loans and other funding instruments include the following:
(i) On May 24, 2019, Sagicor General Insurance Inc entered into a US$12 million loan agreement. The interest rate is 3.50% per annum and the loan matures onJuly 31, 2024.
(ii) On October 1, 2020, The Estates (Residential Properties) Limited issued cumulative preference shares in the amount of US$9 million. Dividends accrue at a rate of 6.75% per annum and are payable semi-annually. The preference shares are redeemable on September 30, 2027.
16 NOTES AND LOANS PAYABLE (continued)
(g) Mortgage Loans
Issuer / mortgagor 2020 2019 4.90% USD mortgage notes due 2025(1) X Fund Properties LLC 45,822 45,741
4.75% USD mortgage notes due 2021(1) Sagicor X-Fund Real Estate
Limited 2,188 2,112
5.00% USD mortgage notes due 2020 X Fund Properties Limited - 4,2558.75% JMD mortgage notes due 2020 X Fund Properties Limited - 10,1369.00% JMD mortgage notes due 2048(1) X Fund Properties Limited 3,356 3,5988.00% JMD mortgage notes due 2021(1) X Fund Properties Limited 3,134 3,54810.00% JMD mortgage notes due 2026(1) X Fund Properties Limited 3,220 3,5113.26%/ 3.61% mortgage notes due 2026(1) X Fund Properties Limited 934 996 Development loan (2) X Fund Properties Limited 953 1,122
59,607 75,019
(1) These notes have a breach of loan covenant which has been disclosed in note 46.3. (2) This note is interest-free with annual forgiveness of debt over ten years, if certain conditions
are met.
X Fund Properties LLC
The 4.90% USD mortgage note is secured by the investment in hotel property. Interest on the mortgage note is paid monthly through to maturity, upon which the outstanding principal is due and payable. The Group may prepay the mortgage note prior to the maturity date only in conjunction with the sale of a property or as a result of casualty or condemnation. The note is payable on October 6, 2025 and attracts a fixed rate interest of 4.90%.
Notes to the Financial Statements SAGICOR FINANCIAL COMPANY Ltd. (formerly Sagicor Financial Corporation Limited)Year ended December 31, 2020 and December 31, 2019 Amounts expressed in US $000
207

75
16 NOTES AND LOANS PAYABLE (continued)
Sagicor X-Fund Real Estate Limited
This mortgage note was issued in three tranches (A,B,C). Tranches A and B have matured while Tranche C, which attracts interest of 4.75%, has a maturity date of May 2021 with an option for further extension. This loan was originally secured by a debenture over units in the Sigma Real Estate Portfolio. This has been substituted for shares in Jamziv MoBay Jamaica Portfolio Limited which holds shares of Playa Hotel and Resorts N.V.
X Fund Properties Limited
These mortgage notes are secured by: • a charge over Jamziv MoBay Jamaica Portfolio Limited allocated to X Fund Properties Limited,• a charge over the assets and undertakings of X Fund Properties Limited.
Movement for the year to December 31, 2020 2019 Balance, beginning of year 517,732 490,275 Valuation of call option embedded derivative (3,082) (2,831) Additions: Gross principal 68,660 197,114 less Expenses (415) (967)
68,245 196,147 Repayments: Principal (109,514) (164,452) Interest (37,414) (37,871)
(146,928) (202,323) Finance leases reclassified to lease liabilities - (4,255)Amortisation during the year 3,588 2,974Accrued Interest 38,838 38,282Effects of exchange rate changes (6,771) (537) Balance, end of the year 471,622 517,732
17 DEPOSIT AND SECURITY LIABILITIES
2020 2019 Carrying
value Fair
value Carrying
value Fair
value Liabilities at amortised cost: Other funding instruments 388,523 387,206 418,047 418,932 Customer deposits 861,652 867,317 808,119 811,715 Securities sold for repurchase 575,604 575,604 512,857 512,857 Bank overdrafts 980 980 6,646 6,646
1,826,759 1,831,107 1,745,669 1,750,150 Liabilities at FVTPL: Structured products - - 6,756 6,756 Derivative financial instruments (note 41.9) - - 264 264
- - 7,020 7,020
1,826,759 1,831,107 1,752,689 1,757,170
Other funding instruments consist of loans from banks and other financial institutions and include balances of $348,559 (2019 - $375,219) due to the Federal Home Loan Bank of Dallas (FHLB). The Group participates in the FHLB programme in which funds received from the Bank are invested in mortgages and mortgage-backed securities.
Structured products are offered by a banking subsidiary. A structured product is a pre-packaged investment strategy created to meet specific needs that cannot be met from the standardised financial instruments available in the market. Structured products can be used as an alternative to a direct investment, as part of the asset allocation process to reduce risk exposure of a portfolio, or to capitalise on current market trends.
Collateral for other funding instruments and securities sold under agreements to resell is set out in note 9.2.
Notes to the Financial Statements SAGICOR FINANCIAL COMPANY Ltd. (formerly Sagicor Financial Corporation Limited)Year ended December 31, 2020 and December 31, 2019 Amounts expressed in US $000
208

76
20 ACCOUNTS PAYABLE AND ACCRUED LIABILITIES
2020 2019
Suspense and other amounts due 44,078 46,257 Amounts due to reinsurers 28,461 17,993 Legal claim (i) 1,126 1,073 Other accounts payable and accrued liabilities 181,797 175,010
255,462 240,333
(i) On March 17, 2014, the Supreme Court of Jamaica granted judgement in favour of a claimant in a case brought against Sagicor Bank Jamaica Limited (“the Bank”), (formerly RBC Royal Bank Jamaica Limited). This claim pre-dated the acquisition of the Bank by Sagicor Group Jamaica Limited, and pre-dated the acquisition of control of the Bank by RBTT from Finsac Limited (“Finsac”)in 2001.
By virtue of the Share Sale Agreement between Finsac, RBTT Financial Holdings Limited and RBTT International Limited, Finsac agreed to fully indemnify RBTT International Limited against any lossthe bank may suffer in this matter. As the current owner of Sagicor Bank Jamaica Limited, Sagicor Group is the current beneficiary of the Indemnity. The Indemnity from Finsac is further supported by a Government of Jamaica Guarantee on a full indemnity basis.
Sagicor appealed the Supreme Court decision and judgment was delivered on July 31, 2018, which ruled that the award previously made to the Claimant be reduced with costs to the Claimant, subjectto an accounting exercise to determine the apportionment of costs between the parties. This reduced award took into account lower interest rates, applying simple interest rather than compounding interest. The issue of costs remains to be determined by the courts following a subsequent application to amend the judgment which was delivered in January 2019. The amount previously awarded to the Claimant has been recorded as payable to the claimant, plus accrued interest, and a corresponding receivable from Finsac/Government of Jamaica has been recorded (note 12).
On July 1, 2019, the Claimant filed an application for conditional leave to appeal to the Privy Councilon the issue of costs, with final leave being granted on October 26, 2020.
18 O THER LIABILITIES / RETIREMENT BENEFIT LIABILITIES
2020 2019
Net defined benefit liabilities (note 31)
Other provisions
66,342 59,597
200 198
66,542 59,795
19 INCOME TAX LIABILITIES
2020 2019
Deferred income tax liabilities (note 33) Income taxes payable
48,873 51,198 16,255 5,691 65,128 56,889
Income taxes payable are expected to be settled within a year of the financial statements’ date.
Notes to the Financial Statements SAGICOR FINANCIAL COMPANY Ltd. (formerly Sagicor Financial Corporation Limited)Year ended December 31, 2020 and December 31, 2019 Amounts expressed in US $000
209

77
21 COMMON SHARES
The authorised share capital of the Company is US$200,000,000 divided into 10,000,000,000 common shares of US$0.01 each and 10,000,000,000 preference shares of US$0.01 each. The common shares issued are as follows:
2020 2019
Number in 000’s Share capital
Share premium Total Number in 000’s Share capital
Share premium Total
Issued and fully paid: Balance, beginning of year 147,839 1,478 762,290 763,768 306,556 3,066 301,132 304,198 Exchange of shares (note 1) - - - - (227,016) (2,270) 2,270 - Repurchase of shares (note 1) (2,974) (29) (15,367) (15,396) (11,548) (116) (19,930) (20,046)
144,865 1,449 746,923 748,372 67,992 680 283,472 284,152 Allotments arising from: Common shares 1,516 15 6,848 6,863 - - - -
New share issue (note 1) - - - - 79,847 798 478,818 479,616
Balance, end of year 146,381 1,464 753,771 755,235 147,839 1,478 762,290 763,768 Treasury shares: Shares held for LTI and ESOP, end of year (note 30.1) (50) (1) (275) (276) (50) (1) (275) (276)
Shares repurchased but not cancelled (1) - (6) (6) - - - -
Total 146,330 1,463 753,490 754,953 147,789 1,477 762,015 763,492
21.1 Share buyback programme
During the year, the board of directors of SFC authorised a share buyback programme that allows the Company to repurchase its common shares (the “NCIB Shares”). The Toronto Stock Exchange (the “TSX”) accepted the Company’s notice of intention to make a normal course issuer bid (“NCIB”) through which the Company may purchase the NCIB Shares during the 12-month period commencing June 22, 2020 and ending June 21, 2021. The Company was initially authorised to repurchase up to 3,000,000 of its common shares under the programme, however, the NCIB was subsequently amended to increase the number of shares that may be repurchased to 8,000,000 common shares. Under the NCIB, purchases may be made on the open market through the facilities of the TSX and/or alternative Canadian trading systems at the market price at the time of acquisition, as well as by other means as may be permitted by TSX rules and applicable securities laws.
Notes to the Financial Statements SAGICOR FINANCIAL COMPANY Ltd. (formerly Sagicor Financial Corporation Limited)Year ended December 31, 2020 and December 31, 2019 Amounts expressed in US $000
210

78
21 COMMON SHARES (continued)
21.1 Share buyback programme (continued)
During the year, the Company repurchased 2,942,500 shares, at a total cost of US$13.1 million, which were subsequently cancelled. Share capital and share premium in equity have been reduced by the cost of the shares repurchased and commission paid on the transactions. The discount arising on the repurchase of shares has been recorded directly in retained earnings.
The cost of shares totalling US$0.006 million, which were repurchased at the year end date but not cancelled, has been reflected in treasury shares.
21.2 Common share dividends
Common share dividends declared, paid and proposed are set out in the following table.
2020 2019 Per share Total Per share Total
Dividends declared and paid during the year: Three-month period ended:
– March 31 5.625¢ 8,353 - - – June 30 5.625¢ 8,387 2.5¢ 7,658 – September 30 5.625¢ 8,262 - - – December 31 5.625¢ 8,241 2.5¢ 7,658
Total 33,243 15,316
Notes to the Financial Statements SAGICOR FINANCIAL COMPANY Ltd. (formerly Sagicor Financial Corporation Limited)Year ended December 31, 2020 and December 31, 2019 Amounts expressed in US $000
211

79
22 RESERVES
Fair value reserves Owner-occupied
and owner-managed property
FVOCI assets
Actuarial liabilities
Cash flow hedges
Currency translation
reserves
Warrant reserve(1)
Other reserves
Total reserves
2020
Balance, December 31, 2019 25,151 94,270 (78,707) (270) (124,421) 20,062 54,892 (9,023)
Total comprehensive income from continuing operations (1,753) 68,375 (49,877) (4) (19,518) - (2) (2,779)
Transactions with holders of equity instruments:
Allocated to reserve for equity compensation benefits - - - - - - 6,978 6,978
Eliminated from reserve for equity compensation benefits - - - - - - (10,899) (10,899)
Transfers to retained earnings and other movements (509) 46 - - - - 1,318 855
Balance, December 31, 2020 22,889 162,691 (128,584) (274) (143,939) 20,062 52,287 (14,868)
(1) The Group has 34,774,993 (2019 - 34,774,993) warrants outstanding which have an exercise price of CDN $11.50 per share. These warrants expire on December 5, 2024. The warrants are listed on the Toronto Stock Exchange.
Notes to the Financial Statements SAGICOR FINANCIAL COMPANY Ltd. (formerly Sagicor Financial Corporation Limited)Year ended December 31, 2020 and December 31, 2019 Amounts expressed in US $000
212

80
22 RESERVES (continued)
Fair value reserves
Owner-occupied and
owner-managed property
FVOCI assets
Actuarial liabilities
Cash flow hedges
Currency translation
reserves
Warrant reserve
Other reserves
Total reserves
2019
Balance, December 31, 2018 23,163 (27,525) 9,362 - (116,953) - 34,958 (76,995)
Total comprehensive income from continuing operations 1,514 117,758 (83,392) (270) (7,569) - (11) 28,030
Transactions with holders of equity instruments:
Allocated to warrant reserve - - - - - 20,062 - 20,062
Allocated to reserve for equity compensation benefits - - - - - 12,998 12,998
Eliminated from reserve for equity compensation benefits - - - - - - (3,811) (3,811)
Transfers to retained earnings and other movements 474 4,037 (4,677) - 101 - 10,758 10,693
Balance, December 31, 2019 25,151 94,270 (78,707) (270) (124,421) 20,062 54,892 (9,023)
Notes to the Financial Statements SAGICOR FINANCIAL COMPANY Ltd. (formerly Sagicor Financial Corporation Limited)Year ended December 31, 2020 and December 31, 2019 Amounts expressed in US $000
213

81
23 PARTICIPATING ACCOUNTS
The movements in the participating accounts during the year and the amounts in the financial statements relating to participating accounts were as follows:
Closed participating account
Open participating account
2020 2019 2020 2019
Movement for the year: Balance, beginning of year 902 2,774 321 1,304 Total comprehensive income / (loss) (613) (1,872) 1,190 (783) Return of transfer to support profit distribution, to shareholders
- - (193) (200)
Balance, end of year 289 902 1,318 321
Financial statement amounts: Assets 63,075 65,913 152,294 151,907 Liabilities 62,786 65,011 150,976 151,586 Revenues 4,589 7,004 16,023 19,751 Benefits 4,599 7,523 12,999 18,798
Expenses 264 511 1,178 1,522 Income taxes 54 84 159 254
The Group no longer sells participating policies in the Eastern Caribbean. As a result, the size of the participating policyholders fund in this region has been decreasing annually and has reached a size where it is no longer beneficial to the policyholders to continue to maintain a separate fund.
Consequently, the participating policies in the Eastern Caribbean were converted to non-participating policies on May 31, 2019 with the level of participating benefits in the form of bonuses and or dividends being guaranteed at conversion.
24 PREMIUM REVENUE
Gross premium Ceded to reinsurers
2020 2019 2020 2019
Life insurance 470,363 460,623 30,094 29,992
Annuity 736,620 592,400 132 283
Health insurance 176,622 179,101 5,089 5,974
Property and casualty insurance 118,347 91,128 63,210 45,459
1,501,952 1,323,252 98,525 81,708
25 POLICY BENEFITS AND CHANGE IN ACTUARIAL LIABILITIES
Gross benefit Ceded to reinsurers
2020 2019 2020 2019
Life insurance benefits 263,130 236,624 24,440 13,523
Annuity benefits 324,994 270,376 77,391 78,864
Health insurance claims 133,185 140,748 3,115 4,834
Property and casualty claims 35,735 29,017 7,498 1,995
Total policy benefits 757,044 676,765 112,444 99,216
Change in actuarial liabilities (note 13.2) 512,140 492,875 (22,026) 8,092
Total policy benefits and change in actuarial liabilities
1,269,184 1,169,640 90,418 107,308
Notes to the Financial Statements SAGICOR FINANCIAL COMPANY Ltd. (formerly Sagicor Financial Corporation Limited)Year ended December 31, 2020 and December 31, 2019 Amounts expressed in US $000
214

82
26 NET INVESTMENT INCOME
2020 2019 Investment income: Interest income (amortised cost assets):
Debt securities 83,907 81,695 Mortgage loans 21,052 20,458 Policy loans 10,881 10,519 Finance loans 61,171 60,941
Securities purchased for resale 804 542 Deposits, cash and other items 951 1,320
178,766 175,475 Interest income (FVOCI assets):
Debt securities and money market funds 135,993 132,539
Interest income earned from financial assets measured at amortised cost and FVOCI 314,759 308,014
26 NET INVESTMENT INCOME (continued)
2020 2019
Interest income earned from financial assets measured at amortised cost and FVOCI 314,759 308,014
Fair value changes and interest income (FVTPL assets): Debt securities 16,636 25,319 Equity securities (9,229) 49,298
Mortgage loans 553 2,524 Derivative financial instruments 10,759 35,701 Other items 2 27
18,721 112,869
Investment income Other income on financial investments 477 253 Investment property – rental income 5,406 8,406
Investment property – (realised losses) / gains (2,987) 27 Investment property – unrealised losses (598) (566)Other investment income / (expense) 1,724 (259)
4,022 7,861
Investment expenses: Direct operating expenses of investment property that generated rental income
4,060 6,319
Other direct investment expenses 2,539 2,611
6,599 8,930
Other investment income 16,144 111,800
Net investment income 330,903 419,814
Notes to the Financial Statements SAGICOR FINANCIAL COMPANY Ltd. (formerly Sagicor Financial Corporation Limited)Year ended December 31, 2020 and December 31, 2019 Amounts expressed in US $000
215

83
27 FEES AND OTHER REVENUE
Fees Recognised Other Revenue Total
at a point in time over time
2020
Service contract revenue 26,008 43,889 - 69,897
Fee income – assets under administration - 2,976 - 2,976
Commission income on reinsurance contracts - 4 15,647 15,651
Other fees and commission income 11,585 2,188 10,792 24,565
Finance lease income - - 75 75
Foreign exchange gains - - 4,078 4,078
Hotel revenue 3,076 12,164 1,885 17,125
Other operating and miscellaneous income 159 - 4,450 4,609
40,828 61,221 36,927 138,976
2019
Service contract revenue 39,856 50,461 - 90,317
Fee income – assets under administration - 2,968 - 2,968
Commission income on reinsurance contracts - - 7,932 7,932
Other fees and commission income 9,349 3,595 8,876 21,820
Finance lease income - - 62 62
Foreign exchange losses - - (1,105) (1,105)
Hotel revenue 7,970 28,786 2,938 39,694
Other operating and miscellaneous income 213 - 6,070 6,283
57,388 85,810 24,773 167,971
Notes to the Financial Statements SAGICOR FINANCIAL COMPANY Ltd. (formerly Sagicor Financial Corporation Limited)Year ended December 31, 2020 and December 31, 2019 Amounts expressed in US $000
216

84
28 INTEREST AND FINANCE COSTS
28.1 Interest costs 2020 2019
Interest expense (amortised cost liabilities): Investment contracts 8,464 7,950 Other funding instruments 3,511 9,934
Customer deposits 9,767 10,168 Securities sold for repurchase 12,449 13,814 Insurance contracts and other items 1,604 1,966
35,795 43,832
Fair value changes and interest expense (FVTPL liabilities) 7,098 10,360
Total interest costs 42,893 54,192
28.2 Finance costs
2020 2019 8.875% senior notes due 2022 30,740 30,297 8.25% convertible redeemable preference shares due 2020 - 4284.85% notes due 2019 - 2,324
5.50% unsecured bond due 2022 333 - 6.25% unsecured bond due 2022 311 - 5.10% unsecured bond due 2020 1,744 604 5.95% unsecured bond due 2020 2,385 794
5.00% notes due 2020 556 316 6.75% notes due 2024 1,041 419 Mortgage Loans 5,020 5,180 Lease liabilities(1) 2,184 2,423
Bank loans & other funding instruments 571 848
44,885 43,633
(1) Interest expense arising from lease liabilities is recognised from 2019 in conformity with IFRS 16.
29 EMPLOYEE COSTS
Included in administrative expenses, commissions and related compensation are the following:
2020 2019
Administrative and hotel staff salaries, directors’ fees and short-term benefits
145,860 137,432
Social security and defined contribution retirement costs 11,852 10,409
Equity-settled compensation benefits (note 30.1 to 30.2) 9,375 15,142
Defined benefit expense (note 31 (b)) 12,491 7,707
179,578 170,690
Notes to the Financial Statements SAGICOR FINANCIAL COMPANY Ltd. (formerly Sagicor Financial Corporation Limited)Year ended December 31, 2020 and December 31, 2019 Amounts expressed in US $000
217

85
30 EQUITY COMPENSATION BENEFITS
30.1 Sagicor Financial Company Ltd.
Effective December 31, 2005, SFCL introduced the LTI plan and the ESOP. A total of 26,555,274 common shares of SFCL (or 10% of shares then in issue) has been set aside for the purposes of the long-term incentive (LTI) plan and the Employee Share Ownership Plan (ESOP).
In 2017, the shareholders of SFCL approved the increase in the number of SFCL’s shares reserved for the LTI and ESOP from 26,555,274 common shares to 40,400,000 common shares.
On December 5, 2019, concurrent with the closing of the transaction between Alignvest Acquisition II Corporation (“Alignvest”) and Sagicor Financial Corporation Limited (“SFCL”), restricted share grants, share options and ESOP awards were exchanged for grants, options and awards in SFC using the Exchange Ratio as defined in note 1. 3,680,687 restricted share grants were exchanged for 850,276 restricted share grants and 2,297,517 ESOP awards were exchanged for 526,831 ESOP awards in SFC (the "Replacement Grants"). 20,250,604 options were exchanged for 4,678,152 options to purchase common shares of Sagicor Financial Company Ltd. (the “Replacement Options”). The Replacement Options provide an optionee the ability to purchase common shares of Sagicor Financial Company Ltd. at a price per share linked to the award year (as adjusted by the exchange ratio), and the terms and conditions of the Replacement Options have remained the same as the initial terms and conditions. The terms of the Replacement Grants remain unchanged. Since these modifications did not increase the total fair value of the Replacement Options or the Replacement Grants, the Group continues to account for the cost of compensation services received as consideration for the equity instruments granted as if the replacement had not occurred.
The fair value of stock options granted is estimated at the date of grant using the Black-Scholes option pricing model as disclosed in section (b) below.
30.1 Sagicor Financial Company Ltd. (continued)
(a) LTI plan (2005) – restricted share grants
Restricted share grants have been granted to designated key management of the Group. Share grants may vest over a four-year period beginning at the grant date. The vesting of share grants is conditional upon the relative profitability of the Group as compared to a number of peer companies. Relative profitability is measured with reference to the financial year preceding the vesting date.
The movement in restricted share grants during the year is as follows:
2020 2019 Number of
grants ‘000
Weighted average
price
Number of grants ‘000
Weighted average
price
Balance, beginning of year 856 US$4.50 656 US$4.50
Grants issued 779 US$4.74 1,056 US$6.28
Grants vested (910) US$4.94 (779) US$5.54
Grants lapsed/forfeited (24) US$4.98 (77) US$4.07
Balance, end of year 701 US$5.02 856 US$4.50
Notes to the Financial Statements SAGICOR FINANCIAL COMPANY Ltd. (formerly Sagicor Financial Corporation Limited)Year ended December 31, 2020 and December 31, 2019 Amounts expressed in US $000
218

86
30.1 Sagicor Financial Company Ltd. (continued)
(a) LTI plan – restricted share grants (continued)
Grants issued may be satisfied out of new shares issued by Sagicor Financial Company Ltd. or by shares acquired in the market. The shares acquired in the market and/or distributed during the year were as follows:
2020 2019 Number in 000’s
$000 Number in 000’s
$000
Balance, beginning of year and end of year
40 206 40 206
During 2019, a cash settlement was made in lieu of share issue.
(b) LTI plan – share options
No share options have been granted to designated key management of the Group during the year. Up to 2008, options were granted at the fair market price of SFCL shares at the time that the option was granted. From 2009, options have been granted at the fair market price of SFCL shares prevailing one year before the option is granted. Options vest over four years, 25% each on the first four anniversaries of the grant date. Options are exercisable up to 10 years from the grant date.
30.1 Sagicor Financial Company Ltd. (continued)
(b) LTI plan – share options (continued)
The movement in share options for the year and details of the share options and assumptions used in determining their pricing are as follows:
2020 2019
Number of options
‘000
Weighted average exercise
price
Number of options
‘000
Weighted average exercise
price
Balance, beginning of year 4,673 US$4.85 3,814 US$5.24
Options granted - - 1,782 US$4.42 Options exercised (2,615) US$5.09 - US$3.90Options lapsed/forfeited (37) US$4.72 (923) US$5.50
Balance, end of year 2,021 US$4.61 4,673 US$4.85
Exercisable at the end of the year 931 US$4.46 2,568 US$5.06
Share price at grant date US$3.72 - 10.82 US$3.72 – 10.82 Fair value of options at grant date US$0.67 - 2.99 US$0.67 – 2.99
Expected volatility 18.6% - 35.8% 18.3% - 35.8% Expected life 7.0 years 7.0 years Expected dividend yield 2.6% - 4.7% 2.6% - 4.7% Risk-free interest rate 4.5% - 6.8% 4.5% - 6.8%
The expected volatility of options is based on statistical analysis of monthly share prices over the 7 years prior to grant date.
Notes to the Financial Statements SAGICOR FINANCIAL COMPANY Ltd. (formerly Sagicor Financial Corporation Limited)Year ended December 31, 2020 and December 31, 2019 Amounts expressed in US $000
219

87
30.1 Sagicor Financial Company Ltd. (continued)
(c) ESOP
From 2006, SFCL approved awards under the ESOP in respect of permanent administrative employees and sales agents of SFCL and certain subsidiaries. The ESOP is administered by the Company and the amount awarded is used to acquire Sagicor Financial Company Ltd. shares. Shares vest over a four-year period in equal tranches, and are issued as they vest. The shares acquired by the Company during the year were as follows:
2020 2019 Number in 000’s
$000 Number in 000’s
$000
Balance, beginning of year 10 70 63 266 Shares acquired - - 53 371 Shares distributed - - (106) (567) Balance, end of year 10 70 10 70
30.2 Sagicor Group Jamaica Limited
(a) Long-term incentive plan
Sagicor Group Jamaica Limited offers stock grants and stock options to senior executives as part of its long-term incentive plan. The group has set aside 150,000,000 of its authorised but un-issued shares at no par value for the stock grants and stock options.
In January 2007, the group introduced a new long-term incentive (LTI) plan which replaced the previous Stock Option plan. Under the LTI plan, executives are entitled but not obliged to purchase the group stock at a pre-specified price at some future date. The options are granted each year on the date of the Board of Directors Human Resources Committee meeting following the performance year at which the stock option awards are approved. Stock options vest in 4 equal instalments beginning the first December 31 following the grant date and for the next three December 31 dates thereafter (25% per year).
30.1 Sagicor Financial Company Ltd. (continued)
LTI plan (2019) – restricted share grants
On December 5, 2019, also concurrent with the closing of the transaction between Alignvest Acquisition II Corporation and Sagicor Financial Corporation Limited, the Company introduced a replacement award for years 2020, 2021 and 2022 under a Sagicor Financial Company Ltd. equity-based plan, in lieu of the foregoing award of restricted share units of the LTI plan introduced for certain executives in December 31, 2005.
Under the plan, certain executives are awarded a number of restrictive share units of Sagicor Financial Company Ltd. which will vest in accordance with the conditions noted below:
(a) Subject to the executives’ continued employment on the first, second and third anniversarydates of the vesting commencement date;
(b) Subject to the Company achieving its return on equity target for the relevant year, as laid out in the Company’s strategic plan or executive award agreement approved by the Company.
(c) Subject to the shares of the Company trading above Canadian $12.00 per share for 20 out of any 30-day consecutive trading days prior to December 31, 2024.
As at December 31, 2020, 545,000 shares have been granted under this plan and are subject to vesting conditions.
The movement in restricted share grants during the year is as follows:
2020 2019 Number of
grants ‘000
Weighted average
price
Number of grants ‘000
Weighted average
price
Balance, beginning of year - - - -
Grants issued 545 US$5.92 - -
Grants vested (350) US$5.92 - -
Balance, end of year 195 US$5.92 - -
Notes to the Financial Statements SAGICOR FINANCIAL COMPANY Ltd. (formerly Sagicor Financial Corporation Limited)Year ended December 31, 2020 and December 31, 2019 Amounts expressed in US $000
220

88
30.2 Sagicor Group Jamaica Limited (continued) 30.2 Sagicor Group Jamaica Limited (continued)
(b) Employee share purchase plan
Sagicor Group Jamaica Limited has in place a share purchase plan which enables its administrative and sales staff to purchase shares at a discount. The proceeds from shares issued under this plan totalled $688 (2019 – $2,017).
(a) Long-term incentive plan (continued)
Options are not exercisable after the expiration of 7 years from the date of grant. The number of stock options in each stock option award is calculated based on the LTI opportunity via stock options (percentage of applicable salary) divided by the Black-Scholes value of a stock option of Sagicor Group Jamaica Limited stock on March 31 of the measurement year. The exercise price of the options is the closing bid price on March 31 of the measurement year.
Details of the share options outstanding are set out in the following table. J$ represents Jamaica dollars.
2020 2019
Number of options
‘000
Weighted average exercise
price
Number of options
‘000
Weighted average exercise
price
Balance, beginning of year 9,600 J$23.44 14,614 J$13.60 Options granted 3,430 J$39.99 3,375 J$36.45 Options exercised (1,689) J$13.97 (7,174) J$12.00 Options lapsed/forfeited (307) J$37.08 (1,215) J$25.52
Balance, end of year 11,034 J$29.58 9,600 J$23.44 Exercisable at the end of the year 6,636 J$25.79 5,742 J$18.98
Further details of share options and the assumptions used in determining their pricing are as follows:
2020 2019
Fair value of options outstanding J$47,995,000 J$30,190,000 Share price at grant date J$7.11 - 39.99 J$7.11 – 36.45 Exercise price J$7.11 - 39.99 J$7.11 – 36.45 Standard deviation of expected share price returns 31.0% 27.0% Remaining contractual term 0.25 – 7 years 0.25 - 7 years Risk-free interest rate 4.43% 4.60%
The expected volatility is based on statistical analysis of daily share prices over seven years.
Notes to the Financial Statements SAGICOR FINANCIAL COMPANY Ltd. (formerly Sagicor Financial Corporation Limited)Year ended December 31, 2020 and December 31, 2019 Amounts expressed in US $000
221

89
31 EMPLOYEE RETIREMENT BENEFITS (continued)
The group medical and life obligations arise from employee benefit insurance plans where benefits are extended to retirees.
All disclosures in sections 31 (a) to (f) of this note relate only to defined benefit plans.
(a) Amounts recognised in the statement of financial position
2020 2019
Present value of funded pension obligations 290,443 316,471
Fair value of retirement plan assets (306,255) (326,582)
(15,812) (10,111)
Present value of unfunded pension obligations 39,258 37,453
Present value of unfunded medical and life benefits 26,168 23,215
Net liability 49,614 50,557
Represented by:
Amounts held on deposit by the Group as deposit administration contracts 25,335 60,944
Other recognised liabilities 41,007 (1,347)
Total recognised liabilities (note 18) 66,342 59,597
Recognised assets (note 12) (16,728) (9,040)
Net liability 49,614 50,557
Pension plans have purchased annuities from insurers in the Group to pay benefits to plan retirees. These obligations which amount to $37,962 (2019 - $36,490) are included in actuarial liabilities in the statement of financial position and are included as retirement plan assets in this note.
31 EMPLOYEE RETIREMENT BENEFITS
The Group maintains a number of defined contribution and defined benefit retirement benefit plans for eligible sales agents and administrative employees. The plans for sales agents and some administrative employees provide defined contribution benefits. The plans for administrative employees in Barbados, Jamaica, Trinidad, Eastern Caribbean and certain other Caribbean countries provide defined benefits based on final salary and number of years active service. Also, in these countries, retired employees may be eligible for medical and life insurance benefits which are partially or wholly funded by the Group. The principal defined benefit retirement plans are as follows:
The above plans also incorporate employees of the Company and other subsidiaries, whose attributable obligations and attributable assets are separately identified for solvency, contribution rate and reporting purposes.
The assets of the Sagicor Life Trinidad and Sagicor Life (Heritage Life of Barbados) pension plans are held under deposit administration contracts with Sagicor Life Inc and because these assets form part of the Group's assets, these plans are presented as unfunded in accordance with IAS 19 (revised).
The above pension plans are registered with the relevant regulatory authorities in the Caribbean and are governed by Trust Deeds which conform with the relevant laws. The plans are managed by the Group under the direction of appointed Trustees.
Funded Plans Unfunded Plans Sagicor Life Barbados & Eastern Caribbean Pension
Sagicor Life Trinidad Pension
Sagicor Life (Heritage Life of Barbados - Barbados & Eastern Caribbean) Pension
Sagicor Life Jamaica Pension
Sagicor Investments Jamaica Pension Group medical and life plans
Notes to the Financial Statements SAGICOR FINANCIAL COMPANY Ltd. (formerly Sagicor Financial Corporation Limited)Year ended December 31, 2020 and December 31, 2019 Amounts expressed in US $000
222

90
31 EMPLOYEE RETIREMENT BENEFITS (continued)
(b) Movements in balances
2020 2019
Medical and life benefits
Retirement obligations
Retirement plan assets
Total Medical and life benefits
Retirement obligations
Retirement plan assets
Total
Net liability / (asset), beginning of year 23,215 353,924 (326,582) 50,557 21,784 327,372 (285,172) 63,984
Current service cost (177) 7,553 9 7,385 667 6,067 - 6,734
Interest expense / (income) 1,530 21,730 (22,654) 606 1,472 18,962 (19,336) 1,098
Past service cost and gains / losses on settlements 84 4,416 - 4,500 - - (125) (125)
Net expense recognised in income 1,437 33,699 (22,645) 12,491 2,139 25,029 (19,461) 7,707
(Gains) / losses from changes in assumptions (3,948) (15,755) 2,185 (17,518) (1,052) (6,658) (316) (8,026)
(Gains) / losses from changes in experience 8,057 (26,112) 28,402 10,347 (239) 8,595 (12,512) (4,156)
Return on plan assets excluding interest income - - 2,629 2,629 - - 25 25 Change in asset ceiling excluding interest expense / (income)
- - 767 767 - (1,295) 201 (1,094)
Net (gains) / losses recognised in other comprehensive income
4,109 (41,867) 33,983 (3,775) (1,291) 642 (12,602) (13,251)
Contributions made by the Group - - (9,951) (9,951) - - (10,007) (10,007)
Contributions made by employees and retirees - 7,443 (7,443) - - 6,980 (6,980) -
Benefits paid (954) (18,638) 18,638 (954) (813) (14,846) 14,794 (865)
Other items - 9,711 (7,160) 2,551 2,233 15,774 (14,131) 3,876
Effect of exchange rate movements (1,639) (14,571) 14,905 (1,305) (837) (7,027) 6,977 (887)
Other movements (2,593) (16,055) 8,989 (9,659) 583 881 (9,347) (7,883)
Net liability / (asset), end of year 26,168 329,701 (306,255) 49,614 23,215 353,924 (326,582) 50,557
Notes to the Financial Statements SAGICOR FINANCIAL COMPANY Ltd. (formerly Sagicor Financial Corporation Limited)Year ended December 31, 2020 and December 31, 2019 Amounts expressed in US $000
223

91
31 EMPLOYEE RETIREMENT BENEFITS (continued)
(c) Retirement plan assets
2020 2019
Equity unit linked pension funds under Group management: Sagicor Equity Fund (Barbados) (39,719) (39,155)
Sagicor Bonds Fund (Barbados) (21,398) (21,706)
Sagicor Eastern Caribbean Fund (St. Lucia) (8,929) (3,624)
Sagicor Pooled Investment Funds (Jamaica):
Equity Funds (61,267) (80,993)
Mortgage & Real Estate Fund (26,616) (33,196)
Fixed Income Fund (17,454) (21,443)
Foreign Currency Funds (26,008) (25,290)
Money Market Fund (1,336) (1,865)
Other Funds (10,912) (10,212)
(213,639) (237,484)
Other assets (92,616) (89,098)
Total plan assets (306,255) (326,582)
The equity unit linked pension funds are funds domiciled in Barbados and Jamaica. Annual reports of these funds are available to the public.
Notes to the Financial Statements SAGICOR FINANCIAL COMPANY Ltd. (formerly Sagicor Financial Corporation Limited)Year ended December 31, 2020 and December 31, 2019 Amounts expressed in US $000
224

92
31 EMPLOYEE RETIREMENT BENEFITS (continued)
(d) Significant actuarial assumptions
The significant actuarial assumptions for the principal geographic areas were as follows:
2020
Pension plans Barbados &
Eastern Caribbean
Jamaica Trinidad
Discount rate - local currency benefits 7.75% 9.00% 5.50%
Discount rate - US$ indexed benefits n/a 5.00% n/a
Expected return on plan assets 7.75% 9.00% 5.50%
Future promotional salary increases 0.00% 9.00% 0.00%
Future inflationary salary increases 2.00% 9.00% 2.00%
Future pension increases 2.00% 0.50% 0.00% Future increases in National Insurance Scheme Ceilings 3.50% n/a 4.00%
Mortality table UP94 with projection scale
AA
American 1994 Group Annuitant Mortality (GAM
94) table with 5-year improvement
UP94 with projection scale
AA
Termination of active members
3% - 18.40% up to age 30, reducing to 1% – 7.2% at
age 50, 0% at age 51
2% - 5.8% up to age 30, to 3.8% - 5.8% at age 50, 2.7% - 3.8% at
age 51
3% up to age 30, reducing to 1% at age 50, 0% at age
51
Early retirement
100% at the earliest possible age to receive
unreduced benefits
n/a
100% at the earliest possible age to receive
unreduced benefits
31 EMPLOYEE RETIREMENT BENEFITS (continued)
2019
Pension plans Barbados &
Eastern Caribbean
Jamaica Trinidad
Discount rate - local currency benefits 7.75% 7.50% 5.00%
Discount rate - US$ indexed benefits n/a 5.00% n/a
Expected return on plan assets 7.75% 7.00% 5.00%
Future promotional salary increases 0.00% 9.00% 0.00%
Future inflationary salary increases 2.00% 9.00% 2.00%
Future pension increases 2.00% 0.50% 0.00%
Future increases in National Insurance Scheme Ceilings
3.50% n/a 4.00%
Mortality table UP94 with projection scale
AA
American 1994 Group Annuitant Mortality (GAM
94) table with 5-year improvement
UP94 with projection scale
AA
Termination of active members
3% - 18.40% up to age 30, reducing to 1% – 7.2% at
age 50, 0% at age 51
2% - 5.8% up to age 30, 3.8% - 5.8% at age 50, 2.7% - 3.8% at
age 51
3% up to age 30, reducing to 1% at age 50, 0% at age 51
Early retirement
100% at the earliest possible age to receive
unreduced benefits
n/a 100% at the earliest possible age to receive
unreduced benefits
Notes to the Financial Statements SAGICOR FINANCIAL COMPANY Ltd. (formerly Sagicor Financial Corporation Limited)Year ended December 31, 2020 and December 31, 2019 Amounts expressed in US $000
225

93
31 EMPLOYEE RETIREMENT BENEFITS (continued)
2020 2019 Group medical and life plans Barbados Jamaica Barbados Jamaica
Long-term increase in health costs 4.25% 7.00% 4.25% 5.00%
(e) Sensitivity of actuarial assumptions
The sensitivity of the pension retirement benefit obligations to individual changes in actuarial assumptions is summarised below:
December 31, 2020
Barbados & Eastern
Caribbean Jamaica Trinidad
Base pension obligation 96,217 178,979 15,247
Change in absolute assumption Increase / (decrease) in pension obligations
Decrease discount rate by 1.0% 8,211 9,311 1,226
Increase discount rate by 1.0% (6,713) (7,175) (870)
Decrease salary growth rate by 0.5% (515) (1,423) (194)
Increase salary growth rate by 0.5% 608 1,636 179
Increase average life expectancy by 1 year 2,405 635 390
Decrease average life expectancy by 1 year (3,171) (649) (190)
31 EMPLOYEE RETIREMENT BENEFITS (continued)
(e) Sensitivity of actuarial assumptions (continued)
2019
Barbados & Eastern
Caribbean Jamaica Trinidad
Base pension obligation 91,216 210,451 14,804
Change in absolute assumption Increase / (decrease) in pension obligations
Decrease discount rate by 1.0% 8,226 14,563 1,482
Increase discount rate by 1.0% (6,525) (10,987) (1,026)
Decrease salary growth rate by 0.5% (561) (2,306) (238)
Increase salary growth rate by 0.5% 563 2,474 288
Increase average life expectancy by 1 year 1,302 994 461
Decrease average life expectancy by 1 year (1,968) (1,035) (188)
Notes to the Financial Statements SAGICOR FINANCIAL COMPANY Ltd. (formerly Sagicor Financial Corporation Limited)Year ended December 31, 2020 and December 31, 2019 Amounts expressed in US $000
226

94
31 EMPLOYEE RETIREMENT BENEFITS (continued)
(e) Sensitivity of actuarial assumptions (continued)
The sensitivity of the medical and life benefits obligations to individual changes in actuarial assumptions is summarised below:
December 31, 2020
Jamaica
Base medical and life obligation 26,018
Change in absolute assumption Increase / (decrease) in medical
and life obligations
Decrease discount rate by 1.0% 4,631
Increase discount rate by 1.0% (3,664)
Decrease salary growth rate by 0.5% (85)
Increase salary growth rate by 0.5% 103
Increase average life expectancy by 1 year 823
Decrease average life expectancy by 1 year (823)
31 EMPLOYEE RETIREMENT BENEFITS (continued)
(e) Sensitivity of actuarial assumptions (continued)
The sensitivity of the medical and life benefits obligations to individual changes in actuarial assumptions is summarised below:
December 31, 2019
Jamaica
Base medical and life obligation 23,215
Change in absolute assumption Increase / (decrease) in medical
and life obligations
Decrease discount rate by 1.0% 4,037
Increase discount rate by 1.0% (3,189)
Decrease salary growth rate by 0.5% (115)
Increase salary growth rate by 0.5% 123
Increase average life expectancy by 1 year 671
Decrease average life expectancy by 1 year (678)
(f) Amount, timing and uncertainty of future cash flows
In addition to the annual actuarial valuations prepared for the purpose of annual financial statement reporting, full actuarial valuations of pension plans are conducted every 3 years. These full valuations contain recommendations for Group and employee contribution levels which are implemented by the Group.
For the 2021 financial year, the total Group contributions to its defined benefits pension plans are estimated to be $14,779.
Notes to the Financial Statements SAGICOR FINANCIAL COMPANY Ltd. (formerly Sagicor Financial Corporation Limited)Year ended December 31, 2020 and December 31, 2019 Amounts expressed in US $000
227

95
32 INCOME TAXES
Group companies are taxed according to the taxation rules of the countries where the operations are carried out. The principal rates of taxation are summarised in note 2.18(c). The income tax expense is set out in the following table.
2020 2019
Current tax:
Current tax on profits for the year 51,549 37,968
Adjustments to current tax of prior periods 1,007 (654)
Total current tax expense 52,556 37,314
Deferred tax:
(Increase) / decrease in deferred tax assets (note 33) (1,884) 7,879
Increase / (decrease) in deferred tax liabilities (note 33) (8,455) 13,986
Total deferred tax expense (10,339) 21,865
Share of tax of associated companies 515 531
Total tax expense 42,732 59,710
32 INCOME TAXES (continued)
Income tax on the total income subject to taxation differs from the theoretical amount that would arise as follows:
2020 2019
Income before income tax expense 27,602 163,284
Taxation at the applicable rates on income subject to tax 22,185 60,546
Adjustments to current tax for items not subject to or allowed for tax
11,995 (10,888)
Other current tax adjustments (1,179) (193)
Adjustments for current tax of prior periods 1,578 (587)
Movement in unrecognised deferred tax assets 3,957 5,330
Deferred tax relating to the origination of temporary differences
(22) (20)
Deferred tax relating to changes in tax rates or new taxes 862 1,505
Deferred tax that arises from the write-down of a tax asset - 229
Tax on distribution of profits from policyholder funds 12 42
Other taxes 3,344 3,746
42,732 59,710
In addition to the above, the income tax on items in other comprehensive income is set out in note 35.
Notes to the Financial Statements SAGICOR FINANCIAL COMPANY Ltd. (formerly Sagicor Financial Corporation Limited)Year ended December 31, 2020 and December 31, 2019 Amounts expressed in US $000
228

96
33 DEFERRED INCOME TAXES
The analysis and movement for the year of deferred tax asset balances are set out in the following table.
Defined benefit
liabilities
Unrealised losses on financial
investments
Unused tax losses Other items Total
2020 Balance, beginning of year 5,213 (1,587) 695 2,173 6,494 (Charged)/credited to: Income 353 (822) (581) 2,934 1,884 Other comprehensive income (284) (443) - (150) (877) Effect of exchange rate changes (372) 122 (36) (165) (451) Balance, end of year 4,910 (2,730) 78 4,792 7,050
Balance to be recovered within one year (1,618)
2019 Balance, beginning of year 6,207 10,700 7,105 3,571 27,583 (Charged)/credited to: Income 116 15 (6,122) (1,888) (7,879) Other comprehensive income (868) (11,869) - 609 (12,128)
Amounts assumed on acquisition - - - 1 1 Effect of exchange rate changes (242) (433) (288) (120) (1,083) Balance, end of year 5,213 (1,587) 695 2,173 6,494
Balance to be recovered within one year (464)
33 DEFERRED INCOME TAXES (continued)
Unrecognised tax losses and potential deferred income tax assets are as follows:
2020 2019
Expiry period for unrecognised tax losses: 2020 - 24,763
2021 19,882 19,882
2022 71,162 71,162
2023 87,255 87,442
2024 55,900 60,566
2025 63,723 64,077
2026 59,167 79,220
2027 63,620 -
No specified expiry date - 559
Total unrecognised tax losses 420,709 407,671
Potential deferred income tax assets 10,546 25,442
Notes to the Financial Statements SAGICOR FINANCIAL COMPANY Ltd. (formerly Sagicor Financial Corporation Limited)Year ended December 31, 2020 and December 31, 2019 Amounts expressed in US $000
229

97
33 DEFERRED INCOME TAXES (continued)
The analysis and movement for the year of deferred tax liability balances are set out in the following table.
Accelerated tax depreciation
Policy liabilities taxable in the
future
Defined benefit assets
Accrued interest
Unrealised gains on financial
investments
Off-settable tax assets relating to unused tax losses
and other items
Other Items Total
2020 Balance, beginning of year 3,721 39,282 (17) 1,501 27,243 (22,134) 1,602 51,198 Charged/(credited) to: Income 2,150 (6,076) 167 (131) 1,345 (1,349) (4,561) (8,455) Other comprehensive income (4,271) (13,067) 20 - 21,314 - 225 4,221
Amounts assumed on acquisition 2,041 - - - - - - 2,041 Effect of exchange rate changes 267 - (16) (17) (538) - 172 (132)
Balance, end of year 3,908 20,139 154 1,353 49,364 (23,483) (2,562) 48,873
Balance to be settled within one year 6,338
2019 Balance, beginning of year 3,106 48,046 325 1,128 1,302 (25,451) 502 28,958 Charged/(credited) to: Income 259 6,647 (822) 177 1,309 3,317 3,099 13,986 Other comprehensive income 113 (15,411) 1,184 - 23,859 - (2,091) 7,654
Amounts assumed on acquisition 134 - (705) 195 759 - 34 417 Effect of exchange rate changes 109 - 1 1 14 - 58 183 Balance, end of year 3,721 39,282 (17) 1,501 27,243 (22,134) 1,602 51,198 Balance to be settled within one year 13,274
Notes to the Financial Statements SAGICOR FINANCIAL COMPANY Ltd. (formerly Sagicor Financial Corporation Limited)Year ended December 31, 2020 and December 31, 2019 Amounts expressed in US $000
230

98
34 EARNINGS PER COMMON SHARE
The computation of diluted earnings per common share recognises the dilutive impact of LTI share grants and share options (note 30.1), ESOP shares grants (note 30.1) and share warrants. In computing diluted earnings per share, the weighted average number of common shares is adjusted by the dilutive impacts of the afore-mentioned share grants and options.
2020 2019
(Loss) / income attributable to common shareholders (3,605) 44,498
Weighted average number of shares in issue (in thousands)
147,830 76,452
LTI restricted share grants and share options (in thousands) 1,570 1,724
ESOP shares (in thousands) 545 541
Share warrants (in thousands) - 2,572
Adjusted weighted average number of shares in issue (in thousands)
149,945 81,289
Basic earnings per common share (2.4)¢ 58.2¢
Attributable to continuing operations (2.4)¢ 57.5¢
Attributable to discontinued operation 0.0¢ 0.7¢
Fully diluted earnings per common share (2.4)¢ 54.7¢
Attributable to continuing operations (2.4)¢ 54.1¢
Attributable to discontinued operation 0.0¢ 0.6¢
Basic earnings per share and fully diluted earnings per share computed on the loss for the year are equal, as the LTI restricted share grants and share options, ESOP share grants and share warrants, are considered to be antidilutive and have been excluded from the computation of fully diluted earnings per share. This treatment is in accordance with IAS 33 – Earnings Per Share.
Notes to the Financial Statements SAGICOR FINANCIAL COMPANY Ltd. (formerly Sagicor Financial Corporation Limited)Year ended December 31, 2020 and December 31, 2019 Amounts expressed in US $000
231
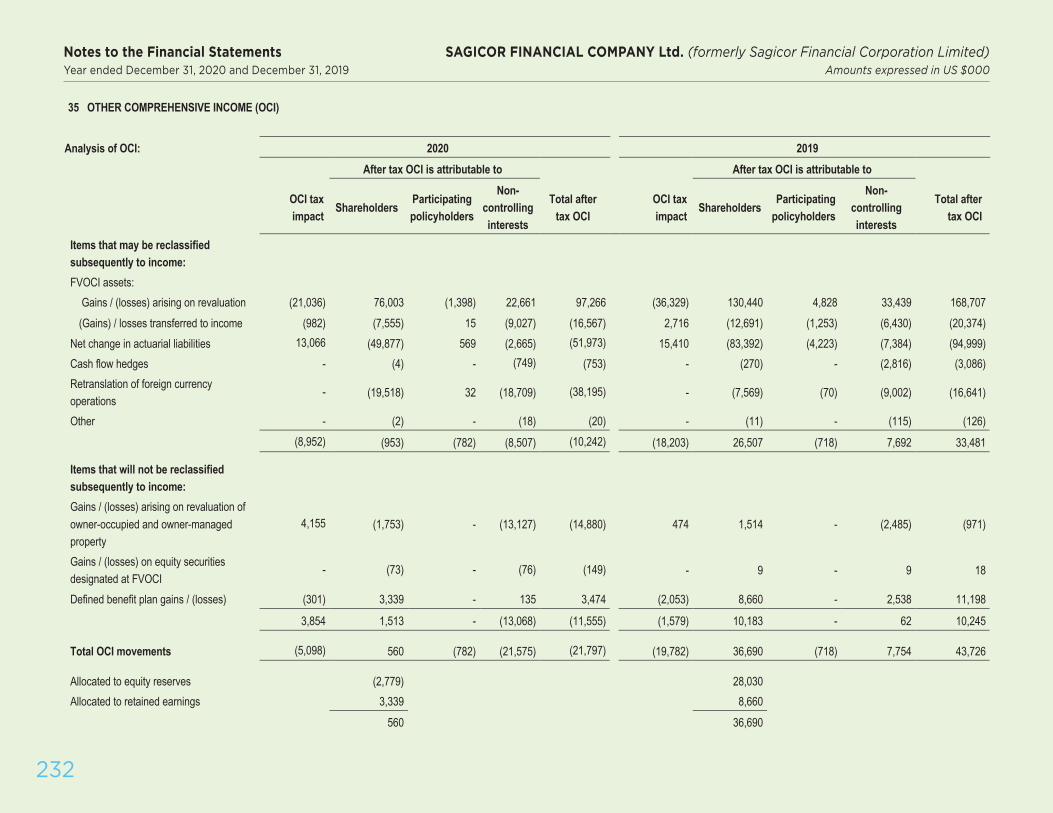
99
35 OTHER COMPREHENSIVE INCOME (OCI)
Analysis of OCI: 2020 2019 After tax OCI is attributable to After tax OCI is attributable to
OCI tax impact
Shareholders Participating policyholders
Non-controlling interests
Total after tax OCI
OCI tax impact
Shareholders Participating
policyholders
Non-controlling interests
Total after tax OCI
Items that may be reclassified subsequently to income: FVOCI assets:
Gains / (losses) arising on revaluation (21,036) 76,003 (1,398) 22,661 97,266 (36,329) 130,440 4,828 33,439 168,707 (Gains) / losses transferred to income (982) (7,555) 15 (9,027) (16,567) 2,716 (12,691) (1,253) (6,430) (20,374)
Net change in actuarial liabilities 13,066 (49,877) 569 (2,665) (51,973) 15,410 (83,392) (4,223) (7,384) (94,999) Cash flow hedges - (4) - (749) (753) - (270) - (2,816) (3,086) Retranslation of foreign currency operations
- (19,518) 32 (18,709) (38,195) - (7,569) (70) (9,002) (16,641)
Other - (2) - (18) (20) - (11) - (115) (126)(8,952) (953) (782) (8,507) (10,242) (18,203) 26,507 (718) 7,692 33,481
(18,203) 26,507 (718) 7,692 33,481Items that will not be reclassified subsequently to income: Gains / (losses) arising on revaluation of owner-occupied and owner-managed property
4,155 (1,753) - (13,127) (14,880) 474 1,514 - (2,485) (971)
Gains / (losses) on equity securities designated at FVOCI
- (73) - (76) (149) - 9 - 9 18
Defined benefit plan gains / (losses) (301) 3,339 - 135 3,474 (2,053) 8,660 - 2,538 11,198
3,854 1,513 - (13,068) (11,555) (1,579) 10,183 - 62 10,245
Total OCI movements (5,098) 560 (782) (21,575) (21,797) (19,782) 36,690 (718) 7,754 43,726
Allocated to equity reserves (2,779) 28,030 Allocated to retained earnings 3,339 8,660
560 36,690
Notes to the Financial Statements SAGICOR FINANCIAL COMPANY Ltd. (formerly Sagicor Financial Corporation Limited)Year ended December 31, 2020 and December 31, 2019 Amounts expressed in US $000
232

100
36 CASH FLOWS
36.1 Operating activities 2020 2019
Adjustments for non-cash items, interest and dividends: Income from financial investments (364,788) (464,010) Loss arising on business combinations, acquisitions and divestitures
1,262 379
Loss on impairment of investment in associates and joint ventures
31,804 -
Net increase in actuarial liabilities 534,166 484,783
Interest costs and finance costs 87,778 97,825 Credit impairment losses 23,997 4,877
Depreciation and amortisation 39,559 35,506
Provision for unearned premiums (2,326) 4,532 Other items 19,605 8,312
371,057 172,204
Net change in investments and operating assets: Investment property 12,003 1,253
Debt securities (482,157) (379,645) Equity securities (331,990) (55,711)
Mortgage loans (35,181) (8,023)
Policy loans 715 (3,782) Finance loans 6,592 (114,788)
Securities purchased for resale (5,203) 6,772
Deposits 3,060 9,808 Other assets and receivables (44,301) (38,568)
(876,462) (582,684)
36.1 Operating activities (continued)
The gross changes in investment property, debt securities and equity securities are as follows:
2020 2019
Investment property:
Purchases (266) (82)
Disposal proceeds 12,269 1,335
12,003 1,253
Debt securities:
Purchases (2,336,535) (3,025,432)
Disposal proceeds 1,854,378 2,645,787
(482,157) (379,645)
Equity securities:
Purchases (442,491) (200,101)
Disposal proceeds 110,501 144,390
(331,990) (55,711)
Net change in operating liabilities:
Insurance liabilities 18,520 (9,660)
Investment contract liabilities 16,784 36,643
Other funding instruments (36,236) (11,480)
Deposits 79,425 43,841
Securities sold for repurchase 69,972 97,583
Other liabilities and payables 25,175 (38,428)
173,640 118,499
Notes to the Financial Statements SAGICOR FINANCIAL COMPANY Ltd. (formerly Sagicor Financial Corporation Limited)Year ended December 31, 2020 and December 31, 2019 Amounts expressed in US $000
233

101
36.2 Investing activities
2020 2019
Property, plant and equipment:
Purchases (18,430) (14,016)
Disposal proceeds 3,437 6,523
(14,993) (7,493)
36.3 Financing activities
2020 2019
Notes and loans payable:
Proceeds 68,245 196,147
Repayments (109,514) (164,452)
(41,269) 31,695
36.4 Lease liability payments
2020 2019
Principal paid (5,697) (4,225)
Interest paid (2,124) (1,316)
(7,821) (5,541)
36.5 Cash and cash equivalents 2020 2019
Cash 359,972 273,072 Call deposits and other liquid balances 188,216 508,918 Bank overdrafts (980) (6,646)
547,208 775,344
Notes to the Financial Statements SAGICOR FINANCIAL COMPANY Ltd. (formerly Sagicor Financial Corporation Limited)Year ended December 31, 2020 and December 31, 2019 Amounts expressed in US $000
234

102
37.1 Playa Hotels & Resorts N.V. (continued)
(ii) Acquisition of 1.1% holding in associate:
The Group compared its share of the net identifiable assets and liabilities of Playa, at fair value, to the purchase price paid. The resulting negative goodwill has been recorded in these financial statements.
. Share of net assets acquired 7,465
Purchase consideration (5,966) Negative goodwill arising on acquisition 1,499
Negative goodwill arose as Playa’s shares have been trading below the company’s book value per share in response to depressed share prices which occurred as the hotel industry has been severely impacted by the effects of COVID-19 coronavirus on tour and hotel bookings, given widespread travel restrictions and cancellations.
37 CHANGE S IN SUBSIDIARY AND ASSOCIATE HOLDINGS
37.1 Playa Hotels & Resorts N.V.
On June 12, 2020, in addition to entering into certain financing transactions to support its ongoing operations, Playa sold 4,878,049 ordinary shares at a price of $20 million which resulted in a 0.6% dilution of Sagicor Group Jamaica Limited’s 15.4% shareholding, and ultimately the Sagicor Group’s ownership interest of 15.4%, in Playa.
On June 15, 2020, Sagicor Financial Corporation Limited, the intermediate parent company of SGJ, acquired a further 1,500,000 shares of Playa by a series of purchases, at a weighted average price of $3.9676 per share, for a total of $5,966.4 including commissions paid. This represented an increase of 1.1% in the Group’s shareholding, bringing the Group’s total shareholding in Playa to 15.9%.
The transactions gave rise to a net loss of $2,753 on dilution of the shareholding (deemed disposal), and negative goodwill of $1,499 on the acquisition of additional shares, as follows:
(i) Deemed disposal of 0.6% holding in associate:
The Group’s share of the carrying value of the investment in Playa on its balance sheet as at June 30, 2020 was compared to its share of the proceeds of $20 million received by Playa and adjusted for recycling of net unrealised foreign exchange gains and unrealised interest rate swap losses in OCI to income.
Group’s share of proceeds received by Playa on issuance of shares 2,963 Share of carrying value of investment in Playa as an associate on the balance sheet of SGJ as at June 30, 2020
(6,075)
(3,112) Net unrealised gains recycled to income 359 Loss on deemed disposal of 0.6% holding in associate (2,753)
Notes to the Financial Statements SAGICOR FINANCIAL COMPANY Ltd. (formerly Sagicor Financial Corporation Limited)Year ended December 31, 2020 and December 31, 2019 Amounts expressed in US $000
235

103
37.2 Advantage General Insurance Company Limited (AGI)
Effective September 30, 2019, the Group acquired 60% of the share capital of Advantage General Insurance Company Limited.
During the year, certain purchase price adjustments were made which impacted the determination of the final goodwill identified on acquisition. Details of the net assets acquired, purchase consideration and goodwill are as follows:
2020 2019 Final
Fair Value Provisional
Fair Value
Net assets acquired: Investment property (note 5) 5,530 5,530 Property, plant and equipment (note 7) 8,663 8,663 Intangible assets 7,226 7,226 Financial investments 62,811 62,811 Reinsurance assets 7,793 7,793 Income tax assets 3,027 3,027 Miscellaneous assets and receivables 8,916 8,916 Cash resources 1,847 1,847 Other policy liabilities (47,478) (49,367) Deposit and security liabilities (5,945) (5,945) Other liabilities / Retirement benefit liabilities (1,514) (1,515) Income tax liabilities (2,593) (416) Accounts payable and accrued liabilities (9,597) (9,597) Total net assets 38,686 38,973
Share of net assets acquired 23,210 23,383 Purchase consideration 31,178 31,178 Goodwill arising on acquisition 7,968 7,795
37.2 Advantage General Insurance Company Limited (AGI) (continued)
Goodwill arising on acquisition has been recognised as follows:
– December 31, 2019 (note 8) 7,795 – December 31, 2020 (note 8) 163 Effect of exchange rate changes 10
7,968
The acquiree’s net income and total revenue are as follows:
Total Revenue Net Income
For the year ended December 31, 2019 43,222 4,364
Consolidated from October 1, 2019 to December 31, 2019 10,973 1,076
Notes to the Financial Statements SAGICOR FINANCIAL COMPANY Ltd. (formerly Sagicor Financial Corporation Limited)Year ended December 31, 2020 and December 31, 2019 Amounts expressed in US $000
236

104
37.3 Bailey Williams Limited
On November 30, 2019, Sagicor Life Jamaica Limited purchased 70% of the issued share capital of Bailey Williams Limited. The transaction was accounted for an asset purchase, as at the time of the acquisition, Bailey Williams was not a business, as defined by IFRS 3. In accounting for the asset purchase, the purchase consideration for the shares was allocated among the identifiable assets in proportion to their relative fair values. There was no fair valuation of the identifiable assets which were recognised on acquisition. As stipulated by IFRS 3 for asset acquisitions, no goodwill or negative goodwill was recognised. Non-controlling interest in the transaction was determined by reference to the non-controlling interest’s proportionate share of the value of the assets recognised. This was a related party transaction.
Details of the net assets acquired and the purchase consideration, determined on a provisional basis, were as follows:
2019 Net assets acquired: Income tax assets 1 Land developed for resale 5,329 Cash resources 7 Deposit and security liabilities (352) Accounts payable and accrued liabilities (49) Total net assets 4,936
Purchase consideration 3,455 Non-controlling interest 1,481
4,936
37.4 Disposal of insurance portfolios
On April 8, 2019, the Group disposed of its insurance portfolios in the territories of Anguilla, Montserrat and St Maarten. The disposal was concluded by contractual agreement and transferred assets to the purchaser in exchange for the assumption of the insurance liabilities by the purchaser. The Group recorded a loss on the sale of these branches of $379.
The net loss recorded by the Group in its consolidated statement of income for the period to sale in 2019 is as follows:
Period to April 8, 2019
Total net loss (589) Loss attributable to shareholders (589)
St Maarten (364) Anguilla (61) Montserrat (164)
(589)
Notes to the Financial Statements SAGICOR FINANCIAL COMPANY Ltd. (formerly Sagicor Financial Corporation Limited)Year ended December 31, 2020 and December 31, 2019 Amounts expressed in US $000
237

105
38 DISCONTINUED OPERATION
On July 29, 2013, SFCL entered into an agreement to sell Sagicor Europe and its subsidiaries to AmTrust Financial Services, Inc. (AmTrust), subject to regulatory approvals. Final regulatory approvals were obtained on December 23, 2013, on which date the sale was completed.
The operations of the Sagicor Europe operating segment are presented as discontinued operations in these financial statements.
The terms of the sale required SFCL to take certain actions and provide certain commitments which included future price adjustments to the consideration up to December 31, 2018, representing adjusted profits or losses from January 1, 2013 in the run-off of the 2011, 2012 and 2013 underwriting years of account of syndicates 1206 and 44, the total price adjustments subject to a limit.
Movement in Price Adjustments 2019
Balance receivable, beginning of year (17,239)
Payment received 17,756
Net currency movements (517)
Receivable end of year -
The price adjustments were subject to a limit based on the terms of the agreement. These results were subject to further underwriting, investment and foreign currency adjustments constrained by the limit as the experience develops.
The net gain recognised in the statement of income is as follows:
2019
Net gain and total comprehensive gain 517
38 DISCONTINUED OPERATION (continued)
Cash Flows
2019
Net Cash flows - Operating Activities 17,756
On February 12, 2019, Sagicor Financial Corporation Limited completed a review of the consideration, related to the price adjustments to December 31, 2018, and entered into a Deed of Release with AmTrust to close this exposure. The final settlement amount of £13.5 million was received on February 26, 2019.
39 CONTINGENT LIABILITIES AND COMMITMENTS
Guarantee and financial facilities at the date of the financial statements for which no provision has been made in these financial statements include the following:
2020 2019
Customer guarantees and letters of credit (1) 35,155 34,769
(1) There are equal and offsetting claims against customers in the event of a call on the above commitments for customer guarantees and letters of credit.
(a) Legal proceedings
The Group is subject to various claims, disputes and legal proceedings, as part of the normal course of business. Provision is made for such matters when, in the opinion of management and its professional advisors, it is probable that a payment will be made by the Group, and the amount can be reasonably estimated.
In respect of claims asserted against the Group which, according to the principles outlined above, have not been provided for, management is of the opinion that such claims are either without merit, can be successfully defended, cannot be reasonably estimated or will result in exposure to the Group which is immaterial to both the financial position and results of operations.
Notes to the Financial Statements SAGICOR FINANCIAL COMPANY Ltd. (formerly Sagicor Financial Corporation Limited)Year ended December 31, 2020 and December 31, 2019 Amounts expressed in US $000
238
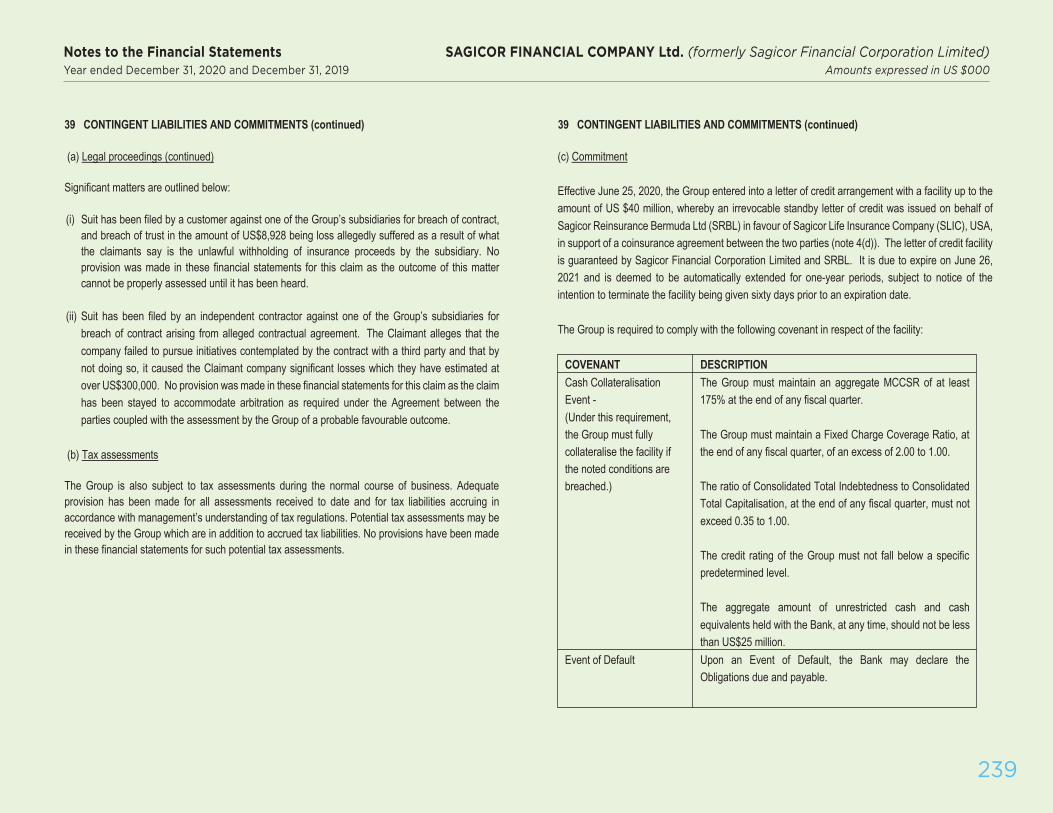
106
39 CONTINGENT LIABILITIES AND COMMITMENTS (continued)
(c) Commitment
Effective June 25, 2020, the Group entered into a letter of credit arrangement with a facility up to the amount of US $40 million, whereby an irrevocable standby letter of credit was issued on behalf of Sagicor Reinsurance Bermuda Ltd (SRBL) in favour of Sagicor Life Insurance Company (SLIC), USA, in support of a coinsurance agreement between the two parties (note 4(d)). The letter of credit facility is guaranteed by Sagicor Financial Corporation Limited and SRBL. It is due to expire on June 26, 2021 and is deemed to be automatically extended for one-year periods, subject to notice of the intention to terminate the facility being given sixty days prior to an expiration date.
The Group is required to comply with the following covenant in respect of the facility:
39 CONTINGENT LIABILITIES AND COMMITMENTS (continued)
(a) Legal proceedings (continued)
Significant matters are outlined below:
(i) Suit has been filed by a customer against one of the Group’s subsidiaries for breach of contract, and breach of trust in the amount of US$8,928 being loss allegedly suffered as a result of what the claimants say is the unlawful withholding of insurance proceeds by the subsidiary. No provision was made in these financial statements for this claim as the outcome of this matter cannot be properly assessed until it has been heard.
(ii) Suit has been filed by an independent contractor against one of the Group’s subsidiaries for breach of contract arising from alleged contractual agreement. The Claimant alleges that the company failed to pursue initiatives contemplated by the contract with a third party and that by not doing so, it caused the Claimant company significant losses which they have estimated at over US$300,000. No provision was made in these financial statements for this claim as the claim has been stayed to accommodate arbitration as required under the Agreement between the parties coupled with the assessment by the Group of a probable favourable outcome.
(b) Tax assessments
The Group is also subject to tax assessments during the normal course of business. Adequate provision has been made for all assessments received to date and for tax liabilities accruing in accordance with management’s understanding of tax regulations. Potential tax assessments may be received by the Group which are in addition to accrued tax liabilities. No provisions have been made in these financial statements for such potential tax assessments.
COVENANT DESCRIPTION Cash Collateralisation Event - (Under this requirement, the Group must fully collateralise the facility if the noted conditions are breached.)
The Group must maintain an aggregate MCCSR of at least 175% at the end of any fiscal quarter.
The Group must maintain a Fixed Charge Coverage Ratio, at the end of any fiscal quarter, of an excess of 2.00 to 1.00.
The ratio of Consolidated Total Indebtedness to Consolidated Total Capitalisation, at the end of any fiscal quarter, must not exceed 0.35 to 1.00.
The credit rating of the Group must not fall below a specific predetermined level.
The aggregate amount of unrestricted cash and cash equivalents held with the Bank, at any time, should not be less than US$25 million.
Event of Default Upon an Event of Default, the Bank may declare the Obligations due and payable.
Notes to the Financial Statements SAGICOR FINANCIAL COMPANY Ltd. (formerly Sagicor Financial Corporation Limited)Year ended December 31, 2020 and December 31, 2019 Amounts expressed in US $000
239

107
• Level 1 - fair value is determined by quoted unadjusted prices in active markets for identical assets; • Level 2 - fair value is determined by inputs other than quoted prices in active markets that are
observable for the asset either directly or indirectly;• Level 3 - fair value is determined from inputs that are not based on observable market data.
The results of applying the fair value hierarchy to the Group's property are as follows:
Level 1 Level 2 Level 3 Total 2020 Investment property - - 78,295 78,295 Owner-occupied properties - - 108,738 108,738 Owner-managed hotel properties - - 76,024 76,024
- - 263,057 263,057
2019 Investment property - - 95,577 95,577 Owner-occupied properties - - 110,172 110,172 Owner-managed hotel properties - - 96,608 96,608
- - 302,357 302,357
40 FAIR VALUE OF PROPERTY (continued)
For Level 3 investment property, reasonable changes in fair value would affect net income. For Level 3 owner-occupied properties and owner-managed hotel properties, reasonable changes in fair value would affect other comprehensive income. The movements for the year in investment property, owner-occupied properties and owner-managed hotel properties are set out in notes 5 and 7.
41 FINANCIAL RISK
The Group’s activities of issuing insurance contracts, of accepting funds from depositors, of investing insurance premium and deposit receipts in a variety of financial and other assets, banking and dealing in securities, exposes the Group to various insurance and financial risks. Financial risks include credit default, liquidity and market risks. Market risks arise from changes in interest rates, equity prices, currency exchange rates or other market factors. The principal insurance risks are identified in notes 42 and 43.
The overriding objective of the Group’s risk management framework is to enhance its capital base through competitive earnings growth and to protect capital against inherent business risks. This means that the Group accepts certain levels of risk in order to generate returns, and the Group manages the levels of risk assumed through enterprise-wide risk management policies and procedures. Identified risks are assessed as to their potential financial impact and as to their likelihood of occurrence.
Disclosures in this note, notes 42 and 43, exclude amounts of the discontinued operation.
40 FAIR VALUE OF PROPERTY
Investment property, owner-occupied property and owner-managed hotel property are carried at fair value as determined by independent valuations using internationally recognised valuation techniques. Direct sales comparisons, when such data is available, and income capitalisation methods, when appropriate, are included in the assessment of fair values. The highest and best use of a property may also be considered in determining its fair value.
Some tracts of land are currently used for farming operations or are undeveloped or are leased to third parties. In determining the fair value of all lands, their potential for development within a reasonable period is assessed, and if such potential exists, the fair value reflects that potential. These lands are mostly in Barbados and the Group has adopted a policy of orderly development and transformation to realise their full potential over time.
The fair value hierarchy has been applied to the valuations of the Group's property. The different levels of the hierarchy are as follows:
Notes to the Financial Statements SAGICOR FINANCIAL COMPANY Ltd. (formerly Sagicor Financial Corporation Limited)Year ended December 31, 2020 and December 31, 2019 Amounts expressed in US $000
240

108
41.1 Credit risk (continued)
Renegotiated assets
The Group may renegotiate the terms of any financial investment to facilitate borrowers in financial difficulty. Arrangements to waive, adjust or postpone scheduled amounts due may be entered into. The Group classifies these amounts as past due, unless the original agreement is formally revised, modified or substituted.
Rating of financial assets
The Group’s credit rating model (note 3.1) applies a rating scale to three categories of exposures: • Investment portfolios, comprising debt securities and money market funds, deposits, securities
purchased for resale, and cash; • Lending portfolios, comprising mortgage, policy and finance loans; • Reinsurance exposures, comprising reinsurance assets for life, annuity and health insurance (see
note 43.3) or realistic disaster scenarios for property and casualty insurance (see note 42.3).
For lending portfolios, the three default ratings of 8, 9 and 10 are utilised, while for investment portfolios and reinsurance assets, one default rating of 8 is utilised.
In sections 41.2, 41.3 and 41.4, we set out for the Group its credit risk exposures and credit impairments.
41.1 Credit risk
Credit risk is the exposure that the counterparty to a financial instrument is unable to meet an obligation, thereby causing a financial loss to the Group. Credit risks are associated primarily with financial investments and reinsurance assets.
Credit risk from financial investments is minimised through: • holding a diversified portfolio of investments;• purchasing quality securities;• advancing loans only after careful assessment of the borrower and obtaining collateral;• placing deposits with financial institutions with a strong capital base;• placing limits on the amount of exposure in relation to any one borrower;• obtaining collateral and guarantees from borrowers.
Investment portfolio assets are mostly unsecured except for securities purchased under agreement to resell, for which title to the securities is transferred to the Group for the duration of each agreement.
For mortgage loans, the collateral is real estate property, and the approved loan limit is 75% to 95% of collateral value. For finance loans, the collateral often comprises a vehicle or other form of security and the approved loan limit is 50% to 100% of the collateral value. Unsecured finance loans are only granted when the initial amount is less than $4,900.
The Group may foreclose on overdue mortgage loans and finance loans by repossessing the pledged asset. The Group will seek to dispose of the pledged asset by sale. In some instances, the Group may provide re-financing to a new purchaser on customary terms.
Policy loans are advanced on the security of the underlying insurance policy cash values. Cash loans are advanced to a maximum of 80% to 100% of the cash surrender value. Automatic premium loans may be advanced to the extent of available cash surrender value.
Notes to the Financial Statements SAGICOR FINANCIAL COMPANY Ltd. (formerly Sagicor Financial Corporation Limited)Year ended December 31, 2020 and December 31, 2019 Amounts expressed in US $000
241

109
41.2 Credit risk exposure
The total credit risk exposures of the Group by operating segment is as follows:
2020 2019
Sagicor Life
Sagicor Jamaica
Sagicor USA
Head office &
other Total
Sagicor Life
Sagicor Jamaica
Sagicor USA
Head office &
other Total
Investment portfolios 1,165,431 1,776,123 2,148,295 129,754 5,219,603 1,045,244 1,697,643 1,770,475 513,997 5,027,359 Lending portfolios 365,869 660,707 99,761 15,933 1,142,270 368,576 681,736 82,652 17,685 1,150,649 Cash 94,111 227,188 59,245 59,066 439,610 88,905 189,433 40,236 42,894 361,468 Reinsurance assets 5,547 12,052 665,221 6,059 688,879 6,968 4,752 679,605 8,084 699,409 Receivables 34,759 63,261 23,312 17,145 138,477 39,480 74,598 6,546 15,473 136,097
Total financial statement exposures 1,665,717 2,739,331 2,995,834 227,957 7,628,839 1,549,173 2,648,162 2,579,514 598,133 7,374,982
Lending commitments 21,897 42,875 - - 64,772 24,314 54,392 - - 78,706
Customer guarantees and letters of credit - 35,155 - - 35,155 - 34,769 - - 34,769
Total off financial statement exposures 21,897 78,030 - - 99,927 24,314 89,161 - - 113,475
Total 1,687,614 2,817,361 2,995,834 227,957 7,728,766 1,573,487 2,737,323 2,579,514 598,133 7,488,457
Notes to the Financial Statements SAGICOR FINANCIAL COMPANY Ltd. (formerly Sagicor Financial Corporation Limited)Year ended December 31, 2020 and December 31, 2019 Amounts expressed in US $000
242
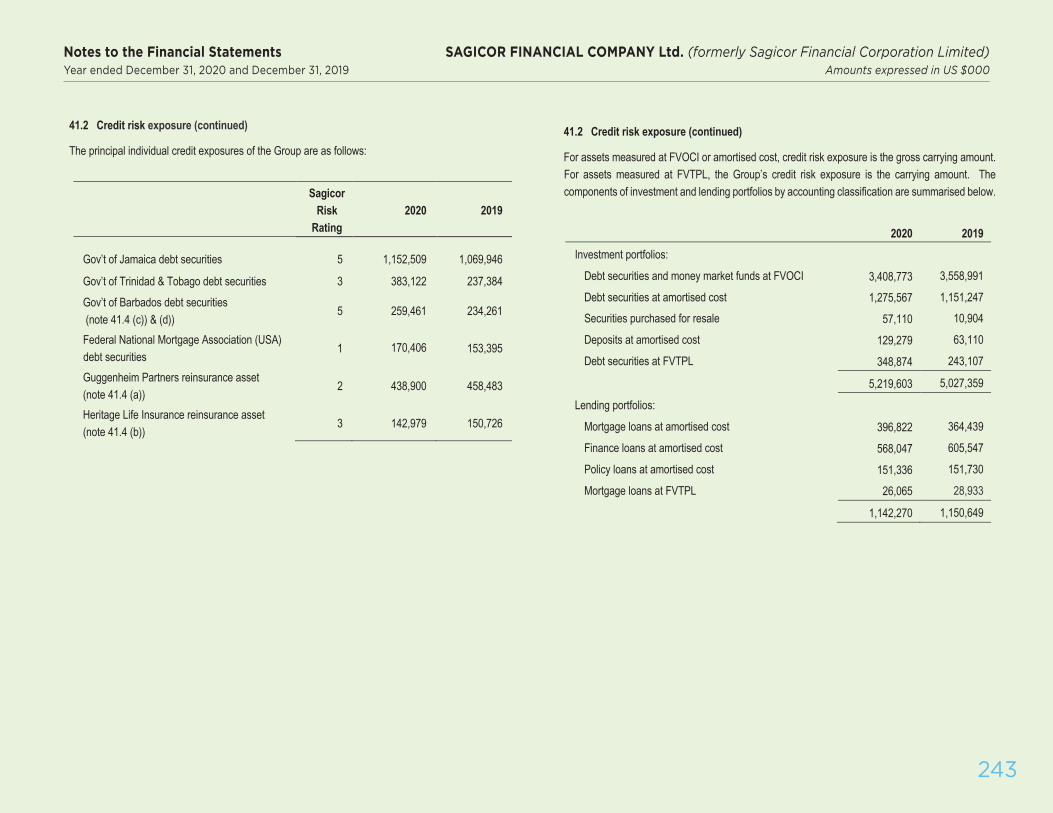
110
41.2 Credit risk exposure (continued)
The principal individual credit exposures of the Group are as follows:
Sagicor Risk
Rating 2020 2019
Gov’t of Jamaica debt securities 5 1,152,509 1,069,946
Gov’t of Trinidad & Tobago debt securities 3 383,122 237,384 Gov’t of Barbados debt securities (note 41.4 (c)) & (d))
5 259,461 234,261
Federal National Mortgage Association (USA) debt securities
1 170,406 153,395
Guggenheim Partners reinsurance asset (note 41.4 (a))
2 438,900 458,483
Heritage Life Insurance reinsurance asset (note 41.4 (b))
3 142,979 150,726
41.2 Credit risk exposure (continued)
For assets measured at FVOCI or amortised cost, credit risk exposure is the gross carrying amount. For assets measured at FVTPL, the Group’s credit risk exposure is the carrying amount. The components of investment and lending portfolios by accounting classification are summarised below.
2020 2019 Investment portfolios:
Debt securities and money market funds at FVOCI 3,408,773 3,558,991
Debt securities at amortised cost 1,275,567 1,151,247 Securities purchased for resale 57,110 10,904
Deposits at amortised cost 129,279 63,110
Debt securities at FVTPL 348,874 243,107
5,219,603 5,027,359
Lending portfolios:
Mortgage loans at amortised cost 396,822 364,439
Finance loans at amortised cost 568,047 605,547
Policy loans at amortised cost 151,336 151,730
Mortgage loans at FVTPL 26,065 28,933
1,142,270 1,150,649
Notes to the Financial Statements SAGICOR FINANCIAL COMPANY Ltd. (formerly Sagicor Financial Corporation Limited)Year ended December 31, 2020 and December 31, 2019 Amounts expressed in US $000
243

111
41.2 Credit risk exposure (continued)
Credit risk exposure – financial investments subject to impairment
Financial assets carried at amortised cost or FVOCI are subject to credit impairment losses which are recognised in the statement of income. The following tables analyse the credit risk exposure of financial investments as at December 31 for which an ECL allowance is recognised.
Debt securities and money market funds – FVOCI Debt securities and money market funds – FVOCI Debt securities
– FVOCI
2020 2019
ECL Staging
POCI Total
ECL Staging
POCI Total Stage 1 12-month
ECL
Stage 2 lifetime
ECL
Stage 3 lifetime
ECL
Stage 1 12-month
ECL
Stage 2 lifetime
ECL
Stage 3 lifetime
ECL
December 31:
Credit grade:
Investment 2,433,495 9,882 - - 2,443,377 2,780,003 4,085 - - 2,784,088
Non-investment 774,601 154,191 4,071 28,572 961,435 678,149 66,421 - 30,144 774,714
Watch - - - 45 45 - 189 - - 189
Default - - 3,841 - 3,841 - - - - -
Unrated 75 - - - 75 - - - - -
Gross carrying amount 3,208,171 164,073 7,912 28,617 3,408,773 3,458,152 70,695 - 30,144 3,558,991
Loss allowance (2,572) (8,465) (6,176) - (17,213) (2,484) (5,734) 1 - (8,217)
Carrying amount 3,205,599 155,608 1,736 28,617 3,391,560 3,455,668 64,961 1 30,144 3,550,774
Notes to the Financial Statements SAGICOR FINANCIAL COMPANY Ltd. (formerly Sagicor Financial Corporation Limited)Year ended December 31, 2020 and December 31, 2019 Amounts expressed in US $000
244

112
41.2 Credit risk exposure – financial investments subject to impairment (continued)
Debt securities – amortised cost Debt securities – amortised cost
2020 2019
ECL Staging
POCI Total
ECL Staging
POCI Total Stage 1 12-month
ECL
Stage 2 lifetime
ECL
Stage 3 lifetime
ECL
Stage 1 12-month
ECL
Stage 2 lifetime
ECL
Stage 3 lifetime
ECL
December 31:
Credit grade:
Investment 346,233 - - - 346,233 236,049 - - - 236,049
Non-investment 717,611 5,269 - 172,192 895,072 751,032 3,218 - 152,799 907,049
Watch 1,700 23,071 2,592 4,972 32,335 670 1,337 - 5,547 7,554
Default - - 1,334 - 1,334 - - - - -
Unrated 575 - - 18 593 573 - - 22 595
Gross carrying amount 1,066,119 28,340 3,926 177,182 1,275,567 988,324 4,555 - 158,368 1,151,247
Loss allowance (2,378) (1,887) (1,402) (414) (6,081) (1,378) (759) - (371) (2,508)
Carrying amount 1,063,741 26,453 2,524 176,768 1,269,486 986,946 3,796 - 157,997 1,148,739
Notes to the Financial Statements SAGICOR FINANCIAL COMPANY Ltd. (formerly Sagicor Financial Corporation Limited)Year ended December 31, 2020 and December 31, 2019 Amounts expressed in US $000
245

113
41.2 Credit risk exposure – financial investments subject to impairment (continued)
Mortgage loans – amortised cost Mortgage loans – amortised cost
2020 2019
ECL Staging
POCI Total
ECL Staging
POCI Total Stage 1 12-month
ECL
Stage 2 lifetime
ECL
Stage 3 lifetime
ECL
Stage 1 12-month
ECL
Stage 2 lifetime
ECL
Stage 3 lifetime
ECL
December 31:
Credit grade:
Investment 189,346 30,349 2,436 - 222,131 210,652 19,929 388 - 230,969
Non-investment 116,728 9,543 15,052 - 141,323 89,906 17,710 2,563 - 110,179
Watch 41 2,929 17,007 - 19,977 89 1,127 12,400 - 13,616
Default - - 13,391 - 13,391 - - 9,675 - 9,675
Gross carrying amount 306,115 42,821 47,886 - 396,822 300,647 38,766 25,026 - 364,439
Loss allowance (1,261) (556) (1,791) - (3,608) (611) (339) (942) - (1,892)
Carrying amount 304,854 42,265 46,095 - 393,214 300,036 38,427 24,084 - 362,547
Notes to the Financial Statements SAGICOR FINANCIAL COMPANY Ltd. (formerly Sagicor Financial Corporation Limited)Year ended December 31, 2020 and December 31, 2019 Amounts expressed in US $000
246

114
41.2 Credit risk exposure – financial investments subject to impairment (continued)
Policy loans – amortised cost Policy loans – amortised cost
2020 2019
ECL Staging
POCI Total
ECL Staging
POCI Total Stage 1 12-month
ECL
Stage 2 lifetime
ECL
Stage 3 lifetime
ECL
Stage 1 12-month
ECL
Stage 2 lifetime
ECL
Stage 3 lifetime
ECL
December 31:
Credit grade:
Investment 144,287 - - - 144,287 144,556 - - - 144,556
Non-investment 7,049 - - - 7,049 7,174 - - -- 7,174
Gross carrying amount 151,336 - - - 151,336 151,730 - - - 151,730
Loss allowance (298) - - - (298) (197) - - - (197)
Carrying amount 151,038 - - - 151,038 151,533 - - - 151,533
Notes to the Financial Statements SAGICOR FINANCIAL COMPANY Ltd. (formerly Sagicor Financial Corporation Limited)Year ended December 31, 2020 and December 31, 2019 Amounts expressed in US $000
247

115
41.2 Credit risk exposure – financial investments subject to impairment (continued)
Finance loans – amortised cost Finance loans – amortised cost
2020 2019
ECL Staging
POCI Total
ECL Staging
POCI Total Stage 1 12-month
ECL
Stage 2 lifetime
ECL
Stage 3 lifetime
ECL
Stage 1 12-month
ECL
Stage 2 lifetime
ECL
Stage 3 lifetime
ECL
December 31:
Credit grade:
Investment 258 - - - 258 1,444 - - - 1,444
Non-investment 523,336 26,388 - - 549,724 578,412 10,927 - - 589,339
Watch - 7,099 - - 7,099 - 2,048 - - 2,048
Default - - 10,966 - 10,966 - - 12,716 - 12,716
Gross carrying amount 523,594 33,487 10,966 - 568,047 579,856 12,975 12,716 - 605,547
Loss allowance (5,208) (903) (6,552) - (12,663) (3,757) (729) (5,754) - (10,240)
Carrying amount 518,386 32,584 4,414 - 555,384 576,099 12,246 6,962 - 595,307
Notes to the Financial Statements SAGICOR FINANCIAL COMPANY Ltd. (formerly Sagicor Financial Corporation Limited)Year ended December 31, 2020 and December 31, 2019 Amounts expressed in US $000
248

116
41.2 Credit risk exposure – financial investments subject to impairment (continued)
Securities purchases for resale – amortised cost Securities purchases for resale – amortised cost
2020 2019
ECL Staging
POCI Total
ECL Staging
POCI Total Stage 1 12-month
ECL
Stage 2 lifetime
ECL
Stage 3 lifetime
ECL
Stage 1 12-month
ECL
Stage 2 lifetime
ECL
Stage 3 lifetime
ECL
December 31:
Credit grade:
Non-investment 57,110 - - - 57,110 10,904 - - - 10,904
Gross carrying amount 57,110 - - - 57,110 10,904 - - - 10,904
Loss allowance - - - - - - - - - -
Carrying amount 57,110 - - - 57,110 10,904 - - - 10,904
Notes to the Financial Statements SAGICOR FINANCIAL COMPANY Ltd. (formerly Sagicor Financial Corporation Limited)Year ended December 31, 2020 and December 31, 2019 Amounts expressed in US $000
249

117
41.2 Credit risk exposure – financial investments subject to impairment (continued)
Deposits – amortised cost Deposits – amortised cost
2020 2019
ECL Staging
POCI Total
ECL Staging
POCI Total Stage 1 12-month
ECL
Stage 2 lifetime
ECL
Stage 3 lifetime
ECL
Stage 1 12-month
ECL
Stage 2 lifetime
ECL
Stage 3 lifetime
ECL
December 31:
Credit grade:
Investment 35,702 - - - 35,702 35,977 - - - 35,977
Non-investment 81,217 249 - - 81,466 25,367 246 - - 25,613
Watch 428 11,246 - - 11,674 716 371 - - 1,087
Unrated 437 - - - 437 433 - - - 433
Gross carrying amount 117,784 11,495 - - 129,279 62,493 617 - - 63,110
Loss allowance (288) (1,271) - - (1,559) (261) (51) - - (312)
Carrying amount 117,496 10,224 - - 127,720 62,232 566 - - 62,798
Notes to the Financial Statements SAGICOR FINANCIAL COMPANY Ltd. (formerly Sagicor Financial Corporation Limited)Year ended December 31, 2020 and December 31, 2019 Amounts expressed in US $000
250
118
41.3 Credit impairment losses – financial investments subject to impairment
The allowance for ECL is recognised in each reporting period and is impacted by a variety of factors, as described below:
• Transfers between stages due to financial instruments experiencing significant increases (or decreases) of credit risk or becoming credit-impaired during theperiod;
• Additional allowances for new financial instruments recognised during the period, as well as releases for financial instruments derecognised in the period;
• Impact on the measurement of ECL due to inputs used in the calculation,including the effect of ‘step-up’ (or ‘step down’) between 12-month and lifetime ECL;
• Impacts on the measurement of ECL due to changes made to models and assumptions; and
• Foreign exchange retranslations for assets denominated in foreign currencies and other movements.
Notes to the Financial Statements SAGICOR FINANCIAL COMPANY Ltd. (formerly Sagicor Financial Corporation Limited)Year ended December 31, 2020 and December 31, 2019 Amounts expressed in US $000
251

119
41.3 Credit impairment losses – financial investments subject to impairment (continued)
LOSS ALLOWANCES Debt securities and money market funds – FVOCI Debt securities and money market funds – FVOCI
2020 2019
ECL Staging
POCI Total
ECL Staging
POCI Total Stage 1 12-month
ECL
Stage 2 lifetime
ECL
Stage 3 lifetime
ECL
Stage 1 12-month
ECL
Stage 2 lifetime
ECL
Stage 3 lifetime
ECL
Loss allowance, beginning of year 2,484 5,733 - - 8,217 1,646 8,011 19,555 - 29,212
Transfers:
Stage 1 to Stage 2 (1,002) 1,002 - - - (70) 70 - - -
Stage 2 to Stage 1 - - - - - 2 (2) - - -
Stage 2 to Stage 3 - (1,525) 1,525 - - - - - - -
Securities originated or purchased 1,981 - - 1,981 1,695 - - - 1,695
Securities fully derecognised (577) (2,614) - - (3,191) (609) (3,481) (19,257) - (23,347)
Write-offs - - - - - (9) - - - (9)
Changes in ECL inputs, models and / or assumptions
(227) 5,871 4,665 - 10,309 (138) 1,251 (15) - 1,098
Effect of exchange rate changes (87) (2) (14) - (103) (33) (116) (283) - (432)
Loss allowance, end of year 2,572 8,465 6,176 - 17,213 2,484 5,733 - - 8,217
Credit impairment (loss) recorded in income (9,367) (3,626)
Notes to the Financial Statements SAGICOR FINANCIAL COMPANY Ltd. (formerly Sagicor Financial Corporation Limited)Year ended December 31, 2020 and December 31, 2019 Amounts expressed in US $000
252

120
41.3 Credit impairment losses – financial investments subject to impairment (continued)
LOSS ALLOWANCES Debt securities – amortised cost Debt securities – amortised cost
2020 2019
ECL Staging
POCI Total
ECL Staging
POCI Total Stage 1 12-month
ECL
Stage 2 lifetime
ECL
Stage 3 lifetime
ECL
Stage 1 12-month
ECL
Stage 2 lifetime
ECL
Stage 3 lifetime
ECL
Loss allowance, beginning of year 1,378 759 - 371 2,508 1,855 1,228 161 612 3,856
Transfers:
Stage 1 to Stage 2 (326) 326 - - - (12) 12 - - -
Stage 1 to Stage 3 - - - - - (108) - 108 - -
Stage 2 to Stage 3 - (663) 663 - - - - - - -
Securities originated or purchased 621 - - 1 622 323 - - - 323
Securities fully derecognised (229) (2) - (3) (234) (152) (51) (270) 4 (469)
Changes in ECL inputs, models and / or assumptions
948 1,466 739 45 3,198 (505) (429) 1 (245) (1,178)
Effect of exchange rate changes (14) 1 - - (13) (23) (1) - - (24)
Loss allowance, end of year 2,378 1,887 1,402 414 6,081 1,378 759 - 371 2,508
Credit impairment (loss) / loss reduction recorded in income
(3,585) 1,815
Notes to the Financial Statements SAGICOR FINANCIAL COMPANY Ltd. (formerly Sagicor Financial Corporation Limited)Year ended December 31, 2020 and December 31, 2019 Amounts expressed in US $000
253

121
41.3 Credit impairment losses – financial investments subject to impairment (continued)
LOSS ALLOWANCES Mortgage loans – amortised cost Mortgage loans – amortised cost
2020 2019
ECL Staging
POCI Total
ECL Staging
POCI Total Stage 1 12-month
ECL
Stage 2 lifetime
ECL
Stage 3 lifetime
ECL
Stage 1 12-month
ECL
Stage 2 lifetime
ECL
Stage 3 lifetime
ECL
Loss allowance, beginning of year 611 339 942 - 1,892 625 283 1,472 - 2,380
Transfers:
Stage 1 to Stage 2 (104) 104 - - - (193) 193 - - -
Stage 1 to Stage 3 (103) - 103 - - (314) - 314 - -
Stage 2 to Stage 1 83 (83) - - - 97 (97) - - -
Stage 2 to Stage 3 - (135) 135 - - - (20) 20 - -
Stage 3 to Stage 2 - 1,019 (1,019) - - - 46 (46) - -
Stage 3 to Stage 1 123 - (123) - - 145 - (145) - -
Loans originated or purchased 514 - - - 514 580 - - - 580
Loans fully derecognised (23) (9) (236) - (268) 50 (112) (525) - (587)
Changes in ECL inputs, models and / or assumptions
165 (658) 1,988 - 1,495 (377) 48 (115) - (444)
Effect of exchange rate changes (5) (21) 1 - (25) (2) (2) (33) - (37)
Loss allowance, end of year 1,261 556 1,791 - 3,608 611 339 942 - 1,892
Credit impairment (loss) recorded in income (1,785) (219)
Notes to the Financial Statements SAGICOR FINANCIAL COMPANY Ltd. (formerly Sagicor Financial Corporation Limited)Year ended December 31, 2020 and December 31, 2019 Amounts expressed in US $000
254

122
41.3 Credit impairment losses – financial investments subject to impairment (continued)
LOSS ALLOWANCES Policy loans – amortised cost Policy loans – amortised cost
2020 2019
ECL Staging
POCI Total
ECL Staging
POCI Total Stage 1 12-month
ECL
Stage 2 lifetime
ECL
Stage 3 lifetime
ECL
Stage 1 12-month
ECL
Stage 2 lifetime
ECL
Stage 3 lifetime
ECL
Loss allowance, beginning of year 197 - - - 197 110 - - - 110
Changes in ECL inputs, models and / or assumptions
105 - - - 105 91 - - - 91
Effect of exchange rate changes (4) - - - (4) (4) - - - (4)
Loss allowance, end of year 298 - - - 298 197 - - - 197
Credit impairment (loss) recorded in income (116) (92)
Notes to the Financial Statements SAGICOR FINANCIAL COMPANY Ltd. (formerly Sagicor Financial Corporation Limited)Year ended December 31, 2020 and December 31, 2019 Amounts expressed in US $000
255

123
41.3 Credit impairment losses – financial investments subject to impairment (continued)
LOSS ALLOWANCES Finance loans – amortised cost Finance loans – amortised cost
2020 2019
ECL Staging
POCI Total
ECL Staging
POCI Total Stage 1 12-month
ECL
Stage 2 lifetime
ECL
Stage 3 lifetime
ECL
Stage 1 12-month
ECL
Stage 2 lifetime
ECL
Stage 3 lifetime
ECL
Loss allowance, beginning of year 3,757 729 5,754 - 10,240 4,441 1,196 7,731 - 13,368
Transfers:
Stage 1 to Stage 2 (379) 379 - - - (299) 299 - - -
Stage 1 to Stage 3 (722) - 722 - - (530) - 530 - -
Stage 2 to Stage 1 147 (147) - - 343 (343) - - -
Stage 2 to Stage 3 - (103) 103 - - - (76) 76 - -
Stage 3 to Stage 1 45 - (45) - - 41 - (41) - -
Loans originated or purchased 1,818 - - - 1,818 2,240 - - - 2,240
Loans fully derecognised (640) (217) (1,761) - (2,618) (862) (374) (2,698) - (3,934)
Changes in ECL inputs, models and / or assumptions
1,380 283 2,013 - 3,676 (1,470) 70 428 - (972)
Effect of exchange rate changes (198) (21) (234) - (453) (147) (43) (272) - (462)
Loss allowance, end of year 5,208 903 6,552 - 12,663 3,757 729 5,754 - 10,240
Credit impairment (loss) recorded in income (7,896) (2,865)
Notes to the Financial Statements SAGICOR FINANCIAL COMPANY Ltd. (formerly Sagicor Financial Corporation Limited)Year ended December 31, 2020 and December 31, 2019 Amounts expressed in US $000
256

124
41.3 Credit impairment losses – financial investments subject to impairment (continued)
LOSS ALLOWANCES Deposits – amortised cost Deposits – amortised cost
2020 2019
ECL Staging
POCI Total
ECL Staging
POCI Total Stage 1 12-month
ECL
Stage 2 lifetime
ECL
Stage 3 lifetime
ECL
Stage 1 12-month
ECL
Stage 2 lifetime
ECL
Stage 3 lifetime
ECL
Loss allowance, beginning of year 261 51 - - 312 355 64 - - 419
Transfers:
Stage 1 to Stage 2 (103) 103 - - - (51) 51 - - -
Deposits originated or purchased 265 - - - 265 121 - - - 121
Deposits fully derecognised (140) - - - (140) (224) (65) - - (289)
Changes in ECL inputs, models and / or assumptions
5 1,117 - - 1,122 60 1 - - 61
Loss allowance, end of year 288 1,271 - - 1,559 261 51 - - 312
Credit impairment (loss) / loss reduction recorded in income
(1,248) 110
Notes to the Financial Statements SAGICOR FINANCIAL COMPANY Ltd. (formerly Sagicor Financial Corporation Limited)Year ended December 31, 2020 and December 31, 2019 Amounts expressed in US $000
257

125
41.3 Credit impairment losses – financial investments subject to impairment (continued)
(a) Economic variable assumptions
During 2019, updates were made to the regression models. With the exception of the utility and energy sector, the macroeconomic indicators for all sectors were updated to produce regressions which are better fitted to explain the relationship between the respective default rates and the macroeconomic variables.
The GBP USD and NZD USD currency pairs were introduced to enhance the explanation of the default rates in the respective sectors. This was considered critical since currency risk and sovereign risk vary among currency pairs and currency shocks can result in major losses for companies and impact their ability to satisfy their debt and consequently result in defaults.
In addition to the currency pairs, it is noted that market indices such as the S&P 500 Financial Index and the Dow Jones Industrial Average Index have demonstrated a stronger correlation to the performance of our investments in the financial and industrial sectors.
41.3 Credit impairment losses – financial investments subject to impairment (continued)
(a) Economic variable assumptions (continued)
Sagicor has selected seven economic factors which provide the overall macroeconomic environment in considering forward-looking information for base, upside and downside forecasts. These are as follows:
As of December 31, 2020 As of December 31, 2019 2021 2022 2023 2020 2021 2022
GDP Growth (USA) Base 2.0% 3.7% 2.8% 1.6% 1.8% 1.9% Upside 4.5% 3.3% 2.4% 2.2% 2.5% 2.5% Downside -0.2% 1.5% 1.5% 1.2% 1.4% 1.3%
World GDP Base 5.2% 4.2% 3.8% 3.4% 3.6% 3.6% Upside 7.8% 6.3% 5.7% 5.0% 5.3% 5.3% Downside 2.6% 2.6% 2.6% 2.5% 2.7% 2.7%
WTI Oil Prices/10 Base $4.82 $4.67 $4.58 $5.62 $5.32 $5.19 Upside $9.39 $9.39 $9.39 $9.47 $9.47 $9.47 Downside $2.02 $1.96 $1.92 $3.45 $3.27 $3.19
DOW Jones Industrial Average Index EPS
Base $1,505.82 $1,739.89 $1,739.89 $1,733.64 $1,885.49 $1,885.49 Upside $2,237.09 $2,584.83 $2,584.83 $2,450.69 $2,665.34 $2,665.34 Downside $882.91 $1,020.16 $1,020.16 $1,045.02 $1,136.56 $1,136.56
The inclusion of the additional variables in the model has improved its robustness.
A comparison of the sensitivity analyses using the old and updated models produced, especially for the financial sector, a more reliable and supportable fit between the default rate and the macroeconomic variables.
Notes to the Financial Statements SAGICOR FINANCIAL COMPANY Ltd. (formerly Sagicor Financial Corporation Limited)Year ended December 31, 2020 and December 31, 2019 Amounts expressed in US $000
258

41.3 Credit impairment losses – fi nancial investments subject to imp airment (c ontinued ) 41.3 Credit impairment losses – financial investments subject to impairment (continued)
(b) Economic variable assumptions (co ntinued) (a) Economic variable assumptions (continued)
As of December 31, 2020 As of December 31, 2019
2021 2022 2023 2020 2021 2022 Sagicor's lending operations in Barbados, Trinidad, and Jamaica have limited readily available information regarding economic forecasts. Management has examined the information within the market and selected economic drivers that have the best correlation to the portfolio's performance. Economic state is assigned to reflect the driver's impact on ECL. S&P 500 Financial
Index - EPS Base Upside Downside
$33.11 $38.95 $38.95 $38.46 $41.44 $41.44 As of December 31, 2020 $49.96 $58.77 $58.77 $54.31 $58.52 $58.52 Barbados Expected state for the next 12 months
Base Upside Downside
Scenario $21.71 $25.54 $25.54 $25.42 $27.39 $27.39 Unemployment rate Negative
Stable GBP/USD Super Negative
Base $1.37 $1.37 $1.38 $1.31 $1.32 $1.32 GDP growth Base Negative
Upside $1.49 $1.55 $1.61 $1.43 $1.49 $1.54 Upside Downside
Expected state for the next 12 months Base Upside Downside
Stable
Downside Super Negative $1.25 $1.20 $1.15 $1.18 $1.15 $1.11
Trinidad & Tobago Unemployment rate
Scenario NZD/USD Negative
Base $0.72 $0.72 $0.72 $0.65 $0.65 $0.65 Stable Upside $0.79 $0.83 $0.85 $0.70 $0.73 $0.75 Super Negative Downside $0.64 $0.61 $0.58 $0.59 $0.57 $0.74 GDP growth Base Negative
Upside Downside
Expected state for the next 12 months Base Upside Downside
Stable Super Negative
Jamaica Scenario Interest rate Stable
Positive Stable
Unemployment rate Base Negative Upside Stable Downside Super Negative
126
Notes to the Financial Statements SAGICOR FINANCIAL COMPANY Ltd. (formerly Sagicor Financial Corporation Limited)Year ended December 31, 2020 and December 31, 2019 Amounts expressed in US $000
259

127
41.3 Credit impairment losses – financial investments subject to impairment (continued)
(a) Economic variable assumptions (continued)
41.3 Credit impairment losses – financial investments subject to impairment (continued)
(b) Significant increase in credit risk (SICR)
The ECL impact of a SICR for debt securities has been estimated as follows:
SICR criteria (see note 3.1)
Actual threshold applied
Change in threshold
ECL impact of change in threshold
2020 2019
Investments 2-notch downgrade
since origination1-notch downgrade
since origination4,988 419
The staging for lending products is based primarily on days past due with 30-day used as backstop, thus sensitivity analysis is not performed.
(c) Loss given default (LGD)
From the inception of IFRS 9, the Group has used the LGD for sovereigns as provided by Moody’s. The 45% LGD in Moody’s current report represents the losses derived using the average trading prices method for US denominated external debt. Due to the limited trading activity and the small percentage of US denominated sovereign debt in our portfolio, we do not believe it is appropriate to use the average trading price method. An analysis of this calculation shows that this LGD includes losses for places such as Greece, Russia and African countries and does not truly reflect a Caribbean experience.
During 2019, an analysis of the LGD calculation was done, still using Moody’s data as a base but exploring different scenarios for deriving the LGD for Caribbean territories.
Sagicor Life Inc’s sovereign exposure is primarily in the Caribbean region where bond markets are very thinly traded. For the majority of our sovereign exposures an internal valuation method is used to produce accurate fixed income prices. To determine the accurate fair value for disclosure purposes in financial reporting, we use the present value of the bond’s expected cash flows.
As of December 31, 2019 Barbados Expected state for the next 12 months
Base Upside Downside
Scenario Unemployment rate Negative
Stable Negative
GDP growth Base Stable Upside Downside
Expected state for the next 12 months Base Upside Downside
Stable Negative
Trinidad & Tobago Unemployment rate
Scenario Negative Stable Negative
GDP growth Base Stable Upside Downside
Expected state for the next 12 months Base Upside Downside
Positive Negative
Jamaica Scenario Interest rate Positive
Positive Stable
Unemployment rate Base Positive Upside Super Positive Downside Stable
Notes to the Financial Statements SAGICOR FINANCIAL COMPANY Ltd. (formerly Sagicor Financial Corporation Limited)Year ended December 31, 2020 and December 31, 2019 Amounts expressed in US $000
260

128
41.3 Credit impairment losses – financial investments subject to impairment (continued)
(c) Loss given default (LGD) (continued)
The ECL impact of changes in LGD rates is summarised as follows:
2019
Debt securities LGD ECL impact of
Rate applied
Change in rate
increase in value
decrease in value
Corporate 52% ( - /+ 5) % 826 (786)
Sovereign, excluding Barbados and Jamaica
35% ( - /+ 5) % 317 (317)
Sovereign - Barbados - BAICO bonds
17% ( - /+ 5) % 25 (25)
Sovereign - Jamaica 15% ( - /+ 5) % 254 (254)
41.3 Credit impairment losses – financial investments subject to impairment (continued)
(c) Loss given default (LGD) (continued)
Using Moody’s NPV method results in a loss given default (LGD) of approximately 35% regardless of the inclusion of members CARICOM solely or all global defaults. Furthermore, Barbados, the most recent defaulted bond issuer in the Caribbean suffered a maximum loss of approximately 36% on the restructured domestic debt which is in line with the LGD using the NPV method.
In light of the above, we adopted the NPV method for determining the LGD for Caribbean Sovereigns and reduced the LGD to 35% as derived from the calculation.
The ECL impact of changes in LGD rates is summarised as follows:
2020
Debt securities LGD ECL impact of
Rate applied
Change in rate
increase in value
decrease in value
Corporate 53% ( - /+ 5) % 1,198 (1,198)
Sovereign, excluding Barbados and Jamaica
35% ( - /+ 5) % 509 (509)
Sovereign - Barbados - BAICO bonds
17% ( - /+ 5) % 50 (50)
Sovereign - Jamaica 15% ( - /+ 5) % 650 (650)
Notes to the Financial Statements SAGICOR FINANCIAL COMPANY Ltd. (formerly Sagicor Financial Corporation Limited)Year ended December 31, 2020 and December 31, 2019 Amounts expressed in US $000
261

129
41.3 Credit impairment losses – financial investments subject to impairment (continued)
(d) Scenario design
The weightings assigned to each economic scenario as at December 31, 2020 are set out in the following table. These weightings are unchanged from the prior year.
Base Upside Downside
Sagicor Life portfolios 80% 10% 10%
Sagicor Jamaica portfolios 80% 10% 10%
Sagicor Life USA 80% 10% 10%
The results of varying the upside and downside scenarios are as follows:
Base – 80% Upside – 5%
Downside – 15%
Base – 80% Upside – 15%
Downside – 5%
Increase in ECL Decrease in ECL
2020 2019 2020 2019
Debt securities 628 269 (628) ($269)
Lending products 253 43 (208) ($40)
Notes to the Financial Statements SAGICOR FINANCIAL COMPANY Ltd. (formerly Sagicor Financial Corporation Limited)Year ended December 31, 2020 and December 31, 2019 Amounts expressed in US $000
262

130
41.4 Gross Carrying Values – financial investments subject to impairment
The following tables explain the movement in the gross carrying amounts of investments and in the ECL classifications for the year. Gross carrying amounts represent the maximum exposure to credit risk.
Debt securities and money market funds – FVOCI Debt securities and money market funds – FVOCI
2020 2019
ECL Staging
POCI Total
ECL Staging
POCI Total Stage 1 12-month
ECL
Stage 2 lifetime
ECL
Stage 3 lifetime
ECL
Stage 1 12-month
ECL
Stage 2 lifetime
ECL
Stage 3 lifetime
ECL
Gross carrying amount, beginning of year 3,458,152 70,695 - 30,144 3,558,991 2,566,176 97,233 54,279 - 2,717,688
Transfers:
Stage 1 to Stage 2 (120,488) 120,488 - - - (4,147) 4,147 - - -
Stage 1 to Stage 3 (164) - 164 - - - - - - -
Stage 2 to Stage 1 - - - - - 267 (267) - - -
Stage 2 to Stage 3 - (7,014) 7,014 - - - - - - -
Securities originated or purchased 1,347,322 - - 45 1,347,367 1,699,054 - - 30,140 1,729,194
Securities fully derecognised (1,310,349) (18,052) - (72) (1,328,473) (717,305) (30,568) (53,493) - (801,366)
Changes in principal and interest (113,924) (4,120) 755 (1,503) (118,792) (57,536) 1,183 - - (56,353)
Effect of exchange rate changes (52,378) 2,076 (21) 3 (50,320) (28,357) (1,033) (786) 4 (30,172)
Gross carrying amount, end of year 3,208,171 164,073 7,912 28,617 3,408,773 3,458,152 70,695 - 30,144 3,558,991
Notes to the Financial Statements SAGICOR FINANCIAL COMPANY Ltd. (formerly Sagicor Financial Corporation Limited)Year ended December 31, 2020 and December 31, 2019 Amounts expressed in US $000
263

131
41.4 Gross Carrying Values – financial investments subject to impairment (continued)
Debt securities – amortised cost Debt securities – amortised cost
2020 2019
ECL Staging
POCI Total
ECL Staging
POCI Total Stage 1 12-month
ECL
Stage 2 lifetime
ECL
Stage 3 lifetime
ECL
Stage 1 12-month
ECL
Stage 2 lifetime
ECL
Stage 3 lifetime
ECL
Gross carrying amount, beginning of year 988,324 4,555 - 158,368 1,151,247 931,848 12,152 798 156,099 1,100,897
Transfers:
Stage 1 to Stage 2 (24,570) 24,570 - - - (180) 180 - - -
Stage 1 to Stage 3 - - - - - (305) - 305 - -
Stage 2 to Stage 3 - (3,874) 3,874 - - - - - - -
Securities originated or purchased 309,544 - - 271 309,815 225,588 - - 550 226,138
Securities fully derecognised (178,539) - - (66) (178,605) (135,291) (7,294) (1,100) (86) (143,771)
Changes in principal and interest (6,468) 3,089 52 18,609 15,282 (20,044) (483) (3) 1,805 (18,725)
Effect of exchange rate changes (22,172) - - - (22,172) (13,292) - - - (13,292)
Gross carrying amount, end of year 1,066,119 28,340 3,926 177,182 1,275,567 988,324 4,555 - 158,368 1,151,247
Notes to the Financial Statements SAGICOR FINANCIAL COMPANY Ltd. (formerly Sagicor Financial Corporation Limited)Year ended December 31, 2020 and December 31, 2019 Amounts expressed in US $000
264
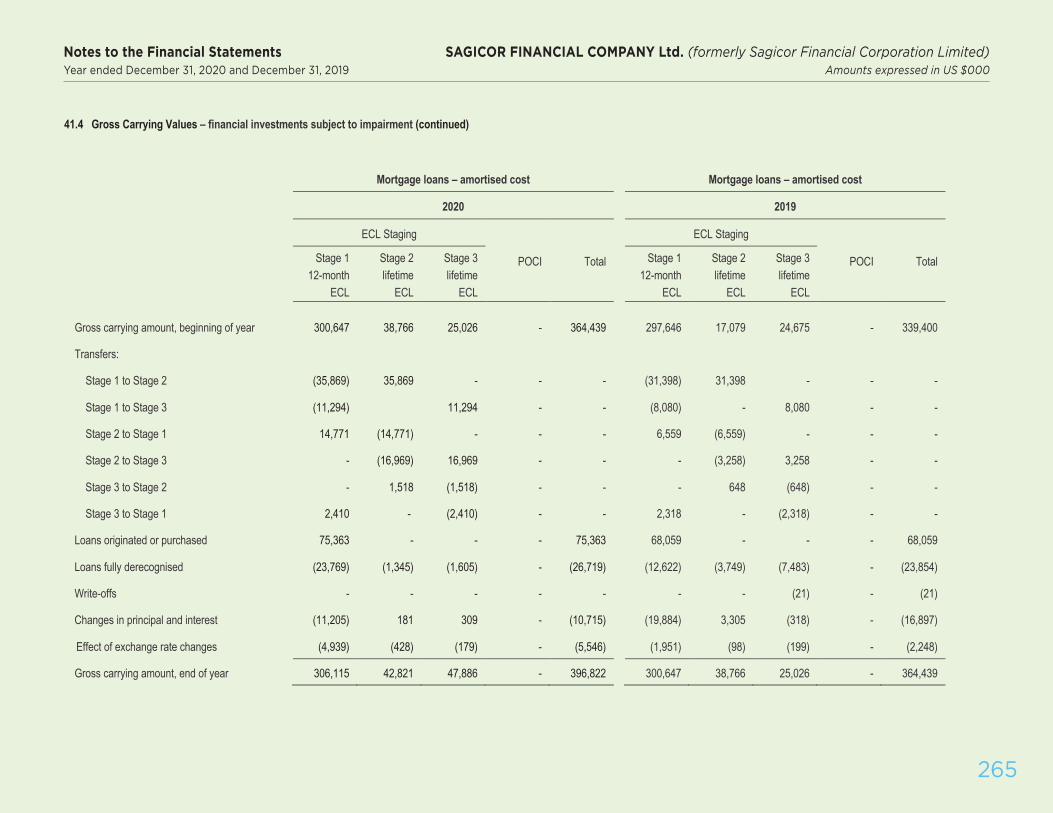
132
41.4 Gross Carrying Values – financial investments subject to impairment (continued)
Mortgage loans – amortised cost Mortgage loans – amortised cost
2020 2019
ECL Staging
POCI Total
ECL Staging
POCI Total Stage 1 12-month
ECL
Stage 2 lifetime
ECL
Stage 3 lifetime
ECL
Stage 1 12-month
ECL
Stage 2 lifetime
ECL
Stage 3 lifetime
ECL
Gross carrying amount, beginning of year 300,647 38,766 25,026 - 364,439 297,646 17,079 24,675 - 339,400
Transfers:
Stage 1 to Stage 2 (35,869) 35,869 - - - (31,398) 31,398 - - -
Stage 1 to Stage 3 (11,294) 11,294 - - (8,080) - 8,080 - -
Stage 2 to Stage 1 14,771 (14,771) - - - 6,559 (6,559) - - -
Stage 2 to Stage 3 - (16,969) 16,969 - - - (3,258) 3,258 - -
Stage 3 to Stage 2 - 1,518 (1,518) - - - 648 (648) - -
Stage 3 to Stage 1 2,410 - (2,410) - - 2,318 - (2,318) - -
Loans originated or purchased 75,363 - - - 75,363 68,059 - - - 68,059
Loans fully derecognised (23,769) (1,345) (1,605) - (26,719) (12,622) (3,749) (7,483) - (23,854)
Write-offs - - - - - - - (21) - (21)
Changes in principal and interest (11,205) 181 309 - (10,715) (19,884) 3,305 (318) - (16,897)
Effect of exchange rate changes (4,939) (428) (179) - (5,546) (1,951) (98) (199) - (2,248)
Gross carrying amount, end of year 306,115 42,821 47,886 - 396,822 300,647 38,766 25,026 - 364,439
Notes to the Financial Statements SAGICOR FINANCIAL COMPANY Ltd. (formerly Sagicor Financial Corporation Limited)Year ended December 31, 2020 and December 31, 2019 Amounts expressed in US $000
265

133
41.4 Gross Carrying Values – financial investments subject to impairment (continued)
Finance loans – amortised cost Finance loans – amortised cost
2020 2019
ECL Staging
POCI Total
ECL Staging
POCI Total Stage 1 12-month
ECL
Stage 2 lifetime
ECL
Stage 3 lifetime
ECL
Stage 1 12-month
ECL
Stage 2 lifetime
ECL
Stage 3 lifetime
ECL
Gross carrying amount, beginning of year 579,856 12,975 12,716 - 605,547 497,099 15,233 15,522 - 527,854
Transfers:
Stage 1 to Stage 2 (30,723) 30,723 - - - (9,367) 9,367 - - -
Stage 1 to Stage 3 (5,050) - 5,050 - - (3,838) - 3,838 - -
Stage 2 to Stage 1 2,372 (2,372) - - 5,050 (5,050) - - -
Stage 2 to Stage 3 - (1,743) 1,743 - - - (848) 848 - -
Stage 3 to Stage 1 93 - (93) - - 75 - (75) - -
Loans originated or purchased 130,947 - - - 130,947 233,332 - - - 233,332
Loans fully derecognised (97,688) (4,778) (3,844) - (106,310) (97,897) (3,674) (4,996) - (106,567)
Write-offs (11) (10) - - (21) - - (79) - (79)
Changes in principal and interest (25,278) (1,453) (4,018) - (30,749) (29,312) (1,608) (1,865) - (32,785)
Effect of exchange rate changes (30,924) 145 (588) - (31,367) (15,286) (445) (477) - (16,208)
Gross carrying amount, end of year 523,594 33,487 10,966 - 568,047 579,856 12,975 12,716 - 605,547
Notes to the Financial Statements SAGICOR FINANCIAL COMPANY Ltd. (formerly Sagicor Financial Corporation Limited)Year ended December 31, 2020 and December 31, 2019 Amounts expressed in US $000
266
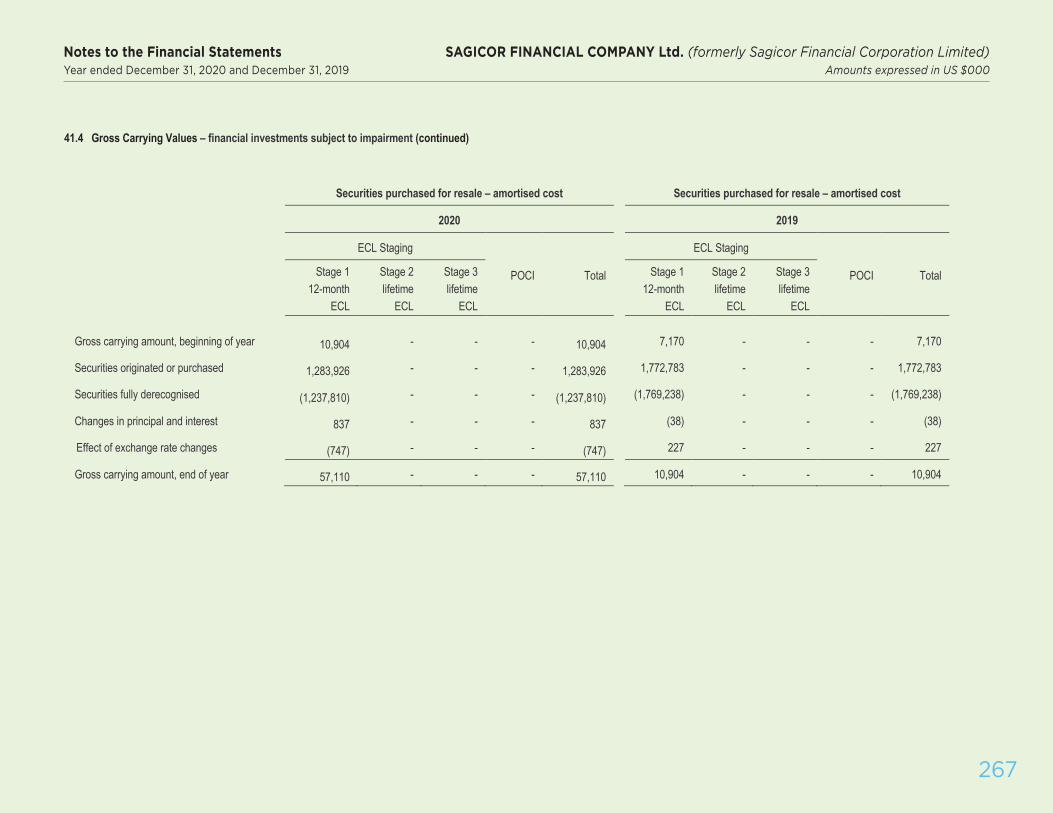
134
41.4 Gross Carrying Values – financial investments subject to impairment (continued)
Securities purchased for resale – amortised cost Securities purchased for resale – amortised cost
2020 2019
ECL Staging
POCI Total
ECL Staging
POCI Total Stage 1 12-month
ECL
Stage 2 lifetime
ECL
Stage 3 lifetime
ECL
Stage 1 12-month
ECL
Stage 2 lifetime
ECL
Stage 3 lifetime
ECL
Gross carrying amount, beginning of year 10,904 - - - 10,904 7,170 - - - 7,170
Securities originated or purchased 1,283,926 - - - 1,283,926 1,772,783 - - - 1,772,783
Securities fully derecognised (1,237,810) - - - (1,237,810) (1,769,238) - - - (1,769,238)
Changes in principal and interest 837 - - - 837 (38) - - - (38)
Effect of exchange rate changes (747) - - - (747) 227 - - - 227
Gross carrying amount, end of year 57,110 - - - 57,110 10,904 - - - 10,904
Notes to the Financial Statements SAGICOR FINANCIAL COMPANY Ltd. (formerly Sagicor Financial Corporation Limited)Year ended December 31, 2020 and December 31, 2019 Amounts expressed in US $000
267

135
41.4 Gross Carrying Values – financial investments subject to impairment (continued)
Deposits – amortised cost Deposits – amortised cost
2020 2019
ECL Staging
POCI Total
ECL Staging
POCI Total Stage 1 12-month
ECL
Stage 2 lifetime
ECL
Stage 3 lifetime
ECL
Stage 1 12-month
ECL
Stage 2 lifetime
ECL
Stage 3 lifetime
ECL
Gross carrying amount, beginning of year 62,493 617 - - 63,110 107,156 371 - - 107,527
Transfers:
Stage 1 to Stage 2 (7,471) 7,471 - - - (616) 616 - - -
Deposits originated or purchased 192,962 - - - 192,962 41,932 - - - 41,932
Deposits fully derecognised (143,456) (245) - - (143,701) (79,081) (371) - - (79,452)
Changes in principal and interest 13,393 3,652 - - 17,045 (6,071) 1 - - (6,070)
Effect of exchange rate changes (137) - - - (137) (827) - - - (827)
Gross carrying amount, end of year 117,784 11,495 - - 129,279 62,493 617 - - 63,110
Notes to the Financial Statements SAGICOR FINANCIAL COMPANY Ltd. (formerly Sagicor Financial Corporation Limited)Year ended December 31, 2020 and December 31, 2019 Amounts expressed in US $000
268

136
41.4 Gross Carrying Values – financial investments subject to impairment (continued)
Policy loans Policy loans
2020 2019
ECL Staging
POCI Total
ECL Staging
POCI Total Stage 1 12-month
ECL
Stage 2 lifetime
ECL
Stage 3 lifetime
ECL
Stage 1 12-month
ECL
Stage 2 lifetime
ECL
Stage 3 lifetime
ECL
Gross carrying amount, beginning of year 151,730 - - - 151,730 147,156 - - - 147,156
Policy loans originated or purchased 4,464 - - - 4,464 5,990 - - - 5,990
Policy loans fully derecognised (4,580) - - - (4,580) (1,265) - - - (1,265)
Changes in principal and interest (216) - - - (216) (8) - - - (8)
Effect of exchange rate changes (62) - - - (62) (143) - - - (143)
Gross carrying amount, end of year 151,336 - - - 151,336 151,730 - - - 151,730
Notes to the Financial Statements SAGICOR FINANCIAL COMPANY Ltd. (formerly Sagicor Financial Corporation Limited)Year ended December 31, 2020 and December 31, 2019 Amounts expressed in US $000
269

137
41.4 Gross Carrying Values – financial investments subject to impairment (continued)
The announcement of the suspended payments was evidence that the financial assets were credit-impaired and consequently, in June, Sagicor reclassified its GOB debt security holdings to Stage 3 with a probability of default of 100%. Some GOB debt instruments were purchased more recently and therefore there were instruments that had not yet experienced a significant increase in credit risk relative to the initial credit risk that moved from Stage 1 to Stage 3 upon the announcement.
On September 7, 2018, the GOB announced its debt-restructuring programme which is being done in conjunction with the economic recovery plan and an International Monetary Fund (IMF) programme. The IMF programme will allow Barbados to reduce its current debt service cost substantially and it is expected that the manageability of the restructured cash flows will improve the credit quality of the instrument offered in the debt exchange.
As at September 30, 2018, the negotiations of the new bond were materially completed and on October 1, 2018, Sagicor signed an agreement with the Government of Barbados which outlined the terms of the debt exchange. In exchange for its debt, the Group has accepted the following securities, the majority of which are series G:
Series G
A 50-year amortising bond which includes a 15-year grace period on principal payments. The interest rates on the bond range from 4% per annum for the first 15 years to 8% for years 26 through 50, with interest capitalisation of 100% for the first five years.
Series C
A 15-year amortising bond with interest rates ranging from 1.0% for the first 3 years to 3.75% for years 5 through to maturity. Interest on these bonds is to be paid quarterly with the first payment due on December 31, 2018. The principal will be repaid in four equal quarterly instalments commencing one year prior to maturity.
Series D
A 35-year amortising bond with interest rates ranging from 1.5% for the first 5 years to 7.5% for years 16 through to maturity. Interest on these bonds is paid quarterly with the first payment due on November 30, 2018. The principal will be repaid in three equal instalments commencing one year prior to maturity with the final payment on August 31, 2053.
41.4 Gross Carrying Values – financial investments subject to impairment (continued)
(a) Reinsurance asset – Guggenheim Partners
The reinsurance asset held in the name of Guggenheim Partners is secured by assets held in a trust. The excess of the fair value of the trust assets over the reinsurance asset is as follows:
2020 2019 Fair value of trust assets 472,395 526,146
Carrying value of reinsurance asset (438,900) (458,483)
33,495 67,663
(b) Reinsurance asset – Heritage Life Insurance Company
The reinsurance asset held in the name of Heritage Life Insurance Company is secured by assets held in a trust. The excess of the fair value of the trust assets over the reinsurance asset is as follows:
2020 2019 Fair value of trust assets 170,191 168,524 Carrying value of reinsurance asset (142,979) (150,726)
27,212 17,798
(c) Government of Barbados debt securities in default – Events in 2018
During the month of June 2018, the Government of Barbados (GOB) suspended all payments to creditors of its external commercial debt which is denominated primarily in US dollars. Interest payments due on June 5, 2018 and June 15, 2018 were not made. Principal payments on matured domestic debt which is denominated in Barbados dollars were suspended and debt-holders were required to roll over principal balances.
Notes to the Financial Statements SAGICOR FINANCIAL COMPANY Ltd. (formerly Sagicor Financial Corporation Limited)Year ended December 31, 2020 and December 31, 2019 Amounts expressed in US $000
270

41.4 Gross Carrying Values – financial investments subject to impairment (continued)
GOB Debt Securities Domestic External Total
debt debt
Gross carrying value prior to default
Loss allowance prior to default
Net carrying value prior to default
Accrued interest and other adjustments
Credit impairment loss arising from the default
Carrying value as of October 1, 2018
275,805 50,741 326,546
(7,890) (1,645) (9,535)
267,915 49,096 317,011
2,664 7,975 10,639
(75,394) (16,508) (91,902)
195,185 40,563 235,748
Accrued interest and other adjustments
Domestic debt not included in restructure
Adjusted carrying value on restructure
1,014 (1) (49,765)
146,434
Fair value on recognition of replacement securities
Gain on derecognition of original securities
147,250
816
(1) As part of the acquisition of the British American Insurance Company (BAICO) insurance portfolio,Sagicor received bonds issued by the Government of Barbados of US$46.6 million to support thepolicyholder liabilities transferred. In order to safeguard the interest of policyholders, these bondswere issued with a protective clause in accordance with the sale and purchase agreement approvedby the Supreme Court which prevented the Government of Barbados from restructuring these bondsat any time. Accordingly, these bonds have been excluded from the Government of Barbados’restructuring plan, and, have been classified as Stage 1.
41.4 Gross Carrying Values – financial investments subject to impairment (continued)
Credit impairment loss and derecognition of original domestic debt securities
As a result of the debt restructure outlined above, a credit impairment loss was recognised in the statement of income. In addition, the domestic debt securities were derecognised since the maturity profile and interest rates of the replacement debt securities were materially different. In November 2018, management derived a yield curve from which the initial fair values of the replacement securities were determined. The yield curve was derived from the Central Bank of Barbados base-line yield curve to which management applied a further risk premium considering:
The risk premium derived is summarised in the following table.
Spread Years (basis points)
0-10 25 11-21 50 22-24 75 25-29 100 30-50 150
The replacement debt securities are classified as “originated credit-impaired” (POCI).
The consequential movement in the carrying values of GOB debt for the period referred to above is summarised in the table which follows:
138
• the GOB credit rating relative to investment grade,• the potential for further default,• the lack of liquidity of the debt, and• the economic uncertainty as Barbados enters a period of severe economic reform and
structural adjustment.
Notes to the Financial Statements SAGICOR FINANCIAL COMPANY Ltd. (formerly Sagicor Financial Corporation Limited)Year ended December 31, 2020 and December 31, 2019 Amounts expressed in US $000
271

139
41.4 Gross Carrying Values – financial investments subject to impairment (continued)
(d) Government of Barbados debt securities in default – Update for 2019
External Debt
The negotiations for the exchange of the external debt were completed on December 11, 2019. In exchange for its debt, the Group has accepted the following:
- Cash in the amount of $264.
- Government of Barbados 6.5% 2021 bond offered in exchange for the accrued or past due interest outstanding (PDI). The interest rate on the bond is 6.5% per annum from October 1, 2019 to, but excluding February 1, 2021 with interest payable on October 1, 2020 and February 1, 2021. The final maturity date on this bond is February 1, 2021.
- Government of Barbados 6.5% 2029 bond offered in exchange for the principal outstanding. The interest rate on the bond is 6.5% per annum from October 1, 2019 to, but excluding October 1,2029 with interest payable each on April 1 and October 1, commencing on April 1, 2020. The finalmaturity date on this bond is October 1, 2029.
Fair value of FVOCI Government of Barbados debt securities
The fair value of the restructured instruments was determined with reference to the price at which the securities were traded at immediately subsequent to the issue of the restructured securities. These trades were between third parties conducted at arm’s length and the prices at which the trades occurred was independently verified.
41.4 Gross Carrying Values – financial investments subject to impairment (continued)
The consequential movement in the carrying values of the external debt from the default in 2018 to the restructure in 2019 is summarised as follows:
GOB Debt Securities
Gross carrying value prior to default in June 2018
Loss allowance prior to default
Net carrying value prior to default
Accrued interest and other adjustments
Credit impairment loss recognised in 2018 arising from the default
Carrying value as of October 3, 2018
Disposals and adjustments recognised in 2019 before restructure
Adjusted carrying value on restructure as of December 11, 2019
Fair value on recognition of replacement securities
Gain on derecognition of original securities
External debt
50,741
(1,645)
49,096
7,975
(16,508)
40,563
(12,978)
27,585
30,107
2,522
Notes to the Financial Statements SAGICOR FINANCIAL COMPANY Ltd. (formerly Sagicor Financial Corporation Limited)Year ended December 31, 2020 and December 31, 2019 Amounts expressed in US $000
272

140
41.5 Liquidity risk
Liquidity risk is the exposure that the Group may encounter difficulty in meeting obligations associated with financial or insurance liabilities that are settled by cash or by another financial asset. Liquidity risk also arises when excess funds accumulate resulting in the loss of opportunity to increase investment returns.
Asset liability matching is a tool used by the Group to mitigate liquidity risks, particularly in operations with significant maturing short-term liabilities. For long-term insurance contracts, the Group has adopted a policy of investing in assets with cash flow characteristics that closely match the cash flow characteristics of its policy liabilities. The primary purpose of this matching is to ensure that cash flows from these assets are synchronised with the timing and the amounts of payments that must be paid to policyholders.
Group companies monitor cash inflows and outflows in each operating currency. Through experience and monitoring, the Group is able to maintain sufficient liquid resources to meet current obligations.
(a) Insurance liabilities
The Group’s monetary insurance liabilities mature in periods which are summarised in the following table. Amounts are stated at their carrying values recognised in the financial statements and are analysed by their expected due periods, which have been estimated by actuarial or other statistical methods.
Expected discounted cash flows
Maturing within 1 year
Maturing 1 to 5 years
Maturing after
5 years Total
2020
Actuarial liabilities 323,144 1,251,502 2,578,055 4,152,701 Other policy liabilities 149,355 18,067 67,189 234,611
Total 472,499 1,269,569 2,645,244 4,387,312
2019
Actuarial liabilities 260,048 1,004,307 2,340,298 3,604,653
Other policy liabilities 127,054 30,549 70,265 227,868
Total 387,102 1,034,856 2,410,563 3,832,521
Notes to the Financial Statements SAGICOR FINANCIAL COMPANY Ltd. (formerly Sagicor Financial Corporation Limited)Year ended December 31, 2020 and December 31, 2019 Amounts expressed in US $000
273

141
41.5 Liquidity risk (continued)
(b) Financial liabilities and commitments
Contractual cash flow obligations of the Group in respect of its financial liabilities and commitments are summarised in the following table. Amounts are analysed by their earliest contractual maturity dates and consist of the contractual un-discounted cash flows. Where the interest rate of an instrument for a future period has not been determined as of the date of the financial statements, it is assumed that the interest rate then prevailing continues until final maturity.
2020 - Contractual un-discounted cash flows 2019 - Contractual un-discounted cash flows On demand or
within 1 year
1 to 5 years
After 5 years
Total On demand
or within 1 year
1 to 5 years
After 5 years
Total
Financial liabilities: Investment contract liabilities 372,337 56,534 21,091 449,962 347,937 66,481 22,160 436,578
Notes and loans payable 23,543 480,314 11,123 514,980 445,894 45,297 68,286 559,477 Lease liabilities 9,462 24,827 22,300 56,589 8,289 25,638 13,164 47,091 Deposit and security liabilities: Other funding instruments 355,050 38,831 24,347 418,228 397,057 14,110 19,918 431,085 Customer deposits 852,836 17,106 6 869,948 815,410 278 - 815,688 Structured products - - - - 6,842 - - 6,842 Securities sold for repurchase 577,998 - - 577,998 514,594 - - 514,594 Derivative financial instruments - - - - 264 - - 264 Bank overdrafts 980 - - 980 6,646 - - 6,646 Accounts payable and accrued liabilities 248,212 1,852 385 250,449 238,569 1,291 473 240,333
Total financial liabilities 2,440,418 619,464 79,252 3,139,134 2,781,502 153,095 124,001 3,058,598 Off financial statement commitments: Loan commitments 63,831 313 628 64,772 66,614 10,999 1,093 78,706 Non-cancellable lease and rental payments 434 - - 434 485 - - 485 Investments and Investment management fees 32,526 2,322 - 34,848 14,330 4,822 - 19,152Customer guarantees and letters of credit 20,095 5,417 9,643 35,155 14,385 9,009 11,375 34,769Capital commitments 15,304 - - 15,304 17,931 - - 17,931
Total off financial statement commitments 132,190 8,052 10,271 150,513 113,745 24,830 12,468 151,043 Total 2,572,608 627,516 89,523 3,289,647 2,895,247 177,925 136,469 3,209,641
Notes to the Financial Statements SAGICOR FINANCIAL COMPANY Ltd. (formerly Sagicor Financial Corporation Limited)Year ended December 31, 2020 and December 31, 2019 Amounts expressed in US $000
274

142
41.5 Liquidity risk (continued)
(c) Financial and insurance assets
The contractual maturity periods of monetary financial assets and the expected maturity periods of monetary insurance assets are summarised in the following table. Amounts are stated at their carrying values recognised in the financial statements. For this disclosure, monetary insurance assets comprise policy loans and reinsurance assets.
2020 – Contractual or expected discounted cash flows 2019 – Contractual or expected discounted cash flows
Maturing within 1 year
Maturing 1 to 5 years
Maturing after
5 years Total
Maturing within 1 year
Maturing 1 to 5 years
Maturing after
5 years Total
Debt securities and money market funds 699,719 944,657 3,585,901 5,230,277 1,166,928 774,148 3,124,191 5,065,267
Mortgage loans 24,138 72,260 322,881 419,279 21,172 38,956 331,352 391,480
Policy loans 4,589 13,756 132,693 151,038 5,264 14,343 131,926 151,533
Finance loans 160,965 207,243 187,176 555,384 184,442 286,589 124,276 595,307
Securities purchased for resale 57,110 - - 57,110 10,904 - - 10,904
Deposits 127,559 161 - 127,720 58,255 2,741 1,802 62,798
Derivative financial instruments 37,188 - - 37,188 36,891 - - 36,891
Reinsurance assets: share of actuarial liabilities 67,237 291,116 281,444 639,797 70,578 279,520 311,713 661,811
Reinsurance assets: other 48,893 - 189 49,082 37,409 - 189 37,598
Premiums receivable 59,780 - - 59,780 57,584 - - 57,584
Other assets and accounts receivable 76,876 2,044 522 79,442 75,886 2,083 544 78,513
Cash resources 439,610 - - 439,610 361,468 - - 361,468
Total 1,803,664 1,531,237 4,510,806 7,845,707 2,086,781 1,398,380 4,025,993 7,511,154
Notes to the Financial Statements SAGICOR FINANCIAL COMPANY Ltd. (formerly Sagicor Financial Corporation Limited)Year ended December 31, 2020 and December 31, 2019 Amounts expressed in US $000
275

143
41.5 Liquidity risk (continued)
(d) Sale and purchase of held-to-collect debt securities
In September 2020, given its continued focus on mitigating liquidity risks by improving its asset liability matching, the Group made a decision to purchase long-term bonds issued by the Government of Trinidad & Tobago (GOTT) in the amount of US$164 million. The transaction was facilitated and financed by the sale of several shorter-term bonds totalling US$129 million which had been included in the “held to collect” category in accordance with this IFRS 9 classification, based on the business model for managing these instruments and their contractual cash flow characteristics. Given the purpose of the transaction, which was not profit-oriented and which yielded an immaterial gain of US$0.3 million, the new instruments acquired have been classified as “held to collect” under the business model, which remains unchanged, and given the contractual terms governing their cash flows.
41.6 Interest rate risk
The Group is exposed to interest rate risks. Cash flow interest rate risk is the risk that future cash flows of a financial instrument will fluctuate because of changes in market interest rates. Fair value interest rate risk is the risk that the fair value of a financial instrument will fluctuate because of changes in market interest rates. The occurrence of an adverse change in interest rates on invested assets may result in financial loss to the Group in fulfilling the contractual returns on insurance and financial liabilities.
The return on investments may be variable, fixed for a term or fixed to maturity. On reinvestment of a matured investment, the returns available on the new investment may be significantly different from the returns formerly achieved. This is known as reinvestment risk.
Guaranteed minimum returns exist within cash values of long-term traditional insurance contracts, long-term universal life insurance contracts, annuity options, deposit administration liabilities and policy funds on deposit. Where the returns credited exceed the guaranteed minima, the insurer usually has the option to adjust the return from period to period. For other financial liabilities, returns are usually contractual and may only be adjusted on contract renewal or contract re-pricing.
41.6 Interest rate risk (continued)
The Group is therefore exposed to the effects of fluctuations in the prevailing levels of market interest rates on its financial position and cash flows. Interest margins may increase or decrease as a result of such changes. Interest rate changes may also result in losses if asset and liability cash flows are not closely matched with respect to timing and amount.
The Group is exposed to risk under embedded derivatives contained in a host insurance contract. These risks include exposures to investment returns which may produce losses to the insurer arising from the following contract features:
• minimum annuity rates which are guaranteed to be applied at some future date; • minimum guaranteed death benefits which are applicable when the performance of an
interest-bearing or unit linked fund falls below expectations;• minimum guaranteed returns in respect of cash values and universal life investment accounts.
The Group manages its interest rate risk by various measures including, where feasible, the selection of assets which best match the maturity of liabilities; the offering of investment contracts which match the maturity profile of assets; the re-pricing of interest rates on loans receivable; policy contracts and financial liabilities in response to market changes. In certain Caribbean markets, where availability of suitable investments is often a challenge, the Group holds many of its fixed-rate debt securities to maturity and therefore mitigates the transient interest rate changes in these markets.
Notes to the Financial Statements SAGICOR FINANCIAL COMPANY Ltd. (formerly Sagicor Financial Corporation Limited)Year ended December 31, 2020 and December 31, 2019 Amounts expressed in US $000
276

144
41.6 Interest rate risk (continued)
The table following summarises the exposures to interest rates on the Group’s monetary insurance and financial liabilities (excluding actuarial liabilities which are disclosed in note 43). It includes liabilities at carrying amounts, categorised by the earlier of contractual re-pricing or maturity dates. Insurance liabilities are categorised by their expected maturities.
2020 2019
Exposure within 1 year
Exposure 1 to 5 years
Exposure after
5 years
Not exposed to
interest Total
Exposure within 1 year
Exposure 1 to 5 years
Exposure after
5 years
Not exposed to
interest Total
Other policy liabilities 13,676 4,103 66,466 150,366 234,611 8,074 3,897 49,277 166,620 227,868
Investment contract liabilities 366,918 46,710 23,894 82 437,604 346,154 60,441 17,657 88 424,340
Notes and loans payable 15,343 445,706 9,859 714 471,622 419,647 27,052 71,479 (446) 517,732
Lease liabilities 7,691 20,547 10,251 1,120 39,609 6,527 19,036 4,232 5,905 35,700
Deposit and security liabilities:
Other funding instruments 352,306 20,285 15,721 211 388,523 395,444 9,798 12,569 236 418,047
Customer deposits 845,326 14,934 5 1,387 861,652 804,901 216 - 3,002 808,119
Structured products - - - - - 6,756 - - - 6,756
Securities sold for repurchase 573,540 - - 2,064 575,604 511,309 - - 1,548 512,857
Derivative financial instruments - - - - - - - - 264 264
Bank overdrafts 969 - - 11 980 6,646 - - - 6,646
Accounts payable and accrued liabilities 826 1,127 - 248,497 250,450 1,074 1,074 - 238,185 240,333
Total 2,176,595 553,412 126,196 404,452 3,260,655 2,506,532 121,514 155,214 415,402 3,198,662
Notes to the Financial Statements SAGICOR FINANCIAL COMPANY Ltd. (formerly Sagicor Financial Corporation Limited)Year ended December 31, 2020 and December 31, 2019 Amounts expressed in US $000
277

145
41.6 Interest rate risk (continued)
The table following summarises the exposures to interest rate and reinvestment risks of the Group’s monetary insurance and financial assets. Assets are stated at carrying amounts, categorised by the earlier of contractual re-pricing or maturity dates. Reinsurance assets and policy loans are categorised by their expected maturities.
2020 2019
Exposure within 1 year
Exposure 1 to 5 years
Exposure after
5 years
Not exposed
to interest Total
Exposure within 1 year
Exposure 1 to 5 years
Exposure after
5 years
Not exposed
to interest Total
Debt securities and money market funds 787,764 889,132 3,472,756 80,625 5,230,277 1,308,182 727,057 2,969,807 60,221 5,065,267
Equity securities - - - 660,573 660,573 - - - 371,464 371,464
Mortgage loans 93,733 65,789 256,392 3,365 419,279 77,676 30,276 281,183 2,345 391,480
Policy loans 3,925 13,380 127,849 5,884 151,038 4,400 14,141 131,791 1,201 151,533
Finance loans 528,923 15,279 6,192 4,990 555,384 572,442 15,574 5,665 1,626 595,307
Securities purchased for resale 57,011 - - 99 57,110 10,871 - - 33 10,904
Deposits 125,411 2,092 - 217 127,720 57,918 2,733 1,802 345 62,798
Derivative financial instruments - - - 37,188 37,188 264 - - 36,627 36,891
Reinsurance assets: other - - 189 48,893 49,082 151 - 189 37,258 37,598
Premiums receivable - - - 59,780 59,780 105 - - 57,479 57,584
Other assets and accounts receivable 896 1,127 - 77,419 79,442 2,804 1,179 - 74,530 78,513
Cash resources 84,246 - - 355,364 439,610 220,494 - - 140,974 361,468
Total 1,681,909 986,799 3,863,378 1,334,397 7,866,483 2,255,307 790,960 3,390,437 784,103 7,220,807
Notes to the Financial Statements SAGICOR FINANCIAL COMPANY Ltd. (formerly Sagicor Financial Corporation Limited)Year ended December 31, 2020 and December 31, 2019 Amounts expressed in US $000
278

146
41.6 Interest rate risk (continued)
The table below summarises the average interest yields on certain financial investments and financial liabilities held during the year.
2020 2019
Financial investments carried at FVOCI and amortised cost: Debt securities and money market funds 4.6% 5.1% Mortgage loans 5.8% 6.0% Policy loans 7.5% 7.3% Finance loans 11.2% 11.6% Securities purchased for resale 2.4% 6.2% Deposits 1.0% 1.6%
Financial liabilities carried at amortised cost: Investment contract liabilities 2.8% 2.6% Notes and loans payable 8.3% 8.1% Other funding instruments 0.9% 2.3% Deposits 1.2% 1.3% Securities sold for repurchase 2.3% 3.0%
a) Sensitivity
Sensitivity to interest rate risk is considered by operating subsidiaries. The effects of changes in interest rates of assets backing actuarial liabilities are disclosed in note 43.4. The Group’s property and casualty operations are not exposed to a significant degree of interest rate risk, since the majority of their interest-bearing instruments have short-term maturities. The sensitivity of the Group’s principal operating subsidiaries engaged in banking, investment management and other financial services are considered in the following paragraphs.
41.6 Interest rate risk (continued)
Sagicor Investments Jamaica Limited and Sagicor Bank Jamaica Limited
The following table indicates the sensitivity to a reasonable possible change in interest rates, with all other variables held constant, on net income and total comprehensive income (TCI) of the above companies which operate in Jamaica.
The sensitivity of income is the effect of the assumed changes in interest rates on income based on floating-rate debt securities and financial liabilities. The sensitivity of TCI is calculated by revaluing fixed rate financial assets carried at FVOCI for the effects of the assumed changes in interest rates. The correlation of a number of variables will have an impact on market risk. It should be noted that movements in these variables are non-linear and are assessed individually.
41.7 Foreign exchange risk
The Group is exposed to foreign exchange risk as a result of fluctuations in exchange rates as its financial assets and liabilities are denominated in different currencies.
In order to manage the risk associated with movements in currency exchange rates, the Group seeks to maintain investments and cash in each operating currency, which are sufficient to match liabilities denominated in the same currency. Exceptions are made to invest amounts in United States dollar assets which are held to back liabilities in Caribbean currencies. Management considers that these assets diversify the range of investments available in the Caribbean, and in the long-term are likely to either maintain capital value and/or provide satisfactory returns.
Assets and liabilities by currency are summarised in the following tables.
2020 2019
Change in Effect on Change in Effect on interest rate Effect on Effect on
net interest rate net TCI TCI
JMD USD income JMD USD income
- 1% - 0.5% 3,454 48,538 - 1% - 0.5% 2,501 21,906
+1% + 0.5% (3,454) (42,924) +1% + 0.5% (2,501) (30,360)
Notes to the Financial Statements SAGICOR FINANCIAL COMPANY Ltd. (formerly Sagicor Financial Corporation Limited)Year ended December 31, 2020 and December 31, 2019 Amounts expressed in US $000
279

147
41.7 Foreign exchange risk (continued)
2020 US$000 equivalents of balances denominated in
Barbados $ Jamaica $ Trinidad $ Eastern
Caribbean $ US $
Other Currencies
Total
ASSETS Financial investments (1) 362,242 1,296,881 575,067 164,029 4,065,554 114,223 6,577,996
Reinsurance assets (1) 1,805 10,129 1,206 1,218 673,676 845 688,879 Receivables (1) 21,195 57,964 12,654 13,213 31,103 3,915 140,044
Cash resources 29,335 98,249 42,160 15,489 203,805 50,572 439,610
Total monetary assets 414,577 1,463,223 631,087 193,949 4,974,138 169,555 7,846,529
Other assets (2) 202,633 416,232 87,267 19,912 692,692 1,048 1,419,784
Total assets of continuing operations 617,210 1,879,455 718,354 213,861 5,666,830 170,603 9,266,313
LIABILITIES Actuarial liabilities 441,850 330,888 456,668 82,634 2,713,759 126,902 4,152,701
Other policy liabilities (1) 81,774 54,671 32,132 11,893 40,128 14,013 234,611
Investment contracts 30,571 74,781 175,492 55,993 91,151 9,616 437,604
Notes and loans payable 21,686 51,948 - - 397,988 - 471,622 Lease liabilities 439 19,520 427 4 18,452 767 39,609
Deposit and security liabilities 25 694,015 19,273 15,184 1,080,462 17,800 1,826,759
Other liabilities / Retirement benefit liabilities 16,011 26,019 13,065 (57) 576 10,928 66,542
Accounts payable and accruals 45,469 88,415 19,072 4,426 87,339 5,730 250,451
Total monetary liabilities 637,825 1,340,257 716,129 170,077 4,429,855 185,756 7,479,899
Other liabilities (2) 20,207 45,733 14,165 4,959 35,791 2,338 123,193
Total liabilities of continuing operations 658,032 1,385,990 730,294 175,036 4,465,646 188,094 7,603,092
Net position (40,822) 493,465 (11,940) 38,825 1,201,184 (17,491) 1,663,221 (1) Monetary balances only(2) Non-monetary balances, income tax balances and retirement plan assets
Notes to the Financial Statements SAGICOR FINANCIAL COMPANY Ltd. (formerly Sagicor Financial Corporation Limited)Year ended December 31, 2020 and December 31, 2019 Amounts expressed in US $000
280

148
41.7 Foreign exchange risk (continued)
2019 US$000 equivalents of balances denominated in
Barbados $ Jamaica $ Trinidad $ Eastern
Caribbean $ US $
Other Currencies
Total
ASSETS
Financial investments (1) 341,196 1,344,085 474,248 150,089 3,879,177 125,385 6,314,180
Reinsurance assets (1) 6,739 3,774 4,767 2,146 681,582 401 699,409
Receivables (1) 22,843 69,362 10,309 15,746 14,785 5,023 138,068
Cash resources 21,158 91,584 26,510 9,658 165,368 47,190 361,468
Total monetary assets 391,936 1,508,805 515,834 177,639 4,740,912 177,999 7,513,125
Other assets (2) 199,216 477,784 90,844 20,828 425,766 1,308 1,215,746
Total assets of continuing operations 591,152 1,986,589 606,678 198,467 5,166,678 179,307 8,728,871
LIABILITIES
Actuarial liabilities 438,452 411,439 366,143 79,372 2,194,599 114,648 3,604,653
Other policy liabilities (1) 80,640 55,802 32,844 12,187 31,725 14,670 227,868
Investment contracts 31,632 81,800 182,907 53,405 65,321 9,275 424,340
Notes and loans payable 14,436 104,402 - - 398,894 - 517,732
Lease liabilities 2,764 23,251 2,317 128 6,392 848 35,700
Deposit and security liabilities 1,276 684,219 1,087 15,316 1,033,146 17,645 1,752,689
Other liabilities / Retirement benefit liabilities 11,901 25,238 12,871 46 2,294 7,445 59,795
Accounts payable and accruals 40,699 116,864 18,115 1,902 57,389 5,364 240,333
Total monetary liabilities 621,800 1,503,015 616,284 162,356 3,789,760 169,895 6,863,110
Other liabilities (2) 18,749 32,529 15,199 5,079 42,210 2,215 115,981
Total liabilities of continuing operations 640,549 1,535,544 631,483 167,435 3,831,970 172,110 6,979,091
Net position (49,397) 451,045 (24,805) 31,032 1,334,708 7,197 1,749,780 (1) Monetary balances only(2) Non-monetary balances, income tax balances and retirement plan assets
Notes to the Financial Statements SAGICOR FINANCIAL COMPANY Ltd. (formerly Sagicor Financial Corporation Limited)Year ended December 31, 2020 and December 31, 2019 Amounts expressed in US $000
281

149
41.7 Foreign exchange risk (continued)
(a) Sensitivity
The Group is exposed to currency risk in its operating currencies for which values have noticeably fluctuated against the United States dollar (USD).
The exposure to currency risk may result in three types of risk, namely:
• Currency risk relating to the future cash flows of monetary balances
This occurs when a monetary balance is denominated in a currency other than the functional currency of the reporting unit to which it belongs. In this instance, a change in currency exchange rates results in the monetary balances being retranslated at the date of the financial statements, and the exchange gain or loss is taken to income (note 27).
• Currency risk of reported results of foreign operations
This occurs when a reporting unit’s functional currency depreciates or appreciates in value when retranslated to the USD, which is the Group’s presentational currency. In this instance, the conversion of the reporting unit’s results at a different rate of exchange results in either less or more income being consolidated in the Group’s income statement.
• Currency risk of the Group’s investment in foreign operations
This occurs when a reporting unit’s functional currency depreciates or appreciates in value when retranslated to the USD, which is the Group’s presentational currency. In this instance, the conversion of the reporting unit’s assets and liabilities at a different rate of exchange results in a currency loss or gain which is recorded in the currency translation reserve (note 22). If the reporting unit is disposed of, either wholly or in part, then the corresponding accumulated loss or gain in the currency translation reserve would be transferred to income or retained earnings.
The operating currency for which value noticeably fluctuates against the USD is the Jamaica dollar (JMD). The theoretical impact of JMD currency risk on reported results, and of the Group’s investment in foreign operations, is considered in the following section.
41.7 Foreign exchange risk (continued)
JMD currency risk
The effect of a 10% depreciation in the JMD relative to the USD arising from JMD reporting units as of December 31, 2020 and for the year then ended are considered in the following table.
Amounts denominated in Total amounts
Effect of a 10% depreciation JMD USD
Financial position:
Assets 2,637,242 1,139,538 3,776,780 (263,725) Liabilities 1,746,457 982,566 2,729,023 (174,646)
Net position 890,785 156,972 1,047,757 (89,079) Represented by:
Currency risk of the Group’s investment in foreign operations (89,079)
Income statement:
Revenue 488,376 89,822 578,198 (33,063) Benefits (204,982) (6,035) (211,017) 20,498 Expenses (196,552) (13,693) (210,245) 19,655 Income taxes (42,949) - (42,949) 4,295
Net income 43,893 70,094 113,987 11,385 Represented by: Currency risk relating to the future cash flows of monetary balances 15,775
Currency risk of reported results of foreign operations (4,390)
11,385
A 10% appreciation in the JMD relative to the USD would have equal and opposite effects to those disclosed above.
Notes to the Financial Statements SAGICOR FINANCIAL COMPANY Ltd. (formerly Sagicor Financial Corporation Limited)Year ended December 31, 2020 and December 31, 2019 Amounts expressed in US $000
282

150
41.8 Fair value of financial instruments (continued)
In assessing the fair value of non-traded financial liabilities, the Group uses a variety of methods including obtaining dealer quotes for specific or similar instruments, and the use of internally developed pricing models such as the use of discounted cash flows. If the non-traded liability is backed by a pool of assets, then its value is equivalent to the value of the underlying assets.
(iii) Level 3 – inputs for the instrument that are not based on observable market data
A financial instrument is classified as Level 3 if: • The fair value is derived from quoted prices of similar instruments that are observable and
which would be classified as Level 2; or • The fair value is derived from inputs that are not based on observable market data.
Level 3 assets designated as FVTPL include mortgage loans, debt securities and equities for which the full income and capital returns accrue to holders of unit linked liabilities. These assets are valued with inputs other than observable market data.
The techniques and methods described in the preceding section (ii) for non-traded financial assets and liabilities may also be used in determining the fair value of Level 3 instruments.
41.8 Fair value of financial instruments
The fair value of financial instruments is measured according to a fair value hierarchy which reflects the significance of market inputs in the valuation. This hierarchy is described and discussed in sections (i) to (iii) below.
(i) Level 1 – unadjusted quoted prices in active markets for identical instruments
A financial instrument is regarded as quoted in an active market if quoted prices are readily and regularly available from an exchange or other independent source, and those prices represent actual and regularly occurring market transactions on an arm’s length basis. The Group considers that market transactions should occur with sufficient frequency that is appropriate for the particular market, when measured over a continuous period preceding the date of the financial statements. If there is no data available to substantiate the frequency of market transactions of a financial instrument, then the instrument is not classified as Level 1.
(ii) Level 2 – inputs that are observable for the instrument, either directly or indirectly
A financial instrument is classified as Level 2 if: • The fair value is derived from quoted prices of similar instruments which would be classified
as Level 1; or • The fair value is determined from quoted prices that are observable but there is no data
available to substantiate frequent market trading of the instrument.
In estimating the fair value of non-traded financial assets, the Group uses a variety of methods such as obtaining dealer quotes and using discounted cash flow techniques. Where discounted cash flow techniques are used, estimated future cash flows are discounted at market-derived rates for government securities in the same country of issue as the security; for non-government securities, an interest spread is added to the derived rate for a similar government security rate according to the perceived additional risk of the non-government security.
Notes to the Financial Statements SAGICOR FINANCIAL COMPANY Ltd. (formerly Sagicor Financial Corporation Limited)Year ended December 31, 2020 and December 31, 2019 Amounts expressed in US $000
283

151
41.8 Fair value of financial instruments (continued)
(a) Financial instruments carried at fair value
2020 2019
Level 1 Level 2 Level 3 Total Level 1 Level 2 Level 3 Total
FVOCI securities:
Debt securities and money market funds 428,362 3,183,555 - 3,611,917 488,832 3,184,589 - 3,673,421
Equity securities 498 513 43 1,054 754 491 46 1,291
428,860 3,184,068 43 3,612,971 489,586 3,185,080 46 3,674,712
FVTPL investments:
Debt securities 21,160 194,394 133,320 348,874 17,719 104,123 121,265 243,107
Equity securities 347,056 286,545 25,918 659,519 85,389 262,344 22,440 370,173
Derivative financial instruments - - 37,188 37,188 - 264 36,627 36,891
Mortgage loans - - 26,065 26,065 - - 28,933 28,933
368,216 480,939 222,491 1,071,646 103,108 366,731 209,265 679,104
Total assets 797,076 3,665,007 222,534 4,684,617 592,694 3,551,811 209,311 4,353,816
Total assets by percentage 17% 78% 5% 100% 14% 81% 5% 100%
FVTPL investment contracts:
Unit linked deposit administration liabilities - - 154,442 154,442 - - 162,385 162,385
FVTPL deposit and security liabilities:
Structured products - - - - - - 6,756 6,756
Derivative financial instruments - - - - - 264 - 264
- - - - - 264 6,756 7,020
Total liabilities - - 154,442 154,442 - 264 169,141 169,405
Total liabilities by percentage - - 100% 100% 0% 0% 100% 100%
Notes to the Financial Statements SAGICOR FINANCIAL COMPANY Ltd. (formerly Sagicor Financial Corporation Limited)Year ended December 31, 2020 and December 31, 2019 Amounts expressed in US $000
284

152
41.8 Fair value of financial instruments (continued)
For Level 3 instruments, reasonable changes in inputs which could be applied to the valuation of FVOCI securities would affect other comprehensive income. Reasonable changes in inputs which could be applied to the valuations of investments designated at FVTPL are largely offset in income, since the changes in fair value are borne by contract holders. Changes in the valuations of structured products reflect changes in the underlying securities and are borne by the contract holders. The following table presents the movements in Level 3 instruments for the year.
Level 3 Financial Instruments
Balance, beginning of year Additions Issues Settlements Fair value gains / (losses) recorded in net investment income Fair value gains / (losses) recorded in interest expense Disposals and divestitures Transfers (out of) Level 3 classification(1) Effect of exchange rate changes Balance, end of year Fair value changes recorded in investment income for instruments held at end of year Fair value changes recorded in interest expense for instruments held at end of year
(1) In the course of reviewing the classification of fair value assets, the Group determined that fixed income assets previously classified as Level 3 would be more appropriately disclosed as Level 2. The fair value ofthese assets is determined by third party investment brokers based on observable market inputs.
2020 2019 2020 2019 FVTPL FVTPL
FVOCI FVTPL Derivative Total Total Total Total investment structured
investments investments instruments assets assets liabilities liabilities contracts products
46 172,638 36,627 209,311 140,433 162,385 6,756 169,141 213,792 22,848 73,530 87,418 - - - -
- - - 19,792 - 19,792 21,255 - - - (26,271) (6,884) (33,155) (68,192)
7,677 6,471 35,633 - - - -
- - - - - (1,527) 156 (1,371) 4,806
- (26,017) (29,964) (55,981) (53,424) - - - - - (11,019)
(3) 225- - - - -
(749) 63 (2,520) 43 185,303 37,188 222,534 209,311 154,442 - 154,442 169,141
- (1,228) 14,748 13,520 15,627 - - - -
- - - - - (1,527) - (1,527) 2,488
- 50,682- -- -
- (1,206)
- (11,019)- 222 (28) 35
Notes to the Financial Statements SAGICOR FINANCIAL COMPANY Ltd. (formerly Sagicor Financial Corporation Limited)Year ended December 31, 2020 and December 31, 2019 Amounts expressed in US $000
285

153
41.8 Fair value of financial instruments (continued)
(b) Financial instruments carried at amortised cost
The carrying values of the Group’s non-traded financial assets and financial liabilities carried at amortised cost approximate their fair value in notes 10, 12, and 20. The fair value hierarchy of other financial instruments carried at amortised cost is set out in the following tables.
As of December 31, 2020
Financial assets at amortised cost Level 1 Level 2 Level 3 Total
Debt securities - 736,175 753,924 1,490,099
Mortgage loans - - 390,938 390,938
Policy loans - - 177,813 177,813
Finance loans - - 560,543 560,543
Securities purchased for resale - - 57,110 57,110
- 736,175 1,940,328 2,676,503
Financial liabilities at amortised cost Level 1 Level 2 Level 3 Total
Investment contracts:
Deposit administration liabilities - - 117,046 117,046
Other investment contracts - - 169,002 169,002
- - 286,048 286,048
Notes and loans payables - 395,833 83,006 478,839
Deposit and security liabilities:
Other funding instruments - 348,559 38,647 387,206
Customer deposits - 1,233 866,084 867,317
Securities sold for repurchase - 18,226 557,378 575,604
- 368,018 1,462,109 1,830,127
- 763,851 1,831,163 2,595,014
41.8 Fair value of financial instruments (continued)
(b) Financial instruments carried at amortised cost (continued)
As of December 31, 2019 Financial assets at amortised cost Level 1 Level 2 Level 3 Total Debt securities - 752,806 609,167 1,361,973 Mortgage loans - - 362,341 362,341 Policy loans - - 181,902 181,902 Finance loans - - 602,512 602,512 Securities purchased for resale - - 10,904 10,904
- 752,806 1,766,826 2,519,632
Financial liabilities at amortised cost Level 1 Level 2 Level 3 Total Investment contracts: Deposit administration liabilities - - 113,767 113,767 Other investment contracts - - 149,928 149,928
- - 263,695 263,695
Notes and loans payable - 332,893 200,958 533,851
Deposit and security liabilities: Other funding instruments - - 418,932 418,932 Customer deposits - 1,121 810,594 811,715 Securities sold for repurchase - - 512,857 512,857
- 1,121 1,742,383 1,743,504
- 334,014 2,207,036 2,541,050
(c) Equity price risk
The Group is exposed to equity price risk arising from changes in the market values of its equity securities. The Group mitigates this risk by establishing overall limits of equity holdings for each investment portfolio and by maintaining diversified holdings within each portfolio of equity securities.
Notes to the Financial Statements SAGICOR FINANCIAL COMPANY Ltd. (formerly Sagicor Financial Corporation Limited)Year ended December 31, 2020 and December 31, 2019 Amounts expressed in US $000
286

154
41.9 Derivative financial instruments and hedging activities (continued)
The contract or notional amounts of derivatives and their fair values are set out in the table which follows.
Contract / notional amount
Fair value
Assets Liabilities
2020 Derivatives held for trading: Equity indexed options 756,586 37,188 -
2019 Derivatives held for trading: Equity indexed options 807,020 36,891 264
(i) Equity indexed options
The Group has purchased equity indexed options in respect of structured products and in respect of life and annuity insurance contracts.
For certain structured product contracts with customers (note 17), equity indexed options give the holder the ability to participate in the upward movement of an equity index while being protected from downward risk.
For certain universal life and annuity insurance contracts, an insurer has purchased custom call options that are selected to materially replicate the policy benefits that are associated with the equity indexed components within the policy contract. These options are appropriate to reduce or minimise the risk of movements in specific equity markets. Both the asset and the associated actuarial liability are valued at fair market value on a consistent basis, with the change in values being reflected in the income statement. The valuations combine external valuations with internal calculations.
41.8 Fair value of financial instruments (continued)
Sensitivity
The sensitivity to fair value changes in equity securities arises from those instruments which are not held under the unit linked model. The table below sets out the source markets of such equity securities and the effects of an across the board 20% change in equity prices on income before tax (IBT) as at December 31, 2020.
Carrying value Effect of 20%
change on IBT
Listed on Caribbean stock exchanges and markets 37,854 7,571 Listed on US stock exchanges and markets 396,451 79,290 Listed on other exchanges and markets 39,145 7,829
473,450 94,690
41.9 Derivative financial instruments and hedging activities
The Group's derivative activities give rise to open positions in portfolios of derivatives. These positions are managed to ensure that they remain within acceptable risk levels, with matching deals being utilised to achieve this, where necessary.
Derivatives are carried at fair value and presented in the financial statements as separate assets and liabilities. Asset values represent the cost to the Group of replacing all transactions with a fair value in the Group’s favour, assuming that all relevant counterparties default at the same time and that transactions can be replaced instantaneously. Liability values represent the cost to the Group counterparties of replacing all their transactions with the Group with a fair value in their favour if the Group were to default. Derivative assets and liabilities on different transactions are only set off if the transactions are with the same counterparty, a legal right of set-off exists, and the cash flows are intended to be settled on a net basis.
Notes to the Financial Statements SAGICOR FINANCIAL COMPANY Ltd. (formerly Sagicor Financial Corporation Limited)Year ended December 31, 2020 and December 31, 2019 Amounts expressed in US $000
287

155
41.10 Offsetting Financial Assets and Liabilities
The Group is eligible to present certain financial assets and financial liabilities on a net basis in the statement of financial position pursuant to criteria described in note 2.13. The following table provides information on (i) the impact of offsetting in the consolidated statement of financial position; (ii) the financial impact of netting for instruments which are subject to enforceable master-netting arrangements or similar agreements, and (iii) cash and financial instrument collateral which can be potentially offset.
Gross amounts of financial assets
Gross amounts set off in the statement of financial position
Net amounts of financial assets as
presented in the statement of financial
position
Impact of master netting arrangements
Impact of offsetting financial instrument
collateral Net amount
2020 ASSETS Non-derivative financial investments 7,201,381 - 7,201,381 (557,378) (384,337) 6,259,666 Derivative financial instruments 37,188 - 37,188 - - 37,188
7,238,569 - 7,238,569 (557,378) (384,337) 6,296,854 LIABILITIES Non-derivative deposit and security liabilities 1,826,759 - 1,826,759 (557,378) (348,559) 920,822
2019 ASSETS Non-derivative financial investments 6,648,753 - 6,648,753 (512,857) (396,952) 5,738,944 Derivative financial instruments 36,891 - 36,891 (264) - 36,627
6,685,644 - 6,685,644 (513,121) (396,952) 5,775,571 LIABILITIES Non-derivative deposit and security liabilities 1,752,425 - 1,752,425 (512,857) (386,981) 852,587 Derivative financial instruments 264 - 264 (264) - -
1,752,689 - 1,752,689 (513,121) (386,981) 852,587
Notes to the Financial Statements SAGICOR FINANCIAL COMPANY Ltd. (formerly Sagicor Financial Corporation Limited)Year ended December 31, 2020 and December 31, 2019 Amounts expressed in US $000
288

156
42 INSURANCE RISK – PROPERTY & CASUALTY CONTRACTS
Property and casualty insurers in the Group are exposed to insurance risks such as underwriting, claims and availability of reinsurance, and to credit risk in respect of reinsurance counterparties.
Sagicor General Insurance and Advantage General Insurance are the principal insurers within the Group's continuing operations that issue property and casualty insurance contracts. They operate mainly in Barbados, Trinidad and Tobago and Jamaica.
The principal insurance risks affecting property and casualty contracts are disclosed in the following sections.
42.1 Underwriting risk
Risks are priced to achieve an adequate return on capital on the insurer’s business. This return is expressed as a premium target return. Budgeted expenses and reinsurance costs are included in the pricing process. Various pricing methodologies, including benchmark exposure rates and historic experience are used and are generally applied by class of insurance. All methods produce a technical price, which is compared against the market to establish a price margin.
Annually, the overall risk appetite is reviewed and approved. The risk appetite is defined as the maximum loss the insurer is willing to incur from a single event or proximate cause. Risks are only underwritten if they fall within the risk appetite. Individual risks are assessed for their contribution to aggregate exposures by nature of risk, by geography, by correlation with other risks, before acceptance. Underwriting a risk may include specific tests and enquiries which determine the insurer’s assessment of the risk. Insurers may also establish deductibles, exclusions, and coverage limits which will limit the potential losses incurred.
Inaccurate pricing or inappropriate underwriting of insurance contracts, which may arise from poor pricing or lack of underwriting control, can lead to either financial loss or reputational damage to the insurer.
42.2 Claims risk
Incurred claims are triggered by an event and may be categorised as: • attritional losses, which are expected to be of reasonable frequency and are less than
established threshold amounts; • large losses, which are expected to be relatively infrequent and are greater than established
threshold amounts;• catastrophic losses, which are an aggregation of losses arising from one incident or
proximate cause, affecting one or more classes of insurance. These losses are infrequent and are generally very substantial.
The insurer records claims based on submissions made by claimants. The insurer may also obtain additional information from loss adjustors, medical reports and other specialist sources. The initial claim recorded may only be an estimate, which is refined over time until final settlement occurs. In addition, from the pricing methodology used for risks, it is assumed that at any date, there are claims incurred but not reported (IBNR).
Claims risk is the risk that incurred claims may exceed expected losses. Claims risk may arise from: • invalid or fraudulent claim submissions;• the frequency of incurred claims;• the severity of incurred claims;• the development of incurred claims.
Claims risk may be concentrated in geographic locations, altering the risk profile of the insurer. The most significant exposure for this type of risk arises where a single event could result in very many claims. Concentration of risk is mitigated through risk selection, line sizes, event limits, quota share reinsurance and excess of loss reinsurance.
Total insurance coverage on insurance policies provides a quantitative measure of absolute risk. However, claims arising in any one year are a very small proportion in relation to the total insurance coverage provided. The total amounts insured by the Group at December 31, gross and net of reinsurance, are summarised by class of insurance.
Notes to the Financial Statements SAGICOR FINANCIAL COMPANY Ltd. (formerly Sagicor Financial Corporation Limited)Year ended December 31, 2020 and December 31, 2019 Amounts expressed in US $000
289

157
42.2 Claims risk (continued)
Each insurer assesses its exposures by modelling realistic disaster scenarios of potential catastrophic events. Claims arising from windstorms, earthquakes and floods, and events triggering multi-coverage corporate liability claims, are potential sources of catastrophic losses arising from insurance risks. Realistic disaster scenarios modelled for 2020 are presented below and result in estimated gross and net losses.
Sagicor General Insurance (SGI)
Gross loss Net loss
A Barbados and St. Lucia windstorm having a 200-year return period 257,408 5,000
Advantage General Insurance Co. Limited (AGI) (subsidiary of Sagicor Group Jamaica Ltd)
Gross loss Net loss
A Jamaican windstorm having a 250-year return period for properties 110,616 500
The occurrence of one or more catastrophic events in any year may have a material impact on the reported net income of the Group.
Total insurance coverage 2020 2019
Property Gross 10,355,536 9,918,290 Net 1,829,004 1,685,857
Motor Gross 980,814 985,202 Net 739,197 628,383
Accident and liability Gross 3,444,904 3,308,670 Net 3,168,727 3,064,125
Total Gross 14,781,254 14,212,162 Net 5,736,928 5,378,365
Notes to the Financial Statements SAGICOR FINANCIAL COMPANY Ltd. (formerly Sagicor Financial Corporation Limited)Year ended December 31, 2020 and December 31, 2019 Amounts expressed in US $000
290

158
42.2 Claims risk (continued)
Development claim liabilities
In addition to sensitivity analysis, the development of insurance liabilities provides a measure of SGI’s and AGI's ability to estimate the ultimate value of claims. The table below illustrates how SGI’s and AGI's estimate of the ultimate claims liability for accident years 2015 - 2020 has changed at successive year ends, up to 2020. Updated unpaid claims and adjustment expenses (ULAE) and IBNR estimates in each successive year, as well as amounts paid to date are used to derive the revised amounts for the ultimate claims liability for each accident year, used in the development calculations. The most recent estimate is then reconciled to the liability recognised in the statement of financial position.
Gross 2015 2016 2017 2018 2019 2020 Total
Estimate of ultimate claims incurred:
At the end of financial reporting year 40,662 37,074 52,834 43,895 40,980 31,603
One year later 39,211 41,534 58,785 45,367 39,833
Two years later 40,422 40,627 60,154 45,520
Three years later 38,426 41,338 60,630
Four years later 38,260 41,351
Five years later 38,726
Current estimate of cumulative claims 38,726 41,351 60,630 45,520 39,833 31,603 257,663
Cumulative payments to date (35,782) (37,889) (55,196) (37,790) (28,578) (14,678) (209,913)
Liability recognised 2,944 3,462 5,434 7,730 11,255 16,925 47,750
Liability in respect of prior years and ULAE 11,134
Total liability (note 14.2) 58,884
Notes to the Financial Statements SAGICOR FINANCIAL COMPANY Ltd. (formerly Sagicor Financial Corporation Limited)Year ended December 31, 2020 and December 31, 2019 Amounts expressed in US $000
291

159
42.2 Claims risk (continued)
Development claim liabilities (continued)
The reinsurers’ share of the amounts is set out below in the following table.
Reinsurance 2015 2016 2017 2018 2019 2020 Total
Estimate of reinsurance recoveries:
At the end of financial reporting year 14,654 15,354 13,200 6,075 2,625 8,025
One year later 13,892 15,578 16,883 6,795 3,349 Two years later 12,236 12,725 15,093 4,399
Three years later 11,561 12,591 15,141
Four years later 11,401 12,329 Five years later 11,076
Current estimate of reinsurance recoveries 11,076 12,329 15,141 4,399 3,349 8,025 54,319 Cumulative reinsurance receipts to date (10,061) (11,447) (14,141) (4,252) (2,517) (3,175) (45,593)
Recoverable recognised 1,015 882 1,000 147 832 4,850 8,726
Recoverable in respect of prior years 2,316
Total recoverable from reinsurers (note 14.2) 11,042
Notes to the Financial Statements SAGICOR FINANCIAL COMPANY Ltd. (formerly Sagicor Financial Corporation Limited)Year ended December 31, 2020 and December 31, 2019 Amounts expressed in US $000
292

160
42.3 Reinsurance risk (continued)
Retention limits represent the level of risk retained by the insurer. Coverage in excess of these limits is ceded to reinsurers up to the treaty limit. Claim amounts in excess of reinsurance treaty limits revert to the insurer. Principal features of retention programmes used by Sagicor General and Advantage General for their property insurance class are summarised in the following table.
The effects of reinsurance ceded are disclosed in notes 14, 24 and 25 and information on reinsurance balances is included in notes 10, 20 and 41.
• the credit risk of holding a recovery from a reinsurer;• the unavailability of reinsurance cover in the market at adequate levels or prices;• the failure of a reinsurance layer upon the occurrence of a catastrophic event.
The Group selects reinsurers which have well-established capability to meet their contractual obligations and which generally have a Sagicor credit risk rating of 1 or 2. Insurers also place reinsurance coverage with various reinsurers to limit their exposure to any one reinsurer.
The reinsurance programmes are negotiated annually with reinsurers for coverage generally over a 12-month period. It is done by class of insurance, though for some classes there is aggregation of classes and/or subdivision of classes by the location of risk.
For its property risks, insurers use quota share and excess of loss catastrophe reinsurance treaties to obtain reinsurance cover. Catastrophe reinsurance is obtained for multiple claims arising from one event or occurring within a specified time period. However, treaty limits may apply and may expose the insurer to further claim exposure. Under some treaties, when treaty limits are reached, the insurer may be required to pay an additional premium to reinstate the reinsurance coverage. Excess of loss catastrophe reinsurance treaties typically cover up to four separate catastrophic events per year.
For other insurance risks, insurers limit their exposure, by event or per person, by excess of loss or quota share treaties.
Type of risk Retention by Sagicor General Insurance - currency amounts in thousands
Property
Type of risk Retention by Advantage General Insurance Co. Limited - currency amounts in thousands
Property
• maximum retention of $4,500 for a single event;• maximum retention of $5,000 for a catastrophic event;• quota share retention to maximum of 20% in respect of treaty limits;• quota share retention is further reduced to a maximum of $375 per event.
• maximum quota share treaty retention of $700 for a single event;• maximum excess of loss retention of $500 for a catastrophic event;• quota share retention to maximum of 10% in respect of treaty limits. • quota share retention is further reduced to a maximum of $500 per event.
42.3 Reinsurance risk
To limit the potential loss for single-policy claims and for aggregations of catastrophe claims, the insurer may cede certain levels of risk to a reinsurer. Reinsurance however does not discharge the insurer’s liability. Reinsurance risk is the risk that reinsurance is not available to mitigate the potential loss on an insurance policy . The risk may arise from :
Notes to the Financial Statements SAGICOR FINANCIAL COMPANY Ltd. (formerly Sagicor Financial Corporation Limited)Year ended December 31, 2020 and December 31, 2019 Amounts expressed in US $000
293
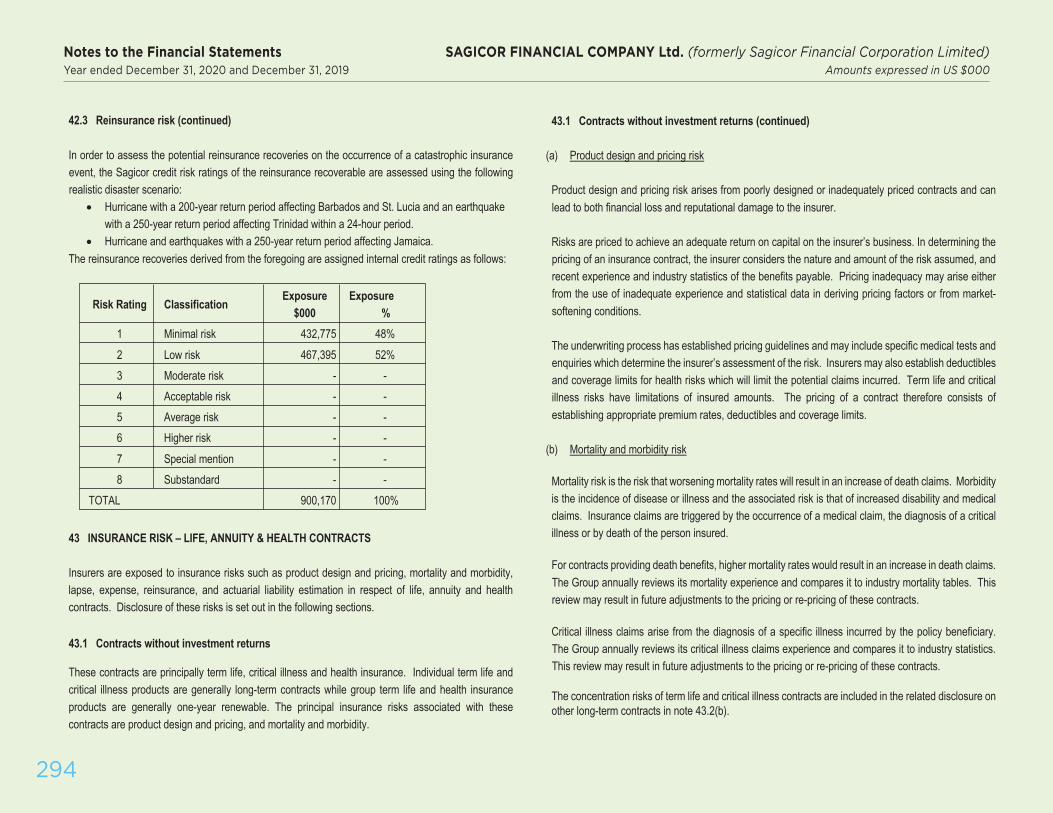
161
43.1 Contracts without investment returns (continued)
(a) Product design and pricing risk
Product design and pricing risk arises from poorly designed or inadequately priced contracts and can lead to both financial loss and reputational damage to the insurer.
Risks are priced to achieve an adequate return on capital on the insurer’s business. In determining the pricing of an insurance contract, the insurer considers the nature and amount of the risk assumed, and recent experience and industry statistics of the benefits payable. Pricing inadequacy may arise either from the use of inadequate experience and statistical data in deriving pricing factors or from market- softening conditions.
The underwriting process has established pricing guidelines and may include specific medical tests and enquiries which determine the insurer’s assessment of the risk. Insurers may also establish deductibles and coverage limits for health risks which will limit the potential claims incurred. Term life and critical illness risks have limitations of insured amounts. The pricing of a contract therefore consists of establishing appropriate premium rates, deductibles and coverage limits.
(b) Mortality and morbidity risk
Mortality risk is the risk that worsening mortality rates will result in an increase of death claims. Morbidity is the incidence of disease or illness and the associated risk is that of increased disability and medical claims. Insurance claims are triggered by the occurrence of a medical claim, the diagnosis of a critical illness or by death of the person insured.
For contracts providing death benefits, higher mortality rates would result in an increase in death claims. The Group annually reviews its mortality experience and compares it to industry mortality tables. This review may result in future adjustments to the pricing or re-pricing of these contracts.
Critical illness claims arise from the diagnosis of a specific illness incurred by the policy beneficiary. The Group annually reviews its critical illness claims experience and compares it to industry statistics. This review may result in future adjustments to the pricing or re-pricing of these contracts.
The concentration risks of term life and critical illness contracts are included in the related disclosure on other long-term contracts in note 43.2(b).
42.3 Reinsurance risk (continued)
In order to assess the potential reinsurance recoveries on the occurrence of a catastrophic insurance event, the Sagicor credit risk ratings of the reinsurance recoverable are assessed using the following realistic disaster scenario:
• Hurricane with a 200-year return period affecting Barbados and St. Lucia and an earthquake with a 250-year return period affecting Trinidad within a 24-hour period.
• Hurricane and earthquakes with a 250-year return period affecting Jamaica.The reinsurance recoveries derived from the foregoing are assigned internal credit ratings as follows:
43 INSURANCE RISK – LIFE, ANNUITY & HEALTH CONTRACTS
Insurers are exposed to insurance risks such as product design and pricing, mortality and morbidity, lapse, expense, reinsurance, and actuarial liability estimation in respect of life, annuity and health contracts. Disclosure of these risks is set out in the following sections.
43.1 Contracts without investment returns
These contracts are principally term life, critical illness and health insurance. Individual term life and critical illness products are generally long-term contracts while group term life and health insurance products are generally one-year renewable. The principal insurance risks associated with these contracts are product design and pricing, and mortality and morbidity.
Exposure Exposure Risk Rating Classification
$000 % 1 Minimal risk 432,775 48% 2 Low risk 467,395 52% 3 Moderate risk - - 4 Acceptable risk - - 5 Average risk - - 6 Higher risk - - 7 Special mention - - 8 Substandard - -
TOTAL 900,170 100%
Notes to the Financial Statements SAGICOR FINANCIAL COMPANY Ltd. (formerly Sagicor Financial Corporation Limited)Year ended December 31, 2020 and December 31, 2019 Amounts expressed in US $000
294

162
43.2 Contracts with investment returns
Life and annuity insurance contracts with investment returns generally have durations of 5 or more years. The contract terms provide for the policyholder to pay either a single premium at contract inception, or periodic premiums over the duration of the contract. From the premium received, acquisition expenses and maintenance expenses are financed. Investment returns are credited to the policy and are available to fund surrender, withdrawal and maturity policy benefits. The principal risks associated with these policies are in respect of product design and pricing, mortality and longevity, lapse, expense and investment.
(a) Product design and pricing risk
Product design and pricing risk arises from poorly designed or inadequately priced contracts and can lead to both financial loss and reputational damage to the insurer.
Risks are priced to achieve an adequate return on capital on the insurer’s business as a whole. In determining the pricing of a contract, the insurer considers the age of the policyholder and/or beneficiary, the expenses and taxes associated with the contract, the prospective investment returns to be credited to the contract, and the guaranteed values within the contract. Pricing inadequacy may arise either from the use of inadequate experience and statistical data in deriving pricing factors or from future changes in the economic environment.
(b) Mortality and longevity risk
Mortality risk is the risk that worsening mortality rates will result in an increase of death claims. Longevity risk is the risk that improving mortality rates will lengthen the pay-out period of annuities.
For contracts providing death benefits, higher mortality rates will result in an increase in death claims over time. For contracts providing the pay-out of annuities, improving mortality rates will lead to increased annuity benefits over time. Insurers annually review their mortality experience and compare it to industry mortality tables. This review may result in future adjustments to the pricing or re-pricing of these contracts.
43.1 Contracts without investment returns (continued)
The cost of health-related claims depends on the incidence of beneficiaries becoming ill, the duration of their illness, and the cost of providing medical services. An increase in any of these three factors will result in increased health insurance claims. In such circumstances, the insurer may adjust the pricing or re-pricing of these contracts.
For health insurance contracts, the concentration of insurance risk is illustrated by the distribution of premium revenue by the location of the insured persons.
2020 Premium revenue by location of insureds Gross Ceded Net
Barbados 28,099 986 27,113
Jamaica 87,901 2,866 85,035
Trinidad & Tobago 36,957 99 36,858
Other Caribbean 23,618 1,105 22,513
USA 47 33 14
Total 176,622 5,089 171,533
(c) Sensitivity of incurred claims
The sensitivity of term life and critical illness claims is included in the related disclosure on other long-term contracts in note 43.4. The impact on gross claims of increasing the total liability by 5% for un-reinsured health insurance claims is illustrated in the following table.
2020 2019
Liability 5% increase
in liability Liability
5% increase in liability
Actuarial liability 40,874 2,044 41,573 2,079
Claims payable 4,260 213 5,252 263
45,134 2,257 46,825 2,342
Notes to the Financial Statements SAGICOR FINANCIAL COMPANY Ltd. (formerly Sagicor Financial Corporation Limited)Year ended December 31, 2020 and December 31, 2019 Amounts expressed in US $000
295

163
43.2 Contracts with investment return s (continued)
Mortality risk may be concentrated in geographic locations, affecting the risk profile of the insurer. The most significant exposure for this type of risk arises where a single event or pandemic could result in very many claims.
Total insurance coverage on insurance policies provides a quantitative measure of absolute mortality risk. However, claims arising in any one year are a very small proportion in relation to the total insurance coverage provided. The total amounts insured by the Group in respect of both contracts with or without investment returns at December 31, gross and net of reinsurance, are summarised by geographic area below.
43.2 Contracts with investment returns (continued)
Total liability under annuity contracts provide a good measure of longevity risk exposure.
2020 2019
Total liability Individual Group Individual Group under annuity contracts contracts contracts contracts contracts
Barbados Gross 132,153 51,697 131,757 48,771
Net 132,153 51,697 131,757 48,771
Jamaica Gross 808 366,268 875 359,566 2020 2019 Net 808 366,268 875 359,566
Individual Group Individual Group Total insurance coverage Trinidad & Tobago Gross 234,514 - 166,644 -
contracts contracts contracts contracts Net 234,514 - 166,644 -
Barbados Gross 4,541,510 1,348,210 4,386,200 1,260,085 Other Caribbean Gross 60,885 84 53,752 31 Net 4,273,518 1,299,099 4,113,950 1,204,619 Net 60,885 84 53,716 31
Jamaica Gross 9,972,092 7,014,650 9,571,001 7,032,326 USA Gross 2,133,520 18,541 1,663,194 19,682 Net 9,820,069 6,912,347 9,438,735 6,929,672 Net 1,480,655 5,641 982,045 5,845
Trinidad & Tobago Gross 3,936,798 2,593,200 3,738,534 2,498,258 Total Gross 2,561,880 436,590 2,016,222 428,050 Net 3,358,690 2,424,954 3,159,462 2,348,251 Net 1,909,015 423,690 1,335,037 414,213
Other Caribbean Gross 8,752,868 1,554,039 8,376,550 1,526,610
Net 7,801,984 1,371,882 7,414,626 1,338,472
USA Gross 8,507,242 32,723 7,414,643 33,354
Net 3,728,123 29,497 3,356,037 32,466
Total Gross 35,710,510 12,542,822 33,486,928 12,350,633
Net 28,982,384 12,037,779 27,482,810 11,853,480
Notes to the Financial Statements SAGICOR FINANCIAL COMPANY Ltd. (formerly Sagicor Financial Corporation Limited)Year ended December 31, 2020 and December 31, 2019 Amounts expressed in US $000
296

164
43.3 Reinsurance risk
To limit its exposure of potential loss on an insurance policy, the insurer may cede certain levels of risk to a reinsurer. The Group selects reinsurers which have well-established capability to meet their contractual obligations and for new business a Sagicor credit risk rating of 1 or 2 is usually selected. Reinsurance ceded does not discharge the insurer’s liability and failure by a reinsurer to honour its commitments could result in losses to the Group.
Insurers have limited their exposure per person by excess of loss or quota share treaties. Retention limits represent the level of risk retained by the insurer. Coverage in excess of these limits is ceded to reinsurers up to the treaty limit. The principal features of retention programs used by insurers are summarised in the following table.
43.4 Sensitivity arising from the valuation of actuarial liabilities
The estimation of actuarial liabilities is sensitive to the assumptions made. Changes in those assumptions could have a significant effect on the valuation results which are discussed below.
The valuation of actuarial liabilities of life insurance and annuity contracts is sensitive to: • the economic scenario used,• the investments allocated to back the liabilities,• the underlying assumptions used (note 13.3 (b) to (f)), and• the margins for adverse deviations (note 13.3 (g)).
43.2 Contracts with investment returns (continued)
(c) Lapse risk
Lapse risk is that, on average, policyholders will terminate their policies ahead of the insurer’s expectation. Early lapse may result in the following:
• Acquisition costs are not recovered from the policyholder;• In order to settle benefits, investments are liquidated prematurely resulting in a loss to the
insurer;• Maintenance expenses are allocated to the remaining policies, resulting in an increase in
expense risk.
(d) Expense risk
The Group monitors policy acquisition and policy maintenance expenses. Expenses are managed through policy design, fees charged and expense control. However, there are a significant number of inforce contracts for which insurers have limited or no ability to re-price for increases in expenses caused by inflation or other factors. Therefore, growth in maintenance expenses is funded either by increasing the volume of inforce policies or by productivity gains. Failure to achieve these goals will require increases in actuarial liabilities held.
(e) Investment risk
A substantial proportion of the Group’s financial investments support insurer obligations under life and annuity contracts with investment returns. The financial risks outlined in note 41 pertaining to credit, liquidity, interest rate, foreign exchange and equity price are considered integral investment risks associated with these insurance contracts.
Asset defaults, mismatches in asset and liability cash flows, interest rate and equity price volatility generally have the effect of increasing investment risk and consequential increases in actuarial liabilities held.
Retention by insurers - currency amounts in thousands
Type of insurance contract
Health insurance contracts with individuals Retention per individual to a maximum of $88
Health insurance contracts with groups Retention per individual to a maximum of $150
Life insurance contracts with individuals Retention per individual life to a maximum of $500
Life insurance contracts with groups Retention per individual life to a maximum of $250
Notes to the Financial Statements SAGICOR FINANCIAL COMPANY Ltd. (formerly Sagicor Financial Corporation Limited)Year ended December 31, 2020 and December 31, 2019 Amounts expressed in US $000
297

43.4 Sensitivity arising from the valuation of actuarial liabilities (continued)
The following table represents the estimated sensitivity of each of the above scenarios to net actuarial liabilities for insurers by segment. Correlations that may exist between scenario assumptions were not explicitly taken into account.
Sagicor Life Inc segment
Sagicor Jamaica segment
Sagicor Life USA segment
2020 2019 2020 2019 2020 2019
Base net actuarial liability
1,136,488 1,038,694 345,376 359,954 1,734,757 1,212,162
Scenario Increase in net liability Increase in net liability Increase in net liability Worsening rate of lapse
202,878 177,552 87,972 78,539 25,481 18,430
High interest rate (94,942) (97,634) (112,512) (116,591) (99,495) (72,194)
Low interest rate 199,405 163,321 83,857 97,115 123,193 83,064 Worsening mortality / morbidity
69,512 42,585 48,908 56,942 16,304 16,980
Higher expenses 39,156 20,419 17,066 20,894 2,630 2,908
43.4 Sensitivity arising from the valuation of actuarial liabilities (continued)
Under Canadian accepted actuarial standards, the AA is required to test the actuarial liability under economic scenarios. The scenarios developed and tested by insurers were as follows:
.
Sensitivity Scenario
Sagicor Life Inc Sagicor Jamaica Sagicor USA segment
segment Segment
Worsening Lapse rates were either doubled or halved, and the more adverse result was selected.
Lapse rates were increased or reduced by 30%, and the more adverse result was selected.
rate of lapse
High Assumed increases in the investment portfolio yield rates of 0.25% per year for 5 years, with the rates remaining constant
thereafter.
Assumed increases in the investment portfolio yield rates of 0.5% for 10 years.
A 1% increase was applied to the investment portfolio rate. interest rate
Low interest Assumed decreases in investment portfolio yield rates of 0.25% per year for 5 years, with the rates remaining constant
thereafter.
Assumed A 1% decrease was applied to the investment portfolio rate. rate decreases in
investment portfolio yield rates of 0.5% per year for 10 years.
Worsening Mortality and morbidity rates for insurance and critical illness products were increased by 3% of the base rate per year for 5 years. For annuity products, the mortality rates were decreased by 3% of the base rate for 5 years.
For life insurance and deferred annuity products, the base assumed rates were increased annually by 3% cumulatively over the next 5 years. For pay-out annuity products only, the mortality rates were decreased by 3% cumulatively over the next 5 years.
mortality and morbidity .
Higher Policy unit maintenance expense rates were increased by 5% per year for 5 years above those reflected in the base scenario. expenses
165
Notes to the Financial Statements SAGICOR FINANCIAL COMPANY Ltd. (formerly Sagicor Financial Corporation Limited)Year ended December 31, 2020 and December 31, 2019 Amounts expressed in US $000
298

166
44 FIDUCIARY RISK
The Group provides investment management and pension administration services to investment and pension funds which involve the Group making allocation, purchase and sale decisions in relation to a wide range of investments. These services give rise to fiduciary risk that may expose the Group to claims for mal-administration or under-performance of these funds.
In the ordinary course of business, the Group manages assets of pension funds, mutual funds and unit trusts which are held in a fiduciary capacity and are not included in the Group’s financial statements. The investments and cash under administration are summarised in the following table.
2020 2019
Pension and insurance fund assets 2,145,393 2,469,920
Mutual fund, unit trust and other investment fund assets 1,375,284 1,665,672
3,520,677 4,135,592
45 STATUTORY RESTRICTIONS ON ASSETS
Insurers are registered to conduct insurance business under legislation in place in each relevant jurisdiction. This legislation may prescribe requirements with respect to deposits, investment of funds and solvency for the protection of policyholders. In general, these requirements do not restrict the ability of the insurer to trade investments. Banking subsidiaries may also be required to hold deposits with Central Banks which regulate the conduct of banking operations.
To satisfy the above requirements, invested assets and cash totalling $1,521,634 (2019 - $1,431,443) have been deposited with regulators or are held in trust to the order of regulators.
In some countries where the Group operates, there are exchange controls or other restrictions on the remittance of funds out of those countries.
43.5 Financial Condition Testing
The Financial Condition Testing (FCT) is a technique used by the Group to assess the adequacy of the insurer’s financial condition by stress-testing the future solvency of the company under different future adverse economic and experience scenarios. The FCT assesses the impact over the next 5 years on the insurer’s financial condition under specific scenarios. The period of 5 years and the specific scenarios have been selected by the Appointed Actuary as per the FCT guidance from the Canadian Institute of Actuaries.
The financial position of an insurer is reflected by the amounts of assets, liabilities and equity in the financial statements at a given date, such as at the end of its most recent fiscal year. The financial position therefore relies on the valuation assumptions used for establishing the actuarial liabilities being adequate to measure future adverse deviations in experience. The financial position does not offer any indication of an insurer’s ability to execute its business plan.
The financial condition of an insurer at a particular date is its prospective ability at that date to meet its future obligations, especially obligations to policyholders, those to whom it owes benefits and to its shareholders. The financial condition analysis examines both an insurer’s ability to execute its business plan and to absorb adverse experience beyond that provided for when its actuarial liabilities are established. The analysis projects the expected future financial position under these scenarios over the FCT period.
The purpose of the FCT is: • to develop an understanding of the sensitivity of the total equity of the insurer and future
financial condition to changes in various experience factors and management policies;• to alert management to material, plausible and imminent threats to the insurer’s solvency; and• to describe possible courses of action to address these threats.
An FCT is conducted periodically by some insurers within the Group.
Notes to the Financial Statements SAGICOR FINANCIAL COMPANY Ltd. (formerly Sagicor Financial Corporation Limited)Year ended December 31, 2020 and December 31, 2019 Amounts expressed in US $000
299

167
46 CAPITAL MANAGEMENT
The Group's objectives when managing capital, which is a broader concept than equity in the statement of financial position, are:
• To comply with capital requirements established by insurance, banking and other financial intermediary regulatory authorities;
• To comply with internationally recognised capital requirements for insurance, where local regulations do not meet these international standards;
• To safeguard its ability as a going concern to continue to provide benefits and returns to policyholders, depositors, note-holders and shareholders;
• To provide adequate returns to shareholders; • To maintain a strong capital base to support the future development of Group operations.
46.1 Capital resources
The principal capital resources of the Group are as follows:
2020 2019
Shareholders’ equity 1,109,780 1,154,051
Non-controlling interests’ equity 546,823 594,506
Notes and loans payable (debt) 471,622 517,732
Total financial statement capital resources 2,128,225 2,266,289
The Group deploys its capital resources through its operating activities. These operating activities are carried out by subsidiary companies which are either insurance entities or provide other financial services. The capital is deployed in such a manner as to ensure that subsidiaries have adequate and sufficient capital resources to carry out their activities and to meet regulatory requirements.
46.2 Capital adequacy
The capital adequacy of the principal operating subsidiaries is discussed in this section.
(a) Life insurers
Capital adequacy is managed at the operating company level. It is calculated by the Appointed Actuary and reviewed by executive management, the audit committee and the board of directors. In addition, certain subsidiaries of the Group seek to maintain internal capital adequacy at levels higher than the regulatory or internationally recognised requirements.
To assist in evaluating the current business and strategy opportunities, a risk-based capital approach is a core measure of financial performance. The risk-based assessment measure which has been adopted is the Canadian Minimum Continuing Capital and Surplus Requirement (MCCSR) standard. The minimum standard recommended by the Canadian regulators for companies is an MCCSR of 150%. A number of jurisdictions in the Caribbean region have no internationally recognised capital adequacy requirements, and in accordance with its objectives for managing capital, the Group has adopted the Canadian MCCSR standard. Jamaica and the USA have recognised capital adequacy standards.
The consolidated MCCSR for the life insurers of the Sagicor Group as of December 31 has been estimated as 252.2% (2019 – 253.2%). This is the principal standard of capital adequacy used to assess the overall strength of the life insurers of the Sagicor Group. However, because of the variations in capital adequacy standards across jurisdictions, the consolidated result should be regarded as applicable to the life insurers of the Group and not necessarily applicable to each individual segment, insurance subsidiary or insurance subsidiary branch.
The Group complies with all regulatory capital requirements.
Notes to the Financial Statements SAGICOR FINANCIAL COMPANY Ltd. (formerly Sagicor Financial Corporation Limited)Year ended December 31, 2020 and December 31, 2019 Amounts expressed in US $000
300

168
46.2 Capital adequacy (continued)
(i) Sagicor Life Jamaica
Sagicor Life Jamaica is governed by the Jamaican MCCSR regime which requires an insurer to maintain a minimum ratio of 150%. For the years ended December 31, 2020 and 2019, this ratio was 183.1% and 179.4% respectively.
(ii) Sagicor Life Insurance Company (USA)
A risk-based capital (RBC) formula and model have been adopted by the National Association of Insurance Commissioners (NAIC) of the United States. RBC is designed to assess minimum capital requirements and raise the level of protection that statutory surplus provides for policyholder obligations. The RBC formula for life insurance companies measures four major areas of risk: (i) underwriting, which encompasses the risk of adverse loss developments and property and casualty insurance product mix; (ii) declines in asset values arising from credit risk; (iii) declines in asset values arising from investment risks, including concentrations; and (iv) off-balance sheet risk arising from adverse experience from non-controlled assets such as reinsurance guarantees for affiliates or other contingent liabilities and reserve and premium growth. If an insurer's statutory surplus is lower than required by the RBC calculation, it will be subject to varying degrees of regulatory action, depending on the level of capitalinadequacy.
The RBC methodology provides for four levels of regulatory action. The extent of regulatory intervention and action increases as the ratio of surplus to RBC falls. The least severe regulatory action is the "Company Action Level" (as defined by the NAIC) which requires an insurer to submit a plan of corrective actions to the regulator if surplus falls below 200% of the RBC amount.
Sagicor Life Insurance Company looks to maintain a surplus of at least 300% of the RBC amount, and the company has maintained these ratios as of December 31, 2020 and 2019 respectively.
46.2 Capital adequacy (continued)
(b) Sagicor Investments Jamaica Limited and Sagicor Bank Jamaica Limited
Capital adequacy and the use of regulatory capital are monitored monthly by management employing techniques based on the guidelines developed by the Financial Services Commission (FSC), the Bank of Jamaica (BOJ), Basel II and the Risk Management and Compliance Unit. The required information is filed with the respective Regulatory Authorities at stipulated intervals. The BOJ and the FSC require each regulated entity to hold the minimum level of regulatory capital, and to maintain a minimum ratio of total regulatory capital to the risk-weighted assets.
The risk-weighted assets are measured by means of a hierarchy of five risk weights classified according to the nature of each asset and counterparty, taking into account any eligible collateral or guarantees. A similar treatment is adopted for off financial statements exposure, with some adjustments to reflect the more contingent nature of the potential losses.
The table below summarises the capital adequacy ratios. During 2020 and 2019, all applicable externally imposed capital requirements were complied with.
Sagicor Investments
Jamaica
Sagicor Bank Jamaica
2020 2019 2020 2019
Actual capital base to risk-weighted assets 15% 20% 14% 14%
Required capital base to risk-weighted assets 10% 10% 10% 10%
Notes to the Financial Statements SAGICOR FINANCIAL COMPANY Ltd. (formerly Sagicor Financial Corporation Limited)Year ended December 31, 2020 and December 31, 2019 Amounts expressed in US $000
301

169
46.3 Financial covenants
(a) 8.875% Senior Notes
Under the indenture entered into by the Group on the issue of these senior notes the Group has to comply with a number of covenants as follows:
46.3 Financial covenants (continued)
(1) See note 1, for further details on the arrangement agreement with Alignvest Acquisition II Corporation. On December 20, 2019, the Group made an Offer to purchase for cash, any and all of the outstanding $320.0 million aggregate principal amount of 8.875% Senior Notes due 2022. On January 27, 2020, $1.9 million notes were tendered, purchased and cancelled.
COVENANT DESCRIPTION Limitation of indebtedness Under this covenant, the Group is restricted to incremental
borrowing up to a prescribed level. The Group must maintain a fixed charge coverage ratio, in excess of 2:1 in order to incur additional debt.
Limitation on restricted payments covenant
This covenant limits cash outflows, dividends, acquisition and investments by the Group. The Group must maintain a fixed charge coverage ratio of 2:1 and an MCCSR capital ratio in excess of 175%.
Limitation on restricted distributions from subsidiaries
This covenant limits the subsidiaries from creating encumbrances or restrictions on their ability to make distributions to the Parent.
Limitation on sale of assets of subsidiary stock
This covenant restricts the Group from selling material subsidiary assets without using the proceeds to either reinvest in the business or offer to buy back bondholders.
Limitation on affiliate transactions
This covenant restricts affiliate transactions of the Group.
Change in control (1) This covenant allows investors to put their bonds back to the Group at a certain value when a specified event has changed ownership/control of the Group.
Limitation on liens This covenant restricts the Group’s ability to secure future debt with the Group’s assets.
Optional Redemption The notes are redeemable at the Group’s option after August 11, 2018 at specified redemption rates.
At December 31, 2020, the Group was in compliance with the specified covenants.
Notes to the Financial Statements SAGICOR FINANCIAL COMPANY Ltd. (formerly Sagicor Financial Corporation Limited)Year ended December 31, 2020 and December 31, 2019 Amounts expressed in US $000
302
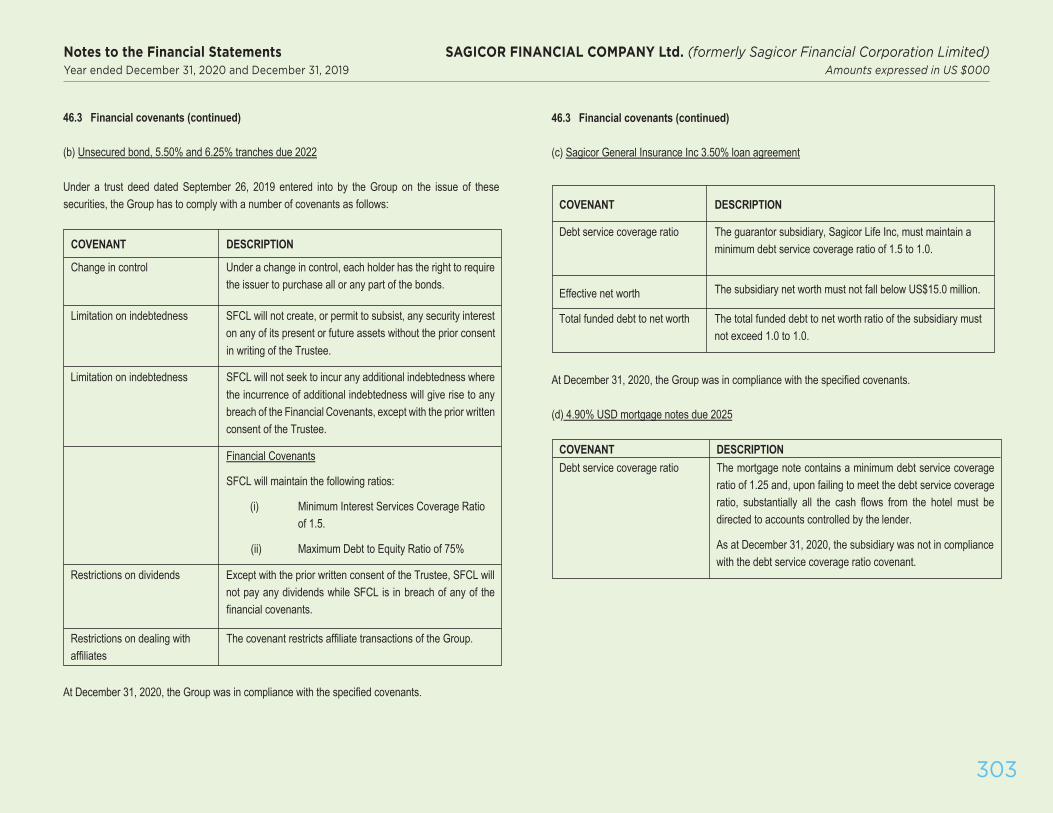
170
COVENANT DESCRIPTION
Change in control Under a change in control, each holder has the right to require the issuer to purchase all or any part of the bonds.
Limitation on indebtedness SFCL will not create, or permit to subsist, any security interest on any of its present or future assets without the prior consent in writing of the Trustee.
Limitation on indebtedness SFCL will not seek to incur any additional indebtedness where the incurrence of additional indebtedness will give rise to any breach of the Financial Covenants, except with the prior written consent of the Trustee.
Financial Covenants
SFCL will maintain the following ratios:
Restrictions on dividends Except with the prior written consent of the Trustee, SFCL will not pay any dividends while SFCL is in breach of any of the financial covenants.
Restrictions on dealing with affiliates
The covenant restricts affiliate transactions of the Group.
(i) Minimum Interest Services Coverage Ratioof 1.5.
(ii) Maximum Debt to Equity Ratio of 75%
46.3 Financial covenants (continued)
(b) Unsecured bond, 5.50% and 6.25% tranches due 2022
Under a trust deed dated September 26, 2019 entered into by the Group on the issue of these securities, the Group has to comply with a number of covenants as follows:
46.3 Financial covenants (continued)
(c) Sagicor General Insurance Inc 3.50% loan agreement
COVENANT DESCRIPTION
Debt service coverage ratio The guarantor subsidiary, Sagicor Life Inc, must maintain a minimum debt service coverage ratio of 1.5 to 1.0.
Effective net worth The subsidiary net worth must not fall below US$15.0 million.
Total funded debt to net worth The total funded debt to net worth ratio of the subsidiary must not exceed 1.0 to 1.0.
At December 31, 2020, the Group was in compliance with the specified covenants.
(d) 4.90% USD mortgage notes due 2025
COVENANT DESCRIPTION Debt service coverage ratio The mortgage note contains a minimum debt service coverage
ratio of 1.25 and, upon failing to meet the debt service coverage ratio, substantially all the cash flows from the hotel must be directed to accounts controlled by the lender.
As at December 31, 2020, the subsidiary was not in compliance with the debt service coverage ratio covenant.
At December 31, 2020, the Group was in compliance with the specified covenants.
Notes to the Financial Statements SAGICOR FINANCIAL COMPANY Ltd. (formerly Sagicor Financial Corporation Limited)Year ended December 31, 2020 and December 31, 2019 Amounts expressed in US $000
303

171
46.3 Financial covenants (continued) 46.3 Financial covenants (continued)
(e) 4.75% USD mortgage notes due 2021 (f) 9.00% JMD mortgage notes due 2048
8.00% JMD mortgage notes due 2021
10.00% JMD mortgage notes due 2026
3.26%/3.61% mortgage notes due 2026
COVENANT DESCRIPTION
Interest coverage ratio, Debt to EBIDTA ratio and a maximum loan to security value ratio.
The company must maintain a minimum interest coverage of 1.35. The company was not compliant at year end.
The company must maintain a maximum ratio of 4.75 for total debt to EBITDA. In 2020, the subsidiary failed to meet its debt covenants of minimum interest coverage and maximum debt to earnings before interest, taxes, depreciation and amortisation (EBITDA) ratio.
There were no penalties for the breaches.
The company must maintain a maximum loan to security value ratio of 75%. The company was compliant at year end.
COVENANT DESCRIPTION
Interest coverage ratio and maximum debt to equity ratio
The mortgage notes contain a minimum interest coverage of 1.5 which is EBITDA divided by interest charges. The company was not compliant at year end.
A maximum debt to equity ratio of 1.8 is to be maintained. The company was compliant at year end.
As a result of the breach of covenant, the notes payable have been classified as “On demand or within 1 year” (see note 41.5).
Notes to the Financial Statements SAGICOR FINANCIAL COMPANY Ltd. (formerly Sagicor Financial Corporation Limited)Year ended December 31, 2020 and December 31, 2019 Amounts expressed in US $000
304

172
47 RELATED PARTY TRANSACTIONS (continued)
Investment advisory and management advisory agreement.
On April 10, 2019, Sagicor Financial Corporation Limited (Sagicor) entered into an Investment Advisory and Management Agreement with Alignvest Management Corporation (Alignvest) for the provision of investment advisory services and/or discretionary investment management services in respect of Sagicor’s and its subsidiaries’ assets. Under this agreement, Alignvest was appointed to provide specified advisory services and has a right of first offer to provide other investment advisory services or investment management services to Sagicor and its subsidiaries where Sagicor wishes to externalise these services, provided that Alignvest or its affiliates have clearly defined and relevant core competencies. Any such services would be provided by Alignvest or its affiliates on arm’s length commercial terms. As consideration for services rendered and performed under the agreement, Alignvest or its applicable affiliates will receive a fee equal to $2.5 million, reduced annually for any fees paid to Alignvest or its affiliates with respect to investment management services or other services provided. The Agreement commenced on December 5, 2019, when Sagicor completed its proposed transaction between Alignvest Acquisition II Corporation and will continue for an initial term of three years unless terminated for cause. On December 5, 2019, Alignvest gave notice that it had assigned certain rights and obligations under the agreement to High Vest Partners Inc, a joint venture between Alignvest and KGT Investments, LLC.
Sagicor Real Estate X-Fund Group – disposal of investment property.
On September 22, 2020, Sagicor Real Estate X-Fund Group sold an investment property, Jewel Grande Montego Bay Resort and Spa, to Sagicor Pooled Investment Funds Limited, a fund managed by Sagicor Life Jamaica Limited. The terms of sale were established by independent valuation of the property and the transaction resulted in a loss to the Group of US$2.9 million.
47 RELATED PARTY TRANSACTIONS
Other than as disclosed in notes 5, 9, 12, 16, 27, 30, 31 and 44, there are no material related party transactions except as disclosed below.
Key management transactions and balances
Key management comprises directors and senior management of the Company and of Group subsidiaries. Key management includes those persons at or above the level of Vice President or its equivalent. Compensation of and loans to these individuals are summarised in the following tables.
2020 2019
Compensation:
Salaries, directors’ fees and other short-term benefits 31,325 26,174
Optional contract benefit - 1,390
Equity-settled contract benefits (note 1) - 5,994
Equity-settled compensation benefits 7,067 7,289
Pension and other retirement benefits 1,369 1,341
39,761 42,188
Mortgage loans Other loans Total loans
Balance, beginning of year 4,095 2,690 6,785
Advances 554 242 796
Repayments (1,230) (2,084) (3,314)
Effects of exchange rate changes (25) (168) (193)
Balance, end of year 3,394 680 4,074
Interest rates prevailing during the year 3.75% - 7.50% 4.00% - 19.95%
Notes to the Financial Statements SAGICOR FINANCIAL COMPANY Ltd. (formerly Sagicor Financial Corporation Limited)Year ended December 31, 2020 and December 31, 2019 Amounts expressed in US $000
305
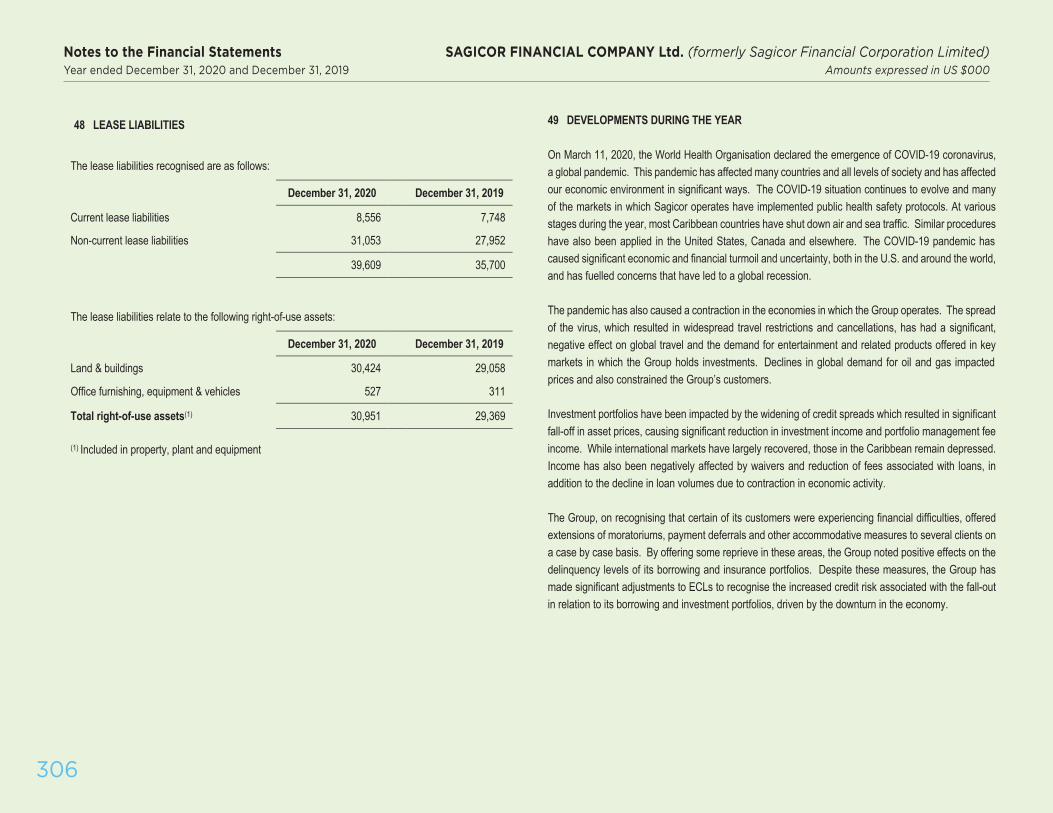
173
49 DEVELOPMENTS DURING THE YEAR
On March 11, 2020, the World Health Organisation declared the emergence of COVID-19 coronavirus, a global pandemic. This pandemic has affected many countries and all levels of society and has affected our economic environment in significant ways. The COVID-19 situation continues to evolve and many of the markets in which Sagicor operates have implemented public health safety protocols. At various stages during the year, most Caribbean countries have shut down air and sea traffic. Similar procedures have also been applied in the United States, Canada and elsewhere. The COVID-19 pandemic has caused significant economic and financial turmoil and uncertainty, both in the U.S. and around the world, and has fuelled concerns that have led to a global recession.
The pandemic has also caused a contraction in the economies in which the Group operates. The spread of the virus, which resulted in widespread travel restrictions and cancellations, has had a significant, negative effect on global travel and the demand for entertainment and related products offered in key markets in which the Group holds investments. Declines in global demand for oil and gas impacted prices and also constrained the Group’s customers.
Investment portfolios have been impacted by the widening of credit spreads which resulted in significant fall-off in asset prices, causing significant reduction in investment income and portfolio management fee income. While international markets have largely recovered, those in the Caribbean remain depressed. Income has also been negatively affected by waivers and reduction of fees associated with loans, in addition to the decline in loan volumes due to contraction in economic activity.
The Group, on recognising that certain of its customers were experiencing financial difficulties, offered extensions of moratoriums, payment deferrals and other accommodative measures to several clients on a case by case basis. By offering some reprieve in these areas, the Group noted positive effects on the delinquency levels of its borrowing and insurance portfolios. Despite these measures, the Group has made significant adjustments to ECLs to recognise the increased credit risk associated with the fall-out in relation to its borrowing and investment portfolios, driven by the downturn in the economy.
48 LEASE LIABILITIES
The lease liabilities recognised are as follows:
December 31, 2020 December 31, 2019
Current lease liabilities 8,556 7,748
Non-current lease liabilities 31,053 27,952
39,609 35,700
The lease liabilities relate to the following right-of-use assets:
December 31, 2020 December 31, 2019
Land & buildings 30,424 29,058
Office furnishing, equipment & vehicles 527 311
Total right-of-use assets(1) 30,951 29,369
(1) Included in property, plant and equipment
Notes to the Financial Statements SAGICOR FINANCIAL COMPANY Ltd. (formerly Sagicor Financial Corporation Limited)Year ended December 31, 2020 and December 31, 2019 Amounts expressed in US $000
306

174
49 DEVELOPMENTS DURING THE YEAR (continued)
In response to the changing, and increasingly uncertain, economic environment, the Sagicor Group has performed reviews and updated its assumptions, including those related to asset impairment, where necessary. Changes in the economic outlook data have been reported in note 41.3 on credit risk and impairment. As part of this process, goodwill was reviewed and stress testing was performed on assessment assumptions. As a result of this exercise, goodwill has been impaired relating to the subsidiary, Sagicor General Insurance Inc (note 8.2). Impairment related to the investment in Playa is detailed in note 6.2 and the Group has revalued downwards certain of its hotel properties. Management considered the potential impact of the pandemic on actuarial reserves but concluded that it had not had a significant impact on actuarial assumptions and the valuation of actuarial liabilities of the Group.
The Group continues to monitor the health crisis and the economic impact on its investments, actuarial reserves, customer and trading partners, and the effect on the industries in which it operates. While global vaccination programmes should allow the world, and more particularly the markets in which the Group operates, to gradually return to normal, this will take time. As a result, the pandemic may continue to negatively impact levels of new business and the level of policyholder lapses and surrenders, as well as loan and credit card delinquencies.
50 SUBSEQUENT EVENTS
i. On January 15, 2021, Sagicor Group Jamaica (SGJ) completed the disposal of its 14.9% equity interest (20,000,000 ordinary shares) in Playa for a net cash consideration of US$96 million. The sale of shares took place in a public offering of 11,499,000 ordinary shares held by the Group, concurrent to an underwritten public offering of 25,000,000 new shares by Playa at a public offering price of US$5.00 per share. These transactions were simultaneous with an assignment of an additional 8,501,000 ordinary shares in Playa held by SGJ to Sagicor Financial Corporation Limited, for cash consideration, at a price equal to the price offered through the public offering, less commission expenses associated with the public offering.
Following this transaction, SFCL holds 10,001,000 shares directly in Playa and the Group’s reduced interest in Playa will result in the investment being designated as a FVTPL investment.
ii. Subsequent to the year end, the Board of Directors of Sagicor Financial Company Ltd. approved and declared a quarterly dividend of US$0.05625 per common share payable on April 21, 2021 to the shareholders of record at the close of business on March 31, 2021.
Notes to the Financial Statements SAGICOR FINANCIAL COMPANY Ltd. (formerly Sagicor Financial Corporation Limited)Year ended December 31, 2020 and December 31, 2019 Amounts expressed in US $000
307

308
SHAREHOLDER INFORMATION

309
SHAREHOLDER INFORMATIONDIVIDENDS
Quarterly dividends were declared and paid as follows in 2020:
A first quarterly dividend of US 5.625 cents per common share, payable on February 28, 2020, was approved as part payment of the final dividend for the financial year ended December 31, 2019 to the registered holders of the common shares of record at the close of business on February 10, 2020.
A second quarterly dividend of US 5.625 cents per common share was approved, payable on May 29, 2020 to the registered holders of the common shares of record at the close of business on May 5, 2020.
A third quarterly dividend of US 5.625 cents per common share was approved, payable on September 18, 2020 to the registered holders of the common shares of record at the close of business on August 28, 2020.
A fourth quarterly dividend of US 5.625 cents per common share was approved, payable on December 16, 2020 to the registered holders of the common shares of record at the close of business on November 25, 2020.
TRANSFER AGENT – SHAREHOLDER ASSISTANCEFor more information on managing your Sagicor shares, shareholders may contact our Transfer Agent, TSX Trust Company.
Investor & Account AssistanceSign in to your TSX Trust account to access all the
data related to your account, including a summary of holdings, transaction history and, proxy voting and more. For your convenience, the TSX has also created a list of Frequently Asked Questions and provided several useful forms at the following link - https://www.sagicor.com/en/Investor-Relations/Transfer-Agent.
Connect with TSX TrustBy Telephone: 1- 647-727-0851 (Outside of North America) 1-833-955-1277 (North American Toll Free)By Email: [email protected] Mail: TSX Trust Company 301-100 Adelaide Street West Toronto, ON, M5H 4H1 Attn: Investor ServicesOffice Hours: 9:00 am to 5:00 pm Monday to Friday (Eastern Time)
CONNECT WITH SAGICOR FINANCIAL COMPANY LTD.Investors may contact Sagicor directly:By Email: [email protected] Telephone: 1-246-467-7500
STOCK EXCHANGE LISTINGSSagicor Financial Company Ltd. is listed on the Toronto Stock Exchange – Symbol TSX:SFC.
Sagicor Financial Corporation Limited was delisted from the London Stock Exchange and has applied to be delisted from the Trinidad and Tobago and Barbados Stock Exchanges.
ADVISORS AND BANKERS
APPOINTED ACTUARYSylvain Goulet, FCIA, FSA, MAAA, Affiliate Member of the (British) Institute of Actuaries and Affiliate Member of the Caribbean Actuarial Association
AUDITORPricewaterhouseCoopers SRL
LEGAL ADVISORSBarry L V Gale, QC, BarbadosBlakes, Cassels & Graydon LLP, CanadaCarrington & Sealy, BarbadosConyers Dill & Pearman Limited, BermudaHamel-Smith, Trinidad and TobagoHobsons, Trinidad and TobagoHolman Fenwick Willan LLP, UKLex Caribbean, BarbadosPatterson K H Cheltenham, QC, BarbadosPaul Hastings LLP, USAShutts & Bowen LLP, USAStikeman Elliott LLP, CanadaTorys LLP, Canada
BANKERSFirst Citizens Bank (Barbados) LimitedCIBC FirstCaribbean International Bank LimitedJP Morgan, USARBC Royal Bank (Trinidad & Tobago) LimitedThe Bank of New York MellonThe Bank of Nova Scotia

310
Sagicor Registered OfficeSAGICOR FINANCIAL COMPANY LtdClarendon House2 Church StreetHamilton HM11BermudaTel: (441) 295-1422Fax: (441) 292-4720
SAGICOR FINANCIAL CORPORATION LIMITEDClarendon House2 Church StreetHamilton HM11BermudaTel: (441) 295-1422Fax: (441) 292-4720
Sagicor Corporate Head OfficeSAGICOR FINANCIAL COMPANY LtdCecil F de Caires BuildingWildey, St Michael, BarbadosTel: (246) 467-7500Fax: (246) 436-8829Email: [email protected]: www.sagicor.com
SAGICOR FINANCIAL CORPORATION LIMITEDCecil F de Caires BuildingWildey, St Michael, BarbadosTel: (246) 467-7500Fax: (246) 436-8829Email: [email protected]: www.sagicor.com
SubsidiariesSAGICOR LIFE INCCecil F de Caires BuildingWildey, St Michael, BarbadosTel: (246) 467-7500Fax: (246) 436-8829Email: [email protected]: www.sagicor.com
Sagicor Life Inc Branch OfficesBarbadosSagicor Life IncSagicor Financial CentreCollymore RockSt MichaelTel: (246) 467-7500Fax: (246) 436-8829
AntiguaSagicor Financial Centre#9 Sir Sydney Walling HighwaySt John’sTel: (268) 480-5500Fax: (268) 480-5520Email: [email protected]
BelizeConey Drive Business PlazaConey DriveBelize City, BelizeTel: (501) 223-3147Fax: (501) 223-7390Email: [email protected]
CuraçaoSchottegatweg Oost #11 WillemstadTel: (599) 9 736-8558Fax: (599) 9 736-8575Email: [email protected]
GrenadaTransNemwil ComplexThe VillaSt George’sTel: (473) 440-1223Fax: (473) 440-4169Email: [email protected]
St LuciaSagicor Financial CentreChoc Estate, CastriesTel: (758) 452-3169Fax: (758) 450-3787Email: [email protected]
Trinidad and TobagoSagicor Financial Centre16 Queen’s Park West, Port of SpainTel: (868) 628-1636/7/8Fax: (868) 628-1639Email: [email protected]
Sagicor Life Inc AgenciesCuraçaoGuillen Insurance ConsultantsP O Box 4929Kaya E, Salas No 34Tel: (599) 9 461-2081Fax: (599) 9 461-1675Email: [email protected]
DominicaWillCher Services Inc44 Hillsborough StreetCorner Hillsborough & Independence StreetsRoseauTel: (767) 440-2562Fax: (767) 440-2563
HaitiCabinet d’AssuranceFritz de CatalogneAngles Rues de Peuple et des MiraclesPort-au-PrinceTel: (509) 3701 1737
OFFICES

311
St KittsSagicor Life IncC/o The St Kitts Nevis Anguilla Trading andDevelopment Co. LtdCentral Street, BasseterreTel: (869) 465-9476Fax: (869) 465 6437
St VincentSagicor Life IncS.V. Browne Agency LimitedFrenchesKingstownTel: (784) 456-1159Fax: (784) 456-2232
SAGICOR LIFE (EASTERN CARIBBEAN) INCSagicor Financial CentreChoc Estate Castries, St LuciaTel: (758) 456-1700Tel: (758) 450-3787
Sagicor Life (Eastern Caribbean) Inc Branch Offices AntiguaSagicor Financial Centre#9 Sir Sydney Walling Highway St John’sTel: (268) 480-5500Fax: (268) 480-5520Email: [email protected]
GrenadaTransNemwil Complex The VillaSt George’sTel: (473) 440-1223Fax: (473) 440-4169Email: [email protected]
St LuciaSagicor Financial Centre Choc Estate, Castries Tel: (758) 452-3169Fax: (758) 450-3787Email: [email protected]
Sagicor Life (Eastern Caribbean) Inc AgenciesDominicaWillCher Services Inc44 Hillsborough StreetCorner Hillsborough & Independence StreetsRoseauTel: (767) 440-2562Fax: (767) 440-2563
St KittsSagicor Life IncC/o The St Kitts Nevis Anguilla Trading and Development Co. LtdCentral Street, Basseterre Tel: (869) 465-9476Fax: (869) 465 6437
St VincentSagicor Life IncC/o Incorporated Agencies Limited FrenchesKingstownTel: (784) 456-1159Fax: (784) 456-2232
Sagicor General Insurance Registered OfficeSAGICOR GENERAL INSURANCE INCCecil F DeCaries BuildingWildey, St Michael, BarbadosTel: (246) 431-2800Fax: (246) 228-8266Email: [email protected]
Sagicor General Insurance IncHaggatt HallSt MichaelBarbadosTel: (246) 431-2800Fax: (246) 426-0752
(246) 228-8266Email: [email protected]
AntiguaSagicor Financial Centre#9 Sir Sydney Walling HighwaySt John’sTel: (268) 480-5500Fax: (268) 480-5550Email: [email protected]
St LuciaSagicor Financial CentreChoc EstateCastriesSt LuciaTel: (758) 452-0994Fax: (758) 450-4870
Trinidad and Tobago16 Queen’s Park WestPort of SpainTel: (868) 623-4744Fax: (868) 628-1639 or (868) 625-1927
Sagicor General Insurance AgenciesHHV Whitchurch & Company LimitedOld StreetP O Box 771RoseauDominicaTel: (767) 448-2182Fax: (767) 448-5787
WillCher Services Inc44 Hillsborough StreetCorner Hillsborough & Independence StreetsRoseau, DominicaTel: (767) 440-2562Fax: (767) 440-2563
OFFICES

312
JE Maxwell & Company LimitedLinmores BuildingCastriesSt LuciaTel: (758) 451-7829Fax: (758) 451-7271Email: [email protected]
Orry J Sands & Co. Ltd.300 east Shirley StreetNassau, NP BahamasTel: (242) 393-4300Fax: (242) 393 6258
SAGICOR FUNDS INCORPORATEDCecil F de Caires Building, Wildey, St Michael, BarbadosTel: (246) 467-7500Fax: (246) 436-8829Email: [email protected]
SAGICOR ASSET MANAGEMENT INCCecil F de Caires BuildingWildey, St Michael BarbadosTel: (246) 467-7500Fax: (246) 426-1153Email: [email protected]
SAGICOR FINANCE INCSagicor Financial Centre Choc EstateCastriesSt LuciaTel: (758) 452-4272Fax: (758) 452-4279
SAGICOR ASSET MANAGEMENT (TRINIDAD AND TOBAGO) LIMITEDSagicor Financial Centre16 Queen’s Park West, Port of SpainTrinidadTel: (868) 628-1636/7/8Fax: (868) 628-1639
NATIONWIDE INSURANCE COMPANY LIMITEDSagicor Financial Centre16 Queen’s Park WestPort of Spain, TrinidadTel: (868) 628-1636Fax: (868) 628-1639Email: [email protected]
BARBADOS FARMS LIMITEDBulkeleySt GeorgeBarbadosTel: (246) 427-5299Fax: (246) 437-8873
SAGICOR PANAMA SAAve Samuel Lewis y Calle Santa RitaEdificio Plaza Obarrio3er Piso Oficina 201Panama City, PanamaTel: (507) 223-1511
SAGICOR BERMUDA RE LTD30 Woodbourne Ave,Pembroke, HM 08 P.O. Box HM 2020 Hamilton HM HX BermudaTel: (441) 296-1711Fax: (441) 292-1540
CAPITAL LIFE INSURANCE COMPANY BAHAMAS LIMITEDC/o Family Guardian Insurance Company LimitedNo 1 Shirley Street & Village RoadP O Box SS-6232Nassau, NP BahamasTel: (242) 393-4000Fax: (242) 393-1100Email: [email protected]
SAGICOR LIFE ARUBA NVFergusonstraat #106AHMO Plaza Building, Suites 1 and 2Oranjestad, ArubaTel: (297) 582-3967Fax: (297) 582-6004Email: [email protected]
Lyder Insurance ConsultantsSeroe Blanco 56ATel: (297) 582-6133
LOJ HOLDINGS LIMITED28-48 Barbados AvenueKingston 5, JamaicaTel: (876) 929-8920(-9)Fax: (876) 960-1927
SAGICOR GROUP JAMAICA LIMITED28-48 Barbados AvenueKingston 5, JamaicaTel: (876) 929-8920(-9)Fax: (876) 960-1927Website: www.sagicorjamaica.com
SAGICOR LIFE JAMAICA LIMITED28-48 Barbados AvenueKingston 5, JamaicaTel: (876) 929-8920(-9)Fax: (876) 960-1927Website: www.sagicorjamaica.com
SAGICOR LIFE OF THE CAYMAN ISLANDS LTDGlobal House, 198 North Church StreetGeorge Town, Grand CaymanCayman IslandsTel: (345) 949-8211Fax: (345) 949-8262Email: [email protected]
OFFICES

313
SAGICOR INSURANCE MANAGERS LIMITED1st Floor Harbour Place103 South Church StreetGeorge TownGrand CaymanTel: (345)-949-7028Fax: (345)-949-7457
SAGICOR PROPERTY SERVICES LIMITED63-67 Knutsford BoulevardKingston 5JamaicaTel: (876) 929-9182Fax: (876) 929-9187
SAGICOR RE INSURANCE LTDGlobal House, 198 North Church StreetGeorge Town, Grand CaymanCayman IslandsTel: (345) 949-8211Fax: (345) 949-8262Email: [email protected]
SAGICOR INSURANCE BROKERS LIMITED28-48 Barbados AvenueKingston, Jamaica Tel: (876) 929-8920(-9) Fax: (876) 960-1927 Website: www.sagicorjamaica.com
EMPLOYEE BENEFITS ADMINISTRATORS LIMITED28-48 Barbados AvenueKingston 5, JamaicaTel: (876) 929-8920(-9)Fax: (876) 960-1927Website: www.sagicorjamaica.com
SAGICOR INVESTMENTS JAMAICA LIMITEDSagicor Bank Building60 Knutsford BoulevardKingston 5, JamaicaTel: (876) 929-5583Fax: (876) 926-4385Email: [email protected]: www.sagicorjamaica.com
SAGICOR BANK JAMAICA LIMITED17 Dominica DriveKingston, JamaicaTel: (876) 960-2340Fax: (876) 929-7324Website: www.sagicorjamaica.com
SAGICOR USA, INC4010 W. Boy Scout Blvd, Suite 800Tampa, Florida 33607, USATel: (813)-287-1602Fax: (813)-287-7420
SAGICOR LIFE INSURANCE COMPANY4010 W. Boy Scout Blvd, Suite 800Tampa, Florida 33607, USATel: (813) 287-1602Fax: (813) 287-7420 Website: www.sagicorlifeusa.com
4343 N. Scottsdale Road, Suite 300Scottsdale, Arizona, 85251, USATel: 1-800-531-5067Fax: (480) 425-5150Website: www.sagicorlifeusa.com
SAGICOR FINANCE LIMITEDMaples Corporate Services LimitedUgland HouseSouth Church StreetGeorge Town, Grand CaymanCayman Islands
Associated CompaniesFAMGUARD CORPORATION LIMITEDNo.1 Shirley Street & Village RoadP O Box SS-6232Nassau, NP BahamasTel: (242) 396 4000Fax: (242) 393 1100Website: www.famguardbahamas.com
RGM LTDAlbion Plaza Energy Centre22-24 Victoria AvenuePort of SpainTrinidadTel: (868) 625-6505Fax: (868) 624-7607
Other Offices1222948 B.C. LtdThomson Building65 Queen Street WestSuite 400, TorontoON M5H 2M5Email: [email protected]
OFFICES


Stronger Together2020 ANNUAL REPORT