Strengthening Evidence-Based Policy Making on Security and ...
144
Strengthening Evidence-Based Policy Making on Security and Justice In Mexico Draft October 2012 OECD in collaboration with Mexico’s Institute for Competitiveness (IMCO)
-
Upload
khangminh22 -
Category
Documents
-
view
3 -
download
0
Transcript of Strengthening Evidence-Based Policy Making on Security and ...

Serie “Mejores Políticas”
MÉXICO MEJORES POLÍTICAS PARA
SEPTIEMBRE 2012
Strengthening Evidence-Based Policy Making on Security and Justice In Mexico
Draft October 2012
OECD in collaboration with Mexico’s Institute for Competitiveness (IMCO)

1
STRENGTHENING EVIDENCE-BASED POLICY MAKING ON SECURITY AND JUSTICE IN MEXICO
OECD IN PARTNERSHIP WITH IMCO
DRAFT OCTOBER 2012

2
ACKNOWLEDGMENTS
This report was commissioned by the Ministry of Economy of Mexico and prepared by the OECD’s Directorate of Public Governance and Territorial Development in close partnership with the Mexican Institute for Competitiveness (IMCO).
The authors would like to thank Mr. Bruno Ferrari, Minister of Economy, and Mr. José Antonio Torre, Undersecretary of Competitiveness, for their trust, encouragement and guidance in undertaking this project. The Ministry of the Interior (Secretaría de Gobernación) of Mexico also made a major contribution to the compilation and quality assessment of data, and the Secretariat would like to thank Dr. Alejandro Poiré, Minister of Interior, for his assistance in this regard. The Secretariat is also very grateful to H.E. Mr. Agustín Garçia-López, Mexico Ambassador to the OECD, for his support from the outset.
The OECD team was led by Mario Marcel, deputy director of the Public Governance and Territorial Development Directorate, and integrated by Monica Brezzi, Zsuzsanna Lonti, Natalia Nolan-Flecha and Vicente Ruiz, with additional contributions and assistance from Jean-Francois Leruste, Tatyana Teplova and Jorge Vásquez. The IMCO team was led by Juan Pardinas and Alejandro Hope, and included Alonso Bustos, Eduardo Clark, Raymundo Davalos, Ana Hernández, and Victor Rivera.
The report also includes contributions from Mr. Jorge Srur from the Inter-American Development Bank (IDB) and Professor Juan Carlos Vilalta from the Centre of Investigation and Teaching of Economics (CIDE). These contributions are properly acknowledged in the corresponding sections of the report. The report similarly benefited from the comments to a draft version by Benjamin Santa María and Lucy Tacher, of IDB.

3
TABLE OF CONTENTS
MAIN FINDINGS AND RECOMMENDATIONS ...................................................................................... 5
Key Findings: Efforts at generating and analysing data on security and justice in Mexico. ....................... 7 Recommendations: strengthening evidence-based policymaking on security and justice in Mexico ....... 10
1. Addressing existing data gaps. .......................................................................................................... 11 2. Transforming data into “actionable” evidence on which to base sound policies and reforms. ........ 13 3. Promoting the use of evidence in the policy-making process. .......................................................... 14 4. Disseminating evidence and involving stakeholders to sustain reform implementation. ................. 15
CHAPTER I: EVIDENCE-BASED POLICYMAKING IN SECURITY AND JUSTICE .......................... 16
1.1 Introduction ......................................................................................................................................... 16 1.2 Security and justice as a policy challenge ........................................................................................... 17
1.2.a The impact of security on wellbeing and competitiveness ........................................................... 17 1.2.b. Evidence-based public policies .................................................................................................... 24 1.2.c. Some distinct methodological challenges and the responses to them .......................................... 26
1.3 The state of the game in Mexico ......................................................................................................... 38 1.3.a. Security and justice in Mexico ..................................................................................................... 38 1.3.b. Knowledge generation, research, policy analysis ........................................................................ 39
1.4 Towards a conceptual framework for building a set of indicators on the performance of security and justice in Mexican states ............................................................................................................................ 42 1.5 The evidence-based policy framework applied to the relationship between security and competitiveness in Mexico ........................................................................................................................ 44 References ................................................................................................................................................. 47
CHAPTER II: TERRITORIAL DISTRIBUTION OF CRIME .................................................................... 49
2.1 Introduction ......................................................................................................................................... 49 2.2 Regional crime statistics in OECD countries ...................................................................................... 50 2.3 The geography of intentional homicide rates ...................................................................................... 53
Spatial dependence of intentional homicide rates .................................................................................. 54 Spatial heterogeneity of intentional homicide rates ............................................................................... 56
2.4 The geography of crimes against property .......................................................................................... 58 Spatial dependence of crimes against property ...................................................................................... 58 Spatial heterogeneity of crimes against property ................................................................................... 60
2.5 Improving metrics of crime in regions for effective policymaking ..................................................... 62 References ................................................................................................................................................. 67
ANNEX 1 – METHODS FOR SPATIAL ANALYSIS ................................................................................ 68
Results: Linear correlations ....................................................................................................................... 70
CHAPTER III: AVAILABILITY OF DATA ON CRIMINAL JUSTICE SECTOR PERFORMANCE FOR MEXICAN STATES ..................................................................................................................................... 75
3.1 Introduction ......................................................................................................................................... 75 3.2 Input indicators .................................................................................................................................... 77

4
1. State appropriations for criminal justice ............................................................................................ 78 2. State appropriations for criminal justice by function ......................................................................... 82 3. State appropriations on criminal justice per inhabitant ...................................................................... 85 4. Federal transfers to States for criminal justice .................................................................................. 88 5. Police officers per inhabitants and reported crimes .......................................................................... 92 6. Public prosecutors per reported crimes .............................................................................................. 96 7. Prison capacity per 100,000 inhabitants ............................................................................................ 99
3.3 Output indicators ............................................................................................................................... 103 8. Clearance rate (convicted crimes) for total reported crime .............................................................. 104 9. Clearance rate for intentional homicide ........................................................................................... 107 10. Percentage of total prison population awaiting resolution (“pre-trial population”) ....................... 110
3.4 Outcome indicators ............................................................................................................................ 113 11. Violent crime as a share of total reported crime ............................................................................ 114 12. Intentional homicides ..................................................................................................................... 117 13. Vehicle theft reports per 10,000 registered vehicles ...................................................................... 122 14. Victimization rate ........................................................................................................................... 125 15. Estimated reported crime as a share of total crime ........................................................................ 127 16. Trust in institutions: Police (state and municipal) ......................................................................... 130 17. Trust in court system: Public prosecutors and judges .................................................................... 133 18. Perceptions of safety ...................................................................................................................... 136
3.5 Conclusion ......................................................................................................................................... 141 Inputs .................................................................................................................................................... 141 Processes .............................................................................................................................................. 141 Outputs ................................................................................................................................................. 142

5
MAIN FINDINGS AND RECOMMENDATIONS
Introduction: the need for improving the evidence base of public policies on Security and Justice
Ensuring basic security and maintaining public order are core responsibilities of the state. These indeed concern the protection of citizens’ rights and the administration of justice for victims of crime or abuse but, above all, security, justice and the rule of law are also ultimate public goods whose benefits are shared by society as a whole. Security and justice are foundations of healthy democracies and an essential component of public governance. A high prevalence of crime is often interpreted as a sign of failure on the part of governments, being also reflected in the public appreciation of political leaders and in the trust on key institutions, like the judiciary and the police.
Security and justice are not only important for good governance, they are also precursors of economic health. Threats to the integrity of property and the security of executives and employees increase the risk of investment and carrying out daily business functions. Exposure to crime changes consumption patterns and business tolerance to risk with a direct impact on economic growth and competitiveness. Corrupt or unnecessarily prolonged justice proceedings reduce investor confidence in the ability of institutions to intervene when needed in order to uphold the rule of law. This creates additional costs in the form of insurance premia, security systems and compensation to employees. This may either entirely drive investors and projects away from certain territories or reduce the competitiveness of countries or regions in markets through larger overhead costs.
While an increase in the costs of “doing business” can have a direct impact on firms’ competiveness, from a macro-economic perspective, crime can further reduce competiveness by detrimentally affecting the pool of human capital (e.g. undermining potential growth by promoting “brain drain” of qualified labour to more secure regions). Moreover, superfluous government expenditures on preventing or fighting crime divert public resources from more productive investments in education and/or infrastructure which can in turn improve the economic appeal of a region for investors and entrepreneurs.
It is necessary then that policy makers exercise strong leadership in fighting crime effectively and guaranteeing security to citizens and businesses. As underscored in this report, however, this is a complex undertaking for several reasons: crime is multi-dimensional with several co-existing causes; it is a territorial phenomenon with different types of crimes concentrating geographically and- at times- displaying different drivers depending on location; government action engulf an entire “eco-system” of stakeholders from national and sub national governments to local police and even non-governmental actors such as community or neighbours groups; law enforcement and justice administration should aim at preventing, solving and punishing crime while respecting basic human rights. Finally crime is dynamic, evolving in type and severity over time, and often highly reactive to law enforcement interventions.
Successful initiatives therefore need to respond to the rationale of public policy-making and implementation and require good governance. These policies must address the different roots of crime, while tailored to the specificities of illegal activities and their locations as well as the complexity of law enforcement system responsible for delivering due process in justice administration to the citizens. They must be adaptable and responsive. Implementing them requires a shared strategy and vision, capable police and justice institutions free of corruption, and effective co-ordination and co-operation both horizontally (across policy silos) and vertically between levels of government.

6
Evidence is at the heart of these success factors. Sound evidence is indeed a fundamental requirement of due process in justice administration, making law enforcement agencies and forensic services systematic providers of inputs into courts´ decisions, but also, evidence is necessary to guide the execution of policies to concentrate resources where they are most needed as well as to assess the performance of the multiple actors of the process. Sound evidence is also especially needed in policy formulation and in assessing progress and the attitudes of citizens and politicians towards crime. More importantly, evidence and evidence gathering should reflect the territorial nature of crime and acknowledge the shared competencies across institutions. This requires the collection of data at the regional and local levels, and a good understanding of the institutional architecture governing security, including administrative delineations and the distribution of roles and responsibilities.
But despite its importance, the generation of evidence to support policy design and implementation in this sector is considerably less developed in some countries relative to other sectors such as education or health. When a student sits a standardised exam, or a patient undergoes a medical procedure, these activities are surely recorded. However, crime is by nature clandestine, making it difficult to capture statistically. Under-reporting is a common problem. Researchers and policymakers have to depend on perception data and surveys that- although improving over time with better sampling and questionnaire methods- have the chief limitation of relying on subjective accounts- sometimes not even of the victims themselves- and accurate recall of past events.
Justice procedures, designed to rightfully protect also the rights of the accused, create additional measurement hurdles: crimes must firstly be identified and brought forward to law enforcement; the police and prosecution, with the support of forensic services, must be capable of gathering accurate information before bringing a case before a judge; the courts must fairly and accurately examine evidence before a resolution is reached. Data must be gathered at each step in the process in order to accurately capture reality. To make comparisons across jurisdictions records should be comparable despite differences in legal codes and agencies.
Evidence-based policymaking in security and justice is, therefore, far from straightforward and should be developed on the basis of a coherent and systematic effort. To this end, the following steps should be considered:
• Generating and gathering basic data: The first step in the evidence-building process is the generation of basic data; emphasizing to the collection and harmonisation of metrics that allow for comparability across units and/or time. Data can be (and should be) both quantitative and qualitative; and should be gathered through various means including surveys of citizens, firms and policy-makers. Administrative records held by public bodies, like the police, prosecutors and courts are especially important given the highly procedural nature of law enforcement and justice administration. As the first building block, the quality of data is of utmost importance, and capabilities and systems should be developed to ensure relevance, representativeness, timeliness, and reliability.
• Transforming data into actionable evidence: While data is a necessary precursor for evidence, it is often insufficient. In isolation, it may not reveal useful findings to policy-makers on issues of relevance: the causes and impacts of crime, the capacities (and shortcomings) of police and the courts, areas for efficiency gains, the effectiveness of policies, and the costs and benefits of implementing some policies over others, etc. Data therefore need to be transformed into actionable evidence that can be used for decision-making. Towards that end, conceptual frameworks for measurement and evaluation need to be built on tested theory, relationships between variables need to be tested and proven, telling indicators need to be developed for

7
benchmarking across regions or countries, and ex-ante and ex-post evaluations of policies should be conducted.
• Using evidence in key decision making processes: Once a strong evidence base has been built, mechanisms need to be developed or reinforced to allow for systematic use of that evidence in the process of creating policies aimed at fighting crime and ensuring due process in justice administration for citizens. This can be done through the formulation of specific strategies, the implementation of formal or informal consultation, on-the-ground implementation, monitoring, and/or the allocation of resources. Policymakers, authorities and organisational units should be open to incorporate such evidence, which may be a challenge for officials formed in a different tradition. This may require a cultural shift in some actors and also a substantial redesign of processes so that evidence is generated and analyzed systematically. To be useful, evidence should be reliable, timely and easy to understand by the actors involved in order to contribute effectively to better policy decisions.
• Disseminating evidence and involving stakeholders to sustain reform implementation. Evidence must be shared, not only to justify decisions, but to mobilise society against crime and confront entrenched interests amongst stakeholders. This requires firstly that adequate opportunities exist for participation in the policy-making process itself, but also the release of authoritative reports, supported by active communication strategies and tools to guide expectations and disseminate results.
These series of steps can provide the basis for an agenda for improving security and justice policies in Mexico that can involve actors at all levels. Such agenda should be seen not as a substitute, but as a necessary complement to structural reforms in the administration of justice and strategies to fight the most immediate threats to the rule of law, like organised crime.
Key Findings: Efforts at generating and analysing data on security and justice in Mexico.
1. The relatively high incidence of crime and the sharp rise in violent crime in recent years in Mexico has had a distinct effect in the generation and analysis of data on security and justice. Many professionals and institutions have set to investigate the issue. Similarly, diverse Mexican institutions have devoted a great effort at improving reliability and comparability of crime-related data, the same way most advanced countries did some three decades ago. Facing a dramatic scenario of violence and organized crime, Mexico has arguably become the faster country in the world in stepping up means to measure crime and disseminate knowledge about it. This has led to concrete progress in a number of dimensions, including (a) an institutional arrangement to recognize the national Institute of Statistics and Geography (INEGI) as the top instance of a national system of crime data collection; (b) a progressive improvement in quality and comparability of administrative registries at the local and state levels which have been targeted as priority in domestic technical discussion between the INEGI and the network of producers and users of that data, particularly police and prosecution units.; (c) a high quality Public Security Census, collecting the most complete information about the sector resources in all the levels of government, ranging from federal to state and local governments, and from police to prosecutor and all public offices related to this public service; (d) one of the most advanced and complete victimization surveys in the world, in terms of accuracy of the questionnaire, sample size and timeliness, and (e) engagement of Mexico as key contributor in the main regional and international projects and institutions aimed at improving the quality and comparability of crime-related data.
2. Crime is a distinctly territorial phenomenon in nearly all OECD member countries, but this is particularly true in the case in Mexico. Beyond national averages, regional differences in crime activities within countries are often important and tend to be concentrated around the same geographic area. This

8
trend is particularly true in the case of Mexico. It is not only the OECD country with the highest national murder rate, but also the country with the widest regional disparities in murders. According to the OECD Regional Statistics Database, in 2009, the murder rate of the state of Chihuahua was 56 times higher than in the state of Yucatan whose rate was conversely close to, or even smaller than the one of many European regions. In terms of property crime, Mexico is second only to Canada, in terms of regional differences. The northern state of Baja California had a rate of crime against property almost three times higher than the national value, while the southern state of Campeche had a rate five times smaller than the Mexican national average. In contrast to some other OECD member countries analyzed, in Mexico, the concentration of homicides has been increasing over time, whereas in the case of property crimes there is a trend towards spatial dispersion, e.g. regions with high property crime rates tend to be more scattered across the country.
Crime has several root causes among which poverty, inequality, unemployment, demographics and the lack of social cohesion are common culprits. Analysis from chapter 2 reveals that there is an additional territorial dimension in the works as well, with the underlying causes of crime differing across regions in some cases. In Mexico, youth unemployment seems to be a key driver of homicides, similar to countries such as Canada, France, and Turkey. This variable is also shown to be a key driver of property crimes in Mexico.
These findings underscore the need for crime policies that are horizontal - addressing the multiple root causes - while also “local” e.g. related to the specificities of the territory. The same applies to policy implementation: the multi-level governance issue is particularly important not only because states have wide powers in the organization of police and courts of law, but because, given the strong local dimension of crime, the alignment of policy objectives across levels of government is essential to increase the effectiveness of prevention and security policies.
3. While crime statistics and victimisation surveys continue to improve in Mexico, some gaps in the evidence on security and justice remain. As a first step towards developing a set of common indicators on security and justice, this report conducted a scoping exercise of available data at the state-level. Data were gathered in accordance with (i) availability for a critical number of States; (ii) alignment, to the extent possible, with existing international indicators as featured in chapter 1; (iii) the quality/reliability of the data as judged by subject-matter experts; and (iv) comparability across regions. In addition, the relevance as well as the strengths and weaknesses of each variable included in the study were also assessed in chapter 2 in the context of their potential relevance for evidence-based decision making (e.g. how data could be interpreted for policy-making).
Results show Mexico is strong in the generation of statistics for measuring the incidence of crime. INEGI and the National Public Safety System (SESNSP) reporting to the Secretariat of Public Safety (SSP), produce internationally harmonised crime statistics disaggregated to the State level (e.g. property crimes such as car theft and violent crime including homicides). Furthermore, as a means to complementing this data and overcoming the issue of underreporting, INEGI carries out victimisation surveys annually, with results disaggregated also to the sub-national level. Furthermore, as a means to complement this data and overcome the issue of underreporting, INEGI also runs the National Survey of Victimization and Perception of Public Security (ENVIPE). The main objective of the ENVIPE is to collect information on: reported and unreported crimes, the perception of public safety, and the perception of the performance and interaction with institutions in charge of public safety and law enforcement. The conceptual framework of the ENVIPE follows the guidelines provided through the Manual on Victimization Survey of the United Nations. Thanks to its sample design, the ENVIPE provides representative information on the incidence of crime at the national and state level, as well as for 17 urban areas in Mexico.

9
These sources ensure that data is gathered uniformly for all states following the same methodology and definitions. Nonetheless, the same issues that exist for other OECD countries apply to such data as well, namely issues of comparability arising from different classification systems across institutions (e.g. for crimes and/or cases).
Finally, a strong dataset exists in Mexico on perceptions of safety and levels of public trust in police and justice institutions. Such information is collected not only by INEGI, as a component of victimisation surveys, but also by additional opinion polls which lend themselves to international comparison. These are key outcome indicators, used ultimately to examine whether changes in levels of crime impact in turn perceptions of safety.
However, following the proposed framework set out in chapter 1, some additional data gaps remain which could hinder the measurement of performance of the key institutions over the longer term (e.g. police, courts and penitentiary institutions):
• Data gathering and recording capabilities. The strongly procedural nature of law enforcement and justice administration should make easier to capture and analyze administrative records. This, however, depends on the data management capabilities of different actors. The police are a major concern in this respect, as limited capacities and motivation of police officers at the local level to enter data into information systems may compromise data quality and timeliness, with other actors, like local prosecutors trying to fill the gaps.
• Financial data: Standardised expenditures data for the police, courts and penitentiary systems are unavailable in Mexico at the regional level. This issue is further complicated by the inability to distinguish between civil justice and criminal justice expenditures, creating ambiguity in relationships between inputs and outcomes. Calculating unit costs, for instance (e.g. “cost per case”) is not possible at this stage. As a proxy for expenditures, budget appropriation can be used and are presented in this study for indicative purposes. Nonetheless, given the weaknesses of such data (e.g. the degree of flexibility that agencies have in how and when appropriations are spent), the study proposes further data collection initiatives for this area. Line-items in state budgets differ, making compilations of appropriations data subject to some subjectivity or over/under estimation.
• Administrative data for police and judicial (court) institutions: The study has found little comparable performance data at the sub-national level on the functioning of the police and courts that is, on the average length of time taken to process a case, the amount of case back-log, the quality of the judicial decisions taken (measured for instance by percentage of cases appealed, overturned, or cancelled due to inadmissible evidence or other errors). Nor is state-level evidence available on procedures or status of ongoing reforms, such as those on the use of alternative dispute resolution or new ICT policies aimed at increasing efficiency and allowing information sharing. One source of this problem could be the lack of alignment in administrative data collection among jurisdictions, which presents challenges for standardised data collection. In Mexico prosecution and judicial jurisdiction are divided between those crimes of the local charter and those of the federal charter. Each state has an autonomous judicial branch that administrates and implements justice for those local charter crimes committed within its jurisdiction. Additionally, however, the judicial branch of the federation divides the national territory into 31 judicial circuits that roughly, but not exactly, correspond to the states.
• Information on public management practices for police, public prosecutors and judges: There is a need for harmonised data collection efforts from states in key areas of public management including human resources practices such as, recruitment and selection, training requirements and

10
opportunities, performance evaluations and integrity (anticorruption policies such as requirements for the disclosure of potential conflicts of interest, the monitoring and follow-up of this information, and opportunities for whistleblowers, etc.). These practices influence the functioning of law enforcement and judicial institutions, helping to identify additional “policy levers” with which to improve their performance. Indeed, trust in police for instance, could be improved if mechanisms for preventing corruption were strengthened.
• Degree of inter-institutional coordination: Greater inter-institutional coordination is necessary for overcoming issues of overlapping or fragmented competencies across agencies and territories. It is also a key driver of positive performance, but little, if any, data exists for example on the degree of information or intelligence sharing among law enforcement agencies, the formal or informal coordination mechanisms that may exist; the amount of joint financing in place to overcome unfunded mandates; or the use of joint initiatives (such as training) to better exploit economies of scale and avoid waste of funds.
4. Formal monitoring mechanisms could be strengthened. Formal mechanisms for monitoring and evaluation could be strengthened in this sector in Mexico. Currently, the Law of the National Public Safety System creates some reporting obligations for state governments. Other than the possibility to withhold some funds from federal transfers, however, there are no clear sanctions for failing to comply. Federal oversight agencies (such as the Secretaría de la Función Pública or the Supreme Audit institution--Auditoría Superior de la Federación) are legally entitled to audit programs and projects funded with federal transfers, but these could be further exploited. Moreover, there are no formal audits of the quality and/or reliability of the information provided by state governments to these and other monitoring bodies. At the state level, there is great heterogeneity in monitoring/oversight mechanisms: some states have made efforts, for instance, to work with crime observatories and other CSO’s to improve the quality of their data, but this is not a universal practice to date.
5. Further efforts are needed to transform existing indicators into “actionable” evidence. Availability of data is key, but sound evidence may not be enough to provide guidance to policy making in the design and implementation of a concrete strategy. This could happen because the comparative analysis may rely on indicators that are far away from the planned policy intervention; and /or the institutional conditions are not known or very difficult to ascertain; the information on the policy objectives is not shared or agreed upon among the different stakeholders (national, local policymakers, citizens and business); and/or the causality and correlation links are difficult to be established. The variables collected through the data scoping exercise in chapter 3, for instance, exemplify these challenges demonstrating, for each indicator, the considerations that should be taken in their interpretation. Clearance rates for instance must be analysed with care, failing to represent how many crime reports culminate in indictments. Likewise, all indicators based on reported crime can be skewed due to under-reporting. Further efforts could be made therefore to develop indicators that are complementary to each other in order to compensate for “gaps” and that provide more powerful information for policy-making and provide insights into the key concerns of politicians and the public: including information on access to justice, existing and missing capacities, responsiveness of the police, reliability and quality of judicial decisions, and effectiveness of the penitentiary system, to name the most important ones. Formulating a strategy for more systematic and meaningful evaluation would require leadership and some element of centralisation (e.g. by the federal government) to ensure consistency and comparability.
Recommendations: strengthening evidence-based policymaking on security and justice in Mexico
In response to the aforementioned findings, the Government of Mexico could consider adopting some or all of the following proposals. Following the logic of the present study, these suggested proposals provide a “road map” of how authorities could (i) increase both the quantity and quality of data at the sub-

11
national level (ii) transform this data into “actionable” evidence which addresses the key concerns of policy-makers (iii) ensure evidence is “taken up” by key decision-makers and (iv) help disseminate evidence with a view to maximise the impact of reforms and ensure sustainability over the longer term.
1. Addressing existing data gaps.
The study has identified key gaps in data at the sub-national level, particularly with regards to inputs (expenditure) data, public management practices and inter-institutional coordination.
• Basic administrative data: develop capabilities for data management and use by the police. In the shadow of judicial reform under way, special efforts should be made at building the capacity in the police for data management through the criminal chain. This support could include technical assistance to clarify concepts, and to ensure that a sound system of crude data collection is available; subsequently to organize data correctly, and to produce basic statistics for analysis. Eventually, balanced parameters on security could be obtained and combined in an indicator basket for several purposes: to increase transparency, to improve management, to allow performance evaluation, etc.
• Expenditure data: adoption of the Classification of Functions of Government (COFOG) both second level and sub-national levels. Currently, Mexico does not provide expenditures according to the COFOG classification in the System of National Accounts neither for federal or sub-national expenditures. In the absence of harmonised expenditures data at the sub-national level, the present study utilised state appropriations (e.g. annual State budgets as approved by the Legislature) as a proxy for sub-national spending in this sector. However, as noted in Chapter 3, appropriations represent government intentions (ex-ante), not actions (ex-post) and are not as accurate as expenditures given the flexibility in how and when allotted resources are actually spent. This ambiguity creates complications for researchers looking to link inputs with outputs for measuring productivity or efficiency. Indeed, without detailed expenditures data, calculating the unit costs of “processing” different types of cases or rehabilitating offenders is not possible. For international comparability, ideally data could be collected on expenditures via the system of Classification of Functions of Government (COFOG). COFOG classifies government expenditure data from the National Accounts Statistics by the purpose of which the funds are used. First-level COFOG splits expenditures into 10 categories, one of which, of interest for our purposes, is public order and safety. Second-level COFOG further splits this category into the following expenditure groups: police services, fire-protection services, law courts, prisons, R&D public order and safety, and public order and safety expenditures not elsewhere classified. Attaining this data would require a commitment by the Mexican National Statistics Office and the states, and implementation of this initiative may require formulation of central guidelines as well as capacity-building in the form of training or support. Nevertheless, it would be a worthy effort; useful not only for analysis in the area of public order and safety, but other policy areas (education, health) as well. Even after acquired, however, one limitation of such data would be the disaggregation of civil vs. criminal law expenditures, which is not distinguishable under the COFOG classification. This is a concern for the “law courts” component, but h may be addressed by the following proposal for additional data gathering exercises.
• Processes: generate standardised and comparable information on judicial systems and public management practices through participation in the CEPEJ survey. Perhaps the largest gap in available data is in the area of processes and public management practices in place justice institutions. The Council of Europe’s European Commission for the Efficiency of Justice (CEPEJ) executes a survey every two years and is currently in its fifth wave of evaluation, offering its over 40 participating countries time-series data through one of the most

12
comprehensive data collection efforts on the justice sector. The questionnaire collects data on the whole production chain of the justice sector (inputs, practices, outputs and outcomes), of which great interest in the case for Mexico may be initially the use of alternative dispute resolution practices and current clearance rates. Chapter 1 offers a detailed description of the content of the database and the CEPEJ methodology, which distinguishes between civil and criminal systems. Each state could participate in this survey permitting both regional and international comparison, and allowing for a more accurate reply to be submitted for Mexico at the national level. The exercise could be incremental, with an initial selection of questions made as per the priorities identified in this present study, and gradual incorporation into the complete Evaluation Cycle over time. The Mexican authorities could draw from the experiences of other federal countries in completing the questionnaire - such as Germany - in order to follow similar harmonisation approaches. The exercise in and of itself could be considered as a joint initiative as well in order to build/promote inter-institutional coordination amongst security and justice authorities across the country.
As shown in chapter 1, the CEPEJ survey covers various elements of institutional information and case management processes. The area of public management practices, however, is less extensively covered in the survey, but includes questions related to certain HRM policies for judges and prosecutors, as well as back-office e-government practices in the sector of justice. Additional gaps remain in the areas of corruption prevention and opportunities for whistle blowing, as well as transparency of operations and decisions. These areas are key for building greater trust in institutions and could be substantiated further. The OECD has existing survey instruments which could be adapted for the justice sector; particularly these include surveys on (i) recruitment and performance assessments for justice sector employees; (ii) compensation practices for judges and police; (iii) requirements for conflict of interest disclosure for these positions and monitoring/follow-up mechanisms for the same; and (iv) proactive disclosure of judicial information and decisions and accessibility of this information by citizens. Ultimately, such instruments could be used beyond the justice sector to incorporate also the police and prison system.
• Inter-institutional coordination: Diagnostic on multi-level governance in security and justice. The OECD analyses common challenges in multi-level governance in various sectors including water governance, ICT and innovation strategies, as well as regulatory governance. It has developed and successfully tested a framework for identifying impediments to horizontal and vertical coordination between government institutions. Once identified (usually through survey of national stakeholders complemented by interviews with key leaders), best practices in the sector are highlighted as potential solutions. Namely, the framework examines the following dimensions:
− Policy gaps: evaluators would assess whether sufficient (formal and informal) mechanisms exist between policy sectors (horizontally) as well as levels of government (vertically) for particular crime policies (e.g. those targeting organised crime for instance, or implementation of case management reforms, etc.). They would assess for duplication, fragmentation or even contradictions which may lead to ineffective or inefficient strategies. These policies would be chosen in consultation with the Government of Mexico and would be complemented by benchmarking and identification of good practices in policy coordination for similar initiatives in other member countries (e.g. organised crime strategies from the United States, Spain, or Italy for instance).
− Administrative gaps: Administrative gaps occur when there is a mismatch between the “policy problem” at hand and the administrative delineation of responsibilities for addressing

13
such problems. It could be the case that “mergers” of sub-national units should occur in particular policy areas, or that – alternatively – there should be further division of responsibilities to improve responsiveness to local specificities. For the chosen policy areas, the diagnostic would assess what could be the appropriate scale for more effective policies.
− Fiscal and capacity gaps: To overcome issues of insufficient funding (“unfunded mandates”), the diagnostic would assess, for instance, whether sub-national units may need to consider shared financing mechanisms or joint human resources initiatives (e.g. joint training) in order to meet responsibilities, and provide examples of successful mechanisms from other member countries (e.g. United Kingdom).
− Information gaps: In the sector of crime, information gaps are key impediments to success. Indeed, criminal activities often exploit these gaps, and intelligence sharing between law enforcement agencies has proven in several occasions to be necessary. The diagnostic would identify information asymmetries between and across levels of government and law enforcement agencies in order to suggest mechanisms for improvement. Adoption of ICTs and integrated back-office systems can be exploited to facilitate the flow of information; leaders in the OECD in this regard (United States) could be brought in to share experiences and lessons learned.
− Accountability gaps: Better performance on the part of the police and justice institutions can be incentivised if the appropriate accountability mechanisms are in place. Policies from national level governments, for instance, may be vague about monitoring or follow-up mechanisms. Additionally, there should be sufficient information publicly available and opportunities for the participation of civil society in the policy-making process. Indeed, along with audit institutions, civil society organisations can actively monitor performance and improve policy design. The second recommendation, towards the construction of a suit of indicators, could be one step to help diffuse this common problem of multi-level governance, making key information available to all stakeholders.
• Improve international comparison by standardising regional crime statistics across Latin American Countries: It would be very relevant for the strengthening of the Mexican crime data system as a whole a country stronger engagement in the regional initiatives aimed to improve and harmonize those statistics, like the IDB-funded Regional System of Standardized Indicators on Peaceful Coexistence and Citizen Security (SES), as well as the new group on citizen security recently created by the Conference of Statistics of the Americas. As country member, Mexico can be benefited by the exchange of experiences, particularly but not exclusively in the field of administrative registries, as well as playing a more important role sharing its developments with less advanced countries. Although Mexico has already developed the highest quality victimization surveys of the region and improved their administrative registries over the last years, it must be highlighted that the abundant information collected by those surveys and records, are not used accurately yet for the design, monitoring and evaluation of public policies. So the knowledge of other SES country members with bigger experience about (Colombia, Chile, for instance) could help Mexico to take better advantage of that data in terms of more efficient and accountable citizen security and justice policies.
2. Transforming data into “actionable” evidence on which to base sound policies and reforms.
In addition to data availability, the study has assessed the strengths and limitations of existing variables with a view to building more powerful “toolkits” for policy makers.

14
• Conduct sectoral study on economic competitiveness and justice sector efficiency. By ensuring the security of property rights, efficient judicial systems contribute to the smooth functioning of markets helping to increase overall economic efficiency, thereby enhancing growth. Timely resolution of the disputes and predictability of court decisions are desirable properties to avoid firms to suffer undue costs that hurt their competitiveness and to guarantee certainty of transactions and investment returns. The Government of Mexico may wish, in union with other member countries, to draw upon the existing frameworks and newly collected data from the CEPEJ survey to participate in a sectoral efficiency study of criminal justice systems with a view to assess its impact on economic competitiveness. The international benchmarking element is key, as these studies identify potential efficiency gains through comparison (e.g. assessing with countries achieve better results with fewer resources, and subsequent comparison of practices). The study could also serve a double purpose, providing an “ex-ante” evaluation on which to later measure the success of ongoing reforms in the States.
• Facilitate, in consultation with national authorities and state governments, the creation of a set of standard indicators for benchmarking security and justice across time and regions. The collection of quality data is a necessary first step in building an evidence-base, however, these data must be codified in ways that allow proper interpretation and evaluation. In this regard, indicators are more useful than raw data as they provide insights into issues of interest to policy-makers. The development of a cadre of indicators on security and justice in Mexico would require a two-fold approach, the first of which is building a conceptual framework for indicators selection. Chapter 1 proposed a working performance measurement framework used by the OECD’s Government at a Glance programme. This framework could be used a starting point for additional elements of performance which could be decided at joint working sessions or workshops and in consultation with civil society. The conceptual framework would be sustained additionally with the findings of “crime theory”, e.g. analysis of the roots of crime, so as to include socio-economic and institutional indicators into the framework as well (GDP per capita, inequality, unemployment, etc), as well as situational factors that might produce crime opportunities. The framework would also incorporate (into the processes dimension) evidence on good practices for institutional coordination and effective crime fighting policies, so as to ensure alignment of performance indicators with successful approaches. While the conceptual framework is key, however, further statistical analysis is necessary to justify the selection of indicators which would be indicative of the dimensions of performance in the criminal justice system that are most important to authorities (e.g. establish statistically significant relationships to desired outputs and outcomes, between quantitative and perception data).
3. Promoting the use of evidence in the policy-making process.
The study has concluded that formal monitoring and evaluation mechanisms could be strengthened as a means of promoting the incorporation of evidence in decisions.
• Investigate the use of evidence in policy decision-making at different levels. While there is a general perception that the use of evidence for policy design and implementation in security and justice in Mexico is very limited, this issue should be investigated further. In particular, surveys and case studies could be developed not only to assess the extent to which data and evidence is under-utilized, but also to identify good practices that could be disseminated across the system.
• Strengthening institutional oversight and accountability to incentivise the use of evidence.
− Clearly designating leadership. Several institutional actors in Mexico must be involved in efforts to improve evidence and its use: law enforcement agencies, the courts and penitentiary

15
systems, state governments, the national statistics office, the supreme audit institution and multiple ministries. However, clear and strong leadership will be required to coordinate these different entities towards common objectives; centralisation to some extent is needed in order to harmonise methodologies and efforts across the states. The SESNSP, an autonomous agency located within the Secretariat of Gobernación, is already responsible for some data collection initiatives and could conceivably play such a role.
− Enlisting independent auditors and civil society. Mexico’s Supreme Audit institution may consider taking ownership of the score card evaluations (proposed below). Likewise, the Government may want to commission benchmarks and evaluations to Universities and objective think tanks to “take up” studies based on the indicators produced.
− Incentivising the use of evidence. Performance evaluations of senior policy makers and leaders could include criteria for demonstrating the use of evidence; new policy proposals or initiatives could be required to demonstrate cost-effectiveness prior to allocation of funds; Federal transfers to states could be made partly contingent on demonstrated improvements.
4. Disseminating evidence and involving stakeholders to sustain reform implementation.
Gathering and interpreting evidence is a first stepping stone for improved results, but the impact and sustainability of these efforts may be limited without buy-in from stakeholders. The proposals suggested here would be possible only with a sufficient evidence base and after the other steps completed.
• Creation of “score cards” on security and justice. Once core performance indicators have been identified, the Government of Mexico could consider using these indicators as the basis for creating “score cards” for states in order to monitor the performance of the police and the courts over time. Though “score cards” traditionally oversimplify the complexities of performance, they have nonetheless been useful tools for communicating to the public and promoting a more informed dialogue on the causes and impacts of crime. They also offer an alternative to composite indicators which, by not clearly presenting the underlying data, often obscure results. The Government of Mexico has one of the more comprehensive open government portals in the OECD (http://portaltransparencia.gob.mx/pot/). Score card ratings and the results of independent evaluations should be proactively disclosed and made publically available on these and other (e.g. regional portals’) mediums.
• Reducing transition costs. Changes to data collection and monitoring methodologies incur costs to all involved. Certainly, at the national level this may imply further leadership and steering costs on behalf of the National Statistics Office and Gobernación. Perhaps it is the States and local institutions, however, which may face the strongest challenges: as a result of new monitoring mechanisms, police reporting classifications for instance may need to change over time to ensure comparability; law enforcement and court systems may need to invest in new or changes to existing ICT tools to monitor and measure how cases are processed, at what speed, etc. It is necessary that these costs be recognized and measured. Towards that end the Government of Mexico may wish to conduct a cost-benefit analysis of the expected costs/benefits of the transition to adopting the standard indicators and offer financial assistance and technical assistance to States and agencies during the transition.

16
CHAPTER I: EVIDENCE-BASED POLICYMAKING IN SECURITY AND JUSTICE
1.1 Introduction
1. Security and justice are among the oldest and most basic functions of the state. They do not only concern victims of crime and abuse, but are also ultimate public goods whose benefits are shared by society as a whole. Security and justice are at the heart of the rule of law of modern, democratic societies and are an essential ingredient of governance, social cohesion and the functioning of markets.
2. While no country can claim to have completely eradicated crime, still some face significant challenges in this area, either at the national level or in specific territories. Crime can also transcend national borders, as drug trafficking, money laundering and cybercrime have become the dark side of globalisation.
3. Notwithstanding its sociological or economic causes, the prevalence of crime reveals a failure of governments to deliver on a core responsibility, proportional to the scale of illegal activities. This is well understood by citizens, who reflect their perceptions of insecurity in their assessments of institutions and authorities. Where crime reaches a large scale it erodes personal wellbeing, trust, the legitimacy of institutions and economic competitiveness.
4. Security and justice should be seen as a critical domain of public policy that should be organized, managed and accountable as such. Given the complexity of crime, security and justice policies should be capable of integrating different disciplines and mobilising different government bodies.
5. Recognizing security and justice as a subject of public policy is especially relevant given the dynamic nature of crime. Criminals sometimes have the means to adjust fast to a changing environment, react to control mechanisms and take advantage of opportunities and legal loopholes. Adaptation also takes place at the territorial level, with the possibility of crime concentrating, expanding and displacing geographically. Dynamic crime cannot thus be fought with static policies. To respond to change in crime patterns, public policies need not only to have the flexibility to adapt, but also the information to do it in an effective way. Information is necessary to detect and anticipate changes in criminal activity, to redeploy public resources, to adapt strategies and means, and to assess the impact of policies. Still, generating and using information in this area is particularly challenging, because it is in the essence of criminal activity to operate in the dark.
6. This chapter is devoted to security and justice as a dimension of governance and as a public policy domain. In particular, the chapter elaborates on how information and evidence can contribute to the effectiveness of such policies in the concrete reality of Mexico. To this end, section 2 depicts security and justice as a distinct policy challenge, both in terms of its potential impact on wellbeing and competitiveness as well as in terms of its requirements on the design and implementation of public policies. Section 3 provides some additional background on how evidence can contribute to the effectiveness of public policies and elaborates on how it translates into the information requirements of effective policymaking on security and justice. This is reflected in some international efforts at promoting and standardizing crime-related statistics. This methodological part of the chapter concludes underscoring the territorial dimension of crime and how it translates into multi-level governance challenges.

17
7. The chapter continues with a preliminary assessment of the situation of Mexico concerning the incidence of crime, its territorial expression and the quantity and quality of evidence available to support public policies. As indicated in the introductory chapter, the purpose here is to analyze the availability and use of information to develop effective policies on security and justice rather than policy performance itself. To this end, the next section proposes a methodological framework to organize and interpret the statistical information on crime, security and justice administration that provides the framework for the analysis of data at the state level in the ensuing chapters. The chapter ends with a section illustrating how our conceptual and methodological framework could be used to analyze a particular dimension of crime, which is the relationship between (in) security and economic competitiveness.
1.2 Security and justice as a policy challenge
1.2.a The impact of security on wellbeing and competitiveness
8. Security – or the lack of it – is a major determinant of the quality of life of people all around the globe. Crime is a direct threat to the physical and psychological integrity of victims and it flows very directly to their immediate entourage of relatives and friends. Security is not determined only by the direct experience of being the victim of a crime but rather by the perception of the risk of being so. Such perception may force people to change their behaviour – like walking on the streets or trusting strangers – or to commit resources to provide extra security – like acquiring security locks, alarms or even private guards.
9. These factors have led the OECD to include safety as one of the components of its Better Life Index, which uses the homicide rate and assault rate as base indicators to rank citizens’ feeling of vulnerability in their country and then compare it against other countries (Figure 1.1). More indirectly, crime is also an important component of health indicators published by specialized agencies, like the WHO, due to its impact on mortality rates.

18
Figure 1.1. Safety as a component of the OECD Better Life Index
Source: OECD Better Life Index. http://www.oecdbetterlifeindex.org/topics/safety/ accessed July 2012.
10. The impact of insecurity on personal well-being can be recognized in people’s responses to opinion surveys. Figure 1.2, depicts the proportion of respondents of Latinobarómetro and Eurobarometer surveys that think that security is of concern. In comparison to their European counterparts, citizens in Latin America perceive crime as a considerably larger concern. Indeed, they ranked this issue-area as the most important, even above other issues such as unemployment and poverty. Conversely, in Europe, on average only 10% of those surveyed replied that this issue was worrisome. In fact, the European country with the highest sense of priority (Cyprus) is well below the Latin American average (28%).
-‐
1.00
2.00
3.00
4.00
5.00
6.00
7.00
8.00
9.00
10.00
Brazil
Mexico
Chile
Estonia
Russian Federatio
nIsrael
Belgium
Turkey
Portugal
Sweden
France
Luxembourg
Netherlands
Italy
Spain
Switzerland
Denm
ark
Slovenia
Hungary
Greece
Germ
any
Unite
d States
Slovak Republic
Norw
ayCzech Re
public
Finland
Korea
Austria
Ire
land
New Zealand
Iceland
Australia
Unite
d Kingdom
Poland
Canada
Japan
Ranking of countries based on the Safety component of the Better Life Index[ 10.00 reflects the lowest perception of risk of people being physically assaulted or falling victim to other types of
crime. Based on assault rate and homicide rate as of 2010 and 2008, respectively, or latest available year]

19
Figure 1.2. Security as a public policy priority, according to Latinobarómetro and Eurobarometer
Source: Eurobarometer (2011), Latinobarometro (2011).
11. Insecurity also has an impact on the productivity and competitiveness of businesses. Threats to the integrity of property, security of executives and employees increase the risk of investing in some countries or areas. Insecurity creates additional costs for businesses in the form of insurance premia, security systems and compensation to employees. This may either entirely drive investors and projects away from certain countries and areas or reduce their competitiveness through larger overhead costs.
12. While there are many studies that attempt to measure the economic impact of crime and insecurity in some high risk countries –Mexico included—security indicators are regularly included in competitiveness measures as the Global Competitiveness Report of the World Economic Forum (Figure 1.3.). The loss of human capital due to life losses, injury, imprisonment and emigration to safer countries further adds to the economic and social cost of crime (see box 1).
28%
3%
7%
11%
11%
15%
20%
21%
28%
30%
30%
33%
33%
34%
39%
39%
40%
45%
61%
0% 20% 40% 60% 80%
Average Latin America
Nicaragua
Brazil
Bolivia
Dominican Republic
Colombia
Peru
Chile
Paraguay
Guatemala
Honduras
Ecuador
Panama
Argentina
Mexico
Uruguay
El Salvador
Costa Rica
Venezuela
Crime as a primary concern in Latin America
10%
4%
4%
6%
6%
6%
7%
8%
8%
8%
8%
8%
9%
9%
10%
10%
11%
12%
12%
13%
14%
18%
19%
21%
0% 20% 40% 60% 80%
Average EuropePortugal
SpainMalta
The Netherlands GermanySweden TurkeyPoland
HungaryUK
IrelandFranceLatvia
FinlandItaly
LithuaniaSlovakia
LuxembourgAustriaSloveniaRomaniaGreeceCyprus
Crime as a primary concern in Europe

20
Figure 1.3. Security in Global Competitiveness Report: business cost of crime and violence
Source: World Economic Forum (2011-12), “The Global Competitiveness Report 2011-2012”.
1.71.91.92.1
2.42.52.52.52.72.82.8
3.13.33.43.43.43.53.53.63.73.73.93.94.04.24.34.44.54.54.64.84.84.84.94.95.05.05.15.15.25.35.35.35.45.45.55.55.55.55.65.65.75.75.75.85.96.06.06.06.16.16.26.36.4
0.0 1.0 2.0 3.0 4.0 5.0 6.0 7.0
GuatemalaEl Salvador
JamaicaVenezuela
HaitiHonduras
South Africa Trinidad and Tobago
Mexico Belize
ColombiaGuyanaEcuador
BrazilDominican Republic
PeruArgentinaParaguayCosta RicaPanama
Puerto RicoBoliviaEgypt
NicaraguaRussian Federation
IndonesiaSuriname
ItalyUnited States
Turkey Chile
GreeceIndia
HungaryKorea
Slovak RepublicUruguay
ChinaIsrael
NetherlandsCanadaFrance
United Kingdom Spain
TunisiaCzech Republic
EstoniaJapanPolandAustria
GermanyBelgiumIreland
New ZealandPortugalAustralia
LuxembourgNorwaySwedenSlovenia
Switzerland DenmarkFinlandIceland
Business cost of crime and violence To what extent does the incidence of crime and violence impose costs on businesses in your country? [1 = to a great extent; 7 = not at all]. 2010–11
weighted average.

21
Box 1: Estimate of Total Domestic Cost of Crime and Violence
There is a widespread recognition that a high rate of crime can have many negative consequences at several levels, which may include
• Undermining the investment climate and deterring investment and growth (e.g. through higher cost of doing business, as a result of high security costs or business losses and lost outputs and working time as a result of crime). High level of crime also diverts investment away from business expansion and productivity improvement, and may lead to a less than optimal operating strategy.
• Eroding the development of human and social capital and thus undermining the potential for growth (e.g. through exodus of qualified labour from the crime-affected areas as a result of reduced quality of life; exodus of productive individuals from the workforce; periodic school closure).
• Diverting public resources excessively away from productive uses that could have a stronger impact on development and growth (e.g. more productive investments could be made into the medical system, for example, at the society-wide level, or into personal education and health at the level of an individual) (World Bank, 2004).
These impacts impose a significant cost on society. For example, several studies in the UK provide estimates of costs of crime ranging from £35 to £60 billion per year. These estimates aim to enable policy-makers to make better-informed decisions about which policy measures are the most effective, by allowing meaningful comparisons to be made of the costs and benefits offered by alternative crime reduction measures. They include a wide range of costs, including economic and social costs of crime and can be grouped in several categories, including
• Health costs, including medical expenses, lost production due to death and injury, and the costs of victims’ emotional suffering. Emotional impact (that reduces quality of life) and legacy of increased fear and interpersonal problems for victims of crime can be substantial, particularly for personal crimes (World Bank, 2004).
• institutional costs, covering government spending on security and the justice system (e.g., security hardware and patrols; awareness programmes and community safety programmes, police, prosecutors, courts, legal aid, prison and probation services, the criminal injuries compensation boards, witness and jury service, costs of victim assistance, victim support units, a proportion of child protection and out-of-home care for children in need etc) (Mayhew, 2003).
• Private security costs in households and businesses (e.g. security alarms and guards; costs of precautionary behaviour, such as taking taxis instead of public transport, avoiding particular people or places, or staying at home after dark) as well as insurance resources and premiums.
• Material and economic costs, encompassing property losses suffered by individuals and businesses, but also lost productivity as a result of loss of human capital from the crime-affected areas or poor business and investment climate.

22
These estimates incorporate costs associated with the full cycle of crime management, including those associated with the anticipation and prevention of crime, responding to crime (costs of criminal justice system, as well as other services to victims, including health and housing; costs related to miscarriage of justice when one is wrongfully accused or acquitted) and dealing with the consequences of crime (medical costs, economic impact) (Brand, S. and R. Price, 2000).
An example of crime cost estimates for South Africa is depicted in the table below (Alda, E. and J. Cuesta, 2010). Such estimates amount to a total cost of US$ 22.1 billion or 7.8% of GDP in 2007. The most burdensome category is the institutional cost of violence (i.e. direct public expenditures through the criminal justice and security systems) followed closely by health-related costs. They represent about two thirds of the total. Interestingly, the remaining third is explained by material transfers from legitimate private owners to thieves, private security costs and economic costs in the form of averted Foreign Direct Investment.
13. Despite the overwhelming evidence on the impact of crime on wellbeing and competitiveness, many governments do not treat security and justice in the same way that they do with traditional policy domains, like education, health or the environment. While strategic objectives are routinely established to mobilise resources and design programs in the latter areas, not many governments dare to set measurable objectives to security and justice, and sometimes even concrete policies and programs are difficult to discern. This may be also reflected in poor statistics, reactive policies, weak coordination and/or low accountability.
14. Many factors could contribute to the neglect of security as public policy domain, including limited resources or corruption, but more often this is due to the belief that security is someone else’s responsibility, be it either the police, the judiciary, the legislature or some other level of government.
Million US$ %GDP
Health costs 7,369.75 2.61. Medical attention 24.69 0.0087
a. Unintentional homicide 10.28 0.0036b. Intentional homicide 14.41 0.0051
2. Disease burden/productivity loss 4,948.60 1.753. Emotional costs 2,396.46 0.85
Institutional costs 7,169.00 2.551. Correction services 1,523.73 0.542. Police, public security 4,612.96 1.653. Justice 1,032.31 0.36
Private security costs 2,827.24 1.001. Households 98.59 0.032. Firms 2,728.65 0.89
Economic costs 1,287.04 0.451. Investment (FDI) 1,287.04 0.45
Transfers 3,426.42 1.211. Residential property 404.14 0.142. Vehicle theft 464.11 0.163. Robbery 5.57 0.0024. Weapons 39.72 0.015. Personal theft 54.82 0.026. Firms’ property, merchandise 2,295.98 0.757. Theft of cattle 162.08 0.06
Grand total 22,079.45 7.81
Estimates of cost of crime by category, 2007

23
However, a highly professional police force or an efficient judiciary are not sufficient, in isolation, to provide an effective response to crime. The experience of many countries indicates that crime cannot be fought by the inertial operation of the police and courts of justice alone. The police and the judiciary are only part of a more complex arrangement of institutions that are responsible for a limited part of law enforcement.
15. Security and justice institutions are strongly interrelated not only by procedures, but also by the nature of crime itself. In terms of processes, law enforcement can benefit from effective prevention and delivers suspects and evidence for courts to administer justice. Court decisions need to be based on legislation and their rulings have to be applied by another set of institutions, like prisons and correctional services. In many countries, these functions are not only distributed across state powers and specialized bodies but also across levels of government, adding to the complexity of the system.
16. In addition to the above, crime can follow a changing pattern, both in terms of the nature of crime, its victims, means and territorial deployment and cannot be effectively controlled by static institutions. To be effective, security and justice institutions need to know where to concentrate their efforts detect changes and redeploy its resources.
17. Thus, the effectiveness of security and justice systems could be seen as depending on three major factors: (a) the coherence of the institutional environment and the legal framework; (b) the coordination of law enforcement and justice administration bodies, and (c) the use of evidence to plan, organize and adapt. In other words, for security and justice to be effective as a policy domain, it has to be organized as such.
18. While good practice in some OECD countries testifies to the importance of coherence, coordination and the use of evidence (Box 2), in many cases government policies on security and justice are fragmented, organised through silos, with overlapping responsibilities across levels of government. At the same time, not all information gets collected, as public sector information processes tend to follow financial flows or bureaucratic processes, making it difficult to extract meaningful data. Many countries may gain substantially from improving policy design and implementation in security and justice.
Box 2: The SaLTo-‐model -‐ Prevention of Crime in Oslo, Norway
It has been universally acknowledged that coordination and cooperation among various stakeholders is key to preventing and reducing crime. One of the examples of effective coordination in crime prevention comes from Norway through the so-called SaLTo model. The SaLTo model was introduced in 2006 as a collaborative crime-prevention strategy between the municipality of Oslo, the Oslo Police District, local coordinators and work groups. It is designed as a central wide ranging crime-prevention action programme, together with budget and local activity plans, and is intended to form the basis for devising central and local action programmes covering all relevant bodies - under the guidance of the Police Council. The model includes a central steering group, supported by local steering groups with representatives of the police, central city authorities and other departments, supported by SaLTO coordinators at the central and district levels, child welfare consultants and follow up teams. It operates on the three-year cycle, with the latest central action programme for 2012-2015 approved in 2011.

24
The model focuses on children and young people aged from 12 to 23 who grew up in challenging or vulnerable environments and who may have engaged in alcohol, drugs or crimes at an early age. The main objectives of this early crime prevention strategy are threefold:
• to reduce child and youth crime;
• to reduce alcohol and drug abuse and
• to coordinate the crime-prevention work.
In 2012-2015 the focus will be on the action areas stated below:
• Safe Schools
• Close follow up of children and young persons who have committed crimes
• Contingencies in respect of acute problems. Assault and menace
• Early intervention – integration of the preventive work
• SaLTo+ (Measures aimed at the 18-23 age group)
• Information and knowledge development
This approach builds on crime prevention expertise, information and local partnerships. It aims at engaging civil society as a whole by developing a broad spectrum of innovative and constructive measures between the various stakeholders; from early identification and intervention in childhood and adolescent to effective follow up of children and young persons who have committed crimes.
Some of the reported results of this model included better coordination, earlier intervention, faster reactions, better information flow, more knowledge on crime and crime prevention and less youth crime, which, in turn, contributed to a safer city. The city of Oslo experienced in the period 2007-2010 a 27.1% decrease in the number of reported victims under the age of 18 and a 63.6% reduction in the number of reported criminal offences in 2010 among young repeat offenders from the previous year.
Source: Official website for the city of Oslo http://www.salto.oslo.kommune.no/english/ (accessed June 2012)
1.2.b. Evidence-based public policies
19. While institutional consistency and coordination have received a lot of attention in the development of security and justice systems, the generation of evidence to support policy design and implementation in this area is considerably less developed, especially in emerging countries.
20. The OECD has proposed to understand evidence-based policymaking in the governance area as comprising four elements (OECD, 2012):
(i) Generating and gathering reliable basic data. Basic data is essential to build solid evidence for policymaking. There are multiple ways of generating data. OECD statistics and “at a glance” publications draw information from administrative records, broad surveys or the codification of opinions of informed observers. Process-based sectors, like health and justice, are especially prolific at generating data, but oftentimes information is not collected in a systematic and/or regular way. Budgets are a very common source of data in the public sector, but accounting rules and classifications define the quality of such information. Surveys of individuals, households or businesses are usually carried out by statistical offices or specialized agencies, and are a privileged means to capture perceptions, attitudes and expectations. Surveys of policymakers, specialists or practitioners of public policies are especially useful for transforming qualitative information into data that can be comparable across different subjects.

25
(ii) Transforming data into actionable evidence. While the basic data is useful, it may not always offer the right responses. Was the policy effective in reaching its impact? What were the real effects? What is the relationship between costs and benefits? When can we expect results? Who bears the cost? What is the impact in terms of citizens' satisfaction and perception? These are the practical questions that leaders or institutions may face. To be able to respond to these questions, basic data needs to be standardized and integrated into algorithms with more analytical content, like ratios, indices and composites. Qualitative information can be codified to be transformed into quantifiable data. But even more sophisticated indicators may be insufficient to answer the more fundamental questions on effectiveness and efficiency. To this end some form of evaluation may be necessary. Many methodologies have been developed to support evaluation under different perspectives and circumstances –like impact evaluations, benchmarking exercises, comparative studies. OECD work in this area suggests that a good evaluation of a program or policy has to be cost-effective, to which end not only the information has to be readily available and the cost affordable, but also the purpose of the program or policy under analysis should be clearly identifiable.
(iii) Using the evidence to support policy decisions. Opportunities should exist for integrating the data into the policy decision-making process. On the one hand, this means that policymakers and decision-making processes should be open to incorporate such evidence. This may require a cultural shift in some actors of this process and also a substantial redesign of processes so that evidence is generated and analyzed systematically. Using evidence for policy decisions, however, is not a matter of pure will; evidence should be reliable, timely and easy to understand by the actors involved in order to contribute effectively to better policy decisions.
(iv) Disseminating evidence and involving stakeholders to sustain reform implementation. Evidence should be necessary not only to technicians, but to all stakeholders in order to address key political economy challenges. When the evidence is available it may help to mobilise stakeholders and confront entrenched interests. This is especially important in the area of security and justice, where crime can be fought more effectively with the support of communities and public opinion. Evidence on the incidence of crime and the performance of public institutions in fighting it needs to be shared with the public, involving stakeholders in participatory processes to sustain reform implementation. Such evidence may also help to manage public expectations and help people understand how the justice system works. This requires authoritative reports, supported by active communication strategies and tools to disseminate the results.
21. Figure 1.4. Illustrates the scheme above by reflecting the volume of information required at each step. In particular, it suggests that each one of the four steps proposed required further synthesizing information in a way that can respond to the interests and capabilities of different stakeholders.

26
Figure 1.4. Pyramid of evidence-‐based policies
Source: OECD.
22. In the case of security and justice, the generation of evidence acquires an even more fundamental role, as the evidence requirements in the implementation of policies may well exceed those for policy implementation. Sound evidence is indeed a fundamental requirement of due process in justice administration, making law enforcement agencies and forensic services systematic providers of inputs into courts´ decisions. But evidence is also necessary to guide the execution of policies to concentrate resources where they are most needed as well as to assess the performance of the multiple actors of the process. Sound evidence is also especially needed in policy formulation and in assessing progress, as the attitudes of citizens and politicians towards crime may be easily dominated by emotions and by the influence of notorious events in the public domain.
1.2.c. Some distinct methodological challenges and the responses to them1
Incidence of crime, administrative records and perceptions
23. Insecurity is a phenomenon affected not only by actual criminal events but also by people’s perceptions and fear of crime as well as by lack of rule of law2. For this reason security and justice policies cannot be confined to reducing crime rates.
24. The relevance of these subjective factors was acknowledged some time ago. The first concerns emerged at the end of the 1960’s and beginnings of the 1970’s, when a few developed countries, led by the USA and the UK, started to implement victimization surveys (VS). This type of surveys is designed to capture unreported criminal events, fear of crime and perceptions of insecurity. The use of VS
1 This subsection includes several contributions by Jorge Srur, of the Inter-American Development Bank. 2 For example, the citizen’s low confidence on Police reduces people’s propensity to report crime, downgrading the
reliability of official criminal records. Violence-related costs are also strongly linked to perceptions: if people feel crime is increasing, although actual rates are dropping, they will spend more on crime prevention and demand more public investment on this. Therefore, better Police and judicial records on crime have to be complemented by information on those unreported facts and perceptions in order to have a complete picture of the insecurity.

27
progressively spread across the world, with the support of UNICRI, a UN based program of the late 80s that also introduced the first surveys in Latin America and the Caribbean (LAC)3.
Box 3: Unreported Crimes: Examples from Canada and United Kingdom
While crime statistics aim to provide a comprehensive picture of crime, it is difficult to capture the full extent of crime, with many criminal activities remaining unreported. The volume of crime that is not officially recorded is often referred to a 'dark figure' of crime (this may include crime that is never reported to the police, as well as the incidences of crime that were reported but never recorded by the police officers). The unreported crime may put into doubt the effectiveness and efficiency of the official crime data and is the primary reason why official crime statistics are often supplemented by 'crime and victimisation' surveys (e.g. British Crime Survey,4 the US National Crime Survey,5 and the Canada’s General Social Survey on Victimization). These surveys and police recorded crimes are complementary to each other and aim to provide a fuller picture of crime. The survey data provide insight into citizen’s experience with crime, their perceptions of living in a safe environment, the functioning of and attitudes towards the criminal justice system and perceptions of anti-social behaviour.
The level of unreported crime revealed through these surveys is indeed significant. For example, according to the 2009 General Social Survey, 69% of Canadians who have been the victim of a crime in the preceding 12 month, did not report it to the police. These figures beg the question of why not all of the crime is reported. Some of the most common reasons in Canada, according to the survey results, included believing that the incident was not important enough (68%); thinking there was nothing the police could do to help (59%); having dealt with the situation in another way (42%) and feeling that the incident was a personal matter (36%). Other reasons revealed through the UK survey included having reported the incident to other authorities, common occurrence of a particular crime, fear of reprisal, disliking or fearing of the police/previous bad experience with the police or courts (Chaplin, R., J. Flatley and K. Smith (eds.), 2011).
Unrecorded crime is problematic as it limits the capability of the criminal justice system to deter crime, may reduce effectiveness of allocating police resources, shield offenders from police actions. Besides, it directly affects citizens and the society as a whole as victims of unreported crime are not eligible for victim compensation benefits and insurance costs are misevaluated. It also has a negative impact on feeling of safety and security, which in turn may contribute to the deterioration of the business climate, national competitiveness and prosperity, as well as confidence in public institutions, including the criminal justice system. This calls for accurate crime data, reflecting reported and unreported crime, as well as targeted actions to raise awareness of the reporting mechanisms and creating a safe climate for reporting crimes. It is also essential to ensure that various data sources on crime are used by government institutions in defining and evaluating policy, programme and budget priorities. These actions tend to bring the
3 UNICRI project included initially only in 4 LAC capital cities. Afterwards, more countries and cities were
developing their own VS. However, periodical, systematic and State-run VS are still exceptional in developing countries, whose statistical priorities are usually allocated away from crime issues.
4 “The British Crime Survey (BCS) is a nationally representative survey with an achieved sample of approximately 47,000 adults living in private households in England and Wales each year. The BCS started in 1981 and has been running as a continuous survey since 2001/02. It is a face-to-face survey in which respondents are asked about their experiences of crime in the 12 months prior to their interview and their perceptions of crime and crime-related topics, such as anti-social behaviour and the police.” UK Office for National Statistics website http://www.statistics.gov.uk/hub/crime-justice/crime/victims-of-crime/index.html (accessed June 2012).
5 “Each year, data are obtained from a nationally representative sample of about 40,000 households comprising nearly 75,000 persons on the frequency, characteristics and consequences of criminal victimization in the United States. Each household is interviewed twice during the year. The survey enables BJS to estimate the likelihood of victimization by rape, sexual assault, robbery, assault, theft, household burglary, and motor vehicle theft for the population as a whole as well as for segments of the population such as women, the elderly, members of various racial groups, city dwellers, or other groups".
Truman, J. (2011), Criminal Victimization 2009, Bureau of Justice Statistics, U.S. Department of Justice.

28
results. For example, the UK Statistics Authority reports that in the UK, the number of unreported crimes peaked in 1995 and has decreased ever since although at a slower rate since 2004 to currently reach its lowest level: according to the 2010/11 BCS report, there is twice as less unreported crimes compared to 1995 which represents 10 million fewer crimes (Ibid).
25. The VS collects not only “subjective” information (perception of insecurity, fear of crime) but also “objective” information: the number of crimes that victims anonymously indicate to have experienced directly or by one of the house members although not necessarily officially reported or claimed to corresponding authorities: VS´s therefore are not only to test interpretations of a perceived reality, but report on actual facts from direct life experience. Matching actual crime incidents with the formally reported ones allows estimating the dark figure of crime, the number of events that victims do not report6.
26. The measurement of the dark figure of crime and the fear of crime have arguably been two of the most relevant steps in supporting evidence-based studies and policies on citizens ´security over the last decades. With the traditional approach based only on police and/or judicial records, policymakers were unable know neither the real evolution of the citizen demands for public safety, nor their “subjective” reasons.
27. More recently, VS´s have evolved to target not only individuals but businesses as well. This new type of VS aims to detect the direct impact of crime in the economic activities and private investments, including the actual costs of crime supported by business units, ranging from small shops to big corporations7.
28. As VS proved the lack of reliability of most police records, shortening the gap between reported and unreported crime began to be recognized as key in strengthening state capacity for fighting delinquency. Therefore, the need for better crime administrative records became a central demand.
29. The more relevant progresses on police reports were developed once the dominant approach on policing moved from the rapid response focus to the prevention of crime. Consistent information about trends, places, delinquents and victims, started to be required as an essential input for more focused and tailor-made preventive plans. Then, the improvement of the quality of police reports, 911 data systems and mapping crime tools, moved up to the top of the reform agenda’s priorities8.
30. Besides police records, other information systems that collect data on crime were also identified as a target for these strengthening efforts. On one side, the prosecutor’s records are strongly linked to those of the police, since both institutions are the key pieces of the same criminal system of the states. On the other side, hospital records register cases of injured people and deaths for external causes (homicide and other violent incidents). Both criminal system and health system are the two main sources of crime data today.
31. The quality of criminal and health records varies from country to country, and crime by crime. Each system (and each institution inside them) collects data for its particular ends, and they usually do not match
6 Sometimes the estimation of the dark figure of crime, as in the Mexico, matches criminal events against not only
those unreported but also those that never reached a state of “investigation proceeding judicial order”. 7 The addition of information collected by home-based VS plus business-focused VS plus census and surveys on
crime-related Public Sector expenditure helps to obtain a pretty complete scope of the actual state of the citizen security and approximate costs of the violence in a territory.
8 The COMPSTAT and other similar systems used by Police departments to analyze and prevent crime, stimulated upgrades in reports, technology, analytical tools, and Police accountability in general.

29
it. So similar events are tracked or valued in different ways and without standards that allows compare data: frequently, incidents registered by one are unknown by the other9.
32. Hence, the main challenges to organize a coordinated response of the State against crime are the improvement of quality of the records in both criminal and health systems, and the reduction of information gaps between them, and also between the institutions of the same criminal systems (police and prosecutors). To the extent of all data sources have advantages and weaknesses, as capacity building projects must improve their respective registries, additional efforts aimed to harmonize those indicators have to be carried out10.
Crime indicators
33. The United Nations Office on Drug and Crime (UNODC), due to a mandate given by the UN members in the late 1970s, is the responsible to systematize and publish international information on crime. UNODC runs a periodical Crime Trend Survey (CTS) that is sent to each country to be filled up with official information. The agency, through its Office of Statistics, has also made a relevant contribution to harmonize VS around the world through a Manual on Victimization Surveys, which, although not mandatory for UN members, has become a forced reference for every organization running this kind of projects around the world.
34. The CTS has tried to be a common framework to collect and estimate crime data worldwide. It has also been useful to reduce a long list of crimes that national statistics reflected according to each country (or state) legal definition, provoking confusions and misinterpretations to compare rates and trends.
35. Nevertheless, those concepts were actually incorporated and used unevenly by the different countries and their institutions. Besides the mentioned technical difficulties in managing public records on crime, some institutional restraints often disrupt the transparency of country official reports. So figures collected by UNODC tables still lack reliability and comparability, and are better to understand collective, regional trends than to know the real situation of crime in a particular country or city.
36. Some types of crime are also captured by the World Health Organization (WHO), from its own perspective and goals. As part of their effort to measure mortality, injuries and other illnesses caused by external causes, WHO records include some crime-related information, particularly on intentional attacks against the life or physical integrity of the individuals. Different numbers for some relevant criminal events, like homicides, are often very significant regarding to the collected by criminal systems, the preferred source used by countries to report data to UNODC11.
9 An injured person after an intentional firearm shot in a report Police can be the same case that the Health records
tracked as homicide once the victim died in the hospital. 10 A best practice, particularly at local levels, is the creation of observatories of the violence where periodically all
the institutions exchange data, case by case, to validate it and analyze in common facts and trends. Colombia has been the country with more progress about (successful experiences can be found in Bogotá, Cali and Medellín).
11 In the case of Brazil, for instance, over the last few years homicide rates collected by WHO have kept around a 25-30 % over the homicide rate reported to UNODC, both by the official national sources, but different. Haiti homicide rate collected by UNODC until 2004 was estimated according to the health system criteria. Since the source switch to Police system numbers go down dramatically: 2010 Haiti homicide rate, for example, is one of the lowest along LAC, similar to Uruguay or Argentina, and 4 times less the rate the country recognized 6 years before.
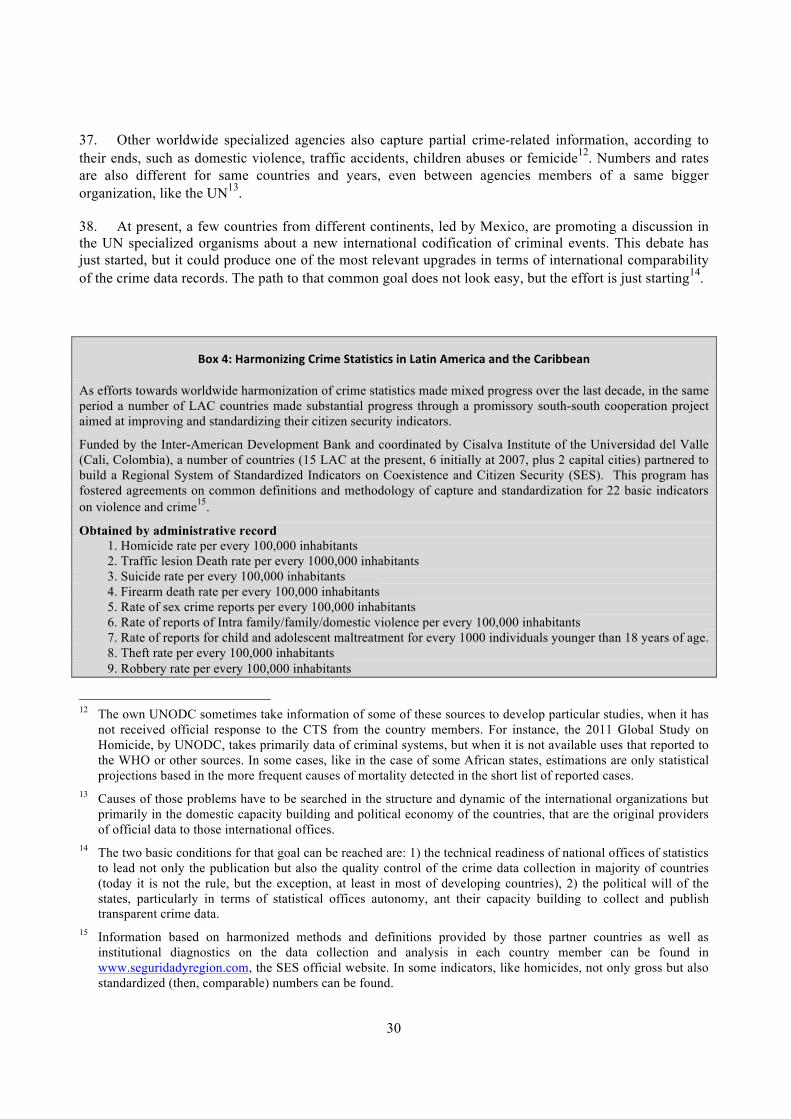
30
37. Other worldwide specialized agencies also capture partial crime-related information, according to their ends, such as domestic violence, traffic accidents, children abuses or femicide12. Numbers and rates are also different for same countries and years, even between agencies members of a same bigger organization, like the UN13.
38. At present, a few countries from different continents, led by Mexico, are promoting a discussion in the UN specialized organisms about a new international codification of criminal events. This debate has just started, but it could produce one of the most relevant upgrades in terms of international comparability of the crime data records. The path to that common goal does not look easy, but the effort is just starting14.
Box 4: Harmonizing Crime Statistics in Latin America and the Caribbean
As efforts towards worldwide harmonization of crime statistics made mixed progress over the last decade, in the same period a number of LAC countries made substantial progress through a promissory south-south cooperation project aimed at improving and standardizing their citizen security indicators.
Funded by the Inter-American Development Bank and coordinated by Cisalva Institute of the Universidad del Valle (Cali, Colombia), a number of countries (15 LAC at the present, 6 initially at 2007, plus 2 capital cities) partnered to build a Regional System of Standardized Indicators on Coexistence and Citizen Security (SES). This program has fostered agreements on common definitions and methodology of capture and standardization for 22 basic indicators on violence and crime15.
Obtained by administrative record 1. Homicide rate per every 100,000 inhabitants 2. Traffic lesion Death rate per every 1000,000 inhabitants 3. Suicide rate per every 100,000 inhabitants 4. Firearm death rate per every 100,000 inhabitants 5. Rate of sex crime reports per every 100,000 inhabitants 6. Rate of reports of Intra family/family/domestic violence per every 100,000 inhabitants 7. Rate of reports for child and adolescent maltreatment for every 1000 individuals younger than 18 years of age. 8. Theft rate per every 100,000 inhabitants 9. Robbery rate per every 100,000 inhabitants
12 The own UNODC sometimes take information of some of these sources to develop particular studies, when it has
not received official response to the CTS from the country members. For instance, the 2011 Global Study on Homicide, by UNODC, takes primarily data of criminal systems, but when it is not available uses that reported to the WHO or other sources. In some cases, like in the case of some African states, estimations are only statistical projections based in the more frequent causes of mortality detected in the short list of reported cases.
13 Causes of those problems have to be searched in the structure and dynamic of the international organizations but primarily in the domestic capacity building and political economy of the countries, that are the original providers of official data to those international offices.
14 The two basic conditions for that goal can be reached are: 1) the technical readiness of national offices of statistics to lead not only the publication but also the quality control of the crime data collection in majority of countries (today it is not the rule, but the exception, at least in most of developing countries), 2) the political will of the states, particularly in terms of statistical offices autonomy, ant their capacity building to collect and publish transparent crime data.
15 Information based on harmonized methods and definitions provided by those partner countries as well as institutional diagnostics on the data collection and analysis in each country member can be found in www.seguridadyregion.com, the SES official website. In some indicators, like homicides, not only gross but also standardized (then, comparable) numbers can be found.

31
10. Rate of automotive theft and robbery per every 10,000 vehicles registered 11. Kidnapping rate per every 100,000 inhabitants 12. Rate of traffic violations under alcohol intoxication per 100 000 people over 15 years
Obtained by surveys 13. Prevalence of sexual violence 14. Prevalence of domestic violence / family / household 15. Crime victimization rate in people over 18 years 16. Percentage of Robbery victimization in people over 18 years 17. Percentage of Theft victimization in people over 18 years 18. Percentage of people over 18 years who perceived insecurity 19. Percentage of people over 18 years who perceived risk 20. Percentage of people over 18 years who perceived fear 21. Percentage of people over 18 years who justify the use of violence 22. Percentage of people over 18 years who have confidence in institutions
In addition to fostering the generation of new standardized data, the project has also supported the creation of multi-sectorial technical units constituted by the different institutions that produce crime data inside each country. Ranging from Police and Prosecutor Offices, to Institutes of Statistics, Ministry of Health and Councils of the Women, those public offices exchange and match their information, finding out the best data available for each indicator. Mexico participates as country member since 2011, led by INEGI. This Institute leads the national system of citizen security information, which includes as part de different institution linked to the production and use of crime data in the country (federal, state, local government). Mexico has engaged actively in supporting other SES countries to run VS through their national offices of statistics, as INEGI has been doing over the last years. At the same time, INEGI has promoted a bigger commitment of all those specialized offices all over the region, that is taking off through a recently new group on Citizen Security statistics created by the CEA (Conference of the Statistics of the Americas), organization that join all public institutes of statistics throughout the region.
Since most of the country members do not run systematically VS yet, the main achievements of the project rest on the strengthening of administrative records. Nevertheless, even in this field, many differences can still be found in the reporting to international agencies (UNODC, OAS, WHO). Country members and the project strategic partners (UNODC, OAS, SICA) have set this gap as one of their priorities to overcome16. Meanwhile data reported to the SES is just the best available on those indicators for those countries17.
Justice indicators
39. There are several types of international indicators on justice administration. Some indicators aim to measure performance and outcomes, such as the quality of justice, governance and the rule of law. Others focus more on the institutional and policy process and procedures and aim to measure the quality of governance in terms of how outcomes are achieved, as well as the inputs and outputs necessary to achieve these outcomes.
16 Those gaps are caused by technical reasons like lack of timely update or differences in the estimation of total
population (so an equivalent number of cases can be linked to different rates per 100,000 inhabitants). But there are likely other non-technical motives to explain under-reporting: weak or blur definitions about the requested data sometimes allow the countries filling up the forms with partial, incomplete figures.
17 The short list of indicators does not include a number of relevant figures needed to describe the citizen security situation of the countries. For instance, Police and Penitentiary resources or rates of recidivism. The Organization of the America States (OAS) collects a wider list of indicators for the total of OAS country members. Those indicators can be found in www.alertamerica.org. Data quality of each indicator is uneven, because the data submitted by the country is restrained by the similar limitations mentioned above for the UNODC or other international organizations.

32
40. These types of indicators tend to be based on different approaches to data collection (although can combine different types of measurement). The assessments of justice performance and outcomes are most often based on opinions of the general public and of qualified experts. The indicators based on expert polls have the advantage of providing cross-country comparability, but suffer from being based on the opinions of a relative limited number of experts per country. Data from population opinion polls are in turn based on perceptions which tend to be inherently subjective, yet they may often be more meaningful than objective data, especially when it comes measuring the public trust in justice institutions.
41. Process, input and output indicators are, in turn, often measured using administrative and qualitative data generated by the institutions. These types of indicators aim to provide concrete guidance to policy makers on what works or not and help them make concrete improvements in specific policy areas but may not necessarily provide the end user perspective or an assessment of the justness or effectiveness of the justice system.
42. Some of the main examples of justice indicators, which represent these different approaches, are presented here. The European Commission for the Efficiency of Justice (CEPEJ) focuses on evaluating efficiency of judicial systems by focusing on the institutional means, such as the legal, regulatory and institutional frameworks necessary to achieve justice performance based on the administrative and qualitative data provided by 49 member states of the Council of Europe (via Ministries of Justice).
43. Indicators have been selected on the basis of what is considered relevant for states who wish to assess the judicial systems’ situation and better understand the functioning of their own systems. Biennial assessment exercises gather and compile administrative (quantitative) and qualitative data from member countries and are peer-reviewed by experts from CEPEJ. The latest 2010 evaluation scheme (based on figures from 2008) comprises more than 100 performance indicators related to budgetary data, procedures related to access to justice, organisation of the court system, safeguards to ensure fair trial, career and status of judges and prosecutors, lawyers, alternative dispute resolution mechanisms, enforcement of court decisions, notaries, court interpreters (for more detailed information see Table 1.1). The national answers also contain descriptions of the judicial systems and explanations. The results of the data collection analysis are validated through peer review by an Expert Group as well as by non-governmental stakeholders (e.g. professional associations of judges and lawyers).
44. This set of indicators aims to provide policy-makers with concrete benchmarks and indications of the possible deficiencies in their justice system that may allow taking targeted and timely action. Yet, as noted, these types of indicators provide only a limited understanding regarding the effectiveness of justice systems and the actual impact of reforms in this area.
Table 1.1. Scope of Coverage of CEPEJ Evaluation of the Judicial Systems (2010)
Public Expenditures: courts, prosecution system and legal aid
The focus is on public budget allocated to the courts, public prosecution services, and the legal aid system
Access to justice This variable includes description of the various types of legal aid, budget, conditions for granting legal aid, court fees, taxes and reimbursement as well as revenues of the judicial system
Users of the courts: rights and public confidence
The focus is on the institutional and policy provisions regarding the supply of information to the court users, protection of vulnerable persons, and role of the public prosecutor in protecting the rights or assisting the victims of crimes, compensation procedures as well as the mechanisms for assessment of the satisfaction of users.
Courts The variable includes court organization, budgetary powers within courts, information

33
and communication technology in the courts and evaluation of quality and performance of the courts
Alternative Dispute Resolution (ADR)
The variable includes a description of different forms of ADR, including mediation, arbitration and conciliation
Judges This variable compares the types and number of professional judges, including those sitting occasionally, non professional judges, as well as trial by jury and participation of citizens
Non-judge staff This variable includes information regarding the number and distribution of non-judge staff, and Rechtspfleger
Fair trial and court activity
This variable is composed of the data regarding provisions for legal representation in court, possibility to challenge a judge, as well as the number of cases related to Article 6 of the European Convention on Human Rights, civil (and commercial) litigious and non-litigious cases at first instance courts, land register cases, business register cases, enforcement cases (non-criminal litigious cases), administrative law cases, criminal law cases (severe criminal offences) and misdemeanour cases (minor offences) at 1st instance courts. It also includes the clearance rate for the total number of non-criminal cases and discusses issues related to comparing case categories, such as procedure and length and measures to increase the efficiency of judicial proceedings
Prosecutors The focus is on the number of public prosecutors, persons with similar duties and staff, their role and powers and case proceedings managed by public prosecutors

34
Status and career of judges and prosecutors
This variable focuses on the institutional and policy procedures in place regarding recruitment, nomination, training, career, bonuses and other profits of judges and prosecutors, as well as disciplinary proceedings and sanctions
Lawyers This area includes data regarding the number of lawyers, organisation of the profession and training as well as practices related to the legal profession
Execution of court decisions
The focus is on the execution of court decisions in civil, commercial and administrative law as well as in criminal matters
Notaries The variable describes the provisions regarding the status, number and functions of notaries, as well as supervision of the profession
Court interpreters The variable includes the number of court interpreters, their title, function and quality, as well as the selection process by the courts
Judicial Reforms This variable provides the description of some of the current trends in judicial reforms
Box 5: How is the CEPEJ survey administered?
The CEPEJ survey has been conducted biannually since 2002 and the 5th edition will be published in September 2012. Each Council of Europe member country nominates a national correspondent who is ultimately responsible for data provision and data quality. National correspondents do not fill out the survey on their own, but distribute it to officials in different parts of the country’s justice system, who provide the responses to different parts of the survey. At the end of the process the national correspondent is responsible for the consolidation of the country’s responses.
The survey has more than 200 items and it takes 6-8 months to fill out. It is more strenuous in federal countries where state level data have to be collected and summarized as well.
Data cleaning is carried out by various statistical tests by the CEPEJ Secretariat and its results are reviewed in detail by the Evaluation Working Group of CEPEJ and unresolved issues are referred back to the national correspondents.
Data is entered into a database that is available for free to all participants and the general public. A separate printed edition of biannual survey results is also produced.
CEPEJ also carries out special reviews of the data collection methods and data quality in member countries upon request.
There are several observer countries to the CEPEJ, including Mexico. Joining the data collection exercise by non-European Council member countries is welcomed by CEPEJ. However, the terms and conditions of such an association have not been established yet.
Expert views and composite indicators: the Rule of Law Index
45. The World Justice Project designed the Rule of Law Index as a quantitative tool to assess a set of outcome-oriented indicators on the rule of law from the perspective of the ordinary person. It examines practical situations in which deficiencies in the rule of law may affect the daily lives of ordinary people by collecting their views across 66 countries. More specifically, the index aims to provide a picture of where countries stand with regard to a number of outcomes that rule of law societies seek to achieve, including access to justice (Box 6).

35
Box 6. Dimensions of the WJP Rule of Law Index
1. Limited Government Powers measures the extent to which those who govern are subject to law. 2. Absence of Corruption measures three forms of corruption: bribery, improper influence by public or private
interests, and misappropriation of public funds or other resources. 3. Order and Security measures how well the society assures the security of persons and property and
encompasses three dimensions: absence of crime; absence of civil conflict and absence of violence to redress personal grievances.
4. Fundamental Rights covers effective enforcement of laws that ensure equal protection; freedom of thought, religion, and expression; freedom of assembly and association; fundamental labour rights (including the right to collective bargaining, the prohibition of forced and child labour, and the elimination of discrimination); the rights to privacy and religion; the right to life and security of the person; and due process of law and the rights of the accused.
5. Open Government measures the extent to which laws are comprehensible, sufficiently clear and publicised to the general public.
6. Effective Regulatory Enforcement concerns the fair and effective enforcement of administrative regulations. 7. Access to Civil Justice measures whether the system is affordable, effective, impartial, and culturally competent
and whether it provides for fair and effective enforcement. 8. Effective Criminal Justice measures whether the system is capable of investigating and adjudicating criminal
offences impartially and effectively, while ensuring that the rights of suspects and victims are protected. 9. Informal Justice is concerned with systems of traditional, tribal, and religious courts, as well as community
based systems -- in resolving disputes.
46. The index is based on the new data specifically collected by the World Justice Project. It includes 9 factors and 52 sub-factors, which were identified in consultation with academics, practitioners, and community leaders from across the various countries. The data is collected through a set of five questionnaires, which were adapted to reflect commonly used terms and expressions. The dataset is mainly drawn from two sources:
(i) A general population poll (GPP) carried out every three years. This is conducted by leading local polling companies using a probability sample of 1,000 respondents in the three largest cities of each country. The GPP is administered in the local language, either via phone, online or face-to-face.
(ii) A qualified respondents' questionnaires (QRQ) administered on a yearly basis in each surveyed
country and completed by in-country experts (2,000 as of 2011) in civil and commercial law, criminal justice, labour law, and public health, consisting of closed ended questions completed by in-country practitioners and academics with expertise in civil and commercial law, criminal justice, labour law, and public health.
47. In addition, some third-party sources provided in 2011 information to capture specific structural rule of law situations (e.g. terrorist bombings and other battle-related deaths). Finally, the findings are cross-checked with existing domestic and international data sources and legal resources.
48. As mentioned, this type of approach generates valuable comparable data which can be used to obtain insights on the overall functioning of justice and broader rule of law institutions in practice, from the perspective of users of the justice system and other citizens and stakeholders. Yet, one needs to keep in mind some limitations in using this index for cross-country comparison, including different perceptions of the rule of law and performance of justice across cultures, different legal architectures, values and views, as well limitations of sampling and stakeholder selection mechanisms.

36
The territorial dimension of crime and security
49. Crime has distinct geographical patterns and national averages often mask strong differences within countries. Murder rates in the State of Chihuahua (77 murders per 100,000 inhabitants) were 25 times higher than in Yucatan and Hidalgo. Similarly, wide differences are observed across regions in different OECD Countries.
50. The geography of crime can be highly dynamic over time and in space. In the case of Mexico, for example, crime activities were clustered in neighbouring states until 2002 with an increasing dispersion in the most recent years. However, over the past twenty years, murder crime rates have been high and tended to occur in north-western states such as Chihuahua, Baja California Norte, Sinaloa and Sonora, next to the Pacific Ocean and the Gulf of California. Murder rates in other states such as Tlaxcala, in the centre, and Yucatan, in the Peninsula, have remained well below the national average for the entire period (around the Canadian national average). Similarly, United States presents a spatial clustering of murder crimes and property crime rates; the latter concentrated in the Southern States.
51. Property crimes tend to be concentrated in the cities, and reported property crimes tend to increase with regional per capita GDP. A similar relation is found among regions of other OECD countries such as Canada, France, Italy, Poland and Turkey. However, in the case of Mexico unemployment and youth unemployment are significantly associated with crime activities in states.
52. Even though regional differences are important in crime activities, it is often difficult to measure them satisfactorily and to identify what socio-economic, institutional and cultural conditions are associated or responsible for crime. First, there are important differences in the definition of crimes that limit international comparison. Second, there is a difficulty to gather robust data. Research demonstrates that a large number of crimes are never reported. Third, reporting by citizens and business is linked to issues of public trust, integrity in the public sector and perceived cost associated with criminal process, making the causality links fuzzy. Finally, the interpretation of crime factors can be difficult if the offences and other socio-economic variables are not available at the geographical level required to produce evidence on the causes of crime activity and not only on the effects. A recent analysis by INEGI, for example, shows that only by geo-referencing crime activity and socio-economic conditions it is possible to provide indications to public authorities on how to intervene to reduce property crimes in the city Aguascalientes (INEGI, 2012).
53. The territorial dimension of crime activity, thus, requires coherent policies across levels of government and government bodies. The multi-level governance issue is particularly important not only because states have wide powers in the organization of police and courts of law, but because, given the strong local dimension of crime, the alignment of policy objectives across levels of government is essential to increase the effectiveness of prevention and security policies.
54. Practices in OECD countries show that national policies to reduce illegal activities can be more effective if coordinated with empowered local authorities and involvement of local community. Conditions, instruments and actors to correctly coordinate wide policies with bottom-up practices can be different depending on the capacity of local governments, the transparency and accountability of practices etc. National and local governments should put in place a process to identify the major coordination gaps and adapt instruments to overcome them.
Box 7: Monitoring Police Performance in the United Kingdom
Since April 2009, Her Majesty’s Inspectorate of Constabulary (HMIC) is responsible for monitoring police

37
performance in England and Wales and for tackling instances of underperformance. HMIC monitors and reports on forces and policing activity with the aim of encouraging improvement. To this end, the HMIC has developed a Police Report Card framework (formerly known as a Rounded Assessment and also referred to as Banding Analysis) for monitoring and assessing Police Performance -‐ in line with the 2008 Policing Green Paper “From the Neighbourhood to the National: Policing our Communities Together” and the Home Office’s subsequent response “The New Performance Landscape for Crime and Policing” (Audit Commission and HMIC, 2010). In 2009, this Police Report Card framework also contributed to the inspections of police authorities in England and Wales undertaken by Audit Commission, the Wales Audit Office and HMIC.
The Police Report Card requires periodic updates throughout the year (Suffolk Police Authority, 2009) and adopts a “balanced scorecard” approach, which analyses individual police force performance against itself over time and compared with peer police authorities. The assessment covers the following domains:
• Confidence & Satisfaction - includes satisfaction indicators and perception indicators and contains indicators that are based on the results of British Crime and User Satisfaction surveys carried out by forces.
• Local Crime & Policing - includes data on crime, sanction detection and offences brought to justice for acquisitive crime as well data for low level violence against the person (other wounding) and road traffic casualties. These indicators are based on recorded crime.
• Protection from Serious Harm - is based on recorded crime and includes indicators for violent crime (e.g. gun and knife crime) and sanction detections and offences brought to justice data for serious violence and serious sexual assault.
• Value for Money – based on a range of benchmarking profiles, showing whether each force is spending more or less than the average (and other benchmarks) on particular activities such as HR, crime investigation or response to calls for service. These profiles are used to point to opportunities for efficiency gains, and support local decision-making in this area (HMIC, 2010).
The assessments are done at the central level for 43 police authorities across the country and are shown with reference to a most similar police group. They can range from “poor”, where the force is not meeting the required national standards or is not delivering an acceptable level or quality of service, to “excellent”, for exemplary service provision which consistently exceeds national threshold standards or normal expectations (HMIC, 2011).
The assessments provide information regarding the state of police performance to enable focused improvement efforts. For example, a 2010 report that drew from the Police Report Card highlighted that most of the police authorities inspected are effective in scrutinizing everyday performance and holding their police forces to account in delivering policing priorities (Audit Commission and HMIC, 2010). Yet, it was highlighted that more needs to be done to ensure a clear and sustained focus on value for money and collaboration.
The reports also highlight persisting challenges in the assessment process, including the need for greater clarity of data as well as complexity and high level of detail of the current approach, which may compromise the ability to undertake a meaningful assessment and improvement of performance. In light of these challenges, the HMIC assessment framework is currently undergoing a review.
55. In this sense, it is essential for evidence-based policymaking in security and justice to have a strong territorial footing. In the case of Mexico, this should start by generating data and evidence at the State level. Mexico’s statistical and analytical capacity should be mobilised at the national and state levels to improve security indicators, including better ways to integrate objective and perception measures of the effectiveness of the judicial system and law enforcement by states. In addition, capabilities to use this information for policymaking should be also developed at the state and local level.

38
1.3 The state of the game in Mexico
1.3.a. Security and justice in Mexico
56. There is no doubt that crime is a pressing reality and a great concern of the Mexican people. In opinion surveys, nearly 40% of the population identifies crime as the most important problem of the country, above the Latin American average (28%) and well ahead of the European average (10%). Official data partly justifies this concern, as the homicide rate in Mexico reached 20 per 100,000 in 2011, very close to the LAC average that in turn exceeds all other regions of the world. This figure is the result of a sharp rise in violent crime in the last 5 years, when the homicide rate nearly doubled, mostly pushed by executions related to organized crime. While other crimes, like robbery and theft, have grown at a more moderate rate, the exposure of the population to crime is very high, as nearly a quarter of them declared having been the victim of a crime in 2010, and 36% of households having at least one victim of crime in the same period. Worse still, nearly 40% of people think that the problem of crime, when evaluated at national level, will worsen in the near future against less than 20% that expect it to improve.
57. Victimization studies indicate that an overwhelming majority of crimes in Mexico are not reported. More specifically, the Mexican Institute of Statistics, INEGI, estimates that 93% of crimes are not declared at all or are not investigated (INEGI, 2011). Those that do not denounce crimes allege that it is because it would be a waste of time or because they do not trust authorities. This is in turn reflected in people´s appreciation of the key institutions in charge of security and justice. According to the same INEGI survey, trust in the police has been decreasing. Latest data from 2011 show on average only 41% of citizens trust the state and local police. Trust in public prosecutors and judges follow the same trend.
58. Responsibilities to fight crime and administer justice in Mexico are distributed among a rather large number of institutions, many of these at the sub national level. The police are organized at the federal, state and municipal level, with different responsibilities concerning prevention and investigation. All the police institutions add up to some 450,000 police officers and agents. Sometimes judiciary police and financial investigators are included in this account. The largest numbers of police officers are found at the state level (45%), followed by the municipal level (40%). The organization of the judiciary also mirrors the federal structure of the country, including prosecutor offices at every state, in addition to the federal level.
59. Some describe this system as highly fragmented, motivating several efforts in recent years to improve strategic direction and coordination, like the creation of the Federal Secretariat of Public Security, the National System of Public Security and the National Council of Public Security, among others.
60. One important initiative in this direction is judicial reform. In 2004 Nuevo Leon became the first state to implement oral trials for some kinds of criminal offenses. Following suit, in June 2006 the northern state of Chihuahua became the first in Mexico to enact a comprehensive reform to its code of criminal procedure and its secondary legislation and, on January 2007, became the first state to implement such reforms. Nonetheless, reforms to actually transform Nuevo Leon’s criminal justice system have stalled, and today, only Chihuahua, the State of Mexico and Morelos have in operation in its entire territory the initiated reforms. While progress has been piecemeal, these experiences proved wrong those who thought that an oral adversarial criminal justice system was inappropriate for Mexico.
61. Responding to these state efforts and of the increasing attention that NGOs, law fora, academic institutions and the public opinion placed over the enormous need for a profound transformation in the country’s penal justice system, a major judicial reform was passed in 2008. This was aimed at replacing a mixed prosecutorial-inquisitorial system with a modern adversarial system with oral trials. The reform sought to equilibrate the conflicting parts, the accused and the victim. This involved ensuring that the rights of the accused are respected, guaranteeing transparency and due process, while at the same time

39
protecting the victims. The reform also created new alternatives for resolution, including conciliation and mediation. The reform also concentrates the responsibility of judges as guarantors of due process and on issuing sentences.
62. The reform of 2008 was designed to be implemented in a gradual way, developing the human capital, the administrative systems and the infrastructure to sustain change, with full implementation in all states planned for 2016. This resembles to a great extent the Chilean reform of 1998-2005 (Box 8). Half way through the transition, however, only seven states (Chihuahua, Oaxaca, Durango, Zacatecas, Estado de México, Morelos and Baja California) were at the stage of implementation in at least one of their judiciary districts, while another 18 were at some intermediate stage and the remaining seven were at an initial stage.
Box 8. Judicial reform in Chile
At the end of the 1990s the Chilean Congress passed a crucial reform to the penal system. This was aimed at replacing an inquisitorial, document-based system whereby the same judge investigated and ruled a case with an oral system with separate representation of prosecution and the defence. To this end, a prosecution system (Ministerio Público) was created, as well as state defence agency. As court rulings would be issued by a tribunal of three judges, the judiciary service also had to be substantially enlarged. The reform was introduced gradually, by region, over a 6-year span, giving time to create the new institutions, select new staff, train judges, prosecutors and defenders, build court facilities, improve the administration of the judiciary, and adapt procedures. Despite all the plans for implementation, transition had to be extended twice and the whole cost of the reform exceeded initial estimates substantially. Overall, personnel of the judicial system grew 400% as a result of the reform and public spending in justice administration increased even more. The preparation of the reform included building a series of indicators to monitor judicial performance. A pre-reform baseline was built to assess progress and performance against expectations. Despite all the costs, the Chilean reform is considered largely successful, as the speed and quality of penal processes improved substantially. This provided the basis for subsequent, successful reforms to family and labour tribunals that extended judicial reform until today.
63. Partly to support the judicial reform, but also as a response to the escalation of crime, the Federal Government of Mexico has substantially increased the resources for security and justice. According to the Executive Secretariat of the National System of Public Security, funding for this purpose grew by 350% between 2008 and 2011. But with a large share of the police force organized at the state or municipal levels, and courts and prosecutor offices responding to the country´s federal structure, it is evident that a substantial part of the success – or absence of it – in improving the security levels in Mexico and the perception population has on this regard depends of the effectiveness of security and justice policies at the level of states. In addition to changing criminal justice administration, professionalizing and providing tools and knowledge to actors in the states, strengthening forensic capabilities and creating investigation protocols are key complementary tasks.
1.3.b. Knowledge generation, research, policy analysis
64. The importance of crime and violence as a phenomenon is so high in Mexico that many professionals and institutions have set to investigate the issue. A recent account indicated that more than 50 non-governmental institutions – think tanks, academic institutions, NGOs – in Mexico and abroad have established programs to study it and contribute to its solution in one way or another.
65. Similarly, diverse Mexican institutions have devoted a great effort at generating and analyzing crime-related data. These efforts range from INEGI´s new victimization survey to the program of research on CIDE on crime at its causes. Statistics are generated and disseminated not only by the statistics institute.

40
Some indicators include CIDE´s survey on the economic, social and cultural reality of local crime and violence (Ersecvid-CIDE) in three municipalities; the National Survey on Insecurity (ENSI) by the Citizens´ Institute of Studies on Insecurity (ICESI), created by a consortium of five universities and business organisations; and several attempts at compiling and synthesizing security indicators, as the Crime Index of CIDAC, a think tank, and México Evalua, a research centre, among others.
66. Facing a dramatic scenario of violence and organized crime, Mexico has arguably become the faster country in the world in stepping up means to measure crime and disseminate knowledge about it. However, more progress has been made in capturing data through surveys than in drawing it from administrative records. Municipal and State Police, Prosecutors and, in general, local and state offices, have still a number of difficulties to collect and process accurate information18. In general, the health system shows better data quality in those subnational levels. Nevertheless, five achievements in the treatment of crime data by Mexico must be highlighted:
1) A new institutional arrangement has recognized to the national Institute of Statistics and Geography (INEGI) as the top instance of a national system of crime data collection. It means that all levels and jurisdictions of Government recognize INEGI as the authority to define, collect, organize, supervise and publish the crime data, no matter which office is the primary responsible to produce it19. This has allowed Mexico to overcome some jurisdictional disputes that compromised the quality and timeliness of crime data. Although the process is far from finished, progress in establishing a national, integrated system is evident20.
2) A progressive improvement in administrative registries in terms of quality and comparability. Seeking the cause of the difficulties to compare records between the states and between institutions inside each state, INEGI detected the fact that about 1400 types of offences are defined by the Federal and subnational penal codes. The conversion of that legal-based data into a unified, brief statistical-shaped typology is well on course, after a multilevel process of discussion with producers and users of the data. As a part of this process, a 41-crime incident statistical codification (organized according to 7 types of goods affected) was built by the Institute and has begun to spread all over the country. On this basis, federal and state institutions will make a double recording of incidents: on one side, according to each institutional definition and ends; on the other side, fitting data to the INEGI statistical matrix21. As the implementation of this new model goes forward, improvement in
18 Those problems are harder in the areas challenged by drug cartels, where organized crime is overcoming the
capacity of the State response, even in the world of the scientific collection of evidence and the statistical follow up of their criminal actions.
19 The INEGI responsibility includes the top public management of the data production and delivery on Government, Public Security, Provision of Justice and Prosecution. The main federal counterparts are, respectively, the national Ministry of Finance, Federal Police, Council of the Judiciary and the General Prosecutor Office. They coordinate committees where the subnational actors of each sector are represented.
20 The last update of 2010 homicide data, for instance, show a high increase in the final numbers, originated in the insufficient quality control (and delay in confirmation of events) of the original published data. Once INEGI could carefully double-check the information, state by state and municipality by municipality, a big number of previously unregistered cases could be captured by the statistical systems. So, the 2010 homicide rate moved from 18.1 per 100,000 inhabitants (UNODC, 2011) to 22.76 per 100,000 inhabitants (INEGI 2012, SES 2012). The number of homicides recognized by the Mexican statistics for that year increased from 20,585 to 25,757.
21 This code is being proposed by Mexico to UNODC as a model for an international debate in order to homogenize statistical definitions. Unlikely the SES intention, whom Mexico is also member, that is focused in a short list of common indicators about a few main criminal events, the INEGI proposal seek a short list but able to include all criminal events. The feasibility to reach so wide consensus in a worldwide unified table is unlikely to be reached in a short time, but it is good news the beginning of the discussion.

41
each institution’s quality of records is the most urgent challenge for the Mexican agenda on criminal data22.
3) A high quality Public Security Census, collecting the most complete information about the sector
resources in all the levels of government, ranging from federal to state and local governments, and from police to prosecutor and all public offices related to this public service. The Census contains information (available or just in progress) provided by 120,000 crime-related public offices, captured by federal (2012), state (2010, 2011) and municipal (2009, 2011) levels of government censuses. A 2012 National Survey on Quality of Government, whit accurate data on the quality of Justice and Public Security services, also offers very useful information about the system.
4) One of the most advanced and complete victimization surveys around the world, in terms of
accuracy of the questionnaire, sample size and timeliness. Actually, there are no one but three tools to capture victimization and perceptions on citizen security, running periodically in Mexico: the ENVIPE (an annual National Survey on Victimization and Perception of Public Security23), the ECOSEP (a monthly fast survey on perception of Public Security, that includes a fear of crime follow-up question) and the ENVE (a new victimization survey applied to corporations and businesses). Although Mexico had implemented victimization surveys over the last decade, the new ENVIPE 2012 has leveraged the quality, sampling and reach of the surveys, until convert its model in a best practice at the international level.
5) Engagement with the main regional and international projects and institutions aimed at improving
the quality and comparability of data. Particularly, the incorporation to the Regional System on Standardized Indicators of Coexistence and Citizen Security (2010), the release -in partnership between INEGI and UNODC- of the Centre of Excellence on Victimization for Crime Statistics on Governance, Victims of Crime, Public Security and Justice (2011)24 and the proposals taken to the UN Committee of Statistics about the involvement of national offices of statistics on crime data collection, and about the development of an statistical crime data international codification.
67. Still, some weaknesses may lie at the base of the security and justice system that compromise not only the effectiveness of policies, but also the reliability of the data. The imbalance between the capabilities of the different parts of the justice chain (police, prosecutor, public defense, and the judiciary) raises both a governance issue and a key question: where to improve the complete process of data management through the criminal chain. The police are a major concern in this respect. Limited capacities and motivation of police officers at the local level to enter data into information systems have led prosecutors to undertake such a role, becoming de fact responsible for classifying and quantifying criminal incidents. However, this has fed back into a vicious circle as the incentives to collect and use data by the police corps has further eroded, making statistics and mapping dependent upon the technical skills and honesty of politically committed officials. Judicial reform may act as a catalyst to improve the coordination between the different actors of the security and justice system. In the shadow of this reform especial efforts
22 That improvement not only is dependent of the technical assistance for better capture and validation of data, but
also of a bigger people confidence on Police and institutions in order to increase the rate of reported crime. 23 Although Mexico has been implementing VS over the last decade, the new ENVIPE, now run by the INEGI, has
meant a relevant upgrade from the size of the sampling (78K homes in 2011, 94 in 2012, a very significant sample in the compared international experience) and quality (for example, a new detailed check-list card of crime events was added to remember the respondent possible incidents of crime against him or her, what impacted in a very higher number of people and crime events finally collected with regard previous surveys).
24 The effort of the Centre of Excellence in order to improve the measurement of organized crime is one of the most relevant projects in progress. A recent International conference organized in Aguascalientes by this Centre showed important progresses about. This knowledge is key to understand the actual evolution of crime in Mexico.

42
should be made at building the capacity in the police for data management through the criminal chain. This support could include technical assistance to clarify concepts, and to ensure that a sound system of crude data collection is available; subsequently to organize data correctly, and to produce basic statistics for analysis. Eventually, balanced parameters on security could be obtained and combined in an indicator basket for several purposes: to increase transparency, to improve management, to allow performance evaluation, etc.
1.4 Towards a conceptual framework for building a set of indicators on the performance of security and justice in Mexican states
68. Section 2 described the OECD approach to evidence-based policymaking as comprising four elements: (i) generating meaningful data; (ii) transforming data into actionable evidence; (iii) using evidence to support policy decisions, and (iv) disseminating evidence for mobilising stakeholders and accountability. This section is devoted to the first of these elements. In particular, we will discuss how indicators can be organized to provide a good basis for assessing the performance of states on security and justice.
69. Improving reliability and comparability of crime data has become a key issue in the public agenda in Mexico. This includes the need of spreading high quality, periodic victimization surveys and more accurate and timely public records on crime. In August of 2011 a congress of Mexican security and justice specialists concluded that:
“The first component of a policy of State in this field should be to draw on a broad, transparent and participative diagnosis. No tool is as powerful in this process as the generation of timely and accurate information over the functioning of the diverse subsystems of security and penal justice.” (UNAM, 2011)
70. Both countries and international institutions face common challenges in this field: more accurate reports, better inter-institutional coordination and data matching, development of minimum standards to compare data (and/or better disclosure of sources and features of their figures), tougher requirements of accountability and data quality control, progressive elimination of overlapping and -last but not the least- better investment in human resources and technology, particularly oriented to integrate and geo-reference databases.
71. The most advanced countries moved to improve information on security and justice some three decades ago. But their efforts have not been sufficiently accompanied by worldwide initiatives to strengthen data for internal and cross-country comparisons. Since crime has begun to show more transnational components and links it is vital to step up efforts at upgrading the systematization and comparability of crime statistics.
72. LAC countries are making substantial efforts in this direction through projects like the IDB sponsored SES featured in Box 4 above. One of the countries that are most committed to this effort is Mexico, whose efforts at institutionalization, investment and development of new high quality tools for measuring crime are putting the country in a leading position in the matter.
73. The main problems of Mexico relate to the quality of the administrative registries at the local and state levels. Fortunately, they have been targeted as priority in domestic technical discussion between the INEGI and the network of producers and users of that data, particularly police and prosecution units. Undoubtedly, collecting data of multiple homicides or from hidden graves, originated by the organized crime, are not easy problems to solve, as they exceed the regular Public Sector technical capacities.

43
74. As this work develops, high quality VS and Public Security Census are already being implemented successfully. Besides such domestic advances, relevant contributions to the international debate are also being made by the country.
75. But evaluating the effectiveness of governments’ security policies -- and the capacity of criminal justice systems in implementing and enforcing these-- is a complex undertaking, requiring consideration for a number of co-existing and inter-related factors. Merely identifying the unit of analysis (e.g. the performance of whom?) and attributing results to particular government institutions and their actions can be a challenge in the face of the multitude of layers/tiers of actors involved. The fiscal and managerial evolution of security policies from national government organisations to regional and local governments, while necessary to improve the responsiveness and efficiency of these, creates in turn a complex “eco system” of overlapping competencies for researchers and policy makers to dissect. Increasingly, even non-governmental actors such as community groups and volunteer organisations play important roles in preventing and combating crime. Measuring their varied, and often unaccounted for, contributions to security outcomes can pose an additional challenge for researchers. A useful performance framework therefore should set out to address the important reality of multi-level governance. Indeed, certain kinds of criminal activities, such as organised crime, often exploit porous borders and co-ordination gaps between government entities in order to flourish.
76. A second challenge in developing a useful construct for performance measurement is establishing linear or causal links between criminal justice institutions’ capacities, their practices and policies, and their impact on crime and security (e.g. the performance of what?). The model adopted in this preliminary study is one utilised by the OECD in measuring the performance of public administrations; beginning with the inputs invested, to examination of the outputs and outcomes achieved. Government outlays or transfers destined for criminal justice institutions (police, prosecutors, judges, forensic experts and penitentiary and correction officers) can provide one indication of their capacity to achieve the desired results. In turn, these capacities and resources are invested into the implementation of policies and management practices designed to effectively target specific policy objectives. These “processes” can be internal to the organisations themselves (such as HRM policies to attract and retain the most competent professionals, integrity policies to prevent corruption of judges and police, ICT systems or ADR procedures which improve case management and processing, practices for promoting inter-agency cooperation, etc.) or outwards-facing policies intended to have a more direct impact on security (e.g. legislative reforms, crime prevention strategies and communications campaigns targeting youth or other segments of the population, intelligence gathering, rehabilitation strategies for inmates, etc.) Ultimately these processes are designed to reduce the incidence of crime, as well as increase citizens’ and firms’ perceptions of security and (to the extent possible) trust in criminal justice institutions. Perceptions of positive performance on the part of criminal justice institutions may raise voters’ and businesses’ proclivity to continue investing in this common public good, creating a positive feedback loop for continued inputs.
77. In addition to permitting researchers to map out the different actors and elements that contribute to overall performance, a second benefit of the OECD’s “production chain” model is that it allows policy makers and researchers to examine two key dimensions of performance: effectiveness and efficiency. The first (effectiveness) through analysis of agencies’ outputs in their own right and secondly through analysis of the outcomes achieved with the given resources (efficiency).
78. From a comparative perspective, this allows for benchmarking of national/sub national governments, or, with sufficient data, the evolution of these two dimensions over time. Better performing nations or states can offer good practices which can be transferred and adapted elsewhere. Such an approach also facilitates the policy design and evaluation process, by permitting decision-makers to adjust resources and policy levers according to changing results.

44
Figure 1.6. Working conceptual framework for performance
Source: OECD Government at a Glance framework.
79. The proposed framework is not immune to a number of methodological issues however. While the progressive nature of the model may imply causality between these variables/categories, it is certainly not always the case. In instances of correlation, for example, the direction of the causality is not always so clear requiring time-series data and regression analysis for further insights. Second, and particularly in the evaluation of crime and security policies, externalities and contextual variables have a heavy influence across each element of the chain. For instance, there are several factors which may influence citizens’ perceptions of safety other than the prevalence of crime, and some crimes have more of an impact than others. To provide a second example, the types and nature of legal codes affect directly case processing times and the punitive measures imposed (which can influence over-crowding in prisons for instance). Finally the model rests on the availability, quality and comparability of the underlying data itself. For instance, of the 55 variables initially selected for this study, only about half were deemed reliable enough to be included for analysis either because of a high number of missing values, data being outdated, comparability and low confidence in the data sources.
80. These and other issues will be discussed in greater depth in the following chapters, allowing for the identification of further research issues and recommendations for improving measurement.
1.5 The evidence-based policy framework applied to the relationship between security and competitiveness in Mexico
81. The OECD approach to evidence–based policymaking depicted in section 1.2.6 may be applied not only to the broader analysis of security and justice policies but also to some specific aspects of it. One

45
aspect that is particularly important for Mexico as an emerging country that needs to grow and reduce economic inequity, is the relationship between security and competitiveness.
82. In Mexico four out of five individuals who have been victims of crime change their behaviour and activities permanently (IMCO, 2006). This fact has a transcendental impact in the economy, affecting the productivity of labour and the number of work days lost because of crime. Even more importantly, exposure to crime changes consumption patterns and business tolerance to risk with a direct impact on a region´s economic growth and competitiveness. For this reason the improvement of public safety conditions within a region is not only the interest of governments but also very importantly of non-government stakeholders, most importantly the business community.
83. The World Economic Forum defines competitiveness as the “set of institutions, policies, and factors that determine the level of productivity of a country” (WEF, 2010), another alternate definition is; the ability of a country or region to attract and maintain investment and talent (IMCO, 2011). With these definitions it should be clear why lower levels of public safety for both individuals and property would lead to a lower overall competitiveness either at the national or regional/state level. In an increasingly globalized world firms should encourage and foster competitiveness with the intention of increasing their overall productivity and be able to better compete in world markets.
84. So far most of the research of regarding the relationship between competitiveness and security has dealt with the existence and fulfillment of clear laws and norms, most importantly the legal certainty of firms and contracts guaranteed by trustworthy and objective court systems. This incorporates judicial certainty in the interaction between individuals, firms and the government within an economy as a fundamental determinant to incentivize investment, growth and competitiveness. The main idea being that regions that lack such legal systems impose higher transaction cost to market participants. While these factors are very well understood within competitiveness research we feel that there is still a need for more detailed examination of the effects of insecurity and criminality to region´s competitiveness.
85. Insecurity and criminality impact individuals and firms by imposing higher costs of market participation. For firms these can be items such as resources spent on private security or the cost of stolen or damaged goods and property, which lower the ability of firms to compete by raising costs relative to firms in safer regions. For this reason firms should encourage changes that lead to better overall security conditions for their regions of business.
86. Despite the fact that the causes of insecurity and criminal incidence in regions are dependent of structural variables such as employment opportunities, income distribution, education, the demographic composition and poverty, these causes are at the same time dependent on institutional factors. For example there is powerful evidence that countries with worse structural conditions than México have in fact lower criminal incidence rates because of changes to their justice procurement institutions (IMCO, 2006). This stresses the idea that the evaluation of law enforcement and justice institutions within a region is of vital importance. Both government and the business community have big incentives to promote the reform of institutions that may lead to better security of individuals and property.
87. Using the OECD’s evidence-based policy making framework we can illustrate how the relationship between security and competitiveness can be further explored with the intention of creating information that could mobilize governmental and non-governmental stakeholders.
(i) Generating basic data: As mentioned throughout this report basic data is of fundamental importance to the policy-making process. Available data on security and justice such as resources spent, human and physical infrastructure outputs, criminal incidence outcomes and public perception on public safety are still far away from the desired levels. Lack of data is a lesser concern for measuring

46
competitiveness as there is an increasing number of both governmental and nongovernmental organizations that collect and compile variables that are necessary to evaluate competitiveness within a region. Still, alongside the need to generate better data on criminal and legal processes, further efforts should be done at raising additional information on dimensions of crime that may affect business decisions, like working days lost by crime victims or additional costs incurred by firms to enforce security.
(ii) Transforming data into actionable evidence: While the availability of basic data is necessary it is not sufficient to understand the complex relationships between security and competitiveness. As mentioned previously, an increasing number of non-governmental institutions, such as think-tanks, and academic centers have proposed and implemented complex and interesting methods to evaluate region´s competitiveness outcomes. Increases in available data should be accompanied by the incorporation of criminal incidence and justice system indicators into such studies potentially increasing our knowledge of the security-competitiveness relationship. Additionally more detailed exercises that analyze the effects of potential interventions and reform on law enforcement and criminal justice also must be undertaken.
(iii) Using evidence on security-competitiveness relationships into policy decisions: Once that data is transformed into evidence it should be disseminated among the relevant decision makers. In the case of the relationship between security and competitiveness the range of policies involved should reach beyond security and justice. The relevant questions to economic authorities and regulators should be not only on the grounds of what could further security do for competitiveness, but to what extent are economic policies and regulations consistent with the need to generate the right structure of incentives for economic agents to contribute to enhance the rule of law.
(iv) Creating indicators and reports that could mobilize non-governmental stakeholders: Secondary diffusion of evidence such as the creation of reports and indicators as well as the involvement of media can play a fundamental role into transforming evidence into policy. The detrimental effect of a lack of security in competitiveness levels does not only affect those institutions responsible with making policy happen, the business community as a one of the agents that can benefit the most from increases in competitiveness can play a vital role in pressuring and cooperating with the relevant authorities to implement reform and ultimately improve criminality outcomes. For this reason the creation and diffusion of evidence is a fundamental part of the policy making process, ideally informing and mobilizing stakeholders that can directly and indirectly benefit from informed policy decisions.

47
References
Alda, E. and J. Cuesta (2010). Comprehensive estimation of costs of crime in South Africa and its implications for effective policy making. Journal of International Development.
Audit Commission and HMIC (2010). Learning Lessons: An overview of the first ten joint inspections of police authorities by HMIC and the Audit Commission.
Australian Bureau of Statistics (2002). Information Paper: Measuring Crime Victimisation, Australia: The Impact of Different Collection Methodologies. Available at http://www.abs.gov.au/ausstats/[email protected]/mf/4522.0.55.001
Brand, S. and R. Price (2000), The Economic and Social costs of Crime, Home Office Research Study 217. London.
Chaplin R., J. Flatley and K. Smith (eds.) (2011), Crime in England and Wales 2010/11. Findings from the British Crime Survey and police recorded crime (2nd Edition). Home Office Statistical Bulletin. London.
HMIC (2010), HMIC Response to Consultation on Value for Money Profiles. Available at http://www.hmic.gov.uk/media/value-for-money-profiles-consultation-response-20100306.pdf
HMIC (2011), Banding Analysis Technical Guidance Available at www.hmic.gov.uk/media/banding-analysis-technical-guidance-20110405.pdf
IMCO (2006), Punto de Inflexión. Situación de la Competitividad de México. IMCO, Cd. de México.
IMCO (2011), Índice de Competitividad Internacional 2011. Más allá de los BRICS. IMCO, Cd. de México.
INEGI (2011). Encuesta Nacional de Victimización y Percepción sobre Seguridad Pública 2011. INEGI. México, 2011.
INEGI (2012). “Territorial Georeferenced Indicators”, presentation given by the INEGI during the OECD’s Working Party on Territorial Indicators. June 2012. Paris, France
Jansson, K. (2008). British Crime Survey - Measuring Crime for 25 years. Home Office, United Kingdom.
Mayhew, P, (2003), “Counting the Costs of Crime in Australia”, Trends and Issues in Crime and Criminal Justice series. No. 247. Australian Institute of Criminology. Australia
National Crime Council of Ireland website.www.crimecouncil.gov.ie/statistics_cri_crime.html accessed June 2012.
OECD (2012). Strengthening the Evidence Base on Public Governance and Supporting Policy makers with Comparative Evidence: The Way Forward. Issues for Discussion.
Perreault, S. and S. Brennan. (2009), Criminal victimization in Canada, 2009, Statistics Canada
Skogan, W. (1977), “Dimensions of the Dark Figure of Unreported Crime”. Crime and Delinquency vol. 23, 1: pp. 41-50.

48
Suffolk Police Authority (2009). “Three Year Plan – Performance Indicators 2010/2011”.Report to the Monitoring and Audit Committee. Available at http://papers.suffolkpoliceauthority.org.uk/publicdocuments/committee_meetings/pdfs/meeting328/Three%20Year%20Plan%20-%20Performance%20Indicators.pdf
UNAM (2011). “Elementos para la Construcción de una Política de estado para la Seguridad y la Justicia en Democracia”. Conferencia Internacional sobre Seguridad y Justicia en Democracia. UNAM-Instituto Iberoamericano de Derecho Constitucional.Cd. de México.
Wallace, M., J. Turner, A. Matarazzo and C. Babyak (2009). Measuring Crime in Canada: Introducing the Crime Severity Index and Improvements to the Uniform Crime Reporting Survey, Statistics Canada.
WEF (2010), The Global Competitiveness Report 2009-2010, WEF.
World Bank (2004). The Road to Sustained Growth in Jamaica. The World Bank. Washington, D.C..

49
CHAPTER II: TERRITORIAL DISTRIBUTION OF CRIME
2.1 Introduction
88. Statistical evidence suggests that crime is a territorial phenomenon. Indeed, beyond national averages, regional differences within countries in criminal activities are often important and crime rates tend to be concentrated or clustered around the same geographic area. Moreover, adaptation of crime activities to new environments can happen quite fast, resulting in territorial concentration or expansion over time.
89. The forces driving these geographical patterns seem to be related to the interaction of different social, economic, institutional and physical factors. Authors like Vilalta (2012b) suggest that territorial disparities in crime could be explained by two alternative approaches. The first approach considers that regional differences are due to the aggregate effect of individual characteristics interacting with the attributes of a particular location. The second approach suggests that geographic patterns result from similar people facing different levels of government and experiencing different trust in institutions and law enforcement, depending on the place where they live. In both cases, the analysis of criminal statistics disaggregated at different geographical scales can provide appropriate information to public policies to detect and anticipate changes in criminal activity. Considering that a significant share of criminal activities in Mexico is caused by the presence of organized crime in specific geographic areas of the country, this approach could be of particular interest for Mexican authorities. Indeed, drug cartels are established in certain regions of the country, while their domains extend across states. Moreover, these domains do not necessarily respect political boundaries, and seem to be reactive to different security policies implemented at different moments in time. Thus, understanding the dynamics of the geographical patterns of criminal activities can contribute to enhance the design of security policies.
90. Geographical patterns provide information on the way criminal activities interact across regions in a country. Indeed, assuming that criminal activities do not respect political boundaries, it seems plausible that crimes sharing the same type of drivers may be present in groups of neighbouring regions. In other words, the crime rate of a region may be correlated with the criminal rates of surrounding regions. This phenomenon - known as spatial dependency- can change over time, signalling a reorganisation of crime activities on the territory. A spatial approach to crime statistics can also help identifying the interaction of criminal activities with socio-economic characteristics and whether the relevance of certain characteristics differs across places (so called spatial heterogeneity analysis).
91. The study of criminal activities following a spatial approach has gained place among social scientists during the past decades. Improvements in data collection and availability of geographic information systems have contributed to the increase of such empirical studies in the most recent years. For instance, Curry and Spergel (1988) use community level data to identify different geographical patterns in intentional homicides and common types of crimes, finding that while intentional homicides are associated to areas of poverty and lack of social control, common crimes are mostly related to a measure of social disorganization. Tita, Engberg, and Cohen (1999) find that gangs tend to form in areas characterized by low values of informal social control. Authors like Messner et al. (1999), Canter (2000), Santtila et al. 2007 have made significant contributions to the literature by analyzing intentional homicide statistics through geographic information systems (GIS). Canter (2000) argues that one of the main advantages of using GIS for analysing homicides is the possibility to better understand offender patterns. Messner et al (1999) and Santtila et al (2007) analyse the spatial patterns of homicides through time; these two studies are focused on the concentration patterns. In both cases the authors reject the existence of a random spatial pattern, i.e. homicides seem to be clustered in particular areas within a community. Following a similar

50
approach, Vilalta (2012b) suggests the existence of a spatial match between metropolitan judicial activity rates and the levels of both institutional and urban infrastructure development in 60 Mexican metropolitan areas. These studies not only highlight the importance of considering the spatial nature of criminal activities, but they also show the significant role of better territorial indicators for policy design, implementation and evaluation.
92. This chapter will first present some evidence on the territorial patterns of criminal activities within OECD countries, drawing the indicators available in the OECD Regional database. In sections 2 and 3 it will provide some evidence on the main socio-economic variables associated with different levels of crime within countries, in a sample of seven OECD countries that includes Mexico.
93. Even though regional differences are important in crime activities, it is often difficult to measure them satisfactorily and to identify what socio-economic, institutional and cultural conditions are associated or responsible for crime. Paragraph 4 discusses the main constraints with measuring security and provides some orientations to increase the availability of internationally comparable statistics at sub-national level.
94. Finally, better data do not automatically translate into actionable evidence, that is to say evidence that can provide guidance to policymaking, because the indicators can be far away from the policy intervention; or because the institutional conditions are not known or difficult to change; or because causality and correlation links are difficult to be established, given the many stakeholders (national, local policymakers, citizens and business), with different information needs, different objectives and capacity. The territorial dimension of crime activity, thus, requires coherent policies across levels of government and government bodies. The multi-level governance issue is particularly important not only because states have wide powers in the organization of police and courts of law, but because, given the strong local dimension of crime, the alignment of policy objectives across levels of government is essential to increase the effectiveness of prevention and security policies. The chapter will address this aspect in its final part.
2.2 Regional crime statistics in OECD countries
95. Despite crime being a territorial phenomenon, the collections of comparable sub-national statistics within this domain tend to be scarce. Considering this constraint, the OECD regional database (RDB) has focused on two widely used variables that account for criminal activities: number of reported intentional homicides and number of reported crimes against property. The RDB stores this information for the states or regions in 26 OECD countries on yearly basis. Both variables are collected on the basis of official statistics provided by the National Statistical Offices or the corresponding National Agency in charge of collecting sub-national information.
96. Under the definition used by the RDB, intentional homicide is considered as the unlawful killing of a human being with malice aforethought, in other words murder. Crimes against property, on the other hand, refer to the set of crimes that includes forgery, arson, burglary, theft, robbery and malicious damage of property. In order to control for differences in population sizes and promote comparability, both variables are usually expressed as rates with respect to the regional population. Both variables refer to the number of crimes reported to the police; underestimation of crimes, due to underreporting, is a common problem in crime statistics and quite important in Mexico, as the recent victimization survey carried out by INEGI highlights. To understand the actual criminal activity reported crimes should be complemented by people’s perception of security of an area. However, the RDB does not include any subjective measure due to poor cross-country comparability of these measures.
97. Regional crime statistics show that national averages often mask strong differences within countries. This is particularly the case of Mexico. Mexico is not only the OECD country with the highest national intentional homicide rate, but it is also the one with the biggest regional disparities in intentional

51
homicides. In 2009, the national intentional homicide rate was close to 18 per 100 000 inhabitants. However, the intentional homicide rate of the state of Chihuahua (109 intentional homicides per 100,000 inhabitants) was 56 times higher than in the state of Yucatan. The intentional homicide rate of Yucatan is close to, or even smaller than the one of many European regions (Figure 2.1).
Figure 2.1. Regional differences in intentional homicide rates by 100 000 population Selected OECD countries - 2009
Source: OECD Regional Database, 2009
98. Similarly, big differences are observed across regions in different OECD Countries; for instance, during the same year in the United States, the intentional homicide rate of the District of Columbia (24 intentional homicides per 100,000 inhabitants) was almost 30 times higher than in New Hampshire. This pattern can also be found in countries like Canada and France where regions like Northwest Territories and Nunavut (CAN) and Corse (FRA) have intentional homicide rates significantly higher than rest of the country.
99. OECD countries also show high regional disparities regarding crimes against property. In 2009, Canada was the country with the biggest disparities in crimes against property; the region Northwest Territories and Nunavut had a rate almost fives higher than the national value. For the same year, Mexico also shows significant regional disparities. Moreover, these disparities seem to follow a geographical pattern similar to the one of intentional homicide rates. The northern state of Baja California Norte (neighbour of Chihuahua) had a rate of crime against property almost three times higher than the national value, while the southern state of Campeche (neighbour of Yucatan) had a rate five times smaller than the national value.
100. Crimes against property are usually higher in urban areas. Indeed, in some European countries like Austria, Belgium, Greece, Great Britain, Spain Norway, and Sweden the region with the capital city features a rate of crimes against property particularly high compared to the rest of the regions in the country (Figure 2.2).
0
5
10
15
20
25
30
Mexico United States
Canada France Australia Turkey Greece Belgium Czech Republic
Korea Slovak Republic
Hungary
Country intentional homicide rate Min -‐ Regional intentional homicide rate Max -‐ Regional intentional homicide rate
Chihuahua -‐109
District of Columbia
Kastamonu, Çankiri, Sinop
Jeju Reg -‐Bruxelles-‐
Cap
Northwest Territories and Nunavut
Severozapad Bratislav Kraj Northern Great PlainAttiki
NorthernTerritories
Corse
Yucatan NewHampshire Prince Edward
Island
Bourgogne Western Australia
Tekirdag, Edirne, Kirklareli
Kentriki Ellada
Vlaams Gewest
Severovychod
JeollaZapadne Slovensko
Western Transdanubia
//

52
Figure 2.2. Regional differences in crimes against property (Country value =1) - 2009
Source: OECD Regional Database, 2009
Note: Each bar represents the difference (expressed as a percentage) between the regions with the highest and lowest values of property crimes rates and the national value. For instance, in Italy the region of Liguria has a rate of crimes against property 40% higher than the national value, whilst the region of Basilicata has a rate of crimes against property 60% lower than the national value. Source: OECD Regional Database, 2009
101. Understanding the links between socio-economic conditions and crime activities is not easy. At a first sight, property crimes tend to be concentrated in the cities, and reported property crimes tend to increase with regional per capita GDP in many OECD countries (see Figure 2.3 for Mexican States).
-‐250% -‐150% -‐50% 50% 150% 250% 350%
Italy
France
United States
Norway
Belgium
Greece
Spain
Turkey
Portugal
Czech Republic
Germany
Austria
Slovak Republic
Mexico
Canada
Lowest regional value Highest regional value
Ontario
Van, Mus, Bitlis, Hakkari
Região Autónoma da Madeira
Stredni Morava
Bayern
Burgenland
Zapadne Slovensko
Campeche
Nord-‐Norge
Vlaams Gewest
Nisia Aigaiou -‐ Kriti
Cataluña
Basilicata
Limousin
South Dakota
Reg -‐Bruxelles-‐Cap
Attiki
Baleares
Adana, Mersin
Algarve
Praha
Bremen
Wien
Bratislav Kraj
Baja California Norte
Northwest Territories and Nunavut
Liguria
Provence-‐Alpes-‐Cote D'Azur
District Of Columbia
Oslo Og Akershus
National value = 0%

53
Figure 2.3. GDP per capita and crime against property in Mexican States - 2008
Note: The region of Campeche is excluded from this graph as an outlier. The region’s GDP includes the most important share of oil production activities; hence its GDP per capita is the one of highest in Mexico but does not necessarily reflect the wealth of the population on the state.
Source: OECD Regional Database; information provided by INEGI.
102. However, as described in the next paragraphs, analyses following a spatial approach can provide insights on the way criminal activities interact across regions and help to better understand the incidence of certain socio-economic variables on different crime activities in different regions.
2.3 The geography of intentional homicide rates25
103. Intentional homicides represent the most extreme form of violence. It should be noticed that intentional homicide rates do not provide information on more common security conditions. However, since the phenomenon they represent has one of the biggest impacts on people’s wellbeing, they are considered as one of the most important indicators when analysing criminal activity.
104. Understanding the way in which intentional homicide rates are distributed across regions is key in the design of any security strategy. Moreover, identifying the socio-economic factors that influence their
25 A detailed description of the concepts used and the statistical output provided by the analysis can be found in the
Annex.
Chiapas
Oaxaca
Guerrero
Tlaxcala
Zacatecas
Puebla
Mexico
Nayarit
Morelos
Michoacan
Veracruz
Hidalgo
Yucatan
Guanajuato
San Luis Potosi
SinaloaDurango
Colima
Jalisco
Baja California Norte
Aguacalientes
Chihuahua
Sonora
Baja California Sur
Queretaro
Tamaulipas
Quintana Roo
Coahuila
Nuevo Leon
Tabasco
Distrito Federal
-‐1.2
-‐0.7
-‐0.2
0.3
0.8
1.3
1.8
8.6 8.8 9 9.2 9.4 9.6 9.8 10 10.2 10.4
Natural logarithm
(ln) of crim
es against prope
rty by 100
pop
ulation
Natural logarithm (ln) of GDP per capita
Higher num
ber of crim
es
Higher values of GDP per capita

54
spatial distribution could help sub-national governments to implement policies intended to eradicate some of the actual drivers of criminal activity.
105. The following paragraphs present the results from the spatial dependency and spatial heterogeneity analysis applied to seven OECD countries: Mexico, the United States, Canada, Italy, Turkey, France and Poland.
Spatial dependence of intentional homicide rates
106. The strength of spatial dependency, i.e. the degree in which neighbouring regions can influence each other, varies according to distance and time. The closer two regions are the higher their interaction or dependency. However, spatial dependency may be present in certain periods of time and missing in others. Criminal activities are dynamic and highly reactive; thus, depending on changes in monitoring efforts and law enforcement across regions, criminal activities may be concentrated or dispersed throughout territory in different points in time. The patterns of spatial dependency for the seven countries in the sample are presented in Figure 2.4. In this figure spatial dependency is expressed through an autocorrelation coefficient, which takes a positive value in the presence of regional concentration and a negative value in presence of regional dispersion.
Figure 2.4. Spatial autocorrelation coefficients over time per country
Source: Calculations based on an Inverse Distance function with the exception of USA for which calculations were based on a Squared Inverse Distance function.
-‐1
-‐0.8
-‐0.6
-‐0.4
-‐0.2
0
0.2
0.4
0.6
0.8
1
1990 1991 1992 1993 1994 1995 1996 1997 1998 1999 2000 2001 2002 2003 2004 2005 2006 2007 2008 2009 2010
Canada France Italy Mexico Poland Turkey USA
Mexico
Turkey
USA
Italy
France
Canada
Poland
Spatial Concentration
Spatial Dispersion

55
107. The results from the spatial dependence analysis show a wide variety in geographical patterns among the seven OECD countries. In general terms, these results suggest that in Mexico, the United States, Canada and France intentional homicides tend be clustered in certain geographical areas; while in Poland, Turkey and Italy intentional homicides tend to be dispersed across regions. Nevertheless, due to the different geographic dynamics followed by each country, it is more adequate to discuss each case independently.
108. The results in Figure 2.4 show that the Mexican geography of intentional homicides is highly dynamic. Indeed, there have been years of spatial concentration followed by other years with no recognizable spatial pattern of intentional homicide rates across Mexican states. However, it should be noticed that in the past couple of years spatial dependency has significantly increased. Since the past decade, intentional homicide crime rates have increased and clustered in northern states such as Chihuahua, Baja California Norte, Sinaloa and Sonora (Figure 2.5). Intentional homicide rates in other states such as Tlaxcala, in the centre, and Yucatan, in the Peninsula, have remained well below the national average for the last decade.
Figure 2.5. Intentional homicide rates in Mexico - 2009
Source: OECD Regional Database, 2009

56
109. In the case of the United States murder rates have always been clustered; yet this concentration has been constantly increasing since 1990. It must be said that the national intentional homicide rate in 2010 was half of what it was in 1990. However, regional differences remain. States like North Dakota and Iowa have been historically among the safest regions of the 180 analyzed in this set of seven countries, similarly to some Canadian regions (e.g. New Brunswick or Prince Edward Island). However, neighbouring states like Louisiana and Mississippi, in the south, or D.C. and Maryland in the mid-Atlantic, have kept very high intentional homicide rates over time (the values of these rates are similar to the ones in Mexican states like Baja California Sur or Coahuila).
110. Countries like France and Canada show relatively stable geographical patterns of intentional homicide rates. Both countries are characterised by one region suffering from a particularly high intentional homicide rate compare to the rest of the regions in each country; this is the case Northwestern Territories in Canada and Corse in the case of France.
111. Italy shows the opposite pattern from Canada and France. While the two latter countries show a pattern of spatial concentration of intentional homicide rates in a small group of regions, Italy presents a pattern suggestive of (decreasing) spatial dispersion between 2006 and 2009; this means that neighbouring regions are dissimilar from each other. Calabria in the south and Emilia-Romagna in the north-centre of the country present the highest intentional homicide rates; about twice the national average.
112. Turkey, like Italy, is another case of constant spatial dispersion. Although intentional homicide rates have decreased over time, one region consistently reports much higher rates than the national average. This is the Kastamonu, Çankiri, Sinop region in the north-centre of the country, bordering the Black sea. Istanbul has also reported high numbers of intentional homicide crimes over the period, however intentional homicide rates have notably decreased after 2007.
113. Poland is the most spatially unstable of the seven countries for this type of crime. Still, although highly variable from one year to another, Poland has shifted from geography of concentration in the late nineties, towards a geography of dispersion by the end of the period. Specifically in 2009, the regions with the highest intentional homicide rates were located in its borders and farther away from each other, particularly Lubelskie in the eastern border, Dolnoslaskie, Lubuskie, and Zachodniopomorskie in the western border, and Warminsko-Mazurskie, in the north.
Spatial heterogeneity of intentional homicide rates
114. If the relationship of intentional homicide rates with another socio-economic factor varies depending on the geographic location, we consider this relationship to be spatial heterogeneous. In other words, in the presence of spatial heterogeneity, the effect of a socio-economic variable on the number of intentional homicides is not the same in different region of the same country. In some cases, it is even possible to find countries where this effect is positive for some regions while negative for others. This is also known as inverse relationship. The results of the analysis show that three socio-economic factors have the strongest relationship with intentional homicide rates among the countries in the sample: youth unemployment rate, GDP per capita and the share of working age population (population aged 15 - 64)26. The socio-economic factors having the strongest relationships with intentional homicide rates for each country are shown in Table 2.1.
26 The factors were chosen based on a correlation analysis, i.e. the factor showing the strongest correlation among
the set of all socio-economic factors was chosen for the spatial heterogeneity analysis. The set of socio-economic factors included demographic, labour and economic variables.

57
115. Both Canada and the US showed an inverse relationship between the socio-economic variable and the intentional homicide rates. In Canada, regional youth unemployment rates were statistically associated with regional intentional homicide rates for the year 2010. This relationship was positive for the northern, western, and central regions of the country; it was negative for the eastern and Atlantic regions. This implies that youth unemployment rates are positively related to intentional homicide rates in British Columbia and Alberta, while negatively related in Ontario or Quebec. In the case of the United States, the socio-economic factor showing the strongest relationship with intentional homicide rates in 2010 was GDP per capita. In this case, the direction of the relationship between the two variables is negative in the west and positive in the east and Alaska. Higher levels of GDP in western states are associated with lower levels of intentional homicide rates; the opposite happens in the eastern states. It is important to highlight that these results are preliminary; it should be validated by a complementary analysis on their robustness and to better assess the underlying mechanisms between crime and various socio-economic variables.
Table 2.1. Socio-economic variables with the strongest relationship to intentional homicide rates
Country Strongest covariate Pearson’s coefficient
Canada Youth unemployment rate -0.782**
France Youth unemployment rate -0.282
Italy Population 15 - 64 years old (%) 0.342
Mexico Youth unemployment rate -0.138
Poland GDP per capita 0.16
Turkey Youth unemployment rate 0.788**
United States GDP per capita 0.632** Note: Based on Pearson´s linear correlation analysis. * Significant at 0.10 level and **0.05 level
116. Although other countries did not show inverse relationships between regional intentional homicide rates and socio-economic factors, all countries did show varying degrees in the strength of the relationships. For instance, in France the relationship between youth unemployment rates and intentional homicide rates was stronger in the western regions and weakened progressively towards the east. In Italy, the relationship between percentage of population 15 - 64 years old and intentional homicide rates was stronger in the centre, particularly in the regions of Marche and Umbria, and getting also progressively weaker towards the south and North. In Mexico, the relationship between youth unemployment rates and intentional homicide rates was stronger in the central-southern states. In the case of Poland, GDP per capita was strongly correlated with intentional homicide rates in the southern regions, particularly in Slaskie, and it began to weaken towards the north.
117. The empirical literature is not conclusive regarding the link between unemployment and crime activities, for example homicides. While many studies point out the correlation between these two variables, the direction of this correlation has been found to be in some cases positive, while in others negative, depending on the territory and the types of crime under study. In the present analysis, this correlation is negative in the case of Mexico for the years between 2005 and 2008, though its significance should be tested at lower territorial scales. Other evidence suggests that crime is a youth activity in Mexico, but homicide not that much. Murders can be linked to illegitimate sources of income/earnings, but may not be significantly influenced by regional economic factors. Indeed, in many instances murders are not fully driven by the situation of the regional economy, but instead by contextual factors associated with drug trafficking and dealing, family structure, and community cohesion. The latter suggests that in order to

58
better understand the linkage of these two variables from a territorial perspective it may be necessary to focus on more disaggregated data (e.g. municipal or city level data).
2.4 The geography of crimes against property27
118. Crimes against the property account for those crimes that have a direct impact on material assets. They are an interesting complement to intentional homicide rates by providing information on a more common type of criminal activity. The same type of spatial analysis used for identifying the geographical patterns of intentional homicide rates has been applied to analyse crimes against property. The spatial analysis of crimes against property considers the same set of OECD countries, and it is also composed by analyses of spatial dependence and spatial heterogeneity.
Spatial dependence of crimes against property
119. Most countries show a pattern of spatial clustering of property crimes at some point between 1990 and 2010. Spatial dispersion is rare and only present in Mexico towards the middle of the last decade. Prior to that, property crime rates in Mexico were spatially clustered (Figure 2.6). Overall, the trend of the six remaining countries is towards decreasing spatial concentration, meaning that property crimes tend to be more disperse across regions . The exceptions are France and the United States.
Figure 2.6. Property crimes: Spatial autocorrelation coefficients over time per country
Source: Own calculations based on an Inverse Distance function with the exception of USA for which calculations were based on a Squared Inverse Distance function.
27 A detailed description of the concepts used and the statistical output provided by the analysis can be found in the
Annex.

59
120. Between 1997 and 2004, property crimes in Mexico were concentrated in a set of states, particularly in Northwestern states like Baja California Norte and Baja California Sur, Sonora, and Colima in the Pacific Ocean. After 2004, property crimes have dispersed and other states have begun to suffer from these crimes. States such as Tabasco in the Gulf of Mexico, Morelos and the Distrito Federal now also have above the average property crime rates, Figure 2.6. Indeed, crime dynamics in geographically separated states have resulted in a shift from spatial concentration to spatial dispersion. In fact the observable trend for the entire period is towards increasing dispersion – that is, neighbouring states become more and more unalike from each other.
Figure 2.7. Crimes against property - 2009
Source: OECD Regional Database, 2009
121. Property crimes in Canada have tended to be highly dependent or concentrated; yet there is a national trend towards a decrease in this spatial concentration. This trend has been very stable over time --meaning not volatile. This implies that provinces have become subtly yet progressively closer or similar in terms of their property crime rates since 1998. Contrary to Canada, property crimes in France are not spatially clustered. However, there are some regions that do stand out with property crime rates above the national average; these regions are Provence-Alpes-Cote D'Azur, Ile de France, and Languedoc-Roussillon. Still, overall there has not been a statistically detectable spatial pattern in the activity of this crime at least between 1996 and 2010. The spatial trend is the same: spatially random.

60
115. The Italian geography of property crime rates shows an opposite pattern to the one of intentional homicide. In the case of intentional homicides, Italian regions were unalike (i.e. spatial dispersed). However, regarding property crimes, Italian regions showed a stable pattern of spatial clustering extending towards the Mediterranean and the northern regions between 2006 and 2009. Regions such as Liguria, Lombardia, and Emilia-Romagna have had property crime rates well above the national average, whereas other regions such as Basilicata and Molise in the south have been well below the national average. Still, the incidence of these crimes decreased for most regions in this period.
116. Poland is somewhat similar to Mexico in its trend towards spatial dispersion of property crimes. While in the late 1990s and early 2000s this kind of crimes were spatially concentrated, particularly in the Zachodniopomorskie and Pomorski regions, for year 2009 the spatial pattern is random (not dependent) and the trend is towards increasing spatial dispersion. The previous regions still possess the highest property crime rates in the country, yet they are less spatially dependent from its neighbouring regions. It must be noted that property crime rates have descended nationwide between 1999 and 2009, whereas in Mexico property crimes have increased notably.
117. In the Turkish case, the trend is towards a spatial concentration of property crime activity. Most activity concentrates in the Antalya-Isparta-Burdur, Izmir, and Adana-Mersin regions in the Mediterranean coast. Another region that stands out is Ankara, the capital. It must be noted that rates for property crimes in the previous regions more than tripled in the last decade. After Mexico, Turkey is the country with highest growth in property crime activity.
118. Finally, the USA presents a spatial clustering of both intentional homicide and property crime rates. With regards to property crimes, the rates have been decreasing since the 1990s. Most of the crime activity has been and still is concentrated in southern states, particularly in Arizona, Florida, Texas, Louisiana, and South Carolina. Washington and Oregon, in the northwest, also property crimes rates above the national average. However, the District of Columbia in the mid-Atlantic, similarly to intentional homicide crimes, ranks first in the nation in property crime rates.28 The spatial trend observed between 1990 and 2010 suggests decrease of spatial clustering in the coming years.
Spatial heterogeneity of crimes against property
119. With the exception of Mexico, the socio-economic variable showing the strongest relationship with the property crime rate was the GDP per capita, Table 2.2. Indeed, for Canada, France, Italy, Poland, Turkey, and the USA, the relationship between property crimes and GDP per capita was positive; in other words, as high values of GDP per capita increases are associated with high values of property crimes rates. In the case of Mexico, the socio-economic variable showing the strongest relationship with property crime rates was the youth unemployment rate; this relationship is positive, that is, regions facing high youth unemployment rates are characterized by high property crime rates.
120. The United States was the only country showing evidence of inverse local relationships between property crime rates and GDP per capita. This means that there is a negative relationship between property
28 Naturally it must be considered in the comparison that the District of Columbia is an urban area, whereas the other
spatial units are states that include rural and urban areas.

61
crime rates and GDP per capita in all central and western states, while there is a positive relationship in the eastern states like Alaska and Hawaii29.
Table 2.2. Socio-economic variables with the strongest relationship to crimes against property
Country Strongest covariate Pearson’s coefficient
Canada GDP per capita 0.592*
France GDP per capita 0.577**
Italy GDP per capita 0.414*
Mexico Youth unemployment rate 0.221
Poland GDP per capita 0.503**
Turkey GDP per capita 0.631**
United States GDP per capita 0.243* Note: Based on Pearson´s linear correlation analysis. * Significant at 0.10 level and **0.05 level
121. The results from the spatial analysis suggest that every country is characterized by its own geography of crime. Indeed, the geographic patterns of both crimes against property and intentional homicide rates are not only different among countries, but for some of these countries they change in time. As in any other empirical analysis, certain caveats regarding these results should be issued. In the first place, the objective of this analysis was exploratory in nature. Thus, a more complete modelling strategy is needed to actually identify causality links between criminal activities and socio-economic variables. In the second place certain limitations concerning the data should be acknowledged, as a large number of crimes are committed, particularly property crimes, but never reported to the police. Under-reporting not only misguides authorities by undermining the actual magnitude of the problem, but it also creates issues in terms of internal and international comparability.
122. The differences in the spatial dynamics of criminal activities suggest that place-based policies, that integrate top-down national policies with bottom-up local initiative, can be necessary to a more effective crime prevention and law enforcement, as discussed below.
Box 9. Spatial analysis of criminal data in selected OECD countries
The analytical strategy in this analysis began with the examination of the spatial distribution of the Intentional homicide Rates and Property Crime Rates over the map. Spatial dependence was tested via Moran´s I global autocorrelation coefficients for each year of available data in each country. Because of the small sample size in most countries, a “p” value of ≤0.10 was the cut-‐off level of significance for spatial tests.
Later on, the linear correlation of the dependent variables with the following four structural covariates was estimated: Population 15 -‐ 64 years old (%), Unemployment rates, Youth Unemployment rates, and GDP per capita. This was performed via Pearson´s linear correlation analysis. The covariate with the largest magnitude was selected for further examination in the spatial heterogeneity analysis. The purpose was to detect preliminary evidence of divergent spatial relationships between variables across regions, whether substantive or as statistical nuisance. As such, the largest covariate was included in the right side of the geographically weighted regression (GWR) equation.
29 It should be highlighted that this type of heterogeneity in the local relationships may be the consequence of an
omitted variable in the model. In any event, the reader must be cautious when interpreting these results.

62
Finally, local coefficients of determination and local slopes (the latter when needed) were estimated.
2.5 Improving metrics of crime in regions for effective policymaking
123. The spatial analysis of the previous paragraphs shows that within-countries differences in crime activity can be important. However, it is not only difficult to measure criminal activities in different places, but also to detect and anticipate their changes. This is essentially due to three reasons. The first reason concerns the identification of the relevant “geography” for economic and social phenomena, which is where society self-organises (live, work and leisure) and where policies are decided and implemented. Often these places do not coincide with administrative boundaries and therefore statistical information is more difficult to be produced. Most recently, with the help of information and communication tools, many countries have invested in producing geo-referential information that can be aggregated at different territorial details. National Statistical Offices and International Institutions have started using geographic information systems not only to disseminate data but also to produce more information by integrating administrative, statistical and geographic sources. A recent analysis done by INEGI shows that only by geo-referencing crime activity and a large set of socio-economic conditions, it was possible to provide indications to public authorities on how to reduce property crimes in Aguascalientes city (MEX). The interpretation of crime factors was difficult before, because the offences and the other socio-economic variables were not available at the geographical level required to produce evidence on the causes of crime activity and not only on the effects.
124. Second, in the case of crime and security, there is a difficulty to gather robust data. Crimes reported to the police are sensitive to changes in legislation, may not be informative about the severity of each offence, and may not include detailed information on the victims. All these issues reduce the potential of this information to design preventive policies against crime. Moreover, research demonstrates that official police-based statistics only tell a part of the story, as a large number of crimes are never reported or recorded (the so-called “dark figure”). According to the US Bureau of Justice Statistics (2010) only 40% of property crimes and 49% of violent crimes were reported to the police. Similar estimates of unreported crimes for Mexico are as high as 90% (ENVIPE, 2010) (See Box 10). Reporting by citizens and business is linked to issues of public trust, the efficiency of law enforcement, integrity in the public sector, attitudes to the police and the perceived cost associated with criminal process. All these reasons have specific geographic features also within countries, making even more difficult to detect the causality links between socio-economic, institutional and cultural conditions, and crime activities. As the potential to overcome these constraints is limited, it is important to supplement the information gathered through police statistics with evidence derived by Victimisation Surveys. Victimisation surveys can provide a more comprehensive picture of the prevalence and incidence of crime, while helping to understand people perceptions and fear of crime. The way communities perceive themselves is not only critical for people well-being but also to give orientations to public policies. Results from the British Crime Survey show that the most important factor associated with public confidence in local police was whether people perceived the police to be dealing with things that matter to their community (Myhill and Beak 2008).
125. In the case of Mexico, where an extensive Victimisation Survey was recently developed, evidence suggests that an increase in the regional number of intentional homicides has initially a strong effect on the perception of insecurity; yet, as the regional number of intentional homicides increases the effect on people’s perception tends to be smaller (Figure 2.8). Moreover, population in States with similar intentional homicide rates expressed very different perception of the security of their region. For example, Distrito Federal (Mexico City) and Nuevo Leon have a perception of insecurity similar to states like Sinaloa and Durango which suffer from the highest intentional homicide rates. It should be noticed though that the perception of insecurity accounts for other crimes than just intentional homicides; in regions like Distrito Federal and Mexico the perception of insecurity may be driven by crimes like kidnapping or car

63
theft and not only by intentional homicides. In addition, violent crimes and in particular intentional homicides tend to receive more coverage by the media, thus affecting people’s perception (Figure 2.8).
Figure 2.8. Perception of security and intentional homicide rates - 2009
Source: Own calculations from National Survey of Victimization and Perception of Public Security (ENVIPE), INEGI, 2010; OECD Regional Database, 2009
Box 10. Cross-‐country comparability issues in regional crime statistics
Despite the efforts of national governments and international agencies regarding the standardization of criminal statistics, there are still some comparability constraints to be overcome. Moreover, this comparability issues are not only present at the international level, but for some countries they also concern sub-‐national crime statistics.
A critical comparability issue affecting a wide set of criminal statistics at different territorial levels is concerned with the multiple definitions of crimes. Indeed, due to the differences in legal procurement systems, the definition of a particular crime can differ from country to country. This issue can be also present within countries, when sub-‐national governments have they own criminal procedures code, as it is the case of Mexico.
The comparability of intentional homicide rates, across and within countries, may be comprised if this indicator is built using different information sources. Information on the number of intentional homicides committed during the year can be collected through criminal justice or health registries. However, these two sources usually provide different intentional homicide counts. A possible reason explaining this difference is the lack of capacity of law enforcement agencies to identify and record criminal activity. This issue could be more important in developing countries who are still working on consolidate their institutions. Despite this drawback, homicides tend to be constantly reported or registered (by either source).
Contrary to intentional homicides, crimes against property can be significantly under report. In some countries, including Mexico, official registries tend to undermine the actual number crimes against property committed
Aguacalientes Baja California Norte
Baja California Sur
Campeche
CoahuilaColima
Chiapas
Chihuahua
Distrito Federal
Durango
Guanajuato
Guerrero
Hidalgo
Jalisco
Mexico
Michoacan
Morelos
Nayarit
Nuevo Leon
OaxacaPuebla
Queretaro
Quintana Roo
San Luis Potosi
Sinaloa
Sonora
TabascoTamaulipas
TlaxcalaVeracruz
Yucatan
Zacatecas
25
35
45
55
65
75
85
95
0 10 20 30 40 50 60 70 80 90 100 110 120
Percen
tage of p
opulation considering their region to be insecure, 2009
Murder rate (100 000 inhab), 2009

64
because people do not report them the police. A possible way to estimate the frequency of these crimes in the society is through the implementation of victimization surveys. Victimization surveys ask to the population whether they have been victims of crime. In Mexico, the difference between official registries and estimates provided by victimization surveys is commonly known as the dark figure (“cifra negra” in Spanish). Victimization surveys usually include questions on the perception of criminal activity. Question regarding the perception of security not only allow authorities to compare objective and subjective measures but they also allow whether the effect of certain security policies is perceived by the population. While in general the sample used in the victimization surveys does not allow to provide evidence at sub-‐national level, some countries have recently addressed this issue and notably Mexico through the victimization and perception survey (ENVIPE)
Victimization surveys provide an interesting solution to overcome in the short term some of the most important national and international comparability issues. Indeed, the international harmonization of victimization surveys is easier to achieve compared to the harmonization of national governmental registries. Victimization surveys have some limitations though. In the first place, they are based on the perception of crime by their respondents; this perception can vary across different cultural and socio-‐economic context though, which could make international comparisons more difficult. Moreover, the accuracy of responses is influenced by the ability of to recall past crimes. Finally, victimizations surveys cannot be a complementary source of information for all types of crimes, they are a good source of information on common crimes affecting citizens, and most recently also to business.
The increasing demand for well-‐being measures at the sub-‐national level has motivated the inclusion into the RDB of additional indicators on security. Indeed, during the following years a more compelling collection of objective measures of security at the regional level will be included into the RDB. But more importantly, a significant part of the collection’s efforts will be directed to identifying internationally comparable indicators on security perception. As it has been widely recognised, well-‐being cannot only be capture through objective outcome indicators. Indeed, to design policies enhancing population’s well-‐being it is necessary to account for the perception of the level of security embedded in the society.
126. The third issue relates to the fact that better data do not automatically translate into actionable evidence. The availability of comprehensive, high quality, shared, accessible information about how a society is performing is crucial to ensure that decision-making is simultaneously responsive and responsible. However, in some cases, sound evidence may not be enough to provide guidance to policy in the design and implementation of a strategy. This impediment is caused by multiple constraints: the comparative analysis may rely on indicators that are far away from policy intervention; the institutional conditions are not known or very difficult to evolve; the information on the policy objectives is not shared or agreed on among the different stakeholders (national, local policymakers, citizens and business); or the causality and correlation links are difficult to be established.
127. Specific inputs, then, need to be added to enter more directly in the “policy toolbox”, i.e. understand a country’s policy design, its implementation and delivery. To underline the fact that these inputs matter for the design, delivery, monitoring and evaluation of policies, they can be referred to as policy measures. Policy measures are of particular relevance in public policies related to crime and justice for which responsibility is shared among different levels of government and many stakeholders. As such, its design and implementation depends on how well information is shared among all the actors and a common vision of results and changes needed to accomplish them is understood and shared among citizens and institutions at different territorial levels.
128. Broadly speaking, three categories of policy measures can be identified. The first category measures the conditions in different countries and places (macroeconomic conditions, structural policies, institutional setting) as well as institutional conditions within a country (this includes actors, financial and human resources, different stakeholders’ responsibilities, etc.) The second category of policy measures relates to a better understanding of the causality links among policy objectives and actions, as well as to the policy levers and complementarities among different policies in a territory. This category cannot include just statistical indicators and must be coupled with qualitative and quantitative evaluations. The third

65
category of policy measures are outcome indicators aimed at capturing the results on which policy can claim to have an effect. These indicators are relevant for a certain policy/territory, and as such they may differ from region to region.
129. Policy measures can leverage the information and knowledge to improve policy results, which in turn will demand refined information and knowledge; this “informed regional policy cycle” aims at improving the final outcomes of policy actions i.e. better lives (Figure 2.9). This iterative process will also help to improve capacity in delivering policies, to build a common vision on the objectives of policy and means to achieve them and to spur civic engagement.
130. In the iterative system of decision-making, policy evaluation has a decisive role in offering insights on conditions, causalities and bottlenecks for the implementation of regional policy and in suggesting ideas on how to revise objectives, resource allocation and tools to deliver. One of the major added-value of evaluation comes from its external position in relation to the policy toolbox (design, delivery and monitoring) allowing an outer vision on the process and, at the same time, it can enable a learning process for policy makers and strengthen the public accountability of policies.
Figure 2.9. Informed regional policy cycle
131. Finally, the effectiveness of the informed regional policy cycle will depend on the interactions among the different actors, national and local policymakers, business and citizens, who have different information needs, different capacity and policy objectives.
POLICY AWARENESS
Policy awareness
KNOWLEDGE
POLICY TOOLBOX Strategy for design, delivery, monitoring and assess policies
-‐ Regional economic structure -‐ Agglomerations and geographic concentration -‐ Persistence of inequalities -‐ Social and environmental performance -‐ Analytical characteristics of different types of regions
INFORMATION -‐ Countries/Regions comparison -‐ Trends
Policy measures: -‐ Conditions / Institutions -‐ Causality diagrams -‐Results (outputs, outcomes) Evaluation of policy
practices
-‐ Improve capacity -‐ Build a common reference to identify policy objectives -‐ Spur civic engagement

66
132. The territorial dimension of crime activity, thus, requires coherent policies across levels of government and government bodies. The multi-level governance issue is particularly important not only because states have wide powers in the organization of police and courts of law, but because, given the strong local dimension of crime, the alignment of policy objectives across levels of government is essential to increase the effectiveness of prevention and security policies.
133. Policy implementation needs a mix of top-down and bottom-up approaches so as to treat the conditions, context, policy levers and learning outcomes as an interconnected system. Conditions, instruments and actors to correctly coordinate wide policies with bottom-up practices can be different depending on the capacity of local governments, the transparency and accountability of practices etc. National and local governments should put in place a process to identify the major coordination gaps and adapt instruments to overcome them. In fact, practices in OECD countries show that national policies to reduce crime activities (tax evasion, organized crime, property crimes et al.) can be more effective if coordinated with increased responsibility of local authorities and involvement of the local community. While top-down policies can be ineffective if lower levels of government are not accountable and communities do not perceive the objectives as their own, on the other hand the devolution of responsibilities to lower level of government should be accompanied by instruments to integrate national and local objectives and coordinate actions to avoid that incentives to local accountability become an obstacle to national or state reforms. Recent news pointed out, for example, that the State’s correction system in Louisiana (United States) created a system of financial incentives to local sheriffs that resulted in longer prison sentences than the rest of the country and worse prison conditions than State run prisons.
134. The following key recommendations summarize the findings of this chapter:
• Develop evidence-based policymaking in this area by improving crime and security information at different geographical level. Mobilise Mexico’s statistical and analytical capacity at National and State levels to improve evidence on and quality of security indicators.
• Build on recent work regarding victimization surveys in order to improve the integration of objective and perception measures. The complementary use of these two types of measures can help to enhance the effectiveness of the judicial system and law enforcement by States.
• Give security and justice a strong local footing. Incorporate an assessment of the conditions and incentives for States/Localities that could help reforming the justice systems.

67
References
Canter, P. 2000. Using a Geographic Information System for Tactical Crime Analysis. In: Goldsmith V, McGuire PG, Mollenkopf JH, Ross TA, editors. Analyzing Crime Patterns: Frontiers of Practice. London: Sage Publications; 3-10.
Curry, David, and Irving Spergel. 1988. Gang homicide, delinquency, and community. Criminology 26:381–405.
Flint, C., Harrower, M., and R. Edsall, R. 2000. But How Does Place Matter? Using Bayesian Networks to Explore a Structural Definition of Place. Paper presented at the New Methodologies for the Social Sciences Conference. University of Colorado at Boulder.
Fotheringham, A.S., Brunsdon, C., and M.E. Charlton. 2002. Geographically Weighted Regression: The Analysis of Spatially Varying Relationships. Chichester: Wiley.
Goodchild, M. F. 1988. Spatial Autocorrelation. Concepts and Techniques in Modern Geography. Norwich: Geobooks.
Messner S.F., Anselin L., Baller R.D., Hawkins D.F., Deane G., Tolnay S.E. 1999. The Spatial Patterning of County Homicide Rates: An Application of Exploratory Spatial Data Analysis. Journal of Quantitative Criminology; 15(4):423-450.
Myhill, A. and K. Beak (2008) Public Confidence in the Police; National Policing Improvement Agency.
Rogerson, P. 2001. Statistical methods for geography. London, Sage.
Santtila P., Laukkanen M., Zappala A. 2007. Crime Behaviours and Distance Travelled in Homicides and Rapes. Journal of Investigative Psychology and Offender Profiling ; 4:1-15.
Tita, George E., John Engberg, and Jacqueline Cohen. 1999. An ecological study of violent gangs: The social organization of set space. Working paper, National Consortium on Violence Research, Carnegie Mellon University, Pittsburgh.
Tobler, W. 1970. A computer movie simulating urban growth in the Detroit region. Economic Geography 46:234–40.
O’Loughlin, J., and L. Anselin. 1992. Geography of international conflict and cooperation: theory and methods. In M.D. Ward (Ed.), The New Geopolitics. London: Gordon and Breach.
Vilalta, C. 2012a. How exactly does place matter? Space, place and spatial heterogeneity. Under review. Manuscript available with author: [email protected]
Vilalta, C. 2012b. The spatiality of judicial data. Applied Spatial Analysis and Policy. DOI: 10.1007/s12061-011-9070-z.

68
ANNEX 1 – METHODS FOR SPATIAL ANALYSIS
Spatial dependence is present when "the value of the dependent variable in one spatial unit of analysis is partially a function of the value of the same variable in neighbouring units" (Flint, et al. 2000, p. 4). Spatial dependence may be tested via spatial autocorrelation analysis. These techniques measure the degree of likeness of objects or activities across units (Goodchild, 1988). The oldest and most typical technique of spatial autocorrelation is Moran´s I global autocorrelation coefficient. Coefficients can be either positive or negative. Significant positive autocorrelation indicates a non-random clustering of values and significant negative autocorrelation indicates a non-random dispersion of values.
In this analysis, spatial dependence was diagnosed via Moran´s I spatial autocorrelation coefficients. These can be calculated in the following manner (Rogerson, 2001):
𝐼 =𝑛 𝑤!" 𝑦! − 𝑦 𝑦! − 𝑦!
!!!
𝑤!"!!
!! 𝑦! − 𝑦 !!
!
Where n is the number of spatial units, xi and xj are the values of the dependent variable in the neighbouring areas i and j, and Wij is the array of neighbouring units also known as neighbourhood matrix. Neighbourhood matrices can be based on different metrics; they can be based on the distance among territorial units or on their position (e.g. contiguity). Values cannot exceed 1 or -1. Again, positive values suggest a positive spatial autocorrelation, in which spatial units with similar values are spatially clustered, whereas negative values suggest negative spatial autocorrelation, in which neighbouring spatial unities present dissimilar values. A coefficient equal or close to zero is suggestive of a spatial random variable.
Spatial heterogeneity is the variation in relationships across space (O'Loughlin and Anselin, 1992). It may be due to three different reasons (Vilalta, 2012a): Two purely methodological and one theoretical.
The first methodological reason is sampling variation. It is unrealistic to expect same estimates from significantly different samples or subsets of spatial data. In regression analysis this statistical nuisance is characterized by non-constant error variance. The second methodological reason is model misspecification.
The third and theoretical reason is substantive spatial variation in relationships. This means that relationships are indeed inherently different across space as a result of a place or a local contextual effect. If spatial heterogeneity is present in the data set, whether it is substantive or not, OLS regression’s intercept and slope estimates will be biased. The reason is that different relationships in different locations will cancel each other out in the calculation of the estimates (Vilalta, 2012a).
Spatial heterogeneity can be detected via Geographically Weighted Regression (GWR). The GWR model extends the traditional OLS model by allowing parameters to vary across space (Fotheringham et al. 2002). The GWR model is written as (Vilalta, 2012a):
y! = a! + b!"x!" + e!
!
!!!

69
Where y! is the estimated value of the dependent variable, a! is the intercept, b!" is the parameter estimate for variable j, x!" is the value of the j-th variable for i, and e! is the error term.
Each spatial unit is given a different weight in the model. Similar to Moran´s I coefficients, larger weights are given to closer places and smaller to farther places. In traditional OLS, all places have the same weight as if all places shared the same location. In GWR, this assumption is also avoided in order to conform to Tobler's first Law of Geography that “everything is related to everything else, but near things are more related to each other" (Tobler, 1970, p. 236).
Typically, weights are calculated with a negative exponential continuous function of the square distance among geographic centroids.30 This way, closer units are given larger weights for the test of the model. For each place, the data will be weighted differently, so that results will be unique to that place (Fotheringham et al., 2002). The weighting function is written as (Rogerson, 2001):31
w!" = e!!!!"!
Where “wij” are the weights given between units “i” and “j”
Spatial data units have to be determined to calibrate each local equation. In GWR, spatial units neither have the same weight nor the same number of neighbours. Not only closer areas are more important than farther areas, but some are more “central” or closely located than others.32 Spatial kernels are utilized for this purpose. Spatial kernels are used to define which spatial units will be neighbours.33 These are necessary in the estimation of each local model. Spatial kernels can be either fixed or adaptive. A fixed spatial kernel implies that neighbours will be all units within a “fixed” distance, and an adaptive spatial kernel implies that neighbours will be defined based on the density of the data units. Where the data is sparse, adaptive spatial kernels will provide wider bandwidths, and where the data is dense, adaptive spatial kernels will provide narrower bandwidths (Fotheringham et al. 2002). As such, it is better to use adaptive spatial kernels as they provide identifiable variable bandwidths for each spatial data unit. This was the criteria for this analysis.34
A local linear equation is obtained for each spatial unit, meaning that the descriptive or explanatory model is tested in all areas or regions. Each is given a local intercept coefficient, a local slope coefficient for the covariate variable, and a local coefficient of determination. All these can be mapped in order to visually assess the null hypothesis assumption of no spatial heterogeneity in the results.35
30 Under a discrete or dichotomous definition of location, places within each local space are given a weight of “1”
and places outside the space are given a weight of “0” (Fotheringham et al, 2002). 31 Note that a traditional OLS model is given when distance is 0 (d = 0) or b = 0. 32 Spatial data units or places are not uniformly distributed across space. 33 A spatial kernel is both a measure of density and a method for density analysis. The kernel density function
calculates the density of a variable within a radius. A spatial kernel has shape and width (i.e. kurtosis and variance).
34 In spatial analysis, the bandwidth is a measure of the kernel. 35 Before that it is always convenient to run OLS or GWR on a one-by-one key independent variable basis and
constantly examine the resulting coefficients (i.e. exhaust all possible alternative hypotheses in spatiality).

70
Results: Linear correlations
Property crimes: Strongest structural covariate* Best covariate Pearson´s coefficient Canada GDP per capita 0.592*
France GDP per capita 0.577** Italy GDP per capita 0.414*
Mexico Unemployment Rate 0.221 Poland GDP per capita 0.503**
Turkey GDP per capita 0.631** USA GDP per capita 0.243*
Note: Based on Pearson´s linear correlation analysis. * Significant at 0.10 level and **0.05 level
Intentional homicide: Strongest structural covariate per country
Strongest covariate Pearson´s coefficient Canada Youth Unemployment Rate -0.782**
France Youth Unemployment Rate -0.282 Italy Population 15 - 64 years old (%) 0.342
Mexico Youth unemployment Rate -0.138 Poland GDP per capita 0.16
Turkey Youth Unemployment Rate 0.788** USA GDP per capita 0.632**
Note: Based on Pearson´s linear correlation analysis. * Significant at 0.10 level and **0.05 level
See page 57 for interpretation of the above results.

71
Results: Spatial correlation in intentional homicide rates
Intentional homicide: Spatial autocorrelation coefficients over time per country* Canada France Italy Mexico Poland Turkey USA
1990 n.a. n.a. n.a. 0.123* n.a. n.a. 0.074
1991 n.a. n.a. n.a. 0.087 n.a. n.a. 0.066
1992 n.a. n.a. n.a. 0.076 n.a. n.a. 0.096*
1993 n.a. n.a. n.a. 0.114* n.a. n.a. 0.089*
1994 n.a. n.a. n.a. 0.073 n.a. n.a. 0.088
1995 n.a. n.a. n.a. 0.123* n.a. n.a. 0.103*
1996 0.666** 0.090** n.a. 0.138** n.a. n.a. 0.093*
1997 0.113 0.086* n.a. 0.138** n.a. n.a. 0.110**
1998 0.147 0.091** n.a. 0.092 n.a. n.a. 0.136**
1999 0.243 0.065** n.a. 0.104 0.207 n.a. 0.119**
2000 0.149 0.060** n.a. 0.084 0.079 -0.162 0.132**
2001 0.628** 0.061** n.a. 0.098 0.183 -0.04 0.149**
2002 0.673** 0.102** n.a. 0.112* 0.108 -0.172 0.172**
2003 0.429** 0.093** n.a. 0.094 0.122 -0.177 0.188**
2004 0.255 0.086** n.a. 0.081 -0.182 -0.109 0.269**
2005 0.650** 0.081** n.a. 0.08 0.036 -0.314 0.362**
2006 0.823** 0.102 -0.178 0.061 -0.058 -0.274 0.370**
2007 0.408* 0.013 -0.115 0.077 -0.078 -0.143 0.338**
2008 0.405* 0.068** -0.165 0.124** -0.238 -0.001 0.339**
2009 0.428** 0.059** -0.122 0.130** -0.019 n.a. 0.336**
2010 0.241 0.097** n.a. 0.154** n.a. n.a. 0.402**
n 15 15 4 21 11 9 21
M 0.417 0.077 -0.145 0.103 0.015 -0.155 0.192
s 0.226 0.023 0.031 0.025 0.144 0.1 0.117
CV*** 54.20% 30.40% 21.50% 24.90% 990.70% 64.40% 60.90%
Source: Own calculations based on an Inverse Distance function with the exception of USA for which calculations were based on a Squared Inverse Distance function.
* Significant at 0.10 level and **0.05 level. Note that significance depends not only on the magnitude of the coefficient but on the sample size and the expected variation which may vary every year.
***CV stands for Coefficient of Variation which is the standard deviation (s) of the sample(n) coefficients divided by its arithmetic mean (M)

72
Results: Geographically Weighted Regression results for intentional homicide rates
Intentional homicide: Geographically Weighted Regression results (GWR) Canada France Italy
Covariate Youth Unemployment Rates
Youth Unemployment Rates
Population 15 - 64 years old (%)
R2 0.467 0.194 0.141
AICc 65.160 28.729 70.047
Global Moran´s I on residuals
-0.013 (0.728)
-0.060 (0.942)
-0.110 (0.471)
Spatial heterogeneity
Inverse relationships were detected
No inverse relationships (local slopes) were
detected*
No inverse relationships (local slopes) were
detected*
Intentional homicide cont.: Geographically Weighted Regression results (GWR) Mexico Poland Turkey
Covariate Youth Unemployment Rates
GDP per capita Youth Unemployment Rates
R2 0.245 0.107 0.470
AICc 263.604 41.233 69.769
Global Moran´s I on residuals
0.070 (0.464)
-0.066 (0.984)
-0.001 (0.809)
Spatial heterogeneity
No inverse relationships (local slopes) were
detected*
No inverse relationships (local slopes) were
detected*
No inverse relationships (local slopes) were
detected*
Intentional homicide cont.: Geographically Weighted Regression results (GWR)* USA
Covariate GDP per capita
R2 0.865
AICc 204.734
Global Moran´s I on residuals
0.015 (0.340)
Spatial heterogeneity
Inverse relationships were detected

73
Results: Spatial correlation in crime against property rates
Property crimes: Spatial autocorrelation coefficients over time per country Canada France Italy Mexico Poland Turkey USA
1990 n.a. n.a. n.a. n.a. n.a. n.a. 0.033
1991 n.a. n.a. n.a. n.a. n.a. n.a. 0.112
1992 n.a. n.a. n.a. n.a. n.a. n.a. 0.126
1993 n.a. n.a. n.a. n.a. n.a. n.a. 0.101
1994 n.a. n.a. n.a. n.a. n.a. n.a. 0.206**
1995 n.a. n.a. n.a. n.a. n.a. n.a. 0.204**
1996 n.a. 0.034 n.a. n.a. n.a. n.a. 0.240**
1997 n.a. 0.022 n.a. 0.248** n.a. n.a. 0.358**
1998 0.594** 0.047 n.a. 0.209** n.a. n.a. 0.356**
1999 0.521** 0.022 n.a. 0.221** 0.322** n.a. 0.314**
2000 0.495** 0.014 n.a. 0.227** 0.263* -0.011 0.298**
2001 0.523** 0.012 n.a. 0.243** 0.255* 0.048 0.285**
2002 0.442* 0.016 n.a. 0.139** 0.250* 0.088 0.286**
2003 0.395* 0.006 n.a. 0.104* 0.157 0.01 0.356**
2004 0.343* 0.011 n.a. 0.088* 0.106 0.184 0.404**
2005 0.353* -0.006 n.a. 0.046 0.116 0.124 0.427**
2006 0.300* 0.008 0.141** -0.001 0.123 0.11 0.407**
2007 0.408* 0.009 0.143** 0.023 0.163 0.139 0.376**
2008 0.27 0.016 0.096* -0.017 0.126 0.124 0.312**
2009 0.251 0.015 0.144** -0.057 0.086 n.a. 0.295**
2010 0.214 0.001 n.a. n.a. n.a. n.a. 0.278**
n 13 15 4 13 11 9 21
M 0.393 0.015 0.131 0.113 0.179 0.091 0.275
s 0.118 0.013 0.023 0.109 0.079 0.064 0.11
CV*** 30.00% 84.90% 17.80% 95.90% 44.40% 70.10% 39.80% Source: Own calculations based on an Inverse Distance function with the exception of USA for which calculations were based on a Squared Inverse Distance function. * Significant at 0.10 level and **0.05 level. Note that significance depends not only on the magnitude of the coefficient but on the sample size and the expected variation which may vary every year. ***CV stands for Coefficient of Variation which is the standard deviation (s) of the sample (n) coefficients divided by its arithmetic mean (M)

74
Results: Geographically Weighted Regression results for crimes against property
Property Crimes: Geographically Weighted Regression results (GWR) Canada France Italy
Covariate GDP per capita GDP per capita GDP per capita
R2 0.693 0.304 0.272
AICc 235.166 357.109 347.822
Global Moran´s I on residuals
0.074 (0.565)
0.051 (0.264)
-0.015 (0.694)
Spatial heterogeneity
No inverse relationships (local slopes) were
detected*
No inverse relationships (local slopes) were
detected*
No inverse relationships (local slopes) were
detected*
Property Crimes cont.: Geographically Weighted Regression results (GWR) Mexico Poland Turkey
Covariate Unemployment Rate GDP per Capita GDP per Capita
R2 0.102 0.561 0.570
AICc 533.911 234.884 340.186
Global Moran´s I on residuals
-0.070 (0.600)
-0.203 (0.436)
-0.023 (0.919)
Spatial heterogeneity
No inverse relationships (local slopes) were
detected*
No inverse relationships (local slopes) were
detected*
No inverse relationships (local slopes) were
detected*
Property Crimes cont.: Geographically Weighted Regression results (GWR) USA
Covariate GDP per capita
R2 0.614
AICc 783.244
Global Moran´s I on residuals
0.029 (0.632)
Spatial heterogeneity
Inverse relationships (local slopes) were
detected

75
CHAPTER III: AVAILABILITY OF DATA ON CRIMINAL JUSTICE SECTOR PERFORMANCE FOR MEXICAN STATES
3.1 Introduction
135. Given the strong territorial nature of crime, crime policies should take into consideration local specificities and be tailored to the root driving causes unique to each region. To support this, evidence is needed not just at the national level but sub-national level as well. Consequently, this chapter explores the availability, validity and reliability of crime statistics at the state level in Mexico carried out through a detailed data scoping exercise. The selection criteria for data to be included into this chapter are the following:
• Availability of data for a critical mass of Mexican States
• Quality of data in terms of validity and reliability
• Comparability – e.g. similar or common definitions and methodologies across the States
• Alignment, to the extent possible, with commonly used international indicators in order to allow – eventually – the comparison of Mexican regional data internationally.
136. Data meeting these requirements are presented in this chapter and grouped according to the framework described in Chapter I --inputs, processes, outputs and outcomes—which, when combined, can provide insights into the various dimensions of performance including capacity, efficiency, effectiveness and quality. The chapter is divided into three parts, starting with capacity indicators, followed by output indicators, and finally concluding with outcome indicators. Altogether Chapter II presents 18 indicators. It is important to note that the dataset presented here does not constitute a formal proposal of indicators that should be adopted to measure the performance of criminal justice system in Mexico. Rather, it is a first step in assessing the strengths and weaknesses of available sub-national level data with the ultimate goal to construct a suit/cadre of variables that can be agreed upon by stakeholders to benchmark the performance of the criminal justice system over time, regionally and – to the extent possible – internationally. As a result, for each indicator information is provided on why it is relevant; how it is measured; measurement across states; and what its strengths and weaknesses are in terms of capturing the phenomenon of interest to policy makers. While the average, minimum and maximum values as well as dispersion of the variables are noted; there is no detailed analysis and explanation of the differences found across states. This requires further research to ascertain statistically significant and causal relationships between the variables identified.

76
Table 1. Summary of regional indicators included in the study
Dimension of performance Sub-dimension Indicator Sources Used Years
Compiled
Input variables Government Outlays (spending proxy)
State appropriations for criminal justice
Annual State Budget Decrees 2008-2011
State appropriations for criminal justice by function
Annual State Budget Decrees 2008-2011
State appropriations on criminal justice per capita
Annual State Budget Decrees 2008-2011
Federal transfers to States for criminal justice
Federation’s Annual Budget 2011
Human and Infrastructure Resources
Police officers per inhabitants and reported crimes per police officer
SESNSP 2011
Reported crimes per public prosecutor
INEGI, SESNSP, CONAPO 2011
Prison capacity per 100,000 inhabitants SSP 2011
Output variables
Processes Clearance rate for total reported crime SESNSP, INEGI 2008-2010
Clearance rate for intentional homicide
INEGI 2008-2010
Percentage of total prison population awaiting conviction
SSP 2011
Outcome variables
Crime rates Violent crime as a share of total reported crime SESNSP 2009-2011
Intentional homicides INEGI, CONAPO 2009-2011 Vehicle theft reports per 10,000 registered vehicles SESNSP, 2009-2010
Victimization rate National Victimization Survey, INEGI 2011
Estimated reported crime as a share of total crime
National Victimization Survey, INEGI, SESNSP
2011
Trust in criminal justice institutions
Trust in institutions: Police (state and municipal)
National Victimization Survey, INEGI 2011
Trust in court system: Public prosecutors and judges
National Victimization Survey, INEGI 2011
Perceptions of safety Perceptions of safety National Victimization Survey, INEGI 2011
Source: OECD Elaboration
137. The results of this first scoping exercise show that there are important data gaps that could hinder the evaluation of the performance of the criminal justice system in Mexico. Those gaps exist in expenditures data, information of processes and public management practices as well as the quality of those processes and services provided such as access to criminal justice, responsiveness of police, prosecutors and courts, accuracy or quality of decisions.

77
3.2 Input indicators
138. When measuring the performance of criminal justice institutions, it is essential first to consider their capacities to achieve the desired policy objectives. Indeed, having able institutions endowed with adequate resources is arguably a key driving force of positive performance. There is evidence, for instance, estimating that a 10% increase in the number of police officers can reduce certain kinds of crimes - mainly property crimes - by as much as 3% (Klick and Tabarrok 2005). Other research indicates that prison capacity may influence recidivism (e.g. inmates from overcrowded prisons are more likely to be repeat offenders) (Chen and Shapiro 2007). Inputs data are also a necessary piece of the puzzle in terms of evaluating efficiency, or value for money attained with tax-payers’ money, helping researchers ascertain whether an increase in financial investments corresponds to an equally proportional increase in the quantity or quality.
139. However, in addition to measuring the quantity of investments and resources, understanding the quality of these can be equally important. For instance, further information on the recruitment, training and performance management of criminal justice employees would provide valuable insights into the skills and competencies of human resources, as well as the incentive structure in place for better individual performance. Likewise, the compensation or remuneration practices for police/judges/prosecutors and prison officials can help evaluators better understand potential vulnerabilities to corruption.
140. As we have seen, the capacity dimension of performance corresponds with the “inputs” and “processes” categories of indicators. As a general trend, input data are the most common performance information utilised in evaluations due to their availability and accessibility, as line ministries and parliaments are generally required to monitor and disclose financial and operational information on spending in their annual budgets as well as mid-year and end-year audits/reports. Indeed, this category of indicators accounts for nearly half of the variables included in this chapter. The amount of sub-national government outlays destined for (and federal transfers received by) the administration of criminal justice institutions are therefore presented here, along with the numbers of police, judges and prosecutors scaled to the size of the regional population. Additionally, information on prison capacity is included as an indicator of the available infrastructure in the prison system. One finding that has emerged from this exercise is that further information is required on the public management practices of criminal justice institutions at the sub-national level in Mexico. Developing a standardised method of collecting this information, either through existing survey instruments or through the development of a tailored framework, could be considered as a next step for measuring the performance of criminal justice institutions at the regional level.

78
1. State appropriations for criminal justice
141. In the absence of detailed expenditures data at the sub-national level, the amount of state appropriations allocated to criminal justice institutions and their policies provides one proxy for the financial resources invested into preventing and combating crime in each of the different states. These data sum up regional governments’ budget itemizations related to three main areas: a) public safety, crime prevention and the penitentiary system, b) justice prosecution, and c) the court system.
142. A higher percentage of appropriations relative to the total budget however could have several explanations: it may suggest a higher priority, or political attention placed on this issue relative to other policy areas. It could also be a reflection, however, of greater need, e.g. states with higher incidences of crime may require greater financial investments in this area than states with less crime.
143. On average across the states, appropriations on criminal justice account for 6.4% of the total State budget, or just over 0.7% of State GDP - the large majority of States stay close to this figure. Mexico’s Federal District has the highest amount of appropriations (14.4% of its budget), mainly because of the large police force that they maintain. The State of Puebla shows the lowest appropriations (2.5% of its budget). Nuevo León is the state with the largest positive change between the years 2009-2011 with a 2.8 percentage point increase in criminal justice appropriations. Conversely Sinaloa ranked last with a reduction of 2 percentage points in the same period.
Definitions and methodology
144. Data were compiled from each State’s approved (final) annual budget and include those line items appropriated to the 3 categories described in the text. Please see indicator 2 of this chapter for a description of the categories of appropriations constituting this aggregate. These appropriations are summed and divided by the total annual approved budget for each state. Data refer to fiscal years not calendar years.
145. It is important to note that these appropriations include also transfers received from the federal budget. Please see indicator 4 for data on federal transfers.
146. In the absence of detailed expenditures data, budget appropriations can act as a proxy for government spending. As opposed to government expenditures, which represent funds already spent, appropriations represent line items in the budget approved for spending for those purposes. However, they represent government intentions (not actions) and are subject to change. For instance, there is some flexibility on the part of different agencies on how and when appropriated funds may be used (e.g. they may be transferred to other programmes under their policy portfolios and/or be carried over to the next fiscal year).
Source:
147. Data for this indicator are compiled from the annual state budget (final) approved by each state´s legislature. Data for States’ GDP are from INEGI. For Baja California Sur, the total corresponds only to public safety and prosecution appropriations.
Reference years
148. All data corresponds to fiscal years 2009-2011. For the following States data was only available for the noted years: Queretaro 2011, Jalisco 2010-2011, Puebla 2010-2011, Tlaxcala 2010-2011.

79
Figure 1. State appropriations on criminal justice as a percentage of total state budgets (2011)
Figure 2. State appropriations on criminal justice as a percentage of state GDP (2011)
0%
2%
4%
6%
8%
10%
12%
14%
16%% of state budget
0.0%
0.2%
0.4%
0.6%
0.8%
1.0%
1.2%
1.4%% of state GDP

80
Figure 3. Change in state appropriations on criminal justice as a percentage of total state budgets between 2009 and 2011 (in percentage points)
Figure 4. Dispersion analysis: state appropriations on criminal justice as a percentage of total state budgets (2011)
-3
-2
-1
0
1
2
3
4Percentage point change, 2009-2011
0% 2% 4% 6% 8% 10% 12% 14% 16%

81
Figure 5. Geographical analysis: state appropriations on criminal justice as a percentage of total state budgets (2011)
Note: The intervals for the geographical analysis maps are: 1st interval: Values lower than Mean minus one Standard Deviation; 2nd interval: Values between 1st interval and the mean; 3rd interval: Values between 2nd interval and values of mean plus on standard deviation; 4th interval: Values higher than mean plus one standard deviation.
Lower than 4%
Between 4% - 6.4%
Between 6.4% - 8.8%
Higher than 8.8%

82
2. State appropriations for criminal justice by function
149. Further disaggregation of state appropriations on criminal justice institutions can be useful for identifying the priorities and main cost components within this area of spending. Having a better understanding of the individual components of spending provides greater insights into which specific areas may be the key “levers” that be may be related to certain outputs, and ultimately, crime reduction. For instance, appropriations for public safety and crime prevention, which correspond namely to the police force and to the penitentiary system, may correlate more strongly with incidences of crime than other categories of spending. On the other hand, justice prosecution and court system appropriations may be more related to the functioning of the courts, e.g. clearance rates and average processing times. Further research is needed to establish causality between these variables, but without the necessary disaggregation of data such analyses cannot be performed.
150. On average across the states, the highest area of spending is on public safety and crime prevention, this category receives in average 47% of the total state budget for criminal justice. Comparatively justice prosecution receives 29% and the court system 24%.
151. From an efficiency perspective, appropriations by function are also crucial for understanding the key cost drivers of criminal justice institutions and identifying potential good practices. Given similar demands or socio-economic conditions across certain states, comparisons may reveal which states can produce the same outputs with fewer resources. Again, detailed expenditures data is needed for calculating unit costs (e.g. cost per case, for instance).
152. However, the relationship between financial inputs and performance is not always evident. The most interesting observation made after ranking states by the percentage of appropriations allocated to public safety and crime prevention (see Figure 6), for instance, relates to the states of Chihuahua and Sinaloa. Although these two states have very high criminal incidence levels, they do not allocate funds intensively towards the prevention of crime and public safety. The lack of expenditure may account for the low performance levels. On the other hand, Coahuila has assigned funds quite intensively towards the prevention of crime and on public safety. This intensity of spending allocation might be a response to increasing levels of criminal incidence.
153. Conversely, with regards to ranking states according to the share of funds dedicated to justice prosecution and the court system, it could be expected that states with lower levels of criminal incidence have a higher proportion of appropriations destined towards prosecution and the criminal justice system, the main reason being that those states did not have to spend larger amounts of resources towards crime prevention and public safety and should rather focus on a more efficient handling of those individuals that were indicted. Yet the two states that rank the highest, Chihuahua and Sinaloa, do not fit this profile. The state of Tlaxcala has low levels of criminal incidence but dedicates few resources to the criminal justice system.
Definitions and methodology
154. Data were compiled from each state’s approved (final) annual budget. Budgetary line items relevant to criminal justice appropriations were aggregated into three categories. 1. Public Safety and Crime Prevention represent mostly preventive and responsive police duties. 2. Prosecution refers to the part of the criminal justice system responsible for processing reported crime, the investigative criminal duties and representing the state in the criminal trial. 3. The court system refers to the state´s judicial branch in charge of maintaining the district courts and administrating the trials. These appropriations are summed and divided by the total annual approved budget for each state. Data refer to fiscal years not calendar years.

83
155. A strong weakness of the data on court system appropriations is that there is no distinction between appropriations between civil and criminal law systems. The court system appropriations presented in these indicators therefore overestimate the appropriations for criminal courts. Second, it is important to note that these appropriations include also transfers received from the federal budget.
156. Most states present sufficiently disaggregated data that enables the compilation of this indicator. However, the following states use a different reporting methodology that makes this variable unavailable: Coahuila state budget merges public safety and prosecution, Queretaro merges public safety, prosecution and judicial branch into one category for years before 2011 and Zacatecas for years before 2010.
157. Please see indicator 1 of this chapter for further information on the differences between expenditures and appropriations.
Source
158. Data for this indicator are compiled from the annual state budget approved by each state´s legislature.
Reference years
159. All data are compiled for the fiscal years 2008-2011, with the following exceptions; Durango 2011, Queretaro 2011, Jalisco 2010-2011, Nayarit 2010-2011, Puebla 2010-2011, Tlaxcala 2010-2011.
Figure 6. Structure of criminal justice appropriations by function (as a percentage of total appropriations, 2011)
0%10%20%30%40%50%60%70%80%90%
100%
Coa
huila
San
Luis
Pot
osí
Hid
algo
Tlax
cala
Col
ima
Oax
aca
Dis
trito
Fed
eral
Mic
hoac
ánN
uevo
Leó
nEs
tado
de
Méx
ico
Yuca
tán
Gue
rrer
oTa
basc
oAg
uasc
alie
ntes
Jalis
coSo
nora
Nat
iona
l ave
rage
Cam
pech
eTa
mau
lipas
Chi
apas
Zaca
teca
sBa
ja C
alifo
rnia
Qui
ntan
a R
ooM
orel
osN
ayar
itVe
racr
uzD
uran
goG
uana
juat
oPu
ebla
Que
réta
roSi
nalo
aC
hihu
ahua
Public Safety Prosecution Court System

84
Figure 7. Criminal justice appropriations by function (millions of USD, 2011)
Figure 8. Criminal justice appropriations by crime (USD, 2011)
0
200
400
600
800
1,000
1,200
1,400
1,600
1,800USD, Millions Public Safety Prosecution Court System
0
5,000
10,000
15,000
20,000
25,000
30,000
35,000
40,000
45,000
50,000
55,000USD

85
3. State appropriations on criminal justice per inhabitant
160. While criminal justice appropriations are one important proxy of governments’ efforts towards criminal justice, scaling these appropriations to the state population is important for data interpretation. Indeed, larger (or lesser) spending on criminal justice could and does often reflect the higher (or lower) demands due to population size. Additionally, excluding federal transfers, criminal justice appropriations on a per capita basis can provide an indication of the tax/revenue burden on individuals for maintaining spending on criminal justice over the longer term relative to other public goods and services.
161. Because this is the variable that is the most related to the state efforts towards law enforcement and criminal justice, it is expected to be strongly correlated to access to justice, efficacy and efficiency indicators. Furthermore, it would be expected that states with higher per capita appropriations for criminal justice to have better overall criminal incidence outcomes, justice system performance outcomes and consequently higher public perception outcomes such as public trust in institutions and feeling of public safety.
162. The first striking result from comparing all Mexican states in this category (Figure 9) is the extremely high amount – almost 180 USD per person – appropriated by the Federal District for criminal justice. It significantly outperforms most states in this category, which is impressive given its population size. In comparison the only other state with comparable population levels, the State of México, spends less than a third of what the DF spends per inhabitant. With 18 USD, the state of Puebla allocates the lowest amount of funding per inhabitant towards criminal justice. Another interesting result is that the states of Coahuila, Tamaulipas and Chihuahua all rank significantly below the national mean despite facing high elevated criminal incidence outcomes. Finally, dispersion analysis (Figure 11) shows that per inhabitant expenditure in criminal justice is comprised between $50 and $60 dollars. While there are few extreme outliers most states spend similar amounts of resources per inhabitant, a fact that might be useful for future benchmarking and comparison.
Definitions and methodology
163. This indicator represents the State appropriations on criminal justice divided by each States’ respective population that includes all state residents. It is important to note that these appropriations include also transfers received from the federal budget. Please see indicators 1 and 2 for description of appropriation categories and the difference between expenditures and appropriations.
164. To facilitate international comparison, all State appropriation figures were converted into USD, utilizing the 2011 exchange rate average from the Bank of Mexico whereby $1 USD = $12.43 MXN.
Source
165. Data for this indicator are compiled from the annual state budget approved by each state´s legislature.
166. Relevant population data comes from Mexico´s National Population Council (CONAPO) projections for years 2008-2011.
Reference Years
167. All data compiled for the fiscal years 2008-2011, with the following exceptions: Durango 2011, Queretaro 2011, Jalisco 2010-2011, Nayarit 2010-2011, Puebla 2010-2011, and Tlaxcala 2010-2011.

86
Figure 9. Criminal justice appropriations per inhabitant (USD, 2011)
Figure 10. Criminal justice appropriations per inhabitant by function (USD, 2011)
0
20
40
60
80
100
120
140
160
180
200USD
0
20
40
60
80
100
120
140
160
180
200USD Public Safety Prosecution Court System

87
Figure 11. Dispersion analysis: criminal justice appropriations per inhabitant (USD, 2011)
Figure 12. Geographical analysis: criminal justice appropriations per inhabitant (USD, 2011)
$0 $50 $100 $150 $200
Lower than $31 USD
Between $31 - $62 USD
Between $62 - $92 USD
Higher than $92 USD

88
4. Federal transfers to States for criminal justice
168. In September of each year Mexico’s lower chamber of Congress approves the budget for the upcoming fiscal year. A sizeable part of this budget consists of transfers that are assigned to the states to fulfil a variety of specific objectives, including the functioning of criminal justice institutions. The indicators below examine the resources transferred by the Federal government to the state governments that are subsequently directed towards crime prevention, public safety and law enforcement objectives. The amount of transfers a state receives can depend on a number of factors including need (e.g. incidences of crime), or population.
169. The transfers included in this category are directly aimed at improving the functioning of state level institutions that have public safety, law enforcement and to lesser degree criminal justice competencies. In contrast with most state level appropriations, these federal transfers provide resources to improve the mentioned institutions, for example by improving and training police forces or by facilitating the transition to the new criminal justice system characterized by oral trials. Due to their origin it is also important to note that these transfers are subject to supervision and evaluation by the federal government.
176. The federal transfers included for this indicator originate from two main programs: the Accountable Police program, and the Public Safety Contributions Fund (FASP), the latter being the most sizable of the two. FASP transfers for the fiscal year 2011 are determined by the following formulaic allocation: population (40%), criminal Incidence levels (25%), vetting of the state police force (15%), the reporting of public safety information (15%) and previous use of public safety federal transfers (5%). The Accountable Police initiative transfers a bulk $2.4 million dollar for those states subscribed to the program with up to an additional $8 million depending on results. Additional federal programs for the improvement of state level public safety and criminal justice exist but the programs considered for this indicator only include those programs where resources were directed towards state governments. These additional programs include, but are not limited to, the Municipal Public Safety Subsidy (transfers to municipalities).
177. By combining this information with the states’ budget appropriations, the percentage of law enforcement and criminal justice state expenditures that originates from federal sources can be estimated. This indicator is valuable for a number of reasons. Firstly, as a measure of “dependency” and state effort; showing to what extent a particular state is spending its own resources on public safety. Secondly, it allows the analysis on how effectively and efficiently the federal government allocates its law enforcement/ criminal justice transfers. Accordingly, it would be interesting to see if the federal government is transferring more resources to those states with more pressing needs of reform and improvement such as those under current pressure from large scale drug trade organizations.
178. On average, the federal government transfers for criminal justice purposes represent about $8.3 dollars per person. Federal transfers accounted on average for 14.2% of total criminal justice appropriations. The ranking of Mexican states according to the percentage of federal transfers that constitute their public safety, law enforcement and criminal justice appropriations (Figure 13), does not yield a clear result. Interestingly the first ranked state Tlaxcala has a low population and a low criminal incidence level, yet still almost a quarter of its outlays come from federal sources. Admittedly, states with those characteristics have also little incentive to invest in law enforcement due to their low criminality levels. In contrast the Federal District, because of its huge expenditure, has a very low share of federal transfers’ percentages in their criminal justice budgets. Similarly Estado de México is also a state with very large outlays for criminal justice objectives and ranks second to last.
179. In general federal transfers seem to be tightly packed in between 10% and 20% of total criminal justice appropriations with only a few outlying states outside this range. Some states, notably Nuevo León,

89
Michoacán, Jalisco, Baja California and Veracruz, receive transfers below the national average despite public safety concerns in these regions.
Definitions and methodology
180. Annually Mexico´s national congress approves a number of transfers to states intended for a variety of law enforcement and criminal justice uses; these include an assortment of expenditures towards outcomes such as the training of state police forces, the national public security system and the transition towards the new penal justice system. In general these federal transfers come from formulaic allocation that takes into account indicators such as the state´s population and the reported crime levels. These transfers were summed and divided by each State´s criminal justice and law enforcement appropriations.
170. It is important to note that the ratios shown here reflect a proxy in the absence of detailed expenditures data at the sub-national level in Mexico. Though all figures are attained from official budget documents, the numerator and denominator of the ratios are from two different sources (e.g. Federal budgets vs. States budgets).
Sources
171. Annual federal transfers to states for public safety and criminal justice purposes are published annually by the Chamber of Deputies in the Federation’s Annual Budget. Detailed FASP and Accountable police transfers are published by the SESNSP.
http://www.secretariadoejecutivo.gob.mx/work/models/SecretariadoEjecutivo/Resource/394/1/images/Difusion_Asignacion_Resultados_FASP_2011.pdf
http://www.secretariadoejecutivo.gob.mx/es/SecretariadoEjecutivo/Avances
Reference Years
172. All data compiled for fiscal year 2011 to correspond with state criminal justice appropriations.

90
Figure 13. Share of state's criminal justice budget that originates from federal transfers (in percentages, 2011)
Figure 14. Dispersion analysis: share of state's criminal justice budget that originates from federal transfers (in percentages, 2011)
0%
5%
10%
15%
20%
25%
30%
0% 5% 10% 15% 20% 25%

91
Figure 15. Criminal justice federal transfers per inhabitant (USD, 2011)
Figure 16. Geographical analysis: federal transfers as a share of total criminal justice appropriations (2011)
0
5
10
15
20
25USD
Lower than 8%
Between 8% - 14.1%
Between 14.1% - 19%
Higher than 19%

92
5. Police officers per inhabitants and reported crimes per officer
173. In addition to the financial resources invested towards improving security, the quantity of human resources allocated to this cause is also key. One would expect criminal activity, or certain types of it, to decrease with a stronger police presence. On the other hand, the causality of this relationship is difficult to discern as the number of police in the field is expected to increase with growing incidences of crime.
174. The relationship between the number of police and crime becomes more complicated when considering the overlapping jurisdictions between municipal and state police, as well as the issue of under reported crimes (less than 20% of crimes are reported).
175. Scaling the number of crimes to the number of police for instance, could provide a better indication of the adequacy of the police force to the security situation of each State, if not an indication of the “burden” or workload on officers. However, the indicator is not immune to the issue of under-reporting, which must be considered when interpreting this variable.
176. In Figure 17, Mexican states are ranked according to the number of police officers per 100,000 inhabitants. The average number of police officers per 100,000 inhabitants is 317. From this graphical analysis it is easy to see the very large number of police officers that the Federal District has and this figure becomes even more impressive considering the extremely large population within its jurisdiction. Additionally, the Federal District has a very small geographic area to serve, making the access of police officers to any given place within the city easier. With numbers of this scale, it is surprising that the Federal District still ranks as the 4th highest state in terms of victimization.
177. Interestingly, when the value for the federal district, the range across all states is rather compact.
178. Across Mexico, there is an average of 5.4 reported crimes per police officers (Figure 20). Most notably, the majority of the states with a current criminality crisis rank very high in regard to the number of reported crime per police officers. This could be due to the natural lag between higher criminal incidence levels and the time needed to increase the state capabilities to respond to such levels. It could also reflect limited budgetary resources in these states to increase police forces.
Definitions and methodology
179. This variable divides the state’s police force by the corresponding state population and the total reported crimes by the state’s police force. The state´s police force includes municipal police, state police and investigative police (Policía Ministerial), and additionally for the federal district it also includes bank and commercial police (Policía Bancaria y Comercial).
180. In general terms, municipal and state police are assigned to public safety and crime prevention tasks. The ministerial police perform investigative duties relevant to prosecution and could be considered equivalent to a detective police force. The bank and commercial police have mostly bulk cash transfer and financial institutions protection duties.
181. This indicator divides the number of police officers, which includes municipal, state, investigative and bank and commercial police, by the number of crimes as reported by the number of criminal preliminaries of both the state and federal jurisdiction for each state.
182. Total reported crime was compiled by the National Public Safety System (SNSP) with information from the Office of the General Attorney for those crimes of the federal charter and from each state´s attorney´s office for those crimes of the local charter. The difference between crimes of the local and federal charter is described on section 6 (Prosecutors per reported crimes).

93
Source
183. Police force data was compiled from a publication by the executive secretariat of the national public safety system (SESNSP) a dependency of the federal executive power accessible at:
184. https://www.secretariadoejecutivosnsp.gob.mx/en/SecretariadoEjecutivo/Estado_de_Fuerza_de_las_Corporaciones_Policiales_Estatales
185. Total reported crime as compiled by the SESNSP, part of the federal executive branch, using federal and state crime report data.
186. Population Data from CONAPO.
Reference years
187. All data refer to the year 2011.
Figure 17. Number of police officers per 100, 000 inhabitants by state (2011)
Figure 18. Dispersion analysis: number of police officers per 100,000 inhabitants (2011)
0
200
400
600
800
1,000
1,200
Number of police officers per 100,000 inhabitants
0 200 400 600 800 1000 1200

94
Figure 19. Geographical analysis: number of police officers per 100,000 inhabitants (2011)
Figure 20. Number of reported crimes per police officer (2011)
0
2
4
6
8
10
12
14
16
Number of reported crimes per police officer

95
Figure 21. Geographical analysis: number of reported crimes per police officer (2011)
Lower than 2.5
Between 2.5 – 5.4
Between 5.4 – 8.2
Higher than 8.2
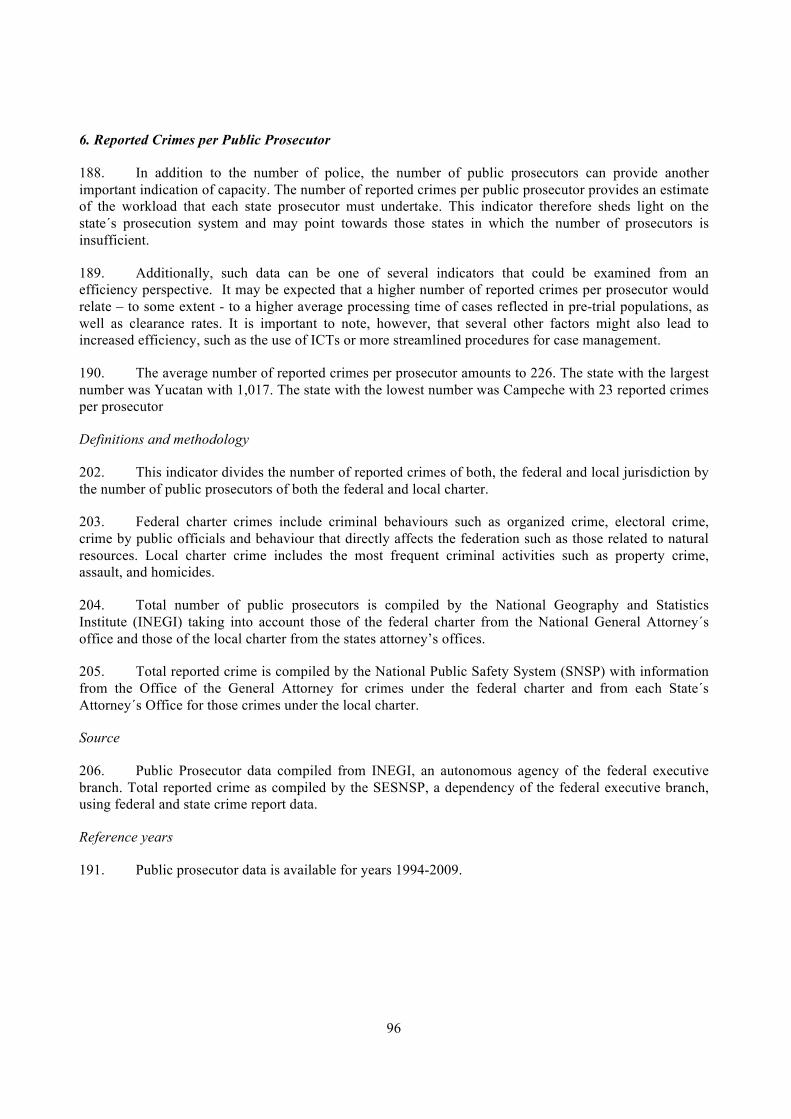
96
6. Reported Crimes per Public Prosecutor
188. In addition to the number of police, the number of public prosecutors can provide another important indication of capacity. The number of reported crimes per public prosecutor provides an estimate of the workload that each state prosecutor must undertake. This indicator therefore sheds light on the state´s prosecution system and may point towards those states in which the number of prosecutors is insufficient.
189. Additionally, such data can be one of several indicators that could be examined from an efficiency perspective. It may be expected that a higher number of reported crimes per prosecutor would relate – to some extent - to a higher average processing time of cases reflected in pre-trial populations, as well as clearance rates. It is important to note, however, that several other factors might also lead to increased efficiency, such as the use of ICTs or more streamlined procedures for case management.
190. The average number of reported crimes per prosecutor amounts to 226. The state with the largest number was Yucatan with 1,017. The state with the lowest number was Campeche with 23 reported crimes per prosecutor
Definitions and methodology
202. This indicator divides the number of reported crimes of both, the federal and local jurisdiction by the number of public prosecutors of both the federal and local charter.
203. Federal charter crimes include criminal behaviours such as organized crime, electoral crime, crime by public officials and behaviour that directly affects the federation such as those related to natural resources. Local charter crime includes the most frequent criminal activities such as property crime, assault, and homicides.
204. Total number of public prosecutors is compiled by the National Geography and Statistics Institute (INEGI) taking into account those of the federal charter from the National General Attorney´s office and those of the local charter from the states attorney’s offices.
205. Total reported crime is compiled by the National Public Safety System (SNSP) with information from the Office of the General Attorney for crimes under the federal charter and from each State´s Attorney´s Office for those crimes under the local charter.
Source
206. Public Prosecutor data compiled from INEGI, an autonomous agency of the federal executive branch. Total reported crime as compiled by the SESNSP, a dependency of the federal executive branch, using federal and state crime report data.
Reference years
191. Public prosecutor data is available for years 1994-2009.

97
Figure 22. Number of reported crimes per public prosecutors (2009)
Figure 23. Dispersion analysis: number of reported crimes per public prosecutors (2009)
0
200
400
600
800
1,000
1,200Number of crimes per public prosecutor
0 200 400 600 800 1,000 1,200

98
Figure 24. Geographical analysis: number of reported crimes per public prosecutor (2009)
Lower than 19
Between 19 – 223
Between 223 – 427
Higher than 427

99
7. Prison capacity per 100,000 inhabitants
192. The relevance of this indicator is based on its ability to show how well prepared a state’s criminal justice system is in relation to incidence of crime. It also provides critical information on pressures for courts’ sentencing (e.g. highly overcrowded prisons may suggest a need for alternative solutions to traditional punishment). State governments should strive for sufficient prison capacity to adequately provide for offenders that are processed, indicted and sentenced through its court system.
193. Each state should have a sufficient prison capacity (considered here as the number of prisoner spaces) to accommodate the expected number of incoming inmates. Due to difficulties to expand prison capacity rapidly, states should in theory have a buffer, implying an unused capacity to house inmates in the eventuality of a higher than expect number of inmates arriving. Alternatively, such information should influence sentencing and legal reform, to allow for alternatives to imprisonment for certain crimes. Also, states with higher historical criminal incidence rates should accordingly have higher prison capacities.
194. In Figure 25 Mexican states are ranked according to their prison capacity. The average prison capacity in Mexican States was 179 prisoner spaces per 100,000 inhabitants and the highest value being Baja California with 446 spaces and the lowest Hidalgo with 27.9. Except for the case of Colima, the majority of states with high prison capacities are those that have had historically higher criminal incidence rates, for example Baja California and the Federal District.
Definitions and methodology
195. This indicator divides the number of each state´s number of prisoner spaces (prison capacity) by the relevant state´s total population (total residents).
196. One key weakness of this indicator however is that this data only takes into account those prisoners recorded by the state´s government although the prison population may also include inmates of the federal charter. Therefore such information could provide an underestimation.
Source
197. Prison capacity compiled from a publication from the federal public safety secretariat (SSP), an organization of the federal executive branch. This publication is accessible at:
198. http://www.ssp.gob.mx/portalWebApp/ShowBinary?nodeId=/BEA%20Repository/365162//archivo
199. Relevant population data from the National Population Council (CONAPO)
Reference years
200. Prison capacity data is available only for 2011.

100
Figure 25. Prison capacity (number of prisoner spaces) per 100,000 inhabitants (2011)
Figure 26. Prison capacity (number of prisoner spaces) per 100,000 reported crimes (2011)
0
50
100
150
200
250
300
350
400
450
500
Number of prison spaces per 100,000 inhabitants
0
100
200
300
400
500
600
700
800Number of prison spaces per 100,000 reported crimes

101
Figure 27. Dispersion analysis: prison capacity (number of prisoner spaces) per 100,000 inhabitants (2011)
Figure 28. Geographical analysis: prison capacity (number of prisoner spaces) per 100,000 inhabitants (2011)
0 50 100 150 200 250 300 350 400 450

102
Figure 29. Prison population per 100,000 inhabitants (2011)
Figure 30. Change in prison population between 2008 and 2011
0
100
200
300
400
500
600Prison population per 100,000 inhabitants
-2,500
-2,000
-1,500
-1,000
-500
0
500
1,000
1,500
2,000
2,500
3,000
3,500
Mic
hoac
ánSi
nalo
aD
uran
goG
uana
juat
oC
oahu
ilaBa
ja C
alifo
rnia
Chi
huah
uaVe
racr
uzC
olim
aTa
mau
lipas
Sono
raZa
cate
cas
Baja
Cal
iforn
ia S
urEs
tado
de
Méx
ico
Mor
elos
Nay
arit
Nat
iona
l ave
rage
Yuca
tán
Cam
pech
eQ
ueré
taro
Tlax
cala
Jalis
coSa
n Lu
is P
otos
íQ
uint
ana
Roo
Oax
aca
Chi
apas
Pueb
laAg
uasc
alie
ntes
Gue
rrer
oH
idal
goTa
basc
oN
uevo
Leó
nD
istri
to F
eder
al
Prison population

103
3.3 Output indicators
201. In addition to variables on inputs and processes which can provide an indication of the capacities of criminal justice institutions and law enforcement agencies, indicators on outputs are needed to provide insights on whether these institutions and agencies are meeting their objectives and how wisely and efficiently they are utilising their allotted resources. Strictly defined, output variables are those related to the measurement of the goods and services produced by government agencies (e.g. in the sector of education this could include teaching hours delivered to students in an academic year, or in health, the number of doctor consultations with patients, etc.). In the justice sector, these can be represented by such measures as the number of cases processed in a given amount of time, the number of convictions passed down, the number of inmates entering and leaving the penitentiary system, amongst others.
202. When outputs are matched with input data, they can be used as indicators of efficiency, to evaluate how well resources are being matched to needs and whether there is room for improvement (in speed, quality or quantity) given the resources invested. For instance, data in this section show that the number of police officers is correlated with a proxy for States’ clearance rates.

104
8. Clearance rate (convicted crimes) for total reported crime
203. As defined in this study, for a particular crime to be “cleared”, several parts of the criminal justice system must effectively perform their assigned duties. Firstly, the police force must apprehend the suspect either via flagrancy or through work performed by the investigative police; next the state´s attorney´s office and its prosecutors must perform the preliminary criminal investigation and proceed to prosecute the suspect in court; and the court system must then try the offender. It is only after a suspect has been tried and a resolution reached, that the crime is logged as cleared by federal and state authorities.
204. In this case, the variable examines only guilty convictions, as a proxy for the “effectiveness” of law authorities to try and convict criminals. Certainly, however, this indicator does not demonstrate the quality of the decisions made (e.g. whether the guilty verdicts are accurate or whether sentencing was appropriate given the crime). Other complementary variables for this indicator therefore could include the percentage of convictions appealed and overturned.
205. In Mexico, the clearance rate on average was 9.4% in 2011. The state of Campeche shows the highest clearance rate - nearly 32% - , whilst Morelos has the lowest, where less than 2% of reported crimes result in conviction.
Definitions and methodology
206. The clearance rate is calculated by dividing the total number of resolved cases (with guilty verdict) in a State by the total number of reported crimes in the same State. Due to different jurisdictions, the total number of convictions is collected from two sources: the federal government and individual state governments which are summed together. This method of calculation is not without some weaknesses, due to the fact that more than one person may be convicted for one particular crime, e.g. there might be more than one person involved in particular crime.
Source
207. Total reported crime is drawn from data compiled by the National Public Safety System (SESNSP).
208. The total number of convictions is obtained from the penal system statistics database from INEGI.
Relevant Years
209. Data is compiled for years 2008-2010

105
Figure 31. Clearance rate for total reported crime (2010)
Figure 32. Percentage point change in clearance rates between 2009 and 2010
0%
5%
10%
15%
20%
25%
30%
35%Clearance rate for total reported crime
-25
-20
-15
-10
-5
0
5
10
Cam
pech
eM
icho
acán
Nay
arit
Col
ima
Tlax
cala
Dur
ango
Zaca
teca
sC
oahu
ilaQ
ueré
taro
Vera
cruz
Sina
loa
Jalis
coN
atio
nal a
vera
geTa
mau
lipas
Sono
raN
uevo
Leó
nH
idal
goPu
ebla
San
Luis
Pot
osí
Yuca
tán
Dis
trito
Fed
eral
Mor
elos
Oax
aca
Gue
rrer
oQ
uint
ana
Roo
Taba
sco
Chi
huah
uaBa
ja C
alifo
rnia
Sur
Gua
naju
ato
Esta
do d
e M
éxic
oC
hiap
asBa
ja C
alifo
rnia
Percentage point change, 2009-2010

106
Figure 33. Dispersion analysis: clearance rate for total reported crime (2010)
Figure 34. Geographical analysis: clearance rate for total report crime (2010)
0% 5% 10% 15% 20% 25% 30% 35%

107
9. Clearance rate for intentional homicide
210. The previous indicator examined the clearance rate using data for the total reported crimes in a state under both the federal and the local charters. It is also interesting to examine the clearance rate for a particular type of crime, both in terms of better accuracy (e.g. these are counted under only the local charter, therefore providing more accurate data), and because homicides, relative to other crimes, may be particularly tied to citizens’ perceptions of security. Indeed, intentional homicide is much more visible and harmful than most other crime, and for this reason criminal prosecution of this offense should be also much more stringent. For this reason the comparison between clearance rate for total reported crime and the clearance rate for intentional homicide can help us better examine the overall effort of each state to persecute and punish serious crime with more intensity than overall crime.
211. As with the clearance rate for total crime, this indicator seeks to lend insight into the performance of the criminal justice system for this serious crime. However, it needs to be coupled with additional information (on the percentage of cases appealed and/or overturned) to provide information on the quality of judicial decisions reached.
212. Using this method, the average clearance rate for homicide in México was 63.9% in 2010, a figure substantially higher than the 9.4% for total reported crime. The comparison between the state with the highest rate and the state with the lowest rate provides a striking piece of information; whereas Yucatan boasts a 247% rate Chihuahua obtains only 2.9%. We can see that most of the worst performing states are those that have experienced a surge of intentional homicides in the past few years. A tentative explanation for this could be that those states have fallen into a feedback loop in which higher number of homicides saturates the system making each homicide less likely to be cleared.
Definitions and Methodology
213. Analogous to the clearance rate of total reported crime this indicator represents the percentage of total intentional homicides that result in a conviction (e.g. guilty verdict). This variable is calculated by dividing the total number of convictions for intentional homicide for a given year in a state by the number of total number of intentional homicides reported in the state in the same year.
214. As is the case with the clearance rate for total reported crime, this indicator may not be entirely accurate as one particular homicide may result in more than one individual being convicted. Indeed, as shown here, the clearance rate for intentional homicide may be higher than 100% due to reporting from previous years and/or more than one individual being convicted for the same crime.
Source
215. Total number of intentional homicides is compiled from the mortality statistics database from INEGI.
216. Total number of convictions for intentional homicide derives from the penal system statistics database from INEGI.
Reference years
217. All data is compiled for years 2008-2010

108
Figure 35. Clearance rate for intentional homicides (2010)
Figure 36. Change in clearance rate for intentional homicides between 2008 and 2010 (percentage points)
0%
50%
100%
150%
200%
250%Clearance rate for intentional homicides
-100
-50
0
50
100
150
200Percentage point change, 2008-2010

109
Figure 37. Dispersion analysis: clearance rate for intentional homicides (2010)
Figure 38. Geographical analysis: clearance rate for intentional homicides (2010)
0% 50% 100% 150% 200% 250%

110
10. Percentage of total prison population awaiting resolution (“pre-trial population”)
218. The right to representation and a fair trial is a key tenant of rule of law in developed countries. Indeed, the police may arrest and process a suspect for an alleged violation of the law, but the rule of law should in theory guarantee the presumption of innocence until there has been a trial and formal resolution to the case (e.g. guilty or innocent verdict). A judicial system which is unable to uphold this basic right within a reasonable amount of time may be showing symptoms of backlogs and/or inefficient case management processes or systems. In extreme cases, conceivably, an arrested inmate could remain in prison awaiting trial for a longer period than the standard sentence of the crime that he/she is accused of.
219. Therefore the share of the prison population awaiting trial (either those awaiting a first trial, or those tried but awaiting sentence) could be one key effectiveness measure of how well justice systems are functioning. Additionally, this variable could point to the possible excessive use of preventive prison detention in certain states, whereby individuals indicted are made to face their trial while in prison. Legally the use of preventive prison is only stipulated for suspects of crimes considered serious (e.g. homicide, organized crime, kidnapping) or when the individual is deemed a flight risk, yet this measure is notoriously overused.
220. Though this variable provides one useful indication, it is not without weaknesses; for instance, it does not demonstrate whether pre-trial inmates are kept in separate quarters from convicted prisoners. Second, such data would need to be coupled with information on the average length of time pre-trial inmates await a judge’s decision. On the other hand, one could hypothesize that a large share of pre-trial population may be positively correlated with average processing time. Finally, the indicator measures two types of individuals; those indicted and awaiting trial and also those individuals under trial but not yet sentenced.
221. According to government official reports, on average in Mexico 44.5% of the inmate population is awaiting trial. There is a great variation between states however, with Baja California Sur shows the highest pre-trial inmate population (approximately 64%) while Puebla reports the lowest (with 29%).
Definitions and Methodology
222. This indicator is directly compiled from a publication of the state of the national penitentiary system as published by the Secretariat for Public Safety (SSP).
223. Data reports the percentage of prison inmates in each state that have been processed (e.g. have been arrested and subsequently indicted by the prosecution) but not convicted by a judge. The indicator measures two types of individuals; those indicted and awaiting trial and also those individuals under trial but not yet sentenced.
224. The second variable represents the percentage of indictments that result in conviction (e.g. total indictments for a State divided by number of convictions in that state for the same year). Values can be greater than 100% due to indictments from previous years and/or more than one individual being convicted for the same crime.
Source
225. Indicator values are compiled from data published by the federal Secretariat of Public Safety (SSP) accessible at:
226. http://www.ssp.gob.mx/portalWebApp/ShowBinary?nodeId=/BEA%20Repository/365162//archivo

111
Relevant years
227. Data available only for the year 2011
Figure 39. Percentage of the total prison population awaiting conviction (2011)
Figure 40. Percentage of indictments resulting in convictions (2011)
0%
10%
20%
30%
40%
50%
60%
70%Pre-trial population as a % of total prison population
0%
20%
40%
60%
80%
100%
120%Percentage of indictments resulting in convictions

112
Figure 41. Dispersion analysis: percentage of the total prison population awaiting conviction (2011)
Figure 42. Geographical analysis: percentage of the total prison population awaiting conviction (2011)
25% 30% 35% 40% 45% 50% 55% 60% 65% 70%

113
3.4 Outcome indicators
228. The final dimension of performance indicators, outcomes, covers variables measuring the impact (whether intended or not) of governments’ policies. They can range from more direct outcomes, e.g. crime rates, victimization rates, as shown here, to more indirect outcomes (affected by additional external variables) such as trust in institutions and perceptions of safety, also included in this section. Outcome indicators are critically important as they view performance from the perspective of users (citizens and firms), however, they are also more sensitive to interpretation due to the several factors which can additionally affect them. A few of these, such as poverty and inequality have already been discussed in chapter one. Additionally, as we have seen in the case of the data in this chapter, these indicators should be interpreted with caution due to issues of comparability, the inherent weaknesses of perception data, and missing observations (e.g. underreporting of crime).

114
11. Violent crime as a share of total reported crime
229. Ultimately, one of the principal goals of law enforcement agencies and the courts is to reduce crime and create/ensure a secure environment for both citizens and firms. Crime rates, which aim ultimately to capture the incidence of crime on society, are key outcome indicators for measuring the performance of criminal justice systems. In particular, the incidence of violent crime is often of greater relative concern; as it may naturally have a greater impact on perceptions of security.
230. In Mexico on average, 25% of total reported crime is of a violent nature, with the State of Nuevo León showing a rate of nearly half of all reported crime. Since 2009, this region also shows the greatest increase in violent crime (+26 percentage points increase). Although Baja California Sur reported the least violent crime in 2011, Guerrero demonstrates the largest decrease in crime with a -10% percentage point reduction.
231. In Figure 43, Mexican states are ranked according to the level of violent crime as a percentage of all reported crime. As expected, the worst case is Nuevo León, being hardly hit by drug trade violence and organized crime. The case of el Estado de México is more puzzling as it ranks second worst, although it hasn’t been hit by the recent violence wave. In contrast to Nuevo Léon and Sinaloa, violent crime is more persistent over time in Estado Mexico.
232. For most of the Mexican states, the share of violent crime is compacted heavily between the 20% and 30% percent of total crime.
233. As with all indicators on reported crimes, one key weakness of this indicator is that it may not accurately reflect true incidences of crime due to underreporting. Therefore, because of the higher likelihood of violent crime being reported, the share of crime that involved violence might be inflated. Additionally, although data attained are from a single national source, there may be differences in reporting across the States and this should be considered when making comparisons across regions.
Definitions and methodology
234. This indicator represents the share of total reported crime that is of a violent nature. Violent crime includes assault, violent theft, homicide and any other reported crime in which the criminal preliminary investigation cites the use of physical violence. Total reported crime consists of all crime registered either in the Attorney General´s Office, for crime of the federal charter, or the state´s Attorney General´s Office, for crime of the local charter.
235. Categorizations of crimes may vary across regions but have been standardized to the extent possible by the SESNEP database. While each state is responsible for its definitions and penalizations for each crime type this variable only asks whether the preliminary criminal investigations cites the use of violence in the criminal act.
Source
236. Both total crime and total violent crime were compiled from data published by the National Public Safety System (SESNSP).
Reference years
237. All data compiled for years 2009-2011

115
Figure 43. Violent crime as a share of total reported crime (in percentages, 2011)
Figure 44. Change in violent as a share of total reported crime between 2009 and 2011 (in percentage points)
0%
5%
10%
15%
20%
25%
30%
35%
40%
45%
50%Violent crime as a % of total reported crime
-15
-10
-5
0
5
10
15
20
25
30Percentage point change, 2009-2011

116
Figure 45. Dispersion analysis: violent crime as a share of total reported crime (2011)
Figure 46. Geographical analysis: violent crime as a share of total reported crime (2011)
5% 10% 15% 20% 25% 30% 35% 40% 45%

117
12. Intentional homicides
238. The rate of total reported intentional homicides controlled by population is one of the most widely used criminal incidence indicator used by policy-makers and researchers due to its explicative power and greater specificity, which allows for better benchmarking and comparison across regions and countries. Furthermore, relative to other types of crime, the issue of under-reporting is less of a concern as such crimes are more likely to be recorded. However, methodological issues remain, since slight differences may exist in the categorization of reported homicides across regions or countries (e.g. different reporting criteria). Likewise, harmonization and alignment of data between public health and law enforcement statistics requires further efforts to improve measurement and comparability: mortality statistics from public health databases (e.g. data on causes of death) differ from those of justice systems.
239. From a performance measurement perspective, homicide rates are key outcome indicators to complement crime rate data. Indeed, physical safety is a key element of security and well-being. Homicide rates also influence citizens’ perception of security. The relationship between homicides and perceptions of safety, for instance, is greater than that of some property crimes (e.g. vehicles theft) and feelings of safety.
240. In 2011 the national average was 22.4 homicides per 100,000 inhabitants. There is large disparity between the states, where the best performing states such as Yucatan(2.3) have homicide rates comparable to highly developed regions of the world, and then states such as Chihuahua (88.1) and Sinaloa (71.7) having extremely high rates of homicide.
241. The analysis of the change in rates between 2009 and 2011 by states shows that in a great majority of states the situation has deteriorated from 2009 to 2011. The state with the largest negative change - Nuevo Leon - has increased its homicide rate by 38 more homicides per 100,000 inhabitants in this period. Another interesting result comes from the state of Chihuahua; a state that while still remaining by far the worst faring state has nevertheless shown an improvement in the number of homicides per 100,000 inhabitants compared to 2009 levels. Finally, there is a great improvement in the homicide rate for the Federal District, although the homicide rate is still considerably above the national average.
242. Further specificity and comparability across states can perhaps be achieved when analyzing a particular category of homicides: those caused by a firearm. Homicides caused by firearms usually point towards deaths resulting from armed robbery, kidnapping and even open confrontation between criminal groups and/or the police forces.
Definitions and methodology
243. The number of intentional homicides per 100,000 inhabitants is calculated by dividing the total number of reported intentional homicides for a given year by the corresponding State population (residents) for the same year.
244. Intentional homicide is defined as per the UNODC definition, as unlawful death purposefully inflicted on a person by another person. However, it is difficult to ascertain whether each state applies the same definition strictly.
245. The share of total reported intentional homicides that are caused by firearm is also shown below. A homicide is considered to have been perpetrated by firearm if the preliminary criminal investigation cites the involvement of one.
Source
246. Intentional homicide data from the mortality statistics database from INEGI.

118
247. Relevant population data comes from Mexico´s National Population Council (CONAPO) and refers to residents.
248. Intentional Homicide definition from the United Nations Office on Drugs and Crime.
Reference years
249. Data compiled for years 2009-2011
Figure 47. Number of homicides per 100,000 inhabitants (2011 and average over the 2009-2011 period)
0102030405060708090
100Number of intentional homicides per 100,000 inhabitants 2009-2011 Average

119
Figure 48. Change in the number of homicides per 100,000 inhabitants between 2009 and 2011 (in percentage points)
Figure 49. Geographical analysis: number of homicides per 100,000 inhabitants (2011)
-20
-10
0
10
20
30
40
50
Dur
ango
Oax
aca
Chi
huah
uaBa
ja C
alifo
rnia
Sono
raH
idal
goAg
uasc
alie
ntes
Que
réta
roD
istri
to F
eder
alYu
catá
nEs
tado
de
Méx
ico
Baja
Cal
iforn
ia S
urM
icho
acán
Tlax
cala
Cam
pech
eTa
basc
oVe
racr
uzC
hiap
asZa
cate
cas
Pueb
laG
uana
juat
oQ
uint
ana
Roo
Nat
iona
l ave
rage
Jalis
coSa
n Lu
is P
otos
íM
orel
osC
oahu
ilaTa
mau
lipas
Col
ima
Gue
rrer
oSi
nalo
aN
ayar
itN
uevo
Leó
n
Percentage point change, 2009-2011

120
Figure 50. Share of intentional homicides perpetrated using a firearm (in percentages, 2011)
Figure 51. Dispersion analysis: share of homicides perpetrated using a firearm (in percentages, 2011)
Figure 52. Geographical analysis: share of homicides perpetrated using a firearm (in percentages, 2011)
0%
10%
20%
30%
40%
50%
60%
70%
80%
90%% of intentional homicides perpetrated using a firearm
0% 20% 40% 60% 80% 100%

121

122
13. Vehicle theft reports per 10,000 registered vehicles
250. While violent crimes including homicides may have a stronger psychological and media impact on perceptions of safety, property crimes may more directly influence economic outcomes such as the propensity to attract investment. Second, property crimes are generally much more common than homicides, and thus it is important to measure and monitor them as a phenomenon. Additionally, from a comparability perspective, this indicator has the advantage that vehicle theft has a much smaller dark number (percentage of crimes that go unreported) than most other property crimes due to the fact that crime reports are necessary to obtain reparations from insurance companies. In addition to this monetary incentive, individuals have a further motivation to report such crime since individuals who reported their vehicle stolen are cleared from responsibility of any wrongdoings or crimes committed using their stolen vehicle.
251. One concern for this indicator is that there is likely to be a number of vehicles in circulation that are not registered, which could inflate the vehicle theft rates. A mitigating factor for this is that insurance companies require the vehicle to be registered and so the proportion of unregistered vehicles reported stolen is likely to be much lower than for registered vehicles. In 2010, an average of 616 registered vehicles per 10,000 were stolen across Mexico, with Chihuahua (2,382.7) the worst standing state and Yucatán (52) the best. Also between the years 2009 and 2010, Durango had the highest increase in the number of vehicle thefts, with an extra 955.1 per 10,000 vehicles stolen. Conversely Quintana Roo presented 1,032 less reports per 10,000 registered vehicles in the same period.
Definitions and methodology
252. This variable is calculated by dividing the total number of vehicles reported stolen in each state in a given year by the total number of registered motor vehicles in each state for the corresponding year.
253. Vehicle theft reports for this category include any motor vehicle reported stolen to state´s Attorney General´s Office regardless of the monetary value of the vehicle. Comparisons with other international indicators that do adopt a threshold, then, should consider this difference. INEGI’s motor vehicle database includes cars, cargo trucks, passenger busses and motorcycles.
254. Information on the number of vehicles is provided to INEGI by each state´s finance secretariat and reports the number of vehicles that are registered in the same state.
Source
255. Grand theft auto reports are compiled from the criminal incidence database of the executive secretariat of the National Public Safety System (SESNSP). Total number registered vehicles by state were compiled from INEGI´s motor vehicle registry database.
Relevant years
256. Data compiled for years 2009-2010

123
Figure 53. Number of vehicle theft reports per 100,000 registered vehicles (2010)
Figure 54. Dispersion analysis: number of vehicle theft reports per 100,000 registered vehicles (2010)
0
500
1,000
1,500
2,000
2,500Number of vehicle theft reports per 10,000 registered vehicles
0 500 1000 1500 2000 2500

124
Figure 55. Geographical analysis: number of theft vehicle theft reports per 100,000 registered vehicles (2010)

125
14. Victimization rate
257. The previous indicators (homicide, vehicle theft) are exceptional in the sense that these types of crimes are more likely to be reported to the police than other crimes. They therefore are helpful performance indicators from the point of view of comparability across States, countries, in terms of better accuracy of the data. However, one of the primary concerns in evaluating government policies against crime is the unobservable nature of the true number of crimes committed. Petty theft, for instance, is much more common and may have a broader impact on perceptions of safety, but may often go unreported. Indeed, it is estimated that the “dark number” of unreported crime may be higher than 90% even for developed regions. For this reason, survey data collected directly from citizens is often used to provide complementary information to that retrieved from official reports from the police.
258. As with all data collected via perception surveys however, there are some inherent weaknesses. Surveyors asking about citizens’ experiences with crime are relying on subjective accounts and memories. They also may retrieve biased information if only cities or urban areas are surveyed for instance. The survey approach used (e.g. phone, internet) may further limit the representativeness of the sample. Perception survey methodologies however have improved over time with better sampling, survey tools, clearer wording and definitions, etc., but the weaknesses need to be considered when interpreting data based on perception surveys.
259. It is expected that this indicator will be related to total reported crime, and that this indicator impacts public perception variables more strongly than the official crime figures.
260. ENVIPE´s victimization data showed that on average México had 23,206 crimes per 100,000 inhabitants, which means roughly 1 in 4 individuals suffer a crime each year.
261. In the following figures, the Mexican states are compared by their victimization rates. Unexpectedly the worst performing state is Aguascalientes, which has not been affected by the current organized crime wave. However, victimization rates do not reflect the intensity of crime, only the number of crimes. So it might be the case that this state suffers a lot of relatively less serious crimes. Even so the other states that perform badly include Chihuahua, Federal District, Baja California and Sonora.
262. From Figure 56 it could be also observed that victimization rates are much less dispersed than other criminal incidence indicators.
Definitions and methodology
263. Citizens’ direct reports on experiences with crime, via surveys, are an alternative method to measure the incidence of crime. The indicator presented here represents how many crimes (whether reported or unreported) occur per 100,000 inhabitants. This indicator is obtained from data compiled by the National Victimization Survey (ENVIPE) from INEGI which asks a sample of households if anyone in their household has been a victim of a crime in the past year. This data is then extrapolated to obtain the overall victimization rate for each state controlled by 100,000 inhabitants.
264. The ENVIPE survey asked respondents questions on the incidence of particular crimes (to mitigate the lack of knowledge of some respondents about what constituted a criminal incident) and the total victimization rate constitutes the sum of those particular crimes.
265. Around 2,500 households were surveyed per state for a total of 78,179 households at the national level. This sample was controlled for urban or rural population and the different income ranges so as to obtain the most representative sample as possible.

126
Source
266. Victimization rates are compiled from the results of the National Victimization Survey (ENVIPE) by INEGI.
Figure 56. Total crime per 100,000 inhabitants as calculated from victimisation surveys (2011)
Figure 57. Dispersion analysis: total crime per 100,000 inhabitants as calculated from victimisation surveys (2011)
0
5,000
10,000
15,000
20,000
25,000
30,000
35,000
40,000Victimisation per 100,000 inhabitants
10000 15000 20000 25000 30000 35000 40000

127
15. Estimated reported crime as a share of total crime
267. Comparing information on the incidence of crime as resulting from victimization surveys and those of the criminal justice institutions themselves provides us with one estimation, or proxy, of the share of total crime which is recorded (or, alternatively, goes unreported) to the police. Indeed the share of crime that is unrecorded is often referred to as the “dark number” of crime. It is first and foremost a complementary measure, to be used alongside reported crime rates data, to measure the incidence of crime in society. Second, it can act as a measure of the reliability of existing data on using reported crime data from the justice system.
268. The “dark number”, however, can also provide an indication of the degree of trust placed in the police and the criminal justice system as a whole. On the one hand, not all crime is recorded; certainly, some crimes go unrecorded as victims may feel that it is too trivial to report, or that the monetary value of the crime (e.g. in cases perhaps of petty theft) may be low. Alternatively, some crime may go unrecorded by police, even if reported by a victim, if there is insufficient evidence to classify it as such. Nonetheless, a high degree of unrecorded crime, particularly in a comparative perspective with other regions or countries, may suggest low levels of trust in the police. Citizens and firms may be reluctant to report crimes if they believe the police will not act, or that the legal system will not effectively reach a resolution to the case. They may also believe the costs (e.g. time, bureaucracy or fees) of the system are excessive.
269. On average in México it is estimated that only about 7% of total crime is reported. Using this methodology the state that reports the highest share of its total crime is Yucatán with 14.2% while in Campeche only 1.8% of crime is reported.
Definitions and methodology
270. This indicator was computed by dividing the total number of reported crime obtained from the SESNSP by the victimization rate obtained from the ENVIPE survey, which estimates the incidence of both reported and unreported crime. From this we obtain an estimation of the share of crime that may be reported annually in each state.
271. The “dark number” represents the share of total crime that goes unreported and is obtained by subtracting the share of crime that is reported from 100%.
Source
272. Victimization data is compiled from the National Victimization Survey (ENVIPE 2011).
273. Total crime data is compiled from the criminal incidence database at the executive secretariat of the National Public Safety System (SESNSP).
Relevant years
274. Data is available only for 2011

128
Figure 58. Reported crime from police statistics as a percentage of total crime as per victimisation surveys (2011)
Figure 59. Dispersion analysis: reported crime from police statistics as a percentage of total crime as per victimisation surveys (2011)
0%
2%
4%
6%
8%
10%
12%
14%
16%Reported crime as a % of total crime
0% 4% 8% 12% 16%

129
Figure 60. Geographical analysis: reported crime from police statistics as a percentage of total crime as per victimisation surveys (2011)
Lower than 3%
Between 3% - 6%
Between 6% - 9%
Higher than 9%

130
16. Trust in institutions: Police (state and municipal)
275. Often the first point of contact between the criminal justice system and citizens/firms are the police. Indeed, municipal and state police in Mexico fulfil mainly preventive and responsive police duties. They are in charge of patrolling to both deter possible offenders and catch criminals; they work with community groups and may participate in and/or implement educational or preventative initiatives; they are amongst the first respondents to emergencies participating in dispute resolutions and take action (e.g. making arrests or issuing fees or citations) when they deem a crime or infraction has been committed.
276. Trust in police therefore is necessary for good collaboration between citizens and police in jointly preventing or responding to crime. It may also be a determinant of whether citizens are likely to report crimes. Low trust in the police may also be symptomatic (whether accurate or not) of perceived corruption or ineffectiveness of the police, or it may be a warning signal to policy makers that police forces lack the capacities or resources to be effective (e.g. insufficient staff or training).
277. As with all perception data, the weakness of this indicator is that citizens may be unable to distinguish between municipal and state police (although the average is taken here for this indicator). Likewise, their perceptions of police may be influenced by news reports or perceptions of police elsewhere, and attributed generally to local/municipal police without considering their true performance.
278. Using this methodology, 41% of the total Mexican population trust their state and municipal police forces. The state with the highest percentage of confidence is Coahuila (60%) and the lowest trust levels can be found in Chiapas (26%).
Definitions and methodology
295. This indicator was computed directly from the results of the trust in public institutions section of the National Victimization Survey (ENVIPE). As part of this survey, respondents were asked the following questions to rate their level of trust in state police and their trust in municipal police in categories that ranged from “a lot of trust”, to “some trust”, “few trust” and “no trust”.
296. The first two options are interpreted here to be the positive responses and are utilized in these calculations as a proxy of “positive trust”.
279. The percentages of trust for each institution (municipal police and state police) were then averaged to estimate the level of trust in state-wide police institutions.
280. Around 2,500 households were surveyed per state for a total of 78, 179 households at the national level. This sample was controlled for urban or rural population and the different income ranges so as to obtain the most representative sample possible.
Source
281. National Victimization Survey (ENVIPE 2011) by INEGI.
Relevant years
282. Data is available only for 2011.

131
Figure 61. Trust in state and municipal police (percentage of positive trust responses, 2011)
Figure 62. Dispersion analysis: trust in state and municipal police (percentage of positive trust responses, 2011)
0%
10%
20%
30%
40%
50%
60%
70%% of positive trust responses
20% 30% 40% 50% 60% 70%

132
Figure 63. Geographical analysis: trust in state and municipal police (percentage of positive trust responses, 2011)
Lower than 31%
Between 31% - 39%
Between 39% - 47%
Higher than 47%

133
17. Trust in court system: Public prosecutors and judges
283. Public prosecutors are a vital part of any criminal justice system, they are those responsible, alongside investigators, for conducting the preliminary criminal investigation, and their findings are critically important elements of the trial. The quality, and objectivity, of their work is key, the honesty with which prosecutors conduct investigations has long be a concern in Mexico because of the relative ease of fabricating or omitting evidence (Such concerns have in great part contributed to the very recently reformed penal system).
284. Likewise, another very vital part of the criminal justice procedure is judges, who are ultimately responsible for the conviction or acquittal of suspected offenders and their respective sentencing. Even with a highly efficient investigative police work and prosecution judges are those who decide the eventual fate of alleged criminals. For this reason the objectivity of judges has long been a public concern in Mexico and more recently even the ability of certain judges to fulfil their jobs has come into question.
285. Citizens’ trust in prosecutors and judges therefore can be an important proxy for whether they believe the court system is capable, objective and free of corruption.
286. As with the police, many of the same weaknesses apply. Citizens may not distinguish between prosecutors and judges at different levels of government. Furthermore, inefficient court systems may not be due to corruption but also a variety of other factors. Nonetheless, coupled with other information on the functioning of the courts, it is one important indicator of their performance.
287. On average across Mexico, 37.8% of the population trust public prosecutors to some degree. The state with the highest levels of trust is Guanajuato with 51% of the population trusting public prosecutors while the lowest ranked is Estado de Mexico with only 19%. The average trust across Mexico for judges amounts to 42.5% of the population, with Colima having the highest percentage of the population 57.3% - trusting judges and Estado de Mexico (26%).
Definitions and methodology
288. These indicators were computed directly from the results of the trust in public institutions section of the National Victimization Survey (ENVIPE) which measures the overall perception of public safety in each state. For the questions relevant to this indicator respondents were asked to rate their level of trust in state prosecutors and judges (Agentes del ministerio publico and Jueces) in categories that ranged from no trust at all to complete trust, the number depicted in our indicator represents the percentage of the population with positive trust in prosecutors.
289. The survey asked the level of trust rated in 4 possible responses “a lot of trust”, “some trust”, “few trust” and “no trust”. The first two are considered to be positive responses.
290. In case of judges the survey does not differentiate between civil court judges and criminal court judges.
291. Around 2,500 households were surveyed per state for a total of 78, 179 households at the national level. This sample was controlled for urban or rural population and the different income ranges so as to obtain the most representative sample possible.
Source
292. National Victimization Survey (ENVIPE 2011) by INEGI

134
Relevant years
293. Data available only for 2011
Figure 64. Trust in public prosecutors (percentage of positive trust responses, 2011)
Figure 65. Dispersion analysis: trust in public prosecutors (percentage of positive trust responses, 2011)
0%
10%
20%
30%
40%
50%
60%% of positive trust responses
15% 25% 35% 45% 55%

135
Figure 66. Geographical analysis: trust in public prosecutors (percentage of positive trust responses, 2011)
Figure 67. Trust in judges (percentage of positive responses, 2011)
Lower than 29%
Between 29% - 37%
Between 37% - 45%
Higher than 45%
0%
10%
20%
30%
40%
50%
60%
70%% of positive trust responses

136
Figure 68. Dispersion analysis: trust in judges (percentage of positive responses, 2011)
Figure 69. Geographical analysis: trust in judges (percentage of positive responses, 2011)
20% 30% 40% 50% 60%
Lower than 34%
Between 34% - 42%
Between 42% - 50%
Higher than 50%

137
18. Perceptions of safety
294. Perhaps the most important ultimate outcome of criminal justice institutions is improving perceptions of safety. Effective law enforcement policies and well functioning courts should serve to ultimately increase the sense of security in society. Indeed, as we saw in previous indicators, there is a relationship between reported crimes, particularly violent ones, and perceptions of safety. Certainly, however, there are many factors that may influence perceptions of safety, other than those of the performance of criminal justice institutions or crime rates.
295. An average of 32% of the population felt safe in their state. The highest level was in Yucatán where 72.6% of the population reported feeling safe while the lowest value was found for Chihuahua where only 8.7% responded they felt safe.
296. According to the same survey, an average of 27.6% of Mexicans felt unsafe walking alone in their State. Just as with the feeling of safety indicator the best performing State was Yucatán (only 10.7% felt unsafe) and the worst Chihuahua (61.7%).
Definitions and methodology
297. This indicator was computed directly from the results of the National Victimization Survey (ENVIPE) which measures the overall feeling of safety for the household population of each state. Its respondents were asked if they felt safe from crime and the percentage depicted in our indicator represents the share of the respondents/surveyed population who responded they felt safe in their state (For this question the only possible responses were “feels safe” and “feels unsafe”). The same source is used for the indicator on fear of walking alone, representing the percentage of responses that replied they felt unsafe walking alone in their state.
298. Around 2,500 households were surveyed per state for a total of 78, 179 households at the national level. This sample was controlled for urban or rural population and the different income ranges so as to obtain the most representative sample as possible.
Source
299. National Victimization Survey (ENVIPE 2011) by INEGI
Relevant years
300. Data available only for 2011

138
Figure 70. Percentage of the population that feels safe in their state (2011)
Figure 71. Dispersion analysis: percentage of the population that feels safe in their state (2011)
0%
10%
20%
30%
40%
50%
60%
70%
80%% of the population
0% 10% 20% 30% 40% 50% 60% 70% 80%

139
Figure 72. Geographical analysis: percentage of the population that feels safe in their state (2011)
Figure 73. Percentage of the population that feels unsafe walking alone in their state (2011)
Lower than 14%
Between 14% - 32%
Between 32% - 49%
Higher than 49%
0%
10%
20%
30%
40%
50%
60%
70%% of the population

140
Figure 74. Dispersion analysis: percentage of the population that feels unsafe walking alone in their state (2011)
Figure 75. Geographical analysis: percentage of the population that feels unsafe walking alone in their state (2011)
0% 10% 20% 30% 40% 50% 60% 70%
Lower than 15%
Between 15% - 27%
Between 27% - 39%
Higher than 39%

141
3.5 Conclusion
301. Mexico is strong in measuring the incidence of crime. The National Institute for Geography and Statistics (INEGI), an autonomous dependency of the executive branch, and the National Public Safety System (SESNSP) a dependency of the Ministry of the Interior (SEGOB), produce internationally harmonised crime statistics disaggregated to the state level (e.g. property crimes such as car theft and violent crime including homicides). Furthermore, INEGI implements a victimisation survey, with results disaggregated also to the sub-national level. This survey instrument continues to improve with recent changes to questions to increase the accuracy and reliability of responses. Additionally, a strong dataset exists for Mexico on perceptions of safety and levels of public trust in police and justice institutions. Such information is collected not only by INEGI as a component of victimisation surveys, but also by additional independent opinion polls which lend themselves to international comparison.
302. As shown in this chapter however, these data are not immune to common methodological problems for crime statistics and perception surveys which should be considered in constructing indicators and subsequent analysis. For data gathered from law enforcement and justice institutions, these include issues of comparability due to differences which can exist across the states in terms of case and crime classification systems. Though some crimes are more prone to underreporting than others, this issue was shown to be an important barrier in general in Mexico – but particularly for property crimes – with implications for underestimating the true incidence and nature of crime. Conversely, for perception data on feelings of security and trust in institutions, such information is sensitive to media coverage on crime and does not distinguish between types of law enforcement and justice personnel. Likewise, statistics gathered from victimisation surveys, though improving through better questionnaire techniques, can also be sensitive as it relies on understanding of the questions and accurate recall of past events. International comparisons of perception data are cautioned, as cultural and domestic events particular to individual countries are key determinants of results.
303. In the framework presented in chapter 1, these statistics would correspond to the category of outcomes indicators, that is, variables which can shed light on the consequences or impacts of security and justice policies. Measuring the performance of criminal justice institutions—their effectiveness, efficiency—as well as establishing the cost-effectiveness of certain policies over others, however, requires generating of additional data. The main gaps identified as part of the scoping exercise conducted for this study include the following:
Inputs
304. Information on the number of personnel exist generally for the individual states, however, standardised expenditures data for the police, courts and penitentiary systems are unavailable in Mexico at the regional level. This issue is further complicated by the inability in some cases to distinguish between civil justice and criminal justice expenditures, creating ambiguity in relationships between inputs and outcomes. Calculating unit costs, for instance (e.g. “cost per case”) is not possible at this stage. As a proxy for expenditures, budget appropriation can be used and are presented in this study for indicative purposes. Nonetheless, given the weaknesses of such data (e.g. the degree of flexibility that agencies have in how and when appropriations are spent), the study proposes further data collection initiatives for this area. Line-items in state budgets differ, making compilations of appropriations data subject to some subjectivity or over/under estimation.
Processes
305. There is a need for harmonised data collection efforts to collect information from states in key areas of public management including human resources practices such as training, recruitment and

142
performance evaluations and integrity (anticorruption policies such as requirements for the disclosure of potential conflicts of interest, the monitoring and follow-up of this information, and opportunities for whistleblowers). These practices influence the functioning of law enforcement and judicial institutions, helping to identify additional “policy levers” with which to improve their performance. Indeed, trust in police for instance, could be improved if mechanisms for preventing corruption were strengthened.
306. Furthermore, information on coordination practices are needed. Greater inter-institutional coordination is necessary for overcoming issues of overlapping or fragmented competencies across agencies and territories. It is also a key driver of positive performance, but little if any data exists for example on the degree of information or intelligence sharing amongst law enforcement agencies, the formal or informal coordination mechanisms that may exist for dialogue and cooperation; the amount of joint financing in place to overcome unfunded mandates; or the use of joint initiatives (such as training) to better exploit economies of scale and avoid waste of funds.
Outputs
307. The study has found little comparable outputs data at the sub-national level on the functioning of the police and courts. That is, on the average length of time taken to process a case, the amount of case back-log, the quality of the judicial decisions taken (measured for instance by percentage of cases appealed, overturned, or cancelled due to inadmissible evidence or other errors). The need for such information is urgent as important judicial reforms are underway. The study recommends participation in existing judicial performance questionnaire implemented biennially by the Council of Europe’s Commission for the Efficiency of Justice.

Strengthening Evidence-Based Policy Making on Security and Justice In Mexico
Organisation for Economic Co-operation and Development2 rue André-Pascal, 75016, Paris, France
www.oecd.org/governance