Strategic Plan for the Kane County Health Department: 2012 ...
240
Strategic Plan for the Kane County Health Department: 2012-2015
-
Upload
khangminh22 -
Category
Documents
-
view
1 -
download
0
Transcript of Strategic Plan for the Kane County Health Department: 2012 ...

Strategic Plan for the
Kane County Health
Department: 2012-2015

KCHD Strategic Plan: 2012-2015 Page 1
I. Background and Overview
As the local governmental public health agency the Kane County Health Department (KCHD) is
charged with the responsibility to act as a catalyst to improve, and a first and last line of defense
to protect, the health of the community and all of its residents. The Department works to
develop policy, systems and programmatic initiatives that bring local policymakers, community
members and health partners --- hospitals, community health centers, social service agencies,
municipalities, school districts and others --- together to achieve community health goals
The 2012-15 Strategic Plan for the Kane County Health Department is the outcome of a process
spanning more than eight months in 2011 and 2012 that involved the Kane County Board, its
Health Advisory Committee, leaders from other Kane County Departments, and the KCHD
Leadership Team and staff. The timeline below documents the key strategic planning meetings
and stakeholder involvement:
The overall approach to the strategic planning process was developed in consultation with
Jennifer Bek and Lee Murphy of Consulting Associates (Geneva, IL). Ms. Bek and Mr. Murphy
then facilitated the two initial strategic planning meetings. The Department’s Executive Director,
Paul Kuehnert, facilitated the remaining meetings and was the primary author this report.
STRATEGIC PLANNING TIMELINE
SEPTEMBER 2011
•September 27Joint Board/Health Advisory Committee Meeting
•September 29Joint Health Advisory Committee/KCHD Leadership Meeting
OCTOBER 2011
•October 6KCHD Leadership Meeting
•October 17KCHD All Staff Meeting
•October 18Health Advisory Committee Meeting
NOVEMBER 2011
•November 3KCHD Leadership Meeting
•November 29Health Advisory Committee Meeting
DECEMBER 2011
•DECEMBER 1KCHD Leadership Meeting
•DECEMBER 15KCHD Leadership Meeting
JANUARY 2012
• January 5KCHD Leadership Meeting
• January 17Health Advisory Committee Meeting
• January 19KCHD All Staff Meeting
• January 19KCHD Leadership Meeting
• January 26Performance Management In-service presented by Marni Mason
FEBRUARY 2012
•February 2KCHD Leadership Meeting
•February 16
•KCHD Leadership Meeting
•February 21Health Advisory Committee Meeting
MARCH 2012
•March 1KCHD Leadership Meeting
•March 15KCHD Leadership Meeting
•March 20Health Advisory Committee Meeting
•March 22KCHD All Staff Meeting

KCHD Strategic Plan: 2012-2015 Page 2
Following this Background and Overview section, the 2012-15 Strategic Plan for the Kane
County Health Department is organized into the following sections that present the products of
the strategic planning process:
2007-2011 Progress Review
2011-12 Strategic Planning Process and Outputs
o Revised Mission Statement
o Key Drivers
o Strategic Initiatives
2012-15 KCHD Strategy Map
Strategic Initiative Charters
Implementation and Accountability Plan
As noted, these are the final work products of an iterative process that involved multiple
stakeholders over more than eight months. Each of the meeting strategic planning-related
meeting agendas and summary draft products from each session are found in the appendices.
A strategic plan is most helpful to an organization when it is considered a ‘living, breathing’
document that truly drives the organizations operations from a strategic perspective. Its
usefulness is driven by its active use by the organization. KCHD intends that the 2012-15
Strategic Plan for the Kane County Health Department be such a planning document.
II. 2007-2011 Progress Review
Facing an executive leadership transition in 2007, the Kane County’s Board of Health and Health
Advisory Committee convened a joint meeting with Health Department senior management and
community stakeholders to establish a long term vision and overall strategic direction. That
vision---“Kane residents are the healthiest people in Illinois!”--- drove the work of the new
Executive Director and the Department’s leadership and staff to clearly articulate organizational
values and establish strategic goals and themes.
In 2007 we developed Health Department-specific strategic themes that identified what was
critical for our organization to focus on in order to improve the health of our community. Our
three strategic themes were:
Excelling at public health
Through effective communication, and
Mobilizing community partnerships.
We implemented seven (7) cross-cutting initiatives within the organization from 2007-09 and
made progress in moving the organization forward along the lines of these focus areas. We did
this work in the context of the five community health priorities that were adopted by
the Kane County Board/Board of Health in the 2006 Community Health Action Plan for Kane
County:
1. Improve access to health care for those without insurance.
2. Eliminate the disparity in African American infant mortality.
3. Reduce the level of chronic disease.
4. Improve availability of community mental health services

KCHD Strategic Plan: 2012-2015 Page 3
5. Maintain core public health protection services.
In 2009, facing the challenges of addressing the public health mission in a worsening fiscal
environment, the Board of Health and Health Advisory Committee reconvened in joint session
to review and update our strategic plan. We boldly charted a course forward, affirming that we
did not want simply a ‘good’ health department but that the times demanded a ‘great’ health
department: one that was truly mission driven, efficient and effective in improving, protecting
and promoting the health of Kane residents.
To communicate our strategic direction, we developed the “3 Keys to Greatness” strategy that
includes:
Key 1: Attracting and retaining educated, committed leaders and staff who excel and
public health;
Key 2: Expertly transform data into actionable health information and communicate it
effectively to diverse audiences; and
Key 3: Convene and support active community partnerships that get population health
results.
Over the past two years we implemented three (3) cross-cutting initiatives focused on the 3 Keys,
as well as two other “running-the-business” initiatives around financial management and quality
improvement.
As detailed in the Progress Report on Strategy Implementation 2007-2011 found in Appendix A,
our Health Department has made significant strides in improving community health and
increasing organizational efficiency and effectiveness during this period. Over the past two years
significant accomplishments include:
Improving our County Health Rankings from 11th
to 9th
overall in Illinois;
Protecting our community from significant health threats by effectively managing an
ongoing outbreak of tuberculosis among the homeless, coordinating response to the novel
H1N1 influenza A pandemic, and containing a number of foodborne illness outbreaks;
Mobilizing our community around the main threat to our children’s health, the
epidemic of obesity and overweight, through the public-private partnership of Making
Kane County ‘Fit for Kids’; and
Reorganizing our Department so that it is slimmer, flatter, and entirely focused on
the essential services of public health. The reorganization has been accomplished in a
manner that assures that we meet national public health accreditation standards and that is
economically sustainable, while assuring that personal health services that the
Department no longer provides were smoothly transferred to community health partners.

KCHD Strategic Plan: 2012-2015 Page 4
III. 2011-12 Strategic Planning Process and Outputs
As we began the 2011-12 strategic planning process, our nation and our Kane County
community were in the midst of the most severe economic recession since the Great Depression.
We faced both new and re-emerging threats to our health ranging from the epidemic of obesity
and diabetes to old killers like tuberculosis and influenza. The health and health care policy
environment was in a state of rapid change and uncertainty that is unlike anything since the
federal initiatives of Medicaid, Medicare and federally qualified health centers were all created
in the 1960’s.
Our strategic planning process re-affirmed our KCHD Vision and Values (see Appendix B) and
provided us with an opportunity to reformulate the KCHD Mission statement, assess key drivers
in the external and internal environments, and devise a set of five strategic initiatives to address
the key drivers and move the KCHD forward toward achieving its mission.
Revised Mission Statement At the September 27, 2011 strategic planning kick-off meeting with Board, Health Advisory Committee,
KCHD senior leadership and leaders from other Kane County Departments (See Appendix C for agendas
and draft summary products from this and every other strategic planning meeting) , an exercise was
conducted to review the current KCHD Mission Statement. Input on potential changes to the mission
statement was gathered from participants. These data were supplemented by gathering feedback via
email from Board members that were not able to attend the September meeting. Additionally, all KCHD
staff participated in the same mission statement review exercise as part of an all-staff meeting in October.
All of this input was reviewed by the Health Advisory Committee and KCHD Leadership Team and a
new mission statement was drafted and reviewed in an iterative process. The final revised KCHD
mission statement was presented to the Kane County Board for final review at the Kane County Board of
Health meeting on December 13, 2011. The final product of this process is the following mission
statement for the KCHD:
“In active partnership with our community, the Kane County Health Department improves
the quality of life and well-being of all residents by developing and implementing local
policies, systems, and services that protect and promote health, and prevent disease, injury
and disability.”
IV. 2011-12 Strategic Planning Process and Outputs
Key Drivers
At the same September 27, 2011, participants brainstormed and identified issues and challenges facing the
Health Department. A joint KCHD Leadership/ Health Advisory Committee work session on September
29, 2011 identified the following as ” key drivers” in the external environment (in addition to funding and
the economy) that must be addressed in our 2011 strategic plan update:
1. Funding and the broader impact of the economy.
2. Changing demographics and diversity.
3. Epidemic of obesity and chronic disease.
4. Integration with land use and transportation planning.

KCHD Strategic Plan: 2012-2015 Page 5
5. Health care reform.
6. Information technology.
For a complete list of drivers see Appendix C.
V. 2011-12 Strategic Planning Process and Outputs
Strategic Initiatives
Follow-up meetings in October and November examined root causes of these drivers, identified strategic
implications for KCHD as an organization, and identified KCHD’s current assets and barriers to
addressing the key drivers and their root causes. This resulted in a listing of potential strategic focus areas
(see Appendix C).
Processing all of this information together has resulted in the identification of the following five key
strategic initiatives for KCHD for the next three years (2012-2015):
1. Build a Mission-Focused Culture: Build a sustainable organizational culture that is based on
our core values and focused on achieving our mission.
2. Model Stewardship: Model responsible stewardship of public resources by providing efficient,
high quality and high impact population health services.
3. Implement Informatics: Fully meet or exceed national public health informatics standards in
order to assure timely, efficient and effective communications.
4. Sustain Partnerships: Sustain focused, effective partnerships to address identified community
health priorities and get results that improve population health.
5. Enhance Health Communication: Enhance provision of health information to our diverse
community that is: tailored, reliable, real-time and actionable.
VI. 2012-15 KCHD Strategy Map
During the same time period that we were conducting our strategic planning process, KCHD was leading
a comprehensive community health assessment and health improvement planning process with eight
community partners: the five hospitals located in Kane County, Kane’s two largest United Ways, and the
INC Board, the largest community mental health Board in Kane.
The resulting Kane County health assessment results pointed to six major threats to community health and
well-being in Kane County at this time: obesity, chronic disease, infant mortality, childhood lead
poisoning, communicable disease and poor social and emotional wellness. The 2012-2016 Community
Health Improvement Plan identifies four cross-cutting priorities for health improvement:
1. Support health behaviors that promote well-being and prevent disease;
2. Increase access to high quality, holistic preventive and treatment services across the health care
system;
3. Support and create health promoting neighborhoods, towns and cities;
4. Promote social, economic and educational environments that optimize health.
Each priority can be addressed through implementation of one or more evidence-based strategies, sixteen
of which are described in the health plan.
Additionally, during this same period, KCHD has collaborated with the Kane County Development and
Community Services Department and the Kane County Division of Transportation to integrate health
improvement planning into the 2040 update of Kane County’s comprehensive land use and transportation
plan. With the adoption of the 2040 Plan, Kane County will become the first county in Illinois to have

KCHD Strategic Plan: 2012-2015 Page 6
formally integrated health into a county comprehensive plan, providing unprecedented opportunities for
population-level health improvement.
Thus, in December and January, the KCHD Leadership Team and the Health Advisory Committee
worked through a number of meeting activities and exercises to identify potential “leverage points” and
areas of integration between the five strategic initiatives of the 2012-2015 KCHD Strategic Plan and the
2012-2016 Community Health Improvement Plan as well as the 2040 Plan and the Fit Kids 2020 Plan
(Kane County’s strategic plan to reverse childhood obesity, adopted in 2011). These exercises and their
draft work products are found in Appendix C.
At a very general or “30,000 foot” view, the connection between the KCHD’s organizational Vision,
Mission, Values and 2012-15 strategic initiatives and the community health improvement outcomes that
we hope to achieve are illustrated in the 2012-15 KCHD Strategy Map below:
Additionally, the community health assessment and the health improvement and other health-related,
policy-focused plans (noted above) all provide context for the strategic initiatives and day-to-day
operations of the KCHD.

KCHD Strategic Plan: 2012-2015 Page 7
VII. Strategic Initiative Charters
Processing all of this information together has resulted in the development of five detailed charters for
cross-cutting committees within KCHD to implement the five key strategic initiatives: Build Mission-
Focused Culture, Model Stewardship, Implement Informatics, Sustain Partnerships and Enhance Health
Communications. The five charters, including objectives for the first year, are found in Appendix D.
VIII. Implementation and Accountability Plan
The charter for each strategic initiative has identified “measures of success” that are desired 2015
outcomes, as well as a set of measureable objectives and activities for the first year of implementation
(April, 2012 through March, 2013.)
The five Strategic Initiative Committees will be convened by their “owner” (accountable staff person) and
the Executive Director in April/May of 2012. The charters documents and work plans for the first year
will be reviewed and approved by the Committees. A scorecard of measures will be developed by the
owners and Executive Director for monitoring and reporting progress made by the Strategic Initiatives
Committee. Progress will be monitored using the scorecard on a quarterly basis by the KCHD Leadership
Team and the Health Advisory Committee and reported on a minimum of an annual basis to the Kane
County Board of Health.

KCHD Strategic Plan: 2012-2015 Page 8
Appendix A
2009 Kane County Health Department
Vision, Mission and Values


KCHD Strategic Plan: 2012-2015 Page 9
Appendix B
Progress Report on Strategy Implementation
2007-2011

N a
PROGRESS REPORT ON STRATEGY
IMPLEMENTATION 2007-2011

Kane County Health Department
Table of Contents
Executive Summary ...................................................................................................................................... 3
Progress Report on Kane County Health Department Strategy Implementation (2007 – 2011) .................. 5
Part 1: Community Health Action Plan Update ........................................................................................... 7
Part 2: 3 Keys to Greatness Update ........................................................................................................... 25
Appendix A: Kane County Health Department Quality Improvement Summary Report .......................... 33
Appendix B: Maternal Child Health Indicators .......................................................................................... 45
Appendix C: County Health Rankings & Selected Health Data ................................................................. 54

Executive Summary
As the local governmental public health agency the Kane County Health Department is charged with the responsibility to act as a catalyst to improve and first and last line of defense to protect, the health of the community and all of its residents. The Department works to develop policy, systems and programmatic initiatives that bring local policymakers, community members and health partners --- hospitals, community health centers, social service agencies, municipalities, school districts and others --- together to achieve community health goals.
Facing an executive leadership transition in 2007, the Kane County’s Board of Health
and Health Advisory Committee convened a joint meeting with Health Department senior management and community stakeholders to establish a long term vision and overall strategic direction. That vision---“Kane residents are the healthiest people in Illinois!”--- drove the work of the new Executive Director and the Department’s leadership and staff to clearly articulate organizational values and establish strategic goals and themes.
In 2007 we developed Health Department-specific strategic themes that identified what
was critical for our organization to focus on in order to improve the health of our community. Our three strategic themes were:
Excelling at public health Through effective communication, and Mobilizing community partnerships.
We implemented seven (7) cross-cutting initiatives within the organization from 2007-09 and made progress in moving the organization forward along the lines of these focus areas. We did this work in the context of the five community health priorities that were adopted by the Kane County Board/Board of Health in the 2006 Community Health Action Plan for Kane County:
1. Improve access to health care for those without insurance.
2. Eliminate the disparity in African American infant mortality.
3. Reduce the level of chronic disease.
4. Improve availability of community mental health services
5. Maintain core public health protection services.
In 2009, facing the challenges of addressing the public health mission in a worsening fiscal environment, the Board of Health and Health Advisory Committee reconvened in joint session to review and update our strategic plan. We boldly charted a course forward, affirming that we did not want simply a ‘good’ health department but that the times demanded a ‘great’ health department: one that was truly mission driven, efficient and effective in improving, protecting and promoting the health of Kane residents.
To communicate our strategic direction, we developed the “3 Keys to Greatness” strategy that includes:
Kane County Health Department September 2011 Page 3

Key 1: Attracting and retaining educated, committed leaders and staff who excel and public health;
Key 2: Expertly transform data into actionable health information and communicate it effectively to diverse audiences; and
Key 3: Convene and support active community partnerships that get population health results.
Over the past two years we implemented three (3) cross-cutting initiatives focused on the 3 Keys, as well as two other “running-the-business” initiatives around financial management and quality improvement. As detailed in the Progress Report, our Health Department has made significant strides in improving community health and increasing organizational efficiency and effectiveness during this period. Over the past two years significant accomplishments include: Improving our County Health Rankings from 11th to 9th overall in Illinois;
Protecting our community from significant health threats by effectively managing an
ongoing outbreak of tuberculosis among the homeless, coordinating response to the novel H1N1 influenza A pandemic, and containing a number of foodborne illness outbreaks;
Mobilizing our community around the main threat to our children’s health, the
epidemic of obesity and overweight, through the public-private partnership of Making Kane County ‘Fit for Kids’; and
Reorganizing our Department so that it is slimmer, flatter, and entirely focused on
the essential services of public health. The reorganization has been accomplished in a manner that assures that we meet national public health accreditation standards and that is economically sustainable, while assuring that personal health services that the Department no longer provides were smoothly transferred to community health partners.
At this time, our nation and our Kane County community are in the midst of the most severe
economic recession since the Great Depression. We face both new and re-emerging threats to our health ranging from the epidemic of obesity and diabetes to old killers like tuberculosis and influenza. The health and health care policy environment is in a state of rapid change and uncertainty that is unlike anything since the federal initiatives of Medicaid, Medicare and federally qualified health centers were all created in the 1960’s.
These times demand a clear strategic focus for the Health Department and a basic faith in the
future of our community based on the resilience and strengths of our community members. We need to find ways to foster healthy people, healthy living and healthy communities like never before!
Paul Kuehnert Executive Director, Kane County Health Department September 22, 2011
Kane County Health Department September 2011 Page 4
Progress Report on Kane County Health Department Strategy Implementation (2007 – 2011)
Background
As the local governmental public health agency the Kane County Health Department is charged with the responsibility to act as a catalyst to improve and first and last line of defense to protect, the health of the community and all of its residents. The Department works to develop policy, systems and programmatic initiatives that bring local policymakers, community members and health partners --- hospitals, community health centers, social service agencies, municipalities, school districts and others --- together to achieve community health goals.
Facing an executive leadership transition in 2007, the Kane County’s Board of Health and Health Advisory Committee convened a joint meeting with Health Department senior management and community stakeholders to establish a long term vision and overall strategic direction. That vision---“Kane residents are the healthiest people in Illinois!”--- drove the work of the new Executive Director and the Department’s leadership and staff to clearly articulate organizational values and establish strategic goals and themes.
In 2007 we developed Health Department-specific strategic themes that identified what
was critical for our organization to focus on in order to improve the health of our community. Our three strategic themes were:
Excelling at public health Through effective communication, and Mobilizing community partnerships.
We implemented seven (7) cross-cutting initiatives within the organization from 2007-09 and made progress in moving the organization forward along the lines of these focus areas. We did this work in the context of the five community health priorities that were adopted by the Kane County Board/Board of Health in the 2006 Community Health Action Plan for Kane County:
1. Improve access to health care for those without insurance.
2. Eliminate the disparity in African American infant mortality.
3. Reduce the level of chronic disease.
4. Improve availability of community mental health services
5. Maintain core public health protection services.
In 2009, facing the challenges of addressing the public health mission in a worsening fiscal environment, the Board of Health and Health Advisory Committee reconvened in joint session to review and update our strategic plan. We boldly charted a course forward, affirming
Kane County Health Department September 2011 Page 5

that we did not want simply a ‘good’ health department but that the times demanded a ‘great’ health department: one that was truly mission driven, efficient and effective in improving, protecting and promoting the health of Kane residents.
To communicate our strategic direction, we developed the “3 Keys to Greatness” strategy that includes: Key 1: Attracting and retaining educated, committed leaders and staff who excel and
public health; Key 2: Expertly transform data into actionable health information and communicate it
effectively to diverse audiences; and Key 3: Convene and support active community partnerships that get population health
results. Over the past two years we implemented three (3) cross-cutting initiatives focused on the 3 Keys, as well as two other “running-the-business” initiatives around financial management and quality improvement. Report Contents This Progress Report has two main sections and three appendices:
Part 1 is a report on our progress in addressing the 5 Community Health Action Plan priorities by updating the measures or indicators of progress that were last reported on in late 2009.
Part 2 is a report on our progress in addressing the “3 Keys to Greatness” cross-cutting
initiatives undertaken by Health Department staff from mid-2009 to date. Appendix A is the Kane County Health Department Quality Improvement Summary
Report, January – June, 2011. Appendix B contains the baseline and first two quarterly reports of Maternal Child Health
Indicators, reports that were promised to the community in order to monitor the impact of the transfer of case management and WIC services from the Health Department to three community health centers.
Appendix C is the 2011 County Health Rankings report for Illinois that contains
important population health data for Kane County.
Kane County Health Department September 2011 Page 6

Part 1: Community Health Action Plan Update
Kane County Health Department September 2011 Page 7
Kane County Health Department
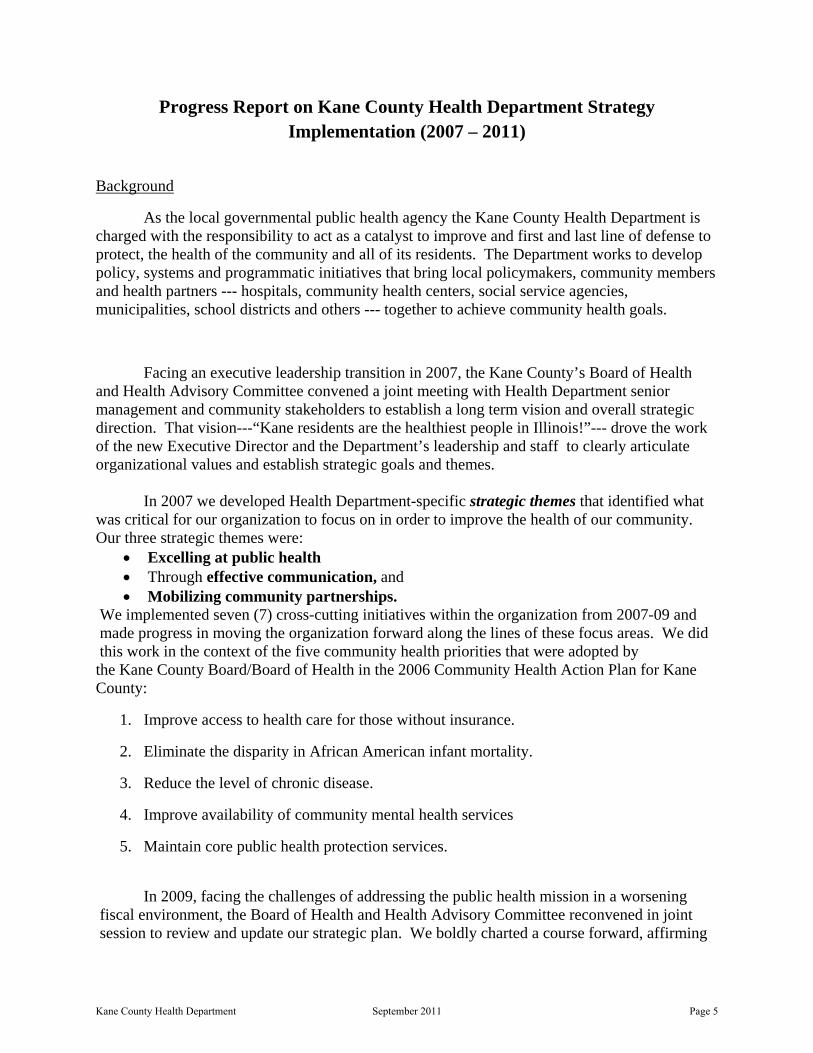
Priority 1: Improve access to healthcare for those without health insurance
2015 Goal: Reduce the rate of hospitalizations for diabetes to 100 per 100,000 residents. Why is this important? If people with diabetes are well informed about their disease and receive regular care from their doctor, most hospitalizations can be prevented. Unnecessary hospitalizations endanger health and drive health costs up. This rate, then, provides a snapshot of how well our health care system is doing in providing care to this population that is estimated to include about 6% of Kane residents.
How are we doing? The 2009 Diabetes hospitalization rate decreased by 14% from its peak in 2005.
0
20
40
60
80
100
120
140
160
180
200
2002 2003 2004 2005 2006 2007 2008 2009
Ra
te p
er
100,
000
Po
pu
lati
on
Diabetes Hospitalization, 2002 to 2009
Kane
IL
2015 Goal
Kane County Health Department September 2011 Page 8
Kane County Health Department
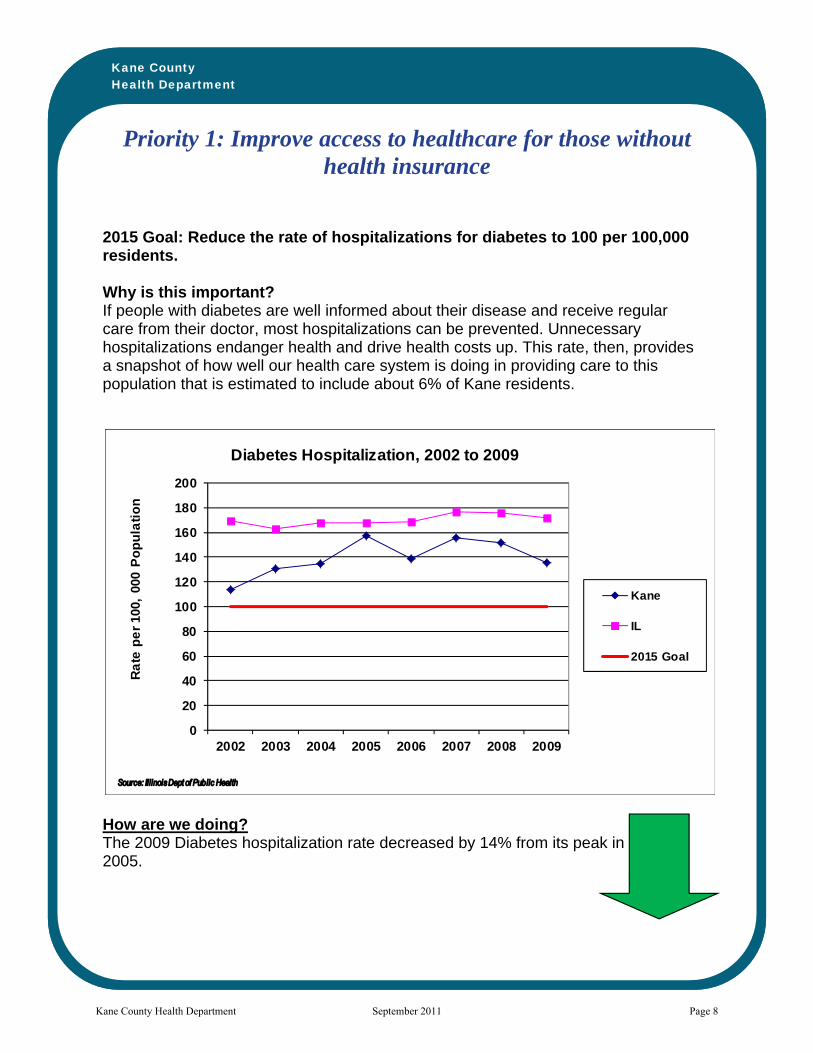
Priority 1: Improve access to healthcare for those without health insurance
2015 Goal: Reduce the rate of hospitalizations for uncontrolled hypertension to 70 per 100,000 residents 18 years old and over. Why is this important? People with uncontrolled hypertension or high blood pressure are likely to have heart attacks or strokes. If people with hypertension are well informed about their disease and receive regular care from their doctor, nearly all hospitalizations can be prevented. Unnecessary hospitalizations endanger health and drive health costs up. This rate, then, provides a snapshot of how well our health care system is doing in providing care to this population that is estimated to be as high as 31% of Kane residents.
How are we doing? Although hospitalization for uncontrolled hypertension has begun to slowly increase, the rate is still below the 2015 goal of 70 per 100,000
0.0
20.0
40.0
60.0
80.0
100.0
120.0
2002 2003 2004 2005 2006 2007 2008 2009
Ra
te p
er
100,
000
Ad
ult
s
Hospitalization for Uncontrolled Hypertension, 2002 to 2009
Kane
IL
2015 Goal
Kane County Health Department September 2011 Page 9

Kane County Health Department
Priority 1: Improve access to healthcare for those without health insurance
2030 Goal: 98% of Kane County residents will have access to healthcare. Why is this important? Lack of health insurance leads people to postpone or neglect to get routine, preventive health services that can help people to have longer, healthier lives. When confronted with health problems, people without insurance often turn to hospital emergency rooms for care, driving up health care costs for all.
How are we doing? The percentage of residents in Kane County with health insurance coverage decreased to 89.1% in 2011.
75
80
85
90
95
100
1997 2002 2006 2008 2011
Percent of A
dults
Kane County Health Insurance Coverage
Kane
Collar
IL*
2030 Goal
*IL 2011 rate was actually for 2010
Kane County Health Department September 2011 Page 10

Kane County Health Department
Priority 2: Eliminate the disparity in African American infant mortality
2010 Goal: Improve 1st trimester entry into Prenatal Care to 80% for African Americans Why is this important? Early entry into prenatal care improves infant health and reduces infant deaths since pregnancy and delivery problems are found early and treated as soon as possible. Entry into prenatal care by a large majority of pregnant women during the first three months of a pregnancy is an important sign of the strength of our health system.
How are we doing? In 2008, about 65.9% percent of African American women in Kane County entered prenatal care in the first three months of their pregnancies.
0
10
20
30
40
50
60
70
80
90
2003 2004 2005 2006 2007 2008
Percent of Live Births
Kane County First Trimester Entry Into Prenatal Care
All Kane County
All African American
2010 Goal
Source: IllinoisDept of Public Health
Kane County Health Department September 2011 Page 11

Kane County Health Department
Priority 2: Eliminate the disparity in African American infant mortality
2015 Goal: Reduce African American Infant Mortality to 10 per 1,000 births. Why is this important? Health disparities are differences in health outcomes experienced by racial, ethnic or socioeconomic groups in a population. Health disparities reflect social conditions and inequities experienced by these groups. Infant mortality has long been known to be the best single measure of the health of a population, group or community.
How are we doing? Although progress still needs to be made, infant mortality rates for African Americans in Kane County during 2003-2007 saw a sizeable decline to 12.2 deaths per 1,000 births
0.0
2.0
4.0
6.0
8.0
10.0
12.0
14.0
16.0
18.0
20.0
1999 ‐2003
2000 ‐2004
2001 ‐2005
2002 ‐2006
2003 ‐2007
Rate Per 1,000
Live Births
Kane County African American Infant Mortality: Rolling Averages 1999‐2007
African American
2015 Goal
Source: IL Dept of Public Health
Kane County Health Department September 2011 Page 12

Kane County Health Department
Priority 2: Eliminate the disparity in African American infant mortality
2015 Goal: Reduce Prematurity in African American infants to 13%. Why is this important? Premature babies (born before 37 weeks) may die or often have serious birth complications, and need specialized therapies. Higher prematurity rates usually lead to higher infant mortality in a population.
How are we doing? In 2008, the prematurity rates for African Americans in Kane County increased slightly to 15.1 percent.
0
5
10
15
20
2003 2004 2005 2006 2007 2006 2007 2008
Percent of Live
Births
Kane County Prematurity Rates By Race, 2001 to 2008
Kane County White African American
Hispanic HP2010 2015 Goal
Source: I linoisDepartment of Publ ic Health
Kane County Health Department September 2011 Page 13

Kane County Health Department
Priority 2: Eliminate the disparity in African American infant mortality
2030 Goal: Zero disparity among racial groups in infant mortality. Why is this important? Health disparities are differences in health outcomes experienced by racial, ethnic or socioeconomic groups in a population. Health disparities reflect social conditions and inequities experienced by these groups. Infant mortality has long been known to be the best single measure of the health of a population, group or community.
How are we doing? Infant mortality rates for all races/ ethnicities in Kane County are declining. The decline is greatest among African American infants, yet, twice as many African American babies died before their first birthday compared to all other races/ethnicities in Kane County.
0.0
2.0
4.0
6.0
8.0
10.0
12.0
14.0
16.0
18.0
20.0
99‐03
00 ‐04
01 ‐05
02 ‐06
03 ‐07
Rate per 1,000 Live Births
Infant Mortality Rates for Kane County By Race/Ethnicity,
5‐Year Averages, 1999 to 2007
AFRICAN AMERICAN
WHITE
HISPANIC
KANE COUNTY
Source: IL Dept of Public Health
Kane County Health Department September 2011 Page 14
Kane County Health Department
Priority 3: Reduce the level of chronic disease
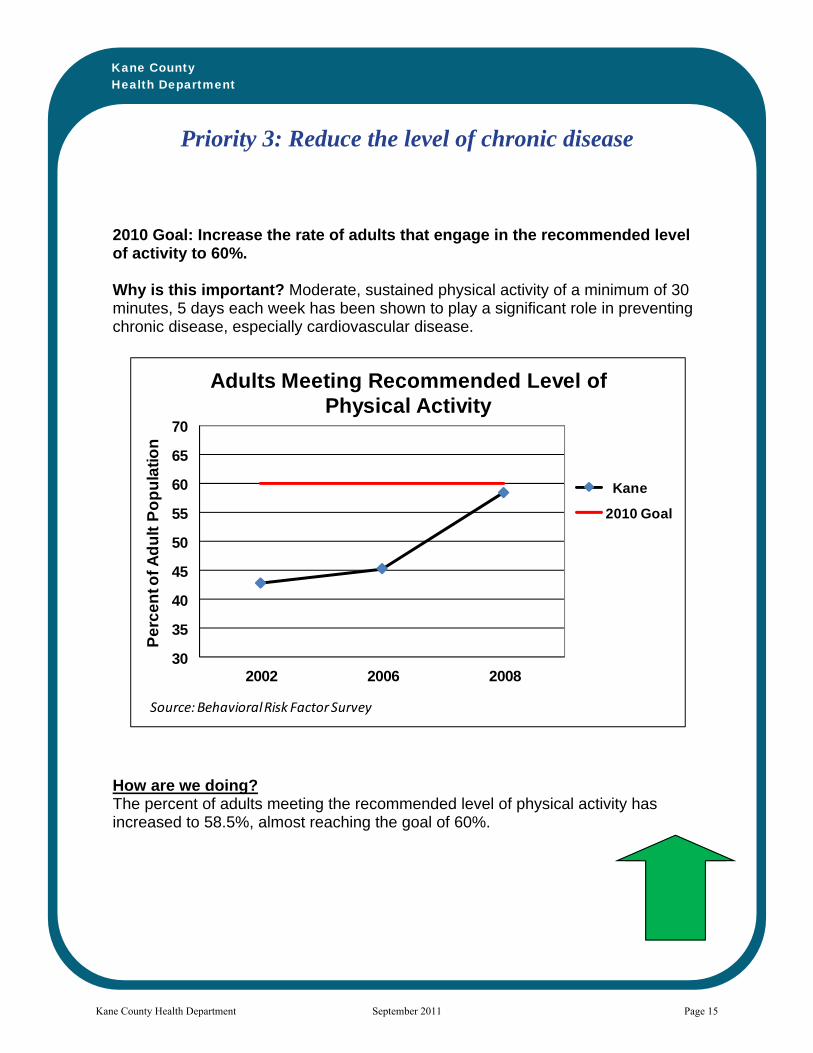
2010 Goal: Increase the rate of adults that engage in the recommended level of activity to 60%. Why is this important? Moderate, sustained physical activity of a minimum of 30 minutes, 5 days each week has been shown to play a significant role in preventing chronic disease, especially cardiovascular disease.
How are we doing? The percent of adults meeting the recommended level of physical activity has increased to 58.5%, almost reaching the goal of 60%.
30
35
40
45
50
55
60
65
70
2002 2006 2008
Pe
rce
nt o
f A
du
lt P
op
ula
tio
n
Adults Meeting Recommended Level of Physical Activity
Kane
2010 Goal
Source: Behavioral Risk Factor Survey
Kane County Health Department September 2011 Page 15

Kane County Health Department
Priority 3: Reduce the level of chronic disease
2015 Goal: Reduce rate of adult smoking and youth smoking to 14%. Why is this important? Smoking tobacco is the single largest cause of chronic disease and premature death. How are we doing? Adult smoking in Kane County dropped to 12%, below the 2015 goal.
0
5
10
15
20
25
30
35
1997 2002 2006 2008 2011
Percent of Adult Population
Adult Smoking, 1997 to 2011
Kane
IL
US
2015 Goal
*IL 2011 rate was actually for 2010
Kane County Health Department September 2011 Page 16
Kane County Health Department
Priority 3: Reduce the level of chronic disease
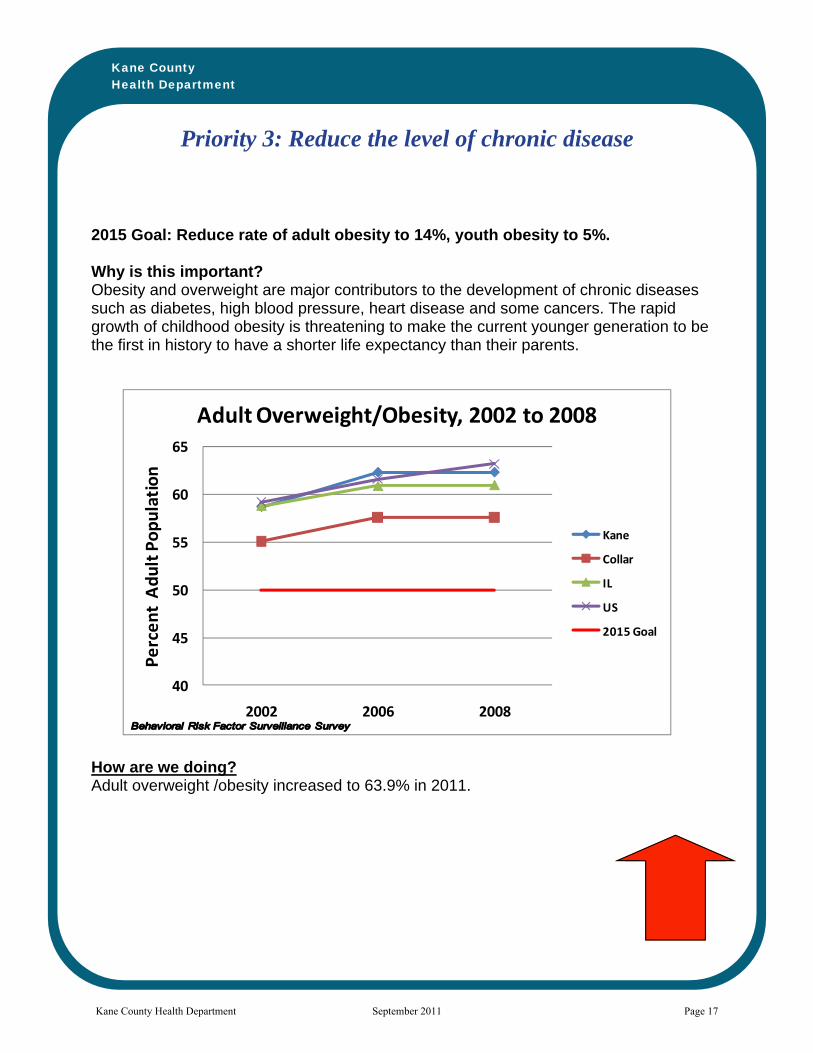
2015 Goal: Reduce rate of adult obesity to 14%, youth obesity to 5%. Why is this important? Obesity and overweight are major contributors to the development of chronic diseases such as diabetes, high blood pressure, heart disease and some cancers. The rapid growth of childhood obesity is threatening to make the current younger generation to be the first in history to have a shorter life expectancy than their parents. How are we doing? Adult overweight /obesity increased to 63.9% in 2011.
40
45
50
55
60
65
2002 2006 2008
Percent Adult Population
Adult Overweight/Obesity, 2002 to 2008
Kane
Collar
IL
US
2015 Goal
Kane County Health Department September 2011 Page 17

Kane County Health Department
Priority 3: Reduce the level of chronic disease
2030 Goal: Reduce rate of premature mortality (under age 65 years) due to coronary heart disease to 25 per 100,000 residents. Why is this important? Premature death from coronary heart disease is almost entirely preventable. This measure reflects the extent to which our Kane County communities, schools and businesses adopt policies that promote wellness and that our residents make healthy lifestyle choices. How are we doing? Premature death from coronary heart disease dropped to 17.2 per 100,000 in 2007.
0
5
10
15
20
25
30
35
40
2003 2004 2005 2006 2007
Ra
te p
er
10
0,0
00
Premature Coronary Heart Disease Mortality2003 to 2007
Kane
IL
2030 Goal
Source: Illinois Departmentof Public Health
Kane County Health Department September 2011 Page 18

Kane County Health Department
Priority 4: Improve availability of community mental health services
2015 Goal: Decrease the proportion of adults who report feeling sad or depressed in the last 30 days to 20%. Why is this important? Depression is a treatable mental illness that affects between 10% and 20% of Kane adult residents during their lifetime. Untreated depression affects the quality of individual and family life, as well as workforce productivity.
How are we doing? The percentage of adults feeling sad or depressed in the past 30 days increased to 40.6% in 2008.
051015202530354045
1997 2002 2006 2008
Per
cen
t o
f A
du
lt P
op
ula
tio
n
Adults Reporting Feeling Sad or Depressed in Past 30 Days
1997 ‐ 2008
Kane
IL
2015 Goal
Kane County Health Department September 2011 Page 19
Kane County Health Department
Priority 4: Improve availability of community mental health services
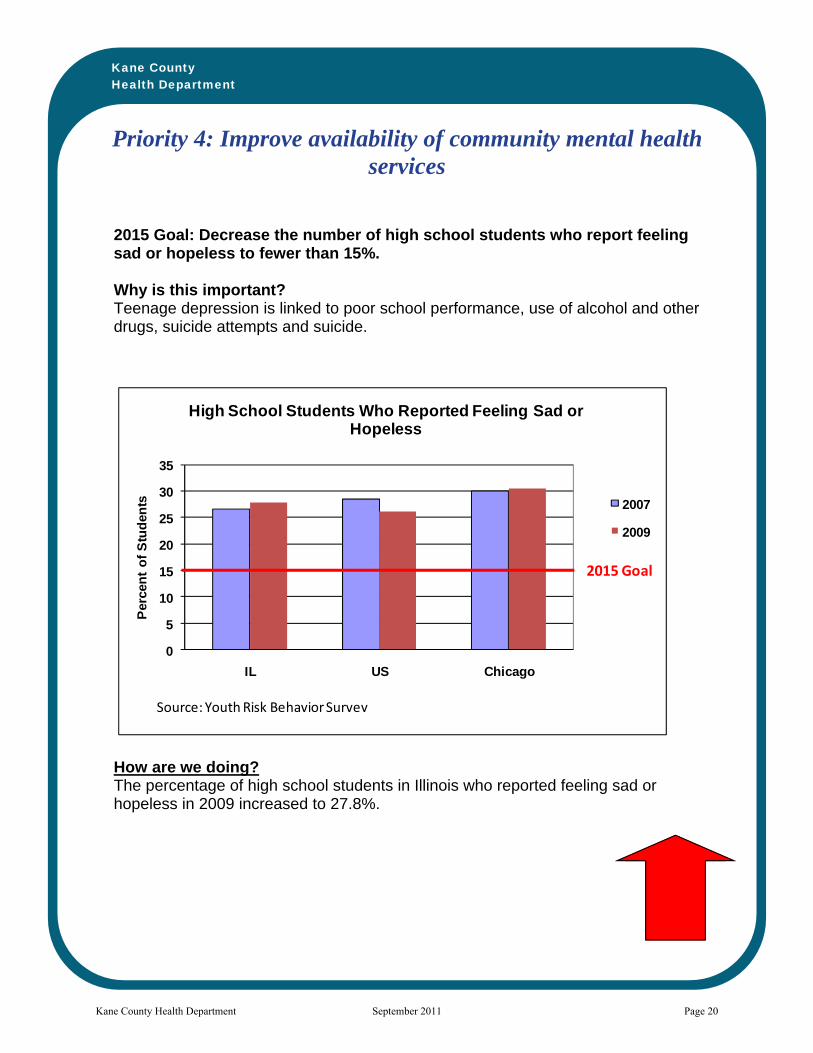
2015 Goal: Decrease the number of high school students who report feeling sad or hopeless to fewer than 15%. Why is this important? Teenage depression is linked to poor school performance, use of alcohol and other drugs, suicide attempts and suicide.
How are we doing? The percentage of high school students in Illinois who reported feeling sad or hopeless in 2009 increased to 27.8%.
0
5
10
15
20
25
30
35
IL US Chicago
Per
cen
t o
f S
tud
ents
High School Students Who Reported Feeling Sad or Hopeless
2007
2009
2015 Goal
Source: Youth Risk Behavior Survey
Kane County Health Department September 2011 Page 20

Kane County Health Department
Priority 4: Improve availability of community mental health services
2030 Goal: Reduce percentage of high school students who attempted suicide to 5%. Why is this important? More than 90% of young people who complete suicide have a diagnosable mental or substance abuse disorder or both. Decreasing the rate of suicide attempts will indicate that our education, health and mental health systems are improving their ability to identify and help at-risk teens.
How are we doing? The percentage of high school students in Illinois who attempted suicide in 2009 increased to 8% and was higher than the US rate.
0
2
4
6
8
10
12
14
IL US Chicago
Per
cen
t O
f S
tud
ents
High School Students Who Reported Attempting Suicide
2007 2009
2030
Goal
Source: Youth Risk Behavior Survey
Kane County Health Department September 2011 Page 21

Kane County Health Department
Priority 5: Maintain core public health protection services
2010 Goal: Reduce rate of infectious syphilis among residents to 1 per 100,000. Why is this important? Infectious syphilis, a sexually transmitted disease, is entirely preventable. If not prevented or detected early, it can lead to serious complications and death. This rate is a measure of the effectiveness of the Public Health Department to prevent, detect and respond to this disease and protect the community.
How are we doing? In 2009, Kane County rate of infectious syphilis increased slightly to 1.5 per 100,000.
0
1
2
3
4
5
6
7
2005 2006 2007 2008 2009
Rate per 100,000
Tarifa por 100,000
US IL Kane Goal /Meta
InfectiousSyphilis Sifilis Infecciosa
Source: Kane County Health Dept
Kane County Health Department September 2011 Page 22

Kane County Health Department
Priority 5: Maintain core public health protection services
2015 Goal: Increase the rate of age-appropriate immunization vaccination coverage to 90% for two-year-olds. Why is this important? Immunizations protect both individuals and the community as a whole from serious, life-threatening communicable diseases such as polio, whooping cough and measles. Younger children are particularly vulnerable to these diseases if not protected by immunizations. Outbreaks of these diseases can rapidly develop and have widespread health and economic effects in a community.
How are we doing? Immunization rates for Kane County children 19-35 months decreased slightly to 72.8%. This rate is the same as Illinois rate but higher than US rate.
60
65
70
75
80
85
90
2005 2006 2007 2008 2009
Percent of Children
Porcentaje de Niños
Goal/ Meta
US
IL
Kane
Childhood ImmunizationsPercent of Children age 19‐35 months
Inmunizaciones InfantilesPerecentaje de Niños entre 19 años y 35 meses4:3:1:3:3:1 Serie de Inmunizaciones Finalizadas
Source: IL Dept of Public Health
Kane County Health Department September 2011 Page 23

Kane County Health Department
Priority 5: Maintain core public health protection services
2030 Goal: 0% of tested children under six will have elevated blood lead levels in their blood. Why is this important? Lead poisoning can have major negative impacts on the growth and development of young children, particularly those 6 years old and under. Most children are exposed to lead due to lead paint that was used in homes built prior to 1970. Lead poisoning is entirely preventable. The rate of lead poisoning in children under 6 is a measure of the effectiveness of the public health department working with the medical community, parents, landlords, municipal development departments and contractors in eliminating sources of lead poisoning.
How are we doing? In 2010, 1.0% of children under six years of age who were tested in Kane County had elevated blood lead levels. This has shown a steady decrease over the past ten years
0.0%
1.0%
2.0%
3.0%
4.0%
5.0%
6.0%
7.0%
8.0%
9.0%
10.0%
'00 '01 '02 '03 '04 '05 '06 '07 '08 '09 '10
Percent of Children
Porcentaje de Niños
Kane County Percentage of Children /Porcentaje de NiñosGoal/Meta
Percentage of Children with Elevated Blood Lead Level
Porcentaje de Niños con elevado Nivel Lead en la Sangre
Source: ILDept of Public Health
Kane County Health Department September 2011 Page 24
Part 2: 3 Keys to Greatness Update
In 2009, facing the challenges of addressing the public health mission in a worsening fiscal environment, the Board of Health and Health Advisory Committee reconvened in joint session to review and update our strategic plan. We boldly charted a course forward, affirming that we did not want simply a ‘good’ health department but that the times demanded a ‘great’ health department: one that was truly mission driven, efficient and effective in improving, protecting and promoting the health of Kane residents.
To communicate our strategic direction, we developed the “3 Keys to Greatness” strategy that includes: Key 1: Attracting and retaining educated, committed leaders and staff who excel and
public health; Key 2: Expertly transform data into actionable health information and communicate it
effectively to diverse audiences; and Key 3: Convene and support active community partnerships that get population health
results. Over the past two years we implemented three (3) cross-cutting initiatives focused on the 3 Keys, creating initiative teams with formal charters, as well as two other “running-the-business” initiatives around financial management and quality improvement. Our efforts and progress to date is summarized below.
Key 1: Attracting and retaining educated, committed leaders and staff who excel and public health
The Team Charter for this initiative described its mission as: “Evaluate staff competencies and address deficiencies through continuing education, training and leadership development activities.” This mission is in support of the overall effort to achieve excellence in public health practice---i.e., achieving maximum efficiency and effectiveness in all we do---in order to achieve the best possible health outcomes for the community. Thus, in 2009 we started exploring national and regional efforts underway in the public health community to identify core competencies for public health staff members1 and brought new resources to the Department to provide continuing education and increase professional knowledge2
1 See the Public Health Foundation’s Council on Linkages between Academia and Public Health for this information at:
that would translate into improved services for the community. This work served us well, then, in providing a framework for our reorganization of the Department in 2010 and the creation of entirely new job descriptions for every job in the Department---based on national standards and competencies.
http://www.phf.org/resourcestools/pages/core_public_health_competencies.aspx 2 For example, we partnered with the University of Illinois Chicago and the University of Washington on a public health nurse education and retention project that is funded by the Health Resources and Services Administration of the Department of Health and Human Services. This grant has provided in-depth training and skill-building for all of our public health nurses at no cost to Kane County.
Kane County Health Department September 2011 Page 25

Examples of key accomplishments in this Key initiative have included:
• Developed and implemented a merit-based pay system for both management and staff
based on achievement of ‘stretch’ performance goals, individualized learning and growth achievements and teamwork and leadership accomplishments.
• As part of the 2010 reorganization, developed and implemented complete reclassifications of jobs into three categories for all staff positions and rewrote all management and staff job descriptions for each classification assuring alignment with national public health standards and a focus on essential public health services
• As part of above, increased educational requirements for most staff and management job classifications while providing for a period of up to four years for current incumbents to attain additional education and meet the requirements with the support of the County’s tuition reimbursement program
• Updated salary survey for all management and staff positions in order to assure alignment of compensation with the new job classifications3
• Increased participation in both continuing education and college undergraduate and graduate programs by staff as per individual learning and growth objectives documented in performance evaluations and job classifications
• Begun implementation of an internal workforce training curriculum aligned with the new job classifications. The initial focus is on assuring that all staff have achieved emergency preparedness training based upon the National Incident Management System standards which requires each employee to gain competency in training areas based on their job classification within the organization and assignments during public health emergencies.
Key 2: Expertly transform data into actionable health information and communicate it effectively to diverse audiences
The team Charter of the Key 2 initiative was stated as: “Develop a comprehensive plan for building KCHD’s health information system, to include three major subcomponents:
1. Coordinated data systems, including a data warehouse 2. Data analysis/transformation into health information
3 Note that there have been no salary or wage increases for Health Department staff since December 2008 for management and December 2009 for staff.
Kane County Health Department September 2011 Page 26

3. Health information/message development, dissemination/communication.”
In the ‘information age’ of the 21st Century, effective communication is central to everything we do in public health. It is mission-critical that the Department obtains a wide variety of accurate health data and transforms it into clear, understandable health information that residents, policymakers and community health partners can act on. Since 2009, KCHD made significant progress in developing a plan to enhance the department’s health information and data management systems and implemented key initiatives focused on increasing the quality of the department’s communication with stakeholders, residents and elected officials. During this time there have been several major events including, the “swine flu” (novel H1N1 A influenza) pandemic and the reorganization of the Department and its services that have provided challenging opportunities to improve our communication effectiveness. The reorganization of the Department resulted in two positions, located in the Office of Community Health Resources, that are explicitly focused on data and communications. These positions, Health Communications Coordinator and Health Data & Quality Coordinator, assure a continued focus on expertly transforming data into information to all our customers that is accurate, real-time and actionable.
Key examples of our progress in data management and communications include:
• Web-based Disease Monitoring
Significant progress has been made in the implementation of web-based disease monitoring systems in collaboration with our five community hospitals and our nine school districts. With the expert help of the County IT Department we developed and implemented web-based reporting for school absenteeism in order to monitor influenza-like illness. We have also made progress in implementing a syndromic surveillance system in Kane’s five hospitals, ESSENCE, that will soon be implemented across the Chicago region. This is an early detection system for disease outbreaks and unusual occurrences that might indicate pandemics or bioterrorism.
• Health Matters
In January 2010, KCHD launched the first Health Matters newsletter. This monthly electronic publication highlights at least three current activities at the health department that have broad impact on the community. Health Matters is distributed currently to over 1,000 community leaders and residents by email each month. Previous editions remain available on the KCHD website. In 2010, the monthly release of Health Matters was changed to coincide with the Public Health Committee meetings in order to provide more in-depth information to our residents on updates provided to the committee. Health Matters provides a unique opportunity for the department to communicate directly with our partners about important public health topics each month.
• Public Health Committee Flash Report
Kane County Health Department September 2011 Page 27
Seeking to eliminate paper reports while maintaining complete transparency on Department activities, we developed a new electronic monthly report for our Board and Health Advisory Committee in January, 2010. Features include high level summary graphs, tables and stories with links to in depth data maintained on our website. Two or three stories illustrating delivery of different essential public health service include a short synopsis of the initiative, a graphical display and link to the essential public health service to which the initiative is tied. The report also includes a high-level picture of the Department’s financial data each month. The flash reports also available to the public on the health department’s website along with the monthly statistics required to be reported.
• Maternal-Child Health Report Card
In August, 2010, the Kane County Board authorized the Department to transfer a number of state-funded grants for individual maternal-child health services to three Community Health Centers serving Kane residents. In order to monitor the impact of this transfer on services to Kane residents the Department gathers a set of service participant and program outcome data, reviews the data with the Kane County Perinatal Committee, and issues quarterly reports of findings and recommendations.
• Messages of the Month
Our Communications Coordinator, in collaboration with partner agency and Department program staff has developed and distributed regular health promotion messages through the Wellness Wednesday emails to all County staff, and monthly information to the community from the Breastfeeding Coalition, and Mental Health Council since 2009.
• Social Media
Beginning in late 2009, the department has maintained an active Facebook page where short, relevant links to health activities, information and events are shared. The Facebook page serves as a critical outlet for providing timely information and resources to individuals who have explicitly requested such updates. Twitter “tweets” provide an opportunity to share timely public health information in short messages that are frequently forwarded or “re-tweeted” by recipients on to their followers. These two communication methods supplement our ongoing maintenance and upgrading of our website (www.kanehealth.com ) and media releases.
Key 3: Convene and support active community partnerships that get population health results. The Charter of our Key 3 initiative was: “…to analyze & evaluate partnerships in the community and develop a process to improve the health department’s participation the most critical partnerships to maximize resources and eliminate redundancies. Each partnership [is to be] evaluated and classified individually…”
In 2009 we completed an inventory of all of the community partnerships the Department was involved in and the partnerships were evaluated and classified using standardized criteria.
Kane County Health Department September 2011 Page 28

For those partnerships that the Department convened and staffed, the members were surveyed about partnership meeting effectiveness. In 2010, with resources from the Illinois Public Health Institute, a plan was developed and implemented to maximize utilization of resources and make partnership meetings more effective4
Also in 2010 the Department was identified by a team of population health services researchers at the University of Wisconsin as a leader in community partnerships and invited to participate in MATCH Multi-Sector Partnership Case Study. This national study is ongoing and is examining the role of partnerships in achieving population health improvements in communities. We look forward to the completion of the study and learning from its findings to further enhance our practice in this area.
.
Following is a brief summary of the key accomplishments of the community health partnerships that the Department has facilitated and staffed over the past two years.
Making Kane County Fit for Kids- created in 2008, this multi-sector campaign was created to reduce childhood obesity a key factor that will drive premature illness and death if action is not taken. Achievements include:
Created public/private Funders’ Consortium that has raised and distributed over $200,000 to the community.
Selected as one of 41 grantees nationally and awarded $360,000 over four years by the Robert Wood Johnson Foundation.
Created Fit Kids 2020, a comprehensive community-developed ten-year plan to reduce obesity.
Kane County Perinatal Committee: Maternal-child health professionals county-wide address the prenatal and postpartum health issues that face new babies and new parents. Coordinated communication, planning and intervention, achievements are:
Managed community oversight of the late 2010 transition of Maternal Child Health (MCH) services for low income women.
Participated in the Centering Pregnancy Project in Illinois, which found that the prematurity rate of participants was 6% as compared to the Illinois state rate of 12.7% (2008, the latest data we have available).
Convened the community and other MCH professionals at Forums to address the disparity in Infant Mortality among Kane County African American infants.
4 The Department competed for these resources made available through the Multi-state Learning Collaborative and funded by the Robert Wood Johnson Foundation. This project, was coordinated by the Illinois Public Health Institute and focused on utilizing quality improvement tools to increase community partner engagement and effectively work together to address community health priorities.
Kane County Health Department September 2011 Page 29

Completed an in-depth Perinatal Periods of Risk Study, analysis and action plan to decrease excess infant deaths. (Presented at a national MCH meeting!)
Conducted physician feedback sessions to develop priorities for promoting health before and between pregnancies.
All Our Kids (AOK) Early Childhood Network: Assuring that we meet the early learning, health, family support, and early intervention needs of very young children, AOK partners have made Kane County home to a vibrant, comprehensive, proactive Early Childhood System through:
Parent Immunization Surveys Developmental screening training and promotion among pediatric practices Choosy Kids workshop for childcare and preschool providers to incorporate activity into
daily activities and learn how this activity helps brain development and learning Created a series of Building Block Parent Handouts about balanced diet and activity to
maintain age appropriate weight Addressed the community learning needs around Childhood Lead poisoning was through
a creative education session and training tool dissemination Stall Street Journals for Kids series directed to preschool children were developed and
widely disseminated. Each Journal consists of a simple message for children and information for parents and child care providers.
Circles of Wise Women are groups of African American community women based in Elgin and Aurora committed to acting together to reduce the number of babies that die before their first birthdays. Through outreach, peer education and advocacy, the Circles have become familiar and welcome in the community:
Poster campaigns to prevent premature births Annual “It’s a Family Affair Barbeque to enhance awareness and prevention Educational, fun “Baby Showers” for African American mothers combine fun with
education in order to decrease infant mortality—in partnership with faith communities, health, and social service agencies
Outreach to African Americans in the larger housing complexes Surveys and town hall meetings for Aurora African American women about health
issues and communication with doctors Participation in community health fairs Healthy cooking demonstrations
. Kane County Mental Health Council is made up of executive leaders from over twenty organizations providing mental health services in Kane County. Recent accomplishments include:
Created an active website to provide information to providers and consumers in the community
Kane County Health Department September 2011 Page 30

Conducted comprehensive service assessments and analysis to develop plans for improving efficiencies in the local mental health system
Supported special awareness efforts such as a mental health message of the month, What a Difference a Friend Makes campaign and the Say it Out Loud anti-stigma campaign.
Kane County Breastfeeding Coalition: Working across the entire county, these partners prevent child obesity and promote women’s health by promoting breastfeeding:
Development and wide dissemination of locally created breastfeeding promotional materials—posters, buttons, and bookmarks using the theme “Mama’s Restaurant”
*Conducting a parent survey at local birthing hospitals, pediatric offices and WIC sites to assess perceptions and experiences parents have with breastfeeding education and support
Recruited Kane MCH professionals to attend Illinois Bridges to Breastfeeding Training
Annual World Breastfeeding events Currently developing a Tool Kit for Pediatricians which will have content
KCHAIN- formed to address access to healthcare needs; the Kane Collaborative Health Access Integration Network has worked with clinics and hospitals to strengthen the safety net in Kane County. Recent efforts have included:
Secured dedicated funding to increase access to specialty care among the un-insured and under-insured
Implemented prescription medication assistance program to assist those in need, many who have recently lost their jobs.
Kane County Coalition for Health & Wellness- dedicated to improving the health of residents in Kane County. Over the past several years this coalition has:
Created and distributed a worksite wellness guide Developed and piloted a Prescription for Wellness program Initiated educational Stall Street Journals for schools and worksites.
Conclusion
The Kane County Health Department has made significant strides in improving community health and increasing organizational efficiency and effectiveness since 2009. Over the past two years our significant accomplishments include: Improving our County Health Rankings from 11th to 9th overall in Illinois;
Kane County Health Department September 2011 Page 31
Protecting our community from significant health threats by effectively managing an ongoing outbreak of tuberculosis among the homeless, coordinating response to the novel H1N1 influenza A pandemic, and containing a number of foodborne illness outbreaks;
Mobilizing our community around the main threat to our children’s health, the
epidemic of obesity and overweight, through the public-private partnership of Making Kane County ‘Fit for Kids’; and
Reorganizing our Department so that it is slimmer, flatter, and entirely focused on
the essential services of public health. The reorganization has been accomplished in a manner that assures that we meet national public health accreditation standards and that is economically sustainable, while assuring that personal health services that the Department no longer provides were smoothly transferred to community health partners.
At this time, our nation and our Kane County community are in the midst of the most severe
economic recession since the Great Depression. We face both new and re-emerging threats to our health ranging from the epidemic of obesity and diabetes to old killers like tuberculosis and influenza. The health and health care policy environment is in a state of rapid change and uncertainty that is unlike anything since the federal initiatives of Medicaid, Medicare and federally qualified health centers were all created in the 1960’s.
These times demand a clear strategic focus for the Health Department and a basic faith in the
future of our community based on the resilience and strengths of our community members. We need to find ways to foster healthy people, healthy living and healthy communities like never before!
Kane County Health Department September 2011 Page 32

Appendix A: Kane County Health Department Quality Improvement Summary Report
January – June, 2011
Kane County Health Department September 2011 Page 33

KANE COUNTY HEALTH DEPARTMENT QUALITY IMPROVEMENT SUMMARY REPORT
January – June 2011 I. Overview During the first six months of 2011, the Kane County Health Department’s (KCHD) Quality Improvement (QI) initiatives have focused on fostering a QI culture among all staff through the following initiatives:
1. Creation of KCHD’s QI framework, including the development and implementation of a QI Policy, QI Plan, and QI Committee (and Committee Charter).
2. Training on and practice of QI tools through monthly All Hands meetings and monthly team meetings.
3. Implementation of section-level Plan-Do-Check-Act (PDCA) projects. II. Activity Summary
1. Governance of QI An overview of the framework for QI was shared with the Kane County Health Advisory Committee in January 2011, and in March 2011, the Committee was surveyed regarding their opinions and views regarding the agency’s pursuit of voluntary Public Health accreditation. Feedback and comments made by the Committee were used in development of QI activities and QI planning in this period. This Committee also provided consultation regarding the development of an agency performance management system.
2. QI Policy A review was completed of the draft QI policy developed in 2010, and modifications were made based on the reorganized KCHD structure. This revised policy was reviewed and approved by the Assistant Director for Community Health Resources and the QI Committee, and was reviewed by the Executive Director. This policy is currently in review by the KCHD Leadership Team as a part of a broader agency policy review.
3. QI Plan A draft QI Plan for 2011 was developed by the Health Data and Quality Coordinator (HDQC) in early April 2011 and shared with the Assistant Director for Community Health Resources and the Health Planner in the Office of Community Health Resources in mid-April. Following that review, modifications were made, and the document was then sent for review to the QI Committee and the Executive Director. The plan was approved and signed by the Executive Director on June 13, 2011. During the June All Hands staff meeting, the plan was shared with all staff and placed on the agency’s shared network drive for view by all staff. This QI Plan provides a framework for QI activities and training through the end of 2011.
Kane County Health Department September 2011 Page 34

4. QI Committee
In March 2011, the QI Committee held its first meeting since the agency reorganization in November 2010. The QI Committee is now comprised of 9 members, 3 from each division/office and includes 1 member of Leadership and 2 staff positions from each division/office. Committee members were selected based on their interest and request to participate, and represent their section workgroup on the section’s PDCA project. In the first 3 months, the committee has worked with the HDQC (who serves as the committee chair) to evaluate and plan All Hands meeting agendas, discuss the role of the Committee in Public Health Accreditation preparation, and to review and finalize a draft QI policy. The group additionally developed a Team Charter, which was approved by the Executive Director on June 13, 2011. This Committee most recently completed PDCA storyboards for their respective projects, which were presented during the June 2011 All Hands staff meeting.
5. Employee QI Training Based on needs identified by staff in January 2011, the HDQC provided training on a number of QI tools (PDCA, Aim Statements, Flowcharts, Cause & Effect Diagrams, Force Field Analysis, Storyboards, Pareto Charts, Pie/Bar/Run Charts, and Check Sheets) during All Hands and section/division meetings. Training materials were developed utilizing the resources of the Public Health Foundation’s Public Health Memory Jogger, the Michigan Quality Improvement Guidebook, and the American Society for Quality’s Public Health Quality Improvement Handbook. For each tool, a PowerPoint training presentation and one-page handout was developed. Time was set aside in both monthly All Hands meetings and monthly section and/or division meetings to learn about and practice QI tools. More information regarding employee training can be found in Section III of this document.
6. Implementation of PDCA Projects Each KCHD section completed a brainstorming process to select an improvement project in January 2011. Aligned with the training completed at All Hands and division/section meetings, each section selected a project, set an Aim Statement, looked at or collected baseline data and completed a root cause analysis. The Aim Statements are listed below: Community Health Resources AIM STATEMENT: By the end of March 2011, 95% of KCHD staff will acknowledge each Code Red call. Public Health Nursing (HRIF) Section AIM STATEMENT: Between 2/1/11 and 12/31/11, 80% of HRIF clients will receive an initial Home Visit within 14 days of receiving the Infant Discharge Record from the last hospital of care. Administrative Section AIM STATEMENT: By July 15, 2011, 100% of grant owners (3) will be approached by Finance to develop a schedule for mandatory grant meetings for the next 12 months. Environmental Health Section
Kane County Health Department September 2011 Page 35

AIM STATEMENT: The Environmental Health Section will decrease the average number of violation #3 by 20% in one year for category 1, 2, and 3 food service establishments. Community Health Section AIM STATEMENT: By July 1, 2011, the Community Health Section will increase from 60% to 100% both the knowledge of meetings and the knowledge of the purpose of the meetings for three selected partnerships. Communicable Disease Section AIM STATEMENT: By July 1, 2011, accuracy of vaccine accountability for the Immunization Program will increase from 92% to 98%. Public Health Nursing (Immunizations) Section AIM STATEMENT: By 7/1/11 the rate of KCHD PHN’s that have reached competency as described in the “Clinical Competencies for Public Health Nurses” will increase from baseline to 100%. KCHD Leadership Team AIM STATEMENT: By 6/1/12, Leadership staff’s self-assessment of financial management competencies will increase from X to Y (levels TBD). An update on progress of these projects can be found in Section VII of this document.
7. Communication An initial QI overview, describing PDCA as the process being implemented at the agency, was distributed in the agency’s Health Matters newsletter in December 2010. In addition, PDCA updates have been provided by the QI Committee representative for each section at monthly All Hands meetings, sharing the progress of the project, as well as any challenges or successes experienced. PDCA workgroups shared storyboards for their respective projects at the June 2011 All Hands meeting, with plans for a final version to be displayed in agency offices. With approval of the QI Plan complete, this plan was shared with all staff and made available on the agency’s shared drive. An article about the implementation of QI activities at KCHD in the first six months of 2011 was developed for the agency’s “Health Matters” newsletter and distributed in June 2011.
8. Links to Public Health Accreditation The HDQC currently serves as the domain lead for accreditation domain 9 (Evaluate and continuously improve processes, programs and interventions), and the QI Committee has been identified as the support team for accreditation preparation. A gap analysis of domain 9 has been completed, and the HDQC and QI Committee are working on a plan to remedy the gaps, including development of a committee charter, finalization of a QI policy and QI plan, and will soon begin discussing how to assess and evaluate customer satisfaction. In addition, the agency is currently exploring the implementation of an agency-level performance management system, built on the Turning Point: Collaborating for New Century in Public Health model designed by the Public Health Foundation and Robert Wood Johnson Foundation. This model
Kane County Health Department September 2011 Page 36

will be aligned in Fall 2011 with the development of an agency strategic plan and a Community Health Improvement Plan (CHIP).
III. Training Summary A plan for staff training relative to QI was developed based on the results of surveys that were completed by staff at All Hands and separately by the Leadership team in January 2011. Results of those surveys are below.
Utilizing 1 ½ - 2 hours of each monthly All Hands meeting and time at Division/Section meetings each month, the Health Data and Quality Coordinator, with the support of the Leadership Team and QI Committee, provided training topics that included:
• QI & Accreditation Overview • PDCA and Aim Statements • Flowcharts, Cause & Effect Diagrams • 5 Why’s • Gantt Charts • Force Field Analysis • Brainstorming & Affinity Diagrams • Storyboard Development • Data Collection, Analysis & Management (including information on check sheets, run charts,
pie charts, bar charts & Pareto diagrams) The training sessions included a PowerPoint presentation outlining the QI tool(s), examples relative to public health, break-out sessions in PDCA workgroups to develop the tool specific to their respective PDCA project, a reporting of what was created in the breakout session, and a quiz to check comprehension of the new material learned. Material was designed to not only build on earlier learning, but also was done in conjunction with the process for PDCA.
Kane County Health Department September 2011 Page 37

Following each training session, staff were surveyed regarding their level of perceived understanding of the new material, as well as their level of interest/buy-in for quality improvement.
Evaluation results were compiled following each meeting, and results were used to improve the format, agenda and activities of subsequent meetings through consultation with the QI Committee. This process was simplified by the use of an electronic audience polling system in March, where quiz results were immediately shared; in April, this expanded to include the meeting evaluation. Staff response to the use of the polling devices was overwhelmingly positive, both for the interaction that they allowed and the immediate feedback provided through their use. The final QI All Hands meeting, held in June 2011, included a summary of the training, a 10-question final quiz on all training topics, and an opportunity to evaluate both the last meeting and the entire 6-month training series. Following the June 2011 All Hands meeting, staff were asked to again complete the QI Training Needs Survey that was a part of the first All Hands meeting in January 2011. The results of these surveys were compared to see if 1) staff perceived need for QI tools training had decreased, 2) staff reported increased use of QI tools, and 3) Leadership reported increased use of QI tools (without the support of the HDQC). Additionally, questions were asked regarding staff understanding of QI in the agency, interest in QI Committee participation, and desire to integrate QI methods into daily work. As the graphs below indicate, the training methods used in the first six months of 2011 were successful in decreasing staff need for training, increasing the use of QI tools (both on an individual level and on a team level by Leadership), and increase in responses to the broad questions regarding QI. Results of this survey will determine the direction of training for the second half of 2011.
Kane County Health Department September 2011 Page 38
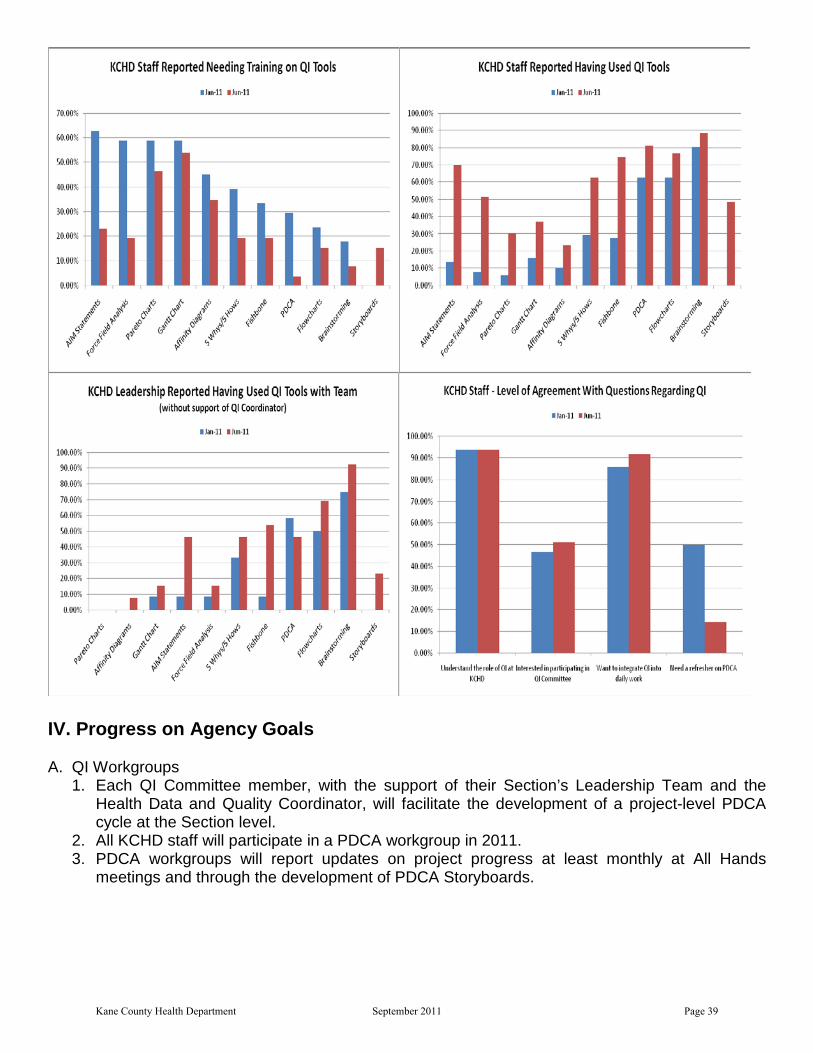
IV. Progress on Agency Goals A. QI Workgroups
1. Each QI Committee member, with the support of their Section’s Leadership Team and the Health Data and Quality Coordinator, will facilitate the development of a project-level PDCA cycle at the Section level.
2. All KCHD staff will participate in a PDCA workgroup in 2011. 3. PDCA workgroups will report updates on project progress at least monthly at All Hands
meetings and through the development of PDCA Storyboards.
Kane County Health Department September 2011 Page 39
All staff currently participate in a PDCA workgroup, and are providing regular updates on project progress through All Hands meetings. Storyboards were developed by the member of the QI Committee representing their respective section, and those storyboards were shared at the June 2011 All Hands meeting, where all staff were given opportunity to ask questions and provide feedback. B. QI Projects
1. All KCHD Sections will complete at least one PDCA cycle during 2011. 2. PDCA projects will be documented and maintained in an electronic format on KCHD’s shared
computer drive (S Drive). 3. A final Storyboard will be completed by all PDCA workgroups to indicate what changes will be
made based on project results. Each KCHD section is currently working on at least 1 PDCA project, and updates are maintained on the agency’s shared computer drive by the HDQC. The QI Committee representative for each PDCA project is currently working with their team to develop their PDCA storyboard, the final version of which was shared with all KCHD staff at the June 2011 All Hands meeting (if project is not complete, storyboard will be as up-to-date as possible).
C. Training
1. KCHD staff will receive QI training during 2011 on the following topics: a. QI and Accreditation Overview b. PDCA and project selection c. Aim Statements d. Flowcharts e. Root Cause Analysis (5 Why’s, Cause & Effect Diagrams, Force Field Analysis) f. Development of storyboards g. Data collection, Analysis and Display (including run charts, Pareto charts, and check
sheets) h. Brainstorming and Affinity Diagrams
Training has been completed, and summary information can be found in Section III of this document. 2. Following the development of KCHD’s Community Health Assessment (CHA), Community
Health Improvement Plan (CHIP) and Strategic Plan, 100% of the KCHD Leadership Team and QI Committee will receive training on development of goals, objectives and performance measures.
As the CHA and CHIP are still in development, no progress has been made on this goal in the first 6 months of 2011. It is anticipated that this work will begin in Fall 2011.
D. Recognition 1. KCHD’s Executive Director will recognize high-performing staff, Programs/Sections, and
Divisions for advancing QI at KCHD. In June 2011, all staff were recognized at the All Hands meeting for their efforts in implementing and integrating QI tools and practices within their work through presentation of a Certificate of Appreciation. The HDQC will meet with the Executive Director in the second half of 2011 to develop a system of on-going recognition regarding QI efforts.
Kane County Health Department September 2011 Page 40
E. Promotion 1. The Health Data and Quality Coordinator will work with the Leadership Team to identify
opportunities to present KCHD QI efforts and projects at conferences and in publications. Upon completion of the first PDCA project, the HDQC will meet with the project’s QI Committee representative and/or section leadership to discuss opportunities for presentation. In addition, the HDQC will provide to the National Association of City and County Health Officials (NACCHO) a summary of QI efforts for use on their “Accreditation Preparation/QI Stories from the Field” website.
F. Long-term Goals 1. As a part of the development of CHA, CHIP and Strategic Plan, the Health Data and Quality
Coordinator will work with those involved to develop Quality Improvement goals and objectives that are quantifiable and time-bound, with specific performance measures that are monitored and evaluated at least quarterly, and that goals and objectives are created both at the agency level (10-15) and at the Division level (10-20 per Division).
2. By the end of 2012, develop Leadership Team and QI Committee members such that PDCA projects can be facilitated independently.
3. By the end of 2012, have in place a functional “Big QI” strategy and Performance Management system at KCHD.
As the CHA and CHIP are still in development, no progress has been made on this goal in the first 6 months of 2011. It is anticipated that this work will begin in Fall 2011.
V. Progress on Quality Improvement Goals National Benchmark/Objective (based on PHAB, Guide to Standards and Measures, Standard 9.2): Implement Quality Improvement of Public Health Processes, Programs and Interventions. Goal 1: Establish a quality improvement plan based on organizational policies and direction. Objective: Develop an annual agency QI Plan that seeks to increase staff knowledge of
quality improvement and supports development of PDCA implementation, and considers importance of PHAB accreditation requirements moving forward.
Measure: Signed and documented 2011 KCHD QI Plan. Key Strategies: 1. Creation of draft QI plan by the Health Data and Quality Coordinator. 2. Review of QI plan by Assistant Director for Community Health Resources, QI
Committee, and Executive Director. 3. 2011 KCHD QI Plan approved by KCHD Executive Director. As of 6/13/2011, the 2011 agency QI Plan was approved by the Executive Director. An overview of this plan was provided to staff during the June 2011 All Hands staff meeting, and a signed copy of the document has been placed on the agency’s network shared drive for view by all staff. Goal 2: Implement quality improvement efforts Objective: Based on the framework of the KCHD QI Plan, implement PDCA as a QI strategy
at KCHD. Measure: Achieve 100% compliance with development and completion of PDCA projects.
Kane County Health Department September 2011 Page 41

Key Strategies: 1. Health Data and Quality Coordinator will meet with each PDCA workgroup or representative at least twice monthly to provide training, technical assistance and support of PDCA project.
2. Health Data and Quality Coordinator will maintain an electronic database of PDCA project work for each workgroup and assure that it is available on the KCHD shared computer drive (S Drive) for review by all KCHD staff. 3. Health Data and Quality Coordinator will provide at least monthly updates to the Assistant Director for Community Health Resources on progress of PDCA projects.
As of 6/21/2011, the HDQC has maintained monthly meetings with all of the PDCA workgroups through All Hands, Division/Section meetings, and the QI Committee. The progress for each group is maintained electronically in the computer of the HDQC and in the PDCA folder on the agency’s shared network drive. At least twice-monthly updates are provided to the Assistant Director for Community Health Resources, as well as to the Executive Director at least once every other month. Goal 3: Demonstrate staff participation in quality improvement methods and tools training Objective: Provide an adequate level of QI training to all KCHD staff. Measure: Train 100% of KCHD staff on QI Tools and QI processes as outlined in QI plan. Key Strategies: 1. Health Data and Quality Coordinator will create and maintain a training log of
staff that have participated in QI Training. 2. All staff will participate in a quiz of the material following training, as well as
completing an evaluation of the effectiveness of the training/presentation. 3. Health Data and Quality Coordinator will work with Assistant Director for
Administration to assure that new employees receive QI training within six months of date of hire.
As of 6/21/2011, staff have received training on QI tools as outlined in the Training section of this report. Each training has included a PowerPoint presentation of the tool and its use, an example, opportunities for staff to practice and report back results, a quiz, and an evaluation for the presenter. In addition, a one-page handout for each tool has been developed and is used in conjunction with the PowerPoint presentation. Hard-copy sign-in sheets, as well as an electronic database, are being used to maintain a log of training. Copies of the training presentations have also been made available on the agency’s network shared drive. As no new hires have occurred during this period, no activity has been done regard to new employee training around QI, though a training plan for new employees will be developed in the second half of 2011.
VI. Progress on Quality Improvement Projects (PDCA)
• Office of Community Health Resources, Community Health Resources Section: Improve response rates of employee call-down drills (as of June 2011) This section has completed several iterations of PDCA, working to remedy all of the root causes. Staff were retrained on the Code Red employee call-down system, provided updated contact information, and have been provided feedback following each drill. As a result, the section has realized that utilizing Code Red as the recording/reporting system
Kane County Health Department September 2011 Page 42

for employee response was not as effective as planned, and staff now call back to the Emergency Response Coordinator to record their response to the drill. This has led to a significant increase in the response rate (82%), but the section continues to work to reach their aim of 95% compliance for this outcome.
• Office of Community Health Resources, Administration Section: Improve structured spending of grant money (as of June 2011) This section has completed a current state flowchart, a root cause analysis and collection of several sets of baseline data. Based on that data collection, it was determined the Aim Statement and thus the direction of the project needed modification. A revised Aim Statement was created by the group, who then brainstormed and selected a potential solution to test. It is the goal of this team that the first step of this large scale project will be met by July 15, 2011, at which time the team will meet to proceed toward more a larger-scale improvement in the project.
• Division of Disease Prevention, Public Health Nursing Section (High-Risk Infant Follow-up Program): Improve rates of initial home visit completed within 14 days of referral receipt (as of June 2011) Based on a root cause analysis, the section theorizes that a lack of communication to families on the part of the hospital regarding the HRIF program impedes the progress of engagement/enrollment on the part of KCHD, which delays program initiation past the 14 day requirement. To that end, the workgroup has theorized that developing messaging regarding the program and providing that education to NICU/L&D units of the 5 Kane County hospitals will improve communication between KCHD and hospitals, as well as inform families of the program. The section is currently working on developing an outreach plan for the local hospitals and including state-level program support in this plan.
• Division of Disease Prevention, Public Health Nursing Section (All PHNs): Improve rate of immunization competence for Public Health Nurses (as of June 2011) This section has gathered baseline data and determined that through the use of the pod-within-a-pod model, which assigns nurses to immunization clinic based on level of competence, an improvement has been demonstrated (average level of competence has improved from 20% to 80%). The PHN supervisor has developed a plan for the non-competencied nurses to achieve competence by the end of the PDCA cycle and to meet the Aim Statement.
• Division of Disease Prevention, Communicable Disease Section: Improve collection and reporting of immunization data (as of June 2011) This section recently completed the PDCA, having exceeded their Aim Statement (By July 1, 2011, accuracy of vaccine accountability for the Immunization Program will increase from 92% to 98%) with reaching 100% accuracy of vaccine accountability and a significant decrease in duplication of data tracking for statistics. Future plans for this project are to maintain the current systems implemented as a result of the PDCA and monitor the results for the next three months, before consideration is made to make additional modifications.
Kane County Health Department September 2011 Page 43

• Division of Health Promotion, Environmental Health Section: Decrease the number of critical food inspection violation #3 (temperature violation) (as of June 2011) While this section had some baseline data regarding the number of critical violations for #3 on an annual basis, the group determined that a short survey, provided to all food establishments visited in the month of May 2011, would gather more information and allow a more specific intervention to be created. Results of that survey were analyzed and the information used to begin brainstorming potential solutions. Through multivoting, the team is currently working to select the strategy they wish to test.
• Division of Health Promotion, Community Health Section: Improve pre and post meeting communication in Community Health Section (as of June 2011) As no baseline data existed for this project, the group created a survey to evaluate communication that occurred regarding the 4 pilot test meetings from January to May. Based on the results of that survey, the group modified their Aim Statement. They most recently brainstormed potential solutions and selected and implemented a test strategy for June 2011 (using a reformatted “Stall Street Journal” to share information about partnerships), and will meet in July to evaluate the results of their strategy.
• KCHD Leadership Team: Improve KCHD financial management system. (as of June 2011) The KCHD Leadership team has developed their Aim Statement and began collecting baseline data.
VII. Conclusion & Next Steps During the first six months of 2011, the Kane County Health Department has made significant strides forward in implementation and acculturation of quality improvement in the agency. Eight PDCA projects have been implemented along with multiple hours of training on QI tools and strategies. Workgroups have not only worked diligently on PDCA projects, but have begun to use QI tools in problem solving daily challenges, seen most in the TB program and the Administration section. The creation of an agency QI Plan and QI Committee charter have also provided a framework for the agency moving forward, and provide evidence for Public Health accreditation preparation. It is the goal that in the second half of 2011, the completion of the agency’s CHA, CHIP and Strategic Plan will allow development of system-level QI efforts, as well as completion of the first set of PDCA projects.
Kane County Health Department September 2011 Page 44

Appendix B: Maternal Child Health Indicators
(Baseline and First Quarter reports)
Kane County Health Department September 2011 Page 45

Kane County Maternal-Child Health Service Profile
Baseline: March 2011
WELL CHILD CENTER
For graphs with state-issued performance outcomes, a red horizontal line on the graph will indicate the performance goal.
Kane County Health Department September 2011 Page 46

KANE COUNTY MATERNAL CHILD HEALTH PROFILE Baseline – March 2011
CASELOAD PROFILE
*”White” and “Other” include Hispanic ethnicity
Kane County Health Department September 2011 Page 47

OUTCOME: Integration of WIC and Family Case Management. Data provided through state performance outcomes for clients in Kane County FCM & WIC. Improvements have been demonstrated in this area within the last 6 months, with integration of both programs above the 95% standard.
90.00%92.00%94.00%96.00%98.00%
100.00%
Q2, FY11 (Baseline)
WIC IntegrationFCM Integration
_________________________________________________________________________________________ OUTCOME: First Trimester Entry into prenatal care, FCM & WIC. Data compiled from Cornerstone (PA07) using Foxfire ad-hoc reporting software (prenatal care entry) and state performance outcomes (entry into WIC and FCM). In this data set, a comparison shows entry into prenatal care, FCM & WIC. First trimester entry into prenatal care stands above 90%, but programmatic entry does not happen at a similar rate.
0.00%
20.00%
40.00%
60.00%
80.00%
100.00%
Q2, FY11 (Baseline)
Prenatal Care*FCM*WIC
*FCM and Prenatal Care data reflects only data collected by KCHD 10/1/2010-11/9/2010. _________________________________________________________________________________________ OUTCOME: Breastfeeding Initiation & Duration for WIC Participants. Data provided through state performance outcomes for clients in Kane County WIC. Breastfeeding Initiation stands above the 75% state performance standard, but Breastfeeding Duration to 6 Months has not yet met the 50% performance standard.
0.00%10.00%20.00%30.00%40.00%50.00%60.00%70.00%80.00%90.00%
100.00%
Q2, FY11 (Baseline)
InitiationDuration
Kane County Health Department September 2011 Page 48

KCHD CALL CENTER
Kane County Health Department September 2011 Page 49
Kane County Maternal-Child Health Service Profile
June 2011
WELL CHILD CENTER
For graphs with state-issued performance outcomes, a red horizontal line on the graph will indicate the performance goal.
Kane County Health Department September 2011 Page 50
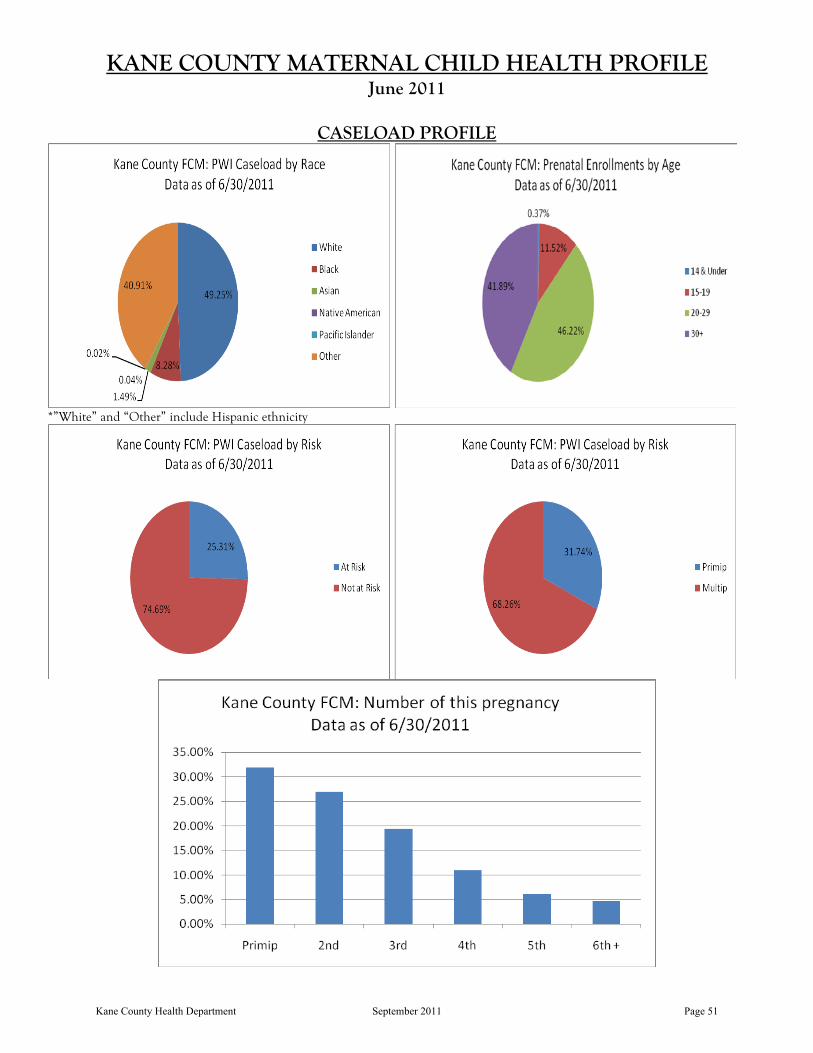
KANE COUNTY MATERNAL CHILD HEALTH PROFILE June 2011
CASELOAD PROFILE
*”White” and “Other” include Hispanic ethnicity
Kane County Health Department September 2011 Page 51

OUTCOME: Integration of WIC and Family Case Management. Data provided through state performance outcomes for clients in Kane County FCM & WIC. Improvements have been demonstrated in this area within the last 6 months, with integration of both programs above the 95% standard.
90.00%92.00%94.00%96.00%98.00%
100.00%
Q2, FY11 (Baseline) Q3, FY11
WIC IntegrationFCM Integration
_________________________________________________________________________________________ OUTCOME: First Trimester Entry into prenatal care, FCM & WIC. Data compiled from Cornerstone (PA07) using Foxfire ad-hoc reporting software (prenatal care entry) and state performance outcomes (entry into WIC and FCM). In this data set, a comparison shows entry into prenatal care, FCM & WIC. First trimester entry into prenatal care stands above 90%, but programmatic entry does not happen at a similar rate.
0.00%
20.00%
40.00%
60.00%
80.00%
100.00%
Q2, FY11 (Baseline) Q3, FY11
Prenatal Care*FCMWIC
*For the baseline data, FCM and Prenatal Care data reflects only data collected by KCHD 10/1/2010-11/9/2010. _________________________________________________________________________________________ OUTCOME: Breastfeeding Initiation & Duration for WIC Participants. Data provided through state performance outcomes for clients in Kane County WIC. Breastfeeding Initiation stands above the 75% state performance standard, but Breastfeeding Duration to 6 Months has not yet met the 50% performance standard.
0.00%10.00%20.00%30.00%40.00%50.00%60.00%70.00%80.00%90.00%
100.00%
Q2, FY11 (Baseline) Q3, FY11
InitiationDuration
Kane County Health Department September 2011 Page 52

KCHD CALL CENTER
Kane County Health Department September 2011 Page 53

Appendix C: County Health Rankings & Selected Health Data
Kane County Health Department September 2011 Page 54

4 | P a g e
County Health Rankings Programs and Policies
The County Health Rankings model is grounded in the belief that programs and policies implemented at the local, state, and federal levels have an impact on the variety of factors that, in turn, determine the health outcomes for communities across the nation.
Health Factors
A number of different health factors shape a community’s health outcomes. The County Health Rankings model includes four types of health factors: health behaviors, clinical care, social and economic, and the physical environment.
Health Outcomes
We measure two types of health outcomes to represent how healthy each county is: how long people live (mortality) and how healthy people feel (morbidity). These outcomes are the result of a collection of health factors and are influenced by programs and policies at the local, state, and federal levels.
http://www.countyhealthrankings.org/
Kane County Health Department September 2011 Page 55

Kane, Illinois
KANECOUNTY
ERRORMARGIN
NATIONALBENCHMARK* ILLINOIS
RANK(OF102)
HEALTH OUTCOMES 9
Mortality 6
Premature death — Years of potential lif e lost bef ore age 75 per 100,000 population (age-adjusted) 5,223 5,007-
5,440 5,564 6,859
Morbidity 30
Poor or fair health — Percent of adults reporting f air or poor health (age-adjusted) 14% 11-16% 10% 16%
Poor physical health days — Av erage number of phy sically unhealthy day s reported inpast 30 day s (age-adjusted) 3.0 2.5-3.4 2.6 3.3
Poor mental health days — Av erage number of mentally unhealthy day s reported in past30 day s (age-adjusted)
2.9 2.5-3.4 2.3 3.2
Low birthweight — Percent of liv e births with low birthweight (< 2500 grams) 7.2% 7.0-7.4% 6.0% 8.4%
HEALTH FACTORS 41
Health Behav iors 50
Adult smoking — Percent of adults that report smoking >= 100 cigarettes and currentlysmoking
17% 14-20% 15% 21%
Adult obesity — Percent of adults that report a BMI >= 30 28% 24-32% 25% 26%
Excessive drinking — Binge plus heav y drinking 21% 18-24% 8% 19%
Motor vehicle crash death rate — Motor v ehicle crash deaths per 100,000 population 10 9-11 12 12
Sexually transmitted infections — Chlamy dia rate per 100,000 population 293 83 460
Teen birth rate — Teen birth rate per 1,000 f emale population, ages 15-19 46 44-47 22 41
Clinical Care 70
Uninsured adults — Percent of population under age 65 without health insurance 19% 16-22% 13% 17%
Primary care providers — Ratio of population to primary care prov iders 1,590:1 631:1 778:1
Preventable hospital stays — Hospitalization rate f or ambulatory -care sensitiv e conditionsper 1,000 Medicare enrollees
75 73-78 52 83
Diabetic screening — Percent of diabetic Medicare enrollees that receiv e HbA1c screening 84% 80-89% 89% 80%
Mammography screening — Percent of f emale Medicare enrollees that receiv emammography screening 64% 59-69% 74% 63%
Social & Econom ic Factors 37
High school graduation — Percent of ninth grade cohort that graduates in 4 y ears 85% 92% 80%
Some college — Percent of adults aged 25-44 y ears with some post-secondary education 59% 68% 64%
Unemployment — Percent of population age 16+ unemploy ed but seeking work 10.3% 10.1-10.4% 5.3% 10.1%
Children in poverty — Percent of children under age 18 in pov erty 13% 11-15% 11% 17%
Inadequate social support — Percent of adults without social/emotional support 19% 15-23% 14% 21%
Single-parent households — Percent of children that liv e in household headed by singleparent 24% 20% 31%
Violent crime rate — Violent crime rate per 100,000 population 280 100 550
Phys ical Env ironm ent 39
Air pollution-particulate matter days — Annual number of unhealthy air quality day s due tof ine particulate matter 2 0 3
Air pollution-ozone days — Annual number of unhealthy air quality day s due to ozone 0 0 4
Access to healthy foods — Healthy f ood outlets include grocery stores and producestands/f armers’ markets 75% 92% 53%
Access to recreational facilities — Rate of recreational f acilities per 100,000 population 9 17 10
* 90th percentile, i.e., only 10% are betterNote: Blank v alues ref lect unreliable or missing data
Source URL: http://www.county healthrankings.org/illinois/kane
4/14/2011 Kane, Illinois
countyhealthrankings.org/print/…/kane 1/1Kane County Health Department September 2011 Page 56

0 3 6 9 121.5Miles
Coronary Heart Disease Hospitalization by Zip CodeKane County, Illinois
Will
Cook
Kane
Lake
DeKalb
Kankakee
McHenry
Grundy
Kendall
DuPage
Boone
1 inch = 18,000 feet
³
Th
e Z
ip C
od
e la
ye
r w
as
cre
ate
d u
sin
g la
ye
rs p
rovid
ed
by
ES
RI’s
we
bs
ite
, a
nd
th
e K
an
e C
ou
nty
De
ve
lop
me
nt
de
pa
rtm
en
t.
N
o a
cc
ura
cy
is a
ssu
me
d w
ith
re
ga
rd t
o t
his
la
ye
r.
Lin
es
ha
ve
no
t b
ee
n c
ert
ifie
d b
y t
he
Un
ite
d S
tate
s P
os
t o
ffic
e.
Th
is m
ap
do
es n
ot
rep
res
en
t a
su
rve
y.
No
acc
ura
cy
is a
ssu
me
d f
or
the
da
ta d
elin
ea
ted
he
rein
, e
ith
er
exp
ress
ed
or
imp
lie
d b
y K
an
e C
ou
nty
or
its
em
plo
ye
es.
Th
is m
ap
is c
om
pile
d f
rom
off
icia
l re
co
rds,
inclu
din
g p
lats
, su
rve
ys,
rec
ord
ed
de
ed
s,
an
d c
on
tra
cts
, a
nd
on
ly c
on
tain
s i
nfo
rma
tio
n r
eq
uir
ed
fo
r lo
ca
l g
ove
rnm
en
t p
urp
ose
s.
Se
e t
he
re
co
rde
d d
oc
um
en
ts f
or
mo
re d
eta
ile
d l
eg
al
info
rma
tio
n.
Legend2005-2009 Census Tracts with at least 50% Pop at or below 200% Poverty Level
2005-2009 Census Tracts where at least 50% Pop are Minorities
2040 Land Use
Fox River
2010 Coronary Heart Disease Hospitalization rate per 100,000 populationRate
0.0 - 4.0
4.1 - 10.9
11.0 - 20.2
7/5/2011 drm
Map Projection: Transverse Mercator
State Plane - I llinois East, NAD 1983
Copyright © 2011 Kane County, Illinois
GIS-Technologies
719 Batavia Ave
Geneva, IL 60134 [email protected]
Voice: (630) 208-8655
Fax: (630) 208-8659
Kane CountyGIS-Technologies
!(
!(
!(!(
!(
!(
!(
!(
!(!(
!(
!(!(
!(
!(
!(
!(!(
!(
!(
tututu
tu
tu
tu
tu §̈¦
§̈¦
§̈¦
§̈¦
Agriculture
Geneva
Aurora
South
Elgin
Elgin
Kaneville
Sugar
Grove
Burlington
Big Rock
Huntley
Saint
Charles
Maple
Park
Algonquin
Hampshire
Batavia
Montgomery
Elburn
Wayne
Bartlett
Barrington
Hills
Virgil
Gilberts
Sleepy Hollow
Lily
Lake
East
Dundee
West
Dundee
Carpentersville
Pingree
Grove
North
Aurora
Campton
Hills
Urban
Agriculture
Critical
25
25
25
31
31
31
47
47
47
62
68
7272
58
64
64
38
38
56
56
3430
30
30
20
20
20 90
90
88
88
605381.4
605052.3
605427.3
605063.9
605113.2
605390.1
605543.1
605103.3
601850.0
601741.7
601103.2
601020.0
600100.0
6017820.2
601700.1
601097.9
601511.5
601240.0
601403.3
601362.5
6014210.6
605042.8
601343.3
601442.1
601192.4
601476.6
601832.6
601840.060175
2.0
601202.460123
4.8
601180.6
601775.9
601820.0
Kane County Health Department September 2011 Page 57

0 3 6 9 121.5Miles
Diabetes Hospitalization by Zip CodeKane County, Illinois
Will
Cook
Kane
Lake
DeKalb
Kankakee
McHenry
Grundy
Kendall
DuPage
Boone
1 inch = 18,000 feet
³
Th
e Z
ip C
od
e la
ye
r w
as
cre
ate
d u
sin
g la
ye
rs p
rovid
ed
by
ES
RI’s
we
bs
ite
, a
nd
th
e K
an
e C
ou
nty
De
ve
lop
me
nt
de
pa
rtm
en
t.
N
o a
cc
ura
cy
is a
ssu
me
d w
ith
re
ga
rd t
o t
his
la
ye
r.
Lin
es
ha
ve
no
t b
ee
n c
ert
ifie
d b
y t
he
Un
ite
d S
tate
s P
os
t o
ffic
e.
Th
is m
ap
do
es n
ot
rep
res
en
t a
su
rve
y.
No
acc
ura
cy
is a
ssu
me
d f
or
the
da
ta d
elin
ea
ted
he
rein
, e
ith
er
exp
ress
ed
or
imp
lie
d b
y K
an
e C
ou
nty
or
its
em
plo
ye
es.
Th
is m
ap
is c
om
pile
d f
rom
off
icia
l re
co
rds,
inclu
din
g p
lats
, su
rve
ys,
rec
ord
ed
de
ed
s,
an
d c
on
tra
cts
, a
nd
on
ly c
on
tain
s i
nfo
rma
tio
n r
eq
uir
ed
fo
r lo
ca
l g
ove
rnm
en
t p
urp
ose
s.
Se
e t
he
re
co
rde
d d
oc
um
en
ts f
or
mo
re d
eta
ile
d l
eg
al
info
rma
tio
n.
Legend2005-2009 Census Tracts with at least 50% Pop at or below 200% Poverty Level
2005-2009 Census Tracts where at least 50% Pop are Minorities
2040 Land Use
Fox River
2010 Diabetes Hospitalization rate per 100,000 populationRate
0.0 - 1.3
1.4 - 3.1
3.2 - 8.2
7/5/2011 drm
Map Projection: Transverse Mercator
State Plane - I llinois East, NAD 1983
Copyright © 2011 Kane County, Illinois
GIS-Technologies
719 Batavia Ave
Geneva, IL 60134 [email protected]
Voice: (630) 208-8655
Fax: (630) 208-8659
Kane CountyGIS-Technologies
!(
!(
!(!(
!(
!(
!(
!(
!(!(
!(
!(!(
!(
!(
!(
!(!(
!(
!(
tututu
tu
tu
tu
tu §̈¦
§̈¦
§̈¦
§̈¦
Agriculture
Geneva
Aurora
South
Elgin
Elgin
Kaneville
Sugar
Grove
Burlington
Big Rock
Huntley
Saint
Charles
Maple
Park
Algonquin
Hampshire
Batavia
Montgomery
Elburn
Wayne
Bartlett
Barrington
Hills
Virgil
Gilberts
Sleepy Hollow
Lily
Lake
East
Dundee
West
Dundee
Carpentersville
Pingree
Grove
North
Aurora
Campton
Hills
Urban
Agriculture
Critical
25
25
25
31
31
31
47
47
47
62
68
7272
58
64
64
38
38
56
56
3430
30
30
20
20
20 90
90
88
88
605380.7
605051.5
605423.1
605061.9
605110.9
605390.2
605541.0
605101.1
601850.0
601740.6
601101.9
601020.0
600100.0
601788.2
601700.1
601091.2
601510.5
601240.0
601401.4
601361.0
601423.1
605042.9
601341.0
601441.1
601190.7
601471.4
601830.9
601840.060175
0.6
601201.260123
2.3
601180.3
601772.5
601820.0
Kane County Health Department September 2011 Page 58

0 3 6 9 121.5Miles
Hypertension Hospitalization by Zip CodeKane County, Illinois
Will
Cook
Kane
Lake
DeKalb
Kankakee
McHenry
Grundy
Kendall
DuPage
Boone
1 inch = 18,000 feet
³
Th
e Z
ip C
od
e la
ye
r w
as
cre
ate
d u
sin
g la
ye
rs p
rovid
ed
by
ES
RI’s
we
bs
ite
, a
nd
th
e K
an
e C
ou
nty
De
ve
lop
me
nt
de
pa
rtm
en
t.
N
o a
cc
ura
cy
is a
ssu
me
d w
ith
re
ga
rd t
o t
his
la
ye
r.
Lin
es
ha
ve
no
t b
ee
n c
ert
ifie
d b
y t
he
Un
ite
d S
tate
s P
os
t o
ffic
e.
Th
is m
ap
do
es n
ot
rep
res
en
t a
su
rve
y.
No
acc
ura
cy
is a
ssu
me
d f
or
the
da
ta d
elin
ea
ted
he
rein
, e
ith
er
exp
ress
ed
or
imp
lie
d b
y K
an
e C
ou
nty
or
its
em
plo
ye
es.
Th
is m
ap
is c
om
pile
d f
rom
off
icia
l re
co
rds,
inclu
din
g p
lats
, su
rve
ys,
rec
ord
ed
de
ed
s,
an
d c
on
tra
cts
, a
nd
on
ly c
on
tain
s i
nfo
rma
tio
n r
eq
uir
ed
fo
r lo
ca
l g
ove
rnm
en
t p
urp
ose
s.
Se
e t
he
re
co
rde
d d
oc
um
en
ts f
or
mo
re d
eta
ile
d l
eg
al
info
rma
tio
n.
Legend2005-2009 Census Tracts with at least 50% Pop at or below 200% Poverty Level
2005-2009 Census Tracts where at least 50% Pop are Minorities
2040 Land Use
Fox River
2010 Hypertension Hospitalization rate per 100,000 populationRate
0.0 - 1.4
1.5 - 6.1
6.2 - 17.7
7/5/2011 drm
Map Projection: Transverse Mercator
State Plane - I llinois East, NAD 1983
Copyright © 2011 Kane County, Illinois
GIS-Technologies
719 Batavia Ave
Geneva, IL 60134 [email protected]
Voice: (630) 208-8655
Fax: (630) 208-8659
Kane CountyGIS-Technologies
!(
!(
!(!(
!(
!(
!(
!(
!(!(
!(
!(!(
!(
!(
!(
!(!(
!(
!(
tututu
tu
tu
tu
tu §̈¦
§̈¦
§̈¦
§̈¦
Agriculture
Geneva
Aurora
South
Elgin
Elgin
Kaneville
Sugar
Grove
Burlington
Big Rock
Huntley
Saint
Charles
Maple
Park
Algonquin
Hampshire
Batavia
Montgomery
Elburn
Wayne
Bartlett
Barrington
Hills
Virgil
Gilberts
Sleepy Hollow
Lily
Lake
East
Dundee
West
Dundee
Carpentersville
Pingree
Grove
North
Aurora
Campton
Hills
Urban
Agriculture
Critical
25
25
25
31
31
31
47
47
47
62
68
7272
58
64
64
38
38
56
56
3430
30
30
20
20
20 90
90
88
88
605381.1
605051.7
605425.0
605062.6
605112.9
605390.2
605542.2
605102.4
601850.0
601741.4
601102.4
601020.0
600100.0
6017817.7
601700.1
601093.9
601511.2
601240.0
601402.3
601362.0
601426.1
605042.4
601342.5
601442.7
601191.8
601473.3
601830.2
601840.060175
1.7
601202.060123
3.1
601180.4
601774.0
601820.0
Kane County Health Department September 2011 Page 59

KCHD Strategic Plan: 2012-2015 Page 10
Appendix C
Strategic Planning Meeting Agendas and Draft Work Products


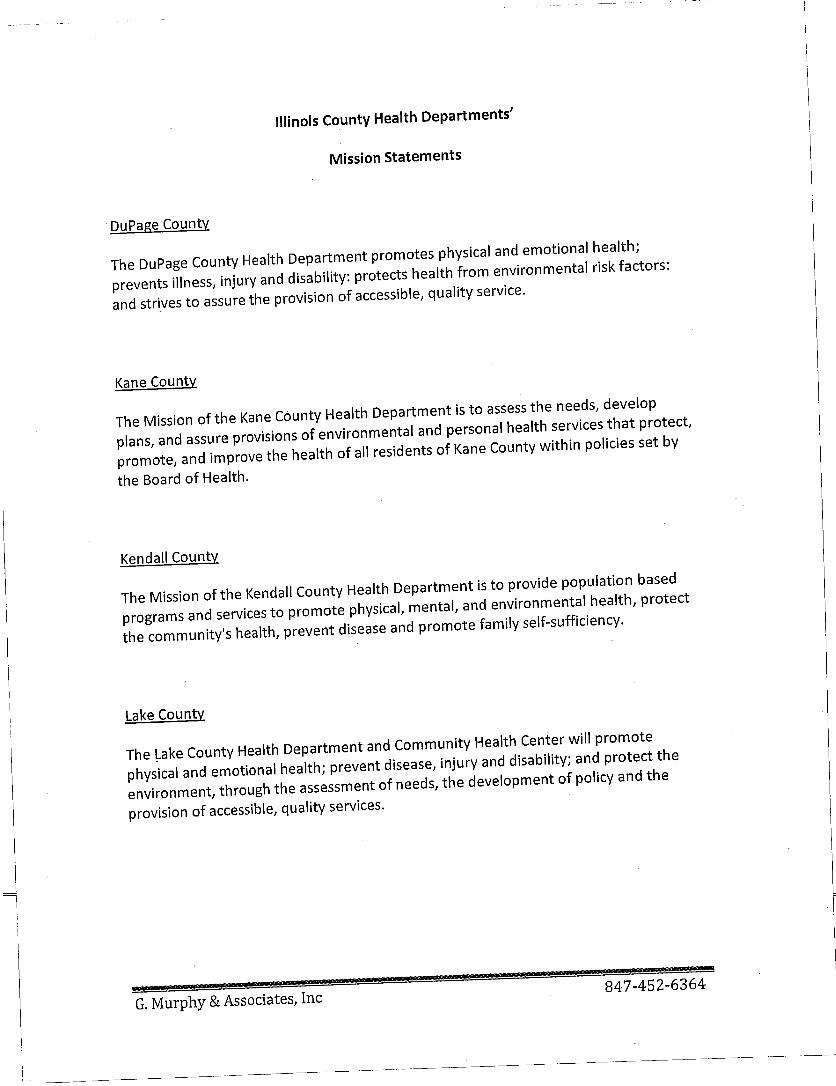


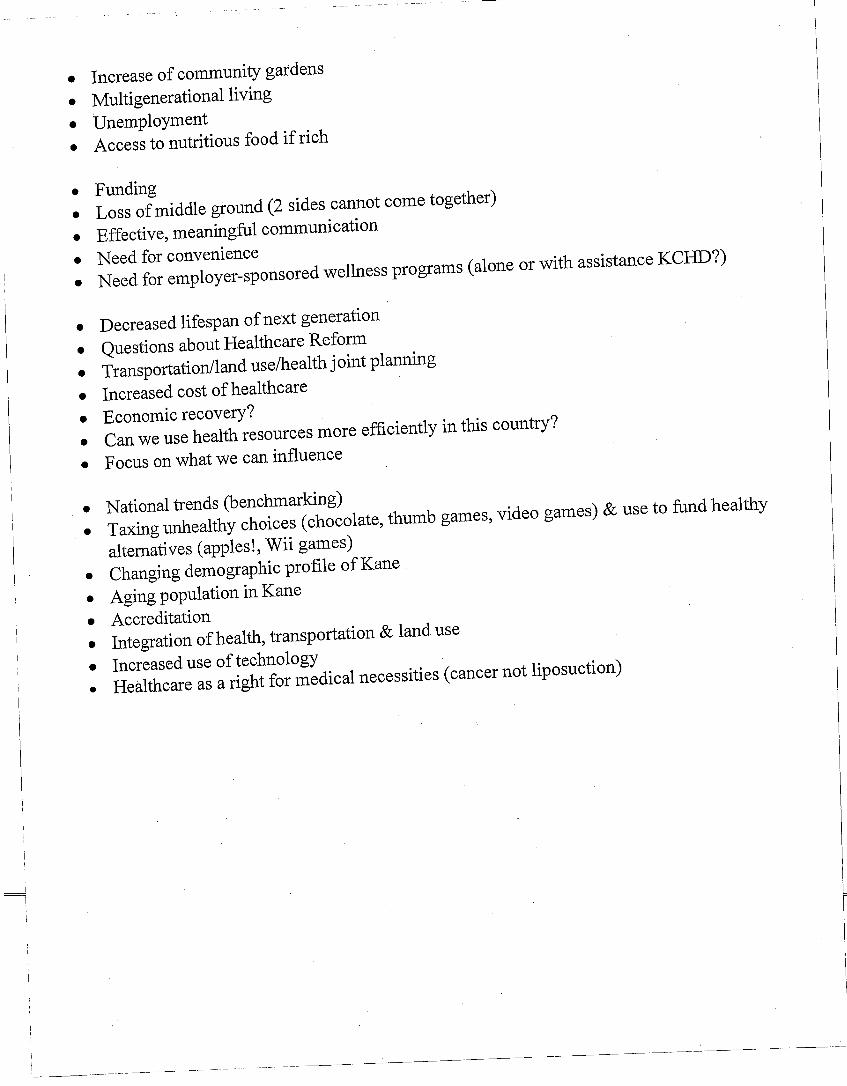

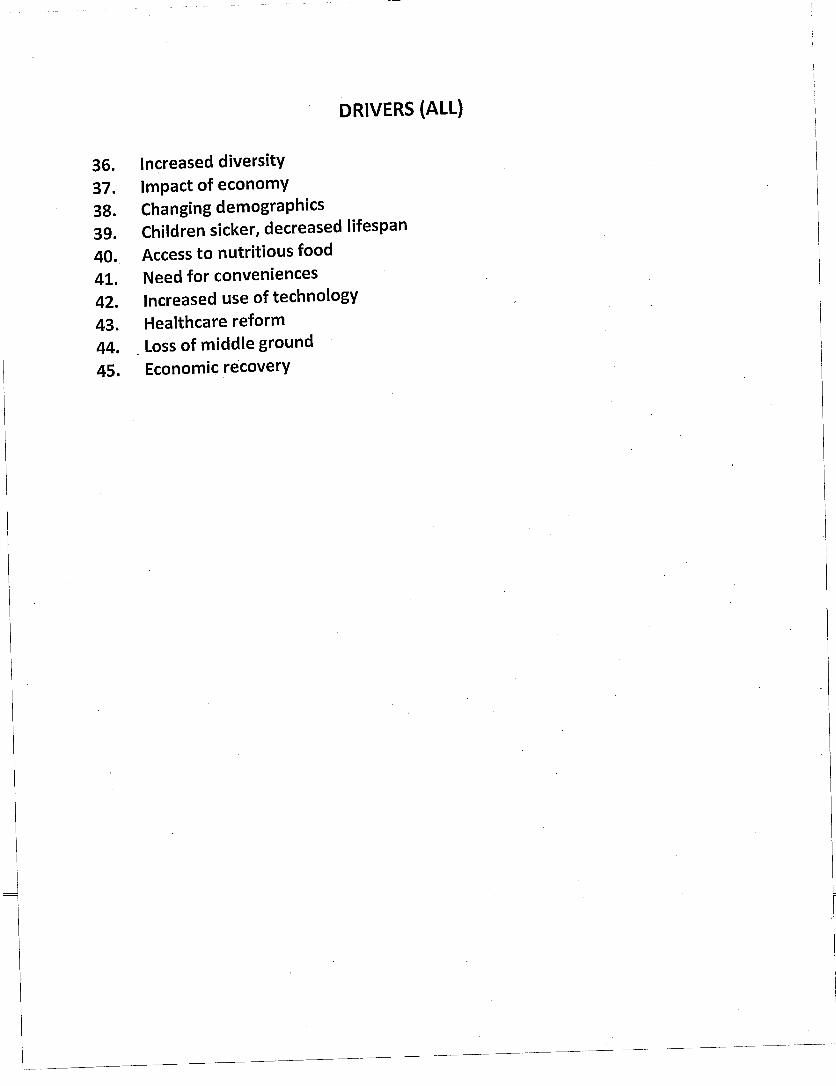

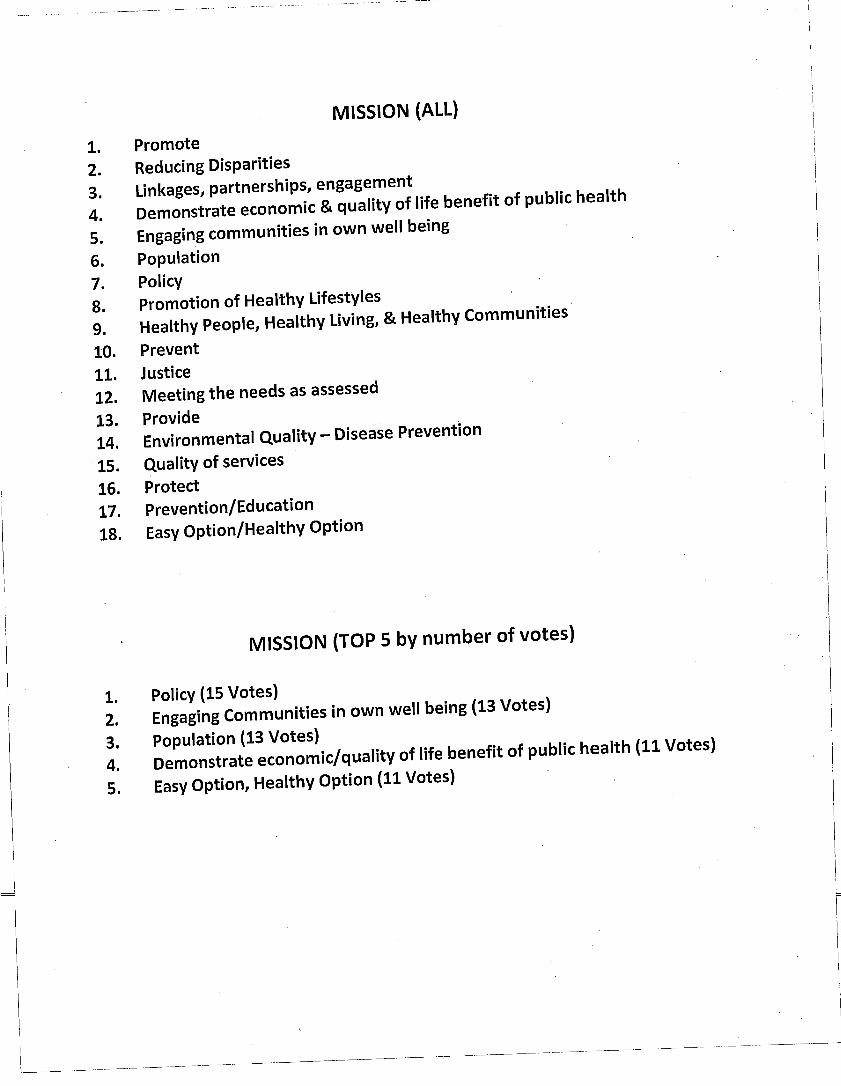


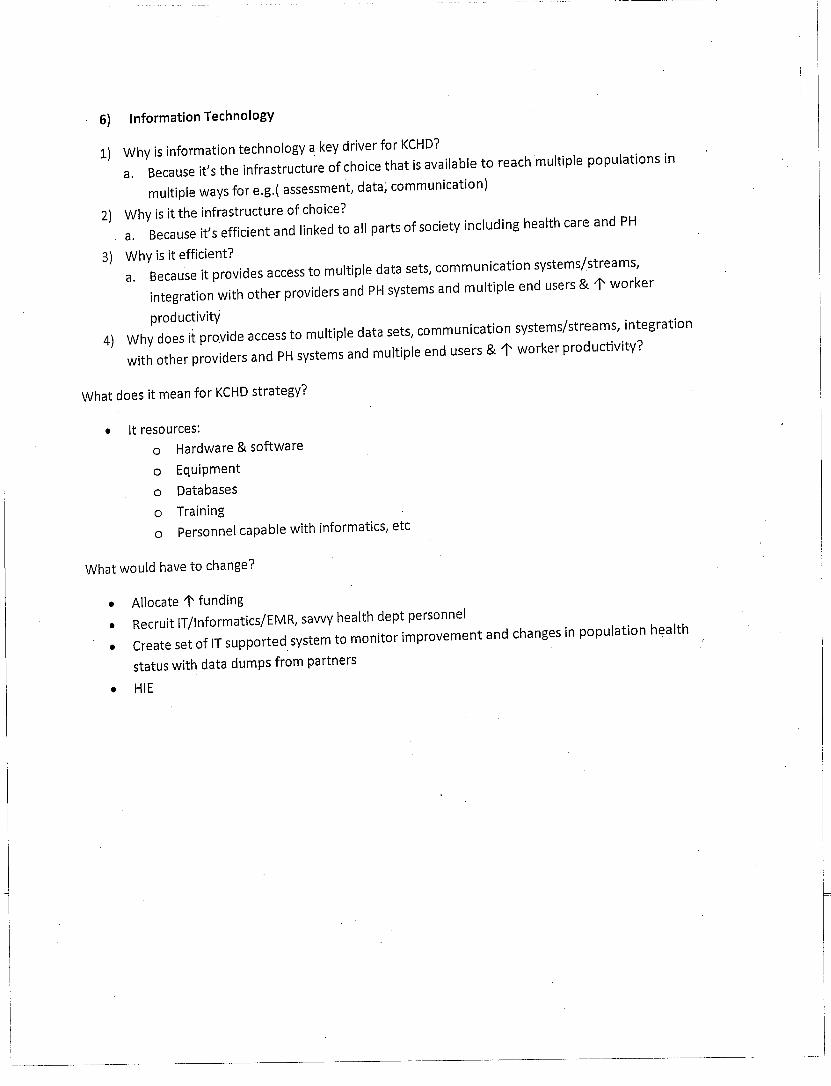


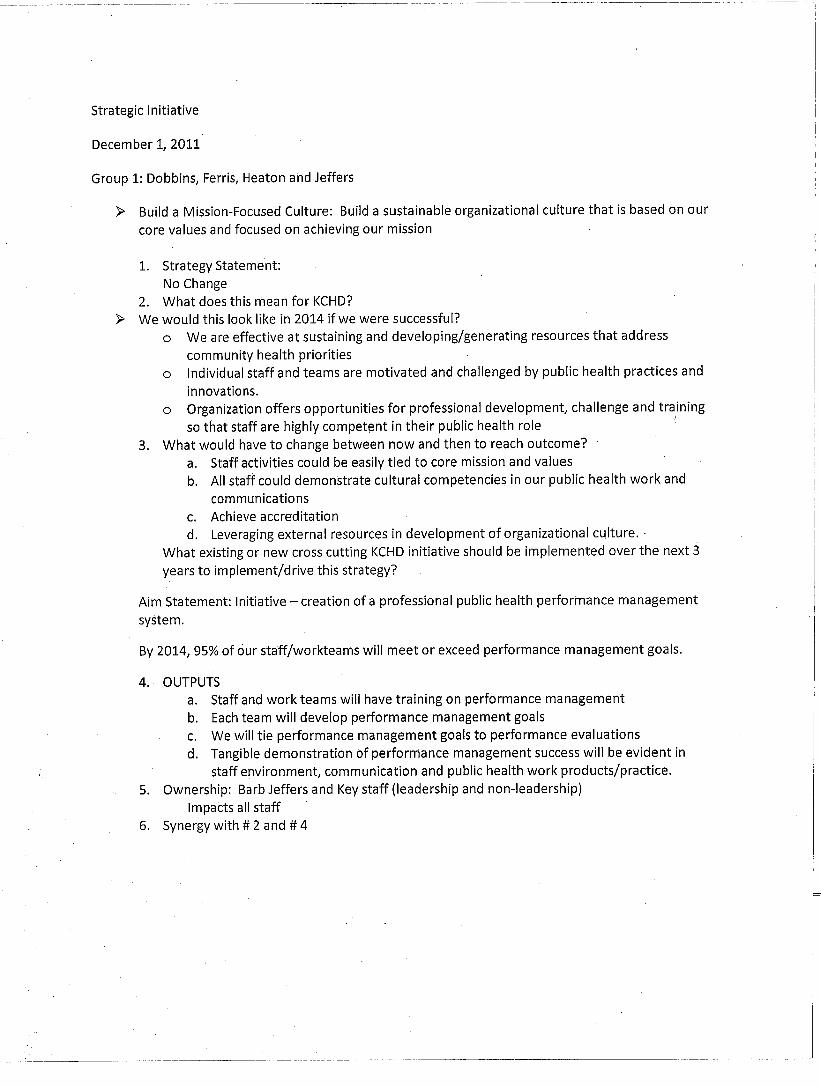


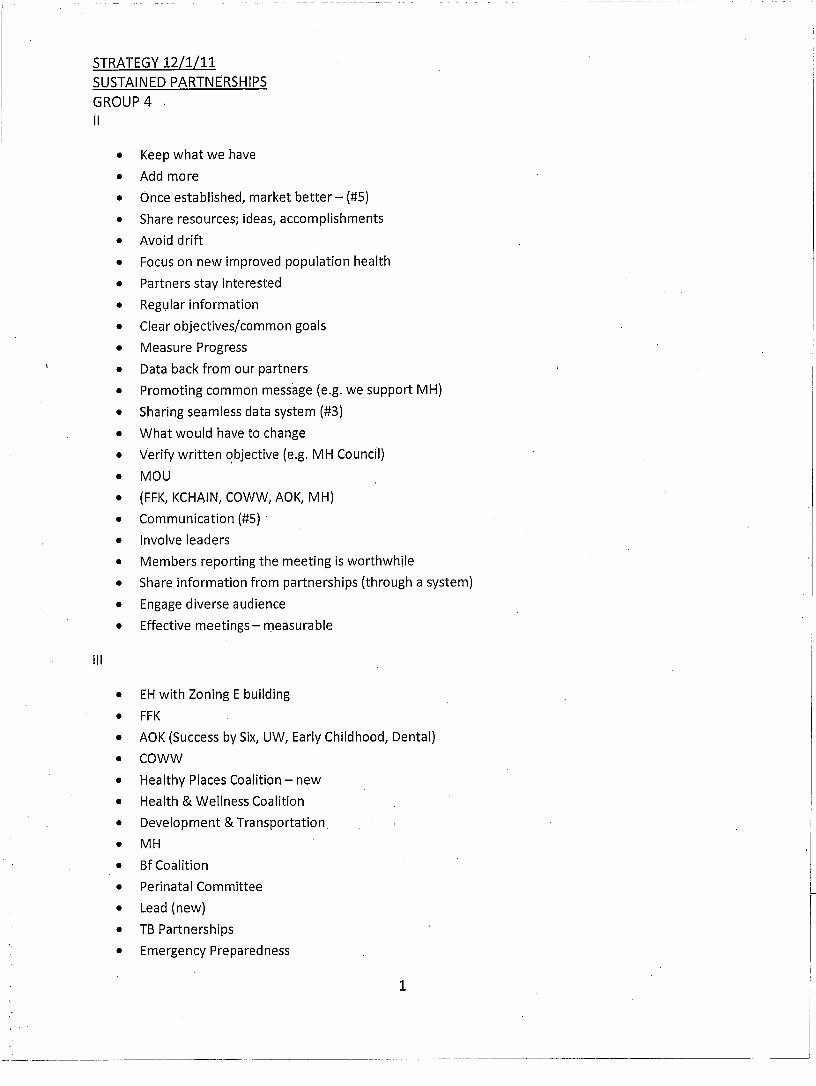
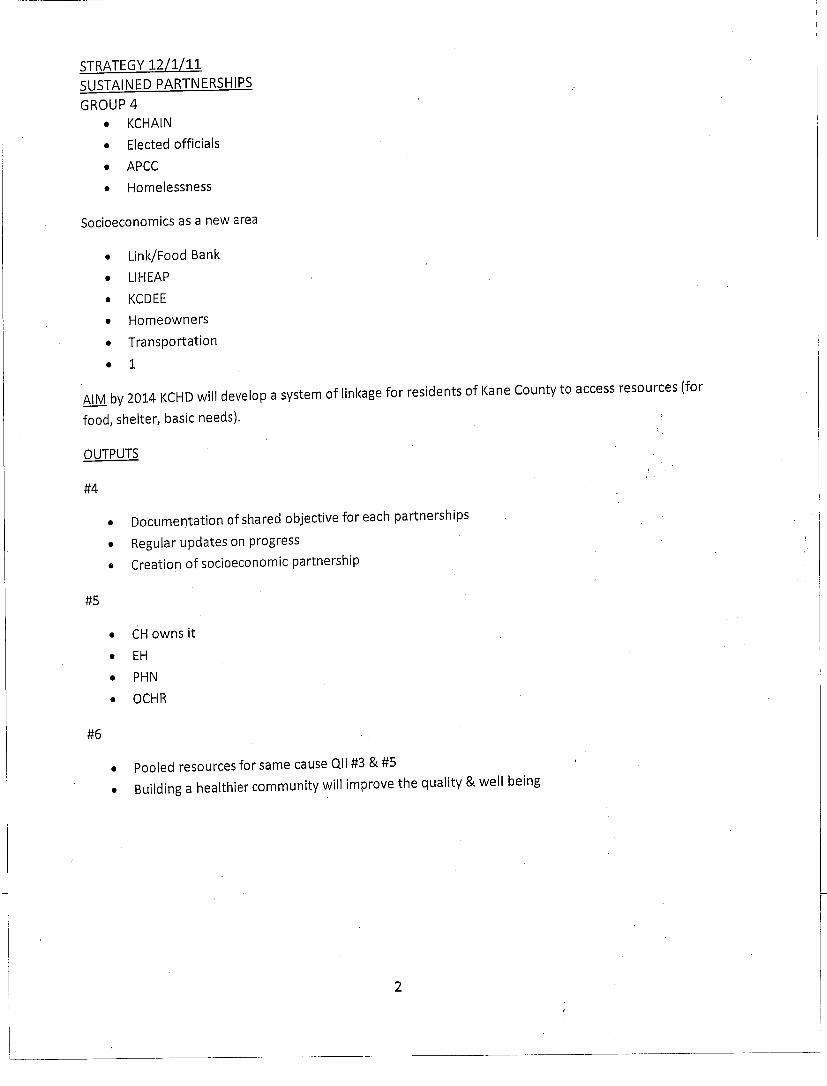


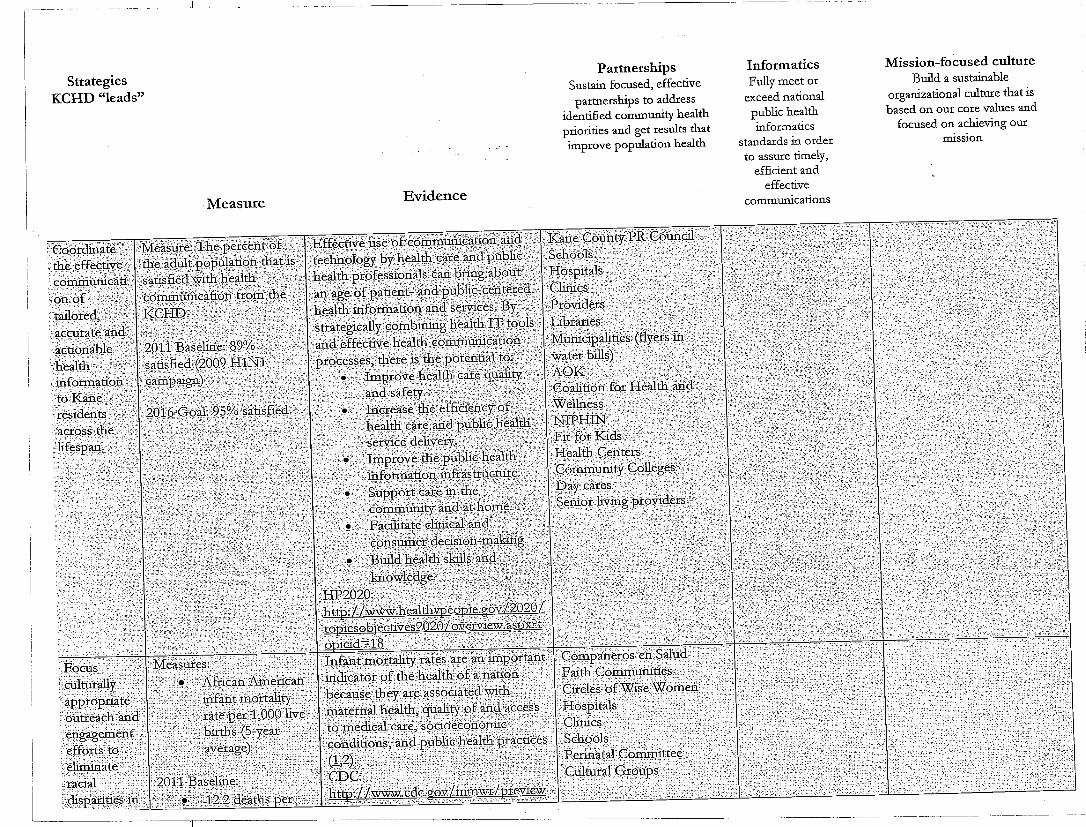


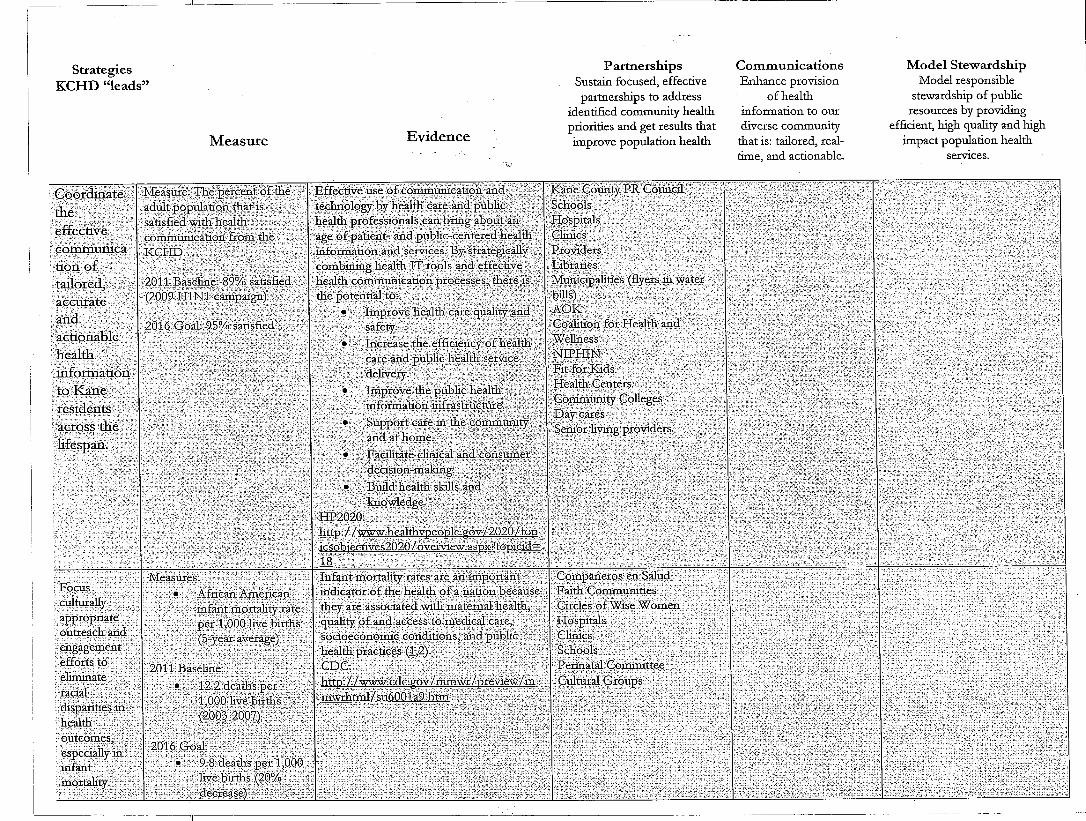

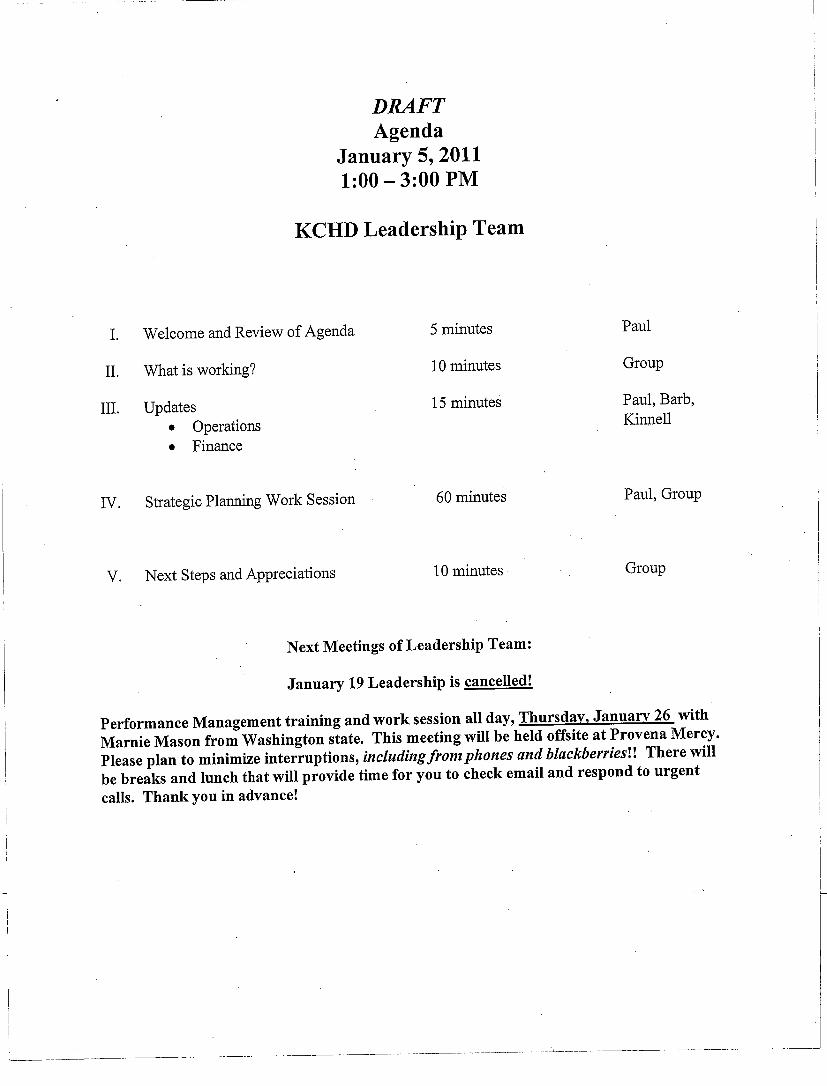
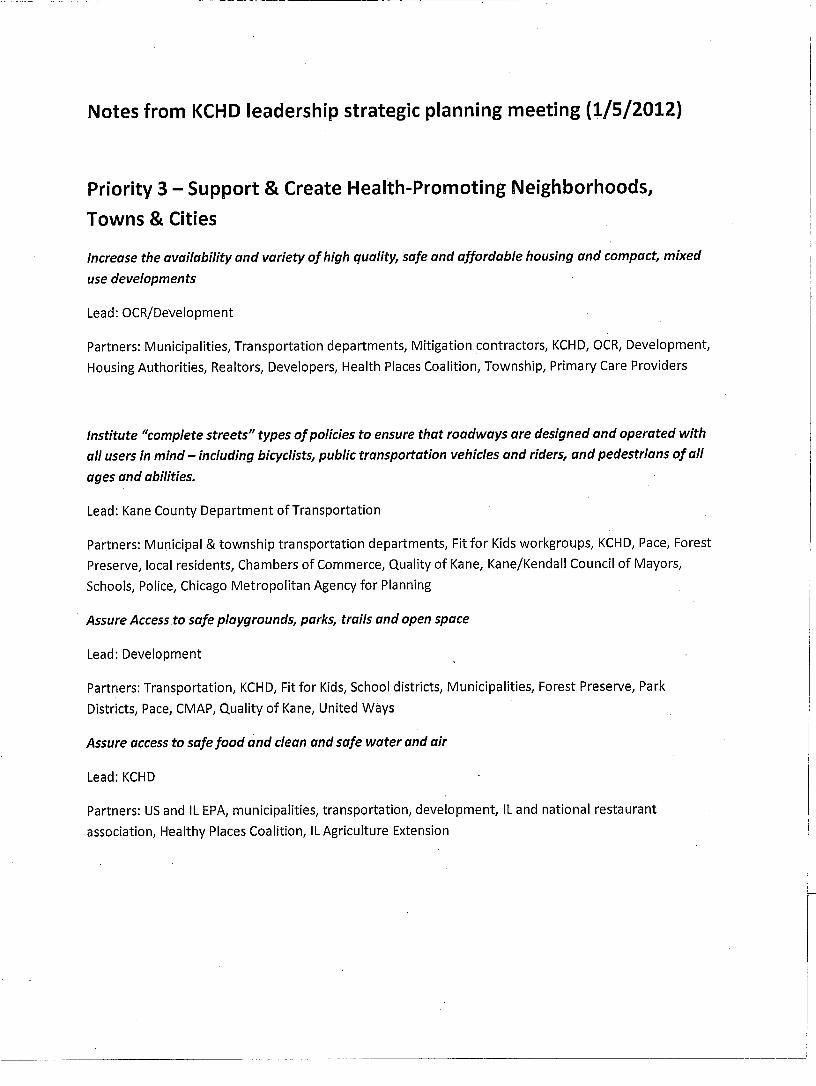

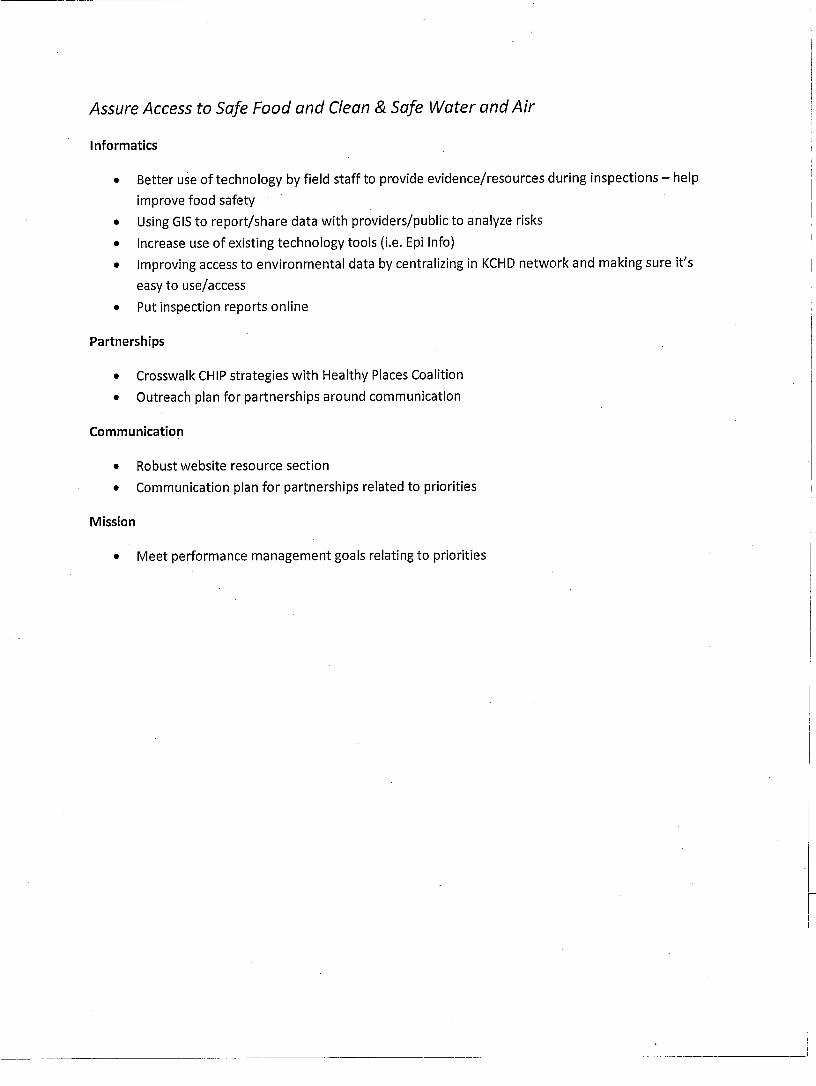


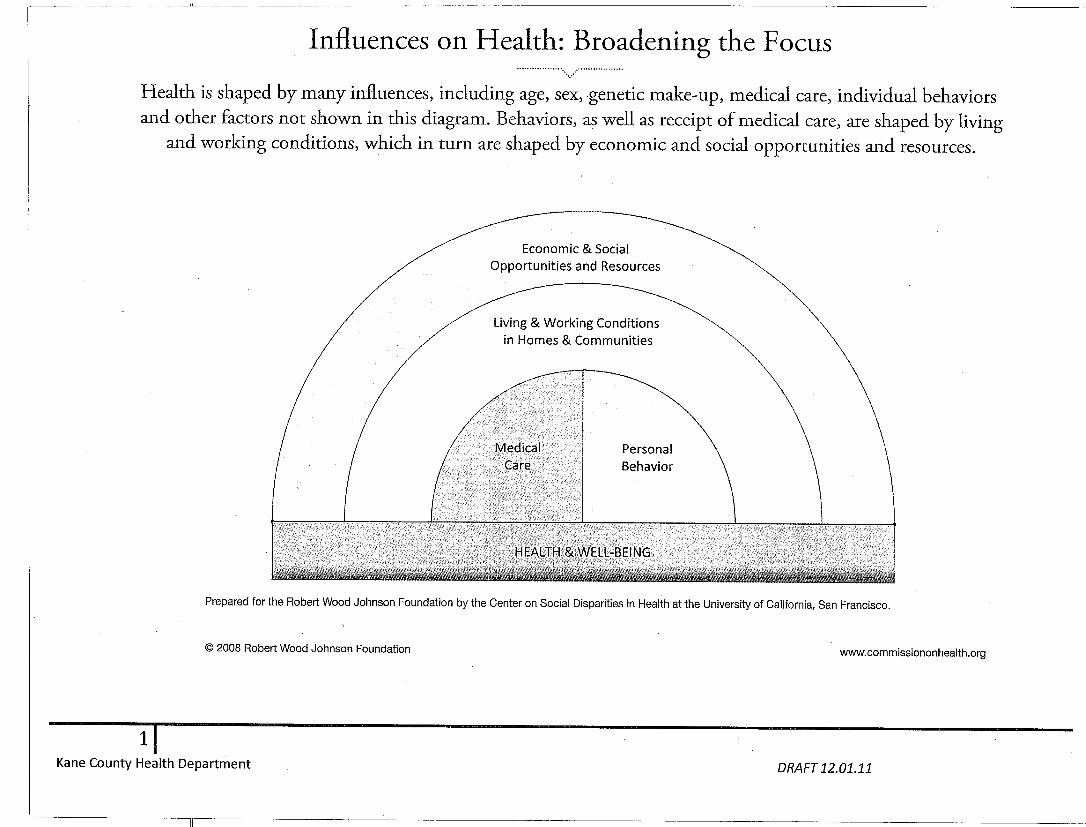

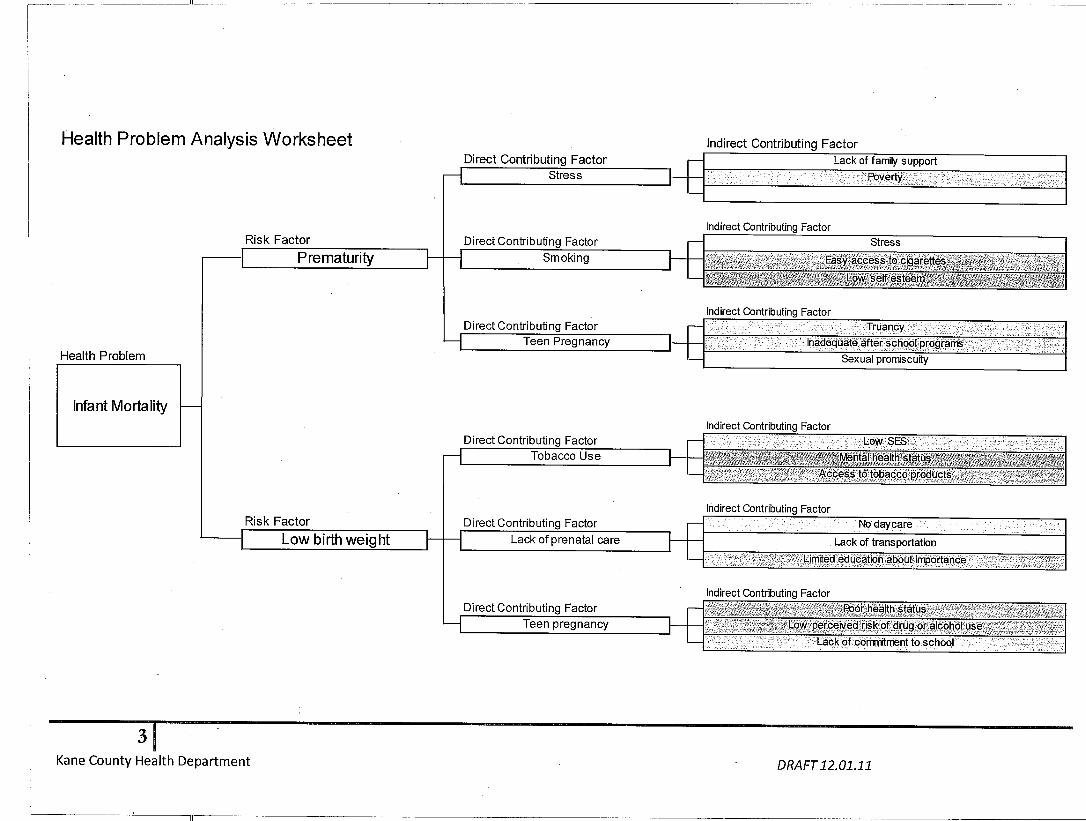


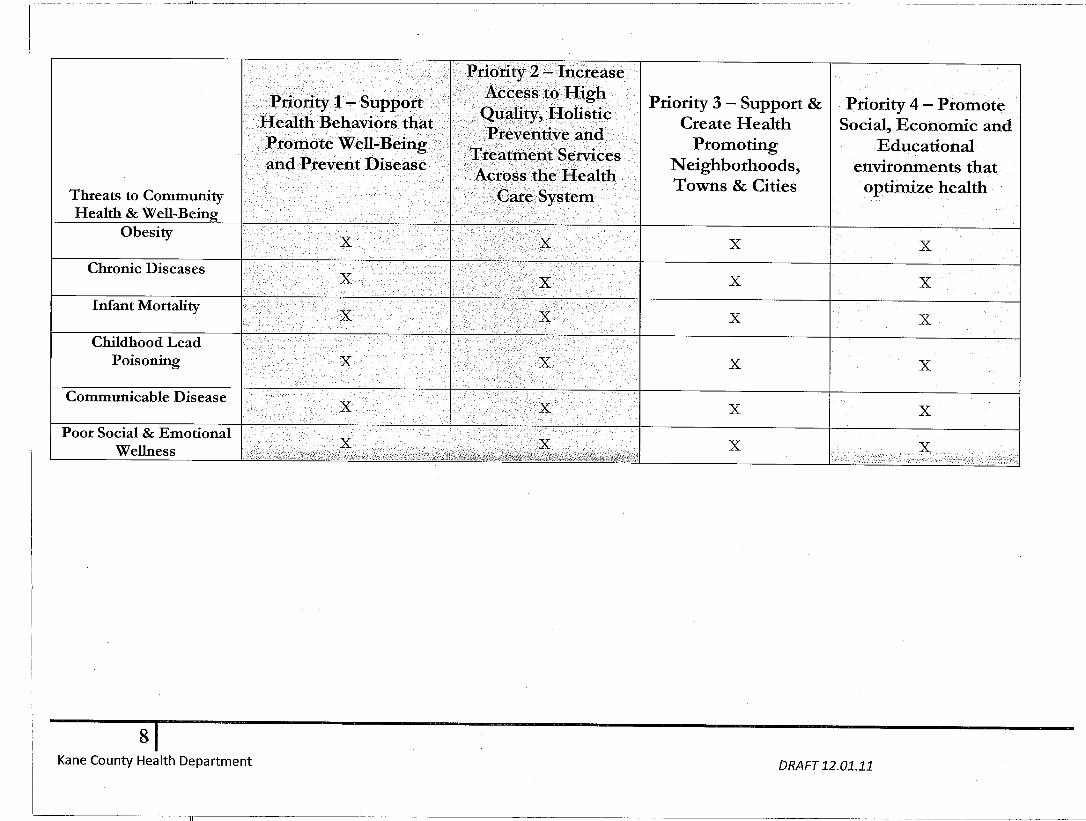


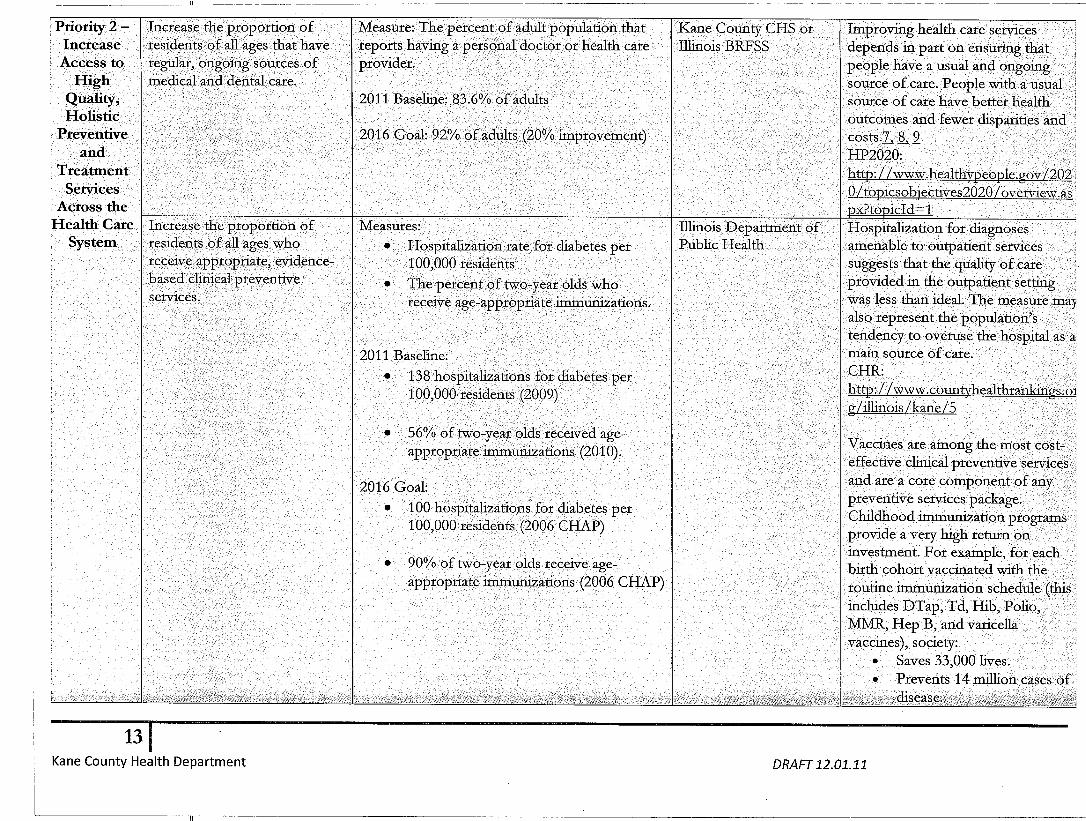
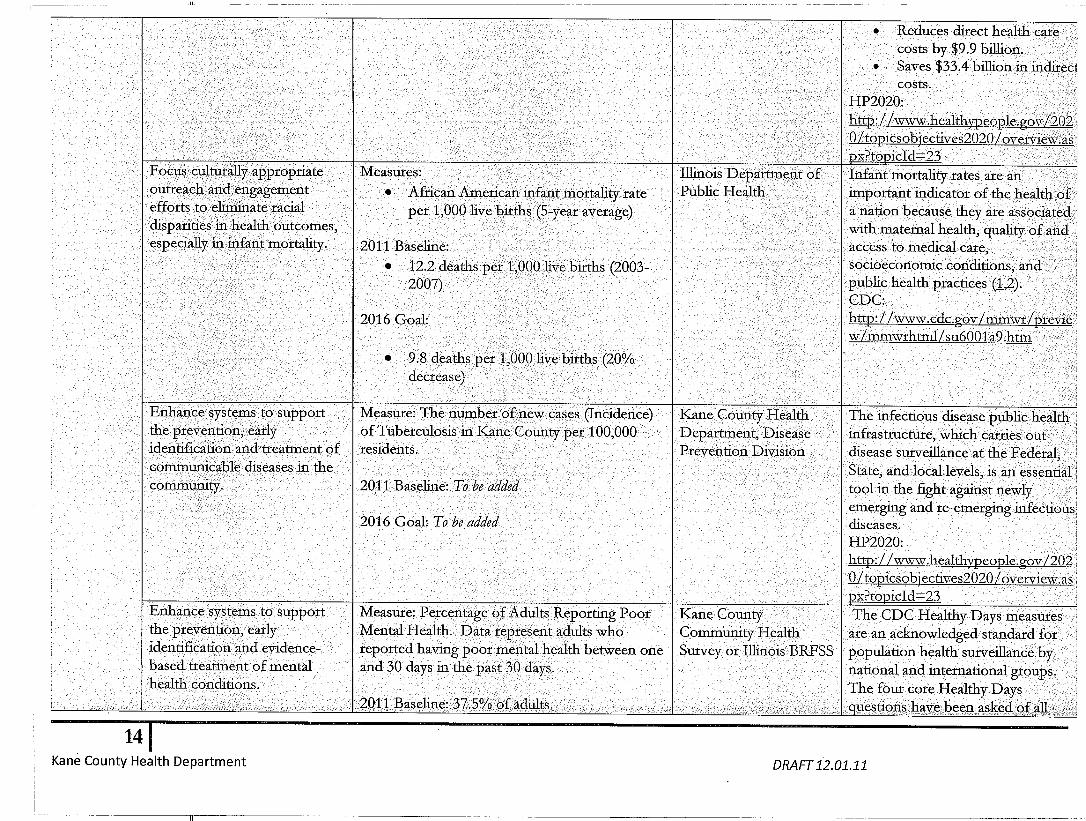


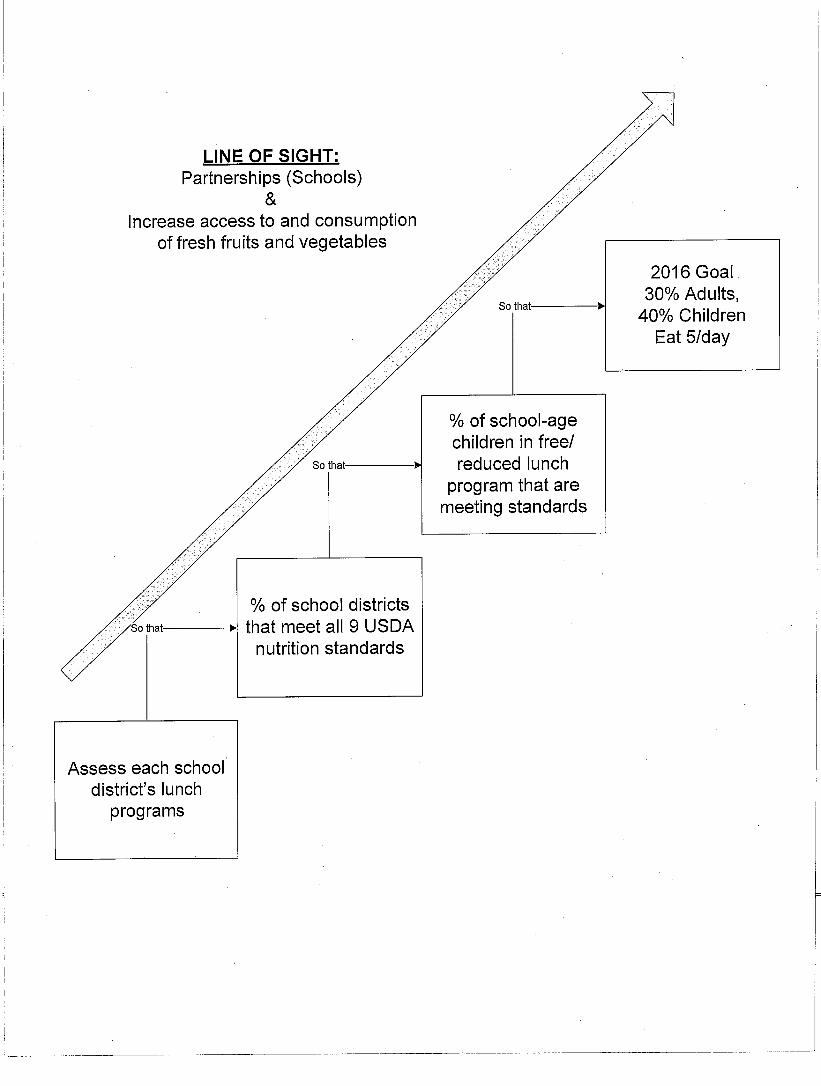

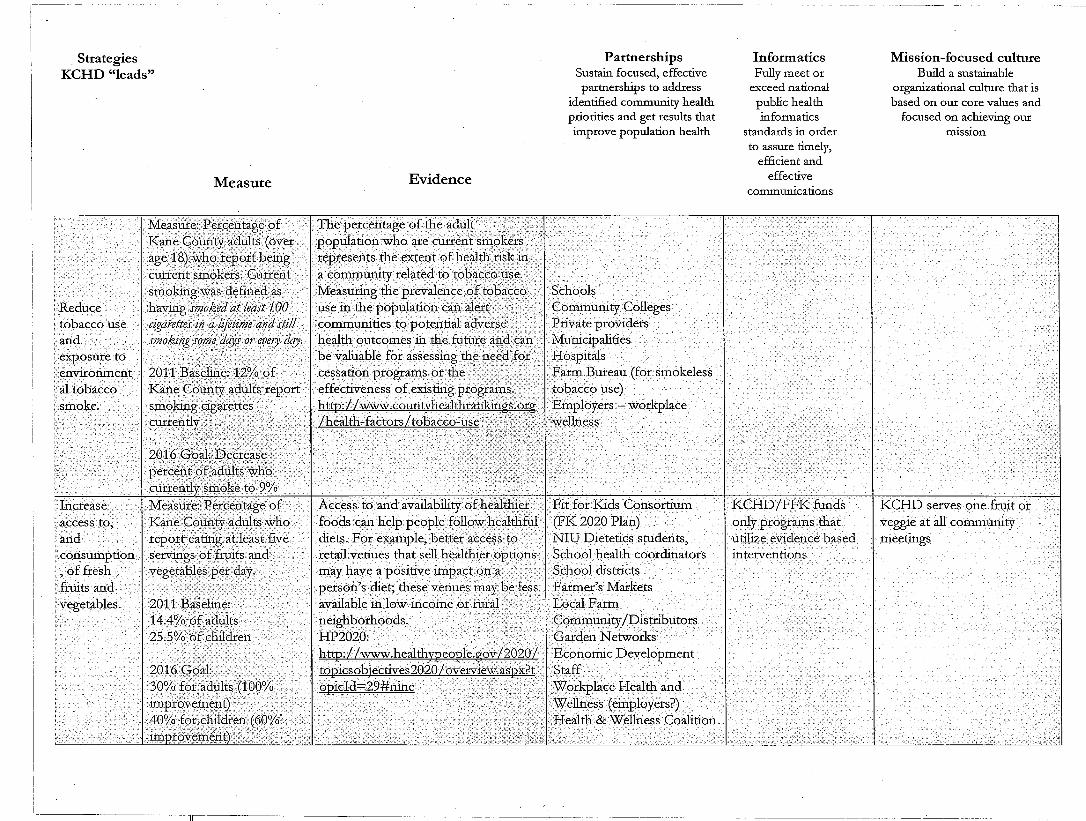

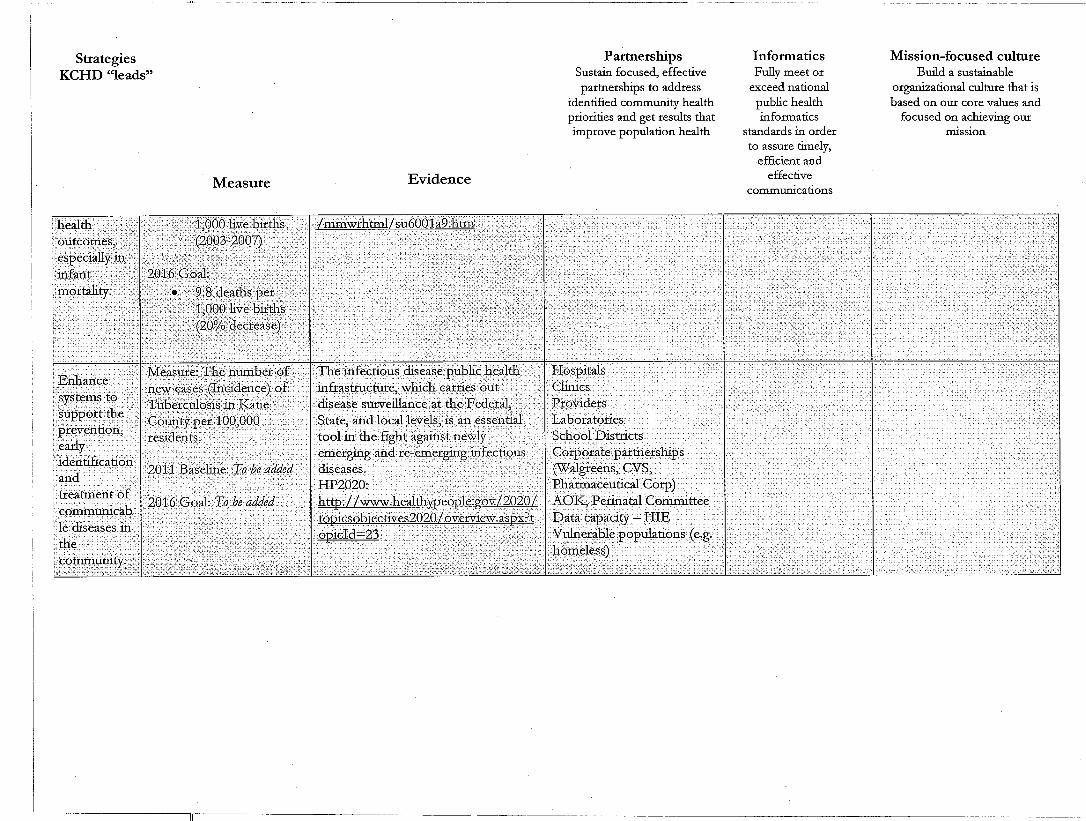


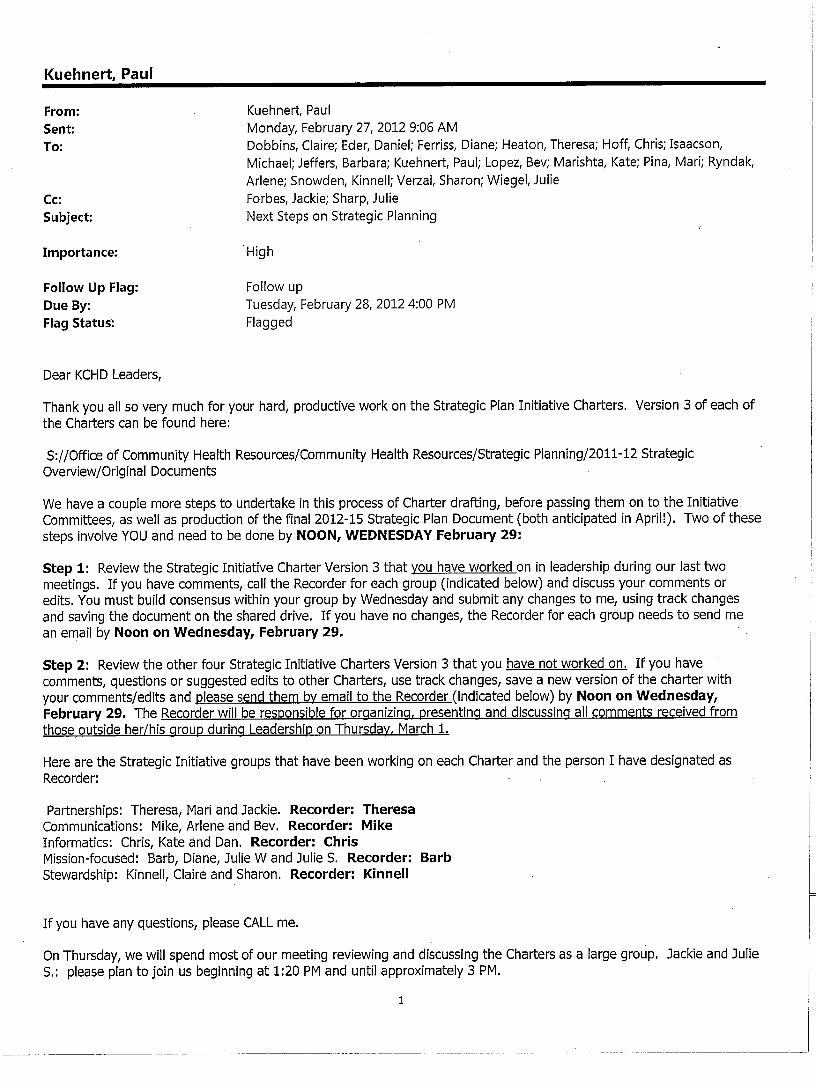


KCHD Strategic Plan: 2012-2015 Page 11
Appendix D
Strategic Initiative Committee Charters
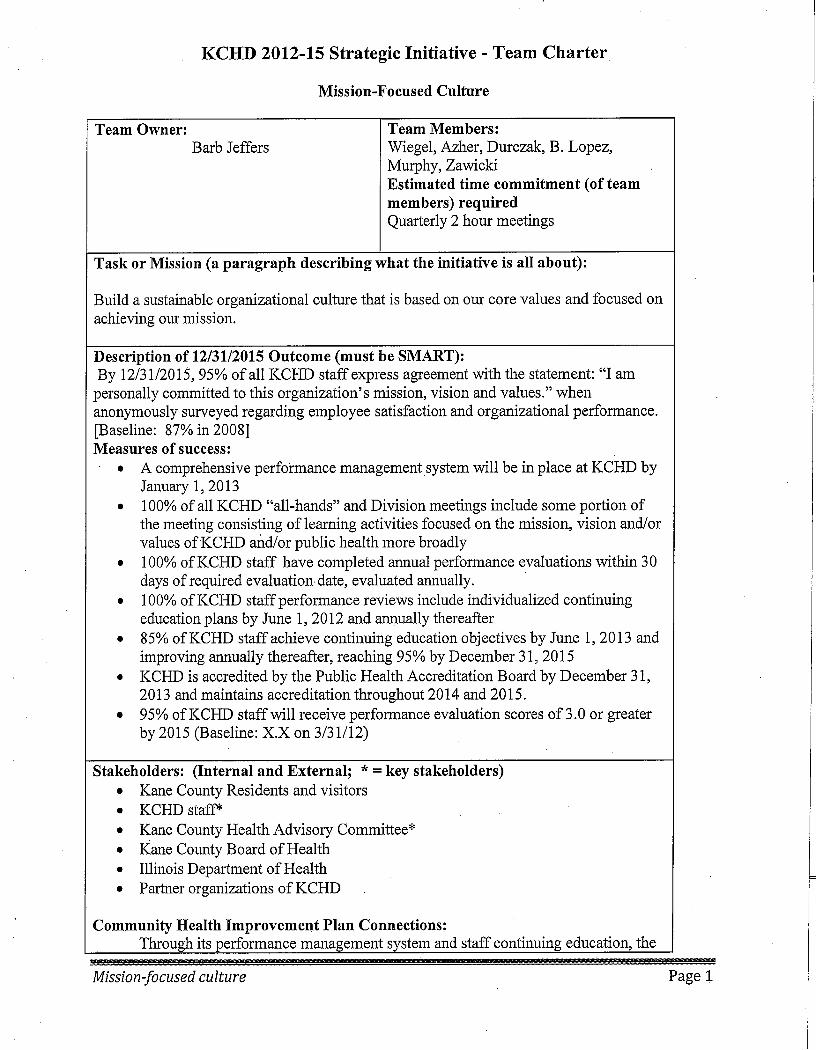
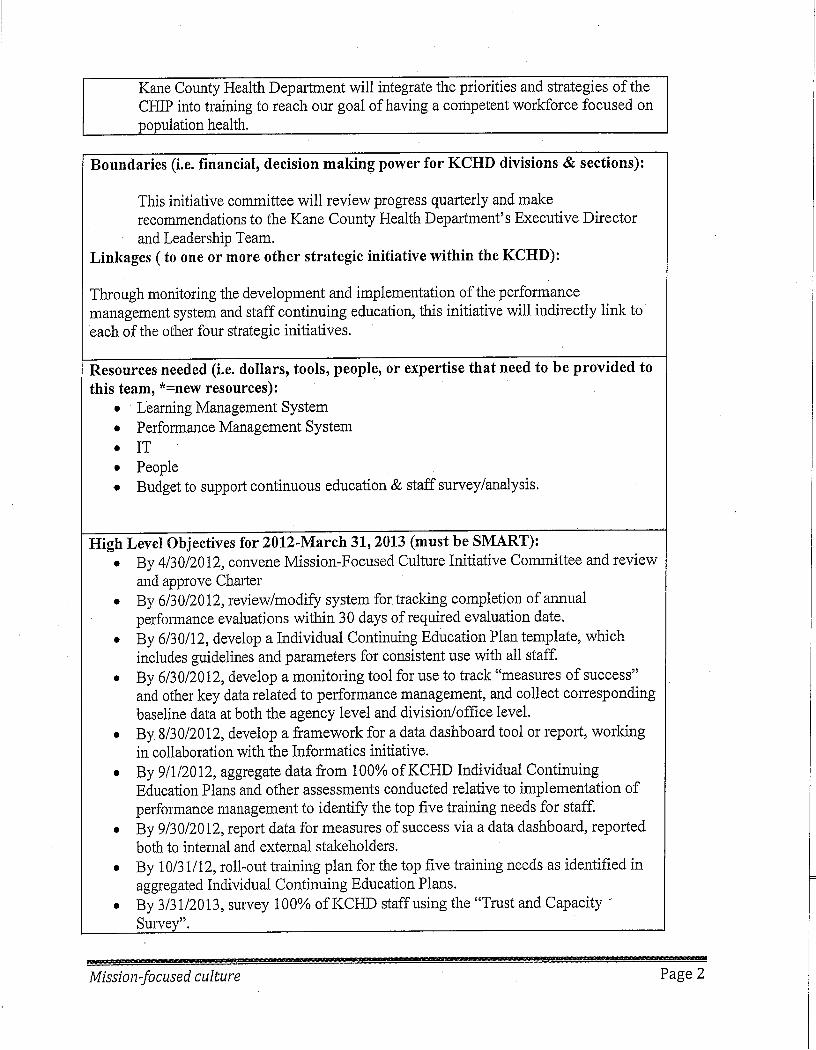


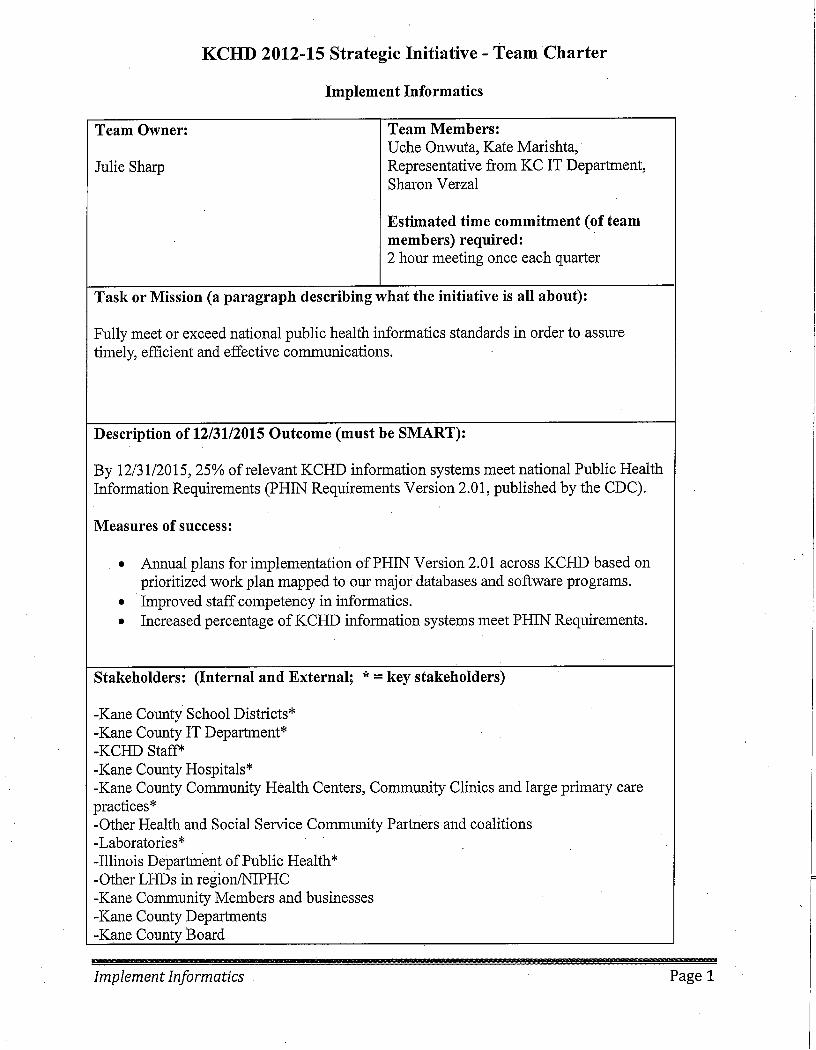


KCHD Strategic Plan: 2012-2015 Page 12
Appendix E
PowerPoint Presentation to the Kane County Board of Health
December 13, 2011
2011 Community
Health Assessment
Results: Improvement
Plan Overview
Community Health Assessment
Quick process review
Results: where to find the
details
Health Priorities & Action Plan
What’s next?

2011 Community Health Assessment & Improvement Planning
Why? • Efficient resource use: 9 Kane County
agency partnership • KCHD reorganization>>>capacity • Alignment around health needs &
priorities
What? • Comprehensive two-part report
• Assessment • Improvement Plan
• 9 customized reports • Health integrated in Comprehensive Plan • Web-based data and source reports

Community Health Assessment Activities
September October November December
Health Advisory
Committee Meeting Sept. 29
Health Advisory
Committee October 18
Community Cafés Aurora October 27th
Community Meetings
Aurora, Elgin
Community Meetings Aurora &
Elgin
Health Advisory Committee
November 15
CHA Partner Meeting
November 21
Quality of Kane Open
Houses Nov 10 & 15
Health Advisory
Committee November
29
CHA Partner Meeting
December 5
Live Presentation of
CHA Results November 17
Health Assessment Results Webinar & Survey
October 21 – November 11
Joint Board/Health
Advisory Committee
Meeting Sept. 27

Why assessment and planning?
• Identify community health needs and
problems
• Identify community assets and resources
• Prioritize limited resources
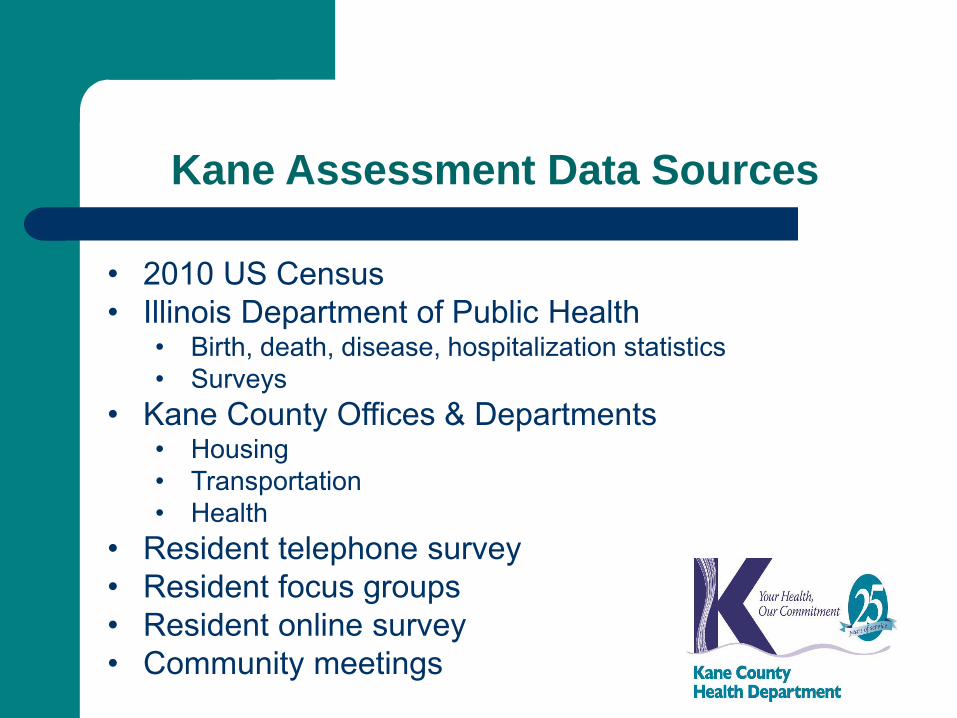
Kane Assessment Data Sources
• 2010 US Census
• Illinois Department of Public Health • Birth, death, disease, hospitalization statistics
• Surveys
• Kane County Offices & Departments • Housing
• Transportation
• Health
• Resident telephone survey
• Resident focus groups
• Resident online survey
• Community meetings

Assessment examined all health factors
• Social, education and economic factors
• Environmental factors
• Physical health
• Mental health
• Health behaviors and health practices
• Community health resources


http://www.kanehealth.com/survey.htm

Kane County Health Assessment Findings: Threats to Community Health
Obesity
Chronic Diseases
Infant Mortality
Childhood Lead Poisoning
Communicable Disease
Poor Social & Emotional Wellness
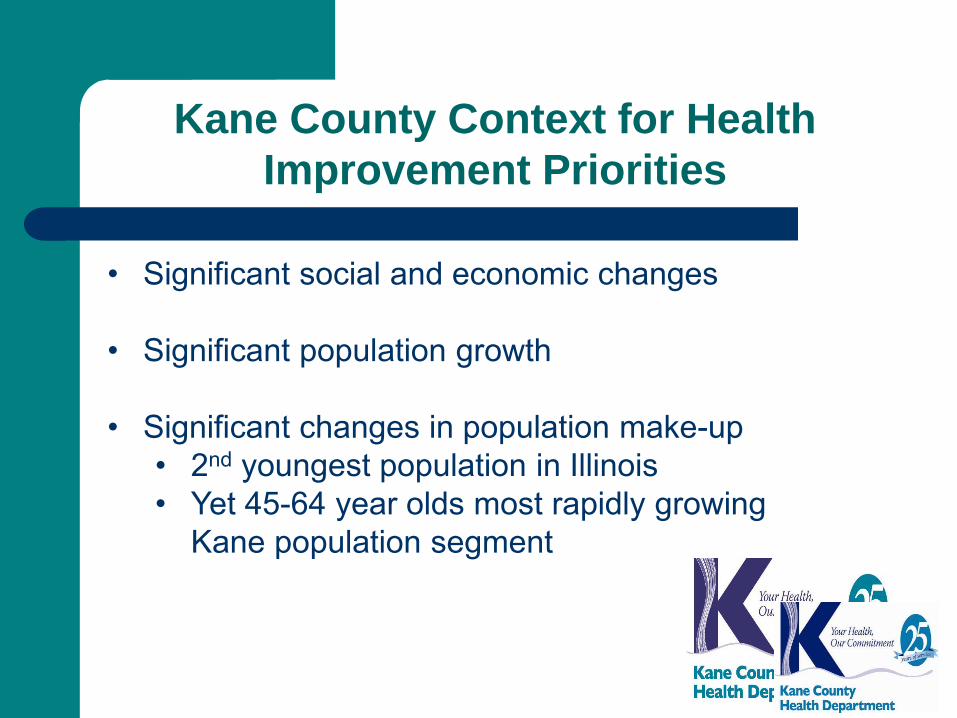
Kane County Context for Health Improvement Priorities
• Significant social and economic changes
• Significant population growth
• Significant changes in population make-up
• 2nd youngest population in Illinois
• Yet 45-64 year olds most rapidly growing
Kane population segment
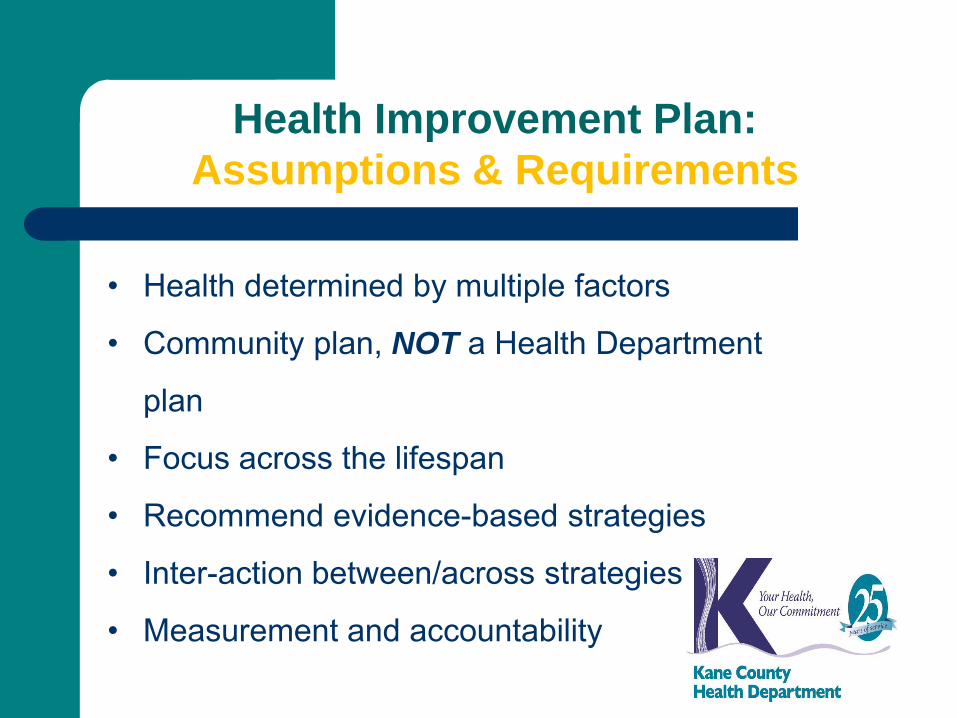
Health Improvement Plan: Assumptions & Requirements
• Health determined by multiple factors
• Community plan, NOT a Health Department
plan
• Focus across the lifespan
• Recommend evidence-based strategies
• Inter-action between/across strategies
• Measurement and accountability

Determinants of Health

Recommended Community Health Improvement Priorities
Priority 1
Support Health
Behaviors that
Promote Well-Being
and Prevent Disease
Priority 2
Increase Access to
High Quality,
Holistic Preventive
and Treatment
Services Across
the Health Care
System
Priority 3
Support & Create
Health Promoting
Neighborhoods,
Towns & Cities
Priority 4
Promote Social,
Economic and
Educational
environments that
optimize health

Threats to
Community
Health
Priority 1
Support Health
Behaviors that
Promote Well-Being
and Prevent Disease
Priority 2
Increase Access to
High Quality,
Holistic Preventive
and Treatment
Services Across the
Health Care
System
Priority 3
Support & Create
Health Promoting
Neighborhoods,
Towns & Cities
Priority 4
Promote Social,
Economic and
Educational
environments that
optimize health
Obesity
X X X X
Chronic Diseases
X x X X
Infant Mortality
X X X X
Childhood Lead
Poisoning
X X X X
Communicable
Disease
X X X X
Poor Social &
Emotional Wellness X X X X


Health Problem Root Cause Analysis Indirect Contributing Factor
Direct Contributing Factor
Indirect Contributing Factor
Risk Factor Direct Contributing Factor
Indirect Contributing Factor
Direct Contributing Factor
Health Problem
Indirect Contributing Factor
Direct Contributing Factor
Indirect Contributing Factor
Risk Factor Direct Contributing Factor
Indirect Contributing Factor
Direct Contributing Factor
Social norms and cultural values Overw eight & obestiy view ed positively
Perceived lack of time
Dominance of motorized transport
Walkability of community & environment
Limited or no healthy options available
Limited restaurant nutritional information
Not breastfeeding
Healthy options cost more
Overweight & Obesity
Limited active transport
Limited acces to fF&V
Poor food literacy
Sedentary Lifestyle
Low levels of physical activityPhysical Inactivity
Unhealthy Diet
Learned patterns of unhealthy behaviors from family and/or friends
Abundance of unhealthy options (i.e. fast food)
Advertising
Nutrition education is low priority
Perceived dangers and safety concerns
Decrease in physical activity
Limited or no PA at w ork
Lack of know ledge or education about importance of PA
Increase in screen time
Parental modeling
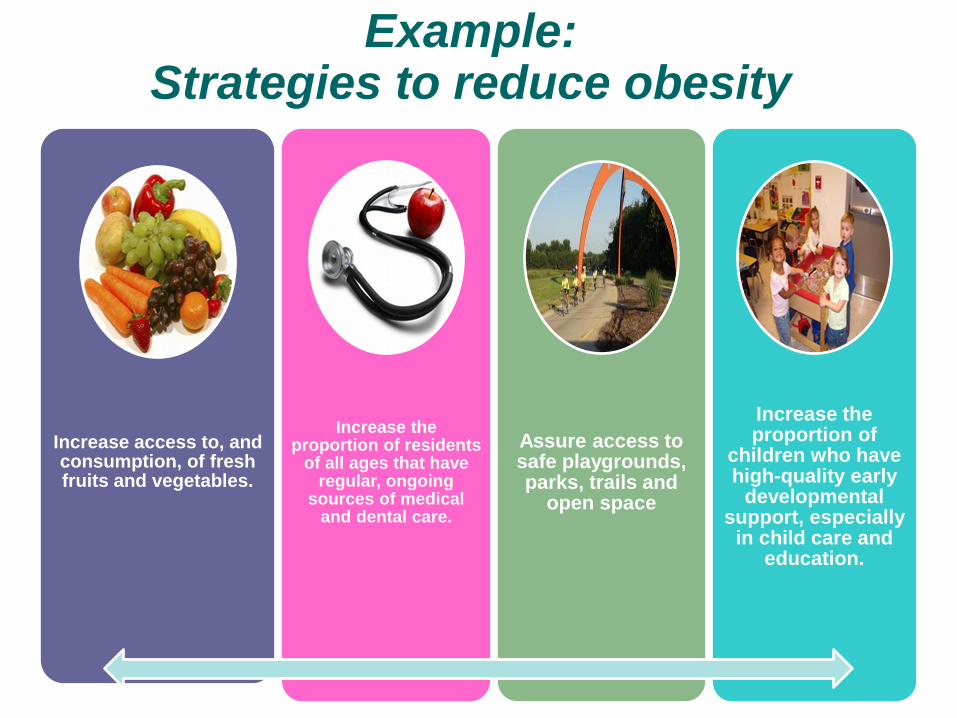
Example: Strategies to reduce obesity
Increase access to, and consumption, of fresh fruits and vegetables.
Increase the proportion of residents
of all ages that have regular, ongoing
sources of medical and dental care.
Assure access to safe playgrounds, parks, trails and
open space
Increase the proportion of
children who have high-quality early
developmental support, especially
in child care and education.

How will we know if we are making progress?
Increase access to, and consumption, of fresh fruits and vegetables.
Percentage of Kane County adults who report eating at least five servings of fruits and vegetables per day. 2011 Baseline: 14.4% of adults 25.5% of children 2016 Goal: 30% for adults (100%
improvement) 40% for children. (60%
improvement)
Kane County Community Health Survey or Illinois BRFSS
Access to and availability of healthier foods can help people follow healthful diets. For example, better access to retail venues that sell healthier options may have a positive impact on a person’s
diet; these venues may be less available in low-income or rural neighborhoods. (HP2020)
Strategy Measure Data Source Evidence

Next steps:
Questions and comments today
Complete draft report by January 31, 2012
Public comment February, 2012
Adoption: March, 2012
2011 Kane County
Health Department:
Strategic
Planning Update

KCHD Strategic Planning Activities
September October November
Joint HAC/KCHD Leadership
Meeting Sept. 29
KCHD Leadership
Meeting October 6
Health Advisory Committee
November 29
Joint Board/Health
Advisory Committee
Meeting Sept. 27
KCHD All Staff Meeting
October 17
Health Advisory
Committee October 18
KCHD Leadership
Meeting November 3
Objectives: • Review/revise mission statement • Assess external and internal
environments • Review/update strategies

Revised Mission Statement
In active partnership with our community, the Kane
County Health Department improves the quality of
life and well-being of all residents by developing and
implementing local policies, systems, and services
that protect and promote health and prevent disease,
injury and disability.

Key External Drivers
1.Funding and the broader impact of the economy.
2.Changing demographics and diversity.
3.Epidemic of obesity and chronic disease.
4.Integration with land use and transportation planning.
5.Health care reform.
6.Information technology.
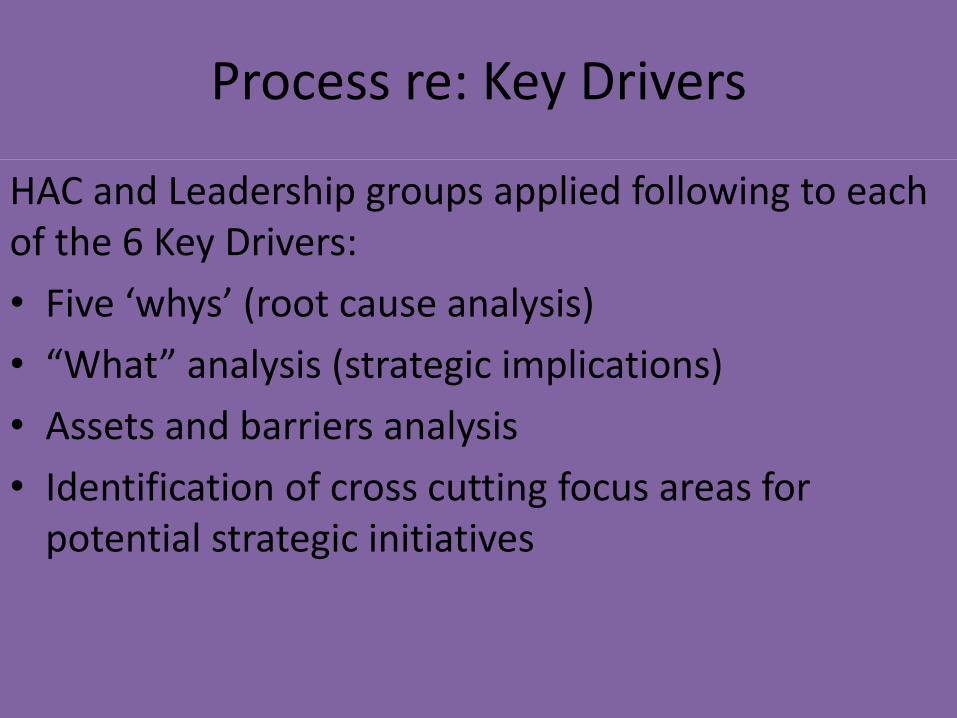
Process re: Key Drivers
HAC and Leadership groups applied following to each of the 6 Key Drivers:
• Five ‘whys’ (root cause analysis)
• “What” analysis (strategic implications)
• Assets and barriers analysis
• Identification of cross cutting focus areas for potential strategic initiatives

Implement Informatics
Model responsible stewardship of public resources by providing efficient, high quality and high impact population health services.
Model Stewardship
Enhance provision of health information to our diverse community that is: tailored, reliable, real-time and actionable.
Enhance health communication
Sustain Partnerships
Build mission-focused culture
Sustain focused, effective partnerships to address identified community health priorities and get results that improve population health.
Build a sustainable organizational culture that is based on our core values and focused on achieving our mission.
Fully meet or exceed national public health informatics standards in order to assure timely, efficient and effective communications.

Sample Implementation Plan
Implement Informatics Make key community health data easily accessible: OCHR
By 6/30/12 Kanehealth.com has community health data repository
Actionable health
information for
individuals,
partnerships and
groups
Strategy Initiative & Owner Output & Date
Outcome
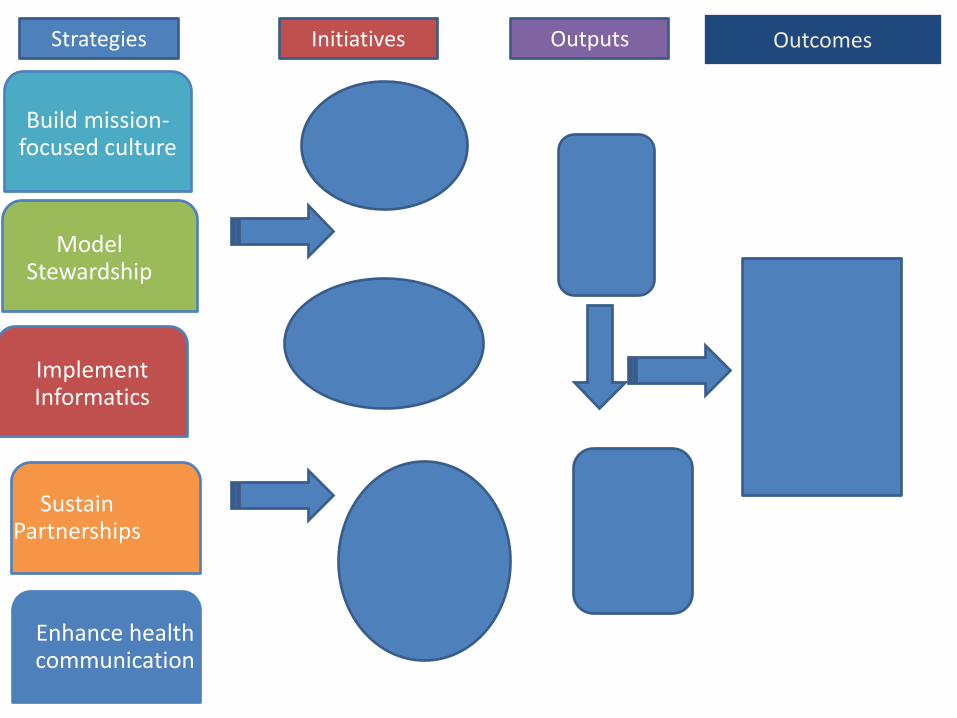
Implement Informatics
Model Stewardship
Enhance health communication
Sustain Partnerships
Build mission-focused culture
Improved Community
Health
Strategies Initiatives Outputs Outcomes

Next steps:
Questions and comments today
Complete draft report by January 31, 2012
Adoption: March, 2012

KCHD Strategic Plan: 2012-2015 Page 13
Appendix F
PowerPoint Presentation to the Kane County Board of Health/Kane County
Board Committee of the Whole
March 27, 2012

2012-2016 Community
Health Assessment & Improvement
Plan
Dr. David Stone
Kane County Health Advisory Committee

2011 Community Health Assessment & Improvement Planning
Why? • Efficient resource use: 9 Kane County
agency partnership • KCHD reorganization>>>capacity • Alignment around health needs &
priorities
What? • Comprehensive two-part report
• Assessment • Improvement Plan
• 9 customized reports • Health integrated in Kane 2040 Plan • Web-based data and source reports
Why assessment and planning?
• Identify community health needs and
problems
• Identify community assets and resources
• Prioritize limited resources

Assessment collected & analyzed many aspects of life in Kane County
• 2010 US Census
• Illinois Department of Public Health • Birth, death, disease, hospitalization statistics
• Surveys
• Kane County Offices & Departments • Development and Community Services
• Transportation
• Health
• Community Reinvestment
• Resident telephone survey
• Resident focus groups
• Resident online survey
• Community meetings

Childhood Lead Poisoning Infant Mortality
Poor Social & Emotional Wellness
Obesity
Chronic Diseases
Communicable Disease
Kane County Health Assessment Findings: Top Threats to Community Health in
Kane County

Kane County Context for Health Improvement Priorities
• Significant social and economic changes
• Significant population growth
• Significant changes in population make-up
• 2nd youngest population in Chicago area
• 45-64 year olds most rapidly growing Kane
population segment

Health Improvement Plan: Assumptions & Requirements
• Health determined by multiple factors
• Community plan, NOT a Health Department
plan
• Focus across the lifespan
• Recommend evidence-based strategies
• Inter-action between/across strategies
• Measurement and accountability

These factors determine our health:

Threats to
Community
Health
Priority 1
Support Health
Behaviors that
Promote Well-Being
and Prevent Disease
Priority 2
Increase Access to
High Quality,
Holistic Preventive
and Treatment
Services Across the
Health Care
System
Priority 3
Support & Create
Health Promoting
Neighborhoods,
Towns & Cities
Priority 4
Promote Social,
Economic and
Educational
environments that
optimize health
Obesity
X X X X
Chronic Diseases
X x X X
Infant Mortality
X X X X
Childhood Lead
Poisoning
X X X X
Communicable
Disease
X X X X
Poor Social &
Emotional Wellness X X X X


Health Problem Root Cause Analysis Indirect Contributing Factor
Direct Contributing Factor
Risk Factor
Health Problem
Direct Contributing Factor
Risk Factor
Low education
Low SES Unemployment
Under-employment
Lack of access to quality early
developmental resources
Lack of culturally appropriate messaging
Communication Lack of access to electronic media
Language access
Financial constraints of agencies
Capacity of early childhood programs Language access
Shortage of qualif ied staff
Poor Social &
Emotional Wellness
Low education
Stress
Stress Unemployment
Under-employment
Depression
Sudden change in SES due to layoffs
Alcohol Family history
Lack of physical activity
Self Image Poor nutrition
Lack of tailored relevant health messaging

Example: Strategies to improve social & emotional wellness
Create environments that prevent excessive
consumption of alcohol.
Enhance systems to support the
prevention, early identification and evidence-based
treatment of mental health
conditions.
Assure access to safe playgrounds, parks, trails and
open space.
Increase the job
skills and readiness of Kane County
residents that are unemployed.

How will we know if we are making progress?
Enhance systems to support the prevention, early identification and evidence-based treatment of mental health conditions.
Measure: Percentage of Adults Reporting their mental health was not good on 14 or more days during the last 30 days. 2011 Baseline: 9.2% 2016 Goal: 7.4% (20% improvement)
Kane County Community Health Survey or Illinois BRFSS
Levels of stress and mental distress are predictive of medical diseases and health services utilization, and data based on the Healthy Days questions allow examination of the reciprocal influences of body and mind.
Strategy Measure Data Source Evidence

Next steps:
Complete draft report online now
Recommend adoption by Kane County Board
of Health: April, 2012
Questions ?
2012-15 Kane County
Health Department:
Strategic Plan
Dr. Carmella Moran Kane County Health Advisory
Committee
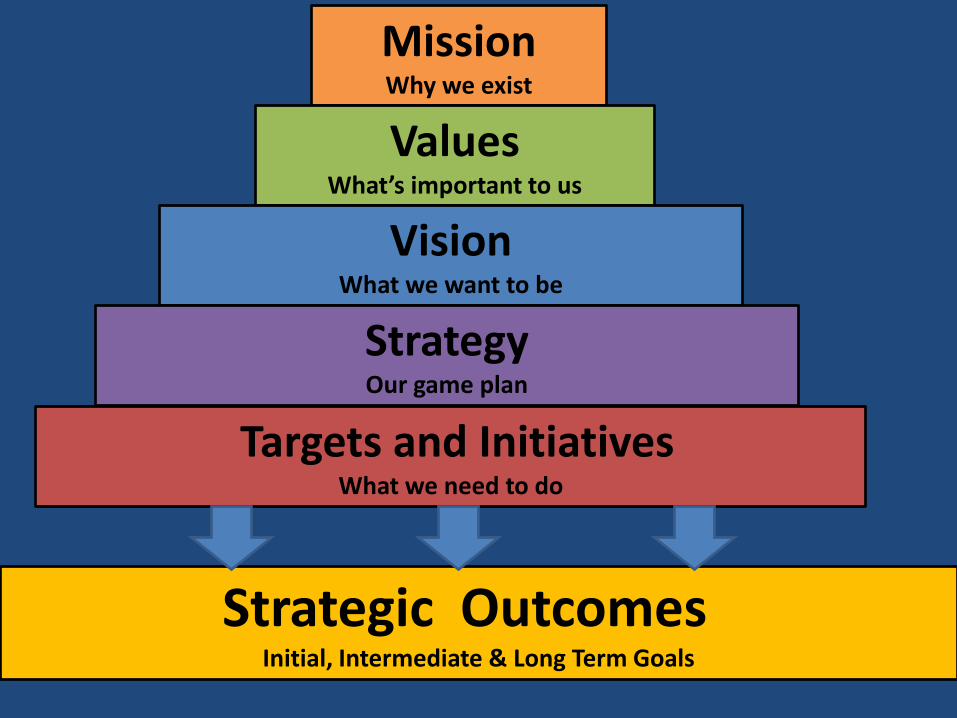
Mission Why we exist
Values What’s important to us
Vision What we want to be
Strategy Our game plan
Targets and Initiatives What we need to do
Strategic Outcomes Initial, Intermediate & Long Term Goals

KCHD Strategic Planning Activities
September October November
Joint HAC/KCHD Leadership
Meeting Sept. 29
KCHD Leadership
Meeting October 6
Health Advisory Committee
November 29
Joint Board/Health
Advisory Committee
Meeting Sept. 27
KCHD All Staff Meeting
October 17
Health Advisory
Committee October 18
KCHD Leadership
Meeting November 3
Objectives: • Review/revise mission statement • Assess external and internal
environments • Review/update strategies


Revised Mission Statement
In active partnership with our community, the Kane
County Health Department improves the quality of
life and well-being of all residents by developing and
implementing local policies, systems, and services
that protect and promote health and prevent disease,
injury and disability.

Key External Drivers
1.Funding and the broader impact of the economy.
2.Changing demographics and diversity.
3.Epidemic of obesity and chronic disease.
4.Integration with land use and transportation planning.
5.Health care reform.
6.Information technology.

Process re: Key Drivers
HAC and Leadership groups applied following to each of the 6 Key Drivers:
• Five ‘whys’ (root cause analysis)
• “What” analysis (strategic implications)
• Assets and barriers analysis
• Identification of cross cutting focus areas for potential strategic initiatives

Implement Informatics
Model responsible stewardship of public resources by providing efficient, high quality and high impact population health services.
Model Stewardship
Enhance provision of health information to our diverse community that is: tailored, reliable, real-time and actionable.
Enhance health communication
Sustain Partnerships
Build mission-focused culture
Sustain focused, effective partnerships to address identified community health priorities and get results that improve population health.
Build a sustainable organizational culture that is based on our core values and focused on achieving our mission.
Fully meet or exceed national public health informatics standards in order to assure timely, efficient and effective communications.


Next steps:
Complete draft strategic plan has been
emailed to you
Recommend adoption by Kane County Board
of Health: April, 2012
Questions ?