Strategic approach to EU agricultural research and innovation
Upload
khangminh22Category
view
0download
0
Strategic Evaluation on Innovation and the knowledgebased economy in relation to the Structural andCohesion Funds, for the programming period 2007-2013 Synthesis ReportCitation for published version (APA):
Ciffolilli, A., Lacave, MI., Lacave, MA., Maroulis, N., Naldini, A., Reid, A., Walendowski, J., & Wintjes, R. J.M. (2006). Strategic Evaluation on Innovation and the knowledge based economy in relation to theStructural and Cohesion Funds, for the programming period 2007-2013 Synthesis Report. EuropeanCommission - DG Regio.
Document status and date:Published: 01/01/2006
Document Version:Publisher's PDF, also known as Version of record
Please check the document version of this publication:
• A submitted manuscript is the version of the article upon submission and before peer-review. There canbe important differences between the submitted version and the official published version of record.People interested in the research are advised to contact the author for the final version of the publication,or visit the DOI to the publisher's website.• The final author version and the galley proof are versions of the publication after peer review.• The final published version features the final layout of the paper including the volume, issue and pagenumbers.Link to publication
General rightsCopyright and moral rights for the publications made accessible in the public portal are retained by the authors and/or other copyrightowners and it is a condition of accessing publications that users recognise and abide by the legal requirements associated with theserights.
• Users may download and print one copy of any publication from the public portal for the purpose of private study or research.• You may not further distribute the material or use it for any profit-making activity or commercial gain• You may freely distribute the URL identifying the publication in the public portal.
If the publication is distributed under the terms of Article 25fa of the Dutch Copyright Act, indicated by the “Taverne” license above,please follow below link for the End User Agreement:
www.umlib.nl/taverne-license
Take down policyIf you believe that this document breaches copyright please contact us at:
providing details and we will investigate your claim.
Download date: 24 Jun. 2022

Strategic Evaluation on Innovation and the knowledge based economy in relation to the Structural and Cohesion
Funds, for the programming period 2007-2013
Contract n° 2005 CE.16.0.AT.015
A report to:
The European Commission Directorate-General Regional Policy
Evaluation and additionality
Synthesis Report
23 October 2006
LACAVE, ALLEMAND
& ASSOCIES CONSULTANTS
1 CONSULTANTS
In association with
Disclaimer
Neither the European Commission, nor any person action on behalf of the Commission is responsible for the use, which might be made of the following information. The views of this study are those of the authors and do not necessarily reflect the policies of the European Commission. Acknowledgements This synthesis report has been produced based on the contribution of a network of national experts (see annex) in the 25 Member States of the European Union and Bulgaria and Romania. The national reporting exercise involved consultations with a range of individuals in key national and regional public, non-profit and private sector organisations. At European level, the study team has benefited from the guidance of the officials of the Evaluation Unit of the Directorate-General for Regional Policy (DG REGIO), notably Messrs Andrea Mairate and Pierre Nicolas; as well as information, comments and suggestions received from officials in the ‘geographic’ units of DG REGIO. The study team would like to thank all those individuals who have contributed their time and ideas to the successful completion of this important study. The usual disclaimer applies and possible remaining errors are the sole responsibility of the study team. Queries or remarks can be sent to the study team via email at: [email protected]

Executive Summary: a Strategic Evaluation of Innovation & Knowledge in the Structural Funds: perspectives for 2007-13 i
1 Europe’s regions, innovation and the knowledge based economy: charting a course for 2007-13 1 1.1 Political context – Lisbon and Cohesion mutually supporting goals ? 1 1.2 Key issues addressed by this study 3
2 Structural Funds interventions to boost innovation and create a knowledge economy: 2000-2006 4 2.1 Structural Funds investment in innovation & knowledge: 2000-2006 4 2.2 What was the strategic focus of innovation & knowledge measures? 8 2.3 How were SF RTDI measures designed and managed? 11
2.3.1 Subsidiarity, regional strategies and programming approaches 11 2.3.2 Operational management of RTDI measures 12
2.4 How well were funds for innovation & knowledge absorbed ? 17 2.5 What factors impinged on the effectiveness RTDI measures ? 19 2.6 Did the Structural Funds improve regional innovation potential ? 23
2.6.1 Structural Funds and innovation in the ‘old’ Objective 1 regions 23 2.6.2 Structural Funds and innovation in the new Member States 25 2.6.3 Structural Funds contribution to innovation in the Objective 2 zones 27
2.7 Closing the gap? The contribution of Structural Funds to a more innovative Europe 29
3 How innovative are Europe’s regions? A comparative overview of regional performance and potential 31 3.1 The knowledge economy and European regions 31
3.1.1 Europe’s regions: economic performance and trends 32 3.1.2 Comparing innovation and knowledge performance of European regions 38
3.2 Innovation and knowledge: clustering regions in a policy perspective 43 3.2.1 Key factors determining regional innovation performance 43 3.2.2 Clusters of European regional knowledge economies 48 3.2.3 Towards an operational typology of innovating regions in Europe 53
3.3 Regional potential for innovation: a prospective analysis 56 3.3.1 Global Consolidation Regions 61 3.3.2 Sustaining Competitive Advantage Regions 63 3.3.3 Boosting entrepreneurial knowledge regions 65 3.3.4 Entering knowledge economy regions 66
4 Europe’s innovation challenge: policy and institutional framework for Structural Funds interventions 69 4.1 Innovation and knowledge policies: the European framework 69 4.2 Member State policy priorities for innovation and knowledge 72
4.2.1 At what level(s) of government is innovation policy managed? 72 4.2.2 Coordination of innovation and knowledge policies 75 4.2.3 What are the current policy priorities in the EU27 ? 77
4.3 The influence of national innovation systems on regional policy 79 4.4 Conclusions: the importance of good governance 81

5 Regional policy and the knowledge economy: priorities and investment options to 2013 83 5.1 Strategic issues for SF investments in innovation and knowledge 83
5.1.1 The role of regional policy in raising research and innovation potential of the EU 86
5.1.2 What types of initiatives are likely to speed up the rate and scope of innovation in the EU? 88
5.1.3 Waking up Europe’s innovative potential: the right policy mix? 90 5.1.4 What can be done to promote technology transfer and better cooperation
between universities, research centres and businesses, particularly SMEs? 98 5.1.5 Ensuring easier access to finance for innovative enterprises 100
5.2 Operational guidelines to maximise effectiveness of Structural Fund interventions for innovation and knowledge 102 5.2.1 Recommendations to the Member States and regional administrations 102 5.2.2 Recommendations to the Commission services 103

List of maps Map 1: Percentage of SFs devoted to Regional RTDI..................................................................6 Map 2: Regional GDP per capita .................................................................................................34 Map 3: GDP per Capita Growth, Annual % (1996-2002) ..........................................................37 Map 4: Public R&D expenditure % of GDP (2002) ...................................................................40 Map 5: Business R&D expenditure % of GDP (2002) ...............................................................41 Map 6: Regional ‘hotspots’ for the Public Knowledge factor....................................................44 Map 7: Regional hotspots in Urban Services ..............................................................................45 Map 8: Regional hotspots in private technology.........................................................................46 Map 9: Regional hotspots for the Learning Family factor..........................................................47 Map 10: Typology of regional knowledge economies in the EU...............................................48 Map 11: Structural Fund regions 2007-13 and European knowledge regions ..........................55 List of exhibits Exhibit 1: Relationship between SFs devoted to RTDI and GERD as % of GDP......................5 Exhibit 2: Weight of SF and effort of EU25 in allocating resources to RTDI ............................7 Exhibit 3: Financial weight of types of RTDI measures financed, 2000-06 ...............................8 Exhibit 4: Categorisation of innovation & knowledge policies ...................................................9 Exhibit 5: Distribution of resources between policy areas by type of zone ..............................10 Exhibit 6: Summary of SF programme management for RTDI .................................................13 Exhibit 7: Correlation between expenditure for RTDI measures & total SFs...........................17 Exhibit 8: Absorption of SF for RTDI by field of intervention (disbursed resources as % of
allocated, ordered by total absorption)................................................................................18 Exhibit 9: Strengths & weaknesses of RTDI measures in 'old' Objective 1 zones ...................23 Exhibit 10: GDP and unemployment, top & bottom 20 European regions ...............................32 Exhibit 11: GDP per capita, average, top and bottom regions (2002) .......................................33 Exhibit 12: Top and bottom 20 regions in terms of growth of GDP and change in
unemployment (1996-2003) ................................................................................................35 Exhibit 13: GDP per capita growth, annual % (1996-2002) ......................................................36 Exhibit 14: Position of European regions on key knowledge indicators ...................................38 Exhibit 15: Public R&D expenditure, % of GDP........................................................................39 Exhibit 16: BERD as a % of GDP – position of EU regions......................................................39 Exhibit 17: Trends in two knowledge indicators – top and bottom EU regions .......................42 Exhibit 18: Growth in GERD/GDP (%) ......................................................................................42 Exhibit 19: Radar diagrams of regional knowledge economies.................................................50 Exhibit 20: Weight of each cluster of regions in the EU population .........................................52 Exhibit 21: Weight of each cluster of regions in EU GDP.........................................................52 Exhibit 22: Four strategic clusters of European knowledge regions..........................................54 Exhibit 23: Regional-national responsibilities for innovation & knowledge policy.................75 Exhibit 24: Synthetic overview of policy mix.............................................................................77 Exhibit 25: Prioritising Structural Fund support for innovation & knowledge.........................91 Exhibit 26: Global Consolidation regions – strategic recommendations...................................92 Exhibit 27: Sustaining competitive advantage – strategic recommendations ...........................94 Exhibit 28: Boosting entrepreneurial knowledge regions – strategic recommendations..........95 Exhibit 29: Entering knowledge economy – strategic recommendations..................................97

591 Synthesis report_final.doc ii
Glossary of terms BERD: Business Expenditure on Research and Development. CSF: Community Support Framework. In some cases, mainly in Objective 1 regions, the adoption of structural programmes is preceded by the adoption of a CSF, which lays down the general strategy for ERDF assistance in a certain number of regions within a Member State. CIP: Between 2007 and 2013, some 350,000 small and medium-sized enterprises (SMEs) will receive 3.6 bln EUR in EU support to invest in all forms of innovation and growth. The new programme will support actions to help enterprises and industry to innovate. It will also boost energy efficiency and renewable energy sources, environmental technologies and a better use of information and communication technology (ICT). ERDF: European Regional Development Funds: whose principal objective is to promote economic and social cohesion within the European Union through the reduction of imbalances between regions or social groups. ESF: European Social Fund: the main financial instrument allowing the Union to realise the strategic objectives of EU employment policy. FP6: The 6th Framework Programme 2002-2006 supports research co-operation and integration of research efforts, promote mobility and co-ordination and invest into mobilising research in support of other EU policies. FP7: Between 2007 and 2013, the 7th Framework Programme plans for a budget of 54.6 bln EUR organised into four programmes on Cooperation, Ideas, People and Capacities. The latter in particular provides enhanced opportunities for regions to participate. GERD: Gross expenditure on Research and Development Innovation: is the implementation of a new or significantly improved product (good or service), or process, a new marketing method, or a new organisational method in business practices, workplace organisation or external relations. The minimum requirement for an innovation is that the product, process, marketing method, or organisational method must be new (or significantly improved) to the firm. ICT: information and communication technologies can be defined as a combination of manufacturing and services industries that capture, transmit and display data and information electronically. IPR: Intellectual Property Rights. JASPER: The Joint Assistance for Preparing Projects in European Regions. This initiative is a technical assistance facility, which will help Member States to prepare high-quality projects for financing by the Structural and Cohesion Funds. Key areas for JASPER assistance will concern transport and energy infrastructure, including trans-European Networks, energy efficiency and renewable energy, and in particular the assessment of public-private partnerships.
JEREMIE: The Joint European Resources for Micro to Medium Enterprises. This initiative will enhance SME access to finance. Member States and regions will have the possibility of outsourcing the management of financial engineering and SME finance programmes to the European Investment Fund. Products will include equity, venture capital, guarantees, loans and technical assistance. Knowledge-based Economy: The knowledge–based economy describes trends in advanced economies towards greater dependence on knowledge, information and high skills levels, and the increasing need for ready access to all of these by the business and public sectors. MAP: Multi-annual Programme for Enterprise and Entrepreneurship was a framework plan of activities (2001-2006), which aimed at: enhancing the growth and competitiveness of enterprises; promoting entrepreneurship, simplifying and improving the administrative, regulatory and financial environment for business, especially for SMEs. NSRF: National Strategic Reference Framework. For 2007-13, this document outlines the national choices made in terms of the community priorities defined in the Strategic Community Guidelines (SCG). The national and local players will draw on this strategic framework to develop operational programmes (OP). Objective 1: helps regions whose development is lagging behind, where the Gross Domestic Product per head is less than 75% of the EU average. Objective 2: helps regions to overcome economic and social problems. Areas undergoing economic change in industry and the service sector, declining rural areas, urban areas in difficulty and depressed areas dependent on fisheries. Operational programme. In the context of the Structural Funds, this refers to a document approved by the Commission to implement a Community Support Framework, comprising a consistent set of priorities and multiannual measures, which may be implemented by one or more Structural Fund or other financial instruments. PPP: Public-Private Partnership. RTDI: research, technological development and innovation SFs: The Structural Funds and the Cohesion Fund are intended to narrow the gaps in development among the regions and Member States of the European Union. They represent 35% of the Community budget, and are therefore the second largest budget item (after the Common Agricultural Policy). SPD: Single Programming Document. In order to speed up and simplify the programming procedure, Member States have had the option since 1993 of presenting a SPD, incorporating both the Plan and the financing request. In this case, the Commission adopts a single decision in respect of elements normally set out separately in a CSF and OP.

591 Synthesis report_final.doc i
Executive Summary: a Strategic Evaluation of Innovation & Knowledge in the Structural Funds: perspectives for 2007-13 Structural Funds for innovation and knowledge Since 2000, innovation and knowledge have become favourite buzzwords in European policy documents inspired by the ‘Lisbon Strategy’ goal to make the EU the most competitive, dynamic, knowledge-based economy by year 2010. The importance of innovation and knowledge-based policies in restructuring economies and making them more competitive has been increasingly drawn to the attention of policy makers and stakeholders. The regional policy level is no exception to this trend. Regional innovation strategies, operational programmes (OPs) and measures in favour of research, technological development and innovation (RTDI) or more generally ‘competitiveness’ have been designed and funded with the support of the Structural Funds (SFs) since the early 1990s. Since 2000, the emphasis on RTDI type measures in the SF has been increased in line with the Lisbon goals. For the 2007-13 period, the European Commission’s Strategic Guidelines for Cohesion set out a framework for the development of the ‘National Strategic Reference Frameworks’ (NSRF). The aim is to ensure that European regions take full advantage of the 308 thousand million EUR made available over the next seven years. The Commission places improving knowledge and innovation at the heart of programmes in both the ‘Convergence’ (regions with less than 75% of the EU’s average income per capita) and ‘Regional Competitiveness’ regions. Hence, the ‘new Cohesion Policy’ should contribute to increasing growth, competitiveness and employment by incorporating the objectives of the Lisbon Strategy. Indeed, certain advocates of increased funding for innovation have proposed that Member States fix a minimum commitment to innovation of the order of 20% of SF spending. This would represent a major increase from the current levels of spending on RTDI in the Structural Funds during 2000-2006. Taking into account the diversity of current national and regional innovation capacities and future potential, this study provides further insight into the most appropriate policy-mix in favour of innovation and knowledge. This report provides a thorough EU wide evidence based review leading to the definition of a menu of options and good practice examples for future SF programming in the field of innovation and knowledge. The aim of the authors is to provoke and inform an open debate about the
future role of EU regional policy in stimulating Europe’s innovation performance, growth and jobs. Structural Funds, innovation & knowledge: lessons from 2000-06 Innovation and knowledge were clearly fixed as priority objectives during the current programming period at EU level. Member States and regional authorities were encouraged to invest more in this field. The outcome according to the analysis of this evaluation is encouraging, however, the situation is not uniform with certain regions and Member States investing much more than others. More specifically, the importance of RTDI investment varied markedly across the EU25. This ranged from 0.3% (Malta) to 15% (Belgian province of Hainaut) in Objective 1 regions of total funds; and from 2.2% (Netherlands) to 29% (Spain) for Objective 2 zones. During the programming period 2000-06, approximately 10,198 MEUR were allocated to RTDI initiatives, or 5.5% of total funds in the EU25. Some 77% of the total Community allocation for RTDI measures was devoted to Objective 1 zones (and within these regions only 9 OPs accounted for 50% of total expenditure). This represents an average planned spending of 4.9% on RTDI from total available SF in these ‘cohesion regions’ where current innovation performance is lowest compared to 9.8% of total funds spent on average on RTDI in the already more competitive Objective 2 areas of western Europe. These figures tend to suggest that RTDI measures, particularly in Objective 1 zones where the bulk of money has been spent, have not been a central plank of EU regional policy interventions. This result cast doubts on the potential leverage effect of SF interventions with respect to the objectives of the Lisbon Strategy. One obvious hypothesis is that national policy and national innovation systems strongly influence the RTDI strategy in the SFs programmes. The analysis suggests that, indeed, the share of SF devoted to RTDI is related to the existing national intensity of investment as measured by gross expenditure on R&D In absolute terms the SF do appear to be an important contributor to national R&D efforts notably in Objective 1 regions and this may contribute over time to a convergence of GERD in Europe. On an annual basis, SFs resources devoted to RTDI account for between 5% to over 18% of gross expenditure on R&D (GERD) in Objective 1 countries. In addition, if the national public and private co-financing is considered, the weight of SF interventions in GERD reaches about 40-50% for

591 Synthesis report_final.doc ii
these countries. In short, EU regional funds provide an important, and even decisive, financial boost to RTDI expenditure in a majority of the EU25. In per capita values (population in eligible zones), the four old ‘Cohesion’ Objective 1 countries (Ireland, Portugal, Spain and Greece) allocated an above average share of resources to RTDI, estimated at 45.4 EUR per person. Other countries such as Germany (Objective 1), Belgium, Finland, Sweden, Austria, Denmark and Italy (Objective 1), also allocated funds to RTDI investment above the EU25 average. RTDI measures – strategic approaches With regards to the focus on different types of RTDI interventions, a distinction can be made between three types of regions: there was a stronger focus on innovation enterprises and knowledge transfer f instruments in Objective 2 regions; whereas support measures aimed at fostering an innovation friendly environment and boosting applied research were dominant in Objective 1 regions. The focus in the new Member States (NMS) was on instruments aimed at encouraging innovation of enterprises and boosting applied research, coherent with low RTDI capabilities of SMEs and weak linkages between the R&D organisations and industry. In terms of approaches to programming, the Objective 1 countries were characterised by a dominance of multi-regional operational programmes, with weak regional level capacities to implement RTDI policies and measures. In Objective 2 zones, the Dutch and Finish approaches can be considered as two possible future models for SF programming of RTDI. On the one hand, the Netherlands adopted a somewhat different approach from most Objective 2 Member States, with an orientation towards RTDI policy labelled ‘peaks in the delta’, or strengthening the ‘hotspots’ of research and innovation. On the other hand, the Finish model used the SF interventions to complement the existing national policy measures and provide a financial instrument for those regions that have fewer capabilities to make use of national funding. The question of whether Member States choose to focus RTDI resources on ‘poles/hotstpots’ or use the money to balance national differences in RTDI potential is likely to be the crux of an on-going debate. Barriers to the implementation of RTDI measures In terms of the effective implementation of RTDI priorities and measures, the evaluation highlights that efforts to improve policy-making, strategy development and evaluation, including coordination between national and regional policy makers remain limited, although these ‘governance’ issues emerge
as a major barrier in the majority of countries. At an operational level, moreover, public-private partnerships in the field of RTDI are considered as weak in close to half of the EU25 and only strong in seven Member States (Austria, Denmark, Finland, Germany, the Netherlands, Sweden and the UK). In financial terms, nevertheless, the absorption capacity of RTDI measures is similar to the total of SF interventions. By January 2006, the total absorption capacity of SFs devoted to innovation knowledge and innovation in Objective 1 and 2 areas of the EU25 was 48.5%. This is a slightly better performance than total SF absorption (47.6%). In Objective 1 zones, only six cases out of 22 have higher RTDI absorption than total SFs capacity (i.e. Belgium, Poland, Spain, United Kingdom and especially Sweden). In Objective 2 zones, RTDI measures have absorbed funds on average better than the total SF programmes. The situation is nevertheless differentiated: Sweden, United Kingdom, the Netherlands and Luxembourg perform better in RTDI while other countries (e.g. Austria, Denmark and Italy) are characterised by worse innovation and knowledge expenditure performance. In summary, there are four main bottlenecks to the effective implementation of SF RTDI measures: An administrative rather than strategic
management of RTDI measures leading to a lack of synergies with other initiatives, etc.;
Lack of expertise at national and regional levels in managing RTDI measures;
A continuing dominance of supply-side measures with poor linkages to regional innovation systems; and
Limited interest for many ‘softer’ ‘demand-side’ measures aimed directly enterprises.
Structural Funds – support to RTDI policies In “old” Objective 1 regions, SFs represent a crucial, if not unique, resource for supporting national and regional RTDI policies. From this point of view, the ‘strategic’ additionality of SF has been very high. As in the “old” Objective 1 regions, SFs are the main resource for supporting RTDI in the new Member States. In contrast, the new ‘Objective 1’ regions have strong needs related to industrial restructuring and good potential due to availability of highly skilled human capital linked to cost competitiveness which attracts foreign investments. In the Objective 2 regions SF interventions played a role of complementary instrument of national policy: in some places facilitating the local expansion or consolidation of technology centres or other innovation facilities, in other regions being used to implement a regional RTDI strategy, and in a few cases to support particularly innovative interventions.

591 Synthesis report_final.doc iii
In the absence of in-depth, quality evaluations of regional innovation measures supported through the SF (improving evaluation practice in this field is a necessity for 2007-13), a case study approach to identify ‘good’ (or rather interesting) practice cases in each of the sub-fields of RTID policy was applied. These examples are intended to be illustrative of specific types of measures and provide opportunities for learning amongst EU regions on different aspects of the process of implementing innovation policy. They should not be considered as necessarily “models’ to apply with further analysis. A number of cases are presented in the synthesis report and more detailed information about the full 38 the most interesting good practice examples can be found in the country reports. Regional innovation performance Recognising that it is not useful in policy terms to present the performance of over 200 EU regions on all innovation and knowledge indicators, it was necessary to reduce the information to a more limited set of ‘synthetic indicators’. Accordingly, factor-analysis was used in order to identify which variables belong to the same explanatory factor (or driver) of regional innovation performance. Four factors Based on the variable with the highest factor loadings, the meaning of each of the four factors were interpreted and given a short symbolic name: Public Knowledge, Urban Services, Private Technology and Learning Families. Public Knowledge: Human resources in science
and technology combined with public R&D expenditures and employment in knowledge intensive services are the most important variable for this factor.
Urban Services: This factor takes into account the differences between industrial areas and service-based area, including the public administration services of the government.
Private Technology: This factor contains the correlated variables of business R&D, occupation in S&T activities, and employment in high- and medium-high-tech manufacturing industries.
Learning Families: The most important variable is the share of the population below the age of 10. Regions scoring high have good possibilities for life long learning in the region seems associated with the lively labour force participation of women.
The next step of the project was to test the relevance of the four regional knowledge-economy factors with the view to check whether they would help in explaining differences in GDP per capita and unemployment rate. In conclusion, almost half of the difference in GDP per capita amongst the 215 European regions is explained by the four
knowledge economy factor scores. The four factors also explain part of the variance in the unemployment rates of the 215 regions. Subsequently, the regions were grouped into types of regions displaying similar characteristics by means of a cluster analysis using the four factors and GDP per capita. The diversity of innovation performance and potential amongst the European regions led to the definition of 11 types of regional knowledge economies in Europe which were used for the country level analysis. Four types of regions In order to arrive at a set of conclusions and recommendations at EU level, four ‘strategic’ groups of regions were derived from the more detailed preliminary analysis: Global Consolidation Regions are on the
top rung of the ladder of European innovative regions. Regions in this group include: Copenhagen, Ile de France, London, Prague, Stockholm and Vienna, etc. These regions are clearly well above the average for all four factors as well as GDP/capita with the exception of the private technology factor where they are close to the EU average.
Sustaining Competitive Advantage Regions (strong industrial and learning regions e.g. Baden-Württemberg, Flanders, Ireland, Piemonte, Rhône-Alpes, Salzburg and Scotland, etc.) are relatively strong on private technology (reflecting the industrial tissue and heritage of these regions) and on learning families but much weaker in public knowledge and urban services (suggesting a difficulty to restructure towards more knowledge based services).
The Boosting Entrepreneurial Knowledge Regions (second-tier capitals and regions with strong public research e.g.; Athens, Berlin, Bratislava, Catalunya, Lisbon, Midi-Pyrénées, Warsaw, and Wallonia, etc.) are strong on public knowledge and relatively competitive in terms of urban services but need to boost private technology and in particular learning family drivers of their knowledge economies.
The Entering Knowledge Economy Regions (broadly similar to the SF “Convergence” regions) lie on the southern and eastern rims of the EU. This group includes most of Greece, southern Spain, Poland except Warsaw, Estonia, Lithuania, Portugal except Lisbon, the Mezzogiorno, etc.). These regions are broadly speaking ‘users’ rather than ‘producers’ of technology
Comparing the typology of four knowledge economy regions (see map at end of executive summary) with the four main types of regions eligible for SF support suggests that if the Structural Fund map was to be drawn on the basis of divergence in

591 Synthesis report_final.doc iv
innovation needs and potential the outcome would be different from that based on income per head gaps. While there is a strong correspondence between the Convergence and ‘Entering Knowledge Economy’ regions, the knowledge economy approach separates out a number of regions (notably capital cities and other major ‘innovation hotspots’) where innovation potential may be fostered more easily. However, equally some ‘northern’ regions are identified as having a potential closer to that of ‘less-innovative’ southern regions. The ultimate conclusion seems to be that such a typology should not be read as a scorecard of more versus less innovative, but rather serve as food for thought to policy makers that they cannot blindly mimic the policies of the ‘innovation hotspots’ but rather need to build their own approach tailored to regional potential. Drivers and specific regional challenges There are several major drivers emerging from the analysis of the country reports and available studies, which influence the future innovation potential of the regions. These are global, sectoral and technological factors. The global drivers have an impact on all types of regions, irrespective of their economic specialisation and technological competencies. At the same time, the innovation potential of regions is also affected by sectoral dynamics. There is also a number of technologies determining to a large extent the pace and direction of innovation, most notably cutting-edge technologies such as nanotechnology and biotechnology. Increasingly, sustainability and need for eco-innovations become a focus across all sectors. Public intervention is an important stimulant in the area through, on one hand, changing the regulatory framework, tax regimes and public procurement rules (‘green procurement’) and, on the other, direct support for developing and implementation of eco-innovations. During 2007-13, regional policy should become a promoter of systemic change within innovation systems at both national and regional level in order to respond to this global challenge. From the analysis of country reports, it is evident that the four main types of regions have different strategic challenges. For the Global Consolidation Regions, the key challenge is to develop a strategic vision for continuing to compete on a global, not national or even European level. These regions should continue competing globally and generate new local clusters of activities from advanced technologies. With regards to the Sustaining Competitive Advantage Regions, their main challenge is to stay on the leading edge in core technology capacities, concentrate resources in the strongest growth potential technological areas and move towards knowledge based services.
The next category of the Boosting entrepreneurial Knowledge Regions faces an important challenge to develop their current niches (both public and private R&D activities) into “competitiveness poles” that will foster entrepreneurship (spin-offs creation around universities) with linkages to international technology platforms and networks. The major challenge for the Entering knowledge economy regions is to enable companies to tap into the existent competencies of the public research institutes as a means to increase their propensity to innovate. In more concrete terms, Eastern EU regions face the challenge of making a rapid stride towards higher technology activities based on current skills base, increased investment in knowledge and attracting more research-intensive industries. For Southern Cohesion regions and rural areas should concentrate efforts in improving ITC networks, developing innovative tourist products and encouraging reconversion of agro-sectors towards new products (e.g. biofules). Innovation governance There are significant differences in formal powers and capabilities of regions in terms of design, funding and implementation of innovation and knowledge policies. However, the emerging evidence from the 2000-2006 perspective is that the capacity of the regions to develop and implement innovation and knowledge policies does not depend only on their powers in this field. Weaknesses in national regulatory environments and co-operation between the major stakeholders of both national and regional innovation systems need to be taken into account. In the past, SF RTDI interventions have proven difficult to implement in certain countries since regulatory framework make them ineffective. Also, a lack of co-ordination and complexity at national level has been emphasised in many countries. The problem affects every type of countries (federal, with ‘autonomous’ regions, centralised, single-region). The lack of co-ordination at regional level is underlined for instance in Spain, France, and in Austria. The co-ordination between the national and regional level is considered as insufficient in Spain and Italy, whereas Finland and the UK provides examples of good practice in this field. The policy mix for innovation and knowledge in the EU27 is structured around a broad ‘consensus’ on three “traditional” policy areas: “knowledge transfer and technology diffusion” first of all; then, “applied research and product development” and “support to creation and growth of innovative enterprises” to a somewhat lesser extent. Going beyond this consensus appears important for the future effectiveness of SF support for RTDI. In large countries such as France, Germany, Italy, the priority given to “knowledge transfer” has not proven as effective and as efficient as was
591 Synthesis report_final.doc v
expected. Previously cited deficiencies in networking and partnership are probably part of the explanation. In this respect, the analysis of this report suggests that strong partnerships are more important than formal decentralisation of powers. Equally, in terms of programming structures there is a clear need for Member States of a medium to large size to reflect on the comparative advantages of multi-regional programmes (achieving critical mass of finance or skills and avoiding duplication) versus regional programmes (allowing tailored made solutions to regional specific issues). At the EU level, the new policy frameworks for regional, innovation and research policies (CIP and FP7) offers many opportunities for synergies with the new Structural Fund programmes in support of the Lisbon strategy. Specific additional instruments should facilitate this outcome, such as the EIB RTD risk-sharing facility, JEREMIE or the Europe Innova Initiative. However: this potential needs to be developed and exploited at ‘grassroots’ level since complementarities will only develop if exploited by local and regional actors through more structured and permanent forms of collaboration. Structural Funds’ investment priorities In the context of on-going negotiations on the future programming of SF interventions in the area of innovation and knowledge, it is clear that there is a need to focus the discussions on the actual regional strengths and future potential taking into account sectorial, technological and innovation trends. The SFs need to achieve a better balance between ‘structuring infrastructure’ in the regional economy to ‘structuring behaviour’ of agents and patterns of co-operation in the regional innovation system. This is not to deny that in selected regions, the SFs should not invest in infrastructure but rather that investment in knowledge infrastructure needs to be made conditional on changes in management of RTDI organisations to improve their performance and impact on regional economies. The needs for regional innovation policies can be summarised as follows: To recognise the diversity of regional
innovation potential, which implies distinct ‘tailor-made’ approaches to target setting and programming of innovative measures in Europe’s regions.
To launch and test more ‘complex projects’ or ‘multi-actor-multi-measure’ initiatives with a clear focus on marketable applications of new technologies rather than R&D infrastructure based approaches to technology development and transfer.
Adopt a longer-term planning and more sustainable process of strategic management of regional innovation policies.
Exploit the new European Territorial Co-operation Objective to create inter-regional innovation platforms.
In this context, the evaluation highlights two main strategic conclusions, in terms of content and strategic design of programmes in the next programming period: Diversity of innovation potential in Europe
implies equally diverse approaches to priority and target setting.
Innovation is primarily an entrepreneurial activity and direct financial support needs to be widened to non-technological and co-operation based instruments.
Strategic recommendations As regards priority and target setting for regional innovation policies, the evaluation recommends that the programme managers for innovation and knowledge measures: avoid adopting identikit policy approaches
based on a mechanical transfer of practice from elsewhere
apply a more sophisticated approach making use of a wider range of baseline indicators to set relevant targets (e.g. increase in turnover of sales from new products) at priority or measure level.
The direct support to enterprises should be focused on three critical factors for boosting the rate and scope of innovation: support for recruitment and exchange of
scientific and engineering staff (but also industrial designers, innovation management specialists, etc.). This approach also has the advantage of supporting innovation while stimulating employment creation.
Open up R&D and innovation support schemes to a broader definition of innovation to include design and other non-technological innovation aspects as well as in sectoral terms considering the launching of specific actions towards creative industries, tourism and other service sectors.
Connect SMEs to providers of knowledge able to inform and assist with product life-cycle renewal as well as large firms and ‘customers’ who provide insight into market trends, future product requirements, etc. should be facilitated.

591 Synthesis report_final.doc vi
Operational recommendations to the Member States and regional administrations Policy-formulation level: improve co-ordination
amongst regional programmes and policies and investment in strategic intelligence tools such as policy benchmarking, foresight, inter-regional co-operation programmes can create a voluntary exchange of now-how.
Programme design: adopt a phased approach to implementing innovation and knowledge interventions and avoid funding sub-critical programmes or measures in favour of larger, ‘riskier’ but if successful more structuring projects.
Relations between policy making institutions: rationalise and review research and innovation intermediary networks.
Contracts and relations between operative funding agencies and their clients: reduce excessive red-tape and formalities and introduce more flexible and risk tolerant practices.
Co-operation culture, rules and procedures between consortia or co-operation networks: ensure that the stakeholders are aware of legal or institutional barriers and analyse the existing culture for cooperation before launching wide-ranging cluster measures.
Recommendations to the Commission services Reinforce understanding and awareness
amongst DG REGIO geographic units of the concepts, issues and operational methods for management and scrutiny of innovation and knowledge type methods.
Commission a series of studies or focused evaluations to deepen understanding of what types of measures are most effective in boosting regional innovation potential.
Work with Eurostat, other Commission services and national and regional authorities to radically improve over the programming period the quality and availability of statistics on regional innovation.
Fund a facility with the aim of providing technical assistance and training to regional and national officials and managers of Structural Fund measures in the field of innovation and knowledge.

591 Synthesis report_final.doc vii

591 Synthesis report_final.doc viii

591 Synthesis report_final.doc 1
1 Europe’s regions, innovation and the knowledge based economy: charting a course for 2007-13
1.1 Political context – Lisbon and Cohesion mutually supporting goals ? In March 2000, Europe’s Heads of State and Government launched an ambitious political initiative for the European Union (EU) to become “the most competitive, dynamic, knowledge-based economy1 by year 2010”. Known as the ‘Lisbon Strategy’, included a broad range of policies and regulatory measures to achieve this goal. Five years later, the 2005 ‘Spring Council’ of EU leaders concluded that all appropriate national and Community resources, including those of Cohesion Policy, should be mobilised in order to renew the basis of Europe’s competitiveness, increase its growth potential and its productivity and strengthen social cohesion, placing the main emphasis on knowledge, innovation and the optimisation of human capital. In short, while progress has been made in moving towards the goals of the Lisbon Strategy there remains a need to create ‘a new partnership for growth and jobs’2 In July 2005, the European’s Commission’s Strategic Guidelines for Cohesion3 set out a new framework for the development of the ‘National Strategic Reference Frameworks’ (NSRF) for 2007-13. The new Cohesion Policy is based on a co-ordinated effort to maximise the impact of public interventions (European, national and regional). In particular, Cohesion Policy must contribute to achieving the Lisbon Strategy objectives. Hence, “the strategic dimension of cohesion policy is strengthened to ensure that Community priorities are better integrated into national and regional development programmes”. In this context, this study contributes to the improvement in the strategic content and quality of programming by providing a synthetic appraisal of regional level gaps, needs and potential in the field of innovation and knowledge in the current 25 EU Member States (EU25), plus Bulgaria and Romania. The Guidelines outline several ways in which cohesion policy can make a difference including concentrating resources on “areas of high growth potential”, “drivers of growth and employment” (such as ICT infrastructure, research and innovation) and developing synergies and complementarities with other Community policies. Accordingly, this study takes into account trends and evolutions in national and regional policy mixes in favour of innovation and the knowledge economy and their
1 The knowledge–based economy describes trends in advanced economies towards greater dependence on knowledge, information and high skills levels, and the increasing need for ready access to all of these by the business and public sectors. OECD 2005, The Measurement of Scientific and Technological Activities: Guidelines for Collecting and Interpreting Innovation Data: Oslo Manual. 2 Communication to the Spring European Council (2005) “Working together for growth and jobs: A new start for the Lisbon Strategy”, COM(2005) 141. Available at: http://www.europa.eu.int/growthandjobs/key/index_en.htm. 3 Communication from the Commission (2005) “Cohesion Policy in Support of Growth and Jobs: Community Strategic Guidelines, 2007-2013”, COM(2005) 0299. Available at: http://www.europa.eu.int/comm/regional_policy/sources/docoffic/2007/osc/index_en.htm.

591 Synthesis report_final.doc 2
articulation with Community instruments, notably the RTD Framework Programme (FP) and the new Competitiveness and Innovation Programme (CIP), but also Community policies such as State Aid rules which influence possible options. While there will be more focus on the necessary conditions for growth (infrastructure, collective services, etc.) under the new Convergence Objective, both the Convergence and the Regional Competitiveness and employment objectives will be expected to focus increased resources on supporting innovation and the knowledge economy. Indeed, the new programmes for 2007-13 are expected to target their resources on three key priorities including “encouraging innovation, entrepreneurship and the growth of the knowledge economy. The second of the three key guidelines is entitled “Improve knowledge and innovation for growth” and includes four sub-priorities: • Increase and improve investment in RTD; • Facilitate innovation and promote entrepreneurship; • Promote the information society for all; and • Improve access to finance. The Guidelines and priorities derive from the experience of previous programming rounds. At the same time, the relevant ‘policy-mix’ for each country, and within each country specific regions, varies depending on their current innovation capacity and potential. This study provides insight into the most appropriate policy mix for a ‘typology’ of European regions based on their innovation potential. Innovation4 is an important factor in releasing the potential of the Lisbon agenda. The knowledge captured in new technologies and processes can drive growth and competitiveness and create new jobs. However, knowledge must be treated as part of a wider framework in which business grow and operate. Developing a knowledge-based economy requires adequate levels of investment in R&D, education, and ICT as well as creating a favourable environment for innovation. Less developed areas need particularly to confront this competitiveness challenge if they are to improve living standards and reduce economic and social disparities. Increasing competitiveness implies economic change through the introduction of new technologies and new methods of production as well as the development of new skills. Innovation is at the heart of this process. Technological and organisational change and new demand generated by rising income levels creates new economic opportunities and, therefore, contribute to the growth potential of these regions. Structural Funds (SFs) are the main Community instruments to promote economic and social cohesion. During the nineties and particularly since 2000 and the start of the current programming period, there has been a growing emphasis placed on how SF investments can enhance regional research and innovation potential, particularly in the less developed areas, and thereby foster knowledge based regional development strategies, as opposed to the more traditional infrastructure based development model.
4 Defined as the implementation of a new or significantly improved product (good or service), or process, a new marketing method, or a new organisations method in business practices, workplace organisation or external relations of an organisation.

591 Synthesis report_final.doc 3
1.2 Key issues addressed by this study The objective of this evaluation was to provide conclusions and recommendations for the future of SFs and Cohesion policy. The study contributes to an informed negotiation of the NSRFs and the preparation of future operational programmes (OPs) by addressing five key issues: • lessons from the past and current experience of innovation and knowledge
economy measures in the SFs, both in terms of priorities and strategic approaches; as well as in terms of operational implementation (see Chapter 2);
• an analysis of the current situation in the field of innovation and the knowledge-based economy at national and regional level. For the national level, performance is compared to the average performance for the EU25 plus Bulgaria and Romania; and at regional level to a typology of EU regions (see chapter 3);
• main needs and potential for innovation in the EU regions drawing on available studies, strategies and foresight studies (see chapter 3);
• the EU and national policies which are likely to influence investment priorities for the Structural Funds (chapter 4); and
• recommendations on main investment priorities for SFs for the 2007-13 programming period and their implications for regional development (chapter 5).
The Commission asked for evidence and insight into five key strategic questions: • How can regional policy contribute, through SFs, to raise the research and
innovation potential of the EU? • What is the best combination of measures to enhance the research capacities and
make an optimal use of existing potential? • What can be done to promote technology transfer and better cooperation between
universities, research centres and businesses, particularly SMEs? • What types of initiatives are likely to speed up the rate and scope of innovation in
the EU? • Are there any specific instruments, which could be mobilised to ensure easier
access to finance for innovative enterprises? The study was carried out over a 12 month period beginning in September 2005 at two levels: • At a European level, the study provided an analysis of indicators on regional
innovation performance and potential, collated and analysed data on the contribution of the SFs to innovation and knowledge and reviewed broad trends in the policy framework and governance structures. This work fed into the national and regional level analysis as well as providing an input into the synthesis report.
• At national level, 27 country reports (EU25 Member States plus Bulgaria and Romania) were produced based on desk-research and consultation with national and regional stakeholders. These reports form an important body of evidence for this report as well as providing more in-depth insight into the issues covered by the study for national and regional authorities and the Commission services.
The annex to this report provides a list of country reports, the experts involved as well as additional background elements concerning the methodology of the study.

591 Synthesis report_final.doc 4
2 Structural Funds interventions to boost innovation and create a knowledge economy: 2000-2006
This study is largely forward-looking, yet to make an informed set of proposals, a stock taking of what has been done previously is required. This avoids the risk of ‘reinventing the wheel’ or worse repeating errors already made. This section analyses the patterns of SF support for innovation and knowledge during the current programming period (2000-2006 for the EU15 and 2004-2006 for the new Member States, NMS). It does so from both a strategic point of view (the priorities of the SFs programmes) and at an operational level (absorption of funds, management of innovation measures, case studies of ‘good’ practice, etc.).
2.1 Structural Funds investment in innovation & knowledge: 2000-2006 During the period 2000-06, approximately 10,198 MEUR were allocated to RTDI initiatives5 through the SF, or roughly 5.5% of total resources6. Some 77% of this sum was devoted to Objective 1 zones, or an average planned spend of 4.9% on RTDI from total available EU funding. In Objective 2 zones, about 2,400 MEUR were devoted to RTDI, corresponding to 9.8% of total funds7. On average, Objective 1 and 2 programmes invested respectively, 92 MEUR and 29 MEUR on RTDI. In terms of programming structures, 166 programmes (82 Objective 1 and 84 Objective 2 programmes) across the EU25 concerned RTDI measures. Of this total, 144 were single-regional and 22 were multi-regional8. Regional programmes received 60% of total SF for RTDI (48% in Objective 1 and 99% in Objective 2). Multi-regional programmes are essentially found in Objective 1 (52% of total SF allocation and 21 programmes) and negligible in Objective 2 (only 1 programme). Seven countries (Czech Republic, Greece, Spain, Ireland, Italy, Portugal and Slovakia) adopted multiregional and regional programmes simultaneously.
5 These figures are based on an analysis of planned expenditure in all SF programmes during the 2000-2006 period using the following SF intervention codes (as defined by the European Commission): 181 Research projects based in universities and research institutes; 182 Innovation and technology transfers, establishment of networks and partnerships between businesses and/or research institutes; 183 RTDI Infrastructure; 184 Training for researchers. The definition encompasses measures that are entirely devoted to research and innovation promotion, therefore it is of relevance as a benchmark, since it avoids over-estimates and allows cross-regional as well as cross-country comparisons. 6 The Commission’s own estimates are somewhat higher standing at 7.4% of total ERDF expenditure for Objective 1 regions and 11% for Objective 2 areas (Cohesion Policy in Support of Growth and Jobs: Community Strategic Guidelines 2007-2013”, COM(2005) 299, 5.07.2005). This represents roughly 3% of the total EU budget, compared to 5-6% for FP6, and to a much smaller percentage for EU support programmes for innovation and the MAP financial instruments (support to venture capital and to guarantee funds). 7 Bulgaria and Romania were only for eligible pre-accession funds of which PHARE is potentially the most relevant instrument for innovation and knowledge. In Bulgaria, where the RTDI intervention takes place only at central level, PHARE funded two programmes dealing with the implementation of the National Innovation Strategy (approved in 2004). These two programmes will only start by the end of 2006. In Romania, there were no explicit PHARE measures geared towards RTDI, but PHARE resources supported participation of Romanian organisation to the EU‘s RTD Framework Programme. 8 For convenience, programmes covering an entire country are classified as multiregional, even if they concern single-region (NUTS2) Member States (e.g. Baltic countries).

591 Synthesis report_final.doc 5
However, 10 programmes accounted for 50% of the total planned resources, whilst the ten least important programmes represented only 0.1% of the total9. The concentration of RTDI funding in a limited number of regions is more notable in Objective 1 than in Objective 2 zones. The importance of RTDI investment also varies markedly across the EU25. Apart from Cyprus, all Member States devoted some part of SF spending to RTDI. This ranged in Objective 1 regions from 0.3% (Malta) to 15% (Belgian province of Hainaut) of total funds; and between 2.2% (Netherlands) and 29% (Spain) for Objective 2 zones. These figures tend to suggest that RTDI measures, particularly in Objective 1 zones where the bulk of money has been spent, have not been a central plank of EU regional policy interventions. This result cast doubts on the potential leverage effect of SF interventions with respect to the objectives of the Lisbon Strategy. One obvious hypothesis is that national policy and national innovation systems strongly influence the RTDI strategy in the SFs programmes. The following graph suggests that, indeed, the share of SF devoted to RTDI is related to the national intensity of investment as measured by gross expenditure on R&D (GERD)10. Exhibit 1: Relationship between SFs devoted to RTDI and GERD as % of GDP Note: data refer to the period 2000-2006 for EU15 and to the period 2004-2006 in the case of NMS Source: Ismeri Europa on the basis of EC and Eurostat data 9 The 10 OPs which devoted the largest amounts of resources to RTDI are: Investigación, Desarrollo e Innovación (multiregional, ES), Sachsen (D), Research (multiregional, IT), Ciência, Tecnologia, Inovação (multiregional, PT), Competitivity (multiregional, GR), Sachsen-Anhalt (D), Thuringen (D), Productive Sector (multiregional, IE), Brandenburg (D). Only one Objective 2 OP is among the top ten: Cataluña (ES), which is actually the fifth largest in the EU. 10 A similar relation holds when BERD is considered instead of total gross expenditure; this might underline the relevance of taking better account of private demand in RTDI strategies.
0,00
0,05
0,10
0,15
0,20
0,25
0,30
0,00 0,01 0,02 0,03 0,04
PT
GR
FI
IE
HU
EELT
SI
PLLV
AT
DE ob1
CZSKMT
NL
CY
DK
UK FR
SE
BE
EU25
DE ob2
ES ob1
ES ob2
IT ob2
ITob1 GERD/GDP
RT
DI S
F/tota
l S
F
LU
0,00
0,05
0,10
0,15
0,20
0,25
0,30
0,00 0,01 0,02 0,03 0,04
P T
G R
F I
I E
H U
E EL T
S I
P LL V
A T
D E o b 1
C ZS K
M T
N L
C Y
D K
U KF R
S E
B E
EU25
DE ob2
ES ob1
ES ob2
IT ob2
ITob1 GERD/GDP
RT
DI S
F/tota
l S
F
LU

591 Synthesis report_final.doc 6
Map 1: Percentage of SFs devoted to Regional RTDI

591 Synthesis report_final.doc 7
However, in absolute terms the SF do appear to be an important contributor to national R&D efforts notably in Objective 1 regions and this may contribute over time to a convergence of GERD in Europe. On an annual basis, SFs resources devoted to RTDI account for between 5% to over 18% of GERD in Objective 1 countries11. In addition, if the national public and private co-financing is considered, the weight of SF interventions in GERD reaches about 40-50% for these countries. This leverage effect of SF is also clear in the more advanced countries with Objective 1 zones: SF devoted to RTDI in Italian, Spanish and German Objective 1 zones12 account for respectively 47%, 70% and 42% of the GERD in the regions concerned. Amongst the Objective 1 territories characterised by a high SF RTDI/GERD ratio are medium to large countries from both the EU15 (Greece, Portugal, and Spain) and the NMS (Hungary and Poland). In short, EU regional funds provide an important, and even decisive, financial boost to RTDI expenditure in a majority of the EU25. To further examine the relative weight of SF RTDI spending, a split is made between: • Countries principally concerned by Objectives 1 and 2, for obvious strategic
reasons and because of substantial differences in the scale of intervention; and • “old” Objective 1 zones (EU15 countries receiving the bulk of resources) and
“new” Objective 1 zones (mainly in central and eastern Europe). This is justified by different strategic approaches and needs of these countries.
Exhibit 2: Weight of SF and effort of EU25 in allocating resources to RTDI Source: Ismeri Europa on the basis of DG REGIO data. 11 18.5% in Lithuania, 15.5% in Latvia, 12.7% in Estonia, 12% in Portugal, 7.8% in Hungary, 7.4% in Greece, 6.2% in Poland, 5.6% in Spain. 12 It is worth recalling that these countries account for about 54% of total Objective 1 resources.
0
50
100
150
200
250
300
0 0,5 1 1,5 2 2,5
•Above average weight of SF
•Above average RTDI effort (! per person)
PT
GR
FI
IE
HUEE
LTSI PL LV
AT
DE ob1
LU
CZ SKMTNL
CY
DK
UK
FR
SE
BE
EU25 Average
WEIGHT = totalSF /GDP
DE ob2
ES ob2
IT ob2
ITob1
•Above average weight of SF
•Below average RTDI effort (! per person)
ES ob1
EF
FO
RT
=
RT
DI
SF
pe
r p
ers
on

591 Synthesis report_final.doc 8
As illustrated in the above exhibit, the “new” Objective 1 countries, located in the southeast quadrant, allocated a below average share of resources to RTDI. In contrast, the four older ‘Cohesion’ Objective 1 countries (Greece, Ireland, Spain and Portugal) received substantial Community resources compared to their GDP and managed to devote significant shares to RTDI. Several of the more developed countries, receiving mostly Objective 2 resources devoted below average share of SF resources to RTDI (including Cyprus, France, the Netherlands, Italy, Luxembourg and the UK). Again, on a purely numerical basis, this could suggest that the SF investments in RTDI are contributing to a ‘catching up’ or ‘convergence’ effect at least in the original cohesion countries.
2.2 What was the strategic focus of innovation & knowledge measures? In order to undertake a more depth analysis of the orientation of the SF support, all identified RTDI measures were categorised with respect to a set of innovation and knowledge policy areas. The exhibit on the next page provides an explanation of this categorisation, which is used throughout the rest of this report. A wide range of interventions but a limited focus on support to clusters and poles The categorisation was used to examine the initiatives funded with Community support13 with the result that four of the six policy areas monopolised 90% of total SF expenditure on RTDI. Measures in favour of boosting applied research, which includes investment in R&D infrastructure in universities as well as direct subsidies to enterprises, amount for close to 30% of total SF RTDI allocations. The second most important type of action also includes a mix of ‘supply side’ (investment in technology centres, etc.) and demand side measures (support for integrating new technologies in enterprises, etc.). Exhibit 3: Financial weight of types of RTDI measures financed, 2000-06
As a percentage of all planned SF RTDI expenditure Source : Country reports of this study, calculation ISMERI Europa.
13 The following data on policy areas are based on rough estimates from the national reports of this study, and provide an indicative picture of strategic preferences.

591 Synthesis report_final.doc 9
Exhibit 4: Categorisation of innovation & knowledge policies Policy area Short description
Improving governance capacities for innovation and knowledge policies
Technical assistance type funding used by public authorities, regional agencies and public-private partnerships in developing and improving policies and strategies in support of innovation and knowledge. This could include past ERDF innovative action programmes as well as support for instance for regional foresight, etc.
Innovation friendly environment
This category covers a range of actions which seek to improve the overall environment in which enterprises innovate, and notably three sub groups: innovation financing (in terms of establishing financial engineering
schemes, etc.); regulatory improvements and innovative approaches to public services and
procurement (this category could notably capture certain e-government investments related to provision of services to enterprises);
Developing human capital for the knowledge economy. This category covers projects in higher education aimed at developing industry orientated courses and post-graduate courses; training of researchers in enterprises or research centres14;
Knowledge transfer and technology diffusion to enterprises
Direct or indirect support for knowledge and technology transfer: direct support: aid scheme for utilising technology-related services or for
implementing technology transfer projects, notably environmentally friendly technologies and ITC;
indirect support: delivered through funding of infrastructure and services of technology parks, innovation centres, university liaison and transfer offices, etc.
Innovation poles and clusters
Direct or indirect support for creation of poles (involving public and non-profit organisations as well as enterprises) and clusters of companies direct support: funding for enterprise level cluster activities, etc. indirect support through funding for regrouping R&D infrastructure
in poles, infrastructure for clusters, etc.
Support to creation and growth of innovative enterprises
Direct or indirect support for creation and growth of innovative firms: direct support: specific financial schemes for spin-offs and
innovative start-ups, grants to SMEs related to improving innovation management, marketing, industrial design, etc.;
indirect support through funding of incubators, training related to entrepreneurship, etc.
Boosting applied research and product development
Funding of “Pre-competitive development” and “Industrial research” projects and related infrastructure. Policy instruments include: aid schemes for single beneficiary or groups of beneficiaries
(including IPR protection and exploitation); research infrastructures for non-profit/public organisations and
higher education sector directly related to universities.
14 This is part of the wider area of in-house training, but in the present study only the interventions targeted to researchers or research functions will be analysed.

591 Synthesis report_final.doc 10
Support for a more innovation friendly ‘environment’ (including financial engineering and training of scientists and engineers, etc.) accounts for 20%; while support for creating innovative enterprises received on average 17% of funds. Despite clear evidence in the country reports of the need to improve capacity for strategic policy making (including coordination between national and regional levels) efforts in this direction remain limited. However, it should be kept in mind that these activities are “softer” measures requiring fewer resources than infrastructure-oriented initiatives, hence 8% of the total seems reasonable. More surprising is the limited investment in innovation poles and clusters, which mobilise only 2% of total Community funding for RTDI. This may be explained by the relatively recent increase of policy interest in this topic. Moreover, the ‘multi-actor-multi-measure’ type nature of such interventions requires sophisticated policy making and implementation capacities as well as a culture of co-operation and partnership within regional innovation systems. In order to examine whether there are geographical differences in spending patterns, the following exhibit provides an overview of the types of measures supported in selected countries representing the “old” and “new” Objective 1 areas as well as in Objective 2 zones15. Exhibit 5: Distribution of resources between policy areas by type of zone
0%
5%
10%
15%
20%
25%
30%
35%
40%
45%
Improving gov Innov. Friendly KT&TD Innov.
Poles&clusters
Support to creation
and growth
Boosting applied
research
proxy "old obj.1" (IT+GR+IE) proxy obj.2 (FR+UK+DK) proxy "new obj.1" (EE+HU+LV+LT+PL+SI)
Source: Ismeri Europa on the basis of the country reports for this study. In the Objective 2 proxy (e.g. France, United Kingdom, Denmark), funds have been used to implement intervention dealing chiefly with support to creation and growth of innovative enterprises (34%), knowledge transfer and technology diffusion (29%) and boosting applied research (19%). This is significantly different from the average.
15 The available information, extrapolated from national reports, does not allow a clear-cut distribution of policy area priorities across objectives. However, in order to provide a picture of the current situation some proxies were used for Objective 1 and 2. Results must be considered carefully since in some country reports, no clear information was available with respect to policy areas. Moreover, some other countries (e.g. ES and DE) receive substantial resources, both in Objective 1 and 2 zones, therefore it is not possible to assign them unequivocally to one proxy group.

591 Synthesis report_final.doc 11
Quite a different picture emerges when considering the countries that received the bulk of Objective 1 resources. In their case, innovation friendly environment (including financial engineering measures) is the most important policy area, followed by applied research and technology transfer. Improving governance, an area, which is not addressed at all in the Objective 2 proxy, receives less than 5% of allocated money in the Objective 1 proxy zones. Support to creation and growth of innovative enterprises is surprisingly weak in old Objective 1 zones (perhaps due to an existing prevalence of smaller family run companies), while it is important in the new Objective 1 zones, which face strong problems of re-converting an outdated economic structure previously dominated by large industrial concerns. The new Objective 1 countries also made a more intensive use of innovation poles and clusters, perhaps due to the later launch of programmes, which only began in 2004. On the basis of the country reports, it is possible to conclude that in notably the older Objective 1 zones, the measures funded remain more traditional than in Objective 2 zones. Within Objective 1 and in NMS, RTDI measures concern mainly infrastructures and investments in machine-embodied technology.
2.3 How were SF RTDI measures designed and managed? One explanation for differences in strategic focus across countries and regions may lie in the potential for a differentiated policy making due to either constitutional decentralisation of power over innovation policy to regional authorities (see also chapter 4) or the emergence over time of regional partnerships able to develop and steer an innovation strategy.
2.3.1 Subsidiarity, regional strategies and programming approaches In a Europe increasingly characterised by decentralisation of powers from the nation state to the regional level, preferences regarding the use of a regional versus multi-regional programming approach are related to two key factors: • the existence of a developed and
decentralised innovation system; and • the amount of resources available for
specific regions to target towards ‘innovative’ enterprises or organisations.
Such factors help to explain why a multi-regional (national OP) approach is preferred in Member States receiving mostly Objective 1 funds, whilst a regional approach is preferred in mainly Objective 2 countries. In the former case, the multiregional programmes overcome a problem of lack of competition (or to put it another way of quality projects) for available resources, since in some less developed or peripheral regions, the number of innovative organisations is limited and
Box 1: ‘Peaks in the delta’ versus ‘plugging the gaps’! During 2000-2006, the Netherlands adopted a somewhat different approach from most Objective 2 Member States, with an orientation towards RTDI policy labelled ‘peaks in the delta’, or strengthening the ‘hotspots’ of research and innovation. The country report points out that this has resulted in the Dutch SPDs investing in regional strengths and ignoring the weaknesses of regional innovation systems. An opposite approach is adopted, in Finland, where SF interventions have been used to complement the existing national policy measures and provide a financial instrument for those regions that have fewer capabilities to make use of national funding. Source: Country reports for the Netherlands and Finland.

591 Synthesis report_final.doc 12
they are not always adequately equipped for carrying out ambitious projects. Moreover, this approach may facilitate trans-regional cooperation and concentration of financial effort on a limited number of priorities. In addition to the Cohesion countries (Greece, Ireland, Spain and Portugal), most of the NMS, eligible for Objective 1, adopted a multiregional (national) approach to RTDI policy funded by the SF, due either to size (e.g. Estonia, Latvia, Lithuania) and/or due to the need to acquire know-how in policies they were not experienced in managing to (e.g. Hungary, Poland, Slovakia). In the latter case (Objective 2), the existence of a more structured innovation system and a generally stronger national (or regional) RTDI policy framework makes it easier on paper to implement more targeted regional programmes. All Objective 2 countries used a regional approach with the exception of one ‘multi-regional’ programme in the Netherlands covering all of the “Urban Areas”. However, contrary to the hypothesis above that this would allow support of complementary actions within an already more sophisticated regional innovation system, zoning has tended to result in a fragmented strategic approach to Objective 2 programming of RTDI measures. In operational terms, it limited the participation of relevant knowledge organisations (private and public) from outside the zone resulting in a reduced potential financial sustainability.
2.3.2 Operational management of RTDI measures The table on the following page sums up the appraisal of management and co-ordination of RTDI measures derived from the country reports for this study: • The first column recalls the nature of
the programming structure. • The second column identifies which
types of organisations are primarily responsible for RTDI measures.
• The third column considers the strength of public-private partnerships related to RTDI measures; and
• The fourth column appraises the effectiveness of policy co-ordination (both vertically between the national and regional authorities and horizontally across policy fields related to innovation).
Box 2: managing RTDI measures in Denmark In Denmark, the SF-funded RTDI interventions are channelled through the business-oriented MEBA (Ministry of Economy and Business Affairs) handling innovation and knowledge policies and the NAEC (National Agency for Enterprise and Construction). At regional level, Regional Growth Fora based on local and regional partnerships of leading actors will be soon the counterpart of national bodies. Strong points are: business expertise and orientation, local/regional partnerships that have been supported through SF (and have proved effective instruments), and the future Fora. Source: Country Report Denmark.

591 Synthesis report_final.doc 13
Exhibit 6: Summary of SF programme management for RTDI
Programming authorities (ERDF)
Bodies managing RTDI measures
Public-private Partnership
Policy Co-ordination
Regional Multi-regional Both
Specific agency Govt. Dept(s) SF ‘secretariat’
Strong Emerging Weak
Good Improvable Poor
Austria Belgium Cyprus Czech Republic Denmark Estonia Finland France Germany Greece Hungary Ireland Italy Latvia Lithuania Luxembourg Malta Netherlands Poland Portugal Slovakia Slovenia Spain Sweden UK Source: Country reports for this study, analysis Technopolis. Managing RTDI measures requires a good deal of domain knowledge and experience of running increasingly complex ‘multi-actor, multi-measure’ programmes (e.g. an innovation pole brings together a range of actors from university research teams, to enterprises to financial or technology advisors; and it may involve a range of types of measures from infrastructure investment to support for collaborative industrial research). In the context of Structural Fund programming the financial management and control is usually carried out by a management authority responsible for an entire programme, while the ‘the implementation agency’ for specific RTDI measures may be a more specialised body.

591 Synthesis report_final.doc 14
Box 3: Finland: regional coordination of Structural Fund support In Finland, the regional TE-Centres, which are responsible for many regional activities of the Ministries of Labour, Trade & Industry, and Environment, have an important role in managing SF-funded interventions. They act in relation with the Regional Management Committees, which were created to coordinate the key actors: regional actors, municipalities, State authorities, and social and economic interest groups. The coordination of RTDI at national and regional level is ensured through four-year regional strategies adopted by Regional Councils, and these strategies have to be coherent with the national framework. Co-funding of SF-funded RTDI interventions is financed by agencies (TE-Centres, TEKES, Finnvera), which use SF along the national guidelines. Strong points are: coherence between national and regional levels, good integration of SF with national RTDI guidelines, high level of expertise through specialised agencies, and strong partnerships at regional/local level. Source: Country Report, Finland.
According to the country reports, operational implementation of RTDI measures tends to be dominated by government departments (either national or regional level) usually responsible for economy or industry & trade; while Ministries of Education and Research are less involved. Programmes are often run by a tandem of a ministry (or regional government department) and a specific agency or Structural Fund management ‘secretariat’ (sometimes in the form of non-profit companies as in Greece for the Information Society programme or as in Scotland in the form of Programme Management Executives). These specialised structures, often based on wide-ranging partnerships (as in, Denmark, Germany or Scotland) of all key actors in a region offer the advantage of creating a one-stop shop for funding applications. However, the involvement of more specialised national or regional agencies dedicated to supporting innovation and technology is then limited to being one actor amongst many and not as a lead agency (e.g. the case of OSEO in France, IWT in Flanders or Tekes in Finland). In the current Objective 2 programmes, Structural Fund support for RTDI has tended to become a parallel and relatively marginal ‘side-show’ to existing RTDI measures supported by the more specialised ‘innovation agencies’. This leads to the risk of fragmentation, reinventing the wheel, sub-critical interventions, etc. This is the case in Flanders (Belgium), for instance, where the additionality of RTDI measures supported under the Structural Funds is at best doubtful. At the same time, centralising all support for RTDI through national agencies does not necessarily provide an optimal solution to the diversity of regional innovation needs. In France, for instance, a group of measures have been delegated to the national innovation agency OSEO (ex-ANVAR) through a global grant, which OSEO re-distributes through its regional offices. While in managerial terms efficient, this process reinforces the ‘identikit’ aspect of French SPDs. However, more recently, the French State has accepted to attribute global grants to a few Regional Innovation Agencies created by regional authorities, and this may prove to be a positive trend towards more regional specialisation in coming years.

591 Synthesis report_final.doc 15
In the Objective 1 zones, management issues are somewhat different, as in the EU15 cohesion countries, SF support essentially provides the foundation for national intervention. In this case, specialised government departments often struggle to implement more sophisticated measures in the context of a national programme management structure better designed for more traditional infrastructure or subsidy measures. Greece is a good example of this situation. The General Secretariat for Science and Technology (GSRT), which has a long experience and a good track record, retains a major role in designing and managing SF-funded RTDI interventions. However, a management authority established to implement the OP, and staffed by civil servants and experts from the private sector, proved not have the capacity nor the experience to plan RTDI measures. At the same time, the dominant position of the GSRT means that capacity of the regional authorities to implement RTDI measures has not improved significantly. The proposed creation of five new ‘super’ regional OPs in 2007-13 risks to perpetuate this since the management structures will be inevitably separated from the 13 regional administrations. Public-private partnerships and innovation strategies Public-private partnerships in the field of RTDI are considered weak in almost half of the EU25 and strong in only seven Member States (Austria, Denmark, Finland, Germany, the Netherlands, Sweden and the UK). PPP can be a key mechanism for developing ‘soft’ demand oriented innovation support and making infrastructure investments really useful for both business and the research community R&D. Within the mainstream programmes, some countries have taken effective steps in this direction. In the UK, while the management and coordination of SF is relatively complex due to the highly devolved nature of the governance structure, programme design and implementation involves a large number of public-private partnerships. In this respect, a recent study on SF interventions has found that a partnership-based approach offers a more integrated and systematic understanding of regional priorities. In Denmark, the Objective 2 programme has funded many partnership-based organisations oriented toward innovation and knowledge, and the mid-term evaluation concluded that they were effective and efficient instruments for supporting regional development). In the Netherlands, the implementation of SF measures has contributed to the diversity and enrichment of the innovation system with new networks and partnerships being initiated in a complementary fashion to already existing organisations and leading to increased influence of provincial governments. Previous evaluations and studies have underlined the role of a partnership-based development of RIS (regional innovation strategies) as a mechanism for improving the design and delivery of SF RTDI measures. During the current period, the regional programmes of innovative actions (RPIA) have continued to offer support to implementation of regional strategies in the fields of innovation, information society and sustainable development. The jury is still out on whether the RPIA, which were ‘mainstreamed’ within the traditional programming structures, have maintained the same level of ‘institutional’ innovation as the earlier RIS projects during 1994-1999.

591 Synthesis report_final.doc 16
In the NMS, the experience of the regional strategy exercises (RIS-NAC funded by the EU’s Innovation Programme) is generally considered as positive (e.g. in Estonia, Malta and Poland). They have contributed to fostering partnerships and to raising awareness of regional innovation governance, however, it is too early to assess their full impact. In the EU15, the situation is more diverse. Among ‘old’ Objective 1 regions, certain Greek and Spanish regions have been able to build on the RIS exercises, such as Thessaly, Central Macedonia, and Crete in Greece; or Castilla y León and Andalucía in Spain. However, the process has often been a long-term one with several steps (e.g. a first RITTS in Thessaly in 1995 was followed by a RIS, a RIS+ and then a RPIA; Castilla y León was one of the pioneers of the Regional Technology Plans before undertaking a RIS). As might be expected, Finland and Sweden have good practice examples in this area such as the Multipolis Network born out of the RIS Northern Finland-Northern Sweden. At the opposite extreme, while most Italian regions have engaged in RIS type exercise, the operational outcome is limited in a majority of them. In some cases such exercises offer a first opportunity for less strong regional structures to become involved in innovation, this is the case of the regional consultative commissions and the RPIA in Portugal. Policy coordination: a crucial weakness In the vast majority of Member States much more could be done to improve policy coordination. In only a handful of countries is policy coordination (between national and regional authorities or between national policy makers and agencies in specific fields, or both) not considered a serious problem for developing a credible innovation policy and, de facto, implementing SF RTDI measures. The Dutch report and to some extent the Swedish and UK reports are the only ones where the authors do not place improved co-ordination at the top of their priorities. The issue of policy coordination is returned to in chapter 4 of this report.

591 Synthesis report_final.doc 17
2.4 How well were funds for innovation & knowledge absorbed ? Spending available funds is not per se a guarantee that a programme or measure will result in the scale or type of impact initially expected. It is, however, one indication that a programme has been efficiently managed or that no institutional bottlenecks arose during programme implementation. By January 2006, the rate of expenditure of SFs committed to innovation and knowledge in Objective 1 and Objective zones of the EU25 was 48.5%. This is a slightly better performance than the total absorption rate (47.6%) or all types of interventions.
Exhibit 7: Correlation between expenditure for RTDI measures & total SFs
Source: Ismeri Europa on the basis of EC data. As illustrated above, the capacity to absorb RTDI funds is correlated with total expenditure capacity16. The best performing countries in terms of total disbursed resources are also the most able to absorb funds allocated to RTDI measures. Countries located beneath the regression line (Estonia, Greece, Italy and Portugal) had slightly more difficulties to spend money on RTDI compared to other kind of initiatives. In Objective 1 zones, only six cases out of 22 have higher RTDI absorption than total SFs capacity (i.e. Belgium, Poland, Spain, United Kingdom and especially Sweden). NMS are grouped around the lowest levels of absorption, essentially because they started their programmes only in 2004. However, for these countries, However, in some countries, the differences are more marked: Polish expenditure on RTDI was
16 All the countries are located close to the regression line, the slope of which is close to 45 degrees, (Spearman Index =0.97).

591 Synthesis report_final.doc 18
two times better than its average for all SF interventions while Estonia had spent only 1% on RTDI in comparison to a total absorption rate of 12%. In Objective 2 zones, RTDI measures have absorbed funds better than the average for all SF programmes. The situation is nevertheless differentiated: Sweden, United Kingdom, the Netherlands and Luxembourg perform better in RTDI while other countries (e.g. Austria, Denmark and Italy) are characterised by worse innovation and knowledge expenditure performance rates. Average absorption rates for the EU25 do not vary substantially between the different types of intervention, using the Commission’s classification (see exhibit).
Exhibit 8: Absorption of SF for RTDI by field of intervention (disbursed resources as % of allocated, ordered by total absorption)
RTDI (in general)*
Research projects at
universities & research institutes
Innovation and technology
transfer, networks & partnerships
between businesses and/or research institutes
RTDI Infrastructure
Training for researchers TOTAL
Sweden 70,7 - 69,8 - - 70,6 Ireland - 63,8 53,2 - - 60,8 Spain 47,7 62,7 58,3 60,4 - 59,7 Luxembourg - 16,2 12,9 70,5 - 55,7 United Kingdom 56,6 47,4 56,8 59,5 - 55,6 Belgium - 41,9 54,6 49,3 - 52,2 Germany - 47,4 53,5 52,9 - 51,7 Finland - 48,4 53,7 48,5 - 51,7 Austria - 49,0 53,5 35,2 - 50,7 The Netherlands - 41,7 52,4 45,8 - 50,1 EU -Average 51,1 52,7 45,8 45,6 60,0 48,5 France 56,0 47,5 50,2 31,7 44,0 48,4 Denmark 46,3 - - - - 46,3 Portugal 43,3 42,7 30,4 12,3 73,7 45,3 Italy 53,1 5,5 37,1 32,4 - 34,9 Greece 1,2 43,2 25,7 11,3 25,0 27,5 Slovenia 7,8 - - - - 7,8 Poland - 0,0 0,0 8,1 - 5,6 Slovakia - 8,0 2,0 - - 3,2 Hungary - 0,0 0,7 5,6 - 3,1 Estonia - 1,8 1,8 1,8 1,8 1,8 Lithuania - 0,1 2,5 1,7 0,1 1,6 Malta - 2,1 0,0 - - 1,5 Czech Republic 0,0 0,0 0,2 0,0 - 0,1 Latvia - 0,0 - 0,0 - 0,0 Cyprus - - - - - - * Note: not possible to attribute to a specific code Source: Ismeri Europa on the basis of European Commission, DG REGIO data.

591 Synthesis report_final.doc 19
Training for researchers, which accounts for a marginal 3% of total resources, was the most dynamic field of intervention in Objective 1 countries but absorbed less than average in Objective 2 zones. Research projects based in universities and research institutes had the next best performance. Measures aimed at innovation and technology transfer as well as RTDI infrastructures absorbed slightly less than average in both Objective 1 and 2 countries. Overall, the absorption performance of RTDI infrastructure measures is lowest, a probable explanation being the “time consuming” nature of planning and implementing such projects. On the other hand, a prevalence of supply-oriented measures, which pay little attention to the real requirements of small firms, may explain the weak performance of technology transfer measures. Among EU15, Portuguese, Greek and French Objective 1 regions show the lowest absorption with respect to RTDI infrastructures, in comparison with other interventions while Italy’s performance is extremely poor with respect to research projects based in universities and research institutes. In EU15 countries characterised by coexistence of multiregional and regional programmes, absorption capacity of RTDI measures implemented, as part of multiregional OPs is significantly higher than regional programmes. Spain is the only exception to this rule. Reasons for lower regional absorption vary between Member States. Limited competence of local administration is certainly one of the most important constraints. In the Italian case, access to Community support was subject to approval of RIS17. This promoted more focused regional approaches, but often delayed the execution of regional RTDI measures.
2.5 What factors impinged on the effectiveness RTDI measures ? A cross-cutting analysis of the country reports for this study highlights four main bottlenecks to the efficient absorption of funds and effective outcomes of SF RTDI measures: • An administrative rather than strategic management of RTDI measures leading to
a lack of synergies with other initiatives, etc.; • Lack of expertise at national and regional levels in managing RTDI measures; • A continuing dominance of supply-side measures with poor linkages to regional
innovation systems • Limited interest for many ‘softer’ ‘demand-side’ measures aimed directly
enterprises, partly due to internal capabilities of enterprises, partly due to over-burdensome bureaucratic procedures
Administrative versus strategic management of RTDI measures A majority of national reports underline that implementation bodies pay more attention on technical or procedural aspects than on whether measures and projects being implemented are likely to combine to achieve stated strategic objectives. This concerns all typologies of regions (“old” Objective 1 such as in Spain and Italy, “new” Objective 1 such as Slovakia, and Objective 2 such as in France and Sweden).
17 The European Commission requested this exercise in order to better define regional strategies and clarify division of responsibilities between regional and national authorities.

591 Synthesis report_final.doc 20
This problem is compounded, in a number of countries, by mid-term evaluations (MTE) for the 2000-2006 period that have not produced ‘strategic’ results contributing to significantly improved management of SF-funded RTDI interventions. MTE often privileged a financial perspective or basic quantitative outputs, without really taking into account the qualitative impacts of measures on regional development. Such shortcomings have been particularly underlined in France and Portugal. This administrative rather than strategic approach to the management of RTDI measures derives from two problems, the first is the weakness of innovation partnerships (notably the capacity of public administrations to interact with other players in the innovation system) outlined in the previous section. A second is related to the prevalence of ‘bottom-up’, project driven approaches where at best strategic synergies happen as part of the individual strategies of participating organisations. The result is a ‘bottom-up exploitation’ of Structural Fund measures in the absence of strategic prioritisation. The Austrian report warns of missed opportunities from failing to adopt a broad view of strategic options and of the risk that programme management is driven to respond to high ‘demand’ for more traditional measures and avoid more innovative actions for fear of lower absorption. A similar lack of a strategic policy approach is evident in Slovenia. Similarly, in Italy, and in particular in Objective 1 regions, there is no strategic vision of how SF interventions can be integrated in a long-term vision of an RTDI policy, and despite a pre-condition to undertake a RIS the planning capacity is weak. In Sweden, while a range of Objective 1 and Objective 2 measures directly or indirectly focus on innovation and knowledge, there is no overall management of such interventions and they remain fragmented and weakly linked to national policies. A more administrative approach also generates difficulties in terms of risk aversion with respect to more innovative projects (Estonia, France) or projects with a high potential social impact (e.g. in Germany) that require additional complementary actions to manage eventual short-term negative effects of introducing innovations. Another effect is that in certain cases there are difficulties with mobilising co-financing (Germany, Greece) due to the absence of involvement of private financial or regional public organisations at initial strategic planning. The common characteristic of countries where strategic management is strong (Denmark, Finland and to some extent the Netherlands and the UK) is that the implementation of RTDI measures is the responsibility of specialised government departments or agencies, supported by a representative partnership. Lack of expertise in managing innovation and knowledge measures A second recurring difficulty identified in the country reports is the limited expertise in the field of innovation and knowledge of many officials responsible for SF management. Lack of expertise was emphasised as being a problem at both national as well as at regional level, and in EU15 countries (France, Greece, Sweden, etc.) as well as in NMS. In NMS, it is often related to a general lack of administrative capacities, which is particularly striking in the field of innovation and knowledge.

591 Synthesis report_final.doc 21
It is generally accompanied by a poor knowledge of other relevant EU programmes, as the Framework Programmes for Research and Development (FPs) and the Multi-annual Programme for Enterprise and Entrepreneurship (MAP 2001-2006) / Competitiveness and Innovation Programme, and European Investment Bank18 (EIB, and notably the European Investment Fund, EIF) funding opportunities. This leads to the risk of an ineffective and inefficient combination of different Community instruments or programmes at regional level, as recommended by the Commission for the coming period. This lack of know-how is evident in specific fields in some countries (e.g. lack of capacity to develop financial engineering schemes is mentioned in France and Portugal), or is more problematic at regional level in general (Greece, Poland) or in specific regions up to now not so involved in Structural Funds or innovation policy (e.g. the urban Randstad area in the Netherlands is signalled out). The weak knowledge about programme or project design extends to certain research, higher education or intermediary structures, highlighted for instance in Slovenia. Continuing dominance of a ‘supply’ culture In many countries, SF RTDI interventions remain supply-oriented. A number of reports underline that there is a real danger of implementing RTDI measures detached from the regional reality, e.g. in the form of science & technology parks or incubator or research facilities built without the accompanying environment of services bridging the gap between research and industry (in particular small firms). Spain, Portugal, and more recently Latvia, Poland, Slovakia, and other NMS have developed ambitious programmes of RTDI infrastructure. Politically, it is often more appealing to use SF for ‘bricks and mortars’ even if absorption capacity is not necessarily higher for RTDI infrastructure (see above). Even in more advanced countries such as the Netherlands, the country reports note a preference for infrastructure compounded by slow starts during the current period for more complex ‘innovative’ measures aimed at networking of companies and research organisations. The intervention logic is a supply-push one namely that such infrastructure will provide enterprises, and in particular small firms, access to knowledge available in universities and research organisations. This is exemplified in countries such as Germany (with a multiplication of investments in a myriad of technology centres in the past in Objective 2 zones and currently in Objective 1) and Belgium, France or Italy, where the Structural Funds have also ‘helped’ to create an over complex and unsustainable myriad of regional innovation intermediaries. The lack of attention to creating capabilities or demand in enterprises which are the target of these infrastructure and technology transfer initiatives may explain why support for “technology transfer” has not borne fruit compared to the number of organisations and the amount of funding dedicated to it. In contrast, Austria and the UK are amongst the countries are concentrating more on stimulating demand for business and technology related services from business sector.
18 www.eib.org

591 Synthesis report_final.doc 22
Limited interest for many ‘softer’ ‘demand-side’ measures The final wide-ranging observation of the country reports was the paradoxal difficulty to mobilise enterprises to become involved in more innovative measures, which on paper respond to specific needs related to innovation activities. One aspect of this problem is that direct financial support for innovation, collaborative R&D, and ‘softer’ measures (such as clusters, strategic intelligence, etc.) only tends to mobilise and involve ‘already innovative’ enterprises (Belgium, Denmark). This is true for many Objective 1 regions, the productive fabric of which is made of small, family run firms not accustomed to innovating. The danger is that policy makers opt for the ‘easy solution’ of providing grants for equipment upgrading under the heading ‘innovation and technology’ which while improving productivity in the short-run does not necessarily generate a more profound re-structuring of the economic base. In this respect, the Cypriot report underlines that the measures proposed sustain “the small firm with limited innovative activity” model already in place. The same criticism is levelled at Italian Objective 1 measures. In the NMS, the novelty of RTDI policy (most countries had very limited funding schemes in place before 2004) is compounded by low demand for the more innovative measures, in particular aid schemes geared towards the private sector. The Estonian R&D financing scheme example does suggest however, that enterprises do move to make use of schemes after an initial ‘learning’ lag. However, low absorption rates of the more demand-focused measures can also be due to limited capacity elsewhere in the innovation system such as in higher education institutes (HEIs) and R&D organisations (e.g. Lithuania, Slovenia). Even in some EU15 countries, there are difficulties. In Sweden for instance, the efforts required to complete an application and build a proposal lead SMEs to look elsewhere for more user-friendly instruments. In France and Germany, universities often lack the capacity to elaborate proposals and handling projects. In the UK, the argument was even advanced that in certain cases support measures had reached saturation point in terms of companies likely to participate and that funds may need to be re-channelled to other fields of SF intervention. The lack of demand for many more innovative soft measures targeting enterprises is compounded by an almost universal complaint about complicated procedures for enterprises seeking funding. This is especially true in Objective 2 regions, where demand is potentially higher. While this is not of course specific to the management of SF RTDI measures, it has consequences on the use of SF by higher education, research organisations, and small firms. In Poland for instance, restrictive rules of public procurement, the fact that the smallest changes require a ministerial decree, the high costs involved in the preparation of applications, etc. are serious bottlenecks. In Portugal, there have been soft changes in programmes, generating confusion among beneficiaries and entailing the closure of some measures. In Sweden, grant recipients frequently complain that administrative controls are over-zealous. Only, Finland appears to stand out as an example of a country where bureaucracy in the management of SF is less of a problem.

591 Synthesis report_final.doc 23
2.6 Did the Structural Funds improve regional innovation potential ?
As noted above, RTDI policy has not been at the top of the cohesion agenda and the contribution of SF to RTDI has not been homogeneous across the EU25. Indeed, it is strongly dependent on national and regional institutional capacity and local demand. However, from the country reports19, it is possible to identify specific cases in which the SFs have helped to improve regional innovation potential20. The following sections outline the way in which the Structural Funds have contributed to improving innovation potential in each of the three main types of Structural Funds’ zones.
2.6.1 Structural Funds and innovation in the ‘old’ Objective 1 regions
“Old” Objective 1 regions: successes and failures in the process of developing an innovation system. In “old” Objective 1 regions, SFs represent a crucial, if not unique, resource for supporting national and regional RTDI policies. From this point of view, the ‘strategic’ additionality of SF has been very high.
Exhibit 9: Strengths & weaknesses of RTDI measures in 'old' Objective 1 zones Strengths Weaknesses
• Strong financial and strategic additionality: without the EU support regional or national RTDI policy would be negligible;
• Impulse for an improvement of regional governance and strategic approaches to RTDI
• Diffusion of RTDI infrastructures, agencies and parks for regional innovation systems
• Creation of some relevant RTDI poles (Crete, Naples etc.) and reinforcement of universities and research institutions
• Support to key R&D centres, mainly in the capital cities
• Insufficient capacity in developing and/or matching local demand of innovation
• Inadequate strategies (i.e. prevalence of supply-oriented interventions, under-utilised grant schemes, barely utilised technology transfer facilities, too complex networking actions) and inefficiencies in the regional innovation systems
• Small improvements in RTDI regional policy governance and, sometimes, financing of a excessive number of intermediaries and regional agencies
When examining strengths and weakness of the SF contribution, a paradoxical picture emerges: many of the strengths are related to the creation of stronger regional innovation systems, concurrently the weaknesses are related to the diverse remaining deficits of these systems. In these regions, more than 15 years of EU financial support has created the structures and the conditions for the regional innovation systems. Yet, only in a few cases has innovation performance taken-off radically. The fragility of the local actors (limited
19 See appendix A for a list of ‘good’ or ‘interesting’ practice cases from the country reports. 20 These cases do not emerge clearly from mid-term evaluations since these largely ‘procedural’ evaluation exercises do not sufficiently develop an appraisal of the effectiveness of RTDI measures. The weakness of the evaluations is a wide-spread problem but it is particularly important in Objective 1, which absorbs the bulk of resources. Therefore the improvement of evaluations in the future is certainly a priority.

591 Synthesis report_final.doc 24
Box 5: Network of Agents for the Promotion of Innovation in Peripheral Areas – RIA Network
The RIA network in Castilla y Leon represents good practice in appropriate and responsive policy making which addresses specific regional problems, customising interventions rather than just taking models from elsewhere. LEGITE is the Regional Innovation Action Programme supported by the SFs and RIA was developed as a sub-programme of this main action to create a greater focus on a particularly pressing regional issue i.e., the challenge of promoting and sustaining innovation in the very sparsely populated peripheral areas. RIA helps business to become more innovative and helps to strengthen local entrepreneurial culture by fostering cooperation and partnership with the existing support structures such as Local Development Agents or Local Action Groups in the LEADER initiative. The overall aim is to spark innovations in partnership with businesses on their ‘home ground’ in often isolated and much less favoured locations and, so, is a model of hands-on, proactive, customised support designed to solve a tricky problem in the short term and in the longer term to embed innovation on the planning agendas of peripheral localities. Despite initial suspicion and indifference the project is making a difference and so far 170 cooperation agreements have been signed between business and support organisations. Source: Country Report Spain
Box 4: West Wales and The Valleys: Technium Centres
The Technium concept offers an optimum environment to enable knowledge-based start-up and spin-out companies to realise their potential. The Welsh Development Agency describes Technium as a network of state-of-the-art facilities supported by the latest information technology coupled with business and technical support staff. 10 Techniums exist at present but eventually the £150 million network is to comprise 13 sites across the region to encourage cluster development in pre-defined “key sectors” such as optoelectronics, digital media, IT, sustainable technologies, automotive technologies and the biosciences. The sites provide access to specialist laboratory facilities and communal networking areas and group together fledgling start-ups, entrepreneurs, researchers, developers, and industrial market leaders. Finally, a team of specialist business and marketing support advisors are available to support growth and development of knowledge based businesses at Technium Centres. The network began with the opening of the flagship Technium Centre in Swansea in 2001. Others have followed it, but the process is ongoing, with further locations under construction or planned for the future. There are currently more than 50 companies resident in Technium Centres across Wales, but it is hoped that more than 200 will eventually benefit when the network is complete. Source: Country Report United Kingdom, See also: http://www.wda.co.uk/index.cfm//wda_home/technium/en4414
numbers of industrial firms and other strong “RTDI consumers”, shortage of R&D centres of excellence, ‘self-interested’ strategies of many agencies and universities, poor capacity for partnership) limited the strategies and the results of the interventions. These constraints prevented also the introduction of policies oriented to (local or external) demand R&D and pushed for a use of SFs geared towards indirect initiatives. In a few cases, depending on the maturity of the local innovation system, there was a shift from supply to demand-oriented approaches while soft initiatives (e.g. promotion of the information society, networking) have been more intensively pursued but with mixed results.

591 Synthesis report_final.doc 25
The issue of innovation governance in Objective 1 regions is a factor explaining these difficulties. Experience suggests that there is not a unique model of regional innovation governance, but rather a set of guiding principles, which need to be applied to fit to local conditions. In this context, the support of the SF to improve governance has been relevant and has benefited from the role of the European Commission as an outsider in the local policy arena.
2.6.2 Structural Funds and innovation in the new Member States
“New” Objective 1 regions: the foundations of an innovation and technology transfer system. As in the “old” Objective 1 regions, SFs are the main resource for supporting RTDI in the new Member States. In contrast, the new ‘Objective 1’ regions have strong needs related to industrial restructuring and good potential due to availability of highly skilled human capital linked to cost competitiveness which attracts foreign investments.
“New” objective 1 Strengths Weaknesses
• basic financial support to national RTDI policy and initial conception of a regional RTDI policy
• push towards the creation of a innovation and technology transfer system, still absent in these countries
• introduction of new policy instruments, mobilisation of new actors (universities, innovation centres, private firms, etc.) and reduction of centre-periphery imbalances
• novelty and complexity of some procedural and managerial aspects;
• difficulty in promoting RTDI regional policy, due to the weak local private and public environment
• crowding-out effects of other incentives to SMEs investments;
With respect to creating an innovation and technology transfer system and promoting new public private partnerships, these regions are on a path similar to that followed by “old” Objective 1 regions, a decade ago. The Polish example in the next box illustrates the importance of capacity building at regional level for innovation policy.
Box 6: Regional Innovation Strategies in Poland
A process of development of RIS started in Poland in 2002 with the first five projects in the regions of Opolskie, Śląskie, Warmińsko-Mazurskie, Wielkopolskie and Zachodniopomorskie initiated with EU support through the RIS-NAC programme. Based on this experience, in 2003, the Polish government provided national grants via to all other regions in order to prepare a RIS. Subsequently, the Structural Funds has provided an opportunity to continue the increasing the capacities of regional partnerships in the area of innovation. Under the Integrated Regional Operational Programme (2004-2006) support is provided for five types of projects in the scope of measure 2.6 Regional Innovation Strategies and transfer of knowledge. Projects funded can support further development of RIS, creation of networks, development of information exchange and communication systems, internships for higher education institutions graduates and for employees of the R&D sector, and scholarships for the doctoral student in strategic areas pre-defined by the RIS. This initiative can be considered good practice mainly because of its pro-innovative approach, which goes beyond direct grants for infrastructure projects. Source: Country Report Poland

591 Synthesis report_final.doc 26
Box 7: Co-operative Research Centres (CRC) in Hungary
Academia-industry co-operation, a key factor underpinning a competitive economy with innovative businesses, has been weak in Hungary. This measure, a successor of a scheme originally launched in 1999) aims at promoting scientific and technological co-operation of the business sector and publicly financed research organisations. It does so by supporting the establishment of new Co-operative Research Centres. The overall budget for the 2004-2006 period is roughly 12 million Euros. The success of the measure is indicated by the fact that five CRCs were set up in the framework of the original scheme (by 2004), and a further 14 CRCs have been supported by the current scheme, either at universities or at research institutes, covering different fields of S&T. Now, each Hungarian region has at least one CRC. 22 project proposals were submitted; requesting 6.4 billion HUF as grants in total. The 14 approved projects requested 4.5 billion HUF as grants. The results to date suggest that the budget of the programme has been used in an efficient way. Even though only the ’predecessor’ scheme has been evaluated, evidence suggests that it had a positive effect on the innovation activities of the participating companies, the number of PhD students and their employment prospects and the professional performance of the hosting higher education institutes. Source: Country Report Hungary
The poor experience and limited institutional structures devoted to RTDI (especially on a regional scale) favoured, in these regions, indirect intervention. There was however a clear shift from support exclusively geared towards public research to the involvement of the private sector.
In this respect, the positive shock generated from SF was significant since certain types of demand-oriented intervention, alien to the industrial policy of these regions, were introduced for the first time along with the practices of monitoring and evaluation. In “new” Objective 1 regions, SF may have also contributed to lessen disequilibria between existing more advanced centres and peripheries in the countries (the Hungarian CRC programme has created centres in each region).
Box 8: Tailoring technology & innovation support for SMEs in Malta
In Malta, the implementation of measure 1.3. “Support to Enterprises” of the SPD, suggests that new Structural Fund schemes providing finance can unleash pent-up demand when properly designed. The high level of applications received by Malta Enterprise to the two rounds of the call for proposals (one in October 2004, the second in January 2005) is evidence of the strong interest of firms and of the leverage effect of the Structural Funds which co-finance 35% of the grants. Private investment has been stimulated by the interventions (1.14 MEUR of direct private investment). The measure contributes to improve the internationalisation and the innovative and technological capacity of local enterprises by supporting them to integrate new processes, up grade technological capacities and quality certification. The scheme already inspired new initiatives more focused on horizontal topics such as start-ups, R&D and innovation (more technological innovation). The main added value of such a scheme in Malta has been to make SMEs aware of innovation (technological and non technological) and the need to adopt new technologies and processes. Source: Country Report Malta

591 Synthesis report_final.doc 27
2.6.3 Structural Funds contribution to innovation in the Objective 2 zones Objective 2: a fragmented contribution of SF to innovation potential. In Objective 2 regions, SFs have been of very limited weight in comparison with national resources and policies making the contribution of Community support difficult to assess. Moreover, zoning led to an even more fragmented intervention, which certainly did not favour critical mass in RTDI policy. However, the national interpretation of eligible zones and strategic choices in terms of management of the programmes exacerbated the Community zoning constraint and scattered resources in too many regions or across many small areas within a single region.
Objective 2 Strengths Weaknesses
• Sustain or development of regional and local approaches to RTDI
• Demonstrative and experimental effects of new policy instruments
• Support for RTDI physical infrastructures and facilities
• Improvement of programming and governance of RTDI regional systems
• limited financial support for RTDI policy • conservative strategic approaches:
innovation was rarely deemed as central to industrial recovery or rural diversification
• procedural complexity of Community policy related to national policy
The result is that in many Objective 2 programmes, RTDI measures have ‘topped-up’ existing national or regional initiatives that only sometimes can be considered as novel policy. Moreover, the small scale of Community resources led often automatically to limited additionality and only demonstration type projects21. Certainly, there are also positive notes such as important improvements of regional innovation systems and the increase of know-how in policy management also among 21 With the exception of a small group of regions (for example Tuscany and Piedmont in Italy), which received a more important input of resources and covered a large part of their territories. In these case the additionality of ST to regional RTDI policy has been important.
Box 9: Integrating national and regional policies in Austria
In 1998, the Austrian Federal government launched three competence centre programmes (Kplus, Kind, Knet), focusing on long-term, outcome-oriented institutionalised cooperative research between the public (academic) and the industrial sector, mainly through the establishment of separate organisational entities. At the outset, the competence centre programmes were purely Federal and there was no regional dimension on whether or not a specific centre was established. However, in order to expand the funding volume, the Austrian regions were invited to support the centres, and most of them chose to use SF money to co-fund their contributions. It is clear that in most cases the centres would have been financed even without SF support, although probably on a smaller scale. With hindsight, however, it has proven a successful policy manoeuvre, as a higher awareness of the strategic dimension of research has been developed in the regions and a more explicit relation has been developed between regional and federal institutions. Thus, somewhat unintentionally, there has been impact both in terms of research outputs as well as at the policy level. In a systems view, the programme has created opportunities for better policy making at regional level (more care to involve local firms, higher attention to the local universities, and of links between them etc.). Source: Country Report Austria

591 Synthesis report_final.doc 28
the most advanced regions (e.g. boost to partnership in United Kingdom, Denmark, Sweden). In addition, the devolution of RTDI policy occurring in many countries has been supported or anticipated in the SF programmes. In general, SF acted in the Objective 2 regions as a complementary instrument of national policy: in some places facilitating the local expansion or consolidation of technology centres or other innovation facilities, in other regions being used to implement a regional RTDI strategy, and in a few cases to support particularly innovative interventions (see the Danish Metal supply project case). In the majority of cases, it seems that SF have not been crucial in the definition of the RTDI patterns. This result depends also on a diffuse conservative approach of the SPDs, which preferred to focus SF on grants for investments or small infrastructures instead of RTDI. However, more novel uses of Structural Fund resources can also be identified such as a number of financial engineering schemes including the case of Ingenium in Emilia Romagna (Italy).
Box 10: Denmark: Innovative Business Development
In Denmark, the Metal Supply project created a transparent market for metal and engineering industries through a digital communication platform. Today 500 firms from across the country are paid-up members of the network. It is thus likely that the initiative will be able to become self-funding and exist after the end of Structural Funds support. The initiative can be considered a good practice since it is an example of the introduction of new technology and business practices in traditional industries, which filled a gap in the market (which none of the participating SMEs could have done on their own) through network formation. It could serve as a source of inspiration for innovative management of producer-supplier relations in other traditional industries, opening up new business opportunities. Source: Country Report Denmark
Box 11: Ingenium: a novel approach to financial engineering in Italy
Ingenium is the first Italian seed capital fund which provides financial support on the basis of a purely market based assessment of applicant potential. The fund, controlled by a joint venture specialised in fund management, takes equity stakes in firms characterised by very high growth potential and high quality managerial staff. The Italian-Dutch fund managers were selected through a European call for tenders. Financial resources for investment amount to approximately on 15 MEUR, including 4 MEUR directly invested by the partners. The launch of Ingenium experienced a delay due to complexity and novelty of the initiative relative to previous regional experience. However, the fund became operational at the beginning of 2005 and to date over 40 applications were submitted by regional but also by non-Italian firms. Most projects concern ICT and, to a lesser extent, biotech, energy, aeronautics etc. Eight firms have already passed the initial scouting and are nearing the final stage leading to access to funding. The initiative represents good practice due to its degree of novelty and as an example of a successful public-private partnership. Ingenium was a courageous initiative strongly pushed by the highly competent staff in charge of managing RTDI policy in Emilia Romagna. In theory, the experience may be easily replicated elsewhere. However, transferring the concept to weaker institutional contexts may be difficult. Source: Country Report Italy, see also: http://www.meta-group.com/ingenium/
591 Synthesis report_final.doc 29
2.7 Closing the gap? The contribution of Structural Funds to a more innovative Europe
One of the key questions which this evaluation was asked to address is “How can regional policy contribute, through SFs, to raise the research and innovation potential of the EU”? The analysis of this chapter leads to a number of conclusions based on the current programming period with respect to this question. They are not always conclusive and unfortunately limited time series and incomplete or poor source materials (mid-term evaluations) made difficult any real appraisal of impact. However, they do offer pointers for Structural Fund managers and policy makers when reflecting on the design and implementation of programmes for 2007-13. Financial leverage versus capacity for policy-making from a systems perspective
During 2000-2006, the Structural Funds have contributed to a significant increase in expenditure on RTDI programmes and measures notably in the old ‘cohesion countries’ (Greece, Spain, Portugal) and in the eight new Member States of Central and Eastern Europe (the same is not true of Cyprus and Malta). SF’s are today the main if not only funding instrument for developing and expanding innovation policies in Objective 1 zones (Convergence Objective regions). Even if pure financial additionality for specific RTDI measures is not always assured, the ramping up of funding for this type of policy is striking across many regions. Although a longer time period is required to validate the hypothesis, there are grounds for arguing that the Structural Funds have contributed, and are likely to continue contributing, to a convergence in the intensity of innovation expenditure across EU regions22. Certainly, in a situation where in many countries, regional power with respect to RTDI policy, is growing, there is no other instrument than the SF at present which can potentially promote a strong convergence effect in European research and innovation activity. However, this rapid increase in funding brings with it dangers related to the capacity to design and manage the implementation of increasingly sophisticated, and sometimes novel or risky, policy measures (innovation poles, networks, cluster policies, competence centres, etc.) which require more management skills and know-how than the standard subsidy to one company or a research team to carry out some product development. Even the single actor-single measure type initiatives require increasing care in selecting and monitoring results if public money is to have a positive impact on the existing situation. Many regions, notably but not exclusively in Objective 1 zones, proved to lack the capacities and know-how to manage RTDI funds, this issue cannot be ignored in launching the 2007-2013 programmes. In this context, the evaluation suggest that SF support has been a crucial element in contributing to capacity building of local, regional and even national authorities in managing RTDI policy. Some examples include: the inclusion of RTDI measures in integrated programmes; the creation of decision making mechanisms and specific bodies to implement policy; a focus on monitoring and evaluation procedures for 22 It could also be argued that this investment through the Structural Funds may contribute to a more balanced European Research Area by increasing the potential of participation in EU research network by peripheral regions. However, to prove or disprove this hypothesis would require a study by itself and little evidence was found in the course of the current evaluation.

591 Synthesis report_final.doc 30
research and innovation investments, etc. In “old” Objective 1 (e.g. Greece, Spain, Southern Italy), RIS/RITTS have had a significant impact on programming capacity. In Italy and Poland, regional administrations were encouraged to elaborate regional innovation strategies leading in many cases to a first generation of regional plans concerning RTDI. In Greece, a national foresight was carried out with Community funds to orient RTDI strategy and Greek regions, which remain weak in terms of competence, were amongst the most active in building regional innovation partnerships. In “new” Objective 1 regions, the development of know-how in monitoring, evaluation and partnership of RTDI policy was supported. Regionalisation of RTDI policy versus critical mass and coherence Community support has contributed in some cases decisively to a decentralisation of influence over RTDI interventions. The SF programmes have boosted the regional role in previously strongly centralised countries (France, Ireland, Portugal) and to reinforcing a decentralisation trend elsewhere (e.g. Poland, Spain United Kingdom). The experience demonstrated that the shift from a central to a decentralised approach of RTDI policy is not easy. It requires a strong orientation of regional policy towards RTDI demand and competitive tendering, in order to avoid local supply-side (research) players engaging in ‘exploitative’ strategies. Moreover, it requires a governance system able to face technical issues and to ensure an efficient management control. Achieving an efficient distribution of power is problematic especially in Objective 1 but on-going efforts to develop regional capacities to not only design strategies (as in the first generation of RIS projects) but also to test and pilot implementation of policies, should contribute to improve effectiveness and efficiency of intervention. The Greek Regional Innovation Poles measure is a good example of a new generation of innovative measures, combining on-going strategy and partnership development with support for projects aimed at building up regional innovation potential in a particular sector or technology field. From the angle of delivery of measures, there are good grounds for many types of initiatives aimed at supporting locally embedded sectors or clusters for a more regional orientation better adapted to the capacities and potential of regional firms. A regional approach, however, has its limits when considering funding for major research infrastructure (at the risk of wasteful duplication in neighbouring regions), when designing financial engineering schemes to support innovation (where a sufficient deal flow may not be available within a single region or country) or when supporting the development of networks of firms and knowledge organisations (where regional boundaries may only hinder technology diffusion or access to required know-how). The example of Objective 2 programmes from the current programming period is a good illustration, in most cases, of how not to design and deliver regional innovation policy. Sub-critical initiatives in terms of financial resources or mobilisation of regional stakeholders, too many measures disconnected from regional or national policy frameworks, inefficient multiplication of intermediary structures with no clear vision of ‘who does what’ in the regional innovation system.

591 Synthesis report_final.doc 31
3 How innovative are Europe’s regions? A comparative overview of regional performance and potential
It has become popular to argue that regions can only prosper by investing in knowledge and innovation and that policy-makers can learn most from the most innovative and knowledge intensive Member States and regions. However, there are many ways to invest in the knowledge economy of European regions. There is also more than one driving factor, and there are many relevant indicators to measure performance. Indeed, due to regional diversity in the enlarged EU, needs and options differ in terms of innovation policy23. Accordingly, when considering future policy options it is more appropriate to compare regions with similar characteristics and performances, and potentially similar development trajectories. This chapter provides, firstly, a description of regional disparities in terms of economic performance and in terms of innovation and knowledge in the EU25 plus Bulgaria and Romania. Based on 15 knowledge economy indicators, four key ‘synthetic factors’ determining regional performance are then identified. These factors are used to develop a typology of regional knowledge economies in Europe. This typology highlights the diversified nature of regional innovation potential and is used as a basis for the prospective analysis in later chapters in order to identify corresponding policy options.
3.1 The knowledge economy and European regions References in academic literature to the terms knowledge economy or knowledge-based economy, stress the importance of knowledge as a production factor (next to the traditional production factors of capital, labour and natural resources) e.g.: “knowledge has become perhaps the most important factor determining the standard of living - more than land, than tools, than labour. Today's most technologically advanced economies are truly knowledge-based”24. The OECD has defined knowledge-based economies as “economies, which are directly based on the production, distribution and use of knowledge and information”25. Before analysing the importance of knowledge and innovation for regional development, the next two sections takes stock of the position of European regions in terms of economic development (sections 3.1.1) and knowledge and innovation performance (3.1.2).
23 See for instance: Todtling, F. & M. Trippl (2005), “One size fits all? Towards a differentiated regional innovation policy approach”. Research Policy 34, 1203–1219. 24 World Development Report, 1999 25 See “The knowledge-based economy” (OECD, 1996).

591 Synthesis report_final.doc 32
3.1.1 Europe’s regions: economic performance and trends In the framework of regional policy, the classification of European regions between Objectives 1 and 2 is guided by the divergence of the performance of regional economies from the EU25 average for a limited number of economic indicators (essentially income per head, or in statistical terms gross domestic product (GDP) per capita, and in the past also unemployment). From a cohesion perspective, these indicators are indeed relatively objective measures of the need to support specific regions, and they correspond with the challenge of “growth and jobs”. At regional level, GDP per capita is a main indicator of economic performance, and hence to some extent past innovation output, notably when it is expressed in the form of purchasing power, which provides a good indicator for relative income levels. Moreover, it is also a measure for productivity, since it is highly correlated to value added per employee. In 2002, Brussels-Capital region had the largest GDP per capita whilst, regions in the two candidate countries, Bulgaria and Romania, display the lowest level of income (see exhibit below and map on following page).
Exhibit 10: GDP and unemployment, top & bottom 20 European regions GDP per capita (2002) Unemployment rate (2003)
Top 20 Bottom 20 Top 20 (low unemployment)
Bottom 20 (high unemployment)
Bruxelles/Brussels Východné Slovensko Salzburg Andalucía Luxembourg Észak-Alföld Tirol Swietokrzyskie London Opolskie Zeeland Leipzig Hamburg Észak-Magyarország Åland Severoiztochen Île De France Swietokrzyskie Açores Lódzkie Wien Podlaskie Emilia-Romagna Sicilia Stockholm Warminsko-Mazurskie Oberösterreich Mecklenburg-Vorpommern Oberbayern Podkarpackie Kärnten Campania Åland Lubelskie Gelderland Slaskie Utrecht Vest Veneto Pomorskie Darmstadt Centru South West Stredné Slovensko Praha Nord-Vest Madeira Halle Bremen Severozapaden Utrecht Dessau Southern and Eastern Severen Tsentralen Noord-Brabant Kujawsko-Pomorskie Trentino-Alto Adige Sud-Est Niederösterreich Východné Slovensko Noord-Holland Severoiztochen Lombardia Calabria Lombardia Yugoiztochen Overijssel Warminsko-Mazurskie Groningen Yuzhen Tsentralen Centro (P) Lubuskie Stuttgart Sud-Vest Luxembourg Zachodniopomorskie Emilia-Romagna Sud Noord-Holland Dolnoslaskie Source: MERIT based on Eurostat data. As shown in the exhibit below, regional disparities in GDP per capita differ considerably amongst Member States. Belgium (along with Germany, the UK, France, the Czech Republic and Slovak Republic) has the largest regional disparity, while in absolute terms the difference in GDP per capita for the regions in Bulgaria is the lowest. Among the better performing small Member States (e.g. Ireland, the Netherlands and Sweden) the regional differences in the level of economic development is relatively small.

591 Synthesis report_final.doc 33
Exhibit 11: GDP per capita, average, top and bottom regions (2002)
GDP per capita
4000
14000
24000
34000
44000
54000
RO BG LV LT PL EE SK HU CZ MT SI PT GR CY ES DE IT FR FI SE BE UK AT NL DK IE LU
Best performing region Country mean Worst performing region EU mean
Wien
Brussels
London
Bratis lavsk_
Stockholm
Bucuresti
Lisboa
Mazow ieckie
Utrecht
Trentino-
A lto Adige
Southern
& Eastern
Île De France
Å land
Comunidad
De Madrid
Sterea Ellada
Hamburg
Praha
Yugozapaden
Közép-Magyarország
Source: MERIT based on Eurostat data However, every Member State (for which regional data is available) has at least one region with a below EU average level of GDP per capita. This means that cohesion is not only a European, but also a national issue. On the other hand it also shows that to some extent regional differences are quite natural e.g. not every quality of a region (or every aspect of well-being) can be measured in terms of GDP per capita, and there will always be concentrations and agglomerations of economic activity. It most of all confirms that geography and agglomeration economies still matter. Despite the surge in investment and use in ICT, knowledge economies are spatially concentred and networked economies. Unemployment is the second economic indicator commonly used as an output or target indicator of regional knowledge economies in the EU. It is an important indicator from a cohesion perspective. It not only refers to the economic allocation of human resources, but also to a higher risk of social exclusion. From a knowledge economy perspective, it could also relate to a mismatch between the education and training systems and the skills required. It can suggest that certain regional innovation systems have been unable to keep pace with restructuring of economic activity (e.g. shifts from manufacturing to services). Again, there are significant variations amongst the 200 plus regions analysed. In 2003 Salzburg was the best performing EU region with an unemployment rate of 2.3 percent, while in contrast the highest unemployment rate of 26 percent was reported in the Polish region of Dolnoslaskie.

591 Synthesis report_final.doc 34
Map 2: Regional GDP per capita

591 Synthesis report_final.doc 35
Exhibit 12: Top and bottom 20 regions in terms of growth of GDP and change in unemployment (1996-2003)
Growth of per capita GDP, Average annual % (1996-2002)
%-point change Unemployment rate (1996-2003)
Top 20 Bottom 20 Top 20 Bottom 20 Bucuresti Mittelfranken Comunidad De Madrid Moravskoslezko Közép-Magyarország Övre Norrland Cantabria Stredné Slovensko Southern and Eastern Oberfranken Región de Murcia Bucuresti Voreio Aigaio Münster País Vasco Ionia Nisia Região Autónoma Da Madeira Rheinhessen-Pfalz Andalucía Lubelskie Latvia Koblenz Extremadura Swietokrzyskie Estonia Jihozápad Border, Midland & Western Notio Aigaio Vest Sud-Est Principado de Asturias Warminsko-Mazurskie Bratislavský Detmold Southern and Eastern Berlin Mazowieckie Schleswig-Holstein Northern Ireland Podlaskie Ipeiros Köln Comunidad Valenciana Mazowieckie Peloponnisos Trier Castilla-la Mancha Kujawsko-Pomorskie Lithuania Strední Morava Canarias Opolskie Luxembourg Lüneburg Mellersta Norrland Lódzkie Nyugat-Dunántúl Valle d'Aosta Aragón Wielkopolskie Praha Hannover Cataluña Pomorskie Border, Midland and Western Leipzig Itä-Suomi Malopolskie Região Autónoma Dos Açores Berlin La Rioja Zachodniopomorskie Közép-Dunántúl Ceuta y Melilla Észak-Alföld Lubuskie Centru Moravskoslezko Castilla y León Slaskie Source: MERIT based on Eurostat data. The trend in GDP per capita between 1996 and 2002 shows a totally different list of good and poorly performing regions (see exhibit above). A catching-up effect is observable26 with high growth rates but starting at a low or very low level, e.g. in Ireland, Latvia and Estonia, the best performing region being Bucuresti in Romania. Among the regions with the lowest growth are many German regions, some of which have a relatively high level of GDP per capita, but now face restructuring difficulties. Most econometric literature reports a rather slow regional convergence process for the period till the late 1990s27, and it is too early to decide if this slow process has increased in more recent years (1996-2003). The trend in unemployment (1996-2003) has been especially positive in many Spanish regions, and very poor in many Polish regions. The next exhibit also suggests that part of the divergence in regional economic performance is still based on national macro-economic performance28.
26 This catching-up refers to Beta convergence (i.e. poor countries tend to grow faster than rich ones) which is necessary, but not sufficient to reach sigma convergence (or declining inequality). 27 E.g.: M. Grazia Pittau &R.Zelli (2006) “Emperical evidence of income dynamics across EU Regions”. Journal of Applied Econometrics 21: 605-628. 28 See also Ezcurra et al. (2005) “Regional Inequality in the European Union: Does Industry Mix Matter?”. In Regional Studies, vol. 39. 6, pp.679-697
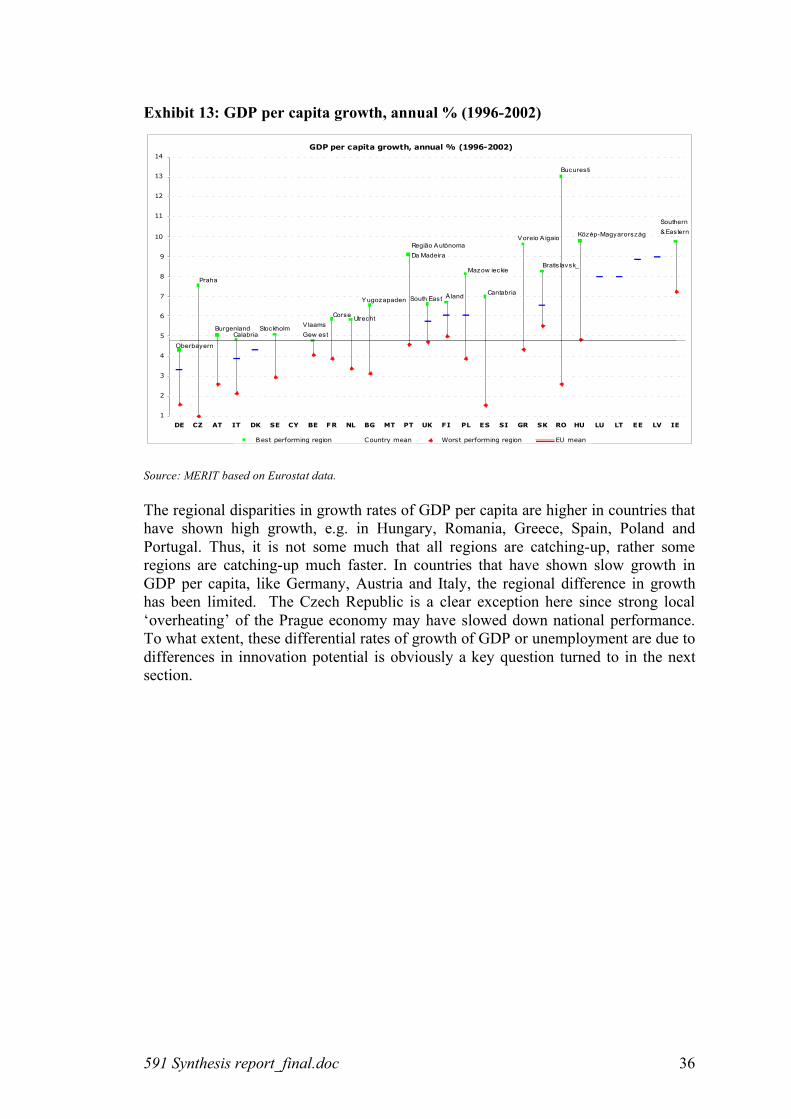
591 Synthesis report_final.doc 36
Exhibit 13: GDP per capita growth, annual % (1996-2002)
Source: MERIT based on Eurostat data. The regional disparities in growth rates of GDP per capita are higher in countries that have shown high growth, e.g. in Hungary, Romania, Greece, Spain, Poland and Portugal. Thus, it is not some much that all regions are catching-up, rather some regions are catching-up much faster. In countries that have shown slow growth in GDP per capita, like Germany, Austria and Italy, the regional difference in growth has been limited. The Czech Republic is a clear exception here since strong local ‘overheating’ of the Prague economy may have slowed down national performance. To what extent, these differential rates of growth of GDP or unemployment are due to differences in innovation potential is obviously a key question turned to in the next section.
GDP per capita growth, annual % (1996-2002)
1
2
3
4
5
6
7
8
9
10
11
12
13
14
DE CZ AT IT DK SE CY BE FR NL BG MT PT UK FI PL ES SI GR SK RO HU LU LT EE LV IE
Best performing region Country mean Worst performing region EU mean
BurgenlandV laams
Gew est
Yugozapaden
Praha
Oberbayern
Voreio A igaio
CantabriaÅ land
Corse
Közép-Magyarország
Southern
& Eastern
Calabria
Utrecht
Mazow ieckie
Região Autónoma
Da Madeira
Bucuresti
Stockholm
Bratis lavsk_
South East

591 Synthesis report_final.doc 37
Map 3: GDP per Capita Growth, Annual % (1996-2002)

591 Synthesis report_final.doc 38
3.1.2 Comparing innovation and knowledge performance of European regions Comparing the innovation and knowledge performance of regions is more difficult than measuring economic performance, as there is no single or commonly agreed set of indicators and often data on relevant indicators is only available at the national and not the regional level. One solution to the measurement problem is to create an index summarising the performance of several different indicators. An example is the Regional Innovation Scoreboard, which has been developed within the European TrendChart on Innovation29. For three of the indicators used in the Regional Innovation Scoreboard the ranking of regions are presented in the next exhibit. An important observation is that the top 20 best performing regions clearly differ per indicator. Simply summarising the scores and ranking the regions would imply loosing sight of regional differences in policy needs and innovation potential. Exhibit 14: Position of European regions on key knowledge indicators
Higher education % of population
Public R&D expenditure as % of GDP
Business R&D expenditure as % of GDP
Top 20 Bottom 20 Top 20 Bottom 20 Top 20 Bottom 20 Etelä-Suomi Campania Berlin Podkarpackie Braunschweig Madeira País Vasco Puglia Braunschweig Sud-Vest Västsverige Illes Balears
Stockholm Strední Cechy Dresden Stredné Slovensko Stuttgart Kriti
Brussels Malta Languedoc-Roussillon Niederösterreich Stockholm Ipeiros
Île De France Basilicata Karlsruhe Yugoiztochen Oberbayern Yuzhen Tsentralen
Utrecht Sardegna Köln Dytiki Makedonia Strední Cechy Swietokrzyskie Navarra Centro (P) Flevoland Burgenland Sydsverige Opolskie
London Nord-Vest Midi-Pyrénées Friesland Pohjois-Suomi Severen Tsentralen
Madrid Sud-Vest Leipzig Mellersta Norrland Eastern Lubuskie Åland Sud-Est Wien Swietokrzyskie Tübingen Notio Aigaio Denmark Valle d'Aosta Lazio Sud-Est Noord-Brabant Lisboa
Dresden Algarve Utrecht Sterea Ellada Östra Mellansverige Alentejo
Leipzig Nord-Est Halle Vorarlberg Mittelfranken Calabria Berlin Norte Groningen Peloponnisos Etelä-Suomi Voreio Aigaio South East Centru Gelderland Valle d'Aosta Darmstadt Podlaskie Länsi-Suomi Alentejo Pohjois-Suomi Severozápad Rheinhessen-Pfalz Dytiki Makedonia Noord-Holland Madeira Etelä-Suomi Sud Île De France Açores Estonia Sud Mazowieckie Centru Berlin Ionia Nisia Scotland Severozápad Bremen Severozapaden Midi-Pyrénées Severozapaden Source: MERIT based on Eurostat data. Public R&D expenditure (as a percentage of GDP) is highest in Berlin. Other capital cities, such as Wien (Austria) and Lazio (Italy) but also some more peripheral regions perform well: for instance, Languedoc-Roussillon in France, Scotland, and Kriti in Greece. Some other surprising results can be noted, such as the fact that Mazowieckie (Warsaw) and Prague in Czech Republic have reached “the public part of the Barcelona target” of spending 1% of GDP on public R&D expenditures (a third of the overall 3% target), while Brussels, for instance, has not.
29 www.trendchart.org

591 Synthesis report_final.doc 39
Public R&D expenditure is strongly concentrated and even among the good performing Member States there are regions with below EU average performance. Concerning business R&D expenditure (BERD) as a percentage of regional GDP the best performing regions in many Member States are not the capital cities, but often more unexpected regions such as Braunsweig (DE), Vastverige (SE), Eastern (UK), Noord-Brabant (NL) and Strední Cechy (CZ). The following diagrams illustrate these differences. Exhibit 15: Public R&D expenditure, % of GDP
Public R&D expenditures, as % of GDP
0,00
0,20
0,40
0,60
0,80
1,00
1,20
1,40
1,60
1,80
2,00
MT LU RO SK LV CY IE BG GR PL CZ ES LT EE IT BE PT SI UK AT HU DE DK NL FR SE FI
Best performing region Country mean Worst performing region EU mean
Languedoc-Roussillon
Flevoland
Berlin
Lisboa
Scotland
Bratislavsk?
Mazow ieckie
Com. De Madrid
Kriti
Praha
Wien
Brussels
Lazio
Bucuresti
Stockholm
Southern&Eastern
Yugozapaden Közép-Magyarország
Etelä-Suomi
Source: MERIT based on Eurostat data.
Exhibit 16: BERD as a % of GDP – position of EU regions
Business R&D expenditure, percentage of GDP
0,00
1,00
2,00
3,00
4,00
5,00
6,00
MT CY BG PL LV GR LT EE RO PT HU SK IT ES CZ IE SI NL AT UK FR LU BE DE DK FI SE
Best performing region Country mean Worst performing region EU mean
Pohjois-Suomi
Vlaams Gew est
Strední Cechy
VästsverigeBraunschw eig
Île De France
Com. De
MadridPiemonte
Noord-Brabant
Podkarpackie
Wien
Southern
&Eastern
Sud
Západné
Slovensko
Eastern
Peloponnisos
Yugozapaden
Lisboa
Source: MERIT based on Eurostat data.

591 Synthesis report_final.doc 40
The availability of data that can be used to analyse trends in regional innovation is limited, however, the exhibit below presents trend in two knowledge economy indicators. Many Italian regions are in the top 20 regions that have high growth in the share of the population with higher education, but this is likely to be due to recent changes in the education system and says little about quality of education. Map 4: Public R&D expenditure % of GDP (2002)

591 Synthesis report_final.doc 41
Map 5: Business R&D expenditure % of GDP (2002)

591 Synthesis report_final.doc 42
Exhibit 17: Trends in two knowledge indicators – top and bottom EU regions %-point increase in
Tertiary education (1999-2002) %-point increase in
R&D intensity (1996-2002) Top 20 Bottom 20 Top 20 Bottom 20
London Dytiki Makedonia Braunschweig Limburg (NL) Lazio Közép-Dunántúl Oberpfalz Liguria Abruzzo Bratislavský Berlin Região Autónoma Da Madeira Emilia-Romagna Mecklenburg-Vorpommern Mittelfranken North East Liguria Dytiki Ellada Algarve Tübingen Marche Berlin Auvergne Gelderland Umbria Västsverige Strední Cechy Gießen Lombardia Ionia Nisia Denmark Slovak Republic Molise Dresden Picardie Oberbayern Sicilia Sterea Ellada Languedoc-Roussillon Abruzzo Toscana Chemnitz Rhône-Alpes Halle Piemonte Norra Mellansverige Noord-Brabant Zuid-Holland Trentino-Alto Adige Sydsverige Valle d'Aosta Groningen Scotland Brandenburg Vlaams Gewest West Midlands Veneto Östra Mellansverige Zeeland Provence-Alpes-Côte d'Azur Puglia Stockholm Hannover Hamburg Friuli-Venezia Giulia Leipzig Unterfranken South East Itä-Suomi Alentejo Közép-Magyarország Chemnitz Pohjois-Suomi Magdeburg Midi-Pyrénées Bremen Campania Övre Norrland Centro (P) Flevoland La Rioja Canarias Thüringen Utrecht Source: MERIT based on Eurostat data. Exhibit 18: Growth in GERD/GDP (%)
Growth in R&D expendidure/GDP
(%-point change,1996-2002)
-1,0
-0,5
0,0
0,5
1,0
1,5
2,0
2,5
IE NL UK PL FR IT SK GR LT SI ES CZ DE PT BE HU DK SE FI
Best performing region Country mean Worst performing region EU mean
Vlaams Gew est
Strední Cechy
Közép-Magyarország
Braunschw eig
Algarve
Noord-Brabant
Scotland Peloponnisos
Valle d'Aosta
Auvergne
Cataluña
Provence-Alpes-
Côte d'Azur
BremenUtrecht
Sw ietokrzyskie
Mazow ieckie Dytiki Makedonia
Andalucía
South East
Brussels
Abruzzo
Severozápad
Bratislavsk?
Região Autónoma Da Madeira
Source: MERIT based on Eurostat data.

591 Synthesis report_final.doc 43
The EU champion in terms of growth in R&D intensity is Braunschweig in Germany, while in contrast another German region Bremen is among the EU regions with a decreasing R&D intensity. Some of the national champions in R&D dynamics are regions such as Algarve (PT), Stredni Cechy (CZ), Cataluna (ES), Valle d’Aosta (IT), and Auvergne (FR). Besides Germany, the regional disparities in R&D dynamics are large in the Netherlands, with Utrecht at the bottom and Noord-Brabant the best performing.
3.2 Innovation and knowledge: clustering regions in a policy perspective
3.2.1 Key factors determining regional innovation performance Based on the availability of data on relevant indicators of innovation and knowledge performance for the highest number of EU27 regions, 15 indicators (see exhibit in appendix B.2) were selected. Since it is over-complex and not useful in policy terms to present the performance of over 200 EU regions on all 15 indicators, the information was reduced to a more limited set of ‘synthetic indicators’. As noted above, the choice was made not to sum all the scores up to one knowledge-index score since this would hide the diversity of regional capacities and potential. Instead, factor-analysis30 was used in order to identify which variables belong to the same explanatory factor (or driver) of regional innovation performance. Based on the variables with the highest ‘factor loadings’, four factors were identified and given short symbolic names: 1) Public Knowledge, 2) Urban Services, 3) Private Technology and 4) Learning Families. It is worth underling that that the relevance of the four regional knowledge-economy factors were tested to be relevant in explaining differences in GDP per capita and unemployment rate (see appendix B.2 for the regression results) to extremely high levels of significance. Almost half of the difference in GDP per capita amongst the 215 European regions is explained by the four knowledge economy factor scores. The four factors also explain part of the variance in the unemployment rates of the 215 regions. The Urban Service factor shows a positive relation with unemployment, so the indicators that are high in this factor do not help in solving unemployment. The other three factors, and especially the Learning Family factor, show a negative relation with unemployment rates, indicating that these factors assist in reducing regional unemployment problems. One interesting cross-cutting conclusion of the factor analysis is that it statistically confirms the earlier hypothesis that the public R&D and business R&D indicators do not belong to the same factor (F1 and F3 respectively). This has implications for developing policy measures aimed at industry-science linkages, which unless they are viewed at inter-regional level may be doomed to failure.
30 Factor analysis is a branch of multivariate statistical analysis designed to explain the correlations or covariances among a set of variables in terms of a limited number of unobservable, latent variables or factors; See also Berlage, L. and D. Terweduwe (1988), “The Classification of Countries by Cluster and by Factor Analysis”. World Development, Vol.16, No.12, pp.1527-1545.

591 Synthesis report_final.doc 44
Public Knowledge (F1): Human resources in science and technology combined with public R&D expenditures and employment in knowledge intensive services are the most important variable for this factor. The most dominant variable is the percentage of the population that has completed higher education. Hence, cities with large universities rank high on this factor. Public R&D and higher education appear to be strongly related to high-tech services, whereas BERD serves high- and medium-high-tech manufacturing. Besides a high score for capital city regions such as Praha and Stockholm, regions in the east of Germany have a rather high score on Public Knowledge. Sicilia, Corse, Luxemburg and Northern Ireland are among the regions with the lowest score on the Public Knowledge factor. Map 6: Regional ‘hotspots’ for the Public Knowledge factor

591 Synthesis report_final.doc 45
Urban Services (F2) This factor takes into account the differences between industrial areas and service-based area, including the public administration services of the government sector. An observation is that there are two different ‘urban’ factors, indicating that academic centres do not necessary co-locate with administration centres. What may not be surprising is that the Urban Services factor is not associated with formal R&D, since R&D is more relevant for innovation in manufacturing than for service industries. The high scores of regions like Brussels, Lazio, and several islands, contrast with the low population density regions in Romania, which still have large manufacturing sectors.
Map 7: Regional hotspots in Urban Services

591 Synthesis report_final.doc 46
Private Technology (F3) This factor contains the correlated variables of business R&D, occupation in S&T activities, and employment in high- and medium-high-tech manufacturing industries. A countervailing influence is the weight of agriculture in a region. One interpretation is that agricultural land-use is at the cost of possibilities of production sites, or that agriculture is not an R&D intensive sector. The result of the geographical representation of this factor is a very strong core-periphery model, where southern Germany is the core and regions with the largest distance from (e.g. Munich, Latvia, Cyprus, Southern Spain and Scotland), have low scores. Map 8: Regional hotspots in private technology

591 Synthesis report_final.doc 47
Learning Families (F4) This fourth knowledge-economy driver is the least easy to interpret. The most important variable is the share of the population below the age of 10. Regions scoring high can be interpreted as places that are attractive to start a family. Good possibilities for life long learning in the region seems associated with the lively labour force participation of women. The factor could also be interpreted as indicating a child-, learning- and participation- friendly environment or culture, or even a ‘pro knowledge-life-style’ based on behavioural norms and values beneficial to a knowledge economy31. The geographical spread of this factor shows a north-south split: high scores in the north-west of Europe and low scores in the south/south-east.
Map 9: Regional hotspots for the Learning Family factor
31 This factor may also correlate or correspond with some of the indicators mentioned by Richard Florida in his book "The Rise of the Creative Class" (2002).
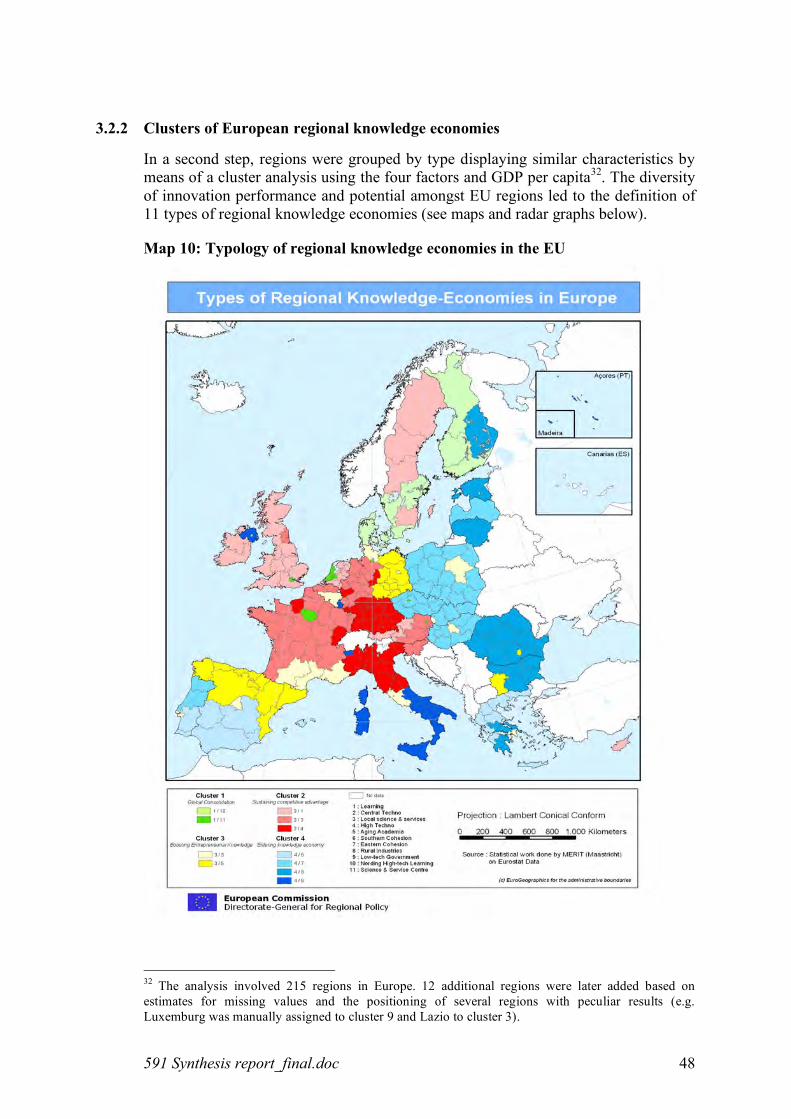
591 Synthesis report_final.doc 48
3.2.2 Clusters of European regional knowledge economies
In a second step, regions were grouped by type displaying similar characteristics by means of a cluster analysis using the four factors and GDP per capita32. The diversity of innovation performance and potential amongst EU regions led to the definition of 11 types of regional knowledge economies (see maps and radar graphs below).
Map 10: Typology of regional knowledge economies in the EU
32 The analysis involved 215 regions in Europe. 12 additional regions were later added based on estimates for missing values and the positioning of several regions with peculiar results (e.g. Luxemburg was manually assigned to cluster 9 and Lazio to cluster 3).

591 Synthesis report_final.doc 49
Type 1: Learning The Learning regions are first of all characterised by the high score on the factor ‘Learning Families’, and the three main components of this factor: life-long-learning, youth and female activity rate. On the other factors the regions are close to the regional average. Unemployment is on average the lowest compared to the other EU regions. Employment in the government sector is limited. GDP per capita is rather high. The regions are located in Austria, Ireland, the Netherlands, Sweden and the UK. There are many similarities with the Nordic High-tech Learning regions, but the business sector in the Nordic version invests more in R&D. Type 2: Central Techno This is a rather large group of regions located mostly in Germany and France with close to average characteristic, but the share of High-tech manufacturing is rather high. The factor-scores as well as GDP-per head is slightly above the regional average, except for the Public Knowledge factor which is slightly lower. Type 3: Local Science & Services This group of regions with diverse nationality consist mainly of capital cities, such as Madrid, Warsaw, Lisbon, Budapest and Athens. These urban areas serve as national centres for business services, government administration, public research institutes and universities. Urban Services and Public knowledge are therefore the strongest factors for this type of region. GDP per capita is on average slightly below the EU25 average, but growing. The low score on life-long-learning is a weakness in most Local Science & Services regions, especially compared to the more wealthy and advanced Science & Service Centres. Type 4: High Techno The High Techno regions host many high-tech manufacturing industries. They are mostly located in Germany (e.g. Bayern and Baden-Wurtemberg), some in Italy (e.g. Lombardia and Veneto) and two French regions. This type is very strong in Private Technology and has a high level of GDP per capita. The factors Public Knowledge and especially the Learning Family factor shows a relative weakness, e.g. in life-long-learning. Growth in terms of GDP per capita has been low and unemployment did not improve much in the previous years. Type 5: Aging Academia These regions are mostly located in eastern Germany and Spain and also include the capitals of Bulgaria and Romania. The strength in the Public Knowledge factor is mostly based on the high share of people with tertiary education. The low score on the Learning Family factor is due to little life-long-learning and relatively few children in the population. The unemployment situation has improved, but is still very high. Type 6: Southern Cohesion Southern cohesion regions are located in Southern Europe, consisting of many Greek, some Spanish and two Portuguese regions. The low score on the Private Technology factor is striking. There is hardly any high-tech manufacturing nor business R&D. Services is the most important sector, but also agriculture is still a rather large sector. The share of manufacturing industry in value added is very limited. Population density is low, but on average it has been increasing.

591 Synthesis report_final.doc 50
Exhibit 19: Radar diagrams of regional knowledge economies
Source: Merit based on Eurostat data. Note: the factor-scores show the deviation (1=standard deviation) per factor from the average of 215 EU regions (0.00).
Learning
-2.0
-1.0
0.0
1.0
2.0
F1
F2
F3F4
GDP
Central Techno
-2.0
-1.0
0.0
1.0
2.0
F1
F2
F3F4
GDP
Local Science & Services
-2.0
-1.0
0.0
1.0
2.0
F1
F2
F3F4
GDP
High Techno
-2.0
-1.0
0.0
1.0
2.0
F1
F2
F3F4
GDP
Aging Academia
-2.0
-1.0
0.0
1.0
2.0
F1
F2
F3F4
GDP
Southern Cohesion
-2.0
-1.0
0.0
1.0
2.0
F1
F2
F3F4
GDP
Eastern Cohesion
-2.0
-1.0
0.0
1.0
2.0
F1
F2
F3F4
GDP
Rural Industries
-2.0
-1.0
0.0
1.0
2.0
F1
F2
F3F4
GDP
Low-tech Government
-2.0
-1.0
0.0
1.0
2.0
F1
F2
F3F4
GDP
Nordic High-tech Learning
-2.0
-1.0
0.0
1.0
2.0
F1
F2
F3F4
GDP
Science & Service Centres
-2.0
-1.0
0.0
1.0
2.0
F1
F2
F3F4
GDP
-2.0
-1.0
0.0
1.0
2.0
Public
know ledge
Urban
services
Private
Technology
Learning
families
GDP per
capita

591 Synthesis report_final.doc 51
Type 7: Eastern Cohesion Manufacturing industries is the dominant sector, whereas services and agriculture are rather small sectors. This type of region is mostly located in Poland, Czech Republic, Hungary and Slovak Republic. Two Portuguese regions are also included. The Public Knowledge factor is the main weakness of this type of regions. However, the score on the Private Technology factor is close to average, which means that it is much stronger in this respect than the Southern Cohesion regions. Unemployment is high, even compared to Rural Industries and Southern Cohesion regions. Type 8: Rural Industries Besides a low per capita GDP, Rural Industries regions have in common a low score on both the factors Urban Services and Private Technology. Population density is very low. The service sector is often very small. Especially agriculture but also manufacturing industries are relatively large sectors. Besides regions in Bulgaria and Romania and Greece, there is also a more Nordic sub-group consisting of Estonia, Lithuania and Itä-Suomi Type 9: Low-tech Government This type of region, mostly located in southern Italy is characterised by a very low score on Public Knowledge combined with a high share of employment in the Government sector. Unemployment is severe, on average comparable to Eastern Cohesion regions. GDP per capita is however close to the regional average. Type: 10 Nordic High-tech Learning The Nordic version of the learning regions are typically strong in the Learning Family factor, but this type also has by far the highest business R&D intensity. In contrast with the popular characterisation of Nordic societies, the size of the government administration is the lowest of all the types. The low score on Urban Services is also due to the low population density. A rather unique feature of this type of regional knowledge economy is the combined strength in both the Public Knowledge and the Private Technology factor. Type 11: Science & Service Centre The main characteristics of this urban group of regions are the high scores on the Public Knowledge and Urban Services factors. Population density is very high. This type also has the highest GDP per capita and productivity. The variables that are captured by the factor Learning Families also show a score above the regional average, but disappointing is the relatively low presence of high and medium-high-tech manufacturing and the business R&D intensity.

591 Synthesis report_final.doc 52
Exhibit 20: Weight of each cluster of regions in the EU population
Cluster population shares
14
16
8
139
4
14
7
4
37
Learning
Central Techno
Local Science &
Services
High Techno
Aging Academia
Southern Cohesion
Eastern Cohesion
Rural Industries
Low -tech Government
Nordic High-tech
Learning
The first exhibit above highlights that four clusters account for 57% of the population, namely the learning, central techno, high techno and Eastern cohesion regions. The second exhibit illustrates that a similar percentage (56%) of GDP is also accounted for by four clusters, which are the same with the exception of Eastern cohesion.
Exhibit 21: Weight of each cluster of regions in EU GDP
Cluster GDP shares
16
16
7
17
7
3
6
2
3
4
11
Learning
Central Techno
Local Science &
Services
High Techno
Aging Academia
Southern Cohesion
Eastern Cohesion
Rural Industries
Low -tech Government
Nordic High-tech
Learning

591 Synthesis report_final.doc 53
3.2.3 Towards an operational typology of innovating regions in Europe The more detailed eleven categories of regions presented above allows for an in-depth appraisal of specific challenges and potential. Indeed, in the country reports, these eleven categories were often further broken down in order to discuss specific regional comparative advantages. However, the preceding analysis suggests that there is a need at EU level to focus on a more limited typology of regions if policy relevant conclusions are to be reached with a view to informing the strategic orientations for programming of SFs. During the 2007-2013 period, the ERDF, the ESF and the Cohesion Fund will contribute to three objectives: • Convergence (ERDF; ESF and Cohesion Fund); • Regional Competitiveness and Employment (ERDF; ESF); and • European Territorial Co-operation (ERDF). Based on a regional GDP below 75 % of the EU average, regions are eligible for the Convergence objective while all other regions have access to the Regional Competitiveness and Employment objective. Geographic eligibility of regions under the European Territorial Co-operation objective concerns either cross-border regions or those belonging to trans-national cooperation areas and is based on a Commission decision. A certain number of the Convergence Regions will be classified as phasing-out regions (regions with a GDP only slightly above the threshold, due to the statistical effect of the larger EU); while a certain number of the Competitiveness and Employment regions are classified as phasing-in regions (subject to special financial allocations due to their former status as “Objective 1” regions). In short for the purpose of comparison with the four main types of regions (Convergence, Convergence-phasing-out, Competitiveness and Competitiveness-phasing-in) supported under the Structural Funds, the typology of knowledge economy regions needs to be more strategically refined in order to say something meaningful at EU level. The exhibit on the next page proposes four strategic clusters of EU27 regions based on a further refinement of the factor analysis allied to normative observations relevant for policy analysis.
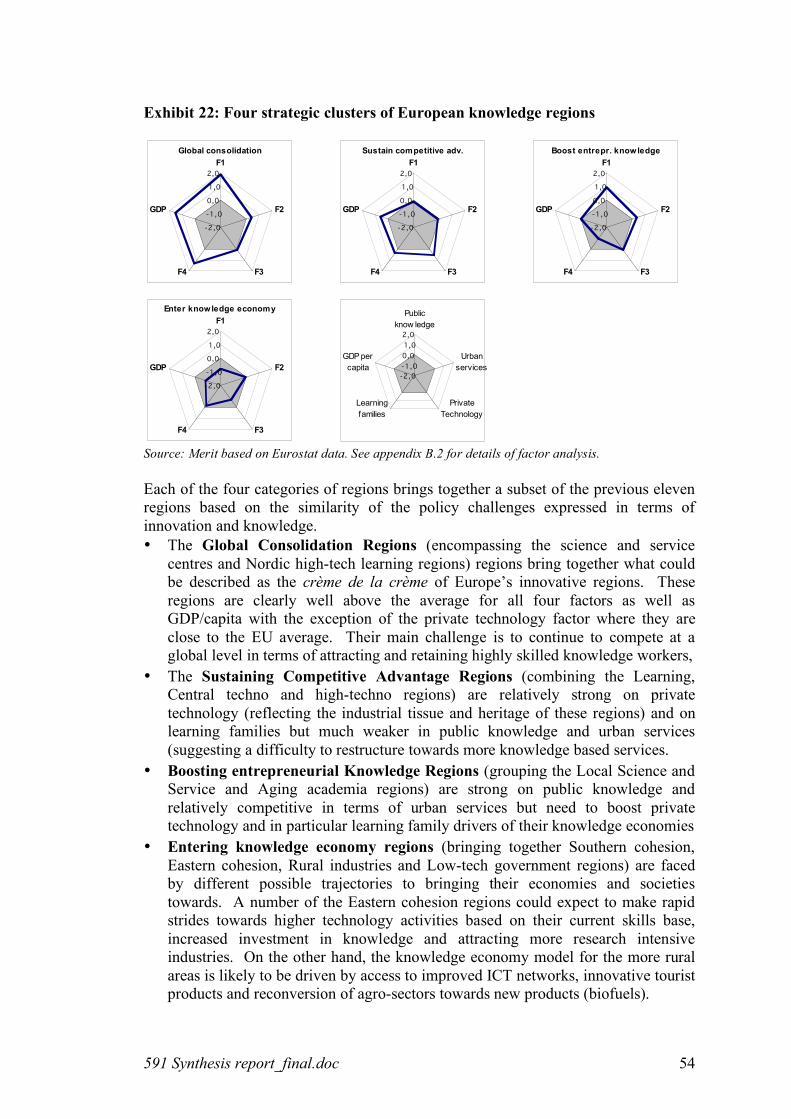
591 Synthesis report_final.doc 54
Exhibit 22: Four strategic clusters of European knowledge regions
Source: Merit based on Eurostat data. See appendix B.2 for details of factor analysis. Each of the four categories of regions brings together a subset of the previous eleven regions based on the similarity of the policy challenges expressed in terms of innovation and knowledge. • The Global Consolidation Regions (encompassing the science and service
centres and Nordic high-tech learning regions) regions bring together what could be described as the crème de la crème of Europe’s innovative regions. These regions are clearly well above the average for all four factors as well as GDP/capita with the exception of the private technology factor where they are close to the EU average. Their main challenge is to continue to compete at a global level in terms of attracting and retaining highly skilled knowledge workers,
• The Sustaining Competitive Advantage Regions (combining the Learning, Central techno and high-techno regions) are relatively strong on private technology (reflecting the industrial tissue and heritage of these regions) and on learning families but much weaker in public knowledge and urban services (suggesting a difficulty to restructure towards more knowledge based services.
• Boosting entrepreneurial Knowledge Regions (grouping the Local Science and Service and Aging academia regions) are strong on public knowledge and relatively competitive in terms of urban services but need to boost private technology and in particular learning family drivers of their knowledge economies
• Entering knowledge economy regions (bringing together Southern cohesion, Eastern cohesion, Rural industries and Low-tech government regions) are faced by different possible trajectories to bringing their economies and societies towards. A number of the Eastern cohesion regions could expect to make rapid strides towards higher technology activities based on their current skills base, increased investment in knowledge and attracting more research intensive industries. On the other hand, the knowledge economy model for the more rural areas is likely to be driven by access to improved ICT networks, innovative tourist products and reconversion of agro-sectors towards new products (biofuels).
Global consolidation
-2,0
-1,0
0,0
1,0
2,0
F1
F2
F3F4
GDP
Sustain competitive adv.
-2,0
-1,0
0,0
1,0
2,0
F1
F2
F3F4
GDP
Boost entrepr. knowledge
-2,0
-1,0
0,0
1,0
2,0
F1
F2
F3F4
GDP
Enter knowledge economy
-2,0
-1,0
0,0
1,0
2,0
F1
F2
F3F4
GDP-2,0
-1,0
0,0
1,0
2,0
Public
know ledge
Urban
services
Private
Technology
Learning
families
GDP per
capita

591 Synthesis report_final.doc 55
Map 11: Structural Fund regions 2007-13 and European knowledge regions

591 Synthesis report_final.doc 56
Box 12: Regional Innovation futures: off-shoring of corporate R&D in the Netherlands
The general trend of globalisation also has more specific sub-trends. For instance, the globalisation of research and R&D (i.e. business R&D). The trend for Dutch multinationals that still have their core R&D units in the Netherlands (e.g. Philips, Shell, DSM, Océ) is not a very dramatic ‘shift’ abroad, but gradually the Netherlands is losing ground as the sole R&D-core for the whole corporation, since the growth of R&D in foreign subsidiaries is growing faster than at home. Besides the efforts to increase R&D by promoting start-ups and academic spin-offs, it is of both national and regional importance to try to increase the embeddedness of the present major core-R&D activities of large multinational companies Source: Country Report the Netherlands.
3.3 Regional potential for innovation: a prospective analysis This section identifies the key trends that are likely to influence the future innovation potential of the four types of ‘regional knowledge-economies’. The identification of trends is based on available literature concerning future technological or sectoral evolutions (foresight and meta-foresight studies, etc.) and on the analysis of the country reports for this study. The outcome is a set of orientations to guide future Structural Fund investments in innovation and knowledge for each type of region. Each of the following sub-sections is structured around a discussion of the likely influence of three specific types of trends for each type of region: • Globalisation, or the evolution in business
strategies and international trade; • Technological trends notably related to
the existing or emerging pervasive technologies; and
• Sectoral innovation systems and their relative importance for the type of region;
A number of ‘drivers’ can be identified as important for the future development of Europe’s regions. These drivers can be segregated at three levels. Global drivers tends to affect all economic sectors, these include trends such as the open innovation ‘paradigm’, global energy prices or delocalisation effects triggered by migration of economic activities to lower cost countries such as China and India. These drivers have an impact on all types of regions, largely irrespective of their economic specialisation.
At the same time the innovation potential/capacity of regions is also affected by sectoral dynamics. The economic performance of regions is influenced by the differences of sectoral systems across regions, which are related to the knowledge and technological capabilities, actors, networks and institutions of a sector33. Thus, changes in sectors are bound to influence the innovation potential of regions not only in terms of technological competences but also in relation to institutions and value chains established either through formal or informal networks of interrelated industries.
33 Malerba, F. (2002). “Sectoral systems in Europe: Summary and conclusions” in Sectoral Systems in Europe – Innovation, Competitiveness and Growth (ESSY).

591 Synthesis report_final.doc 57
Box 13: Regional Innovation futures: creative industries in the UK
The UK regards itself as one of the global forces in the area of creativity and its creative industries, from architecture to video production, do generate proportionately high levels of international interest and exports. The creative industries have come to be seen by national and regional policy makers as focal point for support and encouragement, and as a potential source of enhanced economic success, through innovation within the sector itself, boosting both its world market share and its price-performance. The UK’s regions have tried to promote creative industry in past SF intervention. For instance, North West of England region, in particular Liverpool and Manchester, is working to promote the digital media sector. This is the case of the Media Enterprise Zone in Greater Manchester. Other examples are Wales, Scotland, and East of England. Source: Country Report UK.
From the country reports and literature review34 a number of sectors emerge as important for the majority of the regions. Sustaining and improving regions competitiveness in specific sectors, or creating competitive advantage in these sectors is important for future European growth and employment. Such sectors are: ICT, food, automotive and aerospace, health, pharmaceuticals, electronics, R&D services, recreational and cultural activities, plastics, agriculture, tourism, traditional industries, energy and chemicals. The specialisation of regions within the sectoral value chains varies for each type of region and a full analysis of the importance of sectoral patterns of innovation at national or regional level was not possible in the course of this study35. It is evident that the challenges that the various regions are facing present similarities across sectors and technologies. However, the sectoral dynamics and the productive mix of each type of regions differ, so that complementary but different policy approaches are required by type of region. The challenges presented in the automotive industry are an example that illustrates these differences. The automotive industry is significant for a large number of regions in Europe, such as the central techno, high techno, aging academia, science and services areas and eastern cohesion regions. Core manufacturing regions (high techno, central techno etc) are challenged by low cost producing regions and the key issue for them is staying ahead in leading technological fields and retaining the upmarket segments of the industry (product development, research, marketing etc), while for non core regions such as the Eastern cohesion the main challenge is to build strong suppliers networks and to be aligned with international networks in order to attract FDI.
34 In Aho’s report (Aho, E. 2005) the sectors are selected based on their contribution to the European GDP and their impact on the daily lives of citizens, while in Logotech 2005 the selection is based on the existence of strong European specialisation, the current and expected future growth of the sectors, their knowledge intensity and their relative size. 35 On-going work in the framework of the Sectoral Innovation Watch project funded by DG Enterprise of the European Commission is likely to shed more light on these issues: www.europe-innova.org

591 Synthesis report_final.doc 58
Box 14: Regional Innovation futures: ERDF support for nanotechnology
It takes concerted efforts by science and industry to maximise the benefits of synergies between research, development and production with respect to process technologies for nanoelectronics. Two examples of ERDF funded projects during the 2000-2006 suggest different strategies aligned with regional potential for supporting nanotechnology. Fraunhofer-Center Nanoelectronic Technologies CNT (Germany) The Fraunhofer-Center Nanoelectronic Technologies CNT is a public-private partnership between the Fraunhofer-Gesellschaft, Infineon Technologies AG and Advanced Micro Devices Inc. (AMD), and forms part of a newly established research platform for nanoelectronics representing a total investment value of €700 million. The European Commission granted funding of €232.5 million towards this project, including €48 million from the ERDF for plant and equipment for the initial phase of the CNT. The new centre, with premises on Infineon's research and manufacturing site in Dresden, was inaugurated in May 2005—the German Federal Ministry for Education and Research and the Free State of Saxony. Dresden's ambition is to become the third European centre of advanced research in nanoelectronics, alongside LETI in Grenoble, France and IMEC in Leuven, Belgium. The CNT is an integral part of the Fraunhofer Microelectronics Alliance and will gradually be developed into a platform serving nanotechnologists in industry and in applied and basic research. UIC Nanotech programme (North-East England) The UIC Nanotech programme, established during 2002 by One NorthEast, and funded by the DTI and the ERDF, is designed to facilitate knowledge creation and transfer, between five North East of England universities and industry, particularly small and medium-sized companies. The programme also strengthens the regions capacity and capability for research and development. The main objectives of the UIC Nanotech programme are to enable the five universities in the North East of England to: play a key role in economic growth; be at the heart of regional cluster development; proactively stimulate private sector research and development. Each of the five Universities focuses on a specific areas identified by One NorthEast as being of strategic to the regions economic development: Durham University, Nano-Materials; University of Newcastle, Biomedical; Northumbria University, Novel Surfaces & Coatings; Sunderland University, Drug Release & Pharmaceutical; University of Teesside, Micro & Nanoscale Sensors The capital investment made available by the UIC NanoTech, provided funding for the universities to establish open access facilities and services. The programme is linked to the regionally based Centre of Excellence for Nanotechnologies (Cenamps). Sources: http://www.nanotechnologyworld.co.uk; http://www.cenamps.com.
Finally, a number of technology fields emerge as important for the development of a large number of sectors since they influence the pace and direction of innovation in or across many areas. Three of the key pervasive technologies are nanotechnology, biotechnology and environmental technologies (eco-innovations). Development of the necessary knowledge capacity and competencies in these enabling technologies is expected to affect future competitiveness and innovation potential of the European regions across value chains and sectors.

591 Synthesis report_final.doc 59
Investments in nanotechnology are rising constantly across the world36. Nanotechnology finds applications in a wide spectrum of sectors and activities such as the energy sector37, in plastics (coatings, paints), chemicals, automotive industry (car components with specific characteristics), construction and ICT. Furthermore, convergence of nanotechnology with other technologies in a variety of sectors could provide new generations of products even for traditional sectors. In these cases interdisciplinary research and technology transfer across sectors are important. However, nanotechnology is an emerging technology currently at an early, very exploratory creative phase and wide industrial application is expected after many years. Therefore, investments in nanotechnology have sense only within the framework of a long-term national or regional strategy foreseeing significant investments in academic and applied R&D. At the regional level, only regions with existing R&D potential and enterprises at the international forefront, could participate effectively in such efforts and probably as members of national or international networks. Yet, even in less developed regions, special efforts are required to provoke the interest of new and established enterprises in the opportunities offered, in areas where nanotechnology reaches commercial applications, even if they are few at the moment (e.g. coating, new materials etc.). In theses cases the emphasis should be given on technology transfer and innovation instead of research. Agriculture, food and pharmaceutical sectors are the main areas of biotechnology application although the applications are rapidly spilling over into other sectors. Biotechnology applications in agricultural production have been focused on increasing yields, decreasing crop input needs, such as water and fertilizers, and providing pest control methods. In the food sector, biotechnology applications focus on the improvement of quality, processing and testing. While large international corporations will continue dominating the development of biotech applications and substances for the food industry, technology transfer and use of biotech solutions will provide a key competitive advantage to agro-food businesses. Therefore, support for technology transfer, development of science-industry linkages, with emphasis on: adaptation and improvement of applications; training of existing personnel; and supply of qualified personnel with sufficient scientific and technological background are some of the priorities for regions with agro-food industry. In pharmaceuticals, biotechnology is the leading force for the future of the sector. The nature of the research and its horizon request important inter-industry linkages across national boundaries. Although international corporations dominate the area, there is an increasing number of biotech SMEs aiming to license new drug inventions to multinationals. Therefore, support of biotechnology at a regional level presupposes either the coexistence of research organisations and firms active in biotechnology or the existence of public research organisations or firms actively participating in national or international research networks.
36 The US is planning to spend $3.7 billion during 2005-2008, Japan spent $960 million in 2004, South Korea and Taiwan plan spending spend more than $2 billion over a period of ten years, while China spends around $100 million each year. See European Commission (2004), Towards a European strategy for nanotechnology COM (2004) 338 final. 37 Low power nanomaterials based LEDs for lighting, photovoltaic solar cells based on nanostructured materials with improved endurance and much higher efficiency than current systems, fuel cells or lightweight nanostructured solids that have the potential for efficient hydrogen storage etc.

591 Synthesis report_final.doc 60
Eco-innovations are an increasing focus of attention across all sectors, and notably those responsible for the biggest impact on the natural environment and subject to environmental regulations such as heavy industry, energy, construction, chemicals, automotive, agriculture and food industry, etc. Global challenges like overcoming dependence on oil and global warming have created a necessity to search for new energy sources but also a need for more systemic applications of ecological solutions. In today’s world eco-innovations concern all industry sectors and governments alike. A growing demand for new resource-efficient technologies, products and processes is likely to become a major global driver for R&D and innovations in coming decades. Eco-innovations often appear at the crossroads of different sectors and have horizontal application. Therefore they require concerted efforts, specifically designed strategies and policies and re-organisation of innovation and research systems.38 Independently of regional context all regions and cities will have interest in new ecologically friendly solutions. Eco-innovations can be both highly advanced technology-based solutions as well as relatively simple local projects based on creativity and entrepreneurship. This presents a business opportunity for basically all types of companies and regions. Therefore, while only some regions will become ‘hot-spots’ for developing, testing and disseminating technology-based solutions (global consolidation regions), practically all localities can develop their own niche for entrepreneurship-based eco-innovations. Public interventions are an important stimulant of eco-innovation through, on one hand, changing the regulatory framework, tax regimes and public procurement rules (‘green procurement’) and, on the other, direct support for developing and implementation of eco-innovations. During 2007-13, regional policy must become a promoter of systemic change within innovation systems at both national and regional level in order to respond to this global challenge.
38 Viola Peter (2006) “Eco-Industries”, Scoping Paper, 31.05.2006, http://www.europe-innova.org/exportedcontent/docs/5/6005/en/Scoping Paper Eco-Industries.pdf.
Box 15: Green Mark Managed and delivered by the London Environment Centre Green Mark is an award scheme that enables SMEs to demonstrate their environmental improvement and commitment to customers without having to pay a high price. The use of Green Mark as a marketing tool contributes to the success of the scheme. The award helps consumers to make informed buying choices through a visual indicator of a company's level of environmental excellence and businesses can also use the Green Mark award to raise their credentials and demonstrate that they are acting responsibly to consumers. Source: http://www.green-mark.co.uk/.
Box 16: CENER, Navarra CENER is the Spanish National Centre of Renewable Energy located in Navarra. It is engaged in: Providing support for R&D and
innovation in firms by delivering technological services, running R&D projects under contract and in a consulting capacity
Using research and development to develop production technology and exploit energy sources
Facilitating maximum penetration of renewable energies in the energy system by generating the necessary tools and services to provide solutions to technical problems and relational difficulties between the various agents within the systems
Source: www.cener.com.

591 Synthesis report_final.doc 61
Box 17: Regional Innovation futures: London
London although geographically small, registers scores on key economic indicators and knowledge economy indicators that place it well ahead of the UK average. Greater London has a vibrant SME community, especially in the services sector, and a good complement of prestigious universities. Interaction between the business community and academia is good generally, however it is less evident in some of the capital’s most dynamic sectors, in media, fashion, consulting, finance and so on. Initiatives to promote stronger engagement with these business groups would help to secure continuing success for established sectors such as the creative industries and ICT, and also for new, emerging clusters around, for example, the green economy. Source: Country Report UK.
3.3.1 Global Consolidation Regions The Global Consolidation regions are the top Europe’s innovation hotspots, but often this is for historical reasons with agglomeration and proximity effects strongly influenced by public sector decisions. A significant number of the regions in this group have not been eligible for ERDF funding under the current programming period or if so only in fragmented zones covering specific urban areas of the cities. Many of these regions are the national capitals and national governments have tended to concentrate investment in public research and higher education in or near to these cities creating an unbalanced playing field with respect to other regions in the country. A common characteristic of these regions is the high concentrations of public R&D resources, in terms of expenditure, public research infrastructures, HEIs, and R&D personnel. Moreover, the science base is usually leading edge, internationally. The main difference between the two sub-sets of regions in this group is geographical with the Nordic High-Tech learning regions covering larger administrative areas including more rural areas. Without doubt, separating Stockholm, Copenhagen and Helsinki from their hinterlands would lead them to be classified as science and service centres. However, the Nordic High-Tech learning regions tend also to be stronger on private technology and learning families scores than the science and service centres, both of which could be considered as a comparative advantage in a longer term time horizon. This concentration of public resources naturally attracts private investors to locate R&D and advanced technology production sites. At the same time, these regions are largely urban and manufacturing has increasingly been replaced with services (both public and private) and notably a shift to financial services, creative industries and knowledge intensive services. The regions score least well on private technology due in large part to the shift out of manufacturing and probably due statistically to the difficulty of capturing R&D and innovation activity in services. The dominant sectors in these regions are usually financial services (notably in the capital cities), business services, research and development, creative industries, software and ICT, health services, pharmaceuticals and tourism. These sectors
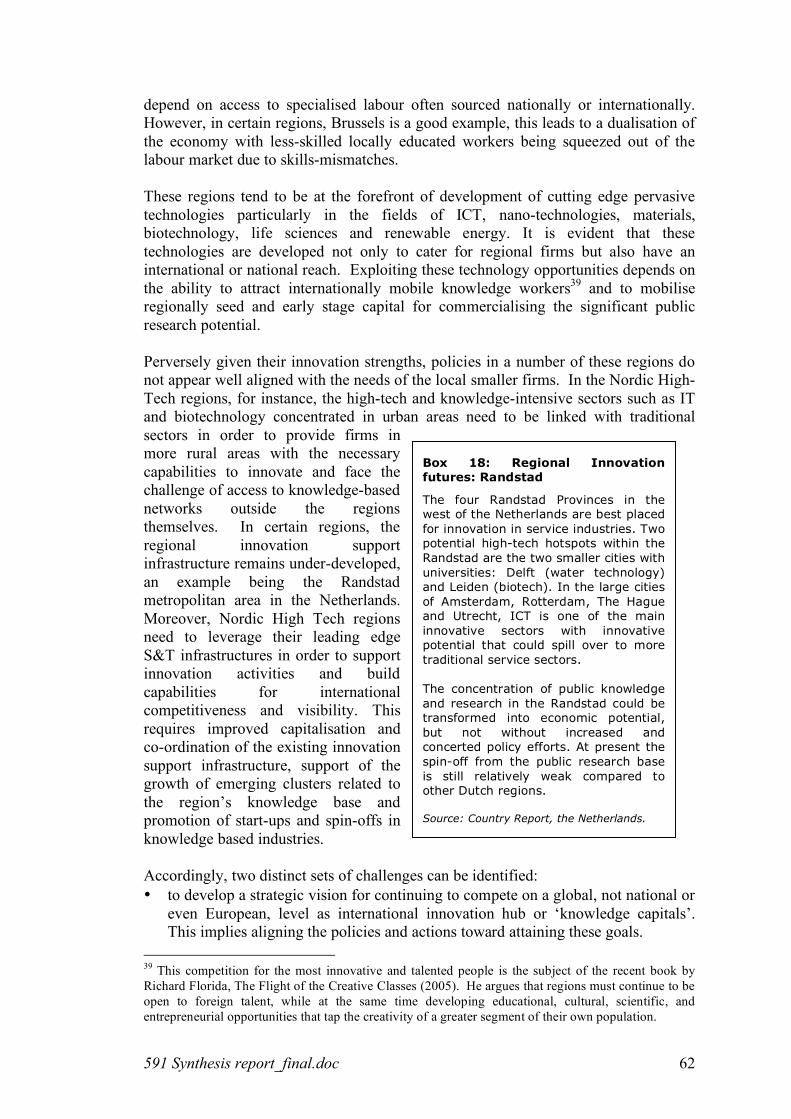
591 Synthesis report_final.doc 62
Box 18: Regional Innovation futures: Randstad
The four Randstad Provinces in the west of the Netherlands are best placed for innovation in service industries. Two potential high-tech hotspots within the Randstad are the two smaller cities with universities: Delft (water technology) and Leiden (biotech). In the large cities of Amsterdam, Rotterdam, The Hague and Utrecht, ICT is one of the main innovative sectors with innovative potential that could spill over to more traditional service sectors. The concentration of public knowledge and research in the Randstad could be transformed into economic potential, but not without increased and concerted policy efforts. At present the spin-off from the public research base is still relatively weak compared to other Dutch regions. Source: Country Report, the Netherlands.
depend on access to specialised labour often sourced nationally or internationally. However, in certain regions, Brussels is a good example, this leads to a dualisation of the economy with less-skilled locally educated workers being squeezed out of the labour market due to skills-mismatches. These regions tend to be at the forefront of development of cutting edge pervasive technologies particularly in the fields of ICT, nano-technologies, materials, biotechnology, life sciences and renewable energy. It is evident that these technologies are developed not only to cater for regional firms but also have an international or national reach. Exploiting these technology opportunities depends on the ability to attract internationally mobile knowledge workers39 and to mobilise regionally seed and early stage capital for commercialising the significant public research potential. Perversely given their innovation strengths, policies in a number of these regions do not appear well aligned with the needs of the local smaller firms. In the Nordic High-Tech regions, for instance, the high-tech and knowledge-intensive sectors such as IT and biotechnology concentrated in urban areas need to be linked with traditional sectors in order to provide firms in more rural areas with the necessary capabilities to innovate and face the challenge of access to knowledge-based networks outside the regions themselves. In certain regions, the regional innovation support infrastructure remains under-developed, an example being the Randstad metropolitan area in the Netherlands. Moreover, Nordic High Tech regions need to leverage their leading edge S&T infrastructures in order to support innovation activities and build capabilities for international competitiveness and visibility. This requires improved capitalisation and co-ordination of the existing innovation support infrastructure, support of the growth of emerging clusters related to the region’s knowledge base and promotion of start-ups and spin-offs in knowledge based industries. Accordingly, two distinct sets of challenges can be identified: • to develop a strategic vision for continuing to compete on a global, not national or
even European, level as international innovation hub or ‘knowledge capitals’. This implies aligning the policies and actions toward attaining these goals.
39 This competition for the most innovative and talented people is the subject of the recent book by Richard Florida, The Flight of the Creative Classes (2005). He argues that regions must continue to be open to foreign talent, while at the same time developing educational, cultural, scientific, and entrepreneurial opportunities that tap the creativity of a greater segment of their own population.

591 Synthesis report_final.doc 63
Box 19: Regional Innovation futures: Flanders
Flanders, a “central technology” region, enjoys a very favourable economic situation, and its development rests in large part on the existence of high-tech activities, supported by strong competence centres. However, this success is fragile, as recent delocalisation and decreasing trends in business R&D show. Endogenous dynamics might not be sufficient to compensate for these adverse globalisation trends, and in particular entrepreneurship needs reinforcing to ensure creation of regional value-added. A strategic innovation policy approach is being developed, to ensure networking and synergies between assets in public and private sectors. Source: Country Report Belgium.
• The major challenges for the Nordic High Tech regions are to alleviate existing weaknesses particularly with regard to interactions among SMEs and knowledge institutions and to counter the threats in traditional sectors operating in markets for standardised goods where price competition dominates. These regions in order to maintain their position with regard to innovation and knowledge need to widen the reach of the current model by including more actors in the networked approach to market-oriented innovation.
3.3.2 Sustaining Competitive Advantage Regions This is a relatively large group of regions, which however is concentrated geographically in the west-centre of Europe stretching from Ireland and the UK regions (excluding Northern Ireland and London) to Austria (excluding Vienna), Northern Italy and Slovenia as well as western Germany and most of France. The Central Techno regions (notably southern Germany and a number of French regions such as Rhône-Alpes), amongst the group are the most ‘balanced’ failing to clearly excel in any of the factors but above average for all except public knowledge. The ‘high-techno’ regions (Northern Italy, Southern Germany) are the motors of private technology development in Europe; while the learning regions (most of the UK, Ireland, the Netherlands except the Randstad, western Austria) are particularly High techno regions are among the most technologically advanced regions in the EU. The major challenges for these regions are to stay on the leading edge in core technology capacities, concentrate resources in the strongest growth potential technological areas –with particular attention to regional excellences and exploit RTDI poles as vehicles to spread innovation and as a basis for long-term development. Moreover it is also necessary to facilitate structural change in manufacturing, leading towards a more innovation-based productive fabric that can withstand global competition. The concentrations of RTDI activities in both traditional and leading technological fields, the strong interaction between the public R&D base and the productive system, the strong institutional capacities, the good performance of SMEs, the efficiency of regional governance of the R&D system and the existence of large and dynamic cities which fuel the demand for new products and advanced services, are the strengths of these regions on which they can build their future completive advantages. Central Techno regions have to a large extent already developed competencies in areas such as biotechnology, micro and nanotechnology, software, and materials that already find applications not only in mature and heavy industries but also in traditional sectors such as ceramics, agro-food etc. These developments need however

591 Synthesis report_final.doc 64
Box 22: Regional Innovation futures: the Irish ‘BMW’ region
Border, Midland and Western (BMW) region is the least developed half of Ireland. The decline of traditional industries, primarily manufacturing, has been acute in the BMW region. Given incapacity to attract higher technology replacement industries, the result is an economy based mainly on traditional sectors, but also a process of brain drain towards south-east Ireland. Revitalising ‘low-tech’ sectors such as (organic) foods, eco-tourism and textiles represent an opportunity of economic growth for many areas of the region such. The collaboration with universities to promote new product development and the definition of forms of business support to enhance SMEs market and management capabilities are crucial. Source: Country Report Ireland.
Box 21: 21Regional Innovation futures: innovation partnerships in Slovenia
The town of Idrija was home to one of the largest European mines of mercury but with the decline of global consumption mining activities ceased in the eighties. Despite not being on main transport corridors, today Idrija is a home of several outstanding globally active firms. Their business activity requires increasing investment in R&D and participation in technology networks and clusters. With resources from ERDF and the cluster of firms, a new research institute in air ventilation and heating was built in the area. Companies also support students via scholarships and have their own educational programmes in the natural sciences and technical studies. In this way Idrija has developed as a successful business-knowledge centre. Source: Country Report Slovenia.
a boost by increasing interregional collaborations and exploiting the strong public and industrial R&D base. The major threat that central techno regions are facing is loss of employment in manufacturing (e.g. in automotive) towards lower cost regions. However, there is an opportunity to maintain the higher value added activities such as R&D and marketing. This will require staying on the leading edge in science and technology and at the same time identifying new and promising fields for creating critical mass (financial, human resources) in order to maintain a competitive advantage in high-tech manufacturing. Learning regions rely on their endowment in knowledge creation. However, the major difficulty they face is to increase the production of knowledge with stronger contribution by the private sector. In the manufacturing sector, the creation of clusters in traditional manufacturing sectors that will enable the uptake of advanced technologies by firms. The strengthening of knowledge transfer mechanisms and technology diffusion to enterprises, the creation of an innovation friendly environment and the provisions of incentives for the creation of spin-offs are prerequisites for the development of enterprises. The creation of nodes or poles around areas of scientific strength is also an alternative for boosting applied research and product development. These nodes should include SMEs that usually form the backbone of regional economies. SMEs in these regions must be outward in focus based on innovation, research, and new product development. Universities and institutes of technologies can play a crucial role in building relationships with SMEs and working on market-driven research. On the other hand, intensive efforts in training and advice are required to improve attitudes to innovation among indigenous SMEs. This emphasis should not be limited to high-tech SMEs, but also to less technologically intensive firms.

591 Synthesis report_final.doc 65
Box 23: Regional Innovation futures: Budapest
In Hungary, Közép Magyarország (Budapest and its hinterland) clearly stands out with its close-to-EU-average income per head. The economic structure of Budapest is dominated by services, accounting for some 80% of gross added value. Investments, in recent years, have focused on this sector, especially transport and logistics, telecommunications, but also business services, and real estate. Tellingly, 60% of all Hungarian R&D workers are employed in the region, and two thirds of the R&D expenditure occurs here. The regional priorities emphasise strengthening co-operation between local SMEs, multinational firms and academia. Otherwise, the danger of brain-drain and of losing competitiveness to competing regions (e.g. Bratislava, Ljubljana, Prague) may become acute. Source: Country Report Hungary.
3.3.3 Boosting entrepreneurial knowledge regions The boosting entrepreneurial knowledge regions are composed of a ‘second tier’ of national capitals with strong national level research concentrations and by a group of regions with a relatively strong public research potential but facing significant problems of migration or renewal of a skilled population. This group of regions faces a significant challenge in boosting knowledge-based entrepreneurship with the private technology factor score being around the average for the EU regions. Two ‘outliers’ in this group are Berlin (due to poor scores on learning family) and the French ‘sunbelt’ regions (Provence-Alpes-Côte d’Azur, Midi-Pyrénées and Languedoc-Roussillon), which have failed to convert strong performance on public knowledge into high-tech manufacturing or services. As in the case of science and services centres, local science and services centres rely on the service economy and on the central position they possess within their countries or neighbouring regions. Such regions should further build their capabilities in order to achieve international competitiveness and visibility by exploiting current niches and agglomerations in high tech sectors and scientific fields and consolidate their position as national or regional hotspots. Thus, an important challenge is to develop their current niches (both public and private R&D activities) into “competitiveness poles” that will foster entrepreneurship (spin-offs creation around universities) with linkages to international technology platforms and networks. The presence of a highly qualified workforce is a benefit for their strategies but there is still considerable space for improvement in life long learning, which is one of the most important factors that diversifies them from the more developed Science and Services regions.

591 Synthesis report_final.doc 66
The major challenge for Aging Academia regions is to reverse the decline of their public research base by strengthening the public R&D profile and increasing linkages with the industry. At the same time, an equally important priority for these regions is to develop nodes of specialisation in areas of strengths such as biotech and pharmaceuticals. Furthermore, another priority is to strengthen regional networks along the supply chain and promote their alignment with the supplier networks of Core manufacturing regions. Moreover, university-business links should be strengthened and extended to SMEs that can exploit the high potential in terms of technical and scientific personnel. At the same time, support for mature industries (textile industry, food industry) that are at risk, due to delocalisation, needs to be intensified and based on applications of new technologies (bio, nano etc).
3.3.4 Entering knowledge economy regions This last group of regions corresponds broadly to the regions which will be eligible under the convergence objective of the Structural Funds during the 2007-13 period, with however some differences40. The regions correspond essentially to the southern and eastern ‘cohesion’ belts’ of lower income per head, broadly speaking less-developed regions or countries. The common feature of this group is a significant under-performance in both public and private technology, yet there is a diverse set of possible scenarios for ‘entering the knowledge economy’. The key issue for the southern cohesion regions is the development of new specialisation areas, combining local advantages in traditional industries (agrofood, textiles) with more knowledge-based activities. In many regions there is sufficient research capacity due to the presence of HEIs for implementing such strategies, which however should align their research efforts with the needs of the respective regional economies needs. For most rural regions the major challenge is the restructuring of the agricultural areas through the development of a multifunctional agricultural space. This could be achieved by combining agricultural activities with other economic sectors such as tourism (agro-tourism) and the adoption of new technologies, such as biotechnology for the creation of knowledge-intensive agro-industries addressed to international markets. Equally important is the upgrading of the educational level of human capital in those regions through life-long learning.
In addition, in most of the regions there is a huge untapped potential for the exploitation of the abundant renewable energy sources, such as solar, wind and biomass. However the relevant technologies cannot be developed in all regions. Thus, emphasis should be given on technology transfer and on the development of collaborations with regions specialised in energy related technologies.
For the tourism industry, the major challenge is the shift of the paradigm towards the development of a high value added tourism sector by exploiting their historical, cultural and environmental advantages in parallel with content development, the development of recreational enterprises, development and transfer of logistics’ technology which will enable the personalisation of services.
40 Notably the eastern German regions (some of which are eligible under transitional funding) and some regions of Spain and the UK eligible under convergence are not included in this type of knowledge region.

591 Synthesis report_final.doc 67
Box 24: Regional Innovation futures: Baleares, innovation in tourism
Economic growth in the Illes Balears has been based on “sun, sea and sand” tourism and the services associated with this activity (including construction). This has led to a paradoxical situation of one of the highest per capita income Spanish regions having one of the most under-developed innovation systems. At the same time, Balears hosts innovative tourist enterprises active globally (Meliá, Barceló, and Iberostar). These firms need to maintain a high level of innovation in processes and products and to apply technologies to remain competitive in this mature sector. In fact, innovations in the hotel industry are as frequent as in many industrial sectors. However, this is not a formalised R&D activity and is not included in statistics. Therefore innovation in the tourist sector has not been considered a component of Spanish policies and only in the last few years in Baleares have major efforts been made. Source: Country Report Spain.
For the eastern cohesion regions where the manufacturing sector is dominant the key challenge is to revitalise and restructure traditional industries through the exploitation of converging technologies such as nanotechnology, biotechnology, ICT, new materials and chemistry in order to develop products with new ‘smart functions’ (e.g. smart textile, smart furniture, smart buildings etc.).
Moreover, a further issue for these areas is the strengthening of regional networks along with the supply chains and promote their alignment with supplier networks of multinational corporations, in terms of quality, increase of productivity or technological capabilities. In areas with R&D capacity, spending on R&D should focus on enabling technologies (nanotechnology, biotechnology, ICT, chemistry etc.). In low-tech areas, emphasis should be on technology transfer, improving productivity by increasing automation and rapid introduction of commercially ready applications. Alignment also requires improvement of quality, skills, lifelong learning and vocational training in order to create a qualified workforce capable of dealing with structural changes in industry. Regions in central and eastern European countries with R&D capacities could attract FDI on design and R&D e.g. in the automotive sector, in plastics and in the chemical industry. A further issue for these regions is also the need to cope with environmental degradation by introducing environmentally friendly production technologies and creation of incentives for industry improvement in energy efficiency. Dynamic clusters in these regions should be helped to consolidate, by managing their own supply chains more actively, developing marketing competences and moving upward in value-chains. This partly depends on their capability to attract new, more skill demanding companies (FDI) which may act as catalysts for technological upgrading. The major challenge for low-tech government regions is to enable companies to tap into the existing know-how of the public research institutes as a means to increase their propensity to innovate. At the same time isolated concentrations of RTDI activities, around large innovative firms or highly productive academic or public research nodes, needs be linked more effectively to the local productive fabric. Hence, priorities for these regions include support to technology transfer and innovation in local SMEs, creation of innovative enterprises, opening of local

591 Synthesis report_final.doc 68
Box 25: Regional Innovation futures: balancing innovation potential in Lithuania
The three Baltic States are characterised by a strong concentrating of higher education, academic and business R&D in their capital cities and second university towns (Tartu in Estonia, Kaunas in Lithuania). The Lithuanian example underlines the risks of this concentration. Vilnius and Kaunas regions are a knowledge and innovation bi-pole, concentrating human and financial resources for innovation with significant potential for producing new technologies. In contrast, industrial cities in industrial cities such as Klaipeda, Siauliai, Panevezys, there is some sectoral innovation potential. However, they are more likely to be users of new technologies developed elsewhere to support innovation and upgrading of their traditional industries (machinery and equipment, food and beverage, furniture, etc.). Unfortunately, today, support for technology transfer and co-operation with the R&D sector is non-existent, which could keep them at the periphery of the knowledge economy, and further strengthen the brain drain towards Vilnius and Kaunas. Source: Country Report Lithuania.
enterprises to international actors and competition and improving the supply of skilled human resources. Moreover, measures to stimulate a strong demand of advanced services are required. At the same time, targeted strengthening of the public research base and infrastructure may be necessary. ‘Rural industries’ regions rely on traditional manufacturing (textiles, agro-food) and some extractive or heavy industries. The major challenge for such regions is the revitalisation of low-tech industries that are increasingly competing with low cost non-EU countries. Converging technologies such as bio, nano and new materials that transcend the boundaries of sectors could allow industries in traditional sectors (textiles, agro-food, furniture, etc) to base their competitive advantage on product differentiation and higher quality. Furthermore rural regions could also take advantage of the opportunities offered by the development of a multi-functional agricultural space. Another important issue for these regions is to cope with environmental degradation by introducing environmentally friendly production technologies and providing incentives for improvements in energy efficiency. In all four types of sub-regions in this group, the promotion of entrepreneurial culture is fundamental in order to increase the contribution of the private sector to regional domestic product. This in turn will require the development of entrepreneurial capabilities and skill in graduates, the provision of incentives for the establishment of start-ups and spin–offs and improvements in the effectiveness of support network for SMEs.

591 Synthesis report_final.doc 69
4 Europe’s innovation challenge: policy and institutional framework for Structural Funds interventions
Future investments in innovation and knowledge through the SFs need to take account of a number of parameters, which limit or influence what can be done through national or regional policies. These parameters fall into two broad types:
• Policies at Community or national level which can influence decisions on
community funding priorities; and • At the Member State level, organisational, institutional (laws and regulations) and
financial frameworks (or national innovation system41) influence the potential for linking of national (or regional) budgets with Community funds.
4.1 Innovation and knowledge policies: the European framework In theory, the three major policies addressing innovation and knowledge-based economy issues (i.e. research, enterprise and industry, and competition policies) are vertical and/or transversal, which means that these policies should ideally combine with Cohesion Policy, which has a territorial dimension, in an optimal way at implementation level. Indeed, within the framework of the renewed Lisbon Strategy42, SF interventions are expected to complement and provide value-added to other European, national or regional policy frameworks. Among 24 economic guidelines of the renewed Lisbon Strategy two are particularly relevant to this report: • Guideline n°7: to increase and improve investment in R&D, in particular by
private business; • Guideline n°8: to facilitate all forms of innovation. The Commissions’s 2006 Report on the Lisbon National Reform Programmes43 pointed to the importance of supporting “a decisive leap in investment for research and innovation” with a greater share of Structural Funds to be spent on innovation and R&D44, in line with the conclusions of the so-called “Aho Report”45. In operational terms, three recent Communications from the Commission have brought closer together research/innovation, industrial and SME policies issues
41 The network of organisations, individuals and institutions, located within or active within national or regional boundaries, that determine and shape the generation, diffusion and use of technology and other knowledge, which, in turn, explain the pattern, pace and rate of innovation and the economic success of innovation. 42 “Working together for growth and jobs. A new start for the Lisbon Strategy”, COM(2005) 24, 2.02.2005. 43 http://www.europa.eu.int/growthandjobs/pdf/2006_annual_report_full_en.pdf. 44 President of the European Commission Press Conference, Inaugural Speaking Points, 25.01.2006. 45 “Creating an Innovative Europe”, Report of the Independent Expert Group on R&D and Innovation appointed following the Hampton Court Summit.

591 Synthesis report_final.doc 70
through a more integrated vision of these policy areas.46 In the past, there was no correspondence between the different programming periods47 as a result of different decision-making processes. There were efforts at coordinating the different programmes and initiatives such as: the creation of a “Bonus Scheme” aimed at boosting involvement of R&D teams in Objective 1 regions48; support to actions aimed at having SMEs participating in FP6 Networks of Excellence; operational management of the MAP; financial instruments of the EIF49; regional innovation networks supported by DG ENTR through FP6 funding. However, coordination has not been sufficiently strong with in particular some ‘conflictual’ situations such as: competition in the field of support to seed and early-stage venture-capital for innovative companies between SF grants and MAP ‘commercial’ instruments; initial difficulties encountered by MAP financial instruments with competition policy rules. The latter situation is worth underlining since it refers to a larger issue, namely the compatibility between the ‘State Aid rules’ of the EU’s Competition Policy (aimed at preventing distortion of competition in the internal market which may result from public support) and the various public policies supporting specific instruments and/or areas50. More positive has been the momentum given by the MAP Enterprise Policy to a more regulatory-friendly environment for SMEs through the ‘Open Method of Coordination’ between Member States, which has resulted in significant changes in a number of Member States, in particular to the benefit of innovative SMEs, and start-ups and spin-offs companies51. On paper, the potential for synergies is even better for the 2007-2013 period, due to streamlining – partly as a result of the renewed Lisbon Strategy. First of all, the programming periods are now aligned for the SF, FP752, and the CIP53, which replaces the MAP. Moreover, the EIB Group is committed to providing financial instruments to support R&D and innovation (and notably eco-innovation). Equally, DG Competition is preparing a reform of State Aid rules concerning RTDI54, with the aim of providing a more flexible framework. 46 “Implementing the Community Lisbon Programme: A Policy framework to strengthen EU manufacturing – towards a more integrated approach for industrial policy”, COM(2005) 474 final, 5.10.2005; “More Research and Innovation – Investing for Growth and Employment: A Common Approach”, COM(2005) 488 final, 12.10.2005; “Implementing the Community Lisbon Programme: Modern SME Policy for Growth and Employment”, COM(2005) 551 final, 10.11.2005. 47 SF: 2000-2006; FP6: 2002-2006; MAP: 2001-2005, 48 Whereby FP6 project participants located in such regions can apply for funding from the SF to cover part of their costs under the FP6 project. The actual effectiveness of this scheme is not clear since 49 www.eif.org 50 For a global view: Scharpf (F.), Gouverner l’Europe, Presses de Science Po, Paris, 2000 (about ‘positive’ and ‘negative’ integration. For a more technical view: Neumann (M.), Competition Policy. History, Theory and Practice, Edward Elgar, 2001, 183 s. 51 See “External Evaluation of the MAP 2001-2005”, European Commission, D.G. ENTR (Información y Desarrollo s.l., Lacave Allemand & Associés). 52 “Proposal for a decision of the European Parliament and the Council concerning the 7th framework programme of the European Community for research, technological development and demonstration activities (2007 to 2013)”, COM(2005) 119 final, 6.04.2005. 53 “Proposal for a decision of the European Parliament and the Council establishing a Competitiveness and Innovation Framework Programme (2007-2013)”, COM(2005) 121 final, 6.04.2005. 54 “Community Framework for State Aid for Research and Development and Innovation”, Commission Staff Working Paper, 20.04.2006.

591 Synthesis report_final.doc 71
Improvement in policy coherence at EU level can be illustrated with some examples: the EIB Group will increase its role in supporting innovation through the new RTD
risk-sharing facility related to FP7; another priority has been added in 2005: better access to finance for SMEs, a priority which is not per se in the innovation field but has a relationship with it – in consistency with the EU priority objectives55;
the JEREMIE agreement between the Commission (DG REGIO, DG ENTR, DG ECFIN) and EIF should allow for a good coherence and complementarity between actions facilitating access to finance for SMEs, in particular innovative ones (seed and venture-capital), even if the conditions for its implementation are not yet certain;
Within the CIP, the Europe Innova Initiative will continue to support networks of clusters and actors for innovation, and an effort needs to be made to avoid duplication with future transnational SF projects (follow-up to INTERREG) supporting clusters;
the EIF is experimenting new initiatives such as the so-called ‘Technology Transfer Accelerator’56, and is part of some networks supported by Europe Innova Initiative; and
Within the CIP, PRO-INNO Europe will support transnational cooperation between national and regional innovation programmes, along the FP6 ERA-NET model.
However, it should be emphasised that the improvement of ‘ex ante’ coherence between the various EU policies does not guarantee that such coherence will necessarily materialise. An effective coherence will mainly depend on how the ‘grassroots’ actors at local and regional level make efforts to combine the different programmes through their own projects and initiatives; and, at least in centralised countries, how central governments will support such a move. In this respect, a recurring theme in the country reports was the need for reflection on how programming procedures could be adjusted and management authorities could be persuaded to support SF projects of a more ‘complex’ or ‘experimental’ (risky) type. For certain projects, there may be clear advantages of combining different sources of EU funding either at one point in the project cycle or consecutively.
55 “Towards a New Strategy for the EIB Group”, June 2005. The 5 priorities are: 1) Economic and social cohesion; 2) Implementation of the Innovation 2010 Initiative; 3) Development of Trans-European and Access Networks; 4) Environmental protection and improvement; 5) SMEs. 56 The ‘Technology Transfer Accelerator’ is a EIF project the objective of which was to assess the feasibility and define the operational modalities of a new type of targeted risk capital and technology transfer investment vehicle linking centres of excellence from different European countries, in order to bridge the financing gap between research and early stage financing through a new scheme.

591 Synthesis report_final.doc 72
4.2 Member State policy priorities for innovation and knowledge
4.2.1 At what level(s) of government is innovation policy managed? There are significant differences in formal powers and capabilities of regions in terms of design, funding and implementation of innovation and knowledge policies, according to different constitutional systems. Countries, and as a consequence their component regions, can be classified in three types: • Highly decentralised countries:
− Federal countries with ‘constitutional regions’ (such as Belgium, Germany, Austria) − Countries with ‘autonomous’ or ‘devolved’ regions (Spain, UK);
• Previously centralised countries devolving increasing powers to regions (e.g.: France, Italy57, the Netherlands) or starting to develop regional institutions (e.g.: Bulgaria, Czech Republic, Romania, Slovakia)
• Smaller ‘single-region’ countries (where even if there are local authorities, they do not in practice have competence or funding to intervene in favour of RTDI).
Federal countries and countries with ‘autonomous’ regions
Centralised countries, with significant regional
‘Single-region’ countries
Austria, Belgium, Germany, Spain, UK
Bulgaria, Czech Republic, Finland, France, Greece, Hungary, Ireland, Italy, the Netherlands, Poland, Portugal, Romania, Slovakia, Sweden
Cyprus, Denmark, Estonia, Latvia, Lithuania, Luxembourg, Malta, Slovenia
In federal countries, the role of the federal ministries and organisations is combined with the role of the regions/länder ones. Belgium is the only country where RTDI policies are fully decentralised with responsibilities shared by Regions and Communities, the federal level retaining only responsibility for research areas requiring homogeneous execution at country level, and research in execution of international agreements. In Germany, the federal level collaborates with the Länder in innovation and knowledge policies: the public part of the financing combines contributions from both the Länder and the federal government; coordination is ensured by the Bund-Länder Commission for R&D. In Austria, the two relevant institutions for innovation and knowledge in each Land are the Ministry of Research and the Ministry of Economic Affairs, but at national level there are a number of organisations active, including two major foundations supporting enterprises and research. The report notes that there is no “Archimedean” point in the system, which would allow some central steering. In countries with ‘autonomous’ regions, the situation is more complex because of the different competences devolved to different regions. For instance, within the UK, there is strong coordination at national level for research, and rather strong 57 There are strong arguments for considering that Italy is moving towards the Spanish or UK model but for the purposes of this analysis it was grouped under the more centralised countries since the Italian country report underlines the lack of clearly assigned competences between national and regional governments.
591 Synthesis report_final.doc 73
coordination for innovation as far as the English regions are concerned. The Department of Trade and Industry (DTI) plays a major role in policy-shaping and policy-making in all areas of innovation and knowledge policy while implementation has been devolved to the Regional Development Agencies, that have often established “Science and Industry Councils” to bring together science, technology and business representatives from across the region; regional officers have close links with DTI officers. Co-funding by national and regional levels for innovation actions is the rule. Scotland, Wales, and to some extent Northern Ireland, are devolved ‘constitutional regions’ with autonomous powers and run their enterprise support and innovation policies independently of the UK government (although academic research is still funded through UK science councils). In Spain, the Inter-ministerial Commission on Science & Technology is responsible for the coordination of R&D and innovation policies; there is a national R&D and Innovation Plan 2004-2007. Regions have powers in the field of RTDI policies; all of them have developed plans for the promotion of RTDI, and in fact RTDI policies are up on the agenda. Framework agreements have been signed between the central government and the regions according to the National Plan. The General council of Science & Technology, a consultative body, includes representatives of both the national level and autonomous communities. However, Catalunya and País Vasco have increasing competences. Centralised countries constitute the largest group. However, the level of centralisation varies considerably from countries such as Portugal and Greece where the regional level has very few powers in innovation and knowledge policies, to countries such as Finland where the powers and the role of municipalities and regions are important. On the other hand, the general tendency in this group is to give growing powers to regions, as illustrated in particular in France, Ireland, and Italy. In Greece, there is more scope for action at the regional level (peripheries), but regional capabilities remain limited58 and the national General Secretariat for Science & Technology (Ministry of Development) and the Ministry of Education remain the main players. Portugal has two autonomous regions, Madeira and Azores, which have powers, but in mainland Portugal, the regional level remains weak, except that they were allowed to manage Regional Programmes of Innovative Actions. In contrast, although Finland has a reasonably centralised policy co-ordination, it has placed RTDI actions under line agencies that have regional offices. At the same time, regional councils are responsible for establishing strategic development plans, which generally emphasise innovation-related issues. Moreover, municipalities have wide-ranging powers and a strong financial independence; the bigger ones have their own development strategies and are important actors in developing local innovation systems (e.g.: Oulu, Tampere, Jyväskylä). In between, there are countries like France, Italy, the Netherlands, Poland, Bulgaria, and Romania. In France, regions have powers in the field of innovation and are more and more involved in co-funding infrastructures for higher education and research; the French institutional framework is characterised by a systematic collaboration 58 Even if in Greece some regions have proven able, building on RIS exercises, to develop capacities in RTDI policies, for instance Central Macedonia, Crete, Thessaly.

591 Synthesis report_final.doc 74
between the national and the regional level through programming “contracts” between the State and the regions, and a strong role played at regional level by national administrations’ representatives. In Italy, competences in RTDI policies are shared between the national and the regional governments, the national government focusing mostly on co-ordinating RTDI policy and pre-competitive development, while regions concentrate on supporting local production systems, provision of innovative services, and technology transfer; there are however strong differences in effective capabilities between advanced regions which rely on specialised regional agencies, and “low-tech government” regions. In the Netherlands, the Provinces have very limited power and funding, but they play a very important role in co-ordinating regional initiatives and institutional structures. In Poland, the Marshal’s offices at regional level act now as de-concentrated authorities of Integrated Regional OP 2004-2006, but in the future will become decentralised authorities of Regional OPs. Although they have competences in the field of regional economic development and implementation of RIS, they lack a capacity to design and implement innovation-oriented policies. In Bulgaria and Romania, two heavily centralised countries, the regional dimension of the RTDI system is still rudimentary; in Bulgaria, its development is highly dependent on the country’s accession to the EU; in Romania, the Regional Development Agencies only bring modest inputs to innovation and knowledge59. In Slovakia, regional governments (except for Bratislava) do not seem to have really taken into account the importance of innovation for economic growth and they have not developed regional innovation plans. In single-region countries, policy-making and delivering are concentrated at national level due to the size of the countries (Cyprus, Malta), but “regional” offices have sometimes been established in some major urban centres, and a regional perspective is slowly developing, sometimes through RIS exercises (e.g. two RIS in Estonia, one covering the south-east, the other the north and west), or the role played by universities as actors located in ‘second cities’ (e.g. Kaunas in Lithuania or Tartu in Estonia), and the growing role of regional development agencies in the promotion of innovation (Slovenia). Previous Structural Fund experience suggests that the capacity of the regions to develop and implement innovation and knowledge policies does not depend only on their powers in this field. Experience with regional innovation strategy exercises also indicates that even in regions with limited powers, a partnership-based approach can improve significantly the policy shaping and the policy-making process and generate new ideas for such policies. The following exhibit summarises the role and influence of national versus regional authorities in each the innovation policy categories defined and used by this study.
59 Although, they have been key actors in RIS projects.

591 Synthesis report_final.doc 75
Exhibit 23: Regional-national responsibilities for innovation & knowledge policy
Policy area Federal Countries
C. with Autonomous
regions
Centralised countries
Single-region countries
Improving governance capacities for innovation and knowledge policies
Innovation friendly environment
Knowledge transfer and technology diffusion to enterprises
Innovation poles and clusters Support to creation and growth of innovative enterprises Boosting applied research and product development Essentially or exclusively a national competence Shared between national and regional (local) authorities Essentially or exclusively a regional competence It is important to keep in mind the potential scope for intervention of different levels of government when designing new programmes, a point returned to in chapter 5.
4.2.2 Coordination of innovation and knowledge policies Given the generally shared responsibilities for innovation and knowledge policies outlined above, the issue of coordination at and between national and regional levels is clearly important, even in Federal countries. In the country reports for this study lack of co-ordination and complexity at national level has been emphasised in a number of countries from all three types of constitutional situations including: Austria, Germany and Spain, Bulgaria Greece, Ireland, Slovenia, Portugal, Sweden, Latvia, Slovakia, Poland, Czech Republic. Difficulties arise generally between the Ministries of Education and Research, and the Ministries of Economy (and Industry), with in some countries a third player (Ministry of Regional Development). Lack of co-ordination may also result from an overload of national consultative bodies, agencies and organisations, as in France. On the other hand, in England, the predominant role of the DTI guarantees a good level of national co-ordination.
Box 26: co-ordinating funding of RTDI policies in Germany
In the Germany, federal system, public financing of RTDI combines contributions from both the Länder and the federal level (Bund). For example, university operations are financed for the most part by the Länder whereas investments in buildings are borne by the Länder and the Bund. The system of combined financing, found not only in the R&D system, has come under criticism in the recent years as it requires significant coordination efforts and political responsibility for decisions is unclear. The federal government and the Länder have launched in March 2006 a reform agenda ("Förderalismusreform") aiming at resolving these issues. Source: Country Report, Germany.

591 Synthesis report_final.doc 76
The fragmentation of the R&D system and of the scientific community is also highlighted as an issue in France, Greece, Ireland and the Netherlands. In France, research activities are conducted by national “grands organismes de recherche” and by universities (regionally), the latter having limited financial resources: co-ordination between them is improving, but is far from being satisfactory; moreover, the creation of two new national agencies has made the system even more complex. In the larger, more decentralised countries, the growing importance of regional RTDI policies requires close coordination with the central government’s actions and this is becoming increasingly important. One approach, is the French system of “contracts” between the State and each region which provides a framework for programming, particularly since the national programming period was aligned in 2000 with the SF programming period. The disadvantage is that this tends to lead to EU funds being seen as ‘topping-up’ resources. Another example is Spain, where although there have been various attempts over time to create co-operation mechanisms, effective and satisfactory coordination between national and regional authorities is still to be achieved. It would help the development of a national strategy to explore more fully the potential for collaboration between the different regions. Such co-operation is particularly important because starting from such a low level of R&D and innovation activities, the Spanish regions risk to duplicate similar infrastructures, with each individual initiative unable to achieve the critical mass need to be effective at national or European levels. Yet even in smaller countries, the fragmentation of the institutional environment is clearly an issue. In Austria, the institutional landscape was described as a ‘mosaic on the move’, while in Belgium, the issue was related more to fragmentation of planning and structures at the sub-regional level, notably in Wallonia. A positive example is given by the Netherlands where the provincial governments, which are linked to most of the RTDI organisations, platforms, alliances, and networks (e.g. by representation in boards and steering groups), ensure a good level of informal cooperation, while having practically no money for funding interventions by themselves.

591 Synthesis report_final.doc 77
4.2.3 What are the current policy priorities in the EU27 ? This section of the report summarises the detailed the analysis of the policy mix available in each country report. The exhibit below provides a simplified ranking of the importance given to the different categories of policies. Exhibit 24: Synthetic overview of policy mix
Policy area Federal Countries
C. with Autonomous
regions
Centralised countries
Single-region countries
Improving governance capacities for innovation and knowledge policies
Innovation friendly environment
Knowledge transfer and technology diffusion to enterprises
Innovation poles and clusters Support to creation and growth of innovative enterprises Boosting applied research and product development Nb: = high priority, = average priority, = low priority Appendix B provides a more detailed view on priorities given by each country to each policy area. In the federal countries and countries with autonomous regions, the key priority areas are “Knowledge transfer and technology diffusion” and “Innovation poles and clusters”; namely a traditional RTDI policy area since the 1970’s and a more recent one which is in line with the institutional pattern of highly decentralised countries. The UK gave high priority on the five first areas out of six, while “Boosting applied research” was given a lower priority. In Spain, both “Innovation poles and clusters” and “Boosting applied research” were given lower priorities In centralised countries, the key priority area is again “Knowledge transfer”, followed by “Boosting applied research” and “Innovation friendly environment”. France is a good example of the centralised-State model, although it is currently in a phase of decentralisation: “Innovation poles and clusters” both with “Boosting applied research” are the two highly prioritised areas while “Knowledge transfer” appears as an average priority”; “Improving governance” is a low priority. Finally, in single region countries, “Improving governance” and “Innovation poles and clusters” are the least prioritised policy areas. Largely depending on the international context, most of the single region countries, lacking natural resources and critical mass, attempt to overcome their disadvantage by supporting an innovation friendly environment for attracting (and retaining) people, businesses and activities. Improving governance capacities for innovation and knowledge policies is globally the least prioritised policy area – only five out of 27 countries make it a high priority. In particular, the need for improving governance in the centralised countries due to a lack of systematic dialogue between state and regional level does not seem to be

591 Synthesis report_final.doc 78
recognised. Equally, more than one third of the Single region countries do not make governance a priority, nevertheless certain countries are engaged in a process of regionalisation such as Denmark requiring more attention to governance and coordination. Innovation friendly environment, is one of the strongest prioritised areas: one third of the overall EU 27 have the area as a key priority. All centralised countries give this area as high or average priority, indicating that these countries have programmes, or schemes addressing these issues. Single region countries place a high importance on this policy area, with the specific focus depending on the context, e.g. innovation financing (e.g. in Luxembourg), as well as regulatory improvement or developing human capital (e.g. in Latvia). In federal countries and countries with autonomous regions categories, the situation is once again contrasted, Germany and UK giving top priority to this area. The area is typically an area for “soft measures”, even if it includes very different measures, some of them concerning the regulatory environment and depending on national decisions, others being closer to ‘field level’ (developing human capital, innovation financing). The European experience in this area is abundant; transfer from one country to another is relatively easy and has been facilitated by the ‘Open Method of Co-ordination’. Innovation financing is one of the most difficult issues, since success requires meeting a complex set of conditions. Knowledge transfer and technology diffusion to enterprises is the highest priority on the average. It is ranked as a high priority by 15 countries. Only Malta and Sweden consider this area as a low priority. Federal countries and countries with autonomous regions are the ones which globally give it top priority. A majority of centralised countries do the same (eight out of 14) while only a minority of single region countries adopt the same ranking (three out of eight). It must be noted that this policy area is the most “classical” with applied research, referring to the concept of ‘technology transfer’ developed in western European countries from the 1970’s. Given the on-going concern to achieve improved commercialisation of research investments, it is not surprising that it remains a high priority. The issue is more to do with the effectiveness of measures the numerous instruments and financial mechanisms available, in countries like France and Germany, which have not met expectations. The level of priority given to Innovation poles and clusters is more diverse with nine countries ranking it a high priority, eight as a medium priority, and ten as a low priority. Four out of five federal countries and countries with autonomous regions consider it a key priority. For instance, Germany has developed a federal programme supporting ‘BioRegios’ and another one supporting networks of competences. In contrast, only three centralised countries give this area high priority and all of them have developed specific programmes (Finland, France and Greece). Italy has developed a programme on ‘technological districts’. In single region countries, only two out of eight countries rank the area as a key priority while half of them rank it as a low priority. This is probably due to the size of these countries and their limited capacity to create a critical mass (of researchers, of businesses, of qualified people, etc.) in specific sectors. Not surprisingly, the two

591 Synthesis report_final.doc 79
countries that give top priority to the area are the largest and/or the richest (Denmark, Slovenia). However the smallness of Malta does not prevent it to develop a clustering process in the ICT sector. Some additional comments have to be made concerning this ‘trendy’ policy area. First, while it is conventional wisdom that highly decentralised countries give top priority to a policy supporting regional or local innovation poles, it is worth emphasising the interest that this policy has raised in some centralised countries: in such countries, it should be expected to favour a more bottom-up approach of the innovation policy than usual provided that the improvement of regional innovation governance is linked to it. Support to creation and growth of innovative enterprises. This is an area, which is considered as a key priority by eight countries; seventeen countries rank it as an average priority, while only three rank it as a low priority. In the federal countries and countries with autonomous regions, the UK is the country that gives the most importance to this policy area, RDAs as well as the DTI are providing support (in particular through financial schemes for start-ups and spin-offs). A large majority of centralised countries give key or average priority to the area. All single region countries consider it a high (Estonia, Luxembourg, Slovenia) or average priority. It appears that, like the area “Knowledge transfer”, this policy area is considered as a ‘normal’ component of the policy mix for innovation and knowledge. However, two issues within this area differentiate countries: • the priority given – or not – to academic spin-offs (for instance, France has so far
given a clear priority to them); • the instruments aimed at supporting growth of innovative enterprises, in particular
through appropriate financial instruments (in this specific field, very few countries seem to have them).
Boosting applied research and product development is the third ‘consensual’ policy area with only Spain giving it a low priority. Federal countries and countries with autonomous regions have a strong commitment to this area with highly developed schemes, and support of R&D infrastructures at regional level. Centralised countries generally consider it as an average priority, except for France, Hungary and Slovakia, which consider it a high priority. In the French case, this is linked to the role played by the major research institutes and recently by the creation of two specific agencies financing R&D on a project basis. A majority of single region countries rank it as a high priority e.g. Estonia aims at replicating the Finnish model along with Slovenia which has a good research potential in certain fields.
4.3 The influence of national innovation systems on regional policy SF support for innovation and knowledge seeks to generate and strengthen the existing national (and/or regional) innovation system in each Member State. In particular, organisational, institutional and financial factors in the innovation system can limit the potential for certain types of intervention, such as rules governing patenting or licensing rights in universities, or the legal capacity of academics for running a business. The type of SF interventions implemented is also affected by the competences that regions have – or have not – in the field of RTDI with respect those retained at national level.

591 Synthesis report_final.doc 80
As stated above, the national level remains globally predominant: in policy-shaping in general; in policy-making and implementation in research policies; in policy-making in innovation policies, and in some countries also in implementation. It is of course less true for federal countries and countries with ‘autonomous’ regions, Belgium being a good example. As a consequence, regional innovation policies and programmes are either supported by or at least have to coordinate with national policies, which means that the effectiveness of regional policies remains largely dependent on the functioning of the national innovation systems. The country reports identify some key issues concerning national innovation systems, beyond co-ordination issues already addressed elsewhere in this report, that may affect positively or negatively regional innovation policies and programmes. Two issues in particular merit a more in-depth review: the legal and regulatory environment; and access to finance and financial instruments. The experience of the 2000-2006 programming period underlines the importance of taking into account the diversity of national regulatory environments. General recommendations concerning SF-funded RTDI interventions may prove difficult to implement in certain countries since regulatory framework make them ineffective – or, on the opposite may be supported by a favourable regulatory environment. This issue can be illustrated by examples drawn from the country reports: In France, the legal status of researchers and academics hinders the creation of
academic spin-offs. In particular, the policy aimed at encouraging spin-offs from university and research organisations has been hampered by the rigid status of civil servants). Secondly, the lack of real autonomy (financial, premises, management of academic staff) of French universities prevents them from developing and implementing effective strategies. Finally, tax breaks for R&D projects in companies have been questioned at implementation level by the interpretation given by the taxation administration on what constitutes R&D.
By law, Swedish university researchers have the sole right to their own inventions. This exception in the law has been the subject of ample debate, but remains in place also after a recent review and despite the criticism that it limits exploitation of university innovations. However, the individual may elect to give up this right in a specific project, which in practice is often the case in international projects, e.g. EU-funded collaborative research projects.
In Greece: the setting-up of a fund of funds for supporting innovation (TANEO) has been delayed because of the lack of regulatory framework; another example concerns a programme supporting the creation of spin-offs from universities and public research (PRAXE), which was delayed because universities had no clear strategy on IPR (which required adopting an adequate regulatory framework).
In Austria, the reform of the university system, allied to an increase in public funding which benefited mainly the business sector has led to high pressures on universities, which are confronted with heavy demand, but do not have sufficient resources to be more than co-operation partners.
Access to capital and innovation financing was often signalled in the country reports, and not only in the NMS, as a bottleneck or a missing link of the national (and regional) innovation systems, Lack of, or over costly, financing hampers the development of innovative businesses. It may concern pre-seed money, seed-capital,

591 Synthesis report_final.doc 81
early stage venture capital, and also later stages in particular concerning buy-outs or transfer of businesses. Pre-seed is in general public-funded and can be let apart. There have been a number of experiments with public money (national and regional)60 supporting regional funds. However, three major problems can be identified. First, there is a problem of market, which is two-fold: size and geographical coverage. A regional fund is risky (except in very large regions), and it is all the more risky if the rules of the fund (imposed by public funding authorities) require the fund not to invest outside the region, or the country, so missing possible good investment opportunities. For instance, even in a region like Lombardy with eight million people and excellent universities and research, the creation of a regional fund of funds proved to be difficult. The second problem is related to exits from the investments: the market for exits is rarely through IPOs, which means that there is a need to often look beyond regional or even national market for exit strategies. If exits prove difficult, fund managers will not be able to invest in new ventures and will shift their focus away from supporting innovation. Thirdly, managing a fund requires highly professional skills both in specialised finance and in cutting-edge technologies (when it is about high-tech start-ups and spin-offs), plus in market research (but market research may be outsourced). These skills are not always present in every region, and multi-regional funds may offer a better opportunity to mobilise required expertise. However, more promisingly, the Greek report suggests that experience of mobilising private capital in the framework of certain programmes such as Eleftho or PRAXE offers a perspective for a more demand or market driven approach after 2007.
4.4 Conclusions: the importance of good governance The policy mix for innovation and knowledge in the EU27 is structured around a broad ‘consensus’ on three “traditional” policy areas: “knowledge transfer and technology diffusion” first of all; then, “applied research and product development” and “support to creation and growth of innovative enterprises” to a somewhat lesser extent. Going beyond this consensus appears important for the future effectiveness of SF support for RTDI. In large countries such as France, Germany, Italy, the priority given to “knowledge transfer” has not proven as effective and as efficient as was expected. Previously cited deficiencies in networking and partnership are probably part of the explanation. The consensus on “applied research and product development” also requires to be carefully examined. First, the distinction between basic (fundamental) and applied research is more and more questioned, for instance in biotechnologies and nanotechnologies). Second, “applied research” seems in a lot of EU countries to have been the priority so far much more than “product development”. In fact, it often appears difficult, when analysing policy measures, to establish a clear-cut divide between “knowledge transfer” and “applied research”. Concerning support to creation and growth of innovative enterprises, some countries tend to privilege academic spin-offs (which requires appropriate regulations 60 An example is provided by the « Fonds Allègre » in France, supported through a 1999 law.

591 Synthesis report_final.doc 82
concerning the legal status of academics) and not the creation of innovative companies in general. Moreover, support to growth of innovative SMEs does not appear in general as a real priority, whereas it has been recognised as a fundamental issue within the Lisbon perspective (e.g. the new CIP financial instruments). Recently, policy-makers have also placed more emphasis on actions to support an “innovation friendly environment”. However, in a lot of countries (including in the EU15), two of components, regulatory improvements and innovation financing, reflect only recent concerns (an example is France for regulatory improvements). Action to improve the regulatory environment is not a natural focus of regional policy; but it is clear that transnational learning through the ‘Open Method of Co-ordination’ could help some Member States and regions avoid problems already encountered elsewhere (the European TrendChart on Innovation and initiatives such as the PROINNO learning platform can offer operational support in this respect). Improved prior appraisals of legislative requirements for implementing certain types of RTDI measures and enhanced consultation between national and regional authorities would also avoid the significant delays seen in the implementation of certain, notably financial, measures during 2000-2006. Innovation poles and clusters are clearly a topical theme with the recent development of programmes in a number of countries and regions. However, successful clustering policies require a strong development of networking and partnership between key players at local/regional and EU/international level (because of globalisation of science and markets61), which calls for improved regional innovation governance. . Given the generalised need for improved coordination and management of policies, the poor level of priority given in general to “improving governance capacities” is both provocative and challenging. In this respect, the analysis of this report suggests that strong partnerships are more important than formal decentralisation of powers. The level of decentralisation of powers and competences has a limited impact on MS policy priorities: even in regions with limited powers, a partnership-based approach can improve policy shaping and policy making and generate new ideas. In terms of programming structures there is a clear need for Member States of a medium to large size to reflect on the comparative advantages of multi-regional programmes (achieving critical mass of finance or skills and avoiding duplication) versus regional programmes (allowing tailored made solutions to regional specific issues). At the EU level, the new policy frameworks for regional, innovation and research policies (CIP and FP7) offers many opportunities for synergies with the new Structural Fund programmes in support of the Lisbon strategy. Specific additional instruments should facilitate this outcome, such as the EIB RTD risk-sharing facility, JEREMIE or the Europe Innova Initiative. However: this potential needs to be developed and exploited at ‘grassroots’ level since complementarities will only develop if exploited by local and regional actors through more structured and permanent forms of collaboration (e.g.: “pôles de compétitivité” in France).
61 S. Berger, How We Compete: What companies around the world are doing to make it in today’s global economy, Doubleday, 2005; Thomas L. Firedman, the World is Flat, 2nd ed., New York, 2006.

591 Synthesis report_final.doc 83
5 Regional policy and the knowledge economy: priorities and investment options to 2013
5.1 Strategic issues for SF investments in innovation and knowledge Increasingly, policymakers, at all levels of governance, recognise that strengthening economic and social cohesion62 of the EU requires stepping up the pace of transition from traditional to knowledge-based regional economies. The primary role of the Structural Funds (SFs) is to foster cohesion, but as outlined previously there is increasing pressure to ensure that all available Community instruments work in synergy towards the goals of cohesion and competitiveness. EU regional policy began in the 1980s63 as a means of reducing significant disparities in income levels and investment capacity across Member States. The funds have been used to absorb ‘shocks’ (industrial restructuring, rural decline, etc.) and to allow regional economies that had failed for a variety of reasons to modernise to close a development gap with the EU average. Yet, today, the ‘paradigm’ underlying regional policy interventions is undergoing a profound mutation with a primary focus on boosting regional competitiveness, irrespective of initial income levels. In this context, the Structural Funds need to achieve a better balance between ‘structuring infrastructure’ in the regional economy to ‘structuring behaviour’ of agents and patterns of co-operation in the regional innovation system. This is not to deny that in selected regions, the Structural Funds should not invest in infrastructure but rather that investment in knowledge infrastructure needs to be made conditional on changes in management of RTDI organisations to improve their performance and impact on regional economies. In turn, this new paradigm of EU regional policy requires change in terms of policy thinking. In particular, innovative and more complex projects should be favoured evolving away from the focus on absorption capacity. The latter creates a risk that the authorities dealing with the implementation of SF interventions look more attentively at financial performance indicators rather than investigate the outputs and value-added of supported actions. Between 2007-2013, 308 thousand million EUR will be available to support the three following objectives of EU regional policy: Convergence objective regions will receive about 81.5% of total funding (some
251.1 thousand million Euro);
62 According to the provisions of the Treaty of Nice: “The Community shall develop and pursue its actions leading to the strengthening of its economic and social cohesion. In particular, the Community shall aim at reducing disparities between the levels of development of the various regions and the backwardness of the least favoured regions or islands, including rural areas. Official Journal of the European Communities “Consolidated versions of the Treaty on European Union and of the Treaty establishing the European Community” (2002), C 325/2. 63 The ERDF was created in the mid-1970s but significant efforts in terms of programming and financial resources

591 Synthesis report_final.doc 84
Regional Competitiveness and Employment objective regions will receive 15.9% of total (approximately 49 thousand million Euro); and
European Territorial Cooperation will receive 2.5% (amounting to some 7.5 thousand million Euro).
The text of the ERDF regulation for 2007-1364 recognises the importance of promoting competitiveness and creating jobs by acknowledging the objectives of the Integrated Guidelines for Growth and Jobs (2005-2008)65. Accordingly, supporting the development of innovation potential in Europe’s regions will be a key priority in both the Convergence and Regional Competitiveness and Employment objectives. In this context, the recent so-called ‘Aho Report’ on Creating an Innovative Europe66 called for Member States to commit from the funds a “minimum voluntary commitment” in favour of research and innovation the order of 20%. If such a target is pursued, it would mean a significant increase of funding earmarked for the goal of increasing research and innovation activities. In other words, the investment for research, technological development and innovation would be roughly a six fold increase during 2007-13 (approximately 61.6 thousand million Euro for 2007-13 compared to 10.2 thousand million Euro during 2000-2006). This concluding section aims to provide a set of strategic reflections on to what extent and how such a large spending increase could really be achieved. The section is structured around the five key questions set by the Commission for the evaluation: • How can regional policy contribute, through SFs, to raise the research and
innovation potential of the EU? • What types of initiatives are likely to speed up the rate and scope of innovation in
the EU? • What is the best combination of measures to enhance the research capacities and
make an optimal use of existing potential? • What can be done to promote technology transfer and better cooperation between
universities, research centres and businesses, particularly SMEs? • Are there any specific instruments, which could be mobilised to ensure easier
access to finance for innovative enterprises? The preceeding analysis of this evaluation suggest that there are four key challenges, in terms of content and strategic design of programmes which need to be addressed in the next programming period: (i) A greater recognition of the diversity of regional innovation potential implies
distinct ‘tailor-made’ approaches to target setting and programming of innovative measures in Europe’s regions.
The evaluation suggests that there is no single ‘best combination of measures’ but rather a need to adapt the policy mix to the specific regional needs and
64 Council regulation of 11 July 2006 laying down general provisions on the European Regional Development Fund, the European Social Fund and the Cohesion Fund and repealing Regulation (EC) No 1260/1999. OJ L 205, 6.8.2005, p. 21. 65 As set out by Council decision 2005/600/EC of 12 July 2005 66 Prepared by an independent expert group on R&D and innovation appointed at the request of the October 2005 Hampton Court Summit. Esko Aho et al. (2006) “Creating an Innovative Europe”, p. 17.

591 Synthesis report_final.doc 85
potentials for each of the main types of regional knowledge economies. What is evident is that the Aho report proposal of a minimum 20% investment in innovation and knowledge in future Structural Fund programmes will be impossible to obtain without resorting to poor value for money ‘R&D infrastructure projects’ on a grand scale. Yet many regions need to face up to the fact that they are primarily ‘users’ of technologies and know-how ‘invented’ elsewhere and focus more on developing effective policies aimed at diffusing and applying such knowledge, than building up ‘advanced research infrastructure’ at the risk of costly duplication and further fragmentation of the ‘European Research Area’.
(ii) There is a need to launch and test more ‘complex projects’ or ‘multi-actor-multi-measure’ initiatives with a clear focus on marketable applications of new technologies rather than R&D infrastructure based approaches to technology development and transfer. The effects of Structural Fund support for innovation and knowledge has not always been significant in terms of over-coming ‘system failures’ in regional innovation systems. A more strategic and systemic approach to focusing on key, existing or emerging, regional strengths in markets or technologies is required if Structural Fund expenditure is to lead to more radical system innovations.
(iii) There is a need for a longer-term planning and more sustainable process of strategic management of regional innovation policies. The lack of an underlying strategic framework for Structural Fund innovation and knowledge measures in many regions is evident. In Western Europe, this has been due to a fragmented zoning map, leading to sub-regionalism and initiatives with limited critical mass or likelihood of achieving ‘excellence’ at European level. In the southern and eastern ‘convergence’ countries, Structural Funds have become or may soon become a surrogate for national innovation policies.
(iv) There is a significant potential for exploiting the new European Territorial Co-operation Objective to create inter-regional innovation platforms. Enterprises operate in specific regional innovation environments but also are linked through (global) value chains67 and innovation networks to other enterprises, suppliers, providers of specialist knowledge, contract research organisations, etc. Regional administrative boundaries mean little in this context, the proximity of a technology centre important for building working relations but not sufficient (if better expertise can be found elsewhere). Equally, (the best) researchers increasingly operate in European wide networks, aiming at bringing together the required expertise and access to research infrastructure. Finally, financial engineering initiatives require a certain scale to generate sufficient ‘deal flow’, mobilise funds (e.g. from business angels or strategic investors) and expert advice, etc.. Creating a ‘high-tech venture fund in every European region is not a solution to the structural weakness of the European venture capital market. Yet, many Structural Fund innovation measures have continued to ignore this reality and encourage an inward looking dynamic of regional actors.
67 A value chain describes the full range of activities that are required to bring a product from its conception to its end use and beyond. This includes activities such as design, production, marketing, distribution and support to the final consumer. The activities that comprise a value chain can be contained within a single firm or divided among different firms. Value chain activities can be contained within a single geographical location or spread over wider areas.

591 Synthesis report_final.doc 86
5.1.1 The role of regional policy in raising research and innovation potential of the EU In a globalising economy, it could be assumed that innovation policy should be a national or even supra-national issue. After all, the concept of the European Research Area (ERA) seeks to overcome three weaknesses the EU suffers from: insufficient funding, lack of an environment to stimulate research and exploit results, and the fragmented nature of activities and the dispersal of resources. Regionalising policy could be seen as counter-productive in such a framework. However, it makes sense to regionalise research and especially innovation policy for at least four reasons68. First of all, innovation processes take place unevenly in geographic space. This is partly due to variety in endowment with production factors and with industrial sectors. Second, innovation networks function differently in various regions (due to socio-cultural reasons but also structure of economy). Third, innovation activity is crucial for economic development and growth on the regional as well as on the national level. It is important to realise that economic development and growth on the two different levels might conflict. Fourth, using a various policy approaches in different regions enables countries to gain much more varied experiences, thereby enabling regions to learn from one another. Assessing the contribution of the Structural Funds to regional research and innovation potential needs to be done against a backdrop of a diverse ‘patchwork’ of innovative regions in Europe. The operational classification of regions into four groups aimed to provide a framework for strategic conclusions, and offers a basis for reflection to policy makers at regional and national levels in terms of the positioning of their region(s) in a wider European context. This evaluation has underlined the important contribution of Structural Funds during 2000-2006 to creating a more level playing field in innovation and knowledge investments across the EU regions. The Structural Funds have an important catalytic role to play in ensuring that regional policies across the EU27 boost strengths, address weaknesses, promote opportunities, and respond to threats of specific regional innovation systems. Hence, it is important during the negotiation of the 2007-13 SF strategic reference framework and operational programmes to focus the discussions on current regional needs and future potential taking into account sectorial, technological and innovation specialisation of regional economies,. Regional policy instruments can play a major role in accelerating economic development and releasing innovation potential of every region in Europe, but it does not mean that each region will become an innovation hot-spot in high-tech industries nor host world acclaimed research centres. Theory and empirical evidence tends to suggest that agglomeration effects create a virtuous circle for a limited number of largely ‘urban regions as national and international nodes’. Hence, many regions (essentially but not exclusively the “Entering the knowledge economy” group) will remain predominantly ‘users’ of knowledge and need to construct their policy intervention around this reality. This does not imply such regions are not innovative rather that the competitiveness of regions in these circumstances is highly dependent 68 See Fritsch, M. and A. Stephan (2005): Regionalization of innovation policy – Introduction to the special issue, in: Research Policy, 34, 1123-1127.

591 Synthesis report_final.doc 87
on the capacity of actors located within them to access leading edge knowledge, develop it into market leading innovations and export these into national and international markets69. Accordingly, ensuring that ‘lagging regions’ have mechanisms for and are open to integration in international knowledge and trading networks is vital. Research suggests that it is the lack of capacity to search for and generate new economic knowledge that limits the capabilities of firms and institutions in less advanced regions. As Simmie (2005) has argued, regional policy makers need to be outward looking in their approach to policy. The export base, trade connections, international connectivity with leading edge firms and institutions are critical to the relative success of the leading innovative regions70. Strategic conclusion 1: diversity of innovation potential in Europe implies equally diverse approaches to priority and target setting!
Designing Structural Fund programmes around an R&D intensity target will lead to perverse effects and inefficient use of funds. Only 21 of 254 regions currently reach an R&D intensity of 3% of GDP71 and concentration of resources is determined by factors (notably historical strengths and global business strategies on location of R&D facilities and internal capacities of regional enterprises) that the Structural Funds can only influence indirectly and in a longer-term perspective.
Recommendations:
Firstly, programme managers for innovation and knowledge measures during 2007-13 need to avoid adopting identikit policy approaches based on a mechanical transfer of practice from elsewhere or following fashion. Investments in nanotechnology research centres do not make sense in all regions, clusters policy are relevant in some circumstances for some industries, etc. The scale of Structural Fund support will also limits what can be done (notably in some convergence regions), requiring in some cases a deliberate choice to concentrate funding on one or two actions with enough critical mass to make a difference. Secondly, programme managers need to adopt a more sophisticated approach making use of a wider range of baseline indicators72 to set relevant targets (e.g. increase in turnover of sales from new products) at priority or measure level.
69 Simmie J. (2003). Innovation and Urban Regions as National and International Nodes. Regional Studies, 6/7, 2003, 607-620 70 Simmie J. (2003). Op. cit. 71 It is estimated that 191.1 thousand million EUR or above 98.1% of the total EU expenditure on R&D was spent in the EU-15 and three Member States, notably Germany (55 thousand million EUR), France (36 thousand million EUR) and the United Kingdom (30 thousand million EUR) accounted for 62%. Eurostat (2006) “R&D expenditure in Europe”, Statistics in focus 06/2006. 72 See for instance: http://trendchart.cordis.lu/scoreboards/scoreboard2005/methodology.cfm

591 Synthesis report_final.doc 88
5.1.2 What types of initiatives are likely to speed up the rate and scope of innovation in the EU? In terms of current performance, a major deficit, across the EU as a whole, remains the intensity of innovation activity in the business sector. However, Structural Fund RTDI measures supported during the current period continue to promote a ‘supply-oriented’ approach to boosting enterprise level innovation. Indeed, there is some evidence that despite 15 years of preaching about ‘systems innovations’ by academics and policy advisors, the ‘linear model’73 is alive and kicking. The rationale for many measures remains a classic market failure argument that enterprises won’t invest in research and innovation because they can’t be assured to reap economic gains. Hence, providing a direct subsidy to reduce risk or funding public or academic researchers is considered as THE solution. In the policy field, this has tended to lead to a bias towards ‘high-tech’ companies irrespective of the evidence on the real extent to which new ‘innovative companies’ create and maintain wealth and employment in regional economies74. The ‘market failure’ argument ignores the significant evidence that an additional real barrier is the internal capacities of companies to design and implement innovation projects. It also ignores what can be termed as ‘systems failures’ where (tacit) knowledge flows and exchange between actors in the innovation system fail to occur due to lack of motivation or incentives to co-operate and institutional (legal and regulatory) barriers. The importance of tacit knowledge places a premium on proximity and provides another rationale for regional level interventions. In this respect, it is important to take into account a number of stylised facts when designing regional innovation policy, these include: • Geographical distance matters for knowledge spillovers: They occur the more
frequently the closer the recipient and the sender of the knowledge are located. • Large firms, in particular multinational companies (MNCs), are a source of
vertical knowledge spillovers, either by providing knowledge for local firms or by tapping into the local knowledge base.
• The better firms are embedded in the regional innovation network the higher is the probability that they innovate and remain competitive.
• Trust in network relationships is crucial for the creation and dissemination of knowledge and innovation.
All of these considerations push toward the conclusion that future Structural Funds investments should give priority to “systemic” instruments, i.e. instruments that are targeting joint developments of business, research and training actors in specific sectors, with a view to enhance innovation. This is the intention of the “innovation or competitiveness poles” approach, which is increasingly popular (France, Belgium, Greece, Finland, Hungary) as well as competence centre types programmes (Austria,
73 Succinctly, the linear model implies that governments fund research in academic or public research institutes, which ‘transfer’ the results to enterprises for product development and hence innovation. An updated version is the drive to “commercialise research results” which ignores that most research results are still several years and millions of Euros away from marketable products. 74 European Commission (2001) “Innovative small and medium sized enterprises and the creation of employment”.
591 Synthesis report_final.doc 89
Estonia, Sweden). Both types of instruments share a number of key properties, i.e. that there is a clear business drive behind them, that all relevant competences sources are brought together towards the goal of raising innovativeness in a sector or group of companies, and that cooperation and networking between companies is at the heart of the initiative. Many existing R&D and innovation subsidy measures financed in the Structural Funds also ignore the non-technological dimension of innovation for the same reasons. Examples of measures focusing on industrial design, strategic intelligence and integrating funding for non-technological innovation do exist and require multiplication across most types of regions. Finally, in many regions, the service sector has a growing role in the economy in terms of contribution to employment and GDP, and for those reasons it has been gaining increasing attention from researchers and policy makers. There are two obstacles in promoting service-innovation based policies. First, the third Community Innovation Survey (CIS 3) shows that, in general, the share of service firms that innovative is still lower when compared with the level of innovation in the manufacturing sector. Second, policymakers tend to focus on innovation in the manufacturing sector rather than in service sector. Yet as recent reports underline there are also opportunities for Member States to extend the target audiences for innovation support to include the service sector; to make existing measures less manufacturing oriented and more sectorally neutral (through changes in eligibility criteria, for example) or to raise awareness of existing innovation support opportunities and their relevance among service sector companies75. Strategic conclusion 2: innovation is primarily an entrepreneurial activity and direct financial support needs to be widened to non-technological and co-operation based instruments The country reports for this evaluation have highlighted a range of Structural Fund measures, which while on paper were responding to innovation needs failed to attract sufficient private sector interest or had low ‘behavioural additionality’76. One inhibiting factor is clearly the bureaucracy in which too many programmes are wrapped up, but this is a widespread issue in Structural Fund programme not specific to RTDI measures. (See also section 5.2). However, a key factor influencing take-up of schemes is the design and delivery of support measures for enterprises, which too often fail to take into account the lack of in-house capacities of many SMEs and the importance of non-technological aspects of the innovation process (including design, marketing and organisational factors). Equally constraints for SMEs to exploit their innovation potential due to information asymmetries must be removed, or alleviated, through government action to connect SMEs into more and better networks with universities and other technology organisations as well as interaction and joint development across value chains, business to business. Regional administrative boundaries should not be a criteria for selecting partners and
75 Cunningham P. (2006) “Innovation in Services”, European Trend Chart on Innovation, Policy Review Workshop 10, p. 33, www.trendchart.org 76 Defined as the difference in firm behaviour resulting from an intervention. The assumption is that the behaviour is changed in a desirable direction, though an evaluation should also be sensitive to perverse effects, for example encouraging firms to take risks that they cannot afford. Another definition is changes in the behaviour of firms inducing a more efficient transformation of innovation inputs to innovation outputs; these changes should be permanent in character (e.g. collaboration)”. See: http://www.oecd.org/dataoecd/54/12/34509835.pdf

591 Synthesis report_final.doc 90
opening of programmes across borders or to non-national participants should be envisaged. Recommendations: Demand side or direct support to enterprises should be focused on three critical factors for boosting the rate and scope of innovation: support for recruitment and exchange of scientific and engineering staff (but also
industrial designers, innovation management specialists, etc.) by enterprises should be given preference over more standard ‘project-driven’ grants where behavioural additionality of the funding is less evident. Introducing new ideas and boosting available skilled ‘innovation staff’ in companies should be a first priority for direct funding schemes during 2007-13. This approach also has the advantage of supporting innovation while stimulating employment creation.
Opening up R&D and innovation support schemes to a broader definition of innovation to include design and other non-technological innovation aspects as well as in sectoral terms considering the launching of specific actions towards creative industries, tourism and other service sectors.
Connecting small to medium sized enterprises to providers of knowledge able to inform and assist with product life-cycle renewal as well as large firms and ‘customers’ who provide insight into market trends, future product requirements, etc. should be facilitated. A range of possible types of measures exists and have been tried and tested in various regions and members states. Such actions should integrate as a pre-condition an extra-regional dimension and should integrate medium-large regional (particularly foreign investment owned) firms in order to create improved value chain linkages.
5.1.3 Waking up Europe’s innovative potential: the right policy mix? If the EU’s regional policy has an important role in enabling different types of regional economies to develop policy solutions which fit specific needs and potential. In this context, the next logical question turn to the question of what is the best combination of measures to enhance research and innovation capacities and make an optimal use of existing potential? Partly due to programme managers keeping an eye on financial absorption, partly out of a lack of strategic vision, the current round of Structural Fund RTDI measures has been very much ‘business as usual’ through implementation of tried and tested measures. In many regions, RTDI measures remain driven by ‘opportunistic’ and ‘self-serving’ tactics of specific key players in the regional innovation system. Even in highly federalised countries, many regional programmes are barely distinguishable from one another despite significant differences in capacities and potential of regional innovation systems. The curse of what the French report has called ‘identikit’ programmes needs to be avoided. If Structural Funds investments in innovation and knowledge are to make a difference in 2007-13, the design and management of the measures needs to take a qualitative leap forward to favour a more selective and strategic focusing of resources. The focus should be placed on measures with proven ‘behavioural additionality’ and avoiding sub-critical, single organisation driven investments in buildings and equipment. This report argues that the specific contribution of the Structural Funds to regional innovation and knowledge policies needs to take into consideration three criteria: a) the economic and innovation profile of the region; b) the capacities of policy-making and implementation structures; c) the elements of the regional policy mix where the value added of Community intervention is highest.

591 Synthesis report_final.doc 91
The exhibit below proposes a prioritised approach to Structural Fund programming of innovation and knowledge measures for 2007-13 for each of the four types of regions. The prioritisation should not be read as an indication of shares in terms of absolute values of Structural Funds support (i.e. the highest priority measure for a specific group may not absorb the largest share of funds) but rather reflects the relative value added of EU regional policy interventions as well as the current state of development of capacities to implement certain types of policies. Exhibit 25: Prioritising Structural Fund support for innovation & knowledge
Global consolidation regions For this group the level of financial support through the Structural Funds will be relatively limited compared to own regional or national resources invested in these regions. These regions need to develop strategies for competing in knowledge creation at global level while maximising the regional (and inter-regional) spill-overs of the critical mass of knowledge. For a regional policy combining Lisbon Strategy with ‘convergence’ objectives, these regions pose a specific challenge. They clearly are already national and even European ‘powerhouses’ and often act as magnets for the most skilled people and available capital, at the cost of other more peripheral regions. Yet, from a Lisbon Strategy perspective, increasing their innovation and knowledge potential is critical for their chances to continue to compete with other major metropolitan regions around the world77. Accordingly, the Structural Funds need to ensure that the knowledge and potential concentrated in these regions is harnessed for the broader benefit of Europe’s regions. The PAXIS ‘Regions of Excellence’ initiative78 underlined the policy learning potential in various fields amongst these leading regions and future programmes under the Territorial Cohesion objective could support further deepening and widening of such networks with a view to more structured and action oriented co-operation. 77 This is not a purely EU concern, see for instance, the analysis of Richard Florida for the US concerning the clustering of highly educated people in a few cities. “Where the Brains Are”, Atlantic Monthly, October 2006. 78 http://cordis.europa.eu/paxis/src/reg_ex.htm
Global
consolidation
Sustaining
competitive
advantage
Boosting
entrepreneurial
knowledge
Entering
knowledge
economy
Improving governance
capacities for innovation and
knowledge policies
* ** **** *****
Innovation friendly environment**** **** ***** ****
Knowledge transfer and
technology diffusion to
enterprises
**** **** ***** ****
Innovation poles and clusters* ***** **** ***
Support to creation and growth
of innovative enterprises
***** ** **** ***
Boosting applied research and
product development* * ** *****
***** High priority - sustained funding required to tackle critical weakness(es)
**** Growing priority - increased funding required to boost innovation potential
*** Early days - preconditions for funding not yet (fully) present
** Cruise control - rationalisation of/improved targeting of funding
* Low priority - no significant needs or community value added

591 Synthesis report_final.doc 92
A major concern for these regions is to strive to remain attractive for mobile knowledge factors: corporate R&D budgets and investments, ‘high-achievers’ in science, business, culture and administration. This requires linking explicitly regional research and innovation policies to inward investment policies, land and urban planning and environmental policies. The attractiveness of Europe’s leading ‘innovation hotspots’ as location sites for enterprises or as homes for the ‘creative class’ depends on the sustainable development of these urban and peri-urban areas (quality of life, congestion and travel to work time, pollution, arts and sports facilities, etc.). A second concern for these areas is to continue to develop new clusters of enterprises in advanced manufacturing sectors, creative industries and knowledge-based services. A sustained focus on creation and growth of innovative enterprises (spin-outs and spin-offs) will be required during 2007-13. Exhibit 26: Global Consolidation regions – strategic recommendations
Key strategic messages
• Becoming or maintaining position as international innovation and knowledge hubs • Enhance strengths in cutting edge pervasive technologies (ICT, nano-micro, materials, life
sciences, renewable energy)
Needs Potential Potential focus of Structural Fund support
Attracting and retaining corporate R&D facilities and human capital
Urban regeneration driven by emerging sectors and new firm creation in creative and knowledge intensive services
Improved strategic management of innovation issues
Manage transport congestion and environmental issues
Commercialisation of breakthroughs in advanced technologies (ICT, medical, etc.)
Strengthening clusters in creative industries79 and eco-industries80
New public-private partnerships (PPP) for testing and developing specific technologies (e-government, public transport, etc.)
Developing clusters in emerging strategic areas such as creative industry, life-sciences, eco-industries etc.
Competence centre type projects to increase networking of universities and smaller firms
Major projects to test/develop new technologies for urban/ public services, etc.
Regions as lead partners of inter-regional networks in advanced technologies
Public-private partnership (PPP) should be favoured in these regions where business and academic pockets are generally deeper. PPP could be used in a number of areas such as the creation of early stage investment funds and incubator facilities for start-ups and spin-offs; ‘large-open laboratories’ for testing new technologies in urban or regional wide context (e.g. transport or logistic technologies, new media & digital communications advances, wireless technologies); mechanisms for joint investment in specific research facilities (charitable trusts). 79 The UK Government’s Department for Culture, Media and Sport (DCMS) define the Creative Industries as: “those industries which have their origin in individual creativity, skill and talent and which have a potential for wealth and job creation through the generation and exploitation of intellectual property.” The list includes the following sectors: Advertising, Architecture, Art & Antiques, Crafts, Design, Designer Fashion, Film and Video, Interactive Leisure Software, Music Performing Arts, Publishing, Software & Computer Services, Television & Radio. 80 See : http://www.europe-innova.org/servlet/Doc?cid=6005&lg=EN for a recent analysis of eco-industries in Europe.

591 Synthesis report_final.doc 93
Sustaining competitive advantage regions The group is the core of the central-western European industrial system. Many of the major cities and university towns in these regions face challenges similar to those of the global consolidation group of regions. Yet on average, the challenges reflect a stronger continuing dominance of industrial activities. Consolidating competitive advantage in high value-added manufacturing activities while diversifying the economic structure into knowledge intensive services is hence the key issue for these regions. These regions offer good growth potential in a number of advanced technology fields but more needs to be done to develop and integrate public research facilities with the economic fabric. Company demographic trends vary but in general country reports for this study flagged up the need for further efforts to boost entrepreneurship and new firm creation. Structural Fund investments in these regions should be focused on the following types of initiatives: • Boosting knowledge creation in regional innovation systems through a few
selected major strategic investments in e.g. clusters or innovation poles type of initiatives. Structural Funds measures in these regions should avoid funding RTDI infrastructure. Nevertheless, in the context of developing a limited number of highly competitive innovation poles PPP-based targeted investments may be relevant (see the French Competitiveness Poles model). Regional and national authorities should monitor and critically evaluate the structuring effect of these measures.
• Rationalising the research system as well as the network of business support intermediaries. This should be done through more competitive selection procedures and by evaluating and then shutting down under-performing organisations or units. Too many regional ‘technology/innovation’ centres lack a viable business model beyond public subsidies. The Commission should be attentive to the need to phase out subsidies over time for many intermediary structures.
• Speeding up the shift to ‘knowledge based services’. This should involve re-thinking state aid schemes to enterprises to integrate better the service sector, supporting regional clusters in knowledge-based services or creative industries, or developing programmes to support innovation in the public sector (health, education, etc.) as driver of new market opportunities for regional SMEs.
• Catalysing a radical greening of economies: in these regions emerging markets based on eco-innovation and extending traditional support for ‘science parks’ to supporting the operational application of ‘industrial ecology’ concepts represents an opportunity for SF to ‘do something different’.
Research and innovation partnerships from these regions are well placed to lead and organise the structuring of inter-regional ‘clusters’ and technology platform type in specific sectors. Future territorial co-operation programmes need to shift up a gear from the ‘soft’ networking and exchange of experience type activities to funding joint programmes of industrial research or technology development. Ensuring synergies with ERANET, INNONETS and technology platforms supported under the Framework Programme is crucial here.

591 Synthesis report_final.doc 94
Exhibit 27: Sustaining competitive advantage – strategic recommendations
Key strategic messages • Consolidate competitive advantage in high value-added manufacturing activities • Maintain higher value added activities (research, marketing etc) within value chains • Diversify the economic structure into knowledge intensive services
Needs Potential Potential focus of Structural Fund support
Rationalise regional innovation intermediary networks (networks or umbrella agencies)
Boost S&E graduates to avoid skills bottlenecks;
Diversify corporate R&D beyond a few key actors, attraction of R&D intensive FDI;
Reinforce ‘innovative poles and clusters’ to retain jobs in high-tech manufacturing
Increase levels of entrepreneurial activity
Shifting into higher value added segments of existing sectors (automotive);
Increasing number of ‘entrepreneurial universities’;
Growth potential in renewable energy and eco-industries;
Diversification towards knowledge intensive service activities81
Competitiveness / innovation poles in core or emerging regional sectors;
Promotion of S&E careers and research-industry and international mobility;
Mentoring, innovation management tools, etc. for boosting entrepreneurship
Regions as lead partners in EU level sectoral innovation networks (automotive, electronics, etc.).
Boosting entrepreneurial knowledge regions For the third type of regions there is a need to achieve a better balance between the relatively strong public R&D base, further strengthened over the last decade including with Structural Fund support, and insufficient private sector innovation efforts. Improving governance of regional innovation policies should be a growing priority in these regions, where partnership based approaches, evaluation and foresight type techniques have only been introduced since the late 1990s. In the northern Spanish or eastern German regions which make up the bulk of these regions this is particularly true and institutional weaknesses represent on average a significant barrier to medium-term improvements in innovation potential. Since improving the co-operation between the R&D sector and industry as well as strengthening strategic R&D fields in the academic and public R&D sector emerge as the major challenges, there is a need for intervention at two levels: the RTDI system as a whole and RTDI performers individually, with a combination of hard measures such as academic spin-offs, innovative start-ups, and goal-oriented projects for a group of enterprises. Like the preceeding group of regions, Structural Fund support for R&D and technology development could be concentrated around a limited number of ‘poles’ in 81 KISA refers to the production and integration of service activities undertaken by firms or public sector actors in the context of manufacturing or services, in combination with manufactured outputs or as stand-alone services. Typical examples of KISA include research and development (R&D), management consulting, information and communications services, human resource management and employment services, legal services (including those related to intellectual property rights) accounting, financing, and marketing-related service activities.

591 Synthesis report_final.doc 95
which the potential for excelling on a European level exists, but which are also strongly anchored in the regional economic tissue. Regions in this group could also usefully learn from experience in the UK or Nordic countries in going beyond rather standard efforts to promote research commercialisation by extending this to efforts to developing an “entrepreneurial spirit” in regional universities (see next section for more on this issue). This could include programmes aimed at greater research-industry mobility (the Walloon region of Belgium which is in this group has developed the FIRST group of mobility schemes an example which others could study). Another possible approach is stimulating more collaborate efforts towards application-oriented research, an example being the competence centre model operational in Austria and Sweden. Territorial co-operation actions could focus on support for the internationalisation of regional clusters, with a view to assisting actors to break out of relatively closed regional innovation systems. Ideally, this could be done through encouraging mobility of staff between cluster participants, or funding joint innovation projects between several firms and research organisations from several different regions, rather than continuing purely ‘relational’ networking activities funded to date under INTERREG, etc. Exhibit 28: Boosting entrepreneurial knowledge regions – strategic recommendations
Key strategic messages • Encourage and support science-business cooperation • Support traditional industries to diversify through the uptake of pervasive technologies • Develop current niches (public and private) into competitiveness poles • Strengthen regional innovation system and improve governance of regional innovation
policies
Needs Potential Potential focus of Structural Fund support
Boost regional strategy and foresight activities and rationalise intermediary networks;
Achieve better balance between public and private R&D effort;
Overcoming skills mis-match/gaps
Foster increased entrepreneurship including research based spin-offs;
Boost technology adoption in regional SMEs
Consolidate position as national or inter-regional nodes of specialisation in specific technology niches
Good potential for higher value tourism and creative industries (urban centres);
Competitive centres of excellence in specific advanced research fields.
Focus on systemic instruments such as competence centres, industry-academic joint R&D, etc.
Support to universities propensity to engage in entrepreneurial activities;
Mentoring, innovation management tools, etc. for boosting entrepreneurship
Support for internationalisation of regional clusters/poles in inter-regional projects

591 Synthesis report_final.doc 96
Entering knowledge economy regions For this group the scale of the challenge is significant because nearly all aspects could be prioritised, due to their generally weak performance in innovation indicators. A first level priority is evidently the need to develop regional strategic policy frameworks by regional administration in close co-operation with representatives of industry, academia and central level. Such strategies need to move beyond the first-generation regional innovation strategy approach to marry concrete support for specific pilot actions involving regional firms and academic or public research organisations with on-going work to develop strategies for specific sub-sectors, evaluate needs and policy implementation, etc. Distilled from the country reports, the following types of actions should be favoured in the 2007-13 programming period: (i) promote innovation in ‘low-tech’ or traditional sectors; (ii) support for emerging sectors or specific opportunities to shifting tourism and related services into higher value added sectors (multifunctional agriculture space and promote tourism). Examples of priority actions in this type of region include: • Significant governance weaknesses suggest need for split of responsibilities:
regional level doing pilot actions, partnership based projects vs national level running grant schemes, etc. The LEGITE project and Regional Innovation Agent Network in Castilla-y-Leon is one example.
• Eastern Cohesion regions is only group in which significant investment in ‘basic research’ infrastructure is justified. However, this needs to be part of a strategic approach and not just ‘structural or basic operational funding’ for academic or research institutes. An example of a strategic approach is the Irish PRTLI model.
• Boosting innovation in “traditional industries” can be done through tailored grant and support schemes. Examples from the country report include the French OSEO global grant or Danish Metal Supply project.
In these regions, the importance of innovation in traditional or low-tech sectors, which remain a major contributor to GDP employment in these regions and particularly incremental innovation should not be forgotten82. Support measures aimed at raising awareness of innovation, promoting innovation management, etc., need to be promoted to begin to create capacity and demand for innovation type projects over time.
82 The 2005 summary of the result of the PILOT project (funded under FP5, see www.pilotproject.org), found that most growth and employment in OECD countries still emanate from so-called LMT industries. See for instance, Hirsch-Kreinsen, H. “Low-Technology”: A Forgotten Sector In Innovation Policy, Paper presented at the ProAct Conference, 15-17 March 2006, Finland.

591 Synthesis report_final.doc 97
Exhibit 29: Entering knowledge economy – strategic recommendations
Key strategic messages • develop operational innovation policy frameworks based on regional partnership • Develop new specialisation areas by combining local advantages in traditional industries
with knowledge intensive activities. • Restructure agricultural areas through multifunctional rural activities. • Develop new trajectory for tourism industry by linking it to other high value added activities
and provision of advanced logistics and ICT for the personalisation of services. • Exploit untapped potential in renewable energy and tackle environmental degradation by
introducing clean technologies.
Needs Potential Potential focus of Structural Fund support
Develop adequate governance and innovation intermediary structures;
Boost low levels of business R&D, notably through attracting FDI;
Rationalise R&D base (e.g. R&D infrastructure, RTDI human resources) into viable centres of excellence;
Raising productivity and product innovation in traditional sectors still dominating employment and regional GDP.
Shifting tourism and related services into higher revenue brackets
Demand for innovation related to modernisation of public services, etc.
New business opportunities from integration biotech – agro-industries;
Renewable energies and sustainable use of natural resources;
Internationalisation by integration of regional firms into global value chains.
Renew regional innovation strategies focusing on specific technologies and sectors.
Support innovative initiatives based on the actual regional potential e.g. in traditional low-tech sectors;
Productivity / technology grant for SMEs;
Profile human resources according to the needs of economy (e.g. placement schemes)
Creation of cross-border research or innovation networks to create critical mass

591 Synthesis report_final.doc 98
5.1.4 What can be done to promote technology transfer and better cooperation between universities, research centres and businesses, particularly SMEs? This question implicitly makes the assumption that businesses need to co-operate with other firms (large and small), contract research organisations, university research teams and public or other non-profit research centres83. It is well documented that only a relatively small proportion of companies collaborate directly with universities. In most innovation surveys around 5% of enterprises with innovative activity report such collaboration. Nevertheless, the more relevant question is whether companies engaged in collaboration with a university have better performance than others? A recent survey based on the 3rd Community Innovation Survey (CIS3) results in the UK84 suggests that there are grounds for arguing that there is a good probability of positive effect for companies that do collaborate with universities, but that the types of effects and the intensity vary depending on location of the university partner. Co-operation with regional universities is undertaken to provide more concrete, while partnerships with universities in other European countries (or beyond) are undertaken to access cutting edge knowledge85. This underlines once again, that policy interventions, through the Structural Funds, which focus too much on building up local ‘technology supply’ to support local enterprises risk creating a ‘closed and introspective’ regional networks and innovation system. These types of reflections lead to a dual rationale for public policy intervention in favour of increasing ‘knowledge transfer’ between enterprises and academic/public research. Firstly, recent theoretical developments and empirical evidence reinforce the importance of a shift in business strategies to what has been called ‘open innovation’. At its root, open innovation assumes that knowledge is widely distributed, and that even the most capable R&D organisations must identify, connect to, and leverage external knowledge sources as a core process in innovation. This concept acknowledges that valuable ideas
83 One of the best recent reviews of the issues concerning university-industry linkages was provide by the 2003 Lambert Review of Business-University Collaboration, commissioned by the UK Treasury. See: http://www.hm-treasury.gov.uk./media/DDE/65/lambert_review_final_450.pdf 84 DTI Occasional Paper No.6, Innovation in the UK: Indicators and Insights, July 2006. See : www.dti.gov.uk 85 The DTI report finds that “The effects of innovation on range, market share and quality are greatest for those (UK companies) who collaborate with universities in Europe. By contrast, the effects of innovation on capacity, costs and environmental impacts are greatest for those who collaborate with UK universities. And in general, the effects of innovation on these performance measures are weaker amongst those companies that collaborate with local or regional universities. These results make some intuitive sense. International collaboration is likely to expose the company to the most exciting scientific advances, but for certain purposes collaboration with a UK university is more effective – perhaps because the transactions costs of co-operation at a distance and across national boundaries can be substantial”.
Box 27: High Tech Campus in Eindhoven
The High Tech Campus in Eindhoven is an interesting example because although the campus is a physical location bringing together different public and private research groups, the strategy is to work with partners in the extended cross-border Leuven-Aachen-Eindhoven ‘innovation triangle’, as well as with other partner regions through the EU. Source: www.hightechcampus.nl.

591 Synthesis report_final.doc 99
can come from inside or outside the company and can go to market from inside or outside the company as well86. This notion has implications for regional innovation policy and a number of regions have already started to develop projects inspired by this concept (see box). The open innovation concept at regional level transcends a simple application locally of the basic principles and acknowledges the importance of inter-regional linkages. Secondly, the so-called ‘triple-helix’ model underlines that university-industry-government interaction is the key to improving the conditions for innovation in a knowledge-based society87. The triple helix denotes not only the relationship of university, industry and government, but also internal transformation within each of these spheres. Increasingly, universities accept that their missions have evolved from being an institution which combines teaching with research, to a third mission relating to supporting economic and social development of the territory in which it is located. An “entrepreneurial university”88 in which research results are routinely scrutinized for commercial as well as scientific potential is becoming the model academic institution. Increasingly, policy-makers need to support the transition of regional universities in developing the internal capabilities to translate research results into intellectual property and economic activity. There is a range of examples of initiatives to support universities to developing this third mission and to developing ‘entrepreneurship’ in the academic sector across the EU. However, even in the relatively more advanced Nordic countries, a recent report89 has underlined that “so far this is an underexploited mechanism for promoting academic entrepreneurship, which could be used more widely and be stimulated by policy makers”. While there are entrepreneurship programmes in the field of business administration, there are only a few that build upon basic studies in science, technology and medicine, where the real opportunities for creating new high-growth firms are larger. Consequently, a focus on entrepreneurship programmes closely related to science, engineering and medicine should be promoted strongly. While, there is no simple one-fits-all ‘set of rules’ for designing and implementing measures in this area90, some ‘good practice’ examples and available evaluations91 do
86 A fact corroborated by the Community Innovation Survey results. Only 38% of enterprises with innovation activity citing internal sources as highly important (CISIII), while external sources such as clients, suppliers and competitors all score relatively highly as well. 87 Etzkowitz H. & L. Leydesdorff, The dynamics of innovation: from National Systems and ‘‘Mode 2’’ to a Triple Helix of university–industry–government relations. Research Policy 29 2000.109–123. Industry is a member of the triple helix as the locus of production; government as the source of contractual relations that guarantee stable interactions and exchange; the university as a source of new knowledge and technology. 88 Etzkowitz H., Research groups as ‘quasi-firms’: the invention of the entrepreneurial university. Research Policy 32 (2003) 109–121. He argues that a dual overlapping network of academic research groups and start-up firms, cross-cut with alliances among large firms, universities and the start-ups themselves appears to be the emerging pattern of academic-business intersection in bio-technology, computer science and similar fields. 89 Sjölander S. et al, Entrepreneurial learning & academic spin-offs – Project report to Nordic Innovation Centre, January 2005. http://www.nordicinnovation.net/_img/entrepreneurial_learning_final_report.pdf 90 See for instance, the results of the MAP project which looked at competence centre and clusters : http://www.map-network.net/publications/roadMAP.pdf

591 Synthesis report_final.doc 100
provide a number of guiding principles for the operation of such schemes. The country reports for this evaluation identified a number of interesting cases, funded by the Structural Funds, aimed at technology transfer, research commercialisation and promoting linkages between business and industry including: the Kplus, Kind, Knet (Austria), the Finnish Stone Centre, regional competence centres in Italy, and the Technium network in Wales. The Guidelines already published by DG REGIO incorporate much of this type of thinking. This evaluation tends to support an increased emphasis not so much on the classical model of “one-to-one, one-off technology transfer”, but rather on a more collaborative model of technology development and diffusion where the role and strategies of the different actors (enterprises, universities, governments) need to co-evolve and become systematically aligned.
5.1.5 Ensuring easier access to finance for innovative enterprises The focus of the policy debate on risk capital has shifted from whether governments should intervene to the question of how can policy makers best work with markets to stimulate the provision of risk capital for businesses with high growth potential92. Despite efforts in recent years to facilitate access to risk capital financing with assistance of SF interventions and other Community initiatives the risk capital markets in Europe are functioning below their potential. Although European venture capital investments reached a record level of 47 bln EUR in 2005, representing a 27% increase compared to the amount invested in 2004 (€36.9 billion)93, less than 0.1% of European GDP was invested as early stage venture capital94, which was in 2004 was half the level of the US. The need for pan-European early stage technology funds is now recognised since such funds offer economies of scale and scope similar to those of successful US technology funds. Yet the overall gap of venture capital investment in Europe, when compared to the US is just a part of the problem. At the same time, there is an acknowledged 'equity gap' at the lower end of the market. EU companies encounter major difficulties in raising risk capital from 300,000 EUR to 3 MEUR, and this situation is particularly severe in less-developed regions, further away from the main financial centres. In this context, an important challenge for EU regional policy is to improve access to equity capital for smaller, high-potential companies. The core problem is that venture capital funds are concentrating on larger deals, leaving the small and risky early-stage deals projects aside95. Accordingly, bank loans remain the main source of funding for majority of entrepreneurs and small firms in Europe. At regional level, public intervention can aim to stimulate private sector investors to provide
91 See for instance: Impacts of the Swedish Competence Centres Programme 1995 – 2003, Erik Arnold, John Clark, Sophie Bussillet http://www.vinnova.se/upload/EPiStorePDF/va-04-03.pdf 92 European Commission (2005) “Conference Report on the Risk Capital Summit 2005: Investing for Growth and Competitiveness in Europe”. 93 European Private Equity and Venture Capital (2006) “EVCA Yearbook 2006”, p. 42. 94 See: http://epp.eurostat.ec.europa.eu/ 95 United States Department of Commerce International Trade Administration and European Commission Directorate-General for Enterprise and Industry (2005) “Working group on venture capital”, final report.

591 Synthesis report_final.doc 101
small-scale risk finance for SMEs with growth potential, while avoiding excessively small local funds96. The new JEREMIE initiative has been designed to facilitate SMEs access to capital, by providing a possibility of outsourcing the management of financial engineering and SME finance programmes to the EIF. Another recent development is the so-called Risk-Sharing Finance Facility in the scope of which the EIB will use the Community grant resources together with its own funds to cover part of risks associated with projects that have a higher risk profile. These two initiatives can be considered as attempts to respond to the weakness of limited capacity to manage financial engineering schemes at local level and to overcome risk aversion in financing innovative projects though the SF. Moreover, there is a need for new forms of financing innovation, combining some of the features of equity investment and loans. Such hybrid instruments of equity and loan have both pros and cons. On the side of advantages, they offer both flexibility and alternative financing opportunities in support of innovative and high-growth companies. Also, they can help to remedy some cultural European characteristics such as risk aversion and reluctance of entrepreneurs to share control of their business. Nonetheless, it has to be noted that mezzanine finance products are not soft loans and come at a higher price. Taking into account that the CIP intends to support mezzanine finance at European level, it appears to be a good idea to test such type of support instruments in the framework of SF interventions. It should be noted, however, that venture capital oriented measures alone will not be a panacea for all early-stage innovation financing problems97. These measures should be always integrated into a broader innovation policy logic adapted to the specific regional context. In conclusion, the main recommendations for SF in this policy area include: invest in national and, when justifiable regional, co-investment funds; support diversified forms of financing innovation e.g. SME guarantee schemes,
etc.; implement investment readiness programmes for SMEs; and support co-operation between banks, venture capitalists and business angel
associations in order to improve access to risk capital for high-growth companies throughout their financing cycle.
96 See for instance the UK Regional Venture Capital Funds scheme, http://www.sbs.gov.uk 97 European Commission (2006) “The Paxis Manual for innovation policy makers and practitioners: Analysis and transfer of innovation policy tools, methodologies and policies”, p. 27.
Box 28: SME guarantee schemes
SME guarantee schemes offer a partial guarantee of loan repayment to a bank. The recent report on Guarantees and Mutual Guarantees prepared by Expert Group BEST Practice in the field of Guarantees suggested that the Structural Funds could make their contribution to an increased future role of guarantees in the EU by providing funding to guarantee schemes to cover part of their risks. Source: Independent Expert Group (2005), Guarantees and Mutual Guarantees, p.5.
591 Synthesis report_final.doc 102
5.2 Operational guidelines to maximise effectiveness of Structural Fund interventions for innovation and knowledge This evaluation has underlined a range of issues concerning the management of Structural Fund interventions for innovation and knowledge that have undermined the effectiveness and impact of their implementation. This section proposes a set of guidelines or recommendations aimed at both the Commission services and Members States and regional authorities.
5.2.1 Recommendations to the Member States and regional administrations Recommendations can be formulated at five broad levels of governance, namely:
• Policy-formulation level: concerning general legal frameworks, governance processes and ‘cultural’ issues within or above a given innovation system
In medium to large Member States, there is a clear need to take action to improve co-ordination amongst regional programmes and policies, both horizontally between regions and vertically with central government departments. An approach via inter-ministerial ‘committees’ does not necessarily seem optimal (e.g. Spanish experience). Rather investment in strategic intelligence tools such as policy benchmarking, foresight, inter-regional co-operation programmes can create a voluntary exchange of now-how.
• Programme design for innovation and knowledge, programme specific laws, regulations and practices, processes for designing such measures, etc.
A series of recommendations can be formulated here related to adopting a phased approach to implementing innovation and knowledge interventions (e.g. raising capabilities in SMEs to undertake projects before launching new funding schemes, sectoral road-maps or foresight as a basis for future technology programmes, etc.). Equally, avoiding funding sub-critical programmes or measures in favour of larger, ‘riskier’ but if successful more structuring projects. Bottom-up initiatives can still be supported but for instance could be delivered through a global grant to a regional organisation, responsible for selecting projects based on a competitive call.
• Relations between policy making institutions like ministries and operative funding agencies (whether they be theme specific or Structural Fund management agencies)
At the level of relations between policy makers and operational agencies, the need to rationalise and review research and innovation intermediary networks has been already underlined. In many regions, the funding levels of such organisations are not sustainable without the inflow of EU funds.
• Contracts and relations between operative funding agencies and their clients In terms of relations with clients (or the final beneficiary), excessive red-tape and formalities of reporting are clearly a turn-off in most Member States even for academic and public/non-profit organisations. More flexible and risk tolerant practices in the implementation of the instruments are required. One way of improving selection processes and reassuring observers on the quality of governance is to internationalise selection procedures for innovation and knowledge measures.

591 Synthesis report_final.doc 103
All major investment projects (creation of new technology centres, specific investments in centres of excellence, etc.) as well as selection of projects involving the structuring of innovation potential in poles or clusters should be selected in this way.
• Co-operation culture, rules and procedures between consortia or co-operation networks active in the region.
Finally in terms of co-operation between different actors in the systems (enterprises, research organisations, etc.) two issues need addressed. First, regional policy makers need to ensure they are aware of legal or institutional barriers. Issues such as the strategy of specific organisations with respect to projecting and exploiting intellectual property need careful attention to avoid perverse results. Secondly, a reasoned analysis of the existing culture for cooperation is required before launching wide-ranging cluster measures.
5.2.2 Recommendations to the Commission services
• Reinforce understanding and awareness amongst DG REGIO geographic units of the concepts, issues and operational methods for management and scrutiny of innovation and knowledge type methods
As part of this evaluation, a round of interviews were carried out with the DG REGIO geographic units responsible for appraising, negotiating and monitoring the National Strategic Reference Frameworks and operational programmes in specific Member States. While in some units, certain officials displayed a good understanding of the issues, in most cases understanding was at best patchy and most had little or no operational experience in this field. Officials in each unit with responsibility for innovation and knowledge type measures should be clearly designated and form a core team. The possibility of developing a set of guides on key issues related to the design, implementation and of innovation measures as delivery of related training should be envisaged with a view to an effective monitoring of NSRF and operational programmes.
• Commission a series of studies or focused evaluations to deepen understanding of what types of measures are most effective in boosting regional innovation potential.
This evaluation by its nature has only been able to compile and synthesis available evidence on the outcomes of innovation and knowledge type measures. Cross-cutting regional analysis of similar measures (e.g. reimbursable loans for product development, industry-science mobility schemes, etc.) could provide greater insight into which types of measures offer the greatest behavioural additionality.
This action could be done in co-operation with the European TrendChart on Innovation (PRO-INNO) and ERAWATCH initiatives (respectively of DG Enterprise and DG Research) which are both seeking to extend their coverage and analysis of regional level innovation and research policies. Carrying out a co-ordinated series of review of regional innovation systems and policies across the different types of ‘knowledge economies’ would provide much greater insight into what works and why, and in what institutional context.

591 Synthesis report_final.doc 104
Expanding and reinforcing the available set of methodological guides on evaluation of Structural Fund interventions to cover more adequately the techniques and approaches to evaluation the various types of innovation and knowledge measures would also be advisable.
• Work with Eurostat, other Commission services and national and regional authorities to radically improve over the programming period the quality and availability of statistics on regional innovation. Even if only a fraction of the available Structural Fund resources for 2007-13 were spent on improving the type, scope, coverage and periodicity of statistical information it would make a significant difference to improving ‘evidence-based’ policy making in the coming decade. Again different Commission services, notably Eurostat, are active in this field, but the option of investing Structural Fund resources in support of such efforts should be considered.
• Fund a facility with the aim of providing technical assistance and training to regional and national officials and managers of Structural Fund measures in the field of innovation and knowledge. Again this could be done jointly with DG Enterprise and DG RTD with the aim of exploiting further existing EU wide networks of regional innovation intermediaries. Making use of existing networks of specialists at EU level is advisable to avoid overlaps.

105
Appendix A Further reading Country reports (Volume 2 of this study) Country report: Austria, July 2006. Country report: Belgium, July 2006. Country report: Bulgaria, July 2006. Country report: Cyprus, July 2006. Country report: Czech Republic, July 2006. Country report: Denmark, July 2006. Country report: Estonia, July 2006. Country report: Finland, July 2006. Country report: France, July 2006. Country report: Germany, July 2006. Country report: Greece, July 2006. Country report: Hungary, July 2006. Country report: Ireland, July 2006. Country report: Italy, July 2006. Country report: Latvia, July 2006. Country report: Lithuania, July 2006. Country report: Luxembourg, July 2006. Country report: Malta, July 2006. Country report: The Netherlands, July 2006. Country report: Poland, July 2006. Country report: Portugal, July 2006. Country report: Romania, July 2006. Country report: Slovakia, July 2006. Country report: Slovenia, July 2006. Country report: Spain, July 2006. Country report: Sweden, July 2006. Country report: United Kingdom, July 2006. Useful sources of further information • Recent news about developments in the field of Regional policy can be found on the web
site of DG Regional Policy: http://ec.europa.eu/regional_policy/index_en.htm • Further information about innovation policy developments across 33 European countries
can be found at: http://trendchart.cordis.lu/ • More information about the national and regional research systems and of the
environment across 37 countries can be found at: http://cordis.europa.eu/erawatch/ • Information on recent and forthcoming studies can be found at:
http://cordis.europa.eu/innovation-policy/studies/ • Publications and recent news concerning innovation across sectors can be found at:
http://www.europe-innova.org/ • General and regional statistics are available at the Eurostat web site:
http://epp.eurostat.ec.europa.eu/

591 Synthesis report_final.doc 106
References Berger S. (2005), How We Compete: What companies around the world are doing to make it in today’s global economy, Doubleday. Berlage L. and D. Terweduwe (1988) “The Classification of Countries by Cluster and by Factor Analysis”. World Development, Vol.16, No.12. Cunningham P. (2006) “Innovation in Services”, European Trend Chart on Innovation, Policy Review Workshop 10. Esko Aho et al. (2006) "Creating an innovative Europe". Davies Sara et al. (2004) “Cohesion Policy Funding for Innovation and the Knowledge Economy”, EPRC. Etzkowitz H. & L. Leydesdorff (2000) “The dynamics of innovation: from National Systems and ‘‘Mode 2’’ to a Triple Helix of university–industry–government relations”. Research Policy 29, 2000. Etzkowitz H. (2003), Research groups as ‘quasi-firms’: the invention of the entrepreneurial university. Research Policy 32. Ezcurra et al. (2005) “Regional Inequality in the European Union: Does Industry Mix Matter?” in Regional Studies, vol. 39. 6. Fagerberg Jan et al. (2004) “The Oxford Handbook of Innovation”, Oxford University Press. Florida Richard (2002) “The Rise of the Creative Class”. Fritsch, M. and A. Stephan (2005) “Regionalization of innovation policy” – Introduction to the special issue, in: Research Policy, 34, 1123-1127. Grazia M. Pittau & Zelli R. (2006) “Empirical evidence of income dynamics across EU Regions”. Journal of Applied Econometrics 21: 605-628. Hirsch-Kreinsen, H. (2006) “Low-Technology”: A Forgotten Sector In Innovation Policy, Paper presented at the ProAct Conference, 15-17 March 2006, Finland. Magnatti Piera (2005) “The ERDF’s contribution towards regional innovation policy”. Malerba, F. (2002). “Sectoral systems in Europe: Summary and conclusions” in Sectoral Systems in Europe – Innovation, Competitiveness and Growth (ESSY). Neumann M. (2001) “Competition Policy. History, Theory and Practice”, Edward Elgar. Scharpf F. (2000) “Gouverner l’Europe”, Presses de Science Po, Paris, 2000. Simmie J. (2003) “Innovation and Urban Regions as National and International Nodes”. Regional Studies, 6/7, 2003, 607-620. Sjölander S. et al (2005) “Entrepreneurial learning & academic spin-offs” – Project report to Nordic Innovation Centre. Thomas L. Firedman (2006) “The World is Flat”, 2nd ed., New York, 2006. Todtling, F. & M. Trippl (2005) “One size fits all? Towards a differentiated regional innovation policy approach”. Research Policy 34. Official documents: Commission (2006) “Community Framework for State Aid for Research and Development and Innovation”, Commission Staff Working Paper, 20.04.2006. Commission (2006) “External Evaluation of the MAP 2001-2005”, DG ENTR (conducted by Información y Desarrollo s.l., Lacave Allemand & Associés). Commission (2006) “The Paxis Manual for innovation policy makers and practitioners: Analysis and transfer of innovation policy tools, methodologies and policies”. Commission Communication (2006) “The Growth and Jobs Strategy and the Reforms of European cohesion policy; Fourth progress report on cohesion”, COM(2006) 281, 12.06.2006. Commission (2005) “Proposal for a decision of the European Parliament and the Council concerning the 7th framework programme of the European Community for research, technological development and demonstration activities (2007 to 2013)”, COM(2005) 119 final, 6.04.2005.

591 Synthesis report_final.doc 107
Commission (2005) “Proposal for a decision of the European Parliament and the Council establishing a Competitiveness and Innovation Framework Programme (2007-2013)”, COM(2005) 121 final, 6.04.2005. Commission (2005) “Conference Report on the Risk Capital Summit 2005: Investing for Growth and Competitiveness in Europe”. Commission (2005) “Partnership in the 2000-2006 programming period”. Commission (2005) “Report to the Working Group for Information Society”. Commission (2005) “The Impact and Added Value of Cohesion Policy”. Commission (2005) “Working Group Report on RTDI”. Commission Communication (2005) “Implementing the Community Lisbon Programme: A Policy framework to strengthen EU manufacturing – towards a more integrated approach for industrial policy”, COM(2005) 474 final, 5.10.2005. Commission Communication (2005) “Implementing the Community Lisbon Programme: Modern SME Policy for Growth and Employment”, COM(2005) 551 final, 10.11.2005. Commission Communication (2005) “More Research and Innovation – Investing for Growth and Employment: A Common Approach”, COM(2005) 488 final, 12.10.2005. Commission Communication to the Spring European Council (2005) “Working together for growth and jobs: A new start for the Lisbon Strategy”, COM(2005) 24. 02.02.2005. Commission Communication to the Spring European Council (2005) “Working together for growth and jobs: Integrated guidelines for growth and jobs (2005-2008)”. 12.04.2005. Commission Communication (2004), “Towards a European strategy for nanotechnology”, COM (2004) 338 final. 12.5.2004. Commission (2002) “Guide to Risk Capital Financing in Regional Policy”. Commission (2001) “Innovative small and medium sized enterprises and the creation of employment”. Council decision (2006) on “Community strategic guidelines on cohesion”, 18 August 2006. Council regulation of 11 July 2006 laying down general provisions on the European Regional Development Fund, the European Social Fund and the Cohesion Fund and repealing Regulation (EC) No 1260/1999. OJ L 205, 6.8.2005. Danish Technological Institute (2005) “Thematic Evaluation of the Structural Funds’ Contributions to the Lisbon Strategy”. DTI (2006) Occasional Paper No.6, Innovation in the UK: Indicators and Insights, July 2006. European Private Equity and Venture Capital (2006) “EVCA Yearbook 2006”. OECD (1996) “The knowledge-based economy”. UK Treasury (2003) “Lambert Review of Business-University Collaboration”. United States Department of Commerce International Trade Administration and European Commission Directorate-General for Enterprise and Industry (2005) “Working group on venture capital”, final report.

591 Synthesis report_final.doc 108
Appendix B Additional exhibits and statistics per chapter
B.1 Structural Fund interventions B 1.1 Good/interesting practice examples from 2000-2006 programmes Country Title Policy field Why it is good or 'interesting' practice. AT Incubators Support to
creation and growth of innovative enterprises
the availability of (physical) incubators (Structural Funds), together with the so far developed management teams (REGplus, but also other projects, particularly from the INTERREG programme) has eventually led to a vibrant scene of local hubs for innovation and growth.
AT Kplus, Kind, Knet Knowledge transfer and technology diffusion to enterprises
focused at long-term, outcome-oriented institutionalised cooperative research between the public (academic) and the industrial sector;
created quite a high awareness for the strategic dimension of research; involvement of local firms, higher attention to the local universities, and of links between them etc.).
BE Valorisation of technological excellence poles
Knowledge transfer and technology diffusion to enterprises
it accounts for important part, in budgetary terms, of the “Knowledge economy” axis in the two programmes i.e. Objective 1 and Objective 2 Meuse-Vesdre.
CZ Co-operation of research and development institutions with business sphere, support innovation
Innovation friendly environment
aims directly at the strengthening of co-operation between universities and SMEs and is characterised by wide range of involved beneficiaries, sectors and types of projects;
high demand of applicants, good absorption capacity in sense of signed contracts and flexible administration of applications.
DE MST.factory dortmund
Knowledge transfer and technology diffusion to enterprises
minimise risks and costs during the start up and growth phase of companies in a high-technology sector by the provision of infrastructure and equipment; stabilises and supports one important pillar for the local cluster development
DE Learning regions Innovation friendly environment
it is the only initiative financed by Structural Funds covering all German Länder.
DK Metal Supply Innovation poles and clusters
introduction of new technology and business practices in traditional industries.
EE SPINNO Programme Support to the creation and growth of innovative enterprises
the programme aims to support the establishment of the commercialisation tools and manners in the R&D and higher educations organisations in Estonia; intellectual property regulations and technology transfer units have developed as well as technology transfer trainings performed.

591 Synthesis report_final.doc 109
Country Title Policy field Why it is good or 'interesting' practice. EL Support of Research
Units for prototyping and commercial exploitation of research results. Identification and exploitation of research results by the creation of spin – offs - PRAXE
Support to the creation and growth of innovative enterprises
first clear framework for the establishment of spin off companies;
raised the interest of a considerable number of researchers and provide public research organisations and researchers with an alternative way for commercialising research results.
EL Support of Incubators and S&T Parks in Greece – ELEFTHO programme
Support to the creation and growth of innovative enterprises
it is one of the first cases in the country where private funds were mobilised for the materialisation of such investments.
ES Regional Innovation Agents Network of Castilla y León
Support to the creation and growth of innovative enterprises
the network became a major player in the intermediation between enterprises and technological infrastructures.
ES IMPULSO Support to the creation and growth of innovative enterprises
capacity to energize the agricultural and automotive supplier industries; integration in interregional cooperation networks, especially for the exchange of information and related experiences.
ES Innovation for diversification and sustainability in the Balearic Islands (INNOBAL XXI)
Support to the creation and growth of innovative enterprises
support was provided for hotel management personnel to adapt to the new technologies.
FIN Octopus Support to the creation and growth of innovative enterprises
the project is an example of a unity where the interests of the public sector (the City of Oulu), research and education (university level) and companies are combined in such a way that new innovations generate new business operations.
FIN The Finnish Stone Centre
Knowledge transfer and technology diffusion to enterprises
it is a very successful example of how different actors in a specific industry combine their forces to establish an expertise centre.
FIN Multipolis Network Project
Innovation poles and clusters
it is a unique model of how to combine resources of technology oriented enterprises and RTDI institutions by networking local clusters of expertise.
FIN South Ostrobothnian University Network EPANET
Boosting applied research and product development
it has been a very effective way to mobilise local resources in a region that does not have a university or a strong research base of its own.
FR Acquisition of equipment for the development of research activities and genotyping services
Support to the creation and growth of innovative enterprises
the project is a good example of a successful development of an innovative firm in the biotech services sector.

591 Synthesis report_final.doc 110
Country Title Policy field Why it is good or 'interesting' practice. FR Measure 9B
“Dynamism of economic actors” (Global grant to OSEO-ANVAR)
Support to the creation and growth of innovative enterprises
the main interest of such a measure is to target beneficiaries which differ from those targeted usually by OSEO-ANVAR, i.e. traditional enterprises, not innovation-oriented, located in rural or former industrial areas.
FR Project of micro-nano-electronic development in Toulon
Knowledge transfer and technology diffusion to enterprises
successful example of promotion of higher education and research combined with a spill-over effect on the capacity to create linkages with other research centres
FR Mecatronics Technology platform
Knowledge transfer and technology diffusion to enterprises
in terms of technology transfer development as the creation of the technology platform led industries and schools of engineers to collaborate on engineering projects and support to enterprises’ innovative processes.
FR Collective Action Multimedia Development Centre
Knowledge transfer and technology diffusion to enterprises
the project is expected to the benefit the automotive sector, especially for the sub-contractors (ICT diffusion among local sub-contractors).
HU Co-operation Research Centres
Boosting applied research and product development
academia-industry co-operation has been weak in Hungary – this measure addresses this issue, building on a very similar ‘predecessor’ measure.
IE Programme for Research in Third Level Institutions (PRTLI)
Boosting applied research and product development
PRTLI has been a major contributor to improvements in infrastructure, research management, and research activity and quality.
IT CRdC – Regional Competence Centres
Knowledge transfer and technology diffusion to enterprises
it succeeded to a certain extent in reorganising the local system of agents providing technology transfer services, promoting private-public partnerships.
IT Fondo Ingenium Innovation friendly environment
a successful partnership between the private and public sectors; thanks to a European call for tender, allowed to identify a joint venture which is able to carry on assessments of applicants based on actual market potential.
LT Support for Research and development activity in enterprises
Boosting applied research and product development
it has promoted innovative thinking in companies and consideration of R&D as an opportunity to increase competitiveness
LV Support to modernisation of scientific infrastructure in public research institutions
Boosting applied research and product development
realisation of this initiative has proven to be a major challenge to Latvia’s researchers, and has also raised the prestige of science in mass media and society at large.
MT Market Entry and Operations Schemes
Support to the creation and growth of innovative enterprises
improving the export readiness of Malta’s SMEs and access to new markets (Market Entry Component), as well as to assist Maltese SMEs in technology audits and upgrades, improved product design and innovative actions

591 Synthesis report_final.doc 111
Country Title Policy field Why it is good or 'interesting' practice. MT FOR-LINK project Improving
governance capacities for innovation and knowledge policies
developing research and innovation capacities in public and private entities, with a particular emphasis on SMEs.
NL STIMULUS Boosting applied research and product development
over 100 clusters, have been supported by Stimulus in the South of the Netherlands. A cluster refers to a project based micro-network of companies. The companies jointly developed new products.
PL Regional Innovation Strategies and transfer of knowledge
Innovation friendly environment
its pro-innovative approach which goes beyond direct grants for physical infrastructure projects; it covers five different but interconnected policy objectives.
PT NITEC – Incentive System for Creating R&D Teams in Companies
Boosting applied research and product development
it addresses a relevant weakness of Portuguese firms – the lack of consistent R&D activities; shows that it is possible to encourage the take up of more committed intangible investments by firms; may be replicated in different contexts.
SK The Business Incubators, Technology Parks and R&D Centres Scheme
Knowledge transfer and technology diffusion to enterprises
the scheme addresses real demand by end users; addresses the major challenge i.e. Slovakia accounts for weak research infrastructure and low rates of transfer of research results to business.
SL Centres of excellence Knowledge transfer and technology diffusion to enterprises
much higher degree of cooperation among researchers of different disciplines and different institutions is gradually developing.
SWE The Coaching Circle (MentorRingen)
Support to the creation and growth of innovative enterprises
in relation to the funds spent, the number of potential start-ups and spin-offs is impressive.
UK London New Business Creation
Support to the creation and growth of innovative enterprises
numerical and financial outputs of the programme; usefulness and impact of the service; and its role as a pan-London business start-up support service.
UK Technium Network Knowledge transfer and technology diffusion to enterprises
Centres are predominantly run by partnerships of organizations from the public and private sector; the network provided opportunities for both Welsh companies and for inward investment in R&D facilities, and encourages cluster development in key sectors.
Source: Country Reports for this study. Good practice examples are explained in more details in the respective country reports.

591 Synthesis report_final.doc 112
B.2 Regional Innovation Performance
Typology of key knowledge economy factors at regional level
Four factors
Indicator
Year
F1 ‘Public
Knowledge’
F2 ‘Urban
Services’
F3 ‘Private
Technology’
F4 ‘Learning Families’
Higher education (HRSTE), % of population completed higher education degree
2003 .839 .151 .190 .184
Knowledge workers (HRSTC, core: % of population that has a S&T education & is occupied in the research sector)
2003
.831 .164 .267 .327
High-tech services (% of employment, (Knowledge-intensive high-technology services: NACE Rev. 1.1 codes 64, 72, 73)
2003
.575 .367 .428 .323
Public R&D (Expenditures as % of GDP (HERD+GOVERD)
2002 .543 .431 .275 -.195
% Value-added services (% share of services in total gross value added at basic prices at NUTS level 2 in Millions of euro, Nace g_p,
2002
.323 .869 .002 .121
% Value-added industry (% share of manufacturing industry in total gross value added at basic prices at NUTS level 2 in Millions of euro, Nace c_to_f, 2002
2002
-.265 -.814 .386 -.061
Government (Employment in public administration as % in total employment, NACE Rev.1 codes 75 and 99, 2003
2003
-.217 .745 .124 -.175
Population density, per square Km 2002 .380 .402 .043 .038 High-tech manufacturing (High-tech and medium/high-tech manufacturing employment, % of total employment, (NACE Rev. 1.1 codes 24, 29 to 35)
2003
-.073 -.331 .873 -.089
% Value-added agriculture (% share of agriculture in total gross value added at basic prices at NUTS level 2 in millions of euro, Nace a_b
2002
-.222 -.350 -.672 -.198
Business R&D (Business R&D expenditures as % of GDP (BERD),
2002 .335 -.050 .664 .267
S&T workers (HRSTO, occupation), % of population that has an occupation in S&T
2003 .560 .178 .589 .382
Youth (% share of population under 10 years of age
2001 -.237 .060 -.015 .868
Life-long learning (% of adults having recently enjoyed training or courses
2003 .472 -.009 .165 .703
Activity rate females (% of total) 2003 .418 -.227 .281 .620 Note: Principal Component Analysis in SPSS. Rotation Method: Equamax with Kaiser Normalization. Main factor loadings are highlighted in bold. Source: MERIT, based on Eurostat data.

591 Synthesis report_final.doc 113
Results of the regression, explaining GDP per capita and unemployment using the four ‘regional-knowledge-economy-factors’
Dependent variable:
Public knowledge
Urban services
Private technology
Learning families
Adj. R2
GDP per capita (PPS)
0.410
(8.332)**
0.336
(6.835)**
0.408
(8.303)**
0.211
(4.290)**
0.482
Unemployment rate -0.135
(-2.165)**
0.199
(3.190)**
-0.239
(-3.838)**
-0.266
(-4.268)**
0.170
Note: T values between brackets. ** Significant at 0.01, * Significant at 0.05. Source: MERIT based on Eurostat data Factors scores for the four strategic clusters F1 F2 F3 F4 GDP
Public
knowledge Urban
services Private
Technology Learning families
TOTAL
GDP per
capita
Global consolidation 1.865450444 0.380558219 0.03578316 1.270625944 0.888 1.527
Sustaining competitive advantage -0.09751275 -
0.101945472 0.537493796 0.358182701 0.174 0.533 Boosting entrepreneurial knowledge 0.967272902 0.311679209 0.07388803
-1.007897422 0.086 0.005
Entering knowledge economy -
0.767749576 -
0.046160116 -
0.642019137 -
0.142625161 -0.400 -0.857 Note: the factor-scores show the deviation (1=standard deviation) per factor from the average of EU regions (0.00). The number of regions =227, regions with estimated scores included.

114
Appendix C Regional typology
Global consolidation Sustaining Competitive Advantage Boosting entrepreneurial knowledge Entering knowledge economy
5.3 Nordic High-tech Learning
5.4 Science & Service Centre
Learning Central Techno High Techno Local Science
& Services 5.4.1 Aging Academia Southern Cohesion 5.5 Rural Industries Eastern Cohesion 5.6 Low-tech
Government
Denmark Wien Oberösterreich Burgenland Stuttgart Région Wallonne Yugozapaden
Anatoliki Makedonia, Thraki
Severozapaden Strední Cechy Valle d'Aosta
Finland Bruxelles/Brussels Salzburg Niederösterre
ich Karlsruhe Berlin Brandenburg Kentriki Makedonia
Severen Tsentralen Jihozápad Abruzzo
Pohjois-Suomi Praha Tirol Kärnten Freiburg Schleswig-Holstein
Mecklenburg-Vorpommern Dytiki Makedonia Severoiztochen Severozápad Molise
Etelä-Suomi Hamburg Vorarlberg Steiermark Tübingen Attiki Chemnitz Thessalia Yuzhen Tsentralen Severovýchod Campania
Stockholm Île De France Cyprus Vlaams Gewest Oberbayern Comunidad De
Madrid Dresden Ipeiros Yugoiztochen Jihovýchod Puglia
Östra Mellansverige Utrecht Ireland Gießen Niederbayern Midi-Pyrénées Leipzig Ionia Nisia Estonia Strední Morava Basilicata
Sydsverige Noord-Holland Border, Midland and Western
Kassel Oberpfalz Languedoc-Roussillon Dessau Dytiki Ellada Sterea Ellada Moravskoslezko Calabria
Västsverige Zuid-Holland Southern and Eastern Hannover Oberfranken
Provence-Alpes-Côte d'Azur
Halle Voreio Aigaio Peloponnisos Közép-Dunántúl Sicilia
London Groningen Lüneburg Mittelfranken Közép-Magyarország Magdeburg Notio Aigaio Itä-Suomi Nyugat-Dunántúl Sardegna
Friesland Weser-Ems Unterfranken Mazowieckie Thüringen Kriti Lithuania Dél-Dunántúl Luxembourg
Drenthe Düsseldorf Schwaben Lisboa e Vale do Tejo Galicia Castilla-la
Mancha Nord-Est Észak-Magyarország Malta
Overijssel Münster Bremen Bratislavský Principado de Asturias Extremadura Sud-Est Észak-Alföld Região Autónoma
Da Madeira Gelderland Detmold Darmstadt Lazio Cantabria Illes Balears Sud Dél-Alföld Northern Ireland Flevoland Arnsberg Braunschweig País Vasco Andalucía Sud-Vest Latvia
Zeeland Koblenz Köln Comunidad Foral de Navarra
Región de Murcia Vest Lódzkie
Noord-Brabant Trier Rheinhessen-Pfalz La Rioja Alentejo Nord-Vest Malopolskie

591 Synthesis report_final.doc 115
Global consolidation Sustaining Competitive Advantage Boosting entrepreneurial knowledge Entering knowledge economy
5.7 Nordic High-tech Learning
5.8 Science & Service Centre
Learning Central Techno High Techno Local Science
& Services 5.8.1 Aging Academia Southern Cohesion 5.9 Rural Industries Eastern Cohesion 5.10 Low-tech
Government
Limburg (NL) Champagne-Ardenne Saarland Aragón Algarve Centru Slaskie
Norra Mellansverige Picardie Haute-Normandie Castilla y León Lubelskie
Mellersta Norrland Centre Franche-Comté Cataluña Podkarpackie
Övre Norrland Basse-Normandie Piemonte Comunidad
Valenciana Swietokrzyskie
Småland med öarna Bourgogne Liguria Bucuresti Podlaskie
North West Nord - Pas-De-Calais Lombardia Wielkopolskie
Yorkshire & The Humber Lorraine Veneto Zachodniopomorski
e
East Midlands Alsace Friuli-Venezia Giulia Lubuskie
West Midlands Pays de la Loire Emilia-Romagna Dolnoslaskie
Eastern Bretagne Toscana Opolskie
South East Poitou-Charentes Umbria Kujawsko-
Pomorskie
South West Aquitaine Marche Warminsko-Mazurskie
Wales Limousin Pomorskie Scotland Rhône-Alpes Norte Auvergne Centro (P) Slovenia Západné Slovensko North East Stredné Slovensko
Vychodné Slovensko
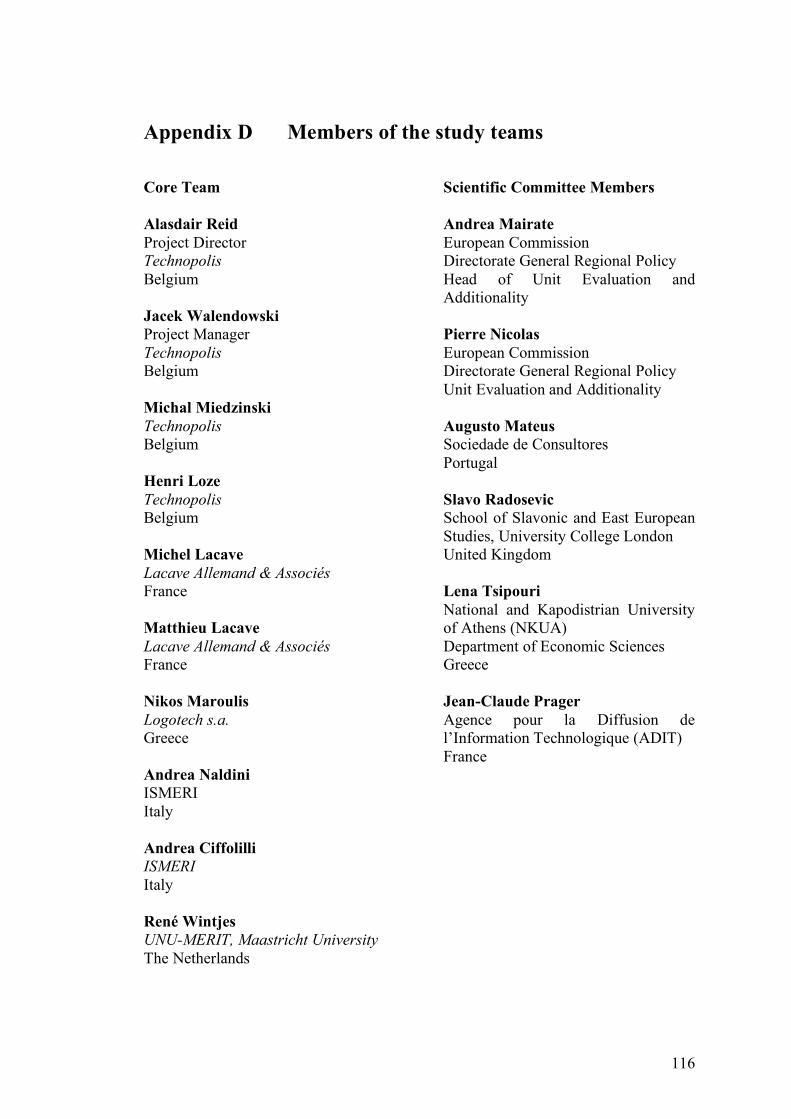
116
Appendix D Members of the study teams
Core Team Alasdair Reid Project Director Technopolis Belgium Jacek Walendowski Project Manager Technopolis Belgium Michal Miedzinski Technopolis Belgium Henri Loze Technopolis Belgium Michel Lacave Lacave Allemand & Associés France Matthieu Lacave Lacave Allemand & Associés France Nikos Maroulis Logotech s.a. Greece Andrea Naldini ISMERI Italy Andrea Ciffolilli ISMERI Italy René Wintjes UNU-MERIT, Maastricht University The Netherlands
Scientific Committee Members Andrea Mairate European Commission Directorate General Regional Policy Head of Unit Evaluation and Additionality Pierre Nicolas European Commission Directorate General Regional Policy Unit Evaluation and Additionality Augusto Mateus Sociedade de Consultores Portugal Slavo Radosevic School of Slavonic and East European Studies, University College London United Kingdom Lena Tsipouri National and Kapodistrian University of Athens (NKUA) Department of Economic Sciences Greece Jean-Claude Prager Agence pour la Diffusion de l’Information Technologique (ADIT) France

591 Synthesis report_final.doc 117
National experts Austria Fritz Ohler Technopolis - Austria Belgium Claire Nauwelaers UNU-MERIT, Maastricht University Bulgaria Mr. Ruslan Stefanov, Center for the Study of Democracy Mrs. Zoya Damianova Applied Research and Communications Fund Ass. Prof. Milanka Slavova, University of National and World Economy Cyprus Anita Soroga Antonis Avranas Logotech s.a. Czech Republic Adolf Filacek (STS Centre CZ) Jiri Loudin (STS Centre CZ) Simon Krbec (CHEVAL ltd.) Karel Mracek (ARO CR) Denmark Henrik Halkier SPIRIT / TRU / IS Aalborg University Estonia Katrin Mannik Technopolis - UK Finland Kimmo Viljamaa Kimmo Halme Advansis Oy France Matthieu Lacave Lacave Allemand & Associés
Germany Michael Guth Roman Noetzel ZENIT GmbH Greece Nikos Maroulis Alexandros Nioras Logotech s.a. Hungary Attila Havas IQ-TANOK bt Ireland Saverio Romeo Technopolis, UK Italy Andrea Ciffolilli Andrea Naldini Luca Rossi Enrico Wolleb Ismeri Europa S.r.l. Latvia Janis Kristapsons Inga Ulnicane Anda Adamsone-Fiskovica Latvian Academy of Sciences Lithuania Monika Kriaucioniene Robertas Jucevicius Institute of Business Strategy Luxembourg Ulrika Thunstrom UNU-MERIT, Maastricht University Malta Matthieu Lacave Lacave Allemand & Associés The Netherlands René Wintjes UNU-MERIT, Maastricht University Poland Jacek Walendowski Technopolis, Belgium

591 Synthesis report_final.doc 118
Portugal Vitor Corado Simões Manuel Mira Godinho Institute for Economics and Business Administration Universidade Técnica de Lisboa Romania Bogdan Rogin East West Expertise Slovakia Vladimír Baláž Institute for Forecasting, Slovak Academy of Science Slovenia Maja Bučar University of Ljubljana, Faculty of Social Sciences Spain Jaime del Castillo Jose Moreno Joaquin Arriola Belén Barroeta Infyde Sweden Tomas Åström Karin Eduards Henrik Segerpalm Faugert & Co Utvärdering Henry Varga, Technopolis, Belgium United Kingdom Saverio Romeo Paul Simmonds Technopolis, UK
Copyright © 2022 FDOKUMEN