
Strain distribution analysis in ring upset forging and hot-rolling ...
96
Retrospective eses and Dissertations Iowa State University Capstones, eses and Dissertations 1976 Strain distribution analysis in ring upset forging and hot-rolling by photoplasticity Adeyinka Kofoworola Oyinlola Iowa State University Follow this and additional works at: hps://lib.dr.iastate.edu/rtd Part of the Materials Science and Engineering Commons is Dissertation is brought to you for free and open access by the Iowa State University Capstones, eses and Dissertations at Iowa State University Digital Repository. It has been accepted for inclusion in Retrospective eses and Dissertations by an authorized administrator of Iowa State University Digital Repository. For more information, please contact [email protected]. Recommended Citation Oyinlola, Adeyinka Kofoworola, "Strain distribution analysis in ring upset forging and hot-rolling by photoplasticity " (1976). Retrospective eses and Dissertations. 6217. hps://lib.dr.iastate.edu/rtd/6217 CORE Metadata, citation and similar papers at core.ac.uk Provided by Digital Repository @ Iowa State University
-
Upload
khangminh22 -
Category
Documents
-
view
1 -
download
0
Transcript of Strain distribution analysis in ring upset forging and hot-rolling ...

Retrospective Theses and Dissertations Iowa State University Capstones, Theses andDissertations
1976
Strain distribution analysis in ring upset forging andhot-rolling by photoplasticityAdeyinka Kofoworola OyinlolaIowa State University
Follow this and additional works at: https://lib.dr.iastate.edu/rtd
Part of the Materials Science and Engineering Commons
This Dissertation is brought to you for free and open access by the Iowa State University Capstones, Theses and Dissertations at Iowa State UniversityDigital Repository. It has been accepted for inclusion in Retrospective Theses and Dissertations by an authorized administrator of Iowa State UniversityDigital Repository. For more information, please contact [email protected].
Recommended CitationOyinlola, Adeyinka Kofoworola, "Strain distribution analysis in ring upset forging and hot-rolling by photoplasticity " (1976).Retrospective Theses and Dissertations. 6217.https://lib.dr.iastate.edu/rtd/6217
CORE Metadata, citation and similar papers at core.ac.uk
Provided by Digital Repository @ Iowa State University

INFORMATION TO USERS
This material was produced from a microfilm copy of the original document. While the most advanced technological means to photograph and reproduce this document have been used, the quality is heavily dependent upon the quality of the original submitted.
The following explanation of techniques is provided to help you understand markings or patterns which may appear on this reproduction.
1.The sign or "target" for pages apparently lacking from the document photographed is "Missing Page(s)". If it was possible to obtain the missing page(s) or section, they are spliced into the film along with adjacent pages. This may have necessitated cutting thru an image and duplicating adjacent pages to insure you complete continuity.
2. When an image on the film is obliterated with a large round black mark, it is an indication that the photographer suspected that the copy may have moved during exposure and thus cause a blurred image. You will find a good image of the page in the adjacent frame.
3. When a map, drawing or chart, etc., was part of the material being photographed the photographer followed a definite method in "sectioning" tiie material. It is customary to begin photoing at the upper left hand corner of a large sheet and to continue photoing from left to right in equal sections with a small overlap. If necessary, sectioning is continued again — beginning below the first row and continuing on until complete.
4. The majority of users indicate that the textual content is of greatest value, however, a somewhat higher quality reproduction could be made from "photographs" if essential to the understanding of the dissertation. Silver prints of "photographs" may be ordered at additional charge by writing the Order Department, giving the catalog number, title, author and specific pages you wish reproduced.
5. PLEASE NOTE: Some pages may have indistinct print. Filmed as received.
Xerox University Microfilms 300 North Zeeb Road Ann Arbor. Michigan 48106

76-28,252
OYINLOLA, Adeyinka Kofoworola, 1942-STRAIN DISTRIBUTION ANALYSIS IN RING UPSET FORGING AND HOT-ROLLING BY PHOTOPLASTICITY.
Iowa State University, Ph.D., 1976 Engineering, materials science
Xerox University Microfilms, Ann Arbor, Michigan 48io6
strain distribution analysis in ring upset forging
and hot-rolling by photoplasticity
by
Adeyinka Kofoworola Oyinlola
A Dissertation Submitted to the
Graduate Faculty in Partial Fulfillment of
The Requirements for the Degree of
DOCTOR OF PHILOSOPHY
Department: Materials Science and Engineering Major: Metallurgy (Mechanical Metallurgy)
:e College
Iowa State University Ames, Iowa
1976
Approved:
In Charge of Ma]or Work
•c— department
Signature was redacted for privacy.
Signature was redacted for privacy.
Signature was redacted for privacy.

ii
TABLE OP CONTENTS
Page
INTRODUCTION AND LITERATURE REVIEW 1
Mechanics of Ring Upset Forging 2
Mechanics of Hot-Rolling 7
Photoplastic Techniques 11
EXPERIMENTAL PROCEDURE 21
Specimen Preparation 21
Compression of Rings 21
Rolling of the 70:30 Laminae Mixture 23
RESULTS 26
Compression of the 70:30 Laminae Rings 26
Coefficient of Friction of the 70:30 Laminae Mixture 31
Rolling of the 70:30 Laminae Mixture 35
DISCUSSION 38
Upset Forging of 70:30 Laminae Rings 38
Rolling of the 70:30 Laminae Mixture 46
SUMMARY 53
REFERENCES 55
ACKNOWLEDGMENTS 59
APPENDIX A: TABLES 60
APPENDIX B: FIGURES 71
1
INTRODUCTION AND LITERATURE REVIEW
Metal forming processes date back 3000 years. Their im
portance, then and now, is included in the fact that the
majority of manufactured metallic products require in part,
or totally, a forming operation. Despite the long existence
and use of certain forming operations such as hot rolling,
cold rolling, drawing, sinking, swaging and extruding, high
forming yields have not been achieved in many areas of
industrial production. This is due largely to lack of under
standing, or to complete ignorance, of some forming parameters.
In order to improve the forming process and the sequence which
yields the desired final product, the effects of parameters
such as strain, strain rate, friction, temperature, billet
size etc., on forming operations and their products must be
understood better.
One of the key requirements for more precise analyses
of deformation forming processes is an accurate description
of the three-dimensional states of stress or strain within a
body undergoing plastic deformation. Coupled with this, is
the need to understand the extent to which friction between
the work piece and die influences the three-dimensional strain
distribution in the deformed body. Friction is, with some
significant exceptions, an unwanted factor with a number of
undesirable side effects. In general, it raises the forces
2
and the power requirements, subjects the deformation tool to
higher pressure, renders deformation less uniform within the
work piece, raises the temperature of the interface and may-
set limits to the maximum obtainable deformation.
A survey of the literature regarding forming operations
in general revealed that a complete strain distribution has
not been established even for unidirectionally rolled billets.
Presumably, this is a consequence of the fact that no reliable
method is available for establishing three-dimensional strain
distributions associated with different sequences of rolling
or, for that matter, for most forming operations. A simula
tive material as well as an experimental technique with a
capability for providing three-dimensional strain distribu
tion is sorely needed. It is towards this goal that the
present research is directed. A thorough understanding of
the three-dimensional strain or stress distribution obtained
with modelling materials could help solve some of the prob
lems encountered in commercial forming operations.
Mechanics of Ring Upset Forging
The importance of friction in all forming operations has
led to the development of various experimental methods to
determine the coefficient of friction and how it affects
deformation processes. Among the early pioneers in this field
of research ; ̂re Male and Cockcroft (1) who developed an

3
experimental test called the ring compression test for the
determination of the coefficient of friction of metals under
conditions of bulk plastic deformation. Their experiment in
volves a simple upset forging operation carried out on a
flat ring-shaped specimen. The coefficient of friction is
related to the change of internal diameter produced by a
given amount of compression in the thickness direction.
Based on their experiment, an empirical formula, through which
the change in internal diameter is related to the coefficient
of friction, was developed. The empirical formula they
gave had the form AD = m InCg , where m is given by:
In m = (0.044 x deformation percentage) + 10.6, AD is the
percentage decrease in internal diameter of a ring upon com
pression and y is the coefficient of friction. As will be
shown later, this formula is incorrect.
A major setback of the method is that a satisfactory
theoretical analysis of the compression of a ring is not yet
available. Consequently, numerical values of the coefficient
of friction y can be obtained only by an independent cali
bration method. The simplified analysis attempted by Male
and Cockcroft did not fit their experimental results that
were obtained presumably because effects due to barrelling
of the specimen could not yet be treated theoretically.
Nevertheless, the ring compression test is often used to
determine the coefficient of friction between the die and the
4
work piece.
The change in geometry during upset forging of hollow
discs has been investigated analytically in recent years-
Avitzur (2) developed a mathematical expression for the
flow of the inner and outer radii of a disc as a function of
the motion of the platens, dimensions of the disc, and
friction between disc and platens. By using the minimum
power approach which he called the Lower Upper Bound solu
tion, the neutral radius was determined based on the
assumption of a constant shear factor between platen and
disc. The material was assumed to obey Levy-Mises stress-
strain rate relations, implying no strain hardening effect,
no elastic deformation and consequently no volume change.
The major disadvantage of this mathematical expression
is that the assumed velocity field produces a stress distribu
tion which does not satisfy the boundary condition of the
interface between disc and platens. The point-by-point agree
ment with actual conditions cannot be judged without the
exact solution or an elaborate experimental study.
Plasticity theory analysis of geometry changes during
compression of hollow cylinders have been insufficiently
developed or their method of application has been very in
volved. Therefore, Hawkyard and Johnson (3) developed a
simple means of predicting strains in the deforming cylinder
from a series of curves which were obtained from geometry
5
changes during the compression process of the cylinders.
From stress equilibrium considerations, they determined
the current position of the neutral surface from which
radial movement originates and hence deduced the incre
mental strain or strain rate pattern. The geometric changes
throughout the process were obtained by integrating the
incremental strains at the inner and outer surfaces. In
their analysis they assumed that there was no barrelling,
thereby, making the actual conditions very simple. Such an
assumption will definitely increase the error with in
creasing frictional stress and increasing cylinder height.
An in-depth study of the Male and Cockcroft method of
determining the coefficient friction was made by Van Sant
(4) whereby a mathematical technique was developed that en
ables the friction effect to be considered quantitatively.
The validity of the proposed mathematical analysis which
depends on an assumed expression for the neutral radius has
not been checked with experiment.
The practicality of some existing forming theories has
been based on simultaneous fulfillment of two conditions;
a) the plastic zone is narrow in one direction and b)
there is a high degree of symmetry (usually axial), ef
fectively reducing the number of independent coordinates to
one. Where either of these conditions does not obtain, no
mathematically respectable theories appear to be available.

6
even for simple basic forming operations such as flat tool
forging or hot-rolling of rectangular sections.
Taking these facts into consideration. Hill (5) proposed
a new method of analysis for any technological forming
process. This analysis, he claimed, is applicable to any
material which is plastic in a broad sense, and whatever the
friction or tool geometry. The procedure of his method in
volves choosing initially a class of velocity fields from
which the best approximation is eventually taken. The chosen
velocity field has to satisfy the static requirements.
Recently, Lahoti and Kobayashi (6) employed Hill's
analysis to explore the modes of deformation in ring compres
sion with barrelling. They investigated the nonuniformity of
flow in the thickness direction. The neutral radius at
various stages of deformation was determined by assuming the
neutral radius to be independent of the bulge formation dur
ing compression. They found that the geometrical changes ob
tained by Hill's method agreed very well with previously
reported theoretical works.
The major advantages of the aforementioned methods of
studying friction at yielding surfaces are that no direct
measurement of force is required, and no yield strength
values are needed, hence the major difficulties of com
pression testing at high temperatures or high strain rates
are eliminated. What these methods have failed to produce
7
is the true spectrum of the internal strain distribution
starting from the internal diameter to the outside diameter
of axially compressed rings whose geometries have been
chosen to prevent barrelling.
Mechanics of Hot-Rolling
Most of the well-known theories of rolling (7) have
been developed to predict the load and torque required by
the rolling mill, and possibly the lateral spread when
billets having width to thickness ratios larger than 6 or
10 are rolled. In the formulation of these widely known
theories, a number of basic assumptions (7) were made,
e.g.: the metal being formed is a continuous isotropic
medium; homogeneous deformation; constant yield stress during
the pass; circular arc of contact; mathematical approxima
tions; constant coefficient of friction along the arc of
contact; plane strain by neglecting lateral spread; the
Huber-Von Mises condition of plasticity; slipping takes place
along the length of the arc of contact; elastic compression
of the strip is negligible; small contact angle and constant
speed of rolling. When rolling sections which have width
to thickness ratios less than 6, such as is common in hot-
rolling of ingots into billets, the theoretical predictions
become unreliable and predictive work has to resort to
empirical formulas with limited ranges of application. The

8
most recent empirical formulations are due to El-Kalay and
Sparling (8), Helmi and Alexander (9) and Beese (10).
The rolling process is complicated, by many factors, to
the extent that it is not possible to obtain a solution for
even the relatively simple problem of flat-rolling and a
proved, accurate, general solution is not yet known. Two-
dimensional states of strain or stress have been described
analytically for the rolling process using the aforementioned
assumptions (7) . Knowledge of three-dimensional strain or
stress states and how they vary with work piece geometry and
other process variables will help improve existing theories
and probably will lead to the development of new theories or
accurate numerical methods such as the finite element ap
proach.
Different approaches have been taken by different in
vestigators to gain information about the strain distribution
within a body undergoing plastic deformation during hot-
rolling. Experimental techniques employed to obtain this type
of information typically involve the placement of grids of one
material into another model material. The composite material
is deformed, sectioned, and the displacements usually in only
two dimensions, are measured. For example, Averbach (11)
determined the distribution of principal strains within a
cast bar of tin by radiographing an embedded network of lead
containing squares approximately 2.1 mm wide (144 network
9
squares per square inch) after a 20% rolling reduction. His
results were computed from only two vertical sections where
he was able to evaluate the longitudinal and vertical strains
directly from the radiographs. The lateral strains were
totally neglected based on the fact that they were too small
for accurate measurement. Instead, he evaluated the lateral
strains by invoking the constancy of volume condition. This
condition would have to be in error by 50% to account for
the observed lateral strains; however, deviations of this
magnitude were not observed.
Orowan (12) studied plastic flow in rolling by part-
rolling wide slabs composed of alternate layers of gray and
white plasticine between unpolished wooden rolls. These
conditions established a coefficient of friction greater than
one, thereby providing for complete sticking to occur. After
the laminated plasticine slabs were part-rolled, they were
withdrawn from the rolls and split longitudinally at the
center line to reveal the strain distribution. Orowan
neglected observations which were not amenable to analysis
within the framework of the mathematical formulation of his
rolling theory. For example, the deformation which occurred
at the entry side of the mill where the material is squeezed
backwards out of the roll gap could not be incorporated in
his analysis. Furthermore, he assumed a small angle of con
tact but obtained large angles of contact in his experiment.

10
This led to considerable error in his calculations. (An
anslysis appropriate to large angles of contact needs to be
formulated.) Nevertheless, Orowan's theory of rolling seems
to stand as the best available since his theory avoids the
usual assumption that deformation can be regarded as a
homogeneous compression locally and takes into account the
inhomogeneity of stress distribution. Furthermore, his
theory takes into consideration any given variation of the
yield stress and of the coefficient of friction along the
arc of contact.
A few attempts have been made recently regarding three-
dimensional analysis of rolling. Oh and Kobayashi (13)
proposed a theory based on an extremum principle for rigid
perfectly plastic material to analyze the three-dimensional
deformation in rolling. They obtained theoretical solutions
for single-pass rolling in terms of sidewise spread, roll
torque and the location of a neutral point. Their theory
revealed the fact that the amount of spread decreases as
initial width-to-thickness ratio increases and as the initial
thickness with respect to roll diameter increases. Previous
experimental results based on this fact correlated excellently
with their theoretical results. Their theory also agrees
excellently with experimental results from rolling of lead
(14) which shows that roll torque increases with increasing
reduction and with increasing initial thickness. From their

11
theoretical calculations, they claimed that there is a small
increase in torque with increasing friction at low reduc
tions. They reported that by decreasing the friction the
neutral point moved toward the exit plane.
Despite the excellent agreement with experimental re
sults, their theory was based on the assumption of a class
of surface shapes followed by the determination of the
velocity field which minimizes the functional for the assumed
surface shape. The minimization was achieved by assuming a
class of velocity fields for all shapes assumed and from
these velocity fields, the steady-state velocity field and
corresponding surface shape was found. The accuracy of
their results depends on how closely the assumed surface
shapes and velocity field approximate the actual solution.
Photoplastic Techniques
Photoelasticity is that branch of experimental stress
analysis which utilizes the phenomenon exhibited by some
transparent materials which are optically isotropic when free
of stress but become temporarily birefringent (i.e., they are
temporarily doubly refractive) in the directions of the
principal strains or stresses when loads are applied to them.
Models made from such materials can therefore be used to ob
tain information regarding the stress or strain distributions
in materials subjected to various systems of loads (15, 16).

12
When viewed in a field of polarized light, the birefringence
manifests itself as an optical interference pattern of light
and dark bands called fringes which may be due to stress,
strain, or a combination of the two, depending on the model
material being used.
There arise two simultaneous sets of interference fringes
which are generally called "isochromatics" and "isoclinics."
It has been established that in the region of linear elastic
response the isochromatics are proportional to the in-plane
maximum shear stresses while the isoclinics give the in-plane
principal stress directions. The two sets of fringes can be
separated by suitable arrangement of the optical elements of
the polarized light field or "polariscope." The quantitative
relationship, which has been shown to exist between the stress
and/or strain state and the optical effect. provides a pre
cise experimental means for evaluating stress or strain
distributions in extremely complicated two- or three-dimen
sional configurations. The method of photoelasticity has been
applied to a wide variety of engineering problems which proved
difficult or impossible to solve by analytical means and
often provides new insight to difficult problems leading
to additional mathematical development.
Experimental evidence to date indicates that the optical
effects produced by stress and/or strain in transparent
materials exists for both elastic and plastic deformations.

13
Hetenyi (17) used the results of tensile tests to study
plastic strains in a nylon copolymer. He found that the
isochromatics could be related to the strain distribution in
this material. Emphasis in his study was placed on optical
indications of yielding. Fried and Shoup (18) used poly
ethylene to study the photoelastic effect in a region of
large deformation, and found that the optical retardation
varied linearly with the principal strain difference well
beyond the range of linear stress-strain behavior. Their
photoelastic model predictions of strain distributions com
pared favorably with those present in an aluminum prototype.
More recently Brill (19) selected polycarbonate as the
model material for basic studies in one- and two-dimensional
photoplasticity. He concluded that the birefringence is a
function only of the principal strain difference and that the
isoclinic parameter provided a measure of the principal strain
directions. A tensile specimen with a central circular hole
was used and the photoplastic results were compared with test
results from metallic analogues. Good agreement was obtained.
Extensive studies of celluloid as a photoplastic material
for determining factors of stress concentration and strain
distributions have been made by Fried (20), Frocht and
Thomson (21), Frocht and Cheng (22), and Monch and Loreck
(23). Polycarbonate material was first suggested by Ito (24);
Gurtman, Jenkins and Tung (25), Brinson (26), and Whitfield
14
(27) have shown the applicability of polycarbonate material
to elasto-plastic problems. Loreck (28) conducted studies of
the mechanical and optical properties of a polyester material
to determine its applicability as a possible photoelastic
material. Dally and Mule (29) recently made an in-depth study
of polycarbonate as a model material for three dimensional
photo-plasticity and established the strain-optic law re
lating the permanent plastic strains to the observed optical
response.
In all of these previous studies attempts were made to
apply the principles of photoelasticity to studies of plastic
deformation in small zones of a specimen in regions of high
stress concentration (30). Design of such components is
usually based on theory-of-elasticity considerations. A
major difficulty always encountered when attempting to obtain
stress or strain information by photoplastic methods is the
selection of a model material which has stress-strain charac
teristics that simulate the real material. Several of the
model materials mentioned previously were satisfactory on the
limited scales required by the problems which were solved.
Since these tests were usually in two-dimensions and involved
only limited plastic deformations, they do not appear to
provide much insight into the phenomena associated with
gross plastic deformation of the type encountered in forming
operations. Morris and Riley (31) developed a photomechanic
15
material which appeared to be well suited for studies beyond
the elastic limit. According to their studies, a mixture
of 60% flexible Laminae EPX 126-3 and 40% rigid Laminae
4116 polyester resins adequately simulates the behavior of
aluminum under uniaxial tension.
Recently Ohashi and Tadashi (32) determined the
stress state within a plastically flowing body in plane strain
by a photorheological method. They rolled 6 mm thick cellu
loid plates subjected to forward tension as well as rolling
torque. They determined stresses in two dimensions and
showed the effect of the applied tension on their distribu
tion, both in the rolls and in the strip specimens. The
method by which they restricted the deformation of the strip
to obtain plane strain needs further investigation to evalu
ate the effect of the constraint on the strain distribution in
the strip during rolling. The experiment was carried out at
only one temperature (65°C). The variation of stress
distribution with temperature also needs further investigation.
Only work-piece geometries involving very large length to
breadth ratios have been accounted for in-rolling investi
gations. The application of the photo-rheological method to
billet rolling needs experimental proof. Finally, the ap
plicability of this experiment to metal rolling has not been
demonstrated.
Employing photoplasticity techniques. Burger, Oyinlola

16
and Scott, (33) examined the three dimensional strain distri
bution in rolled billets using a 60:40 Laminae mixture de
veloped by Morris and Riley (31) as the photoplastic material.
They demonstrated that the 60:4 0 Laminae mixture when de
formed at 40°C simulates, at least in the first approximation,
the characteristics of aluminum when it is deformed at about
425°C. The distribution of principal shear strains deter
mined from the fringe patterns of rolled blocks of the
photoplastic material exhibited features which could be re
lated to edge contours known to form during commercial hot-
rolling of aluminum.
Recently Koehig (34) used another brand of Laminae to
develop a photomechanie material which simulates the be
havior of hot aluminum under uniaxial compression. A cast
of 70% rigid Laminae 4116 mixed with 30% flexible Laminae
4134 polyester resins provided a stress-strain curve that
exhibited little or no strain hardening. This 70:30 Laminae
mixture satisfied a majority of the requirements listed by
Froeht and Thomson (21) for the transition from model to
real material in elasto-plastie problems. However, a
recent investigation (35) revealed that the photoplastic
material did not exhibit the same yield criterion that
aluminum obeys. The investigators (35) observed that the
ratio of compressive to tensile yield strength was approxi
mately 1.35 whereas aluminum has equal tensile and com-

17
pressive yield strengths. The other two well understood
requirements satisfied by 70:30 Laminae mixture are;
a) model and real materials must have the same shape
of stress-strain curve
b) the value of Poisson's ratio in the plastic range
must be the same for both materials.
The material must also meet the following requirements which
are listed in the experimental stress analysis textbook by
Dally and Riley: (15)
a) visible light transparency
b) sensitivity to either stress or strain, as indi
cated by a low material fringe value in terms of
either stress, f^ or strain, f^
c) isotropy
d) homogeneity
e) nonexcessive creeping
f) high modulus of elasticity
g) high ultimate strength
h) material sensitivity (f^ or f^) should not change
markedly with small variations in temperature.
i) no time-edge effects caused by absorption of water
vapor
j) machinability
k) no residual stresses
1) material should not be prohibitively expensive

18
Nondimensional stress-strain comparisons for aluminum and the
70:30 mixture of Laminae polyester resins under uniaxial
compression are shown in Fig. 1.
In order to compare the stress-strain behavior of dif
ferent materials, the Ramberg-Osgood (36) relation is em
ployed. This relation allows the use of dimensionless
variables indicated in Fig- 1.
The Ramberg-Osgood relation is
where E is Young's modulus, is a secant yield stress deter
mined by a secant modulus, = 0.7E, a is the true stress, e
is true strain, and n is a parameter chosen to provide the
best fit to the stress-strain curve of the actual material
being considered and is computed from the expression
n = 1 + -0^353
^1 lo9in Ti" '10 02
where 02 corresponds to a second secant modulus, 0.85E.
The curves in Fig. 1 indicate that the 70:30 polyester
mixture can be used to simulate the behavior of aluminum
under hot working conditions.
Until the present time, all the theories of hot-rolling
have been based on the various assumptions mentioned earlier.
That these assumptions are not always valid can be demon

19
strated, for example, by the fact that defects such as
double-edge bulging, edge cracks and other defects which are
not predicted by the theories appear during hot rolling of
aluminum and other materials in commercial practice. Such
problems stem from secondary stresses produced by the distri
bution of internal strains. Unfortunately, the distribution
of internal strains is generally not known nor is the varia
tion of the internal strain distribution known with respect
to factors such as; work-roll diameter, reduction per pass,
initial thickness of the work-piece, speed of rolling, front
and back tension, nature of friction between the rolls and
the material rolled, temperature field in the material,
physical properties of the material, shape of the roll con
tour and the mill behavior under load.
It can be deduced from the above review of previous
work that a three-dimensional strain distribution for ring
upset forging or for hot-rolling has not been accomplished.
The photoplastic techniques thus offer exciting investigative
possibilities for determining the three-dimensional strain
distribution in the field of deformation processing. The
main purpose of this research was to employ the photoplastic
techniques to analyze the three-dimensional strain distribu
tion in upset forged rings and hot-rolled bars by using the
70:30 Laminae mixture which is suited for photomechanics
studies beyond the elastic limit as described above. A better

20
understanding of strain distributions may provide solutions
to problems encountered in forming operations. An experi
mental analysis of the strain distribution in the compressed
rings as a function of the initial geometry will provide
data for comparison with theoretical predictions. Also,
such data may reveal the optimum geometry of rings to be
most consistent with assumptions employed when friction
coefficients are calculated from ring-compression test data.

21
EXPERIMENTAL PROCEDURE
Specimen Preparation
A mixture of 70% rigid Laminae 4116 and 30% flexible
Laminae 4134 was blended and mixed thoroughly with 0.25%
methyl ethyl ketone peroxide that served as the basic
reactor, 0.10% cobalt napthanate accelerator, and 1% of
styrene and wax molding additives. The mixture was cast into
cylindrical aluminum molds (12 inches high with internal
diameter of 3 inches) whose inner surfaces had been sprayed
with a mold release agent to enhance the removal of the cast
after curing. The casts were allowed to cure partially by
holding at room temperature for 24 hours. The partially
cured blocks were then removed from the molds, hung in an
oven for 24 hours for post-curing at temperatures from 160®F
to 190°F and then cooled at a rate of 60°F per hour. In
machining specimens from the cast blocks, care must be taken
that stresses are not introduced as a result of clamping.
Compression of Rings
A Baldwin-Tate-Emery Universal Testing Machine modified
to permit a controlled strain-rate was used for the ring
compression tests to determine the coefficient of friction
of the Laminae mixture. The output of a displacement
transducer model 7DCDT - 1000 was fed directly to a D.C.

22
voltmeter that gives a voltage indication proportional to
displacement. The signal was then fed to a Moseley Autograph
high input impedance X-Y plotter model 2A on which the
graph of the required voltage versus time has been plotted.
By controlling the cross-head speed of the machine, the
pen on the X-Y recorder could be made to follow the graph,
thereby controlling the strain rate.
Rings of outside diameter 2.5 inches, height 0.5 inch
and internal diameters of 1.625 inch, 1.000 inch and 0.625
inch were machined from a single cast of the 70% rigid- 30%
flexible mixture of Laminae. Actually, 12 rings of each size
were machined out. Three sets of four rings of the same
geometry were compressed axially to reductions of 10, 20,
30 and 40% in height. Each of the three sets was compressed
between platens of different roughness: smooth dies with a
surface roughness of 10 microinches, rough dies with a surface
roughness of 80 microinches, and lubricated smooth dies. A
constant strain rate of 0.007 sec was employed in the com
pression of the rings since this strain rate simulated the
strain rate used to roll the Laminae billets at 51°C.
Additionally, a ring of outside diameter 2.5 inches,
inside diameter 0.625 and height 0.5 inch machined from the
70:30 Laminae mixture was compressed between smooth dies to
an 8% reduction in height at which point the load was held
for five minutes. This was for the purpose of comparing the

23
strain distributions obtained when rings of the same geometry
were compressed to a greater reduction but with the load
removed immediately. The residual reductions after relaxa
tion were similar for the two cases.
Slices were taken transversely through the thickness and
circumferentially from the compressed 70:30 Laminae rings
and studied photoplastically to determine the three dimensional
strain distributions in the rings.
As a check on the validity of theoretical predictions, the
coefficient of friction of aluminum was determined experimen
tally by the ring compression test. Seven aluminum rings of
outside diameter 2.5 inches, inside diameter 1.0 inch and
height 0.5 inch were compressed at 425°C on smooth dies to
reductions in height of 10, 15, 20, 30, 40, 50 and 60%. The
temperature of 425°C corresponds to the middle of the com
mercial rolling temperature range for aluminum. A strain
—1 rate of 0.007 sec was employed.
Rolling of the 70:30 Laminae Mixture
After establishing the fact that the selected photo-
plastic material at 51"C fulfilled a majority of all
necessary requirements for modelling, nineteen blocks with
different thickness-to-width ratios were machined from a
single Laminae cast. These blocks were rolled to various

24
reductions in height by an electric motor-powered rolling
mill which was completely enclosed by an insulated hot-
air chamber that maintained a constant temperature of 51°C.
The air was heated by a resistance element and continually
circulated by means of a small blower. The electric powered
roll drive system used a variable speed motor linked to a
speed reducer gear box which was connected to a large gear by
a link chain. The large gear engaged the drive gears on the
rolls. The photoplastic billets were placed in the hot-air
chamber at the mill entrance until they and the mill were
equilibrated at the required temperature (51 + 1®C). They
were then pushed gently into the mill until the rolls began
to grip.
The overall advantages of the rolling mill complex is
that it offers the opportunity of controlling the rolling
temperature within + 1°C, allows continuous variation of
roll speed by a factor of 10 in the range compatible with
the strain rate requirements of the photoplastic material and
it allows the friction to be varied by modifying the texture
of the roll surface.
During rolling the speed was adjusted to correspond to
-1 the simulative strain-rate of 0.007 sec for aluminum.
Correspondingly, the majority of blocks were rolled at 0.2
revolution per minute. Four blocks with different thickness-
to-width ratios were also rolled to various reductions in

25
thickness at a roll speed of 0.05 revolution per minute in
order to determine the influence of roll speed on the strain
distributions. Using photoplasticity techniques and assuming
constant volume, it was possible to determine the three
dimensional strain distributions on slices taken normal to
the rolling direction for each of the blocks. The rolling
conditions employed are given in Table 1.
26
RESULTS
Compression of the 70:30 Laminae Rings
Table 2 shows the ring compression test data on smooth,
rough and lubricated smooth platens. The final thicknesses
were determined from an average of-four measurements with a
micrometer gage reading to 0.001 ins. The final internal
diameters were also determined by averaging four measure
ments of internal diameters using a telescoping gage.
Transverse and circumferential slices were taken from
each of the rings after compression as shown in Fig. 2.
With the cartesian coordinates shown in Fig. 2, the dif
ference between the algebraically larger and smaller in-
plane strains at any point in the transverse slice can be
expressed as:
where
= the fringe order at the point of interest on the
slice
h^ = the thickness of the slice
fg = the material fringe constant.
At any point in the circumferential slice, the difference
between the algebraically larger and smaller in-plane
strains can be expressed as:

27
Gr-Ce = -IT- Eq. 2
where
= the fringe order at the point of interest on the
slice
h^ = the thickness of the slice
fg = the material fringe constant.
In another investigation (34) the fringe constant for the
70:30 Laminae was found to be 0.004 fringe/inch.
A unique method has been employed in order to deter
mine the fringe order, N, in both the transverse and cir
cumferential slices taken from each of the compressed Laminae
rings. Previous work (34) established that the 70:30
Laminae mixture from which these rings were machined was
negatively birefringent. In order to find the exact fringe
order, N, in any of the slices, a diametrically loaded,
stress-frozen disk made from Bakelite ERL 2774 which is
positively birefringent was placed on the slice where fringe
order information was needed. The fringe patterns were
observed using white light with the polariscope. The
stress-frozen disk was laid on the slice and oriented with
its fringes parallel to those in the slice at the position
where fringe order information was desired. The stress-
frozen disk was translated back and forth in a direction

28
perpendicular to the fringes until matching integral fringe
orders in the slice and disk superposed. This condition
produced an extinction which appeared as a black fringe.
Thus, knowing the fringe order of the disk which corresponded
to the extinction, the fringe order of the extinct fringe in
the slice was obtained. In other words, fringe order one
in the slice provided a black fringe at the order one posi
tion in the disk while all other fringe orders in the
disk remained colored. This was also true for successively
increasing fringe orders. Using this technique to determine
the fringe order in either of the transverse or circum
ferential slice at any point, the successive full fringe
orders at other points could be determined from the colored
fringes of the slices.
The circumferential slice taken from the center of each
of the compressed rings gave the difference between the larger
and smaller in-plane strains only along the mid-section of
the ring from the inner radius to the outer radius (Eq. 1).
Consequently, on the transverse slice the difference between
the larger and smaller in-plane strains along the mid
section (Eq. 2) had to be considered. A third equation in
volving the three strain components was obtained by assuming
constancy of volume which gives:
+ Eg + Eg = 0 Eq. 3

29
Therefore, the three strain components (c^.. Eg and e^) at
positions where the circumferential and transverse slices
intersected, could be determined by simultaneous solution of
the three equations (Egs. 1, 2 and 3).
To assist in selecting the correct fringe order, N,
either on the circumferential or transverse slice, dark-
field isochromatic fringe patterns of the slices from each
of the compressed rings were taken. The dark-field iso
chromatic fringe patterns of the slices taken from the rings
with initial internal diameters of 1.625, 1-00 and 0.625 inch
and compressed on smooth platens are shown in Fig. 3a. In
Figures 3b and 3c are shown the dark-field isochromatic
fringe patterns of the slices from the rings compressed on
rough and lubricated smooth platens with the initial internal
diameters cited directly above.
In order to determine and N^, the fringe orders at
any particular point along the mid-section of the ring on
the transverse and circumferential slices, a graph in which r-r^
the fringe order versus the relative position was o
plotted. In this plot, r is the distance of any full fringe
order from the center of the compressed ring, r^ is the inner
radius of the ring after compression while R is the final
external radius of the compressed ring. For any relative
position along the mid-section of the ring, the corresponding
and were determined from the plot for each of the

30
compressed rings. A typical plot of the fringe order versus r-r^
the relative distance is presented in Fig. 4. o
From this plot a spectrum of points was picked along
the relative distance axis. Knowing the corresponding N^,
h^f h^ and the value of f^ (0.004 fringe/inch), the three
dimensional strain distributions at each selected point were
determined. The three dimensional strain distributions from
the inner radius to external radius of each of the compressed
rings were plotted against the selected position points.
These plots are shown in Figs. 5a, 5b, and 5c for the rings
compressed on smooth, rough and lubricated smooth platens
respectively. In cases where the initial reductions and
consequent relaxed residual reductions were too small to
produce a sufficient number of fringes, strain distributions
were omitted.
Besides the limitation imposed by too few fringes in
the lightly deformed rings, the maximum load output of the
machine limited the highest initial reduction that could be
attained. This situation was more prevalent when compressing
rings with original internal diameters of 0.625 inch on rough
platens. An initial reduction of only 30% could be attained
on these rough platens at the maximum load capacity of the
machine.

31
Coefficient of Friction of the 70:30 Laminae Mixture
An attempt was made to use the Male-Cockcroft empirical
analysis for determining the coefficient of friction under
conditions of bulk plastic deformation. However, examination
of their data showed that their formula was not correct.
Based oh their data, the empirical formula was corrected
to the form:
AD = m (0.055)
where m is given by
In m = (0.044 x % Deformation) + In 6.6
and
AD = Percentage decrease in internal diameter of the ring.
Their experiment was repeated as a check on the corrected
formula. The decrease in internal diameter of an aluminum
ring compressed at 425°C at a strain rate of 0.007 sec ^
versus the percent deformation showed excellent agreement
with the form of their plot as shown in Fig. 6.
The geometric changes obtained in the compression of the
70:30 Laminae rings on platens with different surface char
acteristics, are given in Table 2. Plots of the decrease in
internal diameter of the 70:30 Laminae rings versus the
percent retained reduction are presented in Fig. 7.
To evaluate the homogeneity of plastic deformation during

32
the upsetting of various ring sizes on smooth, rough and
lubricated smooth platens, graphs of the average strain
components (avg.), (avg.), and Eg (avg.), along the
in Fig. 8. The definition of the average strains can be
illustrated using (avg.); it is the sum of the at
the data points shown, for example, in Fig. 5 divided by
the number of such data points. The dashed lines on
each plot represent the appropriate strain component variation
that would occur for homogeneous deformation.
As indicated earlier, the first satisfactory analysis
of the compression of a flat ring was made by Avitzur (2)
through an optimum upper bound mathematical solution. This
was verified later by Hawkyard and Johnson (3) using a
stress analysis approach. In his theoretical treatment,
Avitzur (2) developed the following mathematical relation
ships which can be used to determine the neutral radius,
R^, for a ring specimen under compression.
1) When R < R-n — J.
mid-section of various rings were plotted against In
l+'l+3(Rg/Rn)*
1 + ^ 1 + 3 ( R i / R o ) ^ ^
Eg. 4

33
2) When Ri < Rn 1
-2 (m -|) (1+ - 2 ̂ ) = In E. I+/1+3(R„/R^)4
(R-)
° 1+^1+3(R^/RQ)^(Ro/Rn)^
Eq. 5
where
R^ = Neutral radius
m = Shear factor
R^ = Internal radius
RQ = Original (initial) outer radius
T = Thickness
Avitzur (2) also proposed the following mathematical re
lationship to use for computing the neutral radius directly
from experimental data:
'Ko Eo/Ri - iRi/4Ro
where
AR^, AR^ = changes in the outer and inner radii
respectively and the other symbols were
defined above.
All three mathematical relationships (Egs. 4, 5 and 6)
were derived based on the assumption of a kinematically
admissible pattern of deformation, that is, one satisfying
34
the volume-constancy requirement and the geometrical boundary
conditions (no bulging). Furthermore, it was assumed that
planes normal to the axis of symmetry retain this property
and their velocity varies linearly with their vertical
distance from the origin which is the bottom center of the
hollow disk. The assumption of a constant shear factor
between platens and disk was also invoked.
Using Eg. 6, the neutral radius for each of the rings
compressed on smooth, rough, and lubricated smooth platens
was determined. Also, experimental positions of the neutral
radii were obtained from the points where the SQ curves
intersected the zero strain axis in Figures 5a, 5b, and 5c.
These values can be compared with those computed from Eg. 6
(see Table 3).
Using the graphically determined or the computed values
of R^, the shear factor for each of the compressed rings was
calculated from Eqs. 4 and 5. The shear factors, m, are
presented in Table 3.
The additional 70:30 Laminae ring of outside diameter
2.5 inches, inside diameter 0.625 and height 0.5 inch com
pressed between smooth platens to 8% reduction in height
with load held for five minutes acquired identical patterns
with another ring of the same geometry but with the load
removed immediately. That identical fringe patterns re
sulted from both cases is shown by the dark-field isocromatic

35
fringe patterns presented in Figs. 9a and 9b. The three
dimensional strain distribution and the average strain
components [e^ (avg.), (avg.) and Eg (avg.)] along the
mid-section of the two rings are shown in Figs. 10a and 10b.
Rolling of the 70:30 Laminae Mixture
Three sets of slices were taken from each block that
was rolled for photoplasticity studies; two transverse slices,
slices 1 and 2, three slices parallel to the rolling direc
tion, slices 3, 4 and 5, and three slices perpendicular to
the roll axis, slices 6, 7 and 8. The orientations and
locations of these slices are shown in Fig. 11. For the 1/2
and 1/4 inch thick blocks, only slice 4 was taken from the
set of slices parallel to the rolling direction due to the
thinness of the blocks. Furthermore, only this slice can
be machined conveniently from the block. Each slice was
0.125 inch thick and provided isochromatic and isoclinic (15)
data on the strain field in the plane of the slice. The
three sets of slices thus provided information on the strain
distributions in three orthogonal planes.
The Tardy (15) method of compensation was used to deter
mine the fringe orders in the planes of the slices. Knowing
the fringe order N, the thickness h, and substituting 0.004
fringe/in. for the value of f^, the material fringe constant,
the difference between the algebraically larger and smaller

36
in-plane strains ~ ~h~ determined at any point
in the slices. In terms of the cartesian coordinates Ox, Oy
and Oz shown in Fig. 11, the difference between the in-plane
strains in either slice 1 or 2, are for any of the slices
3, 4 and 5, they are and for any of the slices 6, 7 and
8 they are At any point of intersection of two sets of
slices, it was possible to obtain two independent equations. By
assuming constancy of volume, a third independent equation was
obtained. The solution of these three independent equations
provided the three dimensional strain distributions on slices
taken normal to the rolling direction for each of the rolled
blocks. The three dimensional strain distributions at 9 points
for blocks with initial thickness of 1 inch and 3 points (2, 5
and 8) for blocks with initial thickness of 1/4 or 1/2 inch were
determined. The two dimensional views of slices 2 (slice taken
normal to the rolling direction) and the corresponding inter
section slices taken parallel and perpendicular to the roll
axis are shown in Fig. 12. Points at which strains were deter
mined are indicated in the figure. The three dimensional strain
distributions on slices taken normal to the rolling direction
for each of the rolled blocks are presented in Table 4.
Theoretical predictions of Oh and Kobayashi (13) indicate
that the amount of spread decreases as initial width-to-
thickness ratio increases and increases with increasing
reduction. To check the validity of these predictions.

37
the strain at position 2, for each of the blocks with sizes
0.25 X 2 X 6 inches and 0.25 x 1 x 6 inches, was plotted versus
initial percentage reduction and versus the residual percentage
reduction as shown in Fig. 13. The residual reduction is that
which remains when the block has relaxed completely after rolling.
In order to determine the effect of geometry on the double
bulging caused by nonuniform strain distributions, the average
of each strain, and at positions 1, 3, 7 and 9 for
the blocks with original thicknesses of 1 and 2 inches was
plotted (Fig. 14) against the parameter, (j), that combines the
original thickness, h , the roll radius, R, and the fractional h
reduction, 6, in the form cp = —- The dashed lines in Fig. 14 /r6
join the difference of the average at positions 1, 3, 7 and
9 and the average at positions 2 and 8. This was done to
reveal the different behavior of lateral strains at the mid-
width and at the edges.
38
DISCUSSION
Upset Forging of 70:30 Laminae Rings
As a result of recent ring upset forging research a
relatively simple method has been developed for determining
the coefficient of friction between die and workpiece under
conditions simulating actual practice (1). Theoretical
predictions for edge bulging during ring upsetting were given
by Liu (37). Kobayashi (38) investigated the stress and strain
histories at the equatorial free surface in simple upsetting
of solid cylinders and rings of 1040 steel. His test methods
were almost identical to those of Kudo and Aoi (39) in which
the friction condition at the interface was controlled by
using grooved dies and conical dies with and without lubri
cation. He derived stresses at the free surface from the
measurements of strains.
In spite of these previous research efforts, the
strain distribution within compressed rings has not been
established. From the present research effort, three-
dimensional strain distributions were obtained for the mid-
thickness planes of upset rings. The results were only
qualitative because the visco-elastic photomechanic material
used allowed the strain to relax with time. Methods of in
hibiting relaxation, or for determining how the relaxation
alters the strain distribution, must be established before

39
quantitative results can be obtained.
Many phenomena observed during upset forging of the
70:30 Laminae rings agreed well with reported observations
during upset forging of metallic rings. Two possible modes
of deformation, depending on tool-workpiece interface fric
tion conditions, have been predicted and demonstrated in
ring upset forging (37, 40). The first mode, which is
characterized by a convex outer edge and a concave inner
edge, is favored when the friction between workpiece and
tool is very low. All the 70:30 Laminae rings compressed
between smooth platens lubricated with Nolykote Z, exhibited
this mode of deformation during forging. Previous investi
gators (37, 40) claimed that the neutral radius, for this
mode, was less than the inner radius of the rings. In the
present investigation the neutral radius of 70:30 Laminae
rings compressed between lubricated smooth platens did not
behave this way consistently. For example, Fig. 5c shows
that the neutral radius, taken as the position where Cg equals
zero, is less than the inner radius of sample L-2. Sample
L-3 which had the same geometry and was forged under the
same condition, but to a greater reduction, had a neutral
radius greater than the inner radius of the ring. For an even
higher reduction (Sample L-4) the neutral radius was less
than the inner radius. In samples L-6, L-7 and L-8 (original

40
inner diameter of 1.000 inch), the neutral radius was al
ways greater than the inner radius. For the rings with 0.625
inch original inner diameter sample L-10 had a neutral radius
less than the inner radius of the rings. Two other samples
with the same inner diameter (Samples L-11 and L-12) but
given greater reductions had neutral radius positions greater
than the inner radius. On the whole, the location of the
neutral radius for the 70:30 Laminae rings forged between
lubricated smooth platens was not consistent and did not
agree with the prediction and observation of the earlier
investigators (37, 40).
From the above discussion it is evident that the geometry
and the percentage reduction (be it residual or initial per
centage reduction) determined the location of the neutral
radius for the 70:30 Laminae rings compressed between lubri
cated smooth platens.
The second mode of deformation, predicted and observed,
is characterized by convex inner and outer edges. For this
mode of deformation, the neutral radius falls between the
inner and outer radii. All the 70:30 Laminae rings compressed
on both the smooth and rough platens exhibited this mode of
deformation.
Male and Cockcroft (1) pointed out earlier that meas
urements of the internal diameter of a compressed ring pro

41
vide a particularly sensitive means of determining the
coefficient of friction, y. The internal diameter increases
when y is small and decreases when y is large. This trend
was observed in the compression of 70:30 Laminae rings on
smooth, rough and lubricated smooth platens. However, as
mentioned earlier, in case of lubricated smooth platens,
only Samples L-4 and L-8 exhibited an increase in internal
diameter. An increase occurred at higher reductions only
when the load was held for a short period of time. This
may have been a reflection of the reduced relaxation that
occurred when the load was maintained for a period of time.
Despite the fact that the geometry of the aluminum ring
compressed between smooth platens was quite different from
the geometry employed for friction studies of aluminum by
Male and Cockcroft (1), excellent agreement regarding the
form of the AD versus reduction curve (Fig. 6) was obtained
even though they used a higher test temperature (600°C).
This similarity in the form of the curve shows that the
coefficient of friction between the aliiminum ring and the
platens was constant during compression. However, the AD
versus reduction curves for the 70:30 Laminae rings of simi
lar geometry had greatly different forms compared to those
obtained with metals in this investigation and by Male and
Cockcroft. The discrepancies, shown in Fig. 7, reveal that
the coefficient of friction decreases as the percentage
42
reduction increases. The Male-Cockcroft curves for metals
are indicated by the dashed lines for different values of y.
Besides the decreased barrelling of the 70:30 Laminae rings,
relaxation probably affects the overall experimental results.
The extent of this relaxation affect is not known. Based
on these facts, it is not surprising that there is a general
lack of correlation between the Male-Cockcroft AD versus
reduction curves and those obtained with 70:30 Laminae rings.
The first satisfactory analysis of the compression of a
flat ring was made by Avitzur (2) through an optimum upper
bound mathematical solution. Included in this analysis is
the experimental determination of the neutral radius. To
a certain degree, there is a very good correlation between
the neutral radius determined from Avitzur's (2, Eg. 6)
relationship and the value obtained graphically from the
three dimensional strain distributions along the mid-section
of the rings shown in Fig. 5a,b,c.
Strong evidence supporting the validity of the graphical
determination of the neutral radius was provided fortuitous
ly by sample S-4. In machining the transverse slice to a
thickness of 0.045 inch, a circumferential crack became
visible. This crack resulted in the separation of the cir
cumferential slice into two pieces with separation occurring
almost at the neutral radius evaluated graphically and by

43
using Avitzur's relationship (Eg. 6). In addition to pro
viding experimental evidence to back the theoretical predic
tion of the neutral radius position, sample S-4 also con
firmed that the neutral radius is actually the radial posi
tion where the radial velocity vanishes. In other words,
there exists a cylindrical boundary at the neutral radius
such that, on compression, the material outside the neutral
radius is displaced outward and the material inside the
neutral radius is displaced inwards.
In the mathematical analysis of ring compression carried
out by Avitzur (2), a constant interfacial friction factor
was assumed and barrelling was neglected. In other words,
the effect of frictional stresses at the die/specimen
interfaces was assumed to be transmitted uniformly throughout
the specimen thickness thus simplifying conditions. Avitzur's
(2) assumptions have been shown to be invalid for metals over
all conditions of interfacial friction until the outside
diameter to inside diameter to thickness ratio approaches
6:3:0-5 as predicted from the experiments of Male and
Depierre (41). A number of experimental curves analyzed
theoretically by Male and Depierre (41) yielded values of m
considerably in excess of unity- The values of the interfacial
friction factor computed from Avitzur's relationship in the
present investigation were sometimes in excess of unity.
The values of m in Table 3 show that the interfacial friction

44
factor, m, is not constant. However, for the samples com
pressed on lubricated smooth platens the majority of the m
values were less than unity. It was only for sample L-6
that m was greater than one. For samples compressed on
smooth or rough platens, the majority of computed m values
were greater than one. It appears that, in general, Avitzur's
theory for the interfacial friction factor leads to errors
even for the Laminae mixture.
An analysis of the homogeneity of the plastic deforma
tion occurring during the upsetting of 1040 steel rings was
made by Kobayashi (38). He claimed that in the upsetting of
the ring specimens, the displacements deviated greatly from
those for homogeneous deformation even under lubricated
conditions, thus causing the dimensional change of the inner
surface to be sensitive to the friction conditions at the
interface. Also, he pointed out that the more severe the
frictional constraints the greater the strain path deviated
from that for homogeneous deformation. For the three sets
of ring geometries employed in the analysis of strain distri
bution in compressed rings, the circumferential strain (Cg),
shown in Figs. 8a and 8b, deviates from the behavior expected
for homogeneous deformation which is depicted by the dashed
lines. Presumably this deviation is a result of barrelling
or bulging. The deviation of is less, as shown in Fig. 8c,
when the platens and rings are lubricated. But, the axial
45
and radial strains and obtained from rings compressed
between smooth and rough platens deviate substantially more
from homogeneous deformation as Figs. 8a and 8b reveal. On
the other hand, and values obtained from rings com
pressed between lubricated smooth platens show less deviation
(Pig. 8c). Also, from Figs. 8a,b and c, it is evident that
both Gg and increase as the percentage reduction increases
but sg values do not increase with reduction in all cases.
Based on an in-depth study of the 70:30 Laminae mixture
under compression, it became evident that holding the load
at an initial reduction minimized the relaxation and thus
lead to higher residual reduction after unloading. Compres
sing to a higher initial reduction with the load removed im
mediately, gave rise to a residual reduction which was nearly
equal to that obtained when the load was held. The simi
larity exhibited by dark-field isocromatic fringe patterns
in Figs. 9a and b for the ring with 8% reduction with the
load held and the ring given 20% reduction with the load
removed immediately can be correlated with the strain distri
bution resulting from their final measured residual reduc
tions which are about equal. The average values of the
radial strain, (avg.) for the two rings were the same.
Also point-by-point values of along the mid-section of
the two rings are equal. By holding the load for a period of
time, a higher reduction is retained because the strain

46
relaxation is reduced. An important observation worth
noting is that the value of the average axial strain at the
mid-thickness of the rings which were held under load for a
short time was twice the value of the residual percentage
reduction when rough and smooth platens were used. For
rings compressed between lubricated smooth platens with the
load held, the ratio of the average axial strain to residual
percentage reduction was roughly one-to-one.
Rolling of the 70:30 Laminae Mixture
The effect of friction on shape change during rolling
and, consequently on the three dimensional strain distribu
tion in the block, is evident in the strain distributions of
the 0.25 inch thick x 1 inch wide and 0.25 inch thick x 2
inch wide blocks as shown in Table 4. At an initial reduction
of 7%, there was no sidewise spread in either of the blocks,
i.e., was zero at all positions. At 14% reduction
was greater than zero in the blocks only at positions 2 and
8 (edge positions). At center position 5, remained zero.
A different strain distribution was obtained when the two
sizes of blocks were rolled to a 20% reduction. While
at the center of the two-inch wide block remained zero, it
increased to 4.7% at the center of the one-inch wide block.
All the values computed at positions 2 and 8 for the one-
inch wide blocks were greater than those computed for the

47
two-inch wide blocks at the same relative positions. Thus
it can be concluded that the roll pressure penetration was
greater for the one-inch wide block than for the two-inch
wide block. In other words, the friction effect was less
for the one-inch wide blocks than for the two-inch wide
blocks.
The plane-strain assumption upon which most of the
existing rolling theories have been based was reconfirmed by
the strain analysis of the 0.5 inch high x 2 inch wide blocks
which were rolled to 7 and 14% reductions in height. At 20%
reduction/ the plane-strain assumption no longer held for
this particular size of block. While spread occurred at
position 2, at position 8 on the opposite side, was zero.
A block of similar height but with a width of 1 inch,
exhibited compressive strain at a reduction of 7% at posi
tions 2 and 8 while at 14% reduction, the strain at the edges
were zero and increased rapidly until at 20% reduction the
block cracked.
The double-bulge phenomenon that has been observed during
hot-rolling of aluminum billets in commercial practice was
also observed in the rolling of 70:30 Laminae blocks with
original heights of one inch when rolled at 51®C. As pointed
out earlier, the three-dimensional strain distribution at
nine points were evaluated on slice 2 taken parallel to the

48
roll axis from the blocks which were originally 1 inch
high. Considering the strains at positions 1, 2 and 3 along
one edge of the block and at positions 7, 8 and 9 along the
other edge, it is evident from the results presented in Table
4 that the values of at positions 1, 3, 7 and 9 are
greater than the value at either position 2 or 8 cor
responding to the edge-center of the block. In other words,
a clear picture of double-bulging was depicted by the values
of computed along the edges of the block. Positions 1, 3,
7 and 9 were located close to the rolls while positions 2
and 8 were at the center of the rolled billet. For the four
blocks with original heights of 1 inch, irrespective of the
width, the values of through the thickness at positions
4, 5 and 5 acquired the same profile for all the blocks;
was maximum at the point close to one roll but decreased in
value towards the billet center.
The influence of the block geometry on double-bulge
formation during hot-rolling is clearly demonstrated by Fig.
14 where the average of each of the strains at positions 1,
3, 7 and 9 is plotted against the parameter tj). The dif
ference between the average values at positions 1, 3, 7
and 9 and those at positions 2 and 8, shown by the dashed
lines, reflects the extent of double-bulging at various
reductions. It is evident that double-bulging was less in
49
the one-inch wide block than in the tv;o-inch wide block.
This is revealed by the difference between averaged over
positions 1, 3, 7, 9 and averaged over positions 2 and 8.
For the two one-inch wide blocks rolled to various initial
percentage reductions in height, the value of the difference
between averaged over positions 1, 3, 1, 9 and
averaged over positions 2 and 8, is equal to averaged
over positions 1, 3, 1 and 9 at a lower reduction. At a
higher reduction, the value averaged over positions 1, 3,
7 and 9 was close to being equal to the difference between
averaged over positions 1, 3, 7, 9 and averaged over
positions 2 and 8. For the two two-inch wide blocks rolled
to various initial percentage reductions in height, the value
of the difference between averaged over positions 1, 3, 7,
9 and averaged over positions 2 and 8 was equal to
averaged over positions 1, 3, 7 and 9 only at lower initial
reduction. At higher initial percentage reduction in height,
the difference in averaged over positions 1, 3, 7, 9 and
averaged over positions 2 and 8, was not at all close to
averaged over positions 1, 3, 7 and 9. From the above
discussions, it is evident that the chances of double-bulge
formation occurring in the two-inch wide 70:30 Laminae block
when rolled to higher percentage reductions in height, are
greater than for the one-inch wide block.
The effect of roll speed employed in the rolling of the

50
70:30 Laminae mixture was clearly demonstrated by the 0.5 x
1x6 inch and the 0.5x2x6 inch blocks rolled at speeds
of 0.2 RPM and 0.05 RPM- When 0.5 x 1 x 6 inch blocks were
rolled to a reduction of 14% at roll speeds of 0.2 and 0.05
RPM the transverse spread was uniform on both edges as re
vealed by the fact that values were equal at positions 2
and 8 (Table 5). Furthermore, the values at positions 2,
5 and 8 were greater when the roll speed was 0.05 RPM than
when the roll speed was 0.2 RPM. With another set of 0.5 x
1x6 inch blocks rolled to a reduction of 5%, the spread at
positions 2 and 8 were equal only at a roll speed of 0.2
RPM. A plane-strain condition was attained when a 0.5 x 2 x
6 inch block was rolled at 0.2 RPM to reductions of 7% and
14%. For similar blocks given the same reductions but at a
roll speed of 0.05 RPM, a different spread pattern re
sulted. was compressive on one edge but tensile on the
other edge.
From their experimental results concerning lateral
spread in the rolling of lead, Chitkara and Johnson (14)
found that the ratio of the final width to the original
width increased with increasing reduction. Theoretical solu
tion of this claim was given by Oh and Kobayashi (13) using
extremum principles for rigid perfectly plastic materials.
This trend was also predicted for Steckel rolling by Hill's
(5) analysis. The plot of values at the edge of the rolled

51
70:30 Laminae blocks versus percentage reduction also fol
lowed this trend as shown graphically in Fig. 13.
As indicated earlier in the Introduction, photo-
plasticity has been used extensively for the past few decades
as a unique technique for solving complicated engineering
problems. A number of successes have been reported in the
literature regarding the use of photoplasticity as a tool
for determining stresses or strains in machine complexes.
One significant fact which has not been given special at
tention is the extent to which the visco-elastic nature of
most of the photomechanic materials influences the distribu
tion of either stress or strain.
Based on the present research, the 70:30 Laminae mixture
is visco-elastic and the strain relaxes with time. Despite
the fact that the neutral radius computed using Avitzur's
(2) mathematical solutions for compressed rings agrees ap
proximately with the one obtained from the Sg = 0 intercept
of the three dimensional strain distribution along the mid
section of the rings and, despite the fact that the increase
in spread in the rolled 70:30 Laminae blocks increases with
reduction as predicted by theory, it would be erroneous to
conclude at this time that the three dimensional strain
distributions for various ring and block geometries under
various percentage reductions is quantitative without giving
due consideration to the influence of relaxation on the
52
distributions. A theory based on the visco-elastic proper
ties of the photomechanic materials is worth pursuing. Such
a theory will further enhance the validity of the strains
evaluated by photoplasticity techniques.
Based on the results obtained from this research, the
70:30 Laminae mixture shows some trends in characteristics
which have been established for metals. However, studies
should be conducted to learn more about the structural
properties of this mixture before the mixture can be claimed
to be a good simulating material or before photoplasticity
itself can be claimed a good technique to be used in analyzing
strains from hot forming processes. Nevertheless, for the
first time, a serai-quantitative three-dimensional strain
distribution has been obtained experimentally for the mid
section of a ring. Future research should be directed toward
finding the variation of the three dimensional strain distribu
tion over the thickness of the ring and also in the rolling
direction for rolled billets. This may involve compressing
thicker rings and rolling longer blocks which would permit
more slices from either compressed rings or from rolled blocks
to be taken for photoplasticity strain analyses.

53
SUMMARY
Photoplasticity techniques have been employed to deter
mine the three-dimensional strain distribution along the mid
section in rings of various geometries under uniaxial com
pression and blocks of various sizes rolled to various re
ductions in height. A photomechanic material called Laminae
has been used in the analysis of strains in both compressed
rings and rolled blocks. Specifically, a 7 0% rigid Laminae
mixed with 30% flexible Laminae polyester resins which, at
51°C, provides a stress-strain curve that exhibits little or
no strain hardening and which simulates, at least in the
first approximation, the characteristics of aluminum when
it is deformed at 425°C, was used in the strain analysis.
A good correlation was found between the neutral radius
determined graphically from the three-dimensional strain
distribution along the mid-section of the ring plotted against r-r
the relative distance , and the neutral radius determined
using Avitzur's (2) mathematical solutions for compressed
rings. However, as has been indicated for metals as well,
the interfacial friction factor m determined by another
Avitzur's relationship applied to the 70:30 Laminae rings was
found, in certain instances, to be in excess of unity. This
tends to invalidate his theoretical solutions for determining
the interfacial friction factor, m.
54
Based on the three-dimensional strain distribution on the
slice taken parallel to the roll axis, the ratio of the final
width to the original width (which is equivalent to at
the edge of the rolled block) increased with reduction there
by supporting the theoretical prediction of Oh and Kobayashi
(13) for spread during rolling. Double-bulging was found to
be less in one-inch wide blocks than in two-inch wide blocks.
Uniform spread on both edges of the block of this size was
found to exist at higher reductions either at a roll speed
of 0.2 RPM or 0.05 RPM. Plane-strain was found to exist only
when the two inch wide blocks were rolled at 0.2 RPM either at
lower or higher percentage reductions. The viscoelastic
property of the 70:30 Laminae mixture still stands as a major
problem in reaching a quantitative strain distribution in
either the compressed rings or the rolled blocks.

55
REFERENCES
1. Male, A. T., and M. G. Cockcroft. "A Method for the Determination of the Coefficient of Friction of Metals Under Condition of Bulk Plastic Deformation." Journal of the Institute of Metals 93 (1964), 38-46.
2. Avitzur, B. "Forging of Hollow Discs." Israel Journal of Technology, 2, No. 3 (1964), 295-304.
3- Hawkyard, J. B., and W. Johnson. "An Analysis of the Changes in Geometry of a Short Hollow Cylinder During Axial Compression." International Journal of Mechanical Sciences 9 (1967), 163-182.
4. Van Sant, 0. J. "Mathematical Analysis for Axial Compression of a Flat Ring." Journal of the Institute of Metals 95 (1967), 125-127.
5. Hill, R. A. "General Method of Analysis for Metal-Working Processes." Journal of the Mechanics and Physics of Solids 11 (1963), 305-326-
6. Lahoti, G. D., and Shiro Kobayashi. "On Hill's General Method of Analysis for Metal-Working Processes." International Journal of Mechanical Sciences 16 (1974), 521-540.
7. El-Waziri, A. H. "An Up-to-Date Examination of Rolling Theory." Iron and Steel Engineer 40 (October, 1963), 73-80.
8. El-Kalay, A. K. E. H. A. and L. G. N. Sparling. "Factors Affecting Friction and their Effect Upon Load, Torque and Spread in Hot Flat Rolling." Journal of the Iron and Steel Institute 206 (Feb. 1968), 152-163.
9. Helmi, A., and J. M. Alexander- "Geometric Factors Affecting Spread in Hot Flat Rolling of Steel-"' Journal of the Iron and Steel Institute 206 (Nov. 1968), 1110-1117.
10. Beese, J. A. "Ratio of Lateral Strain to Thickness Strain During Hot Rolling of Steel Slabs." Journal of the Iron and Steel Institute 210 (June 1972), 433-436-

56
11. Averbach, B. L. "Plastic Deformation in the Rolling Process." Journal of Metals, Transactions AIME 188 (Jan. 1950), 150-155.
12. Orowan, E. "The Calculation of Roll Pressure in Hot and Cold Flat Rolling." Proceedings Institute of Mechanical Engineers 150, (1943), 140-167.
13. Oh, S. I., and Shiro Kobayashi. "An Approximate Method For a Three-Dimensional Analysis of Rolling." International Journal of Mechanical Sciences 17 (1975), 293-305.
14. Chitkara, N. R., and W. Johnson. "Some Experimental Results Concerning Spread in the Rolling of Lead." Journal of Basic Engineering 88, (June 1966), 489-499.
15. Dally, J. W., and W. F. Riley. Experimental Stress Analysis. New York; McGraw-Hill Book Co., 1965.
16. Durelli, A. J., and W. F. Riley. Introduction to Photomechanics. Englewood Cliffs, N.J.: Prentice-Hall, Inc., 1965.
17. Hetenyi, M. "A Study in Photoplasticity." U.S. Natl. Congress of App. Mech. Proc. 1 (1952), 499-502.
18. Fried, B., and N. H. Shoup. "A Study in Photoplasticity." U.S. Natl. Congress of App. Mech. Proc. 2 (1954), 477-483.
19. Brill, W. A. "Basic Studies in Photoplasticity." Ph.D. Thesis, Stanford, Cal., 1965.
20. Fried, B. "Some Observations on Photoelastic Materials Stressed Beyond the Elastic Limit." Proceedings of the S.E.S.A. 8(2), (1951), 143-148.
21. Frocht, M. M., and F. A. Thomson. "Studies in Photoplasticity." Proc. U.S. Natl. Cong. Appl. Mech. 3 (1958), 533-540.
22. Frocht, M. M., and Y. F. Cheng. "An Experimental Study of the Laws of Double Refraction in the Plastic State in Cellulose Nitrate-Foundations for Three-Dimensional Photoplasticity." Pages 195-216 in M. M. Frocht, ed. Photoelasticity: Proc. of Int. Symposium on Photo-elasticity, 1961. New York: Pergamon Press, 1963.
57
23. Mônch, E., and R. Loreck. "A Study of the Accuracy and Limits of Application of Plane Photoplastic Experiments." Pages 169-184 in E. Monch, ed. Photo-elasticity Proc. of Inti SiiP-pos-ium on Photoelasticity, 1961. New York: Pergaiuon Press, 1963.
24. Ito, K. "Studies on Photoelasto-plastic Mechanics." Journal of the Science Research Institute, Tokyo 50 (1956), 19-28.
25. Gurtman, G. A., W. C. Jenkins, and T. K. Tung. "Characterization of a Birefringent Material for Use in Photo-elasto-Plasticity." Douglas Rep. SM-47796, Jan. 1965.
26. Brinson, H. F. "An Interpretation of Inelastic Birefringence." Experimental Mechanics 11 (Oct. 1971), 467-471.
27. Whitfield, J. K. "Characterization of Polycarbonate as a Photoelasto-Plastic Material." Ph.D. Thesis, Virginia Polytechnic Institute, 1969.
28. Loreck, R. "Untersuchung von PolyestergieBharzen und • anderen Kunststoffen auf ihre Eignung als photo-plastisches Modellmaterial." Kunststoffe 52 (1962), 139-143.
29. Dally, J. W., and A. Mule. "Polycarbonate as a Model Material for Three-Dimensional Photoplasticity." Journal of Applied Mechanics Transactions of the ASME 40, Series E, No. 2 (June 1973), 600-605.
30. Durelli, A. J., and C. A. Sciammarella. "Elasto-plastic Stress and Strain Distribution in a Finite Plate with a Circular Hole Subjected to Undimensional Load." J. of Applied Mech. 30 (March 1963), 115-121.
31. Morris, D. H., and W. F. Riley. "A Photomechanics Material for Elasto-plastic Stress Analysis." Exptl. Mech. 12 (1972), 10, 488-453.
32. Ohashi, Yoshio, and Nishitani Tadashi. "Effects of Front Tension on Strip Rolling Analyzed by Photo-rheological Method." Japan Society of Mechanical Engineers Bulletin, 14, No. 76 (1971), 1043-1049.
33. Burger, C. P., A. K. Oyinlola, and T. E. Scott. "Full Field Strain Distributions in Hot Rolled Billets by Simulation." To be published in Metals Engineering Quarterly, ca. 1976.

58
34. Koenig, L. N- "Photoplasticity in the Hot Forming of Metals," M.S. Thesis, Iowa State University, 1976.
35. Zachary, L. W. and W. F. Riley. "Photomechanics Methods for Inelastic Stress Analysis." Final Report. U.S. Army Research Office DAHC-40-74-9-0105 (March 1975).
36. Ramberg, W., and W. R. Osgood. "Description of Stress-Strain Curves by Three Parameters." U.S. Natl. Advisory Committee for Aeronautics, Tech. Note 902, 1943.
37. Liu, J. Y. "An Analysis of the Forging of a Flat Ring." ASME Paper No. 70-WA/Prod-28, 1970.
38. Kobayashi, Shiro. "Deformation Characteristics and Ductile Fracture of 1040 Steel in Simple Upsetting of Solid Cylinders and Rings." Journal of Engineering for Industry, Trans. ASME, Series B, 92, No. 2 (May 1970) , 391-399.
39. Kudo, H-, and A. Aoi. "Effect of Compression Test Condition Upon Fracturing of Medium Carbon-Steel-Study on Cold-Forgeability Test Part II." Journal of Japan Society of Technology in Plasticity 8, (1967), 17-27.
40. Depierre, V., F. Gurney, and A. T. Male. "Mathematical Calibration of the Ring Test with Bulge Formation." Technical Report AFML-TR-72-37, March 1972.
41. Male, A. T., and V. Depierre. "The Validity of Mathematical Solutions for Determining Friction from the Ring Compression Test." Journal of Lubrication Technology 93, No. 3 (July 1970), 389-397.
59
ACKNOWLEDGMENTS
It is a valuable experience gained by working under Dr.
T. E. Scott, my major professor, to whom I am indebted for
many valuable discussions regarding this research. The
understanding, thoughtfulness and concerns displayed by him
while under him as a graduate student are gratefully ap
preciated. Certain ideas and studies incorporated in this
research originated in personal discussions with Dr. C. P.
Burger and Professor W. F. Riley of the Department of
Engineering Science and Mechanics. For this, I wish to
express my gratitude to them. The financial assistance of
the National Science Foundation and the facilities provided
by both the U.S. Energy Research and Development Administra
tion and Engineering Research Institute at Iowa State Uni
versity are gratefully acknowledged.

60
APPENDIX A: TABLES
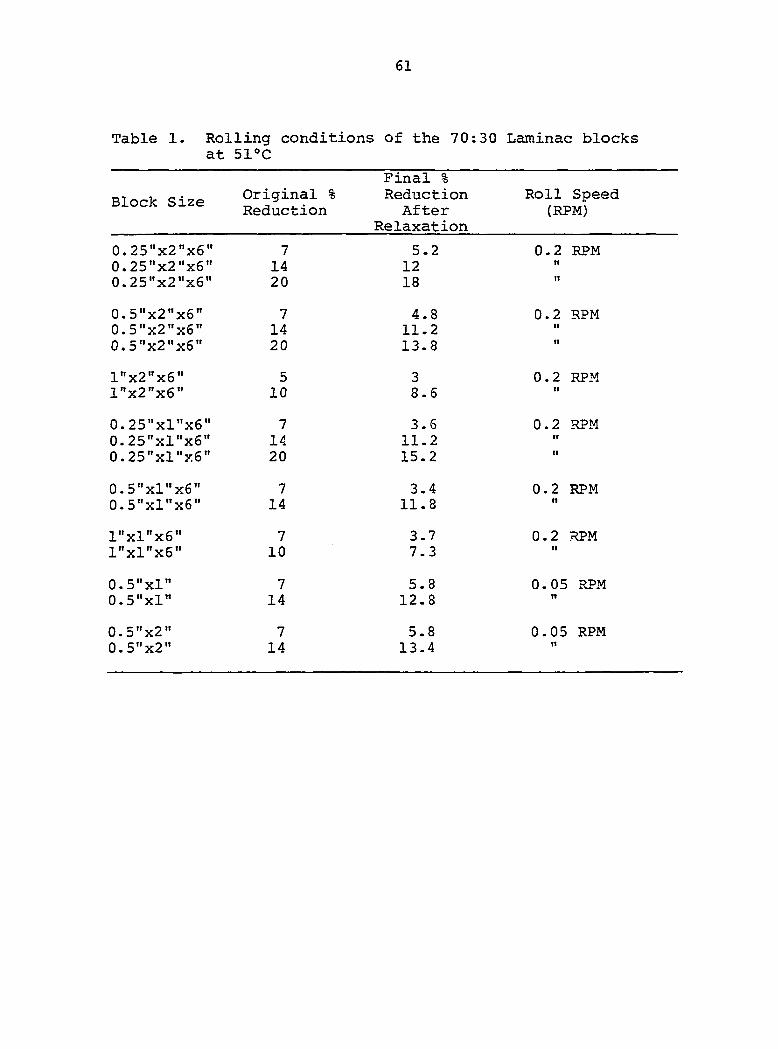
61
Table 1. Rolling conditions of the 70:30 Laminae blocks at 51°C
Final % Original % Reduction Roll Speed
aiocK bize Reduction After (RPM) Relaxation
0.25"x2"x6" 7 5.2 0.2 RPM 0.25"x2"x6" 14 12 rt
0.25"x2"x6" 20 18 11
0.5"x2"x6" 7 4.8 0.2 RPM 0.5"x2"x6" 14 11.2 II
0.5"x2"x6" 20 13.8 tl
I"x2"x6" 5 3 0.2 RPM I"x2"x6" 10 8.6
0.25"xl"x6" 7 3.6 0.2 RPM 0.25"xl"x6" 14 11.2 ff
0.25"xl"x6" 20 15.2 11
0.5"xl"x6" 7 3.4 0.2 RPM 0.5"xl"x6" 14 11.8 II
l"xl"x6" 7 3.7 0.2 RPM l"xl"x6" 10 7.3 II
0.5"xl" 7 5.8 0.05 RPM 0.5"xl" 14 12.8 II
0.5"x2" 7 5.8 0.05 RPM 0.5"x2" 14 13.4 Tl
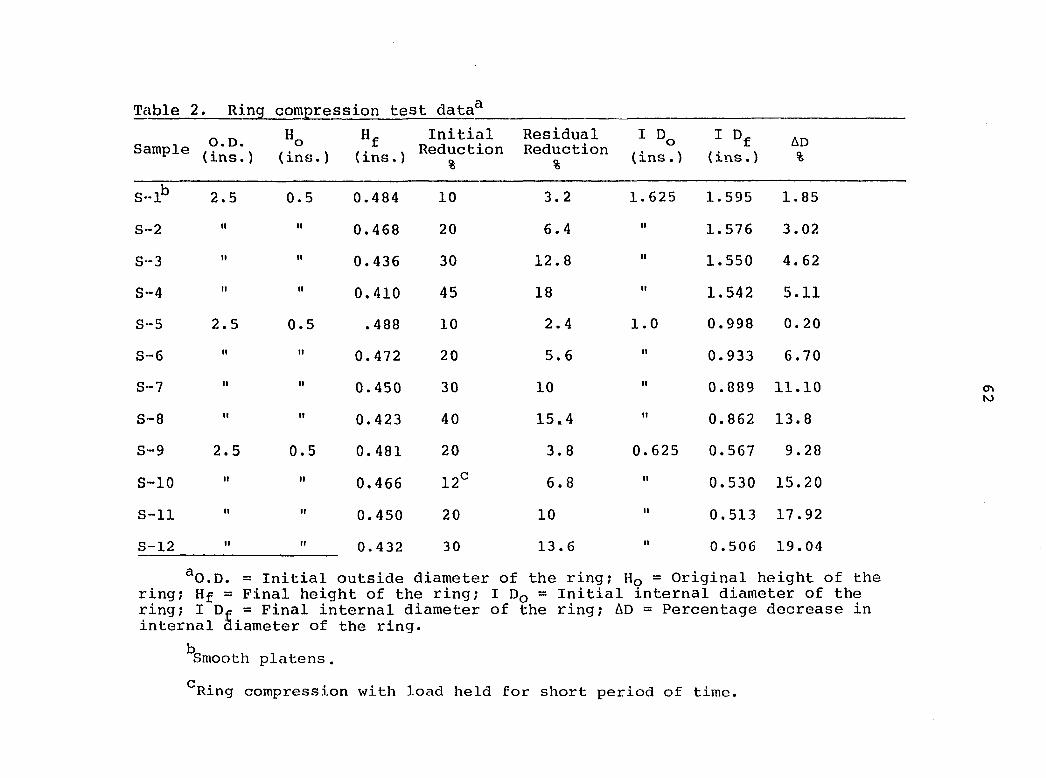
Table 2. Ring compression test data
Sample O.D. (ins.)
Ho
(ins.) Hf
(ins.)
Initial Reduction
%
Residual Reduction
%
I Do
(ins.)
I D,
(ins.) AD %
S "1*3 2.5 0.5 0.484 10 3.2 1.625 1.595 1.85
S--2 I I I I 0.468 20 6.4 I t 1.576 3.02
S--3 I I I I 0.436 30 12.8 I I 1.550 4.62
S-4 I I I I 0.410 45 18 1 1 1.542 5.11
S--5 2.5 0.5 .488 10 2.4 1.0 0.998 0.20
S"6 n I t 0.472 20 5.6 I t 0.933 6.70
S-7 n I I 0.450 30 10 I I 0.889 11.10
S—8 t i I t 0.423 40 15.4 I t 0.862 13.8
S~9 2.5 0.5 0.481 20 3.8 0.625 0.567 9.28
S-10 I I I I 0.466 12° 6.8 I t 0.530 15.20
S-11 I t I I 0.450 20 10 I t 0.513 17.92
S-12 I I 1 1 0.432 30 13.6 I t 0.506 19.04
^O.D. = Initial outside diameter of the ring; Hq = Original height of the ring; Hf = Final height of the ring; I DQ = Initial internal diameter of the ring; I Dg = Final internal diameter of the ring; AD = Percentage decrease in internal diameter of the ring.
Smooth platens.
^Ring compression with load held for short period of time.

Table 2 (Continued)
Sample O.D. (ins.)
«0
(ins.) (ins.)
Initial Reduction
%
R-1^ 2.5 0.5 0.490 10
R-2 I I I I 0.463 20
R-3 I I I I 0.455 30
R-4 I I 11 0.416 35^
R-5 2.5 0.5 0.487 10
R-6 I t I I 0.461 20
R-7 I I I I 0.433 30
R-8 I I I I 0.431 40^
R-9 2.5 0.5 0.491 10
R-10 I I I I 0.450 30
R-11 I I I I 0.449 30°
^Rough platens .
Residual I ^ AD Reduction (ins.) %
2 1.625 1.588 2.28
7.4 t l 1.575 3.08
9 I I 1.557 4.18
16.8 t l 1.539 5.29
2.6 1.00 0.966 3.4
7.8 I I 0.911 8.9
13.4 I I 0.868 13.2
13. 8 I I 0.876 12.4
1.8 0.625 0.591 5.44
10 I I 0.504 19.36
10.5 I I 0.472 24.48

Table 2 (Continued)
Sample O.D. (ins.)
"o (ins.)
«£
(ins.)
Initial Reduction
%
Residual Reduction
%
: Do
(ins.)
I Dg
(ins. ) AD %
L-1® 2.5 0.5 0.486 10 2.8 1.625 1.609 0.985
L-2 M I I 0.467 20 6.6 f l 1.604 1.29
L-3 I I 11 0.453 30 9 . 4 I I 1.588 2.28
L-4 I I I t 0.391 45° 21.8 I I 1.657 -1.97
L-5 I I M 0.490 10 2 1.00 0.984 1.60
L-6 n I t 0.467 20 6.6 I I 0.970 3.00
L-7 I I I I 0.448 30 10.4 I f 0.964 3.60
L-8 I I I I 0.371 40° 25.8 I I 1.004 -0.4
L-9 I I 1 1 0.496 10 0.8 0.626 0.615 1.60
L-10 I I I I 0.476 20 4.8 I I 0.597 4.48
L—11 I I I I 0.451 30 9.8 I I 0.585 6.40
L-12 I I I I 0.370 40 26 I t 0.591 5.4
^Lubricated smooth platens .

Table 3. Dimensional chang es in the upset forging of 70:30 Laminae rings at 51°C
Sample ^i *i/*o
T Ro/T V^o
R n
Calculated
*n Graphical
• ARo ARj, m
S-1 0. 800 1.281 0.625 0. 25 2.562 0.721 0.924 0.855 0.031 -0.013 0.439
S-2 0. 788 1.288 0.612 0. 5 2.576 0.749 0.965 0.875 0.038 -0.025 0.792
S-3 0. 775 1.306 0.593 0. 5 2.612 0.741 0. 968 0.981 0.056 -0.038 0.857
S-4 0. 725 1.325 0.547 0. 5 2.650 0.774 1.025 1.018 0.075 -0.088 12.125
S—6 0. 463 1.288 0. 359 0. 5 2.576 0.611 0.787 0.815 0. 038 -0.032 1.518
S-7 0. 425 1.325 0.321 0. 5 2.650 0.597 0.791 0.789 0.075 -0.075 1.784
S-8 0. 425 1.35 0.315 0. 5 2.7 0.551 0.744 0.713 0.100 -0.075 1.011
S-9 0. 275 1.288 0.214 0. 5 2.576 0.485 0.625 0.606 0.038 -0.038 1.326
S-10 0. 265 1. 3 0.204 0. 5 2.6 0.475 0.617 0.619 0.050 -0.048 1.301
S-11 0. 250 1.35 0.185 0. 5 2.7 0.404 0.545 0.665 0.100 0.063 0.808
S-12 0. 250 1.35 0.185 0. 5 2.7 0. 404 0. 545 0.645 0.100 0.063 1.563

Table 3 (Continued)
Sample R^ R^/R^ T R^/T
R-1 0.800 1. 275 0. 627 0. 5 2. 550 0.736
R-2 0.788 1.300 0. 606 0. 5 2. 600 0.690
R-3 0.775 1.300 0. 596 0. 5 2. 600 0.753
R-4 0.750 1.313 0. 571 0. 5 2. 626 0.768
R-7 0.438 1.313 0. 334 0. 5 2. 626 0.600
R-8 0.425 1.325 0. 321 0. 5 2. 650 0.592
R-10 0. 250 1. 300 0. 192 0. 5 2. 600 0.515
R-11 0.238 1.325 0. 180 0. 5 2. 650 0.472
Calcu- Graph- AR AR. m lated ical
0. 938 1. 150 0. 025 0. 013 0. 533
0. 892 1. 125 0. 050 0. 025 0. 358
0. 979 1. 139 0. 050 0. 038 1. 077
1. 007 1. 168 0. 063 0. 063 3. 139
0. 788 0. 907 0. 063 0. 062 1. 663
0. 791 0. 871 0. 075 0. 075 1. 849
0. 670 0. 658 0. 050 0. 063 2. 514
0. 625 0. 698 0. 075 0. 075 1. 578

Table 3 (Continued)
Sample Ri Ri /Ro T Ro /T Rn /Ro *n Calculated
%n Graphical
ARi ARo m
L-2 0.788 1.288 0. 612 0. 5 2. 576 0. 749 0.965 - 0.038 0.025 0. 236
L-3 0.788 1. 300 0. 606 0. 5 2. 600 0. 722 0.939 0.969 0.050 0.025 0. 541
L-4 0. 788 1.350 0. 584 0. 5 2. 700 0. 657 0.887 - 0.100 0.025 0. 192
L—6 0.475 1.275 0. 373 0. 5 2. 550 0. 620 0.791 0.616 0.025 0.025 1. 516
L-7 0.475 1.313 0. 362 0. 5 2. 626 0. 500 0.656 0.703 0.063 0.025 0. 659
L-8 0.475 1.413 0. 336 0. 5 2. 826 0. 404 0.571 0.664 0.663 0.025 0. 223
L-10 0.281 1.288 0. 218 0. 5 2. 576 0. 461 0.594 - 0.038 0.032 0. 384
L-11 0.281 1. 325 0. 212 0. 5 2. 650 0. 369 0.489 0.465 0.075 0.032 0. 496
L—12 0.281 1.45 0. 194 0. 5 2. 900 0. 271 0.393 0.404 0.200 0.032 0. 242

68
Table 4. Values of the strain components on the slice taken parallel to the roll axis from each of the 70:30 Laminae blocks rolled at 51°C
^ , Initial Roll stlT % Position e £ e Speed
Reduction ^ (RPM)
0.25"x2"x6" 7 2 0 -0.01 0.01 0.2 5 0 -0.01 0.01 8 0 -0.01 0.02
0.25"x2"x6" 14 2 0.019 -0.011 0.09 0.2 5 0 -0.10 0.10 8 0.019 -0.11 0.09
0.25"x2"x6" 20 2 0.046 -0.18 0.14 0.2 5 0 -0.16 0.16 8 0.024 -0.17 0.15
0.5"x2"x6" 7 2 0 -0.02 0.02 0.2 5 0 -0.02 0.02 8 0 -0.02 0.02
0.5"x2"x6" 14 2 0 -0.10 0.10 0.2 5 0 -0.10 0.10 8 0 -0.10 0.10
0.5"x2"x6" 20 2 0.019 -0.11 0.10 0.2 5 0.009 -0.12 0.11 8 0 -0.13 0.13
0-25"xl"x6" 7 2 0 -0.05 0.05 0.2 5 0 —0.04 0.05 8 0 -0.05 0.04
0.25"xl"x6" 14 2 0.03 -0.14 0.10 o
to
5 0 -0.14 0.14 8 0.02 -0.15 0.12
0.25"xl"x6" 20 2 0.07 -0.20 0.14 0.2 5 0.047 -0.19 0.15 8 0.070 -0.20 0.14
0.5"xl"x6" 7 2 -0.011 —0 . 06 0.07 0.2 5 0 -0.06 0.06 8 1 o o
H
— 0.06 0.07 0.5"xl"x6" 14 2 0 —0.06 0.06
5 0.025 -0.17 0.05 8 0 —0.06 0.06
l"xl"x6" 7 10 0.03 -0.05 0.03 0.2 2 -0.006 -0.03 0.03 3 0.036 —0.06 0.02 4 0.01 -0.03 0.03 5 0.008 -0. 04 0.04 6 0.008 -0.04 0.04 8 —0.006 -0.03 0.03 9 0. 036 —0. 06 0.02
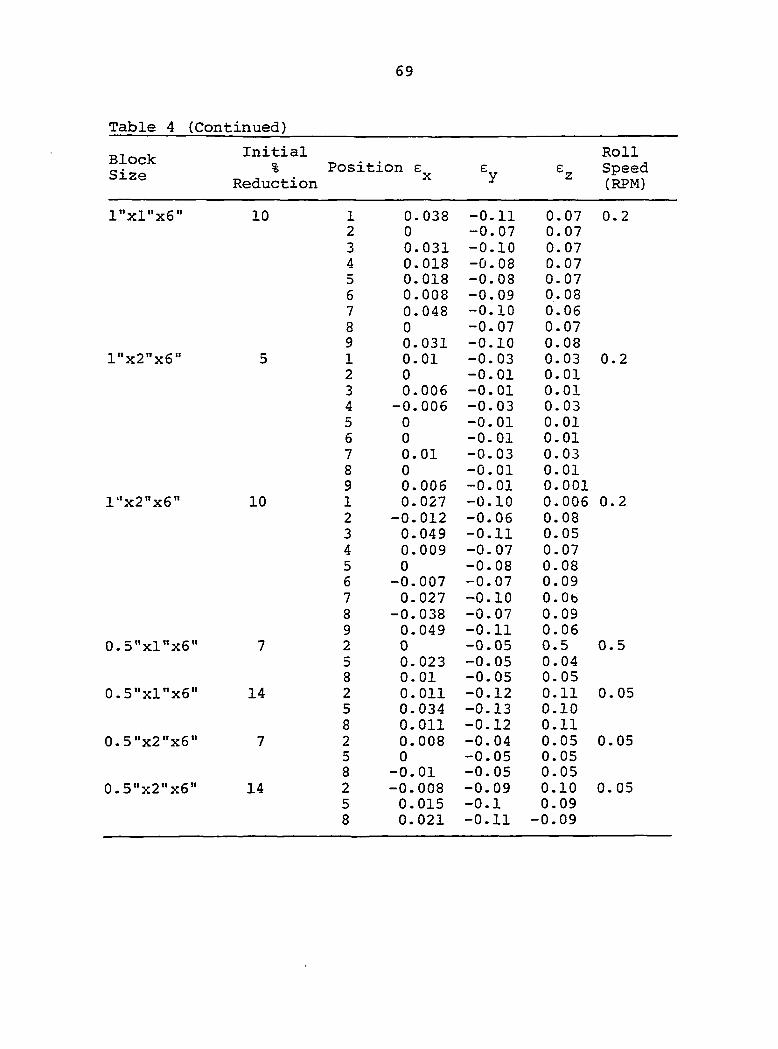
69
Table 4 (Continued)
Block Initial Roll Size % Position £ e e Speed
® Reduction x y z
I"xl"x6" 10
I"x2"x6"
I"x2"x6" 10
0.5"xl"x6"
0.5"xl"x6" 14
0.5"x2"x6"
0.5"x2"x6" 14
1 0.038 -0.11 0.07 2 0 -0.07 0.07 3 0.031 -0.10 0.07 4 0.018 -0.08 0.07 5 0.018 -0.08 0.07 6 0.008 -0.09 0. 08 7 0.048 -0.10 0.06 8 0 -0.07 0.07 9 0.031 -0.10 0.08 1 0.01 -0.03 0.03 2 0 -0.01 0.01 3 0.006 -0.01 0.01 4 —0.006 -0.03 0.03 5 0 -0.01 0.01 6 0 -0.01 0.01 7 0.01 -0.03 0.03 8 0 -0.01 0.01 9 0.006 -0.01 0.001 1 0.027 -0.10 0.006 2 -0.012 — 0.06 0.08 3 0.049 -0.11 0.05 4 0.009 -0.07 0.07 5 0 -0.08 0.08 6 -0.007 -0.07 0.09 7 0.027 -0.10 O.Ob 8 -0.038 -0.07 0.09 9 0.049 -0.11 0.06 2 0 -0.05 0.5 5 0.023 -0.05 0.04 8 0.01 -0.05 0.05 2 0.011 -0.12 0.11 5 0.034 -0.13 0.10 8 0.011 -0.12 0.11 2 0.008 -0.04 0.05 5 0 -0.05 0.05 8 -0.01 -0.05 0.05 2 -0.008 -0.09 0.10 5 0.015 -0.1 0.09 8 0.021 -0.11 -0.09
0 . 2
0 . 2
0.5
0.05
0.05
0.05

Table 5. Effect of roll speed on strain distribution (e ) at the edges of rolled 70:30 Laminae blocks ^
Block Sise e^(2) e^(5) e^(8) Reduoïîon* Speed
(Residual) (RPM)
0.5"xl"x6" -0.01 0.00 -0.01 7 (3.4) 0.20 0.5"xl"x6" 0. 00 0.023 -0.01 7 (5.0) 0.05
0.5"x2"x6" 0. 00 0.00 0.00 7 (4.8) 0.20 0.5"x2"x6" 0.008 0.00 "0.01 7 (5.8) 0.05
0.5"xl"x6" 0.00 0. 025 0. 00 14 (11.8) 0.20 0.5"xl"x6" 0.011 0.034 0. Oil 14 (12.8) 0.05
0.5"x2"x6" 0. 00 0.00 0.00 14 (11.2) 0.20 0.5"x2"x6" -0.008 0.015 0.021 14 (13.4) 0.05

71
APPENDIX B; FIGURES

72
STRAIN RATE
CURVE TEMP.°C SEC"?
AL 425 - 541°C .0017 - .017
---- 70/30 48°C .0026 - .0066
/r
f 1 1 1 1 1 1 1
1 2 3 4 5 6 7 8
eE
Figure 1. Comparison of stress-strain curves for aluminum and 70:30 Laminae mixture plotted according to Ramberg-Osgood relation from Ref. 34.

73
CIRCUMFERENTIAL-SLICE
TRANSVERSE SLICE
Figure 2. Sketch to show how transverse and circumferential slices were taken from the compressed rings at 51°C.
%

Figure 3a. Dark-field isocromatic fringe patterns of the circumferential and transverse slices taken from the rings compressed at 51°C on smooth platens

75
Dark-field isocromatic fringe patterns of the circumferential and transverse slices taken from the rings compressed at 51°C on rough platens

76
Figure 3c. Dark field isocromatic fringe patterns of the circumferential and transverse slices taken from the rings compressed at 51°C on lubricated platens
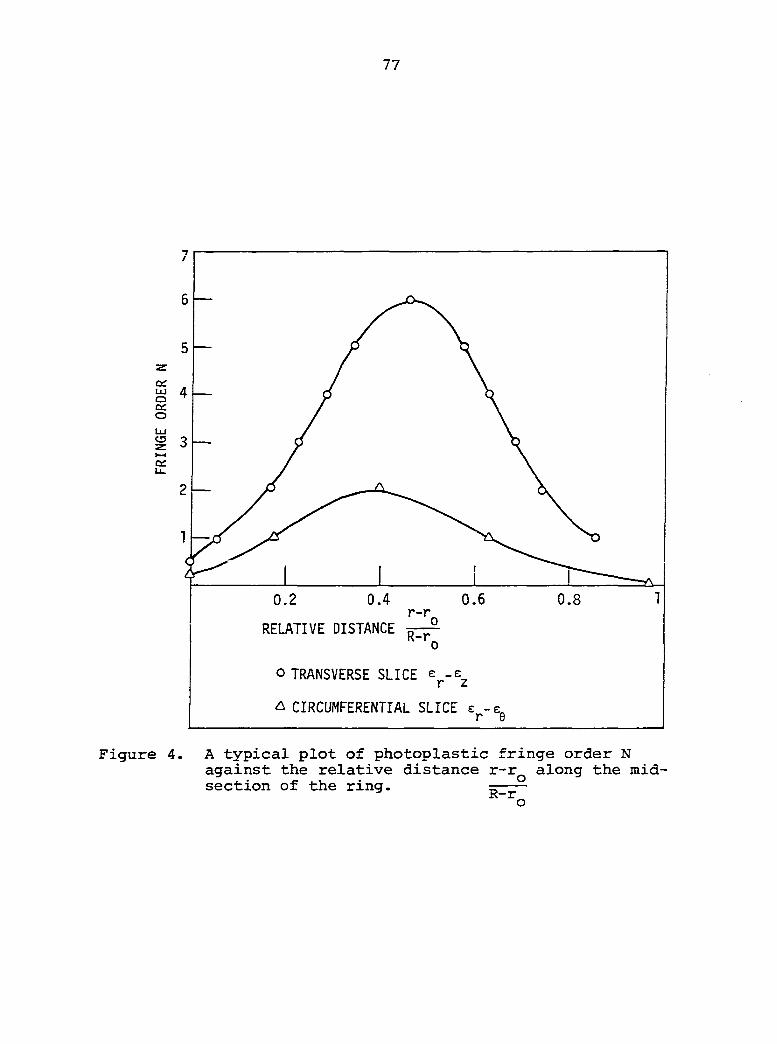
77
ce. LU O ce. o LU C3
0 .6 0.8 r-r
RELATIVE DISTANCE R-r,
o TRANSVERSE SLICE e__e
^ CIRCUMFERENTIAL SLICE s -E.
Figure 4. A typical plot of photoplastic fringe order N against the relative distance r-r^ along the midsection of the ring.
o

78
(a) 40
30 S-1
20 -
o o o 1
w _?^i 1
o o o 1
w
-20 -
-30 -
-40 -40
W
4>
o a
S-5
20 -
10 -
O O 1
b)
'"Z ^2 (avg. )
-20 r
" (avg. )
-30
-40
Eg ^6(avg.)
-30
-40
40
30 S-9
20 -
10 . . 4» ̂. • . MM • .
0 0 /
-10 -U"--
-20
-30
-401 -401
0.2 0.6 1.0
S-2 S-3
S-6 S-7
- / .
\
• -I—
S-10
'r--'̂ L_
S-n
V.
,i-,/J I I L
—— • • /
S-8 -/ \
S-12
0.2 0.6 1.0 0.2 0.6 1.0
r - r_
0 . 2 D . 6 1 . 0
R- r.
Figure 5. The three dimensional strain distributions along the mid-section of the rings compressed at 51®C on (a) smooth, (b) rough, and (c) lubricated smooth platens, respectively.

79
40
30
20
10
G% 0
-10
-20 -
-30
-40
40
30
20
10
E% 0
-10
-20
-30
-40
40
30
20
10
e% 0
-10
-20
-30 r
-40 L
(b)
R-1
I t
R-5
R-9
R-2
/ — • — • • • —
' \
R-6
R-10
« • • — • • — -\
I ..̂ E: ,1—...1—L
—• i
R-3 N-
R-7
t 1 _j L.
R-8
r
R-11
^ (avg. )
— (avg.)
0 . 2 0 . 6 1 . 0 0.2 0.6 1.0 0.2 0.6 1.0
r - r_
Eg (avg. )
0.2 0.6 1.0
Figure 5 (Continued)

40
30
20
10
0
-10
-20
-30
-40
40
30
20
10
0
-10
-20
-30
-40
40
30
20
10
0
-10
-20
-30
-40
80
L-9
(avg.)
Er
Gy. (avg. )
EG Gg(avg.)
no Lll . X LI 2
-,
I ' l l I -
0.2 0.6 1.0 0.2 0.6 1.0 0.2 0.6 1.0
r - r_
0 .2 0 .6
R- r.
2 5 (Continued)

81
A ALUMINUM RING SPECIMENS OF GEOMETRY^ RATIO 6:1-6:2 (0D:ID:HEI6HT) AT 600°C FROf
O ALUMINUM RING SPECIMENS OF GEOMETRY RATIO ^-2:1 at 425 °C.
M RING SPECIMENS OF GEOMETRY RATIO
100
C5 <
Z CC
u. o cr UJ i— LU
z c
cs. LU I— z
LU
LU CC O UJ o
DEFORMATION % Tne percentage aecrease in internal diameter,AD
DEFORMATION % Figure 6. aecrease in
of aluminum rings compressed at 425°C versus percentage deformation.

1.000
1.625
0.625
0.055 w 1.000 0.625
— THEORETICAL CALIBRATION
CURVES FOR RING OF GEOMETRY RATIO 6:3:2 (OD:ID:HEIGHT) FROM REF. 1
Û ROUGH PLATENS • SMOOTH PLATENS o LUBRICATED SMOOTH PLATENS
PERCENT RETAINED REDUCTION IN HEIGHT OF DISK
Figure 7. The percentage decrease in internal diameter,AD, of the 70:30 Laminae rings compressed at 51°C on smooth, rough, and lubricated smooth platens versus retained percentage deformation.

83
SMOOTH PLATENS
1.000
HOMOGENEOUS DEFORMATION
CJ3 > C
w
cs >
s-u
rNj. _0.04 0.14 0.08
-10
>
N U
-30
-40
Figure 8- Variation of the average strains at the midsection in upset rings on, (a) smooth platens, (b) rough platens, and (c) lubricated smooth platens.

84
ROUGH PLATENS
HOMOGENEOUS DEFORMATION
o > c
o u
'O
CD > <£
S-
0.14 0.18 0.2
,
CJ
-10
-20 CD >
N OJ
-30
-40
Figure 8 (Continued)

0.08 0.10 0.14 0.24 0.28
LUBRICATED SMOOTH PLATENS
-10
-20
— HOMOGENEOUS DEFORMATION
-30
-40
Figure 8 (Continued)

86
Figure 9. Dark-field isocromatic fringe patterns of the circumferential and transverse slices taken from the rings compressed at 51°C on smooth platens; (a) 8% reduction with load held for five minutes; (b) 20% reduction with load removed immediately..

e% 0
1 .0 1 .2 1 .0 1 .2
R - r.
Figure 10. The three dimensional strain distributions along the mid-section of the rings compressed at 51®C on smooth platens; (a) 8% reduction with load held for five minutes; (b) 20% reduction with load removed immediately.
00

SLICE 8 \
^LICE 7 ̂
!^^SLICE6
SLICE 5
^SLICE 4
SLICE 3
a*.

89
SLICE 4
Figure 12. Two dimensional views of slices 2 to 9 showing their points of intersections.
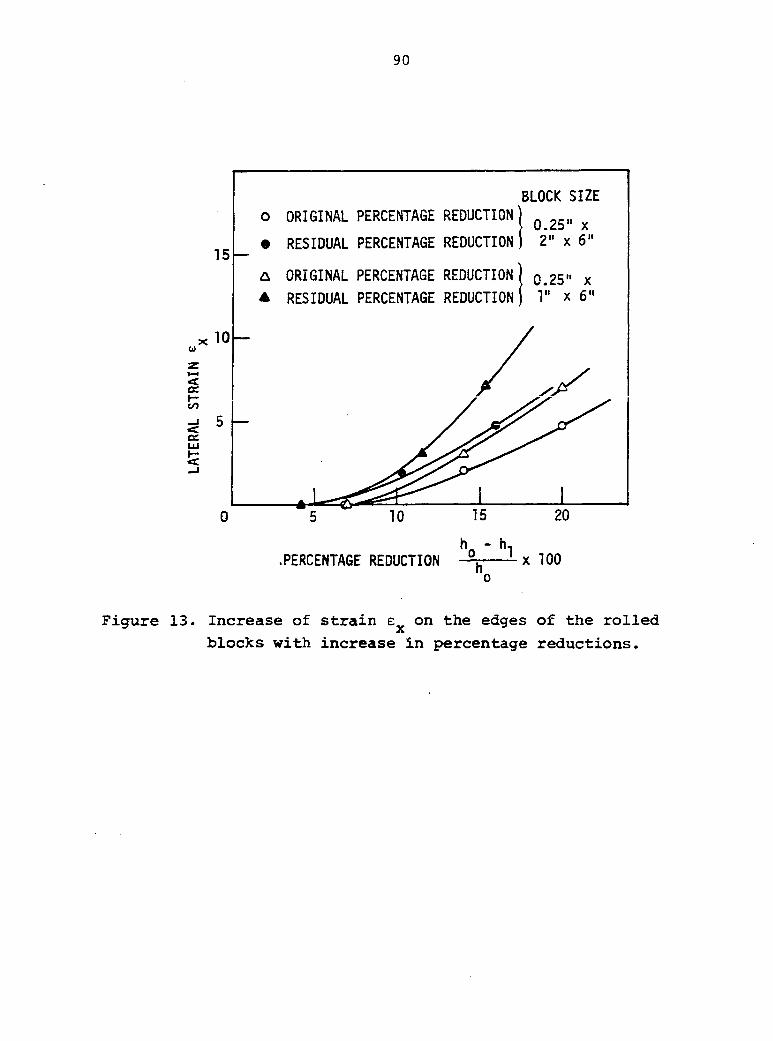
90
BLOCK SIZE O ORIGINAL PERCENTAGE REDUCTION) ^ x
• RESIDUAL PERCENTAGE REDUCTION ) 2" x 6"
A ORIGINAL PERCENTAGE REDUCTION| o.25" x A RESIDUAL PERCENTAGE REDUCTION 1" x 6"
.PERCENTAGE REDUCTION -x TOO
Figure 13. Increase of strain on the edges of the rolled
blocks with increase in percentage reductions.

91
0.08
0.06
0.04
EZ 0.02
u
0.02 —
2 INCH 1 INCH
0.05
0.08
0.12
Figure 14. Effect of width on double-bulge forsrii