Stone artefacts and human ecology at two rockshelters in ...
295
Stone artefacts and human ecology at two rockshelters in Northwest Thailand Ben Marwick A thesis submitted for the degree of Doctor of Philosophy of The Australian National University February 2008
-
Upload
khangminh22 -
Category
Documents
-
view
0 -
download
0
Transcript of Stone artefacts and human ecology at two rockshelters in ...

Stone artefacts and human ecology at two rockshelters in Northwest Thailand
Ben Marwick
A thesis submitted for the degree of Doctor of Philosophy of
The Australian National University
February 2008

ii
To the best of my knowledge, the research presented in this thesis is my own except in
cases where I acknowledge the work of other researchers. This thesis has not been
submitted in any form for any other degree at this or any other university
Ben Marwick

iii
Acknowledgments
Although it is not customary to acknowledge family at the start, Gillian Malacari is the
most important individual in the origin of this project. Gillian led our move to
Thailand, which motivated me to start this project. Once in Thailand, Rasmi
Shoocongdej warmly responded to my interest in her Highland Archaeology Project in
Pangmapha (HAPP) and later provided all kinds of practical and intellectual support
in very generous amounts. With Rasmi’s approval I approached Sue O’Connor with a
proposal for this project and enjoyed her subsequent supervisory support, scholarly
direction and inspiration.
Sue O’Connor and Peter Hiscock were the supervisors of this project. Not only did
they contribute to the improvement of this thesis, but to the benefit of my total post-
graduate experience. They provided valuable research, employment and publishing
opportunities as well as being excellent role models and friends. My post-graduate
experience was also improved by Sharon Donahue of the ANU Department of
Archaeology and Natural History who helped me navigate the ANU’s administrative
complexities.
Thanks to Rasmi Shoocongdej, Cholawit Thongcharoenchaikit, Chatchadawan
Kaewtapaya, Sawitchu Saggrapa Thitiporn Chaiyacharoen, Pipad Krajaejun, Siriluck
Kanthasri, Udomluck Hoontrakul, Mana Kaewongwaan, Anusorn Ampunsri,
Cherdsak Treerayapiwat and John Spies, for their camaraderie and assistance during
my data collection in Pang Mapha and Bangkok. Oraphan Thitikhunphattharawong
and her family shared their generous hospitality with me by hosting parts of my stay at
Tham Lod. Thanks to Supaporn Nakbunlung for her hospitality in Chiang Mai and for
teaching opportunities at Chiang Mai University. Thanks to Cholawit
Thongcharoenchaikit for his invaluable efforts with the experimental work and many
other things and his excellent friendship. Pipad Krajaejun, Sawangpong
Wattanapituksakul and Nattha Chuenwattana always responded surprisingly quickly
to my requests for HAPP data after I left Thailand. Kevin Kiernan forwarded copies of
his hard-to-find but very valuable work on the geology and geomorphology of Pang
Mapha.
Thanks to Mike Gagan for advising on the isotope work, and to Joe Cali and Heather
Scott-Gagan for technical assistance in preparing the samples for mass spectrometry.
Thanks to Ulrike Troitzsch for assistance with the XRD analysis and to Emlyn Williams

iv
for extensive statistical advice. Chris Clarkson, Sophie Collins, Jo Kamminga, Alex
Mackay, Mike O’Brien and Mike Shott provided important input and feedback on
stone artefact technology and related topics. Peter Hiscock and Ben Jeffares offered
careful analysis of the logic of parts of this project.
Thilo Rehren and various anonymous reviewers offered helpful suggestions on the
journal articles that some of the chapters of this thesis are based on.
Thanks to Joyce White, Miriam Stark, David Bulbeck and Peter Bellwood for timely
and detailed advice on doing a PhD in mainland Southeast Asia.
Thanks to the ANU Centre for Archaeological Research for funding for radiocarbon
dates and isotope work. Thanks to the Australian Institute of Nuclear Science and
Engineering for funding radiocarbon dates and travel to the 17th Congress of the
International Union for Quaternary Research. The ANU Graduate School awarded me
a mid-year scholarship that funded the entire 3.5 years of this project.
Thanks to Sophie Collins, Alex Mackay and Patrick Marwick for their very careful
reading of a draft of this thesis.
Reverting to custom, I conclude by expressing my gratitude to Gillian for her
endurance, love and patience. This project would never have started without her, and
could not have been finished without her support. A final thanks to little Kaspar for
lively digressions and for helping me to work more efficiently.

v
Abstract
This thesis documents the interaction of stone artefact technology and local
environmental contexts during the late Pleistocene and Holocene at two rockshelters in
the uplands of northwest Thailand. Previous work has been divided over the
importance of environmental influences in human forager technology in mainland
Southeast Asia. It has also been limited by the use of typological methods that are
poorly suited to the flaked stone artefact technology of the region. Typological
methods have not performed well because of the paucity of formal types in these
assemblages. This has left a gap in our understanding of prehistoric human-
environment relations. Advances in archaeology and human behavioural ecology have
allowed for a more robust articulation between archaeological evidence and
behaviours relating to environmental change. Three general models were developed
from optimal foraging theory: a patch choice model, a central place model and an
optimal dispersion model.
Developments in stone artefact analysis have produced reliable links between specific
technological attributes of artefacts, behaviours relating to technological organisation
and strategies of risk management. These advances were applied here to explore
different dimensions of technological organisation by investigating the three foraging
models. An experiment was conducted to test which variables are most indicative of
risk reduction at the assemblage level for flaked stone artefacts in mainland Southeast
Asia. These variables were then recorded from stone artefacts recovered from
archaeological deposits at Ban Rai Rockshelter and Tham Lod Rockshelter. Although
relatively close to each other, there are stark contrasts in the local availability of
resources at these two sites because of the rugged landscape. These contrasts were
used to refine the three models and produce synchronic hypotheses to test with the
stone artefacts. A palaeoecological record was constructed by analyzing oxygen and
carbon isotopes in freshwater bivalves recovered from the two sites. This allowed for
further refinement of the three models and production of diachronic hypotheses about
the relationship between stone artefact technological organisation and environmental
change.
The result of the hypothesis testing suggested that people were simultaneously
optimising their response to climatic conditions and local resource availability, but in a
way that was not consistently predicted by the existing models. This inconsistency was

vi
resolved by introducing a model of risk management and stone artefact reduction that
includes a point of inflection so that environmental constraints can result in more than
one optimum strategy. This work has vindicated previous claims that mainland
Southeast Asian foragers were sensitive to environmental changes, especially over the
Pleistocene-Holocene boundary. This work has found no support for previous claims
that Pleistocene technologies were flake-based while Holocene industries were cobble-
based. The results have important implications for understanding mainland Southeast
Asian prehistory, including introducing of a suite of effective methods and techniques
for human palaeoecology and stone artefact analysis, identifying potential causes and
probable timing of technological and subsistence changes throughout the region as
well as demonstrating the resilience and vulnerability of human groups to
environmental variability.

vii
Table of Contents
Acknowledgments ................................................................................................................ iii
Abstract ................................................................................................................................... v
Table of Contents .................................................................................................................... vii
List of Figures ........................................................................................................................ xi
List of Tables ......................................................................................................................... xv
1. Introduction ........................................................................................................................1
Introduction .............................................................................................................................1
Aim and structure ...................................................................................................................3
Conclusion ...............................................................................................................................5
2. Approaches to Flaked Stone Artefact Archaeology in Thailand: A Historical
Review ..........................................................................................................................................7
Introduction .............................................................................................................................7
Colani and the Hoabinhian of Vietnam .................................................................................8
Movius and the Chopper-Chopping Tool Complex of Myanmar ..........................................8
The first contributions from Thailand ...................................................................................9
Van Heekeren’s work at Sai Yok 1960-1962 .......................................................................10
Matthew’s analysis of Sai Yok stone artefacts 1964 ...........................................................12
Gorman’s work at Spirit Cave 1965-1971 ..........................................................................13
White and Gorman’s work on Tham Phaa Chan 1972-1979 ..............................................15
Pookajorn’s work at Ban Kao District 1977-1979 ..............................................................17
Anderson’s work at Lang Rongrien 1983-1984 ..................................................................19
Reynolds’ work on Tham Khao Khi Chan and Banyan Valley Cave, 1989-1992 ...............21
Shoocongdej’s work at Lang Kamnam, 1989-1996 .............................................................23
Shoocongdej’s work at Tham Lod and Ban Rai, 1998-present ............................................26
Conclusion .............................................................................................................................26
3. Human Behavioural Ecology, Foraging and Lithic technology ..............................37
Introduction ...........................................................................................................................37
Finding a Good Conceptual Framework: Conditions and Localities ............................37
Selectionist Archaeology and Lithic Analysis ..................................................................40
Dual Inheritance Theory and Lithic Analysis ...................................................................42
Evidential Constraints in Mainland Southeast Asian Assemblages..............................45
Human Behavioural Ecology and Lithic Analysis ...........................................................49
Criticisms and Limitations of Optimal Foraging Models ...............................................53
Three Optimal Foraging Models for Lithic Debitage Assemblages ..............................55
Patch Choice Models ...........................................................................................................56
Central Place Models ..........................................................................................................56
Models of Optimal Dispersion and Group Size ..................................................................57
Conclusion .............................................................................................................................57

viii
4. Analysing Technological Organisation ......................................................................59
Introduction ...........................................................................................................................59
Linking Lithics to Models ....................................................................................................59
Measuring Risk Minimisation .............................................................................................64
Individual Provisioning ......................................................................................................67
Place Provisioning ..............................................................................................................68
Approaches to Artefact Classification ...............................................................................70
Essentialism and stone artefact archaeology .......................................................................72
Nominalism and the reduction thesis .................................................................................76
Summary ................................................................................................................................79
5. A General Model for Quantifying Lithic Reduction in Hoabinhian
Assemblages..............................................................................................................................84
Introduction ...........................................................................................................................84
Defining and identifying artefacts .....................................................................................84
Core .....................................................................................................................................85
Flake ....................................................................................................................................85
Retouched flake ....................................................................................................................86
Flaked piece .........................................................................................................................86
Statistics and Graphs ............................................................................................................87
Descriptive statistics ...........................................................................................................87
Significance testing .............................................................................................................87
Confidence Intervals............................................................................................................90
Bootstrap methods ...............................................................................................................93
Graphical representations ...................................................................................................99
Quantifying lithic reduction ..............................................................................................100
Previous contributions towards understanding Hoabinhian technology ..................101
An experimental approach to quantifying Hoabinhian reduction ..............................102
Results of the experiment ..................................................................................................103
Mass ..................................................................................................................................104
Overhang removal .............................................................................................................104
Interior platform angle ......................................................................................................105
Percentage of dorsal cortex ................................................................................................105
Dorsal flake scars...............................................................................................................106
Dorsal cortex location .......................................................................................................106
Cores ..................................................................................................................................108
Discussion ............................................................................................................................109
Limitations and potential sources of error ......................................................................110
Summary ..............................................................................................................................111
6. The Sites and their setting: Ban Rai and Tham Lod ...............................................122
Introduction .........................................................................................................................122
Overview of the Region .....................................................................................................122
The Study Area .................................................................................................................122
Geology and geomorphology .............................................................................................124
Current Climate and Seasonality ......................................................................................125
Hydrology .........................................................................................................................126
The Distribution and Quality of Raw Materials for Stone Artefacts ...............................127

ix
The Distribution of Floral and Faunal Resources .............................................................129
The Two Rockshelters ........................................................................................................133
Tham Lod .............................................................................................................................133
Site context ........................................................................................................................133
Site description ..................................................................................................................133
Excavations .......................................................................................................................134
Stratigraphy ......................................................................................................................135
Chronology ........................................................................................................................137
Ban Rai ..................................................................................................................................138
Site Context .......................................................................................................................138
Site Setting ........................................................................................................................139
Excavations .......................................................................................................................139
Stratigraphy ......................................................................................................................140
Chronology ........................................................................................................................141
Building testable hypotheses ............................................................................................142
Summary ..............................................................................................................................144
7. Palaeoecological Context of the Study Area ............................................................156
Introduction .........................................................................................................................156
Regional Climate Change and Variability .......................................................................156
Paleoclimate Proxies at Tham Lod and Ban Rai .............................................................162
A New Palaeoclimate Proxy for Tham Lod and Ban Rai: The freshwater bivalve
Margaritanopsis laosensis .................................................................................................164
Stable Isotope Geochemistry and Freshwater Bivalves.................................................165
Mineralogy and taphonomy of the shells ..........................................................................169
Interactions between mineralogy and isotope ratios .........................................................171
Seasonal variation versus multi-year variation in isotope ratios ......................................173
Verifying 30,000 years of climate change at Tham Lod and Ban Rai ...............................173
Interpreting the isotopic records from Tham Lod and Ban Rai .........................................177
Refining the hypotheses .....................................................................................................180
Summary ..............................................................................................................................182
8. Testing the hypotheses: Results of the flaked stone artefact assemblage analysis
189
Introduction .........................................................................................................................189
Patch Choice Model ............................................................................................................189
Tham Lod ..........................................................................................................................190
Ban Rai ..............................................................................................................................191
Discussion .........................................................................................................................191
Central Place Model ...........................................................................................................197
Tham Lod ..........................................................................................................................198
Ban Rai ..............................................................................................................................199
Discussion .........................................................................................................................199
Optimal Dispersion Model ................................................................................................211
Tham Lod ..........................................................................................................................212
Ban Rai ..............................................................................................................................215
Discussion .........................................................................................................................216
Conclusion ...........................................................................................................................228

x
9. Discussion and Conclusion .........................................................................................231
Introduction .........................................................................................................................231
Modelling technology, climate and resource proximity at the two sites ....................231
A history of human foragers in the northwest Thai uplands .......................................239
Some future directions .......................................................................................................244
Conclusion ...........................................................................................................................246
References................................................................................................................................250

xi
List of Figures
Figure 2.1. Map showing sites discussed in the text. Major waterways are shown in
dashed grey lines.......................................................................................................................29
Figure 2.2. Typical sumatralith from Jeremie and Vacher (1992). Scale bars are
centimetres. ................................................................................................................................30
Figure 2.3. Movius’ chopping tools from Myanmar. From Movius (1949) .......................31
Figure 2.4. Artefacts from Sai Yok. From van Heekeren and Knuth (1967). No scale in
original. .......................................................................................................................................32
Figure 2.5. Stone artefacts from Spirit Cave. From Gorman (1971b) .................................33
Figure 2.6. Pleistocene artefacts from Lang Rongrien. From Anderson (1990) ................34
Figure 2.7. Typical Hoabinhian cores. From Van Tan (1994) ..............................................35
Figure 2.8. Artefacts from Banyan Valley Cave. From Reynolds (1992). No scale in
original. .......................................................................................................................................36
Figure 4.1. Schematic representation of essentialist and nominalist approaches to
classification. The peaks represent kinds of artefacts in a hypothetical assemblage, with
the height of peaks indicating their numerical dominance in the assemblage. ...............80
Figure 4.2. Matthews’ metric analyses of flaked cobble artefacts from Sai Yok (n = 100).
Redrawn from Matthews (1964). ............................................................................................81
Figure 4.3. Matthews’ analyses of flake scar numbers and edge angles on pebble tool
artefacts from Sai Yok (n = 183). Redrawn from Matthews (1964). ....................................82
Figure 4.4. Matthews’ metric analyses of flakes from Sai Yok (n = 100). Redrawn from
Matthews (1964). .......................................................................................................................83
Figure 5.1. Artefacts from the experimental assemblage. Top row: two unifacially
flaked cores. Bottom row: view of dorsal surfaces of two flakes, ....................................113
Figure 5.2. Frequency distribution of flakes per core in the experimental assemblage.
...................................................................................................................................................113
Figure 5.3. Plot of changes in the mean proportion of flakes with overhang removal
and increasing reduction. Error bars show 95% Confidence Interval of mean. .............114
Figure 5.4. Plot of changes in mean flake interior platform angle with increasing
reduction. Error bars show 95% Confidence Interval of mean. ........................................114
Figure 5.5. Plot of changes in mean percentage of flake dorsal cortex with increasing
reduction. Error bars show 95% Confidence Interval of mean. ........................................115

xii
Figure 5.6. Plot of changes in the mean number of flake scars on the dorsal surface on
flakes with increasing reduction. Error bars show 95% Confidence Interval of mean. 115
Figure 5.7. Four classes of dorsal cortex location identified by Nishimura (2005).
Modified from Jeremie and Vacher (1992). .........................................................................116
Figure 5.8. Frequency distribution of the four classes of dorsal cortex location. ...........116
Figure 5.9. Changes in the proportions of the four classes of dorsal cortex distribution
with increasing reduction. .....................................................................................................117
Figure 5.10. The relationship of dorsal cortex location to percentage of dorsal cortex.
For example, for all flakes that have 10% dorsal cortex, 80% of those flakes have that
cortex located on the distal region. .......................................................................................118
Figure 5.11. The relationship of dorsal cortex location to interior platform angle. For
example, for all flakes that have an interior platform angle of 40 degrees, 40% of those
flakes have 100% dorsal cortex. .............................................................................................119
Figure 5.12. Scatterplot matrix showing correlations for four of the key flake variables
in the experimental assemblage. Data points have been jittered to reduce overlapping.
Jittering involves the addition of a small amount of random data to each point to
reduce overlapping where many points have the same value. ........................................120
Figure 6.1. Local topography and hydrology of Tham Lod and Ban Rai .......................145
Figure 6.2. Typical view of the study area landscape from a high point near Tham Lod
Rockshelter. Note the rugged topography and the cleared valley where modern
agriculture and settlement is concentrated. ........................................................................146
Figure 6.3. View of Lang River near Ban Rai. Note the relatively dense vegetation and
the cobble river banks. From Shoocongdej et al. (2003a). ..................................................146
Figure 6.4. Schematic of the relationship between forest types, elevation and wetness in
northern Thailand. Modified from Rundel and Boonpragob (1995). ..............................147
Figure 6.5. Views of Tham Lod .............................................................................................148
Figure 6.6. Plan of excavations at Tham Lod. The contour lines show the height above
the plain in front of the rockshelter. Modified from Shoocongdej et al. (2003b). ..........149
Figure 6.7. Stratigraphic section of Tham Lod Area 1. Modified from Shoocongdej et al.
(2003b). ......................................................................................................................................150
Figure 6.8. Age-depth plot for Tham Lod Area 1 with linear regression line and
equation. ...................................................................................................................................151
Figure 6.9. Views of Ban Rai ..................................................................................................152
Figure 6.10. Plan of excavations at Ban Rai. The surface is strewn with wood from log
coffins. Modified from Shoocongdej et al. (2003a). ............................................................153

xiii
Figure 6.11. Stratigraphic section of Ban Rai Area 3. Modified from Shoocongdej et al.
(2003a). ......................................................................................................................................154
Figure 6.12. Age-depth plot for Ban Rai Area 3 ..................................................................155
Figure 7.1. Results of 30 samples taken from umbo to margin of a shell from Ban Rai
excavation unit 11. Values on the vertical axis show maximum, mean and minimum.
...................................................................................................................................................184
Figure 7.2. Results of 30 samples taken from umbo to margin of a shell from Tham Lod
excavation unit 28. Values on the vertical axis show maximum, mean and minimum.
...................................................................................................................................................184
Figure 7.3. Results of oxygen isotope analysis of samples from Tham Lod and Ban Rai
spanning 30,000 years. Data markers show mean and 95% confidence interval. ..........185
Figure 7.4. Pleistocene sequences of δ18O from Hulu, China and Tham Lod. Data
markers for Tham Lod show mean and 95% confidence interval. ..................................186
Figure 7.5. Pleistocene sequences of δ18O from Dongge and Hulu, China and Ban Rai.
Data markers for Ban Rai show mean and 95% confidence interval. ..............................187
Figure 7.6. Results of carbon isotope analysis of samples from Tham Lod and Ban Rai
spanning 30,000 years. Data markers show mean and 95% confidence interval. ..........188
Figure 8.1:. Tham Lod: total MNA per cubic metre per 100 years ...................................194
Figure 8.2: Ban Rai: total MNA per cubic metre per 100 years .........................................195
Figure 8.3: Mean and 95% CI for discard rates at Ban Rai and Tham Lod .....................196
Figure 8.4: Tham Lod: Distribution of flake scar lengths on all cores. ............................205
Figure 8.5: Tham Lod: Distribution of flake lengths for all complete flakes. .................205
Figure 8.6: Ban Rai: Distribution of flake scar lengths on all cores. .................................207
Figure 8.7: Ban Rai: Distribution of flake lengths for all complete flakes. ......................207
Figure 8.8: Average values and 95% confidence intervals for core scar lengths (hollow
circles) and complete flake lengths (solid circles) at Tham Lod and Ban Rai ................208
Figure 8.9: Tham Lod: Probability density functions for the lengths of complete flakes
and flake scars on cores ..........................................................................................................209
Figure 8.10: Ban Rai: Probability density functions for the lengths of complete flakes
and flake scars on cores ..........................................................................................................209
Figure 8.11: Probability density functions for the lengths of complete flakes and flake
scars on cores from the experimental assemblage..............................................................210
Figure 8.12: Scatter plot matrix of key reduction variables for all complete flakes at
Tham Lod. The values have been jittered to separate overlapping points. ....................219

xiv
Figure 8.13: Tham Lod: Z-score plots and Lowess curves for (a) average percentages of
dorsal cortex on complete flakes per excavation unit, (b) average numbers of dorsal
flake scars on complete flakes per excavation unit, (c) proportion of flakes with
overhang removal per excavation unit and (d) average interior platform angle per
excavation unit. .......................................................................................................................221
Figure 8.14: Tham Lod: Z-score plots and Lowess curves for proportions of flakes with
(a) no cortex, (b) distal cortex, (c) lateral cortex, (d) all cortex ..........................................222
Figure 8.15: Scatter plot matrix of key reduction variables for all complete flakes at Ban
Rai. The values have been jittered to separate overlapping points. ................................223
Figure 8.16: Ban Rai: Z-score plots and Lowess curves for (a) average percentages of
dorsal cortex on complete flakes per excavation unit, (b) average numbers of dorsal
flake scars on complete flakes per excavation unit, (c) proportion of flakes with
overhang removal per excavation unit and (d) average interior platform angle. .........225
Figure 8.17: Ban Rai: Z-score plots and Lowess curves for proportions of flakes with (a)
no cortex, (b) distal cortex, (c) lateral cortex, (d) all cortex ...............................................226
Figure 8.18: Central tendencies and 95% confidence intervals for or dorsal cortex,
dorsal flakes scars, overhang removal, interior platform angle and dorsal cortex
distribution at Tham Lod and Ban Rai. ................................................................................227
Figure 9.1. Standard Marginal Value Theorem model ......................................................237
Figure 9.2. Schematic of a derivative function for the modified Marginal Value
Theorem of Figure 9.1 above. ................................................................................................237
Figure 9.3. Derivative function for modified Marginal Value Theorem showing
probable positions of Tham Lod (A-B) and Ban Rai (C-D). ..............................................238
Figure 9.4. Marginal Value Theorem modified to include inflection and multiple
optima .......................................................................................................................................238
Figure 9.5. Distribution of radiocarbon dates in mainland Southeast Asian
archaeological sites dominated by flaked stone artefact assemblages (n = 76). Data from
Reynolds (Feynman 1965, 1985) ............................................................................................243

xv
List of Tables
Table 5.1. Correlations of four classes of dorsal cortex location with reduction intensity
and flake mass. Confidence intervals that include zero indicate a correlation that is not
statistically significant. ...........................................................................................................120
Table 5.2. Spread or variability of values for each variable, measured in standard
deviations. ................................................................................................................................121
Table 6.1. Dates from Tham Lod Area 1. Dates without a SD for the calibrated age were
determined by thermoluminescence methods, the remainder were determined by AMS
radiocarbon methods. All ages are in years before the present. ......................................151
Table 6.1. Dates from Ban Rai Area 3. All ages are in years before the present. ............155
Table 8.1: Tham Lod: flake breakage by raw material .......................................................194
Table 8.2: Ban Rai: flake breakage by raw material ............................................................195
Table 8.3: Tham Lod: Ratios of MNF to cores, maximum and minimum values
highlighted, empty cells indicate no cores. .........................................................................204
Table 8.4: Ban Rai: Ratios of MNF to cores, maximum and minimum values
highlighted, empty cells indicate no cores. .........................................................................206
Table 8.5: Tham Lod: Mean, median values and 95% confidence intervals for dorsal
cortex, dorsal flakes scars, overhang removal, interior platform angle and dorsal cortex
distribution. See text for further explanation. .....................................................................220
Table 8.6: Ban Rai: Mean, median values and 95% confidence intervals for dorsal
cortex, dorsal flakes scars, overhang removal, interior platform angle and dorsal cortex
distribution. See text for further explanation.. ....................................................................224

xvi
If we cannot usefully employ the stone tools, we cut out a very large part of our direct
data from the past, data which provide many of the foundations of our more
theoretically oriented upper stories. (White 1977: 13).

1. Introduction
1
1. Introduction
Introduction
This thesis examines the relationship between human foragers and their environment
through the lens of stone artefacts deposited over a 35,000 year period at two sites in
northwest Thailand. The two sites, Tham Lod and Ban Rai, are located in an area
typical of the extensive seasonal tropical forests and limestone karsts of mainland
Southeast Asia. Despite an almost continuous tradition of archaeological research in
these environments since the 1960s, very little has been discovered about how human
foragers organised their stone artefact technology under varying environmental
conditions. Although statements have frequently been made about technological
change and climate change during the Pleistocene and Holocene in mainland Southeast
Asia, no study of direct links between these two variables has been reported. This
represents a serious gap in the knowledge required for understanding global variation
in non-agricultural human societies.
The organisation of flaked stone artefact technology refers to the choices that human
foragers make when solving the problems of maintaining a constant supply of stone to
do useful work when the availability of stone is discontinuous. The technological and
subsistence practises resulting from specific choices of individual foragers can be
difficult to unambiguously identify. However, when the outcomes of large numbers of
these choices are considered as an aggregate, through the measurement of assemblage-
level reduction, then it is possible to infer time-averaged patterns of decision-making.
For the two sites investigated here, employing stone to do work involves the reduction
of cobbles through the detachment of flakes. Resharpening and reshaping of flakes do
not appear to have been important strategies at these sites. The costs involved in the
reduction process, in terms of consuming artefacts by using them and the costs of
provisioning stone to make artefacts, vary according to the constraints and
opportunities at any given time. For example, where the cost of provisioning is high,
such as when sources of stone are remote, it is advantageous for people to adopt a
strategy that emphasises efficiency. This might include techniques that extend the
amount of work that can be done per unit of stone.

1. Introduction
2
While the organisation of stone artefact technology may reflect social, psychology and
political mechanisms, investigation of the role of the environment has emerged as a
very productive area of inquiry into stone artefact technology. In particular, previous
work has established that stone artefact technology is sensitive to variation in group
mobility, prey abundance and quality and risk related to resource availability and
scheduling (Bamforth 1986, Barton 1988, Bleed 1986, Clarkson 2007, Hiscock 2002a,
Kelly 1988, Kuhn 1995, Nelson 1991, Parry and Kelly 1987, Torrence 1989). This project
was motivated by the success of these previous investigations to apply their concepts
to the explanation of assemblage variability in mainland Southeast Asia. Mainland
Southeast Asia is a largely unknown region on the map of global variation in stone
artefact technology. Surrounding regions such as India, China and Indonesia have a
long history of productive research into stone artefact technology (Madsen et al. 2001,
Moore and Brumm 2007, Pappu 2001). However, the current research focus in
mainland Southeast Asia is on the emergence of agriculture and urbanism (Evans et al.
2007, White and Bouasisengpaseuth 2007). This has left undocumented the deep
prehistory of a large area with distinctive seasonal tropical forest environments and
historical trajectories.
Stone artefacts have not been completely neglected in mainland Southeast Asia, but
previous approaches have relied on concepts and methods that were either
inappropriate or incorrect. This has resulted in an apparent stasis in the study of stone
artefacts in mainland Southeast Asia. Much previous work has been concerned with
how the term ‘Hoabinhian’ is best defined and what diagnostic traits can be abstracted
from the typically amorphous stone artefact assemblages (Hutterer 1977). To be fair,
the difficulty in analysing mainland Southeast Asian flaked stone artefacts is a
common theme in previous work and tentative efforts have been made to replace
unproductive typological methods (Matthews 1964, White and Gorman 2004). This
project was motivated by these efforts to attempt to formulate a systematic and
comprehensive approach to explore variation in the amorphous stone artefact
assemblages characteristic of pre-agricultural mainland Southeast Asia societies.
The choice of study area and sites for this project was opportunistic. To undertake an
excavation large enough to produce the necessary stone artefact assemblage sizes to
make reliable statements about technology and the environment was beyond the limits
of this project. Consequently, a current field program was sought out where large

1. Introduction
3
excavations were already underway. This led to the excavations at Tham Lod and Ban
Rai that were conducted by a large Thai archaeological project directed by Rasmi
Shoocongdej of the University of Silpakorn. These sites were chosen by Shoocongdej
because they are located in an upland region of very high biodiversity that has been a
focus of archaeological research. High biodiversity means that climate changes should
leave more pervasive and detectable signals and the previous archaeological work,
conducted by Gorman (1971b) in the 1960s demonstrates that the study area already
has a reputation for shaping the construction of mainland Southeast Asian prehistory.
Aim and structure
The aim of this project is to explore the organisation of flaked stone artefact technology
under varying climatic conditions during the Pleistocene and Holocene at two sites in
the uplands of northwest Thailand. To achieve this aim, four questions will be
addressed.
1. What is the most productive conceptual framework to employ in the analysis of technological
organisation in mainland Southeast Asia?
Chapter two describes relevant previous work and concludes that although it has
attempted to address questions of ecology and technology, it has generally been
undertheorised and lacks convincing and testable links between observations and
explanations. In chapter three is it argued that evolutionary theory is well suited to this
task and three styles of evolutionary archaeology are examined. Human behavioural
ecology is concluded to be the most suitable given the problems of the other two styles
and the constraints of the available evidence. Ecological theory is an attractive source
of concepts because of three important methodological challenges shared between
ecology and archaeology. First, many ecological systems have long time scales. Second,
many ecological systems are difficult to replicate and replicates are rarely perfect.
Third, control over all aspects of an ecological experiment is difficult because many
variables are difficult to identify and measure (Hilborn and Mangel 1997). These
factors make it hard to get clear, unambiguous results in ecological experiments and
observations (Shrader-Frechette and McCoy 1992). This is also often the case for
archaeologists working on prehistoric human foragers. The success of ecology in
dealing with these challenges has inspired the approach taken here. Three foraging
models are presented as tools creating a bridge from behavioural ecological theory to
testable predictions about technological organisation. Chapter four identifies risk as a

1. Introduction
4
general quality that explains a substantial amount of variation in prehistoric
technology and adapts Kuhn’s (1995) spectrum of provisioning systems to link the
foraging models to technological strategies of risk management.
2. How should variation in technological organisation in mainland Southeast Asia assemblages
be measured most reliably and validly?
In other words, what is the best way to test the predictions of the three foraging models
using flaked stone artefact assemblages? A reliable measurement is one that yields
concordant results when repeated and is synonymous with accuracy and consistency.
Validity is the extent that an instrument measures what it is intended to measure
(Carmines and Zeller 1979). This question is motivated by the problems encountered
by previous work using typological methods to identify and describe patterns of
variation in stone artefact technology. Chapter four examines the issue of artefact
classification and finds that typological methods are inappropriate for mainland
Southeast Asian assemblages, and measurements of assemblage reduction are more
valid. To be precise, people do not reduce assemblages, they reduce individual pieces
of stone but the reliable reconstruction and analysis of these individual events is very
rare because they are difficult to identify in a large assemblage of artefacts. In this
project, ‘assemblage reduction’ refers to an average state of reduction derived from a
combination of numerous individual reduction events occurring relatively close in
space and time. This averaging results from the relatively long periods of time that the
assemblages examined here represent (a single excavation unit can span up to 1000
years) compared to a single reduction event which may last only a few minutes.
Chapter five presents the results of an experiment that identified a suite of variables to
reliably measure stone artefact assemblage reduction.
3. What is the climatic history that forms the backdrop of human forager activity in the
northern Thai uplands?
To make reliable statements about the relationship between human foragers and their
environment it is necessary to have reliable environmental data. Reconstructing
climate history is challenging because of the complex ways that proxies archive
climatic conditions. The seasonal tropics are especially challenging because previous
work has shown that proxies such as pollen and phytolith sequences tend to most
strongly reflect very local conditions and vary in chronological resolution, making
them problematic as regional signals. Chapter seven discusses these problems in detail

1. Introduction
5
and offers a solution in the form of oxygen isotope sequences derived from freshwater
bivalves. The bivalves were recovered from excavations at the same two sites that
produced the stone artefact assemblages. The reliability of the oxygen isotope
sequences is demonstrated by comparison to similar records from speleothems in
China. The isotope sequences establish a climate history directly relevant to, and at the
equivalent chronological resolution of the stone artefact sequences under investigation.
4. To what extent are climatic conditions related to technological organisation over time and
space in the northern Thai uplands?
Previous work has documented only relatively short cultural sequences and the
amount of detail presented for these sequences has made it difficult to detect patterns
within and between sites. The two sites described here are unique in providing a large
sample of flaked stone artefacts spanning 35,000 years. As such, they offer an
unprecedented opportunity to examine the rates and scales of continuity and change in
technology. Although the two sites are relatively close to each other, they are also
unique in allowing comparison between two substantially different local habitats.
Chapter six describes the local context of the sites, showing that Tham Lod is located in
semi-evergreen forest adjacent to a river and a large source of stone suitable for artefact
manufacture. Ban Rai, on the other hand, is located high above the same river, on the
side of a ridge distant from sources of stone and in more open forest. These two
different local contexts provide a convenient laboratory-like situation to test the
influence of variation in climatic conditions relative to differences in the local
availability of resources.
The analysis of the stone artefact assemblages from each site is presented in chapter
eight and is organised around the three foraging models presented in chapter three.
The predictions deriving from the models are refined in chapter six in light of the
specific environmental contexts of the two sites, and further predictions are presented
in chapter seven in light of the climate histories of the sites. These competing
predictions are evaluated in chapter eight which shows that there are substantial
differences between the two sites that reflect technological adjustments to the shift
from dry Pleistocene conditions to wet Holocene conditions. There are also millennial
scale changes in technology at both sites, some of which are related to climatic
variation and others that have non-climate mechanisms.
Conclusion

1. Introduction
6
In answering the four questions posed above, this project will establish its importance
by generating new momentum in the study of mainland Southeast Asian flaked stone
artefacts. It aims to contribute a sense of dynamism into the region’s prehistory and
show how one of the most ubiquitous kinds of material remains can give insight into
substantive issues of mainland Southeast Asian archaeology.

2. Approaches to flaked stone artefact archaeology in Thailand
7
2. Approaches to Flaked Stone Artefact Archaeology in
Thailand: A Historical Review
Introduction
The previous chapter introduced the general aim of this project as an examination of
the relationship between human foragers and their environment from the stone
artefacts evidence. In this chapter a sample of representative previous work is
surveyed to show the potential and limitations of the record. The purpose of this
chapter is to identify what is already known about flaked stone artefact technology in
mainland Southeast Asia by briefly describing some previous analytical and theoretical
approaches to stone artefact archaeology in Thailand. This historical review will
identify the important contributions of these analyses and identify topics deserving
further attention. Finally, some observations will be made about the areas where
progress in understanding flaked stone artefact technology might be possible. A
slightly shorter version of this chapter has been published in the Silpakorn University
International Journal (Marwick 2007a)
Research into stone artefact archaeology has a long history in Thailand and has made
significant contributions to our understanding of Southeast Asian prehistory. Since the
1960s there has been a series of archaeological projects by foreign and Thai
archaeologists that include substantial studies of stone artefacts. The focus in this
chapter is on flaked stone artefacts from excavated cultural deposits because they open
a window into technologies of the past that undated surface sites cannot.
Archaeologists in Thailand are among the most advanced and productive in Southeast
Asia and although the examples here are limited to Thailand, they exemplify the trends
and problems of work throughout mainland Southeast Asia. Although there is some
Thai language literature available on this topic, this chapter focuses on English
language publications because these are the most widely available and influential
sources. To understand the earliest work in Thailand I briefly discuss influential work
in Vietnam and Myanmar to provide some context to archaeology in Thailand (Figure
2.1). Then I discuss a selection of the most detailed and important studies from
Thailand.

2. Approaches to flaked stone artefact archaeology in Thailand
8
Colani and the Hoabinhian of Vietnam
The earliest writings on the stone artefact archaeology of Thailand were strongly
influenced by work on either side of the country, with French archaeologists in
Vietnam and American archaeologists in Myanmar. French archaeologists working in
the northern Vietnamese province of Hoa Binh in the 1920s and 1930s argued for the
presence of distinctive archaeological assemblage that they called ‘Hoabinhian’ (Colani
1927). As a result of this work the First Congress of Prehistorians of the Far East in 1932
agreed to define the Hoabinhian as
a culture composed of implements that are in general flaked with
somewhat varied types of primitive workmanship. It is characterised
by tools often worked only on one face, by hammerstones, by
implements of sub-triangular section, by discs, short axes and almond
shaped artefacts, with an appreciable number of bone tools (Matthews
1966).
Despite the general terms of the definition, Colani’s Hoabinhian is an elaborate
typology as indicated by the 82 artefacts from Sao Dong that she classified into 28 types
(Matthews 1966). Despite this complex system, most Hoabinhian sites are identified
simply by the presence of sumatraliths (White and Gorman 2004), which are river
cobbles that are flaked around the complete circumference but on one surface only, so
that when the cobble is turned over only the original rock surface, known as cortex, is
visible (Figure 2.2). The chronology of Hoabinhian artefacts was assumed by Colani
and others - working before radiocarbon dating methods appeared in the 1950s - to be
Holocene because of the absence of extinct ice-age fauna. The validity of the
Hoabinhian as a chronological or cultural concept in Southeast Asia is a subject of
ongoing and lengthy debate (Shoocongdej 1996a). As will be shown, it has been
variously used as a label for an ethnic group, time period, a form of subsistence
economy and a technology of making stone tools.
Movius and the Chopper-Chopping Tool Complex of Myanmar
From his work in the Irrawaddy Valley of southern Myanmar in the 1930s Movius
(1943, 1944) suggested that a technological line existed separating the unifacial (with
flaking only on a single surface) ‚chopper-chopping tool‛ tradition of eastern Asia
from the bifacial (with flaking on a both upper and lower surfaces) ‚handaxe‛ tradition

2. Approaches to flaked stone artefact archaeology in Thailand
9
of western Asia, Africa and Europe. Movius (1949: 36) defined chopping tools (Figure
2.3) as
core implements usually made on pebbles, or rough, more or less
tabular, chunks of rock, with a cutting edge that has been worked from
both sides. This edge is usually markedly sinuous, since in the majority
of cases it is produced by alternate flaking, or rather by the intersection
of alternating flake scars. This results in the formation of an edge that is
in the form of a broad ‘W’.
These types of artefacts were attributed to the Pleistocene because of the association of
similar forms with Homo erectus at Zhoukodian in China and other pre-modern
hominids in Europe and Africa. The difference between the chopper-chopping tool
complex and assemblages from elsewhere in the world is explained by Movius as a
result of differences in raw materials and ethnicity. Although an important early step
in understanding Southeast Asian stone artefact technology, Movius’ concepts have
made less impact than Colani’s Hoabinhian, and have been criticized for assuming that
absence of evidence (of bifacial artefacts) is evidence of absence (Boriskovsky 1971), for
ignoring bifacially worked artefacts in east Asia (Hutterer 1977) and for not allowing
for the diversity and complexity of east Asian assemblages that have subsequently
been described (Yi and Clark 1983).
The first contributions from Thailand
The earliest published work on stone artefacts in Thailand was on some excavations of
caves and rockshelters south of Chiang Mai and in the west-central of Thailand at
Ratchaburi (Sarasin 1933). Sarasin described the stone artefacts as amorphous and
generally without any indication that they were intentionally manufactured except for
two or three cobbles with unifacial flaking. Sarasin did not discuss his finds in detail,
but these artefacts were later interpreted by Heider (1958) as ‘probably either of the
Palaeolithic chopper-chopping tool tradition or of the Mesolithic Hoabinhian tradition.’
This statement reflected a common view in Southeast Asian archaeology that the
Chopper-Chopping Tool Complex is a Pleistocene assemblage and the Hoabinhian is a
Holocene assemblage, and also reflects the absence of clear differences between the
two stone artefact assemblages. It is noteworthy that Heider identified the Thai
assemblage with both Vietnamese and Burmese assemblages, suggesting a large
homogenous culture area for prehistoric Southeast Asia.

2. Approaches to flaked stone artefact archaeology in Thailand
10
Van Heekeren’s work at Sai Yok 1960-1962
In 1948 van Heekeren published a brief account of his archaeological discoveries in
Kanchanaburi Province, west-central Thailand. His account describes a small number
of artefacts encountered while working on the Thai-Myanmar Railway as a Japanese
prisoner of war in 1943-44. He identified these as a local expression of the Chopper-
Chopping Tool Complex which he named the ‚Fingnoian‛. The age of these artefacts is
uncertain because it is based only on their location in a gravel bed assumed by van
Heekeren to have been formed during the Pleistocene (van Heekeren and Knuth 1967).
Eight stone artefacts were also recovered from a cave near Wan Po and described by
van Heekeren as Hoabinhian from the Holocene period because of their association
with un-mineralised animal bone and molluscs.
Van Heekeren’s finds of flaked and polished stone artefacts in surface assemblages
during the 1940s (in addition to Heider’s (1958) collection of over one hundred
artefacts from surface sites in the same area) encouraged him to return in 1960 with a
team of Danish and Thai specialists. The most important result of this work is the
publication of the excavation at Sai Yok rockshelter in Kanchanaburi. Over 50 square
metres were excavated between 1960 and 1961, some sections to a depth of 425 cm
below the surface. No radiocarbon dates were obtained apparently because no datable
material was found, but the maximum age is estimated by the excavators to be about
10,000 years before the present (BP) because of the associated extant fauna. The 1,500-
odd stone artefacts, mostly made from quartzite, were classified by ‘visual inspection’
according to a typology devised by van Heekeren (1967) (Figure 2.4). Three major
categories of artefacts were recognised, ‘massive high-domed tools, sturdy choppers
with a minimum of trimming, and proper Hoabinhian implements’ and were further
subdivided (van Heekeren and Knuth 1967). Using an analogy to Australian
Aboriginal ethnographic data, they suggest that the Sai Yok artefacts were used for
skinning and dismembering game and manufacturing hunting tools of wood and
bamboo. Several hundred flakes and flake fragments were also found throughout the
deposit but are not described in detail. No data about artefact dimensions or attributes
are presented in the publications but van Heekeren (1967: 107) observed that
<generally the later tools tended to grow smaller and finer and there
was a greater discrimination in selecting the raw material, i.e. smaller,
more shapely and more suitable pebbles were chosen as raw material

2. Approaches to flaked stone artefact archaeology in Thailand
11
in the later periods of occupation. At the same time, however, it must
be admitted that there was an extraordinary slow rate of technical
development in tool manufacture and that tools of the simplest and
crudest type continued to be found in the more recent layers. Lines of
demarcation of types, if they could be drawn at all, would in no way
correspond to those separating upper from lower strata. This suggests
that the pebble tool industry went through an uninterrupted period of
hardly any change. The term 'pre-ceramic pebble tool industry'
therefore is used to cover the entire collection.
The unchanging nature of the artefacts is attributed to their suitability to the tropical
forest environment and the availability of wood and bamboo as raw materials for
implements (van Heekeren and Knuth 1967). Like Movius, van Heekeren notes that
evidence from Sai Yok supports finds from Myanmar, Malaya, India and China in
suggesting that Southeast Asian Pleistocene assemblages do not contain bifacial,
prepared core or standardised blade technologies like those found in Africa, Europe
and west Asia. Van Heekeren (1967: 107-111) explains this difference as a result of
environmental differences, with Southeast Asia ‘characterised by a tropical climate
with heavy rainfall and there were perhaps no major climatic and faunistic changes at
the termination of the Pleistocene period.’ He also suggests that Southeast Asian stone
technology may have developed in isolation from other parts of the world because of ‘a
lack of initiative and creative activity.’
This work is an excellent reflection of European archaeology from the 1960s with the
strict typological approach to the stone artefacts (Lyman et al. 1997, Trigger 1989). The
concern with culture-historical themes is also typical, such as the problem of the
absence from Southeast Asia of the typological sequences and chronological markers
found in Europe, Africa and west Asia. The inferred stagnation of Southeast Asian
lithic assemblages over long periods is also a concern. The most important limitations
of the work were noted shortly after its publication by Gorman (1969b) who criticised
the absence of radiocarbon dates or pollen analyses that could have provided the
chronological and palaeoecological data to support van Heekeren’s conclusions.
Gorman also found that this work was difficult to compare with other Southeast Asian
sites because of the ambiguity of stratigraphic continuity, the lack of supporting
evidence for many statements concerning prehistoric behaviours and the minimal
detail presented in the stone artefact analysis.

2. Approaches to flaked stone artefact archaeology in Thailand
12
Matthew’s analysis of Sai Yok stone artefacts 1964
As part of his PhD research at the Australian National University, Matthews (1964)
analysed some metric and technological attributes of flaked cobble artefacts from Sai
Yok. His aim was to determine if Hoabinhian artefact types were ‘real’ types or an
arbitrary system of types imposed by Colani on a continuum of forms. His method was
to test if the artefact types could be defined as clusters of constantly recurring metric
and non-metric attributes. Matthews’ analysis supported van Heekeren’s conclusions
that the unifacially flaked cobbles became smaller as the depth of deposit decreased
and that there were no marked changes in the assemblage over time. However, the
most significant conclusion of Matthews’ work was that he could not define Colani’s
Hoabinhian types in terms of constantly recurring attributes. In other words,
Hoabinhian types did not exist at Sai Yok and Hoabinhian artefacts simply reflect a
continuous blend of shapes and sizes. Van Heekeren (1967: 38) had similarly suggested
that ‘no hard and fast rules can be made to differentiate the many types of implements,
as some types almost imperceptibly merge into others’. Matthews’ more objective
statistical study lends some empirical support to van Heekeren’s observation.
Matthews (1966: 88) later published some of his critical assessment of Colani’s work
that defined the Hoabinhian and concluded that
Colani has neither defined a satisfactory typology for the collections of
Hoa Binh province, nor has she isolated three chronological phases
based on the stratification of the excavated deposits. However, it
appears that the flaked artefacts, which presumably served as simple
cutting and scraping tools, were larger in the lower parts of the
deposits and that the diminution of size with decreasing depth was a
gradual process.
This statement summarises the knowledge of Southeast Asian stone artefacts in the
1960s. Despite the publication of elaborate and well-illustrated typological
classifications, Matthews shows that these typologies do not accurately reflect the
range of variation in the assemblages. The only robust conclusion from Sai Yok and the
northern Vietnamese sites is that flaked artefacts tend to get smaller in more recent
times. His work shows that Southeast Asian stone artefact assemblages need to be
analysed in a framework that recognises observational units (such as the sumatralith
type) as a commonly occurring shape on a continuum of gradually changing shapes

2. Approaches to flaked stone artefact archaeology in Thailand
13
rather than the traditional framework of discrete and immutable types proposed by the
early French archaeologists.
Matthews’ conclusions about typological methods have been validated by more recent
work outside of Thailand which argues that essentialist typologies hide much of the
variation found in stone artefact assemblages that is important for explanations of
cultural change (Dunnell 1982, Lyman et al. 1997) and mask many of the underlying
processes of artefact manufacture, use and discard (Kuhn 1992a, Schiffer and Skibo
1997). Chapter four explores these concerns in more detail. The main limitation of
Matthews’ work is that it seems to have been exclusively methodological and he made
little contribution to understanding how changes in the artefact assemblages related to
the life and history of the people who produced them. In addition, Matthews did not
publish a detailed account of his analysis and results, so his most important findings
are not widely known and have had little impact.
Gorman’s work at Spirit Cave 1965-1971
Gorman (1969a) recognised that Matthews’ work implied that stone artefacts could not
uniquely define Hoabinhian cultures (with the methods available at the time) so he
chose to focus on the human ecology of the Hoabinhian at Mae Hong Son Province,
northwest Thailand. As part of his PhD work at the University of Pennsylvania he
excavated a series of one metre squares at Spirit Cave to a depth of about one meter.
Fourteen radiocarbon samples were submitted and the results indicated that most of
the excavated materials were deposited at 12,000-7,500 BP (Gorman 1969a). Although
Gorman’s (1972: 80) main aim was to ‘argue for the importance of the humid tropics as
hearths of early plant and animal domestication’, and much of his analysis is dedicated
to organic materials, he made several important contributions to the analysis of
Southeast Asian stone artefacts.
Gorman followed the framework of Matthews and based his approach on Peter
White’s (1969:22) work in New Guinea where he concluded that ‘it is probably more
accurate to regard a stone implement as the record of a series of discrete processes
which have acted on it than as an attempt to create a specific formal type.’ Gorman
(1971b: 30) analysed artefacts from Spirit Cave using ‘technological criteria (i.e.
technique and area of preparatory flaking, length, width, breadth, weight of the
implement etc.), and usewear criteria (edge damage patterns such as step-flaking,
chipping etc.).’ Following his analysis, Gorman (1972) proposed that the frequent use

2. Approaches to flaked stone artefact archaeology in Thailand
14
of the Eurocentric terms ‘Palaeolithic’, ‘Mesolithic’ and ‘Neolithic’ to describe
Southeast Asian archaeology was inappropriate because the defining characteristics of
those periods were not present (Figure 2.5). Gorman, like van Heekeren, suggested that
the absence of any significant changes in stone artefact technology probably resulted
from the apparent continuity of environmental conditions from the terminal
Pleistocene to the Holocene (Gorman 1972).
Preliminary results published in 1970 show two cultural levels at Spirit Cave, the older
level (c. 12,000-9,000 BP) containing a Hoabinhian assemblage of ‘large unifacially
worked cobble cores, grinding stones and retouched and utilised flakes’ and the
younger level (c. 9,000-7,000 BP) containing this Hoabinhian assemblage plus ‘flaked
and quadrangular adzes, small ground and polished slate knives and cord-marked and
burnished ceramics’ (Gorman 1972: 95). Gorman’s (1972: 95) microscopic edge-damage
analysis indicates that many artefacts were used, with sumatraliths having ‘severe step
flaking’ and striations, abrasions and use-fractures are present on edges of about 30%
of retouched and utilised flakes. Most of the stone artefacts at Spirit Cave were made
from readily available coarse-grained quartzite river cobbles.
These lithics formed a small part of Gorman’s analysis, which included ceramics,
animal and plant remains. These data led him to redefine the Hoabinhian from a
simple description of stone artefacts to include ecological dimensions (Gorman 1972:
82):
1. A generally unifacial flaked tool tradition made primarily on water
rounded pebbles and large flakes detached from these pebbles;
2. Core tools ("Sumatraliths") made by complete flaking on one side of a
pebble and grinding stones also made on rounded pebbles, usually in
association with iron oxide;
3. A high incidence of utilized flakes (identified from edge-damage
characteristics)
4. Fairly similar assemblages of food remains including remains of
extant shellfish, fish, and small-medium-sized mammals;
5. A cultural and ecological orientation to the use of rockshelters
generally occurring near fresh water streams in an upland karstic

2. Approaches to flaked stone artefact archaeology in Thailand
15
topography (though Hoabinhian shell middens do indicate at least one
other ecological orientation);
6 Edge-grinding and cord-marked ceramics occurring (though perhaps
as intrusive elements), individually or together, in the upper layers of
Hoabinhian deposits
Gorman’s work is notable because it included a number of important redefinitions
relevant to Hoabinhian stone artefacts that encourage recognition and explanation of
its unique qualities. As with the work of others, the weaknesses of Gorman’s
publications are the absence of detailed discussions or data about the stone artefacts.
This is probably due to Gorman’s interest in agricultural origins at Spirit Cave and the
importance of botanical and zoological remains in his project.
White and Gorman’s work on Tham Phaa Chan 1972-1979
Following from his work at Spirit Cave, Gorman returned to Mae Hong Son and
excavated Tham Phaa Chan (also known as Steep Cliff Cave) and Banyan Valley Cave.
The cultural deposit at Tham Phaa Chan dated from 7,500 BP to 5,100 BP and about 200
cobble artefacts and numerous flakes and other pieces were recovered (White and
Gorman 2004). In 1979 Gorman and Joyce White, then a graduate student under
Gorman’s supervision at the University of Pennsylvania, presented a conference paper
(published unaltered in 2004) arguing against claims that Hoabinhian stone artefact
assemblages were disappointingly amorphous and unpatterned. They intended to
demonstrate the standardization of Hoabinhian manufacturing and curating
procedures and outline a sequence of stages in the reduction of river cobbles into
flaked artefacts at Tham Phaa Chan. Influenced by Collins’ (1975) work in North
America, White and Gorman proposed a lithic reduction model with five behaviour
sets that have distinctive effects on stone artefacts: raw material acquisition,
decortication, an edge modification cycle (use, trimming, rejuvenation, shaping),
bifacial flake removal, and dorsal cortex removal.
White and Gorman sampled 417 flakes, recording a series of metric and technological
variables for each flake. They analysed flakes because they wanted information about
each stage in the manufacturing process rather than just the final stage represented by
the flaked cobble. This focus on flakes is a major departure from the cobble-based
analyses of previous stone artefact studies in Thailand and Southeast Asia generally.

2. Approaches to flaked stone artefact archaeology in Thailand
16
White and Gorman (2004: 437) suggest that the Hoabinhian reduction sequence at
Tham Phaa Chan has three major stages:
(1) the systematic selection of locally available raw materials, namely
somewhat flattened ovaloid quartzite river cobbles, and continuing
with (2) the cobbles’ systematic modification by flaking beginning with
initial shaping by unifacial circumferential decortication, followed by
(3) various differentiated shaping and resharpening activities repeated
as needed throughout the tool’s use-life (with the majority of flakes
struck circumferentially from a single cortical surface).
They concluded that flakes were produced to resharpen the cobble rather than for use
as flake-tools because they believe the average size of flakes was too small for tool-use.
Gorman and White’s study represents a significant turning point in stone artefact
analysis in Southeast Asia for two reasons. Firstly, their study shows that previous
statements about the primitive and inscrutable character of Hoabinhian stone artefacts
are not accurate and that these assemblages do exhibit discernable patterns. Secondly,
they demonstrate that flakes may be more useful than flaked cobbles for
understanding Hoabinhian artefacts. For its time, the study used a progressive and
relatively complex method involving metrical and technological variables for recording
stone artefacts in a materialist framework. The main limitations of the study are the
unclear definitions of stone artefact attributes which make it difficult to understand the
differences between the patterns identified. Further limitations include the absence of
any theoretical framework for interpreting the patterns in terms of what behaviours
they represent and how they change over time. Like Matthews, White and Gorman did
not publish their findings in a timely manner, depriving subsequent workers of its
important innovations.
It is worth noting that 28 cobble tools from Tham Phaa Chan were analysed by
Bannanurag (1988) for traces of usewear using low-power magnification (20-100
magnifications). The presence of steep edge angles, microscopic polish and micro-flake
scars suggested to Bannanurag that the artefacts were probably used for working wood
and bone rather than meat or soft vegetable matter. Bannanurag (1988) appropriately
cautions that her findings are only tentative because of the absence of relevant
comparative experimental work and the small sample analysed.

2. Approaches to flaked stone artefact archaeology in Thailand
17
Pookajorn’s work at Ban Kao District 1977-1979
In the late 1970s Surin Pookajorn led a team of Thai archaeologists from Silpakorn
University to excavate three rockshelters in Kanchanaburi, Western Thailand. This
work was published in English after Pookajorn completed graduate studies on material
from the sites in the United States and Germany. The aim of the work was to use
ethnographic information from the Mlabri hunter-gatherers of northern Thailand to
interpret the archaeology of the Hoabinhian and to determine if the Hoabinhian is
more accurately considered a culture or a ‘technocomplex’ (1984, 1988, 1990, 1992,
1996). These definitions are based on Clarke’s (1968) taxonomy of archaeological time
and space units. Clarke (Clarke 1968: 188) defined culture as a ‘polythetic set of specific
and comprehensive artefact-type categories which consistently recur together in
assemblages within a limited geographical area’. The term ‘technocomplex’ refers to a
vaguer entity and has been used for broadly similar sets of stone artefacts that are
widely distributed across Europe and Africa. The similarities are thought to result from
similar responses to common environmental problems at a regional and inter-regional
scale (Gamble 2004: 130). The three cultural layers of Khao Talu, Ment and Heap caves
were dated from 11,000 to 2,000 BP (Pookajorn 1990). The oldest cultural level is
labelled as Early Hoabinhian (10,000-4,500 BP) with large flaked cobbles and flakes, the
second cultural level is distinguished by the addition of pottery and called the Late
Hoabinhian (4,500-2,000 BP) and the third cultural level is called the transitional
Neolithic-Bronze Age level (2,500-1,000 BP) and in addition to similar material from the
previous levels, includes ground-edge stone artefacts, some new kinds of potsherds
and beads (Pookajorn 1990).
Pookajorn (1988) recovered 3,000 stone artefacts from the three sites and analysed 86 of
these by recording some metric and non-metric variables. Differences in artefact shape
were used to classify flaked cobbles into four types and flakes into six types. The 86
pieces were further classified into six types according to edge angles. Low power
microscopic inspection of some of the artefacts apparently suggested that they were
used for woodworking but it not clear what attributes were considered to be diagnostic
of this. From his analysis and the absence of undefined ‘hunting implements’ in the
assemblages, Pookajorn (1990) concludes that the stone artefacts were not used directly
to extract subsistence recourses but used for tool maintenance purposes, such as
making wood and bamboo implements.

2. Approaches to flaked stone artefact archaeology in Thailand
18
According to Pookajorn, the stone artefact data indicates that the Hoabinhian is a
‘technocomplex <defined by the environment in which the sites are situated, and by
the resources available to prehistoric communities there’ (1990). He updates Gorman’s
six traits for the Hoabinhian with evidence from the Ban Kao sites, showing that
bifacially flaked cobbles appear with the more ubiquitous unifacially flaked cobbles
when fine grained raw material such as chalcedony and chert are available, and that
used flakes may not always be as abundant as Gorman suggested (Pookajorn 1990).
The stone artefacts from Pookajorn’s Ban Kao sites were later investigated in two
undergraduate theses and one MA thesis (Auetrakulvit 1995) from Silpakorn
University but these findings have not been published. More recently, Moser (2001)
published a brief analysis of stone artefacts from Moh Khiew and found that the
assemblage was generally unretouched flakes made from coarse-grained raw
materials. He concludes that the cobble tool typology does not show chronological
variation.
The stone artefact analysis appears to have been a minor component of Pookajorn’s
work compared to the floral and faunal analyses and the ethnographic descriptions
(which do not include stone artefacts, the Mlabri use only organic and metal tools). The
main limitation of the work is the absence of supporting metric, technological and
usewear data in any of the publications which means that many of his statements
about the Ban Kao assemblages are unconvincing because they lack supporting
evidence. It also makes it very difficult to compare the Ban Kao assemblages with any
other assemblages (Bulbeck 2003). This criticism also applies to Pookajorn’s (1996) later
work at Moh Khiew and Sakai Caves, Krabi Province, where the emphasis is on past
environmental reconstruction rather than the stone artefact assemblages. In general,
Pookajorn’s approach to the stone artefacts at Ban Kao appears anachronistic with its
formal typological focus, lack of detailed data and its concern with definitions of the
Hoabinhian rather than questions of human behaviour and history.
These criticisms might be considered unfair in light of Glover’s (1993) observations that
the aims and motives of Thai and western archaeologists frequently differ with Thai
archaeologists showing ‘rather little interest in generalized explanations couched in
terms of evolutionary processes, and not very much in comparative archaeology
outside Thailand’ (Glover 2001:45). However, Pookajorn’s papers in journals such as
World Archaeology (1985) and in an edited volume with western scholars (1996) suggest

2. Approaches to flaked stone artefact archaeology in Thailand
19
that he intended his work to be consumed by an international audience, so
international standards of criticism are appropriate.
Anderson’s work at Lang Rongrien 1983-1984
The aim of the Anderson’s excavation was to ‘trace the archaeological, biological and
geological history of southwestern Thailand, or more broadly speaking, the
northwesternmost edge of the Sunda Shelf’ (Anderson 1990). To achieve this aim
Anderson excavated Lang Rongrien rockshelter at Krabi and revealed a stratified
deposit with one of the oldest cultural sequences in Southeast Asia. The occupational
layers date from >38,000 BP to about 7,500 BP, with a rooffall level at about 27,000 BP
(Anderson 1997). The sequence is divided into three phases: late Pleistocene, dating
between 27,000 and >38,000 BP; early Holocene, between 9,600 and 7,500 BP; and
middle Holocene, probably between 4,000 and 3,500 BP. The Pleistocene archaeological
assemblage is mostly small, unifacially retouched flake tools (Figure 2.6). The early
Holocene assemblage differs because it is dominated by large heavy, unifacially and
bifacially flaked core tools typical of the Hoabinhian industry (Figure 2.7). The middle
Holocene deposits include four burials with pedestal pots and small cord-marked
vessels (Anderson 1987). The most unique and important result of this work is the
suggestion that Southeast Asian Pleistocene assemblages may be flake industries rather
than cobble-based industries as initially suggested by Movius.
Anderson’s (1990:38) stone artefact classification system is a typology derived from van
Heekeren’s work at Sai Yok and is based largely on artefact shape, size and presumed
function. Although some comments are made about retouch and inspection of artefact
use-edges by low power magnification, there are no data in the publications. Metric
and technological variables do not appear to have been part of Anderson’s stone
artefact analysis.
Anderson’s interpretation of the stone artefact data is an attempt to explain the
geographic spread and time span of the Lang Rongrien assemblage. He compares the
artefact types in the Pleistocene layers of Lang Rongrien to other Pleistocene
assemblages in Vietnam, Malaysia, Philippines, South Sulawasi and southern China.
He notes a series of differences but emphasises that all assemblages are characterised
by flake tool assemblages with high proportions of amorphous flakes with steep
unifacial retouch and very low proportions of cobble artefacts (Anderson 1990:66).
Anderson (1990) interprets this regional pattern of Pleistocene flake assemblages as

2. Approaches to flaked stone artefact archaeology in Thailand
20
evidence that Movius’ Chopper-Chopping Tool Complex is not an accurate label for
Southeast Asian assemblages because cobble chopping artefacts are not common, and
the label emphasises wide-area homogeneity and cultural conservatism that is
contradicted by the available evidence. Anderson also notes that despite the amount of
archaeological research conducted since Movius’ time, the apparent Pleistocene
antiquity of the Movius’ Irrawaddy cobble assemblages remains unproven (cf.
Hutterer 1985).
Anderson similarly compares the frequencies of types in the Holocene layers of Lang
Rongrien assemblage to a number of mainland and insular Southeast Asian sites and
shows that the Lang Rongrien assemblage is most similar to the Malaysian Hoabinhian
because of the low proportions of sumatraliths (Lang Rongrien has none) and because
‘nearly all of the flake tools from the middle levels of Lang Rongrien have flat retouch,
a feature that sharply distinguishes them from the Hoabinhian assemblages of
Vietnam’ (Anderson 1990:46).
Anderson suggests an ecological explanation for the origins of the Hoabinhian at Lang
Rongrien, suggesting that the change from Pleistocene flake assemblages to Holocene
cobble assemblages at Lang Rongrien is a response to reduced seasonality, increased
precipitation and warmer temperatures during the Holocene. Anderson suggests that
the Pleistocene flake assemblage was used by hunters who exploited open savannas
and animal movement patterns that were made predictable by the use of valleys as
refuges from the low air temperatures. During the Holocene the increased precipitation
caused the open savannas to disappear and the warmer temperatures reduced the need
for biogeographical refuges. He proposes that the cobble assemblages may be related
to agricultural tasks such as forest-clearing or ground-breaking or shellfish
procurement, but acknowledges that ‘the evidence is not strong’ (Anderson 1988:56).
This interpretation contrasts with Gorman and van Heekeren who believe that there
were no substantial changes in technology and climate at the terminal Pleistocene and
early Holocene.
Anderson’s work is important because Lang Rongrien has a long cultural sequence and
his interpretation of the material is an unusually detailed engagement with historically
and anthropologically significant themes in Southeast Asian archaeology. However, it
is problematic that his conclusions about the Pleistocene flake industry are based on
only 58 artefacts (47.9% of the Pleistocene assemblage) which may be the result of a

2. Approaches to flaked stone artefact archaeology in Thailand
21
series of isolated short episodes rather than reflecting a long term pattern (Bulbeck
2003). The most important problems with his work, like those before him, are the
absence of detailed stone artefact data and the failure to acknowledge contemporary
developments in hunter-gather anthropology and archaeology. At the time Anderson
was working, there were important debates in hunter-gatherer archaeology by
American and European archaeologists about interpreting sites and stone artefacts
which resulted in new approaches and methods (Binford 1980, Binford and Binford
1966, Bordes and de Sonneville-Bordes 1970, Dibble 1987, Rolland 1981). As an
American scholar, Anderson might have been expected to have engaged more with
this work and perhaps have used Lang Rongrien as an opportunity to test these new
methods and concepts.
Reynolds’ work on Tham Khao Khi Chan and Banyan Valley Cave, 1989-1992
Reynolds’ work is unique in mainland Southeast Asian archaeology because he brings
experience in European stone artefact archaeology from his PhD research before
working on stone artefacts from two sites in Thailand. First, he analysed and described
stone artefacts from Tham Khao Khi Chan, Surat Thani Province in southern Thailand,
excavated by the Tharapong Srisuchat and the Thai Fine Arts Department for a salvage
project in 1985 (Reynolds 1989). The site was excavated to a depth of 2.6 metres and
four radiocarbon dates span 6,100 BP to 4,700 BP (Reynolds 1989:42). The second site
Reynolds (1992) analysed stone artefacts and other material from was Banyan Valley
Cave in the northwest province of Mae Hong Son, excavated by Gorman in 1972
(Figure 2.8). The final depths of the excavation were not recorded but were probably
little more than the lowest hearths at 80-90 centimetres below the surface. Two
radiocarbon dates indicate that the site was used between 900 BP and 5,300 BP and six
thermoluminescence dates on ceramics fall within this period. Reynolds classifies the
artefacts using his own typology. Like previous typologists such as van Heekeren,
Reynolds’ method of analysis is to compare the frequency of types in different layers.
In his publication about Tham Khao Khi Chan Reynolds (1989) makes a number of
important arguments about stone artefacts and human behaviour. First, he argues
against White and Gorman’s proposal that the majority of utilised flakes in Hoabinhian
assemblages are the result of core resharpening or reshaping. White and Gorman
suggest that usewear on flakes derives from use of the core from which the flake is
detached, but Reynolds notes that usewear on the utilised flakes from Tham Khao Khi

2. Approaches to flaked stone artefact archaeology in Thailand
22
Chan occurs on the lateral margins of the flakes which would not have been exposed
while the flake was still attached to the core. Similarly, Reynolds argues that the high
ratio of ‘plain’ flakes to utilised flakes suggests that the production of flakes is often
independent of core resharpening. The second observation is that although flakes
outnumber cores in each of the three analytical units, the single conjoin found and the
low ratio of numbers of negative flake-scars on cores to numbers of flakes suggests to
Reynolds that many flakes are missing from the rockshelter and that stages of the
reduction sequence occurred off-site. The third observation is that there are no major
technological changes associated with an increase in the proportion of artefacts made
from fine-grained raw materials (which have more predictable flaking characteristics)
in the upper unit. Reynolds (1989:42) concludes that the Tham Khao Khi Chan
assemblage
<appears to be a fairly typical Hoabinhian for southern Thailand, with
many steep-edged core tools retouched in such as way as to retain
cortex adjacent to the flaked edge. Flakes are an important part of the
assemblage both technologically and functionally. The reduction
strategy employed was generalised and not aimed at producing
specific blank forms. Rather such pieces as were suitable were selected
from a range of flakes. Resharpening flakes were rare. Differential use
of raw materials does not appear to have been significant, but further
study of the raw materials and replicative experiments would be most
informative.
Reynolds’ (1992:84) observations on the stone artefacts from Baynan Valley Cave are
less detailed because of plans to publish them in more detail in the future (in 2007 no
further publications were available). Differences in the stone artefact assemblage
suggest that the four stratigraphic units recorded by Gorman can be grouped into
Hoabinhian and non-Hoabinhian layers. The upper, or younger, two non-Hoabinhian
units ‘lack the pebble tool element, flakes are thinner, and they have fewer step-flaked
dorsal surfaces’ and have a higher proportion of ground edge artefacts (Reynolds
1992:85). Only the lower two units contained small numbers of ‘sumatraliths
(unifacially flaked discoids), short axes, steep-edged pieces [unifacially and bifacially
flaked] and axes, all of which are characteristic of the Hoabinhian technocomplex in
Thailand’ (Reynolds 1992:85).

2. Approaches to flaked stone artefact archaeology in Thailand
23
Like White and Gorman, Reynolds made a significant and progressive contribution to
stone artefact studies in Southeast Asia. Reynolds goes beyond White and Gorman
because he shows how the analysis of technological attributes can be used to
reconstruct behaviours relating to reduction intensity and how they changed over time.
He also shares their limitations, including the absence of detailed metric data and the
lack of discussion of the wider anthropological implications and regional significance.
Reynold’s arguments are weakened by a lack of application of fracture knowledge to
describing the assemblages. At the time Reynolds was working on these two
assemblages fracture dynamics were familiar to archaeologists from a number of
publications (cf. Bamforth 1986, Cotterell and Kamminga 1987, Dibble and Whittaker
1981, Phagan 1985, Speth 1972) and it is unclear why Reynolds did not draw on this
literature.
Shoocongdej’s work at Lang Kamnam, 1989-1996
For her PhD thesis at the University of Michigan, Rasmi Shoocongdej (1996a) worked
on the material from a series of 2.5 metre deep excavations at Lang Kamnan
rockshelter, Kanchanaburi to study mobility organisation of hunter-gatherers in
tropical seasonal environments during Late and post-Pleistocene periods. She defined
mobility organisation as ‘the way foragers arrange their camp movements in relation to
subsistence activities in relation to environmental variability’ (Shoocongdej 1996a:11).
Her interpretive framework was based on the work of Binford (1980) and Kelly (1992)
who argue from ethnographic evidence that mobility organisation is an environmental
adaptation exerting strong influences on hunter-gatherer cultural processes and social
organisation. To evaluate mobility organisation and investigate temporal change, the
excavated sequence at Lang Kamnan was divided into three analytical units based on
radiocarbon dates, stratigraphy and archaeological remains: Late Pleistocene (c. 27,000–
10,000 BP), Early Holocene (c. 10,000–7,500 BP) and the Middle Holocene (c. 7,500–
2,500 BP). The only significant change in the stone artefact assemblage appears to be
the introduction of ground-edge artefacts in the Middle Holocene unit.
Shoocongdej’s aim for the lithic analysis was to determine if the assemblage technology
is expedient (where artefacts are made with a minimum of production effort and
discarded after a relatively brief use-life) or curated (where artefacts have a relatively
long use-life and are repeatedly repaired and resharpened). This distinction is based on
Binford’s (1986) now-famous classification of hunter-gatherers along a spectrum of

2. Approaches to flaked stone artefact archaeology in Thailand
24
mobility from foragers (hunter-gatherers who exploit resources by moving residential
camps to the resource locations) to collectors (hunter-gatherer groups who do not
move residential camps as often, but organize task groups to exploit resources at
remote locations, often in bulk, and bring these resources back to the residential base
camp for the entire group). In their analysis of ethnographic and archaeological
studies, Binford (1980), Kelly (1992), Shott (1986) and others found a strong positive
correlation exists between mobility frequency and the curated component of lithic
assemblages and an inverse relationship between technological diversity and
residential mobility. In brief, they conclude that ‘the more you move, the less you carry
and the more you conserve what you carry’ (Shott 1989b:221).
To fulfil this aim, Shoocongdej created a typology similar to Reynolds’ by classifying
stone artefacts into types according to technological characteristics thought by
Shoocongdej to relate to the artefacts’ manufacture, use, maintenance and discard. The
proportions of these types were then compared to understand the level of curation in
tools found at Lang Kamnan. Shoocongdej also collected metric data from the artefacts
and flakes were examined at 10-40x magnification in an attempt to identify traces of
use.
Shoocongdej recovered 874 stone artefacts from Lang Kamnan and classified them into
ten categories. Quartzite is the most common raw material throughout the assemblage.
She interprets a relatively high ratio of flakes to cores and a relatively high ratio of
tertiary to primary flakes as evidence of tool production. Similarly, the small
proportions of ‘resharpened cores’ and flakes suggest to Shoocongdej (1996:260-282) a
relatively minor tool maintenance component. According to these variables, the
assemblage apparently changes very little over time.
The dominance of unprepared cores, the small number of retouched flaked and the
apparently unsystematic production and use of flakes at Lang Kamnan suggested to
Shoocongdej an expedient assemblage that is typical of a residential mobility strategy
(1996a:280-2, 2000:28). As proposed by many previous researchers (eg. Boriskovsky
1971, Pope 1989), Shoocongdej explains residential mobility as an adaptation to the
ready availability of lithic raw materials and organic raw materials (such as shell,
bamboo and bone) from which more lightweight, portable, flexible and ephemeral
tools can be made. However, determination of mobility strategy was based only on
arbitrary criteria for expediency and Shoocongdej does not examine relative changes in

2. Approaches to flaked stone artefact archaeology in Thailand
25
the extent of artefact production, use and retouching. In fact there are no absolute
criteria for the two extremes of Binford’s mobility spectrum and the most reliable
interpretation of residential or logistical mobility depends on comparisons in specific
contexts. It is unlikely that any mainland Southeast Asian assemblage would be
considered to be typical of a logistical strategy, given the definition that Shoocongdej
uses. For example, Shoocongdej’s (2000) definition of a logistical signature includes ‘a
strong bias in the proportional representation of different body parts’ and ‘a high level
of diversity of functionally specialized tool types’. Previous work has demonstrated
that these two qualities are absent from assemblages produced by human forgers in
mainland Southeast Asia – and many other places also – so it is inappropriate to test a
model that relies on the possibility of these qualities being present.
That said, Shoocongdej’s work represents a watershed in stone artefact analysis and
archaeology generally in Thailand for two reasons. Firstly, she used a research strategy
directed to answering timely questions explicitly about human behaviour, rather than
about artefact classification, and then systematically developed and tested relevant
hypotheses. This contrasts with the more inductive and descriptive character of earlier
work on stone artefacts. Secondly, she interpreted the data in an explicitly
anthropological framework that focused on explaining the human behaviours that
produced the archaeological material. This indicates a greater awareness of recent
developments in archaeological explanation than is evident in any previous work in
the region.
However, Shoocongdej’s stone artefact methods are similar to Reynolds’ and are
similarly uninformed by contemporary methodological work on artefact attributes,
especially analysis of artefact reduction as a measure of the level of assemblage
curation (e.g. Barton 1988, Dibble 1987, Dibble and Pelcin 1995, Kuhn 1990). Other
limitations of this work include a lack of detailed discussion of temporal and spatial
change in the lithic assemblage, except to note that the shift from flake-based to cobble-
based assemblages from the Pleistocene to the Holocene observed at Lang Rongrien
was not apparent at Lang Kamnan. The reluctance to discuss temporal change may be
due to some problems with the site’s chronology. Some radiocarbon dates come from
snail shells lacking cultural contexts and some of the dates are out of sequence
(Bulbeck 2003).

2. Approaches to flaked stone artefact archaeology in Thailand
26
Shoocongdej does not engage with specific problems of Hoabinhian technology raised
by White and Gorman (2004) and Reynolds (1989, 1992) about whether the majority of
flakes result from core resharpening or other behaviours and why stages of the
reduction sequence seem to be missing from some rockshelter assemblages.
Quantitative analysis of the metric data is limited and claims that the artefacts were
used to process fauna are not supported by evidences such as cut marks on the bone or
identification of residues and usewear on the artefacts.
Shoocongdej’s work at Tham Lod and Ban Rai, 1998-present
Following from her PhD work, Shoocongdej (2004) began a project in Mae Hong Son to
develop a cultural and environmental history and study the relationship between
humans and their environment from the Pleistocene to recent times. The project also
aims to create opportunities for training and professional development of Thai
archaeologists. Two rockshelters have been excavated with cultural sequences dating
to the late Pleistocene. Ban Rai was excavated to a depth of about two and a half metres
and has eight radiocarbon dates spanning 10,600-7,250 BP. The deepest of the three
areas excavated at Tham Lod has a depth of about five metres and has four
radiocarbon and two thermoluminescence dates spanning 32,400-12,100 BP
(Shoocongdej 2004). Data collection and analysis is ongoing for Ban Rai and Tham Lod
and so far over a dozen Thai-language technical reports have been prepared (eg.
Shoocongdej and Staff 2003a, 2003b) and one popular book has been recently published
(Shoocongdej 2005) as well as an edited volume of conference papers, both in Thai
(Shoocongdej 2006b). One preliminary report on Ban Rai was recently published in
English (Treerayapiwat 2005). Treerayapiwat (2005) follows Shoocongdej’s methods
but does not present any details of the stone artefacts from Ban Rai beyond numbers of
artefacts in each stratigraphic layer, only noting that ‘the entire spectrum of
production, repair, and use, with the inclusion of utilized cores and flakes, wasted
cores and flakes, hammers, and resharpening flakes’ were found.
Conclusion
Despite the variation in aims and methods, these case studies suggest a basic and
familiar (Reynolds 1990a) outline of culture-history from the stone artefacts. First, the
earliest record is a Pleistocene assemblage of flakes from Lang Rongrien, possibly used
by mobile hunter-gatherers in a highly seasonal environment. The Hoabinhian and
Chopper-Chopping Tool Complex do not seem to be important in Thailand during the

2. Approaches to flaked stone artefact archaeology in Thailand
27
Pleistocene. Second, in the late Pleistocene – early Holocene period the classical
Hoabinhian cobble artefacts appear, possibly in response to denser forest environments
and less seasonal climates, although recent work has shown that terminal Pleistocene
environments were more complex and diverse than previously thought (White et al.
2004). Many more sites are occupied for the first time, but the assemblages are still
dominated by flakes, mostly unretouched. The cobble artefacts may have been used by
mobile hunter-gatherers for woodworking, particularly for making other tools out of
hard wood and bamboo. There seems to be a lot of variation in assemblages from this
period. Finally, in the later Holocene the cobble artefacts become less important and
disappear from some sites to be replaced by polished-edge artefacts and ceramics.
These new forms are usually associated with horticultural populations rather than
hunter-gatherers (Higham 2002:29-30). The task now is to add detail to this basic
outline, refining the chronology, determining the specific characteristics of the
technological changes, their behavioural implications, and their relationship to local
and regional environmental changes.
The progress observed in work discussed here suggests a few themes deserving of
future attention. First, chronology has been a weak point in previous work. As might
be expected, the apparent absence of chronological change in the stone artefacts has not
stimulated interest in dating the archaeological deposits. In addition sites have been
difficult to date because of poor preservation of organic remains. When dates are
available they have not been integrated into a critical account of the chronology of site
formation. This thesis aims to redress this weakness through a systematic analysis of
chronology and site formation at the two sites under examination. Second, the use of
typological classification methods does not appear to have advanced knowledge
substantially. Chapter four expands on this problem, but it can be noted here that the
amorphous quality of Hoabinhian assemblages has frustrated previous attempts to
build explanations based on the division of assemblages into groups of visually
distinctive forms. This thesis departs substantially from previous typological methods
and instead offers a reduction-based approach to stone artefact analysis.
Finally, interest in the relationship between human foragers and their environment has
been an important motive for previous work. This focus has emerged from the
limitations of the amorphous, unretouched stone artefact assemblages typical of
mainland Southeast Asia to inform on other questions such as social and political

2. Approaches to flaked stone artefact archaeology in Thailand
28
organisation. Interest in human-environment relationships is one of the few common
themes running through the previous work, which is otherwise relatively
disconnected. This thesis builds on previous work by taking a systematic approach to
understanding human-environment relationships. Despite the pervasiveness of past
interest in environmental mechanisms, it is unfortunate that they appear to have been
employed as a default mechanism when no other can be demonstrated. An important
symptom of this is the absence of reliable links between the claim that the environment
was influential and the details of how the archaeological record supports this claim.
This is a notable weakness that is common in the previous work discussed here. This
thesis is motivated by the endurance of the environmental mechanism theme and the
need for reliable links between theory and data. As a first step in building these links,
the following chapter presents a new conceptual framework to investigate the
relationship between people and their environment using stone artefact assemblages
from mainland Southeast Asia

2. Approaches to flaked stone artefact archaeology in Thailand
29
Figure 2.1. Map showing sites discussed in the text. Major waterways are shown in dashed grey
lines.

2. Approaches to flaked stone artefact archaeology in Thailand
30
Figure 2.2. Typical sumatralith from Jeremie and Vacher (1992). Scale bars are centimetres.

2. Approaches to flaked stone artefact archaeology in Thailand
31
Figure 2.3. Movius’ chopping tools from Myanmar. From Movius (1949)

2. Approaches to flaked stone artefact archaeology in Thailand
32
Figure 2.4. Artefacts from Sai Yok. From van Heekeren and Knuth (1967). No scale in original.

2. Approaches to flaked stone artefact archaeology in Thailand
33
Figure 2.5. Stone artefacts from Spirit Cave. From Gorman (1971b)

2. Approaches to flaked stone artefact archaeology in Thailand
34
Figure 2.6. Pleistocene artefacts from Lang Rongrien. From Anderson (1990)

2. Approaches to flaked stone artefact archaeology in Thailand
35
Figure 2.7. Typical Hoabinhian cores. From Van Tan (1994)

2. Approaches to flaked stone artefact archaeology in Thailand
36
Figure 2.8. Artefacts from Banyan Valley Cave. From Reynolds (1992). No scale in original.

3. Human Behavioural Ecology, Foraging and Lithic technology
37
3. Human Behavioural Ecology, Foraging and Lithic
technology
Introduction
The previous chapter surveyed earlier archaeology work on flaked stone artefacts in
mainland Southeast Asia and identified a need for a conceptual framework that links
flaked stone artefacts to the relationship between human foragers and their
environment. The aim of this chapter is to explore conceptual frameworks suitable for
making this link. First, the problems and requirements of a good conceptual
framework are discussed. Second, the case is made for an evolutionary framework and
three styles are evaluated. Finally, human behavioural ecology is argued to be the most
suitable and three specific models are presented as a way of describing and
interpreting the data presented in the following chapters. Chapters four and five
continue this development of the link between theory and data.
Finding a Good Conceptual Framework: Conditions and Localities
As noted earlier, the aim of this thesis is to answer questions about people-artefact-
environment interactions and to understand how people, in solving activity-related
problems, create variability and change in the human-made world of things, namely,
technology (cf. Schiffer 2002). Deciding on a good conceptual framework from which to
derive the questions to ask is a difficult task, especially as the tools of inquiry are
constantly evolving amidst shifting and diverse theoretical landscapes. A starting point
is the recognition that the framework must have a commitment to formulate claims
about human behaviour in the past, make efficient use of available evidence, be open
to revision in response to new evidence, be exposed to a wide range of critical
challenges, have internal coherence and external consistency (e.g. compatibility with
well-established knowledge and reliance on plausible background assumptions) and
have explanatory power, generality and simplicity (Dupré 1993, VanPool and VanPool
1999, Wylie 2000). Wylie (2000) notes that simultaneously satisfying all of these
principles is very difficult and trade-offs need to be calculated according to local
requirements. In this thesis there are two ‘localities’ to draw guidelines for practice.
First is the previous work specific to the period and region, namely hunter-gatherer

3. Human Behavioural Ecology, Foraging and Lithic technology
38
archaeology in mainland Southeast Asia and second is the kind of evidence used and
body of methods employed; the technological analysis of stone artefacts.
The previous chapter reviewed some of the most important contributions to human
forager archaeology in mainland Southeast Asia. It concluded that although it is
neither a substantial consumer of, nor contributor to, contemporary archaeological
practice, some loose conventions have emerged. For example, Gorman, Anderson and
Shoocongdej organised their work around human-environment interactions and
approached questions from a North American context of empiricism and normative
theory. Social interpretations were predictably absent (cf. Killick 2004), since the range
and quality of the supporting material evidence is strongly limited by poor
preservation. It is possible to make social arguments from single categories of evidence
such as stone artefacts (e.g. Morris 2004) but this does not allow the ‘tacking’ between
scales and lines of evidence that is necessary for compelling explanations (Wylie 1989).
Interest in the relationship between human foragers and their environment was
identified as an enduring theme in previous mainland Southeast Asian archaeological
work. This particular historical context of research, resembling, as it does, a blank slate
with human ecological tendencies, allows for great freedom of choice in plotting
trajectories for future work. In addition, the relatively low density of research (for
example, in terms of publications per decade) on this period and region means that the
boundaries of inquiry are not well defined, resulting in few constraints in the selection
of conceptual frameworks.
The second ‘locality’, that of stone artefact technological analysis, is altogether
different, with a long history and wide variety of approaches that have been worked
out in detail. Odell’s (2001) survey of these approaches shows that although questions
about sociopolitics and ritual have been convincingly addressed by lithic analyses, the
bulk of work has been focused on technological organisation. Questions of
technological organisation typically refer to human mobility, subsistence, and
adaptations to risk and stress. These are questions of human behavioural ecology,
asking how human interactions with environments are mediated and demonstrated by
lithic technology. Bleed (1997) argues that this materialist focus derives from the
practicalities of technological decision-making. He writes that technological processes
are more accessible to the archaeologist than many other cultural processes because
they involve tasks that produce concrete material results that present themselves in a

3. Human Behavioural Ecology, Foraging and Lithic technology
39
limited number of ways (since artefacts have no memory or intention [but see Gosden
(2005) and Gell (1998) for different views]).
Following from this concreteness of technological decision-making is Bleed’s (1997)
second important point that technical actions have better potential to return immediate
and direct feedback about the success or failure of those actions. Other cultural
behaviours such as social or ideological activities produce less concrete results and the
success or failure of these activities is more difficult to detect in the archaeological
record. With most technological activities, failure has material consequences that
quickly informs the people involved and allows for archaeologically detectable
technological adjustments in response to the failure. In this way, technological change
is analogous to Darwinian selection, where technological variants compete for selection
as the most successful instrument or action under the pressures of specific tasks
(Basalla 1988, Fleck 1992, Ziman 2000b).
The analogy between technological change and Darwinian evolution has received
much attention from archaeologists (Bamforth 2002). The theory of evolution by means
of natural selection is the most powerful tool available for explaining diversity in the
biological world. Because humans are also biological entities, evolutionary processes
are considered by some to be essential to any complete explanation of human behavior
(Winterhalder and Smith 1992: 4). The typically low temporal resolution of
archaeological studies of human technology is better suited to the time scale of
biological processes rather than psychological or cognitive processes. That said, there
are more general arguments that Darwinian evolution might provide all of the
disciplines in the social sciences with similar explanatory power as it has to the
biological sciences (Dennett 1994, Hull et al. 2001, Mesoudi et al. 2006).
Three Darwinian approaches have been explored in the analysis of stone artefacts:
selectionist archaeology, dual inheritance theory and evolutionary ecology (Preucel
1999). Each of these approaches is based on a universal or generic Darwinist
perspective of cultural change, where culture is argued to exhibit variation,
competition, inheritance, and the accumulation of successive modifications over time
(Mesoudi et al. 2004). Despite this shared perspective, the three approaches differ in
their explanatory aims and in their definitions of key details such as where variation
comes from, what is under selection and how selection occurs. Although there is a
voluminous literature of programmatic statements from proponents of these

3. Human Behavioural Ecology, Foraging and Lithic technology
40
approaches (e.g. Boone and Smith 1998, Lyman and O'Brien 1998, O'Brien and Lyman
2002, Winterhalder and Smith 2000), it is more instructive to evaluate their
implementation in archaeological case studies to see how they actually work. The
operational details of the three styles have important implications for their suitability
as conceptual frameworks for mainland Southeast Asian lithic analysis because of the
specific character of the evidence.
Selectionist Archaeology and Lithic Analysis
Selectionist archaeology, also known as evolutionary archaeology, is represented here
by a case study of Palaeoindian projectile points from the southeastern United States.
O’Brien et al. (2001) aim to use cladistic methods to develop hypotheses about the
historical relationships between different kinds of points. They hold that items of
material culture, such as stone artefacts, are part of the human phenotype (or sum total
of the observable characteristics of an individual organism) (O'Brien and Lyman 2000).
This means that artefacts are subject to evolutionary processes just like organic parts of
the phenotype (such as eyes, hair, skin, etc.). While information about the organic parts
is transmitted via genes, information about the artefacts is transmitted via culture (for
example, social contexts of teaching and learning). Continuity of transmission results in
the inheritance of artefact forms, over time this leads to the tool traditions or lineages
that O’Brien et al. (2001) identify as the different kinds of points. The source of new
kinds of artefacts is errors in the transmission of information. They note that they are
unsure how to distinguish unintentional random variation from variation directed by
deliberate attempts by people to solve problems (Lyman and O'Brien 1998).
The objects of selection in this example are the functional traits of the stone points
(O'Brien and Lyman 2000: 375), although it is not clear from O’Brien et al. (2001) how
these functional traits were distinguished from non-functional traits. Elsewhere,
selectionists have claimed that functional traits are those under selection because they
directly affect the Darwinian fitness of the populations that are transmitting the trait
(Dunnell 1978). Distinguishing non-functional traits from functional traits is done by
analysing their frequencies over time. Functional traits tend to follow logistic
frequency curves, where the initial stage of frequency increase is approximately
exponential, then as competition arises from other traits, the increase slows, and may
finally decline (O'Brien and Holland 1990, O'Brien and Holland 1992 ). Non-functional
traits tend to follow Markovian distributions, where variation drifts without selective

3. Human Behavioural Ecology, Foraging and Lithic technology
41
pressures and the frequency of traits is largely determined by their previous states.
Markovian distributions can resemble the classical battleships curves produced by
artefact seriation (Neiman 1995, O'Brien and Holland 1990, O'Brien and Lyman 2000:
318-319).
The separation of functional and non-functional traits is not undertaken by O’Brien et
al. (2001: 1126) in their study of points. Instead they focus on artefact design and refer
to literature on point technology and mechanics that suggests the point traits that are
likely to have been directly related to functional efficiency. The cladistic method orders
the different kinds of points according to the number of differences in traits so a
relative chronology of trait changes is created. Points that are more similar are
proposed to be closer chronologically than points with few traits in common. Ancestor-
descendant relationships are proposed for the different kinds of points, based on
sequences of trait changes. The outcome is that the different kinds of points are
ordered in time, based on the assumption that variation in the points comes from
errors and recombinations during the social transmission of manufacturing
instructions (O'Brien et al. 2001). This method was developed and is widely used by
paleobiologists to reconstruct relationships between extinct species. It has also been
employed with some success by cultural anthropologists and linguists to reconstruct
family trees of culture and language groups (Mace et al. 2005). To date there have been
few applications of cladistics to material culture (Tehrani and Collard 2002, Tëmkin
2004) and there is skepticism that traditional phylogenetic analyses have only limited
application to cultural materials except in situations where traditional transmission is
strong but intercultural exchange is relatively weak, as is the case in the few published
studies. In their phylogenetic analysis of musical instruments, Tëmkin and Eldridge
(2007) conclude that the intricacy of cultural historical patterns means that cultural
systems are more complex than biological systems and additional methodological and
theoretical development is required.
The selectionist case study is intuitively appealing because of its adherence to
Darwinian evolutionary concepts, such as its explicit concern with the relationship
between fitness maximization and engineering design and performance characteristics
of material culture. However, there are two problems that make this case study an
incomplete conceptual framework for future work. First, the link between changes in
functional traits of the stone points and changes in the fitness of the makers is not

3. Human Behavioural Ecology, Foraging and Lithic technology
42
made; it rests on unstated and undemonstrated assumptions about how technological
change affects human reproductive fitness (Preucel 1999, Wylie 1995). The case study
has an inferential void that substantially weakens its internal coherence.
Second, the selectionist approach is problematic because it does not make any claims
about human behaviour in the past. This is not an accidental omission but a deliberate
epistemological gambit by selectionists. As part of their claim to be uniquely scientific,
they state that inference from archaeological to behavioural contexts is fatally insecure
because past behaviours are inaccessible to archaeologists. For selectionists, epistemic
security can only be ensured for identifying variability in the archaeological record and
monitoring it over time; they are interested in the material of the archaeological record,
not in the behaviours that contributed towards its formation (1978, 1980, Dunnell 1989:
45). A related selectionist case study describing the increasing diversity of Great Basin
projectile points at Gatecliff Shelter, Nevada is similarly agnostic about behaviour.
Lyman and O’Brien (2000) outline a history of points at the site, but do not attempt to
explain why these changes occurred. They reject behavioural reconstruction on the
grounds that ‘there is no deterministic relation between the behavioral terms of
reconstruction and the debris of the archaeological record’ (Dunnell 1992: 16). Wylie
(1995: 208) notes that this is paradoxical because in order to provide compelling
explanations for the adaptive advantages of specific variations in artefact design,
selectionists must depend on behavioural reconstruction to establish exactly how a
specific variation favoured human reproduction under specific conditions. In other
words, they need to link people to stone points rather than simply undertaking a
palaeobiology of material culture.
Dual Inheritance Theory and Lithic Analysis
A more coherent application of evolutionary principles to archaeological explanation
can be found in case studies that employ Boyd and Richerson’s Dual Inheritance
Theory (DIT). This theory asserts that there are Darwinian evolutionary forces acting
on the cultural transmission of information that are unique and independent of genetic
evolution. While selectionists see change in material culture as the result of only
selection and drift during cultural transmission, DIT holds that there are specific biases
arising from human psychology that can affect cultural transmission at the population
level. These include directed or content-based bias (when the content of one variant is
easier to learn, remember and transmit than another variant), frequency-based bais

3. Human Behavioural Ecology, Foraging and Lithic technology
43
(when the commonness or rarity of a variant is the criteria determining its
transmission), model-based bias (when a variant is transmitted because of its
association with a suite of other attributes associated with individuals exhibiting the
variant) and guided variation (when individuals copy existing behaviours and modify
them by trial and error) (Boyd and Richerson 1985). The operation of these biases has
been demonstrated by ethnoarchaeological and experimental studies.
Bettinger and Eerkens (1997, 1999) use metric analyses of late Holocene stone artefact
assemblages from the Great Basin of western North America to explore the
consequences of different cultural evolutionary processes. In their 1997 study they
analyse a large sample of projectile points (n = 5285) to test predictions about the effects
of different biases of cultural transmission on metric variability. They expect that
guided variation and content-based bias will be important during times of low
population densities and techno-organizational complexity because competing variants
are easily compared by field testing and individual experience. When the population
grows and/or technology becomes more complex they expect frequency-based and
model-based biases to be more important because individual field testing of variants is
inefficient compared to relying on social transmission of pre-tested variants.
These expectations allow them to hypothesize that complex point shapes will have less
metric variation than simple forms, that arrowheads will be less variable than dart
points and that long-lived forms will be more variable than briefly appearing forms.
These expectations receive only equivocal support from the data. As predicted,
complex point forms show less metrical variation than simple forms, and arrowheads
show less variation than dart points. However, 81% of metric variation is strongly
correlated with artefact size (r = 0.899), meaning that differences in types of cultural
transmission have only a small effect. Inspired by Bettinger and Eerkens, Shott (1997)
undertook a similar test of these social transmission models using metric attributes of
stone points from late Holocene contexts of the North American Midwest and found
that differences in cultural transmission have an even smaller effect on lithic variation
than observed by Bettinger and Eerkens.
Shott’s findings are not surprising, given Boyd and Richerson’s (1992: 90) observation
that analyses of archaeological records tends to show that ‘forces like direct bias and
guided variation are relatively weak, and that the uncritical transmission of cultural
traditions is a strong effect’. More encouraging results come from Bettinger and

3. Human Behavioural Ecology, Foraging and Lithic technology
44
Eerkens’ (1999) study of changes in metric variables of stone points during the
introduction of bow and arrow technology to eastern California and central Nevada at
around AD 300–600. Using an approach similar to their earlier study, they equate
guided transmission with high metric variation and low correlation between different
metric attributes (such as mass and basal width). Lithic assemblages with metric
variables that are less variable and more highly correlated are equated with model-
based bias. Their analysis shows that assemblages from eastern California have poor
correlations of basal width and mass, suggesting that bow-and-arrow technology was
probably introduced and spread by guided variation. Conversely, in central Nevada,
the new technology was probably introduced and maintained by indirect bias because
the metric attributes are strongly correlated. Bettinger and Eerkens interpret this data
to mean that eastern Californian groups acquired the bow and arrow from distant and
unfamiliar neighbours, and with limited contact they had to develop and customise the
bow and arrow technology largely by trial and error. The opposite seems to be true for
central Nevada where the appearance of bow and arrows was probably a result of
faithful copying, suggesting closer social contacts with the donor group. They further
conclude that these differences in social transmission indicate substantial differences in
social organisation and hunting behaviours in the two regions. The success of this case
study is partly due to the absence of a direct relationship between the attributes that
vary and mechanical constraints and processes related to point manufacture and use.
As O’Brien and Lyman observe (2002) there is no reason why basal width and mass
should be correlated or mechanically constrained, so it is likely that some other force is
responsible for patterns in their variation.
These archaeological applications of DIT show some similarities with the selectionist
case study in their shared focus on artefact design traits and the recognition that
selective pressures act on information about artefact design and manufacture.
Significant differences in DIT include the primary selective role attributed to
transmission biases and the decoupling of selective processes and the biological fitness
of the artefact makers. Richerson and Boyd (2000) argue that cultural transmission
biases evolved during the Pleistocene when they conferred adaptive advantages in
rapidly fluctuating environments. Their models show that social learning is a useful
adaptation in situations where climatic variation is not fast enough for individual
discovery of adaptive behaviours by trial and error to be effective but not slow enough
for adaptive behaviours to be genetically encoded. Under these conditions natural

3. Human Behavioural Ecology, Foraging and Lithic technology
45
selection shaped our psychology so that it uses short-cuts - transmission biases – to
improve the efficiency of social learning by reducing costs and errors (Richerson and
Boyd 1992). The result is that transmission bias ‘is a culling process analogous to
natural selection’ acting on socially transmitted information (Richerson and Boyd 1992:
67). Selection resulting from transmission bias may not always optimise genetic fitness,
since genetic reproduction is not required for cultural reproduction (for example,
information can be transmitted to non-kin) (Richerson and Boyd 1992: 75-85). This
biologically non-adaptive potential establishes culture and biology as two separate, but
interacting evolutionary systems, in a similar way that Brighton et al. (2005) have
argued that language is a third separate interacting evolutionary system.
The most important advantage of DIT over selectionist archaeology is that it is a
conceptual framework that links people to the stone points. The case studies discussed
here show that Dual Inheritance Theory provides description and explanation that
include details of artefact design, reconstruction of cultural behaviours (such as
contexts of learning) and incorporate historically specific conditions known from other
sources. These qualities make DIT an excellent candidate for a conceptual framework
because it explains human behaviour in the past, has internal coherence and external
consistency.
Evidential Constraints in Mainland Southeast Asian Assemblages
The main failing of DIT, in context of current knowledge about mainland Southeast
Asian lithic assemblages, is that it does not make efficient use of available evidence.
The DIT case studies are not good analogues for the evidence available from mainland
Southeast Asia. The Great Basin assemblages are based on large numbers of visually
distinctive forms of stone artefacts in collections that have accumulated after decades
of intensive fieldwork. Claims (for example, by Colani) for visually distinctive flaked
stone artefacts analogous to points being present in mainland Southeast Asian
assemblages have been unconvincing for two reasons. First, the existence of discrete
artefacts forms has been questioned by Matthews’ work showing the metrical
continuity between different forms. Second, subsequent work in mainland Southeast
Asia has failed to usefully employ any kind of classification based on visually
distinctive flaked artefacts to describe geographical distributions or chronological
phases.

3. Human Behavioural Ecology, Foraging and Lithic technology
46
Even if mainland Southeast Asian assemblages did have comparable visually
distinctive artefact forms, the use of DIT assumes that similarities between assemblages
can be interpreted as being phylogenetically homologous (i.e. due to common
technological ancestry via cultural transmission) as opposed to being homoplasic (i.e.
due to convergent technological evolution via adaptation). In favour of the idea of
convergent technological evolution, there is an extensive body of literature
demonstrating that morphological variation in retouched stone artefacts is most
strongly related to the amount of reduction that the artefact has undergone (Bamforth
1986, Hiscock 2006, Hiscock and Attenbrow 2005, Kuhn 1994, 1995, Torrence 1983,
1989). This view holds that the shape and size of artefacts in many assemblages is
substantially controlled by processes of edge and tool maintenance rather than a desire
by the knapper to produce discrete shapes. The degree of maintenance is explained in
terms of the performance of the artefact within the economic context that the ancient
foragers operated in, rather than the biases of information transmission.
Another way to explain this problem is by comparing the degree of intentionality that
can be deduced from artefact form. Intentionality is used in typological frameworks to
explain why assemblages appear to contain artefacts with similar shapes and sizes.
Hiscock (2007) has identified four traits that are often used by typological analysts to
infer intentionality: repeated shapes, regular (usually symmetrical) form,
morphological features in excess of performance requirements and extensive
modification by retouching. When these traits appear very prominent in stone artefacts
some analysts, such as Bettinger and Eerkens, argue that the form of the artefact is
dependent on socially learned information is high. Conversely, if the form of the
artefact is more strongly controlled by other factors, such as mechanical constraints of
the raw material, then explanations based on biases in the transmission of social
information receive less support. Hiscock’s four traits are all present for assemblages of
Great Basin points. For example, the numerous flake scars on Great Basin points reflect
a high degree of effort invested in shaping the points, suggesting that a predefined
form has influenced the shaping of the raw material. Similarly, the low coefficients of
variation of metric variables on different forms gives the appearance of knappers
working with a mental template of the final products (Eerkens and Bettinger 2001).
These details, combined with ethnographic accounts, have been used to support
typological claims that a high degree of intentionality is present in point forms, making
them an ideal artefact for investigating cultural transmission.

3. Human Behavioural Ecology, Foraging and Lithic technology
47
On the other hand, mainland Southeast Asian assemblages have no analogous artefact
forms with similar corroborating evidence of effort to impose form or work from a
mental template. Invoking an explanation for artefact form based on social
transmission of information – in mainland Southeast Asia or the Great Basin – risks
committing the ‘finished artefact fallacy’ described by Davidson and Noble (1993).
They claim that it is ‘a fallacy to assume that the form in which a stone artefact is found
is a product of an intention to produce that form’. In this context the most relevant
element of the fallacy is that knapping involves the application of simple mechanical
principles and constraints and the results of these should not confused with prior
intentions of the knapper (Davidson 2002). Given the failure of typological systems and
the absence of convincing evidence of intentionally shaped pieces in mainland
Southeast Asian assemblages, artefact form is likely to be more dependent on raw
material properties such as flaking mechanics and abundance or scarcity. The role of
biases in information transmission on artefact form is likely to be very difficult to
convincingly demonstrate. When there is no risk of mistakenly committing the finished
artefact fallacy, such as when dealing with constructed (as opposed to reduced)
artefacts such as ceramic vessels, textiles and baskets, DIT analyses are highly
productive (Bentley and Shennan 2003, Collard and Shennan 2000, Collard and Tehrani
2005, Jordan and Shennan 2003, Shennan and Wilkinson 2001).
Clarkson’s (2004) attempt to track changes in transmission bias in an assemblage of
retouched flakes is an instructive example of the difficulties of identifying cultural
evolutionary processes in assemblages where intentionality in shaping artefacts is less
evident, compared to the Great Basin points. He observes that after 3,000 BP there are
apparently co-ordinated increases in the central tendencies and decreases in variation
of metric and retouch variables of artefacts from four excavated rockshelters in the
Wardaman Country on the edge of the semi-arid zone in northern Australia. This
change is interpreted as stochastic variation followed by directional selection or direct
bias transmission (Clarkson 2004: 258). It is important to note that Clarkson includes
both a selectionist interpretation and a DIT interpretation of the lithic data. Clarkson
recognizes the selectionist interpretation of a mode shift and reduction in variation in
artefact assemblages as ‘directional selection’, one of the three classical patterns of
natural selection in biological populations (the others being stabilising selection
[variation reduction, no mode change] and disruptive selection [mode split into two]).
Similarly Clarkson acknowledges that the same data would be explained by DIT as a

3. Human Behavioural Ecology, Foraging and Lithic technology
48
result of direct bias transmission, which occurs when individuals adopt a variant based
on direct knowledge and evaluation of the variant itself. Clarkson (2004: 282) explains
his reluctance to choose between the two interpretations as a result of the limitations of
theoretical modeling rather than to any problem with the data. This reflects the
problem of equifinality — in this case where more than one kind of evolutionary
explanation is suitable for the available lithic data. However the data may have some
relevance since the variables he considers (indicators of shape, size and retouch type)
are arguably more relevant to the performance of the artefacts and thus their maker’s
fitness rather than sensitive indicators of non-adaptive transmission biases. Indeed,
Clarkson’s (2004: 258) main argument is that the results are ‘what would be expected if
natural selection were operating to optimize technologies and design features in
periods of increased risk and resource depression.’
The difference between Clarkson’s two candidate interpretations is subtle and
highlights the operational difficulties with these two approaches. The difference relates
to the perception of changes in mode and variation resulting from fitness-optimizing
natural selection (the selectionist view) or rational decision making in relation to
proximate goals (the DIT view). This is an unsolved empirical problem, although the
bulk of work to date has focused on transmission studies and concludes that pattern-
generating transmission biases can emerge in contexts where biological fitness
optimization is probably not a significant variable (Mesoudi 2005). Similarly, when
dealing with cultural materials that have very limited variation that is independent of
performance characteristics, it is difficult to make the case that non-adaptive
transmission biases can be reliably measured. Despite these problems, there is some
consensus that the two approaches are broadly complementary and that the most
important difference is simply one of temporal scale. O’Brien and Lyman (2002) and
Mesoudi et al. (2006) have suggested the selectionist approach is macroevolutionary,
with its focus on reconstructing lineages and evolutionary relationships of artifacts and
stated interest in the relationship between artefact engineering and biological fitness
(and disinterest in explaining behaviour). Conversely, they suggest that explanations
based on social transmission of information are targeting microevolutionary processes
where unique evolutionary dynamics are generated by transmission modes (e.g.
horizontal, oblique) and biases (e.g. directed, frequency-based) with no obvious
biological parallels. In a similar way, Flannery (1999) has noted that the relationship
between the two influential explanatory concepts of process and agency can be

3. Human Behavioural Ecology, Foraging and Lithic technology
49
described in terms of long term evolutionary processes resulting from palimpsests of
behaviours by multiple agents.
Choosing between the two evolutionary approaches depends on what temporal scale is
the priority, and indeed, what scale is analyzable given the evidence and methods
available. In addition to its epistemological problems noted above, selectionism fails to
qualify as a good conceptual framework for this project because it does not include a
commitment to explaining human behaviour in the past. Approaches derived from DIT
are more suitable because their findings can be related to behaviour, but have very
strict data requirements – namely complex artefacts with variation in attributes that are
not exclusively linked to mechanical performance properties or constraints. The
microevolutionary scale qualifies as a likely explanatory framework, but unfortunately
the data requirements cannot be satisfied by mainland Southeast Asian assemblages
because they have very small proportions of pieces that can confidently be described as
intentionally shaped. It has been shown that evolutionary theory can be productively
employed on stone artefact assemblages with certain specific qualities, but the question
now is how can evolutionary theory do something interesting with assemblages of
unretouched flakes and cores?
Human Behavioural Ecology and Lithic Analysis
A parsimonious approach to interpreting assemblages dominated by non-tool
components, often called debitage or waste, is to consider them as representative of
behavioural patterns and adaptive strategies, rather than conglomerates of selected
and transmitted information. In fact, assemblages of this kind of fundamental
technology are ideal for examining adaptation. Since there are no retouched pieces,
there is no modification of artefacts that could be considered unrelated to their
performance of life-sustaining functions and very little avenue for non-adaptive
variability to interact with transmission biases. The transmission biases could have an
effect on functional attributes, but as Clarkson observed, it is difficult to distinguish
this from variation resulting from biological fitness-enhancing selection. It could be
argued then that every attribute in a debitage assemblage is performance related and
thus directly related to fitness and adaptation. But since there is currently no
satisfactory method for connecting changes in functional features directly to biological
fitness, another model must be invoked to relate the assemblage attributes to
evolutionary processes. What is required is an evolutionary model that shifts the

3. Human Behavioural Ecology, Foraging and Lithic technology
50
evidential demands and theoretical limitations away from selection and towards
adaptation. Fortunately there is a third style of evolutionary archaeology that is well-
suited to assemblages that have none of Hiscock’s (2007) traits suggestive of purposive
design.
Human behavioural ecology (HBE) studies human behaviour as adaptations to local
environments. It is a field of study applying theory from evolutionary ecology, which
examines how the evolutionary history of organisms influences their responses to
selective pressures in the environment, to anthropological questions. This theory
developed from ethological studies that asked why certain patterns of animal behavior
emerged and persist and sought answers from the ecological contexts of these
behaviours (Shennan 2002a). Behavioral ecology has inspired many who study
adaptation in ecological context because of its employment of simple models as
heuristic tools for understanding relationships between environmental variables and
behaviour (Gremillion 2002).
Most often, the methods of behavioural ecology that are applied to anthropological
problems are optimal foraging models (OFM), one of the most widely employed suite
of behavioural methods in ecology (Sih and Christensen 2001). These models are
instruments of prediction or investigation, where a complex system or process
involving biologically significant resources is scaled-down to isolate key variables
(Winterhalder 2002). The usefulness of models is assessed by testing situation-specific
predictions generated from the models and iteratively refining the model until a good
fit is obtained between predicted and observed (or archaeologically inferred)
behaviour. Mismatches between observed and expected results are used to redirect the
model (cf. Bliege Bird et al. 2001). Bird and O’Connell (2006) observe that for many
models the predictions pertain to fitness-related goals of behavior, decision variables
associated with achieving those goals, trade-offs connected with the decision variables,
currencies to evaluate those trade-offs, and constraints that define or limit the actor’s
situational response. All of these are based on the assumption that foraging behaviour
is fitness-enhancing when food requirements are met as quickly as possible, freeing
time for other fitness-related activities. To avoid the selectionists’ problem of not
knowing how to relate material culture to fitness-enhancing behaviours, human
behavioural ecologists often use energetic or economic efficiency as a rough proxy for
biological fitness (Bettinger et al. 1997, Kuhn 2004a: 562).

3. Human Behavioural Ecology, Foraging and Lithic technology
51
Mackay’s (2005) study of lithic debitage assemblages in archaeological sites in Cape
York, northeastern Australia is a good example of a study of debitage assemblages
using concepts derived from human behavioural ecology models. Although Mackay
does not explicitly organize his investigation to test predictions derived from a model,
he asks how people solved the problem of maintaining a constant supply of stone
artefacts under varying degrees of mobility and with discontinuous distributions of
raw materials. This question could be recast from a behavioural ecological perspective
as asking how people made decisions to optimize their use of technology, given
constraints of mobility necessary to obtain subsistence resources and unevenness in the
patches of raw materials. This question, in various guises, has long been common in
studies of hunter-gatherer technological organisation (e.g. Binford 1979, Torrence
1989). What makes Mackay’s study relevant here is that he answers the question using
debitage assemblages, unlike other work that uses assemblages of formal tools
analysed using typological methods. Mackay’s methods measure economic efficiency
by comparing the relative amounts of effort invested in assemblages to extend the use-
lives of artefacts. Other studies have similarly examined debitage assemblages (Cowan
1999) but Mackay’s is notable because of the wide range of variables that he measures
and the complete absence of formal tools from his assemblages (unlike Cowan who has
bifaces in his assemblages).
Mackay’s work is a useful prototype for an evolutionary study of mainland Southeast
Asian lithic assemblages because he successfully explains how environmental contexts
provide constraints and opportunities relating to the organisation (or decision rules) of
a relatively informal lithic technology. His questions and methods are relevant to
mainland Southeast Asia but further work is necessary to explain why optimization
models are useful to an evolutionary explanation of lithic assemblage variation. The
role of evolutionary processes in HBE is quite different from selectionist and DIT
approaches that explicitly refer to selection and transmission as controls on artefact
variation. In classical optimal foraging models the role of selection is to produce a
phenotype with the cognitive flexibility to weigh the costs and benefits of particular
strategies. Behavioural strategies are general decision categories (for example, what
prey? which location?) that are distinct from behavioural tactics that specify the
particular techniques of foraging. The strategies themselves, or the information that
generates them, are not considered to be under strong selection. Instead, the most
important selection remains at the lowest levels as defined for biological evolution; a

3. Human Behavioural Ecology, Foraging and Lithic technology
52
process that acts on genotype variation (Cronk 1991: 28). Natural selection maximizes
gene survival, and individuals, as temporary vehicles for genes, should behave in ways
that maximize reproductive fitness. So natural selection supplies the capacity to
generate a range of behavioural strategies, but the particular strategy employed
depends on the specific environment. Variation in behavioural strategies results from
environmental variation because natural selection has produced a phenotype with
sufficient flexibility to track environmental variation optimally (Boone and Smith 1998:
S145).
This link between genes and behaviour is known as the ‘phenotypic gambit’ and has
the advantage of allowing the details of the inheritance process to be ignored and
instead focus on behaviour with the working assumption that it represents an
adaptation produced by decision rules, which are under selection (Shennan 2002a).
This is one of the key differences between behavioural ecology and other evolutionary
approaches to archaeology; behavioural changes result from phenotypic flexibility
rather than selective processes. In archaeology, the phenotypic gambit departs slightly
from the classical optimal foraging models because in addition to genes, culture is
another system of inheritance that affects behavioural strategies (Jeffares 2005). This
means that there could be a role for DIT in HBE as ‘rules of thumb’ to improve the
efficiency of information processing (Jochim 1983) or as a source of alternative
hypotheses when adaptive predictions are not satisfied, because cultural transmission
biases can result in non-adaptive behaviours (Shennan 2002b). In the context of
debitage assemblages, this detail of multiple inheritance systems is of little importance
because, as suggested above, the effect of DIT will be very difficult to detect. A related
implication is that OFT models are based on individual selection and archaeological
assemblages are predicted to reflect the average foraging behaviour for optimisng
individual fitness. This does not imply that other levels of selection are impossible, just
difficult to deal with analytically. For example, group selection would be more
important in the analysis of an assemblage with a strong signal of cultural transmission
bias (for example if the assemblage was decorated pottery). In any case, the priority of
HBE is to focus on behavioural adaptation without having to tackle the hard problem
of demonstrating and explaining heritability in material culture.

3. Human Behavioural Ecology, Foraging and Lithic technology
53
Criticisms and Limitations of Optimal Foraging Models
Although optimality models allow the heritability problem to be side-stepped -- a
major advantage when dealing with debitage assemblages -- there are two special
issues that it raises when applied to human behaviour. Sterelny (2004) has suggested
that the good fit between animal behaviour and OFM is because animals have simple
heuristics with low decision loads that lead to near-optimal behaviour. Humans are
different, according to Sterelny (2004), because the trade-offs relating to our survival
are far more complex and have much higher decision loads. DIT provides some of the
heuristics to reduce this load, but Sterelny’s point is that trade-offs related to
information processing need to be incorporated into OFM. This is not a fatal issue,
since modeling is deliberately simplifying and the history of success in anthropological
applications of OFM suggest that simplifying or glossing over information processing
is not a critical compromise (Bird and O'Connell 2006). A second issue raised by
Sterelny (2004: 253) is that the incompleteness of the archaeological record and
ambiguities involved in reconstructing behavioural strategies mean that models can
only be tested for qualitative consistency of the predictions of the model and patterns
of inferred behaviour. This is a more significant limitation because an important
outcome of modeling is predictive failure, revealing unexpected constraints, currencies
and decision rules (Smith 1991). Qualitative models offer less resolution about where
predictive failures occur, for example they cannot provide specific threshold values for
variables where predictions fail.
Sterelny’s first criticism may have some relevance for more developed applications of
OFM to ethnographic and zooarchaeological studies (e.g. Bird and Bliege Bird 1997,
Broughton 1994, Hawkes et al. 1982, O'Connell and Hawkes 1981), but is premature for
lithic archaeology where formal models are in their infancy. Only a small number of
formal mathematical models of behaviours relating to stone artefacts have been
developed (Brantingham and Kuhn 2001, Elston and Brantingham 2002, Kuhn 1994,
Metcalfe and Barlow 1992) and only one of these has been tested with archaeological
data (Surovell 2003). It is hardly surprising that Surovell’s work is on Folsom and
Goshen assemblages in Wyoming and Colorado, chronologically and geographically
adjacent to where O’Brien et al. (2001) and Bettinger and Eerkens (1999) obtained data
for their evolutionary studies. When dealing with the archaeology of less intensively
examined areas where fewer assumptions can be reliably justified, Torrence (1983: 14)
has suggested that application of formal models to technology are ‘not necessary or

3. Human Behavioural Ecology, Foraging and Lithic technology
54
appropriate although the formation of more specific models should be the ultimate
goal’. Similarly, Metcalfe and Barlow (1992: 352) conclude that formal modeling of
lithic technological organisation ‘require[s] estimating the various parameters of the
model with a level of precision unlikely ever to be available from the archaeological
record.
Jochim (1989) has highlighted an important reason why formal modeling seems to
work so well for zooarchaeology and ethnographic studies of subsistence but has been
less useful for lithic studies. He attributes the difference to the fundamental difficulty
of quantifying stone artefacts as a fitness-related resource. The energetic and
nutritional requirements of humans are relatively easily predicted from experimental
data and measured either directly during subsistence activities or by reliable
archaeological proxies such as prey body-size (e.g. Grayson and Delpech 1998,
Gremillion 2002). On the other hand, there is no ‘recommended daily intake’ for stone
artefacts (Shea 1991), especially in environmental contexts such as the tropics where
organic materials fail to preserve and organic tool use is likely but not identifiable
archaeologically. In addition to the absence of reliable predictors of lithic requirements,
there are also no general methods for measuring intake or consumption of stone
artefacts. For example, Kuhn (1994) has calculated that the optimum length of
transported artefacts is 1.5 to 3 times the minimum usable size. However, determining
the absolute value of these optimum lengths in lithic assemblages with very few or no
tools (the smallest of which might be assumed to be at their minimum usable size) is
complicated by a variety of other affecting variables such as raw material nodule size,
raw material scarcity, manufacturing costs, mobility costs, frequency of use and
frequency of discard (Jochim 1989: 108).
Like Sterelny, Bird and O’Connell (2006) similarly conclude that the main limitation
affecting behavioural ecological approaches to technology is difficulties in quantifying
key variables relating to costs and benefits of different technological strategies. One
way to work around this limitation is to shift from using ratio or interval data that
animal ecologists use as inputs to using ordinal data (Elston and Brantingham 2002:
112, Simms 1987). As Sterelny noted, ranking of inputs is better suited to the quality of
most archaeological data, but the downside is a sacrifice in the precision of modeling
and reduction in the potential for insightful predictive failure. Instead of predicting
day-to-day behaviour, model with ordinal inputs investigate the general rules and

3. Human Behavioural Ecology, Foraging and Lithic technology
55
constraints that characterise foraging behaviours over multiple generations (Simms
1983). Although precision is reduced, there are two advantages to less specific models.
First is that a ranking method bypasses the dilemma of measuring optimizing versus
satisficing, a concept that describes individuals behaving as if to satisfy a minimum
requirement or having to choose behaviours when information processing or time
constraints limit the ability to make an optimal decision (Ward 1992). Models based on
ranking show which strategies will ‘do better’ than others in specific contexts. This
position is more compatible with ethnographic hunter-gatherer societies where trade-
offs that are not fossilized in debitage assemblages (such as those explained by costly
signaling theory) can result in behavioural strategies that are inconsistent with
predictions derived from models (Hawkes et al. 1995). Under these conditions it is
more reasonable to look for instances when one strategy is doing better than another,
rather than expect optimal strategies to be reflected in the palimpsest of shifting goals,
currencies and constraints that is compressed into the archaeological record. All things
being equal, a strategy of ‘doing better’ or meliorising (Dawkins 1982) will tend to
approach the optimal strategy (Mithen 1988).
Second, a relaxing of precision means that the models are less bound by their more
problematic assumptions. For example, the prey choice models assume that foragers
search at random through the patches of their habitat, an assumption that is
improbable for foragers of any species (Durham 1981: 220). Ignoring this assumption
means that the distribution of prey encounters need not follow a Poisson distribution,
which would be unlikely if foragers are manipulating their environment to make prey
encounters more uniform or highly aggregated (Zeleznik and Ian 1991). Similarly,
some optimal dispersal and group size models make the unlikely assumptions that
foragers do not share information with each other and have no memory of foraging
locations between trips (Durham 1981). Discarding these assumptions makes little
difference to qualitative tests of these models, attesting to their robustness as
behavioural heuristics (Heffley 1981).
Three Optimal Foraging Models for Lithic Debitage Assemblages
Despite these limitations and compromises, qualitative model testing has proven to be
a fruitful archaeological research strategy that generates explanations that have a good
fit with data (e.g. Clarkson 2006, Yesner 1981). The complexity of prehistoric decision-
making is broken down by OFM into four discrete dimensions: prey choice (or diet

3. Human Behavioural Ecology, Foraging and Lithic technology
56
breadth, what resource to seek); patch choice (where to seek the resource); time
allocation (how long to spend seeking for each alternative); and social foraging (with
whom to forage or share resources and information) (Smith 1983). Debitage assemblages
are not suitable for answering questions about prey choice because this relates
specifically to what is included in a forager’s diet and usually requires information
about the energetic return rates of resources which are often equated to the biological
species exploited (Grayson and Delpech 1998, Kaplan and Hill 1992, Stephens and
Krebs 1986, Winterhalder and Goland 1997). Sources of lithic raw materials could be
conceived of as ‘prey’ but they are better modeled as patches rather than prey because
their location is usually static over the long term. However, debitage assemblages are
well suited to questions about patch choice, time allocation and social organization.
These three dimensions are modeled for hunter-gatherers below.
Patch Choice Models
Patch choice models attempts to explain how foragers select the patches or
environments they exploit and how much time they should spend in each patch. Patch
models predict that potential foraging locales will be exploited in order of the return
rates expected from searching for and handling resources within each, adjusted for the
costs of traveling (MacArthur and Pianka 1966). The marginal value theorem is a
formal expression examining how long a forager should remain in a patch, taking into
account declining return rates over the time that foragers exploit a patch (Charnov
1976). Two of the several predictions following from this model are particularly
interesting. First, the optimal forager should leave any patch when it is depleted to the
point where foraging elsewhere will yield higher returns, taking travel costs into
account. Second, since time allocation to any patch is a function of average yields for all
utilized patches, as the overall productivity of a set of patches rises less time should be
spent in any one patch and conversely (declining productivity increases optimal patch-
stay times) (Smith 1983). In archaeological terms, these predictions simply suggest that
areas or periods of higher patch yields will have evidence of more intensive human
occupation as people exploit a reliable and abundant resource.
Central Place Models
The central place model will predict how people’s foraging behaviours given certain
travel costs, transport costs and resource returns (Orians and Pearson 1979). A general
central place model predicts that as travel and transport costs increase then so should

3. Human Behavioural Ecology, Foraging and Lithic technology
57
the resource return. A more specific formulation, the field processing model, predicts
that as travel and transports costs increase then so should the amount of pre-
processing of resources to optimize the delivery of useful material at the central place
(Barlow and Metcalfe 1996, Bettinger et al. 1997, Bird and Bliege Bird 1997, Metcalfe
and Barlow 1992). This model focuses on in-field processing or pre-processing of
artefacts before they arrive at their final destination. For example assemblages with
pieces that show signs of extensive cortex removal and less than expected pieces with
cortex might reflect the in-field detachment of unwanted material to reduce weight and
increase the artefact’s utility prior to transport (Clarkson 2006).
Models of Optimal Dispersion and Group Size
Models of optimal dispersion predict optimum forager settlement patterns under
different environmental conditions, assuming they are minimizing round-trip travel
costs from resource to settlement location. These models predict that as resources
become more mobile and clumped, foragers will increasingly aggregate into larger
groups and when resources are more stable and evenly distributed, foragers will
increasingly disperse into smaller groups (Horn 1968). In anthropological terms, the
model predicts that foragers will increasingly adopt a residential settlement pattern in
stable/evenly dispersed environments because small frequently-relocating settlements
will always be near resources. On the other hand, a logistical settlement pattern is a
better strategy in mobile/clumped environments, with larger settlements from which
small groups of people venture out to collect resources at distant or constantly shifting
patches (Binford 1980, Harpending and Davis 1977, Heffley 1981). In archaeological
terms, a residential settlement will show signs of a relatively low investment in
economising technology because the group can easily relocate to new stone sources,
while a logistical settlement will show signs of higher investment in efficiency because
the group cannot easily relocate and the availability of stone sources is less predictable.
Conclusion
This aim of this chapter has been to determine the most suitable conceptual framework
for investigating links between lithic assemblages from mainland Southeast Asia and
the relationship between human foragers and their environment. The case was made
for pursuing an evolutionary framework. Three distinct evolutionary approaches to
lithic archaeology were considered and HBE was found to be the most appropriate.
The limitations and assumptions of HBE were discussed and qualitative model testing

3. Human Behavioural Ecology, Foraging and Lithic technology
58
was argued to be the best way to make use of HBE. Three models are presented and
their predictions outlined. These models resemble classical models of economic
behaviour and rely less on selection than the other two approaches. This is an
advantage for HBE because identifying the action of selection in lithic assemblages can
be difficult, especially if the assemblage is mostly debitage. In HBE, evolutionary
theory has an ontological role, explaining how the economic preferences came to be.
The presentation of these models glossed over complex issues because generality was
preferred to precision. The following chapter looks more specifically at linking HBE to
testing the general predictions of these three model using flaked stone artefact
assemblages. Chapter five then examines the specific methods suitable for testing the
general predictions. The general predictions are refined into specific predictions in
chapters six and seven following the description of relevant contextual environmental
and climatic data.

4. Analysing technological organisation
59
4. Analysing Technological Organisation
Introduction
The main finding of the previous chapter was that foraging models developed by
human behavioural ecologists are likely to be productive when using stone artefacts to
examine the relationship between human foragers and their environment. The aim of
this chapter is to develop a bridge between the general HBE models and methods for
testing the predictions of these models. The first step is to find some quality that is
specific enough to be robustly measured in lithic assemblages but general enough to be
inserted into the models explaining behavioural strategies. Finding this quality is
known as the ‘currency problem’ because of the difficulty in identifying the variable
that has the greatest influence on behavioural strategies across the broadest range of
contexts and is convenient for analysis (Jeffares 2002: 122-125, Winterhalder 1981: 21).
This quality is identified here as risk and Kuhn’s (1995) spectrum of provisioning
strategies is adapted to measure technological investment in risk reduction. The second
step is to review how best to classify the assemblage in preparation for determining
their position along Kuhn’s spectrum. It is concluded that typological classifications
are inappropriate and a nominalist approach based on the measurement of attributes is
more suitable. Chapter five completes the link between theory and measurement by
detailing the particulate attributes on the artefacts that are most sensitive to risk
reduction.
Linking Lithics to Models
A good method for finding the most general qualities relating to variation in lithic
assemblages is to survey the technological strategies practised by a large sample of
cultural groups living in a diverse range of environments. In this case, technology is
broadly defined as a society’s ‘customary means of manipulating the physical
environment’ (Bleed 1997). There are four main hypotheses proposing a general quality
that strongly influences technological strategies: Oswalt’s (1976) hypothesis that the
nature of the food exploited is the key variable, Torrence’s hypothesis that it is risk of
subsistence failure (Torrence 1989), Shott’s (1986) hypothesis that it is residential

4. Analysing technological organisation
60
mobility and Shennan’s (2001) hypothesis that population size is the primary variable
controlling technological diversity and complexity.
Oswalt (1976) analysed the toolkits and diets of 36 hunter-gatherer groups. He
classified technologies into five types, from the least complex (an ‘instrument’ such as a
digging stick) to the most complex (a ‘complex untended facility’ such as a snare). For
20 groups he observed a relationship between the degree of reliance on mobile food
resources (especially aquatic animals) and toolkit complexity and concluded that
exploiting mobile prey is more difficult than stationary foods (such as plants) and
therefore requires more complex technology. Oswalt claimed that it was the nature of
the food available that was responsible for this relationship. Torrence (1983) used a
similar functional classification and similar sample of forager groups to test the
hypothesis that time stress was a key component related to technological organisation.
Torrence proposed a model that predicted increased reliance on mobile foods equating
to increased time stress because of the increased search and handling time required
compared to stationary foods. Relatively simple technologies (such as Oswalt’s
instruments) do little to reduce time stress because they require continuous and direct
operation to acquire food resources (for example, digging for tubers). A middle
category such as weapons reduce time and energy inputs when seeking mobile prey
because they reduce the distance between the locations where the prey is spotted and
captured (Torrence 2001: 79). Finally, more complex technologies such as snares reduce
time stress further still by freeing up people to pursue other tasks at the same time that
the snare is working. Like Oswalt, she looked at the relationship between technology
and reliance on mobile food resources (using latitude as a proxy for the proportions of
plants and animals available for consumption, with fewer plants available further from
the equator because of shorter growing seasons). Torrence found a positive and
significant correlation between toolkit complexity, toolkit diversity and latitude,
strongly supporting her hypothesis.
Torrence (1989) later refined her interpretation of the correlation, suggesting that time
stress was only a proximate cause for variation in technology. Time stress caused by
limitations in the duration of prey availability is just a specific case of stress related to
the probability and cost of failing to capture prey, which Torrence proposes is the
ultimate cause of technological variation. The probability of prey capture failure and
the costs of this failure are two important variables that contribute to the suite of risks

4. Analysing technological organisation
61
that hunter-gatherers manage with various behavioural strategies (Torrence 2001: 77).
In their discussion of risk, Bamforth and Bleed (1997) extend Torrence’s analysis
further to determine the relative importance of probability and cost of failure to
technological organisation. Using partial regression methods, their analysis suggested
that after sampling bias is removed from Oswalt’s data, increasing latitude relates
primarily to toolkit diversity rather than complexity, which is mostly controlled by the
degree of dependence on aquatic resources. They also note that probability of failure
seems to be the main variable operating on the cross-cultural analysis. Failure costs
probably make a contribution also, but this is difficult to accurately evaluate across
different technologies and environments.
Shott (1986) proposed that the key variable for technological organisation was mobility
because carrying costs limit the number of tools available. Ethnographic research
suggests that highly mobile groups will have less complex tools than more sedentary
groups because the tools they carry must be suitable for a wider range of tasks (Ebert
1979, Kelly 1988, Kelly 1992). Shott examined correlations between technological
diversity and complexity and a range of mobility variables (including frequency and
magnitude) for 14 hunter-gatherer groups. Toolkit diversity and mobility frequency
were found to be significantly negatively correlated, as predicted. Other variables were
not significantly correlated. For example, relationships between toolkit diversity and
total mobility magnitude, toolkit complexity and frequency of moves or average
distance per move and territory size and toolkit diversity or complexity, were not
significant (Shott 1986).
Shennan’s approach to identifying the primary variable in technological organisation is
rather different from that of Oswalt, Torrence and Shott. He adapted a mathematical
model of mutation and selection used in population genetics to investigate the effect of
population size on the extent to which cultural innovations (‘mutations’) are
advantageous to the biological fitness of human populations and their attractiveness as
models for imitation. Specifically, Shennan models the transmission of craft traditions,
such as toolkit production, because of the specific transmission characteristics of this
kind of information (i.e. craft traditions) are passed from a parent or adult of the
parent’s generation to the same gender offspring once per generation during childhood
and very rarely learned from peers (Shennan and Steele 1999). The results of the
modeling show that members of larger populations are on average both substantially

4. Analysing technological organisation
62
biologically fitter and more attractive as models for imitation while smaller
populations suffer the persistence of innovations which are less beneficial
reproductively and less attractive to imitate. The implication for technology is that
rates of successful technological innovation are likely to be correlated with population
sizes and densities, so bigger populations have more complex and diverse
technologies.
To identify which of these four hypotheses used to explain toolkit variation is the most
general and most important, Collard et al. (2005) conducted a stepwise multiple
regression analysis of technological, ecological, subsistence, mobility and population
data from 20 hunter-gatherer groups worldwide (the same used by Oswalt and
Torrence). Their results supported Torrence’s hypothesis that risk of resource failure is
the primary influence on hunter-gatherer technology. The only variables that
significantly influenced toolkit complexity and diversity were effective temperature
(which they use instead of latitude as a similar proxy for length of growing season) and
net above-ground productivity (reflecting the increase in plant biomass during the
growing season). They did not find any significant correlations supporting the
hypotheses of Oswalt, Shott and Shennan. Like Bamforth and Bleed (1997), Collard et
al (2005) caution that risk buffering is less well correlated with toolkit structure for
hunter-gatherer groups with a substantial aquatic resource component in their diet.
They cite two examples of groups exploiting aquatic foods with complex toolkits that
would otherwise be unexpected, given their relatively low risk environments (the
Calusa of southern coastal Florida and the San groups occupying the floodplains of the
Botletli River in the northern Kalahari). These exceptions are of limited significance in
the analysis of lithic assemblages because aquatic foraging toolkits are typically made
from ephemeral organic materials with few lithic components. If aquatic toolkits are
widely used, they are likely to be underrepresented by lithic assemblages and therefore
unlikely to substantially distort lithic assemblage complexity and diversity as robust
measures of risk minimisation.
Risk is a useful concept to articulate general technological strategies with behavioural
ecological models (Hiscock 1994). The problem of risk is ubiquitous in animal foraging
systems (where it is defined as ‘variance’ rather than ‘probability of failure’, although
these can be considered equivalent in this context) and there is a substantial literature
on optimal foraging modelling and empirical testing of how animals respond to risk

4. Analysing technological organisation
63
(Caraco 1981, Kacelnik and Bateson 1996, 1997, Real and Caraco 1986). Important
results from this work are three general principles that predict how animals respond to
risk. First, animals whose average expected foraging returns are above survival
requirements tend to be risk-averse and animals whose average expected returns are
not, tend to be risk-prone. Second, when variance is in amount of returns, animals are
more usually risk-averse, whereas when variance is in delay of returns, animals are
almost universally risk-prone. Third, direction and magnitude of risk-sensitive
preferences may be influenced by the number of options available in the choice set
(Bateson 2002). Ecologists have observed a variety of behaviours for minimising risk
including torpor, group foraging, food sharing and storage (Winterhalder et al. 1999).
A similar suite of responses to risk has been documented by anthropologists examining
human groups, highlighting the universality of the problem of risk. In their survey of
ethnographic literature, Winterhalder et al. (1999) list some of the frequently observed
risk-minimising strategies, including diversification of food resources (e.g. crop types
or herd composition), diversification of resource collection locations (e.g. field
dispersion, increased foraging mobility), food transfers and sharing and storage. More
specific human responses to risk sensitivity include information storage (e.g. encoding
of survival information in oral tradition), exchange relationships and, of course,
technology (Minc and Smith 1989, Sobel and Bettles 2000, Wiessner 1982). These
responses can be generalised into four strategies that minimise risk by spreading
exposure to it (1) across multiple individuals, (2) over time, (3) over space and (4)
across economic activity types (Winterhalder et al. 1999: 339).
Although highly variable, humans are similar to most large omnivores, in being
generally risk-averse (Winterhalder et al. 1999: 338). As noted above, human
technology mostly operates to spread risk over time and space by reducing time stress
related to foraging. However, Fitzhugh (2001) has suggested that in the special case of
technological innovation, humans can change from risk-averse to risk-prone. He
proposes that when groups begin to experience resource yields below minimum
requirements they should become risk-prone by exploring new technologies in the
hope of improving resource yields. Fitzhugh suggests that increased innovation and
variation can be expected in response to heightened risks when groups encounter
unfamiliar environments (through migration or climate change), resource depression
(especially of high-yielding prey) or social-political competition.

4. Analysing technological organisation
64
It should be no surprise that the risk-averse responses listed by Winterhalder et al.
(1999) resemble some of the predictions of the three optimal foraging models presented
in the previous chapter. For example, the patch choice model predicts that individuals
will stay longer in a patch when in a more profitable patch relative to other patches, as
the distance between patches increases and when the environment as a whole is less
productive. Staying in a patch for longer is equivalent to minimising risk by
minimising exposure to other patches that probably yield less. The central place model
predicts that the further a forager goes the more they will bring back. This is equivalent
to minimising risk by spreading it over time and space; by increasing the load with
distance the forager maintains an average return rate given the travel and transport
costs for all trips and smooths out variation in returns for trips of different lengths.
These similarities between risk reducing strategies and optimising strategies suggest
that risk reduction, or minimizing the likelihood of a shortfall, can be employed as a
currency for optimal foraging models (Stephens 1990). Winterhalder (1990)
demonstrates this when examining trade-offs between rate-of-return maximisation
strategies and risk-minimisation strategies in subsistence practises and risk
management for pre-modern agriculturalists in central England and hunter-gatherers
of the Kalahari in Southern Africa. Using diet breadth models, he shows that for both
examples the model predicts similar outcomes for rate-of-return maximisation and
risk-minimisation. In the case of the archaeological record of technological organisation
other influential factors, for example those related to social and historically contingent
contexts, cannot be ruled out, so it is unlikely that a risk minimisation strategy will
always be optimal. However, for models with maximum generality, risk is clearly the
most useful variable and will be highly influential even if people are satisficing instead
of optimising.
Measuring Risk Minimisation
If risk seems to be a suitably general quality explaining variation in prehistoric
technology, including lithic assemblages, and for use as a currency for optimal
foraging models, then the next step is to determine how risk minimising strategies can
be identified in the particular lithic assemblages under consideration here. There has
already been considerable work done on identifying risk minimising strategies in stone
artefact technology. This work is based on the assumption that conflation of
archaeological deposits and palimpsest formation do not obscure the signal of short

4. Analysing technological organisation
65
time scale activites repeated over long time periods. One influential example is Bleed’s
(1986) categorisation of tools as ‘maintainable’ (readily repairable) and ‘reliable’
(unlikely to break while in use). Maintainable tools are described as relatively simple,
generalised, light and portable, being suitable for quick and easy repair during use.
Reliable tools are more complex and specialised, with redundant design elements to
minimise unscheduled repair time and requiring more effort and time to produce and
repair (and thus more costly when they fail). Assemblages that are relatively abundant
in both reliable and maintainable tools reflect an investment to minimise a relatively
high exposure to risk, in a similar way that the more complex and diverse assemblages
discussed above correlate with more challenging environments.
Bleed’s approach has proven very productive in a variety of archaeological studies
(Bleed 2001, Bousman 1993, Bousman 2005, Hiscock 2006, Myers 1989, Neeley and
Barton 1994) but is limited by its dependence on visually distinctive and relatively
complex tools as the objects of analysis and the reality that reliable and maintainable
tools are not mutually exclusive. The conventional idea of a tool is a specimen that has
at least one of the four attributes identified by Hiscock (2007) to hypothesise implement
design (repeated shaped, regular form, morphological features in excess of
performance requirements and extensive retouch). This is a crucial limitation in this
context because the assemblages considered here, like many flaked stone assemblages
from mainland Southeast Asia, are almost entirely unretouched flakes and cores; there
are no tools, conventionally defined. Similarly the approach used by Torrence et al. in
the above discussion of toolkit complexity and diversity is also not suitable for
assemblages of unretouched stone artefacts because they constitute only a single
dimension of diversity and complexity, so comparing two or more assemblages from
the same region will always produce the same result. This is not to say that
unretouched flakes were not used, only that tools cannot be unambiguously
distinguished from tool-making debris. Similarly, the stone component may represent
only part of the whole implement, so analysis of tool design is limited to one small,
often simple and cheap component. Bleed and Torrence have proposed special cases of
a theory for connecting risk to stone artefacts, but what is needed here is a more
general theory that connects risk to the largest part of stone artefact assemblages in
mainland Southeast Asia – the unretouched flakes and cores. This is a difficult task
since without tools it is necessary to generalise beyond well-understood dimensions of

4. Analysing technological organisation
66
tool design such as standardisation, flexibility and use-life (Hiscock 2006, Nelson 1991,
Surovell 2003, Ugan et al. 2003).
To begin the derivation of this general theory it is necessary to return to the three
optimal foraging models outlined in the previous chapter and consider how to test
their predictions. The patch choice model is the simplest, stating that the higher the
value of the patch the longer a forager will remain there. The archaeological correlate
of this is simply more and larger sites with higher artefact densities in high value
patches. A minor consideration is to ensure that technological changes alone are not
responsible for higher densities, this can be dealt with first by analysing artefact
technologies and second by examining discard rates of other cultural materials.
Similarly, the predictions of the central place model can be tested by measuring the
relative degrees of pre-processing of lithic raw material prior to entering the site. The
methodological challenge here is distinguishing pre-processing from on-site
processing. This can be done by analysing core and flake ratios and metrics in
assemblages recovered from archaeological sites and identifying pieces that appear to
be missing from the assemblage. For example, cores are present in the assemblage but
certain size classes of flakes appear to be absent then it is possible that those flakes
were detached form the core off-site during a pre-processing event. More complicated
are testing the predictions of the model of optimal dispersion, which describes when
people will adopt logistical or residential settlement patterns. The problem here is that
it is difficult to identify these differences in settlement patterns in unretouched lithic
assemblages. More specifically, an approach is needed that shows how foragers solved
the problems of maintaining an adequate supply of stone artefacts at different points
on a spectrum of high to low residential mobility.
The most productive approach to making the connection between lithic assemblages
and residential mobility are the two ‘provisioning strategies’ described by Kuhn
(1992b, 1995, 2004b). Individual provisioning describes a strategy of keeping individual
foragers supplied with the artefacts and raw materials they need as they move through
the landscape. Place provisioning refers to strategies that involve supplying artefacts
and raw materials to places where activities are likely to be carried out. Like Bleed’s
scheme, Kuhn’s system has been most commonly employed in the analysis of tools
rather than unretouched pieces. Kuhn’s system is here adapted for assemblages of

4. Analysing technological organisation
67
unretouched flakes and cores, following the example of Mackay (2005) who modified it
to suit an assemblage with no formal components.
Individual Provisioning
The main limiting factor in provisioning mobile individuals with technology is
transport cost, so artefacts should be designed to supply a satisfactory amount of
potential utility given these transport costs (Kuhn 2004b: 432). The exact method for
obtaining this satisfactory amount varies across different lithic technologies (Goodyear
1989, Kuhn 1994, Morrow 1995, Nelson 1991, Roth and Dibble 1998, Shott 1986).
Amongst this diversity of methods the general trend is for mobile individuals to
provision themselves with artefacts that have undergone some processing and are
ready for use rather than less- or un-processed raw material nodules, which would
involve carrying mass that is not contributing to the artefact’s function. This strategy is
most directly relevant to testing the predictions of the central place model, since the
predictions of that model hinge on travel and transport costs. When foragers have to
travel further to obtain resources, the field processing model predicts that pre-
processing of resources should increase to optimise the delivery of useful material
given travel and transport costs. In the case of lithic assemblages, the correlate of
increased travel and transport costs is increased individual provisioning.
In particular, the expected characteristics of an assemblage resulting from individual
provisioning are pieces that have reduction potential and, more importantly, pieces
that have had that potential extended, realised and/or exhausted. Reduction potential
refers to the degree that an artefact can be modified and repaired to prolong its useful
life, making less raw material do more work (Macgregor 2005, Shott 1989a). Identifying
reduction potential of tools is difficult and problematic despite several ingenious
methods (Clarkson 2002, Eren et al. 2005, Kuhn 1990, Shott 1995), and for assemblages
without tools at all a different approach is required. Hiscock (2006) has suggested that
instead of looking for reduction potential, assemblages can be examined to identify
technological decisions that resulted in reducing the rate at which artefacts need to be
resupplied, thus reducing procurement and transport costs. Hiscock (2006: 81) calls
these decisions to reduce procurement and transport costs an ‘extension strategy’ and
notes that it is characterised by fewer and smaller artefacts that have attributes suitable
for extended flaking, use and resharpening. Examples of these attributes include

4. Analysing technological organisation
68
higher quality raw materials (Goodyear 1989) and cores with multiple platforms
(Macgregor 2005). When employing this strategy foragers are investing relatively more
energy in a smaller number of artefacts for the return of use over an extended period.
Perhaps the most useful link provided by the concept of individual provisioning is
between lithic assemblages and the predictions of the optimal dispersion model. The
paradigmatic mobile individual is one who makes lengthy logistical foraging trips
from a base camp, but foragers as a group are all mobile individuals when the
residential camp is a small frequently relocating settlement. This means that a signal of
individual foraging in an assemblage can reflect high logistical mobility during
conditions of mobile and clumped resources or high residential mobility in
stable/evenly dispersed environments if foraging activities are out of phase with raw
material provisioning opportunities. Local factors, such as the availability of raw
material and the nature of particular foraging resources are the key to disentangling
the two possibilities. For example if a residentially mobile group is foraging in an area
of relative raw material abundance then the signal of individual provisioning in the
assemblage should be weak. On the other hand, foragers involved in logistical
movements are always likely to adopt an individual provisioning strategy, according
to the predictions of the central place model.
Place Provisioning
Where the signal of individual provisioning is weak then a different provisioning
strategy, place provisioning, is likely to be operating. Place provisioning occurs when
transport costs do not strongly constrain technological choices. The relaxation of these
constraints means that people will tend to amass quantities of raw material at more
permanently or more frequently occupied locations. These locations will tend to be
provisioned with raw material in various states of manufacture including unworked
nodules and less reduced specimens (Parry and Kelly 1987). This strategy is optimal
under three conditions: abundant raw material, low residential mobility or short range
logistical movements.
The identification of place provisioning strategy as the opposite of individual
provisioning provides a more robust link between optimal foraging models and lithic
assemblages. In reality, the two strategies are not polar opposites but will both be
present in an assemblage to different degrees depending on the particular habitat.
Place provisioning strategies will be predicted by the patch choice model when

4. Analysing technological organisation
69
foragers are in an area or period of high patch yields. Similarly, place provisioning is
predicted by the central place model when travel and transports costs are relatively
low or logistical movements are short. Finally, place provisioning is predicted by the
optimal dispersion model when resources are patchy/mobile but near to the residential
camp or stable/evenly dispersed when raw material provisioning is in phase with
substance resource acquisition. Once again, determining the mix of factors influencing
technological provisioning choices requires knowledge of the local habitat.
These two provisioning strategies, when linked with the optimal foraging models
described in the previous chapter, can be ultimately regarded as responses to varying
degrees of exposure to risk. There are two specific kinds of risk that these provisioning
strategies should be most effective at lessening. First is subsitence risk, or the risks
associated with procuring food. This is the kind of risk that Torrence’s work refers to,
and is likely to be relevant in the discussion any mobile technology of human foragers.
Elston and Raven (1992: 33-34) describe this as contingency risk, which is the
probability of not having enough toolstone to meet subsistence needs. This risk
increases as toolstone supply diminishes and suggests that people will increasingly
invest effort in monitoring and managing stone consumption to avoid insufficiency.
However, the flake and core assemblages examined here are likely to have been used
for other tasks in addition to food procurement, such as processing materials for
shelters and repairing tools for other purposes. A second kind of risk, technological
risk, may be more important for this kind of assemblage which cannot be exlusvely
linked to food procurement. Technological risk refers to the risk of running out of
usable tools or raw material and being unable to perform key activities. This kindof
risk is more general because it does not require knowledge of how the artefacts were
used. Instead it depends on the assumption that making and maintaining stone
artefacts incurs an opportunity cost by diverting time from time sensitive activities
such as pursuing mobile resources or travelling between patches. Elston and Raven
(1992: 33-34) describe this as venture risk, which is the probability that the
procurement and opportunity costs of seeking stone resources will exceed the benefits
of any stone resources gained. These different kinds of risks are not quantified in detail
here, but serve a heuristic purpose in linking stone artefact technology and risk
management. This taxonomy of risk illustrates the sorts of risks that stone arteafact
technology can minimise through the choice of an individual or place provisioning
strategy.

4. Analysing technological organisation
70
In general, individual provisioning will be adaptive in high risk environments while
place provisioning is suitable for low risk environments where time and energy can be
diverted to tasks other than technological provisioning. That said, an individual’s
technological decisions are likely to be influenced by risk on a variety of scales from
personal momentary risk to population-level generational risk. This means that a lithic
assemblage will include a combination of individual and place provisioning strategies
and analysis of provisioning strategies will only reflect a response that is an average of
several different responses conflated together during the formation of the
archaeological deposits. Consideration of the minimum chronological resolution of
analytical units is important for interpreting this average response.
In using these two provisioning strategies and related behavioural ecological models
to answer archaeological questions, much previous work has focussed on partitioning
a typology into categories along the spectrum between place and individual
provisioning (e.g. McCall 2006). While this approach generally works because of an
occasional correspondence between typology and artefact reduction intensity in
assemblages from certain times and places, it is necessary to consider an alternative
philosophy of classification for assemblages that are not readily amenable to
typological classification. This is a typical problem of mainland Southeast Asian lithic
assemblages, largely due to the very small numbers of retouched pieces and the
relatively indistinct patterns of core reduction.
Approaches to Artefact Classification
Classification is an enduring and central concern of archaeology, as it is in many other
disciplines. In particular, biology has a long tradition of working at the general
problem of how to arrange phenomena to do useful analytical work. Since biologists
have been thinking about this for much longer than archaeologists, it might be
instructive to see how they have confronted the problems of grouping entities. Also,
the processes of change in a flaked stone artefact over its use-life suggest that there is
good reason to look to biology for ideas about classification. The nature of change for a
flaked stone artefact is the flake-by-flake removal of mass that changes the size and
shape of the artefact (Flenniken 1984, Steffen et al. 1998). Although the flakes removed
are discrete units, these flakes are typically much smaller than the artefact from which
they are removed (for example a core or retouched flake) so the process of change of a
stone artefact can be viewed as a continuous reduction of mass and morphological

4. Analysing technological organisation
71
possibilities. This process of change by continuous reduction can be compared to
natural selection of variation in a biological population. The artefactual equivalent to a
biological population is an assemblage, when a group of artefacts in the same place
from the same time are under consideration.
The process of natural selection in biological populations is reductive because variation
in a biological population is reduced when less successful variants are removed from
the population by their failure to reproduce. Other processes such as mutations,
genetic drift and genetic recombination generate biological variation. The sources of
variation in stone artefact assemblages and biological populations are, of course, very
different but I suggest that the mechanisms of change in lithic assemblages and
biological populations are conceptually similar. Morphologies of both assemblages of
flaked stone artefacts and biological populations change because of a process of
continuous reduction. Even if an artefact is used by multiple people over different
times and locations, morphological and size change of that piece can only occur
through the flake-by-flake removal of mass. A direct analogy between natural selection
and stone artefact reduction is problematic because stone reduction does not remove
unsuccessful variants from the assemblage like natural selection does. However, the
more abstract concept of gradual change by reduction of variation is shared by stone
artefacts and biological populations and has implications for archaeological
classification.
This conceptual equivalence of the processes of change is significant because it means
that the philosophical and methodological work of biologists on classification is
relevant to archaeologists dealing with flaked stone artefacts. For example, Ernst Mayr
(1959), identified two basic philosophies that underlie attempts to define concepts of
biological species: ‘typological’ thinking versus ‘population’ thinking (Figure 4.1).
Mayr’s ‘typological’ thinking is similar to what archaeologists mean when they refer to
typologies. It presumes the existence of discoverable and discrete kinds of things.
Things are of the same kind because they share real and fixed ‘essences’ — and these
essential properties dictate whether a specimen is of kind A or kind B (Lyman and
O'Brien 2002). This approach to classification was dominant in biology from Plato and
Aristotle until Darwin. Modern biologists are generally critical of this essentialism
(Sober 1980), with Hull (1965a, 1965b) arguing that it was responsible for 2000 years of

4. Analysing technological organisation
72
stasis in the development of the science of biology, and Popper (2003: 11) similarly
writing that
the development of thought since Aristotle could, I think, be summed
up by saying that every discipline as long as it has used the Aristotelian
method of definition has remained arrested in a state of empty verbiage
and barren scholasticism, and that the degree to which the various
sciences have been able to make any progress depended on the degree
to which they have been able to get rid of this essentialist method.
Essentialism and stone artefact archaeology
Should essentialism also be criticised by archaeologists working with Southeast Asian
stone artefacts? In this context there are three criticisms of essentialism. First,
essentialism results in a method that uses only a very small fraction of the available
sample. Typological thinking in stone artefact studies results in methods that classify
assemblages into discrete groups of artefacts according to their shapes and sizes. The
shapes and sizes of artefacts are explained by typologists as the result of an intentional
design in the mind of the artefact maker to produce tools for specific purposes (Dibble
1995: 32, Hiscock and Attenbrow 2005). This results in a focus on the most visually
striking artefacts in an assemblage, usually only a small proportion of most
archaeological assemblages (Hiscock 2007). In the earliest published description of a
typology Southeast Asian flaked stone artefacts, Colani (1927) writes that over 1000
artefacts were recovered from the excavations at Sao Dong, Vietnam, of which 82
artefacts were classified into 28 types. Similarly, in Pookajorn’s (1988) excavation of
over 3000 artefacts from three rockshelters at Ban Kao, central Thailand, he classified 86
of those artefacts into 10 types. Excavations at Laang Spean, western Cambodia,
recovered 8502 stone artefacts, of which 34 were classified into seven types (Mourer
1977). In these three examples the analysed samples are rather small for reliable
statistics and convincing interpretation (cf. Shennan 1988) and there are a large number
of artefacts that are not contributing to the analysis. Even if the unanalysed pieces
really were waste from prehistoric tool-making, it is widely accepted by stone artefact
analysts in other parts of the world that this kind of debitage has considerable
analytical value (Andrefsky 1998: chapter six, Clarkson and O'Connor 2005, Collins
1975). This suggests that the typological approach to Southeast Asian stone artefact
analysis results in an inefficient use of the available data.

4. Analysing technological organisation
73
A second criticism of essentialist approaches is that they hide or compress variation
into a small number of groups. Artefacts that do not appear to fit comfortably into the
typology are explained by the typologist as imperfections, flawed realisations of the
ideal mental image or the result of variation in skill and raw materials that is usually
viewed as having no explanatory value (Dunnell 1986, O'Brien and Lyman 2000:33).
Colani (1927:56) dismisses the large number of artefacts that she does not analyse as
‘among the rudest ever made by human hands.’ Later archaeologists working in
Vietnam have been similarly nonplussed by the ‘great number of indefined *sic+ tools’
in Hoabinhian assemblages and are ‘puzzled with the idea of how to find a suitable
type for them’ (Chung 1994).
In Thailand, van Heekeren observed that ‘the overwhelming majority of the flakes
from [Sai Yok] displayed no signs of edge-chipping from use or from planned retouch
and typological examination of the flakes does not indicate intended production of any
predetermined shapes. They may therefore be labelled as waste products’ (van
Heekeren and Knuth 1967:23). The Sai Yok lithic assemblage was later revisited by
Matthews (1964:188) who undertook a detailed and systematic analysis of the flaked
stone artefacts, motivated by a concern that the Hoabinhian types focussed on by other
archaeologists were ‘an arbitrary selection< being made from a continuous range of
shapes’. Matthews was influenced by Spaulding’s (1953) argument that types can be
discovered in archaeological assemblages by using statistical tests such as chi-square to
identify distinctive differences between groups of artefacts with similar combinations
of attributes. Although Spaulding’s approach cannot discover ‘natural’ types because
the types discovered by statistical analysis ultimately depends on the choices made in
the selection and weighting of variables (Dunnell 1971), Matthews was able to use
Spaulding’s method to test the idea that the Hoabinhian assemblage from Sai Yok
contained the discrete types described by Colani.
Matthews (1964:230) analysed the Sai Yok assemblage to test his claim that Colani’s
Hoabinhian typology was not justified and resulted in ‘individual *artefacts+ from
continuous ranges [being] given typological significance they did not deserve.’
Matthews collected data from the Sai Yok artefacts using measurements of continuous
variables to see if different artefact types would identify themselves by showing
different and discrete modes in the results. On each artefact he recorded a suite of
metric dimensions as well as observations about the quantity and distribution of flake

4. Analysing technological organisation
74
scars and cortex as well as the shape of the artefact (Matthews 1964:150-3). Matthews’
conclusion is unequivocal; the Sai Yok assemblage does not contain discrete types but
only kinds of artefacts with measurements and attribute states that overlap on a
continuum with other kinds. Figure 4.2 shows that metric variables for flaked cobble
artefacts vary continuously rather than having discrete peaks. The same continuous
variation is evident in flake scar numbers and edge angles or cores (Figure 4.3) and
metric variables on flakes (Figure 4.4). This result demonstrates that, in the case of the
Hoabinhian, typological analysis ignores variation in lithic assemblages and instead
focuses on a few forms that are not representative of numerically and technologically
important aspects of the assemblage. Despite Matthews’ early demonstration of how
typological analysis compresses and neglects variation, typological methods have
continued to be used in mainland Southeast Asian archaeology (eg. Pookajorn 1990,
Santoni et al. 1990). Had Matthews presented his results more directly by stating that
Hoabinhian types are not necessarily final products but visually distinctive forms
resulting from different stages of reduction with overlapping attribute variation then
his results may have had a more immediate impact.
Matthews’ study indicates that essentialist approaches to Southeast Asian stone
artefacts are problematic because they are inefficient in their use of data and they fail to
incorporate the full range of assemblage variation. In addition to these two specific
issues, there is a third and more general problem with essentialist approaches, one that
is common to the analysis of all kind of artefacts. This problem is that because
typological analyses cannot measure gradual change in artefacts over time (because
continuous morphometric variation is not tracked), only the difference between kinds
of artefacts can be measured (Lyman and O'Brien 1997). If a kind of thing (such as a
stone artefact type) is based on discrete and exclusive essences, then for that thing to
change it must drop one essence and take on another, so it must undergo a
transformational step-like change rather than a gradual and continuous change (Mayr
1982). This means that a typologist can produce sequences of kinds of artefacts,
showing that there are differences over time, but this sequence does not allow them to
measure gradual change leading to empirical historical relationships with clear
ancestor-descendant relationships (Dunnell 1980:38, O'Brien and Lyman 2000:35).
Measuring historical change in artefact lineages is an increasingly important concern in
artefact analysis with the growing interest in evolutionary theory in archaeology

4. Analysing technological organisation
75
(Boone and Smith 1998, Lyman and O'Brien 2006, Lyman and O'Brien 1998, Marwick
2006)
An example of this problem in Southeast Asia is the numerous lithic industries named
by Vietnamese researchers, such as the Sonvian, Bacsonian and Da But, that are
defined according to the frequencies and presence or absence of certain lithic types,
and the geography of site location (Huu Nga 1994, Khac Su 1994, Van Tan 1997). These
different industries are equated with cultures, for example the Sonvian and the
Hoabinhian are regarded by Khac Su (1994:26-27) as ‘independent, separated cultures’
with some ‘cultural interrelation’. The typological differences between the lithic
industries are relatively clear but the historical relationships between these industries
are unclear. For example, we do not know if they are divergent lineages from a
common ancestor, ancestor-descendant industries or if the two industries really
represent two points on continuum of a single industry where the changes in the lithic
assemblages are best explained as adaptations to different ecological conditions (cf.
Nishimura 2005).
To summarise, the use of essentialist approaches in Southeast Asian archaeology has
three significant criticisms: first, it is an inefficient method, with large numbers of
artefacts ignored because they do not fit into type categories; second, continuous
morphometric variation at the assemblage level is largely ignored in favour of ideal
specimens, despite the empirical reality that these ideal types are not representative of
the assemblage; and third, that typological analyses cannot explain historical change in
artefact lineages. That said, we should not completely abandon essentialism because
typological thinking still has value as a system of classification for archaeologists.
Metal, ceramic and many other kinds of artefacts, for example, often have discrete
forms with no continuity between shape and size between different classes of artefact.
These kinds of artefacts are built up from a plan, such as a metal cast or coil and slabs
of pottery (1987, Schiffer and Skibo 1997) and resharpening or repair need not involve
the one-way reduction of mass like stone artefacts (Shott 2005, Steffen et al. 1998).
Broken metal artefacts can be melted and recast and broken ceramic vessels can be
ground up and recycled as temper (Deal and Hagstrum 1995), rather than gradually
moving through a spectrum of utility and changing morphology like flaked stone
artefacts. Typological classifications of ceramic, metal and other constructed (as
opposed to reduced) artefacts can be valid and useful for answering a variety of

4. Analysing technological organisation
76
questions about past human behaviours. These kinds of artefacts (and related
attributes such as decorations) are especially well suited to analysis using frequency
seriation, where the quantities of various kinds are tracked together over time (O'Brien
and Lyman 2000:271-300). This often results in ‘battleship curves’ (also known as
Markovian structures) that can be analysed to discover biases in the social transmission
of artefact-related information and answer fundamental questions about the spread
and persistence of cultural traits (Bentley and Shennan 2003, Neiman 1995). In addition
to the analytical value of typological thinking, it is also a useful system for assemblage
curation and public education, where things need names so that stories about them can
be told, as well as having to be organised and displayed within discrete spaces.
Nominalism and the reduction thesis
If typological approaches to flaked stone artefacts in Southeast Asia are problematic,
then how can the opposing philosophy of classification – Mayr’s ‘population’ thinking
– be employed in stone artefact analysis? This approach to classification holds that
phenomena cannot exist as discrete entities because they are always in the process of
becoming something else. No two things are ever exactly alike because similar things
do not share an essence, they are just at similar points in the process of becoming
something else. The nominalist sees individual things that are composed of unique
features and when these things are grouped together they form populations that are
described by statistical abstractions such as mean and measures of variation (Mayr
1959). Like essentialism, nominalism is a way of viewing the world that was familiar to
the ancient Greeks as well as ancient Arab and Chinese authors (Bowler 2003), but was
an unpopular philosophy until Darwin. Darwin’s contribution is significant because he
replaced typological thinking with population thinking through his collection of
evidence supporting gradual rather than sudden change in animals and his proposal of
natural selection as a mechanism for this gradual change.
The nominalist approach to stone artefact analysis recognises that morphological
variation in stone artefacts reflect different stages along a continuum of change rather
than the intentional creation of discrete types. This approach is supported by
ethnographic studies that have recorded how tool morphology changes as the tool
undergoes continuous resharpening throughout its use-life (Gallagher 1977, Gould et
al. 1971, Hayden 1977, Hayden 1979). This approach is known as the ‘continuum
model’ or the ‘reduction thesis’ (Hiscock and Attenbrow 2003, Shott 2005). Nominalist

4. Analysing technological organisation
77
analyses are well-suited for classifying flaked stone artefacts because each flake that is
removed, either during the manufacture, use or resharpening of an artefact, is a small
step in the process of the artefact becoming a different shape and size. Over the life of
an artefact, this flake-by-flake change resembles a continuous process that can be
measured with continuous measurement variables. Following from this, an assemblage
of artefacts is a group of individual pieces that were in the process of becoming
something else (through morphometric change resulting from use, reduction,
breakage, discard, etc.) at the time they entered the archaeological record. Although
individual artefacts may have noteworthy histories of manufacture and use, it is only
when they are considered together at the assemblage level that meaningful statements
about technological patterns can be made. Extrapolating technological schemas from
single pieces risks confusing unique stochastic events with longer-term patterns of
behaviour that are of greater archaeological interest.
Measuring the degree of this change in artefact shape and size is the focus of
nominalist analyses (Clarkson and O'Connor 2005). Shott (2005) presents a catalogue of
methods developed in the last twenty years for measuring artefact reduction in
assemblages, including Dibble’s (1987) comparison of relative numbers of Middle
Palaeolithic scraper types, Kuhn’s (1990) geometric index of unifacial reduction,
Barton’s (1988) perimeter retouch index and Clarkson’s (2002) index of invasiveness.
These methods are yet to be tested with assemblages from mainland Southeast Asia.
Despite having been very illuminating elsewhere, they may be of limited use with
mainland Southeast Asian assemblages because of the relatively low proportions of
intensively reduced artefacts (White and Gorman 2004).
A more productive method is likely to be diacritical analysis, which includes all flakes
and cores in an assemblage and ranks individual flake reduction according to simple
changes in individual flake morphology that logically follow from changing core
morphology as reduction intensity increases (Sellet 1993: 108). In this way, the
assemblage can be described in terms of statistics based on the population of
individual artefacts. For example, although technological attributes interact in complex
ways, a reasonable expectation is that as an assemblage is reduced, the average number
of flake scars on flakes and cores will often increase, and the average amount of cortex
will correspondingly decrease. Similarly, proportions of artefacts with overhang
removal (the presence of a series of overlapping flake scars less than about 5 mm long

4. Analysing technological organisation
78
at the intersection of the striking platform and the dorsal surface) may also increase as
the knapper adjusts the core platforms to prepare them for the more difficult blows
required to detach flakes from smaller cores (Macgregor 2005). The following chapter
develops this approach further and presents experimental evidence in support of a set
of variables for measuring artefact reduction at the assemblage level for Hoabinhian
assemblages.
There are three specific and significant advantages for the nominalist approach when
dealing with flaked stone artefacts. The first is that it allows the analyst to jettison
assumptions about the knapper’s mental goals and functional desires when describing
and analysing the assemblage (Hiscock and Attenbrow 2005: 33). Adopting a
nominalist approach shifts the criteria of classification from the unknowable mental
states of the knapper inferred by the typologist to the attributes of fracture surfaces
which have the obvious advantage of being objectively described. As a result, a
nominalist analysis includes all products of the knapping ‘waste’ (for example
unretouched flakes and amorphous cores), not just the sample that appear to have been
used or designed for use. One reason to do this is because the fracture surfaces of the
waste material preserves information about earlier states of the cores, thus
documenting manufacturing processes that are not preserved in intensively reduced
cores that would otherwise be the exclusive object of analysis in a typological system.
A second reason to prefer the nominalist approach of using the entire assemblage
rather than only pieces assumed to have been tools is that there is yet to be a
convincing demonstration of the claimed associations of tool form and function that
Hoabinhian typological systems rely on (Bannanurag 1988, Kim Dzung 1994).
Finally, the nominalist approach is advantageous because variation in assemblage
reduction can be interpreted as a reflection of variation in behavioural responses to the
conditions of lithic production and discard. This interpretation is possible because
lithic production is not simply a technical act, but a process of supplying functional
tools at the same time as solving problems related to risk, cost, and efficiency in
systems of time budgeting, mobility and land use (Bleed 2001, Clarkson and Lamb
2005, Hiscock 1994, Kelly 1988, 1992b, 1994, Kuhn 1995). From this embeddedness of
technology in other systems, the distribution of assemblages at different stages of
reduction over space and time can be seen as a reflection of variation in planning, land

4. Analysing technological organisation
79
use and settlement and subsistence patterns in everyday life of hunter-gatherers
(Binford 1979, Kuhn 1995, Nelson 1991).
Summary
This chapter has identified risk as a quality that is general enough be used with the
foraging models and important in the explanation of technological variation. Kuhn’s
spectrum of provisioning systems was adapted to link the idea of risk reduction to
behavioural strategies involving stone artefacts. Finally, a review of artefact
classification systems argued that a nominalist system based on the measurement of
artefact attributes is best suited to the investigation of risk reducing behaviours using
flaked stone artefacts. The next chapter shows specifically which artefact attributes are
the most reliable indicators of risk reducing strategies.

4. Analysing technological organisation
80
Figure 4.1. Schematic representation of essentialist and nominalist approaches to
classification. The peaks represent kinds of artefacts in a hypothetical assemblage, with the
height of peaks indicating their numerical dominance in the assemblage.

4. Analysing technological organisation
81
Figure 4.2. Matthews’ metric analyses of flaked cobble artefacts from Sai Yok (n = 100).
Redrawn from Matthews (1964).

4. Analysing technological organisation
82
Figure 4.3. Matthews’ analyses of flake scar numbers and edge angles on pebble tool artefacts
from Sai Yok (n = 183). Redrawn from Matthews (1964).

4. Analysing technological organisation
83
Figure 4.4. Matthews’ metric analyses of flakes from Sai Yok (n = 100). Redrawn from
Matthews (1964).

5. A general model for reduction
84
5. A General Model for Quantifying Lithic Reduction in
Hoabinhian Assemblages
Introduction
Now that the problem of the most appropriate approach to the classification of
artefacts has been addressed, the next step is to determine the most relevant variables
for quantifying lithic reduction at the assemblage level, rather than for specific
specimens. These variables are the key to a general theory connecting risk to stone
artefacts because they allow direct measurement of the degree that risk reducing
strategies have influenced assemblage formation. The aim of this chapter is to describe
the specific techniques for measuring risk reducing strategies in flaked stone artefact
assemblages. The first part of this chapter is a brief review of artefact definitions and
general statistical and graphical techniques. The second part presents the results of an
experiment designed to identify the most reliable attributes for measuring assemblage
reduction intensity as a proxy for investment in risk reduction. A slightly shortened
version of the second part of this chapter has been accepted for publication in the
Journal of Archaeological Science (Marwick 2007b).
Defining and identifying artefacts
The previous chapter described the nominalist philosophy of classification as the most
suitable approach to analysing flaked stone artefacts. The implication of following this
approach is that the most parsimonious and robust division of flaked lithic specimens
is into four classes: cores, flakes, retouched flakes and flaked pieces. These classes are
defined by simple empirical qualities, namely macroscopic scar form and
superimposition, and are independent of functional and mental assumptions (Hiscock
2007). While additional subdivisions are possible, for example unifacial and bifacial
cores or retouched flakes, these subdivisions are undesirable at this high level of
classification because they impose discontinuities on the assemblage that may obscure
or conflate relationships with other technological properties important for
understanding sequences of manufacturing actions. This simple four class system has
the advantages of clarity, efficiency and objectivity over previous Hoabinhian

5. A general model for reduction
85
classification schemes which have had limited success because of their complexity and
subjectivity.
Core
In this classification a core is defined as specimen with one or more negative
conchoidal flake scars and no positive flake scars. A negative flake scar is a fracture
surface that has negative impressions of one or more of the following; ring crack, cone,
bulb, concentric ripples or fracture termination (Cotterell and Kamminga 1987,
Crabtree 1972). Further description and information on the mechanics of the formation
of flake scars can be found in Phagan (1985), Whittaker (1994) and Macgregor (2005).
No distinction was made between complete and broken cores because the coarseness of
the lithic material and the relatively high frequency of internal faults in the rock made
distinguishing core fragments from unbroken cores difficult. Quantification of cores is
simply given as a total count of specimens.
Flake
A flake is defined here as a specimen with one or more positive conchoidal flake scars
(i.e. one or more ventral surfaces). A positive conchoidal scar can be identified using
one or more of the following properties: ring crack, cone, bulb, concentric ripples or
fracture termination. A flake may also have negative flake scars, but this property is
irrelevant to its membership of the class.
Flakes are the most numerous kind of artefact in this project and describing their
different states of fragmentation is necessary to accurately calculate the abundance of
flakes and to distinguish complete from broken specimens. The distinction between
complete and broken specimens is important for accurate technological interpretations
of many flake attributes. For example it would be spurious to analyse flake lengths and
include length measurements from transversely broken flakes where the length of the
original intact flake cannot be measured.
Four kinds of flake fragment were recognised here, following Hiscock (2002b).
Longitudinally broken fragments occur when a flake has broken along the percussion
axis and split the flake so that the broken fragments include part of the striking
platform, fracture initiation and termination. Transversely broken flakes occur when
the flake is broken along an axis perpendicular to the percussion axis. Transversely
broken pieces include portions of both lateral margins but not necessarily the platform

5. A general model for reduction
86
or fracture initiation (unless it is a proximal fragment), and termination (unless it is a
distal fragment). Marginal fragments occur when a piece of the flake margin breaks
away, these fragments have only portions of one lateral margin and no termination or
initiation. Surface fragments are pieces that are a portion of ventral or dorsal surface,
with no initiation, termination or margins present.
Although technological analysis is undertaken only on complete flakes, these different
fragmentation classes can be used to estimate the abundance of flakes in an
assemblage. Influenced by studies of taphonomy and zooarchaeological quantification,
Hiscock (2002b) has proposed a formula for calculating minimum numbers of flakes
(MNF) from complete and fragmented flakes. The formula sums the number of
complete flakes, the largest category of transverse fragments (proximal or distal,
excluding medial), the largest category of longitudinal fragments without a transverse
break (left or right) and the largest category of transversely and longitudinally broken
fragments (right/proximal, left/proximal, right distal, left/distal). Minimum numbers of
flakes must be calculated separately on different raw materials because their different
mechanical properties mean that their susceptibility to fragmentation varies.
Retouched flake
A retouched flake is defined here as a flake on which scars have been produced after
the formation of the last ventral surface. This is identifiable by the presence of one or
both of these two properties: the flake has scars that encroach onto the ventral surface
(and were created after that surface) and/or the flake has scars that originate from the
ventral surface (and were created by striking that existing ventral surface) (Hiscock
and Attenbrow 2005: 34). This is a polythetic class because is it based on the specimen
having at least one of the properties of the flake class and one of these two retouch
properties. Very few retouched flakes were recorded so no further analyses of these
were undertaken.
Flaked piece
Although the previous three classes will capture the great majority of artefacts in an
assemblage, an additional class is necessary to classify specimens that cannot be
classified as cores or flakes. The flaked piece class is for specimens where the definite
identification of positive or negative flake scars is impossible because of fragmentation,
weathering or encrustations. This class makes the classificatory framework exhaustive

5. A general model for reduction
87
so that all specimens can be classified as well as reducing observer bias induced by
guessing the classification of ambiguous specimens.
Statistics and Graphs
Now that the basic classes of artefacts have been defined, it is important to explain the
approach and theory relating to the exploration of relationships in the data obtained
from these classes. The focus of the analytical methods here is on continuities of
variations in the stone artefact assemblages, so it is important to have appropriate,
consistent and explicit statistical methods to describe patterns and test the predictions
of the models outlined in chapter three.
Descriptive statistics
These methods include basic statistics to describe the numerical qualities of a class or
any of its attributes. Sample size or batch size is depicted as ‘n’ and refers to the number
of observations made for any particular class or attribute. Mean is one measure of
central tendency of a sample and is calculated by the sum of measurements divided by
the number of measurements. Median is the value in the sample that is below half of
the values when they are ordered by rank. Where there is an even number of values
then the median is the average of the two middle values. The median and the mean are
both measures of the central tendency of a sample, but the median is less sensitive to
extreme values and skew than the mean. Standard deviation is a measure of the spread
or dispersion of values around the mean. It is calculated by taking the square root of
the sample variance, where variance is the sum of the squares of the differences
between a value and the sample mean divided by one less than the sample size.
Significance testing
Null hypothesis significance testing (NHST) is a widely used and conventional
approach for inferring patterns and relationship from data. However, ecologists and
psychologists have debated the usefulness of NHST as a valid approach for scientific
inference (Carver 1993, Gill 1999, Gliner et al. 2002, Johnson 1999, Shaver 1993, Thomas
2001, Thompson 2004, Vacha-Haase 2001). There has been similar concern about the
usefulness of this approach in archaeological research, but perhaps less progress
towards a better framework for inference (Chibnik 1985, Christenson 1979, Clark and
Stafford 1982, Cowgill 1977, Scheps 1982, Thomas 1978). Di Stefano et al. (2005) have
identified five main points in the debate. First is that NHST is used mechanistically as

5. A general model for reduction
88
if it was an objective rule that provided an unambiguous and rigorous answer
(Stewart-Oaten 1995). Second, NHST tends to focus effort on testing a single
uninformative null hypotheses; that there is no difference between a parameter (such
as the mean) measured on two or more samples (Anderson et al. 2000, Johnson 1999).
The reason why this is uninformative is because as sample sizes increase it is inevitable
that a test of the difference between the two samples will result in increasingly small p
values, such that a very small difference between the samples becomes a statistically
significance difference although it might not have any scientific importance (Berkson
1938, Royall 1986, Yoccoz 1991). A more informative approach would provide the
statistic for the two samples, the difference between the statistics from the two samples
and the error associated with the estimates.
The third theme in the criticism of NHST is an over-reliance on p values without
including necessary information such as effect sizes or error estimates. In their survey
of 347 journal articles published in the Journal of Wildlife Management and Ecology over
the period 1978-1999, Anderson et al. (2000) found that 47% of p values did not include
estimates of means, effect sizes or error estimates. Effect sizes are important because
they represent a standardized difference between the means of two samples or a
standardized measure of association, and have the potential to reveal whether a
statistically significant result reflects a scientifically meaningful difference rather than a
trivial difference (Maxwell et al. 1981, Maxwell and Delaney 1990). Error estimates
provide information about the degree of accuracy of a statistic, giving an estimation of
how close it is to its true value. This is important for assessing the reliability of a
comparison of two samples and the impact of sample size, for example, smaller
samples will have higher error estimates than large ones so less confidence can be
placed in the results of a significance test (Nix and Barnette 1998).
The fourth point is that the use of NHST results in uninformative and misinterpreted p
values. For example, knowing the magnitude of difference between two samples and
the accuracy of this measurement is more informative than simply knowing that they
are different, yet p values only state whether or not there is a difference. Similarly, p
values do not indicate the probability that the observed effect is due to chance, the
probability that the null hypothesis is true, the reliability of the result or effect and
error sizes (Di Stefano et al. 2005, Nickerson 2000). The p value represents the
probability of the observed data, or more extreme data, given that the null hypothesis is

5. A general model for reduction
89
true and certain other conditions hold (Johnson 2005). The final objection noted by Di
Stefano et al. (2005) is that the use of NHST has a tendency to encourage arbitrary
inferences, especially the use of 0.05 as a cut-off for significance (Johnson 1999).
In response to these five criticisms and other more philosophical objections (Gill 1999,
Nickerson 2000) some authors take an extreme view that NHST should be abandoned
entirely in favour of other approaches (Anderson et al. 2000). These other approaches
include Bayesian statistics (where rejection or acceptance of hypotheses is
fundamentally linked to previous beliefs and assumptions) and Information Theoretic
techniques (where competing models are ranked according to how well they
approximate the process that generated observed data) (Johnson and Omland 2004,
Stephens et al. 2007a).
Bayesian statistics constitute a different way of doing science, not just an alternative
statistical tool (Dennis 1996). The two distinguishing features of Bayesian methods are
the quantification of estimates of how likely each explanation is believed to be and the
input of these estimates into probabilistic models. There has been some application of
these methods in archaeological dating, chronologies and artefact seriation (Buck et al.
1996, Buck and Sahu 2000, Christen and Litton 1995, Dellaportas 1998, Halekoh and
Vach 2004). Although Bayesian methods have been encouraged because they formalise
previous beliefs and assumptions and because it gives the probability of the hypothesis
given the data (which is what researchers usually really want to know), the method is
still relatively obscure in archaeology, probably due to the difficulties of implementing
the computation (Aldenderfer 1998: 110, Baxter 1994: 222) and difficulties in
representing qualitative archaeological data as quantitative probabilities (Reece 1994).
Since this project is not primarily a computational study and the modelling is only
semi-quantitative as discussed in the previous chapter, Bayesian statistics are not a
suitable alternative to significance testing here.
Advocates of Information Theoretic (IT) techniques claim that NHST is relatively
uninformative because it tests only a single hypothesis while IT methods
simultaneously evaluates multiple working hypotheses and rank models according to
how much the goodness of fit of the models with the data (Anderson et al. 2000,
Hilborn and Mangel 1997). IT methods are philosophically attractive because of the
claims that it searches for the best model rather than the true model, the high value it
places parsimony and simplicity, its advocacy of the concept of multiple working

5. A general model for reduction
90
hypotheses and its focus on quantifying strength of evidence rather than providing
arbitrary dichotomies like NHST (Burnham and Anderson 2002). As a relatively
recently developed statistical method, there has been little formal use of model-
evaluating IT techniques in archaeology although there has been scattered employment
of more general concepts of IT analyses in assemblage diversity studies (Justeson 1973,
Kent 1992, Kintigh 1984) Although the theory underlying IT inferential procedures is
robust, the novelty of the method means that there is still uncertainly about which of
the possible model-evaluating criteria is most suitable under given conditions (Guthery
et al., Kass and Raftery 1995), how it responds to small samples sizes (Richards), what
the ‘rules of thumb’ are for interpreting differences in criteria values for competing
models (Stephens et al. 2007b) and doubt that IT techniques entirely overcome the
criticisms of NHST (Stephens et al. 2005). IT methods are easier to calculate than
Bayesian methods but have a similar requirement for fully quantitative models because
of the need for maximum likelihood estimators in IT calculations. This need for fully
quantitative inputs and the uncertainties in interpreting the results preclude IT
techniques from being suitable here.
Confidence Intervals
Having now reviewed some of the problems with NHST and the two alternatives,
Bayesian methods and IT methods, as suitable quantitative methods for comparing
samples, what options remain for alternative approaches to comparing samples?
Fortunately, critics of NHST are almost unanimous in recommending the use of
confidence intervals in place of significance tests (Cowgill 1977, Cumming and Finch
2001, Fidler et al. 2006, Gardner and Altman 1986, Thompson 1999, Thompson 2002,
Wonnacott 1987). Confidence intervals (CIs) are an established component of
conventional statistical methods that are intervals or ranges of plausible values for
some quantity or population parameter of interest; they are a set of parameter values
that are reasonably consistent with the observed sample data. Cumming and Finch
(2001) offer four reasons for using CIs. First, CIs give point and interval information
that is accessible and comprehensible, especially through the simple visual display of
data, enabling substantive understanding and interpretation. Second, there is a direct
link between CIs and NHST: noting that an interval excludes a value is equivalent to
rejecting a hypothesis that asserts that value as true — at a significance level related to
the CI percentage (usually 95%). Third, CIs are useful in the accumulation of evidence
over multiple experiments, supporting meta-analysis and meta-analytic thinking

5. A general model for reduction
91
focused on estimation. Finally, CIs give information about precision that may be more
useful and accessible than a statistical power value.
Despite the advantages of CIs over NHST and more complex approaches, they are not
yet widely used in archaeology or other disciplines (Ely 2001, Fidler et al. 2004a,
2004b), so it is necessary to explain how they are calculated and how to correctly
interpret the results and graphical depictions. Confidence intervals are most commonly
calculated at 95%, indicating the range of values that gives a 95% probability of
including the population parameter being estimated (usually the mean). The
computation uses probability theory to take account of sampling error, formally
expressed as: mean ± t x SE, where SE denotes the standard error of the mean, SD/√n,
where SD is the standard deviation and n is the size of the sample. The t value is
determined from the t-distribution according to the degrees of freedom of the sample
under investigation (calculated as n-1). The main prerequisite for the use of this
calculation is that the distribution of the sample data resembles a Gaussian, or normal,
curve (Cumming and Finch 2001). This t-based approach is not very robust under
extreme deviations from normality (Boos and Hughes-Oliver 2000).
The distribution of data from lithic assemblages, especially metric data, is not well
understood so the existence of normal distribution, a prerequisite of this approach,
cannot be assumed. Early experimental work described the size distribution of lithic
debitage produced during biface manufacture as an exponential distribution (Ahler
1986, Baumler and Downum 1989, Patterson 1990, Patterson and Sollberger 1978).
Stahle and Dunn (1982) also examined debitage from an experimental biface
assemblage of Afton projectile points, a dart point from the North American mid-
continent. Unlike Patterson, Stahle and Dunn interpreted the cumulative relative
frequencies of flake size categories as a Weibull distribution. Shott and Sillitoe (2004,
2005) have also used the Weibull distribution to model ethnographic data on stone
artefact use-life durations from highland New Guinea and reduction of an
archaeological assemblage of Palaeoindian flakeshavers from the Bull Brook site in the
northeastern United States. The Weibull distribution has some theoretical appeal
because of its usefulness as a model for analysing failure (including the fracture of
brittle solids) and death data in engineering, ecology and medicine (Iii et al. 1978).
However, Shott’s archaeological example only included a single kind of artefact and
Stahle and Dunn (1982) were not able to use the Weibull distribution to accurately

5. A general model for reduction
92
model assemblages of a mixture of flakes from a variety of biface reduction stages.
Since most lithic assemblages are palimpsests, a mixture of reduction stages and
different artefact forms is more likely to reflect archaeological reality.
For mixed lithic assemblages Shott (1994) suggested that artefact size distributions
could be modelled by the log skew Laplace function because this function has been
successfully used to model particle sizes of complex mixed cave sediments (Fieller et
al. 1992a, 1992b). Unfortunately Shott does not present any detailed empirical results of
using the log skew Laplace function so it is difficult to evaluate its usefulness. Similarly
inspired by research in engineering and geology, Brown (2001, Brown et al. 2005) has
argued that fractal distributions are appropriate and useful for size-frequency
distributions of lithic debitage. Fractal models have been successfully applied to
analyse the fragmentation of rocks and soils (Borodich 1997, Perfect 1997). These
models are well developed in geology and geophysics, with many natural phenomena
exhibiting fractal distributions (Radlinski et al. 1999, Turcotte 1997). Brown (2001)
found that ten previously published experimental lithic assemblages could be
modelled as fractal distributions, as well as six archaeological assemblages from Late
Postclassic Mayapan in Mexico. In these assemblages the fractal dimension closely and
systematically corresponded to the degree of assemblage reduction. However, Brown
also noted that many other assemblages from Mayapan approximated a normal
distribution and he attributed this to floor cleaning and re-deposition of lithic debris.
The diversity of probability distributions that have been proposed to model lithic
debitage suggests that variation across different lithic technologies cannot be robustly
described by a single distribution. None of the distributions appear to have properties
that maintain their robustness when recovery techniques vary, for example when
different sized sieves are used or when artefacts are identified by people with different
levels of skill. However, the four proposed distributions reveal two important general
features of lithic assemblages. First, is the obvious detail that they are generally not
Gaussian or normal (with the exception of a those noted by Brown (2001)), so the
conditions for employing traditional hypothesis tests (such as the chi-square and t-
tests) and the common CI calculation are not satisfied. Second is that these
distributions reflect the typically skewed shape of the sample distribution, where most
values cluster to the lower extreme of the sample’s size range.

5. A general model for reduction
93
The textbook correction for the non-normality and skewness is the use of
transformation functions such as taking the square root, inverse or logarithm of the
sample values (Drennan 1996: 56-59). Transformation is a versatile and robust method
for preparing data for statistics requiring a normal distribution but is inappropriate for
some distributions, such as those with multiple modes. There have been some claims
that transformations are problematic because very sensitive to variations in the
minimum values of a sample (Osborne 2002), they make confidence intervals difficult
to interpret because they standardise the variances of samples (Bland and Altman
1996) and testing the mean on transformed scales is not always equivalent to testing on
the original scale (Zhou et al. 1997). These claims do not invalidate transformation as a
statistical method (a common transformation, the Z-score is used in this project), but
the overall approach chosen here explores an entirely different approach to statistics
based on theoretical distributions, which is what transformations are often preparation
for.
Bootstrap methods
In this situation where confidence intervals are desired but the sample distribution is
unknown and transformations are undesirable, computer-intensive resampling
methods such as the bootstrap can be used in place of classical mathematical methods
(Diaconis and Efron 1983, Efron and Tibshirani 1991). Classic mathematical methods
rely on theoretical distributions, which require strong assumptions of both the sample
and the population. When these assumptions are not met, computer-intensive
resampling methods can replace analytically difficult or ambiguous distribution
theory. The basic idea of the bootstrap is that the distribution of the observed data is
the best guide to the distribution of the population from which that data derives. The
bootstrap is thus a ‘distribution free’ method because it does not depend on the
distribution of the sample data resembling a known distribution. Point values and
estimates are then calculated from a distribution generated out of the observed data
(Boos 2003).
Bootstrapping consists of a few simple steps repeated a large number of times. First,
random sample values are taken or ‘resampled’ from the original set of observed data
to create a new set the same size. The values in the original set are usually denoted as
(x1, x2,..., xn) and the new set as (x1*, x2*,..., xn*). The new set of values is known as the
‘bootstrap sample’. The randomly sampled values from the original set of observed

5. A general model for reduction
94
data are ‘replaced’ back in the original set after they are sampled, this means it is
possible that one value might appear multiple times in the bootstrap sample even
though it only appears once in the original sample. The statistic of interest, such as the
mean, median, correlation coefficient or any other function (usually denoted as 𝜃 or
theta-hat and the corresponding parameter of the population is simply 𝜃 or theta) is
then calculated on the bootstrap sample (that statistic from the bootstrap sample is
represented as 𝜃∗ or theta-star). The two steps of random resampling with replacement
and calculating 𝜃∗ on the resulting new sample are then repeated a large number of
times, usually 1000 or more so that there are 1000 or more values for 𝜃∗, this is known
as the sampling distribution of 𝜃∗.
The recommended number of repetitions varies from 25 upwards (Efron and
Tibshirani 1993) and a number of rules have been proposed for determining the
necessary number (Booth and Hall 1994, Hall 1986). However, Chernick (1999: 114)
suggests that debates about numbers less than 5000 are irrelevant because of the
ubiquity and speed of modern computers. A practical approach suggested by
Lunneborg (2000) is that the number of repetitions be incremental increased until
successive SE estimates of (x1*, x2*,..., xn*) vary by less than 1%. These large numbers of
repetitions are quickly and easily accomplished by modern desktop computers, but
early investigations into the bootstrap occurred in the 1970s when computing resources
were not as powerful or affordable, so the bootstrap was considered a ‘computer-
intensive’ method in comparison to classical mathematical methods using lookup
tables (Efron 1979). In the calculations performed here and in the following chapters,
10,000 repetitions were conducted for all implementations of the bootstrap.
Once the sampling distribution is obtained then confidence intervals can be calculated
to represent the accuracy of 𝜃∗. Because of its conceptual simplicity and its freedom
from restrictive assumptions the bootstrap is popular amongst statisticians for
calculating CIs. As a result of this popularity a daunting variety of different bootstrap
methods have been developed for calculating CIs (DiCiccio and Efron 1996, Diciccio
and Romano 1988, Efron 1987). The simplest bootstrap method is percentile CI, where
the values of 𝜃∗ are ordered from smallest to largest and then the 𝜃∗ values at the 2.5th
and the 97.5th percentiles are taken as the upper and lower limits of the 95% CI. This
method is appealing because of its clarity and simplicity (Wood 2004). However, the
percentile bootstrap does not work well for small samples or skewed distributions

5. A general model for reduction
95
(Chernick 1999: 53, Manly 1997: 50, Shao and Tu 1995: 132, 166) and Hall (1988) offers
theoretical arguments against the use of percentile methods. Similarly, empirical
simulation studies comparing alternative bootstrap methods show that the percentile
method is less accurate than other bootstrap methods (Hoyle and Cameron 2003,
Kelley 2005, Ukoumunne et al. 2003). This means that percentile CIs will include the
true value of the unknown parameter less often than 95% and will include more
erroneous values of the unknown parameter than is desirable (Good 2005: 90).
The relative newness of bootstrap methods means that they are still evolving and there
are currently no clear reasons for favouring one method over another. In this context,
two criteria can be introduced to aid in choosing between the numerous other
bootstrap methods for producing CIs. First is to focus on methods with demonstrated
suitability for skewed distributions that resemble the size-frequency distributions
noted above for lithic assemblages. Second is to prefer less mathematically complex
methods to keep implementation of the method straightforward and preserve the
conceptual appeal of the bootstrap as a robust but simple method for non-normal data.
Hoyle and Cameron (2003) compare six different methods for calculating
nonparametric bootstrap confidence intervals on estimates of recreational fishing
catches obtained from telephone and diary surveys. This data is highly skewed with
most respondents reporting a small catch size and just a few reporting large catches.
The six methods were normal bootstrap (where the SD of the bootstrap distribution is
the estimate of the sample SE and then used for common CI calculations), two
percentile bootstrap methods, bias corrected bootstrap (a variation of the percentile
method that adds a correction derived from difference between 𝜃 and 𝜃∗), bias
corrected and accelerated bootstrap (a variation of the percentile method that corrects
for skewness by introducing a constant) and bootstrap-t (where the bootstrap
distribution is of a statistic that is a ratio of the random variable to its SE). The
simulation was based on 4000 sub-samples of 100 values (catch sizes) taken from a total
of 2844 values and each of the 4000 sub-samples was resampled 4000 times to generate
the bootstrap distribution according to one of the six methods. The results of the
simulations were then compared to the sample of 2844 values to see how well the
simulated CIs represented the catch rate and total catch sizes of the larger sample.
Their results showed that the bootstrap-t method produces the most correct and least

5. A general model for reduction
96
biased coverage, with the skewness of the data handled poorly by the other methods
(Hoyle and Cameron 2003: 104).
Zhou and Dinh (2005) conducted simulations calculating CIs on log-normal and
gamma distributions to test the performance of normal (non-bootstrap) t, bootstrap-t,
bias corrected and accelerated bootstrap and three methods of transforming the normal
t statistic. Like the data used by Hoyle and Cameron (2003), the log-normal and gamma
distributions are highly skewed. They created CIs using the different methods for 27
variants of the log-normal distribution and 28 variants of the gamma distribution,
running 10,000 simulated samples for each variant (to keep sampling variation small)
and 1000 bootstrap samples for each generated dataset. Zhou and Dinh (2005) found
that the bootstrap-t and two of the three transformation methods gave similar results
and better coverage than the bias corrected and accelerated bootstrap. Similarly, Manly
(1997: 66-68) examined the performance of the same seven bootstrap methods tested by
Hoyle and Cameron (2003) on a computer-generated pseudo-random sample of 20
values with an exponential distribution. Each of the seven methods was used to find
95% CIs of the mean using 1000 bootstrap replications from the sample of 20 values. He
found that the bootstrap-t method provided the best coverage of the true 95% CI. The
bootstrap-t CI coverage was 95.2% with the coverage of the next best method, the bias-
corrected and accelerated method, at 92.4%.
These simulations are far from the final word on which bootstrap method is
definitively superior, but they suggest that the bootstrap-t method outperforms other
methods for skewed sample distributions. Other empirical studies show that the CIs
from bootstrap-t methods perform well in terms of coverage accuracy compared to
other bootstrap methods in more general situations (Canty et al. 1996, Davison and
Hinkley 1997: Example 5.7 and Section 5.7, Hall 1988, Shao and Tu 1995: Section 4.4.4,
Ukoumunne et al. 2003). Hall (1989) has also used theory to demonstrate that
bootstrap-t has exceptionally good CI coverage properties for regression functions.
However, it has also been noted that bootstrap-t methods can give unstable and wide
CIs when complex functions and small samples are involved (Efron and Tibshirani
1993: 162, Kilian 1999).
The success of the bootstrap-t is encouraging because it is second in simplicity to the
simple percentile method CI, while the other bootstrap methods are considerably more
complex (Chernick 1999: 59, Manly 1997: 65). Although the case that has been made
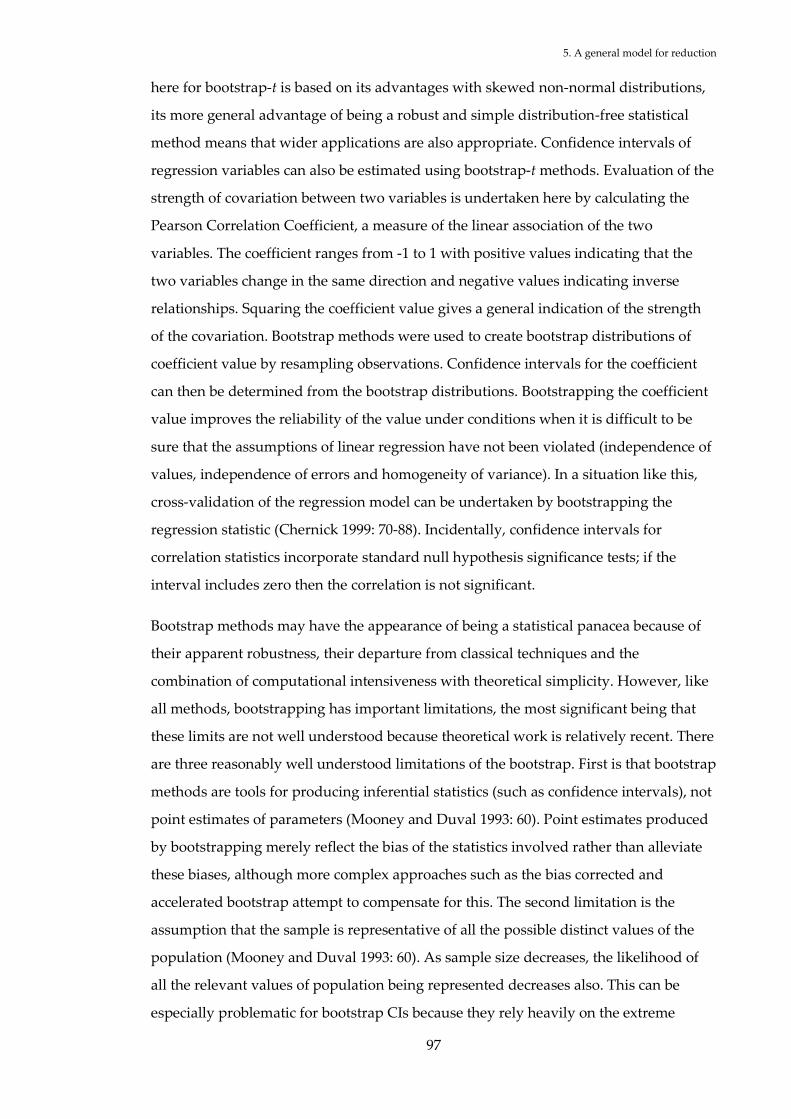
5. A general model for reduction
97
here for bootstrap-t is based on its advantages with skewed non-normal distributions,
its more general advantage of being a robust and simple distribution-free statistical
method means that wider applications are also appropriate. Confidence intervals of
regression variables can also be estimated using bootstrap-t methods. Evaluation of the
strength of covariation between two variables is undertaken here by calculating the
Pearson Correlation Coefficient, a measure of the linear association of the two
variables. The coefficient ranges from -1 to 1 with positive values indicating that the
two variables change in the same direction and negative values indicating inverse
relationships. Squaring the coefficient value gives a general indication of the strength
of the covariation. Bootstrap methods were used to create bootstrap distributions of
coefficient value by resampling observations. Confidence intervals for the coefficient
can then be determined from the bootstrap distributions. Bootstrapping the coefficient
value improves the reliability of the value under conditions when it is difficult to be
sure that the assumptions of linear regression have not been violated (independence of
values, independence of errors and homogeneity of variance). In a situation like this,
cross-validation of the regression model can be undertaken by bootstrapping the
regression statistic (Chernick 1999: 70-88). Incidentally, confidence intervals for
correlation statistics incorporate standard null hypothesis significance tests; if the
interval includes zero then the correlation is not significant.
Bootstrap methods may have the appearance of being a statistical panacea because of
their apparent robustness, their departure from classical techniques and the
combination of computational intensiveness with theoretical simplicity. However, like
all methods, bootstrapping has important limitations, the most significant being that
these limits are not well understood because theoretical work is relatively recent. There
are three reasonably well understood limitations of the bootstrap. First is that bootstrap
methods are tools for producing inferential statistics (such as confidence intervals), not
point estimates of parameters (Mooney and Duval 1993: 60). Point estimates produced
by bootstrapping merely reflect the bias of the statistics involved rather than alleviate
these biases, although more complex approaches such as the bias corrected and
accelerated bootstrap attempt to compensate for this. The second limitation is the
assumption that the sample is representative of all the possible distinct values of the
population (Mooney and Duval 1993: 60). As sample size decreases, the likelihood of
all the relevant values of population being represented decreases also. This can be
especially problematic for bootstrap CIs because they rely heavily on the extreme

5. A general model for reduction
98
values in the tails of the sample distribution. However, experimental data reported by
Mooney and Duval (1993) indicates that the asymptotics that the bootstrap relies on
improves accuracy before the central limit theorem does during multiple runs with
incremental increases in sample size. Like Chernick (1999: 150), they found that
bootstrap CIs outperformed parametric intervals on a variety of tests with small
samples (n = 14-50). Finally, the third significant limitation of bootstrap is that the
sample reflects a random sample from the population. The theoretical justification of
the bootstrap depends on the assumption that the empirical distribution of the sample
is a good estimator of the population distribution (Mooney and Duval 1993: 60). If the
validity of this assumption is threatened by data that was not collected using simple
random sampling then more complicated adjustments need to be made to the
bootstrap method. These limitations are less restrictive than traditional methods based
on known distributions, but they indicate that careful substantive reasoning remains
necessary for the appropriate application of bootstrap methods.
In the results of stone artefact analyses that follow, the bootstrap-t method was used to
calculate 95% CI on various statistics such as the mean and correlation coefficient.
Results are expressed as a point value with the 2.5th percentile and 97.5th percentile in
square brackets following the point value. A number of software implementations of
bootstrap methods are available, including several for Microsoft Excel (Christie 2004,
Good 2005, Meineke 2000, Wood 2005). This would be the simplest technique but the
performance of the Excel’s random number generator in standard tests of randomness
has been criticised as inadequate (McCullough and Wilson 2005). The quality of
random number generation is important because bootstrap methods rely heavily on
random numbers to resample the original sample. Instead, the S-Plus Resample
Library for S-Plus 8.0 was chosen as the most suitable implementation with the
advantage of having a built-in routine for bootstrap-t CIs and bootstrapping regression
CIs (Insightful Corporation 2002). In the S-Plus implementation the bootstrap-t CIs of
sample means, for example, are determined by (1) calculating the means and standard
deviations for each column of the original data and bootstrap samples, (2) calculating
the t statistic for each bootstrap sample: (bootstrap means - means of original
data)/(bootstrap standard errors), (3) calculating quantiles of the bootstrap distribution
of the t statistic (4) inverting those quantiles to obtain confidence limits. This bootstrap-
t procedure is similar for other statistics.

5. A general model for reduction
99
Graphical representations
Three major forms of graphical representations of data are used here for the visual
display of quantitative information about patterns and relationships between variables.
First are dot charts, where one or more variables are depicted (usually on a common
continuous measurement scale) across multiple categories (usually positioned on the y-
axis). Values on dot plots are judged by their position along the horizontal axis (cf.
Figure 8.1). These are a less familiar form of graph that are advocated by Cleveland
and McGill (1984a, 1984b, 1985) as a replacement for more common bar charts.
Cleveland and McGill’s (1985, 1987) experiments on the visual perception of
information encoded in graphs demonstrated a hierarchy in the accuracy of decoding
for different forms of graphs. They found that points positioned along a common scale
(such as the dot chart) are consistently interpreted most accurately, while graphs based
on length and area (such as bar graphs) are harder to compare visually and interpret
accurately. Other advantages resulting from the emphasis on points positioned along a
common scale is that they do not require a zero baseline as bar charts do and they have
a highly efficient ratio of data to ink because most of the ink in the graph is non-
redundant ink arranged in response to variation in the numbers represented (Gillan
and Richman 1994, Tufte 1986).
The second form of graph is the confidence interval graph which plots several kinds of
statistical information in a single graph (cf. Figure 5.3 for example). The vertical lines
indicate the region of the 95% confidence interval for the mean values of each category
on the x-axis. The mean value is depicted as a point on the CI line. These graphs show
the direction and magnitude of changes in the values of point estimates between
categories. They also allow comparison of shape of the distributions of measurements
of some variable for different categories. A special feature of 95% CI graphs is that they
have a direct link to familiar null hypothesis significance tests, as noted above
(Cumming and Finch 2001). For example, the values of points in the region of the CI
give p values of >0.05 for the null hypothesis and points outside of the CI give p values
of <0.05. When comparing two or more CIs, it is possible to determine p values from
the lengths and overlap of the CI lines. Cumming and Finch (2005) offer a rule of
thumb for reading p values from 95% CI graphs: when n > 10 (they can be quite
different) and CI lengths do not differ by more than a factor of two, an overlap of 0.5 of
the CI length for two independent categories results in p ≈ 0.05 and when the CI lines

5. A general model for reduction
100
touch but do not overlap, p ≈ 0.01. This feature supports quick visual inference without
relying on arbitrary p values.
The third major form of graph is a conventional time series graph. In these graphs the
horizontal axis represents time values (such as thousands of years) and the vertical axis
represents a value that is being examined for change over time (for example, Figure
6.8). A variety of common bar, line and dot charts are also used throughout.
Quantifying lithic reduction
Numerous studies have documented general measures of core reduction in
assemblages showing that core reduction exerts considerable influence upon various
attributes of lithic assemblages (Dibble et al. 1995). Analysis of Eurasian assemblages
show that as core reduction increases, the number of blanks per core and extent of core
preparation also increase (Bar-Yosef 1991, Marks 1988, Montet-White 1991). Similarly,
as core reduction increases in Eurasian assemblages, average core size, flake size, flake
platform area, and cortex area on the cores and flakes decrease (Henry 1989, Marks et
al. 1991, Newcomer 1971). Studies of Hoabinhian assemblages make limited use of
these general indicators of core reduction intensity (Reynolds 1989, 1992, Shoocongdej
2000, White and Gorman 2004). These indicators are used only as assemblage
descriptors while the overall assemblage interpretation is still based on typological
analyses (Shoocongdej 1996b). The limited use of these core reduction indicators in
Hoabinhian assemblages may be because there has been little experimental work to
demonstrate their relevance.
In addition to measuring core reduction, a variety of methods have been developed for
quantifying flake reduction for assemblages around the world (Clarkson 2002, Dibble
1987, Kuhn 1990). These methods are based on flake cross-section geometry, flake
retouch perimeter, flake retouch height, flake retouch invasiveness, flake allometry and
typological comparisons. These methods have been examined in detail by Hiscock and
Clarkson and they conclude that the flake retouch height and invasiveness
measurements are the most effective metrics (Clarkson 2002, Hiscock and Clarkson
2005a, 2005b). Unfortunately most of these methods are poorly suited for analysing
Hoabinhian assemblages because these assemblages typically have very low
proportions of retouched flakes and few or no artefact forms with clear discontinuities
in morphology and size (Matthews 1964, Reynolds 1989, 1992, Shoocongdej 1996a,
White and Gorman 2004). A customised and standardised method for measuring

5. A general model for reduction
101
reduction in Hoabinhian assemblages would provide the necessary data for comparing
relative reduction intensity within and between assemblages from different contexts.
Previous contributions towards understanding Hoabinhian technology
The method proposed here builds on three previously published studies of Hoabinhian
lithic reduction. First, White and Gorman (2004) analysed variation in technological
variables of flakes from Tham Phaa Can in northwest Thailand. Their study
demonstrated that two sequences of flake production could be discerned in the
assemblage, and that the conventional assumption of the Hoabinhian as an amorphous
technology requires rethinking. White and Gorman’s study is significant because it is
the first to consider the analytical potential of Hoabinhian flake technologies rather
than core and tool typologies. A second technological study is Reynolds’ (1989)
analysis of a small assemblage of lithics (n = 385) from Tham Khao Khi Chan
rockshelter in southern Thailand, where he produces a typology based on
technological attributes of flakes and cores. He makes some brief observations about
the ratio of cores to flakes and flake dorsal cortex types (primary, secondary and
tertiary) as indicators of reduction intensity. The main limitation of these two studies is
that they do not supply an interpretative framework to link the descriptions of flake
technology to an explanation of human behaviours.
In his comparison of core and flake attributes from two cave assemblages from
northern Vietnam, Nishimura (2005) similarly focuses on the technological attributes of
flakes. He arbitrarily defines a series of flake attributes as indicators of expedient or
curated assemblages and interprets assemblage variation as a direct reflection of
frequency of site use. The more expedient assemblage (Bung rockshelter) is interpreted
as a temporary camp and the more curated assemblage (Xom Trai) as a base camp that
was more frequently visited. Nishimura suggests that the intensity of site use may be
explained by the environmental context of the sites, since he considers Xom Trai to be
in an ecologically richer location than Bung rockshelter. This interpretation associating
expedient technology with low frequency of site occupation is difficult to reconcile
with ethnographic and ethnoarchaeological work indicating that expedient artefacts
are usually associated with longer durations of site occupation (Kelly 1995, Parry and
Kelly 1987) and the provisioning of places rather than of mobile individuals (Kuhn
1995).

5. A general model for reduction
102
An experimental approach to quantifying Hoabinhian reduction
These descriptions of previous studies suggest that there is still a pressing need for
robust measures of Hoabinhian assemblage reduction. Shocoongdej (1996a) has noted
that the lack of systematic lithic production experiments using river cobble material in
Southeast Asia makes it difficult to measure assemblage reduction with confidence. In
an attempt to help assuage this problem, the experiment described here was designed,
following Amick et al. (1989), with two objectives in mind. First, to observe how a large
number of flake variables change over the course of core reduction, and second, to
identify the most responsive variables for use in archaeological analysis.
A simple experiment was designed to record changes in 28 metric and technological
variables of flakes struck by the author from 30 river cobbles by hard-hammer
percussion. Cobbles of a variety of different sizes and shapes were collected from the
Lang River, adjacent to the Tham Lod rockshelter archaeological site in northwest
Thailand (Shoocongdej 2004). The raw materials of the cobbles were orthoquartzite (n =
25), sandstone (n = 3) and andesite (n = 2). These raw materials have similar mechanical
properties and were not separated for analysis. Detached pieces over 5 mm with
unambiguous positive scars (having evidence of a bulb of percussion or bending
initiation) were recorded as flakes. The order of each flake was recorded as they were
struck and flaking continued until flakes could no longer be detached using freehand
percussion. Although the cores are not discussed here, core mass was recorded after
each flake detachment and the final state of the core was also recorded.
The experimental cobble reduction was carried out in order to create a variety of
typical Hoabinhian typological forms (cf. Colani 1927, Forestier et al. 2005), simulating
a range of possible reduction sequences, until the cobble could no longer be held for
flaking. Although it is difficult to generalise about typical Hoabinhian assemblages
because the number of well-described assemblages is small and many pieces are
unretouched and amorphous (especially flakes), they have historically been
characterised by the presence of sumatraliths (ovoid cobbles flaked unifacially and
invasively around the entire circumference), short axes (sumatraliths broken along the
short axis of the cobble) choppers (ovoid cobbles flaked unifacially and invasively
along half of its circumference following the long axis of the cobble) and other
variations of unifacially flaked cobbles. Bifaces are rare in Hoabinhian assemblages
from mainland Southeast Asia but they have been described from the Malay Peninsula

5. A general model for reduction
103
and island Southeast Asia (Bulbeck 2003). To date there is no convincing evidence of
systematic reworking of retouched tools and the preparation of core forms for
standardised products in Hoabinhian assemblages.
This experiment was undertaken at the same time and place as the collection of data
from the stone artefact assemblage at Tham Lod (described in chapter eight), so the
experimental flaking was modelled on the range of cores and flakes found in this
archaeological assemblage as well as those described in publications of other sites (e.g.
Forestier 2000, van Heekeren and Knuth 1967). Moser (2001) observes that Hoabinhian
flakes are produced by hard hammer percussion, so cobbles were used here as
hammerstones. After a core was completely reduced, every flake was given an
individual percentile ranking reflecting its position in the sequence of all flakes
removed from that core. To analyse the data, flakes from all 30 cores were ordered
together by their individual percentile ranking and then arbitrarily divided into ten
ranked classes to form a continuum of reduction intensity from early reduction (1) to
late reduction (10). This means that all cores and therefore a variety of reduction
sequences contributed flakes to each of the ten ranks of the reduction intensity
continuum. The raw data from this experiment are available by contacting the author
via the Department of Archaeology and Natural History, Research School of Pacific
and Asian Studies, The Australian National University.
Results of the experiment
The thirty cobbles produced a total of 625 flakes and 159 flaked pieces. The average
number of flakes per cobble is 21 with a maximum of 72 and most cobbles producing
less than 30 flakes (Figure 5.1, Figure 5.2). Figure 5.2 shows two modes in the
distribution of the numbers of flakes per core. The first mode indicates that most cores
produced less than the average number of flakes, with 11 cores producing between two
and eleven flakes. A second mode occurs at about 36 flakes per core. The two cores
producing 66 and 72 flakes each are considered to be outliers.
As a first step to understanding how flake morphology and attributes vary through the
reduction sequence, a series of basic attributes are examined here. A simple model of
reduction intensity of flaked cobble assemblages can be employed to generate
predictions about which variables are most likely to reflect reduction. The geometry of
the ovoid cobbles typical of Hoabinhian assemblages suggests that variables relating to
dorsal cortex and dorsal flake scars are likely to have simple linear or curvilinear

5. A general model for reduction
104
relationships with reduction intensity. Interior platform angle and overhang removal
are also likely to be related to reduction because they are sensitive to the size and
inertia of the core. Flake mass is unlikely to correlate with reduction intensity because
the oblate spheroid geometry of the cobbles will probably result in short early
reduction flakes made by acute, glancing blows on the perimeter of the cobble,
followed by mid-reduction flakes that are as long as the maximum thickness of the
cobble and finally followed by late-reduction flakes that are small because most of the
mass of the cobble has been already removed. The following analyses test these
predictions of this simple model.
Mass
Flake mass is used as a general measure of flake size and has been observed as a
reliable indicator of reduction for biface manufacture (Amick et al. 1988, Magne and
Pokotylo 1981). For this experiment, flake mass does not significantly vary according to
the extent of reduction (r = 0.017 [-0.036, 0.071]) and is not a useful reduction indicator.
Maudlin and Amick (1989) also observed that size variables were poor indicators of
reduction and suggested it was probably because of the small flakes that are
continuously produced throughout the reduction process. In this case the oblate
spheroid model appears to be a good explanation of the distribution of flake lengths.
Overhang removal
Overhang removal (OHR), also known as platform trimming or platform preparation,
is defined here as the presence of a series of overlapping small (an arbitrary scar length
of <15 mm is used here) step-terminated flake scars initiated from the platform surface
onto the dorsal surface of a flake (Clarkson and O'Connor 2005). These scars are often
interpreted as the removal of a lip left on the platform by earlier flake removal and are
presumably generated to maintain a certain core morphology for the predictable
removal of flakes as core size decreases and platform angles increase (Clarkson and
O'Connor 2005). In this case however OHR was also noted to occur as a result of
accidental platform edge shattering as well as platform maintenance, suggesting that it
results from both intentional and unintentional behaviours. As predicted, this
experiment shows a strong and significant positive correlation between the presence of
OHR and increasing intensity of cobble reduction (r = 0.892 [0.698, 1.085] Figure 5.3).

5. A general model for reduction
105
Interior platform angle
As suggested by the model, the increase in the percentage of flakes with OHR is
probably a result of shifting core geometry and size as flake removal progresses.
Interior platform angle (IPA) was measured on flakes as the angle between the striking
platform and the ventral surface with a goniometer. Despite a number of studies of
platform angles showing that it is difficult to measure reliably (Dibble and Bernard
1980), in this experiment there is a significant correlation between IPA and extent of
reduction (r = 0.307 [0.231, 0.368]). The IPAs of the early reduction flakes are typically
less than 90 and then in the later stages of reduction the values cluster around 90-100
(Figure 5.4). The 90-100 values are probably asymptotic because it is difficult to
remove flakes at higher angles without risking aberrant hinge and step terminations
that alter the morphology of the core’s free face and reduce its useful life (Macgregor
2005, Whittaker 1994). An interesting result of this experiment is that the increasing
percentage of OHR and the increasing IPA appear to be directly linked. Increases in
flake IPA result in more acute platform angles on the core, creating lips on the platform
that are removed when the core is prepared for another flake removal, leaving traces of
OHR.
Percentage of dorsal cortex
The amount of cortex (the skin on the outer surface of the cobble formed with chemical
or mechanical weathering) on the dorsal surface of a flake is another important
indicator of an assemblage’s extent of reduction (Cowan 1999, Morrow 1984, Odell
1989). The popularity of this variable is based on the simple assumption that flakes
with a high percentage of cortex come from the outer surface of the core and once that
outer surface has been completely removed, all subsequent flakes will be noncortical.
Thus, the model predicts that the more extensive the core reduction, the higher the
proportion of noncortical flakes in an assemblage (cf. Dibble et al. 2005). In this
experiment the percentage of flake dorsal cortex (measured in intervals of ten percent
for each flake) is significantly correlated with the extent of cobble reduction (r = -0.491
[-0.551, -0.429]). The mean percentage of dorsal cortex for the experimental assemblage
is 25% and the standard deviation is 32%. Although there is a good statistical
correlation for the overall reduction sequence, Figure 5.5 shows that dorsal cortex is
most sensitive to variation in the early stages of core reduction. In the later half of the
reduction process the average percentage of dorsal cortex is low but the small variation

5. A general model for reduction
106
between the later stages suggests the influence of some stochastic effects. These results
support the predictions of the model and corroborate those of earlier studies
suggesting that cortex percentage is most useful as an indicator of early reduction
(Dibble et al. 1995, Dibble et al. 2005, Magne and Pokotylo 1981, Mauldin and Amick
1989).
Dorsal flake scars
Closely related to the percentage of dorsal cortex is the number of flake scars on the
dorsal surface of flakes. In this experiment the number of flake scars per flake ranged
from 0 to 8 with a mean of 1.72. The number of dorsal flake scars per flake is
significantly correlated with reduction intensity (r = 0.308 [0.239, 0.377], Figure 5.6).
However, Maudlin and Amick (1989) note that dorsal flake scars can also be highly
correlated with flake size and in this case the correlation with flake mass is stronger (r =
0.424 [0.344, 0.503]) than the correlation with reduction intensity. On the other hand,
there are weak but significant correlations between standardised numbers of flake
scars per flake and reduction intensity (standardised by dividing by mass or by flake
surface area, mass: r = 0.193 [0.125, 0.261], flake surface area: r = 0.293 [0.221, 0.360]).
Figure 5.6 suggests that this variable becomes asymptotic as reduction increases,
probably because the constant size of flakes limits the maximum number of visible
flake scars to about two. These results provide only equivocal support for the model’s
predictions, suggesting that the number of dorsal flake scars may be a less reliable
indicator of reduction intensity than the other variables discussed here.
Dorsal cortex location
Nishimura (2005) has suggested that the location of dorsal cortex in flakes in
Hoabinhian assemblages in northern Vietnam may indicate stages of tool making. He
noted that early stages are characterised by flakes with 100% dorsal cortex (primary
flakes) and flakes with a crescent-shaped distribution of dorsal cortex (cortex extending
from the platform, around one margin and contacting the distal end). He notes that the
later stages of ‘resharpening or otherwise rejuvenating an edge *on a core tool+’ results
in flakes with cortex on the distal end of the flake and flakes without any dorsal cortex
(tertiary flakes) (cf. Jeremie and Vacher 1992, Nishimura 2005). This cobble reduction
experiment demonstrates that Nishimura’s four classes (Figure 5.7) are an exhaustive
classification because they describe more than 98% of flakes (Figure 5.8).

5. A general model for reduction
107
Cortex location has been used to distinguish between multidirectional core reduction,
bifacial reduction and dart production (Tomka 1989) but does not appear to have been
systematically investigated as an indicator of reduction intensity. This experiment
shows that numbers of flakes with 100% cortex and crescent patterned cortex
significantly decrease as reduction continues while numbers of flakes with distal cortex
and no cortex increase significantly (Table 5.1). Table 5.1 also shows that the four
classes are relatively insensitive to flake size, making them more reliable indicators of
reduction than counts of dorsal flake scars. Figure 5.9 shows how the majority of flakes
change from primary to tertiary very early in the reduction process, supporting the
earlier observation that major changes in dorsal cortex occur during the early stages of
reduction. The important detail in this figure is that it shows the middle stages of
reduction can be identified in the region with <10% crescent-pattern flakes and >20%
distal-patterned flakes. The usefulness of these two flake classes as indicators of mid-
reduction is also indicated by their good correspondence with two other reliable
indicators of reduction intensity, dorsal cortex percentage (Figure 5.10) and IPA (Figure
5.11).
The reason that these flake classes are good indicators of reduction is probably because
unifacial cobble reduction typically begins with removal of primary and crescent-
patterned flakes as flakes are removed from the circumference of the cobble, followed
by the appearance of distal-pattered flakes as flake removal begins to overlap previous
scars around the circumference of the cobble and invade towards the centre of the
cobble. Distal-patterned and tertiary flakes become more abundant when flake removal
is increasingly invasive and core rotation increases so that flake scars intersect with
previous scars.
Although this four class system has yet to be used to interpret any archaeological
assemblages, it can be shown to have some advantages over other methods of
recording dorsal cortex. Firstly, the four class system has stronger correlations with
reduction intensity (Table 5.1) and weaker correlations with flake size than the popular
primary-secondary-tertiary system (secondary flakes and reduction intensity: r = -0.232
[0.161, 0.303], secondary flakes and flake mass: r = 0.265, [0.200, 0.341]).
Secondly, Sullivan and Rosen (1985) note that the primary-secondary-tertiary system is
problematic because of false assumptions and inconsistent definitions across different
analysts. Although all the analyses presented here were undertaken by a single person,

5. A general model for reduction
108
the wider utility of this method for other analysts and projects with multiple analysts
can be evaluated by an inter-observer error experiment. To assess the level of inter-
observer reliability available with the four flake classes a series of simple blind tests
were undertaken. Ten people with a range of experience in lithic analysis classified
thirty flakes into the four cortex classes plus an ‘other’ category. Their results were
compared to the author’s and the average difference was 10.6%. Two of the more
experienced participants had no errors in their classification, suggesting that with more
training and familiarity, error levels can be very low or zero. These results mean that
inter-observer error in the use of these four classes is relatively low (cf. Clarkson 2002)
and unlikely to be greater than other measurements (Fish 1978).
Finally, the distal cortex class provides valuable resolution for the later stages of the
reduction process. Although flakes with distal cortex have a low correlation with
overall reduction (Table 5.1), they are useful markers of intensive reduction because
they are most abundant in the second half of the reduction process, compared to
tertiary flakes that become abundant relatively early in the reduction process. This
feature of the distal cortex flakes is especially relevant in assemblages where flakes are
transported out of the assemblage or partially worked cores are introduced and
reduced further so that the proportions of primary and tertiary flakes no longer
accurately represent the extent of reduction occurring at the site.
Cores
The initial masses of the 30 cores ranged from 190 g to 1737 g with an average mass of
735 g. The final masses ranged from 92 g to 1040 g with a mean of 316 g. The
percentage mass lost during flaking ranged from 5% to 81% with a mean of 54%. There
is a moderate positive correlation between initial nodule mass and final core mass (r =
0.673, [0.413, 0.932]). This suggests that although the end points of the cores were
determined by when they could no longer be held for flaking, this quality is not readily
identifiable as a threshold minimum core mass (which would be expected to produce a
distribution with most points close to an asymptote). It is likely that in addition to an
inertia threshold below which the material is not suited to freehand reduction – in this
case probably at about 100 g – the geometry of the core also influences core use-life
duration.
As expected, larger cores tend to produce more flakes. However initial core mass
appears to have only weak positive correlations with the amount of flakes produced,

5. A general model for reduction
109
with the correlation between initial nodule mass and flake count at r = 0.488 [0.102,
0.875]. The correlation between final core mass and flake count is 0.162 [-0.176, 0.502],
suggesting that final core mass is a poor indicator of the productivity of the core prior
to discard. Similarly, change in core mass is weakly correlated with flake productivity
(r = 0.162 [-0.166, 0.503],). Change in core mass is also weakly correlated with initial
core mass (r = 0.254 [-0.132, 0.641]). These consistently weak correlations suggest that
final core mass gives little insight into the life of the core before discard (cf. Braun et al.
2005). This highlights the importance of data from flakes in accurately understanding
lithic reduction in Hoabinhian assemblages.
Discussion
This experiment was designed to reproduce the particular qualities of Hoabinhian
assemblages, especially the unifacial circumferential, centripetal reduction of ovoid
cobbles (Forestier 2000). The results presented here support the predictions of a simple
model of assemblage reduction and suggest that there are a number of simple
technological attributes of flakes that are robust indicators of the intensity of reduction
in Hoabinhian lithic assemblages. Analysis of the experimental data showed that the
most important variables for measuring reduction intensity are the presence of
overhang removal, interior platform angle and percentage of dorsal cortex. These
attributes have the advantages of being well understood and widely used by lithic
analysts as well as being easily recognisable, allowing rapid and accurate data
collection. In addition to these familiar attributes a new method of classifying flakes
according to dorsal cortex location has been proposed. This new method was shown to
be similarly useful for measuring assemblage reduction intensity and its reliability is
demonstrated by relatively low inter-observer error.
A further advantage of the attributes discussed here is that they can be used to produce
summary ratios describing an assemblage for comparison with other assemblages.
These ratios represent a continuous measurement of assemblage variation without
imposing arbitrary stages or events onto the reduction process. Summary ratios of
flake attributes can be used to describe the extent of cobble reduction even when cores
have been removed from the assemblage.

5. A general model for reduction
110
Limitations and potential sources of error
One possible objection to this interpretation of the strong correlations of reduction with
the key flake variables is the problem of multicollinearity. Multicollinearity occurs
when two or more independent explanatory variables in a model have strong linear
correlations. The presence of multicollinearity is a problem because collinear variables
contribute redundant information and can cause other variables to appear to be less
important than they really are. Multicollinearity also makes it difficult or impossible to
reliably estimate their individual correlation values. For example, it could be possible
that there is a strong negative correlation between the percentage of dorsal cortex and
the number of dorsal flake scars. This might occur because higher numbers of flake
scars are likely to remove a greater area of the dorsal surface than smaller numbers of
flake scars on the same sized flake. However, it is also possible that large numbers of
small flake scars will remove less dorsal cortex than one or two large flake scars. Figure
5.12 shows the correlations between four of the key flake variables described above.
The relatively low correlations between the variables, compared to their correlations
with reduction intensity stages described above, suggest that multicollinearity is not a
problem here. This interpretation is supported by a more formal measure of
multicollinearity, the variance inflation factor (VIF). The VIF is a scaled version of a
multiple correlation coefficient between one variable and the rest of the independent
variables (Neter and Wasserman 1996). For the four variables in Figure 5.12, the VIFs
are overhang removal = 1.072, interior platform angle = 1.191, dorsal scars = 1.272 and
dorsal cortex = 1.137. Variance inflation factor values of 30-100 are considered to
indicate moderate to strong collinearities (Belsley et al. 2004, Velleman and Welsch
1981). These low VIF values confirm that multicollinearity is not a problem in this
analysis.
As an additional demonstration of the usefulness of these variables as independent
measures of reduction, it is possible to show that these variables are roughly similar in
their sensitivity to reduction intensity. Table 5.2 shows the Z-score transformations for
the maximum and minimum values of each of those four variables in the ten reduction
levels. Z-scores were calculated with a simple standardising transformation that
subtracts the sample mean from each data point and divides the result by the sample
standard deviation. The result is set of dimensionless values that indicate the
standardised deviations from the sample mean (Abdi 2006). The main advantage of the
Z-score is its dimensionless quality, enabling meaningful comparison between

5. A general model for reduction
111
variables with different measurement units such as numbers of dorsal flake scars and
interior platform angle. The table shows the range of each of those four variables in
terms of standard deviations, illustrating the spread or variability of values for each
variable. The maximum variability here is about 1.5 to 2 standard deviations with none
of the variables showing unusually high or low variation. This suggests that these
variables are roughly equivalent in their sensitivity to change as reduction intensity
changes.
Shott (1996) has noted that it is not easy to design experiments that depict how ancient
stoneworking actually proceeded. This experiment has tried to simulate the defining
characteristics of Hoabinhian assemblages, such as unifacial, centripetal and
circumferential cobble reduction. However, it is likely that Southeast Asian lithic
assemblages represent a range of raw material procurement and core reduction
strategies (Forestier et al. 2005, White and Gorman 2004). Until future work describes
these different reduction strategies we cannot know how well this experiment
approximates the range of variation in the Hoabinhian. Nevertheless, most of the
variables identified here are reliable indicators of reduction in a range of technological
systems, including biface manufacture, so the variation within Hoabinhian
technologies is unlikely to compromise the robustness of these measures. Finally,
taphonomic and recovery processes will influence assemblages in complex ways that
may influence inter- and intra-site comparisons of the technological variables discussed
here. Breakage of flakes may distort the proportions of complete flakes representing
different stages of reduction in ways that are difficult to discern from the recovered
archaeological assemblage. This highlights the need for detailed descriptions of
deposits and excavation methods to accompany the interpretation of lithic
assemblages.
Summary
This chapter has completed the link from a general theory of understanding the
relationship between humans and their environment via flaked stone artefacts. A series
of definitions have been provided to support a nominalist classification of an
assemblage. A review of statistical methods indicated that computer-intensive
resampling techniques are best suited to analysing lithic assemblages where a
theoretical distribution cannot be assumed to accurately represent the distribution of
variables in the assemblage. Confidence intervals were argued to be an appropriate

5. A general model for reduction
112
method to evaluate differences in the central tendancies of variables. Incidently, for the
article describing this experiment published in the Journal of Archaeological Science all of
the regression results were presented with conventional p values rather than
bootstrapped confidence intervals, because of the relative unfamiliarity of resampling
methods. In this case the outcomes were the same, but it argued there that resampling
methods have stronger support from theory when analysing stone artefacts. Analysis
of the experimental assemblage identified five key attributes for measuring assemblage
reduction intensity, as a proxy for energy invested in risk reduction. These are:
overhang removal, interior platform angle, dorsal cortex, dorsal flake scars and the
distribution of dorsal cortex. An unexpected finding was the insensitivity of core
attributes to changes in reduction intensity. This suggests that flake attributes are the
most reliable and valid indicators of reduction and core attributes. These methods will
be used to analyse the assemblages from the two sites described in the next chapter.

5. A general model for reduction
113
Figure 5.1. Artefacts from the experimental assemblage. Top row: two unifacially flaked cores.
Bottom row: view of dorsal surfaces of two flakes.
Figure 5.2. Frequency distribution of flakes per core in the experimental assemblage.

5. A general model for reduction
114
Figure 5.3. Plot of changes in the mean proportion of flakes with overhang removal and
increasing reduction. Error bars show 95% Confidence Interval of mean.
Figure 5.4. Plot of changes in mean flake interior platform angle with increasing reduction.
Error bars show 95% Confidence Interval of mean.

5. A general model for reduction
115
Figure 5.5. Plot of changes in mean percentage of flake dorsal cortex with increasing
reduction. Error bars show 95% Confidence Interval of mean.
Figure 5.6. Plot of changes in the mean number of flake scars on the dorsal surface on flakes
with increasing reduction. Error bars show 95% Confidence Interval of mean.

5. A general model for reduction
116
Figure 5.7. Four classes of dorsal cortex location identified by Nishimura (2005). Modified
from Jeremie and Vacher (1992).
Figure 5.8. Frequency distribution of the four classes of dorsal cortex location.

5. A general model for reduction
117
Figure 5.9. Changes in the proportions of the four classes of dorsal cortex distribution with
increasing reduction.

5. A general model for reduction
118
Figure 5.10. The relationship of dorsal cortex location to percentage of dorsal cortex. For
example, for all flakes that have 10% dorsal cortex, 80% of those flakes have that cortex
located on the distal region.

5. A general model for reduction
119
Figure 5.11. The relationship of dorsal cortex location to interior platform angle. For example,
for all flakes that have an interior platform angle of 40 degrees, 40% of those flakes have
100% dorsal cortex.

5. A general model for reduction
120
Table 5.1. Correlations of four classes of dorsal cortex location with reduction intensity and
flake mass. Confidence intervals that include zero indicate a correlation that is not
statistically significant.
Class Reduction Intensity Flake Mass
100% Cortex -0.349 [-0.418, -0.281] 0.015 [-0.054, 0.085]
Crescent -0.319 [-0.399, -0.238] 0.056 [-0.026, 0.139]
Distal 0.101 [0.019, 0.181] 0.287 [0.192, 0.382]
No Cortex 0.373 [0.296, 0.451] -0.271 [-0.316, -0.225]
Figure 5.12. Scatterplot matrix showing correlations for four of the key flake variables in the
experimental assemblage. Data points have been jittered to reduce overlapping. Jittering involves
the addition of a small amount of random data to each point to reduce overlapping where many
points have the same value.
Overhang Removal
40
60
80
100
120
0
2
4
6
8
0.0 1.0
Interior Platform Angle
(degrees)
Dorsal Cortex (%)
0 20 40 60 80 100
Dorsal Scars
r = 0.159
[0.091, 0.228]
r = -0.108
[-0.160, -0.055]
r = -0.257
[-0.346, -0.167]
r = -0.309
[-0.392, -0.226]
r = 0.364
[0.285, 0.441]
r = 0.246
[0.156, 0.337]

5. A general model for reduction
121
Table 5.2. Spread or variability of values for each variable, measured in standard deviations.
Interior
Platform
Angle
Dorsal Cortex
(%)
Overhang
Removal Dorsal Scars
Z-score
maximum
1.16 2.25 1.30 0.99
Z-score
minimum
-2.18 -0.93 -1.45 -1.99

6. The sites and their setting
122
6. The Sites and their setting: Ban Rai and Tham Lod
Introduction
The previous three chapters have outlined the analytical approach that is being
employed in this project. A framework based in human behavioural ecology has been
established and links have been made down to the specific attributes to be measured
on the stone artefacts. In this chapter some of the specific ecological qualities relevant
to analysing the assemblages are reviewed. Winterhalder (1980) has argued that when
testing hypotheses about ecological adaptation it is necessary to go beyond normative
descriptions that gloss over spatial heterogeneity and temporal fluctuations. The aim of
this chapter is to go beyond normative description and identify the particular
constraints and opportunities relevant to human foragers that derive from the physical
environment of the study area. It will describe the current landscape and climate in
terms of a habitat for human foragers. These habitat variables are used to build testable
hypotheses from the models presented in chapter three. The relevance of this current
information is based on the assumption that differences between modern and past
conditions are largely related to range and distribution of modern taxa and water
sources, with minor changes in taxonomic composition and geomorphology, rather
than major taxonomic turnovers and catastrophic geomorphological shifts. The current
climate and resource parameters are discussed in order to set the stage for
reconstructing the past conditions of prehistoric hunter-gatherers’ habitats. Chapter
seven then discusses the history environmental conditions in more detail.
Overview of the Region
The Study Area
Although the two rockshelters examined here are both on the Lang river, activities at
these locations are likely to have been influenced by conditions elsewhere in the area
that people moved through. To capture some of the variation and diversity that might
be typical of the home range of the prehistoric human foraging groups that used the
two sites, the study area is expanded beyond the two sites to the boundaries of Pang
Mapha District, an area of some 1,120 km2 (Shoocongdej 2006a). This area is within the
range of variation for total areas of forager mobility (Kelly 1995: 114-5) and about half

6. The sites and their setting
123
the area calculated from the movements of the Northern Thai Mlabri foragers by
Pookajorn (1985, 1988). Pang Mapha District is located about 150 km northwest of
Chiang Mai. It is part of the southern extension of the Shan mountain ranges (Santisuk
1988: 11), which in turn are part of a series of discontinuous limestone outcrops
following the north-south alignment of mountain ranges extending from Malaysia to
Myanmar (Dunkley 1985). The boundaries to the north and west are shaped by the
drainage for the Salaween River which marks the border between Thailand and
Myanmar. The south and east boundaries of the district follow long walking paths on
high ridges. These ridge-top paths are probably ancient as they are the most effective
way to travel in this area because of the abundant rugged peaks, dense valley
vegetation and seasonal swelling of rivers that make walking through valleys and
across slopes difficult.
The main access to the area today is the highway from Chaing Mai to Mae Hong Son,
on which the main town of Soppong is located. Although the district is one of the least
populated areas in Thailand, Pang Mapha has a high diversity of ethnic groups, mostly
living in isolated small villages that have been established in the last few generations
(Kernmel-Torrès 2004). These groups include the Shan, Lisu, Lahu, Karen, Hmong and
smaller numbers of other groups. The Shan are the most numerous, as a relic
population of the eastern margin of the Shan State. The Shan language is in the Tai-
Kadai family and is closely related to Thai. The Shan State is presently a state in the
Union of Myanmar that shares the border with Pang Mapha. Before the Thai-Myanmar
border was formally determined, Pang Mapha was largely controlled by the Shan
State. The Karen also derive from homelands along the Thai-Maynmar border,
especially the Karen State, Kayah State and southern Shan State. The Karen language is
classified in the Tibeto-Burman group of the Sino-Tibetan family and is not similar to
Thai. Most Karen groups in Pang Mapha are refugees from oppressive treatment by the
military dictatorship in Rangoon that opposes Karen autonomy within Myanmar.
These Karen have settled in Pang Mapha within the last two or three generations.
Immigration of Shan and Karen people is continuous in Pang Mapha as people take
advantage of the difficulties in controlling the border in the rugged terrain to escape
persecution in Myanmar. The Lisu and Lahu are ethnic groups from southern China
who speak languages in the Loloish family of the Tibeto-Burman group. They probably
arrived in Pang Mapha as part of the diaspora of ethnic minorities leaving south China
during the civil unrest in the early days of the Republic of China (i.e. after 1912),

6. The sites and their setting
124
although some may have arrived in earlier migrations during the late Qing Dynasty
(1644-1912). The Hmong also trace their origins to southern China and probably
arrived in Pang Mapha under similar conditions to the Lisu and Lahu. None of these
groups claim any connection with prehistoric remains found in Pang Mapha.
Geology and geomorphology
The uplands of far Northwest Thailand are a formation of hills and mountains with
prominent and very steep pinnacles and ridges of limestone (Figure 6.1, Figure 6.2).
The geomorphology of this area was examined and recorded during six speleological
expeditions conducted over 1983-1986 by members of the Australian Speleological
Research Council (Dunkley and Brush 1986). The landscape that contains the two
archaeological sites examined here covers an area of about 1000 km2 which is described
as extremely rugged with 47% of the landscape area consisting of slopes over 60%
(Dunkley 1985).
The limestone that dominates the landscape is of Permian age and is comparable in
lithology and structure to carbonates of similar age in the Sino-Burman mountains
(Kiernan 1991b). The folding and faulting that dominates the structural geology trends
north-south and dates from the pre-Cretaceous Kimmeridgean Orogeny to the west in
the Shan States of Burma. Later epeirogeneric uplift caused the area to become more
exposed to erosion and deposition, a process that continued throughout the Tertiary
and Quaternary (Kiernan 1991b). Partially as a result of this uplift, the Permian
limestone karst currently rises up to 1000 m above the valley floors and accordant
summits (possibly representing ancient erosion surfaces) are prominent especially at
about 1100 m. Drainage in the karst systems determined the formation of extant caves
(as underground streams) and rockshelters (though sinkhole evolution). Even today,
drainage is mostly underground and as the landscape has evolved and eroded,
numerous deep caves and cliffs have become exposed and left hanging above the
valley floor. This drainage is very extensive, with the region containing two of the most
extensive underground cave systems known in mainland Southeast Asia. The surface
flow of the few waterways in the region is also a feature of the underground drainage,
with most streams ending in a drop into a limestone sinkhole. The exposure of cliffs
and caves generally accompanies valley incisions into non-carbonate sedimentary
rocks that underlie the folded limestone.

6. The sites and their setting
125
Surrounding these karstic features are Quaternary sediments including recent
slopewash sediments, rockfall talus and travertine that appear to be the product of
relative landscape stability (Kiernan 1991a). Kiernan (1991b) suggests that the current
surface sediment deposits largely result from anthropogenic erosion caused by
swidden agricultural activity and burning on the valley slopes during the Holocene.
He also notes that many extant gravels and sediments amongst the karst result from
Pleistocene processes (Kiernan 1991b). The high relief of the area results in
considerable potential energy from water flow, facilitating erosion by catastrophic
events and strong relationships between landscape evolution and regional climate
change. For example, slope stability in this highly rugged region is greatly influenced
by vegetation cover. Changes in climate result in changes in the density of vegetation
that insulates and protects biomass and substrate from mobilisation by surface water
flow. Changes in seasonality have the most extreme effects on climate-mediated
landscape evolution. For example, when the magnitude of difference between the wet
and dry seasons is great, warm and wet conditions during wet seasons will foster
luxuriant plant growth that favours chemical weathering and the development of soils
that insulate the ground from mechanical processes. During the dry season much of
this vegetation will recede and expose the soils for removal by the first monsoonal
rains. The resulting lowering of soil surface on the slopes corresponds with higher
sediment loads in surface water and increased alluvial sediment deposition on river
terraces (Kiernan 1991a). This interaction of climate and landscape suggests that the
prehistoric climate change is likely to have had pervasive influences beyond changes in
the ranges of floral and faunal taxa.
Current Climate and Seasonality
Pang Mapha currently has a seasonal tropical climate with three highly distinct
seasons: cool and dry (November to February), hot and dry (March to May) and warm
and wet (May to October). Prehistoric climates for the study area are discussed in
chapter seven. Current seasons in the study area, like much of the tropics and
subtropics, are controlled by the location of the Inter Tropical Convergence Zone
(ITCZ), a low pressure weather system that moves over mainland Southeast Asia in a
northerly direction during May, and in a southerly direction during September. This
results in two major air streams affecting the climate of the study area: the northeast
monsoon and the southwest monsoon (Manisan 1995). The northeast monsoon brings
cool and dry air from the Siberian anti-cyclone over major parts of Southeast Asia. The

6. The sites and their setting
126
monsoon commences in November and lasts until February. During this time the study
area is in a winter season, characterized by relative aridity combined with low air
temperatures. The summer season can be considered to be a transition period, from
mid-February to mid-May, as primary influence shifts from the northeast to southwest
monsoon. The hottest month is usually April. The southwest monsoon, which begins in
mid-May and ends by mid-October, brings air of high humidity originating from the
Indian Ocean towards Thailand. This southwest monsoon corresponds with the rainy
season in the study area. Rainfall peaks occur during the retreat of the monsoon,
generally from August to September. Abundant rainfall from tropical cyclones also
occurs from August to October.
Detailed climate records for Pang Mapha Province are not available, but a weather
station in the district capital, Mae Hong Son, has been collecting temperature and
rainfall data since 1951. Average annual rainfall in Mae Hong Son is 1277 mm, but may
be closer to 2000 mm in Pang Mapha (Richardson 2003), with 90% falling between May
and October (the monsoon season). This is typical of most of northern Thailand,
although the mountainous location of Pang Mapha causes heavier rainfall that is
spread over a longer period of time relative to lower altitude areas (Poussart and
Schrag 2005).
The annual variation in mean temperatures in Mae Hong Son is relatively narrow,
from 29°C in April to 21°C in January. A better indication of the variability comes from
the mean monthly maximum and minimums, since it is the extremes that impose limits
on bioproductivity. Temperatures range from mean maximums of 36°C in April to
28°C in December and mean minimums of 24°C in June and 14°C in January. During
the coldest months the temperature in Pang Mapha frequently falls below 10°C and
ground frosts have been reported (Richardson 2003).
Hydrology
The high variation in seasonal rainfall in the study area means that potable water
distribution varies greatly over the landscape between the wet and dry seasons. During
the dry season water is restricted to small but continuous flows of the four permanent
rivers that run through the study area. Springs are present in some deep narrow
gorges. The rivers run in deep troughs running north-south, with three of the four
waterways (Khong River, Pong Saen Pik Stream and Lang River) draining into the Pai
River to the south which flows west and joins the Salween River in Myanmar.

6. The sites and their setting
127
Although the course of all four waterways occasionally follows subterranean routes,
Lana River is notable because it actually drains into an underground system. The two
archaeological sites discussed here are both adjacent to the Lang River which goes
underground for about 600 m near Tham Lod rockshelter (Figure 6.1).
During the wet season these four main waterways become dramatically swollen with
rainfall and runoff. They carry a large sediment load that reshapes the river banks each
season with sediment erosion and deposition. Current sediment loads are likely to be
greater than prehistoric conditions because modern swidden agricultural activities on
the steep hillsides result in greater soil erosion than erosion from forest floors (Kiernan
1987). Away from the rivers a network of numerous small tributaries appears during
the wet season. Most of these are ephemeral, only flowing after rain but holding pools
of water for several days after flow ceases. During the wet season the distribution of
potable water extends to steeply elevated ridges (c. 300 m) about the rivers and in the
rocky gullies draining them, with pools and soaks forming in areas that otherwise have
no potable water. Underground water flows are common in the study area, especially
to the south between Lang River and the Pai River, but these are not easy to access. In
this area there are no significant perennial streams because drainage is entirely
underground (Dunkley 1985). The extensive underground drainage throughout the
study area, combined with the high relief promoting surface drainage, means that
standing pools of water are usually short-lived except during the peak of the wet
season.
The Distribution and Quality of Raw Materials for Stone Artefacts
The distribution of non-carbonate lithologies in the study area is closely related to
hydrological activity (Figure 6.3). Waterways erode through the limestone to expose
non-carbonate sedimentary rocks, as well as carrying gravels from long distance
upstream sources. Most streambeds in the study area are mantled by clasts from
gravels (2-64 mm diameter) to cobbles (64–256 mm diameter, most being 100-150 mm)
which in turn are partially covered by sandy silts. Cobbles in particular have mostly
been reworked from pre-existing bank and bed deposits (Kiernan 1991b). These stream
deposits are composed of quartzite and metaquartzite (50%) with smaller proportions
of sandstone (20%) mudstone (20%) and other sedimentary and metamorphic
lithologies (10%) (Kiernan 1991b). Similarly composed deposits are also found on
terraces up to 15 m above the current river levels although these are generally overlain

6. The sites and their setting
128
by 0.5 m to 1 m of sandy loam. Hillside alluvial gravels and cobbles are apparent when
surface infiltration has been inhibited by thick surface covers or poor soil development.
These hillside deposits tend to be composed of sandstone and mudstone with no
quartzite. They include high terrace deposits and relict cobbles probably representing
lag clasts from very ancient terrace sediments that have been extensively dissected and
reworked (Kiernan 1991b). Compared to streambed and terrace deposits, clasts in
hillside deposits are very weathered and rarely intact since they are highly susceptible
to erosion causing blocky disintegration. Average weathering depth of rinds on
sandstone clasts in these assemblages is 3.4 mm, compared to 1.1 mm for rinds on the
low terraces (Kiernan 1991b).
There are two major implications of this distribution of non-carbonate lithologies for
prehistoric people seeking raw materials for making stone artefacts. First is that fine
grained sedimentary raw materials such as chert and silcrete are extremely rare in the
landscape of the study area, with coarser-grained raw materials such as quartzite and
sandstone abundant instead. Mineralogical structure, especially grain or crystal size, is
an important factor influencing many variables of stone artefact manufacture
(Brantingham et al. 2000). Fine-grained rocks, or those with small crystal sizes, tend to
flake predictably and a high degree of control over the flaking process is possible.
When a blow is applied to a fine grained rock, the force travels through the mass
relatively uninterrupted because the rock is homogenous and isotropic. This means
that fine grained materials are highly plastic; their shape and size can be relatively
easily transformed by reduction to a variety of forms (Goodyear 1989). On the other
hand, when a blow is applied to a coarser grained rock, the propagation of force is
more likely to be interrupted and redirected as it travels around the grains. This makes
flaking less predictable, resulting in irregular fractures and severe, irreparable errors
during reduction (Brantingham et al. 2000). As a consequence, coarser grained raw
materials are less plastic and their reduction results in a relatively restricted range of
forms. In summary, the choice of raw materials is limited in the study area, and the
particular raw materials available further limit artefact manufacturing options.
The second implication of the distribution of lithologies is that the quality of rock
declines as distance from a waterway increases. Cobbles found in streambeds have
been size- and quality-sorted by water flow. For example, clasts with internal
weaknesses will tend to break into smaller pieces during reworking and be carried by

6. The sites and their setting
129
water flow to lower energy locations. This means that cobbles in high-energy locations,
where the water volume is relatively large, will tend to have few internal weaknesses
and flaws. There is a gradual change in the proportions of raw materials as deposits
increase in distance from waterways. Streambed and low terrace deposits are up to
50% quartzite, while high terrace and hillside deposits tend to have high proportions of
sandstone and mudstone and no quartzite. Of these three types of rock, quartzite is
most desirable for making stone artefacts because the grains in quartzite are most
tightly bound, making it relatively tough and able to hold a more durable working
edge over a variety of edge angles and over a longer use-life, compared to mudstone
and sandstone. This is because quartzite is a metamorphic rock, formed by heat and
pressure applied to quartzite-rich sandstone, fusing the quartz crystals into dense
matrix with an even texture (Pellant 1992). Sandstone and mudstone, on the other
hand, are sedimentary rocks with a less dense matrix that has not been compressed by
heat and pressure. The texture of sandstone and mudstone is characterised by pore
spaces between the grains. These pore spaces reduce the contact between grains,
reducing the toughness of the rock and making it relatively easy to break (Pellant
1992). This lower toughness means that the morphological possibilities for durable
working edges are limited to very obtuse angles and these edges have relatively short
use-lives because the rock abrades relatively quickly during contact.
The Distribution of Floral and Faunal Resources
Another suite of resources of importance to human forager groups are the plants and
animals that they share the landscape with and consume as subsistence resources. As
with stone, the distribution of these is correlated with water availability. Additional
variables in the distribution of flora and fauna are climate, soil type and parent rock
materials. Although the interaction of these variables creates complex ecological
patterns, elevation can be used as a proxy for these variables when describing the local
ecology in the study area (Figure 6.4). This is possible because the extreme ruggedness
of the topography results in relatively large differences in elevation between the valley
floors and the ridge tops, with corresponding differences in soil, parent rock and water
availability (Santisuk 1988). The high variability in elevation in the study area means
that the study area is a mosaic of forest types over short distances, grading in
taxonomic composition and structure from dense and moist forests of the valley floors
to the more open evergreen forests on the ridges. That said, the distribution of
vegetation in the study area in either horizontal or vertical directions does not follow a

6. The sites and their setting
130
simple pattern, with overlapping distributions of the different forest types (Santisuk
1988). In general the vegetation below 1000 m above mean sea level (amsl) can be
called ‘lowland vegetation’ and the vegetation above 1000 m amsl is ‘montane
vegetation’, both of which can be subdivided into several sub-types according to the
dominant taxa and structure.
Starting with the lowest of the lowland vegetation, the river banks of the Lang River
are typical of the lower parts of the study area with semi-evergreen forest spreading
from the sheltered moist valleys of low hill ranges up to about 900 m amsl (Santisuk
1988). The habitat of semi-evergreen forests is characterised by about 5-6 dry months
and 1400-1800 mm of rainfall. This type of lowland forest is also known as ‘dry
evergreen forest’, ‘seasonal rain forest’ or ‘mixed deciduous forest’ and is composed of
a mixture of a deciduous canopy trees (usually less than one third) and evergreen taxa
in the canopy and lower stories (Santisuk 1988: 27). Along larger water courses, such as
the Lang River, semi-evergreen forest forms a narrow strip of galley forest
characterised by dense tall stands of evergreen dipterocarps, especially Ditperocarpus
turbinatus. The density of trees ranges from 170 to 713 per hectare (Rundel and
Boonpragob 1995). The forest is structurally three-tree layered, with an upper layer at
around 22-35 m, a middle layer at 10-22 m and a lower layer at <10 m (Santisuk 1988:
28). The lower layer also includes a well developed shrub layer with abundant woody
climbers and palms. The richness of the understory means that horizontal visibility is
often less than 20 m (Rundel and Boonpragob 1995). Bamboo is relatively uncommon
because it is not suited to limited light that penetrates canopy, so it only appears in
open areas. In the past it is likely that this forest also included Tectona grandis (teak) as
a dominant species but human activities such as logging and village construction have
heavily disturbed the forests of the study area, and teak is now relatively rare (Rundel
and Boonpragob 1995).
A second type of forest, dry dipterocarp forest, overlaps with semi-evergreen forest in
its upper ranges and extends up to about 1000 m amsl. Dry dipterocarp forest is a
relatively low and open forest dominated by deciduous trees, ranging from a nearly
closed canopy to an open woodland structure. Its habitat is characterised by 5-7 dry
months and 1000-1500 mm of rainfall, a slightly drier habitat than the lower semi-
evergreen forests. Dominant species include Dipterocarpus obtusifolius, Shorea Optusa,
Shorea siamensis and the legumes Xylia kerrii and Pterocarpus macrocarpus (Rundel and

6. The sites and their setting
131
Boonpragob 1995). The canopy and story structure of dry dipterocarp forests is similar
to semi-evergreen forests, but the tree density of dry dipterocarp forests is lower at 20
to 88 per hectare (Rundel and Boonpragob 1995). Bamboo is relatively common in
more open areas.
At the highest elevations in the study area a distinctive montane vegetation pattern
appears, characterised by the presence of tall pines such as Pinus merkusii and Pinus
kesiya as well as Quercus sp. and Castanopsis sp. This type of forest appears from about
1000 m amsl and is called ‘hill evergreen forest’ or ‘lower montane pine-oak forest’. It is
best developed along ridges and moderate to steep slopes at 1000-1400 m amsl
(Santisuk 1988). Few statistics are available for hill evergreen forests, but they are
known to be an open woodland forest type characterised by widely spaced trees with a
dense canopy that limits development of the lower stories and shrubs (Santisuk 1988).
To summarise these vegetation patterns, there is a trend in forest structure from high
tree density and developed undergrowth in humid lower elevations to more open
woodland in drier and more elevated contexts. Although the taxonomic composition
does not change greatly and transitions between the different forest types are not
sharp, there is a substantial gradient of decreasing biomass density as distance from
the river and elevation increases. The significance of this gradient for human forager
populations is that while generally similar kinds of food resources are available in each
kind of forest, the ease of walking and stalking prey through the understory varies
substantially. The density of the lowland vegetation, combined with the ruggedness of
the terrain, imposes limits on the magnitude of human mobility. On the other hand,
people moving through the montane forests on ridges and hill sides were less impaired
because the woodlands were more open and less filled with lower story growth. These
differences would have been especially stark during the wet season when the
deciduous vegetation of the lowland forests are covered in leaves and biomass density
is at its highest.
The correlation between elevation, dryness and forest types means that estimating
vegetation patterns during past climates is relatively straightforward. Wetter
conditions will allow the lowland vegetation to expand its range to higher elevations,
so far as the soil is sufficiently well drained. Similarly, the lowland forests will retract
towards the waterways under drier conditions, with a concomitant increase in the
range of the montane forests. These changes in forest distributions are likely to have

6. The sites and their setting
132
influenced how human forager populations organised their mobility strategies and
technology. For example, it could be suggested that during wet conditions people
preferred habitats in montane forests because the density and humidity of the lowland
forests made travelling less efficient. Abundant precipitation means that water is
available in adequate quantities on the ridges and slopes away from the lowland
waterways. Similarly, during dry conditions people might be expected to concentrate
their activity at lower forests near waterways because the less developed lowland
forest is more habitable than the typical semi-evergreen forest and reduced
precipitation means than water is less available on the ridges and slopes away from the
waterways.
The fauna of the study area are less well known than the vegetation because they have
been more heavily impacted by human activities such as hunting, logging and farming.
Surveys of modern village inhabitants in the Lang River basin indicate that 67 mammal
species have been observed in the study area in the last 15 years. (Lao Yi Pa and
Tacumma 2000, Srikosamart et al. 1999, Wangwacharakul et al. 2000). Those known to
have been eaten in the historical period are listed here. Of the larger mammals, these
include Elephas maximus (Asian elephants), Bos gaurus (gaur), Bos javanicus (banteng),
Panthera tigris (tiger), Panthera pardus (leopard or panther), Muntiacus muntjak (common
barking deer), Cervus unicolor (sambar dear), Naemorhedus sumatraensis (Southern
serow), Naemorhedus caudatus (long-tailed goral), Sus scrofa (Eurasian wild pig),
Arctonyx collaris (hog badger), Macaca sp. (macaque) and Macaca mulatta (rhesus
macaque). Some of these large mammals have become locally extinct during the last 15
years, especially Elephas maximus, Bos gaurus, Bos javanicus, Panthera tigris, and Panthera
pardus (Lao Yi Pa and Tacumma 2000). Smaller bodied mammals include Presbytis sp.
(langur), Hylobates sp. (gibbon), Hylobates lar (white-handed gibbon), Viverridae
(civets), Paradoxurus hermaphroditus (common palm civet), Felidae (medium and small
wild cats), Muridae (rats and mice), Sciurinae (squirrels), Cynocephalus variegatus
(sunda colugo), Tupaia belangeri (northern tree shrew), and Chiroptera (bats). The most
abundant mammals during historical times have been Macaca mulatta, Hylobates lar,
Paradoxurus hermaphroditus, Sus scrofa, Muntiacus muntjak, Cervus unicolor, and
Naemorhedus sumatraensis (Wangwacharakul et al. 2000). Many of these have been
identified in the faunal records from Tham Lod and Ban Rai, but the generally poor
condition of the faunal assemblage strongly limits its analytical potential.

6. The sites and their setting
133
The Two Rockshelters
The two sites described here were excavated by the Highland Archaeology Project in
Pang Mapha (HAPP). This project was directed by Rasmi Shoocongdej, an Associate
Professor of archaeology at Silpakorn University, Bangkok and staffed by students and
specialists from Silpakorn and other institutions in Thailand. The project began in 2001
and concluded in 2007. Excavations at Tham Lod and Ban Rai were conducted by the
HAPP in 2002 and 2003. I joined the project in 2004 when the HAPP were engaged in
post-excavation analysis. In the following account, descriptions of the excavation
methods and stratigraphy have been derived from published accounts such as
Shoocongdej (2006a) and Treerayapiwat (2005) as well as more detailed unpublished
Thai-language reports produced by the HAPP (Shoocongdej and Staff 2003a, 2003b).
Tham Lod
Site context
Tham Lod rockshelter is about 250 m away from the Lang River and about 15 m above
current high water levels. This means that prehistoric occupants would have had easy
access to the river and related resources such as abundant materials for making stone
artefacts. It is on the edge of a relatively flat area surrounded by steep low hills and
karst formations (Figure 6.5). The overhang of the rockshelter is part of a long cliff that
has been interpreted by Khaokiew (2004) as a circular collapsed doline about 100 m in
diameter. The current floor of the rockshelter rises about nine metres above the level of
the flat area in front of it, indicating that sediment accumulation is connected to
geomorphic process on the slopes above and to the sides of the rockshelter. The
elevation of the rockshelter is about 640 m amsl (Shoocongdej 2006a). As is typical of
this elevation, the surrounding vegetation is a mix of semi-evergreen forest and dry
dipterocarp forest. About twenty years ago the vicinity of the rockshelter was
developed into a forest management and education station and there are several small
buildings and small playing fields in the area. This has obscured the natural
topography and vegetation of the area, probably making the shelter more exposed than
in the past.
Site description
The rockshelter is roughly straight and faces north (Figure 6.6). The maximum extents
of the level area where the excavations were located is 30 m east-west by five metres

6. The sites and their setting
134
north-south. The east-west dimensions are defined by large boulders to the east and an
uneven surface to the west. The height of the overhang is about 20 m and the slope
from the floor of the rockshelter down to the flat area in front of the rockshelter is
about 30 degrees. No rock art is visible on the rockshelter but wide pink stains run
down the height of the shelter. These stains probably result from minerals dissolved in
water that runs down the rock during the wet season rains, indicating that water
regularly enters the rockshelter and either drains off the surface, or seeps through the
sediments.
Excavations
Three discrete areas were excavated by the HAPP at Tham Lod (Figure 6.6). The first
area abuts the rear of the shelter and is four metres long and between 1.2 m and 2 m
wide, depending on the shape of the back wall. The second excavation area is located
further down the slope and consists of an 8 x 8 m square and an adjoining 2 x 2 m
square. The third area is further still down the slope and is a trench of 9 x 2 m.
Although the initial excavation method for the three areas was proposed to follow
natural layering of the sediments, the homogeneity of the sediments meant that in
practice excavation units were roughly horizontal arbitrary units 10 cm deep. This has
an important implication for the usefulness of the excavated materials from areas two
and three.
These two areas are located on the slope, and although the initial excavation units
followed the level of the ground surface, the lower units were horizontal because of the
difficulty of following the ground surface at depth. This means that the horizontal
excavation units most likely cross-cut layers of sediments deposited at different times.
For example, a horizontal excavation unit on the slope will result in the downslope
section recovering younger material relative to the upslope section, because sediments
in the downslope section are closer to the ground surface and overlay the sediments in
the upslope section. As a result, excavation areas two and three were excluded from
the analysis here because of uncertainly about the contemporaneity of artefacts within
excavation units. Excavation area one was considered unproblematic because the
ground surface is relatively level, and assuming the lower levels are also level, any
cross-cutting effects should be relatively minor. All excavated materials passed
through sieves with a 1.5 mm mesh.

6. The sites and their setting
135
Stratigraphy
The homogeneity of sediments at Tham Lod, probably caused by water flow from the
cliff face, makes it difficult to discern depositional units (Figure 6.7). The discussion
here focuses on identifying excavation units that are disturbed to exclude them from
the analysis.
The top three to four centimetres of excavation area one consists of a fine red-brown
clayey sand with dispersed ash and charcoal and small pieces of limestone detached
from the cliff face. Material recovered includes animal and human bone, shell, stone
artefacts, ceramic pieces, seeds and other plant matter as well as obviously recent metal
items such as coins and glass. Excavation unit one begins immediately below this layer
and includes two post holes about 20 x 20 cm extending 14-46 cm below the surface.
Surrounding the postholes is a continuation of the loose red-brown clayey sand with
small limestone pieces and scattered ash and charcoal along with increased quantities
of animal bone and teeth, shell, ceramic, plant matter and stone artefacts. Some glass
beads were found but also modern items such as iron and plastic, indicating that
mixing had occurred in these levels. Except for a having two features that are discrete
areas of charcoal, ash and burnt sediment, excavation unit two has similar qualities
including modern metal and glass objects. River pebbles and cobbles, as well as similar
sized pieces of caliche (also known as calcrete, a hardened deposit of calcium
carbonate), appear in these upper levels and are abundant throughout. Units three and
four are also similar.
In unit five there is a burial indicated by the presence of a human tibia and femur as
well as dispersed cranial fragments. An unusually large river boulder (30 cm diametre)
was found overlying these bones. About 20 cm below this burial a second burial was
uncovered, also with unusually large river boulders and limestone rock. A human
radius, ulna and some teeth were identified. Bones from both burials were very fragile
and only denser bone remained intact. Both burials are interpreted as having the body
interred in a flexed position. Difficulty in discerning the intrusive burial feature from
the surrounding sediments means that only limited confidence can be placed in the
association of the dates with the burials. It is possible that the dates provide ages for
the sediment that the body was placed in, rather than the time that the burial occurred.
Bones from the burial have not been dated.

6. The sites and their setting
136
Below the burials the loose red-brown sediments continue, but in unit six, 50-60 cm
below the surface, there is a denser than usual accumulation of limestone boulders and
cobbles ranging in size from 5 to 30 cm in diameter. This is interpreted by
Wattanapituksakul (2006a) and Khaokiew (2004) as a roof fall episode, possibly caused
by earthquakes. A large number of human bone fragments were also recovered
amongst the rock. Stone artefacts, shells, animal bones continue to be recovered, but
plant remains, ceramic, metal and glass no longer appear. The proportion of limestone
rocks in the sediment seems to drop slightly in the units below 60 cm from the surface,
but remains higher than any units above the main roof fall concentration. In these
lower levels an intrusive rock appears in the east wall of the excavation. The intrusion
of this rock increases with depth until at the base of the excavation nearly half of the
area is occupied by the rock. To compensate for this intrusion, volume calculations for
each excavation unit (for calculation of artefact discard rates) were based on surface
areas derived from plan drawings of each excavation unit. The plan drawings showed
the extent of intrusion of the rock into each excavation unit and allowed volume to be
calculated from the surface area of excavated sediment of each unit multiplied by the
depth of the unit.
This combination of limestone rocks mixed with red-brown sediment and pieces of
caliche continues down to unit 32 (310-320 cm below the surface) when large quantities
of river cobbles also appear. The quantity of river cobbles decreases by unit 42 (410-420
cm below the surface) and is absent in units below. The presence of cobbles in these
units is interpreted by Khaokiew (2004) as evidence that the rockshelter was once part
of an ancient stream terrace. Only small amount of faunal remains and no artefacts
were recovered from the river cobble bearing units. In the final 30 cm of excavation
below the river cobble bearing units, no artefacts or faunal material were recovered.
To summarise the stratigraphy of Tham Lod, excavation units between the ground
surface and unit six are highly likely to have been disturbed by the two burials and
recent activity that has intruded modern objects into the sediments. The units below
the roof fall in unit six show no signs of major disturbance, although the homogeneity
of the sediments makes this difficult to detect. The absence of major stratigraphic units
or areas of disturbance suggests no need to aggregate excavation units to form
analytical units that reflect the history of depositions or to avoid disturbed contexts.
Evidence of occupation appears to be absent below unit 32, suggesting that occupation

6. The sites and their setting
137
began around that time. The first occupation of Tham Lod is probably related to a
change in the local hydrology, with the stream moving away from the rockshelter and
creating a dry area suitable for habitation.
The presence of caliche throughout the entire deposit (except the river cobble bearing
units) is an important indicator of preservation conditions. Although the sediments are
described as loose, the caliche results in a semi-concrete texture throughout the strata,
with rocks, stone artefact and animal bone fragments often tightly bound in a
carbonate matrix. The cause of this is not well understood at Tham Lod, but it probably
results from carbonic acid derived from carbon dioxide dissolved in the water as it
passes through the sediments (Goldberg and MacPhail 2006: 178). This acid dissolves
animal bones and calcium carbonate in the surrounding limestone then during neutral
or alkaline conditions the carbonate precipitates out of solution to form a solid. This
probably explains why the faunal remains are in such poor condition, combined with
the likely gnawing and fragmenting action of Hystricids (Zeitoun et al. 2005). The stone
artefact assemblage is less affected by this geochemistry, but it suggests that an
analysis of residues on the stone artefacts would not be productive because any
residues may have been dissolved or washed off the edge of the artefact.
Chronology
Establishing the chronology of sediment accumulation at Tham Lod was challenging
because of the poor organic preservation in most units and other problems. For
example, two samples of 500 g each of animal bone were sent to the Waikato
Radiocarbon Laboratory for dating but the amount of datable carbon was below the
level of instrument error. Three thermoluminescence samples were unable to be
exported due to bureaucratic difficulties and a sample of shell was tested for U-Th
dating but contained insufficient concentrations of uranium. Twelve age
determinations were obtained for area one (Table 6.1) and no attempt has been made to
relate these to dates from areas two and three because stratigraphic continuity between
the areas cannot be demonstrated (although it is worth noting that dates from the other
areas are all within the range of the area one dates). All radiocarbon dates were
converted to calendar ages using the CALPAL2001 calibration curve in the CALPAL_A
software (Weninger et al. 2007). Interpolation of ages for each excavation unit was
obtained by deriving an age-depth curve from a regression equation relating the dates
to their excavation unit (as a proxy for depth below the ground surface). A linear

6. The sites and their setting
138
model is used because there are no changes in the stratigraphy that suggest substantial
nonlinear changes in the rates of accumulation. Prior to calculating this regression, two
dates that were more than 10,000 years younger that the dates stratigraphically above
them were identified as major anomalies and excluded from the sample. The
relationship between the age and depth of the remaining 10 samples is strongly
positively correlated (r = 0.884 [0.694, 1.074]). A simple linear regression using the least-
squares method can be defined as
Age = (791.40 x Excavation Unit) + 9599.67
The regression is not forced through the origin because disturbance in the upper
undated layers is likely to have altered sedimentation rates. This equation gives an r2
value of 0.782 [0.585, 0.940], indicating a good fit (Figure 6.8). Inspection of
standardised residuals means that cases that depart the most from the model can be
easily identified In this case, no outliers were identified (values exceeding two
standard deviations from the calculated value) so no further refinement of the model
was necessary.
This high correlation and r2 values implies a relatively constant rate of sedimentation
during the Pleistocene at Tham Lod. Each excavation unit represents about 791 years.
However, the sequence of dates still contains inversions and the period 15,000-20,000
BP is unrepresented. This may represent a slowing of sedimentation rates that slowed
the accumulation of datable material. Alternatively sediments and datable material
may have been removed by erosion during this period. With the current data it is not
possible to be sure of the cause of the absence of dates in the period 15,000-20,000 BP.
This suggests that some uncertainty is justified for the regression equation, although in
the absence of further data it will be used here to interpolate ages for all excavation
units. It is possible that there is a small Holocene signal from Tham Lod but
disturbance of the upper layers means this cannot be reliably identified. In any case,
the most substantial occupation at Tham Lod is clearly during the Pleistocene, so the
available sample is probably representative of the overall pattern.
Ban Rai
Site Context
In stark contrast to Tham Lod, Ban Rai is perched high up on the southern side of a
steep valley (Figure 6.1). It is about 10 km from Tham Lod in the same river valley.

6. The sites and their setting
139
However, the distance from the river to the site is about 200 vertical metres for Ban Rai,
taking over an hour to make the difficult ascent from the river to the site. To the west of
the site the river drains into a sinkhole. The site is located about 760 m amsl, 120 m
higher than Tham Lod. The vegetation immediately surrounding the site is semi-
evergreen, similar to Tham Lod, but with a greater bamboo component and just
upslope from the rockshelter is an ecotone where a mix of dry dipterocarp and
montane forests occur. Above the shelter in these montane forests is a long open ridge
that is currently an important walking trail between villages. This ecotone is important
because it means prehistoric occupants of Ban Rai were well situated to access montane
environments, which are likely to have been a focus of occupation given the distance to
the river and difficulty of access.
Site Setting
The rockshelter is a north-facing open circle about 105 x 42 m with a cliff height of
about 30 m (Figure 6.9, Figure 6.10). The dimensions are defined by the cliff walls and
the steep slope dropping away from the front of the shelter. Sediment accumulation
appears to result from limestone decay and alluvial and aeolian sediments introduced
from upslope from the shelter. The rockshelter was formerly a cave and the remnants
of roof collapse are evident across the floor of the rockshelter and especially out near
where the cave entrance would have been. The floor of the rockshelter is relatively
even, making it a significant feature on the surrounding steeply sloping valley side.
The level area appears relatively well sheltered from the weather and there are no
mineral stains on the cliff race indicating high volumes of water flow. A small amount
of rock art is faintly visible in red monochrome on the east side of the rockshelter. At
the time of excavation remains of about 15-20 log coffins were scattered across the floor
of the rockshelter. About six of these were still standing with upright posts and
elevated platforms that presumably held corpses. A small number of human teeth were
found associated with these coffins.
Excavations
Three discrete areas close to the back of the rockshelter were selected for excavation
(Figure 6.10). Area one was situated to focus on the log coffin activity and was a trench
of 14 x 2 m between a pair of large wooden posts and a smaller coffin structure close to
the rockshelter wall. The location of area two targeted the highest mound at the site
with excavations covering an area of about 6 x 2 m. Area three (4 x 4 m) was located

6. The sites and their setting
140
near the rock art and in an area where flaked stone artefacts had been found on the
surface.
Of these three areas, area three was chosen as the focus for this project. According to
HAPP data, area three has a substantially larger stone artefact sample (n = 9462)
compared to areas one (n = 757) and two (n = 922). Also, area one is described by
Treerayapiwat (2005) as disturbed and area two has a similar problem with a 30 cm pit
containing a flexed burial. As a result, area three was judged to be most suitable for
this project because it is the least disturbed excavation and has the largest sample of
flaked stone artefacts. All excavated materials passed through sieves with a 1.5 mm
mesh.
Stratigraphy
As at Tham Lod, excavation began with the intention of following major features and
natural stratigraphy. However these were elusive after a few centimetres below the
surface so sediment was removed in arbitrary approximately 10 cm deep units (Figure
6.11). The sediment was a fine brown sand with pebble sized limestone pieces. These
upper units contained stone artefacts, animal bone, shell, ceramics and an iron artefact.
The units in the upper 30 cm contain some signs of disturbance such a post hole from a
log coffin structure and plant leaves throughout the matrix. In excavation unit three
(35-40 cm below the surface) a small thin circular feature of ash and animal bone was
identified. In unit five a small thin circular feature of red sediment and ash appears,
probably the result of a campfire. This unit appears to the be the lowest level where
ceramic pieces were found, with only stone artefacts, faunal remains and shell
continuing into the lower layers. Additional minor features of ash and charcoal with
minor variations in sediment colour occur throughout the lower layers. These features
were not excavated separately from the excavation units.
The amount of limestone rock in the sediment appears to increase with depth. For
example by unit 22 (195-205 cm below the surface) it was necessary to use an iron bar
to loosen the rock-sediment matrix for removal. Below this unit the quantity of
artefacts drops substantially, although faunal remains and shell continue. Concomitant
with this increase in limestone and decrease in artefacts is a gradual change from the
fine brown sand of the upper units to a yellow sand that extends to the base of the
excavation in unit 32 at 305 cm below the surface. Stone artefacts remain present but
only in very small numbers until unit 28 and then disappear from the sequence.

6. The sites and their setting
141
To summarise the stratigraphy of Ban Rai, there is little in the available descriptions
that casts doubt on the integrity of the deposit. Sediment accumulation at Ban Rai
appears relatively straightforward compared to Tham Lod. Sediments probably
originate from the surrounding slopes. The sediments at Ban Rai are consistently fine
and sandy and there are no signs of extensive water flow such as the caliche and semi-
concrete sediments at Tham Lod. Despite this, the faunal remains are similarly small
and fragmented like at Tham Lod, indicating that carnivore action may be largely
responsible for this. The absence of large pieces of limestone in the deposit suggests
that the cliff face is relatively stable and no major weathering or rockfall occurring
during the time represented by the excavation. The yellow sediment in the lower units
suggests low concentrations of ash and organic material, confirming the low intensity
of occupation suggested by the sparse artefact signal. However, bedrock was not
reached and there was no indication of any change in sediments such as the cobble-
bearing units at Tham Lod, so it is possible that human occupation occurred in the
unexcavated layers below the yellow sediments.
Chronology
Seven radiocarbon dates were available for area three of Ban Rai (Table 6.2). These
radiocarbon dates were converted to calendar ages using the CALPAL2001 calibration
curve in the CALPAL_A software (Weninger et al. 2007). As for Tham Lod,
interpolation of ages for each excavation unit was obtained by deriving an age-depth
curve from a linear regression equation relating the dates to their excavation unit (as a
proxy for depth below the ground surface). The relationship between the age and
depth of the seven samples is strongly positively correlated (r = 0.774 [0.417, 1.132]).
Removing the date from unit three which is anomalous because it is older than dates in
unit ten and 12 improves the correlation slightly (r = 0.883 [0.469, 1.269]). A simple
linear regression using the least-squares method on these six dates can be defined as
Age = (160.51 x Excavation Unit) + 5807.92
This equation gives an r2 value of 0.780 [0.464, 0.806], indicating a good fit (Figure 6.12).
Inspection of the standardised residuals revealed no outliers. The high correlation and
r2 value for this equation suggests that this model is a good fit for the depth-age
relationship at Ban Rai. Each excavation unit represents about 160 years, providing
much greater chronological resolution than Tham Lod. On the other hand, the stone
artefact sequence only spans from the beginnings of occupation at about 9700 BP to

6. The sites and their setting
142
6200 BP, much shorter than the 30,000 years represented by Tham Lod. Interestingly,
Ban Rai is typical of other rockshelter sequences known in the study area, with
similarly brief early Holocene occupation signals at Spirit Cave and Tham Phaa Chan,
also in the highlands of Mae Hong Son Province. The timing of the beginning of
occupation at Ban Rai is notable, since it coincides with the start of the Holocene
period. Two dates from areas one and two also suggest earliest occupation at the
Pleistocene/Holocene boundary (Treerayapiwat 2005). The sterile yellow layers below
the occupation deposit suggest that this date for earliest occupation is very reliable,
although it is possible that a hiatus separates a much earlier occupation from these
Holocene deposits.
Little geological data are available for the archaeological sediments at Ban Rai and
Tham Lod. The dominant depositional processes appear to be alluvial and aeolian
transport of sediment, but it has not been possible to identify changes in the
contributions of these processes. Similarly, although there appears to be no major
hiatuses at a macroscopic scale it is not possible to be equally certain that finer scale
interruptions have not occurred, for example in the deposition and removal of
sediment on decadal scales. As a result, the interpretations that follow here assume that
at the highest resolution, the stone artefact assemblages represent an average of
roughly 500-1000 years and fluctuations in depositional contexts more frequent than
1000 years were unable to be detected with the material available.
Building testable hypotheses
In chapter three I argued that the most productive approach to analysing typical
mainland Southeast Asian flaked stone artefacts is by using them to test predictions
from three optimal foraging models. I described the patch choice model, the central
place model and the model of optimal dispersion and group size. In chapters four and
five I discussed the method and theory linking these models to flaked stone artefact
assemblages. Now that some details are known about the environmental parameters of
the study area and the two sites it is possible to be more specific about the predictions
that can be made about the sites. The predictions presented here are synchronic,
without reference to chronology. In the following chapter, when climate history is
reconstructed for the study area, the predictions will be further refined to include a
diachronic dimension.

6. The sites and their setting
143
The patch choice model predicts that areas of higher patch yields will have evidence of
more intensive human occupation as people exploit a reliable and abundant resource.
Under current conditions it might be expected that the environs of Tham Lod have a
higher yield than Ban Rai because of Tham Lod’s close proximity to the river. Ban Rai
is also near montane forests which have a lower biomass than the semi-evergreen
forests surrounding Tham Lod. All other things being equal, the patch choice model
predicts a greater density of stone artefacts might be expected at Tham Lod compared
to Ban Rai.
The central place model predicts that as travel and transports costs increase then so
should the amount of pre-processing of resources to optimize the delivery of useful
material at the central place. Given that in this landscape the river banks are the main
source of the highest quality material for making stone artefacts, the difference in
distance from the river is likely to be a substantial influence on travel and transport
costs at the two sites. Tham Lod is adjacent to the river while Ban Rai is much further
away and requires a steep ascent to travel from the river to the site. Under current
conditions, it can be predicted from the central place model that pre-processing of
stone will be substantially more frequent in the Ban Rai assemblage compared to Tham
Lod. The main prediction here is that the Ban Rai assemblage will be ‘incomplete’ with
evidence of stages of stone reduction missing from the assemblage, having taken place
off-site.
The model of optimal dispersion and group size predicts that a residential settlement
pattern is adaptive in stable/evenly dispersed environments and a logistical settlement
pattern is a better strategy in mobile/clumped environments. This model has
potentially interesting implications for predicting human responses to seasonal
variation, but chronological resolution at the two sites is too low to test these
predictions with confidence. At a more general scale, it can be predicted that Tham Lod
is more suited to a residential settlement pattern because of its close proximity to the
river and the high biomass of the surrounding semi-evergreen and dry deciduous
forests. The density of these forest types constrains mobility and the abundance and
closeness of resources, especially stone, means that high logistical mobility was
probably unnecessary as well as inefficient. On the other hand, Ban Rai is likely to be
more suited to logistical settlement because of its altitude. It is predicted that occupants
of Ban Rai would have taken advantage of the relative openness of the montane forests

6. The sites and their setting
144
to engage in long range foraging trips. Similarly, the distance of Ban Rai from a reliable
water source means that water is an unstable resource and foragers probably had to
journey some distance to ensure access to water and resources that concentrate around
upland water sources such as game. The distance of Ban Rai from reliable sources of
stone suggests that people made targeted forays to ensure an adequate supply and
were more selective about quality than occupants of Tham Lod. The main prediction of
the optimal dispersion model is a relatively strong signal of greater assemblage
reduction, as a result of individual provisioning, at Ban Rai compared to Tham Lod.
Summary
This chapter has surveyed the environmental settings of the two sites that are the focus
of this project. The current climate and resource parameters have been presented and
some initial predictions about the stone artefact assemblages have been developed.
This information about current conditions will be used in the following chapter to
reconstruct the past conditions of prehistoric hunter-gatherers’ habitats. Then a more
refined set of predictions will be presented for testing in chapter eight.

6. The sites and their setting
145
Figure 6.1. Local topography and hydrology of Tham Lod and Ban Rai

6. The sites and their setting
146
Figure 6.2. Typical view of the study area landscape from a high point near Tham Lod Rockshelter.
Note the rugged topography and the cleared valley where modern agriculture and settlement is
concentrated.
Figure 6.3. View of Lang River near Ban Rai. Note the relatively dense vegetation and the cobble
river banks. From Shoocongdej et al. (2003a).

6. The sites and their setting
147
Figure 6.4. Schematic of the relationship between forest types, elevation and wetness in northern
Thailand. Modified from Rundel and Boonpragob (1995).

6. The sites and their setting
148
Figure 6.5. Views of Tham Lod
a) View to Areas 1-3, note the red vertical stains on
the rockshelter wall. From Shoocongdej et al.
(2003b).
b) View over Areas 2 (L front) and 3 (R back),
both backfilled, from Area 1, note the flat area in
front of the rockshelter (author photo)
c) Excavation in progress at Area 1. From
Shoocongdej et al. (2003b). d) Completed excavation at Area 1 (author photo)

6. The sites and their setting
149
Figure 6.6. Plan of excavations at Tham Lod. The contour lines show the height above the plain in
front of the rockshelter. Modified from Shoocongdej et al. (2003b).

6. The sites and their setting
150
Figure 6.7. Stratigraphic section of Tham Lod Area 1. Modified from Shoocongdej et al. (2003b).

6. The sites and their setting
151
Table 6.1. Dates from Tham Lod Area 1. Dates without a SD for the calibrated age were
determined by thermoluminescence methods, the remainder were determined by AMS radiocarbon
methods. All ages are in years before the present.
Excavation
unit Age
1 SD
for age
Calibrated
age
1 SD for
calibrated
age
Dated material Lab code
4 12,100 60 14,070 140 organic sediment Beta-168223
7 13,640 80 14,764 60 organic sediment Beta-168224
9 13,422 541 13,422
calcrete Akita-TL7
17 24,920 200 29,910 270 charred material Beta 194122
18 20,000 117 23,900 180 Margaritanopsis laosensis Wk-20398
24 22,257 154 22,257
sedimentary quartz Akita-TL12
27 29,318 336 34,500 500 Margaritanopsis laosensis Wk-20399
28 22,190 160 26,740 400 shell (unspecified) Beta-172226
31 32,380 292 32,380
organic sediment Akita-TL10
32 34,029 598 39,960 1050 Margaritanopsis laosensis Wk-20400
Figure 6.8. Age-depth plot for Tham Lod Area 1 with linear regression line and equation.
y = 791.4x + 9599.7
R² = 0.7822
0
5,000
10,000
15,000
20,000
25,000
30,000
35,000
40,000
45,000
0 5 10 15 20 25 30 35
Calibrate
d years BP
Excavation unit

6. The sites and their setting
152
Figure 6.9. Views of Ban Rai
a) View across Ban Rai Rockshelter, shallow trenches are visisible in Area 3 on the left. From
Shoocongdej et al. (2003a).
b) Excavations in progress at Ban Rai Area 3. Rulers are 1 m. From Shoocongdej et al. (2003a).
c) View of the deeper levels at Ban Rai Area 3. From Shoocongdej et al. (2003a)

6. The sites and their setting
153
Figure 6.10. Plan of excavations at Ban Rai. The surface is strewn with wood from log coffins.
Modified from Shoocongdej et al. (2003a).

6. The sites and their setting
154
Figure 6.11. Stratigraphic section of Ban Rai Area 3. Modified from Shoocongdej et al. (2003a).

6. The sites and their setting
155
Table 6.2. Dates from Ban Rai Area 3. All ages are in years before the present.
Excavation
unit Age
1 SD
for age
Calibrated
age
1 SD for
calibrated
age
Dated material Lab code
3 7040 60 7870 60 Margaritanopsis laosensis OZJ686
10 6600 70 7500 50 Margaritanopsis laosensis OZJ687
12 6850 70 7700 70 Margaritanopsis laosensis OZJ688
17 7950 70 8820 130 Margaritanopsis laosensis OZJ689
18 7250 40 8080 60 charred material Beta-168220
22 8850 50 9970 140 charred material Beta-168221
23 8190 50 9150 90 charred material Beta-168222
Figure 6.12. Age-depth plot for Ban Rai Area 3
y = 160.51x + 5807.9
R² = 0.7797
0
2,000
4,000
6,000
8,000
10,000
12,000
0 5 10 15 20 25
Calibrate
d years BP
Excavation unit

7. Palaeoecological context
156
7. Palaeoecological Context of the Study Area
Introduction
In addition to the details of temporal variation presented in the previous chapter, to
refine and reliably test hypotheses generated by the models proposed in chapter three
it is necessary to have a palaeoecological record to provide inputs into the models. This
chapter first surveys relevant previous work and refutes earlier arguments that the
seasonal tropics show little difference between the climates of the Pleistocene and
Holocene. To remedy some of the problems of previous work a highly localised, high
resolution palaeoclimate study of oxygen isotopes was undertaken. For this study,
freshwater bivalves were recovered from the archaeological excavations at Tham Lod
and Ban Rai and sampled for isotopic analysis. The reliability and robustness of this
isotope record is demonstrated and it is argued to be a suitable proxy for
palaeoecological conditions during the prehistoric occupation of Tham Lod and Ban
Rai. Interpretations of climate history during the period of human occupation at Tham
Lod and Ban Rai are discussed and the predictions of the foraging models are further
refined. The raw data that this chapter is based on are available by contacting the
author via the Department of Archaeology and Natural History, Research School of
Pacific and Asian Studies, The Australian National University.
Regional Climate Change and Variability
There are a variety of archaeological perspectives on regional climate change and
variability in mainland Southeast Asia, highlighting the need for robust data. For
example, Gorman (1971a) claims that global climatic events have had negligible impact
on tropical environments. Gorman notes that eustatic sea level changes after 25,000 BP
would have altered the preservation of coastal sites and the area of ‘optimum’ hunter-
gatherer habitats. He cites extant fauna present in Niah Cave at 32,000 and continuity
of plant taxa in a pollen core from Taiwan as evidence of generally similar climates
from the late Pleistocene to recent times (Gorman 1971b: 59-62). In his review of
Hoabinhian evidence from mainland Southeast Asia he does not suggest that these sea
level changes might have been part of a wider suite of climate changes requiring any
substantial modification of human behaviour or technology (Gorman 1971a).

7. Palaeoecological context
157
On the other hand, Anderson (1988) argues that climatic events have influenced major
cultural changes amongst SE Asian hunter-gatherer populations. As noted in chapter
two, Anderson suggests that cooler and drier conditions during the Pleistocene created
savannah conditions on the Malay Peninsula that made animal hunting a successful
mode of subsistence. As a result the Pleistocene human occupants made small flake
tools as hunting implements and the larger cobble artefacts only appear later when the
climate becomes warmer and wetter and hunting implements become less important in
human subsistence technology. Anderson’s arguments are mostly based on global
climate data indicating differences in average temperatures between the Pleistocene
and Holocene.
In part, this discrepancy between Gorman and Anderson is due to Gorman working
much earlier when fewer data were available. The environmental history of mainland
Southeast Asia is poorly documented relative to the rest of the world (Penny 2001), but
the number of studies has been steadily increasing. A review of current evidence
shows that Anderson was more accurate but high variation between different records
in mainland Southeast Asia means that only the broadest trends appear over wide
areas. This variability emphasises the need for site-specific climatic records for
describing robust relationships between human behaviour and climate. The work of
Hastings and Liengsakul (1983) is notable because it is the first broad overview of Late
Quaternary climate change for mainland Southeast Asia using data from that region.
They interpret climatic conditions from nine radiocarbon dated stratified sediments
throughout Thailand. They state that the period from 60,000 BP to 30,000 BP was cool
and dry, followed by a warm and wet period until 20,000 BP, then returning to cool
and dry conditions until about 11,000 BP at the beginning of the Holocene when warm
and wet conditions resumed. Changes in swampy mangrove vegetation in a pollen
core from Chanthaburi Province, southeast Thailand similarly suggests sea level
regression at about 20,000 BP and sea level increases at about 8,400 BP (Pramojanee and
Hastings 1983).
Pollen and other kinds of microflora are the main sources of evidence for more recent
palaeoclimate studies in mainland Southeast Asia. Maloney(1992) describes sequences
of pollen from 33 locations in mainland and island Southeast Asia including pollen
from deep sea cores, archaeological sites and dry land pollen cores. He notes that most
of these cores are only late Holocene sequences, many contain incomplete descriptions

7. Palaeoecological context
158
of pollen taxa and many of them have no radiocarbon dates at all, limiting their
usefulness for palaeoclimate reconstruction. His synthesis of these cores indicates that
most dry land pollen cores only yield evidence for very localised vegetation changes
within freshwater swamp forest or mangrove swamp, or a change from mangrove
swamp to freshwater swamp (Maloney 1992).
More recently, flora microfossils have been described from four sediment cores
extracted from three lakes in south, north and northeast Thailand (Penny 2001, White
et al. 2004). The core with the oldest sequence, spanning 40,000 years, was taken from
Nong Pa Kho (NPK), taken from a peat swamp on the Korat Plateau, northeast
Thailand (Penny 2001). A 230 cm core was dated with five radiocarbon determinations
in the following stratigraphic sequence: 6700±50 BP, 5970±60 BP, 12,350±60 BP,
11,540±90 BP and 38,300±600 BP (uncalibrated). The oldest date is unusual given the
relatively short core length and the inversion at the third and fourth dates is difficult to
explain but may result from growth of an intrusive root (Penny 2001). The Pleistocene
sequence is remarkable because of its environmental stability, in contrast to high
altitude sites where temperature changes seem to have resulted in large altitudinal
migrations of plant taxa (Flenley 1979, 1998, Stuijts et al. 1988). From the base of the
core to about 11,000 BP the record is dominated by a stable majority of Pine/Oak forest
taxa such as Pinus, Quercus, and Cyperacae as well as relatively high proportions of
charcoal. This suggests drier and cooler conditions that favoured an expansion of the
range of montane forests and increased fire events. The stability of the Pine/Oak forest
is at odds with local geomorphological evidence from Tung Kula Ronghai on the
southern Khorat Plateau, northeast Thailand, where an organic sand unit dated to
34,000-20,000 BP is interpreted by Loëffler et al. (1983) to indicate a humid phase just
before the last glacial maximum. Penny (2001) suggests that this disagreement is
because the Pine/Oak taxa represented by the core have a wide ecological tolerance,
strong tolerance for fire and egregious growth and profligate pollen production,
leading to an exaggerated impression of community stability.
Nevertheless, cool-adapted species such as Alnus, Ulmus and Artemisa are prominent
during the Pleistocene section of NPK, with Alnus peaking at 21,000 BP suggesting a
subtle reduction in temperature around the glacial maximum. Similarly high values of
these three species also occur between approximately 13,400 BP and 11,600 BP,
suggesting cool and dry conditions again just before the Holocene. This is coincident

7. Palaeoecological context
159
with an increase in the rate of dust accumulation in the Malan loess of central China,
also suggesting a drop in temperature. This increase in dust accumulation occurs just
before the Younger Dryas, which is manifest by a reduction in dust accumulation in
the loess, suggesting a strengthening of the warm, moist summer monsoon (Zhisheng
et al. 1993). The influence of the Younger Dryas is not evident at NPK.
The Holocene sequence from NPK indicates a rapid shift from Pine/Oak forest to
tropical broad-leaf taxa, especially Cephalanthus, and ferns such as Lygodium,
suggesting possibly swamp-forest or inundated riparian vegetation as a response to
wetter and warmer conditions (Penny 2001). Changes in the Holocene taxa are
extremely dynamic, but it is possible to discern a few important shifts. Modern
vegetation appears at about 6300 BP. At about 5500 BP there is an increase in charcoal
and at 4700 BP there is a decline in the abundance of many dryland taxa. Penny (2001)
suggests that these changes might have resulted from increased burning and
subsequent disturbance, but notes that the extent of these influences or their causes is
not clear.
Also on the Khorat Plateau of northeastern Thailand is the lake Nong Han
Kumphawapi (NHK), in Udon Thani Province, where two cores (1.41 m and 6.18 m)
have been extracted (Penny 1999). Thirteen radiocarbon determinations are available
for the two cores indicating sediment accumulation from about 14,350 BP to 2000 BP
(uncalibrated). The short Pleistocene sequence has little pollen but is characterised by
mottled sediments, suggesting periodic wetting and drying and a strong seasonal
contrast in the climate (Penny 1999). The dominant taxa represented by the few spores
present are Pinus, Celtis and Uncaria/Wendlandia, suggesting relatively open and dry
conditions. The period 10,200-9500 BP is marked by high rates of sedimentation,
suggesting high sediment mobility in the lake catchment probably due to increased
precipitation from a stronger southwest monsoon with relatively open vegetation
(Kealhofer 1996). After about 9800 BP taxonomic diversity increases considerably with
Altingia, Combretacae/Melastomataceae, Dipterocarpaceae, Elaeocarpus and others
suggesting an expansion of dry deciduous or semi-evergreen forests and more humid
conditions than present (Penny 1999). At 6600-6400 BP many of these lowland taxa
disappear and there is an increase in charcoal and a dramatic increase in Pinus and
Cephalanthus. Penny (1999) suggests that this change might be due to the high tolerance
of Pinus to frequent fires and exposed soils and their prolific pollen production. This

7. Palaeoecological context
160
change might be a result of a termination of a strengthening of the summer monsoon,
with temperatures and precipitation declining or anthropogenic disturbance. The cause
is ambiguous because chronological resolution of the monsoon event and the NHK
core is inadequate to be certain of a relationship, and there is no robust archaeological
evidence for human activity on the Khorat Plateau at that time. These conditions
persist until about 2800 BP when charcoal quantities decline, and secondary forest taxa
such as Trema and Macaranga become more common, probably a result of changes in
anthropogenic burning from widespread forest burning to more restricted burning
areas (Kealhofer and Penny 1998). These Mid and Late Holocene changes at NHK
highlight one of the weaknesses of microflora records, namely that the anthropogenic
signal can interfere with the climate signal, making it difficult to discern the climate
mechanisms that are interacting with human ecological systems.
To the west of NHK and NPK is Kwan Phayao, a lake in Phayao Province, northern
Thailand. A 5.88 m core was extracted from the lake and dated with five radiocarbon
determinations from about 19,000 BP to 640 BP (uncalibrated). The Pleistocene
sequence is very short, with a date of 19,190±120 BP (Beta-099704) at 546-548 cm depth
and a date of 9850±50 (Beta-106544) at 527-531 cm depth, only about 17-19 cm apart,
suggesting very slow sedimentation or erosion during this time (White et al. 2004). The
brief Pleistocene sequence is characterised by Pine/Oak woodland, suggesting cooler
and drying conditions resulting in an expansion of this type of forest into lower areas
than it currently occupies. Unusually, charcoal quantities are relatively low during this
period, indicating that fires may have been relatively infrequent. Notable changes in
the Holocene sequence include a decline in Dipterocarpaceae (Hopea/Shorea type,
Dipterocarpus type), Macaranga and Fagaceae (Lithocarpus/Castanopsis type and Quercus)
at around 4500-1700 BP, possibly reflecting the development of drier conditions related
to a regional weakening of the southwest monsoon flow over Indochina (Maxwell and
Liu 2002, White et al. 2004). Pine/Oak tax dominate the sequence throughout the
Holocene, even though they only currently grow on slopes 470 m above the lake,
highlighting the confounding effect of the prolific pollen production that is typical of
these taxa. After 1860 BP there is an increase in charcoal quantities and regrowth taxa
such as Macaranga and Trema, interpreted by White et al. (2004) as indicative of forest
disturbance through burning, probably anthropogenic.

7. Palaeoecological context
161
To the south of Thailand is the Nong Thale Song Hong (NTSH) core, a 3.8 m core taken
from a closed basin lake in Trang Province, within 75 km of the archaeological sites
Lang Rongrien and Moh Khiew. There are five radiocarbon dates for the core, but the
two stratigraphically lowest ones are inconsistent with the upper three and have been
rejected as inconsistent. The three accepted dates are 6330±50 BP, 10,820±50 BP and
21,170±90 BP, all uncalibrated (Maloney 1999). The phytolith sequence in the NTSH
core shows relatively high percentages of burnt phytoliths and grass phytoliths during
the Pleistocene period. During the Holocene these two groups decline substantially
and arboreal phytoliths increase concomitantly (Kealhofer 2002). This suggests more
frequent burning and more grassland with less forest during the Pleistocene, indicating
drier conditions than the Holocene.
Pollen samples from NTSH are restricted to the Holocene levels, except for one sample
with an interpolated age of about 17,500 BP. The single Pleistocene sample is
dominated by Castanopsis sp., suggesting open forest but with enough standing water
suitable for the aquatic plant Nymphoides. Nymphoides continues into the early Holocene
and is joined by Castanopsis indica and Lawsonia inermis, suggesting a swamp forest
community during conditions of high lake levels, perhaps related to a high
groundwater table as sea levels transgress the continental shelf and annual rainfall
increased with the strengthening of the southwest monsoon (White et al. 2004). These
conditions persist until about 7600 BP when deciduous and evergreen taxa become
dominant (Dipterocarpaceae, Acacia, Combretaceae and Lagerstroemia), probably
indicating edaphic dryness (Maloney 1999). Increased locally dry conditions are also
indicated at about 7000 BP with relatively high quantities of the regrowth tree
Macaranga, the fern Lygodium and grass pollen as well as the disappearance of the palm
Borassodendron machadonis after 4000 BP. After 4000 BP there are indicators of forest
disturbance with increased charcoal quantities and secondary growth taxa (Macaranga,
Mallotus, Trema and Urticaceae/Moraceae). At about the same time are increases in
swamp forest taxa suggesting locally wetter conditions (Elaeocarpus ruqosus, Carallia
brachiata, Nymphoides and Lycopodium cernuum). It is unclear how clearly the pollen
record is reflecting regional climate change or human landscape modification in these
Late Holocene samples, although the presence of the economic taxa Palaquium, Piper
and Areca after 1500 BP strongly suggest human influence (Maloney 1999, White et al.
2004).

7. Palaeoecological context
162
Although these pollen and phytolith records have substantial gaps and ambiguities in
interpreting the taxonomic variation, it is possible to summarise some of the broad
climatic trends that they represent. Cores from areas surrounding the study area, such
as South Asia, East Asia and offshore generally show three major events in Late
Pleistocene-Holocene climate dynamics: (1) a Pleistocene-Holocene transition from cool
and dry conditions to warmer and wetter conditions, (2) an Early to Mid Holocene
precipitation maximum and (3) and a Mid to Late Holocene transition to drier
conditions, usually involving stronger seasonality (Maxwell 2001, Maxwell and Liu
2002). The Thai cores also include these elements, but not as a uniform, synchronous
response. The Pleistocene seems to have been relatively drier and cooler than current
conditions, with an increase in the modern range of Pine/Oak forests and increased
burning events. This trend is comparable with evidence from cores in higher latitudes
and altitudes in Yunnan (Shaomeng et al. 1986, Xiangjun et al. 1986). In general the
Holocene sequences of the Thai cores are characterised by high variability over time
and space. The timing and impact of the Pleistocene/Holocene transition varies, as does
the timing and impact of the Early Holocene monsoon maximum. This variability has
also been documented in northeastern Cambodia (Maxwell 2001). The Mid and Late
Holocene climate record from the Thai cores is also clouded by possible anthropogenic
forest disturbance, reducing robustness of the climate signal in the pollen record.
Paleoclimate Proxies at Tham Lod and Ban Rai
The key attribute of the pollen evidence is variation under the influence of local
conditions. With none of the cores inside the study area or in similar upland
environments, they are unsuitable as palaeoclimate proxies for the archaeological
sequences from Ban Rai and Tham Lod, except as general indicators of contrasting
conditions between the Pleistocene and Holocene for mainland Southeast Asia.
Unfortunately this low level of spatial and chronological resolution adds little to what
is already known about global climates, highlighting the importance of climate records
generated from proxies recovered at or very near the archaeological sites. The highly
rugged topography of the study area combined with its highly seasonal climate means
that there are no lakes or swamps to provide ideal coring conditions. Dan Penny
(personal communication) has examined sediments from Ban Rai and Tham Lod and
found pollen grains and fern spores present, though the preservation is generally poor.
He found that the number of taxa is relatively low and many samples contained no
pollen. Those that contained pollen were characterized by upland high altitude wind-

7. Palaeoecological context
163
pollinated plants, local grasses and ferns. The incompleteness of the pollen record
means that it is not possible to discern change over time with any confidence.
Pumijumnon and Trikanchanawattana (2006) also investigated pollen records in the
study area, taking samples from seven locations near Ban Rai and Tham Lod, as well as
examining sediments from the two rockshelter excavations. Two dates were obtained
for the non-rockshelter locations, giving relatively young ages of 280 BP and 650 BP.
Like Penny, they found that sediments from the rockshelters contained insufficient
pollen to make conclusions about prehistoric climates (Trikanchanawattana 2005). The
relatively shallow time depth of the other samples similarly precludes any insights into
palaeoclimate. Nevertheless, Pumijumnon and Trikanchanawattana (2006) state that
past vegetation was similar to the present, but with a cooler climate indicated by
higher quantities of Pinus and grasses with reduced quantities of Circulisporites and the
plankton Concentricystes which suggest less humid conditions and less frequent
flooding. However, this trend is not consistent, with some locations showing a trend
towards increased dryness over time. This mosaic of changes over a relatively short
time suggests that the pollen sequences reflect highly localized conditions. The causes
of these changes are unclear, although it seems likely that anthropogenic disturbance is
a significant influence since the pollen samples span a period of increasing population
and agricultural activity in the study area. In any case they are of limited use as
palaeoclimate proxies for the archaeological sequence at Tham Lod and Ban Rai
because of their short time depth and non-synchronous patterns.
Another line of evidence comes from Wattanapituksakul’s (2006a) identification and
morphometric analysis of mammal teeth excavated from Tham Lod. He identified 2300
mammal teeth specimens, representing a minimum number of 218 individuals classed
into 31 taxa, mostly Cervidae, Sus scrofa, Bovinae and Pecora. Most mammals
represented in the sequence have wide habitat ranges and are not diagnostic of
anything less than extreme changes in local vegetation or climate. Also, analysis of
change over time is limited by the lumping of excavation units into five analytical
units, reducing chronological resolution and resulting in a very high number and
diversity of specimens in a single analytical unit. Like Pumijumnon and
Trikanchanawattana, Wattanapituksakul concludes that, in general, past climates were
similar to current conditions. Notable taxa represented in the mammal teeth
assemblage are Ursus tibetanus, Rhinocerotidae, both large-bodied mammals, and

7. Palaeoecological context
164
Naemorhaedus. Curiously, the habitat of Rhinocerotidae is dense forest and swamp,
while Ursus tibetanus and Naemorhaedus typically prefer open montane habitats. All
three of these taxa occur in Pleistocene and Holocene units, suggesting that taxonomic
representation may be more indicative of human foraging ranges and strategies rather
than changes in mammalian habitat ranges related to climate change.
One detail from the teeth assemblage that might reflect climate is a gradual reduction
in the width of the first and second upper molars of Naemorhaedus from the Pleistocene
to the Holocene. This reduction in molar width is argued by Wattanapituksakul
(2006b) to reflect a reduction in body size of Naemorhaedus possibly in response to a
decrease in the quality of food, the seasonal availability of food or a warmer climate.
This supports the pollen and other data in suggesting that the Holocene was
significantly warmer than the Pleistocene, but adds little in terms of magnitude or
chronological resolution.
A New Palaeoclimate Proxy for Tham Lod and Ban Rai: The freshwater bivalve
Margaritanopsis laosensis
To overcome the limitations of low chronological resolution, poor preservation and
anthropogenic interference with the climate signal it was necessary to seek a proxy
other than microflora or mammal teeth. Ideally this proxy would be present in all
excavation units from Ban Rai and Tham Lod so that a chorological resolution
equivalent to the stone artefact sequence could be achieved. This proxy was also
required to archive climatic information in a way that was relatively independent of
anthropogenic influence. The only material that met these conditions was the
freshwater bivalve Margaritanopsis laosensis, the most abundant shell at both sites (99%
mass of all shell at Tham Lod and 96% mass of all shell at Ban Rai) and the only taxa
that occurs in more than 95% of the excavation units at both sites. In brief, the theory
behind the choice of shell as a proxy is that while the shell organism is alive and
growing the hard part of its shell, the isotopic properties of the shell will reflect the
isotopic properties of the water it lives in, which varies according to climatic
conditions.
The main assumption here, as with the pollen and mammal teeth, is that the shells
entered the archaeological site shortly after they died and stopped archiving climatic
conditions. If the shells died long before they entered the site (ie. they were antiques)
then their palaeoclimate signal will not be synchronised with the stone artefacts, and

7. Palaeoecological context
165
will be of limited use for analysing relationships between the two records. The
assumption that the death of the shells was contemporary with the strata they were
recovered from is supported by the sequence of radiocarbon dates discussed the
previous chapter. For both sites the materials dated includes Margaritanopsis laosensis as
well as other organic materials and thermoluminescence analysis of sediments. The
relatively high correlation coefficients for the depth-radiocarbon age relationship
suggest that the deposition of the dated shells was contemporaneous with the rest of
the material in the strata the shells are found in. This means that the association of
shells and stone artefacts in excavation units is probably robust.
Stable Isotope Geochemistry and Freshwater Bivalves
The link between the shell and the climate that it lived in is complex, but relatively well
understood by palaeoecologists. The key is the equilibrium between the oxygen
isotopes shell carbonate in the water that the shell lives in. Atoms of a given element,
such as oxygen, with differing numbers of neutron (but identical numbers of protons
and electrons) are called isotopes. There are two types of isotopes, those that emit
radiation and gradually decay into another element or isotope, and those that are
stable (Hoefs 2004). Stable isotopes form during the decay of radioactive isotopes,
although many also formed during the explosions of stars at earlier times in the history
of the universe. Isotopes are important in geochemistry because they have similar
chemical properties (because of the identical numbers of electrons) but slightly
different physical properties because of their difference in mass (resulting from the
different numbers of neutrons). This difference in physical properties causes slight
differences in the reaction rates of molecules containing different isotopes (Hoefs 2004).
For example, during water evaporation, the heavier water molecules composed of 18O
are slower to evaporate than the lighter 16O because the 18O molecules require more
energy to change phase from liquid to vapour. Reactions that cause differences in
isotope ratios include basic physical processes such as melting, freezing, crystallisation,
condensation and evaporation, as well as more complex processes such as plant
photosynthesis and animal metabolism. This variation in reaction rates results in
variation in the ratios of commonly occurring isotopes, such as 18O /16O, 13C/12C and
14N/15N in the skeletons and flesh of living organisms.
The processes that result in variation in isotope ratios are called fractionation. There are
two kinds of fractionation, equilibrium fractionation and kinetic fractionation (Criss

7. Palaeoecological context
166
1999). Equilibrium fractionation describes bidirectional isotopic exchange reactions that
occur between two different phases of a compound at a rate where equilibrium is
maintained, for example the transformation of water vapour to liquid precipitation.
The temperature of the equilibrium reaction influences the degree of fractionation that
occurs, with higher temperatures generally causing faster reactions and greater
differences in isotope ratios. Kinetic fractionation is a unidirectional process where the
lighter isotope reacts faster and becomes irreversibly concentrated in the products of
the reaction. Examples of kinetic fractionation include biological processes such as
photosynthesis and respiration as well as evaporation. Living organisms prefer lighter
isotopes because of the lower energetic costs in reacting the lighter isotope compared
to the heavier one (Hoefs 2004). This preference can result in substantial fractionations
between the substrate (where the heavier isotope is more abundant) and the
biologically mediated product (where the lighter isotope is more abundant).
Kinetic fractionation is responsible for the variation in stable isotope ratios in biogenic
carbonate, such as from corals, molluscs and otoliths. Analyses of these carbonates
have become an important tool for reconstructing past environmental and climatic
conditions. There are three reasons why biogenic carbonates are useful palaeoclimate
archives. First, the carbon and oxygen isotopic ratios in the shell or skeletal aragonite
have a close relationship to the isotopic values of the water that the organism lives in.
Oxygen isotopes are the more important of the two because oxygen isotopes from the
water are incorporated into the shell carbonate. Carbon isotopes are also useful for
palaeoclimate reconstruction because some shell carbon is derived from ambient
dissolved inorganic carbon in the water. This dissolved carbon may come from plants
that grow in different habitats in the study area. However, shell carbonate also derives
from metabolic processing of carbon in the food digested by the shell organism (Geist
et al. 2005). There is no simple relationship between carbon isotope ratios in river water
and in shell carbonate (Dettman et al. 1999). This means that carbon isotope values of
shells are less directly influenced by the isotopic values of the water that they grew in.
However, the kinetic and metabolic effects on carbon isotope ratios are generally very
small (Auclair et al. 2004, Carre et al. 2005), so carbon isotope ratios can cautiously be
interpreted as an environmental signal.
A second reason why biogenic carbonates are useful is that they can survive thousands
to millions of years of burial, so they can provide data for a variety of spatial and

7. Palaeoecological context
167
temporal scales. Third, biogenic carbonate is generally deposited continuously during
the lifetime of an organism, providing potentially very high resolution records for
reconstructing past climates. More specifically, the isotopic signatures of oxygen and
carbon of shell carbonates growing in freshwater reflect the temperature and isotopic
concentration of the water in which the shell secretes its successive layers of calcium
carbonate.
There are two models for interpreting isotope signatures of riverine bivalve shell
carbonate (Dettman and Lohmann 1993). First is the ‘temperature-dominated’ model
where variability in oxygen isotopes in shell carbonate is a reflection of changes in
surface water temperature. This model is appropriate in fluvial systems that are
dominated by groundwater input where variation in the isotopic concentration of
meteoric water (rainfall) at seasonal scales is overwhelmed by the isotopic effects of
seasonal changes in water temperature. Higher water temperatures result in higher
metabolic rates, higher magnitudes of kinetic fractionation and greater differences in
the ratio of isotopes. Similarly, lower temperatures result in correspondingly low
metabolic rates and lesser differences in isotopic ratios. This model is suited to shells in
habitats where the seasonality of rainfall is low.
In habitats where rainfall seasonality is marked, such as the study area considered
here, a different model based on rainfall mediated isotopic changes is more
appropriate. This second model is the ‘water-based’ model, where the effects of
temperature-dependent oxygen isotope fractionation are greatly diminished relative to
seasonal changes in the oxygen isotope ratios of precipitation. In this model the
influence of regional climate on the isotopic composition of meteoric water is more
substantial than temperature. Changes in the oxygen ratio in river water are driven by
variations in the isotopic character of meteoric water, produced as atmospheric water
vapour moves inland from its oceanic source (Kaandorp et al. 2003).
To interpret the oxygen isotope values from the shells from Ban Rai and Tham Lod, the
‘water-based’ model is most relevant because variation in the ecology of the Lang
River, from which the shells were originally collected, is largely determined by
precipitation. During the dry season the river is very shallow, flow is slow and the
water is very clear. During the wet season high levels of precipitation increases the
volume and flow rates by several multiples and the water becomes opaque with silt

7. Palaeoecological context
168
and debris from runoff. Changes in surface water temperature, assuming they relate to
air temperature, are less pronounced.
This is a result of the monsoonal climate of the study area with distinct wet and dry
seasons resulting in high seasonal variation in precipitation. The northeast monsoon
brings cool and dry air from the Siberian anti-cyclone over major parts of Thailand
from November to February. During these months, eastern winds bring air of high
humidity that has traversed the South China Sea towards the East Coast of peninsular
Thailand. The southwest monsoon, which begins in mid-May and ends by mid-
October, brings 90% of the annual rainfall and air of high humidity originating from
the Indian Ocean (Khedari et al. 2002). Ideally, a year’s worth of river water and
Margaritanopsis laosensis specimens would have been collected as a control sample to
establish the isotopic variation that these monsoonal systems are responsible for
(Mannino et al. 2003). However, despite intensive searching and sampling kilometres
of river banks, this project was unable to locate specimens of Margaritanopsis laosensis,
and it is believed that the species is locally extinct due to pollution of the river from
intensive agricultural activity.
In the absence of a modern control sample it was necessary to simplify the model for
shells as palaeoclimate indicators. The initial plan was to sample single shells multiple
times across the life of each shell for sub-annual resolution of isotope ratios (Jones et al.
2005). Without a control sample to interpret these sub-annual variations this plan was
changed so that multiple samples from single shells were combined to produce an
average isotope ratio for the life of each shell. To interpret these results, the model of
the relationship between the shell and the climatic conditions it grew in is no longer
based on seasonal changes but instead relies on variation at a multi-year scale (since
shells of similar size have a typical lifespan of two to three years). More specifically the
oxygen isotope values of meteoric water are likely to increase during periods of
heightened aridity (when the water molecules containing the lighter 16O evaporate
leaving the heavier 18O to become relatively concentrated in the water) and decrease
during periods of increased precipitation (the effect of evaporation is much less and the
δ18O of the precipitation stays close to that of the source, the Indian Ocean). This model
predicts that oxygen isotope ratios of Margaritanopsis laosensis will show relatively high
ratios of 18O during periods of reduced rainfall and increased evaporation and

7. Palaeoecological context
169
relatively high ratios of 16O during periods of increased rainfall and reduced
evaporation.
Mineralogy and taphonomy of the shells
When shells for oxygen isotope analysis are recovered in areas where limestone
geology is dominant it is critical that the carbonate produced by the shell when it is
alive is aragonite rather than calcite. Aragonite and calcite are chemically identical
forms of calcium carbonate, but with different structures, symmetry and crystal shapes.
Shells can grow aragonite, calcite or both in alternating layers (Falini et al. 1996,
Thompson et al. 2000). Calcite is the major component of limestone, so when the shell
is made of calcite in limestone environments, it is impossible to be certain that the shell
calcite is a result of skeletal growth in the shell or taphonomic processes that have
displaced the biogenic mineral with calcite from the surrounding limestone. These
taphonomic processes can include carbonate recrystallisation and isotopic exchange
with the surrounding limestone. At Ban Rai and Tham Lod this is an important
concern, not only because of the limestone geology, but also because the high volume
of seasonal precipitation promotes dissolution and recrystallisation of carbonates in the
sediments that the water drains through. If the skeletal carbonate of Margaritanopsis
laosensis is calcite then it is unsuitable for isotopic analysis because the carbonate of the
shell is indistinguishable from contaminating limestone carbonate resulting from
taphonomic processes. This means that the oxygen isotope ratios of the shell carbonate
will not reflect the isotope ratios of the water it grew in, but instead the isotope ratios
of the surrounding limestone, which have no relation to the climate conditions
prevailing while the shell was alive.
To assess the viability of Margaritanopsis laosensis for oxygen isotope analysis a series of
small analyses were undertaken. Four specimens were selected from Ban Rai and four
from Tham Lod, from the upper, middle and lower excavation units of each site, to
investigate mineralogy and taphonomic alteration of the mineralogy. It was
hypothesised that if the shells were primarily aragonite, then some or all of the
aragonite in the older shells might have changed to calcite because of prolonged
exposure to the influence of the surrounding limestone and because aragonite is an
unstable mineral that slowly decays to form calcite. It was also hypothesised that
taphonomic processes might differentially alter the shell, with the best preservation of
the original shell mineral at the thickest area near the umbo.

7. Palaeoecological context
170
As a qualitative mineralogical test, the shells were sawn in half from margin to umbo
and stained with Feigl's solution which stains black in the presence of aragonite
(Friedman 1959, Lewis and McConchie 1994). This confirmed that Margaritanopsis
laosensis secreted aragonite but did not indicate if taphonomic processes had altered the
amount. To investigate taphonomic alteration, a preliminary mineralogical study using
X-ray diffraction (XRD) analysis was undertaken to quantitatively determine the
mineralogy.
The eight shells were sampled in four locations per shell using a 0.35 mm or 0.5 mm
drill bit to create a particulate sample. Prior to sampling, possible contaminants were
removed by cleaning the shells with a wire brush and an abrasive disk attached to an
electric rotary tool. The particulate sample was then ground finely in acetone using an
agate mortar and pestle for three minutes and then transferred by pipette to a quartz
sample plate and mounted in the XRD instrument. The samples were analysed at the
ANU Department of Earth and Marine Sciences using a Siemens D501 Diffractometer
(Copper target) and interpreted using computer software (database: PDF-2,
search/match: DiffracPlusEva 10.0, quantitative analysis: Siroquant V3).
The results of the analysis of these eight shells showed that they are mostly aragonite
with consistently small amounts of calcite. The percentage by mass of aragonite ranged
from 99.9 to 90.4 and of calcite from 9.6 to 0.1. Lower values were found in the samples
taken from the umbo compared to other parts of the shell. The average percentages of
calcite to aragonite are 3.1% to 96.5% at Ban Rai and 4.2% to 95.8% at Tham Lod.
Overall, there is an average of less than five percent calcite by mass in each shell.
Surprisingly the amount of calcite appears to decrease with the depth of the deposit
that the shell was recovered from and thus the age of the shell. The shell that returned
the highest calcite value of 9.6% mass is notable because it had a different colour and
texture to the other shells. This specimen was selected because it was thought to have
been cooked or burnt because the shell was much denser than the others and had a
blue-grey coloured exterior. The mineralogical analysis suggests that it was burnt,
which could cause decay of the aragonite into calcite and thus explain the higher
percentage of calcite.
Although these results come from only a small sample, they confirm that
Margaritanopsis laosensis is an aragonite producing species and suggest that taphonomic
processes probably have not substantially altered the mineralogy of the archaeological

7. Palaeoecological context
171
specimens. These results suggest that Margaritanopsis laosensis specimens recovered
from excavations at Ban Rai and Tham Lod are suitable for oxygen isotope analysis.
Interactions between mineralogy and isotope ratios
Before undertaking a detailed shell isotope study, it was necessary to ensure that there
was no interaction between the slight variations in shell mineralogy and oxygen
isotope ratios. If there is an interaction then shells sampled for isotope analysis need to
have very similar ratios of calcite and aragonite in order to discard the calcite influence
as a constant, substantially restricting the number of shells suitable for oxygen isotope
analysis. If there is no interaction then some variation in ratios of calcite and aragonite
is tolerable and sampling is not so constrained. This is important because although
Margaritanopsis laosensis is the most abundant shell species at both sites, the majority of
specimens are either burnt or broken - as might be expected if they were a food
resource - with only small numbers of intact specimens (<5) per excavation unit. If it is
necessary to sample only specimens with equivalent ratios of calcite and aragonite then
the sample might be so small that it will be unreliable. Also, isotope analyses are a
relatively expensive analytical procedure and instrument time was difficult to secure,
so it was prudent to fully assess the viability of Margaritanopsis laosensis with smaller
samples before conducting a larger scale analysis. To assess interaction between
mineralogy and isotope ratios a further 23 specimens were sampled for XRD to
determine the ratios of calcite and aragonite and for mass spectrometry to determine
the oxygen and carbon isotope ratios. The sample size was determined by the capacity
of a single automated run of the mass spectrometer and a smaller sample size was not
possible.
Samples of shell carbonate were extracted by sawing the shell in half from margin to
umbo and then drilling into the profile at the thickest part of the shell near the umbo.
Similar to the XRD sampling, a 0.35 mm or 0.5 mm drill bit was used and the
particulate matter was collected with subsamples of 180-200 μg weighed for delivery to
the mass spectrometer. Microdrilling was chosen as the most appropriate technique
because of the relatively low spatial resolution required (Spötl and Mattey 2006). The
samples were analysed at the ANU Research School of Earth Sciences on a Finnigan
MAT 251 using a Kiel Microcarbonate device, both computer-controlled using ISODAT
software. Following convention, results are reported as delta (δ) values in parts per mil
(‰). The delta value is an expression of the difference between the raw isotopic values

7. Palaeoecological context
172
of the shell and a standard, in this case Vienna Peedee Belemenite (VPDB) (Criss 1999:
35). National Bureau of Standards NSB 19 was used as an equivalent of VPDB. The
carbonate samples were reacted with two drops 105% phosphoric acid at a temperature
of 90°C over a reaction time of 13 minutes. Water was removed from the H2O-CO2 gas
evolved from this reaction by freezing and then vaporising CO2 in a double trap system
using liquid nitrogen. The pure CO2 then entered the inlet system of the mass
spectrometer for measurement (Ayling et al. 2006). The working gas used (KAZZA)
was composed of δ18O VPDB = - 1.88‰; δ13C VPDB = 2.39‰. Data was corrected for 17O
interference using the method of Santrock et al. (1985) and normalised so that a sample
of solid NBS 19 analysed by this method would yield the following results: δ18O VPDB
= - 2.20‰; δ13C VPDB = 1.95‰. The working gas values and ion correction methods are
reported here to allow comparison with data produced in different laboratories.
Analysis of these 23 specimens supported the findings of the previous analysis relating
to mineralogy and depth and showed only very weak interactions between mineralogy
and age and mineralogy and isotope ratios. The percentage of aragonite in the shell
varied from 100% to 88.4% with a mean of 95.9% and standard deviation of 3.7%. The
correlations between percentage aragonite and excavation depth (as a proxy for time of
exposure to carbonate recrystallisation, isotopic exchange with the surrounding
limestone or aragonite decay) are relatively weak (Tham Lod: r = -0.168, Ban Rai: r = -
0.475). This suggests that the time that the shells have been buried in the archaeological
deposits has had little effect on their mineralogy. Similarly, the variation in ratios of
calcite and aragonite in the shells has little effect on δ18O values (Tham Lod: r = -0.113,
Ban Rai: r = -0.037) or the δ13C values (Tham Lod: r = -0.240, Ban Rai: r = 0.176). These
results suggest that there is little interference in the climate signal in these shells from
taphonomic processes. The amount of calcite in the shell does not appear to
substantially increase over time nor does it substantially interact with the oxygen and
carbon isotopes of the shell. This makes variation in presence of calcite in the shell
difficult to explain, since one shell gave a value of 100% aragonite it is unlikely that
Margaritanopsis laosensis secretes calcite as well as aragonite (there appears to be no
information available about shell formation and carbonate metabolism for this species).
Similarly, with no strong relationship between calcite percentage and depth of
recovery it seems that taphonomic processes contribute little to the percentage of
calcite in the shells, unless it is an asymptotic relationship where the calcite percentage
increases only to a certain point. Nevertheless, the main implication of these results is

7. Palaeoecological context
173
that Margaritanopsis laosensis is suitable for oxygen isotope analysis for palaeoclimate
reconstruction.
Seasonal variation versus multi-year variation in isotope ratios
A final preliminary analysis was necessary to check that the isotopic variation between
specimens was greater than the seasonal isotopic variation within a specimen. If
isotopic variation between specimens was greater than the seasonal isotopic variation
within a single specimen then a reliable multi-year climatic signal can be obtained. If
the opposite is true and variation within a single shell is equivalent or greater than
variation between specimens then the intra-annual seasonal signal is dominant and a
multi-year climate signal cannot be reliably discerned. One specimen each from Ban
Rai and Tham Lod was also intensively sampled across the profile of the shell to
determine the seasonal range of variation in isotope values.
Thirty isotope samples were taken along the profile of the shell from Ban Rai and 22
samples from the Tham Lod shell, following cleaning and cutting the shell as described
above. The samples were evenly spaced across the profile from umbo to margin,
although the margins of both shells were damaged. The sequence does not represent a
full spectrum of carbonate deposition because the most recently deposited layers were
absent. The range of variation in δ18O for the multiple samples from the individual
specimens was 0.59‰ for the Ban Rai specimen (Figure 7.1) and 0.74‰ for the Tham
Lod specimen (Figure 7.2). This is less than the range of values for the 23 specimens
analysed for isotope-mineralogy interactions which have ranges of 1.47‰ (14
specimens from Ban Rai) and 2.49‰ (nine specimens from Tham Lod). These results
show that variation in isotopic ratios is greater between individual specimens than
within an individual specimen. This means that variation between specimens is likely
to contain a reliable climate signal.
Verifying 30,000 years of climate change at Tham Lod and Ban Rai
Given the encouraging results of these small preliminary analyses, it was decided to
select three shells from all excavation units where Margritanopsis laosensis is present to
sample for isotopic analysis, with one of the three specimens also sampled for XRD
analysis to check that no unusual taphonomic processes had occurred in each sampled
excavation unit. Three was chosen because it was the maximum number of intact
specimens in most of the excavation units. These data were combined with data from

7. Palaeoecological context
174
the previous analysis to produce a total of 155 samples analysed for isotope ratios.
Analytical precision for replicate measurements (n = 36) of δ18O in NBS-19 was ±0.06‰
(2SD). Twenty-six excavation units at Tham Lod were sampled and 14 excavation units
were sampled from Ban Rai. This gives a relatively detailed sequence of climate change
spanning from about 6000 BP to about 35,000 BP.
Figure 7.3 shows the δ18O values for Ban Rai and Tham Lod with interpolated age
values on the horizontal axis determined by the regression equations described in the
previous chapter. Before examining the record in detail, it is important to establish the
reliability of the range and magnitude climate signal by comparing it to similar
sources. This is important because the Holocene data come from Ban Rai and the
Pleistocene data from Tham Lod with no overlap, so it is necessary to investigate the
possibility that the different locations might distort or add noise to the climate signal.
Although the shells at both sites come from the same river, there is a possibility that
slight variations in local conditions in the river might have influenced isotopic
fractionation in unpredictable ways (Shanahan et al. 2005).
No comparable data are currently available in mainland Southeast Asia. Further north
at two locations in China there are two locations where comparable oxygen isotope
data from speleothems have been analysed and published (Wang et al. 2001, Yuan et
al. 2004, Zhao et al. 2003). Detailed chronological and oxygen isotopic data from these
two locations was downloaded from internet archives at the World Data Center for
Paleoclimatology, Boulder, Colorado, USA (http://www.ncdc.noaa.gov/paleo/). Carbon
isotope data was not available. These records are significant because the cave
speleothems grow in relatively constant temperature conditions (similar to the mean
annual air temperature), so oxygen isotopic variation is mostly a function of the
oxygen isotopic composition of cave drip water, which is closely related to mean local
precipitation (McDermott 2004, Schwarcz 1986). This sensitivity to precipitation makes
the speleothem data ideal to test the model of isotope variation in Margritanopsis
laosensis as a function of precipitation and evaporation.
Wang et al. (2001) describe a very high resolution sequence of δ18O from five
stalagmites in Hulu Cave (also known as Tangshan Cave), 28 km east of Nanjing. The
sequence was dated with 59 230Th dates with analytical errors of 150-400 years,
spanning 75,000 BP to 11,000 BP. These data are useful for verifying the range and
variation in the isotope values from Tham Lod since it represents the Pleistocene phase

7. Palaeoecological context
175
of the sequence. The overlap of Hulu and Tham Lod starts at 34,000 BP and ends at
11,000 BP. During this time the maximum δ18O values from both sequences are close at
-4.70‰ from Hulu and -5.53‰ from Tham Lod, with the Hulu maximum occurring at
about 16,100 BP and the Tham Lod maximum at about 15,100 BP (Figure 7.4). Wang et
al. (2001) suggest that the sharp increase to this value represents Heinrich Event 1 (H1),
one of six extreme events when large amounts of glacial ice were released into the
North Atlantic ocean. The massive addition of fresh water and rock mass carried by the
glaciers altered ocean circulation patterns and produced anomalous deposits of ice-
rafted debris and high δ18O values in ice cores (Hemming 2004, Meese et al. 1997). Zhao
et al. (2003) have also observed this H1 event in another speleothem record from Hulu.
The similarly sharp increase in δ18O values at Tham Lod suggests that a signal from H1
may also be present in this sequence. However, the relatively low resolution of the
Tham Lod sequence means that further work is required in Thailand to reliably
demonstrate that peak dryness during the Last Glacial Maximum in northern China
and northwest Thailand was synchronised.
The minimum δ18O values of the two sequences are -8.67‰ from Hulu and -7.62‰
from Tham Lod. These minimum values are not synchronised with the Hulu minimum
at about 32,700 BP and the Tham Lod minimum at about 23,000 BP. Wang et al. (2001)
suggest that the Hulu minimum corresponds with a brief warm period recorded in the
Greenland ice cores as Greenland Interstadial five (Meese et al. 1997). The sequence at
Tham Lod does not appear to indicate this warm period, and the minimum value at
Tham Lod occurs at the time of the second highest value at Hulu, so there does not
appear to be any synchrony between the two records in documenting warm and wet
periods. Similarly, the steep drop at Hulu from about 14,800 BP to 13,000 BP, indicating
a rapid transition to warmer and wetter conditions, is not documented at Tham Lod.
Wang et al. (2001) interpret this rapid warming at Hulu as evidence of the Bølling-
Allerød Interstadial, a widespread warm period probably triggered by an exceptionally
large melting event of continental ice sheets into the North Atlantic, causing an
increase in sea levels and altering ocean circulation patterns (Weaver et al. 2003). The
Bølling-Allerød Interstadial is also documented in a another stalagmite record from
Hulu Cave (Zhao et al. 2003). The two δ18O values at 11,200 BP and 12,700 BP at Tham
Lod may indicate a signal of the Younger Dryas, the sharp increase in δ18O at Hulu
indicating a rapid return to glacial conditions after the Bølling-Allerød Interstadial, but
the resolution of the Tham Lod sequence is too low to identify this with certainty.

7. Palaeoecological context
176
It is unclear why there is the possibility of synchrony for the dry events but none at all
for the wet events in these Pleistocene sequences. There is a substantial difference in
elevation between the two sites with Hulu Cave only 100 m amsl (Yuan et al. 2004),
compared to about 640 m amsl for Tham Lod. The standard deviation of values at
Tham Lod is less than at Hulu (Hulu SD = 0.95‰, Tham Lod SD = 0.63‰), despite the
Hulu sample being much larger. This means that it is possible that the rugged upland
topography of Tham Lod creates orographic effects that dampen variation in the local
signal during regional changes in wetness and dryness. It may also be relevant that the
radiocarbon calibrations of Pleistocene dates at Tham Lod are difficult to make fine
correlations with the TL dates from the Chinese speleothems because CalPal uses a
hypothetical model for dates older than around 26,000 BP rather than actual
calibrations (Ramsey et al. 2006).
Nevertheless, there is good overall agreement between Hulu and Tham Lod (Figure
7.4), such as the general upward trend towards Last Glacial Maximum out of slightly
warmer and wetter conditions before 30,000 BP, as well as similar magnitudes and
range of δ18O values. This provides robust verification of the reliability of the Tham
Lod sequence and is especially impressive given that the Hulu sequence comes from
stalagmite carbonate and the Tham Lod sequence comes from shell carbonate. This
suggests that the primary control on δ18O values in both Pleistocene sequences is
precipitation rather than atmospheric temperature effects, as predicted by the model
for Margritanopsis laosensis. Kinetic effects from the secretion of biogenic carbonate by
Margritanopsis laosensis appear to have a negligible effect on isotopic ratios at the scales
examined here. If the net effect of temperature on aragonite δ18O is likely to be small,
then the δ18O signal will be dominated by changes in the δ18O of the seawater moisture
source and the amount or types of monsoon precipitations (Dansgaard 1964, Schwarcz
1986). Variations in surface seawater δ18O in the South China Sea, where the summer
monsoon draws its moisture, are well known for this period (Wang et al. 1999) and are
small relative to those observed in these Thai and Chinese isotope records. The
summer monsoon in southeast China contributes 80% of annual precipitation, with
δ18O of the summer rainfall being 10‰ lower than the winter rainfall (Zheng et al.
1983). Equivalent data are not available for Thailand, but because the Thai climate is
similarly dominated by summer monsoon rain (Khedari et al. 2002), it is reasonable to
explain the δ18O change in the Thai records in terms of changes in the ratio of summer
to winter precipitations (Wang et al. 2001, Zhao et al. 2003).

7. Palaeoecological context
177
A similar comparison for the Holocene sequence of δ18O values Ban Rai is available
from Dongge Cave, 18 km southeast of Libo, Guizhou Province. The elevation of
Dongge Cave is comparable to Ban Rai at 680 m amsl (Yuan et al. 2004). A very high
resolution sequence of δ18O values was obtained from two stalagmites. The isotope
sequence was dated by 66 230Th dates and spans from recent times to about 15, 600 BP,
continues again from about 40,000 BP to about 65,000 BP and again from about 90,000
BP to about 160,000 BP. These data are useful for verifying the reliability of the
sequence from Ban Rai, given that the Dongge sequence also overlaps with Hulu with
very little difference in the overlapping sections of the two Chinese sequences. This
continuity between the Chinese sequences is useful for evaluating the relationship
between the Ban Rai sequence and the Tham Lod sequence, now that the reliability of
Tham Lod has been established. The Dongge sequence overlaps the entire Ban Rai
sequence, spanning from about 5,900 BP to 9,800 BP. The range of δ18O values from Ban
Rai fits within the Dongge range (Figure 7.5). The Dongge sequence ranges from -
8.46‰ at 8,300 BP to-9.33‰ at 9,000 BP and the Ban Rai sequence ranges from 7.94‰
at 5,900 BP to -9.05‰ at 6,600 BP. There does not appear to be any synchrony in these
maximum and minimum values.
A slight trend of increasing dryness is apparent over the duration of the Ban Rai
sequence. This may reflect the end of the Middle Holocene Optimum, a warm-moist
event caused by changes in the Earth’s orbit that spanned 8,200–5,700 BP (Zhou et al.
2001). Yuan et al. (2004) do not identify this Optimum in the Dongge sequence, but it
has been described in pollen sequences elsewhere in China (An et al. 2000, Liew et al.
2006, Wang et al. 2007, Zhuo et al. 1998). Despite the absence of clear climatic events in
the Ban Rai sequence, the overall similarities in magnitude and variation with the
Dongge sequence (Ban Rai SD = 0.30‰, Dongge SD = 0.22‰) suggests that the isotope
sequence from Ban Rai provides a reliable climate signal and has not been substantially
distorted by local effects.
Interpreting the isotopic records from Tham Lod and Ban Rai
Given that the oxygen isotope ratios from Tham Lod and Ban Rai are generally reliable
indicators of past climatic conditions, it is now possible to examine these two
sequences as histories of climate relevant to the archaeological record. At the broadest
level there is a clear difference in isotope ratios between the Pleistocene and Holocene
periods. The average δ18O value for the period 6000 to 10,000 BP is -8.58‰ (SD =

7. Palaeoecological context
178
0.30‰) and for the period 10,000 to 34,000 BP the average value is -6.61‰ (SD =
0.63‰). Without a modern control sample it is not possible to calculate a water
temperature-isotope fractionation relationship to accurately predict past temperatures
from the isotope values in this location. However, the relationship between
temperature, δ18O of water and δ18O of biogenic aragonite has been empirically
determined as
T°C = 20.6 – 4.34(δ18Oaragonite - δwater)
where δ18Oaragonite is the value of the shell and δwater is the δ18O value of the water minus
0.2‰ (Dettman et al. 1999, Grossman and Ku 1986). The subtraction of 0.2‰ from the
δ18O value reflects the different scales on which they are normally measured (PDB or
VPDB for carbonate, SMOW or VSMOW [Vienna standard mean ocean water] for
water) (Dettman et al. 1999). This means that in general, a change in δ18Oaragonite of 1‰ is
approximately equivalent to 4-5°C. For Ban Rai and Tham Lod the difference of
average δ18O values between the Pleistocene and Holocene is -1.97, suggesting that the
Pleistocene was on average cooler than the Holocene in the range of 7.8°C to 9.8°C.
This change from cooler to warmer temperatures corresponds with
Wattanapituksakul’s (2006b) interpretation of the reduction in molar width of
Naemorhaedus as indicating a warmer climate in the Holocene.
The close correspondence between the Thai and Chinese sequences suggest that finer
scale variations in the Thai sequences are most reliably interpreted as changes in
monsoon precipitation, since the isotopic variation in the Chinese sequences is almost
entirely explained by monsoon variability (Wang et al. 2001, Zhao et al. 2003). The
Tham Lod sequence, starting at about 34,000 BP has a period of relatively wet but
unstable conditions until about 20,000 BP. This instability is indicated by the high
variability in mean δ18O values during this time. The warm and wet period at 35,000-
20,000 BP agrees with the stratified sediments described by Hastings and Liengsakul
(1983) and the geomorphological evidence described by Loëffler et al. (1983). The
variability in δ18O values is at odds with the Nong Pa Kho pollen sequence that
suggests environmental stability during the Pleistocene, supporting Penny’s (2001)
interpretation that the characteristics of the dominant Pine/Oak taxa result in an
exaggerated impression of community stability.
From about 20,000 BP to about 11,100 BP conditions are at their driest, including the H1
event of local maximum dryness at about 15,600 BP. This is probably the local

7. Palaeoecological context
179
signature of the Last Glacial Maximum, when local conditions were very dry and cool
in response to global increases in ice sheet area. This generally agrees with pollen
sequences from Kwan Phayao and Nong Han Kumphawapi suggesting dry conditions.
The Tham Lod sequence ends at about 11,000 BP, leaving a gap until in the data until
about 9,800 BP when the Ban Rai sequence begins. This gap, combined with the
relatively low chronological resolution of the excavation units, is unfortunate because
it means there is no data available to investigate the effect of the Younger Dryas, an
event that is controversial as a proposed cause of shifts from hunter-gatherer to
agricultural economies in west Asia (Bar-Yosef 2002, Moore and Hillman 1992,
Richerson et al. 2001, Willcox et al.). The Younger Dryas does not seem to be evident at
any of the Thai pollen cores.
The Ban Rai sequence, starting at about 9,800 BP, suggests consistently and
substantially higher precipitation than preceding times. Variability is also reduced,
compared to the Tham Lod sequence, although this may be an effect of the shortness of
the Ban Rai sequence. Increased precipitation during the Holocene is also
demonstrated by the pollen cores, but Holocene climate variability is argued to be
higher than during Pleistocene, in contrast to the δ18O records. As noted above, there is
a slight trend towards increasing dryness until the Ban Rai δ18O sequence ends at 5,900
BP, but the shortness and relatively low resolution of the sequence limits the reliability
of further identifications of climate events.
Interpreting variation in the carbon isotope ratios is difficult because of the uncertainty
about what controls them, not only in biogenic carbonates but also in speleothems also.
Currently the only comparable carbon isotope sequence is from one stalagmite at Hulu
dated from about 16,500 BP to about 10,700 BP (Zhao et al. 2003). Fluctuations in this
record are interpreted as indicating the relative abundance of plants that use the C3
photosynthetic pathway (mainly trees) versus those using C4 photosynthesis (mainly
tropical–subtropical grasses) or bioproductivity (that determines the amount of
isotopically light organic matter released to the soil) in areas where C4-type vegetation
is not present (Dorale et al. 1998 , Goede 1994), combined with some contribution from
inorganic processes acting on soil CO2 (Baker et al. 1997). In the case of shell carbonate
these mechanisms are also likely to be important because soil δ13C influences river
water δ13C through surface runoff. Given the close relationship between precipitation
and bioproductivity in monsoonal regions, it is reasonable to expect that δ13C values

7. Palaeoecological context
180
will become more negative during periods of higher precipitation, indicating a
dominance of trees or generally greater bioproductivity.
At a broad level, this relationship between δ13C and bioproductivity appears to explain
the Thai isotope records. During the Pleistocene when δ18O values suggest drier
conditions, the δ13C values indicate either dominance of tropical–subtropical grasses or
lower bioproductivity (Figure 7.6). Similarly, the increase in summer monsoon rains
suggested by δ18O values during the Holocene is complemented by δ13C values that
indicate an expansion of forest vegetation or greater bioproductivity. At a finer scale,
influences on δ13C values are harder to discern with the available data and
interpretation of the record becomes difficult. For example there is a sustained
downward trend from 20,000 BP to about 11,500 BP, but this is difficult to explain as
increased forest vegetation because it occurs at a time when oxygen isotopes suggest
hightened dryness. This ambiguity in the δ13C sequence from Margritanopsis laosensis
means that the δ18O sequence will be relied on as the primary palaeoclimate proxy.
Refining the hypotheses
Now that a climate history is available for the two sites it is possible to revisit the
synchronic hypotheses proposed in the previous chapter and refine them by adding a
diachronic dimension.
The patch choice model predicts that periods of relatively higher patch yields, lower
variance in patch richness or smaller distances between patches will have evidence of
relatively more intensive human occupation as people exploit a reliable and abundant
resource. In this case it is predicted that during wetter times there will be higher
densities of artefacts because the landscape can support more human activity. Linking
human population size to stone artefact assemblages is fraught with uncertainty, but
assuming all things are equal, a higher carrying capacity will result in more people
engaging in more stone artefact making and repairing episodes. At the broadest level,
it can be predicted that occupation during the Holocene will result in higher densities
of stone artefacts that during the Pleistocene. This means that Ban Rai, with its
Holocene sequence of occupation, is expected to have higher densities than Tham Lod,
which is an entirely Pleistocene sequence. This is at odds with the synchronic
hypothesis generated by the patch choice model which predicts the opposite, based on
Tham Lod’s favourable location relative to resources such as water and stone. Testing
these competing hypotheses is an excellent opportunity to discern the relative

7. Palaeoecological context
181
importance of proximity to resources versus climate in determining settlement
patterns.
The central place model predicts that as travel and transports costs increase then so
should the amount of pre-processing of resources to optimize the delivery of useful
material at the central place. There is little reason to think that climate change at the
scale described here would alter the distance of the sites from stone sources. However,
it is likely that drier conditions would favour an increase in the range of open montane
forests and a contraction of the denser semi-evergreen and dry deciduous forests. This
increase in relatively low biomass environments would increase travel times for the
collection of food resources. Similarly, travel time for procuring water would also be
increased during drier conditions as the availability of water would be restricted
because of higher evaporation and reduced precipitation. The prediction for the stone
artefact assemblage is that during drier periods there will be greater assemblage
reduction compared to wetter periods. During dry periods people are predicted to
have minimised travel and transport costs by minimising the mass of stone that they
carry, with more extensive preparation of artefacts before carrying them to other
locations. At the broadest level, Tham Lod is predicted to have the most extensively
pre-processed assemblage because of its Pleistocene occupation. Once again, this is at
odds with the synchronic hypothesis that predicts Ban Rai to have higher assemblage
pre-processing because of its greater distance to the stone source. These conflicting
predictions present another opportunity to test the relative importance of climate and
distance to resources.
Finally, the model of optimal dispersion and group size predicts that a residential
settlement pattern is adaptive in stable/evenly dispersed environments and a logistical
settlement pattern is a better strategy in mobile/clumped environments. From the
available data it is difficult to discern how the structure and distribution of resources
would have changed under different precipitation regimes. However, drier conditions
will result in an expansion of the low density montane forests as well as making
surface water less available. In this case, drier conditions can be equated with
mobile/clumped environments, and therefore the expected signal is more intensive
assemblage reduction than during wetter periods. At the broadest level, highest
assemblage reduction is expected at Tham Lod compared to Ban Rai because of the
Pleistocene aridity that characterises occupation at Tham Lod compared to the

7. Palaeoecological context
182
increased precipitation during the Holocene occupation at Ban Rai. Like the previous
two models, this prediction seems paradoxical given the opposite synchronic
hypothesis derived from this model in the previous chapter. The question of what is
the greatest influence of hunter-gatherer organisation of stone artefact technology,
climate or resource availability, has profound implications for all three models under
investigation here.
Summary
This chapter has reviewed previous work on palaeoclimate reconstruction relevant to
the study area. It is noted that there has been ambiguity about the importance of
climate change as an influence on human behaviour in mainland Southeast Asia. This
previous work is argued to be limited because of the distance of the pollen cores from
the study area, the importance of local influences on the pollen sequence and the extent
of anthropogenic disturbance interfering with the climate signal. Currently available
palaeoclimate data from the study area is similarly limited by poor preservation and
low chronological resolution. In response to these limitations a new palaeoclimate
proxy was developed by analysing oxygen isotope ratios in the freshwater bivalve
Margaritanopsis laosensis which is ubiquitous in the excavated sequences at Tham Lod
and Ban Rai. The theory of isotope geochemistry is presented, a model of isotopic
variation in Margaritanopsis laosensis developed and the analytical methods and results
are described. Surprisingly good verification of the isotope record at Tham Lod and
Ban Rai comes from speleothem records from China. A broad interpretation of climate
history at Tham Lod and Ban Rai is offered.
This new palaeoecological record has been used to make some refinements to the
predictions derived from the three optimal foraging models presented in chapter three.
Interestingly, at the broadest level the refined predictions incorporating the effects of
climatic variation over a synchronic dimension are exactly opposite to the diachronic
predictions derived from the same models in the previous chapter. This is largely a
result of the discrete periods of occupation that the sites represent, with Ban Rai
representing the Holocene and Tham Lod representing the Pleistocene. This unusual
situation of conflicting hypotheses from the same models presents an excellent natural
laboratory to examine the competing effects of climatic variation and proximity to
resources on human technological organisation.

7. Palaeoecological context
183
In addition to this broad level analysis, a high resolution analysis is described in the
next chapter. The oxygen isotope sequence will be integrated with data from the flaked
stone artefact assemblages at the level of the excavation unit, providing millennial scale
resolution. This allows more detailed examination of the relationship between the
organisation of stone artefact technology and inferred variation in precipitation and
associated ecological changes.

7. Palaeoecological context
184
Figure 7.1. Results of 30 samples taken from umbo to margin of a shell from Ban Rai excavation
unit 11. Values on the vertical axis show maximum, mean and minimum.
Figure 7.2. Results of 30 samples taken from umbo to margin of a shell from Tham Lod excavation
unit 28. Values on the vertical axis show maximum, mean and minimum.
-8.16
-8.76
-8.51
δ18O
PD
B ‰
-5.82
-6.55
-6.20
δ18O
PD
B ‰

7. Palaeoecological context
185
Figure 7.3. Results of oxygen isotope analysis of samples from Tham Lod and Ban Rai spanning
30,000 years. Data markers show mean and 95% confidence interval.
-11
-10
-9
-8
-7
-6
-5
-4
-3
-2
56
78
910
11
12
13
14
15
16
17
18
19
20
21
22
23
24
25
26
27
28
29
30
31
32
33
34
35
36
δ18
OPDB ‰
Calibrate
d A
ge ka BP

7. Palaeoecological context
186
Figure 7.4. Pleistocene sequences of δ18
O from Hulu, China and Tham Lod. Data markers for
Tham Lod show mean and 95% confidence interval.
-10
-9
-8
-7
-6
-5
-4
10
15
20
25
30
35
40
45
δ18
OPDB ‰
Calibrate
d A
ge ka BP
Hulu
Tham
Lod

7. Palaeoecological context
187
Figure 7.5. Pleistocene sequences of δ18
O from Dongge and Hulu, China and Ban Rai. Data markers
for Ban Rai show mean and 95% confidence interval.
-10
-9
-8
-7
-6
-5
-4
45
67
89
δ18
OPDB ‰
Calibrate
d A
ge ka BP
Do
ngg
e
TL

7. Palaeoecological context
188
Figure 7.6. Results of carbon isotope analysis of samples from Tham Lod and Ban Rai spanning
30,000 years. Data markers show mean and 95% confidence interval.
-14
-12
-10
-8
-6
-4
-2
56
78
910
11
12
13
14
15
16
17
18
19
20
21
22
23
24
25
26
27
28
29
30
31
32
33
34
35
36
δ13
CPDB ‰
Calibrate
d A
ge ka BP

8. Testing the hypotheses
189
8. Testing the hypotheses: Results of the flaked stone
artefact assemblage analysis
Introduction
The previous two chapters described some of the key environmental variables that are
likely to have had some influence on the strategies that human foragers used to
organise their stone technology. The aim of this chapter is to examine the flaked stone
artefact record to test predictions developed in the previous two chapters about how
sensitive stone artefact technology was to these environmental variables. This chapter
presents the results of the analysis of flaked stone artefacts from Tham Lod and Ban
Rai. The chapter is organised around testing the hypotheses derived from the three
models presented earlier. In many of the results described below correlations are used
to provide a summary description of the interaction between changes in climatic
conditions measured by δ18O values and behaviours relating to stone artefact
technology. In general, for most influences on human behaviour, correlations range
between 0.0 and ±0.5 and rarely exceed ±0.5, unlike the physical sciences where higher
correlations are relatively common (such as the depth-age models discussed in chapter
six). For example Feingold’s (1994) meta-analysis of correlations between gender and
assertiveness produced a correlation of 0.25. Similarly, among identical twins raised
together, the correlation for most personality traits is 0.50 (Dunn and Plomin 1990,
Loehlin et al. 1988). Since this chapter is concerned with human behaviours relating to
stone artefact technology, correlations greater than the arbitrary value of ±0.3 are
considered to be behaviourally meaningful and requiring explanation. The raw data
that this chapter is based on are available by contacting the author via the Department
of Archaeology and Natural History, Research School of Pacific and Asian Studies, The
Australian National University.
Patch Choice Model
In brief, the predictions derived from this model are that locations and periods of
higher patch yields will have evidence of more intensive human occupation as people
exploit a reliable and abundant resource. Considering only the contrasting locations of
the sites, the synchronic hypothesis predicted that Tham Lod was more intensively

8. Testing the hypotheses
190
occupied than Ban Rai. However, given the stark difference between Holocene and
Pleistocene climates in the study area, the diachronic hypothesis suggests that
occupation during the wetter and warmer Holocene should be more intensive, so Ban
Rai should be more intensively occupied than Tham Lod. To test these competing
predictions, stone artefact discard rates are used here as a proxy of the intensity of
human occupation.
A standardised measure of artefact discard is needed for reliable comparison between
the two sites. First, the minimum number of artefacts (MNA) was calculated for each
excavation unit. This is equivalent to the minimum number of flakes (MNF) plus the
total number of cores for each raw material. A simple count of artefacts is unreliable
because taphonomic processes can cause fragmentation. Fragmentation of artefacts
means that the number of flakes is likely to be less than the number of pieces in the
assemblage. The MNF method described in chapter five offers a way to calculate a
reliable estimate of artefact abundance. Second, the MNA was standardised as a
density measurement by dividing it by the volume of the excavation unit to account for
the different excavation strategies at the two sites. This was especially important at
Tham Lod where a large intrusive rock significantly altered excavation unit volume as
depth increased. Finally, the MNA density measurement is expressed as a density per
thousand years to allow comparison between Ban Rai and Tham Lod because their
excavation units represent different periods of time. The assumption in using this
metric is that the two rockshelters have had relatively continuous deposition of
sediments with no substantial loss of sediments to erosion.
Tham Lod
Of all the flakes and flaked pieces recognised from Tham Lod area one (n = 1935),
about 30% (n = 573) were broken (Table 8.1). Minimum numbers of flakes in the Tham
Lod assemblage were separately calculated for three classes of raw materials: quartzite,
sandstone and others. At Tham Lod, 60% (n = 1164) of flakes and flaked pieces were
quartzite and 34% (n = 663) were sandstone, together representing 94% (n = 1827) of all
flakes and flaked pieces at Tham Lod. These figures only represent flaked stone
artefacts from excavation unit seven to unit 32 which is the last excavation unit
containing artefacts. The units above unit seven are disturbed so artefacts recovered
from those units are excluded from the analysis because of their uncertain provenance.
The estimated minimum number of artefacts from Tham Lod in this analysis is 1722,

8. Testing the hypotheses
191
discarded over about 20,000 years (15,100 – 34,900 BP). Figure 8.1 shows the change in
MNA per cubic metre per hundred years over time at Tham Lod. Discard rates range
from 3.8 to 29.6 artefacts per cubic metre per hundred years, with an average of 13.8.
The main peak in artefact discard is around 30,200-33,300 BP with a secondary peak at
about 21,500-23,100 BP. The earlier peak is appears to have been an abrupt increase and
decrease in discard while the later peak suggests a more gradual change in discard
rate.
Ban Rai
Flakes and flaked pieces from all excavation units at Ban Rai area three are included
here (n= 1423), consisting of 77% (n = 1095) complete flakes and 33% (n = 328) flaked
pieces (Table 8.2). Amongst flakes and flaked pieces, the main raw material classes at
Ban Rai were quartzite (49%, n = 699), andesite (45%, n = 638) and others (6%, n = 86).
After calculating minimum artefacts for each excavation unit (Figure 8.2), the range of
artefact discard was 2.0 to 466.7 artefacts per cubic metre per hundred years, with an
average of 126.4. The main peak in artefact discard occurs at 8700-8500 BP and a
smaller peak spread from 7600 to 7100 BP. Both peaks represent relatively abrupt
changes in discard rates.
Discussion
The range of discard rates is relatively low overall, suggesting relatively low intensities
of site use at both sites. The highest discard rates are 29.6 and 126.4 artefacts per cubic
metre per hundred years at Tham Lod and Ban Rai. By comparison, the average
number of flakes from a single core in the experimental assemblage discussed in
chapter five was 21. This suggests that during the period of maximum discard at these
two sites one core was reduced roughly every 25 years. In other words, this degree of
activity might reflect small numbers of people visiting the sites for a day or two every
few years or for a week every century. The apparent abruptness of the peaks in discard
at the two sites is difficult to explain and may be a result of the time-averaging caused
by the excavation method. A parsimonious interpretation of the abruptness of the
changes might relate to the flexibility of technological change. For example, the
changes might suggest that people were capable of substantially altering their artefact
discard behaviours within a minimum of 160 years (the average time represented by an
excavation unit at Ban Rai).

8. Testing the hypotheses
192
Stone artefact discard rates are nearly an order of magnitude higher at Ban Rai
compared to Tham Lod (Figure 8.3). This large difference supports the diachronic
prediction that Holocene occupation will be more intensive because of increased
biomass resulting from increased precipitation and warmth. The prediction that Tham
Lod would have higher intensities of occupation because of its favourable location in
high biomass forests and close proximity to the river is not supported. Examination of
higher resolution correlations between artefact discard and climatic conditions offers
similar support for the importance of climate influencing occupation intensity. The
correlation between artefact discard and δ18O values at Tham Lod is -0.205 [-0.585,
0.176] and at Ban Rai is 0.099 [-0.384, 0.582]. Although these correlations are weak and
probably not statistically significant (since the 95% confidence intervals for both
includes 0.0), it is notable that the Tham Lod correlation is slightly negative and is
greater in absolute magnitude than the Ban Rai correlation. The negative correlation
means that people at Tham Lod may have tended to discard more artefacts when
precipitation was higher and discarded fewer artefacts when conditions were drier.
The main peak in artefact discard at Tham Lod at about 30,200-33,300 BP is within the
warm and wet period identified from the multiple palaeoclimate proxies discussed in
the previous chapter. Recalling that the average chronological resolution of the
excavation units at Tham Lod was about 791 years, this correlation probably reflects
millennium-scale or greater variations in adaptation rather than shorter scale patterns
such as the use of the rockshelter during the rainy season versus the dry season. The
greater magnitude of the correlation in the Tham Lod sequence compared to Ban Rai
sequence suggests that people’s decisions about occupation intensity were more
sensitive to climatic change during the Pleistocene than during the Holocene. Although
variation in stone artefact discard is much higher at Ban Rai compared to Tham Lod, it
does not appear to co-vary with δ18O values.
An important caveat relevant to these findings is that artefact discard rates are only an
approximate proxy for occupation intensity. The relationship between artefact discard
and occupation intensity is complex and influenced by three factors. First is the nature
of the use of the rockshelter. If the loci of activity in the rockshelters shifted over time
then the excavated samples may not accurately reflect overall changes in occupation
intensity. This possibility is difficult to exclude without excavation of a larger area at
each site. The influence of variations in technological strategies on the reliability of
artefact discard rates as a proxy for occupation can be evaluated by examining the

8. Testing the hypotheses
193
correlation between quantities of faunal remains and stone artefacts. An increase in
faunal remains would be expected during increased occupation intensity because more
people would be expected to be using the rockshelters for processing and consuming
food. The correlation between total mass of faunal remains and MNA at Tham Lod is -
0.124 [-0.463, 0.214] and at Ban Rai is 0.287 [-0.103, 0.679]. Mass of faunal remains is a
problematic measure of faunal abundance because of variations in the allometric ratios
between bone mass and carcass mass for individuals in the same taxa of different sex
and age of individuals of different taxa. Similarly, larger animals will contribute a
larger mass of bone to the assemblage and burning of bone changes bone mass (Casteel
1978, Klein and Cruz-Uribe 1984, Reitz and Wing 1999). Nevertheless, it is the only
abundance measure collected by the HAPP for each excavation unit, other measures
were calculated on aggregates of excavation units. The problems with mass as an
abundance measure make the very weak correlations between mass and MNA difficult
to interpret, although they do cast some doubt on the reliability of artefact discard as a
proxy for occupation intensity.
A second factor is the possibility of different rates of sediment accumulation and
erosion at the two sites that may cause the same intensity of occupation to appear as
highly divergent densities of artefacts. The different positions of the sites on the valley
sides and different distances to the river may undermine observations about the
contrasting densities of artefacts at the two sites. However, in the absence of detailed
sediment histories it is not possible to further investigate the influence of different rates
of sediment accumulation on artefact densities.
A third factor that influences the relationship between artefact discard and occupation
intensity is technological change. Technological change could be a confounding
variable if there was substantial change in technological strategies that altered the
output of knapping events to produce substantially different numbers of flakes, but
without any change in the number of people visiting the site or the duration and
frequency of their visits. This will be addressed later in this chapter and the reliability
of discard rates as a proxy for occupation intensity will be reassessed.

8. Testing the hypotheses
194
Table 8.1: Tham Lod: flake breakage by raw material
Complete Proximal Medial Distal Longitudinal
Right
Longitudinal
Left
Estimated
MNF
%
MNF
Quartzite 760 49 2 1 209 143 1018 59
Sandstone 513 21 0 1 62 66 600 35
Other 89 5 1 0 10 3 104 6
Total 1362 75 3 2 281 212 1722
Figure 8.1:. Tham Lod: total MNA per cubic metre per 100 years
15.1
15.9
16.7
17.5
18.3
19.1
19.9
20.7
21.5
22.3
23.1
23.8
24.6
25.4
26.2
27.0
27.8
28.6
29.4
30.2
31.0
31.8
32.6
33.3
34.1
34.9
0 10 20 30 40
Calibrate
d ka years BP
MNA m-3
per 100 years

8. Testing the hypotheses
195
Table 8.2: Ban Rai: flake breakage by raw material
Complete Proximal Medial Distal Longitudinal
Right
Longitudinal
Left
Estimated
MNF
%
MNF
Quartzite 529 50 0 0 75 46 654 49
Andesite 493 39 0 0 56 53 588 44
Other 73 1 0 0 8 4 82 6
Total 1095 90 0 0 139 103 1324
Figure 8.2: Ban Rai: total MNA per cubic metre per 100 years
6
6.1
6.3
6.4
6.6
6.8
6.9
7.1
7.3
7.4
7.6
7.7
7.9
8.1
8.2
8.4
8.5
8.7
8.9
9
9.2
9.3
9.5
0 200 400 600
Calibrate
d ka years BP
MNA m-3
per 100 years

8. Testing the hypotheses
196
Figure 8.3: Mean and 95% CI for discard rates at Ban Rai and Tham Lod
0
50
100
150
200
250
300
350
Ban Rai Tham Lod
Artefacts m
-3per 100 years

8. Testing the hypotheses
197
Central Place Model
The central place model predicts that as travel and transports costs increase then so
should the amount of pre-processing of resources to optimize the delivery of useful
material at the central place. The term ‘pre-processing’ is used here only to refer to
reduction of an artefact before it arrives at the site of its final use. It does not imply that
artefact reduction moves the artefact towards the form of an end product. The
attributes of the site locations led to the synchronic hypothesis that predicted Tham
Lod would have a lower frequency of pre-processing compared to Ban Rai because of
Tham Lod’s close proximity to the river as a source of high quality materials for
making stone artefacts. On the other hand, consideration of climate history and the
timing of site occupation led to the diachronic hypothesis that predicted Tham Lod
would have the most extensively pre-processed assemblage because of its Pleistocene
occupation, when conditions were drier and travel costs would be amplified.
Measuring the degree of pre-processing in an assemblage was done by analysing core
and flake attributes to see how the assemblage differs from what would be expected if
the assemblage was produced as part of a closed system without any off-site
component. The archetypal closed system is the experimental assemblage described in
chapter five. Comparison between the archaeological assemblage and the experimental
assemblage is based on the assumption that the lengths of reduction sequences are
equivalent. In particular, two methods were employed. First, the ratios of MNF to cores
calculated for each site and then for each excavation unit at each site. The expectation is
that if stone is processed before it enters the site then the ratio will deviate from the
ratio observed in the experimental assemblage which represents a closed system where
no introduction or removal occurred. A lower ratio of MNF to cores would be expected
in an assemblage where flakes have been removed from the cores off-site during pre-
processing to increase the utility of the core as a transported mass of flakable stone.
Second, the size distribution of flake scars on cores was compared to the size
distribution of flakes in the assemblage. For this purpose the last five complete flake
scars over 5 mm on each core were recorded. This comparison was only undertaken for
the whole assemblage from each site because the number of core scars per excavation
unit is too low to make reliable comparisons with the distribution of flake lengths. The
expectation is that greater difference betweens the distributions of complete flake
lengths and core scar lengths will indicate greater degrees of pre-processing. More

8. Testing the hypotheses
198
specifically, core scar average lengths should be smaller than complete flake average
lengths to indicate the presence of some cores that have been introduced to the
assemblage with large flakes already removed. A greater difference between average
lengths of core scars and complete flakes may indicate a higher proportion of pre-
processed cores in the assemblage. Comparison of these metrics with the experimental
assemblage may also be useful to calibrate the extent of pre-processing.
Before examining the archaeological data it must be noted that the reliability of the
results produced by these methods is compromised by the difficulty of isolating pre-
processing from confounding factors. For example, the ratio of MNF to cores not only
measures how different an assemblage is from a closed system assemblage where no
addition or removal of material has occurred, but is also sensitive to the overall
productivity of cores in an assemblage and differential transport of flakes and cores. To
extend the example, consider if ten cores were introduced to both assemblages and at
Tham Lod each core produced 20 flakes and at Ban Rai each core produced 50 flakes.
In this case it would be a mistake to interpret the high MNF to core ratio at Ban Rai as a
removal of cores from the assemblage or an increase in flakes being imported into the
assemblage. In general it is assumed here that cores are more likely to be imported
than flakes because or a core’s ability to produce flakes. Other possible measures of
pre-processing, such as the amount of cortex on artefacts, are similarly confounded by
effects of reduction.
Tham Lod
The ratio of the minimum number of flakes to the total number of cores for all
excavation units at Tham Lod is 4.5. The maximum ratio of 107 occurs for sandstone
flakes and cores at around 32,600 BP in excavation unit 29 and the minimum ratio of
0.3 occurs for other raw materials at about 27,000 BP in unit 22 (Table 8.3). There is a
moderate correlation between the ratio of MNF to cores and MNA (r = 0.317 [-0.181,
0.812] which is mostly explained by the sharp spike in MNF:core values over 30,400-
33,600 BP, coinciding with high discard rates over 30,200-33,300 BP.
Figure 8.4 shows the distribution of lengths of all flake scars (n = 1113) recorded on all
cores (n = 394) at Tham Lod. Measurements for all five scars were possible for 23% (n =
91) of the cores and more than half of the cores had at least three measurable scars
(51%, n = 202). The maximum flake scar length on the cores is 117.9 mm and the
minimum is 3.7 mm with a mean of 25.4 [24.7, 26.1] mm. Figure 8.5 shows the

8. Testing the hypotheses
199
distribution of lengths of all complete flakes (n = 1350) recorded at Tham Lod. The
maximum length is 123.3 mm, the minimum is 7.0 mm and the mean is 34.9 [34.2, 35.7]
mm.
Ban Rai
The ratio of the minimum number of flakes to the total number of cores for all
excavation units at Ban Rai is 11.0. The maximum ratio of 52.5 occurs for quartzite
flakes and cores at about 7,100 BP in excavation unit eight and the minimum ratio of
0.7 occurs for andesite at about 6,800 BP in unit six (Table 8.4). As at Tham Lod, there is
a moderate correlation at Ban Rai between the ratio of MNF to cores and MNA (r =
0.349 [-0.026, 0.725]. In general at Ban Rai, as the number of artefacts increases, the
number of flakes increases also except for the increase in artefact discard at about
8,700-8,500 BP when the ratio of MNF to cores remains relatively low.
Figure 8.6 shows the distribution of lengths of flake scars (n = 389) recorded on all cores
(n = 123) at Ban Rai. Core scar data was collected in the same way as for the Tham Lod
cores. Measurements for all five scars were possible for 24% (n = 30) of the cores and
63% of cores had at least three measurable scars (n = 77). The maximum flake scar
length on the cores is 60.5 mm and the minimum is 7.1 mm with a mean of 20.8 [20.0,
21.7] mm. Figure 8.7 shows the distribution of lengths of all complete flakes (n = 1073)
recorded at Ban Rai. The maximum length is 77.9 mm, the minimum is 10.1 mm and
the mean is 29.3 [28.61, 29.93] mm.
Discussion
The ratio of MNF to cores when all excavation units are considered together is higher
at Ban Rai (11.0) than at Tham Lod (4.5). As an example of a closed system, the
experimental assemblage described in chapter five has a range of MNF to core ratios of
1 to 58, with an average of 19.9. The ratio at Ban Rai is closer to the average ratio in the
experimental assemblage, suggesting that than the Ban Rai is characterised by less pre-
processing of stone than Tham Lod. However, as noted above, the ratio of MNF to
cores is a very simple assemblage metric and this direct comparison with the
experimental assemblage may be misleading.
For example, the difference in MNF to core ratios between Tham Lod and Ban Rai can
be explained by a number of possibilities: cores have been removed from Ban Rai;
flakes have been introduced to Ban Rai independent of the cores they were struck

8. Testing the hypotheses
200
from; flakes have been removed from Tham Lod; or previously worked cores have
been introduced to Tham Lod without any further flake production at the site. The
only two of these that are relevant to the question of pre-processing are the possibilities
of flakes being introduced to Ban Rai without their parent cores (assuming that the
flakes are the end point of pre-processing and the cores have been discarded off-site as
waste) and previously worked cores being introduced to Tham Lod with no further
flake production (assuming that the core is the optimum load). Unfortunately the
available evidence does not discern between these two possibilities since the
assumptions about the intended utility of the transported material cannot be tested.
The safest conclusion here is that these results hint at more pre-processing at Tham
Lod, but the method does not permit a high level of confidence in this finding.
Correlations between the ratios of MNF to cores and δ18O values are low for both sites,
suggesting no influence of climate on this measure of pre-processing (Tham Lod: r = -
0.181 [-0.557, 0.194], Ban Rai: r = -0.007 [-0.598, 0.582].
Like the MNF:core data, the flake metrics data require careful consideration before
they can be used for hypothesis testing. The greater maximum and mean values of the
flake lengths compared to the core scars at both sites is not relevant to testing pre-
processing hypotheses. The difference in these means is expected because the larger
flake scars on the cores corresponding to the large flakes are absent due to the removal
of these scars from the core during early stages of core reduction. After the early stages
of flake reduction these flake scars are now dorsal flake scars on large flakes.
Differences between the average core scar length and average complete flake length are
almost non-existent between the two assemblages. Figure 8.8 shows the average and
95% confidence intervals for core scar lengths and complete flake lengths for the two
sites. For Ban Rai the difference is 8.5 mm and for Tham Lod the difference in 9.5 mm.
With only 1 mm between the two assemblages, these differences in point values do not
immediately suggest much difference in pre-processing. On the other hand differences
in the shape of the distributions of values between the mean and maximum suggest
that some complicated differences do exist.
Figure 8.9, Figure 8.10 and Figure 8.11 show the probability density functions for the
lengths of flakes and flake scars on cores at Tham Lod, Ban Rai and the experimental
assemblage from chapter five. These probability density function plots are smoothed
versions of the histograms that are more suitable for visual comparison. Of particular

8. Testing the hypotheses
201
relevance to the central place model is the shape of the curves in the region between
the mean and maximum values for the three assemblages. This region is relatively
symmetrical for the Tham Lod assemblage but the Ban Rai and experimental
assemblages shows an unusual asymmetry. This asymmetry reflects the complex
distributions of larger flake scar lengths as the core geometry shifts during reduction.
Similarly, the asymmetry in the distribution of complete flake lengths for Ban Rai and
the experimental assemblage probably reflects complex relationships in changing core
geometry. Given that the experimental assemblage is the control data for a closed
assemblage, the similarity between Ban Rai and the experimental assemblages
indicates that Ban Rai was more of a closed assemblage than Tham Lod. More formal
support for this conclusion is provided by Two-Sample Kolmogorov-Smirnov tests that
show no significant differences between the distribution of flake scar lengths on cores
from Ban and the experimental assemblage (ks = 0.126, p = 0.095). For all of the other
pairs of distributions the Kolmogorov-Smirnov tests show that each pair of
observations could not reasonably have come from the same distribution. This
supports the results of the MNF:core data that pre-processing was more frequent at
Tham Lod.
The difference between the minimum values of core scar lengths and flake lengths,
where minimum flake lengths are consistently greater than minimum core scar lengths,
may be in part due to recovery biases that neglected to collect smaller flakes from the
sieves during excavation because they are less distinctive than larger flakes. To test this
possibility I sieved two cubic metres of excavated sediments from spoil heaps at Tham
Lod through a 1 mm sieve. A small number of additional flakes and flake pieces were
recovered, but they were all within the size range of the assemblage recovered by the
HAPP. It is also possible that the seasonal rains wash smaller pieces off the surface of
the rockshelter before they can be incorporated into the matrix. If recovery and
taphonomic biases can be assumed to have a small effect on the distribution of flakes
smaller than the average length, then differences between the two assemblages might
be relevant to differences in pre-processing. However, inspection of the probability
density functions suggests that there is little difference between the two sites in the
region between the mean and the minimum values. So if these data in this region of the
distribution are relevant to the question of pre-processing then they do not support
substantial differences between the two sites.

8. Testing the hypotheses
202
A more general limitation of this analysis is that pre-processing is difficult to reliably
measure independently of general artefact reduction. It was noted earlier that the ratio
of MNF to cores measures not only how different an assemblage is from a closed
system assemblage where no addition or removal of material has occurred, but is also
sensitive to the overall productivity of cores in an assemblage. The problem is that pre-
processing is a special kind of stone artefact reduction – one that only occurs in transit -
and is difficult to unambiguously measure. This is a unique problem for stone artefacts
because it is unlike other types of resources that have relatively distinctive low-utility
or no-utility components. For example, resources that have been productively
modelled using central place foraging theory typically have components that are
readily recognisable as waste suitable for removal during pre-processing prior to
consumption. Acorns and mussels have shells and mammals have bony sinewy parts
such as phalanges, metatarsi and caudal vertebrae (Bettinger et al. 1997, Bird and
Bliege Bird 1997, Nagaoka 2005).
With stone, especially when the assemblage is dominated by informal and
unretouched pieces, it is less clear about what can be considered low-utility or no-
utility components. Only in special cases when the final stone product can be identified
with some certainty, such as in the study by Beck et al. (2002) of Palaeoarchaic bifaces
from the Great Basin, are more reliable statements about pre-processing of stone
possible. But even with bifaces, Beck et al. (2002) claim that the point of maximum
utility is difficult to measure because both the biface and the flakes removed from it
have degrees of utility that vary depending on the intent of the manufacturer; the
biface might have been a finished tool, a blank or a core. As argued in chapter four,
intentionality in mainland Southeast Asian flaked stone artefact manufacture is an
unquantifiable variable, so if intention is important for understanding pre-processing,
as Beck et al. claim, then the role of the manufacturer’s intent in determining stone
utility is another substantial confounding influence for the quantification of utility.
In the relatively simple stone artefact assemblages analysed here, obtaining reliable
measurements of utility or intentionality is beyond the ability of current methods.
However, it is possible to assess the influence of one possible confounding variable
with data produced for testing the predictions of the optimal dispersion model. If there
is a high correlation between the MNF:core values and the key reduction variables at
the two sites then it is possible that increases in MNF:core values are determined by the

8. Testing the hypotheses
203
increased numbers of flakes produced when assemblage reduction intensity increases.
This would imply that the reliability of MNF:core as a measure of pre-processing is
low. At Ban Rai the correlations between the eight key reduction variables described in
chapter five (overhang removal, interior platform angle, amount of dorsal flake scar,
percentage of dorsal cortex and the four categories of dorsal cortex location) and
MNF:core values are all between 0.0 and ±0.3 and at Tham Lod the correlations are
similarly low, between 0.0 and ±0.26, except for flakes with 100% cortex (r = -0.392 [-
0.645, -0.139]). The correlation between flakes with 100% cortex and MNF:core values
suggests that as the number of flakes relative to cores increases, the proportion of
flakes with 100% cortex decreases, a relationship that might be expected as core
reduction is extended and increasing numbers of flakes are removed after the cortex-
bearing flakes are all detached. However, the overall low correlations between the
other five variables measuring assemblage reduction and MNF:core values suggest
that assemblage reduction intensity in general is not a major confounding factor and
that the MNF:core measure may be useful as an indicator of pre-processing.
To summarise the results of testing the predictions of the central place model, Ban Rai
appears to be closer to the paradigmatic closed assemblage represented by the
experimental assemblage, so pre-processing appears to have been more important at
Tham Lod. This supports the prediction that Tham Lod would have the most
extensively pre-processed assemblage because of its Pleistocene occupation, when
conditions were drier and travel costs were greater than during the Holocene. These
results support the importance of climate over location and proximity to resources in
human forager adaptation. The possibility of the reliability of these results being
compromised by confounding factors related to assemblage reduction was explored
and found to be minor, but limiting the degree of confidence that can be placed in the
intpretations.

8. Testing the hypotheses
204
Table 8.3: Tham Lod: Ratios of MNF to cores, maximum and minimum values highlighted, empty
cells indicate no cores.
Calibrated
years BP Sandstone Quartzite Others
All materials
combined
14,100 21.0 4.0 1.0 5.2
14,900 1.8 10.6
6.4
15,700 3.0 14.3 2.3 7.3
16,500 1.0 3.0 3.0 2.1
17,300 19.0 11.5 3.3 8.7
18,200 0.9 7.0 4.0 2.9
19,000 1.9 2.7
2.4
19,800 4.3 4.5
4.4
20,600 2.6 3.8 1.3 2.8
21,400 2.6 1.7 0.5 2.2
22,200 11.5 3.6 1.0 5.2
23,000 2.8 7.0 1.0 3.3
23,900 4.7 6.5
4.6
24,700 2.4 2.4
2.5
25,500 5.5 0.6
1.5
26,300 7.8 1.5 0.3 2.5
27,100 1.5 1.4 4.0 1.5
27,900 2.8 1.6 3.0 2.2
28,700 1.2 0.9
1.1
29,500 11.2 3.4 1.5 6.3
30,400 48.5 5.6
19.3
31,200 30.7 5.7 14.0 17.6
32,000 107.0 15.0
47.3
32,800 11.3 7.2 4.0 9.3
33,600 37.0 16.0 3.0 18.7
34,400
2.0
29.0

8. Testing the hypotheses
205
Figure 8.4: Tham Lod: Distribution of flake scar lengths on all cores.
Figure 8.5: Tham Lod: Distribution of flake lengths for all complete flakes.

8. Testing the hypotheses
206
Table 8.4: Ban Rai: Ratios of MNF to cores, maximum and minimum values highlighted, empty
cells indicate no cores.
Calibrated
years BP
Andesite Quartzite Others All materials
combined
6400
12.0 1.0 9.0
6500
7.2
9.2
6600
16.0
16.0
6800 2.0 6.0
4.2
6900
5.0
7000 0.7
3.0 13.8
7100 4.5
10.0
7300
52.5
70.5
7400 7.0
8.5
7500 7.0
12.0 29.3
7600 13.7 25.7 3.5 15.6
7800
28.0
48.0
7900 7.3 13.5
10.2
8000 7.5 15.5
11.5
8100 3.5 7.0
4.6
8200 5.0 5.0
5.2
8400 20.6 17.5
21.7
8500 7.7 9.2
8.7
8600 2.5 4.0
3.3
8700 1.9 5.5
2.7
8900 13.0
15.0

8. Testing the hypotheses
207
Figure 8.6: Ban Rai: Distribution of flake scar lengths on all cores.
Figure 8.7: Ban Rai: Distribution of flake lengths for all complete flakes.
Flake scar length (mm)
806040200
Frequency
20
15
10
5
0
Flake scar length (mm)
80604020
Frequency
40
30
20
10
0

8. Testing the hypotheses
208
Figure 8.8: Average values and 95% confidence intervals for core scar lengths (hollow circles) and
complete flake lengths (solid circles) at Tham Lod and Ban Rai
18
20
22
24
26
28
30
32
34
36
Ban Rai Tham Lod
millim
etr
es

8. Testing the hypotheses
209
Figure 8.9: Tham Lod: Probability density functions for the lengths of complete flakes and flake
scars on cores
Figure 8.10: Ban Rai: Probability density functions for the lengths of complete flakes and flake
scars on cores
0 40 80 120
m illim e tres
0 .00
0 .02
0 .04
0 .06
Pro
ba
bility d
en
sity fu
nctio
n
co res
flakes
0 40 80 120
m illim e tres
0 .00
0 .02
0 .04
0 .06
Pro
ba
bility d
en
sity fu
nctio
nco res
flakes

8. Testing the hypotheses
210
Figure 8.11: Probability density functions for the lengths of complete flakes and flake scars on cores
from the experimental assemblage
10 30 50 70 90
m illim e tres
0 .00
0 .02
0 .04
0 .06
Pro
ba
bility d
en
sity fu
nctio
n
co res
flakes

8. Testing the hypotheses
211
Optimal Dispersion Model
A model of optimal dispersion predicts optimum forager settlement patterns under
different environmental conditions, assuming they are minimizing round-trip travel
costs from resource to settlement location. The assumptions are the same as the central
place model, but the predictions are more generally about forager mobility rather than
specifically about one kind of resource processing. This increased generality suggests
that predictions of the optimal dispersion model can be more reliably tested than the
central place model. The optimal dispersion model evaluated here predicts that as
resources become more mobile and clumped, foragers will increasingly aggregate into
larger groups practicing logistical foraging but when resources are more stable and
evenly distributed, foragers will increasingly disperse into smaller groups using a
residential settlement pattern. The synchronic hypothesis, derived from the proximity
of major resources to the two sites, predicts that occupation at Ban Rai was dominated
by logistical strategies compared to Tham Lod which is predicted to have been
dominated by residential strategies. These differing levels of dominance are not meant
to imply that the two sites had opposing strategies. Instead the implication is that there
were different combinations or balances of the two strategies at the two sites. The
archaeological correlate of this prediction is that assemblage reduction will be more
extensive at Ban Rai compared to Tham Lod. On the other hand, the diachronic
hypothesis, informed by the climate history revealed by the δ18O sequences, predicts
that reduction will be lower at Ban Rai because it was occupied during the Holocene
when climatic conditions favoured more stable and evenly distributed environments.
The methods for measuring assemblage reduction were presented in detail in chapter
five where analysis of the experimental assemblage revealed a small number of flake
attributes that are particularly well suited to measuring reduction in assemblages
similar to Tham Lod and Ban Rai. As a first step in the analysis of the archaeological
assemblages, the reliability of these attributes as suitable reduction measures for the
archaeological assemblages was verified by analysing correlations between a sample of
these variables to confirm their usefulness as reduction indicators. The second step was
summarising the two assemblages in terms of these variables for a detailed comparison
of differences in reduction at the two sites. These summary statistics were compared to
the equivalent statistics from the experimental assemblage described in chapter five to
calibrate the intensity of reduction for the two archaeological assemblages. Finally,

8. Testing the hypotheses
212
changes in the reduction variables over time at each site were considered and
correlations with δ18O values were evaluated.
Tham Lod
Figure 8.12 is a scatter plot matrix showing correlations for four of the key flake
reduction variables for all complete flakes at Tham Lod (n = 1093). The correlations are
similar in magnitude to the experimental assemblage and reveal no unusual
multicollinearities. As expected, there are negative correlations between dorsal cortex
and the other variables indicating that the proportion of dorsal cortex decreases as
numbers of dorsal scars, flakes with overhang removal and interior platform angle size
increases. Positive correlations between numbers of dorsal scars, flakes with overhang
removal and interior platform angle size were also predicted by the reduction model
because each of these variables increase with increasing reduction. None of the 95%
confidence intervals include 0.0, so these correlations are unlikely to be due to chance.
These results indicate that the reduction model presented in chapter five is probably a
reliable framework for interpreting the Tham Lod assemblage.
Given the suitability of the reduction model to this assemblage, it is possible to
summarise the assemblage in terms of the key reduction variables identified by the
model. Table 8.5 presents a summary of the key flake variables for Tham Lod. It should
be noted that the mean and median values for the interval variables, such as dorsal
cortex percentage, dorsal scar number and interior platform angle were calculated
from the entire assemblage as a single sample. Mean and medians of the nominal
variables, such as overhang removal and the four dorsal cortex categories, were
calculated using the excavation units as sub-samples. The divergence between the
mean and median values for dorsal cortex percentage reflects the skewed distribution
of this variable, indicating that the mean is probably a poor indictor of central tendency
in this case. Similarly, the absence of overlap in the 95% confidence intervals for mean
and median values of interior platform angle reflects the unusual shape of the
distribution of this variable and that the median should be used as a more robust
measure of central tendency.
The position of these summary statistics along the one to ten scale of assemblage
reduction intensity used for the experimental assemblage (where one is very light
reduction and ten is very intensive reduction) gives a rough measure to calibrate
assemblage reduction at Tham Lod. Interpolation of Figure 5.5 in chapter five indicates

8. Testing the hypotheses
213
that the median dorsal cortex value at Tham Lod is equivalent to about five to six on
the scale of reduction intensity derived from the experimental assemblage. Similarly,
the values in the Tham Lod assemblage for mean dorsal flake scars is about six on the
reduction intensity scale. Median interior platform angle at Tham Lod is 100° which is
beyond the upper limits of the 95% confidence interval at eight on the reduction scale.
This value is beyond the range of the experimental assemblage and is ambiguous
because if the average at Tham Lod was lower it could correspond either to levels 6-7
or levels 9-10. Values for overhang removal at Tham Lod are also at the upper extremes
of the range recorded in the experimental assemblage and are difficult to calibrate
reliably because of the large 95% confidence intervals for the experimental data. This
large variation may be because it is a proportion and not an average like the other
variables. The process of averaging removes extremes of variation from the other
variables. The safest interpretation of the interior platform angle and overhang
removal data from Tham Lod is that they probably indicate relatively intensive
reduction somewhere in the six to ten region of the scale. The ratios of the four
categories of cortex distribution at Tham Lod correspond to a reduction intensity level
of three to four. Overall, calibration of the key reduction variables measured for the
Tham Lod assemblage suggests a moderate level of assemblage reduction of about five
to six on the scale of one to ten.
Examination of values of the key flake variables for each excavation unit showing the
distribution of the sample in more detail than the summary statistics described above.
In Figure 8.13 the variables are shown as Z-scores with Lowess regression lines
showing the change in four variables over time. The Lowess curves were generated in
S-Plus with symmetric locally-fitted quadratic polynomials with a span of 0.3. Figure
8.14 shows similar graphs for the four categories of cortex distribution. In this case, the
signs on the Z-score values for percentages of dorsal cortex were reversed (from
negative to positive and vice versa) so that higher Z-scores for all four variables
indicate more intensive assemblage reduction. Lowess regression lines were generated
by S-PLUS. Lowess is a locally weighted polynomial regression technique for
smoothing non-parametric data (Cleveland 1981, Cleveland and Devlin 1988). The
Lowess technique reduces noise by generating a predicted value for each point. The
predicted value is derived by fitting a weighted linear regression where the weights
decrease with distance from that point (Insightful Corporation 2007: 359). The main
advantage of Lowess regression is that it does not require a function to describe the

8. Testing the hypotheses
214
regression model so it is ideal for modelling complex processes where theory is weak
or non-existent. In this case, the division of assemblage into excavation units is
arbitrary and not based on any theory of change in forager use of the sites over time.
Given this atheoretical sampling strategy, Lowess is an especially suitable technique to
visualise trends across the excavation units.
These graphs reveal three interesting details about change over time in the stone
artefact assemblage at Tham Lod. First, there is a broad trend towards more intensive
assemblage reduction over time. The lowess lines, although showing considerable
variation, tend to trend upwards for for all variables. This trend is most pronounced
for overhang removal and least apparent for dorsal cortex especially between 30,200-
34,900 BP (units 26-32) when Z-scores for dorsal cortex trend upwards. This suggests
that there is synchrony in these indicators of reduction intensity at broad chronological
scales. Second, proportions of flakes with overhang removal shows much greater range
of variation than the other variables. Overhang removal Z-scores range ±1.5 standard
deviations from the mean while the others do not exceed ±0.3 standard deviations. This
may indicate that overhang removal was more sensitive to changes in assemblage
reduction than the other variables. On the other hand, it may result from the greater
range of variation due to the analysis of overhang removal as a proportion rather than
an average like the other variables, as noted for the experimental assemblage. Third,
aside from the overall upward trend, directions of change amongst these four variables
are not closely synchronised. This suggests that at finer scales the variables appear to
be responding to different influences or to the same influences in different ways that
are difficult to reliably interpret.
Graphs of the four categories of dorsal cortex on complete flakes support this
interpretation of broad-scale increasing reduction (Figure 8.14). Despite poor
synchrony at the level of the excavation unit, Figure 8.14 shows relatively high
reduction in the later periods of site occupation, with high proportions of flakes with
no cortex and distal cortex and low proportions of flakes with crescent cortex.
Similarly, in the earlier periods of occupation the proportion of flakes with no cortex
and distal cortex are relatively low and the proportion of flakes with crescent cortex is
relatively high, suggesting relatively low reduction. Proportions of flakes with 100%
dorsal cortex do not clearly follow the trend evident in the other three categories.

8. Testing the hypotheses
215
Ban Rai
The results from Ban Rai are similar to Tham Lod, with correlations similar in
magnitude and direction to the experimental assemblage and no problematic
multicollinearities. Figure 8.15 is a scatter plot matrix showing correlations for four of
the key flake reduction variables for all complete flakes at Ban Rai (n = 707). None of
the 95% confidence intervals include 0.0, so these correlations are unlikely to be due to
chance. As for the Tham Lod assemblage, these results indicate that the reduction
model presented in chapter five is probably a reliable framework for interpreting the
Ban Rai assemblage.
Table 8.6 shows the summary statistics for the key flake variables at Ban Rai, calculated
in the same way as for Tham Lod. Major divergences between mean and median
values (indicated by no overlap between 95% confidence intervals) are apparent for
dorsal cortex percentage, dorsal scars and interior platform angle. Inspection of the
distributions of these variables confirms that the median is a more robust measure of
central tendency for these variables because of skewed distributions, especially large
numbers of zero values for dorsal cortex. These values were then calibrated by
reference to the experimental assemblage in the same way that the Tham Lod values
were calibrated. The dorsal cortex value at Ban Rai calibrates to the maximum
reduction intensity level of ten. The median dorsal flake scar value calibrates to about
level six. As for Tham Lod, the median interior platform angle at Ban Rai is towards
the upper limit of the range observed experimentally, so the calibrated level is
ambiguous. Similarly, the high value for overhang removal at Ban Rai makes
calibration unreliable except to note that it calibrates to the higher end of the reduction
intensity scale. The ratios of the four categories of cortex distribution at Tham Lod
correspond to a reduction intensity level of six to seven. Considered together after
calibration, the key reduction variables measured for the Ban Rai assemblage suggests
a moderate to high level of assemblage reduction of about seven to eight on the scale of
one to ten.
Analysis of changes in these variables over time confirms the observation about the
greater sensitivity of overhang removal that was noted for Tham Lod assemblage. At
Ban Rai the higher range of variation in the proportion of flakes with overhang
removal relative to the other variables is very similar to Tham Lod, with overhang
removal varying more than ±2.0 standard deviations and the others not exceeding ±1.0

8. Testing the hypotheses
216
standard deviation (Figure 8.16). As noted above, this may be partially explained
because it is a proportion rather than an average. Like Tham Lod, a broad trend in
these four variables towards more intensive reduction is also apparent at Ban Rai.
Unlike Tham Lod, there appears to be some synchrony at a finer scale at Ban Rai, with
fairly close changes in direction and magnitude of Z-scores for overhang removal,
dorsal cortex and dorsal scars. Interior platform angle does not show the same degree
of co-ordinated change (Figure 8.16). This synchrony suggests that changes in these
variables were tuned to relatively fine chronological scales rather than the broad scales
observed at Tham Lod.
Changes in the four categories of dorsal cortex similarly show a degree of co-ordinated
variation (Figure 8.17). In particular, the proportions of flakes with no cortex, flakes
with crescent-shaped cortex and flakes with distally located cortex co-vary closely. The
general pattern of change is similar to that observed in the other variables, of higher
reduction in the later period of occupation. As at Tham Lod, proportions of flakes with
100% dorsal cortex do not follow the trends evident in the other three categories.
Discussion
Comparing the summary statistics and the overall calibrated intensity reduction levels
for the two assemblages suggests that the Ban Rai assemblage was probably reduced
more intensively than the Tham Lod assemblage. The calibrated values for the two
assemblages indicate a moderate level of reduction for Tham Lod compared to a
moderate-high level for Ban Rai. However this calibration is only a rough guide to the
difference between the sites because of overlapping error ranges for each of the ten
reduction levels in the experimental data as well as the problem of archaeological data
that could not be calibrated because it fell outside the range of the experimental data.
Another perspective on the differences between the two sites is presented in Figure
8.18 which summarises the differences between the key variables at the two sites.
Overall, these graphs support the results of the calibration and show that reduction
was more intensive at Ban Rai than Tham Lod. In particular, values for median dorsal
cortex percentage were lower at Ban Rai and values for mean overhang removal and
mean dorsal scars were lower at Tham Lod, all indicating more intensive reduction at
Ban Rai. Values for median interior platform angle were equivalent at the two sites,
indicating that these variables have limited power to discriminate. Figure 8.18 also
shows that three of the four categories of cortex distribution (the exception is distal

8. Testing the hypotheses
217
cortex) indicate substantially higher assemblage reduction at Ban Rai compared to
Tham Lod. Crescent and 100% cortex flakes were higher at Tham Lod, indicating less
intensive reduction while the proportion of flakes with no cortex was higher at Ban
Rai, indicating more intensive reduction.
Returning to the predictions derived from the optimal foraging model, the higher
degree of reduction intensity at Ban Rai supports the synchronic hypothesis. Higher
assemblage reduction was predicted for Ban Rai compared to Tham Lod when the
proximity of major resources to the two sites was the main influence on technological
organization, rather than climatic conditions. These data suggest that foragers
occupying Ban Rai tended to organize their technology around logistical strategies
more than the occupants of Tham Lod who employed more residential strategies.
Examination of changes in these variables with the sequence at each site shows that
although local resource distribution appears to have been the dominant influence on
patterns of optimal dispersion, the stone artefact assemblages were also responsive to
changes in climate. At Tham Lod the highest correlation between δ18O values and
technological attributes is a moderate positive correlation with overhang removal (r =
0.435 [0.124, 0.746]). This correlation suggests that as conditions become drier and
cooler people tended to produce flakes with higher proportions of overhang removal,
probably reflecting an increase in reduction intensity during these times. The other
variables have very weak correlations with δ18O values (dorsal flake scars: r = 0.186 [-
0.101, 0.473], dorsal cortex: r = -0.046 [-0.441, 0.348], interior platform angle: r = 0.122 [-
0.274, 0.517], no cortex: r = -0.222 [-0.599, 0.155], distal cortex: r = 0.184 [-0.275, 0.643],
crescent cortex: r = -0.289 [-0.204, 0.782] and all cortex: r = -0.074 [-0.460, 0.312]). The
moderate positive correlation between δ18O values and overhang removal, combined
with higher variation in overhang removal values compared to the others, suggests
that stone artefact technology of the occupants of Tham Lod was probably sensitive to
climatic variation.
This sensitivity of technology to climatic variation is not evident in the Ban Rai
assemblage. Correlations between technological attributes and δ18O values are
generally very low or inconsistent with models of technological sensitivity to climatic
conditions employed here. For example, the correlation between δ18O values and
interior platform angle is 0.320 [-0.241, 0.881], suggesting that as climate varies towards
more difficult conditions then reduction intensity increases. Conversely, the correlation

8. Testing the hypotheses
218
between δ18O values and numbers of dorsal flake scars is -0.343 [-0.888, 0.201], a result
that is inconsistent with theory that predicts more intensive assemblage reduction
during drier and cooler conditions. These correlations between δ18O values and interior
platform angle and numbers of dorsal flake scars are the highest correlations for the
Ban Rai assemblage. The other variables have very weak correlations with δ18O values,
some of which are also inconsistent with the models (dorsal cortex: r = 0.104 [-0.665,
0.874], overhang removal: r = -0.124 [-0.884, 0.635], no cortex: r = -0.081 [-0.687, 0.526],
distal cortex: r = -0.218 [-0.972, 0.536], crescent cortex: r = -0.137 [-0.682, 0.407] and all
cortex: r = 0.152 [-0.614, 0.919]). These results suggest that the technological strategies
employed by the occupants of Ban Rai were relatively insensitive to climatic variation,
a result also noted in the analysis of the patch choice model.

8. Testing the hypotheses
219
Figure 8.12: Scatter plot matrix of key reduction variables for all complete flakes at Tham Lod.
Each point represents a single complete flake. The values have been jittered to separate overlapping
points.
Overhang Removal
Interior Platform Angle
(degrees)
Dorsal Scars
r = 0.212
[0.164, 0.260]
r = 0.230
[0.171, 0.289]
r = -0.195
[-0.239, -0.151]
r = -0.197
[-0.261, -0.134]
r = 0.265
[0.213, 0.317]
r = -0.368
[-0.419, -0.317]Dorsal Cortex (%)
20
45
70
95
120
145
170
0
2
4
6
8
0.0 0.2 0.4 0.6 0.8 1.0
20 45 70 95 120 145 170
0 20 40 60 80 100
0
20
40
60
80
100

8. Testing the hypotheses
220
Table 8.5: Tham Lod: Mean, median values and 95% confidence intervals for dorsal cortex, dorsal
flakes scars, overhang removal, interior platform angle and dorsal cortex distribution. See text for
further explanation.
Key flake variables Mean
Confidence
Interval
minimum
Confidence
Interval
maximum
Dorsal cortex (%) 29.7 27.7 31.6
Dorsal flake scars (#) 1.61 1.54 1.67
Overhang removal (proportion) 0.21 0.17 0.25
Interior platform angle (degrees) 97.1 96.0 98.2
Median
Confidence
Interval
minimum
Confidence
Interval
maximum
Dorsal cortex (%) 20.0 16.2 23.8
Dorsal flake scars (#) 2.00 1.02 2.97
Overhang removal (proportion) 0.21 0.16 0.27
Interior platform angle (degrees) 100.0 100.0 100.0
Dorsal cortex distribution Mean
Confidence
Interval
minimum
Confidence
Interval
maximum
No cortex 0.36 0.32 0.39
Distal cortex 0.20 0.17 0.24
Lateral cortex 0.23 0.21 0.26
100% cortex 0.08 0.06 0.10
Median
Confidence
Interval
minimum
Confidence
Interval
maximum
No cortex 0.34 0.29 0.40
Distal cortex 0.21 0.16 0.27
Lateral cortex 0.22 0.17 0.27
100% cortex 0.08 0.05 0.11

8. Testing the hypotheses
221
Figure 8.13: Tham Lod: Z-score plots and Lowess curves for (a) average percentages of dorsal
cortex on complete flakes per excavation unit, (b) average numbers of dorsal flake scars on
complete flakes per excavation unit, (c) proportion of flakes with overhang removal per excavation
unit and (d) average interior platform angle per excavation unit.

8. Testing the hypotheses
222
Figure 8.14: Tham Lod: Z-score plots and Lowess curves for proportions of flakes with (a) no
cortex, (b) distal cortex, (c) lateral cortex, (d) all cortex

8. Testing the hypotheses
223
Figure 8.15: Scatter plot matrix of key reduction variables for all complete flakes at Ban Rai. Each
point represents a single complete flake. The values have been jittered to separate overlapping
points.
Overhang Removal
Interior Platform Angle
(degrees)
Dorsal Scars
r = 0.319
[0.265, 0.374
r = 0.186
[0.115, 0.257]
r = -0.245
[-0.293, -0.196]
r = -0.425
[-0.497, -0.353]
r = 0.379
[0.319, 0.439]
r = -0.313
[-0.383, -0.242]Dorsal Cortex (%)
40
60
80
100
120
140
0
1
2
3
4
5
0.0 0.2 0.4 0.6 0.8 1.0
40 60 80 100 120 140
0 20 40 60 80 100
0.0
0.2
0.4
0.6
0.8
1.0
0 1 2 3 4 5
0
20
40
60
80
100

8. Testing the hypotheses
224
Table 8.6: Ban Rai: Mean, median values and 95% confidence intervals for dorsal cortex, dorsal
flakes scars, overhang removal, interior platform angle and dorsal cortex distribution. See text for
further explanation.
Key flake variables Mean
Confidence
Interval
minimum
Confidence
Interval
maximum
Dorsal cortex (%) 20.1 17.9 22.3
Dorsal flake scars (#) 1.88 1.81 1.96
Overhang removal (proportion) 0.26 0.21 0.31
Interior platform angle (degrees) 94.5 93.0 96.0
Median
Confidence
Interval
minimum
Confidence
Interval
maximum
Dorsal cortex (%) 0.0 0.0 0.0
Dorsal flake scars (#) 2.00 2.00 2.00
Overhang removal (proportion) 0.27 0.22 0.31
Interior platform angle (degrees) 100.0 98.9 101.0
Dorsal cortex distribution Mean
Confidence
Interval
minimum
Confidence
Interval
maximum
No cortex 0.55 0.48 0.61
Distal cortex 0.15 0.11 0.18
Lateral cortex 0.20 0.16 0.24
100% cortex 0.04 0.02 0.06
Median
Confidence
Interval
minimum
Confidence
Interval
maximum
No cortex 0.55 0.44 0.61
Distal cortex 0.16 0.11 0.22
Lateral cortex 0.22 0.16 0.27
100% cortex 0.04 0.01 0.07

8. Testing the hypotheses
225
Figure 8.16: Ban Rai: Z-score plots and Lowess curves for (a) average percentages of dorsal cortex
on complete flakes per excavation unit, (b) average numbers of dorsal flake scars on complete
flakes per excavation unit, (c) proportion of flakes with overhang removal per excavation unit and
(d) average interior platform angle.

8. Testing the hypotheses
226
Figure 8.17: Ban Rai: Z-score plots and Lowess curves for proportions of flakes with (a) no cortex,
(b) distal cortex, (c) lateral cortex, (d) all cortex

8. Testing the hypotheses
227
Figure 8.18: Central tendencies and 95% confidence intervals for or dorsal cortex, dorsal flakes
scars, overhang removal, interior platform angle and dorsal cortex distribution at Tham Lod and
Ban Rai.
0
5
10
15
20
25
TL BR
Media
n %
D
osral C
orte
x
0.15
0.20
0.25
0.30
0.35
TL BR
Mean Proportion of O
verhang Rem
oval
98
98
99
99
100
100
101
101
102
TL BR
Media
n In
terio
r Pla
tform
A
ngle
1.5
1.6
1.7
1.8
1.9
2.0
TL BR
Mean N
um
ber D
orsal Scars
0.3
0.4
0.4
0.5
0.5
0.6
0.6
0.7
TL BR
Mean Proportion of N
o C
orte
x
0.1
0.2
0.3
TL BR
Mean Proportion of D
ista
l C
orte
x
0.15
0.20
0.25
0.30
TL BR
Mean Proportion of Late
ral C
orte
x
92
94
96
98
100
TL BR
Mean Proportion of A
ll C
orte
x

8. Testing the hypotheses
228
Conclusion
This chapter has described the results of testing predictions derived from three optimal
foraging models with the flaked stone artefact data from Tham Lod and Ban Rai. To
summarise the results briefly, the data supported the patch choice model’s prediction
that occupation intensity was influenced more by climatic conditions than proximity of
the site to resources. Similarly, the data supported the central processing model’s
prediction that pre-processing was influenced more by climatic conditions than
resource proximity although this support is only equivocal because of confounding
factors. Finally, in contrast to the previous two models, the data supported the optimal
dispersion model’s prediction that assemblage reduction was more influenced by
proximity of the site to resources than climatic conditions.
Some of the results are less straightforward than predicted by the models. In part, this
is because the models are simplifications of very complex systems with stochastic
components that are difficult to measure reliably. However, some of this complexity
also highlights unexpected interactions between the technological and climatic
variables. One notable pattern is the apparent close climatic tracking evident in the
Tham Lod assemblage. Artefact discard rates and assemblage reduction intensity at
Tham Lod are more closely correlated with δ18O values than at Ban Rai. This suggests
that the technological strategies of Pleistocene foragers more closely tracked
environmental fluctuations than Holocene foragers. One explanation for this might be
the greater magnitude of fluctuation in environmental conditions during the
Pleistocene compared to the Holocene. This might have resulted in environmental
conditions that fluctuated close to the limits of tolerance of the stone artefact
technology, necessitating relatively frequent technological adjustment to maintain
efficiency during rapid and high magnitude changes in climate. This tracking
behaviour may be analogous to habitat tracking and appears to have been less
important during the Holocene when Ban Rai was occupied, perhaps because
environmental parameters during that time were less variable overall and well within
the range of tolerance of the technology. An alternative interpretation of the
assemblage reduction data is that the overall higher degree of reduction at Ban Rai
meant that foragers were already buffered against exposure to environmental
fluctuations. With the available evidence it is difficult to rule out this alternative
interpretation, but modification of current theory might offer a way to discern between
the two interpretations. This will be pursued further in the next chapter.

8. Testing the hypotheses
229
A second unexpected pattern is the different scales of synchrony observed in the
technological variables at each site, independent of correlations with δ18O values. At
Tham Lod a broad-scale trend of increasing assemblage reduction was observed, but
only weak synchrony of variables at the level of the excavation unit. Conversely, at Ban
Rai there appears to be a close co-ordination of changes in most of the technological
variables at the level of the excavation unit. This suggests that although technology
may have been more sensitive to relatively high-frequency environmental changes at
Tham Lod, it appears to have been a relatively subtle response that did not require
major technological adjustments. On the other hand, although technology at Ban Rai is
relatively insensitive to environmental change, changes in technological organisation at
Ban Rai appears to have been more coherent and tuned to a higher frequency of
variation than at Tham Lod. The available evidence does not shed any light on possible
causes of this high frequency variation.
Finally, the analysis in this chapter has encountered an important limitation in using
flaked stone artefact assemblages to test predictions derived from optimal foraging
models. The question of whether artefact discard rates are a problematic proxy for
occupation intensity remains unresolved. Faunal correlations did little to strengthen
the relationship between artefact discard and occupation intensity. The second possible
confounding factor is technological change that alters the numbers of artefacts without
any change in the amount of people or the frequency and duration of their occupation
of the site. The data presented for testing the predictions of the optimal dispersion
model are relevant to this problem because, all things being equal, more intensive
assemblage reduction could result in higher MNA values without implying more
intensive occupation. Low correlations between the key assemblage reduction
variables and MNA would suggest that MNA is not confounded by variation in
technological strategies and that occupation intensity is decoupled from technological
organisation.
At Ban Rai all correlations between technological variables and MNA are between 0
and ±0.3. At Tham Lod all of the technological variables have similarly low correlations
with MNA of between 0 and ±0.08 except for the four categories of dorsal cortex
distribution. Although correlations between MNA and four categories of dorsal cortex
distribution are slightly higher, they suggest that reduction was less intensive when
MNA was high. For example, the correlations suggest that flakes with no cortex (r = -

8. Testing the hypotheses
230
0.462 [-0.779, -0.145]) and flakes with distal cortex (r = -0.251 [-0.621, 0.119]) tend to
become relatively less numerous as the MNA increases, while flakes with crescent
cortex (r = 0.354 [0.016, 0.692]) become more numerous, indicating that reduction
becomes less intense when MNA increases. Flakes with 100% cortex do not follow this
pattern (r = -0.328 [-0.557, -0.079]), becoming more abundant when MNA is low, rather
than less abundant as expected given the other correlations, indicating more intensive
reduction during periods of high MNA. Despite this inconsistency, these results are
interesting because they mostly suggest that people actually invested less effort in
optimising core productivity during times when high numbers of artefacts were
discarded. This is the opposite of what would be expected if technological variation
was a confounding variable for MNA as a measure of occupation intensity. That said,
the absence of similar correlations between MNA and the other key flake variables at
Tham Lod, and the absence of correlations for any variables at Ban Rai, suggest that
any links between MNA and technological change are weak. The safest conclusion here
is that MNA is probably a reliable measure of occupation intensity because it is not
confounded by technological changes that would otherwise explain variation in MNA.
To conclude, this chapter has tested the hypotheses derived from the three models
presented earlier and discussed some of the complexities and limitations revealed by
the tests. The next chapter will address the implications of these results, especially the
apparent paradox of the patch choice and central place models appearing to give
primacy to climatic conditions as the dominant variable influencing technological
organisation while the optimal dispersion model conversely suggests resource
proximity was more important.

9. Discussion and Conclusion
231
9. Discussion and Conclusion
Introduction
This chapter draws out the implications of the results presented in the previous chapter
and describes how they contribute to the problems raised by previous work discussed
in chapter two. A revision of the foraging models is presented to better accommodate
the results. Some general future directions for research are proposed and the four
questions posed in chapter one are answered.
Modelling technology, climate and resource proximity at the two sites
The outcomes of testing the three optimal foraging models present an apparent
paradox. The unique differences in the environmental contexts and history of
occupation of the two sites provided an unusual opportunity to test the importance of
small-scale differences in local resource availability and environment change. On one
hand, Ban Rai is located relatively distant from important resources such as stone and
water and occupied only during the Holocene. On the other hand, Tham Lod is located
very close to running water and abundant stone supplies and was only occupied
during the Pleistocene. From the simple difference in the timing of occupation at the
two sites it could be suggested that during the Pleistocene people tended to tether
themselves to locations with close and reliable resources, which during the Holocene
their residential patterns were less constrained because increased precipitation
removed some of the limits to settlement in more distant and patchy areas. The
paradox is that instead of a consistent and direct relationship between human
behaviour and environmental change or local resource distribution, the results show a
mosaic of relationships. For example, for the patch choice model and the central place
model it was found that behaviour was influenced more by climatic conditions than
proximity of the site to resources, but the optimal dispersion model suggested that
people were more influenced by proximity of the site to resources than climatic
conditions.
More specifically, the paradox is that Ban Rai has a higher intensity of site occupation
than Tham Lod as well as a higher degree of assemblage reduction intensity than Tham
Lod. This suggests that people are simultaneously optimising their response to climatic

9. Discussion and Conclusion
232
conditions and local resource availability, but in a way that was not predicted by the
existing models. The models predict that a low degree of site occupation intensity
should accompany high assemblage reduction intensity. Employing the Marginal
Value Theorem (MVT) here as a generalised analytical tool for optimising benefit to
cost ratios helps to demonstrate the problem. Although originally conceived by
Charnov (1976) to model how long a forager resides in patches of food to maximise
their net rate of energy intake, MVT has been used to model diverse ecological
phenomena such as optimising the trade-off between egg size and egg number (Smith
and Fretwell 1974), optimal courtship persistence and mate guarding (Parker 1974,
Parker and Stuart 1976).
Figure 9.1 shows how this model can be similarly adapted for stone artefact
technological strategies that optimise risk reduction. The vertical axis corresponds to
the currency involved in this model: risk reduction. On the right side of the risk
reduction axis is the time invested in stone artefact reduction, increasing to the right.
The curved line is a proposed relationship between time invested in technology and
risk reduction. This line suggests that a small investment in technology will produce a
rapid increase in risk reduction, but then after further investments in technology the
returns in risk reduction will eventually taper off. This can be conceived as reflecting
the physical limits in artefact reduction; artefacts below a certain size are difficult to
productively reduce by further knapping, and difficult to use for processing resources.
On the left side of the risk reduction axis is the time spent by foragers being mobile.
The straight line that connects time spent being mobile to the curve of the relationship
between time invested in technology and risk reduction indicates the optimum
configuration under certain conditions. For example, when forager mobility is
relatively high (point B), perhaps because of low biomass and patchy food distribution,
then this model predicts that the optimum investment in assemblage reduction will
also be relatively high, compared to conditions when mobility is less (point A).
To reprise the discussion in chapters three and four, the logical justification of this
model is based on the contribution that artefact reduction makes to risk reduction. In
chapter four a number of categories of risk were surveyed and the kind most relevant
the assemblages under investigation here was found to be technological or venture risk
(Elston and Raven 1992: 33-34). Technological risk refers to the risk of running out of
usable tools or raw material and being unable to perform key activities. This risk

9. Discussion and Conclusion
233
increases during a toolstone foray in proportion to the time, energy, and opportunity
costs involved in searching for, handling and processing stone. As the costs of
acquiring stone increase, for example through increased travel times to the source, it
would be expected that the use extracted per unit of stone acquired will increase. In
practical terms, the more difficult it is to get a nodule of rock, the more useful that rock
has to be inorder to justify the investment in acquiring it. One way to measure how
much use has been extracted in an assemblage is to see how extensive nodule
reduction has been, or how much time and effort was put into extracting flakes from
cores to perform tasks. Figure 9.1 assumes that the costs of acquiring stone increase as
the time spent being mobile increases because increased mobility constrains the
scheduling of stone tool procurement and reduction through a decrease in the
predictability of encountering stone sources.
The modelin Figure 9.1 is well suited to the evidence from Tham Lod, where
assemblage reduction intensity appeared to have been tuned to environmental changes
indicated by the δ18O values. In terms of the schematic in Figure 9.1, foragers at Tham
Lod probably occupied the spectrum between point A and point B, depending on the
degree of mobility that suited the environmental conditions. A similar model explains
the pattern of occupation intensity at Tham Lod, if the ‘time invested in technology’
axis is relabelled ‘inverse of occupation intensity’, since occupation appeared to
become less intensive during times when higher mobility is predicted because of
reduced precipitation.
The model is less well suited to describing the differences between Tham Lod and Ban
Rai, which includes a major reorganisation of mobility strategies as people shift their
habitation from a low site close to the river and stone sources to an elevated site away
from these resources. If occupation at Tham Lod can be modelled as occupying the
region between points A and B on Figure 9.1, how can Ban Rai be modelled? The
higher values for assemblage reduction intensity suggest that the optimum level of
mobility at Ban Rai should be to the left of point B, but the higher occupation intensity
and lower degree of pre-processing at Ban Rai suggest that forager mobility at Ban Rai
was not higher than Tham Lod, or at least not substantially higher. As it is, the model
in Figure 9.1 can not resolve these differences between the two sites.
One clue towards resolving these differences into a unified model is the timing of
occupation at the two sites. In light of the local environmental conditions, the absence

9. Discussion and Conclusion
234
of overlap in the histories of occupation of the two sites is probably not accidental.
Drier and more variable conditions during the Pleistocene may have made locations
like Ban Rai impossible to occupy except fleetingly en route to more habitable
locations. Similarly, increased wetness during the Holocene may have made Tham Lod
uninhabitable because of the high density of vegetation, high humidity and
inhospitable fauna such as snakes and mosquitoes. In the case of Tham Lod, this
suggests that the correlation between wetness and site habitability is not a simple
linear function, but has a turning point where increasing wetness ceases to increase a
site’s habitability and instead makes it less habitable. In the case of Ban Rai, it may
have only become habitable after a certain threshold of wetness was passed, increasing
the reliability availability of surface water and altering the vegetation structure so that
semi-evergreen forests were more accessible from the site.
One approach to modelling the idea of a turning point is to consider a less complex
model relating only assemblage reduction and wetness or amount of precipitation.
Figure 9.2 shows how wetness could be related to assemblage reduction for the two
sites. At maximum dryness there is only one option for optimum reduction, but as
wetness increases there are two increasingly divergent optimal levels of reduction. On
the left side of the curve the optimal level of reduction decreases as wetness increases,
to the point where the curve intersects the vertical axis where no further decreases in
reduction are possible (there are obvious limits on the amount useful work that can be
done with unmodified cobbles). This is equivalent to the predictions of the optimal
dispersion model where increasing wetness corresponds to increasing evenness and
predictability of resources, increasing residential mobility and assemblages biased
towards place provisioning.
On the right side of the curve the optimal level of reduction increases as wetness
increases. This means that for a limited range of wetness there are two optimal levels of
reduction. For example, Figure 9.2 shows that a certain range of wetness can have two
different levels of assemblage reduction as optimal solutions (A-B or A’-B’). The
possibility of two optimal states for assemblage reduction in a given range of wetness
means that other factors must have played a substantial role in determining which of
the two solutions was the overall optimum state of technological organisation for a
given time and location. In this case, proximity of resources can be considered as an

9. Discussion and Conclusion
235
important factor for deciding between the two possible optimal solutions because of
the substantial difference in the local settings of the two sites.
The assemblage from Tham Lod occupies the region between points A and B on Figure
9.3, with relatively low levels of wetness corresponding to moderate levels of
reduction. The assemblage from Ban Rai occupies the region of the curve between
points C and D on Figure 9.3. The shorter distance between C and D compared to A
and B reflects difference in magnitude of variation in assemblage reduction intensity
between the two sites. This intersection of the curve with the vertical axis on Figure 9.3
is important because it indicates the point where the degree of wetness is sufficiently
high that further decreases in assemblage reduction are not a practical response to
increasing wetness and a major reorganisation of settlement patterns are necessary.
This may have been the case with Tham Lod and Ban Rai, where the commencement of
occupation at Ban Rai signalled a major shift in settlement patterns and increase in
assemblage reduction was an optimal strategy for foragers during the increased
wetness of the Holocene. This settlement shift is probably an outcome of innovative
behaviour compelled by conditions of greater risk sensitivity. Fitzhugh (2001) proposes
that as risk sensitive populations begin to experience mean yields below minimum
requirements, they should switch from a risk-averse to a risk prone attitude to
innovation. A risk prone attitude involves testing new technologies or strategies that
might give higher payoffs than existing ones in the new conditions. In this case, the
shift from Pleistocene to Holocene conditions was probably what caused foragers to
experience mean yields below minimum requirements and trigger a brief change in
risk management until the new strategy – one including Ban Rai as part of the
settlement system and abandoning Tham Lod – became established.
Integration of this simple turning-point model of wetness and assemblage reduction
into the MVT results in Figure 9.4. The key difference between this model and the
unmodified MVT is in the relationship between assemblage reduction and risk
reduction. In this modified model the relationship states that instead of ending in a
horizontal asymptote, the function reaches a point of inflection where increased
investment in assemblage reduction leads to continuing increases in risk reduction,
resembling a cubic function. In this example, the point of inflection represents the shift
in settlement from the low location of Tham Lod near the river to the elevated and
distant location at Ban Rai. For simplicity and realism, this function is defined as a

9. Discussion and Conclusion
236
partial function that is not defined for values beyond certain minimum and maximum
points on the horizontal axis, reflecting limitations encountered by human foragers.
Since the intention here is only semi-quantitative modelling, it is not necessary to
specify an equation to describe this model. Similar to the unmodified MVT, the Tham
Lod assemblage occupies the region between points A and B. The Ban Rai assemblage
occupies the region between points B and C on the horizontal axis, a much smaller
range than Tham Lod, reflecting the much smaller range of variation in assemblage
reduction intensity at Ban Rai compared to Tham Lod. The introduction of a point of
inflection means that although the degree of mobility was not very different between
the two sites, it is possible for the more reduced assemblage at Ban Rai to have been an
alternative optimal solution. The point of most extensive reduction at Ban Rai is
represented on Figure 9.4 by C’.
The implications of this revised model are that conventional models do not generalise
well when constraints result in more than one optimum strategy. This is a problem that
has been noted by animal ecologists, for example Kacelnik and Bateson (1996) note that
risk-sensitive foraging theory makes different predictions about how animals should
respond depending on the precise biological scenario, with the energy budget rule
failing as a universal predictor for risk-sensitive foraging models. The poor fit of
models based on energy as a currency has led Bateson (2002) to suggest that ‘we may
have to abandon the idea that animals evaluate alternative options using any absolute
currency, but instead evaluate options comparatively’. Although psychological factors
are undoubtedly relevant, they are unfortunately out of reach of an analysis of flaked
stone artefacts. Furthermore, the abandonment of an absolute currency might be an
overly extreme suggestion, since the identification of multiple optima here means that
risk reduction can still be employed as a single currency that is maximised despite
switches in habitat preference.

9. Discussion and Conclusion
237
Figure 9.1. Standard Marginal Value Theorem model
Figure 9.2. Schematic of a derivative function for the modified Marginal Value Theorem of Figure
9.1 above.

9. Discussion and Conclusion
238
Figure 9.3. Derivative function for modified Marginal Value Theorem showing probable positions
of Tham Lod (A-B) and Ban Rai (C-D).
Figure 9.4. Marginal Value Theorem modified to include inflection and multiple optima

9. Discussion and Conclusion
239
A history of human foragers in the northwest Thai uplands
In the context of previous archaeological work discussed in chapter two, this modelling
of technology and settlement has three substantial implications for current
understandings of cultural history in mainland Southeast Asia. The first implication is
a contribution to regional culture history. The first occupation of Tham Lod at about
35,000 BP is within the timing of first modern human activity in mainland Southeast
Asia proposed by other sites, such as about 38,000 BP at Lang Rongrien. The river
cobbles in the lowest levels of Tham Lod suggest that it was not a suitable location for
human habitation prior to about 35,000 BP. If Tham Lod had a substantial depth of
sterile deposit below the lowest artefacts then it might suggest that people were not in
the area at all until 35,000 BP. As it is, the geoarchaeology of Tham Lod only suggests
that this particular site was unsuitable for habitation during earlier periods and does
not rule out earlier human occupation of the study area. Earlier evidence is currently
very sparse, with small numbers of hominin teeth recovered from caves in northeast
Thailand (Tougard et al. 1998) and Vietnam (Demeter et al. 2005) dated to before
100,000 BP. There are also claims of hominid skeletal remains at 500,000 BP from
Lampang Province, Northwest Thailand (Pramankij and Subhavan 2001). The
contribution of Tham Lod to questions surrounding the earliest colonisation is that
sites in low open contexts such as Tham Lod are likely to be poor archives of human or
hominin occupation throughout varying hydrological regimes. More productive sites
are likely to be found in more elevated contexts.
In light of previous work, Tham Lod is unique as a site with continuous occupation
from about 35,000 BP to about 10,000 BP. Sequences at sites of similar antiquity, such as
Lang Rongrien and Lang Kamnan were interrupted by roof fall, creating
discontinuities and limiting analytical options. The sequence from Tham Lod has
allowed a longitudinal analysis of technological variation that has not been possible at
other sites. This has resulted in a number of new insights into Pleistocene occupation
that may reflect general trends in mainland Southeast Asia. For example, at Tham Lod
there is a peak in occupation intensity between about 30,200 BP and 33,300 BP, when
δ18O values are at their lowest, indicating relatively warm and wet conditions. This has
not been observed previously and might reflect a small increase in population as
conditions became less risky. A second insight is the observation that the Pleistocene
occupants of Tham Lod appear to have adapted their stone artefact technology to
closely track environmental change. This is an important point because previous work

9. Discussion and Conclusion
240
has tended to characterise Pleistocene assemblages as homogenous and unchanging
throughout the entire period. The results presented here suggest that this is not the
case, and instead that Pleistocene assemblages were flexible and their variation was a
key instrument of forager adaptation to the highly variable Pleistocene climate.
The second implication relates to one of the major themes in previous work on the
archaeological of foragers in mainland Southeast Asia; the apparent dominance of
flakes in Pleistocene assemblages, interpreted by Anderson (1990) and Van Tan (1997)
as the toolkit of highly mobile hunters. Although the discussion in chapter two was
limited to sites in Thailand, Van Tan (1997) argues that the prominence of flakes in
Pleistocene assemblages is also found in sites in northern Vietnam and southern China.
He labels the phenomena the Ngoumian and, like Anderson, argues that the change
from flake to pebble artefacts resulted from a change from cool climates to warmer and
more humid climates from the Pleistocene to the Holocene.
The approach taken here with the evidence from Tham Lod and Ban Rai suggests that
the Ngoumian as a distinctive cultural tradition is probably illusory. In chapter three it
was argued that unretouched flaked stone artefact assemblages, such as those typical
of mainland Southeast Asian sites, are poorly suited to the identification of cultural
traditions. This is because of the difficultly in reliably identifying and measuring
variation in artefact form that can be attributed to transmission biases that are
distinctive to a cultural tradition. Similarly, it was argued that invoking an explanation
for artefact form based on social transmission is problematic because of the difficulty of
reliably separating the effects of intentionality from the constraints of raw material
mechanics. The same arguments apply to other industries proposed from flaked stone
artefact assemblages in mainland Southeast Asia, such as the Hoabinhian and Sonvian.
Further, the evidence from Tham Lod and Ban Rai, like Lang Kamnan, offers little
support for the ubiquity of the Ngoumian in mainland Southeast Asia. While there are
a few excavation units with high MNF to core ratios in the Pleistocene, spanning a few
thousand years in total, there is no evidence for a sustained high ratio of MNF
throughout the Pleistocene compared to the Holocene assemblage at Ban Rai. In fact
the MNF to core ratios are generally lower during the Holocene. The pattern of a
change from flake tools to cobble tools does not seem to be present at Tham Lod and
Ban Rai, casting doubt on the universality claimed for the Ngoumian. That said, the
identification of the Ngoumian as a variation in stone artefact assemblages related to

9. Discussion and Conclusion
241
ecological conditions is strongly supported by the results presented in the previous
chapters. The previous chapter pointed out a number of stark differences between
Pleistocene and Holocene stone artefact technologies that were argued to be a result of
environmental factors. The key implication of this analysis for the Ngoumian is that the
characterisation of foragers as Pleistocene hunters and Holocene tree choppers is a
caricature. The differences are substantially more subtle and complicated than a
change from dominance of flakes to dominance of cobbles, but research instruments
employed in previous studies have not been designed to identify these subtleties.
The human behavioural ecological theory discussed in chapters three and four offers a
sound conceptual framework to pursue themes such as the Ngoumian. These concepts,
coupled with the robust methods discussed in chapter five, will contribute towards a
more objective and reliable understanding of variation in stone artefact assemblages
and more systematic monitoring technological adjustments to ecological variation. For
example, Anderson (1990) proposes that different regional typological variants of the
Hoabinhian probably reflect adaptations to different environmental settings. However,
available typological descriptions of these Hoabinhian variants are not based on
ecological theory and do not permit productive comparison to test Anderson’s
proposal. One of the key contributions of the work presented here is that a method has
been presented that will produce a theoretically informed and objective assemblage
analysis suitable for comparing with other assemblages analysed in the same way. The
method presented here avoids the problems of previous essentialist methods that
ignored large numbers of artefacts because they did not fit into type categories. These
previous methods also ignored continuous morphometric variation at the assemblage
level in favour of ideal specimens despite the empirical reality that these ideal types are
not representative of the assemblage.
The third implication of the work presented here that is relevant to previous
archaeological research is the apparent increase in numbers of sites during the early to
late Holocene. In chapter two it was noted that all nine sites described were occupied
over the period 10,000-5,000 BP with five sites that were only occupied during this
period. Reynolds’ (1990b) collection of dates from of a large number of Hoabinhian
sites throughout mainland Southeast Asia similarly suggests that this period was one
that resulted in a peak in the archaeological record (Figure 9.5). This middle Holocene
peak in human activity does not appear to have been previously described or

9. Discussion and Conclusion
242
explained. One possible explanation can be suggested from the discussion of
palaeoclimate data in chapter seven. It was noted that pollen sequences in China
record a Middle Holocene Optimum, a warm-moist event caused by changes in the
Earth’s orbit that spanned 8,200–5,700 BP. The trend of increasing dryness in the
sequence of δ18O values from Ban Rai was argued to reflect the end of this Middle
Holocene Optimum. This correlation of chronology of occupation and climatic
conditions, like all the correlations discussed here, does not prove the cause, but it
gives a strong hint. It is possible that the increased rainfall and reduced variability of
the Middle Holocene Optimum increased the abundance of resources and forager
population sizes increased as a result. The relatively high MNA at Ban Rai compared to
Tham Lod is suggestive of a higher population during the middle Holocene, but a
longer and more detailed Holocene sequence is needed to determine if this is localised
to the Middle Holocene Optimum or typical of the entire Holocene, or even due to
altered settlement patterns unrelated to population changes
If the Middle Holocene Optimum is related to the peak in forager activity then it is
noteworthy that there were no apparent changes in technological trajectories. For
example at Ban Rai there is no correlation between any of the stone artefact variables
and δ18O values as the effect of the Middle Holocene Optimum declines, although the
short span of the occupation sequence at Ban Rai means that the full effect of the
Middle Holocene Optimum is difficult to reliably measure. One possible explanation
for the apparent absence of technological reorganisation at this time is that the change
in climatic conditions resulted in an increase in population, which then posed new
problems for resource procurement and mobility organisation. The optimum solution
to these problems may have been a major reorganisation of subsistence strategies,
perhaps including more extensive manipulation of the availability of plant resources in
a way that came to resemble horticulture.

9. Discussion and Conclusion
243
Figure 9.5. Distribution of radiocarbon dates in mainland Southeast Asian archaeological sites
dominated by flaked stone artefact assemblages (n = 76). Data from Reynolds (Feynman 1965,
1985)
2
4
7
9
11
14
16
18
21
23
25
28
30
32
35
37
39
42
0 10 20 30
Uncalibrate
d ka BP
Number of Dates

9. Discussion and Conclusion
244
Some future directions
Comparison of the results presented in the previous chapters with the archaeological
research described in chapter two, such as in the previous section, is relatively
straightforward. On the other hand, comparison of the processes of obtaining results
used by this project and by previous workers reveals some stark differences and raises
broader implications about the nature of scientific progress in archaeology. A review of
the approach adopted for this project illustrates some of the philosophical departures
from previous work. This project was undertaken from the position that archaeology is
a science, a process of learning – in this case about people in the past – where
competing ideas are measured against observations (Feynman 1965, 1985). This is
generally also the case with previous work but it is helpful to identify alternative views
of the scientific method to understand the differences between this project and
previous work.
Although the body of relevant previous work is relatively small, it can be described as
the output of a ‘republic of science’ consisting of independent thinkers whose work has
been judged by three main criteria: plausibility; scientific value (including accuracy,
intrinsic interest and importance) and originality (Polanyi 1962). In this case, the main
criterion of scientific merit is adherence to research traditions and the deference to the
authority of communal beliefs and values (Ziman 2000a). Explicit discussion of
hypotheses and theories has not been prominent in previous work and there is limited
evidence of critical engagement. In the context of stone artefact archaeology in
mainland Southeast Asia, one of the key research traditions has been the typological
method of assemblage classification, based on the idea that discrete stone artefact types
are identifiable and have meaning relevant to human behaviour. This tradition has
been challenged twice, by Matthews (1964) and White and Gorman (2004), but with
limited effect probably because of the relatively delayed and obscure delivery of these
challenges and the firmness of typology as an established method.
The research project described here has attempted to work outside of the established
research traditions and extend the challenge posed by Matthews (1964) and White and
Gorman (2004). For example, the frothy debates about the definition, distribution and
timing of the Hoabinhian have been side-stepped here. Chapter four was devoted to
the problems and inadequacies of typological approaches to flaked stone artefact
assemblages in mainland Southeast Asia. As a result of that investigation, typological

9. Discussion and Conclusion
245
approaches were completely rejected for the analysis undertaken here. The innovations
presented in this thesis are well below the order required for a Kuhnian (1962) shift in
the focus of investigation where a large body of contradictory data has accumulated or
an alternative focus has been presented that explains the discrepancies between the
previous work and their observations. Instead, a possible future direction that this
work hints at is a shift from the adherence to tradition typical of the republic of science
model to the establishment of a broad scientific research program that is working on
the ‘hard core’ of prehistoric human ecology in mainland Southeast Asia (cf. Lakatos
1980).
In this context, the hypotheses of previous work are still valid and useful because of
their relevance to the hard core, despite the poor fit between the methods employed to
test these hypotheses. This project has offered some more effective methods and
progressive theory to continue the advancement of this scientific research program.
However, the proposal to establish a scientific research program does not necessarily
require the use of the theory and method presented here. It simply requires the
confrontation of multiple hypotheses with data as the arbitrator (Hilborn and Mangel
1997: 14). The formulation of hypotheses should encourage more explicit links between
method and theory, which has been the most serious weakness of the typological
approach. The constant testing and rejection of hypotheses is more likely to lead to
innovation and breakthroughs than the republic of science approach which has given
more weight to conformism than originality.
The ‘hard core’ of the research program that most of the previous work has revolved
around has been largely implicit. Anderson (1990) and Shoocongdej (2000) have been
the most explicit with their claims for links between climate and forager mobility and
technology. This project has evaluated these links in the context of one region and
attempted to more explicitly define the core of the research program. This has been
done by the identification of a theory, or a systematic statement of principles and
relationships, suitable for understanding flaked stone artefact assemblages typical of
mainland Southeast Asia. In this case, human behavioural ecology was identified as
the most productive conceptual framework.
An important consequence of the choice of theory in this project was that the theory
came with a number of well-developed models, or stylised representations used in
explaining phenomena. The explicit use of models is an important distinction between

9. Discussion and Conclusion
246
this project and previous work. Models are tools used to simplify a complex system or
process and direct attention to specific problems, communicate ideas and devise
testable predictions (Winterhalder 2002). Models are a bridge between raw intuitions
and abstractions and observable consequences and measureable qualities. They are
valuable for the discipline they impose on the selection of method and the logical links
they provide between theory and measurement. The use of models in archaeology is
not new (Clarke 1972), and this project has shown that models do not need to be highly
mathematical or sophisticated in order to reliably test predictions and generate new
knowledge about flaked stone artefact archaeology in mainland Southeast Asia.
Conclusion
To determine if the aim of this project was achieved, the four questions posed in the
introduction are reviewed here. The first question asked what the most productive
conceptual framework is for the analysis of technological organisation in mainland
Southeast Asia. This question was answered in chapter three which argued in general
that evolutionary theory was the most productive. Technological change was argued to
be analogous to Darwinian selection, where technological variants compete for
selection as the most successful instrument or action under the pressures of specific
tasks. More specifically, human behavioural ecology was identified as the style of
evolutionary explanation that was best suited to the constraints of the evidence from
the two sites. Selectionist approaches were dismissed because of their failure to address
questions about human behaviour and the problem of unstated and undemonstrated
assumptions about how technological change affects human reproductive fitness. Dual
Inheritance Theory (DIT) was similarly inappropriate because of the difficulty in
distinguishing between morphometric variation that is related to bias in the cultural
transmission of artefact-manufacturing instructions or simply related to variation in
the amount of reduction that the artefact or assemblage has undergone. A further
problem for both the selectionist and DIT approaches is that they have only been
employed on assemblages containing artefacts with very distinctive forms such as
Palaeoindian points. An important constraint of mainland Southeast Asian
assemblages is that they lack visually distinctive artefact forms, making it difficult to
employ selectionist and DIT approaches. Human behavioural ecology is more suitable
because it is focussed on adaptation rather than transmission, and how stone artefacts
form part of a general behavioural strategy to optimize risk reduction under specific
environmental conditions.

9. Discussion and Conclusion
247
The second question posed in the introduction asked how variation in technological
organisation in mainland Southeast Asia assemblages should be measured most
reliably and validly. Chapter three concluded with three models to generate
predictions to test with the stone artefact assemblages. In chapter four it was
established that the link between the predictions of the models and measurement of the
assemblages was the quality of risk reduction. Risk is a general quality that strongly
influences the way people organise their stone artefact technology. Kuhn’s (1995)
spectrum of place and individual provisioning was adapted as an instrument to
measure risk reduction. Individual provisioning is a strategy expected when the risk of
failing to obtain stone when it is needed is high, resulting in high investments of time
and energy in extending the useful lives of artefacts. On the other hand, place
provisioning is a strategy expected when risks of failure are low and relatively less
time and energy is invested in artefact production and maintenance. Through the
production and analysis of an experimental stone artefact assemblage, it was
demonstrated in chapter five that there are five attributes of complete flakes that are
indicators of the time and energy invested in stone artefact assemblages. These
variables are the presence of overhang removal, the percentage of dorsal cortex, the
number of dorsal flake scars, the interior platform angle and the distribution of dorsal
cortex. The identification of these variables completed the link from human
behavioural ecological theory to the three foraging models and their predictions to the
measurement of the assemblages for testing of the predictions.
The third question posed in the introduction was about the climatic history that formed
the backdrop of human forager activity in the northern Thai uplands. Chapter six
described the current climate and environmental setting of the two sites, identifying
the environmental parameters that were most likely to vary as a result of changes in
climate. Chapter seven reviewed previous work on climate history in Thailand and
presented a new proxy in the form of oxygen isotope sequences derived from
freshwater bivalves excavated from Tham Lod and Ban Rai. The reliability of the
oxygen isotope sequences was demonstrated by comparison to similar records from
speleothems in China. In general, the oxygen isotope sequences showed that
Pleistocene climates were substantially drier and more variable than Holocene
climates. More importantly, the isotope sequence established a climate history well-
suited for comparison with the stone artefact record because it came from the same

9. Discussion and Conclusion
248
location and at the equivalent chronological resolution of the stone artefact sequences
at Tham Lod and Ban Rai.
The fourth question asked to what extent climatic conditions were related to
technological organisation over time and space in the northern Thai uplands. This
question was answered in detail in chapter eight and earlier in this chapter. Three key
findings are worth repeating here: first, the results of the stone artefact analysis
demonstrated that Pleistocene technology was more sensitive to climate change than
Holocene technology, second that the change in climate from the Pleistocene to the
Holocene was accompanied by a shift in forager settlement patterns rather than a
substantial change in their stone artefact technology, and third that during the
Holocene technological change was more coherent and tuned to a higher frequency of
variation than during the Pleistocene, but no longer strongly coupled to environmental
variation.
Answering these four questions has made a modest but novel contribution to the
research problems resulting from incomplete knowledge and flawed understandings
of the organisation of flaked stone artefact technology under varying climatic
conditions in mainland Southeast Asia. Substantial future potential has been revealed
for reduction-based stone artefact assemblage analysis in mainland Southeast Asia and
computer-intensive statistical methods based on resampling for stone artefact analysis
in general. These kinds of analysis should now be employed to establish corroborating
evidence from a greater number of sites in Thailand. The evidence that the patterns
described here are based is very limited and future work should investigate the
presence of these patterns at other sites with evidence of Holocene and late Pleistocene
behavioural systems. Beyond the research problem, the practical significance of this
contribution is that two general human systems have been affirmed as successful
strategies for dealing with climate change: shifts in technological organisation and
shifts in settlement patterns. This project has demonstrated the resilience and
vulnerability of human groups to environmental variability. There is always a risk of
sounding trite when attempting to express the contemporary relevance of
archaeological research, especially research into chronologically remote and exotic
forms of human social organisation such as foragers. However, human cultures gauge
their ability to adapt to future climate variations on the basis of what is known from
past records and experience. Efforts to understand past cultural responses to large and

9. Discussion and Conclusion
249
persistent climate changes may prove instructive for assessing modern preparedness
for a changing and uncertain future (deMenocal 2001, Weiss and Bradley 2001). The
research described here implies that changes in human technological organisation and
settlement patterns are likely to be important strategies for managing climate change in
some contexts, including the present and future. Similarly, this research also implies
that in other contexts human behaviour and technology has sufficient pliancy and
latitude to manage climate change without any discernable modifications.

References
250
References
ABDI, H. (2006) Z-scores. IN SALKIND, N. J. (Ed.) Encyclopedia of Measurement and
Statistics. Sage Publications, Thousand Oaks.
AHLER, S. A. (1986) The Knife River Flint Quarries: Excavations at Site 32DU508,
Bismarck, State Historical Society of North Dakota.
ALDENDERFER, M. (1998) Quantitative methods in archaeology: A review of recent
trends and developments. Journal of Archaeological Research, 6, 91-120.
AMICK, D. S., MAULDIN, R. P. & BINFORD, L. R. (1989) The potential of experiments
in lithic technology. IN AMICK, D. S. & MAULDIN, R. P. (Eds.) Experiments in
Lithic Technology. Oxford, BAR International Series 528.
AMICK, D. S., MAULDIN, R. P. & TOMKA, S. A. (1988) An evaluation of debitage
produced by experimental bifacial core reduction of a Georgetown chert
nodule. Lithic Technology, 17, 26-36.
AN, Z. S., PORTER, S. C., KUTZBACH, J. E., WU, X. H., WANG, S. M., LIU, X. D., LI,
X. Q. & ZHOU, W. J. (2000) Asynchronous Holocene optimum of the East Asian
monsoon. Quaternary Science Reviews, 19, 743-762.
ANDERSON, D. D. (1987) A Pleistocene - Early Holocene rockshelter in Peninsular
Thailand. National Geographic Research, 3, 184-198.
ANDERSON, D. D. (1988) Excavations of a Pleistocene rockshelter in Krabi and the
prehistory of Southern Thailand. IN BRONSON, B. & CHAROENWONGSA, P.
(Eds.) Prehistoric Studies: The Stone and Metal Ages in Thailand. Bangkok, Thai
Antiquity Working Group.
ANDERSON, D. D. (1990) Lang Rongrien rockshelter: a Pleistocene-early Holocene
archaeological site from Krabi, Southwestern Thailand, Philadelphia, University
Museum, University of Pennsylvania.
ANDERSON, D. D. (1997) Cave archaeology in Southeast Asia. Geoarchaeology, 12, 607-
638.
ANDERSON, D. R., BURNHAM, K. P. & THOMPSON, W. L. (2000) Null Hypothesis
Testing: Problems, Prevalence, and an Alternative. The Journal of Wildlife
Management, 64, 912-923.
ANDREFSKY, W. (1998) Lithics: A macroscopic approach, Cambridge, Cambridge
University Press.
AUCLAIR, A.-C., LECUYER, C., BUCHER, H. & SHEPPARD, S. M. F. (2004) Carbon
and oxygen isotope composition of Nautilus macromphalus: a record of
thermocline waters off New Caledonia. Chemical Geology, 207, 91.
AUETRAKULVIT, P. (1995) การวิเคราะห์เทคนิคการกระเทาะเครื่องมือหิน : กรณีศึกษาตัวอย่าง เครื่องมือหินที่พบในหลุมขุดค้นแหล่งโบราณคดีถ ้าหมอเขียว 2 อ้าเภอเมือง จังหวัดกระบี่ Department of
Archaeology. Bangkok, Silpakorn University.

References
251
AYLING, B. F., MCCULLOCH, M. T., GAGAN, M. K., STIRLING, C. H., ANDERSEN,
M. B. & BLAKE, S. G. (2006) Sr/Ca and [delta]18O seasonality in a Porites coral
from the MIS 9 (339-303 ka) interglacial. Earth and Planetary Science Letters, 248,
462-475.
BAKER, A., ITO, E., SMART, P. L. & MCEWAN, R. F. (1997) Elevated and variable
values of 13C in speleothems in a British cave system. Chemical Geology, 136,
263-270.
BAMFORTH, D. B. (1986) Technological Efficiency and Tool Curation. American
Antiquity, 51, 38-50.
BAMFORTH, D. B. (2002) Evidence and metaphor in evolutionary archaeology.
American Antiquity, 68, 573-580.
BAMFORTH, D. B. & BLEED, P. (1997) Technology, Flaked Stone Technology, and
Risk. IN BARTON, C. M. & CLARK, G. A. (Eds.) Rediscovering Darwin:
Evolutionary Theory in Archeological Explanation. Archeological Papers of the
American Anthropological Association Number 7
BANNANURAG, R. (1988) Evidence for ancient woodworking: A microwear study of
Hoabinhian tools. IN BRONSON, B. & CHAROENWONGSA, P. (Eds.)
Prehistoric Studies: The Stone and Metal Ages in Thailand. Bangkok, Thai Antiquity
Working Group.
BAR-YOSEF, O. (1991) Raw material exploitation in the Levantine Epi-Paleolithic. IN
MONTET-WHITE, A. & HOLEN, S. R. (Eds.) Raw Material Economies Among
Prehistoric Hunter-Gatherers. Lawrence, University of Kansas Publications in
Anthropology.
BAR-YOSEF, O. (2002) The role of the Younger Dryas in the origin of agriculture in
west Asia. IN YASUDA, Y. (Ed.) The Origins of Pottery and Agriculture. New
Delhi, Roli Books.
BARLOW, K. R. & METCALFE, D. (1996) Plant utility indices: Two Great Basin
examples. Journal of Archaeological Science, 23, 351-371.
BARTON, C. M. (1988) Lithic Variability and Middle Paleolithic Behaviour: New evidence
from the Iberian Peninsula, Oxford, British Archaeological Reports.
BASALLA, G. (1988) The Evolution of Technology, Cambridge, Cambridge University
Press.
BATESON, M. (2002) Recent advances in our understanding of risk-sensitive foraging.
Proceedings of the Nutrition Society, 61, 509-519.
BAUMLER, M. F. & DOWNUM, C. E. (1989) Between micro and macro: A study in the
interpretation of small-sized lithic debitage. IN AMICK, D. S. & MAULDIN, R.
P. (Eds.) Experiments in Lithic Technology, British Archaeological Reports
International Series.
BAXTER, M. J. (1994) Exploratory multivariate analysis in archaeology, Edinburgh,
Edinburgh University Press.
BECK, C., TAYLOR, A. K., JONES, G. T., FADEM, C. M., COOK, C. R. & MILLWARD,
S. A. (2002) Rocks are heavy: transport costs and Paleoarchaic quarry behavior
in the Great Basin. Journal of Anthropological Archaeology, 21, 481-507.
BELSLEY, D. A., KUH, E. & WELSCH, R. E. (2004) Regression Diagnostics: Identifying
Influential Data and Sources of Collinearity, New York, Wiley-IEEE.
BENTLEY, R. A. & SHENNAN, S. J. (2003) Cultural transmission and stochastic
network growth. American Antiquity, 68, 459-485.

References
252
BERKSON, J. (1938) Some Difficulties of Interpretation Encountered in the Application
of the Chi-Square Test. Journal of the American Statistical Association, 33, 526-536.
BETTINGER, R. L. & EERKENS, J. (1997) Evolutionary implications of metrical
variation in Great Basin projectile points. IN BARTON, C. M. & CLARK, G. A.
(Eds.) Rediscovering Darwin: Evolutionary Theory and Archaeological Explanation.
Arlington, Virginia, American Anthropological Association.
BETTINGER, R. L. & EERKENS, J. (1999) Point Typologies, Cultural Transmission, and
the Spread of Bow-and-Arrow Technology in the Prehistoric Great Basin.
American Antiquity, 64, 231-242.
BETTINGER, R. L., MALHI, R. & MCCARTHY, H. (1997) Central Place Models of
Acorn and Mussel Processing. Journal of Archaeological Science, 24, 887-899.
BINFORD, L. R. (1979) Organizational and formation processes: looking at curated
technologies. Journal of Anthropological Research, 35, 255-273.
BINFORD, L. R. (1980) Willow Smoke and Dogs' Tails: Hunter-Gatherer Settlement
Systems and Archaeological Site Formation. American Antiquity, 45, 4-20.
BINFORD, L. R. & BINFORD, S. R. (1966) A Preliminary Analysis of Functional
Variability in the Mousterian of Levallois Facies. American Anthropologist, 68,
238-295.
BIRD, D. & O'CONNELL, J. (2006) Behavioral Ecology and Archaeology. Journal of
Archaeological Research, 14, 143-188.
BIRD, D. W. & BLIEGE BIRD, R. L. (1997) Contemporary Shellfish Gathering Strategies
among the Meriam of the Torres Strait Islands, Australia: Testing Predictions of
a Central Place Foraging Model. Journal of Archaeological Science, 24, 39-63.
BLAND, J. M. & ALTMAN, D. G. (1996) Statistics notes: Transformations, means, and
confidence intervals. British Medical Journal, 312, 1079.
BLEED, P. (1986) The optimal design of hunting weapons: maintainability or reliability.
American Antiquity, 51, 737-747.
BLEED, P. (1997) Content as variability, result as selection: toward a behavioural
definition of technology. IN CLARK, G. A. & BARTON, C. M. (Eds.)
Rediscovering Darwin: Evolutionary Theory in Archaeology. Washington, American
Anthropological Association.
BLEED, P. (2001) Trees or chains, links or branches: conceptual alternatives for
consideration of stone tool production and other sequential activities. Journal of
Archaeological Method and Theory, 8, 101-127.
BLIEGE BIRD, R., SMITH, E. & BIRD, D. (2001) The hunting handicap: costly signaling
in human foraging strategies. Behavioral Ecology and Sociobiology, 50, 9-19.
BOONE, J. L. & SMITH, E. A. (1998) Is it evolution yet? A critique of evolutionary
archaeology. Current Anthropology, 39, 141-157.
BOOS, D. D. (2003) Introduction to the Bootstrap World. Statistical Science, 18, 168-174.
BOOS, D. D. & HUGHES-OLIVER, J. M. (2000) How Large Does n Have to be for Z and
t Intervals? The American Statistician, 54, 121-128.
BOOTH, J. G. & HALL, P. (1994) Monte Carlo approximation and the iterated
bootstrap. Biometrika, 81, 331-340.
BORDES, F. & DE SONNEVILLE-BORDES, D. (1970) The Significance of Variability in
Palaeolithic Assemblages. World Archaeology, 2, 61-73.
BORISKOVSKY, P. I. (1971) Ancient Stone Age of South-Eastern Asia, Leningrad, Nauka.
BORODICH, F. M. (1997) Some fractal models of fracture. Journal of the Mechanics and
Physics of Solids, 45, 239-259.

References
253
BOUSMAN, C. B. (1993) Hunter-gatherer adaptations, economic risk and tool design.
Lithic Technology, 18, 59-85.
BOUSMAN, C. B. (2005) Coping with risk: Later stone age technological strategies at
Blydefontein Rock Shelter, South Africa. Journal of Anthropological Archaeology,
24, 193–226.
BOWLER, P. J. (2003) Evolution: The History of an Idea, Berkeley, CA, University of
California Press.
BOYD, R. & RICHERSON, P. J. (1985) Culture and the Evolutionary Process, Chicago,
University of Chicago Press.
BOYD, R. & RICHERSON, P. J. (1992) Cultural inheritance and evolutionary ecology.
IN WINTERHALDER, B. (Ed.) Evolutionary Ecology and Human Behavior. New
York, Aldine de Gruyer.
BRANTINGHAM, P. J. & KUHN, S. L. (2001) Constraints on Levallois Core
Technology: A Mathematical Model. Journal of Archaeological Science, 28, 747-761.
BRANTINGHAM, P. J., OLSEN, J. W., RECH, J. A. & KRIVOSHAPKIN, A. I. (2000)
Raw Material Quality and Prepared Core Technologies in Northeast Asia.
Journal of Archaeological Science, 27, 255-271.
BRAUN, D. R., TACTIKOS, J. C., FERRARO, J. V. & HARRIS, J. W. K. (2005) Flake
recovery rates and inferences of Oldowan hominin behavior: a response to
Kimura 1999, 2002. Journal of Human Evolution, 48, 525-531.
BRIGHTON, H., SMITH, K. & KIRBY, S. (2005) Language as an evolutionary system.
Physics of Life Reviews, 2, 177-226.
BROUGHTON, J. M. (1994) Late Holocene Resource Intensification in the Sacramento
Valley, California: The Vertebrate Evidence. Journal of Archaeological Science, 21,
501-514.
BROWN, C. T. (2001) The Fractal Dimensions of Lithic Reduction. Journal of
Archaeological Science, 28, 619-631.
BROWN, C. T., WITSCHEY, W. R. T. & LIEBOVITCH, L. S. (2005) The Broken Past:
Fractals in Archaeology. Journal of Archaeological Method and Theory, 12, 37-78.
BUCK, C. E., CAVANAGH, W. G. & LITTON, C. D. (1996) Bayesian approach to
interpreting archaeological data, England, Wiley Chichester
BUCK, C. E. & SAHU, S. K. (2000) Bayesian models for relative archaeological
chronology building. Applied Statistics, 49, 423-440.
BULBECK, F. D. (2003) Hunter-gatherer occupation of the Malay Peninsula from the
Ice Age to the Iron Age. IN MERCADER, J. (Ed.) Under the Canopy: The
Archaeology of Tropical Rainforests. Piscataway, NJ :, Rutgers University Press,.
BURNHAM, K. P. & ANDERSON, D. R. (2002) Model selection and multimodel inference:
a practical information-theoretic approach, New York, Springer-Verlag.
CANTY, A. J., DAVISON, A. C. & HINKLEY, D. V. (1996) Contribution to the
discussion of 'Bootstrap confidence intervals' by T. J. DiCiccio and B. Efron, .
Statistical Science, 11, 214-219.
CARACO, T. (1981) Risk-Sensitivity and Foraging Groups. Ecology, 62, 527-531.
CARMINES, E. G. & ZELLER, R. A. (1979) Reliability and validity assessment:
Quantitative applications in the social sciences, Beverly Hills, Sage.
CARRE, M., BENTALEB, I., BLAMART, D., OGLE, N., CARDENAS, F., ZEVALLOS,
S., KALIN, R. M., ORTLIEB, L. & FONTUGNE, M. (2005) Stable isotopes and
sclerochronology of the bivalve Mesodesma donacium: Potential application to

References
254
Peruvian paleoceanographic reconstructions. Palaeogeography, Palaeoclimatology,
Palaeoecology, 228, 4-25.
CARVER, R. P. (1993) The Case Against Statistical Significance Testing, Revisited.
Journal of Experimental Education, 61, 287-292.
CASTEEL, R. W. (1978) Faunal Assemblages and the" Wiegemethode" or Weight
Method. Journal of Field Archaeology, 5, 71-77.
CHARNOV, E. L. (1976) Optimal foraging: the marginal value theorem. Theoretical
Population Biology, 9, 129-136.
CHERNICK, M. R. (1999) Bootstrap methods: A practitioner's guide, New York Wiley.
CHIBNIK, M. (1985) The Use of Statistics in Sociocultural Anthropology. Annual Review
of Anthropology, 14, 135-157.
CHRISTEN, J. A. & LITTON, C. D. (1995) A bayesian approach to wiggle-matching.
Journal of Archaeological Science, 22, 719-725.
CHRISTENSON, A. L. (1979) On the Virtues of Simplicity: Some Comments on
Statistical Analysis in Anthropology. Plains Anthropologist, 24, 35-38.
CHRISTIE, D. (2004) Resampling with Excel. Teaching Statistics, 26, 9-14.
CHUNG, T. N. (1994) Technological and typological characteristics of the chipped tools
in the Hoa Binh culture. Vietnam Social Sciences, 5, 46-55.
CLARK, G. A. & STAFFORD, C. R. (1982) Quantification in American Archaeology: A
Historical Perspective. World Archaeology, 14, 98-119.
CLARKE, D. L. (1968) Analytical archaeology, London, Methuen
CLARKE, D. L. (1972) Models in archaeology, London, Methuen.
CLARKSON, C. (2002) An Index of Invasiveness for the Measurement of Unifacial and
Bifacial Retouch: A Theoretical, Experimental and Archaeological Verification.
Journal of Archaeological Science, 29, 65-75.
CLARKSON, C. (2004) Technological Provisioning and Assemblage Variation in the
Eastern Victoria River Region, Northern Australia: A Darwinian Perspective.
School of Archaeology and Anthropology. Canberra, Australian National
University.
CLARKSON, C. (2006) Interpreting Surface Assemblage Variation in Wardaman
Country, Northern Territory: An Ecological Approach. IN ULM, S. & LILLEY, I.
(Eds.) An Archæological Life: Papers in Honour of Jay Hall. Brisbane, Aboriginal
and Torres Strait Islander Studies Unit, The University of Queensland.
CLARKSON, C. (2007) Lithics in the land of the lightening brothers. The archaeology of
Wardaman Country, Northern Territory, Canberra, ANU E Press.
CLARKSON, C. & LAMB, L. (2005) Introduction: Casting New Light on Old Stones. IN
CLARKSON, C. & LAMB, L. (Eds.) Rocking the Boat: Recent Australian
Approaches to Lithic Reduction, Use and Classification. Oxford, Archaeopress.
CLARKSON, C. & O'CONNOR, S. (2005) An Introduction to Stone Artefact Analysis.
IN BALME, J. & PATERSON, A. (Eds.) Archaeology in Practice: A Student Guide to
Archaeological Analysis. Blackwell Publishing.
CLEVELAND, W. S. (1981) LOWESS: A Program for Smoothing Scatterplots by Robust
Locally Weighted Regression. The American Statistician, 35, 54-54.
CLEVELAND, W. S. (1984a) Graphical Methods for Data Presentation: Full Scale
Breaks, Dot Charts, and Multibased Logging. The American Statistician, 38, 270-
280.
CLEVELAND, W. S. (1984b) Graphs in Scientific Publications. The American Statistician,
38, 261-269.

References
255
CLEVELAND, W. S. & DEVLIN, S. J. (1988) Locally Weighted Regression: An
Approach to Regression Analysis by Local Fitting. Journal of the American
Statistical Association, 83, 596-610.
CLEVELAND, W. S. & MCGILL, R. (1985) Graphical Perception and Graphical
Methods for Analyzing Scientific Data. Science, 229, 828-833.
CLEVELAND, W. S. & MCGILL, R. (1987) Graphical Perception: The Visual Decoding
of Quantitative Information on Graphical Displays of Data. Journal of the Royal
Statistical Society. Series A (General), 150, 192-229.
COLANI, M. (1927) L'âge de la pierre dans la province de Hoa Binh. Mémoires du
Service Géologique de l'Indochine, 13.
COLLARD, M., KEMERY, M. & BANKS, S. (2005) Causes of Toolkit Variation Among
Hunter-Gatherers: A Test of Four Competing Hypotheses. Canadian Journal of
Archaeology, 29, 1-19.
COLLARD, M. & SHENNAN, S. (2000) Processes of Culture Change in Prehistory: A
Case Study from the European Neolithic. IN RENFREW, C. & BOYLE, K. (Eds.)
Archaeogenetics: DNA and the Population Prehistory of Europe. Cambridge,
McDonald Institute for Archaeological Research.
COLLARD, M. & TEHRANI, J. J. (2005) Cladistic analysis of Turkmen textiles sheds
light on cultural evolution. IN MACE, R., HOLDEN, C. J. & SHENNAN, S.
(Eds.) The Evolution of Cultural Diversity: a Phylogenetic Approach. London, UCL
Press.
COLLINS, M. C. (1975) Lithic technology as a means of processual inference. IN
SWANSON, E. (Ed.) Lithic Technology: Making and Using Stone Tools. The Hague,
Mouton.
COTTERELL, B. & KAMMINGA, J. (1987) The Formation of Flakes. American Antiquity,
52, 675-708.
COWAN, F. L. (1999) Making Sense of Flake Scatters: Lithic Technological Strategies
and Mobility. American Antiquity, 64, 593-607.
COWGILL, G. L. (1977) The Trouble with Significance Tests and What We can do
about It. American Antiquity, 42, 350-368.
CRABTREE, D. E. (1972) An introduction to flintworking, Occasional Papers of the Idaho
State University Museum, N.28.
CRISS, R. E. (1999) Principals of Stable Isotope Distribution, New York, Oxford University
Press.
CRONK, L. (1991) Human Behavioral Ecology. Annual Review of Anthropology, 20, 25-
53.
CUMMING, G. & FINCH, S. (2001) A Primer on the Understanding, Use, and
Calculation of Confidence Intervals that are Based on Central and Noncentral
Distributions. Educational and Psychological Measurement, 61, 532-574.
CUMMING, G. & FINCH, S. (2005) Inference by Eye: Confidence Intervals and How to
Read Pictures of Data. American Psychologist, 60, 170-180.
DANSGAARD, W. (1964) Stable isotopes in precipitation. Tellus 16 438-468.
DAVIDSON, I. (2002) The 'Finished Artefact Fallacy': Acheulean Handaxes and
Language Origins. . IN WRAY, A. (Ed.) The Transition to Language. Oxford,
Oxford University Press.
DAVIDSON, I. & NOBLE, I. R. (1993) Tools and Language in Human Evolution. IN
GIBSON, K. & INGOLD, T. (Eds.) Tools, Language and Cognition in Human
Evolution. Cambridge, Cambridge University Press.

References
256
DAVISON, A. C. & HINKLEY, D. V. (1997) Bootstrap methods and their application,
Cambridge, Cambridge University Press
DAWKINS, R. (1982) The Extended Phenotype: The Long Reach of the Gene, Oxford, Oxford
University Press.
DE TERRA, H. & MOVIUS, H. L. (1943) Research on Early Man in Burma. Transactions
of the American Philosophical Society, 32, 271-393.
DEAL, M. & HAGSTRUM, M. (1995) Ceramic Reuse Behavior among the Maya and
Wanka: Implications for Archaeology. IN SKIBO, M., WALKER, W. H. &
NIELSEN, A. E. (Eds.) Expanding Archaeology. Salt Lake City, University of Utah
Press.
DELLAPORTAS, P. (1998) Bayesian Classification of Neolithic Tools. Applied Statistics,
47, 279-297.
DEMENOCAL, P. B. (2001) Cultural Responses to Climate Change During the Late
Holocene. Science, 292, 667-673.
DEMETER, F., BACON, A.-M., NGUYEN, K. T., LONG, V. T., DURINGER, P.,
ROUSSE, S., COPPENS, Y., MATSUMURA, H., DODO, Y., NGUYEN, M. H. &
TOMOKO, A. (2005) Discovery of a second human molar and cranium
fragment in the late Middle to Late Pleistocene cave of Ma U'Oi (Northern
Vietnam). Journal of Human Evolution, 48, 393-402.
DENNETT, D. C. (1994) Darwin's Dangerous Idea: Evolution and the Meanings of Life,
London, Simon & Schuster.
DENNIS, B. (1996) Discussion: Should Ecologists Become Bayesians? Ecological
Applications, 6, 1095-1103.
DETTMAN, D. L. & LOHMANN, K. C. (1993) Seasonal change in Paleogene surface
water 18O: Fresh-water bivalves of western North America. Climate change in
continental isotopic records, Geophysical Monograph 78. American Geophysical
Union.
DETTMAN, D. L., REISCHE, A. K. & LOHMANN, K. C. (1999) Controls on the stable
isotope composition of seasonal growth bands in aragonitic fresh-water
bivalves (Unionidae). Geochimica et Cosmochimica Acta, 63, 1049-1057.
DI STEFANO, J., FIDLER, F. & CUMMING, G. (2005) Effect size estimates and
confidence intervals: An alternative focus for the presentation and
interpretation of ecological data. IN BURK, A. R. (Ed.) New Trends in Ecology
Research. Hauppauge, NY, Nova Science Publishing.
DIACONIS, P. & EFRON, B. (1983) Computer Intensive Methods in Statistics. Scientific
American, 248 116-130.
DIBBLE, H. (1995) Middle Paleolithic scraper reduction: background, clarification, and
review of evidence to date. Journal of Archaeological Method and Theory 2, 299-368.
DIBBLE, H., L. , SCHURMANS, U., A. , IOVITA, R., P. & MCLAUGHLIN, M., V.
(2005) The measurement and interpretation of cortex in lithic assemblages.
American Antiquity, 70, 545-560.
DIBBLE, H., ROTH, B. & LENOIR, M. (1995) The use of raw materials at Combe-
Capelle Bas. IN DIBBLE, H., ROTH, B. & LENOIR, M. (Eds.) The Middle
Paleolithic Site of Combe-Capelle Bas (France). Philadelphia, University Museum
Press.
DIBBLE, H. L. (1987) The Interpretation of Middle Paleolithic Scraper Morphology.
American Antiquity, 52, 109-117.

References
257
DIBBLE, H. L. & BERNARD, M. C. (1980) A Comparative Study of Basic Edge Angle
Measurement Techniques. American Antiquity, 45, 857-865.
DIBBLE, H. L. & PELCIN, A. (1995) The Effect of Hammer Mass and Velocity on Flake
Mass. Journal of Archaeological Science, 22, 429.
DIBBLE, H. L. & WHITTAKER, J. C. (1981) New experimental evidence on the relation
between percussion flaking and flake variation. Journal of Archaeological Science,
8, 283.
DICICCIO, T. J. & EFRON, B. (1996) Bootstrap Confidence Intervals. Statistical Science,
11, 189-212.
DICICCIO, T. J. & ROMANO, J. P. (1988) A Review of Bootstrap Confidence Intervals.
Journal of the Royal Statistical Society. Series B (Methodological), 50, 338-354.
DORALE, J. A., EDWARDS, R. L., ITO, E. & GONZALEZ, L. A. (1998) Climate and
Vegetation History of the Midcontinent from 75 to 25 ka: A Speleothem Record
from Crevice Cave, Missouri, USA. Science, 282, 1871-1874.
DRENNAN, R. D. (1996) Statistics for Archaeologists: A Commonsense Approach, New
York, Plenum Press.
DUNKLEY, J. R. (1985) Karst and Caves of the Nam Lang - Nam Khong region, North
Thailand. Helictite, 23, 3-22.
DUNKLEY, J. R. & BRUSH, J. B. (Eds.) (1986) Caves of Northwest Thailand: Report of the
Australian Speleological Expedition 1983-1986, Sydney, Speological Research
Council.
DUNN, J. & PLOMIN, R. (1990) Separate Lives: Why Siblings are So Different, New York,
John Wiley.
DUNNELL, R. C. (1971) Systematics in Prehistory, New York, The Free Press.
DUNNELL, R. C. (1978) Style and function: A fundamental dichotomy. American
Antiquity, 43, 192-202.
DUNNELL, R. C. (1980) Evolutionary theory and archaeology. IN SCHIFFER, M. B.
(Ed.) Advances in Method and Theory. New York, Academic Press.
DUNNELL, R. C. (1982) Science, social science, and common sense: the agonizing
dilemma of modern archaeology. Journal of Anthropological Research, 38, 1-25.
DUNNELL, R. C. (1986) Methodological issues in Americanist artifact classification. IN
SCHIFFER, M. B. (Ed.) Advances in Archaeological Method and Theory. New York,
Academic Press.
DUNNELL, R. C. (1989) Aspects of the application of evolutionary theory. IN
LAMBERG-KARLOVSKY, C. C. (Ed.) Archaeological thought in America.
Cambridge, Cambridge University Press.
DUNNELL, R. C. (1992) Archaeology and evolutionary science. IN WANDSNIDER, L.
(Ed.) Quandaries and quests: Visions of archaeology's future. Center for
Archaeological Investigations Occasional Paper 20.
DUPRÉ, J. (1993) The Disorder of Things: Metaphysical Foundations of the Disunity of
Science, Cambridge, Harvard University Press.
DURHAM, W. H. (1981) Overview: Optimal Foraging Analysis in Human Ecology. IN
WINTERHALDER, B. & SMITH, E. A. (Eds.) Hunter-Gatherer Foraging Strategies:
Ethnographic and Archaeological Analyses. Chicago, The University of Chicago
Press.
EBERT, J. I. (1979) An ethnoarchaeological approach to reassessing the meaning of
variability in stone tool assemblages. IN KRAMER, C. (Ed.) Ethnoarchaeology:

References
258
Implications of Ethnography for Archaeology. New York, Columbia University
Press.
EERKENS, J. W. & BETTINGER, R. L. (2001) Techniques for Assessing Standardization
in Artifact Assemblages: Can We Scale Material Variability? American Antiquity,
66, 493-504.
EFRON, B. (1979) Computers and the Theory of Statistics: Thinking the Unthinkable.
SIAM Review, 21, 460-480.
EFRON, B. (1987) Better Bootstrap Confidence Intervals. Journal of the American
Statistical Association, 82, 171-185.
EFRON, B. & TIBSHIRANI, R. (1991) Statistical Data Analysis in the Computer Age.
Science, 253, 390-395.
EFRON, B. & TIBSHIRANI, R. J. (1993) An introduction to the bootstrap, New York,
Chapman & Hall.
ELSTON, R. & RAVEN, C. (Eds.) (1992) ArchaeologicaI lnvestigations at Tosawihi, A Great
Basin Quarry, Silver City, Intermountian Research.
ELSTON, R. G. & BRANTINGHAM, P. J. (2002) Microlithic Technology in Northern
Asia: A Risk-Minimizing Strategy of the Late Paleolithic and Early Holocene.
Archeological Papers of the American Anthropological Association, 12, 103-116.
ELY, M. (2001) The importance of estimates and confidence intervals rather than p
values. Sociology, 33, 185-190.
EREN, M. I., DOMINGUEZ-RODRIGO, M., KUHN, S. L., ADLER, D. S., LE, I. & BAR-
YOSEF, O. (2005) Defining and measuring reduction in unifacial stone tools.
Journal of Archaeological Science, 32, 1190-1201.
EVANS, D., POTTIER, C., FLETCHER, R., HENSLEY, S., TAPLEY, I., MILNE, A. &
BARBETTI, M. (2007) A comprehensive archaeological map of the world's
largest preindustrial settlement complex at Angkor, Cambodia. Proceedings of
the National Academy of Sciences, 104, 14277-14282.
FALINI, G., ALBECK, S., WEINER, S. & ADDADI, L. (1996) Control of Aragonite or
Calcite Polymorphism by Mollusk Shell Macromolecules. Science, 271, 67-69.
FEINGOLD, A. (1994) Gender differences in personality: a meta-analysis. Psychological
Bulletin, 116, 429-56.
FEYNMAN, R. P. (1965) The Character of Physical Law, Cambridge, MIT Press.
FEYNMAN, R. P. (1985) Surely You’re Joking Mr Feynman, New York, W. W. Norton
and Sons.
FIDLER, F., BURGMAN, M. A., CUMMING, G., BUTTROSE, R. & THOMASON, N.
(2006) Impact of Criticism of Null-Hypothesis Significance Testing on Statistical
Reporting Practices in Conservation Biology. Conservation Biology, 20, 1539-1544.
FIDLER, F., CUMMING, G., BURGMAN, M. & THOMASON, N. (2004a) Statistical
reform in medicine, psychology and ecology. Journal of Socio-Economics, 33, 615-
630.
FIDLER, F., THOMASON, N., CUMMING, G., FINCH, S. & LEEMAN, J. (2004b)
Editors can lead researchers to confidence intervals, but can't make them think:
statistical reform lessons from medicine. Psychological Science, 15, 119-26.
FIELLER, N., GILBERTSON, D., GRIFFIN, C., BRIGGS, D. & JENKINSON, R. (1992a)
The statistical modeling of the grain size distributions of cave sediments using
log skew Laplace distributions: Creswell Crags, near Sheffield, England. Journal
of Archaeological Science, 19, 129-150.

References
259
FIELLER, N. R. J., FLENLEY, E. C. & OLBRICHT, W. (1992b) Statistics of Particle Size
Data. Applied Statistics, 41, 127-146.
FISH, P. R. (1978) Consistency in archaeological measurement and classification: a pilot
study. American Antiquity, 43, 86–89.
FITZHUGH, B. (2001) Risk and invention in human technological evolution. Journal of
Anthropological Archaeology, 20, 125-167.
FLANNERY, K. V. (1999) Process and agency in early state formation. Cambridge
Archaeological Journal, 9, 3–21.
FLECK, J. (1992) Selectionism Dominant: An Essay Review. Science, Technology, &
Human Values, 17, 237-248.
FLENLEY, J. R. (1979) The equatorial rain forest: A geological history, London,
Butterworths.
FLENLEY, J. R. (1998) Tropical Forests Under the Climates of the Last 30,000 Years.
Climatic Change, 39, 177-197.
FLENNIKEN, J. J. (1984) The Past, Present, and Future of Flintknapping: An
Anthropological Perspective. Annual Review of Anthropology, 13, 187-203.
FORESTIER, H. (2000) De quelques chaînes opératoires lithiques en Asie du Sud-Est au
pléistocène supérieur final et au début de l'holocène L'Anthropologie, 104, 531-
548.
FORESTIER, H., ZEITOUN, V., SEVEAU, A., DRIWANTOR, D. & WINAYALAI, C.
(2005) Prospections paléolithicques et perspectives technologiques pour
redéfinir le hoabinhien du Nord de la Thaïlande (campagnes 2002-2005).
Aséanie, 15, 33-60.
FRIEDMAN, G. F. (1959) Identification of carbonate minerals by staining methods.
Journal of Sedimentary Petrology, 29, 87-97.
GALLAGHER, J. (1977) Contemporary stone tools in Ethiopia: Implications for
archaeology. Journal of Field Archaeology, 4, 407-414.
GAMBLE, C. (2004) Archaeology: The Basics, London, Routledge.
GARDNER, M. J. & ALTMAN, D. G. (1986) Confidence intervals rather than P values:
estimation rather than hypothesis testing. British Medical Journal, 292, 746-50.
GEIST, J., AUERSWALD, K. & BOOM, A. (2005) Stable carbon isotopes in freshwater
mussel shells: Environmental record or marker for metabolic activity?
Geochimica et Cosmochimica Acta, 69, 3545.
GELL, A. (1998) Art and Agency. An Anthropological Theory, Oxford, Clarendon Press.
GILL, J. (1999) The Insignificance of Null Hypothesis Significance Testing. Political
Research Quarterly, 52, 647-674.
GILLAN, D. J. & RICHMAN, E. H. (1994) Minimalism and the Syntax of Graphs.
Human Factors: The Journal of the Human Factors and Ergonomics Society, 36, 619-
644.
GLINER, J., A., LEECH, N., L. & MORGAN, G., A. (2002) Problems with Null
Hypothesis Significance Testing (NHST): What do the textbooks say? The
Journal of Experimental Education, 71, 83.
GLOVER, I. (1993) Other people's pasts: Western archaeologists and Thai prehistory.
Journal of the Siam Society, 81, 45-53.
GLOVER, I. C. (2001) Archaeology, Nationalism and Politics in Southeast Asia. Hukay:
Bulletin of the University of the Philippines Archaeological Studies Program, 3, 37-65.

References
260
GOEDE, A. (1994) Continuous early last glacial palaeoenvironmental record from a
tasmanian speleothem based on stable isotope and minor element variations.
Quaternary Science Reviews, 13, 283-291.
GOLDBERG, P. & MACPHAIL, R. I. (2006) Practical And Theoretical Geoarchaeology,
Cornwall, Blackwell Publishing.
GOOD, P. (2005) Introduction to statistics through resampling methods and Microsoft Office
Excel, Chichester, Wiley.
GOODYEAR, A. C. (1989) A hypothesis for the use of crypto-crystalline raw materials
among Paleoindian groups of North America. IN ELLIS, C. G. & LOTHROP, J.
C. (Eds.) Eastern Paleoindian Lithic Resource Use. Boulder (Co), Westview Press.
GORMAN, C. (1969a) Hoabinhian: A pebble tool complex with early plant associations
in Southeast Asia. Science, 163, 671-673.
GORMAN, C. (1969b) Review of 'Archaeological Excavations in Thailand, Volume 1:
Sai Yok: Stone Age Settlements in the Kanchanaburi Province. Dr H. R. van
Heekeren and Count Eigil Knuth. Copenhagen: Munksgaard, 1967. Asian
Perspectives, 11, 124-127.
GORMAN, C. (1971a) The Hoabinhian and After: Subsistence Patterns in Southeast
Asia during the Late Pleistocene and Early Recent Periods. World Archaeology, 2,
300-320.
GORMAN, C. (1971b) Prehistoric Research in North Thailand: A Culture-
Chronographic Sequence from the Late Pleistocene to the Early Recent Period.
PhD Thesis. Honolulu, University of Hawaii.
GORMAN, C. (1972) Excavations at Spirit Cave, North Thailand: Some interim
interpretations. Asian Perspectives, 13, 79-107.
GOSDEN, C. (2005) What Do Objects Want? Journal of Archaeological Method and Theory,
12, 193-211.
GOULD, R. A., KOSTER, D. A. & SONTZ, A. H. L. (1971) The Lithic Assemblage of the
Western Desert Aborigines of Australia. American Antiquity, 36, 149-169.
GRAYSON, D. K. & DELPECH, F. (1998) Changing diet breadth in the Early Upper
Palaeolithic of Southwestern France. Journal of Archaeological Science, 25, 1119-
1130.
GREMILLION, K. J. (2002) Foraging Theory and Hypothesis Testing in Archaeology:
An Exploration of Methodological Problems and Solutions. Journal of
Anthropological Archaeology, 21, 142-164.
GROSSMAN, E. L. & KU, T. (1986) Oxygen and carbon isotope fractionation in
biogenic aragonite: temperature effects. Chemical Geology, 59, 59-74.
GUTHERY, F. S., BRENNAN, L. A., PETERSON, M. J. & LUSK, J. J. (2005) Information
Theory in wildlife science: Critique and viewpoint. Journal of Wildlife
Management, 69, 457-465.
HALEKOH, U. & VACH, W. (2004) A Bayesian approach to seriation problems in
archaeology. Computational Statistics and Data Analysis, 45, 651-673.
HALL, P. (1986) On the Number of Bootstrap Simulations Required to Construct a
Confidence Interval. The Annals of Statistics, 14, 1453-1462.
HALL, P. (1988) Theoretical Comparison of Bootstrap Confidence Intervals. The Annals
of Statistics, 16, 927-953.
HALL, P. (1989) Unusual properties of bootstrap confidence intervals in regression
problems. Probability Theory and Related Fields, 81, 247-273.

References
261
HARPENDING, H. C. & DAVIS, H. (1977) Some implications for hunter-gatherer
ecology derived from the spatial structure of resources. World Archaeology, 8,
275-286.
HASTINGS, P. & LIENGSAKUL, M. (1983) Chronology of the Late Quaternary climatic
changes in Thailand. IN THIRAMONGKOL, N. & PISUTHA-ARNOND, V.
(Eds.) Proceedings of the First Symposium on Geomorphology and Quaternary
Geology of Thailand. Bangkok, Chulalongkorn University Department of
Geology.
HAWKES, K., HILL, K. & O'CONNELL, J. F. (1982) Why hunters gather: Optimal
foraging and the Ache of Eastern Paraguay. American Ethnologist, 9, 379-398.
HAWKES, K., ROGERS, A. R. & CHARNOV, E. L. (1995) The male's dilemma:
Increased offspring production is more paternity to steal. Evolutionary Ecology,
9, 662-677.
HAYDEN, B. (1977) Stone tool functions in the Western Desert. IN WRIGHT, R. V. S.
(Ed.) Stone Tools as Cultural Markers, Change, Evolution and Complexity. Canberra,
Australian Institute of Aboriginal Studies.
HAYDEN, B. (1979) Palaeolithic Reflections: Lithic Technology and Ethnographic
Excavations Among Australian Aborigines Canberra, Australian Institute of
Aboriginal Studies.
HEFFLEY, S. (1981) The Relationship between Northern Athapaskan Settlement
Patterns and Resource Distribution: An Application of Horn's Model. IN
WINTERHALDER, B. & SMITH, E. A. (Eds.) Hunter-Gatherer Foraging Strategies:
Ethnographic and Archaeological Analyses. Chicago, The University of Chicago
Press.
HEIDER, K. G. (1958) A pebble-tool complex in Thailand. Asian Perspectives, 2, 64-67.
HEMMING, S. R. (2004) Heinrich events: massive late Pleistocene detritus layers of the
North Atlantic and their global climate imprint. Review of Geophysics, 42, 1-43.
HENRY, D. (1989) Correlations between reduction strategies and settlement patterns.
IN HENRY, D. O. & ODELL, G. H. (Eds.) Alternative Approaches to Lithic
Analysis. Washington, American Anthropological Association.
HIGHAM, C. F. W. (2002) Early Cultures of Mainland Southeast Asia, Bangkok, River
Books.
HILBORN, R. & MANGEL, M. (1997) The Ecological Detective: Confronting Models with
Data, Princeton Princeton University Press.
HISCOCK, P. (1994) Technological responses to risk in Holocene Australia. Journal of
World Prehistory, 8, 267-292.
HISCOCK, P. (2002a) Pattern and Context in the Holocene Proliferation of Backed
Artifacts in Australia. Archaeological Papers of the American Anthropological
Association, 12, 163-177.
HISCOCK, P. (2002b) Quantifying the Size of Artefact Assemblages. Journal of
Archaeological Science, 29, 251-258.
HISCOCK, P. (2006) Blunt and to the Point: Changing technological strategies in
Holocene Australia. IN LILLEY, I. (Ed.) Archaeology in Oceania: Australia and the
Pacific Islands. Blackwell.
HISCOCK, P. (2007) Looking the other way: a materialist/technological approach to
classifying tools and implements, cores and retouched flakes, with examples
from Australia. IN MCPHERRON, S. & LINDLEY, J. (Eds.) Tools or Cores? The

References
262
Identification and Study of Alternative Core Technology in Lithic Assemblages.
Pennsylvania, University of Pennsylvania Museum.
HISCOCK, P. & ATTENBROW, V. (2003) Early Australian implement variation: a
reduction model. Journal of Archaeological Science, 30, 239–249.
HISCOCK, P. & ATTENBROW, V. (2005) Australian's Eastern Regional Sequence
Revisited. Technology and change at Capertee 3, Oxford, Archaeopress.
HISCOCK, P. & CLARKSON, C. (2005a) Experimental evaluation of Kuhn's geometric
index of reduction and the flat-flake problem. Journal of Archaeological Science,
32, 1015-1022.
HISCOCK, P. & CLARKSON, C. (2005b) Measuring Artefact Reduction - An
Examination of Kuhn's Geometric Index of Reduction. IN CLARKSON, C. &
LAMB, L. (Eds.) Lithics 'Down Under': Australian Perspectives on Lithic Reduction,
Use and Classification. Oxford, Archaeopress.
HOEFS, J. (2004) Stable Isotope Geochemistry, Berlin, Springer.
HORN, H. S. (1968) The adaptive significance of colonial nesting in the Brewer's
Blackbird (Euphagus cyanocephalus). Ecology, 49, 682-694.
HOYLE, S. D. & CAMERON, D. S. (2003) Confidence intervals on catch estimates from
a recreational fishing survey: a comparison of bootstrap methods. Fisheries
Management and Ecology, 10, 97-108.
HULL, D. L. (1965a) The Effect of Essentialism on Taxonomy--Two Thousand Years of
Stasis (I). British Journal for the Philosophy of Science, 15, 314-326.
HULL, D. L. (1965b) The Effect of Essentialism on Taxonomy--Two Thousand Years of
Stasis (II). British Journal for the Philosophy of Science, 16, 1-18.
HULL, D. L., LANGMAN, R. E. & GLENN, S. S. (2001) A general account of selection:
Biology, immunology, and behavior. Behavioral and Brain Sciences, 24, 511–573.
HUTTERER, K. L. (1977) Reinterpreting the Southeast Asian Palaeolithic. IN ALLEN,
J., GOLSON, J. & JONES, R. (Eds.) Sunda and Sahul. London, Academic Press.
HUTTERER, K. L. (1985) The Pleistocene archaeology of Southeast Asia in regional
context. Modern Quaternary Research in Southeast Asia, 9, 1-23.
HUU NGA, H. (1994) The Hoa Bin and Bac Son cultures in Vietnam. Vietnam Social
Sciences, 5, 31-34.
III, J. E. P., WIENER, J. G. & SMITH, M. H. (1978) The Weibull Distribution: A New
Method of Summarizing Survivorship Data. Ecology, 59, 175-179.
INSIGHTFUL CORPORATION (2002) S-PLUS Resample Library User’s Manual, Seattle,
Insightful Corporation.
INSIGHTFUL CORPORATION (2007) S-PLUS 8 for Windows User's Guide, Seattle,
Insightful Corporation.
JEFFARES, B. (2002) The Scope and Limits of Biological Explanations in Archaeology.
MA Thesis. Wellington, Victoria University of Wellington.
JEFFARES, B. (2005) Regaining Archaeology’s Nerve: Culture and Biology in
Archaeological Theory. Biology and Philosophy, 20, 545-556.
JEREMIE, S. & VACHER, S. (1992) Le Hoabinhien en Thailande: un exemple
d'approche experimentale. Bulletin de l'Ecole Francaise d'Extreme-Orient, 79, 173-
209.
JOCHIM, M. (1983) Optimization models in context. IN MOORE, J. A. & KEENE, A. S.
(Eds.) Archaeological Hammers and Theories. London, Academic Press.

References
263
JOCHIM, M. A. (1989) Optimization and stone tool studies: Problems and potential. IN
TORRENCE, R. (Ed.) Time, Energy and Stone Tools. Cambridge, Cambridge
University Press.
JOHNSON, D. H. (1999) The Insignificance of Statistical Significance Testing. The
Journal of Wildlife Management, 63, 763-772.
JOHNSON, D. H. (2005) What hypothesis tests are not: a response to Colegrave and
Ruxton. Behavioural Ecology, 16, 323-324.
JOHNSON, J. B. & OMLAND, K. S. (2004) Model selection in ecology and evolution.
Trends in Ecology & Evolution, 19, 101-108.
JONES, D. S., QUITMYER, I. R. & ANDRUS, C. F. T. (2005) Oxygen isotopic evidence
for greater seasonality in Holocene shells of Donax variabilis from Florida.
Palaeogeography, Palaeoclimatology, Palaeoecology, 228, 96-108.
JORDAN, P. & SHENNAN, S. (2003) Cultural transmission, language, and basketry
traditions amongst the California Indians. Journal of Anthropological Archaeology,
22, 42-74.
JUSTESON, J. S. (1973) Limitations of Archaeological Inference: An Information-
Theoretic Approach with Applications in Methodology. American Antiquity, 38,
131-149.
KAANDORP, R. J. G., VONHOF, H. B., DEL BUSTO, C., WESSELINGH, F. P.,
GANSSEN, G. M., MARMOL, A. E., ROMERO PITTMAN, L. & VAN HINTE, J.
E. (2003) Seasonal stable isotope variations of the modern Amazonian
freshwater bivalve Anodontites trapesialis. Palaeogeography, Palaeoclimatology,
Palaeoecology, 194, 339.
KACELNIK, A. & BATESON, M. (1996) Risky Theories--The Effects of Variance on
Foraging Decisions. American Zoologist, 36, 402-434.
KACELNIK, A. & BATESON, M. (1997) Risk sensitivity: cross-roads for theories of
decision-making. Trends in Cognitive Science, 1, 304-309.
KAPLAN, H. & HILL, K. (1992) The evolutionary ecology of food acquisition. IN
SMITH, E. A. & WINTERHALDER, B. (Eds.) Evolutionary Ecology and Human
Behaviour. New York, Aldine De Gruyter.
KASS, R. E. & RAFTERY, A. E. (1995) Bayes Factors. Journal of the American Statistical
Association, 90, 773-795.
KEALHOFER, L. (1996) The human environment during the terminal Pleistocene and
Holocene in Northeastern Thailand: Phytolith evidence from Lake
Kumphawapi. Asian Perspectives, 35, 229-254.
KEALHOFER, L. (2002) Changing Perceptions of Risk: The Development of Agro-
Ecosystems in Southeast Asia. American Anthropologist, 104, 178-194.
KEALHOFER, L. & PENNY, D. (1998) A combined pollen and phytolith record for
fourteen thousand years of vegetation change in northeastern Thailand. Review
of Palaeobotany and Palynology, 103, 83-93.
KELLEY, K. (2005) The Effects of Nonnormal Distributions on Confidence Intervals
Around the Standardized Mean Difference: Bootstrap and Parametric
Confidence Intervals. Educational and Psychological Measurement, 65, 51-69.
KELLY, R. L. (1988) The Three Sides of a Biface. American Antiquity, 53, 717-734.
KELLY, R. L. (1992) Mobility/Sedentism: Concepts, Archaeological Measures, and
Effects. Annual Review of Anthropology, 21, 43-66.
KELLY, R. L. (1995) The Foraging Spectrum: Diversity in Hunter-Gatherer Lifeways,
Washington, D.C, Smithsonian Institution Press.

References
264
KENT, S. (1992) Studying Variability in the Archaeological Record: An
Ethnoarchaeological Model for Distinguishing Mobility Patterns. American
Antiquity, 57, 635-660.
KERNMEL-TORRÈS, D. (Ed.) (2004) Atlas of Thailand: Spatial Structures and
Development, Chiang Mai, IRD Editions, Paris.
KHAC SU, N. (1994) The Sonvian and the problem of the proto-Hoabinhian in
Vietnam. Vietnam Social Sciences, 5, 22-30.
KHAOKIEW, C. (2004) Geoarchaeology of Tham Lod rockshelter, Mae Hong Son. MA
Thesis. Department of Geology. Bangkok, Chulalongkorn University.
KHEDARI, J., SANGPRAJAK, A. & HIRUNLABH, J. (2002) Thailand climatic zones.
Renewable Energy, 25, 267-280.
KIERNAN, K. (1987) Soil erosion from the hilltribe opium swiddens in the Golden
Triange, and the use of Karren as an erosion yardstick. Endins: Publicació
d'Espeleologia, 13, 59-63.
KIERNAN, K. (1991a) Geomorphological Evidence for Quaternary Climatic Change in
the Low Sino-Burman Ranges. Singapore Journal of Tropical Geography, 12, 112-
123.
KIERNAN, K. (1991b) Tropical Mountain Geomorphology and Landscape Evolution in
Northwest Thailand. Zeitschrift für Geomorphologie NF, 53, 187-206.
KILIAN, L. (1999) Finite-Sample Properties of Percentile and Percentile-t Bootstrap
Confidence Intervals for Impulse Responses. The Review of Economics and
Statistics, 81, 652-660.
KILLICK, D. (2004) Social constructionist approaches to the study of technology. World
Archaeology, 36, 571-578.
KIM DZUNG, N. (1994) The study of using traces on the stone tools of Xom Trai Cave
(Hoa Binh culture). Vietnam Social Sciences, 5, 56-63.
KINTIGH, K. W. (1984) Measuring Archaeological Diversity by Comparison with
Simulated Assemblages. American Antiquity, 49, 44-54.
KLEIN, R. G. & CRUZ-URIBE, K. (1984) The Analysis of Animal Bones from Archeological
Sites, Chicago, University Of Chicago Press.
KUHN, S., L. (2004a) Evolutionary perspectives on technology and technological
change. World Archaeology, 36, 561-570.
KUHN, S. L. (1990) A geometric index of reduction for unifacial stone tools. Journal of
Archaeological Science, 17, 581-593.
KUHN, S. L. (1992a) Blank Form and Reduction as Determinants of Mousterian Scraper
Morphology. American Antiquity, 57, 115-128.
KUHN, S. L. (1992b) On planning and curated technologies in the Middle Paleolithic.
Journal of Anthropological Research, 48, 185-207.
KUHN, S. L. (1994) A Formal Approach to the Design and Assembly of Mobile
Toolkits. American Antiquity, 59, 426-442.
KUHN, S. L. (1995) Mousterian Lithic Technology, Princeton, Princeton University Press.
KUHN, S. L. (2004b) Upper Paleolithic raw material economies at UcagIzlI cave,
Turkey. Journal of Anthropological Archaeology, 23, 431-448.
KUHN, T. (1962) The Structure of Scientific Revolutions, Chicago University of Chicago
Press.
LAKATOS, I. (1980) The Methodology of Scientific Research Programmes, New York,
Cambridge University Press.

References
265
LAO YI PA, S. & TACUMMA, T. (2000) Forests in the Kong River and Lang River
Basins. IN DILOKWANICH, S., KULPARADIT, K., SIRIPORNPIBUL, C.,
SHOOCONGDEJ, R., SPIES, J., CHAREONTHONG, K. & LAOYIPA, S. (Eds.)
An Exploration and Database of the Caves of Mae Hong Son Province. Unpublished
Report to the Thailand Research Fund.
LEWIS, D. W. & MCCONCHIE, D. (1994) Analytical sedimentology, New York,
Chapman & Hall.
LIEW, P. M., LEE, C. Y. & KUO, C. M. (2006) Holocene thermal optimal and climate
variability of East Asian monsoon inferred from forest reconstruction of a
subalpine pollen sequence, Taiwan. Earth and Planetary Science Letters, 250, 596-
605.
LOEHLIN, J. C., WILLERMAN, L. & HORN, J. M. (1988) Human Behavior Genetics.
Annual Review of Anthropology, 39, 101-133.
LÖFFLER, E., THOMPSON, W. P. & LIENGSAKUL, M. (1983) Geomorphological
development of the Tung Kula Ronghai. IN THIRAMONGKOL, N. &
PISUTHA-ARNOND, V. (Eds.) Proceedings of the First Symposium on
Geomorphology and Quaternary Geology of Thailand. Bangkok, Chulalongkorn
University Department of Geology.
LUNNEBORG, C. E. (2000) Data Analysis by Resampling: Concepts and Applications,
California, Duxbury.
LYMAN, R. & O'BRIEN, M. (2006) Evolutionary archaeology is unlikely to go extinct:
response to Gabora. World Archaeology, 38, 697-703.
LYMAN, R. L. & O'BRIEN, M., J. (1998) The goals of evolutionary archaeology: History
and explanation. Current Anthropology, 39, 615.
LYMAN, R. L. & O'BRIEN, M. J. (1997) The Concept of Evolution in Early Twentieth-
Century Americanist Archaeology. Archeological Papers of the American
Anthropological Association, 7, 21-48.
LYMAN, R. L. & O'BRIEN, M. J. (2000) Measuring and Explaining Change in Artifact
Variation with Clade-Diversity Diagrams. Journal of Anthropological Archaeology,
19, 39-74.
LYMAN, R. L. & O'BRIEN, M. J. (2002) Classification. IN TERRELL, J. E. (Ed.) Darwin
and Archaeology: A Handbook of Key Concepts. Westport, Connecticut, Bergin and
Garvey.
LYMAN, R. L., O'BRIEN, M. J. & DUNNELL, R. C. (1997) The Rise and Fall of Culture
History, New York, Plenum Press.
MACARTHUR, R. H. & PIANKA, E. R. (1966) On optimal use of a patchy
environment. American Naturalist, 100, 603-609.
MACE, R., HOLDEN, C. J. & SHENNAN, S. J. (Eds.) (2005) The evolution of cultural
diversity. A Phylogenetic Approach, London, UCL Press.
MACGREGOR, O. (2005) Abrupt Terminations and stone artefact reduction potential.
IN CLARKSON, C. & LAMB, L. (Eds.) Rocking the Boat: Recent Australian
Approaches to Lithic Reduction, Use and Classification. Oxford, Archaeopress.
MACKAY, A. (2005) Informal Movements: Changing Mobility Patterns at
Ngarrabullgan, Cape York Australia. IN CLARKSON, C. & LAMB, L. (Eds.)
Rocking the Boat: Recent Australian Approaches to Lithic Reduction, Use and
Classification. Oxford, Archaeopress.

References
266
MADSEN, D. B., LI, J., BRANTINGHAM, P. J., GAO, X., ELSTON, R. G. &
BETTINGER, R. L. (2001) Dating Shuidonggou and the Upper Paleolithic blade
industry in North China. Antiquity, 75, 706-716.
MAGNE, M. P. & POKOTYLO, D. (1981) A pilot study in bifacial lithic reduction
sequences. Lithic Technology, 10, 34-47.
MALONEY, B. K. (1992) Late Holocene Climatic Change in Southeast Asia: The
Palynological Evidence and Its Implications for Archaeology. World Archaeology,
24, 25-34.
MALONEY, B. K. (1999) A 10,600-year pollen record from Nong Thale Song Hong,
Trang Province, South Thailand. Bulletin of the Indo-Pacific Prehistory Association
(Melaka Papers, Volume 2), 18, 129-137.
MANISAN, V. (1995) Geography and climatology in every season of various parts in
Thailand, Technical document of Meteorological Department, Thailand, Bangkok.
MANLY, B. F. J. (1997) Randomization, Bootstrap and Monte Carlo Methods in Biology,
London, Chapman and Hall.
MANNINO, M. A., SPIRO, B. F. & THOMAS, K. D. (2003) Sampling shells for
seasonality: oxygen isotope analysis on shell carbonates of the inter-tidal
gastropod Monodonta lineata (da Costa) from populations across its modern
range and from a Mesolithic site in southern Britain. Journal of Archaeological
Science, 30, 667.
MARKS, A. (1988) The curation of stone tools during the upper Pleistocene: a view
from the central Negev, Israel. IN DIBBLE, H. & MONTET-WHITE, A. (Eds.)
Upper Pleistocene Prehistory of Western Eurasia. Philadelphia, University Museum
Press.
MARKS, A., SHOKLER, J. & ZILHAO, J. (1991) Raw material usage in the Paleolithic.
The effects of local availability on selection and economy. IN MONTET-
WHITE, A. & HOLEN, S. R. (Eds.) Raw Material Economies Among Prehistoric
Hunter-Gatherers. Lawrence, University of Kansas Publications in
Anthropology.
MARWICK, B. (2006) What can archaeology do with Boyd and Richerson's cultural
evolutionary program? The Review of Archaeology 26, 30-40.
MARWICK, B. (2007a) Approaches to Stone Artefact Archaeology in Thailand: A
Historical Review. Silpakorn University International Journal, 7, 49-88.
MARWICK, B. (2007b) What Attributes are Important for the Measurement of
Assemblage Reduction Intensity? Results from an Experimental Stone Artefact
Assemblage with Relevance to the Hoabinhian of Mainland Southeast Asia
Journal of Archaeological Science, doi:10.1016/j.jas.2007.08.007.
MATTHEWS, J. M. (1964) The Hoabinhian in Southeast Asia and elsewhere. PhD
Thesis. Canberra, Australian National University.
MATTHEWS, J. M. (1966) A Review of the 'Hoabinhian' in Indo-China. Asian
Perspectives, 9, 86-95.
MAULDIN, R. P. & AMICK, D. S. (1989) Investigating patterning in debitage from
experimental biface core reduction. IN AMICK, D. S. & MAULDIN, R. P. (Eds.)
Experiments in Lithic Technology. Oxford, BAR International Series 528.
MAXWELL, A. L. (2001) Holocene Monsoon Changes Inferred from Lake Sediment
Pollen and Carbonate Records, Northeastern Cambodia. Quaternary Research,
56, 390-400.

References
267
MAXWELL, A. L. & LIU, K. B. (2002) Late Quaternary pollen and associated records
from the monsoonal areas of continental South and SE Asia. IN KERSHAW, P.,
DAVID, B., TAPPER, N., PENNY, D. & BROWN, J. (Eds.) Bridging Wallace’s
Line: The Environmental and Cultural History and Dynamics of the SE-Asian-
Australian Region, Advances in GeoEcology 34. Reiskirchen, Catena Verlag.
MAXWELL, S. E., CAMP, C. J. & ARVEY, R. D. (1981) Measures of strength of
association: A comparative examination. Journal of Applied Psychology, 66, 525-
534.
MAXWELL, S. E. & DELANEY, H. D. (1990) Designing Experiments and Analyzing Data:
A Model Comparison Perspective, Belmont, CA, Wadsworth.
MAYR, E. (1959) Darwin and the evolutionary theory in biology. IN MEGGERS, J. (Ed.)
Evolution and anthropology: A centennial appraisal. Washington, DC,
Anthropological Society of Washington.
MAYR, E. (1982) The Growth of Biological Thought: Diversity, Evolution and Inheritance,
Cambridge, Harvard University Press.
MCCALL, G. S. (2006) Multivariate perspectives on change and continuity in the
Middle Stone Age lithics from Klasies River Mouth, South Africa. Journal of
Human Evolution, 51, 429-439.
MCCALL, G. S. (2007) Behavioral ecological models of lithic technological change
during the later Middle Stone Age of South Africa. Journal of Archaeological
Science, In Press, Corrected Proof.
MCCULLOUGH, B. D. & WILSON, B. (2005) On the accuracy of statistical procedures
in Microsoft Excel 2003. Computational Statistics & Data Analysis, 49, 1244-1252.
MCDERMOTT, F. (2004) Palaeo-climate reconstruction from stable isotope variations
in speleothems: a review. Quaternary Science Reviews, 23, 901-918.
MEESE, D. A., GOW, A. J., ALLEY, R. B., ZIELINSKI, G. A., GROOTES, P. M., RAM,
M., TAYLOR, K. C., MAYEWSKI, P. A. & BOLZAN, J. F. (1997) The Greenland
Ice Sheet Project 2 depth-age scale: Methods and results. Journal of Geophysical
Research, 102, 26411-26424.
MEINEKE, I. (2000) An add-in implementation of the resampling syntax under
Microsoft Excel. Computer Methods and Programs in Biomedicine, 63, 99-104.
MESOUDI, A. (2005) The transmission and evolution of human culture. PhD Thesis. St.
Andrews, United Kingdom, University of St. Andrews.
MESOUDI, A., WHITEN, A. & LALAND, K. N. (2004) Is Human Cultural Evolution
Darwinian? Evidence Reviewed from the Perspective of The Origin of Species.
Evolution, 58, 1-11.
MESOUDI, A., WHITEN, A. & LALAND, K. N. (2006) Towards a unified science of
cultural evolution. Behavioral and Brain Sciences, 29, 329-347.
METCALFE, D. & BARLOW, K. R. (1992) A model for exploring the optimal trade-off
between field processing and transport. American Anthropologist, 94, 340-356.
MINC, L. & SMITH, K. (1989) The spirit of survival: Cultural responses to resource
variability in north Alaska. IN HALSTEAD, P. & O'SHEA, J. (Eds.) Bad Year
Economics. Cambridge, Cambridge University Press.
MITHEN, S. (1988) Modeling hunter-gatherer decision making: complementing
optimal foraging theory. Human Ecology, 17, 59-83.
MONTET-WHITE, A. (1991) Lithic acquisition, settlements, and territory in the
Epigravettian of central Europe. IN MONTET-WHITE, A. & HOLEN, S. R.

References
268
(Eds.) Raw Material Economies Among Prehistoric Hunter-Gatherers. Lawrence,
University of Kansas Publications in Anthropology.
MOONEY, D. C. Z. & DUVAL, R. D. (1993) Bootstrapping: A Nonparametric Approach to
Statistical Inference, London, Sage Publications Inc.
MOORE, A. M. T. & HILLMAN, G. C. (1992) The Pleistocene to Holocene Transition
and Human Economy in Southwest Asia: The Impact of the Younger Dryas.
American Antiqtuity, 57, 482-494.
MOORE, M. W. & BRUMM, A. (2007) Stone artifacts and hominins in island Southeast
Asia: New insights from Flores, eastern Indonesia. Journal of Human Evolution,
52, 85-102.
MORRIS, J. C. (2004) "Agency" theory applied - a study of later prehistoric lithic
assemblages from northwest Pakistan. IN GARDNER, A. (Ed.) Agency
Uncovered: Defining and Demystifying Agents in Archaeology. London, UCL Press.
MORROW, C. A. (1984) A biface production model for gravel-based chipped stone
industries. Lithic Technology, 13, 28-32.
MORROW, T. (1995) Bigger is better: Comments on Kuhn's Formal approach to mobile
Toolkits. American Antiquity, 61, 581-590.
MOSER, J. (2001) Hoabinhian: Geographie und Chronologie eines steinzeitlichen
Technocomplexes in Südostasien, Köln, Lindensoft.
MOURER, R. (1977) Laang Spean and the prehistory of Cambodia. Modern Quaternary
Research in Southeast Asia, 3, 29-56.
MOVIUS, H. L. (1944) Early man and Pleistocene stratigraphy in southern and eastern Asia,
New York, Kraus Reprint.
MOVIUS, H. L. (1949) The Lower Paleolithic Cultures of Southern and Eastern Asia.
Transactions of the American Philosophical Society, New series, 38, 329-420.
MYERS, A. (1989) Reliable and maintainable technological strategies in the Mesolithic
of mainland Britain. IN TORRENCE, R. (Ed.) Time, Energy and Stone Tools.
Cambridge, Cambridge University Press.
NAGAOKA, L. (2005) Declining foraging efficiency and moa carcass exploitation in
southern New Zealand. Journal of Archaeological Science, 32, 1328-1338.
NEELEY, M. P. & BARTON, C. M. (1994) A new approach to interpreting late
Pleistocene microlith industries in southwest Asia. Antiquity, 68, 275-288.
NEIMAN, F. D. (1995) Stylistic variation in evolutionary perspective: implications for
decorative diversity and inter-assemblage distance in Illinois Woodland
ceramic assemblages. American Antiquity, 60, 7-36.
NELSON, M. C. (1991) The study of technological organization. Archaeological Method
and Theory, 3, 57-100.
NETER, J. & WASSERMAN, W. (1996) Applied linear statistical models, Chicago, Irwin
Homewood.
NEWCOMER, M. (1971) Some quantitative experiments in handaxe manufacture.
World Archaeology, 3, 85–94.
NICKERSON, R. S. (2000) Null hypothesis significance testing: A review of an old and
continuing controversy. Psychological Methods, 5, 241-301.
NISHIMURA, M. (2005) Attribute analysis of the Hoabinhian industry: implications
from a comparative study of Bung Cave and Xom Trai Cave, northern Vietnam.
Journal of Southeast Asian Archaeology, 25, 81-104.
NIX, T. W. & BARNETTE, J. J. (1998) The data analysis dilemma: Ban or abandon. A
review of null hypothesis significance testing. Research in the Schools, 5, 3-14.

References
269
O'BRIEN, M. J., DARWENT, J. & LYMAN, R. L. (2001) Cladistics Is Useful for
Reconstructing Archaeological Phylogenies: Palaeoindian Points from the
Southeastern United States. Journal of Archaeological Science, 28, 1115-1136.
O'BRIEN, M. J. & HOLLAND, T. D. (1990) Variation, selection, and the archaeological
record. IN SCHIFFER, M. B. (Ed.) Archaeological Method and Theory. Tuscon,
University of Arizona Press.
O'BRIEN, M. J. & HOLLAND, T. D. (1992 ) The Role of Adaptation in Archaeological
Explanation. American Antiquity, 57, 3-59.
O'BRIEN, M. J. & LYMAN, R. L. (2000) Applying Evolutionary Archaeology: A Systematic
Approach, New York, Kluwer Academic/Plenum.
O'BRIEN, M. J. & LYMAN, R. L. (2002) Evolutionary Archeology: Current Status and
Future Prospects. Evolutionary Anthropology, 11, 26-36.
O'CONNELL, J. F. & HAWKES, K. (1981) Alyawarra plant use and optimal foraging
theory. IN SMITH, B. & WINTERHALDER, B. (Eds.) Hunter-Gatherer Foraging
Strategies. Chicago, Chicago University Press.
ODELL, G. H. (1989) Experiments in lithic reduction. IN AMICK, D. S. & MAULDIN,
R. P. (Eds.) Experiments in Lithic Technology. Oxford, British Archaeological
Reports.
ODELL, G. H. S. (2001) Stone Tool Research at the End of the Millennium:
Classification, Function, and Behavior. Journal of Archaeological Research, 9, 45-
100.
ORIANS, G. H. & PEARSON, N. E. (1979) On the theory of central place foraging. IN
HORN, D. J., MITCHELL, R. D. & STAIRS, G. R. (Eds.) Analysis of Ecological
Systems. Columbus, Ohia State University.
OSBORNE, J. (2002) Notes on the use of data transformations. Practical Assessment,
Research & Evaluation, 8, 1-7.
OSWALT, W. H. (1976) An Anthropological Analysis of Food-getting Technology, New
York, Wiley.
PAPPU, S. (2001) Middle Palaeolithic stone tool technology in the Kortallayar Basin,
South India. Antiquity, 75, 107-117.
PARKER, G. A. (1974) Courtship persistence and female-guarding as male time
investment strategies. Behavior 48, 157-184.
PARKER, G. A. & STUART, R. A. (1976) Animal behavior as a strategy optimizer:
evolution of resource assessment strategies and optimal emigration thresholds.
American Naturalist 110, 1055-1076.
PARRY, W. J. & KELLY, R. L. (1987) Expedient core technology and sedentism. IN
JOHNSON, J. K. & MORROW, C. A. (Eds.) The Organization of Core Technology.
Boulder, Westview Press.
PATTERSON, L. W. (1990) Characteristics of Bifacial-Reduction Flake-Size
Distribution. American Antiquity, 55, 550-558.
PATTERSON, L. W. & SOLLBERGER, J. B. (1978) Replication and Classification of
Small Size Lithic Debitage. Plains Anthropologist, 23, 103-112.
PELLANT, C. (1992) Rocks and Minerals, New York, Dorling Kindersley.
PENNY, D. (1999) Palaeoenvironmental analysis of the Sakon Nakhon Basin, Northeast
Thailand: Palynological perspectives on climate change and human occupation.
Bulletin of the Indo-Pacific Prehistory Association (Melaka Papers, Volume 2), 18, 139-
149.

References
270
PENNY, D. (2001) A 40,000 year palynological record from north-east Thailand;
implications for biogeography and palaeo-environmental reconstruction.
Palaeogeography, Palaeoclimatology, Palaeoecology, 171, 97-128.
PERFECT, E. (1997) Fractal models for the fragmentation of rocks and soils: a review.
Engineering Geology, 48, 185-198.
PHAGAN, C. J. (1985) Lithic technology: flake analysis. IN VIERRA, R. (Ed.) Prehistory
of the Ayacucho Basin, Peru. Michigan, The University of Michigan Press.
POLANYI, M. (1962) The Republic of Science: Its Political and Economic Theory.
Minerva, 1, 54-73.
POOKAJORN, S. (1984) The Hoabinhian of mainland southeast Asia : new data from the
recent Thai excavation in the Ban Kao area, Bangkok :, Thai Khadi Research
Institute, Thammasat University.
POOKAJORN, S. (1985) Ethnoarchaeology with the Phi Tong Luang (Mlabrai): Forest
Hunters of Northern Thailand. World Archaeology, 17, 206-221.
POOKAJORN, S. (1988) Archaeological research of the Hoabinhian culture or technocomplex
and its comparison with ethnoarchaeology of the Phi Tong Luang, a hunter-gatherer
group of Thailand, Tubingen, Verlag Archaeologica Venatoria : Institut fur
Urgeschichte der Universitat Tubingen.
POOKAJORN, S. (1990) Hoabinhian cave excavations in Ban Kao District, West
Thailand. IN GLOVER, I. & GLOVER, E. (Eds.) Southeast Asian Archaeology 1986.
Proceedings of the First Conference of the Association of Southeast Asian
Archaeologists in Western Europe. London, BAR.
POOKAJORN, S. (1992) The Phi Tong Luang (Mlabri): A hunter-gather group in Thailand,
Bangkok, Odeon Store.
POOKAJORN, S. (1996) Human activities and environmental changes during the Late
Pleistocene to Middle Holocene in Southern Thailand and Southeast Asia. IN
STRAUS, L. G., ERIKSEN, B. V., ERLANDSON, J. M. & YESNER, D. R. (Eds.)
Humans at the End of the Ice Age: The Archaeology of the Pleistocene-Holocene
Transition. New York, Plenum Press.
POPE, G. G. (1989) Bamboo and Human Evolution. Natural History, 48-56.
POPPER, K. R. (2003) The Open Society and its Enemies, London, Routledge & Kegan
Paul.
POUSSART, P. F. & SCHRAG, D. P. (2005) Seasonally resolved stable isotope
chronologies from northern Thailand deciduous trees. Earth and Planetary
Science Letters, 235, 752-765.
PRAMANKIJ, S. & SUBHAVAN, V. (2001) Preliminary Report on the Discovery of
Evidence of the oldest Hominids (2 Million to 200,000 years old) in Thailand.
Silpa Wattanatham, 23, 38-47 (in Thai).
PRAMOJANEE, P. & HASTINGS, P. J. (1983) Geomorphological and palynological
investigation of sea level changes in Chantaburi, SE Thailand. IN
THIRAMONGKOL, N. & PISUTHA-ARNOND, V. (Eds.) Proceedings of the First
Symposium on Geomorphology and Quaternary Geology of Thailand. Bangkok,
Chulalongkorn Univeristy Department of Geology.
PREUCEL, R. W. (1999) Review of O'Brien, Michael J. (editor) 1996. "Evolutionary
archaeology: Theory and application" Foundations of Archaeological Inquiry
Series. Salt Lake City: University of Utah Press. Journal of Field Archaeology, 26,
93-99.

References
271
PUMIJUMNON, N. & TRIKANCHANAWATTANA, C. (2006) Pollen over time: The
search for Holocene environments. IN SHOOCONGDEJ, R. (Ed.) Social, Cultural
and Environmental Dynamics in the Highlands of Pangmapha, Mae Hong Son
Province: Integrated Archaeological Research into the Region. Bangkok, Highland
Archaeology Project in Pangmapha (In Thai).
RADLINSKI, A. P., RADLINSKA, E. Z., AGAMALIAN, M., WIGNALL, G. D.,
LINDNER, P. & RANDL, O. G. (1999) Fractal Geometry of Rocks. Physical
Review Letters, 82, 3078-3081.
RAMSEY, C. B., BUCK, C., E., MANNING, S., W. , REIMER, P. & PLICHT, H. V. D.
(2006) Developments in radiocarbon calibration for archaeology. Antiquity, 80,
783.
REAL, L. & CARACO, T. (1986) Risk and Foraging in Stochastic Environments. Annual
Review of Ecology and Systematics, 17, 371-390.
REECE, R. (1994) Are Bayesian statistics useful to archaeological reasoning? Antiquity,
68, 848-850.
REITZ, E. J. & WING, E. S. (1999) Zooarchaeology, Cambridge, Cambridge University
Press.
REYNOLDS, T. E. G. (1989) Techno-typology in Thailand: A case study of Tham Khao
Khi Chan. Bulletin of the Indo-Pacific Prehistory Association, 9, 33-43.
REYNOLDS, T. E. G. (1990a) Problems in the Stone Age of Thailand. Journal of the Siam
Society, 78, 109-114.
REYNOLDS, T. E. G. (1990b) Review of Hoabinhian. IN BARNES, G. (Ed.) Hoabinhian.
Jomon, Yayoi. Early Korean States: Bibliographic Reviews of Far Eastern Archaeology.
Oxford, Oxbow Books.
REYNOLDS, T. E. G. (1992) Excavations at Banyan Valley Cave, Northern Thailand: A
report on the 1972 season. Asian Perspectives, 31, 77-97.
RICHARDS, S. A. (2005) TESTING ECOLOGICAL THEORY USING THE
INFORMATION-THEORETIC APPROACH: EXAMPLES AND CAUTIONARY
RESULTS. Ecology, 86, 2805-2814.
RICHARDSON, E. (2003) A geographical analysis of prehistoric sites in Pang Mapha.
Conference on People, Culture, and Paleoenvironment in Highland Pang Mapha, Mae
Hong Son Province. Silpakorn Unversity, Bangkok.
RICHERSON, P. J. & BOYD, R. (1992) Cultural inheritance and evolutionary ecology.
IN SMITH, E. A. & WINTERHALDER, B. (Eds.) Evolutionary Ecology and Human
Behavior. Hawthorne, NY, Aldine de Gruyter.
RICHERSON, P. J. & BOYD, R. (2000) Built for speed: Pleistocene climate variation and
the origin of human culture. IN THOMPSON, N. & TONNEAU, F. (Eds.)
Perspectives in Ethology Vol. 13. New York, Kluwer Academic/Plenum.
RICHERSON, P. J., BOYD, R. & BETTINGER, R. L. (2001) Was Agriculture Impossible
during the Pleistocene but Mandatory during the Holocene? A Climate Change
Hypothesis. American Antiquity, 66, 387-411.
ROLLAND, N. (1981) The Interpretation of Middle Palaeolithic Variability. Man, 16, 15-
42.
ROTH, B. J. & DIBBLE, H. L. (1998) Production and Transport of Blanks and Tools at
the French Middle Paleolithic Site of Combe-Capelle Bas. American Antiquity,
63, 47-62.
ROYALL, R. M. (1986) The Effect of Sample Size on the Meaning of Significance Tests.
The American Statistician, 40, 313-315.

References
272
RUNDEL, P. W. & BOONPRAGOB, K. (1995) Dry forest ecosystems of Thailand. IN
BULLOCK, S. H., MOONEY, H. A. & MEDINA, E. (Eds.) Seasonally Dry Tropical
Forests. . Cambridge, UK., Cambridge University Press.
SANTISUK, T. (1988) An account of the vegetation of Northern Thailand, Stuttgart, Franz
Steiner Verlag.
SANTONI, M., PAUTREAU, J.-P. & PRISHANCHIT, S. (1990) Excavations at Obluang,
Province of Chiang Mai, Thailand. IN GLOVER, I. & GLOVER, E. (Eds.)
Southeast Asian Archaeology 1986. Proceedings of the First Conference of the
Association of Southeast Asian Archaeologists in Western Europe. London, BAR.
SANTROCK, J., STUDLEY, S. A. & HAYES, J. M. (1985) Isotopic analyses based on the
mass spectra of carbon dioxide. Analytical Chemistry, 57, 1444-1448.
SARASIN, F. (1933) Prehistoric Researches in Siam. Journal of the Siam Society, 26, 171-
202.
SCHEPS, S. (1982) Statistical Blight. American Antiquity, 47, 836-851.
SCHIFFER, M. B. (2002) Studying Technological Differentiation: The Case of 18th-
Century Electrical Technology. American Anthropologist, 104, 1148-1161.
SCHIFFER, M. B. & SKIBO, J. M. (1987) Theory and experiment in the study of
technological change. Current Anthropology, 28, 595-622.
SCHIFFER, M. B. & SKIBO, J. M. (1997) The explanation of artefact variability. American
Antiquity, 62, 27-50.
SCHWARCZ, H. P. (1986) Geochronology and isotopic geochemistry of speleothems.
IN FRITZ, P. & FONTES, J. C. (Eds.) Handbook of Environmental Isotope
Geochemistry. Amsterdam, Elsevier.
SELLET, F. (1993) Chaîne opératoire; the concept and its applications. Lithic Technology,
18, 106-12.
SHANAHAN, T. M., PIGATI, J. S., DETTMAN, D. L. & QUADE, J. (2005) Isotopic
variability in the aragonite shells of freshwater gastropods living in springs
with nearly constant temperature and isotopic composition. Geochimica et
Cosmochimica Acta, 69, 3949.
SHAO, J. & TU, D. (1995) The Jackknife and Bootstrap, New York, Springer.
SHAOMENG, L., YULOU, Q. & WALKER, D. (1986) Late Pleistocene and Holocene
Vegetation History at Xi Hu, Er Yuan, Yunnan Province, Southwest China.
Journal of Biogeography, 13, 419-440.
SHAVER, J. P. (1993) What Statistical Significance Testing Is, and What It Is Not.
Journal of Experimental Education, 61, 293-316.
SHEA, J. J. (1991) Review of 'Time, Energy and Stone Tools'. American Anthropologist,
93, 250.
SHENNAN, S. (1988) Quantifying archaeology, Edinburgh Edinburgh University Press.
SHENNAN, S. (2001) Demography and Cultural Innovation: a Model and its
Implications for the Emergence of Modern Human Culture. Cambridge
Archaeological Journal, 11, 5-16.
SHENNAN, S. (2002a) Archaeology and evolutionary ecology. World Archaeology, 34, 1-
5.
SHENNAN, S. (2002b) Genes, Memes and Human History, London, Thames and Hudson.
SHENNAN, S. & STEELE, J. (1999) Cultural learning in hominids: a behavioural
ecological approach. IN BOX, H. & GIBSON, K. (Eds.) Mammalian Social
Learning: Comparative and Ecological Perspectives. Cambridge, Cambridge
University Press.

References
273
SHENNAN, S. & WILKINSON, J. (2001) Ceramic style change and neutral evolution: A
case study from Neolithic Europe. American Antiquity, 66, 577-594.
SHOOCONGDEJ, R. (1996a) Forager mobility organisation in seasonal tropical
environments: A view from Lang Kamnan Cave, western Thailand. PhD Thesis.
Ann Arbor, The University of Michigan.
SHOOCONGDEJ, R. (1996b) Working towards an anthropological perspective on Thai
prehistory: Current research on the Post-Pleistocene. Bulletin of the Indo-Pacific
Prehistory Association (Chiang Mai Papers, Volume 1), 14, 119-132.
SHOOCONGDEJ, R. (2000) Forager Mobility Organization in Seasonal Tropical
Environments of Western Thailand. World Archaeology, 32, 14-40.
SHOOCONGDEJ, R. (2004) Preliminary report on the archaeological investigations of
the highland archaeology project in Pang Mapha (HAPP), Mae Hong Son
Province, between 1998-2004. Southeast Asian Archaeology International
Newsletter, January 2004, 6-8.
SHOOCONGDEJ, R. (2005) โบราณคดีบนพื นที่สูงในอ้าเภอปางมะผ้า จังหวัดแม่ฮ่องสอน, Nakhorn
Patom, Silpakorn University Press.
SHOOCONGDEJ, R. (2006a) Late Pleistocene activities at the Tham Lod Rockshelter in
Highland Pang Mapha, Mae Hong Son Province, Northwestern Thailand. IN
BACUS, E. A., GLOVER, I. C. & PIGGOTT, V. (Eds.) Uncovering Southeast Asia's
Past: Selected Papers from the 10th Annual Conference of the European Association of
Southeast Asian Archaeologists. Singapore, NUS Press.
SHOOCONGDEJ, R. (Ed.) (2006b) พลวัตทางสังคม วัฒนธรรม และส่ิงแวดล้อมบนพืนที่สูง ในอ้าเภอปางมะผ้า จังหวัดแม่ฮ่องสอน: งานวิจัยบูรณาการโบราณคดีเชิงพื นที่แบบครบวงจร [Social, Cultural and
Environmental Dynamics in the Highlands of Pangmapha, Mae Hong Son Province:
Integrated Archaeological Research into the Region], กรุงเทพ [Bangkok], โครงการโบราณคดีพื นที่สูงในอ้าเภอปางมาะผ้า จังหวัดแม่ฮ่องสอน [Highland Archaeological Project
in Pangmapha, Mae Hong Son].
SHOOCONGDEJ, R. & STAFF (2003a) รายงานวิจัยฉบับสมบูรณ์ โครงการโบราณคดีบนพื นที่สูงในเขตอ้าเภอปางมะผ้า, จังหวัดแม่ฮ่องสอน ระยะที่สอง, (เล่มที่ 4: การขุดค้นแหล่งโบราณคดีเพิงผาบ้านไร่). เสนอต่อ ส้านักงานกองทุนสนับสนุนการวิจัย (สกว.) ฝ่ายที่ 3 ฝ่ายสวัสดิภาพสาธารณะ. Bangkok,
Highland Archaeology Project in Pang Mapha District, Mae Hong Son
Province.
SHOOCONGDEJ, R. & STAFF (2003b) รายงานวิจัยฉบับสมบูรณ์ โครงการโบราณคดีบนพื นที่สูงในเขตอ้าเภอปางมะผ้า, จังหวัดแม่ฮ่องสอน ระยะที่สอง, (เล่มที่ 5: การขุดค้นแหล่งโบราณคดีเพิงผาถ ้าลอด). เสนอต่อ ส้านักงานกองทุนสนับสนุนการวิจัย (สกว.) ฝ่ายที่ 3 ฝ่ายสวัสดิภาพสาธารณะ. Bangkok,
Highland Archaeology Project in Pang Mapha District, Mae Hong Son
Province.
SHOTT, M. J. (1986) Technological organization and settlement mobility: An
ethnographic examination. Journal of Anthropological Research, 42, 15-51.
SHOTT, M. J. (1989a) On Tool-Class Use Lives and the Formation of Archaeological
Assemblages. American Antiquity, 54, 9-30.
SHOTT, M. J. (1989b) Technological organization in Great Lakes Paleoindian
assemblages. IN ELLIS, C. J. & LOTHROP, J. C. (Eds.) Eastern Paleoindian lithic
resource use. Boulder Westview Press.

References
274
SHOTT, M. J. (1994) Size and form in the analysis of flake debris: Review and recent
approaches. Journal of Archaeological Method and Theory, 1, 69-110.
SHOTT, M. J. (1995) How much is a scraper? Curation , use rates and the formation of
scraper assemblages. Lithic Technology, 20, 53-72.
SHOTT, M. J. (1996) Stage versus continuum in the debris assemblage from production
of a fluted biface. Lithic Technology, 21, 6–22.
SHOTT, M. J. (1997) Transmission theory in the study of stone tools: A midwestern
north American example. Rediscovering Darwin: Evolutionary Theory and
Archaeological Explanation. Arlington, Virginia, American Anthropological
Association.
SHOTT, M. J. (2005) The reduction thesis and its discontents: Review of Australian
approaches. IN CLARKSON, C. & LAMB, L. (Eds.) Rocking the Boat: Recent
Australian Approaches to Lithic Reduction, Use and Classification. Oxford,
Archaeopress.
SHOTT, M. J. & SILLITOE, P. (2004) Modeling Use-Life Distributions in Archaeology
Using New Guinea Wola Ethnographic Data. American Antiquity, 69, 339-356.
SHOTT, M. J. & SILLITOE, P. (2005) Use life and curation in New Guinea experimental
used flakes. Journal of Archaeological Science, 32, 653-663.
SHRADER-FRECHETTE, K. S. & MCCOY, E. D. (1992) Statistics, costs and rationality
in ecological inference. Trends in Ecology & Evolution, 7, 96-99.
SIH, A. & CHRISTENSEN, B. (2001) Optimal diet theory: when does it work, and when
and why does it fail? Animal Behaviour, 61, 379-390.
SIMMS, S. (1983) Comment on "Anthropological applications of optimal foraging
theory: a critical review" by E.A. Smith. Current Anthropology, 24, 646.
SIMMS, S. (1987) Behavioral Ecology and Hunter. Gatherer Foraging: An Example from the
Great Basin, Oxford, British Archaeological Reports.
SMITH, C. C. & FRETWELL, S. D. (1974) The optimal balance between size and
number of offspring. American Naturalist, 108, 499-506.
SMITH, E. A. (1983) Anthropological Applications of Optimal Foraging Theory: A
Critical Review. Current Anthropology, 24, 625-651.
SMITH, E. A. (1991) Inujjuamiut Foraging Strategies: Evolutionary Ecology of an Arctic
Hunting Economy, New York, Aldine.
SOBEL, E. & BETTLES, G. (2000) Winter hunger, winter myths: subsistence risk and
mythology among the Klamath and Modoc. Journal of Anthropological
Archaeology, 19, 276-316.
SOBER, E. (1980) Evolution, population thinking, and essentialism. Philosophy of
Science, 47, 350–383.
SPAULDING, A. C. (1953) Statistical techniques for the discovery of artifact types.
American Antiquity 18, 305-313.
SPETH, J. D. (1972) Mechanical Basis of Percussion Flaking. American Antiquity, 37, 34-
60.
SPÖTL, C. & MATTEY, D. (2006) Stable isotope microsampling of speleothems for
palaeoenvironmental studies: A comparison of microdrill, micromill and laser
ablation techniques. Chemical Geology, 235, 48-58.
SRIKOSAMART, S., NOASAWASD, S., LAO YI PA, S. & SUTEETHORN, V. (1999) The
status of salt earth and wildlife in Mae Hong Son province and the potential for
supporting eco-tourism, Bangkok, Thai Forestry Department.

References
275
STAHLE, D. & DUNN, J. (1982) An analysis and application of the size distribution of
waste flakes from the manufacture of bifacial stone tools. World Archaeology, 14,
84–97.
STEFFEN, A., SKINNER, E. J. & AINSWORTH, P. W. (1998) A view to the core:
Technological units and debitage analysis. IN WANDSNIDER, A.,
RAMENOFSKY, F. & STEFFEN, A. (Eds.) Unit Issues in Archaeology. Salt Lake
City, University of Utah Press.
STEPHENS, D. W. (1990) Risk and incomplete information in behavioural ecology. IN
CASHDAN, E. (Ed.) Risk and Uncertainty in Tribal and Peasant Economies.
Boulder, Colorado., Westview Press.
STEPHENS, D. W. & KREBS, J. R. (1986) Foraging Theory, Princeton University Press.
STEPHENS, P. A., BUSKIRK, S. W. & DEL RIO, C. M. (2007a) Inference in ecology and
evolution. Trends in Ecology & Evolution, In Press, Corrected Proof.
STEPHENS, P. A., BUSKIRK, S. W., HAYWARD, G. D. & DEL RIO, C. M. (2007b) A
call for statistical pluralism answered. Journal of Applied Ecology, 44, 461-463.
STEPHENS, P. A., BUSKIRK, S. W., HAYWARD, G. D. & MARTINEZ DEL RIO, C.
(2005) Information theory and hypothesis testing: a call for pluralism. Journal of
Applied Ecology, 42, 4-12.
STERELNY, K. (2004) Review of Genes, Memes and Human History. Mind & Language,
19, 249-257.
STEWART-OATEN, A. (1995) Rules and Judgments in Statistics: Three Examples.
Ecology, 76, 2001-2009.
STUIJTS, I., NEWSOME, J. C. & FLENLEY, J. R. (1988) Evidence for Late Quaternary
vegetational change in the Sumatran and Javan highlands. Review of
Palaeobotany and Palynology, 55, 207-216.
SULLIVAN, A. P., III & ROZEN, K. C. (1985) Debitage Analysis and Archaeological
Interpretation. American Antiquity, 50, 755-779.
SUROVELL, T. A. (2003) The Behavioural Ecology of Folsom Lithic Technology. PhD
Thesis. Department of Anthropology. Tucson, The University of Arizona.
TEHRANI, J. & COLLARD, M. (2002) Investigating cultural evolution through
biological phylogenetic analyses of Turkmen textiles. Journal of Anthropological
Archaeology, 21, 443-463.
TËMKIN, I. (2004) The evolution of the Baltic psaltery: A case for phyloorganology. The
Galpin Society Journal, 57, 219-30.
TËMKIN, I. & ELDREDGE, N. (2007) Phylogenetics and Material Cultural Evolution.
Current Anthropology, 48, 146-153.
THOMAS, A. D. (2001) Statistical significance, effect size, and replication: What do the
journals say? The Journal of Experimental Education, 69, 310-20.
THOMAS, D. H. (1978) The Awful Truth about Statistics in Archaeology. American
Antiquity, 43, 231-244.
THOMPSON, B. (1999) If Statistical Significance Tests are Broken/Misused, What
Practices Should Supplement or Replace Them? Theory Psychology, 9, 165-181.
THOMPSON, B. (2002) What Future Quantitative Social Science Research Could Look
Like: Confidence Intervals for Effect Sizes. Educational Researcher, 31, 25-32.
THOMPSON, B. (2004) The" significance" crisis in psychology and education. Journal of
Socio-Economics, 33, 607-613.
THOMPSON, J. B., PALOCZI, G. T., KINDT, J. H., MICHENFELDER, M., SMITH, B.
L., STUCKY, G., MORSE, D. E. & HANSMA, P. K. (2000) Direct Observation of

References
276
the Transition from Calcite to Aragonite Growth as Induced by Abalone Shell
Proteins. Biophysical Journal, 79, 3307-3312.
TOMKA, S. A. (1989) Differentiating lithic reduction techniques: An experimental
approach. IN AMICK, D. S. & MAULDIN, R. P. (Eds.) Experiments in Lithic
Technology. Oxford, BAR International Series 528.
TORRENCE, R. (1983) Time budgeting and hunter-gatherer technology. IN BAILEY, G.
(Ed.) Hunter-Gatherer Economy in Prehistory. Cambridge, Cambridge University
Press.
TORRENCE, R. (1989) Re-tooling: towards a behavioral theory of stone tools. IN
TORRENCE, R. (Ed.) Time, Energy and Stone Tools. Cambridge, University of
Cambridge.
TORRENCE, R. (2001) Hunter-Gatherer Technology: Macro- and Microscale
Approaches. IN PANTER-BRICK, C., LAYTON, R. & ROWLY-CONWY (Eds.)
Hunter-Gatherers: An Interdisciplinary Perspective. Cambridge, Cambridge
University Press.
TOUGARD, C., JAEGER, J. J., CHAIMANEE, Y., SUTEETHORN, V. &
TRIAMWICHANON, S. (1998) Discovery of Homo sp. tooth associated with a
mammalian cave fauna of Late Middle Pleistocene age, northern Thailand.
Journal of Human Evolution, 35, 47-54.
TREERAYAPIWAT, C. (2005) Patterns of Habitation and Burial Activity in the Ban Rai
Rock Shelter, Northwestern Thailand. Asian Perspectives, 44, 231-245.
TRIGGER, B. G. (1989) A History of Archaeological Thought, Cambridge, Cambridge
University Press.
TRIKANCHANAWATTANA, C. (2005) Palynological study at Ban Tham Lod and Ban
Rai in Pang Mapha district, Mae Hong Son province, northern Thailand. MA
Thesis. Bangkok, Mahidol University.
TUFTE, E. R. (1986) The visual display of quantitative information, Graphics Press
Cheshire, CT, USA.
TURCOTTE, D. L. (1997) Fractals and Chaos in Geology and Geophysics, Cambridge,
Cambridge University Press.
UGAN, A., BRIGHT, J. & ROGERS, A. (2003) When is technology worth the trouble?
Journal of Archaeological Science, 30, 1315-1329.
UKOUMUNNE, O. C., DAVISON, A. C., GULLIFORD, M. C. & CHINN, S. (2003) Non-
parametric bootstrap confidence intervals for the intraclass correlation
coefficient. Statistics in Medicine, 22, 3805-3821.
VACHA-HAASE, T. (2001) Statistical Significance should not be Considered one of
Life's Guarantees: Effect Sizes are Needed. Educational and Psychological
Measurement, 61, 219-224.
VAN HEEKEREN, H. R. & KNUTH, E. (1967) Archaeological Excavations in Thailand.
Volume 1. Sai Yok. Stone Age Settlements in the Kanchanaburi Province,
Copenhagen, Munksgaard.
VAN TAN, H. (1994) The Hoabinhian in Southeast Asia: Culture, cultures or
technocomplex? Vietnam Social Sciences, 5, 3-8.
VAN TAN, H. (1997) The Hoabinhian and before. Bulletin of the Indo-Pacific Prehistory
Association (Chiang Mai Papers, Volume 3), 16, 35-41.
VANPOOL, C. S. & VANPOOL, T. L. (1999) The Scientific Nature of
Postprocessualism. American Antiquity, 64, 33-53.

References
277
VELLEMAN, P. F. & WELSCH, R. E. (1981) Efficient Computing of Regression
Diagnostics. The American Statistician, 35, 234-242.
WANG, L., SARNTHEIN, M., ERLENKEUSER, H., GRIMALT, J., GROOTES, P.,
HEILIG, S., IVANOVA, E., KIENAST, M., PELEJERO, C. & PFLAUMANN, U.
(1999) East Asian monsoon climate during the Late Pleistocene: high-resolution
sediment records from the South China Sea. Marine Geology, 156, 245-284.
WANG, S., LÜ, H., LIU, J. & NEGENDANK, J. (2007) The early Holocene optimum
inferred from a high-resolution pollen record of Huguangyan Maar Lake in
southern China. Chinese Science Bulletin, 52, 2829-2836.
WANG, Y. J., CHENG, H., EDWARDS, R. L., AN, Z. S., WU, J. Y., SHEN, C. C. &
DORALE, J. A. (2001) A High-Resolution Absolute-Dated Late Pleistocene
Monsoon Record from Hulu Cave, China. Science, 294, 2345-2348.
WANGWACHARAKUL, V., RATANASEAMPONG, S., NABHITABRATA, J.,
JINTANAYON, S. & TRISURAT, Y. (2000) Biological resource values in Mae Hong
Son province Bangkok, Bangkok, Office of Environmental Policy and Planning.
WARD, D. (1992) Role of satisficing in foraging theory. Oikos, 62, 312-317.
WATTANAPITUKSAKUL, S. (2006a) Late Pleistocene mammal teeth from Tham Lod
rockshelter, Amphoe Pang Mapha, Changwat Mae Hong Son. MA Thesis.
Department of Geology. Bangkok, Chulalongkorn University.
WATTANAPITUKSAKUL, S. (2006b) Why is that size important? Perspectives from an
analysis of mammalian teeth from the Late Pleistocene. IN SHOOCONGDEJ, R.
(Ed.) Social, Cultural and Environmental Dynamics in the Highlands of Pangmapha,
Mae Hong Son Province: Integrated Archaeological Research into the Region.
Bangkok, Highland Archaeology Project in Pangmapha (In Thai).
WEAVER, A. J., SAENKO, O. A., CLARK, P. U. & MITROVICA, J. X. (2003) Meltwater
Pulse 1A from Antarctica as a Trigger of the Bolling-Allerod Warm Interval.
Science, 299, 1709-1713.
WEISS, H. & BRADLEY, R. S. (2001) ARCHAEOLOGY: What Drives Societal Collapse?
Science, 291, 609-610.
WENINGER, B., JÖRIS, O. & DANZEGLOCKE, U. (2007) CalPal-2007. Cologne
Radiocarbon Calibration & Palaeoclimate Research Package.
http://www.calpal.de/, accessed 2007-11-08.
WHITE, J. C. & BOUASISENGPASEUTH, B. (2007) Archaeology of the Middle
Mekong: Introduction to the Luang Prabang Exploratory Survey. IN
GOUDINEAY, Y. & LORRILLARD, M. (Eds.) Research Nouvelles sur le Laos
Paris, l'École Française d'Extrême Orient.
WHITE, J. C. & GORMAN, C. F. (2004) Patterns in "amorphous" industries: the
Hoabinhian viewed through a lithic reduction sequence. IN PAZ, V. (Ed.)
Southeast Asian archaeology: Wilhelm G. Solheim II Festschrift. Quezon City,
University of the Phillipines Press.
WHITE, J. C., PENNY, D., KEALHOFER, L. & MALONEY, B. (2004) Vegetation
changes from the late Pleistocene through the Holocene from three areas of
archaeological significance in Thailand. Quaternary International, 113, 111-132.
WHITE, J. P. (1969) Typologies for some prehistoric flaked stone artefacts of the
Australian New Guinea Highlands. Archaeology and Physical Anthropology in
Oceania, 4, 18-46.
WHITE, J. P. (1977) Crude, colourless and unenterprising? Prehistorians and their
views on the Stone Age of Sunda and Sahul. IN ALLEN, J., GOLSON, J. &

References
278
JONES, R. (Eds.) Sunda and Sahul: Prehistoric studies in Southeast Asia, Melanesia
and Australia. London, Academic Press.
WHITTAKER, J. (1994) Flintknapping: Making and Understanding Stone Tools, Austin,
University of Texas Press.
WIESSNER, P. (1982) Beyond Willow Smoke and Dogs' Tails: A Comment on Binford's
Analysis of Hunter-Gatherer Settlement Systems. American Antiquity, 47, 171-
178.
WILLCOX, G., FORNITE, S. & HERVEUX, L. (2007) Early Holocene cultivation before
domestication in northern Syria. Vegetation History and Archaeobotany, DOI:
10.1007/s00334-007-0121-y.
WINTERHALDER, B. (1980) Environmental analysis in human evolution and
adaptation research. Human Ecology, 8, 135-170.
WINTERHALDER, B. (1981) Optimal foraging strategies and hunter-gatherer research
in anthropology: theory and models. IN WINTERHALDER, B. & SMITH, E. A.
(Eds.) Hunter-Gatherer Foraging Strategies: Ethnographic and Archaeological
Analyses. Chicago, The University of Chicago Press.
WINTERHALDER, B. (1990) Open field, common pot: The behavioral ecology of
nonmarket, intergroup exchange. IN CASHDAN, E. (Ed.) Risk and uncertainty in
tribal and peasant economies. Boulder, Colorado, Westview Press.
WINTERHALDER, B. (2002) Models. IN HART, D. M. & TERRELL, J. E. (Eds.) Darwin
and Archaeology: A Handbook of Key Concepts. Westport, Conneticut, Bergin and
Garvey.
WINTERHALDER, B. & GOLAND, C. (1997) An evolutionary ecology perspective on
diet choice, risk, and plant domestication. IN GREMILLION, K. J. (Ed.) People,
Plants and Landscapes: Studies in Paleoethnobotany. Tuscaloosa, AL, University of
Alabama Press.
WINTERHALDER, B., LU, F. & TUCKER, B. (1999) Risk-sensitive adaptive tactics:
Models and evidence from subsistence studies in biology and anthropology.
Journal of Anthropological Research, 7, 301-348.
WINTERHALDER, B. & SMITH, E. A. (1992) Natural selection and decision-making:
Some fundamental principles. IN SMITH, E. A. & WINTERHALDER, B. (Eds.)
Evolutionary Ecology and Human Behavior. Hawthorne, NY, Aldine de Grutyer.
WINTERHALDER, B. & SMITH, E. A. (2000) Analyzing adaptive strategies: human
behavioural ecology at twenty-five. Evolutionary Anthropology, 9, 51-72.
WONNACOTT, T. (1987) Confidence intervals or hypothesis tests? Journal of Applied
Statistics, 14, 195-201.
WOOD, M. (2004) Statistical inference using bootstrap confidence intervals.
Significance, 1, 180-182.
WOOD, M. (2005) Bootstrapped Confidence Intervals as an Approach to Statistical
Inference. Organizational Research Methods, 8, 454-470.
WYLIE, A. (1989) Archaeological cables and tacking: the implications of practice for
Bernstein's 'Options beyond objectivism and relativism'. Philosophy of the Social
Sciences, 19, 1-18.
WYLIE, A. (1995) An Expanded Behavioral Archaeology: Transformation and
Redefinition. IN SKIBO, J. M., WALKER, W. H. & NIELSEN, A. E. (Eds.)
Expanding Archaeology. Salt Lake City, University of Utah Press.
WYLIE, A. (2000) Questions of Evidence, Legitimacy, and the (Dis)Unity of Science.
American Antiquity, 65, 227-237.

References
279
XIANGJUN, S., YUSHU, W., YULOU, Q. & WALKER, D. (1986) Late Pleistocene and
Holocene Vegetation History at Kunming, Yunnan Province, Southwest China.
Journal of Biogeography, 13, 441-476.
YESNER, D. R. (1981) Archaeological Applications of Optimal Foraging Theory:
Harvest Strategies of Aluet Hunter-Gatherers. IN WINTERHALDER, B. &
SMITH, E. A. (Eds.) Hunter-Gatherer Foraging Strategies. Chicago, The University
of Chicago Press.
YI, S. & CLARK, G. A. (1983) Observations on the Lower Palaeolithic of Northeast
Asia. Current Anthropology, 24, 181-202.
YOCCOZ, N. G. (1991) Use, overuse, and misuse of significance tests in evolutionary
biology and ecology. Bulletin of the Ecological Society of America, 72, 106-111.
YUAN, D., CHENG, H., EDWARDS, R. L., DYKOSKI, C. A., KELLY, M. J., ZHANG,
M., QING, J., LIN, Y., WANG, Y., WU, J., DORALE, J. A., AN, Z. & CAI, Y.
(2004) Timing, Duration, and Transitions of the Last Interglacial Asian
Monsoon. Science, 304, 575-578.
ZEITOUN, V., SEVEAU, A., FORESTIER, H., THOMAS, H., LENOBLE, A., LAUDET,
F., ANTOINE, P.-O., DEBRUYNE, R., GINSBURG, L. & MEIN, P. (2005)
Decouverte d'un assemblage faunique a Stegodon-Ailuropoda dans une grotte
du Nord de la Thailande (Ban Fa Suai, Chiang Dao). Comptes Rendus Palevol, 4,
255.
ZELEZNIK, W. S. & IAN, M. B. (1991) Assumption validity in human optimal foraging:
The Barà hunters of Venezuela as a test case. Human Ecology, V19, 499-508.
ZHAO, J.-X., WANG, Y.-J., COLLERSON, K. D. & GAGAN, M. K. (2003) Speleothem
U-series dating of semi-synchronous climate oscillations during the last
deglaciation. Earth and Planetary Science Letters, 216, 155-161.
ZHENG, S., HOU, F. & NI, B. (1983) CO isotope study of precipitations in China.
Chinese Science Bulletin, 13, 801–806.
ZHISHENG, A., PORTER, S. C., WEIJIAN, Z., YANCHOU, L., DONAHUE, D. J.,
HEAD, M. J., XIHUO, W., JIANZHANG, R. & HONGBO, Z. (1993) Episode of
Strengthened Summer Monsoon Climate of Younger Dryas Age on the Loess
Plateau of Central China. Quaternary Research, 39, 45-54.
ZHOU, W., HEAD, M. J. & DENG, L. (2001) Climate changes in northern China since
the late Pleistocene and its response to global change. Quaternary International,
83-85, 285-292.
ZHOU, X. H. & DINH, P. (2005) Nonparametric confidence intervals for the one- and
two-sample problems. Biostatistics, 6, 187-200.
ZHOU, X. H., GAO, S. & HUI, S. L. (1997) Methods for Comparing the Means of Two
Independent Log-Normal Samples. Biometrics, 53, 1129-1135.
ZHUO, Z., BAOYIN, Y. & PETIT-MAIRE, N. (1998) Paleoenvironments in China
during the Last Glacial Maximum and the Holocene optimum. Episodes, 21,
152–158.
ZIMAN, J. (2000a) Commentary on The Republic of Science: Its Political and Economic
Theory. Minerva, 38, 21-25.
ZIMAN, J. M. (Ed.) (2000b) Technological innovation as an evolutionary process,
Cambridge, U.K. :, Cambridge University Press.