Stock Price and Volumes Reaction to Annual Earnings Announcement: A Case of the Nairobi Securities...
12
International Journal of Business, Humanities and Technology Vol. 3 No. 2; February 2013 100 Stock Price and Volumes Reaction to Annual Earnings Announcement: A Case of the Nairobi Securities Exchange Mercy Kangai Gatabi Kiremu Chuka University Department of Business Administration P.O BOX 109-60400, Chuka, Kenya Nebat Galo Chuka University Department of Business Administration P.O BOX 109-60400, Chuka, Kenya Adolphus Wagala Chuka University Department of Business Administration P.O BOX 109-60400, Chuka, Kenya James Kinyua Mutegi Chuka University Department of Environmental Studies and Resource Development P.O BOX 109-60400, Chuka, Kenya Abstract Modern corporate organizations listed in the security markets periodically communicate their financial performance to stakeholders through earnings announcements. Efficient markets immediately absorb and reflect the new information into the share prices. This paper examines the effect of annual earnings announcement at the Nairobi Securities Exchange (NSE) by analyzing changes in share prices and trading volumes for the period from 2006 to 2010. Abnormal returns during the event window of 91 days were determined using the event study methodology employing the market model on data from 5 listed companies. Further, the volume reactions were examined by use of the trading activity ratio (TAR). Inferential and descriptive statistics were used to test for significant effect on TAR and price changes. The results obtained indicate that the abnormal returns and TAR were not significant at 5% probability level. Thus the NSE is of semi-strong efficiency, whereby it is not possible to earn abnormal returns in the NSE using the publicly available information. Key Words: Event, Event window, illiquidity, Market efficiency, Securities exchange, thin trading 1.0. Introduction The value-relevance of earnings announcements has been an important topic in financial accounting over the last four decades (Booth, Kallunki, Sahlstro, & Tyynela, 2011). Financial statements act as tools of communication on a firms’ performance especially during the period under review. Publicly quoted companies are obliged to publish their audited financial statement at the end of every financial year (CMA, 2011). A Firm’s performance is of great importance to investors since it has a direct impact on returns to investment. It is therefore expected that upon release of financial reports, an efficient market should immediately absorb the information and adjust the stock prices accordingly. A number of empirical researches have been carried out on the impact of accounting information on share prices (Afego, 2011). Some have sought to establish the value of the information in forecasting future financial performance while others have attempted to measure its impact on share prices (Booth et al, 2011; Ball & Brown, 1968).
Transcript of Stock Price and Volumes Reaction to Annual Earnings Announcement: A Case of the Nairobi Securities...

International Journal of Business, Humanities and Technology Vol. 3 No. 2; February 2013
100
Stock Price and Volumes Reaction to Annual Earnings Announcement: A Case of
the Nairobi Securities Exchange
Mercy Kangai Gatabi Kiremu
Chuka University
Department of Business Administration
P.O BOX 109-60400, Chuka, Kenya
Nebat Galo
Chuka University
Department of Business Administration
P.O BOX 109-60400, Chuka, Kenya
Adolphus Wagala
Chuka University
Department of Business Administration
P.O BOX 109-60400, Chuka, Kenya
James Kinyua Mutegi
Chuka University
Department of Environmental Studies and Resource Development
P.O BOX 109-60400, Chuka, Kenya
Abstract
Modern corporate organizations listed in the security markets periodically communicate their financial
performance to stakeholders through earnings announcements. Efficient markets immediately absorb and reflect
the new information into the share prices. This paper examines the effect of annual earnings announcement at the Nairobi Securities Exchange (NSE) by analyzing changes in share prices and trading volumes for the period from
2006 to 2010. Abnormal returns during the event window of 91 days were determined using the event study
methodology employing the market model on data from 5 listed companies. Further, the volume reactions were
examined by use of the trading activity ratio (TAR). Inferential and descriptive statistics were used to test for significant effect on TAR and price changes. The results obtained indicate that the abnormal returns and TAR
were not significant at 5% probability level. Thus the NSE is of semi-strong efficiency, whereby it is not possible
to earn abnormal returns in the NSE using the publicly available information.
Key Words: Event, Event window, illiquidity, Market efficiency, Securities exchange, thin trading
1.0. Introduction
The value-relevance of earnings announcements has been an important topic in financial accounting over the last
four decades (Booth, Kallunki, Sahlstro, & Tyynela, 2011). Financial statements act as tools of communication on
a firms’ performance especially during the period under review. Publicly quoted companies are obliged to publish their audited financial statement at the end of every financial year (CMA, 2011). A Firm’s performance is of great
importance to investors since it has a direct impact on returns to investment. It is therefore expected that upon
release of financial reports, an efficient market should immediately absorb the information and adjust the stock
prices accordingly.
A number of empirical researches have been carried out on the impact of accounting information on share prices
(Afego, 2011). Some have sought to establish the value of the information in forecasting future financial performance while others have attempted to measure its impact on share prices (Booth et al, 2011; Ball & Brown,
1968).
© Centre for Promoting Ideas, USA www.ijbhtnet.com
101
Although very crucial the bulk of these studies have been carried out in developed markets such as the United States of America and the UK. The present study investigated the reaction of Kenyan stock market to annual
earnings announcement.
1.0 Market Response to Earnings Announcements
There is a general consensus that common stock prices and volumes traded react to information contained in accounting based earning disclosures (Arriff, Loh, & Chew, 1997; Beaver, 1968). Similarly, Morse (1981)
reported a significant change in trading volumes and prices the day before the event, extending up to the third day
after the announcement for volume and the second day for price fluctuations. The British share prices were also
found to be significantly affected by financial disclosures (Clubb, 1995). The announcements of accounting and financial results are very useful because they do not only give information on the firm itself but they also give
indications of performance of similar companies. This is often achieved by analyzing financial returns from
closely competing firms to guide in forecasting the forthcoming results of a company.
The interpretation of the evidence that annual earnings announcements initiate a strong share market response has
been questioned (Bamber, Christensen, & Gaver, 2000). He further asserts that most earnings announcements are not associated with unusual share price reactions. This is because annual financial disclosures are largely pre-
empted by more timely sources of information such as the interim accounts, business news about a specific firm
and financial results of closely competing firms thus the release of annual earnings has very little or no impact on share prices of the firm (Ball and Brown 1968).
Some researchers argue that stock prices at the time of the announcement follow the direction and magnitude of the unexpected portion of the earnings disclosed in annual and interim financial reports (Ball, 1992). This effect
on stock prices continues even after the announcement is made (Ball, 1992). The latter phenomenon is referred to
as the “post-announcement drift” and was first formally documented by Ball and Brown in (1968) and Jones and Litzenberger in (1970). The presence of the drift has been attributed to several reasons. First, it is caused by
investors under-reacting to news and second, the news induce an unobservable transitory risk factor that then
influence the price and finally, the drift is merely a byproduct of a particular research design. The evidence that
has been produced thus tends to support the under-reaction story (Bernard and Thomas, 1990; Chan et al., 1996). This is further supported by Fama (1998) who states that the drift is the “granddaddy of all under reaction events”.
The presence of the drift should be eliminated by the arbitrage process. (Jacob, Lys, & Sabino, 2000). This is
however prevented from happening due to the presence of arbitrage risks (Mendenhall, 2005).
Under-reaction and the accompanying drift are not limited to earnings announcements. For example, under-
reaction has been found to be associated with stock splits (Desai and Jain, 1997), seasoned equity offerings
(Kadiyala and Rau, 2004), analyst recommendations (Womack, 1996), and tender offer and open market re-purchases (Ikenberry, Lakonishok, & Vermaelen, 1995). This is attributed to the fact that these types of news
events require significant information processing by investors.
1.1 Market Efficiency
Recent evidence suggests that stock markets give a big boost to economic development through creation of
liquidity (Levine, 1996). Most profitable investments require long-term commitment of capital, yet investors are
often reluctant to commit their savings for long periods. Liquid equity markets make investment less risky thus making them more attractive because they allow savers to acquire an asset or equity and dispose it quickly and
cheaply in order to access savings or alter their portfolios. Conversely, companies enjoy permanent access to
capital raised through equity issues. Liquid markets boost long-term economic growth through improved capital
allocation to long-term and profitable investments. In an efficient market, security prices reflect in totality all publicly available information thus eliminating any opportunity to make excess profits from available information
because it is already captured in the market prices (Fox and Opong, 1999; Fama, 1970). EMH assumes that
investors are out to maximize their utility, that agents have rational expectations, and that whenever new relevant information appears, the agents update their expectations appropriately. There are three forms of efficiency
namely; the weak, semi-strong and the strong form. In the weak form of efficiency, future returns cannot be
predicted from past returns or any other market-based indicator because the securities reflect all the past
information regarding price movement making it impossible for an investor to use the same information to earn abnormal returns, (Pandey, 2005).
International Journal of Business, Humanities and Technology Vol. 3 No. 2; February 2013
102
There are two ways of testing this form of efficiency, namely the tests of independence also known as the random walk method and trading rules test. In the semi-strong form of efficiency the security prices reflect all publicly
available information including the data in weak form. In the semi-strong form of efficiency high level of
fundamental analysis is required for the prices to fully reflect all publicly available information, Fama (1970). There are three models of calculating abnormal returns namely: the market model, the mean adjusted returns
model, and the market adjusted returns model. Of the three, the market model, which is based on the capital asset
pricing model-CAPM (Markowitz, 1952; Sharpe, 1964), is the best specified model since it controls for the both
systematic and the unsystematic risk of the stock. The strong form of efficiency is the highest level of market efficiency whereby security prices reflect all public and private information both published and the unpublished.
Efficient markets attract more investors translating into increased market liquidity (Osei, 1998).
3.0. Methodology
The Nairobi Stock Exchange (NSE) was constituted in 1954 and is a member of the African Stock Exchanges
Association. Before independence in 1963, it had only 10 listed companies, a number that rapidly rose after independence, the 1970s saw 20 more companies listed while 5 new companies were listed in the 1980s, a
number that doubled in the 1990s (Mala & White, 2006). The NSE is the principal stock exchange of Kenya and
had 58 listed companies as at February 2012. It is the fourth largest stock exchange in Africa in terms of trading volumes, and fifth in terms of market capitalization as a percentage of the Gross Domestic Product (GDP)
(www.kenya-advisor.com/nairobi-stock-exchange.html). It has successfully facilitated the privatization of some
government owned corporations. One of the most successful privatization was that of Kenya Airways in 1996 which earned the privatization team the World Bank Award of Excellence for being a model success story in the
divestiture of state-owned enterprises, (www.nse.co.ke).
Research Design and Sampling Procedures
The research was carried out as an event study. The event study starts with the hypothesis on how a particular
event affects the value of a firm (Serra, 2002). Abnormal returns are calculated around the event date using the market model and used to determine the level of the market’s efficiency. The concept of abnormal returns coupled
with the notion that information is readily impounded into security prices is the central key of event study
methods (Serra, 2002). The purpose of the study was to evaluate the market reaction to annual earnings
announcements by companies listed at the NSE from 2006 to 2010. In the present study, the daily closing stock prices were analyzed to measure the impact of earnings announcements on stock prices.
Data on public announcement of annual earnings by the 58 listed companies was collected from the NSE daily trading information. To eliminate the non trading phenomenon which arises when some securities do not trade on
a daily basis giving rise to zero returns, only companies that had been listed and actively trading throughout the
study period were selected. Further, all companies whose event date could not be obtained were eliminated from
the study. To eliminate the problem of confounding effects, all companies that had a major event during the event window were eliminated from the study. Confounding effects occurs when multiple noteworthy events occur on
the same announcement dates making it impossible to determine the event that caused the after announcement
stock price (Mc Williams et al, 1997). The earnings announcement dates and major events were identified by carefully studying the NSE hand book, the NSE daily trading information and the companies’ newsletters. Since
most companies announce their earnings and dividends during the same period, only companies with positive
correlation between dividend announcement and earnings announcement were selected. This assisted in
neutralizing the effects of dividend announcements. This criterion gave a sample of 5 companies for the five years translating to 25 annual earnings announcements.
3.1. Data Collection and Analysis
The study used secondary data from the NSE relating to annual earnings announcements, daily share prices, daily traded volumes and NSE 20 share index covering all the days in the event window for the period from 2006 to
2010. The study sample was arrived at as follows. 20 companies out of the 58 listed companies had other major
events during the event window and were therefore eliminated from the study. Of the remaining companies, 27 companies had one or more of the annual earnings announcement dates during the period under study missing
while one company had been suspended from trading at the NSE during the same period. This narrowed down the
sample to 11 companies whose annual announcement dates were available for the 5 years under study.

© Centre for Promoting Ideas, USA www.ijbhtnet.com
103
Since most companies make annual earnings announcement along with dividend announcement only companies whose dividend and earnings had a positive correlation were selected, this was aimed at eliminating the effects of
the dividends announcement. 2 companies did not have a positive correlation between earnings and dividends
announced and were therefore eliminated. A negative correlation between earnings per share (EPS) and dividend per share (DPS) indicates that the earnings and dividends distributed did not move in the same direction thus an
increase in earnings led to a decrease in dividends distributed to shareholders. Further 2 companies were
eliminated since their shares were illiquid due to thin trading and this reduced the companies to six. Out of the
remaining six companies, one company did not have trading data relating to year 2005 which was necessary for calculating the market model’s constants. Thus it was eliminated leaving only five companies which met the
criteria for inclusion in the sample.
The market model was used to calculate the daily abnormal returns. The constants in the model were calculated
over an estimation period of one calendar year prior to the event window.
The study considered an event window of 91 days focusing on 45 days before the event (t =-45) and 45 days after
the event date (t = 45) with the event day represent by t = 0. The 91 days period was considered to be sufficient
for the estimation of the abnormal return of the model with good level of accuracy based on previous studies that carried out research on a similar period. For instance, Aduda & Chemarum (2010) studied the daily adjusted stock
prices for an event period of 101 days, while Savitri and Martani, (2008) made use of daily adjusted stock prices
105 trading days and Dhar and Chhaochharia, (2008) used 81 days. The event was the earnings announcement while the event date was the date of announcement and the event window included the event date. The period
around the event date was used to aggregate abnormal returns on the individual stock.
The abnormal return data was analysed by Statistical Package for Social Sciences (SPSS) version 17.0. Data was
analysed by descriptive and inferential statistics and significance tested by T-test. The level of significance was
set at 5%.
The trading activity ratio (TAR) was used to test the volume changes during the event window. It is calculated as
follows
…………………………………………Equation 1
To test for efficiency, the market model was used to calculate abnormal returns around the event date. It
hypothesizes a linear relation between stock returns and market returns:
…………………………………………………….….Equation 2
Where;
= the actual daily return on security j at day t
= the daily market return at the NSE on day t
= ordinary least squares intercept; the average rate of return of stock
when the market return is neutral which can be expressed as
-
= stock sensitivity to market return (The slope coefficient)
= the error term for security j at day t
The test of significance of abnormal return was done using the hypothesis
H0:

International Journal of Business, Humanities and Technology Vol. 3 No. 2; February 2013
104
H1:
The normal return is the expected return without conditioning on the event taking place. For firm j and event date
t, the abnormal return was calculated as;
……………………………………………….…………Equation 3
Where; , and are the abnormal, actual and expected returns for the duration of study.
The NSE 20 share Index was used as a proxy for computing market return. To avoid the influence of extreme
values, the logarithm of the daily market return was used.
The market return was computed as,
……………………………………………...…………………Equation 4
Where; It = is the 20 share index on day t
It-1 = is the 20 share index on day t-1
The daily return for security j was calculated by the equation:
…...……………………………………………………………Equation 5
Where; Rt = is the stock price on day t
Rt-1 = is the daily stock price on day t-1
The and were calculated for each share in the sample by regressing the share’s daily log-function share
price return against the daily market returns over one year prior to the event window.
The expected returns for security j at day t was defined as
……………………………………………………………Equation 6
The abnormal returns were summed and averaged cross-sectionally for each day t as follows:
………………………………………………………………….Equation 7
Where; N = Number of earnings announcements in the sample at day t
ARjt = Abnormal return for security j at day t
The calculated abnormal returns were aggregated to draw an overall conclusion on the earnings announcement
event. To accommodate a multiple period event window, the study made use of the Cumulative Average
Abnormal Return (CAAR). The cumulative average abnormal returns ( ) for all firms for 91days were
then calculated as the sum of the abnormal returns.
= …………………………………..……………………….Equation 8
t= -45 to +45
To test for significance of the average abnormal returns Brown & Warner, (1985) procedure was followed. It is formulated as follows;
………………………………………..……………………….Equation 9
The statistical significance for the cumulative abnormal returns was calculated as;
……………………………………….……………………Equation 10
Where;
© Centre for Promoting Ideas, USA www.ijbhtnet.com
105
= the estimated standard deviation
d… = is the total number of days that AAR is cumulative and
n = number of earnings announcement in the sample on day t.
4.1. Market Reaction to the Annual Earnings Announcement
This study sought to establish how the NSE responds to annual earnings announcement by testing how the share
price and trading volumes respond to the announcement as well as establish the efficiency of the market response to the announcement. This was achieved by analyzing AAR and CAAR during the event window.
4.2.1. The Stock Prices Reaction to Annual Earnings Announcement
The market model was used to calculate the AAR and CAAR during the event window. The markets AAR and
CAAR, was obtained by calculating the daily average AAR and CAAR for the 25 observations. To test for significance, the t-statistic for the AAR and CAAR were obtained and compared to the t-table values at 5% level
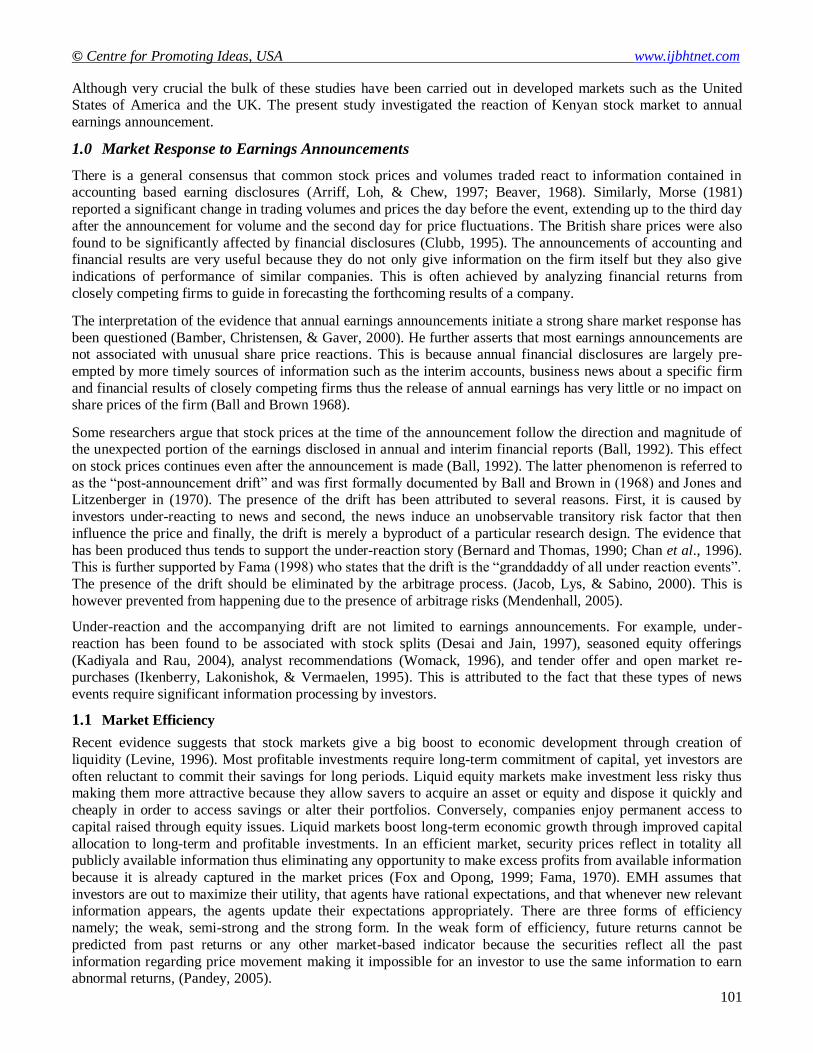
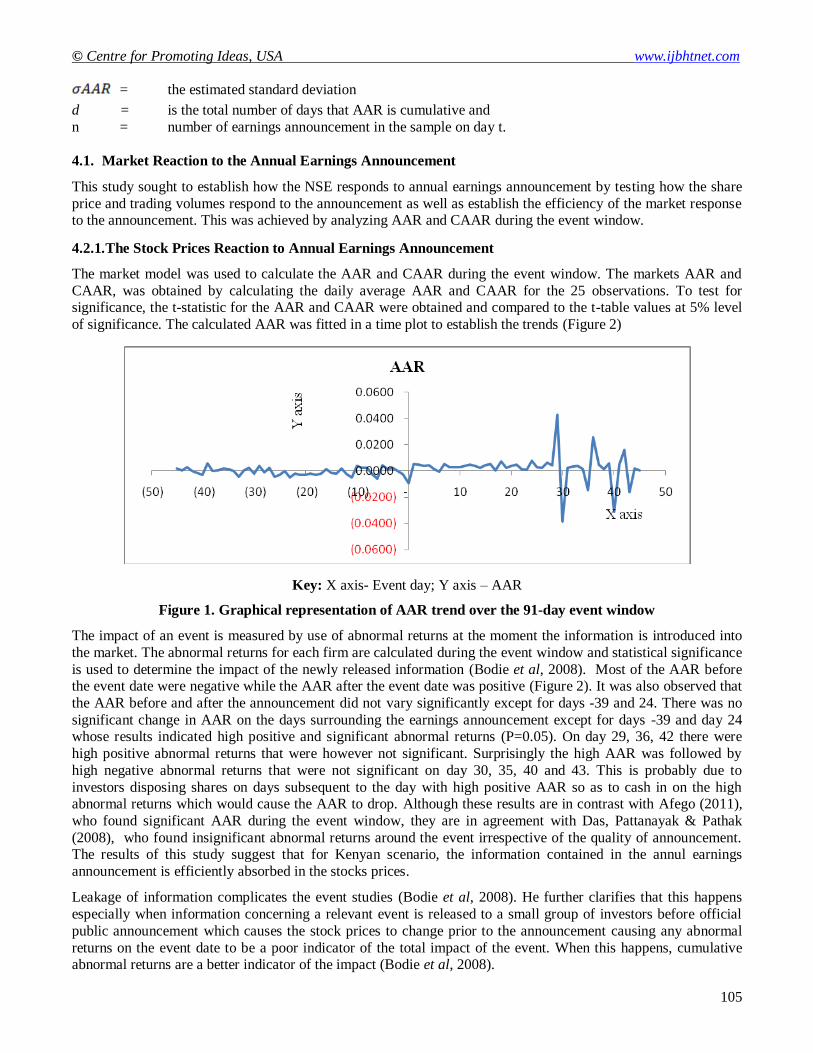
of significance. The calculated AAR was fitted in a time plot to establish the trends (Figure 2)
Key: X axis- Event day; Y axis – AAR
Figure 1. Graphical representation of AAR trend over the 91-day event window
The impact of an event is measured by use of abnormal returns at the moment the information is introduced into
the market. The abnormal returns for each firm are calculated during the event window and statistical significance
is used to determine the impact of the newly released information (Bodie et al, 2008). Most of the AAR before the event date were negative while the AAR after the event date was positive (Figure 2). It was also observed that
the AAR before and after the announcement did not vary significantly except for days -39 and 24. There was no
significant change in AAR on the days surrounding the earnings announcement except for days -39 and day 24 whose results indicated high positive and significant abnormal returns (P=0.05). On day 29, 36, 42 there were
high positive abnormal returns that were however not significant. Surprisingly the high AAR was followed by
high negative abnormal returns that were not significant on day 30, 35, 40 and 43. This is probably due to
investors disposing shares on days subsequent to the day with high positive AAR so as to cash in on the high abnormal returns which would cause the AAR to drop. Although these results are in contrast with Afego (2011),
who found significant AAR during the event window, they are in agreement with Das, Pattanayak & Pathak
(2008), who found insignificant abnormal returns around the event irrespective of the quality of announcement. The results of this study suggest that for Kenyan scenario, the information contained in the annul earnings
announcement is efficiently absorbed in the stocks prices.
Leakage of information complicates the event studies (Bodie et al, 2008). He further clarifies that this happens
especially when information concerning a relevant event is released to a small group of investors before official
public announcement which causes the stock prices to change prior to the announcement causing any abnormal
returns on the event date to be a poor indicator of the total impact of the event. When this happens, cumulative abnormal returns are a better indicator of the impact (Bodie et al, 2008).
International Journal of Business, Humanities and Technology Vol. 3 No. 2; February 2013
106
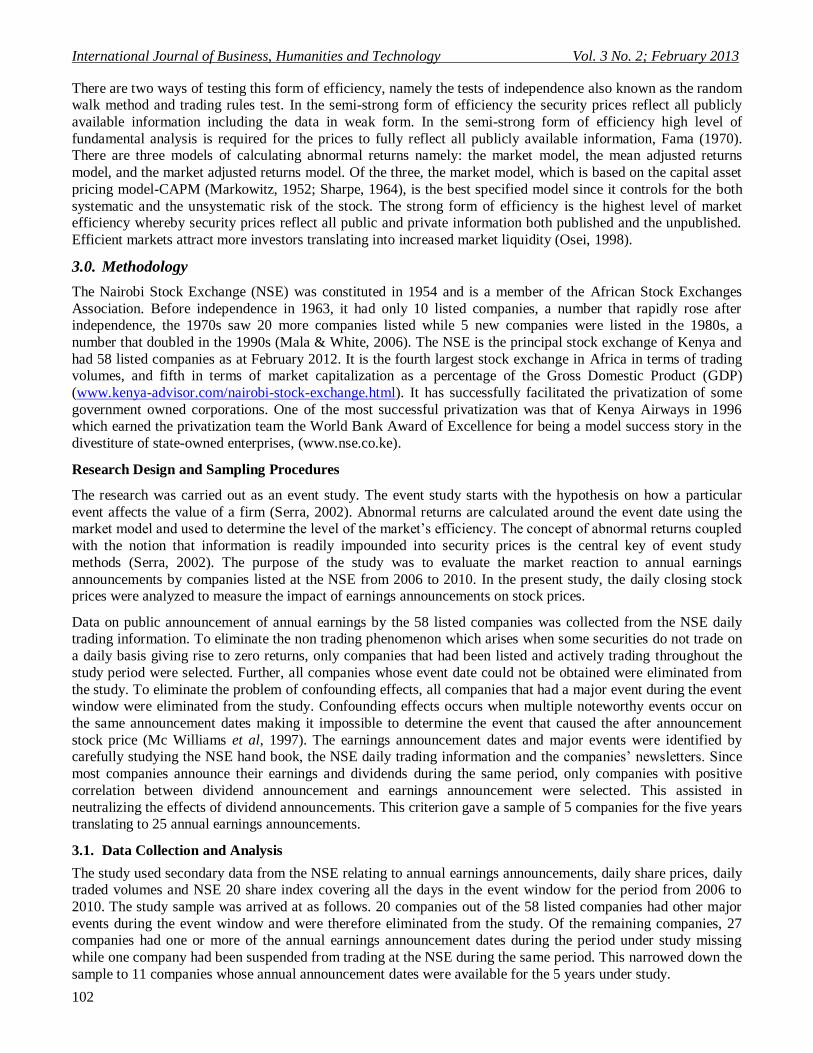
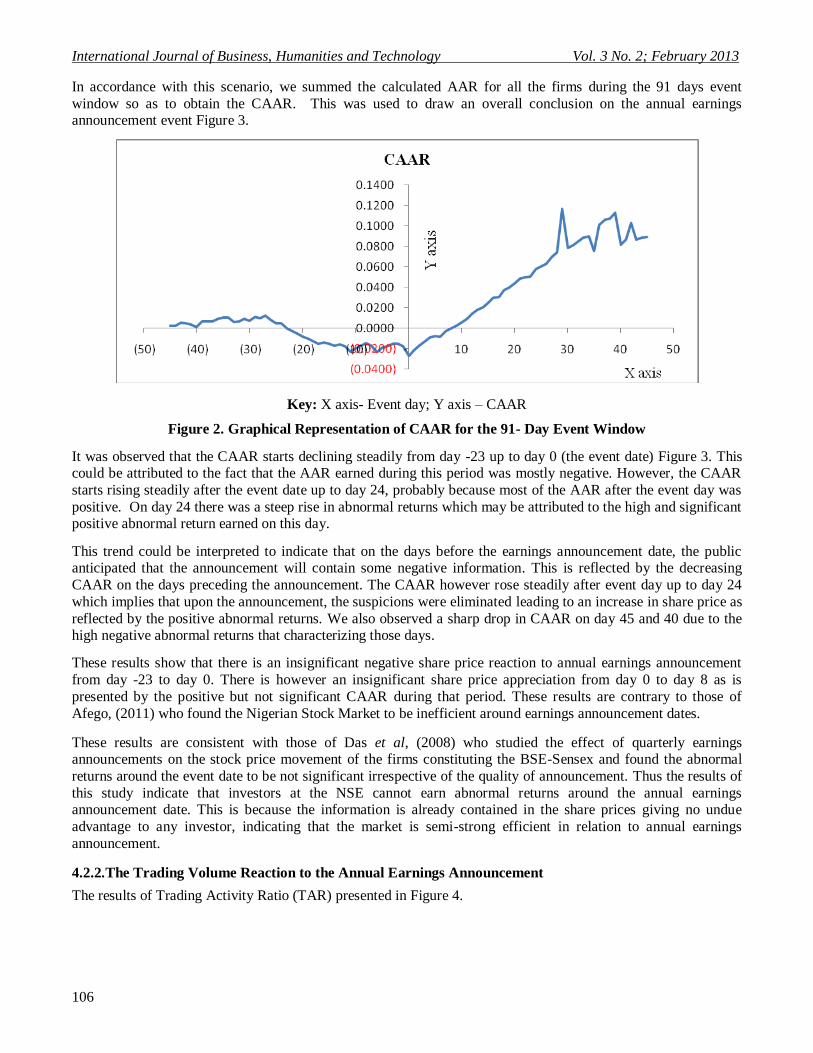
In accordance with this scenario, we summed the calculated AAR for all the firms during the 91 days event
window so as to obtain the CAAR. This was used to draw an overall conclusion on the annual earnings announcement event Figure 3.
Key: X axis- Event day; Y axis – CAAR
Figure 2. Graphical Representation of CAAR for the 91- Day Event Window
It was observed that the CAAR starts declining steadily from day -23 up to day 0 (the event date) Figure 3. This could be attributed to the fact that the AAR earned during this period was mostly negative. However, the CAAR
starts rising steadily after the event date up to day 24, probably because most of the AAR after the event day was
positive. On day 24 there was a steep rise in abnormal returns which may be attributed to the high and significant positive abnormal return earned on this day.
This trend could be interpreted to indicate that on the days before the earnings announcement date, the public anticipated that the announcement will contain some negative information. This is reflected by the decreasing
CAAR on the days preceding the announcement. The CAAR however rose steadily after event day up to day 24
which implies that upon the announcement, the suspicions were eliminated leading to an increase in share price as
reflected by the positive abnormal returns. We also observed a sharp drop in CAAR on day 45 and 40 due to the high negative abnormal returns that characterizing those days.
These results show that there is an insignificant negative share price reaction to annual earnings announcement
from day -23 to day 0. There is however an insignificant share price appreciation from day 0 to day 8 as is
presented by the positive but not significant CAAR during that period. These results are contrary to those of
Afego, (2011) who found the Nigerian Stock Market to be inefficient around earnings announcement dates.
These results are consistent with those of Das et al, (2008) who studied the effect of quarterly earnings announcements on the stock price movement of the firms constituting the BSE-Sensex and found the abnormal
returns around the event date to be not significant irrespective of the quality of announcement. Thus the results of
this study indicate that investors at the NSE cannot earn abnormal returns around the annual earnings announcement date. This is because the information is already contained in the share prices giving no undue
advantage to any investor, indicating that the market is semi-strong efficient in relation to annual earnings
announcement.
4.2.2. The Trading Volume Reaction to the Annual Earnings Announcement
The results of Trading Activity Ratio (TAR) presented in Figure 4.
© Centre for Promoting Ideas, USA www.ijbhtnet.com
107
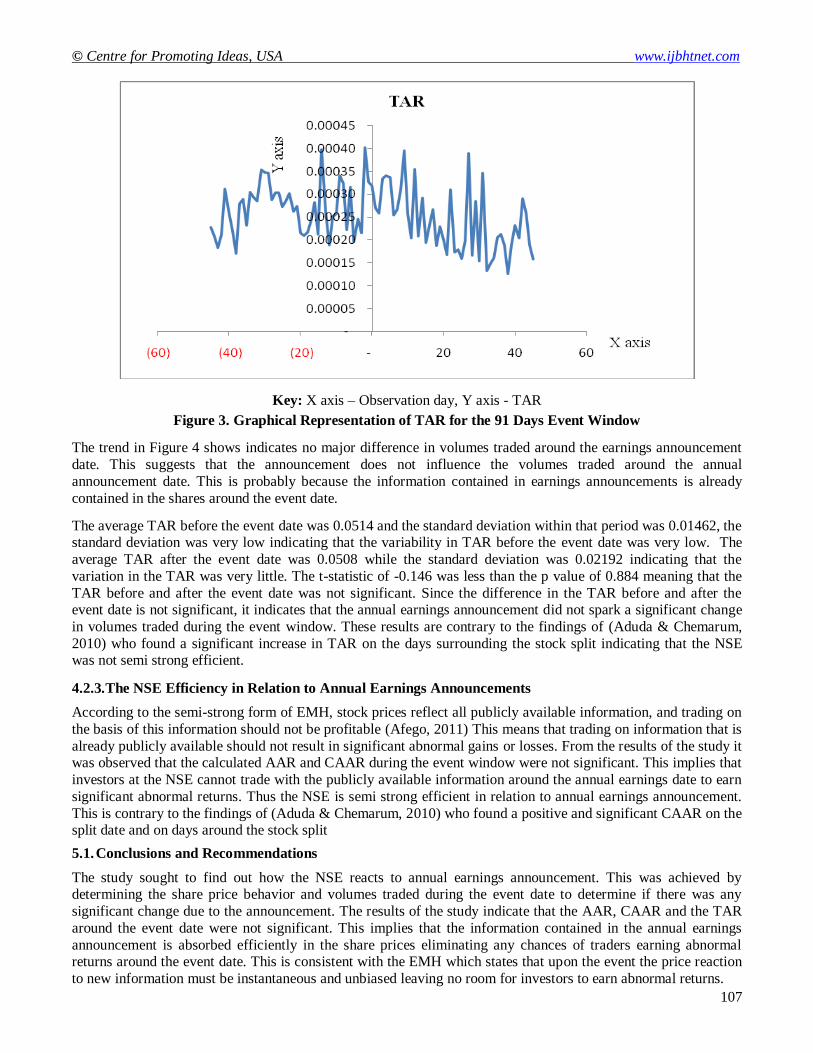
Key: X axis – Observation day, Y axis - TAR
Figure 3. Graphical Representation of TAR for the 91 Days Event Window
The trend in Figure 4 shows indicates no major difference in volumes traded around the earnings announcement
date. This suggests that the announcement does not influence the volumes traded around the annual
announcement date. This is probably because the information contained in earnings announcements is already
contained in the shares around the event date.
The average TAR before the event date was 0.0514 and the standard deviation within that period was 0.01462, the standard deviation was very low indicating that the variability in TAR before the event date was very low. The
average TAR after the event date was 0.0508 while the standard deviation was 0.02192 indicating that the
variation in the TAR was very little. The t-statistic of -0.146 was less than the p value of 0.884 meaning that the
TAR before and after the event date was not significant. Since the difference in the TAR before and after the event date is not significant, it indicates that the annual earnings announcement did not spark a significant change
in volumes traded during the event window. These results are contrary to the findings of (Aduda & Chemarum,
2010) who found a significant increase in TAR on the days surrounding the stock split indicating that the NSE was not semi strong efficient.
4.2.3. The NSE Efficiency in Relation to Annual Earnings Announcements
According to the semi-strong form of EMH, stock prices reflect all publicly available information, and trading on
the basis of this information should not be profitable (Afego, 2011) This means that trading on information that is
already publicly available should not result in significant abnormal gains or losses. From the results of the study it was observed that the calculated AAR and CAAR during the event window were not significant. This implies that
investors at the NSE cannot trade with the publicly available information around the annual earnings date to earn
significant abnormal returns. Thus the NSE is semi strong efficient in relation to annual earnings announcement.
This is contrary to the findings of (Aduda & Chemarum, 2010) who found a positive and significant CAAR on the split date and on days around the stock split
5.1. Conclusions and Recommendations
The study sought to find out how the NSE reacts to annual earnings announcement. This was achieved by determining the share price behavior and volumes traded during the event date to determine if there was any
significant change due to the announcement. The results of the study indicate that the AAR, CAAR and the TAR
around the event date were not significant. This implies that the information contained in the annual earnings
announcement is absorbed efficiently in the share prices eliminating any chances of traders earning abnormal returns around the event date. This is consistent with the EMH which states that upon the event the price reaction
to new information must be instantaneous and unbiased leaving no room for investors to earn abnormal returns.
International Journal of Business, Humanities and Technology Vol. 3 No. 2; February 2013
108
5.2. Recommendations
Based on the findings in this study, the following recommendations are made.
1. A number of stocks at the NSE were found to be illiquid due to thin trading. This is associated with the fact
that most investors in the developing markets are poorly-informed. To counter this problem, educational programmes should be implemented especially to the general public in order to increase awareness about
stock market activity. This will not only attract an increased number of participants, but it will also boost
liquidity (Mlonzi et al, 2011) 2. Large institutional and foreign investors should be attracted and encouraged to participate at the NSE. This
would be achieved by increasing investor confidence through establishing relevant policies to enhance the
efficiency of the stock market. Since Institutional and international investors have a greater capacity to
conduct extensive security analyses they will help improve availability of relevant financial information and the overall quality of the information environment of the NSE.
3. Policy makers and regulators at the NSE are encouraged to; Encourage more research on the NSE form of
efficiency, this will provide a forum for investors to get the information on the form of efficiency of the market and boost their confidence when investing at the NSE
4. The stock market should also be encouraged to maintain a record of the various event dates in a way that
they are easily accessible so as to aid in event studies as opposed to the current way where these are not kept in a summarized form and a researcher has to rummage through so much information to extract the
announcement dates.
5. The regulatory authorities should ensure compliance to insider trading laws by market participants. The
authorities need to strengthen their capacity to effectively monitor activities in the market, and to effectively deal with offenders. Reduction in unequal access to information not only boosts investor confidence but it
also helps improve the competiveness and informational efficiency of emerging stock markets (Mlonzi,
Kruger, & Nthoesane, 2011). 6. Further studies should be conducted to establish the nature of the market reaction to good and bad news and
interim reports
References
Aduda, J., & Chemarum, C. (2010). Market Reaction to Stocks Splits: Empirical Evidence from the Nairobi Stock
Exchange. African Journal of Business & Management (AJBUMA) , Vol 1, pp. 165-184.
Afego, P. (2011). Stock Price Response to Earnings Announcements: Evidence from the Nigerian Stock Market. University of Dundee, DD1 4HN, United Kingdom: Unpublished.
Arriff, M., Loh, A., & Chew, P. (1997). The Impact of Accounting Earnings Disclosures on Stock Prices in Singapore.
Asia Pacific Journal of Management , Vol. 14, pp. 17-29.
Ball, R. (1992). Price Earnings Anormaly. Journal of Accounting and Economics , Vol. 15, pp. 45-319.
Ball, R., & Brown, P. (1968). An Empirical Evaluation of Accounting Income Numbers. Journal of Accounting Research , Vol 6(2), pp. 78-159.
Bamber, L., Christensen, T., & Gaver, K. (2000). Do We Really "Know" What We Think We Know? A Case Study of Seminal Research and its Subsequent Overgeneralization. Accounting Organisation & Society , 25 (2), pp. 29-103.
Beaver, W. (1968). The Information Content of Annual Earnings Announcements. Journal of Accounting Research ,
Vol. 6, pp. 67-97.
Bernard, v., & Thomas, J. (1990). Evidence that Stock Prices Do Fully Reflect the Implications of Current Earnings for
Future Earnings. Journal of Accounting and Economics , Vol. 13 (4), pp. 40-305.
Bodie, Z., Kane, A., & Marcus, A. (2008). Investments. Singapore: Mc Mgraw.Hill International.
Booth, G., Kallunki, J., Sahlstro, P., & Tyynela, J. (2011). Foreign vs Domestic Investors and the Post Announcement
Drift. International Journal of Managerial Finance , Vol. 7 (3), pp. 220-237.
Brown, S., & Warner, J. (1985). Using Daily Stocks Returns: The case of Event Studies. Journal of Financial Economics , Vol 14, pp 3-31.
Chan, H., Faff, R., & Ramsay, A. (2005). Firm Size and the Information Content of Annual Earnings Announcement:
Australian Evidence. Journal of Business Finance and Accounting , Vol 32 (1), pp. 211-253.
Chan, L., Jegadeesh, N., & Lakonishok, J. (1996). Momentum Strategies. Journal of Finance , Vol. 51, pp. 713-1681.
Chen, G., Cheng, T. W., & Gao, N. (2005). Information Content and Timing of Earnings Announcements. Journal of Business Finance & Accounting , Vol 31 (1 & 2), pp. 65-95.
© Centre for Promoting Ideas, USA www.ijbhtnet.com
109
Clubb, C. (1995). An Empirical Study of Information Content of Accounting Earnings, Funds Flow and Cash Flow in
the U.K. Journal of Business Finance and Accounting , Vol. 22 (1), pp. 35-52.
CMA. (2011). CMA Securities Disclosure Obligations of Issuers_Reulations 2011-2. Das, S., Pattanayak, J., & Pathak, P. (2008). The Effect of Quartely Earnings Announcements on Sensex: A Case with
Clustering of Events. ICFAI University Journal of Accounting Research , Vol. 7 (4), pp. 64-78.
Desai, H., & Jain, P. (1997). Long-run Common Stock Returns Following Stock Splits and Reverse Splits Dividends.
Journal of Business , Vol. 70, pp. 34-309.
Dhar, S., & Chhaochharia, S. (2008). Market Reactions Around Stock Splits and Bonus Issues: Some Indian Evidence.,
Working paper Series, January 24, 2008. Fama, E. (1970). Efficient Capital Markets: A Review of Theory and Empirical Work. The journal of Finance , Vol. 25
(2), pp. 383-417.
Fama, E. (1998). Market Efficiency, Long-term Returns and Behavioral Finance. Journal of Financial and Economics ,
Vol. 49, pp. 283-306.
Fox, A., & Opong, K. (1999). The Impact of Board Changes on Shareholder Wealth: Some U.K. Evidence. Corporate
Governance. An International Review , Vol.7, pp. 385-396.
Ikenberry, D., Lakonishok, J., & Vermaelen, T. (1995). Market Underreaction to Open Market Share Repurchases.
Journal of Financial Economics , Vol. 39, pp. 181-208.
Jacob, J., Lys, T., & Sabino, J. (2000). Autocorrelation Structure of Forecast Errors From Time Series Models:
Alternative Assessments of Causes of Post Announcement Drift. Journal of Accounting and Economics , Vol.
28, pp. 58-329.
Jones, C. P., & Litzenberger, R. (1970). Quarterly Earnings Reports and Intermediate Stock Price Trends. Journal of
Finance , Vol. 25, pp. 8-143.
Kadiyala, P., & Rau, P. (2004). Investor Reaction to Corporate Event Announcements: Underreaction or Overreaction.
Journal of Business , Vol. 77, pp. 86-357.
Kombo, D. K., & Tromp, D. L. (2006). Proposal and Thesis Writing, an Introduction. Nairobi: Pauline Publications,
Africa.
Levine, R. (1996). Stock Markets: A Spur to Economic Growth. Stock Markets, Corporate Finance and Economic
Growth (p. 4). World Bank.
Mala, R., & White, M. (2006). Assessment of an Emerging Stock Market: The Case for Fiji’s Stock Market.
International Research Journal of Finance and Economics , ISSN 1450-2887 (6), 116-132.
Markowitz, H. (1952). Portfolio Selection. Journal of Finance , Vol. 7 (1), pp. 77-91.
McWilliams, A., & Siegel, D. (1997). Event Studies in Management Research: Theoritical and Empirical Issues.
Academy of Management Journal , Vol. 40 (3), pp. 57-626.
Mendenhall, R. (2005). Arbitrage Risk and Post Earnings Announcement Drift. Journal of Business , Vol 77, pp. 94-
875.
Mlonzi, V., Kruger, J., & Nthoesane, M. (2011). Share Price Reaction to Earnings Announcement on the JSE-ALtX: A
Test for Market Efficiency. Southern African Business Review , Vol 15 (3), pp. 142-166.
Morse, D. (1981). Price and Trading Volumes Reaction Sorrounding Earning Announcements: A Closer Examination.
Journal of Accounting Research , Vol. 19 (2), pp. 83-374.
Mugenda, O. M., & Mugenda, A. G. (2005). Research Methods: Quantitive and Qualitative Approaches. Nairobi,
Kenya: Acts Press.
Osei, K. A. (2002). Asset Pricing and Informational Efficiency of Ghana Stock Market. Nairobi: African Economic
Research Consortium.
Osei, K. (1998). Analysis of Factors Affecting the Development of an Emerging Capital Market: The Case of The
Ghana Stock Market. Nairobi: African Economic Research Consortium.
Pandey, I. (2005). Financial Management:New Delhi: Vikas Publishing House. Savitri, M., & Martani, D. (2008). The Analysis Impact of Stock Split on Stock Return and Volume: The Case of
Jarkata Stock Exchange. 7th International Business Research Conference. Sydney, Australia: Journal of
Business and Policy Research.
Serra, A. P. (2002). Event Study Tests: A brief survey. Working papers PEP 117 , .
Sharpe, W. F. (1964). Capital Asset Prices: A Theory of Market Equilibrium Under Conditions of Risk. Journal of Finance , pp. 425-442.
Womack, K. L. (1996). Do Brokerage Analysts' Recommendations Have Investment Value? Journal of Finance , Vol.
51, pp. 68-137. www.kenya-advisor.com/nairobi-stock-exchange.html, October 18, 2011. www.nse.co.ke, 30th
November 2012
International Journal of Business, Humanities and Technology Vol. 3 No. 2; February 2013
110
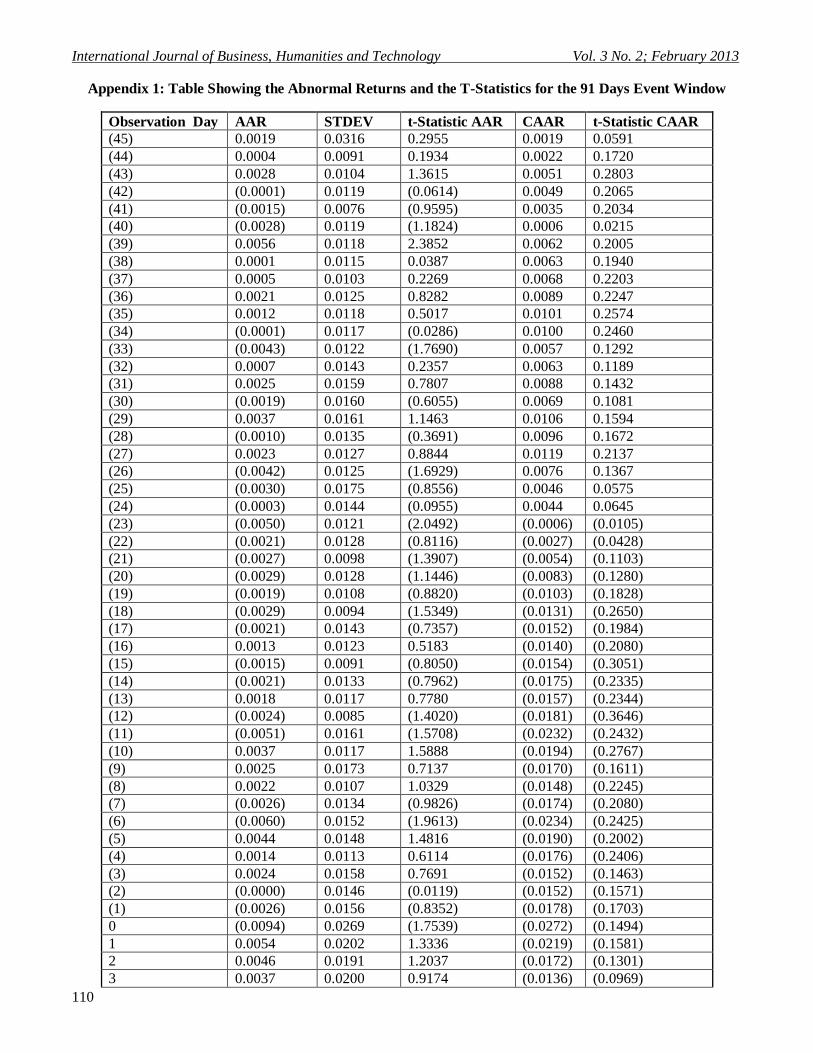
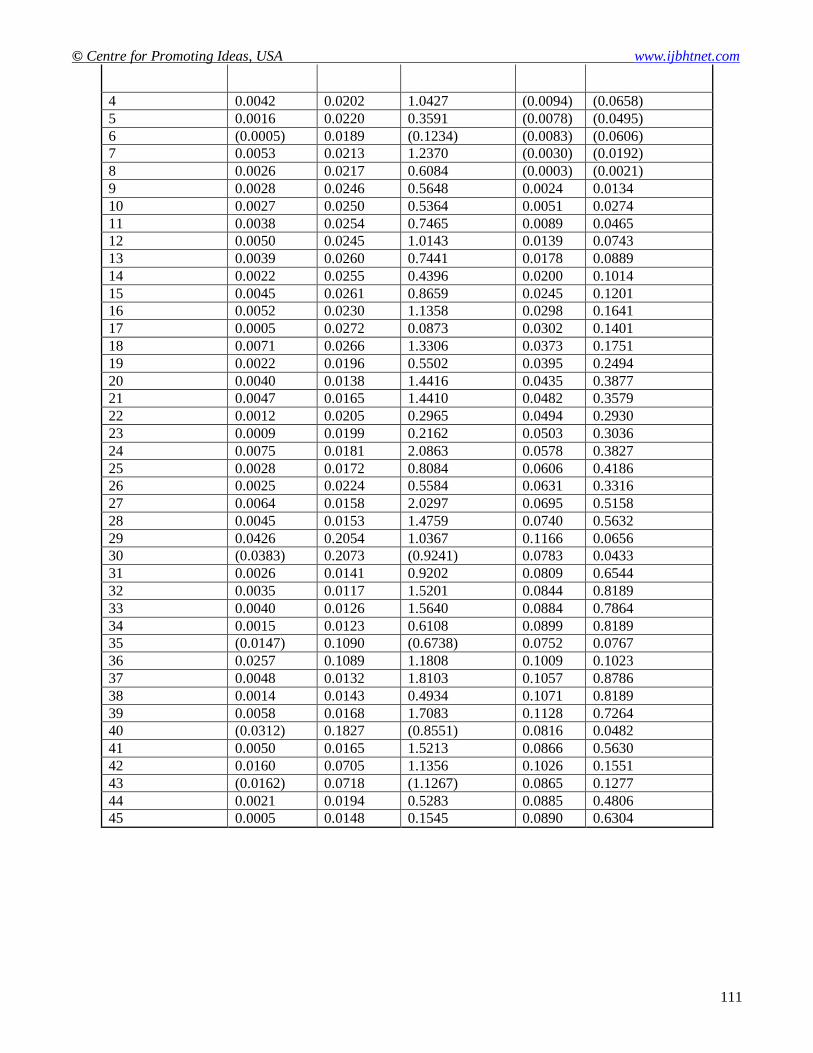
Appendix 1: Table Showing the Abnormal Returns and the T-Statistics for the 91 Days Event Window
Observation Day AAR STDEV t-Statistic AAR CAAR t-Statistic CAAR
(45) 0.0019 0.0316 0.2955 0.0019 0.0591
(44) 0.0004 0.0091 0.1934 0.0022 0.1720
(43) 0.0028 0.0104 1.3615 0.0051 0.2803
(42) (0.0001) 0.0119 (0.0614) 0.0049 0.2065
(41) (0.0015) 0.0076 (0.9595) 0.0035 0.2034
(40) (0.0028) 0.0119 (1.1824) 0.0006 0.0215
(39) 0.0056 0.0118 2.3852 0.0062 0.2005
(38) 0.0001 0.0115 0.0387 0.0063 0.1940
(37) 0.0005 0.0103 0.2269 0.0068 0.2203
(36) 0.0021 0.0125 0.8282 0.0089 0.2247
(35) 0.0012 0.0118 0.5017 0.0101 0.2574
(34) (0.0001) 0.0117 (0.0286) 0.0100 0.2460
(33) (0.0043) 0.0122 (1.7690) 0.0057 0.1292
(32) 0.0007 0.0143 0.2357 0.0063 0.1189
(31) 0.0025 0.0159 0.7807 0.0088 0.1432
(30) (0.0019) 0.0160 (0.6055) 0.0069 0.1081
(29) 0.0037 0.0161 1.1463 0.0106 0.1594
(28) (0.0010) 0.0135 (0.3691) 0.0096 0.1672
(27) 0.0023 0.0127 0.8844 0.0119 0.2137
(26) (0.0042) 0.0125 (1.6929) 0.0076 0.1367
(25) (0.0030) 0.0175 (0.8556) 0.0046 0.0575
(24) (0.0003) 0.0144 (0.0955) 0.0044 0.0645
(23) (0.0050) 0.0121 (2.0492) (0.0006) (0.0105)
(22) (0.0021) 0.0128 (0.8116) (0.0027) (0.0428)
(21) (0.0027) 0.0098 (1.3907) (0.0054) (0.1103)
(20) (0.0029) 0.0128 (1.1446) (0.0083) (0.1280)
(19) (0.0019) 0.0108 (0.8820) (0.0103) (0.1828)
(18) (0.0029) 0.0094 (1.5349) (0.0131) (0.2650)
(17) (0.0021) 0.0143 (0.7357) (0.0152) (0.1984)
(16) 0.0013 0.0123 0.5183 (0.0140) (0.2080)
(15) (0.0015) 0.0091 (0.8050) (0.0154) (0.3051)
(14) (0.0021) 0.0133 (0.7962) (0.0175) (0.2335)
(13) 0.0018 0.0117 0.7780 (0.0157) (0.2344)
(12) (0.0024) 0.0085 (1.4020) (0.0181) (0.3646)
(11) (0.0051) 0.0161 (1.5708) (0.0232) (0.2432)
(10) 0.0037 0.0117 1.5888 (0.0194) (0.2767)
(9) 0.0025 0.0173 0.7137 (0.0170) (0.1611)
(8) 0.0022 0.0107 1.0329 (0.0148) (0.2245)
(7) (0.0026) 0.0134 (0.9826) (0.0174) (0.2080)
(6) (0.0060) 0.0152 (1.9613) (0.0234) (0.2425)
(5) 0.0044 0.0148 1.4816 (0.0190) (0.2002)
(4) 0.0014 0.0113 0.6114 (0.0176) (0.2406)
(3) 0.0024 0.0158 0.7691 (0.0152) (0.1463)
(2) (0.0000) 0.0146 (0.0119) (0.0152) (0.1571)
(1) (0.0026) 0.0156 (0.8352) (0.0178) (0.1703)
0 (0.0094) 0.0269 (1.7539) (0.0272) (0.1494)
1 0.0054 0.0202 1.3336 (0.0219) (0.1581)
2 0.0046 0.0191 1.2037 (0.0172) (0.1301)
3 0.0037 0.0200 0.9174 (0.0136) (0.0969)
© Centre for Promoting Ideas, USA www.ijbhtnet.com
111
4 0.0042 0.0202 1.0427 (0.0094) (0.0658)
5 0.0016 0.0220 0.3591 (0.0078) (0.0495)
6 (0.0005) 0.0189 (0.1234) (0.0083) (0.0606)
7 0.0053 0.0213 1.2370 (0.0030) (0.0192)
8 0.0026 0.0217 0.6084 (0.0003) (0.0021)
9 0.0028 0.0246 0.5648 0.0024 0.0134
10 0.0027 0.0250 0.5364 0.0051 0.0274
11 0.0038 0.0254 0.7465 0.0089 0.0465
12 0.0050 0.0245 1.0143 0.0139 0.0743
13 0.0039 0.0260 0.7441 0.0178 0.0889
14 0.0022 0.0255 0.4396 0.0200 0.1014
15 0.0045 0.0261 0.8659 0.0245 0.1201
16 0.0052 0.0230 1.1358 0.0298 0.1641
17 0.0005 0.0272 0.0873 0.0302 0.1401
18 0.0071 0.0266 1.3306 0.0373 0.1751
19 0.0022 0.0196 0.5502 0.0395 0.2494
20 0.0040 0.0138 1.4416 0.0435 0.3877
21 0.0047 0.0165 1.4410 0.0482 0.3579
22 0.0012 0.0205 0.2965 0.0494 0.2930
23 0.0009 0.0199 0.2162 0.0503 0.3036
24 0.0075 0.0181 2.0863 0.0578 0.3827
25 0.0028 0.0172 0.8084 0.0606 0.4186
26 0.0025 0.0224 0.5584 0.0631 0.3316
27 0.0064 0.0158 2.0297 0.0695 0.5158
28 0.0045 0.0153 1.4759 0.0740 0.5632
29 0.0426 0.2054 1.0367 0.1166 0.0656
30 (0.0383) 0.2073 (0.9241) 0.0783 0.0433
31 0.0026 0.0141 0.9202 0.0809 0.6544
32 0.0035 0.0117 1.5201 0.0844 0.8189
33 0.0040 0.0126 1.5640 0.0884 0.7864
34 0.0015 0.0123 0.6108 0.0899 0.8189
35 (0.0147) 0.1090 (0.6738) 0.0752 0.0767
36 0.0257 0.1089 1.1808 0.1009 0.1023
37 0.0048 0.0132 1.8103 0.1057 0.8786
38 0.0014 0.0143 0.4934 0.1071 0.8189
39 0.0058 0.0168 1.7083 0.1128 0.7264
40 (0.0312) 0.1827 (0.8551) 0.0816 0.0482
41 0.0050 0.0165 1.5213 0.0866 0.5630
42 0.0160 0.0705 1.1356 0.1026 0.1551
43 (0.0162) 0.0718 (1.1267) 0.0865 0.1277
44 0.0021 0.0194 0.5283 0.0885 0.4806
45 0.0005 0.0148 0.1545 0.0890 0.6304