edital nº 015/2013 - UFAM - Universidade Federal do Amazonas
Upload
khangminh22Category
view
0download
0
Status Report -2015 Page i
SSttaattuuss RReeppoorrtt -- 22001144//001155
SSCCHHOOOOLL SSEECCTTOORR RREEFFOORRMM PPRROOGGRRAAMM ((SSSSRRPP))-- DDiissttrriicctt
SSCCHHOOOOLL SSEECCTTOORR RREEFFOORRMM PPRROOGGRRAAMM ((SSSSRRPP))-- CCeennttrree
EEDDUUCCAATTIIOONN FFOORR AALLLL SSHHIISSHHUU VVIIKKAASSHH KKAARRYYAAKKRRAAMM
CCOOMMMMUUNNIITTYY SSCCHHOOOOLL CCAAPPAACCIITTYY DDEEVVEELLOOPPMMEENNTT PPRROOGGRRAAMM
Government of Nepal
Ministry of Education
Department of Education
Sanothimi, Bhaktapur
Nepal

Status Report -2015 Page ii
Publisher
Government of Nepal
Ministry of Education
Department of Education
Monitoring & Management Section
Sanothimi, Bhaktapur
© All Rights Reserved to publisher
Advisors
Mr. Khagaraj Baral (Director General, DOE)
Dr. Dilliram Rimal (Director General, DOE)
Ms. Dev Kumari Guragai (Director, DOE)
Mr. Baikuntha Prasad Aryal (Director, DOE)
Working Team
Mr. Rakesh Shrestha (Deputy Director, DOE)
Mr. Narayan Krishna Shrestha (Deputy Director, DOE)
Mr. Shankar Bahadur Thapa (Deputy Director, DOE)
Dr. Babu Ram Dhungana (Deputy Director, DOE)
Mr. Kul Bahadur Phadera (Deputy Director, DOE)
Mr. Shiva Raj Pokhrel (Section Officer, DOE)
Mr. Hari Bhakta Paudel (Section Officer, DOE)
Ms. Narayani Joshi (Section Officer, DOE)
Ms. Nanda Maya Sitaula (CO, DOE)
Ms. Colleen Moses (Australian Volunteer, DOE)
Better Services Pvt. Ltd., Madhyapur Thimi – 16, Bhaktapur

Status Report -2015 Page iii
Acknowledgements
The key objectives of this Status Report (2014-2015) are to present the current position of
school education, the School Sector Reform Plan (SSRP) and various activities performed in FY
2014-15; to analyze the strengths, weakness, underlying problems, issues and constraints
experienced during implementation. Moreover, this report intends to share the progress of key
performance indicators against targets set as well as best practices occurred at district and
central levels.I believe it will help programme implementers, planners, researchers,
Development Partners and stakeholders to get information on the status of the school level
educational programme implementation in Nepal.
The School Sector Reform Programme (2009-2015) was designed with the objectives of
improving access & equity; quality and relevance; good governance and management of school
education. Policies under it were steered towards access and participation; expansion of free
and compulsory basic education; equity and social inclusion; introduction of soft vocational skills
in secondary education; meeting the prioritized minimum enabling conditions of learning;
ensuring equitable access; and educational governance through shared responsibility between
central and local government. To achieve these objectives, Department of Education (DOE) has
implemented various types of educational programmes in the fiscal year 2014-2015. In addition,
the DOE made quick response towards managing damaged schools/classrooms of earthquake
(occurred on April 25, 2015) affected districts.
The NPC, MOE, MOF, pooling and non-pooling Development Partners (DPs) are greatly
esteemed for their contribution and support in implementing the SSRP (2014-2015). On behalf
of DOE, I would like to extend sincere thanks to NPC, MOE, MOF, line agencies of MOE and
JCM members for their contributions and support. Lastly, I would like to thank advisors, working
team members, officials of DOE and other CLAs, and Better Services Pvt. Ltd. for their
invaluable contribution in preparing this report.
Khagaraj Baral
Director General
Department of Education
Sanothimi, Bhaktapur, Nepal

Status Report -2015 Page iv
Abbreviations
ASIP Annual Strategic Implementation Plan
AWPB Annual Work Plan & Budget
CAS Continuous Assessment System
CBO Community Based Organization
CDC Curriculum Development Center
CLC Community Learning Centre
CRC Camera Ready Copy
DEO District Education Office
DOE Department of Education
DTCO District Treasury Comptroller's Office
ECED Early Childhood Education and Development
EFA Education for All
EIECD Emergency in Education Capacity Development
DRR Disaster Risk Reduction
EMIS Education Management Information System
FCBE Free and Compulsory Basic Education
FCGO Financial Comptroller General's Office
FMR Financial Monitoring Report
FPR Financial Progress Rate
FSP Flexible Schooling Programme
FY Fiscal Year
GON Government of Nepal
GER Gross Enrollment Rate
GPI Gender Parity Index
GAS General Administration Section
IES Inclusive Education Section
INGO International Non-Governmental Organization
IPR Implementation Progress Report

Status Report -2015 Page v
IGP Income Generating Program
JEMC Janak Education Material Centre
JFA Joint Financing Arrangement
MEC Minimum Enabling Conditions
MOE Ministry of Education
MOF Ministry of Finance
MTEF Medium Term Expenditure Framework
NER Net Enrollment Rate
NFEC Non-formal Education Centre
NGO Non-Governmental Organization
NPR Nepalese Rupees
OOSC Out of School Children
PPC Pre Primary Class
PPR Physical Progress Rate
PTA Parent Teacher Association
RC Resource Centre
RED Regional Education Directorate
SIP School Improvement Plan
SOE Statement of Expenditures
SOP School Outreach Programme
SMC School Management Committee
SSRP School Sector Reform Programme
TOT Training of Trainers
TRO Teachers' Record Office
TYIP Three-Year Interim Plan
VDC Village Development Committee
VEP Village Education Plan
WEP Women Education Programme
Status Report -2015 Page vi
Table of Contents S.N. Particular Page
Acknowledgements ii
Abbreviations iii
Table of Contents v
List of Tables xii
List of Figures xvi
List of Annex xix
Executive Summary xx
Part I Introduction 1
1.1 Background 1
1.2 Objectives of the Report 2
1.3 Report Preparation Process 3
1.4 Data Sources 5
1.5 Structure of the Report 5
1.6 Implementation of ASIP and AWPB (2014/2015) 5
1.7 Overall Strategic Priorities 6
1.8 Overall Issues and Challenges 8
1.9 Allocated Budget and Expenditure 10
Part II School Sector Reform Program (SSRP) 38
Chapter 1: Early Childhood Education and Development (ECED) 38
2.1.1 Introduction 38
2.1.2 ASIP Priorities 39
2.1.3 Achievement Against Indicators 41
2.1.4 Achievement against Annual Targets of the Program 44
2.1.5 Analysis of Progress 44
2.1.5.1 Major Achievements 44
2.1.5.2 Innovations and Case Studies 46
2.1.5.3 Areas forImprovement 46
2.1.5.4 Constraints 46
2.1.5.5 Addressing Constraints and Maximizing Achievements 47
Chapter 2: Ensuring Access to School Education 48
Status Report -2015 Page vii
S.N. Particular Page
2.2.1 Basic Education 48
2.2.1.1 Introduction 48
2.2.1.2 ASIP Priorities 50
2.2.1.3 Achievement Against Indicators 55
2.2.1.4 Achievement against Annual Targets 66
2.2.1.5 Analysis of Progress 69
2.2.1.5.1 Major Achievements 69
2.1.5.1.1 Gap analysis between ASIP priorities and annual progress 70
2.1.5.2 Innovations and Case Studies 70
2.1.5.3 Areas of Under-Performance 71
2.1.5.4 Constraints 71
2.1.5.5 Addressing Constraints and Maximizing Achievements 72
2.2.2 Secondary Education 72
2.2.2.1 Introduction 72
2.2.2.2 ASIP Priorities 75
2.2.2.3 Achievements against Indicators 77
2.2.2.4 Achievement against Annual Targets 83
2.2.2.5 Analysis of Progress 84
2.2.2.5.1 Major Achievements 84
2.2.2.5.2 Innovations and Case Studies 84
2.2.2.5.3 Areas of Under-Performance 85
2.2.2.5.4 Constraints 85
2.2.2.5.5 Addressing Constraints and Maximizing Achievement 86
2.2.3 Physical Facilities Improvement 86
2.2.3.1 Introduction 86
2.2.3.2 ASIP Priorities 86
2.2.3.3 Achievement against Indicators 87
2.2.3.4 Achievement Against Annual Targets 87
2.2.3.5 Analysis of Progress 88
2.2.3.5.1 Major Achievements 88
2.2.3.5.1.1 Gap Analysis Between ASIP Priorities and Annual Progress 89
2.2.3.5.2 Innovations and Case Studies 89
2.2.3.5.3 Areas of Under-Performance 89

Status Report -2015 Page viii
S.N. Particular Page
2.2.3.5.4 Constraints 90
2.2.3.5.5 Addressing Constraints and Maximizing Achievements 90
Chapter 3: Literacy and Lifelong Learning 91
2.3.1 Introduction 91
2.3.2 ASIP Priorities 91
2.3.3 Achievement against Indicators 94
2.3.4 Achievement against Annual Targets 96
2.3.5 Analysis of Progress 97
2.3.5.1 Major Achievements 97
2.3.5.1.1 Gap analysis between ASIP and annual progress 97
2.3.5.2 Innovation and Case Studies 98
2.3.5.3 Areas of Under-Performance 98
2.3.5.4 Constraints 98
2.3.5.5 Addressing Constraints and Maximizing Achievements 99
2.3.5.6 Areas of Under-Performance 99
2.7.5.7 Constraints 99
2.7.5.8 Addressing Constraints and Maximizing Achievements 100
Chapter 4: Enhancing Educational Quality 101
2.4.1 Introduction 101
2.4.2 ASIP Priorities 101
2.4.3 Achievement against Indicators 109
2.4.4 Achievement against Annual Targets 112
2.4.5 Analysis of Progress 114
2.4.5.1 Major Achievements 114
2.4.5.1.1 Gap Analysis between ASIP priorities and annual targets 116
2.4.5.2 Innovations and Case Studies 116
2.4.5.3 Areas of Under-Performance 118
2.4.5.4 Constraints 118
2.4.5.5 Addressing Constraints and Maximizing Achievements 119
Chapter 5: Soft Skills and Community School Capacity Development Program (TVET)
120
(A) Soft Skills 120
2.5.1 Introduction 120
Status Report -2015 Page ix
S.N. Particular Page
2.5.2 ASIP Priorities 120
2.5.3 Achievement against Indicators 120
2.5.4 Achievement against Annual Targets 121
2.5.5 Analysis of Progress 121
2.5.5.1 Major Achievements 121
2.5.5.1.1 Gap analysis between ASIP Priorities and Annual Targets 121
2.5.5.2 Innovations and Case Studies 122
2.5.5.3 Areas of Under-Performance 122
2.5.5.4 Constraints- Lack of set indicators and lack of integration of TSSP in ASIP
122
2.5.5.5 Addressing Constraints and Maximizing Achievements 122
2.5.5.6 Lessons Learned 122
2.5.5.7 Reflection 122
(B) Community School Capacity Development Program (Technical Education and Vocational Training- TVET)
123
3.2.1.1 Introduction 123
3.2.1.2 Concise information about students instructors and lab assistants 127
3.2.1.2 Strategic Priorities 127
3.2.1.3 Achievements 128
3.2.1.4 Lessons Learned and Best Practice 130
3.2.1.5 Constraints 134
3.2.1.6 Addressing Constraints and Maximizing Achievements 134
Chapter 6: Teacher Education and Development 136
2.6.1 Introduction 136
2.6.4 Achievement against Annual Targets 151
2.6.5 Analysis of Progress 153
2.6.5.1 Major Achievements 153
2.6.5.1.1 Gap analysis between annual achievement and ASIP priorities 154
2.6.5.2 Innovations and Case Studies 155
2.6.5.3 Areas of Under-Performance 156
2.6.5.4 Constraints 156
2.6.5.5 Addressing Constraints and Maximizing Achievements 157
Chapter 7: Capacity Development for Effective Service Delivery 158
2.7.1 Introduction 158
Status Report -2015 Page x
S.N. Particular Page
2.7.2 ASIP Priorities 158
2.7.3 Achievement Against Annual Targets 159
2.7.4 Analysis of Progress 160
2.7.4.1 Major Achievements 160
2.7.4.2 Gap Analysis between Annual Achievement and ASIP Priorities 161
2.7.4.3 Innovations and Case Studies 161
2.7.5.4 Areas of Under-Performance 162
2.7.5.5 Constraints 162
2.7.5.6 Addressing Constraints and Maximizing Achievements 162
Chapter 8: School Management and Monitoring 163
2.8.1 Introduction 163
2.8.2 ASIP Priorities 163
2.8.3 Achievement against Indicators 165
2.8.4 Achievement against Annual Targets 166
2.8.5 Analysis of Progress 168
2.8.5.1 Major Achievements 168
2.8.5.2 GAP Analysis Between Annual Achievement and ASIP Priorities 169
2.8.5.2 Innovations and Case Studies 169
2.8.5.3 Areas of Under-Performance 171
2.8.5.4 Constraints 171
2.8.5.5 Addressing Constraints and Maximizing Achievements 171
Chapter 9: Incentives and Support 172
2.9.1 Introduction 172
2.9.2 ASIP Priorities 172
2.9.3 Achievement Against Indicators 173
2.9.4 Achievement against Annual Targets District Level 173
2.9.5 Analysis of Progress 174
2.9.5.1 Major Achievements 174
2.9.5.2 Gap analysis between annual achievement and ASIP priorities 175
2.9.5.3 Innovations and Case Studies 175
2.9.5.4 Areas of Under-Performance 175
2.9.5.5 Constraints 176
2.9.5.6 Addressing Constraints and Maximizing Achievements 176
Status Report -2015 Page xi
S.N. Particular Page
Chapter 10: School Operation/Management and School Employee Remuneration Costs
177
2.10.1 Introduction 177
2.10.2 ASIP Priorities 177
2.10.3 Achievement against Annual Target 178
2.10.4 Analysis of Progress 178
2.10.4.1 Major Achievements 178
2.10.4.2 Innovations and Case Studies 179
2.10.4.3 Areas of Under-Performance 179
2.10.4.4 Constraints 179
2.10.4.5 Addressing Constraints and Maximizing Achievements 179
Part III COMPLEMENTARY INTERVENTION 180
3.1 National Early Grade Reading Programme 180
3.1.1 Introduction 180
3.1.2 Achievements 180
3.1.3 Constraints 180
3.1.4 Lessons Learned 181
3.1.4 Reflection 181
3.2.2 Enhancing Vocational Education and Training (EVENT) 181
3.2.2.1 Introduction 181
3.2.2.2 Achievements 181
3.2.2.3 Lessons Learned 184
3.2.2.4 Key Challenges 184
3.2.3 Technical Education in Community School (Annex Project) 185
3.2.3.1 Introduction 185
3.2.3.2 Major Achievements 186
3.2.3.3 Constraints 186
3.2.3.4 Lessons Learned 187
3.2.3.5 Reflection 187
3.3 UNESCO Supported Programmes 187
3.3.1 Introduction 187
3.3.2 Achievements 187
3.3.2.1 Improving the Education Management Information System (EMIS) at DOE/MOE
187

Status Report -2015 Page xii
S.N. Particular Page
3.3.2.2 Literacy in mother tongue 188
3.3.2.3 UNESCO's response to post-earthquake activities included 189
3.3.2.4 USE of ICT in education development included 189
3.3.2.5 Empowering adolescent girls and women: Promoting equitable education,literacy and lifelong learning (Malala Funds for Girls' Education) included
189
3.3.2.6 Supporting processes for post-2015 education development in Nepal 189
3.3.2.7 Inform policy through relevant research and study to develop national capacities
190
3.3.3 Constraints 190
3.3.4 Addressing Constraints and Maximizing Achievements 191
3.3.5 Lessons Learned 191
3.3.6 Way Forward 192
3.4 WFP Supported School Feeding Program 192
3.4.1 Introduction 192
3.4.2 Achievements 194
3.4.3 Major problems 194
3.4.4 Way forward for better performance 194
3.4.5 Lessons Learned 195
3.4.6 Reflection 195
3.5 International and National NGO Supported Program (Excluding UNICEF)
195
3.5.1 Introduction 195
3.5.2 Objective and Target Area 196
3.5.3 Overall Progress of the 2nd Project Year and the Gorkha Earthquake 196
3.6 Local Government Funded Interventions 198
3.6.1 Introduction 198
3.8.2 Achievements 198
3.8.3 Constraints 198
3.8.4 Addressing Constraints and Maximizing Achievements 198
PART IV MEETING MANDATORY REQUIREMENTS 199
4.1 Introduction 199
4.2 Status of Implementation 199
4.3 Addressing Constraints and Maximizing Achievements 201
Status Report -2015 Page xiii
S.N. Particular Page
PART V CONCLUSION 202
List of Tables
S.N. Particular Page
Table No. 1 Total National Budget Allocation in FY 201/14 in NPR 11
Table No. 2 Summary of the National Budget Alloction by Percentage in FY 201/14, (NPR)
11
Table No. 3 Total Allocation in Education Budget and Actual Expenditure for FY 2014/2015 (NPR)
11
Table No. 4 Total Proposed Budget of Education on Red Book, FY 2014/2015 12
Table No. 5 Actual Education Budget Allocation and Percentage share of Sub Sectors for FY 2014/2015 (NPR)
14
Table No. 6 Percentage Share of Sub-Sector Budget Allocation in Education, FY (2010-2015)(Currency NPR)
16
Table No. 7 Trend of Budget Flow from FYs 2011/2012 to 2015/2016 (NPR in Thousand and Dollar in Million)
18
Table No. 8 Total SSRP Pooling Budget Allocation and Actual Expenditure for FY 2014-2015 (NPR)
18
Table No. 9 FYs Actual SSRP Pooling Budget Allocation and Actual Expenditure for FY 2014/2015 (NPR)
20
Table No. 10 Share Percentage of the Budget under SSRP Pooling Budget Head
21
Table No. 11 Total Budget Allocated in Red Book for 12 Programs Implemented through DEO for FY 2014/2015 (NPR)
22
Table No. 12 Physical Progress (PPR) and Financial Progress (FPR) of Twelve Different Budgets Released through DOE (both for Recurrent and Capital Cost) for FY 2014/2015
23
Table No. 13 Actual Recurrent Budget Allocation across 12 Programs Implemented through DOE and Actual Expenditure for FY 2014/2015
24
Table No. 14 Total Capital Budget Allocation in 12 Programs Implemented through DOE and Actual Expenditure for FY 2014/2015 (NPR)
26
Table No. 15 Total SSRP Budget Allocation in Nine Sub-Components, their Percentage shares for (Budget Head No. 3500803/4 and 350123/4) NPR
27
Table No. 16 Allocated Budget and Expenditure of SSRP (District and Central) by Activities and Sub-Components for FY 2014/2015 Budget Head No. (350803/04 &3501213/4)
29

Status Report -2015 Page xiv
Table No. 17 Allocated Budget for Expenditure of SSRP (District) by Activities and Sub-Components for the FY 2014/2015 Budget Head No. (350803/04)
30
Table No. 18 Allocated Budget and Expenditure of SSRP (centre) by 9 Components for FY2014/15 Budget Head no.3501213/4
31
Table No. 19 Budget Allocation for SSRP District and Center based on Red Book, 2014/2015
32
Table No. 20 Comparison of Total SSRP Budget Allocated in Districts and Central Level Agencies and Progress Achieved in Terms of Expenditure in Budget Heads No.3508033/4 and 350123/4 in NPR in FY 2014/2015
32
Table No. 21 Comparison of Total SSRP Budget Allocated in Districts and Central Level Agencies and Physical & Financial Progress Achieved in Terms of Expenditure for Budget Head No. 3508033/4 & 350123/4 in NPR FY 2014/2015
33
Table No. 22 FY 2014/2015 Total SSRP Recurrent Costs Allocated across Districts and Central Level Agencies and Progress Achieved in Terms of Expenditure for Budget Head No's 3508033/4 & 350123/4 in NPR
35
Table No. 23 Total SSRP Capital Cost Allocated in Districts and CLAs and Progress Achieved in Terms of Expenditure for Budget Head No.'s 3508033/4 and 350123/4 in NPR FY 2014/2015
36
Table No. 24 Total Number of ECO/PPCs by Types and Eco-belts 39
Table No. 25 Progress of ECD against the Relevant KPIs 41
Table No. 26 ECD/PPC Enrolment by Sex and Social Groups (Dalit & Janajati in 2015-2016)
43
Table No. 27 Targets for the FY 2014/2015 and Implementing Status of ECED Program
44
Table No. 28 Trends of School Numbers Increasing in Nepal 2008 to 2015 49
Table No. 29 Trend in Total Number of Enrolments at Primary, Lower Secondary and Basic Levels 2009-2015
55
Table No. 30 SSRP Indicators at Primary, Lower Secondary and Basic Levels 55
Table No. 31 Comparison of Achievement against the Target of Gross Intake Rate (GIR) in Grade 1 from 2008 to 2015
56
Table No. 32 Gross Intake Rate (GIR) in Grade 1 (2015-2016) 57
Table No. 33 Progress Achieved against the Target of Net Intake Rate (NER) for Grade 1 from 2008 to 2015
58
Table No. 34 Net Enrollment Rate (NER) in Grade 1, (2015-2016) 59
Table No. 35 Gross Enrollment Rate (GER) of Primary, Lower Secondary and Basic Level in (2015-2016)
60
Table No. 36 Progress Achieved against the Target of GER at Lower 61

Status Report -2015 Page xv
Secondary Level from 2008 to 2015
Table No. 37 Achievement against the Target for Gross Enrollment Rate (GER) for Basic Education from 2009 to 2015
62
Table No. 38 Net Enrollment Rate (NER) by Levels in (2015-2016) 63
Table No. 39 Achievement against the Target for the Net Enrolment Rate (NER) at Primary Level Education from 2008 to 2015
63
Table No. 40 Achievement against the Target for Net Enrollment Rate (NER) in Basic Education from 2008 to 2015
64
Table No. 41 Comparison of Achievement of Net Enrollment (NER) in Lower Secondary Level from 2008 to 2015
65
Table No. 42 Physical Progress Achieved against Annual Target 66
Table No. 43 Physical Progress Achieved against Annual Target 67
Table No. 44 Trend of School Increasing in Nepal from 2008 to 2015 74
Table No. 45 Distribution of religious schools at Secondary level, 2015-2016 75
Table No. 46 Gross Enrolment Rates (GER) and Net Enrolment Rates (NER) at Secondary Level 2014/2015
77
Table No. 47 Achievement against the Target for Gross Enrolment Rate (GER) in Secondary Level Education from 2008 to 2015
78
Table No. 48 Achievement against the Target for Net Enrollment Rate (NER) in Secondary Level from 2008-2015
79
Table No. 49 Current Status of GER, NER and Other Indicators for Secondary Level from 2008-2014
80
Table No. 50 Percentage of Students Passed in the Regular SLC Examination from 2008 to 2015
81
Table No. 51 Physical Progress Achieved Against Annual Targets 83
Table No. 52 Physical Progress Achieved Against Annual Targets 87
Table No. 53 Physical Progress Achievement Against Annual Targets 89
Table No. 54 Major Programme Activities under SSRP FY 2014/2015 94
Table No. 55 Targets for Literacy Programs in Nepal from 2001 to 2016 95
Table No. 56 Achievement of Literacy Programs in Nepal from 2008 to 2015 95
Table No. 57 Activity-wise Targets and Achievement 2014/2015 96
Table No. 58 Activity-wise target and achievement 2014/15 96
Table No. 59 List of Literate Districts 100
Table No. 60 Achievement against Annual Targets 110
Table No. 61 Physical Progress Achieved Against Annual Targets 112
Table No. 62 Physical Progress Achieved Against Annual Targets 113
Table No. 63 Major Programme Activities, Target and Budget Allocation for the 121

Status Report -2015 Page xvi
FY (2015/16 TVET)
Table No. 64 Students Enrolled in Grade 9 & 10 and Schoolwise TSLC- 2072 123
Table No. 65 TEVT School Incur lab and equiptment management costs 128
Table No. 66 Exam results of TSLC 2071 129
Table No. 67 Course Structure (Animal Science) 131
Table No. 68 Course Structure (Plant Science) 132
Table No. 69 Course Structure (Computer Science) 132
Table No. 70 Course Structure (Civil Engineering) 133
Table No. 71 Course Structure (Electrical Engineering) 133
Table No. 72 Total Number of Teachers in all types of Community Schools by levels (based on approved positions)
136
Table No. 73 TPD Design 137
Table No. 74 Major Programme Activities, Target and Budget Allocation for the FY 2014/2015 (TPD)
141
Table No. 75 Physical Achievement against Annual Targets for Budget head 350803 (District level)
144
Table No. 76 Physical Achievement against Annual Targets for Teacher Education Development
145
Table No. 77 Summary of the Current Status in Key Performance Indicators (TPD) in 2014/2015
147
Table No. 78 Teacher Training Status in 2015-2016 151
Table No. 79 Physical Achievement against Annual Targets 159
Table No. 80 Physical Progress Achieved against Annual Targets 160
Table No. 81 Physical Achievement against Annual Targets 165
Table No. 82 Physical Achievement against Annual Targets 166
Table No. 83 Physical Achievement against Annual Targets 167
Table No. 84 Achievement against Indicators 2013-2014 173
Table No. 85 Physical Achievement against Annual Targets 173
Table No. 86 Physical Achievement against Annual Targets 178
Table No. 87 Achievements made in FY 2013/2014 181
Table No. 88 TFCS (Annex) School Status of FY 2014/15 186
Table No. 89 Annual Progress Report of Day Meal Program F/Y 2071/72 (2014/2015)
194
Table No. 90 Status of Implementation against Mandatory Requirements 199
Table No. 91 Summary of SSRP System Indicators, Base-Year Status, and Targets and Achievements (2009-2015)
204
Status Report -2015 Page xvii
Table No. 92 Summary of the SSRP Key Performance Indicators (base year status, progress status and targets)
205
Table No. 93 Summary of the SSRP Key Performance Indicators (base year status, progress status and targets)
206
List of Figures
S.N. Particular Page
Figure No. 1 Percentage share of Sub-Sector-Wise 17
Figure No. 2 Total SSRP Pooling Budget Allocated and Actual Expenditure for FY 2014/2015 (NPR)
20
Figure No. 3 Physical Progress rate and Financial Progress rate for the SSRP Pooling Budget
21
Figure No. 4 Comparison of the Physical Progress (PPR) and Financial Progress (FPR) of the Twelve Different Budgets Released through the DOE (both for Recurrent and Capital Costs) for FY 2014/2015
24
Figure No. 5 Physical Progress (PPR) and Financial Progress (FPR) of the Recurrent Costs across Twelve Different Budget Heads Implemented through DOE in FY 2014/2015
25
Figure No. 6 Physical Progress (PPR) and Financial Progress (FPR) on Capital Cost of Three Budget Heads Implemented through DOE in FY 2014/2015
26
Figure No. 7 Comparison of Percentage share of SSRP (District) and SSRP (Center) Budget Allocation through the Nine (9) components
28
Figure No. 8 Comparison of the Physical Progress Rate (PPR) & Financial Progress Rate (FPR) of SSRP (District) and SSRP (Center) Budget Allocation and Expenditure across Nine (9) Components
29
Figure No. 9 Comparison of the Physical Progress Rate (PPR) and Financial Progress Rate (FPR) of SSRP (District) and SSRP (Center) Budget Allocation and Expenditure across Nine (9) Components
30
Figure No. 10 Comparison of the Physical Progress Rate (PPR) and Financial Progress Rate (FPR) of SSRP (Center) on Budget Allocation and Expenditure through the Nine (9) components
31
Figure No. 11 FY 2014/2015 Comparison of Total SSRP Budget Allocated in Central level Agencies and Progress Achieved in Terms of Expenditure for Budget Head No. 350803/4 and 350123/4
33
Figure No. 12 Comparison of Total SSRP Budget Allocated across Districts and Central Level Agencies and Progress Achieved in Terms of Expenditure across Budget Head No.'s 3508033/4 and 3501213/4 in NPR FY 2014/2015
34
Figure No. 13 FY 2014/2015 Total SSRP Recurrent costs Allocated to Districts 35
Status Report -2015 Page xviii
S.N. Particular Page
and Central Level Agencies and Progress Achieved in Terms of Expenditure for Budget Head No.'s 3508033/4 and 350123/4 in NPR
Figure No. 14 FY 2014/2015 Total SSRp Capital Cost Allocted in District and Central Level Agency and Progress Achieved in terms of Expenditure for Budget Head No.'s 3508033/4 and 350123/4
36
Figure No. 15 Comparison of Total No. of ECD/PPCs from 2008 to 2015 39
Figure No. 16 Progress of ECD against relevant KPI's (Percentage of New Entrants with ECED Experience 2010- 2015
41
Figure No. 17 Key Performance Indicators for Measuring the Progress of Gross Enrolment Rate of ECEDCS/Pre Primary Since 2010 to 2015
42
Figure No. 18 Percentage of Dalit and Janajati in Total Children in ECD/PPCs in (2015-2016)
43
Figure No. 19 Composition of ECD/PPC Enrolment by Social Group 43
Figure No. 20 Progress Achieved in 2014-15 45
Figure No. 21 Progress Achieved in 2014-2015 45
Figure No. 22 Total No of Schools in Nepal 2008 to 2015 49
Figure No. 23 Trend of Average Growth of schools 2008 to 2015 50
Figure No. 24 Progress Achieved Against the Target of Gross Intake Rate (GIR) in Grade 1 since 2008 to 2015
56
Figure No. 25 Gross Intake Rate (GIR) in Grade 1, (2015-2016) 57
Figure No. 26 Progress Achieved Against the Target of Net Intake Rate (NER) in Grade 1 from 2008 to 2015
58
Figure No. 27 Net Enrolment Rate (NER) in Grade 1, 2015-2016 59
Figure No. 28 Gross Enrolment Rate (GER) by levels in 2014/2015 60
Figure No. 29 Progress Achieved against the Target GER for Lower Secondary Level from 2008 to 2015
61
Figure No. 30 Achievement against the Target for Gross Enrollment Rate (GER) in Basic Education from 2009 to 2015
62
Figure No. 31 Net Enrolment Rate (NER) by Levels in (2015-2016) 63
Figure No. 32 Achievement against the Target for Net Enrollment Rate (NER) of Basic Education from 2008 to 2015
64
Figure No. 33 Comparison of Achievement against the Target of NER of Basic Education from 2008 to 2015
65
Figure No. 34 Comparison of Achievement of Net Enrollment Rate (NER) in Lower Secondary Level from 2008 to 2015
66
Figure No. 35 Total No of Secondary Schools from 2008 to 2015 in Nepal 73
Status Report -2015 Page xix
S.N. Particular Page
Figure No. 36 Trend of Schools Increasing in Nepal from 2008 to 2015 74
Figure No. 37 Gross Enrolment Rate (GER) at Secondary Level in 2014/2015 77
Figure No. 38 Comparison of Achievement against the Target for Gross Enrollment Rate (GER) in Secondary Level Education from 2008 to 2015
78
Figure No. 39 Net Enrolment Rate (NER) at Secondary Level in (2015-2016) 79
Figure No. 40 Achievement against the Target for Net Enrollment Rate (NER) in Secondary Level from 2008-2014
80
Figure No. 41 Comparison of GER & NER of Secondary Level from 2008 to 2014
81
Figure No. 42 Comparison of SLC Result 82
Figure No. 43 Percentage of Students Passing the Regular SLC Examination from 2008-2015
82
Figure No. 44 Trend of Pupil/teacher Ratio for Grades 9-12 from 2008-2015 83
Figure No. 45 Percentage Progress for Literacy and Continuing Education 97
Figure No. 46 Trend of Promotion, Repetition and Dropout Rate in Grade 1 110
Figure No. 47 Trend of Promotion, Repetition and Dropout Rates in Grade 5 111
Figure No. 48 Trend of Promotion, Repetition and Dropout Rate in Grades 6-8 111
Figure No.49 Total Number of teachers in all types of community schools by levels (based on approved positions)
137
Figure No. 50 Teachers Trained in Community Schools 148
Figure No. 51 Trained Teachers in Community Schools at Secondary Level 149
Figure No. 52 STR of Community Schools Basic Education 150
Figure No. 53 STR of Community Schools Secondary Teacher Training Status in 2015-2016Education
150
Figure No. 54 Teacher Training Status in 2015-2016 151
List of Annexes
Annex 1 Annual Programme and Budget (District Level) 211-228
Annex 2 Annual Programme and Budget (Central Level) 229-244
Annex 3 TEVT (Community School Capacity Development) 245-249
Annex 4 Education for All Child Development Programme (UNICEF Funded)
250-257

Status Report -2015 Page xx
EXECUTIVE SUMMARY
Nepal has made significant improvements in education through its progressive policies and
programmes implemention. The School Sector Reform Plan (SSRP 2009-2015) which is now in
its final year of implementation is the major program supporting expansion of access and equity
significantly through various measures like; inclusion, free and compulsory basic education,
decentralized management and an improved Educational Management Information System.
The Department of Education (DOE) is the main implementing agency of the SSRP. Both
pooling and non-pooling funding moDalities have been adopted in its implementation. The
pooling fund has been guided by the Joint Financial Arrangement (JFA), agreed upon by the
Government of Nepal and the pooling Development Partners including ADB, AusAid, EU,
Finland, GPE, JICA, Norway, UNICEF and the World Bank. Similarly, the non-pooling partners
include; JICA, UNESCO, UNICEF, USAID, WFP and non-Government organizations including
AIN.
For effective implementation of the SSRP, the DOE coordinated with central level educational
agencies such as National Center for Educational Development (NCED), Curriculum
Development Center (CDC), Office of the Controller of Examinations (OCE) and Non-formal
Education Center (NFEC) as well as other line agencies. District Education Offices (DEOs) and
Regional Education Directorates (REDs) carried out SSRP activities based on the annual
program and budget and provided implementation guidelines from MOE/DOE. A synopsis of the
Status Report is presented as follows:
1. The overall physical and financial progress of the programmes under the pooling budget
sub-heads was found satisfactory.
2. Based on the Red Book for fiscal year 2014-15, the total budget allocated for the SSRP at
district and central level budget heads 350121 and 350803 was 18,445,149,000 NPR, of
which the Financial Progress made was 85.72%.
3. Based on the Red Book for fiscal year 2014-15, the total budget allocated for the SSRP
(District level) was NPR 18,170,787,000, of which the Financial Progress made was
86.18%.
4. Based on the Red Book for fiscal year 2014-15, the total budget allocated for the SSRP
(Center) was NPR 274,363,000. The total expenditure was NPR 159,802,210 (56.14%).
5. Based on the Red Book for fiscal year (2014-15), the total recurrent costs allocated for the
twelve programs implemented through the Department of Education was NPR
65,847,402,960, of which the expenditure was NPR 60,905,024,497 (with a Physical
Progress rate of 76.91% and Financial Progress rate of 92.49%).
6. The total capital cost allocated for the three program budget heads which were
implemented through the Department of Education was NPR 102,069,000, of which
expenditure was NPR 52,371,640 (with a Physical Progress rate of 35.06% and Financial
Progress rate of 51.31%).
Status Report -2015 Page xxi
7. As reported by the District Education Offices, 29,300 ECEDCs (out of total 30,034)
received instructional material management costs, remuneration and PCF funds. The
Physical Progress and Financial Progress rates in this category remained 97% and 94%
respectively.
8. The aggregate Physical Progress and Financial Progress rates of alternative education
flexible schools programs (FSP), open schools programs (Grades 6-8), inclusive education
programs, Free and Compulsory Basic education programs, and traditional schools were
79.35% and 63.01%.
9. Open schools programs for Grades 9-10, non-formal adult school programs, and
traditional school programs were implemented to expand access to secondary education.
The aggregate Physical Progress and Financial Progress rates of these programmes were
97.49% and 88.67% respectively.
10. Support of NPR 1,624,990,000 was provided to schools of earthquake affected districts to
continue their instructional activities through emergency education.
11. Support of NPR 3,350,849,000 was provided for the improvement of physical facilities in
schools. In FY 2014-2015, 994 new classrooms and 1,127 new school buildings were
constructed, 540 school buildings were maintained, 204 schools were retrofitted, and
1,000 classrooms were renovated with furniture.
12. The midday meal programme was provided to 79,147 school students of Karnali Zone and
283,696 students from 14 targeted Districts including ECED children. This programme
contributed in improving students‟ regular attendance, retention and health condition.
13. Free textbook grants were made available for 2,797,389 Primary level students, 1,337,484
Lower Secondary students, 660,240 Secondary students and 125,437 Higher Secondary
level students during FY 2014-2015.
14. PCF salary grants amounting to NPR 1,149,105,150 were made available to schools to
serve 233,189 un-served students on the basis of PCF salary guidelines. Similarly, 28,877
schools received non-salary PCF funds amounting to NPR 417,269,010 to manage
instructional material.
15. A 10-day Teacher Professional Development (TPD) module for 14,888 teachers of Basic
level and 2,200 teachers of Secondary level was delivered.
16. In a pilot program, 3,027 Basic level teachers teaching in English medium received a 10-
day training course.
17. All DEOs and REDs published their bulletins to ensure transparency, and prepared ASIP,
AWPB annually, and quarterly IPR with the annual Status Report.
18. A total 765,957 Dalit students in Grades 1-8, 75,721 Dalit students in Grades 9-10, 3,392
students with disability in Grades 9-10, and 1,573,220 female students including Karnali
benefitted from the scholarship program. Similarly, 77,316 students from targeted
populations at Basic level (children from 22 Janajati and marginalized groups, such as
Mukta Kamaiya, Badi, Haliya, Charuwa, etc.) received the scholarship.

Status Report -2015 Page xxii
19. The targeted scholarship was made available for 127,785 students (martyrs‟ children,
Kamhalari, conflict affected children, Secondary level talent students, science students)
studying at the Secondary and Higher Secondary level.
20. Support for the TEVT stream in 99 selected schools continued in FY 2014-2015. A total
3,238 students (first batch) passed the Technical SLC in five major subjects (computer
science, electrical engineering, plant science, animal science and civil engineering).
21. A Letter Grading System (LGS) has been initiated in SLC examinations for 99 schools in
the Technical and Vocational stream.
22. The partnership and collaboration with I/NGOs expanded and utilized resources to create
enabling educational environments especially during the period of natural disaster.
23. To improve the effectiveness of education service delivery at school level, 443 schools
were merged with neighboring schools, 627 schools were closed and 43 schools were
downsized during FY 2014-2015.
24. Selected schools (497) were provided with smartboards to strengthen the
teaching/learning process.
25. In FY 2014-2015, 7,920 Primary, 2,670 Lower Secondary and 2,146 Secondary teachers
were newly appointed and deployed to permanent posts. Similarly, the vacancy of 1,872
Lower Secondary and 1,383 Secondary teacher positions was announced in FY 2014-
2015.
26. For the improvement of the teaching/learning process of science subjects, 810 Secondary
schools were supported to establishe and run science laboritories and 933 schools were
supported to establish libraries.
27. The second round of NASA of Grade 8 has been completed whereas that of Grades 3 and
5 are in progress.
28. Due to the earthquake, the most affected 14 Districts, and 27 other Districts, were
supported with NPR 1,235m to resume educational programs at schools. With this support
TLCs and toilets were constructed and highly affected students were provided school
bags, textbooks and uniforms.

Status Report -2015 Page 1
PART – 1
INTRODUCTION
1. 1. Background
The School Sector Reform Plan (SSRP) was a long-term strategic plan to achieve the goals and
objectives of Basic and Secondary Education. It was in line with the three- year interim plan
(2010-2013) that had been formulated giving consideration to the opportunities and challenges
in the areas of poverty alleviation, economic growth, employment generation and inclusive
development. The budget speech for fiscal year 2014-2015 indicated general education be re-
oriented towards Technical and Vocational Educational. Special attention was paid to elevate
students from excluded groups during the year. Furthermore, technical education was expected
to extend into Higher Secondary schools in collaboration with the private sector. To identify
appropriate models and approaches, the SSRP aimed at testing and piloting different schemes
for soft-skills with the intention of continuing ongoing programmes.
The SSRP had its roots in the EFA National Plan of Action 2001-15 and the Three Year Interim
Plan. It provided the strategic framework for the Annual Strategic Implementation Plans (ASIP)
and Annual Work Plan and Budget (AWPB). Key policy values, such as the right to education,
gender parity, and inclusiveness were articulated as strategic interventions in the plan.
The School Sector Reform Program (2009-2015) aimed to achieve the following major
objectives as part of the strategic plan of Government of Nepal:
1. Ensure equitable access to quality Basic education for all children.
2. Expand access to Early Childhood Education and Development (ECED).
3. Increase functional literacy and competencies among youth and adults.
4. Increase access, equity, quality and relevance in Secondary education.
5. Equip Secondary level students with soft skills based Technical and Vocational
Education.
6. Improve the performance of the service delivery system and develop capacity.
7. Teacher‟s professional competencies development.
8. Monitor and evaluate the impact of education interventions.
9. Improve the efficiency and effectiveness of the SSRP.
The major components of the SSRP were:
1. Early Childhood Education and Development (ECED).
2. Ensuring Access to School Education.
3. Literacy and Lifelong Learning.
4. Enhancing Educational Quality.
Status Report -2015 Page 2
5. TEVT soft skills.
6. Teacher Education and Development.
7. Capacity Development for Effective Service Delivery.
8. School Management and Monitoring.
9. Incentives and Support.
The program was jointly funded by the GoN and pooling Development Partners (DPs) and
implemented through a Sector Wide Approach (SWAP). SSRP supporter Development Partners
were ADB, AusAID, EC, Finland, GPE, Norway, UNICEF, and the World Bank whereas Japan,
WFP, UNESCO, INGOs and USAID were non-pooling Development Partners. NGOs,
communities and local bodies also contributed in SSRP implementation.
The DOE, under the MOE, was the main agency responsible for overall planning, programming,
budgeting, and implemention of programs within the education sector budget, with the
partnership of various Central level agencies and other local bodies to meet the diversified
needs, demands and aspirations of people as well as to achieve national and international
commitments to public education.
The SSRP was guided by international commitments and national periodic plans such as the
UN Charter of Human Rights Convention, World Conference of Education for All by 2015,
Millennium Develomement Goals (MDG), the contemporary Constitution of Nepal, the Three
Year Plan of NPC, SSRP (2009-2015), Budget Speech and Red Book of FY (2014-2015), and
ASIP/AWPB (2014-2015). Program implementation, and monitoring and evaluation were based
on the National Monitoring and Evaluation Guideline, 2013 developed by the National Planning
Commission. The final budget authority and programmes of FY (2014-2015) were approved by
the MOE and delegated to DOE.
The tools, techniques and process of monitoring and evaluation had been made robust and
effective for good governance, transparency, sustainability and accountability to achieve
maximum outputs, outcomes and positive impacts of education in society. This report presents
the overall status of different programs implemented by DOE, CLAs, REDs and DEOs in FY
(2014-015).
1.2. Objectives of the Report
The DOE would like to review the SSRP progress in this Status Report (2014-2015) for:
(i) Meeting programme inputs, activities, processes, outputs, outcomes and
impacts;
(ii) Sharing and giving feedback regarding legislative actions and financial activities
undertaken to implement educational programmes;
(iii) Transparency, responding and accountability for the proper use of program funds
and;
(iv) Examining the capacity development of staff and organizations within the MOE
system.

Status Report -2015 Page 3
The ultimate objectives of the Status Report (2014-2015) are to:
(1) Present and analyze the overall status of the implemented programs/activities in FY
(2014- 15);
(2) Analyze the strengths, weakness, underlying problems, issues and constraints that were
faced during the implementation of the programmes; and
Share the status of the targets vs. achievements and best practices among the districts, central
level agencies (CLAs), concerned authorities and stakeholders.
1.3. Report Preparation Process
An advisory team was formed to guide, coordinate and support activities for report preparation.
The Monitoring and Management Section conducted monthly internal reporting meetings to
collect information from all divisions and sections of DOE and compile reports. The CLAs,
regional and district level Annual Status Reports (FY 2014/15) were obtained from REDs and
DEOs. These reports were consolidated and collated with information from sound databases.
1) IPR and Flash Report collection: Implementation Progress Reports (IPRs), Flash Report I
and Flash Report II forms were collected from REDs and DEOs.
2) Data entry: The Monitoring and Management Section entered and processed data obtained
from CLAs, REDs and DEOs.
3) Data tabulation: The Monitoring and Management Section tabulated the data into tables.
Summary tables were prepared to present the budget expenditure and the allocated education
sector budget for FY 2014/15. Total allocated budget for FY 2014/15 and the expenditure costs
for SSRP activities by component are shown in Annex 3.
4) Conversion of data into educational indicators: The Monitoring and Management Section
and the Consultant worked on converting the numerical data/tables into educational indicators
and statistics such as average, mean, mode, deviation, standard deviation, rank, percentile,
ratios and indices. The educational indicators were used to measure, compare and evaluate the
progress towards ASIP, AWPB, SSRP core documents, policy matrixes and guidelines for
2014/15.
5) Preliminary draft report writing: Reviewing the previous year‟s Status Report, ASIP, AWPB
and policy documents, the preliminary draft report was prepared taking data and information
(obtained from Flash Reports I and II, IPR and other reports from DEOs and REDs) into
account.
6) Analysis and interpretation of data: The progress, achievements and successes
accomplished during the implementation of the entire program were compared with pre-
determined targets set in the ASIP and AWPB of 2014/2015 under the DOE.
Status Report -2015 Page 4
Inputs, processes followed and outputs obtained were studied, compared and evaluated against
the targets set. The real budget expenditure (for FY 2014/2015) was compared with the actual
allocated education sector budget for FY 2014/15. The sub sector-wise budget allocation trends
from FY 2010/11 to FY 2014/15 were compiled and analyzed. The proposed total SSRP pooled
budget by different budget heads was compiled and analyzed against real budget expenditure
for FY 2014/15. The total expenditure for SSRP activities by components were analyzed and
interpreted against the ASIP/ AWPB of FY 2014/2015 and allocated budget.
7) Taking recommendations and suggestions from experts: The preliminary draft report
was shared with MOE authorities, DOE division chiefs, section chiefs, consultants and experts
to obtain their feedback/suggestions for refining the report. Similarly, suggestions were obtained
from experts based on the framework of the objectives, policy guidelines, SSRP strategies,
ASIP 2014/15 and AWPB 2014/15 and the Implementation Progress Report (IPR) 2014/15. The
ongoing education reform initiatives and assistance as set out in the Mid-Term Expenditure
Framework (MTEF) such as the Business Plan, Joint Consultative Mission (JCM) 2014, Good
Governance Action Plan of Government of Nepal, Millennium Development Goals (MDG), and
Education for All National plan of action were also quite supportive in this regard.
8) Preliminary draft report sharing for feedback collection: An internal seminar was
conducted at DOE with the participation of MOE and DOE officials to collect their
feedback/suggestions. The draft report was shared and presented for consultation.
Feedback/suggestions were also obtained from each DOE section.
9) Draft report sharing to JCM of Government Agencies and Donor Partners (DPs): A
Joint Consultative Meeting (JCM) was conducted with the participation of government agencies
and Development Partners. The participants included officials of Government Agencies such as
MOE, DOE, NPC, MoF, MoFLD, CDC, STRO, SOCE, HSEB, CTEVT, TSC, NCED, NFE,
EVENT, etc. Donor Partner participants included officials of ADB, Aus-AID, Denmark, EU/DFID,
GPE, Finland, Norway, UNICEF, Save the Children Alliance and the World Bank . Similarly,
there was also input from experts, advisors, consultants and other senior officials of the I/NGOs.
The draft report was shared for discussion and consultation.
10) Review and incorporation of DPs' comments on the Status Report : GoN agencies and
DPs returned the consultative and thematic report to DOE with their comments and suggestions
for its improvement. The comments, suggestions and advice obtained from responsible persons
(DPs, MOE, DOE and other central agencies) was consolidated into a final report. Relevant
suggestions and comments were incorporated in the report and content and language was
edited.
11) Submitting Status Report to MOE and DPs with other required documents: The final
approved printed copy of the Status Report will be submitted to the Ministry of Education,
Ministry of Federalism and Local Development, Ministry of Finance, National Planning
Commission, other central agencies and all Development Partners of MOE.
Status Report -2015 Page 5
1.4. Data Sources
The report utilized both qualitative and quantitative information from different sources. Annual
Status Reports compiled by all DEOs, REDs and CLAs were the main sources. Data and
information from IPRs/FMRs and DOE/MOE/CLAs' monitoring reports prepared by monitoring
DEOs and REDs were also referenced. Flash Report I (2014/2015) data and information was
consolidated. In conducting financial analysis, data and information obtained from the Financial
Comptroller General‟s Office (FCGO) was also used. The data used in the analysis of Physical
Progress was from the unaudited financial data obtained directly from corresponding
institutions. Calculations of Financial and Physical Progress for both district and central level
budget heads were carried out using the National Planning Commission guidelines and
templates.
1.5. Structure of the Report
In this report, Part I comprises the Introduction (i.e. background, objective of the report, report
preparation process, data sources, structure etc.). Part II consists of ten chapters, which reflect
the status of the School Sector Reform Program (SSRP). These chapters focus on analyzing
the component-wise physical and financial progress against targets outlined in the 2014/15
ASIP and AWPB. It also looks at the current status of progress towards the target 15 national
SSRP indicators. Part III focuses on complementary interventions (i.e. NEGRP, Technical
Education and Vocational Training, Pro-Poor targeted Secondary School Stipend, USAID,
UNESCO, UNICEF, JICA, other I/NGO and Local Government Supported Programmes).
Finally, Part IV includes conclusive remarks on major achievements and constraints, and the
Physical and Financial Progress information on the SSRP and other programmes are included
as Annexes.
1.6. Implementation of ASIP and AWPB (2014/2015)
The DOE has prepared an Annual Strategic Implementation Plan (ASIP) and Annual Work Plan
and Budget (AWPB) using a bottom-up and participatory approach. The ASIP was developed
within the policy framework of the School Sector Reform (SSRP) the contemporary Constitution
of Nepal and the three-year national plan (2013/014-2015/016). The ASIP/AWPB was an
operational plan for implementing the SSRP for Fiscal Year 2014/2015 (July 17, 2014 to July
16, 2015). The ASIP had planned to implement the activities and set targets within a one-year
time bound schedule and within a set cost for implementation. Planning of the ASIP was built on
the strengths and opportunities gleaned from education reform initiatives in the past.
1. The ASIP 2014/2015 was prepared to streamline strategic implementation of the SSRP for
the fiscal year 2014/2015. It was guided by the Mid-Term Expenditure Framework (MTEF),
Business Plan, agreed actions of the Mid-Term Review (MTR) of SSRP and Joint Consultative
Mission (JCM) 2014, Good Governance Action Plan of Government of Nepal, Millennium
Development Goals (MDG), and Education for All national plan of action. Similarly, it was also
guided by the budget ceiling, guidelines, budget speech and Red-book, JFA, JAD and
Status Report -2015 Page 6
agreement papers, Policy Matrix and GAAP. Others were the Status Reports, IPR and Flash
Reports, Education Research, survey and monitoring reports, District level ASIP/AWPB and
agreements with teachers‟ professional organizations.
2. The Government of Nepal developed SSRP aiming to promote school sector reform and the
holistic development of schools by consolidating the opportunities and strengths of the past
and collaborating with Development Partners (DPs). The programme has been jointly funded
by the GON, and Pooling DPs and its implementation is assisted by various non-pooling DPs.
3. The SSRP has partially achieved its aims by cultivating the socio-economic development of
the country through human resource development. The SSRP has helped many citizens of
Nepal to become functionally literate and numerate, and to obtain basic life skills and
knowledge for a better quality of life.
4. The objective of the SSRP is to increase access to all, improving quality of school education,
and emphasizing the social inclusion of children from marginalized groups.
5. Key reform agendas of the SSRP were the implementation of Free and Compulsory Basic
education (Grades 1-8) and the Continuous Assessment System (CAS); piloting Secondary
education from Grades 9-12; Students' Achievement Testing; strengthening teacher
management; quality improvement; and ensuring Priority Minimum Enabling Conditions
(PMEC) at school level.
6. ASIP 2014/2015 has provided a tool to assist education managers in transforming planned
strategies into intended outcomes. This ASIP has encompassed both cost and non-cost
reform agendas for school education components.
7. Access, quality, equity and social inclusion in school education were the overall strategic
priorities of the ASIP/AWPB. The time-bound action plan with resource allocation has
provided working guidelines to education managers and has helped us in achieving the overall
objectives of the SSRP.
1.7. Overall Strategic Priorities
The strategic plan for FY 2014/2015 was to set priorities, focus resources, strengthen
operations, ensure that service providers and other stakeholders worked towards common
goals, establish objective agreements, improve implementation to obtain intended
outcomes/results, and to monitor, assess and evaluate programmes. ASIP (2014/15)
determined the following overall strategic priorities to achieve the predetermined goals and
objectives of SSRP (2009-2015):
1. Early Childhood Development Centers (ECDCs) will be expanded and relocated to
address equity concerns by mapping of the current status. Collaboration with local
bodies, communities and NGOs will be improved, along with operations, quality
enhancements and regular monitoring of ECDCs.
2. Free and Compulsory Basic Education (FCBE) will be strategically implemented in a
Status Report -2015 Page 7
phased manner, with special needs-based interventions to assist deprived communities
(eg Raute, Chepang, Mushahar and Badi), where significant numbers of children are
out-of-school; this will happen in close coordination with concerned ministries, local
authorities, I/NGOs and other stakeholders.
3. The current incentive scheme at both Basic and Secondary levels will continue to
support schooling of girls, Dalits, and children with disabilities as well as other
disadvantaged and marginalized communities.
4. NCED will develop and run teacher training programmes in MLE and disabled-friendly
teaching and learning along with Teacher Professional Development.
5. A comprehensive policy on Medium of Instruction (MoI) including the use of the mother
tongue, Nepali, and English will be formulated.
6. The results and recommendations of NASA reports will be implemented to improve the
quality of school education.
7. The Curriculum Development Centre will set-up the minimum achievement levels for
students in each Grade with specific focus on reading levels among students in Grades
1-3. For this the Government will expand the National Early Grade Reading Programme
(NEGRP). Similarly, learning achievement at community schools will be improved by
encouraging interschool partnerships to ensure equity in learning achievement. Student
learning will be supported through enhancing ICT in education.
8. The institutional capacity of REDs, DEOs, RCs and schools will be strengthened. The
role of School Supervisors and Resource Persons will be specified and they will have
performance contracts. The DoE will develop performance indicators to enhance the
performance of the RP/SS
9. Equitable access in Secondary level education (Grades 9-12) will be delivered based on
mapping, and gradually made free, including science education. Integration of Grades 9-
12 education policies, curriculum, examinations and training will be carried out in line
with the amended Education Act.
10. Prioritized Minimum Enabling Conditions (PMEC) will be ensured at all levels with a
focus on functioning girl‟s toilets, libraries and science laboratories at secondary level.
11. Necessary preparation will be made for the integration of soft-skills in the secondary
level curriculum and teachers training curriculum. Introduction of the pre-vocational
stream in secondary education will continue in 100 schools. CDC in collaboration with
CTEVT will develop and enforce the National Vocational Qualification Framework.
12. The existing supervision and monitoring system will be strengthened to provide general
and instructional support to Secondary schools. Initiatives will be undertaken to establish
result oriented monitoring and supervision system at all levels.
13. After publication of SLC results in each District, RED and at DOE, results will be

Status Report -2015 Page 8
reviewed and necessary remedial action taken for further improvement of SLC results.
District level indicators and targets will be set to improve SLC results and interventions
14. Basic literacy classes under LINEMC in each district will be concentrated in targeted
VDCs/ Municipalities so they can be declared fully literate.
15. On-going vocational programmes such as annexes in community schools, trade schools
in selected Districts with specialized trades/skills, and skills development, training and
certification programmes will continue. Based on experience gained from implementing
the soft skills curriculum in lower secondary level, necessary preparations will be made
for integrating soft-skills in the secondary curriculum.
16. In order to ensure the appropriate utilization of funds, the practices of financial and social
auditing will be tied to trimester funds release to schools as a mandatory provision.
17. Governance, accountability and transparency in the textbook printing and distribution
system will be further improved at all levels on a regular basis.
These strategic priorities were guidelines for accomplishing the overall programs and activities
of SSRP (2014-15).
1.8. Overall Issues and Challenges
ASIP (2014/15) identified some challenges to be resolved for the effective implementation of
targeted programs; these are negative aspects of program implementation, which hinder the
progress of programs in the field and with which managers must deal. Overall issues and
challenges for FY 2014/15 are outlined below:
1. Early Childhood Education and Development (ECED): There is a lack of overarching
cross-sector coordination of ECD, or recognition of the holistic scope that is needed to
ensure children‟s overall development. Improving overall management including
scientific, mapping based re-location of existing centers within VDCs and Districts is a
concern. Effective coordination, collaboration and support between and among different
ministries and district level authorities with local bodies and concerned stakeholders is
crucial. In addition to this, there is insufficient capacity to undertake adequate monitoring
and control of quality standards in ECED centers that are privately run or run with the
support of I/NGOs. It has been seen equally as a challenge to ensure sufficient human
and non-human resource management.
2. Lifelong Learning: Ensuring access to effective literacy and lifelong learning programs
for marginalized communities with low literacy rates has been a challenge. The
convergence of literacy programs with Income Generating Programmes (IGPs) is a need
of the newly literate but reaching remote and marginalized groups and offering locally
Status Report -2015 Page 9
appropriate programs, relevant to diverse local needs, including languages, culture and
local knowledge and value systems has been a challenge.
3. Access and Equity: Identification and ensuring equitable access to out-of-school
children is a challenge. Restructuring of schools‟, ensuring PMECs and MECs and
quality of curricular transactions in classroom settings is a major challenge. In the same
way, use of curriculum and learning materials and ensuring availability and use of
learning materials and textbooks in classrooms and schools is also a major concern. In
addition to this enhancing learning achievement and reading skills of basic level children
is a challenge to the government. Similarly, in spite of several efforts by the government,
dropouts and repetition rates in Grade 1 are still high, indicating that improving internal
efficiency in schools has been an ongoing challenge. The government has developed
the consolidated equity strategy with a view to providing education to children of all
sectors, with special interventions. However, resources gaps are still a huge challenge to
incorporation of programs and activities in this fiscal year, as suggested by the strategy.
Despite the timely and regular reporting of data, further effort is required to ensure
validity & reliability.
4. Teacher Management and Development: Teacher management, recruitment of
qualified teachers in schools on a regular basis, qualification upgrading of existing
teachers, and deployment and redeployment remain challenging tasks. Studies indicate
that the system needs to make further efforts to deliver priority areas such as continuous
assessment of students, classroom action research, and local curriculum development.
Similarly, it is a challenge to ensure that teachers transmit the skills they received in
training during interaction with students. Continuous opportunities to learn and sharing is
vital for teachers‟ professional development. This requires appropriate coordination
among Resource Centers, School Supervisors and training institutions.
5. Financial Management: The government is implementing a Financial Management
Implementation Action Plan (FMIAP) to improve the financial management system. The
internal audit system is supposed to be an important tool to maintain fiscal discipline,
internal control and the standard of programme outcomes by identifying and correcting
flaws and mismatches immediately. Though the monitoring and reporting system is in
place, improvement to the internal audit system is of crucial concern. The IEMIS system
is a critical tool for planning, financing, service delivery and reporting. Appropriate
resource allocation, proper utilization, quality auditing and timely reporting are the major
concerns of financial management and monitoring.
6. Capacity and Institutional Arrangement: The effective implementation of the SSRP
depends upon the capacity of concerned actors at all levels as well as clear-cut
implementation tools and adequate infrastructure support. Infrastructure development
Status Report -2015 Page 10
and capacity enhancement of the system is a challenge. Effective service delivery
requires capable human resources and well-functioning institutions. Due to the lack of
adequate capacity development and limited motivation, the system is facing many
challenges. The MOE has prepared an institutional strategy implementation plan, and
developed incentive schemes and different capacity development related initiatives to
encourage and motivate front line organizations and personnel, and these initiatives
require additional funding and proper planning and implementation. Therefore, detailed
planning, effective implementation and additional funds management are of critical
concern.
Accountability: The SSRP extension document stresses the need for accountability
and responsibility of stakeholders at all levels. There is a need for further improvement
to persuade all players to carry out their roles as expected by establishing a strong
internal control mechanism. In order to ensure effective and efficient implementation of
SSRP provisions, there is a need to make all stakeholders accountable through
developing such mechanisms as linking responsibilities and authorities to further
strengthen public accountability and transparency.
7. Technical Education and Vocational Training (TEVT): The implementation of TVET
as a separate stream is yet to materialize. Management and preparation of required
human resources, infrastructure development and expansion of the programme are
crucial concerns for technical education. Similarly, effective implementation, coordination
and collaboration between and among government, non-government organizations and
the private sector are some areas of challenge.
8. Monitoring: Several issues and challenges are associated with the existing monitoring
and evaluation system in the education sector. The share of resources channeled to
schools is continuously increasing. Proper management of resources including account
keeping, reporting and public disclosure of provided funds is of major concern.
Establishing results-based monitoring as an integral part of educational planning, and
management is a critical concern. Enhancing the quality of monitoring and school
supervision at schools and at classroom level is essential for better learning outcomes.
9. Resources: The SSRP extension document proposed a number of actions to be
implemented in the two-year period for effective implementation of the SSRP. The
implementation of key agreed actions needs further work and additional resources.
1.9. Allocated Budget and Expenditure
According to the Red Book (2014/2015) published by the Government of Nepal, the total
national budget allocated was NPR 618 bilion and 100 million for fiscal year FY 2014/2015, to

Status Report -2015 Page 11
implement national educational policies and programmes. The total national budget allocation
for FY 2014/2015 is given below in Table 1.
Table No. 1 Total National Budget Allocation in FY 2014/15 (in NPR)
SN Description Total amount Source of Budget
Nepal
Government
Foreign DPs grant Foreign DPs loan
1 Total national budget 618,100,000,000 495,185,306,000 73,385,924,000 49,528,770,000
2 Recurrent costs 398,951,195,000 348,766,638,000 45,880,897,000 4,303,660,000
3 Capital costs 116,755,042,000 71,870,334,000 24,262,419,000 20,622,289,000
4 Financial management costs 102,393,763,000 74,548,334,000 3,242,608,000 2,460,2821,000
5 Share of education budget 86,034,055,000 73,576,928,000 11,177,094,000 1,106,116,000
Of the total national budget, the share of recurrent costs allocated was about NPR 398 billion and 951 million (64.54%) while the percentage share of capital cost allocated was NPR 116 billion and 755 million (18.89%). The summary of the figures quoted in the budget speech for FY 2014/2015 is given in Table 2 below.
Table No. 2 Summary of the National Budget Allocation by Percentage in FY 2014/15, (NPR)
SN Description Total amount Source of Budget
Nepal Govt. Foreign DPs grant Foreign DPs loan
1 Total national Budget 100.00 80.11 11.87 8.01
2 Recurrent costs 64.54 56.43 7.42 0.70
3 Capital costs 18.89 11.63 3.93 3.34
4 Financial Management
Costs
16.57 12.06 0.52 3.98
5 Share of education budget 13.92 11.90 1.81 0.18
The economic growth rate was set at 5.5% and the money inflation rate was projected at 8% for fiscal year 2013/14. Of the total national budget, the share of foreign grants was NPR 12 billion and 283 million (19.89%). Of the total national budget, the percentage share of budget allocation to the education sector was NPR 85 billion and 34 million (13.92%). The total education budget was distributed across recurrent and capital costs, as presented in Table 3 below:
Table No.3 Total Allocation in Education Budget and Actual Expenditure for FY 2014/2015 (NPR)
Budget Head Head name
Budget Allocated in
Red Book
Actual Allocation of
Budget
Actual
Expenditure
Progress
%
350 Total education
budget 86,034,055,000 85,970,148,449.00 79,602,328,870.63 92.59

Status Report -2015 Page 12
Recurrent costs
85,860,138,000
(99.80%) 85,787,902,289 79,506,285,690.70 92.68%
Capital cost 173,917,000 (0.20%) 182,246,160.00 96,043,182.69 52.70%
According to the Red Book (2014/2015) by MOF, the entire education sector budget (NPR
86,034,055,000) for FY 2014/2015 was distributed into the following 32 sub-budget heads, to
serve the diversified needs of education and types of education from Pre-Primary to higher level
education, as given in Table 4 below:
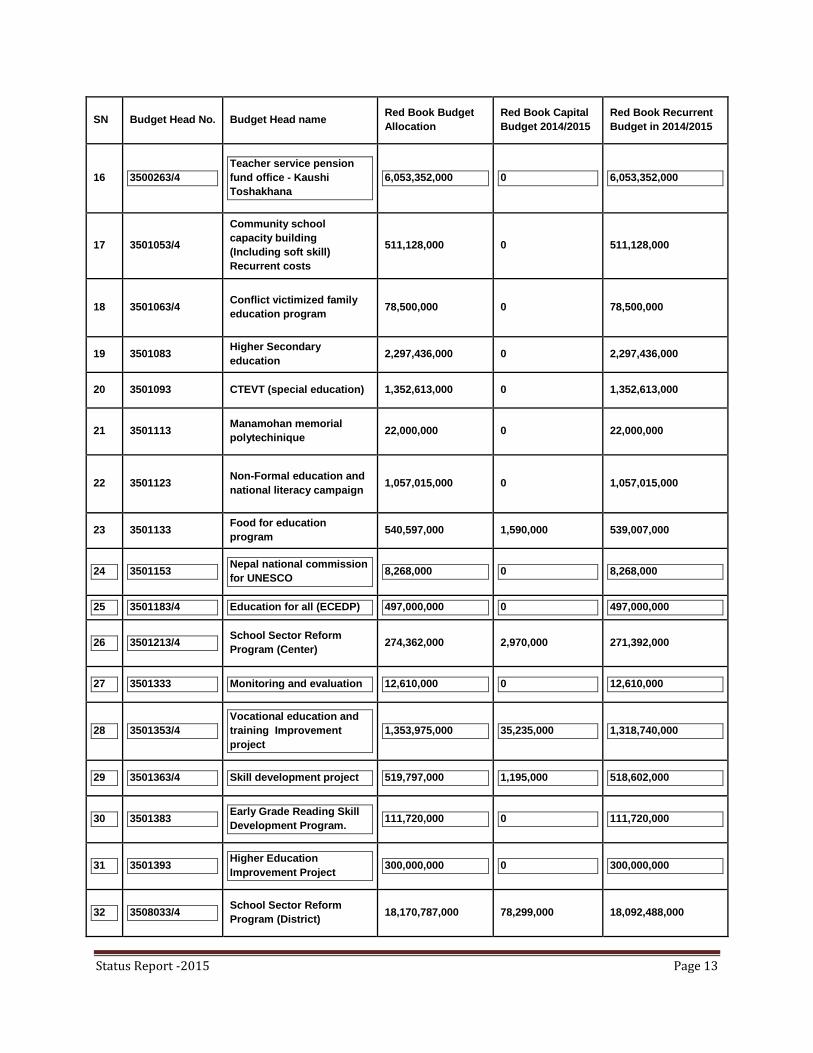
Table No. 4 Total Proposed Budget of Education on Red Book, FY.2014/2015
SN Budget Head No. Budget Head name Red Book Budget
Allocation
Red Book Capital
Budget 2014/2015
Red Book Recurrent
Budget in 2014/2015
1 3500113/4 Ministry of education 467,892,000 11,700,000 456,192,000
2 3500123 Department of education 54,918,000 0 54,918,000
3 350013 Regional education
directorate 61,638,000 0 61,638,000
4 3500143 District education office 6,319,851,000 0 6,319,851,000
5 3500153/4 Office of the controller of
school examination 371,011,000 1,000,000 370,011,000
6 3500163 Education for all (Primary
teacher salary) 28,883,975,000 0 28,883,975,000
7 350017
Lower Secondary and
Secondary level teacher
salary
15,407,005,000 0 15,407,005,000
8 3500183/4 Curriculum Development
Center 26,995,000 1,000,000 25,995,000
9 350019 University grant
commission 6,519,664,000 0 6,519,664,000
10 3500203/4 teacher service
commission 165,179,000 1,000,000.00 164,179,000
11 3500213/4 Non-Formal education
center 13,973,000 1,953,000 12,020,000
12 3500223/4 School teacher record
office 40,938,000 10,445,000 30,493,000
13 3500233/4 Special education council 102,995,000 20,000,000 82,995,000
14 3500243/4 National center for
educational development 118,004,000 6,980,000 111,024,000
15 3500253 Libraries (Dilliraman,
Keshar, National) 18,857,000 550,000 18,307,000
Status Report -2015 Page 13
SN Budget Head No. Budget Head name Red Book Budget
Allocation
Red Book Capital
Budget 2014/2015
Red Book Recurrent
Budget in 2014/2015
16 3500263/4
Teacher service pension
fund office - Kaushi
Toshakhana
6,053,352,000 0 6,053,352,000
17 3501053/4
Community school
capacity building
(Including soft skill)
Recurrent costs
511,128,000 0 511,128,000
18 3501063/4 Conflict victimized family
education program 78,500,000 0 78,500,000
19 3501083 Higher Secondary
education 2,297,436,000 0 2,297,436,000
20 3501093 CTEVT (special education) 1,352,613,000 0 1,352,613,000
21 3501113 Manamohan memorial
polytechinique 22,000,000 0 22,000,000
22 3501123 Non-Formal education and
national literacy campaign 1,057,015,000 0 1,057,015,000
23 3501133 Food for education
program 540,597,000 1,590,000 539,007,000
24 3501153 Nepal national commission
for UNESCO 8,268,000 0 8,268,000
25 3501183/4 Education for all (ECEDP) 497,000,000 0 497,000,000
26 3501213/4 School Sector Reform
Program (Center) 274,362,000 2,970,000 271,392,000
27 3501333 Monitoring and evaluation 12,610,000 0 12,610,000
28 3501353/4
Vocational education and
training Improvement
project
1,353,975,000 35,235,000 1,318,740,000
29 3501363/4 Skill development project 519,797,000 1,195,000 518,602,000
30 3501383 Early Grade Reading Skill
Development Program. 111,720,000 0 111,720,000
31 3501393 Higher Education
Improvement Project 300,000,000 0 300,000,000
32 3508033/4 School Sector Reform
Program (District) 18,170,787,000 78,299,000 18,092,488,000
Status Report -2015 Page 14
SN Budget Head No. Budget Head name Red Book Budget
Allocation
Red Book Capital
Budget 2014/2015
Red Book Recurrent
Budget in 2014/2015
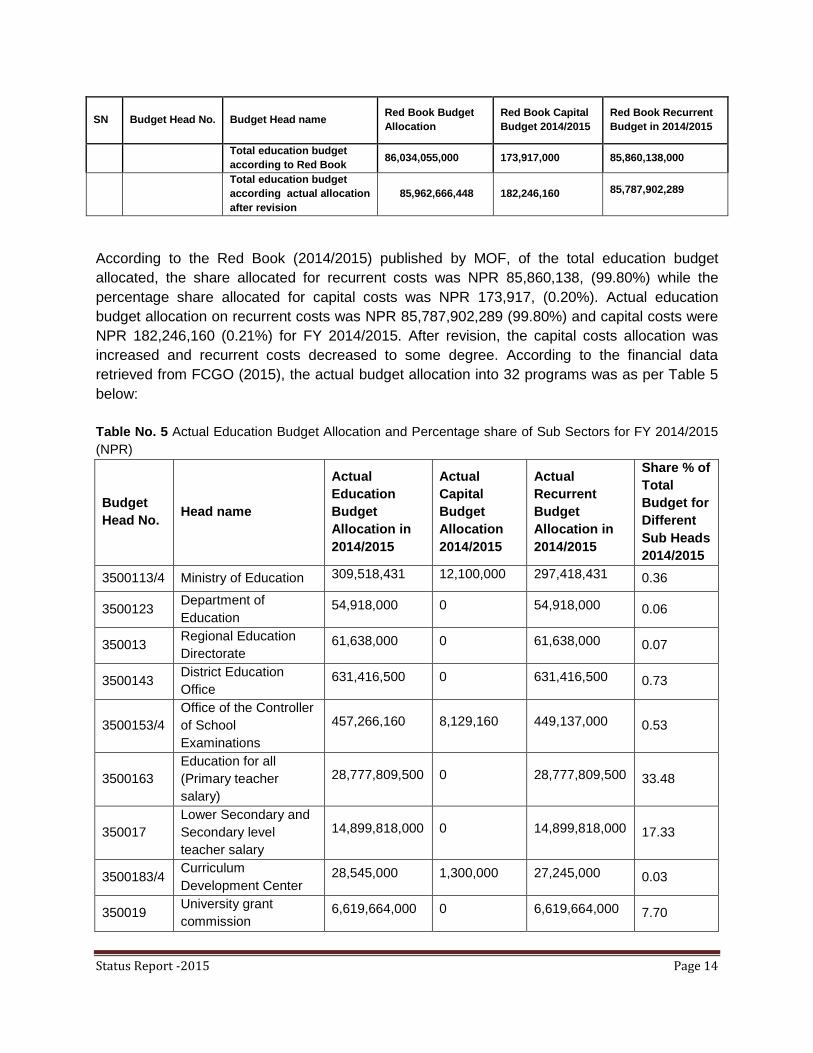
Total education budget
according to Red Book 86,034,055,000 173,917,000 85,860,138,000
Total education budget
according actual allocation
after revision
85,962,666,448 182,246,160 85,787,902,289
According to the Red Book (2014/2015) published by MOF, of the total education budget
allocated, the share allocated for recurrent costs was NPR 85,860,138, (99.80%) while the
percentage share allocated for capital costs was NPR 173,917, (0.20%). Actual education
budget allocation on recurrent costs was NPR 85,787,902,289 (99.80%) and capital costs were
NPR 182,246,160 (0.21%) for FY 2014/2015. After revision, the capital costs allocation was
increased and recurrent costs decreased to some degree. According to the financial data
retrieved from FCGO (2015), the actual budget allocation into 32 programs was as per Table 5
below:
Table No. 5 Actual Education Budget Allocation and Percentage share of Sub Sectors for FY 2014/2015
(NPR)
Budget
Head No. Head name
Actual
Education
Budget
Allocation in
2014/2015
Actual
Capital
Budget
Allocation
2014/2015
Actual
Recurrent
Budget
Allocation in
2014/2015
Share % of
Total
Budget for
Different
Sub Heads
2014/2015
3500113/4 Ministry of Education 309,518,431 12,100,000 297,418,431 0.36
3500123 Department of
Education 54,918,000 0 54,918,000 0.06
350013 Regional Education
Directorate 61,638,000 0 61,638,000 0.07
3500143 District Education
Office 631,416,500 0 631,416,500 0.73
3500153/4
Office of the Controller
of School
Examinations
457,266,160 8,129,160 449,137,000 0.53
3500163
Education for all
(Primary teacher
salary)
28,777,809,500 0 28,777,809,500 33.48
350017
Lower Secondary and
Secondary level
teacher salary
14,899,818,000 0 14,899,818,000 17.33
3500183/4 Curriculum
Development Center 28,545,000 1,300,000 27,245,000 0.03
350019 University grant
commission 6,619,664,000 0 6,619,664,000 7.70

Status Report -2015 Page 15
Budget
Head No. Head name
Actual
Education
Budget
Allocation in
2014/2015
Actual
Capital
Budget
Allocation
2014/2015
Actual
Recurrent
Budget
Allocation in
2014/2015
Share % of
Total
Budget for
Different
Sub Heads
2014/2015
3500203/4 Teacher service
commission 165,179,000 1,000,000 164,179,000 0.19
3500213/4 Non-Formal education
center 13,973,000 1,953,000 12,020,000 0.02
3500223/4 School teacher record
office 1,040,338,000 9,845,000 1,030,493,000 1.21
3500233/4 Special education
council 110,182,000 20,000,000 90,182,000 0.13
3500243/4
National Center for
Educational
Development
118,770,898 6,980,000 111,790,898 0.14
3500253 Libraries (Dilliraman,
Keshar, National) 19,712,000 850,000 18,862,000 0.02
3500263/4
Teacher service
pension fund office -
Kaushi Toshakhana
6,053,352,000 0 6,053,352,000 7.04
3501053/4
Community school
capacity building
(including soft skills)
recurrent costs
511,128,000 0 511,128,000 0.59
3501063/4
Conflict Victimized
Family Education
Program
78,500,000 0 78,500,000 0.09
3501083 Higher Secondary
education 1,697,436,000 0 1,697,436,000 1.97
3501093 CTEVT (special
education) 1,352,613,000 0 1,352,613,000 1.57
3501113 Manamohan Memorial
Polytechinique 32,000,000 0 32,000,000 0.04
3501123
Non-Formal education
and national literacy
campaign
1,044,693,000 0 1,044,693,000 1.22
3501133 Food for Education
program 541,197,000 1,590,000 539,607,000 0.63
3501153
Nepal national
commission for
UNESCO
8,268,000 0 8,268,000 0.01
3501183/4 Education for all
(ECEDP) 497,000,000 0 497,000,000 0.58
3501213/4 School Sector Reform
Program (Center) 284,668,960 3,770,000 280,898,960 0.33
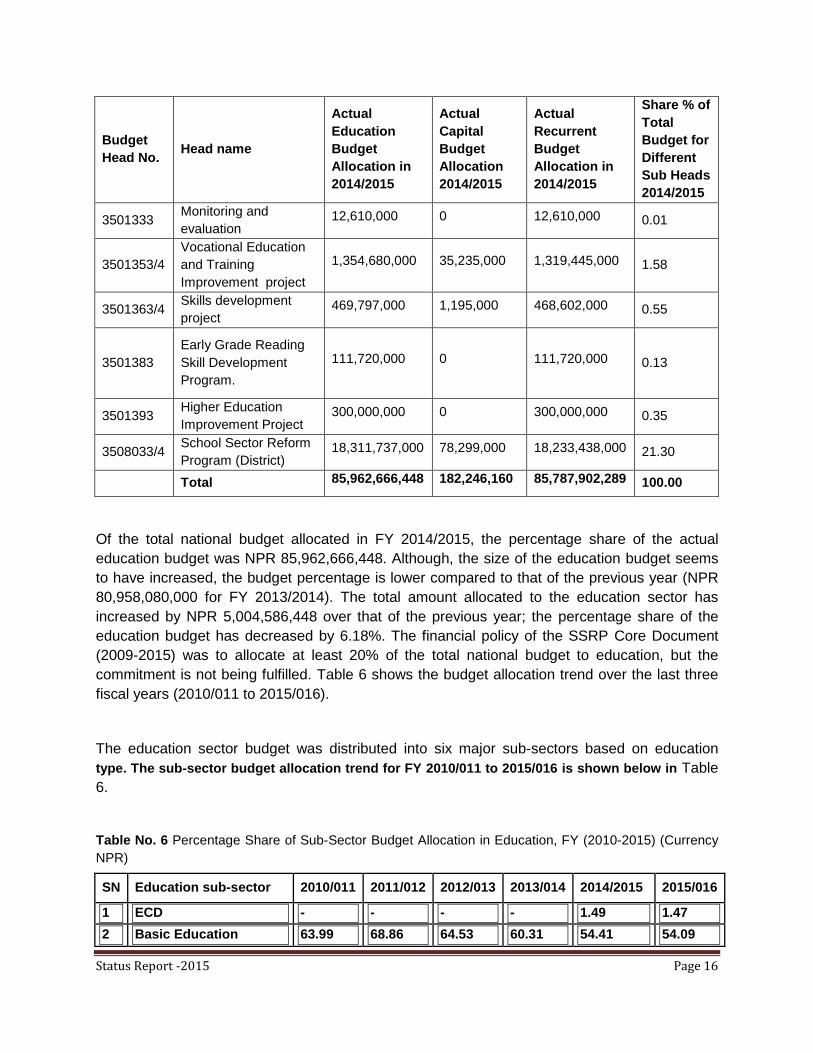
Status Report -2015 Page 16
Budget
Head No. Head name
Actual
Education
Budget
Allocation in
2014/2015
Actual
Capital
Budget
Allocation
2014/2015
Actual
Recurrent
Budget
Allocation in
2014/2015
Share % of
Total
Budget for
Different
Sub Heads
2014/2015
3501333 Monitoring and
evaluation 12,610,000 0 12,610,000 0.01
3501353/4
Vocational Education
and Training
Improvement project
1,354,680,000 35,235,000 1,319,445,000 1.58
3501363/4 Skills development
project 469,797,000 1,195,000 468,602,000 0.55
3501383
Early Grade Reading
Skill Development
Program.
111,720,000 0 111,720,000 0.13
3501393 Higher Education
Improvement Project 300,000,000 0 300,000,000 0.35
3508033/4 School Sector Reform
Program (District) 18,311,737,000 78,299,000 18,233,438,000 21.30
Total 85,962,666,448 182,246,160 85,787,902,289 100.00
Of the total national budget allocated in FY 2014/2015, the percentage share of the actual
education budget was NPR 85,962,666,448. Although, the size of the education budget seems
to have increased, the budget percentage is lower compared to that of the previous year (NPR
80,958,080,000 for FY 2013/2014). The total amount allocated to the education sector has
increased by NPR 5,004,586,448 over that of the previous year; the percentage share of the
education budget has decreased by 6.18%. The financial policy of the SSRP Core Document
(2009-2015) was to allocate at least 20% of the total national budget to education, but the
commitment is not being fulfilled. Table 6 shows the budget allocation trend over the last three
fiscal years (2010/011 to 2015/016).
The education sector budget was distributed into six major sub-sectors based on education
type. The sub-sector budget allocation trend for FY 2010/011 to 2015/016 is shown below in Table
6.
Table No. 6 Percentage Share of Sub-Sector Budget Allocation in Education, FY (2010-2015) (Currency
NPR)
SN Education sub-sector 2010/011 2011/012 2012/013 2013/014 2014/2015 2015/016
1 ECD - - - - 1.49 1.47
2 Basic Education 63.99 68.86 64.53 60.31 54.41 54.09
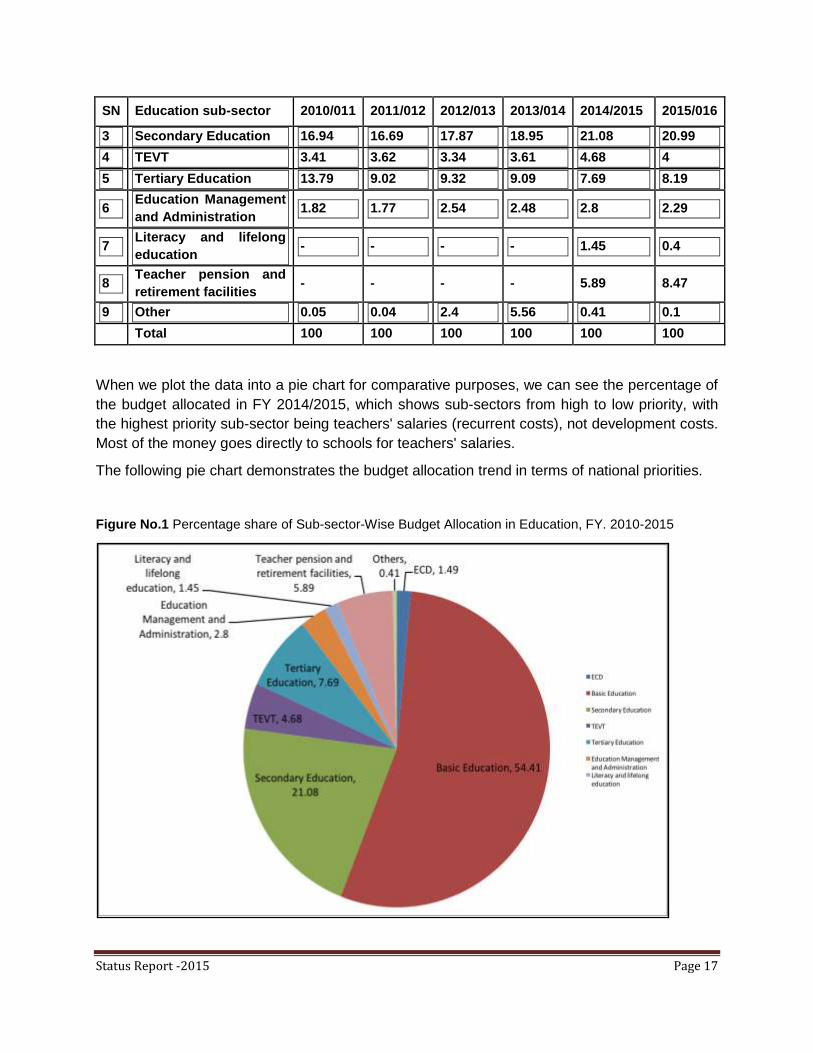
Status Report -2015 Page 17
SN Education sub-sector 2010/011 2011/012 2012/013 2013/014 2014/2015 2015/016
3 Secondary Education 16.94 16.69 17.87 18.95 21.08 20.99
4 TEVT 3.41 3.62 3.34 3.61 4.68 4
5 Tertiary Education 13.79 9.02 9.32 9.09 7.69 8.19
6 Education Management
and Administration 1.82 1.77 2.54 2.48 2.8 2.29
7 Literacy and lifelong
education - - - - 1.45 0.4
8 Teacher pension and
retirement facilities - - - - 5.89 8.47
9 Other 0.05 0.04 2.4 5.56 0.41 0.1
Total 100 100 100 100 100 100
When we plot the data into a pie chart for comparative purposes, we can see the percentage of
the budget allocated in FY 2014/2015, which shows sub-sectors from high to low priority, with
the highest priority sub-sector being teachers' salaries (recurrent costs), not development costs.
Most of the money goes directly to schools for teachers' salaries.
The following pie chart demonstrates the budget allocation trend in terms of national priorities.
Figure No.1 Percentage share of Sub-sector-Wise Budget Allocation in Education, FY. 2010-2015

Status Report -2015 Page 18
A large amount (54.41%) of the total budget was allocated to Basic education. Secondary
education received the second highest budget allocation (21.08%), Tertiary education third
(7.69%), teachers' pension fourth (5.89%), and Technical Education and Vocational Training
(TEVT) fifth (4.68%). Administrative costs, literacy and ECD were deemed lower priority areas.
Table No. 7 Trend of Budget Flow since FYs 2011/12 to 2015/016 (NPR in Thousand and Dollar in
Million)
S
N Description
Allocation FY
2011/012
Allocation FY
2012/013
Allocation FY
2013/014
Allocation FY
2014/2015
Allocation FY
2014/2015
Amount % Amount % Amount % Amount % Amount %
1 Total national budget
(NPR) 33,916,785,000 100
370,126,328,00
0 100
51,724,00
00 100
618,100,000,
000
10
0
819,468,
884
10
0
2 Share of Education Sector
Budget (NPR) 63,918,839
16.6
1 63,431,397
15.6
7
80,958,08
0
15.6
5
85,970,148,4
49
13.
93
98,642,8
26
12.
04
3
Total SSR Pooling budget
in total education sector
budget (in N PRs)
51,926,210 81.2
4 51,984,824
81.9
5
67,098,70
4
82.8
8
70,003,006,4
60
81.
43
81,591,6
56
82.
71
4 Pooling budget total
(in USD million) 721.2
81.
42 604.47
81.9
5 771.25
82.8
8 826.51
81.
43 807.84
82.
71
5 Government share of
pooling (NPR 39,577,416
76.2
2 41,779,177
65.8
7
52,282,17
7
77.9
2
6,442,558,88
5
86.
61
69,600,0
39
85.
3
6 Government share of
pooling (in USD million) 549.69
76.
22 485.8
65.8
7 600.94
77.9
2 715.84
86.
61 689.11
85.
3
7 DPs share of pooling
budget (NPR) 12,348,794
23.7
8 10,205,647
19.6
3
14,816,52
7
22.0
8 9,960,222.15
13.
39
11,991,6
17
14.
7
8 DPs share of pooling
budget USD million 171.51
23.
78 118.67
19.6
3 170.3
22.0
8 110.67
13.
39 118.73
14.
7
The School Sector Reform Program received two types of budget financing, pooling and non-
pooling. The pooled fund was guided by the Joint Financial Arrangement (JFA), agreed upon by
the pooled financing Development Partners (DPs). The DOE coordinated with Central level
agencies (National Center for Educational Development (NCED), Curriculum Development
Center (CDC), Office of the Controller of Examinations at school level (SOCE), Education
Review Office (ERO), School Teachers Record Office (STRO), EVENT, Food for Education,
Non-formal Education Centre (NFEC), and Higher Secondary Education Board (HSEB).
Based on the Red Book for FY 2014/2015, of the total education budget (NPR 86,034,055,000)
in FY 2014/2015, only NPR 69,458,515,000 was allocated to the School Sector Reform
Programme (SSRP) pooling budget. The budget was later adjusted by the DOE and NPR
70,003,006,460 was released to DEOs, REDs, DOE and CLAs for implementation.
Table No. 8 Total SSRP Pooling Budget Allocation and Actual Expenditure for FY 2014-2015 (NPR)
SN Budget Sub-
Head No. Name of program
Initial Red
Book Budget
Actual
Released
Budget
Actual
Expenditure
Percentage
of Financial
Progress
Against
Released
Budget
1 3500163 Education for all (Primary
teacher salary) 28,883,975,00
28,777,809,500.
00
28,008,030,096.
65 97.33

Status Report -2015 Page 19
SN Budget Sub-
Head No. Name of program
Initial Red
Book Budget
Actual
Released
Budget
Actual
Expenditure
Percentage
of Financial
Progress
Against
Released
Budget
0
2 3500173 Lower Secondary and
Secondary teacher Salary
15,407,005,00
0 14,899,818,000.
00
14,249,103,367.
58 95.63
3 3500213 Non-Formal education
(Recurrent costs) 12,020,000 12,020,000 12,429,116 103.4
4 3500214 Non-Formal education (Capital
cost) 1,953,000 1,953,000.00 1,688,429.00 86.45
5 3500223 School teacher record office 30,493,000 1,030,493,000 803,868,312.6 78.01
6 3500224 School teacher record office 10,445,000 9,845,000.00 2,725,079.00 27.68
7 3500233 Special education council 82,995,000 90,182,000 81,776,227 90.68
8 3500234 Special education council 20,000,000 20,000,000.00 0 0
9 3500263 Teacher service pension fund
office-Kaushi Toshakhana 6,053,352,000 6,053,352,000.0
0
6,064,951,434.9
6 100.19
10 3501053
Community school capacity
building (Including soft skill)
recurrent costs
511,128,000 511,128,000.00 200,203,480.24 39.17
11 3501213
School Sector Reform
Program (Center level)
recurrent costs
271,392,000 280,898,960 159,209,220.00 56.68
12 3501214
School Sector Reform
Program (Center level) capital
costs
2,970,000 3,770,000.00 590,990.00 15.68
13 3508033
School Sector Reform
Program (District level)
recurrent costs.
18,092,488,00
0 18,233,438,000.
00
15,728,498,228.
16 86.26
14 3508034
School Sector Reform
Program (District level) capital
costs
78,299,000 78,299,000.00 51,780,652.76 66.13
Total 69,458,515,00
0 70,003,006,460.
00
65,364,854,633.
95 93.37
According to the program Implementation Progress Report (IPR-2014/15) and Status Report
submitted by DEOs, REDs and CLAs to DOE, NPR 65,364,854,633 (93.37%) was the total
expenditure.
The non-pooled funding DPs were the Government of Japan, UNESCO, UNICEF, USAID and
WFP. Non-pooling Development Partners have supported the technical & financial
implementation of the SSRP, with targeted support by UNESCO towards capacity building,
quality and girls‟ education by UNICEF, and the midday meal and nutrition program by WFP,
while the Save the Children Alliance, World Education and other I/NGOs have provided
complementary support to MOE‟s regular programs.
The SSRP pooling budget for FY 2014/2015 was allocated into main sub-program heads for
implementation, seen below in Table 9 and in Figure 2.
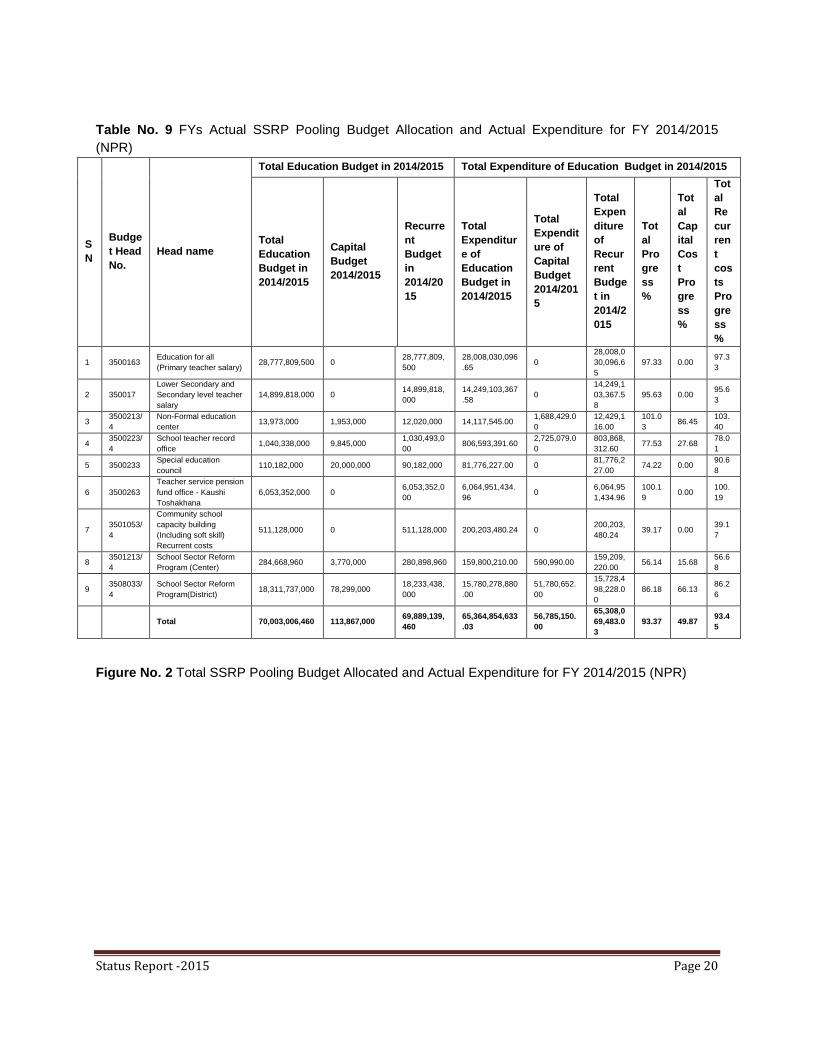
Status Report -2015 Page 20
Table No. 9 FYs Actual SSRP Pooling Budget Allocation and Actual Expenditure for FY 2014/2015
(NPR)
S
N
Budge
t Head
No.
Head name
Total Education Budget in 2014/2015 Total Expenditure of Education Budget in 2014/2015
Total
Education
Budget in
2014/2015
Capital
Budget
2014/2015
Recurre
nt
Budget
in
2014/20
15
Total
Expenditur
e of
Education
Budget in
2014/2015
Total
Expendit
ure of
Capital
Budget
2014/201
5
Total
Expen
diture
of
Recur
rent
Budge
t in
2014/2
015
Tot
al
Pro
gre
ss
%
Tot
al
Cap
ital
Cos
t
Pro
gre
ss
%
Tot
al
Re
cur
ren
t
cos
ts
Pro
gre
ss
%
1 3500163 Education for all
(Primary teacher salary) 28,777,809,500 0
28,777,809,
500
28,008,030,096
.65 0
28,008,0
30,096.6
5
97.33 0.00 97.3
3
2 350017
Lower Secondary and
Secondary level teacher
salary
14,899,818,000 0 14,899,818,
000
14,249,103,367
.58 0
14,249,1
03,367.5
8
95.63 0.00 95.6
3
3 3500213/
4
Non-Formal education
center 13,973,000 1,953,000 12,020,000 14,117,545.00
1,688,429.0
0
12,429,1
16.00
101.0
3 86.45
103.
40
4 3500223/
4
School teacher record
office 1,040,338,000 9,845,000
1,030,493,0
00 806,593,391.60
2,725,079.0
0
803,868,
312.60 77.53 27.68
78.0
1
5 3500233 Special education
council 110,182,000 20,000,000 90,182,000 81,776,227.00 0
81,776,2
27.00 74.22 0.00
90.6
8
6 3500263
Teacher service pension
fund office - Kaushi
Toshakhana
6,053,352,000 0 6,053,352,0
00
6,064,951,434.
96 0
6,064,95
1,434.96
100.1
9 0.00
100.
19
7 3501053/
4
Community school
capacity building
(Including soft skill)
Recurrent costs
511,128,000 0 511,128,000 200,203,480.24 0 200,203,
480.24 39.17 0.00
39.1
7
8 3501213/
4
School Sector Reform
Program (Center) 284,668,960 3,770,000 280,898,960 159,800,210.00 590,990.00
159,209,
220.00 56.14 15.68
56.6
8
9 3508033/
4
School Sector Reform
Program(District) 18,311,737,000 78,299,000
18,233,438,
000
15,780,278,880
.00
51,780,652.
00
15,728,4
98,228.0
0
86.18 66.13 86.2
6
Total 70,003,006,460 113,867,000 69,889,139,
460
65,364,854,633
.03
56,785,150.
00
65,308,0
69,483.0
3
93.37 49.87 93.4
5
Figure No. 2 Total SSRP Pooling Budget Allocated and Actual Expenditure for FY 2014/2015 (NPR)

Status Report -2015 Page 21
Table 10 Share percentage of the budget under SSRP pooling budget heads
Of the total SSRP pooling budget the recurrent costs allocation was NPR 69,889,139,460 and
actual expenditure on recurrent costs was NPR 65,308,069,483.03 (93.45%); the portion of
capital costs allocated was NPR 113,867,000 and expenditure on capital costs was
NPR,56,785,150.00 (49.87%) for FY 2014/2015.
The highest percentage share of the SSRP pooling budget was allocated to Primary teachers‟
salaries at 41.11%. The percentage share of the SSRP pooling budget for the SSRP (District
level) was the second highest at 26.16%, and Lower Secondary and Secondary teacher salaries
were third at 21.28%. The percentage share of the SSRP pooling budget for teachers' pension
was 8.65%.
Technical Education and Vocational Training received the lowest level of investment with 0.41%
of the total SSRP pooling budget. The SSRP (Central level) likewise received a very low
percentage share at 0.41%. Special education and non-formal education also received low
priority in the budget allocation. The Physical and Financial Progress rates for the SSRP pooling
budget is shown in the following figure:
Figure - 3 Physical Progress Rate and Financial Progress Rate (for the SSRP Pooling Budget)
SSRP Budget
Heads
EFA
(Pri.
teacher
salary)
L/SL
teacher
salary
NFE TRO Special
education
Teacher
pension
CSCDP-
TEVT
SSRP
(Center)
SSRP
(District)
Total
Share % of budget 41.11 21.28 0.02 1.49 0.16 8.65 0.73 0.41 26.16 100

Status Report -2015 Page 22
The budget released through the Department of Education to the DEOs, REDs, and CLAs has
six (6) SSRP pooling budget sub-heads as well as six other sub-heads for the fiscal year
2014/2015. All DEOs, REDs and other Central agencies have implemented the budget and
activities in the fields given in the table below.
Initially, the Red Book (2014/2015) had allocated a total of NPR 72,692,815,000 for 12 budget
heads to the programs whose budget flows through the Department of Education to the DEOs,
REDs and other CLAs. Of this, NPR 72,591,546,000 was for recurrent costs and NPR
101,269,000 was for the capital costs of those programs.
Table No. 11 Total Budget Allocated in Red Book for 12 Programs Implemented through DOE for FY
2014/2015 (NPR)
SN Budget Head
No. Budget Head Name
Red Book Budget
Allocation
Red Book Capital
Budget
2014/2015
Red Book Recurrent
Budget in 2014/2015
1 3500123 Department of
Education 54,918,000 0 54,918,000
2 350013 Regional Education
Directorate 61,638,000 0 61,638,000
3 3500143 District Education
Office 6,319,851,000 0 6,319,851,000
4 3500163
Education for all
(Primary teacher
salary)
28,883,975,000 0 28,883,975,000
5 350017
Lower Secondary and
Secondary level
teacher salary
15,407,005,000 0 15,407,005,000
6 3500233/4 Special education
council 102,995,000 20,000,000 82,995,000

Status Report -2015 Page 23
SN Budget Head
No. Budget Head Name
Red Book Budget
Allocation
Red Book Capital
Budget
2014/2015
Red Book Recurrent
Budget in 2014/2015
7 3501053/4
Community school
capacity building
(Including soft skill)
Recurrent costs
511,128,000 0 511,128,000
8 3501083 Higher Secondary
education 2,297,436,000 0 2,297,436,000
9 3501183/4 Education for all
(ECEDP) 497,000,000 0 497,000,000
10 3501213/4 School Sector Reform
Program (Center) 274,362,000 2,970,000 271,392,000
11 3508033/4 School Sector Reform
Program(District) 18,170,787,000 78,299,000 18,092,488,000
12 3501383
Early Grade Reading
Skill Development
Program.
111,720,000 0 111,720,000
Total 72,692,815,000 101,269,000 72,591,546,000
The overall progress on Physical and Financial aspects of the twelve programs implemented
through DOE has been satisfactory. Based on the Red Book for fiscal year 2014/2015, the total
budget allocated for the 12 programs delivered through DOE was NPR 72,692,815,000.
However after confirmation of the DPs pro-rata share the actual allocation was NPR
18,569,405,780. From this the total expenditure on the 12 programs delivered through DOE was
NPR 15,940,079,090 (85.72%).
The following table demonstrates the overall financial and Physical Progress rates of the 12 programs
delivered through DOE.
Table No. 12 Physical Progress Rate (PPR) and Financial Progress Rate (FPR) of Twelve Different
Budget's Released through DOE (both for Recurrent and Capital Cost) for FY 2014/2015
SN
Budget
Head
No.
Budget Title
Name
Estimated / Allocated Budget Actual expenditure Budget Progress
Percentage
Capital
Cost
Recurrent
costs Total
Capit
al
Cost
Recurrent
costs Total
Cap
ital
Cos
t
Recu
rrent
cost
s
T
ot
al
1 350012
3
Department of
education 0 54,918,000 54,918,000 0
48,938,36
9.58
48,938,36
9.58 0.00 89.11
89
.1
1
2 350013
3
Regional
education
directorate
0 61,638,000 61,638,000 0 51,211,39
2.27
51,211,39
2.27 0.00 83.08
83
.0
8
3 350014
3
District
education offices 0 631,416,500 631,416,500 0
592,690,0
41.17
592,690,0
41.17 0.00 93.87
93
.8
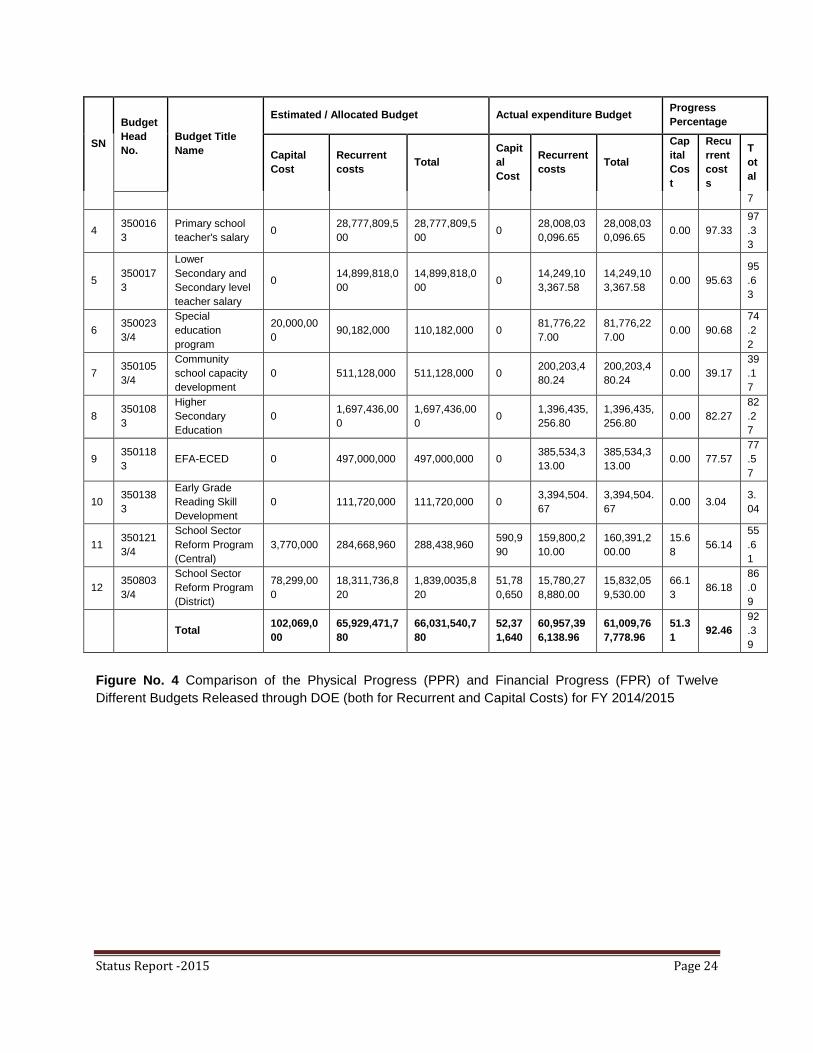
Status Report -2015 Page 24
SN
Budget
Head
No.
Budget Title
Name
Estimated / Allocated Budget Actual expenditure Budget Progress
Percentage
Capital
Cost
Recurrent
costs Total
Capit
al
Cost
Recurrent
costs Total
Cap
ital
Cos
t
Recu
rrent
cost
s
T
ot
al
7
4 350016
3
Primary school
teacher's salary 0
28,777,809,5
00
28,777,809,5
00 0
28,008,03
0,096.65
28,008,03
0,096.65 0.00 97.33
97
.3
3
5 350017
3
Lower
Secondary and
Secondary level
teacher salary
0 14,899,818,0
00
14,899,818,0
00 0
14,249,10
3,367.58
14,249,10
3,367.58 0.00 95.63
95
.6
3
6 350023
3/4
Special
education
program
20,000,00
0 90,182,000 110,182,000 0
81,776,22
7.00
81,776,22
7.00 0.00 90.68
74
.2
2
7 350105
3/4
Community
school capacity
development
0 511,128,000 511,128,000 0 200,203,4
80.24
200,203,4
80.24 0.00 39.17
39
.1
7
8 350108
3
Higher
Secondary
Education
0 1,697,436,00
0
1,697,436,00
0 0
1,396,435,
256.80
1,396,435,
256.80 0.00 82.27
82
.2
7
9 350118
3 EFA-ECED 0 497,000,000 497,000,000 0
385,534,3
13.00
385,534,3
13.00 0.00 77.57
77
.5
7
10 350138
3
Early Grade
Reading Skill
Development
0 111,720,000 111,720,000 0 3,394,504.
67
3,394,504.
67 0.00 3.04
3.
04
11 350121
3/4
School Sector
Reform Program
(Central)
3,770,000 284,668,960 288,438,960 590,9
90
159,800,2
10.00
160,391,2
00.00
15.6
8 56.14
55
.6
1
12 350803
3/4
School Sector
Reform Program
(District)
78,299,00
0
18,311,736,8
20
1,839,0035,8
20
51,78
0,650
15,780,27
8,880.00
15,832,05
9,530.00
66.1
3 86.18
86
.0
9
Total 102,069,0
00
65,929,471,7
80
66,031,540,7
80
52,37
1,640
60,957,39
6,138.96
61,009,76
7,778.96
51.3
1 92.46
92
.3
9
Figure No. 4 Comparison of the Physical Progress (PPR) and Financial Progress (FPR) of Twelve
Different Budgets Released through DOE (both for Recurrent and Capital Costs) for FY 2014/2015

Status Report -2015 Page 25
The Department of Education achieved 95% Physical Progress Rate and 92.46% Financial
Progress across the 12 programs implemented through it, with teacher salaries being the
highest. The Community School Capacity Development Program (CSCDP),TEVT and EGRP
had the lowest progress among the twelve programs delivered.
The actual recurrent costs were NPR 65,847,402,960 after confirmation of DPs pro-rata share
and out of this the total expenditure on the 12 programs delivered through DOE was NPR
60,905,024,497.
Table No.13 Actual Recurrent Budget Allocation across 12 Programs Implemented through DOE and
Actual Expenditure for FY 2014/2015 (NPR)
SN Budget Head
No. Head name
Recurrent Budget
in 2014/2015
Total Expenditure
of Recurrent
Budget in
2014/2015
Physical
Progress
s %
Total
Recurren
t costs
Progress
%
1 3500123 Department of education 54,918,000 48,938,369.58 90 89.11
2 3500133 Regional education directorate 61,638,000 51,211,392.27 84 83.08
3 3500143 District education office 631,416,500 592,690,041.2 94 93.87
4 3500163 Education for all (Primary
teacher salary) 28,777,809,500 28,008,030,097 98 97.33
5 350017 Lower Secondary and
Secondary level teacher salary 14,899,818,000 14,249,103,368 96 95.63
6 3500233 Special education council 90,182,000 81,776,227 91 90.68
7 3501053
Community school capacity
building (Including soft skill)
Recurrent costs
511,128,000 200,203,480.2 40 39.17
8 3501083 Higher Secondary education 1,697,436,000 1,396,435,257 82 82.27
9 3501183 Education for all (ECEDP) 497,000,000 385,534,313 80 77.57
10 3501213 School Sector Reform Program
(Center) 280,898,960 159,209,220 74.10 56.68
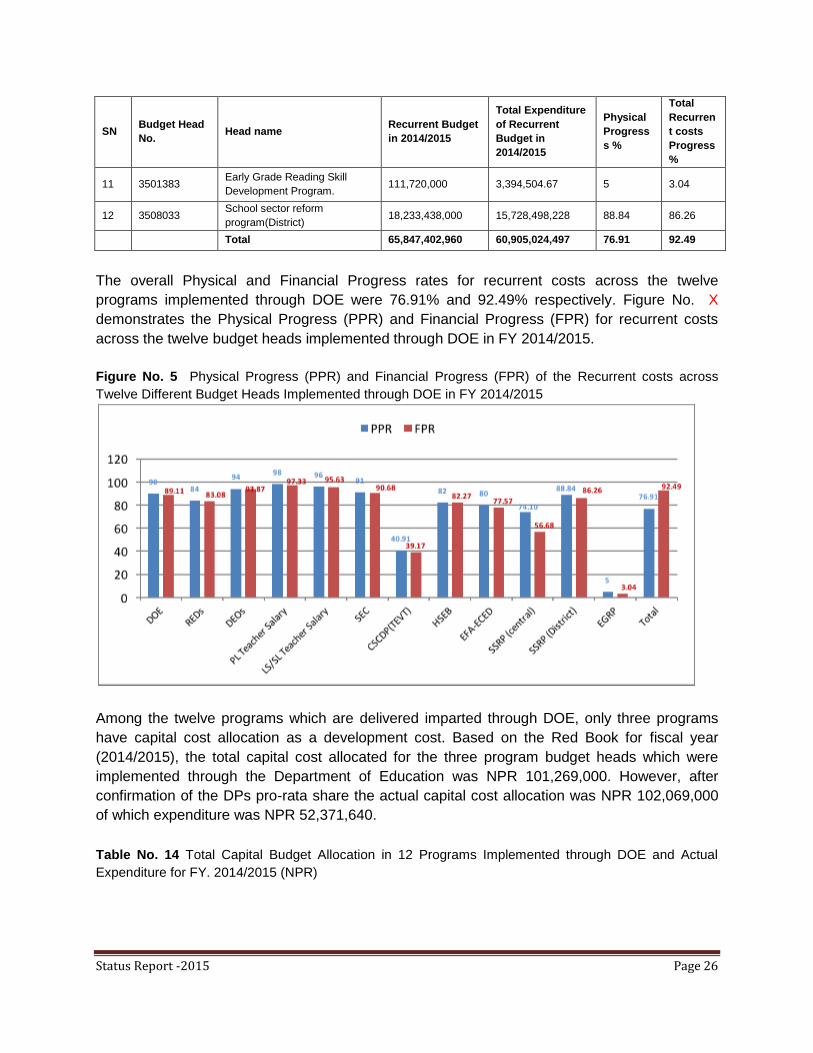
Status Report -2015 Page 26
SN Budget Head
No. Head name
Recurrent Budget
in 2014/2015
Total Expenditure
of Recurrent
Budget in
2014/2015
Physical
Progress
s %
Total
Recurren
t costs
Progress
%
11 3501383 Early Grade Reading Skill
Development Program. 111,720,000 3,394,504.67 5 3.04
12 3508033 School sector reform
program(District) 18,233,438,000 15,728,498,228 88.84 86.26
Total 65,847,402,960 60,905,024,497 76.91 92.49
The overall Physical and Financial Progress rates for recurrent costs across the twelve
programs implemented through DOE were 76.91% and 92.49% respectively. Figure No. X
demonstrates the Physical Progress (PPR) and Financial Progress (FPR) for recurrent costs
across the twelve budget heads implemented through DOE in FY 2014/2015.
Figure No. 5 Physical Progress (PPR) and Financial Progress (FPR) of the Recurrent costs across
Twelve Different Budget Heads Implemented through DOE in FY 2014/2015
Among the twelve programs which are delivered imparted through DOE, only three programs
have capital cost allocation as a development cost. Based on the Red Book for fiscal year
(2014/2015), the total capital cost allocated for the three program budget heads which were
implemented through the Department of Education was NPR 101,269,000. However, after
confirmation of the DPs pro-rata share the actual capital cost allocation was NPR 102,069,000
of which expenditure was NPR 52,371,640.
Table No. 14 Total Capital Budget Allocation in 12 Programs Implemented through DOE and Actual
Expenditure for FY. 2014/2015 (NPR)

Status Report -2015 Page 27
Budget Head
No. Head name
Capital Budget
2014/2015
Total Expenditure
of Capital Budget
2014/2015
Total Physical
Progress on
Capital Cost
%
Total Financial
Progress on
Capital Cost %
3500234 Special education
council 20,000,000 0 0 0
3501214 School Sector Reform
Program (Center) 3,770,000 590,990 20.29 15.68
3508034 School Sector Reform
Program(District) 78,299,000 51,780,650 84.89 66.13
Total 102,069,000 52,371,640 35.06 51.31
The Physical Progress rate of 35.06% and Financial Progress rate of 51.31% was for the capital
cost of three programs implemented through DOE. The overall Physical and Financial Progress
rates for capital costs of the three program budget heads implemented through DOE are
relatively low. Figure 6 demonstrates the overall Financial and Physical Progress of capital
costs for SSRP (Center level).
Figure No. 6 Physical Progress (PPR) and Financial Progress (FPR) on Capital Cost of Three Budget
Heads Implemented through DOE in FY 2014/2015
DOEs, REDs and other CLAs including DOE were unable to spend the capital cost properly as
per the allocation for the fiscal year 2014-015. The overall Financial and Physical Progress of
capital cost for SSRP (District level) was relatively better. The budget allocated for SSRP
(Center level) capital costs was not fully utilized by the Central level agencies. The capital cost
for budget head number 3500234 (Special Education Council) was not fully utilized due to the
earthquake and Terai Bandh.
The School Sector Reform Program (District Level and Center level) budget head numbers
3500803/4 & 350123/4 are at the heart of the educational plans & programs of Nepal and have

Status Report -2015 Page 28
an important role for the development of overall school education from pre-Primary to Higher
Secondary level. Within the School Sector Reform Program (District Level and Center level)
budget head numbers 3500803/4 & 350123/4, the budget has been divided into 9 major
components, based on the nature of activities, and each of these 9 components is intended to
fulfill the goals & objectives of EFA and MDG. The percentage share of component-wise budget
allocation of SSRP (Districts and Center) is given in the following table.
Table No. 15 Total SSRP Budget Allocation in Nine Sub Components, their Percentage shares for
(Budget Head No.3500803/4 and 350123/4) NPR
SN Component-wise Budget Allocation
Actual Budget Allocation
Allocated Total SSRP Budget Percentage share
SSRP District SSRP Central SSRP District
SSRP
Centra
l
1 Early Childhood Education and Development 1,213,464,000 4,857,000 6.63 1.71
2 Ensuring access to all 5,976,046,600 24,551,000 32.64 8.62
3 Literacy and continuous education 200,887,500 0 1.10 0.00
4 Improvement of educational quality 4,138,785,159.36 88,464,000 22.60 31.08
5 Teacher education and Development 430,641,000 48,226,000 2.35 16.94
6 Capacity development for effective service delivery. 131,583,000 36,295,000 0.72 12.75
7 School management and follow up 1,273,346,400 82,275,960 6.95 28.90
8 Incentives and support 1,576,538,810 0 8.61 0.00
9 Per child funding unit (Non salary) 3,370,444,350 0 18.41 0.00
Total 18,311,736,820 284,668,960 100.00 100.00
Budget allocation at District level was higher than for Central level activities. The financial
allocation at District and Central levels were NPR 18,311,736,820 (98.47%) and NPR
284,668,960 (1.53%) respectively out of NPR 18,596,405,780.
Figure below demonstrates the percentage share of total budget allocation across the nine
components based on formula funding and national priority. The budget allocation is divided into
major 9 components to ensure fulfillment of the aims of equitable access of quality Basic
education for all children; expanding access to early childhood education and development
(ECED); increasing functional literacy and competencies among youth and adults; increasing
access, equity, quality and relevance of Secondary education; equipping Secondary level
students with soft skill based Technical and Vocational Education; improving the performance
of the service delivery system and developing capacity; teacher‟s professional

Status Report -2015 Page 29
competencies development; and monitoring and evaluating the impact of education
interventions.
Figure below demonstrates that, in SSRP(district), programs such as ensuring access to all,
improvement of education quality, and non-salary per child cost (PCF) have been given funding
priority. More funds have been given in SSRP (center) for improving quality education, teacher
education and development, capacity building for effective service delivery and school
management and follow up programs.
Figure No. 7 Comparison of Percentage share of SSRP (District) and SSRP (Center) Budget Allocation
through the Nine (9) components.
Literacy and continuous education, early childhood education and development, incentive and
support to students as an incentive to increase their participation in school and retention all
received less budget allocation in FY 2014/2015.
Table No. 16 Allocated Budget and Expenditure of SSRP (District and Central) by Activities and Sub - Components for FY 2014/2015 Budget Head No. (350803/04 & 3501213/4)
S
N
Component-
wise Budget
allocation
Actual Budget Allocation (NPR) Expenditure for Both (NPR)
SSRP
District
SSRP
Central Total
SSRP District SSRP Central Financial & Physical Progress for
Combination of Both
SSRP
District
Physic
al
Progre
ss %
Finan
cial
Progr
ess
%
SSRP
Central
Physic
al
Progre
ss %
Finan
cial
Progr
ess
%
Total
Physic
al
Progre
ss %
Fina
ncial
Prog
ress
%
1
Early Childhood
Education and
Development
1,213,464,0
00 4,857,000
1,218,321,0
00
1,130,592,8
00 96.44 93.17 342,730 6.18 6.18 1,130,935,530 51.31
92.8
3
2 Ensuring Access
to all
5,976,046,6
00
24,551,00
0
6,000,597,6
00
5,037,030,2
10 75.00 84.29
13,633,56
0 31.62 68.25 5,050,663,770 53.31
84.1
7
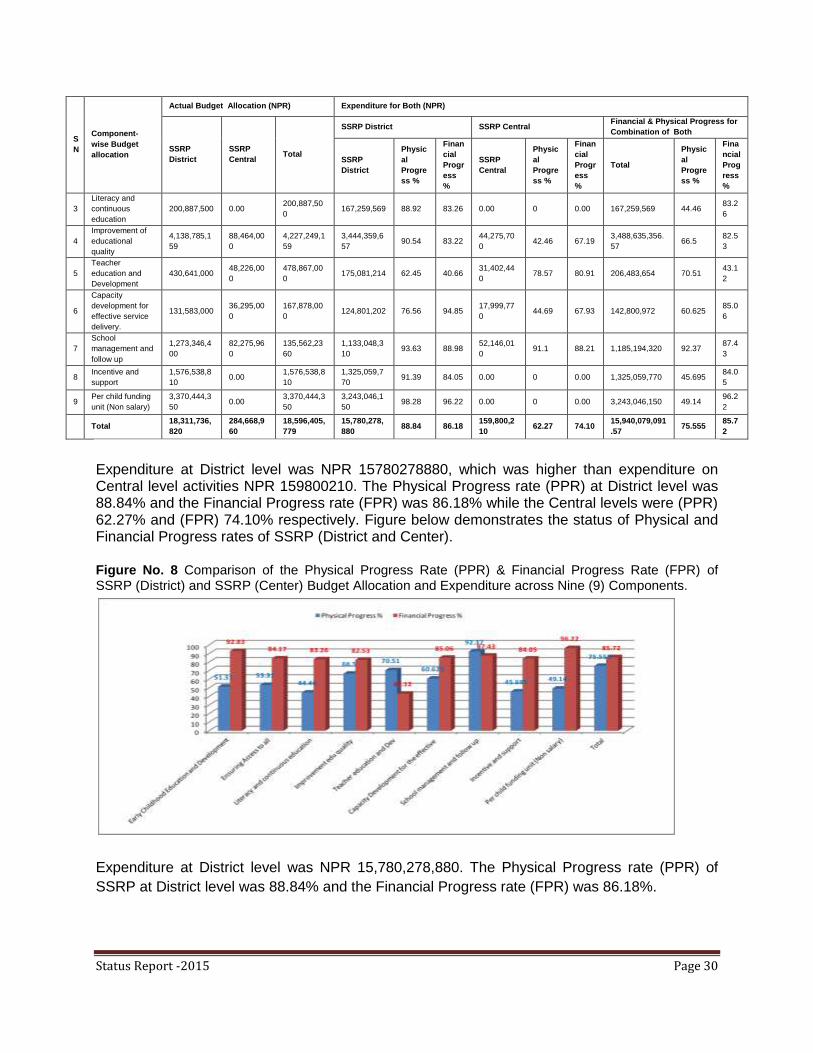
Status Report -2015 Page 30
S
N
Component-
wise Budget
allocation
Actual Budget Allocation (NPR) Expenditure for Both (NPR)
SSRP
District
SSRP
Central Total
SSRP District SSRP Central Financial & Physical Progress for
Combination of Both
SSRP
District
Physic
al
Progre
ss %
Finan
cial
Progr
ess
%
SSRP
Central
Physic
al
Progre
ss %
Finan
cial
Progr
ess
%
Total
Physic
al
Progre
ss %
Fina
ncial
Prog
ress
%
3
Literacy and
continuous
education
200,887,500 0.00 200,887,50
0 167,259,569 88.92 83.26 0.00 0 0.00 167,259,569 44.46
83.2
6
4
Improvement of
educational
quality
4,138,785,1
59
88,464,00
0
4,227,249,1
59
3,444,359,6
57 90.54 83.22
44,275,70
0 42.46 67.19
3,488,635,356.
57 66.5
82.5
3
5
Teacher
education and
Development
430,641,000 48,226,00
0
478,867,00
0 175,081,214 62.45 40.66
31,402,44
0 78.57 80.91 206,483,654 70.51
43.1
2
6
Capacity
development for
effective service
delivery.
131,583,000 36,295,00
0
167,878,00
0 124,801,202 76.56 94.85
17,999,77
0 44.69 67.93 142,800,972 60.625
85.0
6
7
School
management and
follow up
1,273,346,4
00
82,275,96
0
135,562,23
60
1,133,048,3
10 93.63 88.98
52,146,01
0 91.1 88.21 1,185,194,320 92.37
87.4
3
8 Incentive and
support
1,576,538,8
10 0.00
1,576,538,8
10
1,325,059,7
70 91.39 84.05 0.00 0 0.00 1,325,059,770 45.695
84.0
5
9 Per child funding
unit (Non salary)
3,370,444,3
50 0.00
3,370,444,3
50
3,243,046,1
50 98.28 96.22 0.00 0 0.00 3,243,046,150 49.14
96.2
2
Total 18,311,736,
820
284,668,9
60
18,596,405,
779
15,780,278,
880 88.84 86.18
159,800,2
10 62.27 74.10
15,940,079,091
.57 75.555
85.7
2
Expenditure at District level was NPR 15780278880, which was higher than expenditure on Central level activities NPR 159800210. The Physical Progress rate (PPR) at District level was 88.84% and the Financial Progress rate (FPR) was 86.18% while the Central levels were (PPR) 62.27% and (FPR) 74.10% respectively. Figure below demonstrates the status of Physical and Financial Progress rates of SSRP (District and Center).
Figure No. 8 Comparison of the Physical Progress Rate (PPR) & Financial Progress Rate (FPR) of SSRP (District) and SSRP (Center) Budget Allocation and Expenditure across Nine (9) Components.
Expenditure at District level was NPR 15,780,278,880. The Physical Progress rate (PPR) of
SSRP at District level was 88.84% and the Financial Progress rate (FPR) was 86.18%.
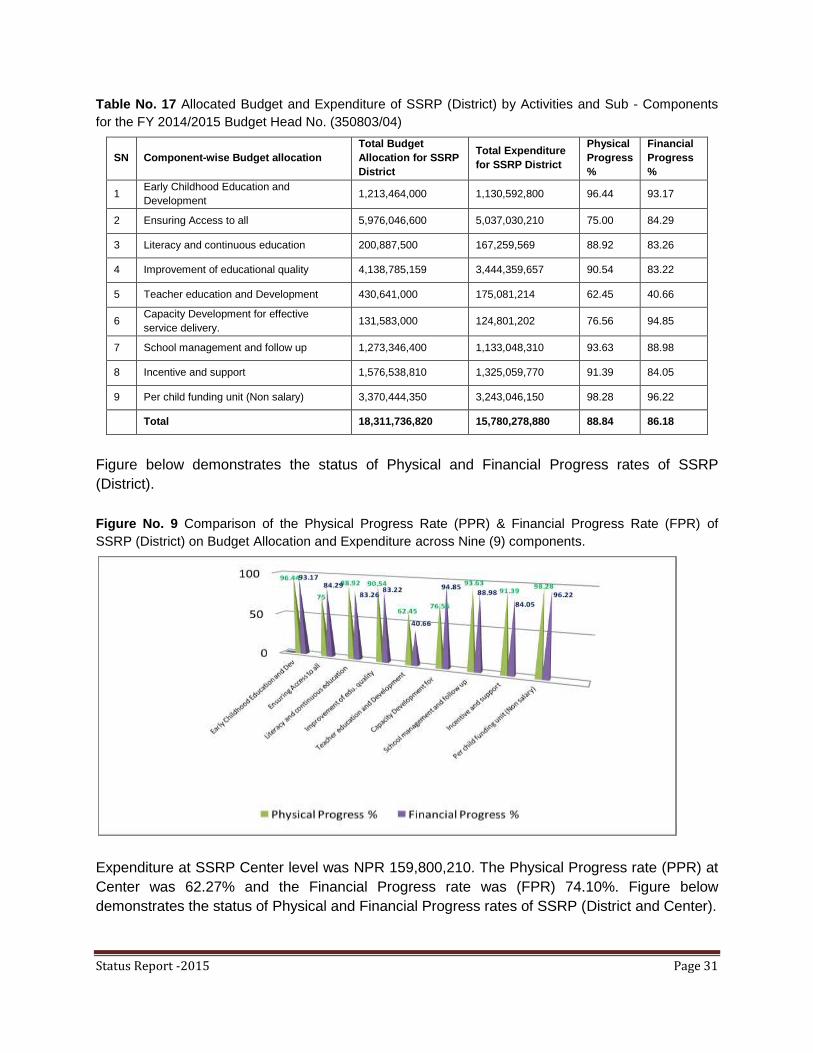
Status Report -2015 Page 31
Table No. 17 Allocated Budget and Expenditure of SSRP (District) by Activities and Sub - Components
for the FY 2014/2015 Budget Head No. (350803/04)
SN Component-wise Budget allocation
Total Budget
Allocation for SSRP
District
Total Expenditure
for SSRP District
Physical
Progress
%
Financial
Progress
%
1 Early Childhood Education and
Development 1,213,464,000 1,130,592,800 96.44 93.17
2 Ensuring Access to all 5,976,046,600 5,037,030,210 75.00 84.29
3 Literacy and continuous education 200,887,500 167,259,569 88.92 83.26
4 Improvement of educational quality 4,138,785,159 3,444,359,657 90.54 83.22
5 Teacher education and Development 430,641,000 175,081,214 62.45 40.66
6 Capacity Development for effective
service delivery. 131,583,000 124,801,202 76.56 94.85
7 School management and follow up 1,273,346,400 1,133,048,310 93.63 88.98
8 Incentive and support 1,576,538,810 1,325,059,770 91.39 84.05
9 Per child funding unit (Non salary) 3,370,444,350 3,243,046,150 98.28 96.22
Total 18,311,736,820 15,780,278,880 88.84 86.18
Figure below demonstrates the status of Physical and Financial Progress rates of SSRP
(District).
Figure No. 9 Comparison of the Physical Progress Rate (PPR) & Financial Progress Rate (FPR) of
SSRP (District) on Budget Allocation and Expenditure across Nine (9) components.
Expenditure at SSRP Center level was NPR 159,800,210. The Physical Progress rate (PPR) at
Center was 62.27% and the Financial Progress rate was (FPR) 74.10%. Figure below
demonstrates the status of Physical and Financial Progress rates of SSRP (District and Center).
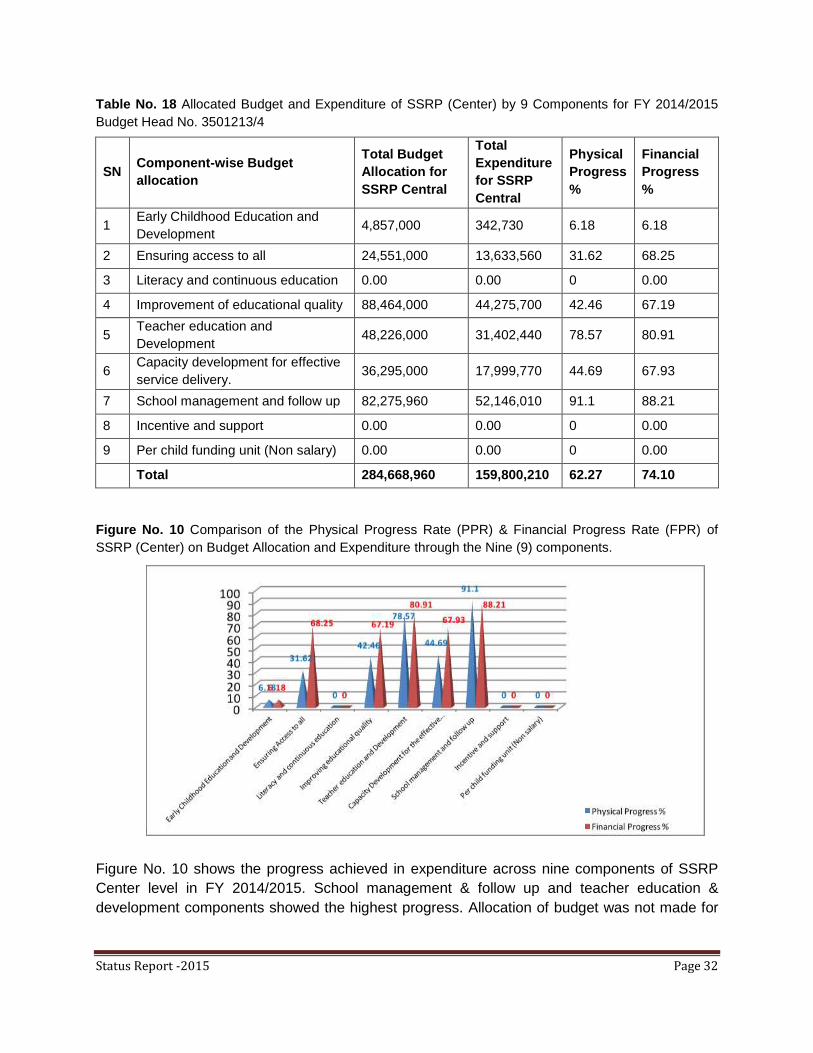
Status Report -2015 Page 32
Table No. 18 Allocated Budget and Expenditure of SSRP (Center) by 9 Components for FY 2014/2015
Budget Head No. 3501213/4
SN Component-wise Budget
allocation
Total Budget
Allocation for
SSRP Central
Total
Expenditure
for SSRP
Central
Physical
Progress
%
Financial
Progress
%
1 Early Childhood Education and
Development 4,857,000 342,730 6.18 6.18
2 Ensuring access to all 24,551,000 13,633,560 31.62 68.25
3 Literacy and continuous education 0.00 0.00 0 0.00
4 Improvement of educational quality 88,464,000 44,275,700 42.46 67.19
5 Teacher education and
Development 48,226,000 31,402,440 78.57 80.91
6 Capacity development for effective
service delivery. 36,295,000 17,999,770 44.69 67.93
7 School management and follow up 82,275,960 52,146,010 91.1 88.21
8 Incentive and support 0.00 0.00 0 0.00
9 Per child funding unit (Non salary) 0.00 0.00 0 0.00
Total 284,668,960 159,800,210 62.27 74.10
Figure No. 10 Comparison of the Physical Progress Rate (PPR) & Financial Progress Rate (FPR) of
SSRP (Center) on Budget Allocation and Expenditure through the Nine (9) components.
Figure No. 10 shows the progress achieved in expenditure across nine components of SSRP
Center level in FY 2014/2015. School management & follow up and teacher education &
development components showed the highest progress. Allocation of budget was not made for
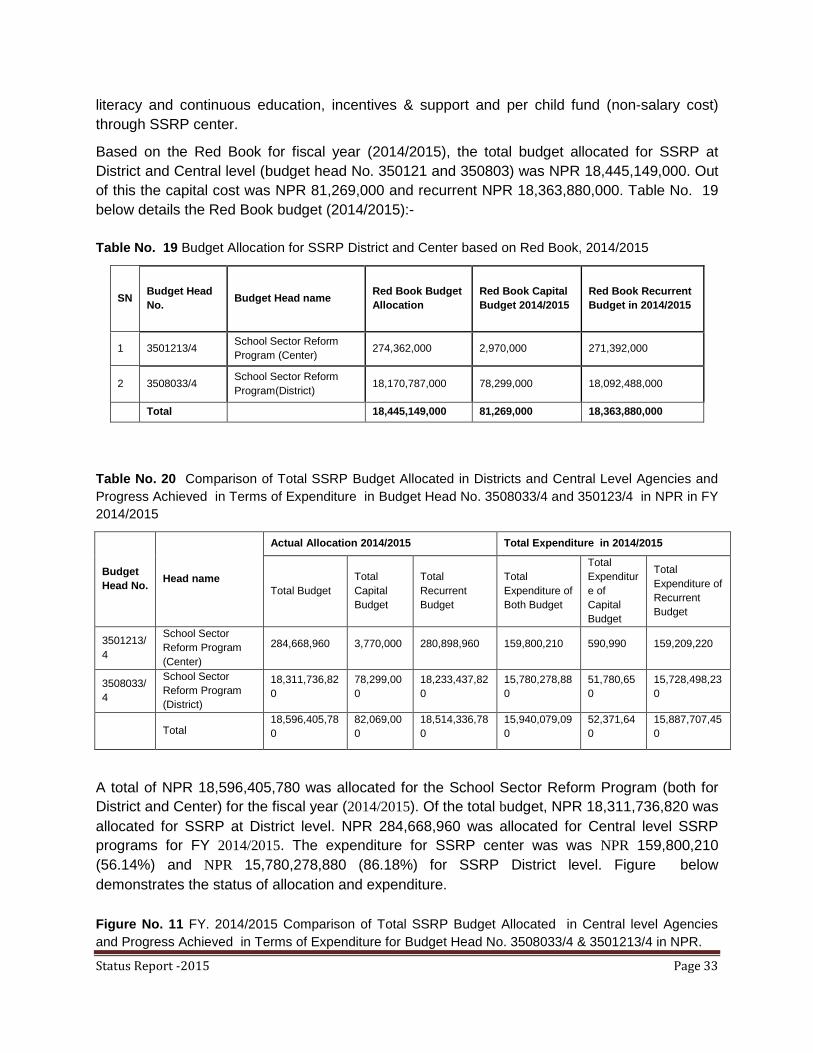
Status Report -2015 Page 33
literacy and continuous education, incentives & support and per child fund (non-salary cost)
through SSRP center.
Based on the Red Book for fiscal year (2014/2015), the total budget allocated for SSRP at
District and Central level (budget head No. 350121 and 350803) was NPR 18,445,149,000. Out
of this the capital cost was NPR 81,269,000 and recurrent NPR 18,363,880,000. Table No. 19
below details the Red Book budget (2014/2015):-
Table No. 19 Budget Allocation for SSRP District and Center based on Red Book, 2014/2015
SN Budget Head
No. Budget Head name
Red Book Budget
Allocation
Red Book Capital
Budget 2014/2015
Red Book Recurrent
Budget in 2014/2015
1 3501213/4 School Sector Reform
Program (Center) 274,362,000 2,970,000 271,392,000
2 3508033/4 School Sector Reform
Program(District) 18,170,787,000 78,299,000 18,092,488,000
Total 18,445,149,000 81,269,000 18,363,880,000
Table No. 20 Comparison of Total SSRP Budget Allocated in Districts and Central Level Agencies and
Progress Achieved in Terms of Expenditure in Budget Head No. 3508033/4 and 350123/4 in NPR in FY
2014/2015
Budget
Head No. Head name
Actual Allocation 2014/2015 Total Expenditure in 2014/2015
Total Budget
Total
Capital
Budget
Total
Recurrent
Budget
Total
Expenditure of
Both Budget
Total
Expenditur
e of
Capital
Budget
Total
Expenditure of
Recurrent
Budget
3501213/
4
School Sector
Reform Program
(Center)
284,668,960 3,770,000 280,898,960 159,800,210 590,990 159,209,220
3508033/
4
School Sector
Reform Program
(District)
18,311,736,82
0
78,299,00
0
18,233,437,82
0
15,780,278,88
0
51,780,65
0
15,728,498,23
0
Total 18,596,405,78
0
82,069,00
0
18,514,336,78
0
15,940,079,09
0
52,371,64
0
15,887,707,45
0
A total of NPR 18,596,405,780 was allocated for the School Sector Reform Program (both for
District and Center) for the fiscal year (2014/2015). Of the total budget, NPR 18,311,736,820 was
allocated for SSRP at District level. NPR 284,668,960 was allocated for Central level SSRP
programs for FY 2014/2015. The expenditure for SSRP center was was NPR 159,800,210
(56.14%) and NPR 15,780,278,880 (86.18%) for SSRP District level. Figure below
demonstrates the status of allocation and expenditure.
Figure No. 11 FY. 2014/2015 Comparison of Total SSRP Budget Allocated in Central level Agencies
and Progress Achieved in Terms of Expenditure for Budget Head No. 3508033/4 & 3501213/4 in NPR.
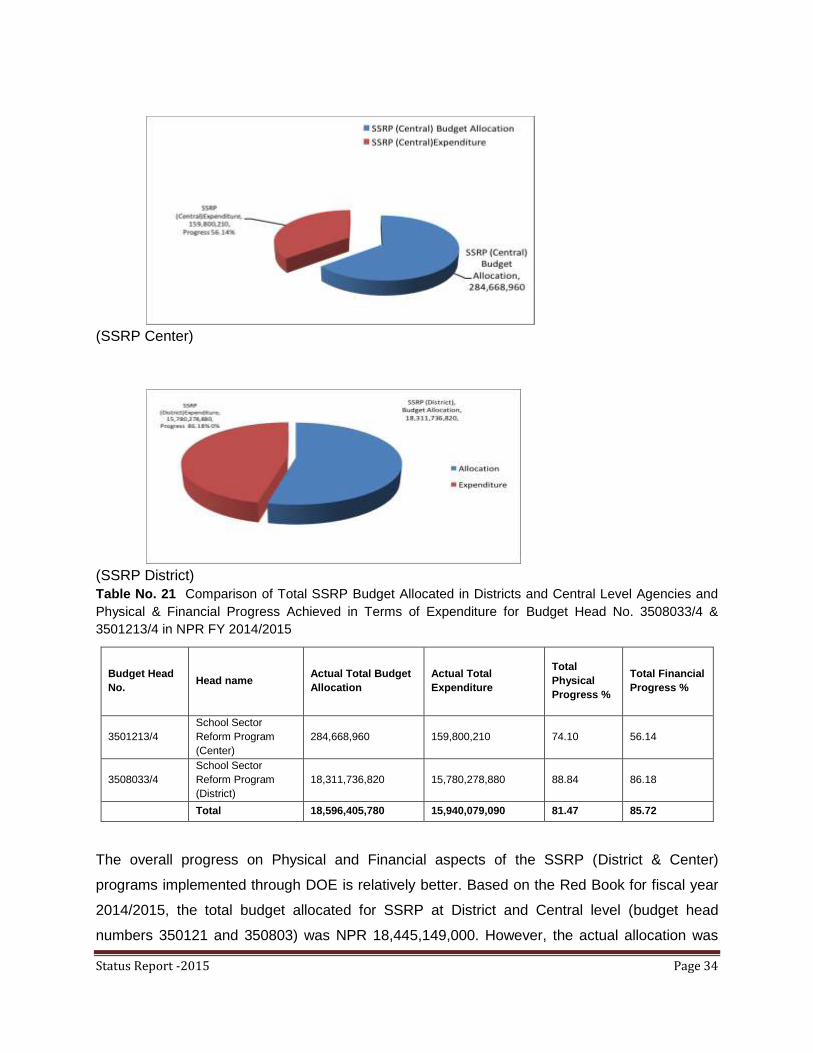
Status Report -2015 Page 34
(SSRP Center)
(SSRP District)
Table No. 21 Comparison of Total SSRP Budget Allocated in Districts and Central Level Agencies and
Physical & Financial Progress Achieved in Terms of Expenditure for Budget Head No. 3508033/4 &
3501213/4 in NPR FY 2014/2015
Budget Head
No. Head name
Actual Total Budget
Allocation
Actual Total
Expenditure
Total
Physical
Progress %
Total Financial
Progress %
3501213/4
School Sector
Reform Program
(Center)
284,668,960 159,800,210 74.10 56.14
3508033/4
School Sector
Reform Program
(District)
18,311,736,820 15,780,278,880 88.84 86.18
Total 18,596,405,780 15,940,079,090 81.47 85.72
The overall progress on Physical and Financial aspects of the SSRP (District & Center)
programs implemented through DOE is relatively better. Based on the Red Book for fiscal year
2014/2015, the total budget allocated for SSRP at District and Central level (budget head
numbers 350121 and 350803) was NPR 18,445,149,000. However, the actual allocation was
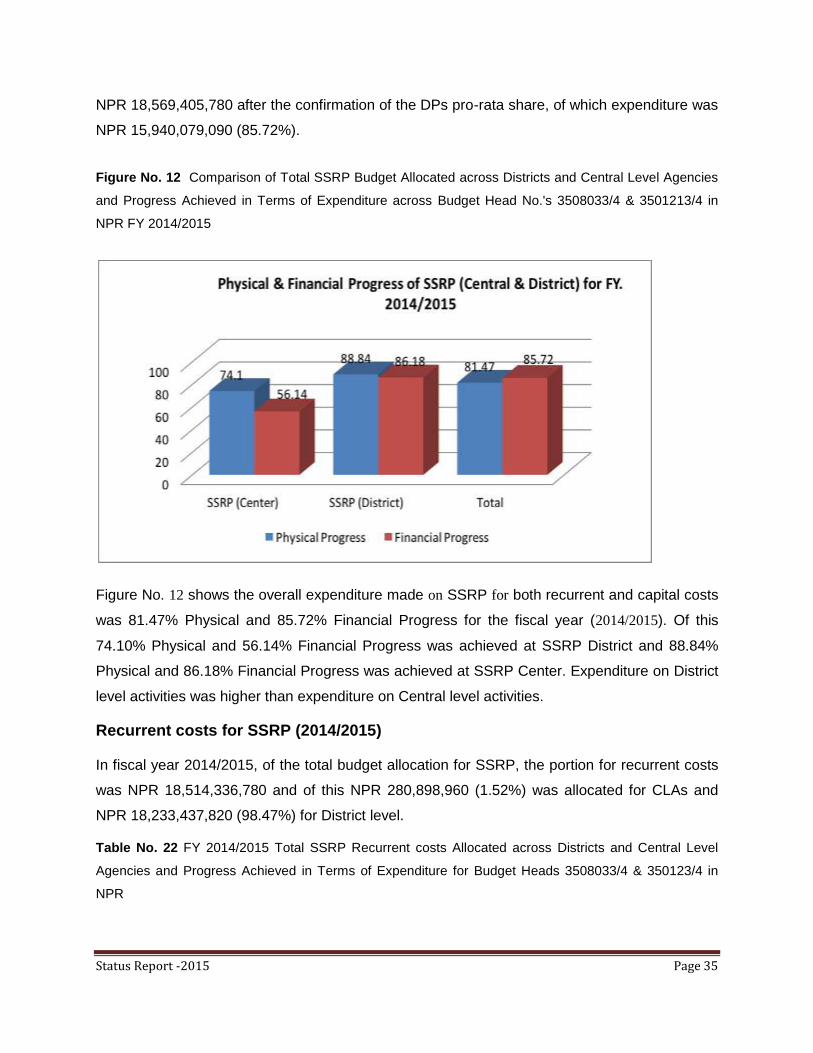
Status Report -2015 Page 35
NPR 18,569,405,780 after the confirmation of the DPs pro-rata share, of which expenditure was
NPR 15,940,079,090 (85.72%).
Figure No. 12 Comparison of Total SSRP Budget Allocated across Districts and Central Level Agencies
and Progress Achieved in Terms of Expenditure across Budget Head No.'s 3508033/4 & 3501213/4 in
NPR FY 2014/2015
Figure No. 12 shows the overall expenditure made on SSRP for both recurrent and capital costs
was 81.47% Physical and 85.72% Financial Progress for the fiscal year (2014/2015). Of this
74.10% Physical and 56.14% Financial Progress was achieved at SSRP District and 88.84%
Physical and 86.18% Financial Progress was achieved at SSRP Center. Expenditure on District
level activities was higher than expenditure on Central level activities.
Recurrent costs for SSRP (2014/2015)
In fiscal year 2014/2015, of the total budget allocation for SSRP, the portion for recurrent costs
was NPR 18,514,336,780 and of this NPR 280,898,960 (1.52%) was allocated for CLAs and
NPR 18,233,437,820 (98.47%) for District level.
Table No. 22 FY 2014/2015 Total SSRP Recurrent costs Allocated across Districts and Central Level
Agencies and Progress Achieved in Terms of Expenditure for Budget Heads 3508033/4 & 350123/4 in
NPR
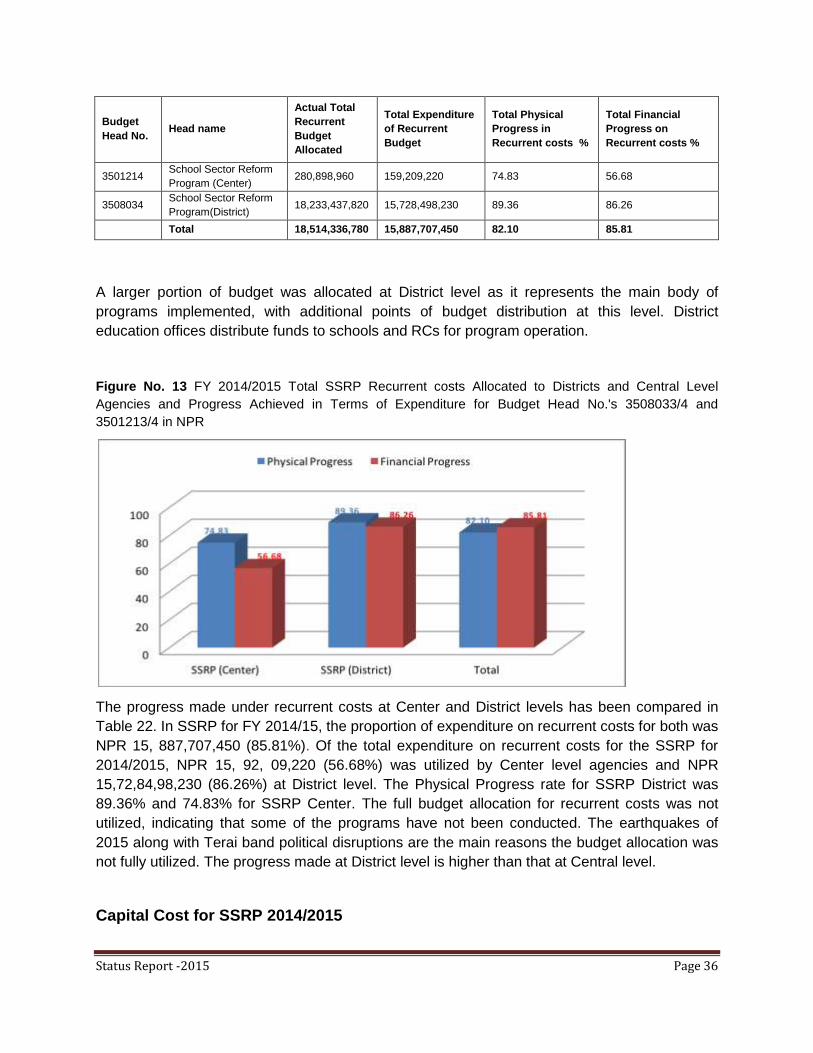
Status Report -2015 Page 36
Budget
Head No. Head name
Actual Total
Recurrent
Budget
Allocated
Total Expenditure
of Recurrent
Budget
Total Physical
Progress in
Recurrent costs %
Total Financial
Progress on
Recurrent costs %
3501214 School Sector Reform
Program (Center) 280,898,960 159,209,220 74.83 56.68
3508034 School Sector Reform
Program(District) 18,233,437,820 15,728,498,230 89.36 86.26
Total 18,514,336,780 15,887,707,450 82.10 85.81
A larger portion of budget was allocated at District level as it represents the main body of
programs implemented, with additional points of budget distribution at this level. District
education offices distribute funds to schools and RCs for program operation.
Figure No. 13 FY 2014/2015 Total SSRP Recurrent costs Allocated to Districts and Central Level
Agencies and Progress Achieved in Terms of Expenditure for Budget Head No.'s 3508033/4 and
3501213/4 in NPR
The progress made under recurrent costs at Center and District levels has been compared in
Table 22. In SSRP for FY 2014/15, the proportion of expenditure on recurrent costs for both was
NPR 15, 887,707,450 (85.81%). Of the total expenditure on recurrent costs for the SSRP for
2014/2015, NPR 15, 92, 09,220 (56.68%) was utilized by Center level agencies and NPR
15,72,84,98,230 (86.26%) at District level. The Physical Progress rate for SSRP District was
89.36% and 74.83% for SSRP Center. The full budget allocation for recurrent costs was not
utilized, indicating that some of the programs have not been conducted. The earthquakes of
2015 along with Terai band political disruptions are the main reasons the budget allocation was
not fully utilized. The progress made at District level is higher than that at Central level.
Capital Cost for SSRP 2014/2015

Status Report -2015 Page 37
Of the total budget allocation for SSRP in FY 2014/2015, NPR 82,069,000 was assigned for
capital costs for District and Center.
Table No. 23 Total SSRP Capital Cost Allocated in Districts and CLAs and Progress Achieved in Terms
of Expenditure for Budget Head No.'s 3508033/4 and 3501213/4 in NPR FY 2014/2015
Budget
Head No. Head name
Actual Total
Capital Budget
Allocated
Total Expenditure
of Capital Budget
Total Physical
Progress in
Capital Cost %
Total Financial
Progress on
capital cost %
3501214 School Sector Reform
Program (Center) 3,770,000 590,990 20.29 15.68
3508034 School Sector Reform
Program(District) 78,299,000 51,780,650 84.89 66.13
Total 82,069,000 52,371,640 52.59 63.81
Of the total capital cost allocated to SSRP in 2014/2015, NPR 3,770,000 (4.59%) was
designated for Center level agencies and NPR 78,299,000 (95.41%) for District level. A larger
portion of the capital cost budget was allocated for Districts than Central level, due to the District
levels greater requirement for development of infrastructure and equipment for delivering
educational services directly to stakeholders. The present status of infrastructure development,
equipment purchasing and technology used at District level is less than for Central bodies.
Figure No. 14 FY 2014/2015 Total SSRP Capital Cost Allocated in Districts and Central Level Agencies
and Progress Achieved in Terms of Expenditure for Budget Head No.'s 3508033/4 and 3501213/4 in NPR
Table 23 compares the progress made under capital costs in Center and District levels. Of total
capital costs allocated to the SSRP for FY 2014/15, capital costs for both levels was NPR
Status Report -2015 Page 38
52,371,640 (63.81% fiscal progress). Of total expenditure on capital costs, NPR 590,990
(15.68% fiscal progress) represents progress made by CLAs and NPR 51,780,650 (66.13%)
fiscal progress by Districts and REDs. The spending capacity or budget utility capacity was low
for CLAs. The Physical Progress rate for SSRP in Districts was 84.89%, and 20.29% for SSRP
Center. The budget allocated for capital costs was not fully utilized by the Central level
agencies, indicating that some programs were not completed or conducted.
Status Report -2015 Page 39
PART II
SCHOOL SECTOR REFORM PROGRAM (SSRP)
Chapter 1
Early Childhood Education and Development (ECED)
2.1.1 Introduction
Child Care at the Early Childhood Development (ECD) program fosters a congenial learning
environment for children of 3 to 5 years of age to develop motor, mental, social and emotional
skills. The program supports fostering children's all round development by providing a firm
foundation for Basic education. It is a fundamental base for Primary education. The Education
Act and regulation established ECED as a foundation to the structure of education. Community
and school based ECED programs have been in operation in Nepal since 2004-05.
There are a number of committees managing ECEDs, providing guidelines, formulating policy,
coordinating, supervising and monitoring, at both Central and District levels. The Department of
Education holds a key role in coordinating I/NGOs and community based organizations to
operate ECEDs in collaboration. DPs have an important role in supporting strengthening of this
program in schools and the community. Institutional schools have made significant contributions
towards the expansion and delivery of ECED/Pre-Primary services especially in urban areas.
The DOE has been continuously providing lump sum grants to ECD centers. The objective of
the ECED program is to strengthen the educational base for students entering Grade 1.
Fostering children's all-round development includes the physical, mental, psychological, social
and emotional development of children for their good citizenship & better future. The ECED
program is the continuation of earlier BPEP & EFA programs. The GON has recognized the
beneficial effects of ECED programs and believes it is a real foundation for Basic education, an
opportunity for promoting retention and completion of Basic education and a way of improving
education quality. The objective to expand access to quality education includes better ECED
services for children of 3-4 years of age to prepare them for Basic education.
According to Flash I report 2015-16, there are 36,059 (35,121 last year) ECD/PPCs throughout
the country. Of the total 36,059 ECD/PPCs 5,543 (5,087 last year), 15.37% are running as pre-
Primary classes in institutional schools and 30,516 (84.63%) are running in community schools
and as community based ECDs. These 30,516 ECD/PPCs were supported by the government
. Table 14 and Figure 11 below show the total 36,059 ECDs/PPCc running as community-based
ECDs and institutional school PPCs in 2014/2015. They are distributed according to eco-belt &
type as follows.
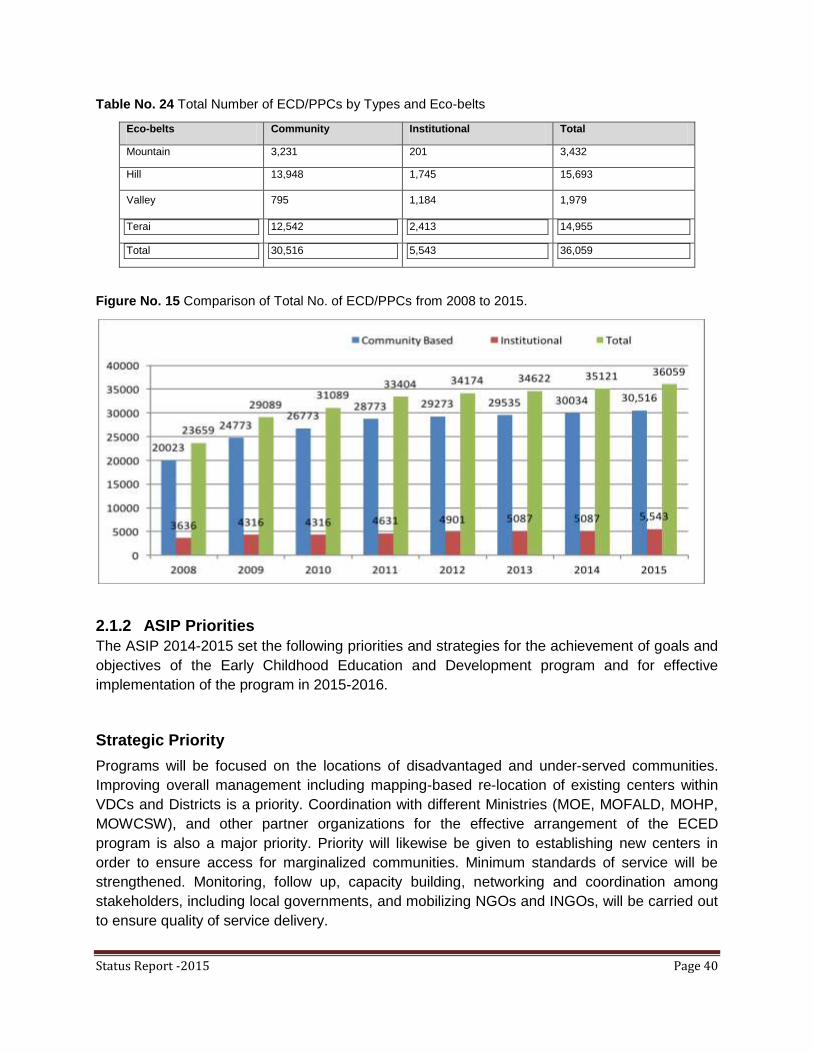
Status Report -2015 Page 40
Table No. 24 Total Number of ECD/PPCs by Types and Eco-belts
Eco-belts Community Institutional Total
Mountain 3,231 201 3,432
Hill 13,948 1,745 15,693
Valley 795 1,184 1,979
Terai 12,542 2,413 14,955
Total 30,516 5,543 36,059
Figure No. 15 Comparison of Total No. of ECD/PPCs from 2008 to 2015.
2.1.2 ASIP Priorities
The ASIP 2014-2015 set the following priorities and strategies for the achievement of goals and
objectives of the Early Childhood Education and Development program and for effective
implementation of the program in 2015-2016.
Strategic Priority
Programs will be focused on the locations of disadvantaged and under-served communities.
Improving overall management including mapping-based re-location of existing centers within
VDCs and Districts is a priority. Coordination with different Ministries (MOE, MOFALD, MOHP,
MOWCSW), and other partner organizations for the effective arrangement of the ECED
program is also a major priority. Priority will likewise be given to establishing new centers in
order to ensure access for marginalized communities. Minimum standards of service will be
strengthened. Monitoring, follow up, capacity building, networking and coordination among
stakeholders, including local governments, and mobilizing NGOs and INGOs, will be carried out
to ensure quality of service delivery.
Status Report -2015 Page 41
Strategies
ECED program strategies include plans of action designed to achieve a predetermined vision,
mission goals and the objectives of early childhood education and development in Nepal.
ASIP/AWPB 2014/2015 determined the following tactics and strategies to successfully
implement the program across the country:
1. Support will continue for maintaining national minimum norms and standards. Improving the
quality of existing program will be emphasized.
2. Mapping of programs will continue in the remaining Districts. Based on the findings of
mapping activities, priority will be given to relocating and opening ECD centers to address
equity concerns. Priority will be given to Recruitment of local female facilitators. An effective
coordination, collaboration and support mechanism will be established for the recruitment of
female facilitators.
3. The strategy of affiliating community based centers with the nearest community will
continue, to improve management and operational support, to channel resources and for
monitoring. The strategies of building partnerships and collaboration between concerned
government agencies, I/NGOs and private providers will also continue with a view to sharing
expertise and resources.
4. Quality of service delivery and assessment of performance outcomes will be continuously
monitored and information gathered will be used to improve the performance of centers.
5. Efforts will be made to make materials available by mobilizing government organizations,
communities and non-government resources. Support for ECED centers through non-salary
PCF grants will be reviewed and further strategies will be designed accordingly. Local
bodies and communities will be encouraged to support centers in terms of financial and non-
financial resources.
6. Midday meal provision to all the school based ECED centers in the Karnali Zone will
continue. For the other 14 Districts where day meal provisions exist at the school level,
homegrown food practices and a cost-sharing model will be promoted.
7. One thousand and fifty-three (1,053) centers will be developed as model centers within
policy guidelines ensuring the minimum standards of ECED are met. The standards of the
Model ECED center will be developed and incorporated in the DOE‟s Program
Implementation Manual.
8. Facilitators will conduct awareness programs for the parents of marginalized and
disadvantaged groups.
9. The existing Basic and refresher-training program will be organized for current and new
facilitators respectively. The National networking meeting will be programmed regularly for
better coordination between Government and concerned Non-government organizations.
10. Half-yearly progress sharing and interactive meetings for facilitators will be organized at RC
level.

Status Report -2015 Page 42
2.1.3 Achievement Against Indicators
There has been a continual increase in the number of ECD/PPCs centers and facilities in Nepal.
Based on pre-set targets for both ECD/PPCs GER, and the percentage of new children in
Grade 1 with ECD/PPCs experience, in the SSRP core document, the government has
established new ECD/PPCs as per the DEOs‟ demand to provide ECD services to un-served
children. The involvement of children in early childhood care services was 967,507 attending
36,516 ECD/PPCs for 2015-2016, where the total number of children in ECD/PPCs was
10,14,339 for 2014/2015, a decrease of 938 (2.76%) as compared to the previous school year.
The ratio of children enrolled in ECD/PPCs was 1:27 compared to 1:32 in the previous school
year.
Table 25: Progress of ECD against the Relevant KPIs
Indicators %
U
ni
t
Targets
Achievements 2010
2011
2012
2013
2014
2015
2010
2011
2012
2013
2014
2015
New entrants with ECEDCS experience % 41 45 51 57 59 62 49.9 52
.1 54.3 55.6
56.
9
59.
6
Gross Enrollment Rate ECEDCS/Pre
Primary % 67 72 77 78 79 80 66.2 70 72.9 73.7
76.
7
77.
7
According to Flash Report 2015-2016, the percentage of new Grade 1 entrants with ECD/PPCs
experiences was 59.6% compared to 56.9% in 2014 and 55.6% in 2013, an increase of 2.7%
from 2014 to 2015. Table 15 presents the trend of key performance indicator 'Percentage of
new children with ECD/PPC experiences in Grade 1, since 2010 to 2015 respectively,
comparing progress against the target.
Figure No. 16 Progress of ECD against relevant KPIs (Percentage of new entrants with ECE/DCS
experience) 2010 to 2015
0
10
20
30
40
50
60
70
80
2010 2011 2012 2013 2014 2015
Targets
Achievements
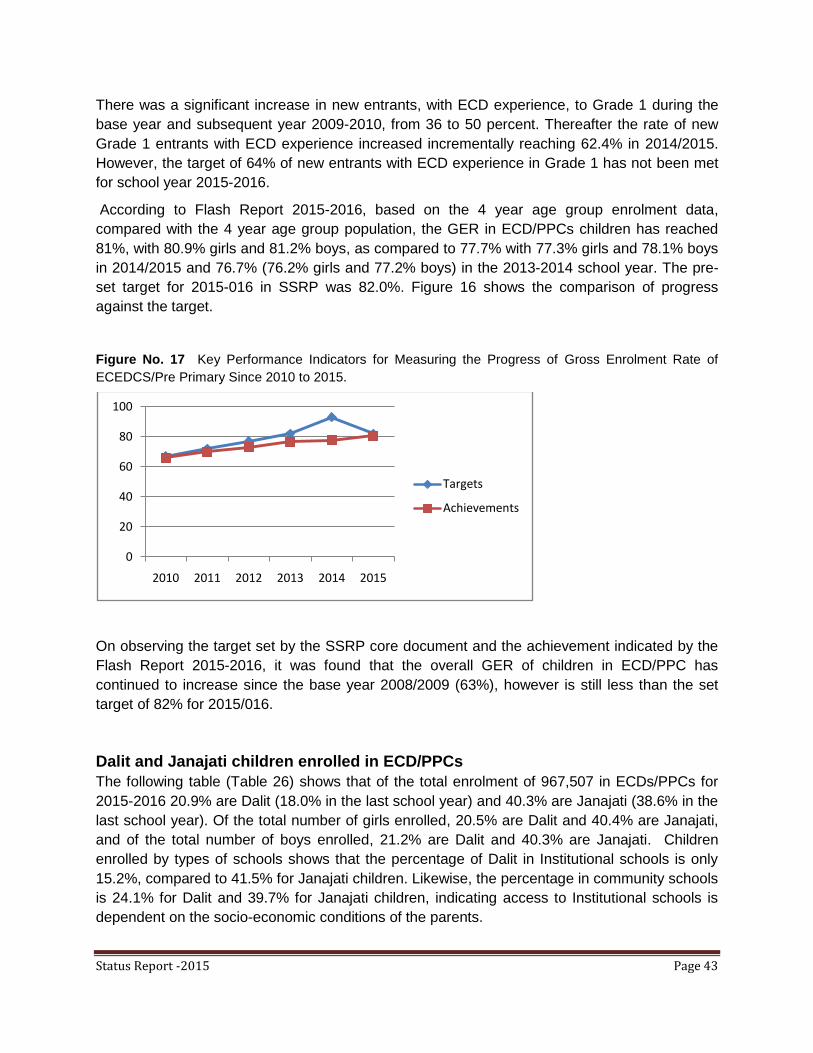
Status Report -2015 Page 43
There was a significant increase in new entrants, with ECD experience, to Grade 1 during the
base year and subsequent year 2009-2010, from 36 to 50 percent. Thereafter the rate of new
Grade 1 entrants with ECD experience increased incrementally reaching 62.4% in 2014/2015.
However, the target of 64% of new entrants with ECD experience in Grade 1 has not been met
for school year 2015-2016.
According to Flash Report 2015-2016, based on the 4 year age group enrolment data,
compared with the 4 year age group population, the GER in ECD/PPCs children has reached
81%, with 80.9% girls and 81.2% boys, as compared to 77.7% with 77.3% girls and 78.1% boys
in 2014/2015 and 76.7% (76.2% girls and 77.2% boys) in the 2013-2014 school year. The pre-
set target for 2015-016 in SSRP was 82.0%. Figure 16 shows the comparison of progress
against the target.
Figure No. 17 Key Performance Indicators for Measuring the Progress of Gross Enrolment Rate of
ECEDCS/Pre Primary Since 2010 to 2015.
On observing the target set by the SSRP core document and the achievement indicated by the
Flash Report 2015-2016, it was found that the overall GER of children in ECD/PPC has
continued to increase since the base year 2008/2009 (63%), however is still less than the set
target of 82% for 2015/016.
Dalit and Janajati children enrolled in ECD/PPCs
The following table (Table 26) shows that of the total enrolment of 967,507 in ECDs/PPCs for
2015-2016 20.9% are Dalit (18.0% in the last school year) and 40.3% are Janajati (38.6% in the
last school year). Of the total number of girls enrolled, 20.5% are Dalit and 40.4% are Janajati,
and of the total number of boys enrolled, 21.2% are Dalit and 40.3% are Janajati. Children
enrolled by types of schools shows that the percentage of Dalit in Institutional schools is only
15.2%, compared to 41.5% for Janajati children. Likewise, the percentage in community schools
is 24.1% for Dalit and 39.7% for Janajati children, indicating access to Institutional schools is
dependent on the socio-economic conditions of the parents.
0
20
40
60
80
100
2010 2011 2012 2013 2014 2015
Targets
Achievements

Status Report -2015 Page 44
Table No. 26 ECD/PPC Enrolment by Sex and Social Groups (Dalit & Janajati in 2015-2016).
Students Number of children in ECD/PPC Percentage share in total children
Total Dalit Janajati Dalit Janajati
Girls 470,699 96,302 190,022 20.5 40.4
Boys 496,808 105,463 200,209 21.2 40.3
Total 967,507 201,765 390,231 20.9 40.3
Figure No. 18 Percentage of Dalit and Janajati in Total Children in ECD/PPCs in (2015-2016)
Source: Flash Report I, 2072.
The number in Dalit and Janajati groups has increased slightly, and the number has increased
in other social groups. The composition of ECD/PPC enrolment by social groups is presented
below in Figure 19.
Figure No. 19 Composition of ECD/PPC Enrolment by Social Group
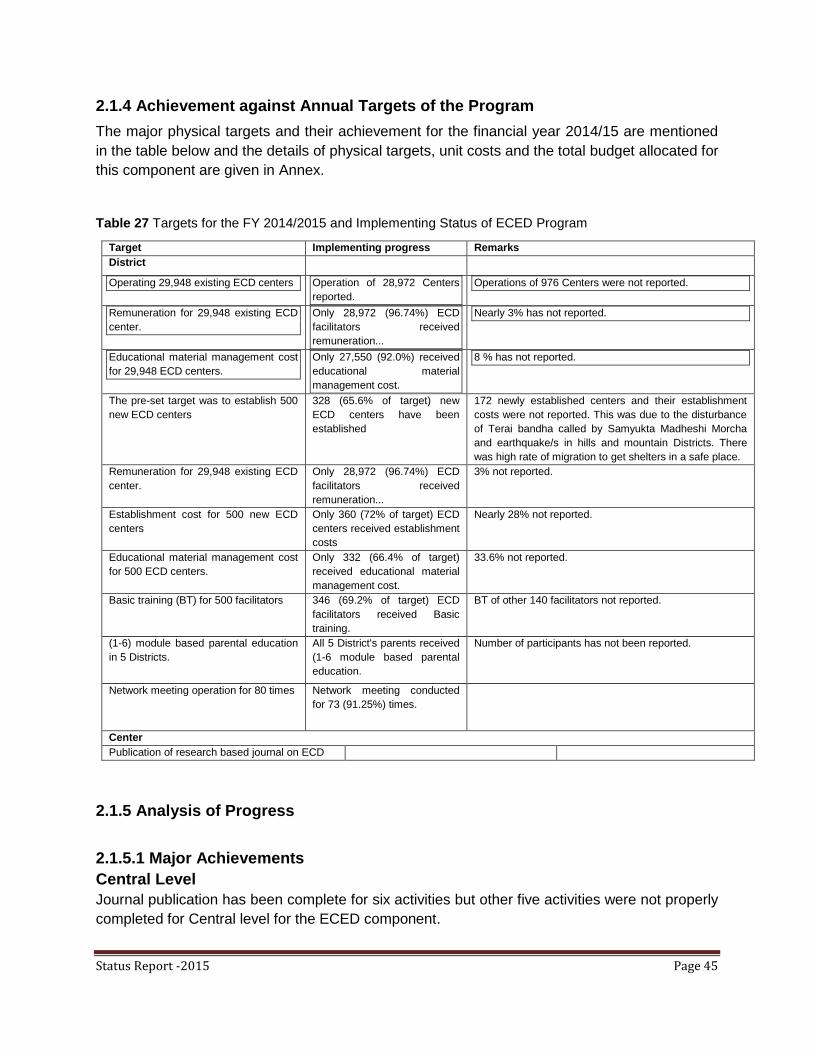
Status Report -2015 Page 45
2.1.4 Achievement against Annual Targets of the Program
The major physical targets and their achievement for the financial year 2014/15 are mentioned
in the table below and the details of physical targets, unit costs and the total budget allocated for
this component are given in Annex.
Table 27 Targets for the FY 2014/2015 and Implementing Status of ECED Program
Target Implementing progress Remarks
District
Operating 29,948 existing ECD centers Operation of 28,972 Centers
reported.
Operations of 976 Centers were not reported.
Remuneration for 29,948 existing ECD
center.
Only 28,972 (96.74%) ECD
facilitators received
remuneration...
Nearly 3% has not reported.
Educational material management cost
for 29,948 ECD centers.
Only 27,550 (92.0%) received
educational material
management cost.
8 % has not reported.
The pre-set target was to establish 500
new ECD centers
328 (65.6% of target) new
ECD centers have been
established
172 newly established centers and their establishment
costs were not reported. This was due to the disturbance
of Terai bandha called by Samyukta Madheshi Morcha
and earthquake/s in hills and mountain Districts. There
was high rate of migration to get shelters in a safe place.
Remuneration for 29,948 existing ECD
center.
Only 28,972 (96.74%) ECD
facilitators received
remuneration...
3% not reported.
Establishment cost for 500 new ECD
centers
Only 360 (72% of target) ECD
centers received establishment
costs
Nearly 28% not reported.
Educational material management cost
for 500 ECD centers.
Only 332 (66.4% of target)
received educational material
management cost.
33.6% not reported.
Basic training (BT) for 500 facilitators 346 (69.2% of target) ECD
facilitators received Basic
training.
BT of other 140 facilitators not reported.
(1-6) module based parental education
in 5 Districts.
All 5 District's parents received
(1-6 module based parental
education.
Number of participants has not been reported.
Network meeting operation for 80 times Network meeting conducted
for 73 (91.25%) times.
Center
Publication of research based journal on ECD
2.1.5 Analysis of Progress
2.1.5.1 Major Achievements
Central Level
Journal publication has been complete for six activities but other five activities were not properly
completed for Central level for the ECED component.
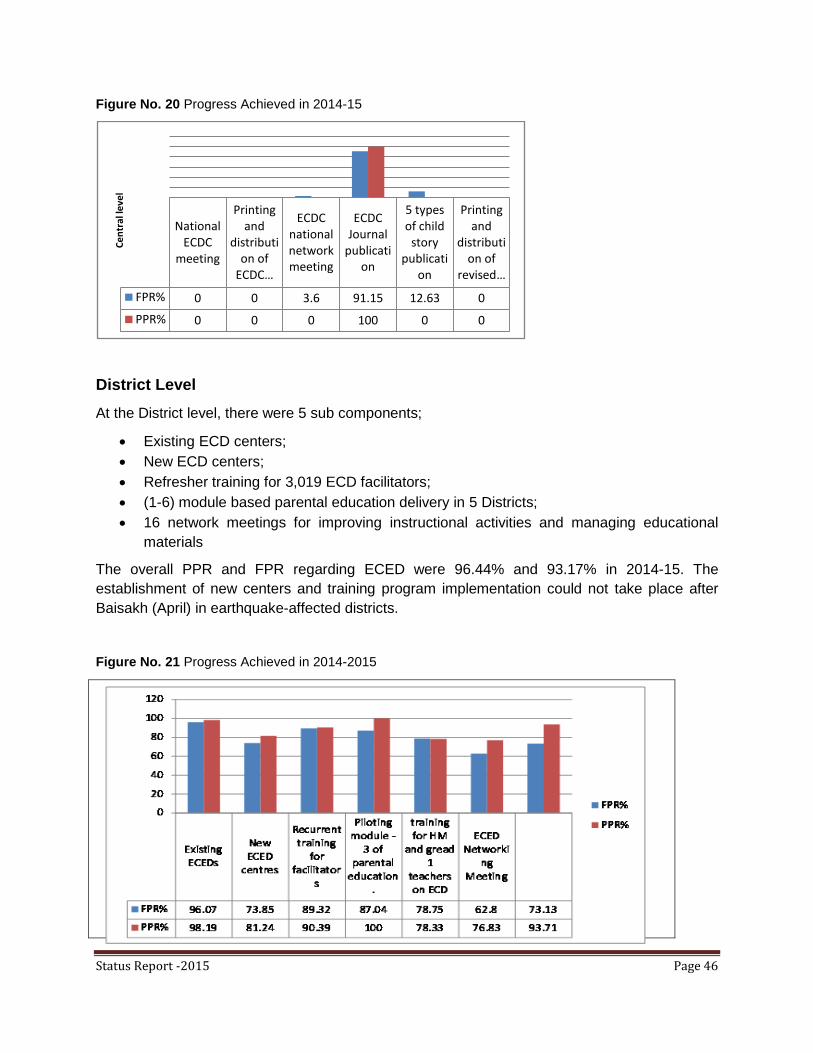
Status Report -2015 Page 46
Figure No. 20 Progress Achieved in 2014-15
District Level
At the District level, there were 5 sub components;
Existing ECD centers;
New ECD centers;
Refresher training for 3,019 ECD facilitators;
(1-6) module based parental education delivery in 5 Districts;
16 network meetings for improving instructional activities and managing educational
materials
The overall PPR and FPR regarding ECED were 96.44% and 93.17% in 2014-15. The
establishment of new centers and training program implementation could not take place after
Baisakh (April) in earthquake-affected districts.
Figure No. 21 Progress Achieved in 2014-2015
National ECDC
meeting
Printing and
distribution of
ECDC …
ECDC national network meeting
ECDC Journal
publication
5 types of child
story publicati
on
Printing and
distribution of
revised …
FPR% 0 0 3.6 91.15 12.63 0
PPR% 0 0 0 100 0 0
Ce
ntr
al le
vel

Status Report -2015 Page 47
2.1.5.2 Innovations and Case Studies
i. DEO Dolakha monitored the ECEDs at the community level, after which it restructured the
ECD centers taking primariy the number of regular students into account. It has also
instigated NGOs working in the District to invest in the child education sector, which has in
turn motivated local bodies (DDC and VDCs) to support the ECD sector.
ii. A majority of District Education Offices prepared ECD profiles. DEO Surkhet included
conducted workshops on the preparation of educational materials focused on improved
quality of ECD centers. Similarly, some DEOs such as Kathmandu, Lalitpur, Palpa and
Ramechhap strengthened ECD centers closely working with DDC.
iii. Many Districts developed their funds for the midday meals for children in ECD classes. In
Palpa District, the village and municipal child protection committees coordinated to develop
the fund for midday meals.
iv. DEO Manang arranged inter-ECD center visits for facilitators to share their experiences and
observe best practices from top performing centers.
v. Kathmandu District mobilized DDC, Municipality and VDC to supervise installation of
carpeting on the floor in the ECD classroom and provision of educational materials in ECD
classes. DEO Syangja collaborated with local agencies for tiffin box management and with
guardians for the management of midday meals.
vi. In the districts, Education Networks (network of DEO, I/NGOs, and local bodies) have been
formed and activated. The network supports DEOs to implement the educational programs
effectively and to build up the capacity of the school stakeholders.
2.1.5.3 Areas for the improvement
i. The quality of facilitators as well as the classrooms has to be enhanced from the
viewpoint of local ownership, awareness and resources.
ii. Access for vulnerable and disadvantaged groups has to be increased.
iii. The distribution of ECD centers at the districts has to be properly balanced.
2.1.5.4 Constraints
The quantitative achievements of the ECED program are positive and exciting. There are some
praiseworthy achievements and progress in some Districts with the joint collaboration of
NGOS/INGOS and local bodies. However, there are some constraints, which hinder the
effective and efficient implementation of the program. These include:
i. Quality: There are some spaces for the improvement of the quality of basic training for
facilitators. Refresher trainings and further learning opportunities for facilitators, as well as
physical aspects of the ECD centers, are still low priority areas for the schools and the
communities.
ii. Facilitators‟ discontinuation: Discontinuation of facilitators has been a big challenge. Large
numbers of ECD facilitators leave the job because of poor remuneration, opportunity of
employment elsewhere and others.

Status Report -2015 Page 48
iii. Motivational factors: Incentives for ECD facilitators, insufficient materials and low priority of
schools in the community were the major demotivating factors for ECD facilitators.
iv. Ownership: ECD management is the responsibility of local elected bodies according to the
Local Self Government Act 2055. However, due to the absence of elected bodies in local
government for a long time, the MOE has been coordinating the ECD management.
v. Delay in releasing budget: Delay in releasing budget and financial authority has affected
on-time implementation of the programs.
2.1.5.5 Addressing Constraints and Maximizing Achievements
i. Incentives for ECD facilitators have been increased from FY 2013-2014, but this is still
insufficient for their livelihood. Each ECD center is provided NPR 1000 per annum for
managing the learning materials, which is certainly insufficient with the viewpoint of
present market value. However, some of the districts mobilized local resources for
supporting the management costs as well as for providing some extra remuneration to
facilitators. For enhancing the effectiveness of ECD activities, the facilitators‟
remuneration and ECD management cost should be reviewed.
ii. Majority of the districts have emphasized on the need of at least 10 days basic refresher
training programs.
iii. Many Districts have good collaborations with partner organizations such as UNICEF,
Save the Children, Seto Gurans and local bodies such as Municipalities and VDCs in
promoting ECD activities and strengthening their capacity.
iv. Capacity of DEOs should be enhanced in managing ECD centers- to monitor, supervise,
plan for and implement programs in their areas.
v. District level ECD networks must be supported to conduct needs based research
frequently.
vi. RCs as well as local bodies should be made more responsible for the monitoring and
supervision of ECD centers.
vii. Making ECD centers more resourceful and child-friendly through the leadership of a
trained facilitator is the prime concern of ECD stakeholders. It may be possible to assign
local bodies as caretakers.
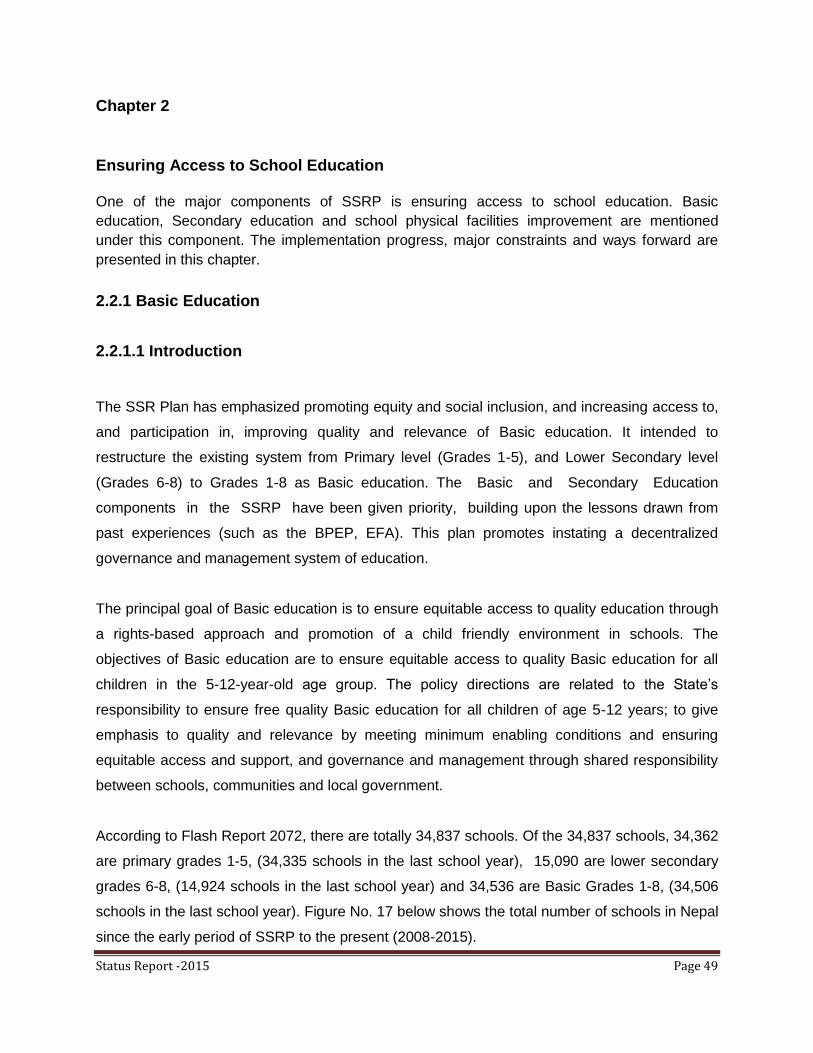
Status Report -2015 Page 49
Chapter 2
Ensuring Access to School Education
One of the major components of SSRP is ensuring access to school education. Basic
education, Secondary education and school physical facilities improvement are mentioned
under this component. The implementation progress, major constraints and ways forward are
presented in this chapter.
2.2.1 Basic Education
2.2.1.1 Introduction
The SSR Plan has emphasized promoting equity and social inclusion, and increasing access to,
and participation in, improving quality and relevance of Basic education. It intended to
restructure the existing system from Primary level (Grades 1-5), and Lower Secondary level
(Grades 6-8) to Grades 1-8 as Basic education. The Basic and Secondary Education
components in the SSRP have been given priority, building upon the lessons drawn from
past experiences (such as the BPEP, EFA). This plan promotes instating a decentralized
governance and management system of education.
The principal goal of Basic education is to ensure equitable access to quality education through
a rights-based approach and promotion of a child friendly environment in schools. The
objectives of Basic education are to ensure equitable access to quality Basic education for all
children in the 5-12-year-old age group. The policy directions are related to the State‟s
responsibility to ensure free quality Basic education for all children of age 5-12 years; to give
emphasis to quality and relevance by meeting minimum enabling conditions and ensuring
equitable access and support, and governance and management through shared responsibility
between schools, communities and local government.
According to Flash Report 2072, there are totally 34,837 schools. Of the 34,837 schools, 34,362
are primary grades 1-5, (34,335 schools in the last school year), 15,090 are lower secondary
grades 6-8, (14,924 schools in the last school year) and 34,536 are Basic Grades 1-8, (34,506
schools in the last school year). Figure No. 17 below shows the total number of schools in Nepal
since the early period of SSRP to the present (2008-2015).
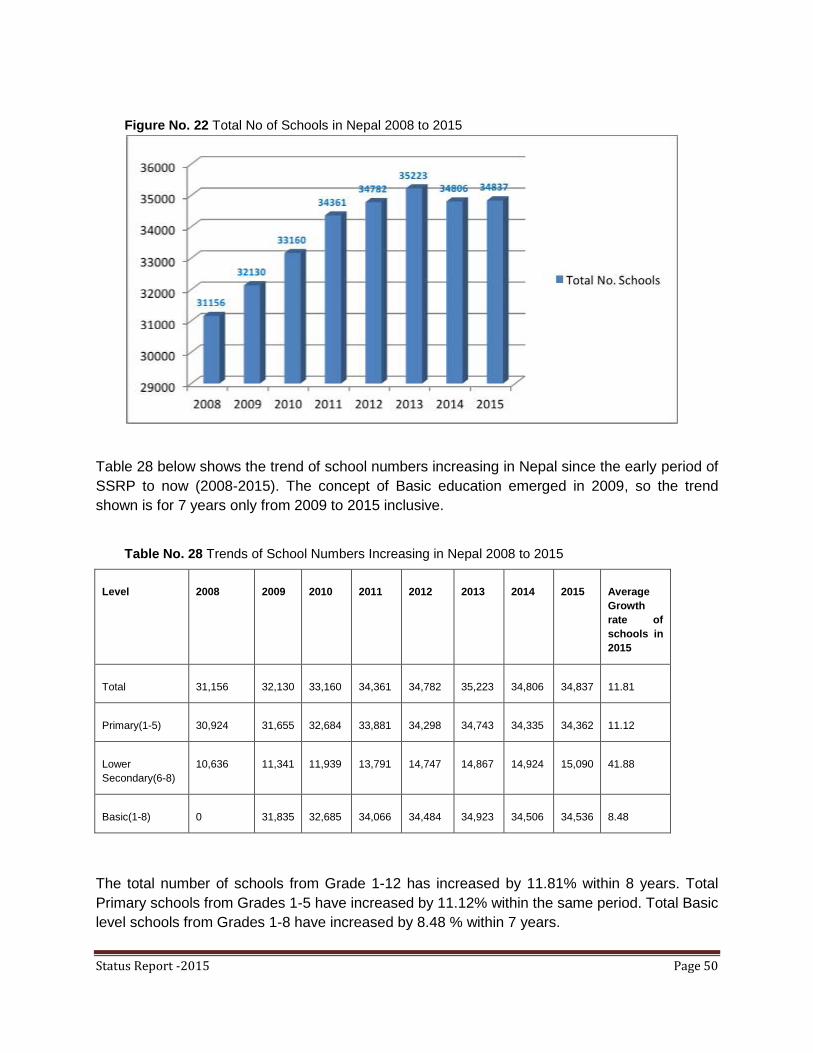
Status Report -2015 Page 50
Figure No. 22 Total No of Schools in Nepal 2008 to 2015
Table 28 below shows the trend of school numbers increasing in Nepal since the early period of
SSRP to now (2008-2015). The concept of Basic education emerged in 2009, so the trend
shown is for 7 years only from 2009 to 2015 inclusive.
Table No. 28 Trends of School Numbers Increasing in Nepal 2008 to 2015
Level 2008 2009 2010 2011 2012 2013 2014 2015 Average
Growth
rate of
schools in
2015
Total 31,156 32,130 33,160 34,361 34,782 35,223 34,806 34,837 11.81
Primary(1-5) 30,924 31,655 32,684 33,881 34,298 34,743 34,335 34,362 11.12
Lower
Secondary(6-8)
10,636 11,341 11,939 13,791 14,747 14,867 14,924 15,090 41.88
Basic(1-8) 0 31,835 32,685 34,066 34,484 34,923 34,506 34,536 8.48
The total number of schools from Grade 1-12 has increased by 11.81% within 8 years. Total
Primary schools from Grades 1-5 have increased by 11.12% within the same period. Total Basic
level schools from Grades 1-8 have increased by 8.48 % within 7 years.

Status Report -2015 Page 51
Figure No. 23 Trend of Average Growth of schools 2008 to 2015
Total Lower Secondary schools from Grades 6-8 have increased by 41.88% within 8 years.
According to Flash Report 2072, of the total 34,837 schools, 930 schools are religious schools,
including Madarasa, Gumba/Vihar and Ashram/Gurukul, and of these, 912 schools are Primary
level and 58 are Lower Secondary level. Of the 930 schools, 764 are Madarasa, 80
Gumba/Vihar and 86 are Asharam/Gurukul schools.
From the beginning of the SSRP, considerable effort is being made to ensure equitable access
to quality basic education. Aligning with the constitution of Nepal, the GON has decided to
implement free education up to Grade 8 and has prioritized several incentive schemes to
support the schooling of children and to ensure that Minimum Enabling Conditions (MECs) are
in place in all schools for the delivery of quality education. The provision of free Basic education
includes the waiving of admission, tuition, examination fees and the cost of textbooks.
Moreover, the GON has also expressed its commitment to make Basic Education compulsory.
Gradual implementation of this commitment has begun in selected VDCs of all 75 Districts.
2.2.1.2 ASIP Priorities
The ASIP/AWPB 2014/2015 set the following strategic priorities and strategies for the effective
implementation of the Basic education program, which also address the MTR recommendations
on quality and equity challenges.
Strategic Priorities
ASIP/AWPB 2014/2015 has set the following priorities ensuring access to the school education
programs component.
Status Report -2015 Page 52
Compulsory Basic education that is being piloted will be strengthened. In 10 identified Districts
Free and Compulsory Basic education will be implemented. In addition to this, as mentioned in
the access to out-of-school children strategy implementation plan, alternative strategies will be
implemented. Focused interventions will be carried out to bring out-of-school children into the
system. The ongoing program of teacher redeployment will continue. In order to ensure quality
education at the Basic level, resources will be channeled to schools based on the PMEC survey
findings to provide support to meet the PMECs in at least 20% of additional schools. A database
for individual scholarship recipient students' details will be established. In the selected schools
of the Districts, reading skills development support will be provided to manage the book
corner/library.
Based on the recommendations of the study report on textbooks, further strategies will be
developed to ensure quality printing and timely distribution of textbooks and the role of JEMC
and the private sector will be clearly defined and strongly monitored. A competency-based
curriculum for Grades 6-8 has been developed. Based on this curriculum, textbooks will be
developed and piloted in selected schools. The student assessment system will be carried out
at different levels: i) schools having up to Grade 3 student assessment as the highest Grade will
be coordinated and carried out by RCs and leader schools; ii) Grade 5 student assessment will
be coordinated and carried out by the Resource Center, and iii) Grade 8 student assessments
will be coordinated and carried out by the District. Student incentive programs such as
scholarships and the midday meal will continue and be prioritized to ensure their on time
availability.
Strategies
Strategies for Basic education are in line with DOE's long-term goals and objectives for school
education for Grades 1-8. The following strategies were proposed to face the access, quality
and equity challenges in Basic education.
Improving Access and Equity
1. Free and Compulsory Basic Education (FCBE) will be implemented in a phased manner.
DEOs will provide technical and logistical support in line with the CBE model and
according to the eligibility criteria provided by DOE to VDCs and Municipalities.
International NGOs and CBOs will be actively engaged in aligning their commitments
and support at District and VDC level with the CBE model and the prioritized VDCs, as
identified by the DEO in the Districts.
2. I/NGOs will, in close coordination with DEOs, VDCs/VECs that have large numbers of
Out-of-School Children (OOSC), seek the support of DOE/DEO through the CBE model.
Additional needs-based interventions will be provided to strengthen enrolment and
participation in education to severely deprived communities, such as Raute, Chepang,
Mushahar, Badi, etc.
3. At the outset, the selected VDCs, where CBS data has showed that there are significant
numbers of OOSC, will be supported as per the need identified through mapping of

Status Report -2015 Page 53
OOSC. This will exclude Districts and VDCs which already have intensive support
through other programs, such as the Karnali zone and CBE Districts/VDCs.
4. MOE will coordinate with the MOFALD where possible to mobilize its' resources through
DDC and VDC/Municipalities to support effective implementation of Free and
Compulsory education. MOE will consistently follow-up with the MOFALD and MOF for
the allocation of at least 20% of the local funds to be spent in education development
within each VDC/municipalities
5. Based on needs identified by DEOs, Schools with residential facilities for OOSC children
will be provided in Districts where mainstreaming measures are not feasible. In addition,
residential schools will be run in Manang, Mustang, Upper Dolpa, Rasuwa, Upper Mugu,
Upper Humla Districts on a model basis.
6. Alternative modes of schooling will be strengthened in areas with a high proportion of
OOSC to address the learning needs of those children who are unlikely to be enrolled in
school due to their age. Within this, partnerships and collaboration with GOs, I/NGOs
and other providers will be initiated to share expertise, experiences and resources in
implementing these programs.
7. DEOs will promote Community Learning Centers (CLCs) in collaboration with local
NGOs, VDCs and Municipalities for working children and street children to develop a
profile of such children.
8. Efforts will be made to improve the enrolment and pass rates and to reduce dropout and
repetition rates by strengthening Child- Friendly School (CFS) learning environments,
ensuring PMEC and child centered learning practices in schools.
9. Incentives will be provided to community schools that meet 100% retention (no dropout
and no repetition) in Grade 1 and achieve over 95% cycle completion rate at the end of
grade five. In addition, DEO will publicly recognize SMC members of schools that meet
100% retention.
10. In areas where seasonal migration is a common phenomenon, mobile schools will
continue to operate.
11. Incentives and scholarship schemes will continue to support schooling of girls, Dalits and
children with disabilities including other disadvantaged and marginalized communities.
Increasing access and promoting equity and social inclusion in school education will be
at the core of the incentives and scholarship program. For further alignment, integrated
Scholarship Guidelines will specify the distribution mechanisms and the targeting criteria
for scholarships and other incentives to strengthen a targeted needs based approach.
Scholarship distribution and monitoring mechanisms will be strengthened through a „one
door‟ system. In Districts where Poverty Cards have been issued, all children of poverty
card holders will receive scholarships. In other Districts, intermediate ways will be
developed to support children belonging to poor families, regardless of their ethnicity,
until poverty cards have been issued.
12. A comprehensive package for Parenting Education will be developed. The package will
be run in partnership with I/NGOs in the District, prioritizing Districts/VDCs with high
numbers of OOSC. Such parenting education will focus on providing parents with Basic
literacy and numeracy and on making them aware of the value of education and how to
establish an education-enabling learning environment at home.

Status Report -2015 Page 54
13. NCED will develop and run teacher training programs in MLE, and disabled-friendly
learning & teaching for school teacher, as per identified needs. The opportunities for
demand-based multilingual education will be expanded by developing MLE capacity of
teacher and providing teaching and learning materials in the mother tongue. The
development of a comprehensive language policy including the use of the mother tongue
Nepali, and English, will be pursued, based on a joint study of the challenges and
opportunities with regards to Medium of Instruction (MOI) in Nepal.
Quality and relevance
1. School mapping, IEMIS data, SIP/VEP and PMECs survey reports will be used to
determine a school‟s physical and educational needs and to meet these needs
accordingly.
2. Mandatory provision and regular use of book corners in all community schools will be
prescribed by providing appropriate resources and training to teacher on the purpose &
use of book corners for teaching & learning activities.
3. Action plans for reform interventions based on the National Assessment of Student
Achievement (NASA) findings will be prepared and implemented to strengthen learning
outcomes. The results and recommendations of the NASA reports will inform relevant
priority areas in the ASIP/AWPB. Implementation of the NASA will continue, for the
coming fiscal year, for Grade 3 and 5, and further implementation of NASA will be
pursued through an action plan.
4. Minimum standards for educational settings will be implemented, improving quality of
education at all levels by focusing on student-centered learning/teaching methods. In
order to foster quality and relevance, performance-based incentives for schools and
teacher will be reviewed and implemented. The schemes will be updated annually based
on critical M&E of their effectiveness and impact. The teacher-student ratio will be
reviewed for the recruitment and (re)deployment of teacher.
5. The Continuous Assessment System (CAS) will be strengthened with CDC developing
Grade-specific remedial courses and NCED developing a more comprehensive training
package focusing on CAS and remedial classes. All teacher will receive CAS and
remedial training.
6. CDC will develop Grade-wise minimum achievement levels of students with specific
focus on reading levels among students in Grade 1-3. For this purpose, Early Grade
Reading Assessment (EGRA) tools will be reviewed and adjusted to measure students
learning outcomes accordingly and meet the need for EGRA. EGRA tools will be used to
assess students‟ reading competency in Grades 1-3. DEOs with support from ERO will
assess students‟ progress in reading levels annually and will recognize teacher whose
students achieve the highest reading level in the District. The Government will
implement a National Early Grade Reading Program (NEGRP) focused on strengthening
literacy skills in Grades 1-3. Within the next two years, MOE/DOE will develop a
comprehensive program on NEGRP and will pilot several models of intervention in
selected Districts and schools.
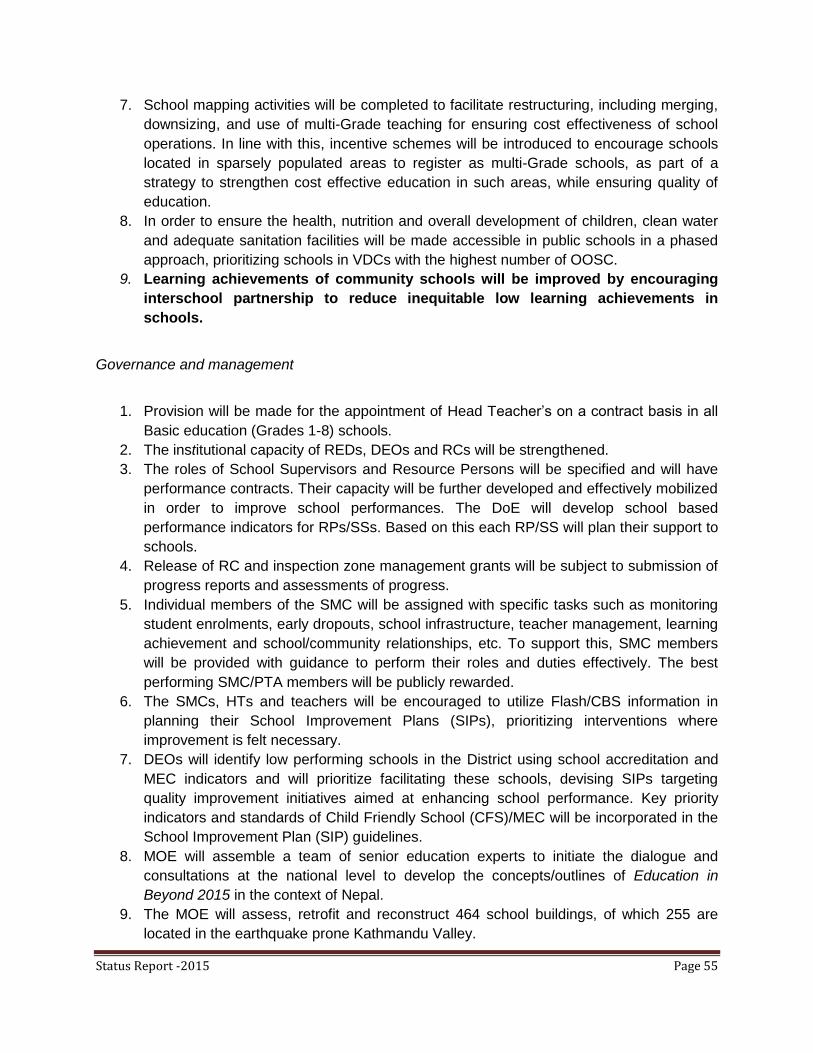
Status Report -2015 Page 55
7. School mapping activities will be completed to facilitate restructuring, including merging,
downsizing, and use of multi-Grade teaching for ensuring cost effectiveness of school
operations. In line with this, incentive schemes will be introduced to encourage schools
located in sparsely populated areas to register as multi-Grade schools, as part of a
strategy to strengthen cost effective education in such areas, while ensuring quality of
education.
8. In order to ensure the health, nutrition and overall development of children, clean water
and adequate sanitation facilities will be made accessible in public schools in a phased
approach, prioritizing schools in VDCs with the highest number of OOSC.
9. Learning achievements of community schools will be improved by encouraging
interschool partnership to reduce inequitable low learning achievements in
schools.
Governance and management
1. Provision will be made for the appointment of Head Teacher‟s on a contract basis in all
Basic education (Grades 1-8) schools.
2. The institutional capacity of REDs, DEOs and RCs will be strengthened.
3. The roles of School Supervisors and Resource Persons will be specified and will have
performance contracts. Their capacity will be further developed and effectively mobilized
in order to improve school performances. The DoE will develop school based
performance indicators for RPs/SSs. Based on this each RP/SS will plan their support to
schools.
4. Release of RC and inspection zone management grants will be subject to submission of
progress reports and assessments of progress.
5. Individual members of the SMC will be assigned with specific tasks such as monitoring
student enrolments, early dropouts, school infrastructure, teacher management, learning
achievement and school/community relationships, etc. To support this, SMC members
will be provided with guidance to perform their roles and duties effectively. The best
performing SMC/PTA members will be publicly rewarded.
6. The SMCs, HTs and teachers will be encouraged to utilize Flash/CBS information in
planning their School Improvement Plans (SIPs), prioritizing interventions where
improvement is felt necessary.
7. DEOs will identify low performing schools in the District using school accreditation and
MEC indicators and will prioritize facilitating these schools, devising SIPs targeting
quality improvement initiatives aimed at enhancing school performance. Key priority
indicators and standards of Child Friendly School (CFS)/MEC will be incorporated in the
School Improvement Plan (SIP) guidelines.
8. MOE will assemble a team of senior education experts to initiate the dialogue and
consultations at the national level to develop the concepts/outlines of Education in
Beyond 2015 in the context of Nepal.
9. The MOE will assess, retrofit and reconstruct 464 school buildings, of which 255 are
located in the earthquake prone Kathmandu Valley.

Status Report -2015 Page 56
2.2.1.3 Achievement against Indicators
The enrollment of students in Primary and Basic level schools has decreased in the six years
from 2009 to 2015; however, the enrollment of students at Lower Secondary and Secondary
levels has increased.
Table No. 29 Trend in Total Number of Enrolments at Primary, Lower Secondary and Basic Levels 2009-
2015
Level 2009 2010 2011 2012 2013 2014 2015 AAGR
Primary (1-5) 4,900,663 4,951,956 4,782,885 4,576,693 4,401,780 4,335,355 4,220,061 -14
Lower
Secondary (6-8) 1,604,422 1,699,927 1,812,680 1,823,192 1,828,351 1,835,313 1,862,183 16
Basic
(1-8) 6,505,085 6,651,883 6,595,565 6,399,885 6,230,131 6,170,668 8,082,244 -7
Note: Average Annual Growth Rate (AAGR)
The trend shows that the total enrollment of students at Primary and Basic level has decreased
to 14% and 7.0% respectively. The total enrollment of students in Lower Secondary level has
increased between 2009 and 2015. Based on Flash Report 2072, the progress achieved against
key performance indicators can be observed from 2008 to 2015. The following table presents a
summary of the current status of the KPIs of Primary, Lower Secondary and Basic levels.
Table No. 30 SSRP Indicators at Primary, Lower Secondary and Basic Levels
Indicators
2008 2009 2010 2011 2012 2013 2014 2015
Achievement in %
GIR at Grade 1 147.7 144 142.4 140.7 141.2 141.8 137.0 135.5
NER at Grade 1 83.1 86.4 89 90.7 91.2 91.6 93.0 93.8
GER
Grades 1-5 142.8 141.4 139.5 135.9 130 136.8 134.4 134.0
Grades 6-8 80.1 88.7 94.5 100 100.6 84.3 89.7 95.4
Basic (Grades1-8) 123.3 124.4 123.7 120 115.7 117.1 119.2
NER
Grades 1-5 91.9 93.7 94.5 95.2 95.3 95.6 96.2 96.6
Grades 6-8 57.3 63.2 69.3 70 72.2 72.6 74.6 80.2
Basic (Grades 1-8) 86 86.6 87.5 86.3 87.6 88.7
Coefficient of internal efficiency
Primary
66.5 79.0 80.9 81.5
Source: Data source Flash Report 2072, Status Report 2071 and SSRP Core Document (2009-2015)
Gross Intake Rate (GIR) and Net Enrolment Rate (NER) in Grade 1
The Gross Intake Rate (GIR) and Net Enrollment Rate (NER) are both input indicators relating
to the enrolment in the first Grade at Primary level. GIR indicates the holistic enrollment of

Status Report -2015 Page 57
children in Grade 1 with the coverage of underage, correct age and overage children. NER
indicates the total number of correct new entrants in Grade 1 of five years‟ age, with respect to
the total population of five-year age children or same age. NER does not cover the underage
and over age students within the age specific class. It shows the level of access to Primary
education of the eligible population of Primary school-entrance age.
According to Flash Report 2072, based on the total number of new enrolments in Grade 1 and
the total number of 5 years‟ age group, the overall GIR for Grade 1 is 135.5% with 142.5% for
girls and 129.1% for boys in 2015 and the overall GIR for Grade 1 was 137.0% in the last school
year 2015.
Table No. 31 Comparison of Achievement against the Target of Gross Intake Rate (GIR) in Grade 1 since
2008 to 2015
Year National Target Achievement
2008 141 147.7
2009 148 144.0
2010 144 142.4
2011 140 140.7
2012 137 141.2
2013 133 141.8
2014 130 137.0
2015 133 135.5
Data source Flash Report 2072, Status Report 2071 and SSRP Core Document (2009-2015)
Figure No. 24 Progress Achieved Against the Target of Gross Intake Rate (GIR) in Grade 1 since 2008 to
2015
Data source Flash Report 2072 and SSRP Core Document (2009-2015)

Status Report -2015 Page 58
The national target of GIR for Grade 1 was determined 135% for 2014/2015 but the
target was not meet because of enrollment of underage and overage children in Grade
1. A longer interval is needed to achieve the national target as set in the SSRP Core
document 2009-2015. The overall GIR for Grade 1 varies according to the eco-belts,
shown below in Table No. 32 and Figure No. 25.
Table No. 32 Gross Intake Rate (GIR) in Grade 1, (2015-2016)
Eco-belts Girls Boys Total
Mountain 157.6 138.5 147.6
Hill 143.2 139.2 141.1
Valley 142.4 122.7 131.9
Terai 139.7 122.4 130.6
Total 142.5 129.1 135.5
Data source Flash Report 2072
Figure No. 25 Gross Intake Rate (GIR) in Grade 1, (2015-016)
Data source Flash Report 2072

Status Report -2015 Page 59
According to Flash Report 2072, the overall Net Intake Rate (NER) in Grade 1 is 93.8%
(Compared to 93.0% in the last school year). Flash Report I, 2072 shows that the Net
Enrollment Rate (NER) in Grade 1 has been increasing over the last seven years.
Table No. 33 Progress Achieved Against the Target of Net Intake Rate (NER) for Grade 1 from 2008 to
2015
Year National Target Achievement
2008 78 83.1
2009 81 86.4
2010 83 89.0
2011 86 90.7
2012 88 91.2
2013 91 91.6
2014 94 93.0
2015 96 93.8
Data source Flash Report 2072, Status Report 2071 and SSRP Core Document 2009-2015
Figure No. 26 Progress Achieved Against the Target of Net Intake Rate (NER) in Grade 1 from 2008 to
2015
Data source Flash Report 2072 and SSRP Core Document 2009-2015
The pre-set national target for 2015/016 has not been met because all the age group students
could not reach school.
Table No. 34 Net Enrollment Rate (NER) in Grade 1, (2015-2016)

Status Report -2015 Page 60
Eco-belts Girls Boys Total
Mountain 94.8 94.1 94.5
Hill 94.2 95.0 94.6
Valley 92.8 96.1 94.6
Terai 93.5 92.9 93.2
Total 93.8 93.9 93.8
Data source Flash Report 2015-2016
The table above and graph below shows that the NER is marginally higher for boys than for
girls. It also indicates that the enrollment of five-year-old children in Grade 1 is not increasing,
with 3.4% students still out-of-school, indicating additional steps need to be taken to target out-
of-school children to enable them to attend formal schooling. Table No. 34 and Figure No. 27
below represent the overall scenario and status of NER in Grade 1 based on gender and eco-
belts.
Between the eco-belts, there is little difference with regard to NER in Grade 1; the Valley and
Hill eco-belts show the highest NER (94.6%) followed by the Mountain eco-belt, with the Terai
eco-belt having the lowest NER (93.2%). The NER has increased by 0.8% points in the last
school year.
Figure No. 27 Net Enrollment Rate (NER) in Grade 1, 2015-2016
Data source Flash
Report 2071.
Gross and Net
Enrolment
Rate (GER and NER) at Primary, Lower Secondary and Basic Levels

Status Report -2015 Page 61
The Gross Enrollment Rate (GER) and Net Enrollment Rate (NER) pertain to enrolment in
Primary level. The GER represents the level-wise, total sum of children in Primary level from
class one to five, including underage, correct age and overage children. NER however
represents new enrollments of children 5-9 years of age (correct aged children) in Primary level
with respect to the total population of 5-9 year olds. NER does not include children aged below
five years (underage) or above 9 years (overage) within the age specific classes (5-9).
Table No. 35 Gross Enrolment Rate (GER) of Primary, Lower Secondary and Basic Level in (2015-2016)
Level GER NER
Girls Boys Total GPI Girls Boys Total GPI
Primary(1-5) 140 128.2 134.0 1.09 96.2 96.9 96.6 0.99
Lower Secondary(6-8) 98.9 91.9 95.4 1.08 81.6 80.2 80.9 1.02
Basic(1-8) 124.1 114.5 119.2 1.08 88.9 88.6 88.7 1.00
Data source Flash Report 2015-2016.
Table 35 and Figure 28 show the gross enrollment trends at Primary level. According to Flash
Report 2015-2016, the total GER at Primary level is 134.4%, with 140.0% for girls and 128.2%
for boys. GER is decreasing in comparison with last year. The GER decreased in 2014 because
of the decrease in the population growth rate, verified in Flash Reports from responsible
authorities and with the use of student database software in Districts.
Figure No. 28 Gross Enrolment Rate (GER) by levels in 2014/2015
Data source Flash Report 2071.
According to Flash Report 2015-2016, the total GER at Lower Secondary level is 95.4% with
GER of 98.9% for girls and GER of 91.9% for boys. When compared with the status of the

Status Report -2015 Page 62
previous year (89.7% total, 92.0% for girls and 87.4% for boys) the GER in total, as well as for
both genders, has increased in the current school year.
Figure 29 demonstrates GER at Lower Secondary level increased from last year.
Table No. 36 Progress Achieved against the Target of GER at Lower Secondary Level from 2008 to 2015
Year
Progress
Achievement
2008 80.1
2009 88.7
2010 94.5
2011 100
2012 100.6
2013 84.3
2014 89.7
2015 95.4
The GER of Primary level, Lower Secondary level and Basic level 1-8 for 2014/2015 is
demonstrated above in Figure 29. Primary level achieved a higher GER than Basic and Lower
Secondary levels.
Figure No. 29 Progress Achieved against the Target GER for Lower Secondary Level from 2008 to 2015
According to Flash Report 2015-2016, the total GER for Basic level is 119.2%, with 124.1% for
girls and 114.5% for boys respectively (as compared to 117.1% in the last school year).
Progression of the GER at Basic level from 2008 to 2015 is given below in Table 37.
Table No. 37 Achievement against the Target for Gross Enrollment Rate (GER) for Basic Education from
2009 to 2015
Year National Target Achievement
2008 116
2009 123 123.3

Status Report -2015 Page 63
2010 125 124.4
2011 128 123.7
2012 130 120
2013 132 115.7
2014 132 117.1
2015 131 119.2
Data source Flash Report 2072, Status Report 2071 and SSRP Core Document 2009-2015
The GER in Basic levels (1-8) for 2015-2016 is demonstrated above in Table 37 and the
subsequent progress of GER for Basic levels from 2008 to 2015 is given below in Figure 30.
Figure No. 30 Achievement against the Target for Gross Enrollment Rate (GER) in Basic Education from
2009 to 2015.
Data source Flash Report 2072, Status Report 2071 and SSRP Core Document 2009-2015
This shows that there was a small increase in the GER at the Basic level over the last school
year. When we compare the GER for Basic level from 2008 to 2015, it shows that the pre-set
national target was achieved.
The GER will be decreased further in the planned implementation period. Firstly, this means
that the total enrollment of under-age and over-age students (5-12) will be reduced at the Basic
level. Secondly, there is still both low enrollment and significant drop out rates of students in
Lower Secondary level classes (6-8), so the GER of Basic level is reducing each year instead of
increasing to meet the national target of 131.
According to Flash Report 2072, the overall NER at Primary level is 96.6%, with 96.2% for girls
and 96.9% for boys respectively for 2015. When compared with the status of last year (96.2%
total, 95.7% for girls and 96.6% for boys), the NERs for both girls and boys, as well as in total,
have increased.
Table No. 38 Net Enrolment Rate (NER) by Levels in (2015-2016)
Level NER
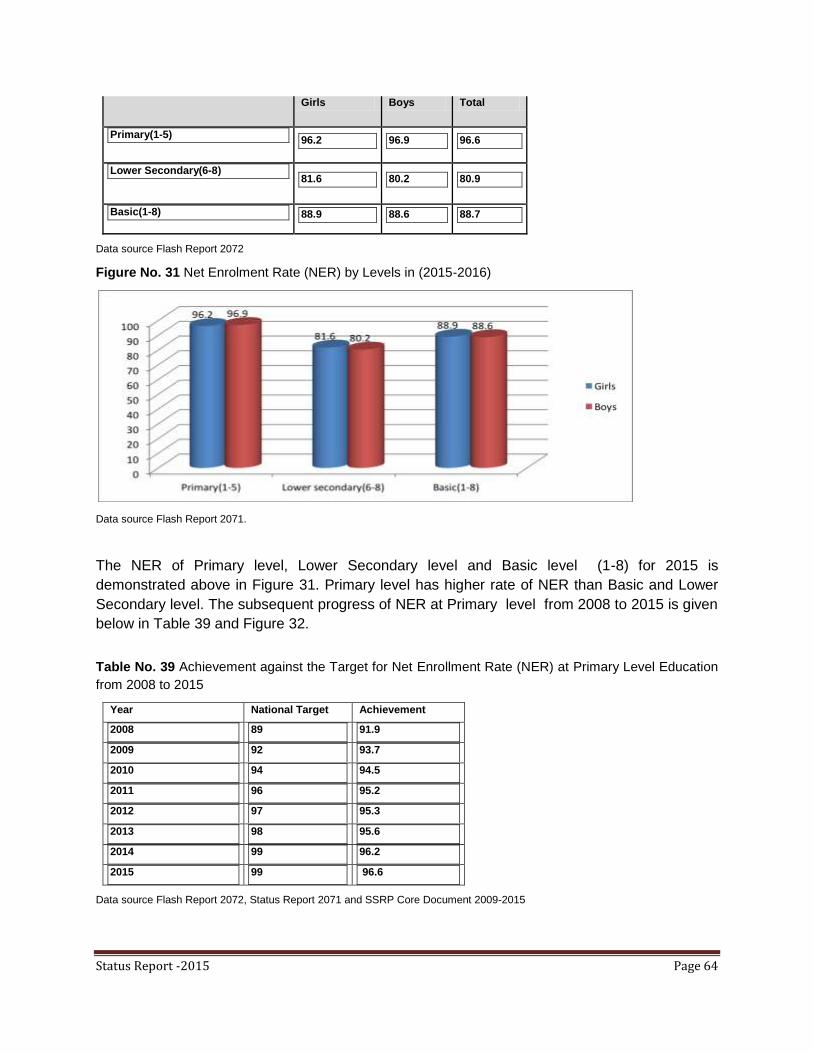
Status Report -2015 Page 64
Girls Boys Total
Primary(1-5) 96.2 96.9 96.6
Lower Secondary(6-8) 81.6 80.2 80.9
Basic(1-8) 88.9 88.6 88.7
Data source Flash Report 2072
Figure No. 31 Net Enrolment Rate (NER) by Levels in (2015-2016)
Data source Flash Report 2071.
The NER of Primary level, Lower Secondary level and Basic level (1-8) for 2015 is
demonstrated above in Figure 31. Primary level has higher rate of NER than Basic and Lower
Secondary level. The subsequent progress of NER at Primary level from 2008 to 2015 is given
below in Table 39 and Figure 32.
Table No. 39 Achievement against the Target for Net Enrollment Rate (NER) at Primary Level Education
from 2008 to 2015
Year National Target Achievement
2008 89 91.9
2009 92 93.7
2010 94 94.5
2011 96 95.2
2012 97 95.3
2013 98 95.6
2014 99 96.2
2015 99 96.6
Data source Flash Report 2072, Status Report 2071 and SSRP Core Document 2009-2015
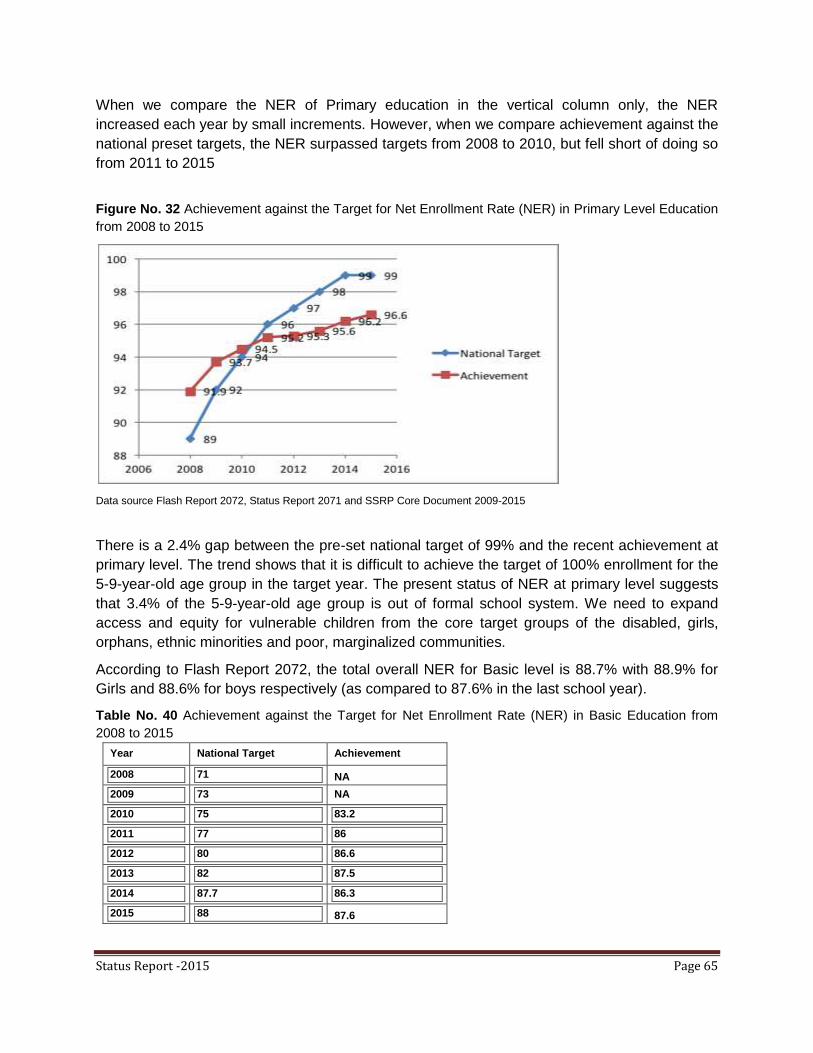
Status Report -2015 Page 65
When we compare the NER of Primary education in the vertical column only, the NER
increased each year by small increments. However, when we compare achievement against the
national preset targets, the NER surpassed targets from 2008 to 2010, but fell short of doing so
from 2011 to 2015
Figure No. 32 Achievement against the Target for Net Enrollment Rate (NER) in Primary Level Education
from 2008 to 2015
Data source Flash Report 2072, Status Report 2071 and SSRP Core Document 2009-2015
There is a 2.4% gap between the pre-set national target of 99% and the recent achievement at
primary level. The trend shows that it is difficult to achieve the target of 100% enrollment for the
5-9-year-old age group in the target year. The present status of NER at primary level suggests
that 3.4% of the 5-9-year-old age group is out of formal school system. We need to expand
access and equity for vulnerable children from the core target groups of the disabled, girls,
orphans, ethnic minorities and poor, marginalized communities.
According to Flash Report 2072, the total overall NER for Basic level is 88.7% with 88.9% for
Girls and 88.6% for boys respectively (as compared to 87.6% in the last school year).
Table No. 40 Achievement against the Target for Net Enrollment Rate (NER) in Basic Education from
2008 to 2015
Year National Target Achievement
2008 71 NA
2009 73 NA
2010 75 83.2
2011 77 86
2012 80 86.6
2013 82 87.5
2014 87.7 86.3
2015 88 87.6
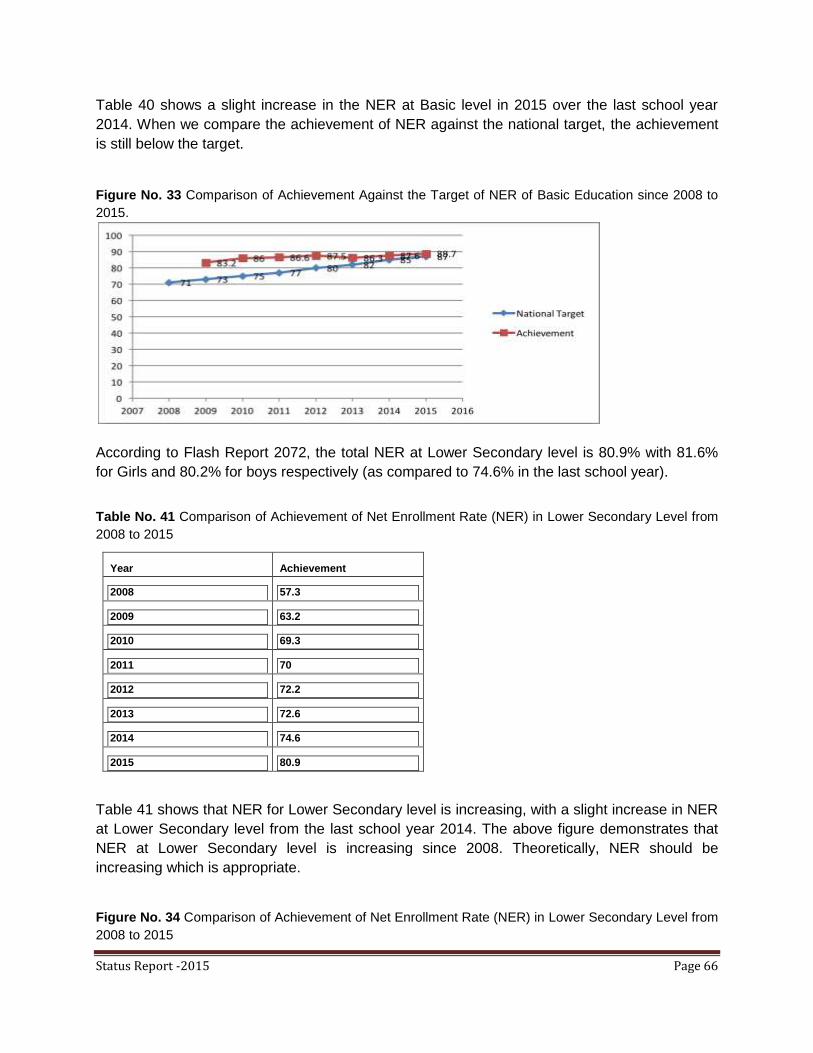
Status Report -2015 Page 66
Table 40 shows a slight increase in the NER at Basic level in 2015 over the last school year
2014. When we compare the achievement of NER against the national target, the achievement
is still below the target.
Figure No. 33 Comparison of Achievement Against the Target of NER of Basic Education since 2008 to
2015.
According to Flash Report 2072, the total NER at Lower Secondary level is 80.9% with 81.6%
for Girls and 80.2% for boys respectively (as compared to 74.6% in the last school year).
Table No. 41 Comparison of Achievement of Net Enrollment Rate (NER) in Lower Secondary Level from
2008 to 2015
Year Achievement
2008 57.3
2009 63.2
2010 69.3
2011 70
2012 72.2
2013 72.6
2014 74.6
2015 80.9
Table 41 shows that NER for Lower Secondary level is increasing, with a slight increase in NER
at Lower Secondary level from the last school year 2014. The above figure demonstrates that
NER at Lower Secondary level is increasing since 2008. Theoretically, NER should be
increasing which is appropriate.
Figure No. 34 Comparison of Achievement of Net Enrollment Rate (NER) in Lower Secondary Level from
2008 to 2015
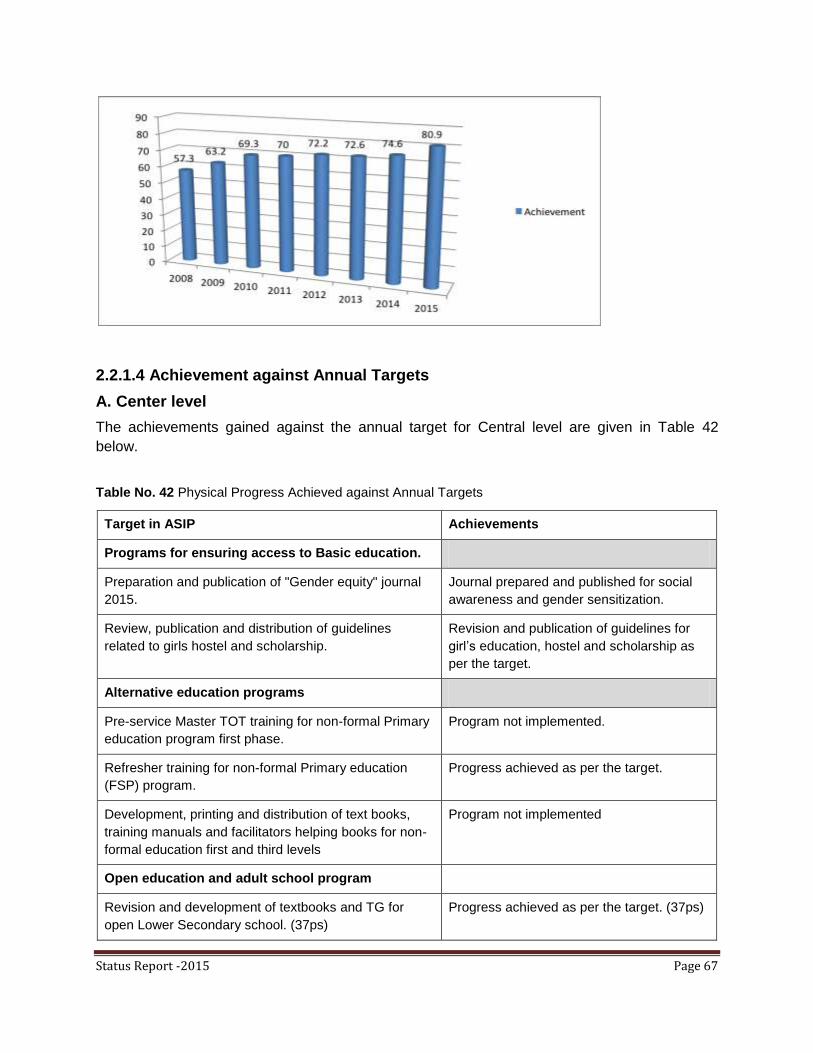
Status Report -2015 Page 67
2.2.1.4 Achievement against Annual Targets
A. Center level
The achievements gained against the annual target for Central level are given in Table 42
below.
Table No. 42 Physical Progress Achieved against Annual Targets
Target in ASIP Achievements
Programs for ensuring access to Basic education.
Preparation and publication of "Gender equity" journal
2015.
Journal prepared and published for social
awareness and gender sensitization.
Review, publication and distribution of guidelines
related to girls hostel and scholarship.
Revision and publication of guidelines for
girl‟s education, hostel and scholarship as
per the target.
Alternative education programs
Pre-service Master TOT training for non-formal Primary
education program first phase.
Program not implemented.
Refresher training for non-formal Primary education
(FSP) program.
Progress achieved as per the target.
Development, printing and distribution of text books,
training manuals and facilitators helping books for non-
formal education first and third levels
Program not implemented
Open education and adult school program
Revision and development of textbooks and TG for
open Lower Secondary school. (37ps)
Progress achieved as per the target. (37ps)

Status Report -2015 Page 68
Target in ASIP Achievements
Printing and distribution of first level textbooks and TG. Program not implemented.
Inclusive education program
5 days orientation program on inclusive education for
HT of the school having resource class
Program conducted as per the target.
3 days interaction program of stakeholders on multi-
language teaching extension program.
Program not conducted
6 days training for mathematics and science teacher of
the schools with resource classes for blind students.
Program not conducted
Printing and distribution of brail books for Grades (1-
12).
Program not conducted
Conducting meetings for operating religious schools. Progress achieved as per the target.
Textbook development, printing and distribution for (
Class 4- Magar & Dhimal; Class 5 - Tamang Sambhota
and Class 2 Bajjika and Kulung)
Progress achieved as per the target.
Class 5's four subjects' textbook development of
Madarasa
Program not conducted
Translation in English of Grade 8 textbooks (6 subjects) Progress achieved as per the target.
Curriculum development of Gurukul education Grade
7's four subjects ( Ethics, Jyotish and social studies )
Progress achieved as per the target.
Interaction program for operating religious type of
schools such as Gurukul & Ashram effectively
Progress achieved as per the target.
B. District level
The achievements gained against the annual target for District level are given in Table 43
below.
Table No. 43 Physical Progress Achieved against Annual Targets
Target in ASIP Achievements Remarks
Operation of existing 235 flexible schooling
program (FSP) Centers
58 (54.35%) Centers
operated
177 centers found
under-reported (only
partially reported)
Remuneration for 235 facilitators 132 (56.17%) facilitators
received remuneration
Remuneration of 103
facilitators under-
reported.
Textbooks and SIP supports through mother 2,045 (43.51%) schools 2,655 students found

Status Report -2015 Page 69
Target in ASIP Achievements Remarks
school for 4,700 students received support through
mother schools
under-reported
Operation of 37 Open schools (Grades 6-8)
level I and II
32 (86.49%) schools
operated
5 schools found
under-reported.
Textbooks and SIP supports through mother
school for 37 schools
31 (83.78%) schools received
support through mother
schools.
6 schools found
under-reported
Operation of 304 non-formal adult schools for
women
160 (52.63%) schools
operated
144 schools found
under-reported
Operation of 7 mobile schools 2 (28.57%) schools operated 5 schools found
under-reported.
Continuity of student enrollment and
improvement in 80 centers (DEOs and REDs)
74 (92.50%) centers
completed
6 centers were
under-reported.
Operation of 380 residential Resource Centers 359 (94.47) RCs operated 21 RCs found under-
reported.
Management costs for 380 resource classes 337 (88.68) classes received 43 classes were
under-reported
Operation of 62 Assessment Centers 60 (96.77) centers operated
2 centers found
under-reported
Scholarship distribution for 46,476 disabled
students of class's 1-8
Scholarship distributed for
32,258 (69.41%) disabled
students
14,218 students were
under-reported
Co-curricular activities for disabled students in
74 Districts
Activities conducted in 66
(89.19%) Districts
8 Districts found
under-reported.
Training for deaf resource teacher at 20 schools Training conducted at 16
(80%) schools
4 schools found
under-reported
Preparation of profile of NGOs & CBOs working
in the area of girls education and profile
dissemination to strengthen girls education
network (80 times)
Preparation of profile and
girls education network 66
(82.50%) times
14 times found
Implementation of comprehensive compulsory
Basic education in 21 Districts for 113 schools 113 (100%) schools received.
Programs for Free and Compulsory Basic
education for 50 persons
Program conducted for 50
(100%) persons
Special educational program for 29 children
from marginalized (Raute, Badi, Musahar,
7 (24.14%) children received
the support
22 students were not
reported
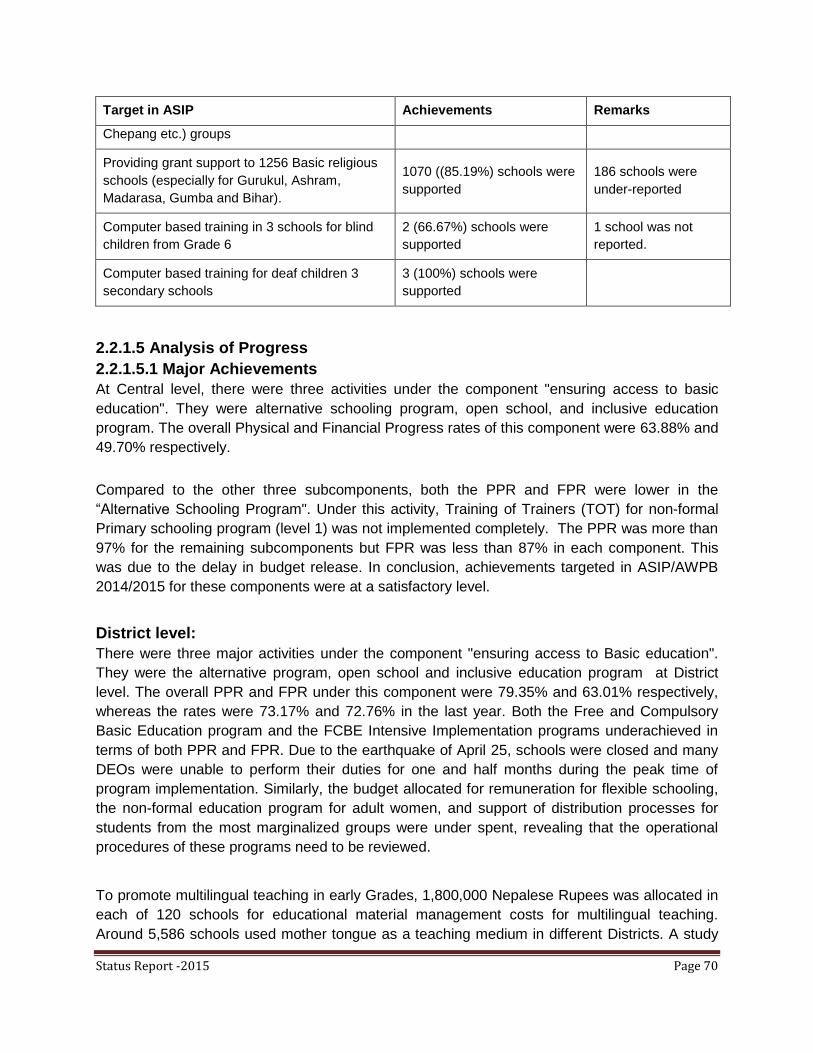
Status Report -2015 Page 70
Target in ASIP Achievements Remarks
Chepang etc.) groups
Providing grant support to 1256 Basic religious
schools (especially for Gurukul, Ashram,
Madarasa, Gumba and Bihar).
1070 ((85.19%) schools were
supported
186 schools were
under-reported
Computer based training in 3 schools for blind
children from Grade 6
2 (66.67%) schools were
supported
1 school was not
reported.
Computer based training for deaf children 3
secondary schools
3 (100%) schools were
supported
2.2.1.5 Analysis of Progress
2.2.1.5.1 Major Achievements
At Central level, there were three activities under the component "ensuring access to basic
education". They were alternative schooling program, open school, and inclusive education
program. The overall Physical and Financial Progress rates of this component were 63.88% and
49.70% respectively.
Compared to the other three subcomponents, both the PPR and FPR were lower in the
“Alternative Schooling Program". Under this activity, Training of Trainers (TOT) for non-formal
Primary schooling program (level 1) was not implemented completely. The PPR was more than
97% for the remaining subcomponents but FPR was less than 87% in each component. This
was due to the delay in budget release. In conclusion, achievements targeted in ASIP/AWPB
2014/2015 for these components were at a satisfactory level.
District level:
There were three major activities under the component "ensuring access to Basic education".
They were the alternative program, open school and inclusive education program at District
level. The overall PPR and FPR under this component were 79.35% and 63.01% respectively,
whereas the rates were 73.17% and 72.76% in the last year. Both the Free and Compulsory
Basic Education program and the FCBE Intensive Implementation programs underachieved in
terms of both PPR and FPR. Due to the earthquake of April 25, schools were closed and many
DEOs were unable to perform their duties for one and half months during the peak time of
program implementation. Similarly, the budget allocated for remuneration for flexible schooling,
the non-formal education program for adult women, and support of distribution processes for
students from the most marginalized groups were under spent, revealing that the operational
procedures of these programs need to be reviewed.
To promote multilingual teaching in early Grades, 1,800,000 Nepalese Rupees was allocated in
each of 120 schools for educational material management costs for multilingual teaching.
Around 5,586 schools used mother tongue as a teaching medium in different Districts. A study
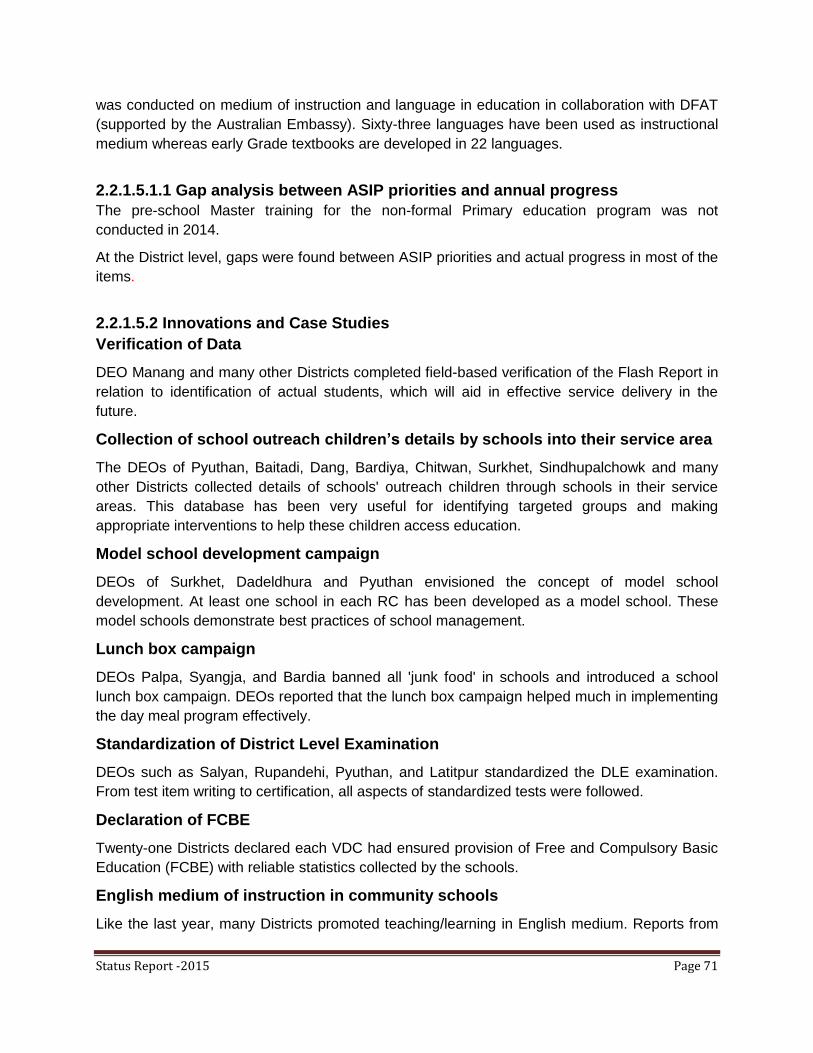
Status Report -2015 Page 71
was conducted on medium of instruction and language in education in collaboration with DFAT
(supported by the Australian Embassy). Sixty-three languages have been used as instructional
medium whereas early Grade textbooks are developed in 22 languages.
2.2.1.5.1.1 Gap analysis between ASIP priorities and annual progress
The pre-school Master training for the non-formal Primary education program was not
conducted in 2014.
At the District level, gaps were found between ASIP priorities and actual progress in most of the
items.
2.2.1.5.2 Innovations and Case Studies
Verification of Data
DEO Manang and many other Districts completed field-based verification of the Flash Report in
relation to identification of actual students, which will aid in effective service delivery in the
future.
Collection of school outreach children’s details by schools into their service area
The DEOs of Pyuthan, Baitadi, Dang, Bardiya, Chitwan, Surkhet, Sindhupalchowk and many
other Districts collected details of schools' outreach children through schools in their service
areas. This database has been very useful for identifying targeted groups and making
appropriate interventions to help these children access education.
Model school development campaign
DEOs of Surkhet, Dadeldhura and Pyuthan envisioned the concept of model school
development. At least one school in each RC has been developed as a model school. These
model schools demonstrate best practices of school management.
Lunch box campaign
DEOs Palpa, Syangja, and Bardia banned all 'junk food' in schools and introduced a school
lunch box campaign. DEOs reported that the lunch box campaign helped much in implementing
the day meal program effectively.
Standardization of District Level Examination
DEOs such as Salyan, Rupandehi, Pyuthan, and Latitpur standardized the DLE examination.
From test item writing to certification, all aspects of standardized tests were followed.
Declaration of FCBE
Twenty-one Districts declared each VDC had ensured provision of Free and Compulsory Basic
Education (FCBE) with reliable statistics collected by the schools.
English medium of instruction in community schools
Like the last year, many Districts promoted teaching/learning in English medium. Reports from

Status Report -2015 Page 72
Districts indicate this practice has increased the students‟ enrolment as well as their retention in
community schools.
Research at District level for educational development
DEO Tanahu conducted research on the effectiveness teaching/learning in English medium.
The findings were positive in favor of English medium instruction.
DEO Tanahu also conducted research on the frequency in attendance of students in class one,
with results showing that Dalit and Janajati community children were more infrequent attendees
than other groups.
Performance Contract with HTs
DEO Sindhupalchok carried out performance contracts for all Head Teacher to promote net
enrollment at Primary level.
Multilingual Education
A Bhote-Nepali-Kaaike-English Multilingual Dictionary 2014/015 was developed. This was used
in 23 schools of 7 VDCs at basic level.
2.2.1.5.3 Areas of Under-Performance
i. Access of hard core groups (difficult to reach/marginalized group) to school education is
the major challenge.
ii. Initiatives on gender equality and equity issues have been taken at the central as well as
district levels, however, there is a need of transforming the initiatives into result based
interventions particularly in terai, Midwestern and Farwestern regions in order to
increase the retention and enhance the quality of girls‟ learning.
iii. The dropout rate is high and the promotion rate is low in disadvantaged groups and
areas.
2.2.1.5.4 Constraints
i. The Government had difficulty in bringing about the full budget on time. The budget was
released three times, such that activities and budget could not be allocated at once to
the Districts. The delay in budget release and funding allocation has created complexity
for the timely implementation of programs. For some programs, release of budget and
reimbursement of expenses occurred in the last month of the fiscal year.
ii. The SSRP envisioned that local bodies would take responsibility for the planning,
implementing and monitoring of Basic Education (including Free and Compulsory Basic
education). However the local bodies are not fully functional and there have been no
local body elections from the last ten years. As a result, the local bodies could not
contribute as it was planned.

Status Report -2015 Page 73
iii. The verification of data and reallocation of programs (regarding non-formal Primary
schools, FSP/SOP and open schools) were insufficient.
2.2.1.5.5 Addressing Constraints and Maximizing Achievements
To minimize the aforementioned constraints and to maximize achievements, the following points
will be useful in coming years.
i. Release and allocation of budget and programs should be made once at the
beginning of the fiscal year (as happened in the year 2013-14). DOE should then use
the remainder of the year to monitor and provide support to Districts in the
implementation of programs.
ii. Free and Compulsory Basic program has been implemented in 13 Districts
(Dhankuta, Saptari, Bhaktapur, Parsa, Kaski, Rupandehi, Surkhet, Bardiya,
Dadeldhura, Kanchanpur, Dolpa, Mustang and Manang) as well as 194 VDCs in 48
Districts throughout the country.
iii. A comprehensive strategy paper has been prepared to bring out-of-school children
into the mainstream education system.
iv. Verification and reallocation of programs should be made regarding non-formal
Primary schools, FSP/SOP and open schools in coming years.
v. Performance contracts with Head Teacher, RPs and School Supervisors continued
in 2014/2015.
vi. The numbers of Child Friendly Schools and classrooms has increased.
vii. Teaching/learning in English medium has been introduced as per the demand of
parents in many schools throughout the nation.
viii. Teacher training curriculum includes inclusive education, rights based education,
civic education, human rights, child rights and learning and other issues and
concepts, which helps to create an appropriate learning environment in schools.
ix. Student counseling, student clubs and other student-focused programs have been
launched in collaboration with NGOS/INGOS, CBOS etc.
x. Early Grade Reading Program has got continuation.
2.2.2 Secondary Education
2.2.2.1 Introduction
The goals of Secondary education are to meet national development needs by producing
competent and skilled human resources, and to provide a sound foundation for Tertiary
education. These goals encompass further objectives of improving access to and equity, quality
and relevance of Secondary education. The direction of policy is towards; expanding free
Secondary education; ensuring opportunities for equitable participation in all aspects of
Secondary education; equity and social inclusion; quality and relevance by introducing soft

Status Report -2015 Page 74
vocational skills in Secondary education; and governance & management of Secondary
education through shared responsibility between Central and local governments.
The intention of the SSRP is also to revise the school structure with Grades 1-8 being the Basic
level and Grades 9-12 the Secondary level. The SSR Plan (2009-2015) emphasized increasing
access to and participation in promoting equity and social inclusion and improving quality and
relevance of Secondary education. Secondary level education is again restructured into two
streams such as the existing general education stream from Grades 9-12, and Vocational and
Technical stream from Grades 9-12.
According to Flash Report 2014/2015, of the total 35,223 schools (2014/2015), 1070 schools
were closed/merged and the total number of schools decreased to 34,837 in the current school
year 2015-2016. Out of a total 34,837 schools; 8,967 are Secondary Grades (9-10); 3,656 are
Higher Secondary Grades (11-12) and 9,263 are Secondary Grades (9-12) levels. Figure 35
shows the total number of schools in Nepal since the early period of SSRP to now (2008-2015).
Figure No. 35 Total No of Secondary Schools since 2008 to 2015 in Nepal
Figure 35 and Table 44 show the trend of schools increasing in Nepal since the early
period of SSRP to now (2008-2015). The beginning of the Basic education concept
emerged in 2009, so the trend analyzed is from 2009 to 2015, for 7 years only.
Table No. 44 Trend of School Increasing in Nepal Since 2008 to 2015
Year 2008 2009 2010 2011 2012 2013 2014 2015
Average
Growth rate of
schools in
2015
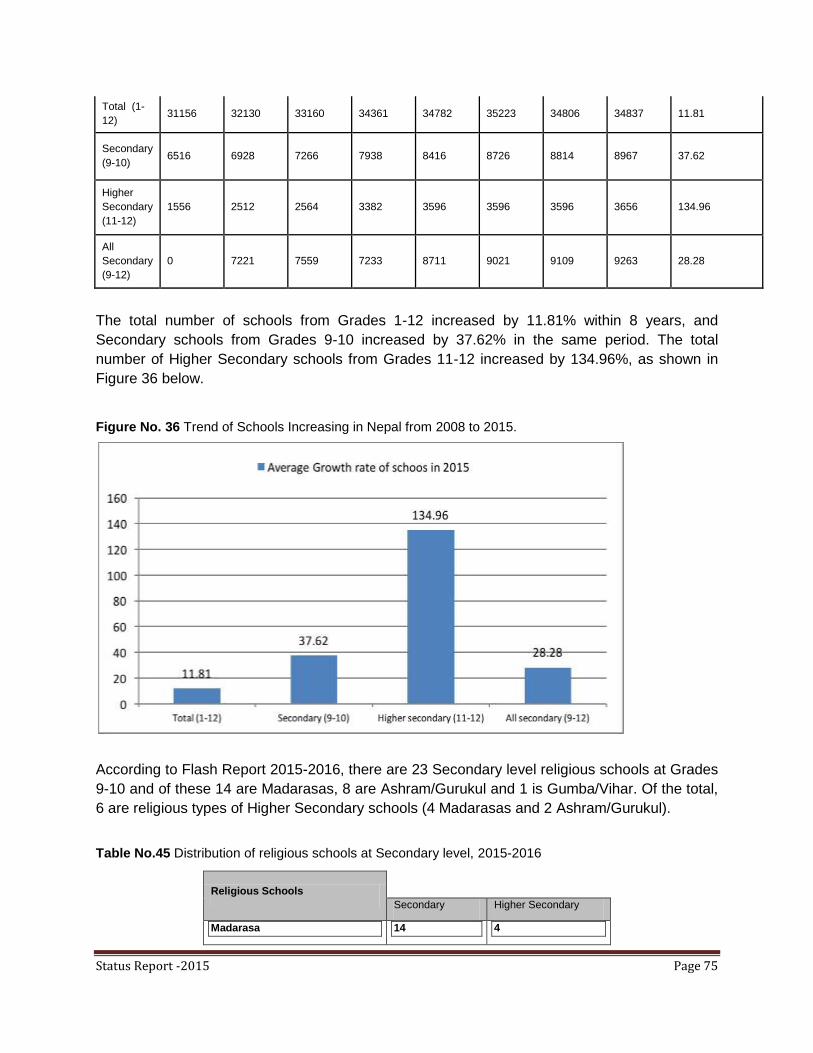
Status Report -2015 Page 75
Total (1-
12) 31156 32130 33160 34361 34782 35223 34806 34837 11.81
Secondary
(9-10) 6516 6928 7266 7938 8416 8726 8814 8967 37.62
Higher
Secondary
(11-12)
1556 2512 2564 3382 3596 3596 3596 3656 134.96
All
Secondary
(9-12)
0 7221 7559 7233 8711 9021 9109 9263 28.28
The total number of schools from Grades 1-12 increased by 11.81% within 8 years, and
Secondary schools from Grades 9-10 increased by 37.62% in the same period. The total
number of Higher Secondary schools from Grades 11-12 increased by 134.96%, as shown in
Figure 36 below.
Figure No. 36 Trend of Schools Increasing in Nepal from 2008 to 2015.
According to Flash Report 2015-2016, there are 23 Secondary level religious schools at Grades
9-10 and of these 14 are Madarasas, 8 are Ashram/Gurukul and 1 is Gumba/Vihar. Of the total,
6 are religious types of Higher Secondary schools (4 Madarasas and 2 Ashram/Gurukul).
Table No.45 Distribution of religious schools at Secondary level, 2015-2016
Religious Schools
Secondary Higher Secondary
Madarasa 14 4
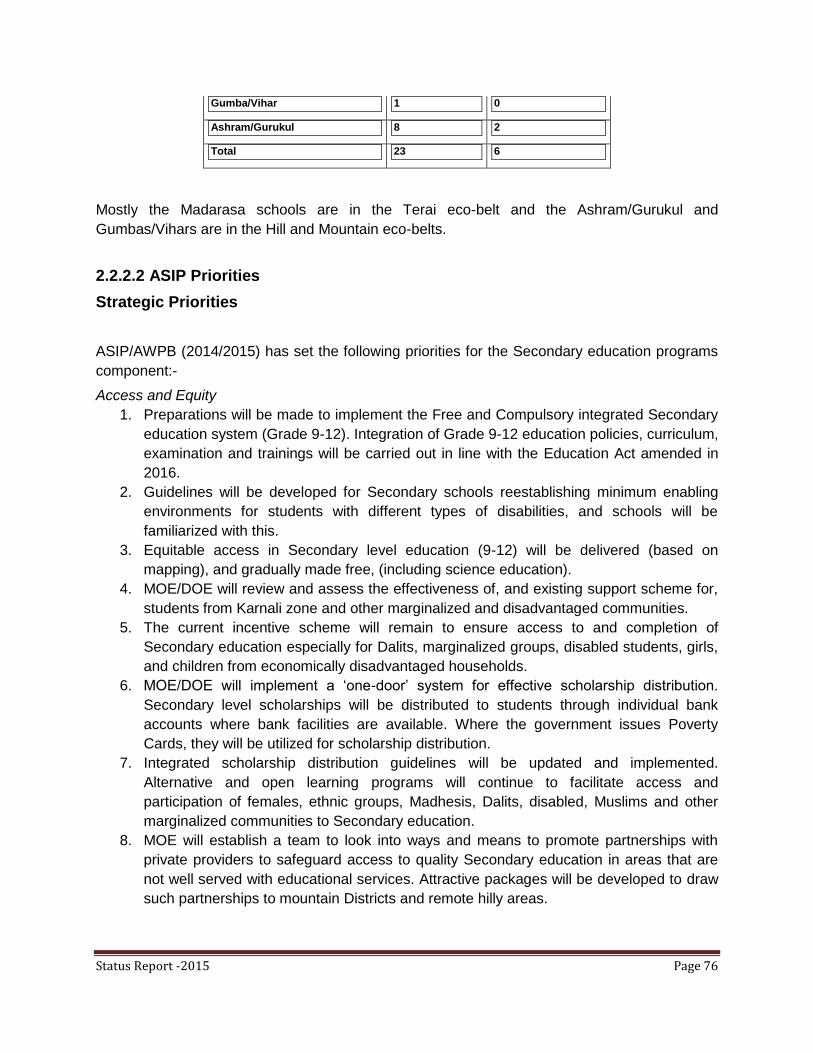
Status Report -2015 Page 76
Gumba/Vihar 1 0
Ashram/Gurukul 8 2
Total 23 6
Mostly the Madarasa schools are in the Terai eco-belt and the Ashram/Gurukul and
Gumbas/Vihars are in the Hill and Mountain eco-belts.
2.2.2.2 ASIP Priorities
Strategic Priorities
ASIP/AWPB (2014/2015) has set the following priorities for the Secondary education programs
component:-
Access and Equity
1. Preparations will be made to implement the Free and Compulsory integrated Secondary
education system (Grade 9-12). Integration of Grade 9-12 education policies, curriculum,
examination and trainings will be carried out in line with the Education Act amended in
2016.
2. Guidelines will be developed for Secondary schools reestablishing minimum enabling
environments for students with different types of disabilities, and schools will be
familiarized with this.
3. Equitable access in Secondary level education (9-12) will be delivered (based on
mapping), and gradually made free, (including science education).
4. MOE/DOE will review and assess the effectiveness of, and existing support scheme for,
students from Karnali zone and other marginalized and disadvantaged communities.
5. The current incentive scheme will remain to ensure access to and completion of
Secondary education especially for Dalits, marginalized groups, disabled students, girls,
and children from economically disadvantaged households.
6. MOE/DOE will implement a „one-door‟ system for effective scholarship distribution.
Secondary level scholarships will be distributed to students through individual bank
accounts where bank facilities are available. Where the government issues Poverty
Cards, they will be utilized for scholarship distribution.
7. Integrated scholarship distribution guidelines will be updated and implemented.
Alternative and open learning programs will continue to facilitate access and
participation of females, ethnic groups, Madhesis, Dalits, disabled, Muslims and other
marginalized communities to Secondary education.
8. MOE will establish a team to look into ways and means to promote partnerships with
private providers to safeguard access to quality Secondary education in areas that are
not well served with educational services. Attractive packages will be developed to draw
such partnerships to mountain Districts and remote hilly areas.

Status Report -2015 Page 77
9. Private & public partnerships will be encouraged to share best practices in quality
improvement. Partnerships will also be developed between better performing and
underperforming schools, in particular between private & public schools.
Quality and Relevance
1. The guidelines developed by MOE for setting Secondary education standards will be
reviewed and all Secondary schools will be required to comply by 2015.
2. Within PMEC, special consideration will be given to ensuring that all community
Secondary schools have a functioning library and science laboratory.
3. Provision will be made for incentives to the two best performing Secondary schools
in each District who will be awarded with 500,000Rs each. The best performing
schools will support underperforming schools to obtain better results.
4. MOE/DOE will provide special incentives to acquire qualified, competent science and
mathematics teacher, including temporary waivers on teaching licenses for a
specified time period.
5. Preparation will be made for the integration of soft-skills in Secondary and teacher
training curriculum content, to pilot within schools that have received the Basic
education level soft-skills curriculum.
6. Introduction of the pre-vocational stream in Secondary education will continue in 100
schools.
7. CDC in collaboration with CTVET will develop the National Vocational Qualification
Framework.
8. An integrated framework of alternative/open learning will be developed and
implemented.
9. A National curriculum framework, including vocational education, will be developed
for Grades 9-12.
Learning and Evaluation
1. Learning achievement in community schools will be improved by encouraging inter-
school partnerships to ensure equity.
2. Remedial support programs will be launched in schools targeting students lagging
behind in acquiring minimum learning achievements.
3. Student learning will be supported through enhancing ICT in education. Community
involvement will be promoted through advocacy and awareness.
4. The existing supervision and monitoring system will be strengthened with the intent
of providing general and instructional support to integrated Secondary schools.
5. The existing capacity of RED will be reviewed and strengthened with a view to
augmenting their role, enabling them to manage Grade 10 examinations at the
regional level.
6. DEOs generate performance contracts with head teachers in their respective districts.
7. Schools‟ achievement performance will be linked to the RPs, SSs and DEOs when
evaluating the performance of those officials.

Status Report -2015 Page 78
8. After the publication of SLC result in each District, RED and at Central level, review
workshops will be organized to take necessary remedial action for further
improvement.
9. District level indicators and targets set to improve SLC results and interventions will
be initiated in all Districts.
10. Separate Head Teacher on performance contracts will be made available in all
Secondary schools by 2015/016.
11. A National Examination Board (NEB) will be established and put into operation after
the enactment of the Education Act in 2016.
2.2.2.3 Achievement against Indicators
The progress achieved so far regarding KPIs is detailed in the Flash Report, which includes
achievements in Secondary education. The following tables and figures present a summary of
the current status of the KPIs.
Gross Enrolment Rate (GER) at Secondary Level
According to Flash Report 2015-2016, the overall GER in Secondary level (9-10) is 75.1%, with
78.4% for girls and 71.6% for boys. The GER in Secondary level last year was 70.1%. Table 46
shows the GER and NER at Secondary and Higher Secondary levels in the school year 2015-
2016. Table No. 46 Gross Enrolment Rates (GER) and Net Enrolment Rates (NER) at Secondary Level
2014/2015
Level GER NER
Girls Boys Total GPI Girls Boys Total GPI
Secondary (9-10) 78.4 71.6 75.1 1.09 57.4 58.6 58.0 0.98
Higher Secondary (11-12) 37.5 37.6 37.5 1.00 17.1 16.6 16.8 1.03
Secondary (9-12) 58.4 54.9 56.7 1.06 37.8 37.9 37.8 1.00
According to Flash Report 2015-2016, the overall GER in Higher Secondary levels (11-12) is
56.7%, with 58.4% for girls and 54.9% for boys.
Figure No. 37 Gross Enrolment Rate (GER) at Secondary Level in 2014/2015

Status Report -2015 Page 79
According to Flash Report 2015-2016, the overall GER in Secondary education levels (9-12) is
56.7%, with 58.4% for girls and 54.9% for boys. The trend of GER at Secondary level, Higher
Secondary level and Grades (9-12) for 2013-2014 is given above in Figure 37.
Table No. 47 Achievement against the Target for Gross Enrollment Rate (GER) in Secondary Level
Education from 2008 to 2015
Years Secondary (9-10) Higher Secondary (11-12) Secondary (9-12)
2008 59.5 40
2009 65.7 23.6 44.7
2010 66.3 26 46.2
2011 46.2 28.9 49.4
2012 71.7 31.6 51.7
2013 68.7 32 50.4
2014 70.1 32.9 51.6
2015 75.1 37.5 56.7
The subsequent progress of GER in Secondary levels (9-10) from 2008 to 2015 is shown
above in Table 47 and Figure 38 below.
Figure No. 38 Comparison of achievement Against the Target for Gross Enrollment Rate (GER) in
Secondary Level Education from 2008 to 2015
On examination the GER in Secondary level from 2008 to 2015 increased almost each year,
with the total increase being quite substantial, from 59.5% in 2008 to 75.1% in 2015. The above
figure demonstrates the comparison of GER of different levels Secondary education.
0
20
40
60
80
2008 2009 2010 2011 2012 2013 2014 2015
59.565.7 66.3 70 71.7
68.7 70.175.1
23.6 26 28.9 31.632 32.9 37.5
40 44.7 46.2 49.4 51.750.4 51.6
56.7
Pe
rce
nta
ge %
2008 2009 2010 2011 2012 2013 2014 2015
Secondary (9-10) 59.5 65.7 66.3 70 71.7 68.7 70.1 75.1
Higher secondary (11-12) 23.6 26 28.9 31.6 32 32.9 37.5
Secondary (9-12) 40 44.7 46.2 49.4 51.7 50.4 51.6 56.7

Status Report -2015 Page 80
Net Enrolment Rate (NER) at Secondary Level
According to Flash Report 2015-2016, the overall NER in Secondary level is 57.9% with 57.4%
for girls and 58.6% for boys. The NER for 2014 was 56.1%. The NER suggests that 42.1% of
the Secondary levels age group (13-14 years age group) were either out-of-school or enrolled at
other levels.
Figure 39 Net Enrolment Rate (NER) at Secondary level in (2015-2016)
The NER of Secondary level, Higher Secondary level and class 9-12 is given below in the Table
48 and Figure 39.
Table No. 48 Achievement against the Target for Net Enrollment Rate (NER) in Secondary Level
from 2008 to 2015
Indicators 2008 2009 2010 2011 2012 2013 2014 2015
Target 20 21 22 23 24 26 27 29
Achievement 36.4 40.8 46.5 52.1 54.3 55 56.1
When compared against the target, the acheivement rate increased each year. NER has
reached 56.1%, up from 36.4% in seven years and the target has been met (because the NER
is to increase and GER decrease while planning). There is a positive trend for student
enrollment in Secondary level. The progress against the target is given below in Figure 40.
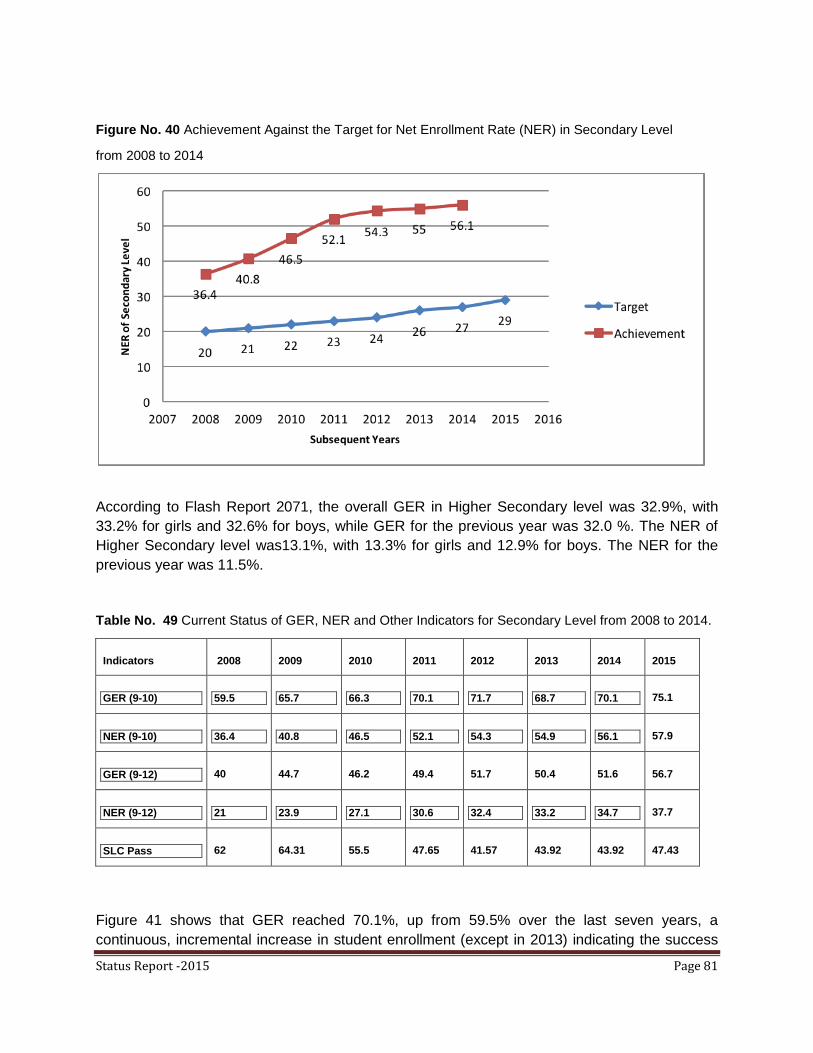
Status Report -2015 Page 81
Figure No. 40 Achievement Against the Target for Net Enrollment Rate (NER) in Secondary Level
from 2008 to 2014
According to Flash Report 2071, the overall GER in Higher Secondary level was 32.9%, with
33.2% for girls and 32.6% for boys, while GER for the previous year was 32.0 %. The NER of
Higher Secondary level was13.1%, with 13.3% for girls and 12.9% for boys. The NER for the
previous year was 11.5%.
Table No. 49 Current Status of GER, NER and Other Indicators for Secondary Level from 2008 to 2014.
Indicators 2008 2009 2010 2011 2012 2013 2014 2015
GER (9-10) 59.5 65.7 66.3 70.1 71.7 68.7 70.1 75.1
NER (9-10) 36.4 40.8 46.5 52.1 54.3 54.9 56.1 57.9
GER (9-12) 40 44.7 46.2 49.4 51.7 50.4 51.6 56.7
NER (9-12) 21 23.9 27.1 30.6 32.4 33.2 34.7 37.7
SLC Pass 62 64.31 55.5 47.65 41.57 43.92 43.92 47.43
Figure 41 shows that GER reached 70.1%, up from 59.5% over the last seven years, a
continuous, incremental increase in student enrollment (except in 2013) indicating the success
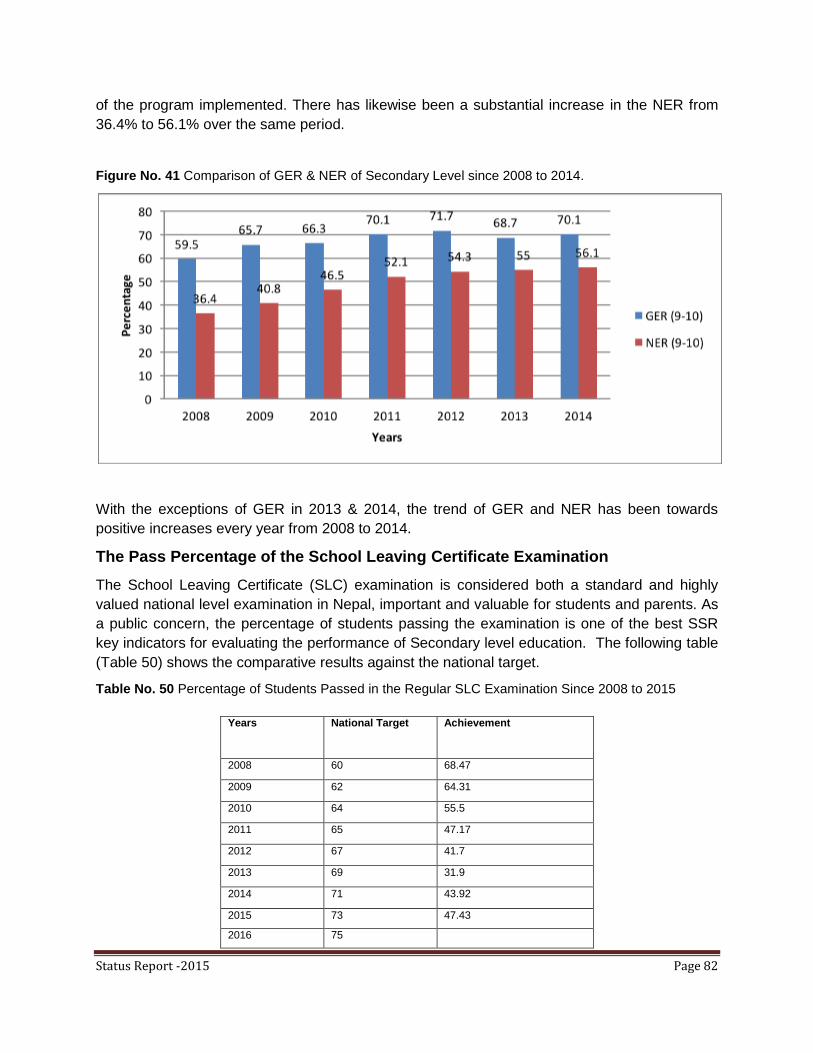
Status Report -2015 Page 82
of the program implemented. There has likewise been a substantial increase in the NER from
36.4% to 56.1% over the same period.
Figure No. 41 Comparison of GER & NER of Secondary Level since 2008 to 2014.
With the exceptions of GER in 2013 & 2014, the trend of GER and NER has been towards
positive increases every year from 2008 to 2014.
The Pass Percentage of the School Leaving Certificate Examination
The School Leaving Certificate (SLC) examination is considered both a standard and highly
valued national level examination in Nepal, important and valuable for students and parents. As
a public concern, the percentage of students passing the examination is one of the best SSR
key indicators for evaluating the performance of Secondary level education. The following table
(Table 50) shows the comparative results against the national target.
Table No. 50 Percentage of Students Passed in the Regular SLC Examination Since 2008 to 2015
Years National Target Achievement
2008 60 68.47
2009 62 64.31
2010 64 55.5
2011 65 47.17
2012 67 41.7
2013 69 31.9
2014 71 43.92
2015 73 47.43
2016 75
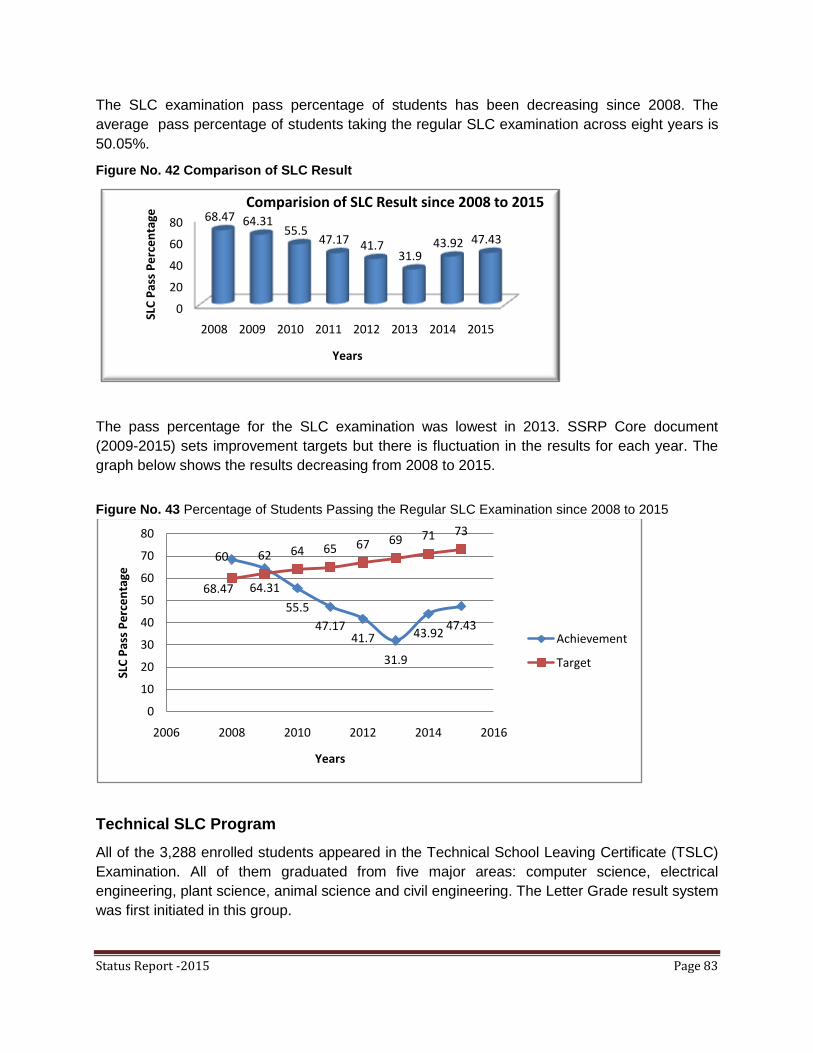
Status Report -2015 Page 83
The SLC examination pass percentage of students has been decreasing since 2008. The
average pass percentage of students taking the regular SLC examination across eight years is
50.05%.
Figure No. 42 Comparison of SLC Result
The pass percentage for the SLC examination was lowest in 2013. SSRP Core document
(2009-2015) sets improvement targets but there is fluctuation in the results for each year. The
graph below shows the results decreasing from 2008 to 2015.
Figure No. 43 Percentage of Students Passing the Regular SLC Examination since 2008 to 2015
Technical SLC Program
All of the 3,288 enrolled students appeared in the Technical School Leaving Certificate (TSLC)
Examination. All of them graduated from five major areas: computer science, electrical
engineering, plant science, animal science and civil engineering. The Letter Grade result system
was first initiated in this group.
0
20
40
60
80
2008 2009 2010 2011 2012 2013 2014 2015
68.47 64.3155.5
47.17 41.731.9
43.92 47.43
SLC
Pas
s P
erc
en
tage
Years
Comparision of SLC Result since 2008 to 2015
68.47 64.31
55.5
47.1741.7
31.9
43.9247.43
60 62 64 65 67 69 71 73
0
10
20
30
40
50
60
70
80
2006 2008 2010 2012 2014 2016
SLC
Pas
s P
erc
en
tage
Years
Achievement
Target

Status Report -2015 Page 84
Pupil/teacher Ratio
Figure 40 below demonstrates that the pupil/teacher ratio for Grades 9-12 has been decreasing
continuously from 2012 to 2015, and met the national target for achievement progress. The
Government has supplied teacher salary's for Higher Secondary level since 2010, and as a
result the pupil/teacher ratio for Secondary levels 9-12 has been 1:23.
Figure No. 44 Trend of Pupil/teacher Ratio for Grades 9-12 from 2008 to 2015.
According to Flash Report 2071, the overall GER of Higher Secondary level is 32.9%, with
33.2% for girls and 32.6% for boys. The overall GER of Higher Secondary level for the 2013
was 32.0%.
According to Flash Report 2071, the NER for the Higher Secondary level is 13.1% with 13.3%
for girls and 12.9% for boys. The overall NER of Higher Secondary level for the previous year
(2013) was 11.5%.
2.2.2.4 Achievement against Annual Targets
At District level
The achievements gained against the annual target for District level are given in Table 51
below.
Table No. 51 Physical Progress Achieved Against Annual Targets
Target in
ASIP/AWPB Implementation status

Status Report -2015 Page 85
2.2.2.5 Analysis of Progress 2.2.2.5.1 Major Achievements
Central level activities
There were few activities planned under this component at Central level in the fiscal year
2014/15. The curriculum of Grades 9 and 10 computer subjects was revised, and Grade 6
computer textbook was developed.
There were two major activities under this component at the District level. They were Alternative
Provision for Secondary Education, and Curriculum Dissemination. Both of the activities were
implemented, and for this component the PPR was 85.44% and the FPR was 81.06%.
Only 70% of the Basic level religious schools received supporting grants. Some Secondary
schools (Grades 9-12) have been undertaking initiatives such as student counselling and
awareness programs to young girls (to stop early marriage and drop out); carrying out
research/study on education quality; and conducting dummy SLC examination.
2.2.2.5.2 Innovations and Case Studies
Self-Evaluation and Commitment
DEOs of Baglung, Dolakha, Gulmi, Syangja and many others conducted the following activities
to promote quality education:
i. Mobile meeting of RP/SS/HT and other DEO staff
ii. Team supervision
iii. Self-evaluation and dissemination
iv. Local political parties, their sister organizations, and other stakeholders committed to
school peace zone
v. Schools determined their own learning achievements targets
Education Management in Emergency (EMiE)
Alternative Provision for Secondary Education
School Grants for open education Grades 9-10 84.0 83 schools received
grants
Grants for schools with special need students (blind
schools - 6 and deaf schools - 6) 12 schools
11 schools received
grants
Non-formal Secondary education for adult women
Grades 9-10 34 schools
31 schools received
grants
Grants to support religious Secondary schools
(Gurukul, Ashram, Madrasha, Gumba and Bihar) 20 schools
14 schools received
grants
Dissemination of Grade 8 curriculum 21,702 teachers 21,922 (101.01%)
teachers oriented

Status Report -2015 Page 86
DEO Udaypur has started integrating educational management during emergency periods into
District level plans.
Declaration of Learning Improvement Year
DEOs of Gulmi and many other Districts declared 2014/2015 as a learning improvement year.
Residential school recommendation
In an intensive consultation with stakeholders, DEO Manang recommended restructuring to
establish three residential schools, focused on servicing those students from remote and areas
of seasonal migration.
Free and Compulsory Education
DEO Manang has implemented Free and Compulsory education in all VDCs.
Preparation of Documentary
DEO Gulmi developed a visual documentary of schools for effective school mapping and a
strong and reliable database.
Use of Modern Instructional Technology
DEOs of Gulmi and Syangja applied modern instructional technology in classroom teaching with
ICT, establishing help desk and digital display boards to ensure the right to information and
transparency for service seekers. They also started to enter all records and activities on
computers and, in collaboration with Nepal Telecom, many Districts started e-notice boards to
transfer information for rapid service delivery.
SLC result analysis
The DEOs of Kathmandu, Dhading and many others analyzed the result of SLC examination
involving community schools, institutional schools and other stakeholders. This was followed
by discussions in relation to reasons for low performance, measures necessary for
improvement, and different actors‟ role in this regard. Good performing schools, teachers and
students (in SLC examination) were also awarded. Similarly, DEO Dolakha conducted
interaction programs at various forums and made all Secondary schools analyze students‟
learning achievements and set school/subject goals for improving the SLC result.
2.2.2.5.3 Areas of Under-Performance
In spite of the efforts made to improve the school education, the result of SLC examination
was not satisfactory though.
2.2.2.5.4 Constraints
i. Students‟ access to libraries is very limited.
ii. There are limited facilities of practically teaching/learning conditions in secondary schools.
iii. There are still not sufficient teachers at Secondary level as provisioned by the Education
Act.

Status Report -2015 Page 87
2.2.2.5.5 Addressing Constraints and Maximizing Achievement
i. Minimum numbers of subject teachers, as provisioned by the Education regulation, should
be made available in each Secondary school.
ii. Computer, library and science lab facilities should be increased in schools.
Schools and communities should take the initiative to establish a library and enhance reading culture. 2.2.3 Physical Facilities Improvement
2.2.3.1 Introduction
Creating a child friendly environment and making physical facilities available at schools plays a
vital role in ensuring student access to, and retention in, Basic and Secondary education.
Keeping children in school and bringing in out-of-school children demands sufficient space,
appropriate furniture, safe school premises, and appropriate and sufficient water and sanitation
facilities. In this context SSRP emphasized construction of new school buildings meeting the
requirements of students with disabilities, construction of classrooms meeting minimum
standards, restoration of school building/classrooms, improvement of school‟s external
environments and construction of separate toilets for girls.
2.2.3.2 ASIP Priorities
ASIP (2014/2015) set the following strategic priorities and strategies for effective
implementation of the school physical facilities improvement program, which also addresses the
MTR recommendations on quality and equity challenges.
Strategic Priorities
In order to ensure quality education at Basic level, resources will be channelled to
schools, based on the prioritized minimum enabling conditions (PMECs) survey findings,
to provide support to meet the PMECs in at least 20% more schools.
Strategies
1. Priority CFS indicators (currently named PMECs) will be clarified as an integral part of the
CFS framework but hereafter labelled as Level 1 (comprising 5 indicators: classroom for
each class, Basic learning materials, textbooks for all students, separate girls‟ toilets, & book
corner or library etc.). A roll-out plan will be developed considering the baseline currently
being gathered. Other components of the roll-out plan will be capacity building and
dissemination/communication in particular so that school level stakeholders are clear about
CFS and MECs.

Status Report -2015 Page 88
2. The implementation of commitments made by the MOE (under the Nepal Risk Reduction
Consortium Flagship 1: Safe Schools and Hospitals) to undertake the assessment,
retrofitting and reconstruction of 900 school buildings in the Kathmandu Valley will begin
with the first group of 260 schools for which funding has been secured. In parallel the MOE
will undertake the retrofitting of 50 schools across Nepal.
3. Mapping of out-of-school children (who, where and how) will be conducted, requiring
disaggregated household data by location, and will affect the design and implementation of
appropriate interventions.
4. School Management Committees (SMCs), Head Teacher (HTs) and teacher will be
encouraged to utilize Flash information in planning their School Improvement Plans (SIPs)
and prioritizing interventions where improvement is felt necessary. DEOs will identify low
performing schools in the District using school accreditation and MEC indicators. Key priority
indicators and standards of Child Friendly Schools (CFSs) & MEC will be incorporated in the
School Improvement Plan (SIP) guidelines. Using the information, DEOs will facilitate
schools devising SIPs, targeting quality improvement initiatives aimed at enhancing school
performance.
2.2.3.3 Achievement against Indicators
2.2.3.4 Achievement Against Annual Targets
The annual targets and achievements during FY 2014/15 are as follows:
Table 52 Physical Progress Achieved Against Annual Targets
Activities
Target of
ASIP/AWPB
(2014/2015)
Achievement in
2014/2015
New Classrooms construction for PMEC-less schools,
community managed, and remote schools 994
937
Girls toilet construction for PMEC- less schools, community
managed, and remote schools 2500 2280
Construction of school building (Continuation from last years') 679 672
Construction of school building 540 507
Construction of school building (4 room) 448 430
School Earthquake Safety Program 204 121
Classroom restoration and furniture management 1,000 1046
Improving the external environment of schools 6,000 5056
Maintenance of RC building 50 58
Quick Rehabilitation of disaster affected schools 40 40
DEO building construction 13 12
Maintenance of DEO,RED and ETC building 79 25
Purchasing of laptop and LCD projector 184 163
Management of alternative power backup 37 37
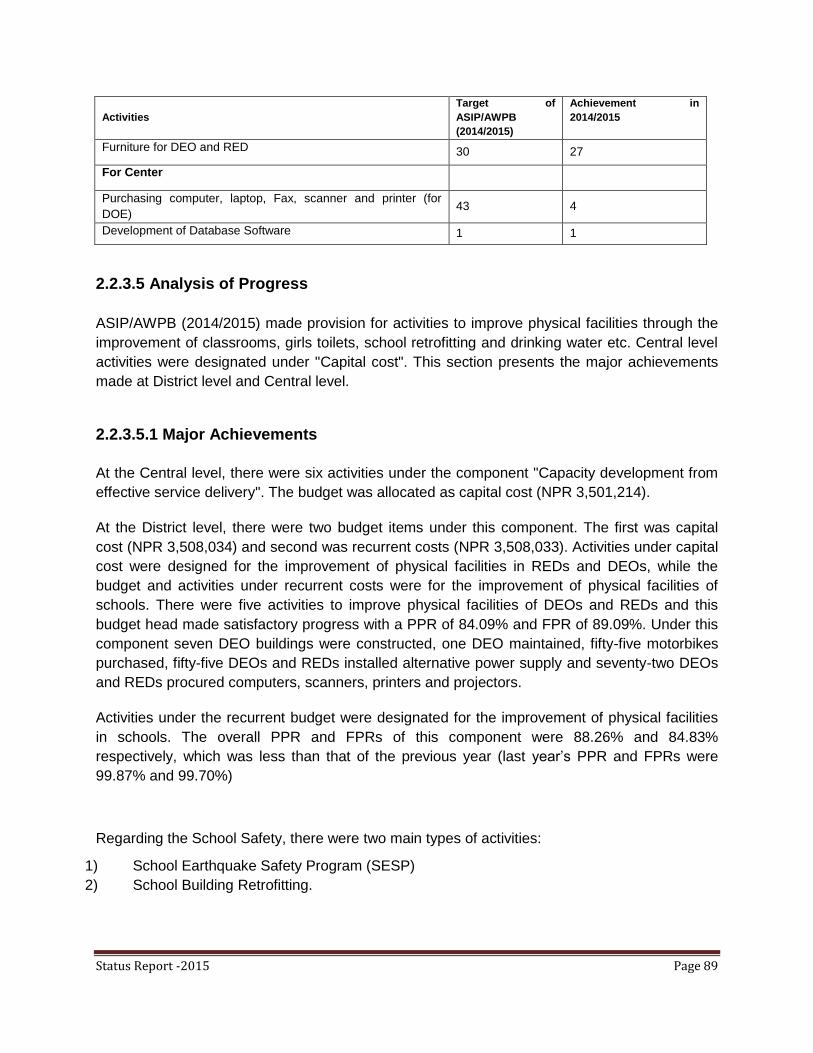
Status Report -2015 Page 89
Activities
Target of
ASIP/AWPB
(2014/2015)
Achievement in
2014/2015
Furniture for DEO and RED 30 27
For Center
Purchasing computer, laptop, Fax, scanner and printer (for
DOE) 43 4
Development of Database Software 1 1
2.2.3.5 Analysis of Progress
ASIP/AWPB (2014/2015) made provision for activities to improve physical facilities through the
improvement of classrooms, girls toilets, school retrofitting and drinking water etc. Central level
activities were designated under "Capital cost". This section presents the major achievements
made at District level and Central level.
2.2.3.5.1 Major Achievements
At the Central level, there were six activities under the component "Capacity development from
effective service delivery". The budget was allocated as capital cost (NPR 3,501,214).
At the District level, there were two budget items under this component. The first was capital
cost (NPR 3,508,034) and second was recurrent costs (NPR 3,508,033). Activities under capital
cost were designed for the improvement of physical facilities in REDs and DEOs, while the
budget and activities under recurrent costs were for the improvement of physical facilities of
schools. There were five activities to improve physical facilities of DEOs and REDs and this
budget head made satisfactory progress with a PPR of 84.09% and FPR of 89.09%. Under this
component seven DEO buildings were constructed, one DEO maintained, fifty-five motorbikes
purchased, fifty-five DEOs and REDs installed alternative power supply and seventy-two DEOs
and REDs procured computers, scanners, printers and projectors.
Activities under the recurrent budget were designated for the improvement of physical facilities
in schools. The overall PPR and FPRs of this component were 88.26% and 84.83%
respectively, which was less than that of the previous year (last year‟s PPR and FPRs were
99.87% and 99.70%)
Regarding the School Safety, there were two main types of activities:
1) School Earthquake Safety Program (SESP)
2) School Building Retrofitting.

Status Report -2015 Page 90
Table No. 53 Physical Progress Achievement Against Annual Targets
S.N. District F/Y 2010/011 F/Y 2011/012 F/Y 2012/013 F/Y 2013/014 F/Y 2014/015
Target Progress Target Progress Target Progress Target Progress Target Progress
Kathmandu Valley
1 Kathmandu 5 5 20 18 70 54 114 58 43 14
2 Lalitpur 5 5 20 19 33 16 46 30 19 0
3 Bhaktapur 5 5 10 8 33 18 46 46 12 6
Some Implementation Challenges:
1. Longer time taking procedures to hire consultants for preparing drawings, design and
estimate,
2. No timely allocation of budget,
3. Limited contribution from the community level as it requires more funds to purchase
materials and skilled labour for constructing/repairing buildings/classrooms,
4. Requirement of extra classrooms during the construction period,
5. Lack of skilled technical human resource (Masons, Engineers and Sub-engineers etc.),
and
6. Increase in volume of works and costs due to unforeseen complications during
construction period.
2.2.3.5.1.1 Gap Analysis Between ASIP Priorities and Annual Progress
There are a number of factors that have to be strengthened, for example; classroom
rehabilitation, furnishing the classrooms adequately, and improving the external environment of
schools.
2.2.3.5.2 Innovations and Case Studies
DEO Salyan collaborated with RRN and NGOs to construct anti-earthquake schools, as
well as providing guidance to retrofit old structures.
Allocation of physical facilities in schools was finally settled by the DOE on the basis of
PMEC indicators and selections were displayed on the DOE‟s website, effectively
ensuring transparency of misuse.
DOE carried out thorough inspection of physical structures allocated from BS 2063, in
eight Districts of the Terai region as a first stage and with the intention to implementing
this strategy in all 75 Districts.
2.2.3.5.3 Areas of Under-Performance
Cost sharing of physical facilities improvement program is below the target.
The blanket approach to budgeting for school physical facilities improvement affected
uniformity and quality in construction.
Status Report -2015 Page 91
2.2.3.5.4 Constraints
Cost sharing at the local level is not given due attention by the stakeholders.
Costs allocated to physical facilities improvement is based on a blanket approach. Due
to this, uniformity in quality is not achieveable.
Inspection of construction by technical professionals from Central level is inadequate.
Physical facility improvement programs for DEOs and REDs are insufficient.
2.2.3.5.5 Addressing Constraints and Maximizing Achievements
The DOE has initiated a system to ensure schools physical facility selection based on
PMEC indicators only.
Display of all selected schools on the DOE website increased transparency and
accountability.
Frequency of technical monitoring and follow-up from Central and District levels
increased, which ensures the quality of program implementation.
Collaboration between DOE and I/NGOs will be of advantage in filling the gap and
ensuring the PMECs in schools.
Public contribution to schools physical facilities improvement has been made
compulsory.
A survey to identify the total number of additional new classrooms and girl's toilets
required to meet PMECs should be conducted so that reallocation of resources can be
made.
Status Report -2015 Page 92
Chapter 3
Literacy and Lifelong Learning
2.3.1 Introduction
The goal of the SSRP is to go beyond achieving the 3 R skills, to literacy and lifelong learning
and to develop, among illiterate youths and women, life skills enabling the building of
competency in communication and the use of social service institutions to address their own,
family and community issues of daily life (ASIP 2012-13).
Literacy and continuous education underpin the right to Basic education for all adults and youths
between 15 and 45 years of age. The objective of this component has been to provide
comprehensive literacy and Basic competencies, imparting values and skills that improve quality
of life and lead to prosperity. There are no separate literacy classes for the disabled, adults,
women or youths and they can enroll in adult literacy classes with other participants run by NFE
and DOE as well as other local CBOs and NGOs. Literacy classes give priority to disabled
persons who have missed the opportunity of formal schooling.
Nepal‟s' adult illiteracy dropped from 54% in 2001 to 34.1% in 2011. The 2011 statistics
revealed that Nepal's literacy rate (5+ years) is 65.9% (male 75.1% and female 57.4%).
Increasing adult literacy to 75% by 2015 is still a challenge and demands significant effort and
determination.
A geographical analysis of literacy rates by District also shows that the literacy rate is unevenly
distributed with an overwhelming majority of Terai Districts in Central and eastern development
regions, hills and mountainous Districts in the Midwest, and far west development regions
having the lowest literacy levels.
Currently adult literacy, women‟s literacy and functional literacy programs including skills-based
training for income generation (IG) are in operation and, together with CLC, a program for
dropouts is underway. The literacy campaign is an intensive program which has been operating
continuously since 2009.
2.3.2 ASIP Priorities
ASIP 2014/2015 set the following strategic priorities and strategies for effective implementation
of the literacy and life skills improvement program:-
Literacy and lifelong learning programs will be targeted at pockets of marginalized
communities. Under the Literate Nepal Mission (LINEM), Basic literacy classes in each
District will target VDCs/ Municipalities with the aim of declaring them fully literate. The
number of such VDCs/ Municipalities will be scaled up each year. The piloted Mother
Tongue Based Literacy (MTBL), trilingual literacy and NFE MIS programs will be expanded
to more Districts. Ownership of program management will be shared within communities,
and information based planning, programming and decision-making will be encouraged. In
order to promote mother tongue literacy, the CRCs of literacy materials developed so far in

Status Report -2015 Page 93
different mother tongues will be made available to all Districts. The supply of these materials
will be in accordance with the demand of the linguistic group concerned. Literacy programs
will be aligned with IGP and ICT programs as far as possible and partnership strategies will
continue. Partnerships with local government, NGOs and other providers has proved an
effective strategy for sharing expertise, resources and experience, which in turn accelerates
program efficiency.
Based on the data of the Population Census, pockets where out-of-school children (OOSC)
are concentrated will be identified. The current allocation/distribution of Alternative
Schooling Programs (Flexible Schooling, Adult Non-Formal Schools and Open Schooling)
and their locations will be revisited and reallocated to the identified pockets to ensure these
programs serve those most in need. Along with this, curricula materials, implementation
modalities and the existing period for completion will be revisited and appropriate models
developed. An Income Generation Program (IGP) will be conducted in areas where OOSC
are concentrated targeting mothers in order to encourage them to enroll their children in
schools or ASPs. Strengthening existing NFE‟s in coordination with DOE will be initiated and
priority will be given to updating household data collected in the previous year. A framework
and mechanism will be developed for certification and accreditation of NFEs, informal
learning and education.
Strategies
1. Literacy and lifelong learning programs will be targeted at pockets of marginalized
communities in 17 Districts with high rates of illiteracy. The CLCs will be strengthened with
capacity building activities, resources and technology to enable them to implement literacy
and lifelong learning programs and to complement the national literacy program, run under
Literate Nepal Mission (LINEM). The CLCs will offer multiple options for learning and income
generation as well as meet the diverse needs of the community.
2. Under LINEM, Basic literacy classes in each District will be concentrated in targeted
VDCs/Municipalities in order to declare them fully literate. The number of such
VDCs/Municipalities will be scaled up each year. Various implementation modalities will be
expedited depending upon the context of each District.
3. The success stories of piloting Mother Tongue Based Literacy (MTBL), Trilingual literacy
and NFE MIS programs will be expanded to more Districts in which local experts will be
consulted to develop contextual learning materials. Ownership of program management will
be shared with communities, and information based planning, programming and decision-
making will be encouraged. Print and electronic media will be mobilized to facilitate both
national and local level literacy campaigns.
4. In order to promote mother tongue literacy, the CRCs of literacy materials developed so far
in different mother tongues will be made available to all Districts. As per the demand of
concerned linguistic groups, the supply of these materials will be ensured. New mother
tongue-based materials will be developed depending on availability of funds.

Status Report -2015 Page 94
5. Literacy programs will be aligned with IGP and ICT programs as far as possible. Partnership
strategies will continue and, apart from NGOs and Community Based Organizations (CBOs),
partnerships will also be built with schools and political, professional and social groups in
planning, managing, implementing, monitoring and evaluating literacy programs.
Partnerships with local government, NGOs and other providers has proved an effective
strategy for sharing expertise, resources and experience, which in turn contributes to the
acceleration of program efficiency.
6. Under the overall guidance of DEO, CLCs and schools will be made responsible for
managing, implementing and monitoring Basic literacy. Schools, VDC/NP, NGOs and CLCs
will be responsible for delivering Basic literacy classes, whereas post-literacy and IG
programs will be run through CLCs. Necessary training and other support will be provided to
CLCs to assist them to carry out the proposed endeavors.
7. Capacity of DEOs, CLCs and NFEC in regards to effective program design, implementation
and monitoring will be strengthened based on Capacity Needs Assessment Exercises and
in-depth study of CLCs carried out by NFEC. Efforts will focus on strengthening and capacity
building of existing CLCs rather than expanding their number.
8. Based on Population Census data, pockets where OOSC are concentrated will be identified.
Present allocation/distribution of Alternative Schooling Programs (Flexible Schooling, Adult
Non-Formal Schools & Open Schooling) and their locations will be revisited and reallocated
to the identified pockets to ensure the programs serve those in need. Along with this,
curricula materials, implementation modalities, and existing periods for completion will also
be revisited and appropriate models will be developed.
9. Income Generation Programs (IGPs) will be carried out in pockets where OOSC are
concentrated, targeting mothers to encourage them to enroll their children in schools or
ASPs.
10. An integrated framework and implementation guidelines will be developed in order to
establish linkages among various initiatives such as literacy, post-literacy, non-formal adult
schools and open schools. Involvement of different institutions (e.g. NCED, NFEC and DOE)
in their implementation will also be revisited. Post-literacy and income generation schemes
will be concentrated in the same pockets where Basic literacy is conducted.
11. Strengthening existing NFE management information systems in coordination with DOE will
be initiated. Updating household data collected in the previous year will continue.
12. Schools and ClCs will work in a coordinated way to support one another to implement both
formal and Non-Formal educational programs including literacy at local level. CLCs will
utilize surplus physical infrastructure at schools resulting from school mergers and other
factors.
13. Frameworks and mechanisms will be developed for the certification and accreditation of
NFECs, informal learning and education. Initiatives for assessing literacy skills of new
literates will be piloted.

Status Report -2015 Page 95
14. To supplement the activities mentioned in ASIP, additional activities will also be undertaken,
mobilizing funds available from other sources
Targets for the FY 2014/15 (SSRP)
The major physical targets for the year are as follows. The details of physical targets, unit costs
and total budget allocated for this component are given in Annex I.
Delivery of 12,000 Adult Post-literacy classes targeting 240,000 persons, particularly
women.
Mobilizing 2,500 groups, involving 25,000 females, for income generating activities
Providing support to 2,199 CLCs for implementing and monitoring the post-literacy and
IG programs, of which 400 CLCs will receive support for establishing reading centers.
The major physical targets for the fiscal year 2014/15 are given in the Table below:
Table No. 54 Major programme activities under SSRP FY 2014/15
SN Activities Unit Allocated Budget in '000
Physical Target Budget
1 Training on micro-credit and saving for IG Group Center 5,000 3,100
2 Thematic training Center 5,000 1,6800
3 Seed money for IG group Center 2,500 25,000
4 Training for facilitators of Post-literacy Programs Person 12,000 24,000
5 Incentive allowance for facilitators of Post-
literacy program Person 12,000 72,000
6 Monitoring through CLC Center 1,200 9,000
7 Stationary costs Person 240,000 24,000
8 Transportation costs Center 12,000 2,400
9 Text books cost Number 240,000 24,000
200,300
2.3.3 Achievement against Indicators
According to the CBS Nepal‟s “Population Census Preliminary Report 2011”, the overall national
literacy rate for the age group 5+ years is 65.9%, of which the rate for males is 75.1% and
females is 57.4%. Nepal has reduced its adult illiteracy from 54% in 2001 to 34.1% in 2011.
According to the SSRP Core document (2009-2015), Nepal has set the targets for literacy rates
of different age groups as shown in Table 55 below, although the target has not yet been met
and is a challenging national target.
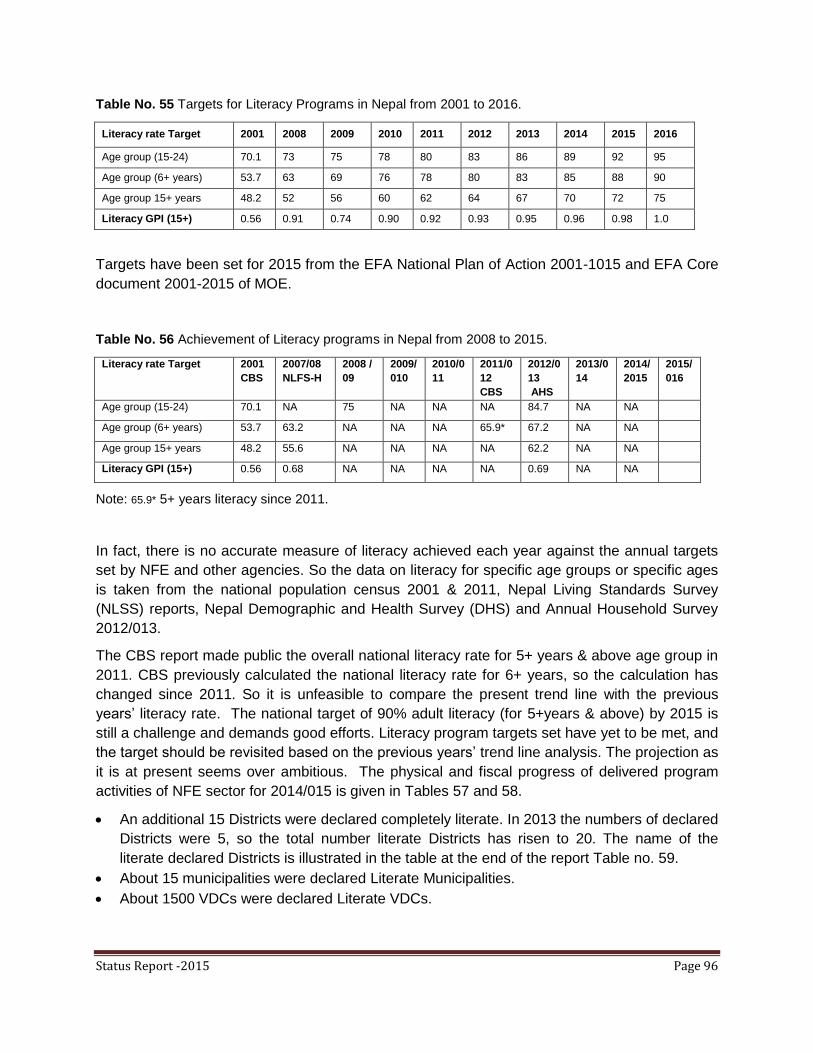
Status Report -2015 Page 96
Table No. 55 Targets for Literacy Programs in Nepal from 2001 to 2016.
Literacy rate Target 2001 2008 2009 2010 2011 2012 2013 2014 2015 2016
Age group (15-24) 70.1 73 75 78 80 83 86 89 92 95
Age group (6+ years) 53.7 63 69 76 78 80 83 85 88 90
Age group 15+ years 48.2 52 56 60 62 64 67 70 72 75
Literacy GPI (15+) 0.56 0.91 0.74 0.90 0.92 0.93 0.95 0.96 0.98 1.0
Targets have been set for 2015 from the EFA National Plan of Action 2001-1015 and EFA Core
document 2001-2015 of MOE.
Table No. 56 Achievement of Literacy programs in Nepal from 2008 to 2015.
Literacy rate Target 2001
CBS
2007/08
NLFS-H
2008 /
09
2009/
010
2010/0
11
2011/0
12
CBS
2012/0
13
AHS
2013/0
14
2014/
2015
2015/
016
Age group (15-24) 70.1 NA 75 NA NA NA 84.7 NA NA
Age group (6+ years) 53.7 63.2 NA NA NA 65.9* 67.2 NA NA
Age group 15+ years 48.2 55.6 NA NA NA NA 62.2 NA NA
Literacy GPI (15+) 0.56 0.68 NA NA NA NA 0.69 NA NA
Note: 65.9* 5+ years literacy since 2011.
In fact, there is no accurate measure of literacy achieved each year against the annual targets
set by NFE and other agencies. So the data on literacy for specific age groups or specific ages
is taken from the national population census 2001 & 2011, Nepal Living Standards Survey
(NLSS) reports, Nepal Demographic and Health Survey (DHS) and Annual Household Survey
2012/013.
The CBS report made public the overall national literacy rate for 5+ years & above age group in
2011. CBS previously calculated the national literacy rate for 6+ years, so the calculation has
changed since 2011. So it is unfeasible to compare the present trend line with the previous
years‟ literacy rate. The national target of 90% adult literacy (for 5+years & above) by 2015 is
still a challenge and demands good efforts. Literacy program targets set have yet to be met, and
the target should be revisited based on the previous years‟ trend line analysis. The projection as
it is at present seems over ambitious. The physical and fiscal progress of delivered program
activities of NFE sector for 2014/015 is given in Tables 57 and 58.
An additional 15 Districts were declared completely literate. In 2013 the numbers of declared
Districts were 5, so the total number literate Districts has risen to 20. The name of the
literate declared Districts is illustrated in the table at the end of the report Table no. 59.
About 15 municipalities were declared Literate Municipalities.
About 1500 VDCs were declared Literate VDCs.

Status Report -2015 Page 97
2.3.4 Achievement against Annual Targets
At Central level, there were three subcomponents; literacy education, post-literacy programs
and continuous education. Altogether there were six activities implemented successfully. The
overall Physical and Financial Progress observed was 100% and 95.75% respectively.
At the District level, there were two sub-components; the Income Generation Program and the
Post-literacy Program, both through CLC and which were completed successfully. The overall
Physical and Financial Progress was satisfactory with the PPR at 97.53% and FPR at 96.80%.
Last year the Physical and Financial Progresses were 97% and 95% respectively, showing that
the implementation status is continuously improving. Major activities, targets and progress
achieved under the literacy and lifelong learning component of SSRP in 2014/2015 are
presented in Table below.
Table No. 57: Activity-wise targets and achievement 2014/2015
Major program activities Unit Targets Achievement Remarks
Districts level:
Training for IG group Group 5,000 4,919
Thematic Training Persons 5,000 4,918
Seed Money Distribution Group 2,500 4,976
Training of facilitators (Post-literacy) Persons 12,000 11,622
Remuneration for local motivators Persons 12,000 11,706
Monitoring through CLC Cluster 1,200 1,165
Stationary costs Persons 240,000 231,991
Transportation costs Class 12,000 11,735
Text book costs Person 240,000 234,700
Table No. 58 Activity-wise targets and achievement 2014/2015
Central level:
Major program activities Unit Targets Achievements Remarks
Preparation, production and distribution of
CLC operational guidelines times 1 1
Operational guideline
produced and distributed
Development and distribution of CLC
training materials times 1 1
training materials developed
and distributed
MToT on post-literacy education program person 80 80 Program conducted
Developing/Updating guideline of School
level evaluation for mobilization of students
in literacy program
times 1 1 Guideline developed
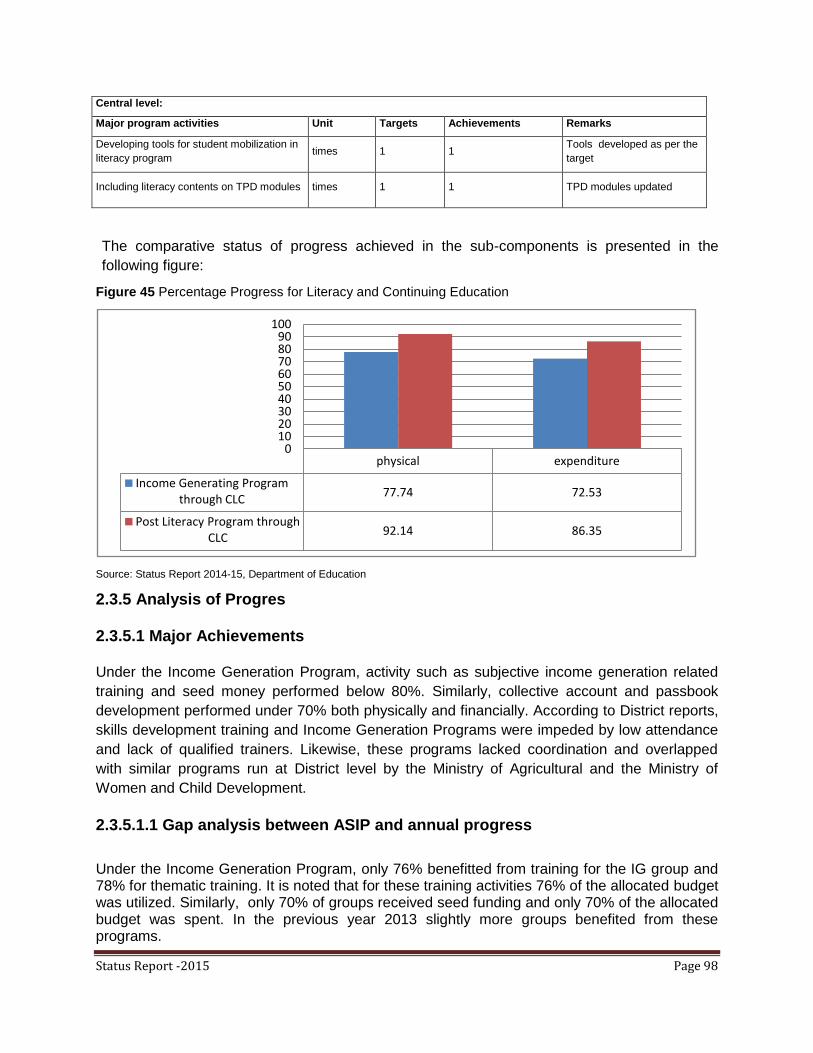
Status Report -2015 Page 98
Central level:
Major program activities Unit Targets Achievements Remarks
Developing tools for student mobilization in
literacy program times 1 1
Tools developed as per the
target
Including literacy contents on TPD modules times 1 1 TPD modules updated
The comparative status of progress achieved in the sub-components is presented in the
following figure:
Figure 45 Percentage Progress for Literacy and Continuing Education
Source: Status Report 2014-15, Department of Education
2.3.5 Analysis of Progres
2.3.5.1 Major Achievements Under the Income Generation Program, activity such as subjective income generation related
training and seed money performed below 80%. Similarly, collective account and passbook
development performed under 70% both physically and financially. According to District reports,
skills development training and Income Generation Programs were impeded by low attendance
and lack of qualified trainers. Likewise, these programs lacked coordination and overlapped
with similar programs run at District level by the Ministry of Agricultural and the Ministry of
Women and Child Development.
2.3.5.1.1 Gap analysis between ASIP and annual progress
Under the Income Generation Program, only 76% benefitted from training for the IG group and 78% for thematic training. It is noted that for these training activities 76% of the allocated budget was utilized. Similarly, only 70% of groups received seed funding and only 70% of the allocated budget was spent. In the previous year 2013 slightly more groups benefited from these programs.
physical expenditure
Income Generating Program through CLC
77.74 72.53
Post Literacy Program through CLC
92.14 86.35
0102030405060708090
100

Status Report -2015 Page 99
Similarly, funds were not fully utilized in 2014 for the post-literacy program through CLCs and
fewer individuals benefited except in the printing and distribution of copies of ledgers and
passbooks. Greater effort is needed so that more groups and persons benefit from these
programs.
The target is to increase the overall adult literacy rates by 75% by 2015. Unfortunately, the only
literacy data available is for 2011. Since 2011 a number of initiatives have been undertaken
without measuring literacy rates. It is of utmost importance that the outcomes of these new
programs are measured early in 2015 to assess whether the specific targets will be met by the
end of the year and what other initiatives can be taken to meet the targets.
2.3.5.2 Innovations and Case Studies
Many Districts such as VDCs/Municipalities conducted intensive literacy campaigns,
coordinating with local bodies including NGOs, INGOs, CBOs, schools, youth clubs,
housewife groups, and religious organizations.
Mobilization of CLS was a model in various Districts such as Dang, Dhading and
Chitwan.
Pyuthan District was proposed as the model District for student mobilization after which
the District was declared an illiterate-free District.
Panchthar District prepared a separate literacy textbook, incorporating exercises in the
textbook, which provided an excellent example.
2.3.5.3 Areas of Under-Performance
Illiterate men and women felt uncomfortable in literacy classes.
Facilitators in the literacy classes were not equipped with andragogy techniques.
Limited monitoring by relevant organizations.
Lack of ownership by local bodies.
Limited learning materials for adult learning.
Income generation by post-literate groups is not satisfactory.
Despite some model CLCs, the majority of them did not exhibit satisfactory performance.
Lack of post-literacy programs for newly literate persons.
Lack of qualified instructors to conduct the Income Generation Program.
Flexible schooling programs were not conducted all over the country.
2.3.5.4 Constraints
Regular update and record of MIS of NFE could not be managed annually.
Duplication in non-formal classes

Status Report -2015 Page 100
Unavailability of trained human resource to handle training like saving and IGP. Due to
low remuneration for trainers, the mobilization of technical personnel from agriculture
development office, veterinary offices were difficult.
NFE is not owned as shared responsibility by local government bodies and stakeholders.
2.3.5.5 Addressing Constraints and Maximizing Achievements
Insufficient coordination among local government bodies in delivery of NFE classes.
Literacy survey and regular update of NFE database should be made mandatory.
The survey report and the updated database should be utilized for selecting participants
(illiterate persons).
Interventions to sustain literacy focused on post-literacy, skills training and income
generation programs, should be implemented for the new literate.
Regular follow-up study and success case stories should be publicized regularly.
Coordination and collaboration with local government bodies in delivery of NFE classes
should be undertaken.
Program orientation for the DEOs and NFE section chief of the District Education Offices
and Regional Education Directorate was conducted to strengthen their program
implementation capacities.
Updated statistics should be used to conduct further programs.
Facilitators of NFE classes should be equipped with sufficient skills and expertise in
andragogy.
Learning materials should be updated and should meet the need for digital literacy.
2.3.5.6 Areas of Under-Performance
Motivating schools for school handover to community schools did not work well.
Under performance on updating the social and financial audit of community and
institutional schools.
Institutional development was not effective.
Quantitative increases to social and financial audits did not ensure the public service
delivery or achievement of the students.
Insufficient budget was allocated for the program "media for effective service delivery",
which diminished use of media for service delivery.
School financial and Social Audit record management of both institutional and
community schools is still unsatisfactory.
2.3.5.7 Constraints
Grants for school financial and Social Audits are insufficient, which affected quality output.

Status Report -2015 Page 101
Management capacity of local stakeholders is poor; affecting quality management of schools.
Lack of training programs for novice accountants in schools.
Lack of capacity development of DEO's officials on current trends for effective service delivery.
Budget allocated for educational exhibitions was not sufficient.
Lack of awareness of parents at the local level.
Involvement of community and local agencies in educational service delivery was not as effective as anticipated.
2.3.5.8 Addressing Constraints and Maximizing Achievements
Use of ICT and media for educational service delivery has been very effective.
Each DEO has a website as an efficient service delivery medium.
Activation of VECs in every VDC.
Teacher redeployment implementation, school merging and coordination with different community based organizations, NGO/INGOs and local bodies for quality service delivery were the main strategies.
Table No 59 List of Literate Districts
S. N. Name of District Date of Declaration Remarks
1 Sindhupalchok 2071/03/03
2 Lalitpur 2071/03/09
3 Palpa 2071/03/12
4 Dhading 2071/03/29
5 Mustang 2071/03/09
6 Syangja 2071/05/23
7 Chitwan 2071/03/09
8 Arghakhanchi 2072/03/20
9 Surkhet 2072/03/13
10 Pyuthan 2072/03/24
11 Gulmi 2072/03/26
12 Tanahun 2072/03/28
13 Kaski 2072/03/30
14 Nawalparasi 2072/03/31
15 Lamjung 2072/03/31
16 Rupandhehi 2071/03/31
17 Nuwakot 2071/05/21
18 Panchathar 2072/04/09
19 Dang 2072/03/24
20 Bhaktapur 2072/08/25
Status Report -2015 Page 102
Chapter 4 Enhancing Educational Quality
2.4.1 Introduction The main aim of the School Sector Reform Program (SSRP) is to improve the quality and
relevance of school education. The SSRP aimed to define minimum enabling conditions for
service delivery, develop a national framework of norms and standards for quality assurance,
and introduce the mother tongue in early Grades and continuous assessment system (CAS) for
quality enhancement. Based on the strategic framework of the SSRP core document, different
interventions are proposed in ASIP annually and are being implemented regularly. ASIP
2014/2015 is a continuation of the effort, and proposes many interventions for improving the
quality of school education.
2.4.2 ASIP Priorities
Strategic Priorities
Strategic priorities for ECEDCS
The following strategic priorities were devised to implement the program for achieving the
objectives the of ECED program:-
1. Support will continue for maintaining the national minimum norms and standards. Quality
enhancement of the existing programmes will be emphasized.
2. Mapping of programmes will continue in the remaining Districts. Based on the findings of the
mapping, priority will be given to relocating and opening centers to address equity concerns.
Priority will be given to recruitment of local female facilitators. An effective coordination,
collaboration and support mechanism will be established for motivationing teacher.
3. The strategy of affiliating community based centers with the nearest community school will
continue to improve management, operational support, monitoring, and channeling of
resources. The strategies of building partnership and collaboration with concerned
government agencies, and I/NGOs will continue with a view to sharing expertise and
resources.
4. The quality of service delivery and assessment of performance outcomes will be
continuously monitored and the information used to improve the performance of centers for
the delivery of quality services.
5. Efforts will be made to make materials available by mobilizing government organizations,
communities and non-government resources. Support to ECED centers through non-salary
PCF grants will be reviewed and further strategies will be designed accordingly. Local
bodies and communities will be encouraged to support centers in terms of financial and non-
financial resources.
6. Midday meal provision to all the school based ECED in the Karnali Zone will continue. For the other
14 Districts where day meal provision exists at the school level, home-grown food practices and a
Status Report -2015 Page 103
cost sharing modality will be promoted. The existing refresher training materials for the mid-day
meal management committee will be revised.
7. Minimum standards of ECED will be met through the development of 1053 model centers
within policy guidelines. Specifications for model ECED centers will be developed and
incorporated in the DOE‟s Programme Implementation Manual.
8. Facilitators will organize Parental Education (PE) and awareness programmes for the
parents of marginalized and disadvantaged groups. A tool will be developed for change
monitoring (Parents‟ knowledge before and after the PE), and facilitators will conduct
assessments based on the tool.
9. The existing basic and refresher training programme will be organized for facilitators
including the newly appointed ones. The National networking meeting will be regularized for
better coordination among concerned Government and Non-Government organizations.
10. Half-yearly progress sharing and interactive meeting for facilitators will be organized at RC level.
Strategic priorities for Basic Education
The following strategic priorities were addressed by the MTR recommendations on quality and
equity challenges in Basic education and to achieve the objectives of the Basic education
program: -
Improving Access and Equity
1. Free and Compulsory Basic Education (FCBE) will be implemented in a phased manner.
DEOs will provide technical and logistic support in line with the CBE model and
according to the eligibility criteria provided by DOE to interested VDCs and
Municipalities. I/NGOs and CBOs will be actively engaged in aligning their commitments
and support at District level and VDC level with the CBE model and the prioritized VDCs,
as identified by the DEO in the Districts.
2. I/NGOs will work in close coordination with DEOs, VDCs/VECs that have large numbers
of OoSC, seeking the support of DOE/DEOs through the CBE model. Additional needs-
based interventions will be provided to strengthen enrolment and participation in
education to severely deprived communities, such as Raute, Chepang, Mushahar &
Badi.
3. At the outset, the selected VDCs, where CBS data has showed that there are significant
numbers of OOSC, will be supported as per the needs identified through mapping. This
will exclude Districts and VDCs which already have intensive support through other
programs, such as the Karnali zone and CBE Districts/VDCs.
4. MOE will, where possible, coordinate with the MOFAL to mobilize its resources through
DDC and VDC/Municipalities to support effective implementation of Free and
Compulsory education in VDCs and Municipalities. MOE will regularly follow-up with the
MOFALD and MOF for the allocation of at least 20% of the local funds to be spent on
education development within each VDC/Municipality.
Status Report -2015 Page 104
5. Based on identified need by DEOs, Schools with residential facilities for those OOSC
children will be provided in Districts where mainstreaming measures are not feasible. In
addition, residential schools will be run in Manang, Mustang, Upper Dolpa, Rasuwa,
Upper Mugu & Upper Humla Districts on model basis.
6. Alternative modes of schooling will be pursued in areas with high numbers of OOSC to
address the learning needs of those children who are unlikely to be enrolled in school
due to their age. Within this, partnerships and collaboration with GOs, I/NGOs and other
providers will be initiated to share expertise, experiences and resources.
7. DEOs will promote Community Learning Centers (CLCs) in collaboration with local
NGOs, VDCs and Municipalities to develop the profile of working children and street
children.
8. Efforts will be made to improve enrolment and pass rates and to reduce dropout and
repeat rates by strengthening Child- Friendly School (CFS) learning environments,
ensuring PMEC and child centered learning practices in schools.
9. Incentives will be provided to community schools that meet 100% retention (no dropouts
and no repeats) in Grade 1 and achieve over 95% cycle completion rate at the end of
Grade five. In addition, DEO will publicly commend SMC members of schools achieving
100% retention.
10. In areas where seasonal migration is common, mobile schools will continue to operate.
11. Incentives and scholarship schemes will continue to support schooling of girls, Dalits,
children with disabilities and other disadvantaged and marginalized communities.
Increasing access and promoting equity and social inclusion in school education will be
at the core of the incentives and scholarship program. For further alignment, integrated
Scholarship Guidelines will specify the distribution mechanisms and targeting criteria for
scholarships and other incentives to strengthen a need based approach. Scholarship
distribution and monitoring mechanisms will be strengthened through a „one door‟
system. In Districts where Poverty Cards have been issued, all children of poverty card
holders will receive scholarships. In other Districts, provisional measures will be
developed to support children belonging to poor families, regardless of their ethnicity,
until poverty cards have been issued.
12. A comprehensive package for Parenting Education will be developed. The package will
be run in partnership with I/NGOs in the District, prioritizing Districts/VDCs with high
numbers of OOSC. Parenting Education will focus on providing parents with Basic
literacy and numeracy, making them aware of the value of education and how to
establish an education-enabling learning environment at home.
13. NCED will develop and run teacher training programs in MLE and disabled-friendly
teaching and learning schools as per identified need. The opportunities for demand-
based multilingual education will be expanded by developing MLE capacity of teacher
and providing teaching and learning materials in the mother tongue. The development of
a comprehensive language policy including the use of the mother tongue, Nepali, and
English will be pursued, based on a joint study on the challenges and opportunities with
regards to Medium of Instruction (MOI) in Nepal.
Status Report -2015 Page 105
Quality and relevance
1. School mapping, IEMIS data, SIP/VEP and PMECs survey reports will be used to
determine a school‟s physical and educational needs and to meet these needs
accordingly.
2. Mandatory provision and regular use of book corners in all community schools will be
enforced by providing appropriate resources and training to teacher on the use and
purpose of a book corner which they can use for learning activities.
3. Action plans for reform interventions based on the National Assessment of Student
Achievement (NASA) findings will be prepared and implemented to strengthen learning
outcomes. The results and recommendations of the NASA reports will inform relevant
priority areas in the ASIP/AWPB. Implementation of the National Assessment of Student
Achievement (NASA) will continue. For the coming fiscal year, NASA for Grade 3 and 5
will be carried out. Further institutionalization of NASA will be pursued through an action
plan.
4. Minimum standards for educational environments will be implemented for improving
quality of education at all levels by focusing on student-centered learning/teaching
methods. In order to foster quality and relevance, performance-based incentives for
schools and teacher will be reviewed and implemented. The schemes will be updated
annually based on critical monitoring and evaluation of their effectiveness and impact.
The teacher-student ratio will be reviewed for the recruitment and (re)deployment of
teacher.
5. The Continuous Assessment System (CAS) will be strengthened with CDC developing
Grade-specific remedial courses and NCED developing a more comprehensive training
package focusing on CAS and remedial classes. All teacher will receive CAS and
remedial training.
6. CDC will develop Grade-wise minimum achievement levels for students with specific
focus on reading levels among students in Grades 1-3. For this purpose, EGRA tools will
be reviewed and adjusted to measure students learning outcomes accordingly and meet
the need for early Grade reading assessment. EGRA tools will be used to assess
students‟ reading competency in early Grades (1-3). DEOs with support from ERO will
annually assess students‟ progress in reading levels and will award teacher achieving
the highest reading level in the District. The Government will implement National Early
Grade Reading Program (NEGRP) focused on strengthening literacy skills in Grades 1-
3. Within the next two years, MOE/DOE will develop a comprehensive program on
NEGRP and will pilot a few models of interventions in selected Districts and schools.
7. School mapping activities will be completed to facilitate restructuring, including merging,
downsizing, and use of multi-Grade teaching to ensure cost effectiveness of school
operations. In line with this, incentive schemes will be introduced to encourage schools
located in sparsely populated areas to register as multi-Grade schools.
Status Report -2015 Page 106
8. In relation to school health and nutrition program, clean water and adequate sanitation
facilities will be ensured and strengthened in public schools in a phased manner,
prioritizing schools in VDCs with highest number of out-of-school children.
9. Learning achievement in community schools will be improved through interschool
partnership in public schools.
Governance and management
1. The appointment of headteachers on a contract basis will be introduced in all Basic
education (Grades 1-8) schools.
2. The institutional capacity of REDs, DEOs and RCs will be strengthened.
3. The role of School Supervisors (SS) and Resource Persons (RP) will be specified and
they will have performance contracts. Their capacity will be further developed and
effectively mobilized in order to improve school‟s performance. The DOE will develop
school based performance indicators for RPs/SSs, from which they will plan their
support to schools.
4. Release of RC and inspection zone management grants will be subject to submission of
progress reports and assessment of progress.
5. Individual members of the SMC will be assigned specific tasks such as student
enrolment, early dropout, school infrastructure, teacher management, learning
achievement, school community relationships and so forth. SMC members will be
provided with the necessary orientation to perform their roles and duties effectively. The
best performing SMC/PTA members will be publicly recognised.
6. The SMCs, HTs and teachers will be encouraged to use information from various official
reports (MOE/DOE reports and CBS reports) in developing School Improvement Plans
(SIPs) prioritizing interventions where improvement is felt necessary.
7. DEOs will identify low performing schools in the District using school accreditation and
MEC indicators and will prioritize assisting these schools to devise SIPs, targeting
quality improvement initiatives aimed at enhancing school performance. Key priority
indicators and standards of Child Friendly School (CFS)/MEC will be incorporated in the
School Improvement Plan (SIP) guidelines.
8. MOE will assemble a team of senior education experts to initiate the dialogue and
consultations at national level to develop the concepts of Education in Beyond 2015 in
the context of Nepal.
9. The MOE will assess, retrofit and reconstruct 464 school buildings, of which 255 are
located in the earthquake prone Kathmandu Valley.
Strategic priorities for Secondary Education
The following strategic priorities were decided to achieve the objectives of the Basic education
program:-
Status Report -2015 Page 107
Access and Equity
1. Necessary preparations will be made to implement the Free and Compulsory integrated
Secondary education system (Grades 9-12). Integration of Grades 9-12 education policies,
curriculum, examinations and training will be carried out in line with the Education Act
(amended in 2016).
2. Guidelines and orientation will be developed for secondary schools in establishing minimum
enabling environment for students with different types of disabilities.
3. Equitable access to secondary level education (Grades 9-12) will be ensured based on
mapping.
4. MOE/DOE will review and assess the effectiveness of existing support schemes for students
of Karnali zone as well as students of marginalized and disadvantaged communities.
5. The current incentive scheme will continue to ensure access to and completion of
Secondary education especially for Dalits, marginalized groups, disabled students, girls, and
children from economically poor households.
6. MOE/DOE will implement a „one-door‟ system for effective scholarship distribution. At
secondary level, scholarships will be distributed to students through individual bank
accounts (where bank facilities are available). Poverty cards issued by the government will
be utilized for scholarship distribution.
7. The integrated scholarship distribution guidelines will be updated and implemented.
Alternative and open learning programs will continue to enable access to and participation of
women, ethnic groups, Madhesis, Dalits, disabled, Muslims and other marginalized
communities in secondary education.
8. MOE will convene a team to look into ways and means to promote partnerships with private
providers to safeguard access to quality Secondary education in areas that are not well
served with educational services. Packages will be developed to attract such partnerships in
mountain districts and remote hilly areas.
9. Private/public partnerships will be emphasized for sharing best practices in quality
improvement. In addition to this, partnerships will be developed between better and low
performing schools, particularly private & public schools.
Quality and Relevance
1. The guidelines developed by MOE for setting secondary education standards will be
reviewed and all secondary schools will be required to meet them by 2015.
2. Within PMEC, priority will be given to ensuring all community secondary schools have a
functioning library and science laboratory.

Status Report -2015 Page 108
3. Provision will be made for incentives to the two best performing Secondary schools in each
District, who will be awarded NPR 500,000 each. The best performing schools will support
weaker schools to obtain better results.
4. MOE/DOE will make provision and provide special incentives to acquire qualified and
competent science and mathematics teachers.
5. Necessary preparation will be made for the content of teacher training of, and integration of
soft-skills in, the Secondary curriculum, for the purpose of piloting the curriculum in schools
that have received the Basic education level soft-skills curriculum.
6. Introduction of the pre-vocational stream in Secondary education will continue in 100
schools.
7. CDC in collaboration with CTVET will develop and enforce the National Vocational
Qualification Framework in the country.
8. An integrated framework of alternative/open learning will be developed and implemented. A
National curriculum framework for Grades 9-12 will also be developed.
Learning and Evaluation
1. Learning achievement in community schools will be improved by encouraging interschool
partnerships to ensure equity.
2. Remedial support programs will be launched in schools targeting students lagging behind in
acquiring minimum learning outcomes.
3. There will be a minimum of eight teacher (through teacher redeployment, PCF salary
support and local resource mobilization) in identified integrated Secondary level schools
(Grades 9-12) in pilot Districts. Attention will be given to deploying teacher by considering
the school as a unit.
4. Student learning will be supported through enhancing ICT in education. Community
involvement will be promoted through advocacy and awareness.
5. The existing supervision and monitoring system will be strengthened to provide general and
instructional support to integrated Secondary schools.
6. The existing capacity of REDs will be reviewed and strengthened enabling them to manage
Grade 10 final examinations at the regional level.
7. Performance contracts with Head Teacher will be prepared by the DEO. Better performing
teacher(s) & headteacher(s) will receive additional incentive.
8. The performance evaluation of RPs, SSs and DEOs will be linked with achievement and
performance of schools in their respective areas.
9. After the publication of SLC results, review workshops will be organized at district, regional
and central levels to take necessary remedial action for further improvement.

Status Report -2015 Page 109
10. Setting the targets and indicators for the improvement of SLC results, necessary
interventions will be initiated at all districts.
11. Separate headteachers in all secondary schools will be instated by 2015/016 on
performance contract basis.
12. A National Examination Board (NEB) will be established and put into operation after the
enactment of the amended Education Act in 2016.
Strategic priorities for Monitoring and Evaluation
The following strategic priorities were devised to achieve the objectives of the Basic education
program: -
1. EPC and other concerned agencies and authorities review the annual reports of NASA
and other reports produced by ERO.
2. An integrated monitoring mechanism will be developed among central level agencies
(CLAs) to make monitoring more comprehensive, effective, efficient and compliant.
Proper cooperation among CLAs will reduce duplication in monitoring activities.
3. Establishing a clear linkage between planning and programme monitoring activities will
be prioritized.
4. Participatory monitoring will be strengthened at school level involving SMC, PTA, and
child clubs.
5. Central level and other agencies under MOE will be encouraged to prepare and
implement M&E plans in line with the ASIP/AWPB in order to reduce duplication and to
ensure the efficiency, effectiveness, sustainability, and timeliness of service delivery to
beneficiaries. The ASIP/AWPB will be used as one of the basic instruments for
performance and progress monitoring against the stated priorities, targets, and budgets.
6. Assessing the school level status against SSRP indicators is the key priority of
monitoring and reporting.
7. The Flash Reporting system, NASA reports, the NFEC, HSEB, OCE database, and
census report will be considered as a foundation for reviewing and revising the KPIs of
SSRP to make it more contextual.
8. Capacity of the human resources at all levels (from school level to central level) will be
strengthened in order to enhance the quality of monitoring, supervision and reporting
mechanisms. In this regard, the human resource capacity in monitoring and review
functions will be developed.
9. REDs will be strengthened to carry out monitoring activities on a regular basis and
support the district for the proper implementation of educational plans and programmes.

Status Report -2015 Page 110
10. The capacity of School Supervisors and RPs will be developed to carry out supervision
activities in order to ensure professional support to the teacher.
11. Resource allocation will be tied up with the monitoring plan.
12. Average achievement scores by subject, teacher, level & class will be calculated and
compiled in order to ensure accountability at all levels.
13. In order to ensure the appropriate utilization of funds provided, financial and Social
Auditing will be tied to the trimester fund release to schools as a mandatory provision.
14. Preparations will be made for establishing a financial management information system in
the education systems at the Central, regional and District level.
15. Monitoring reports will be utilized for timely adjustments in programme implementation
and for informed decision-making processes at various levels.
16. IEMIS will be strengthened by improving and integrating existing databases &
introducing technological innovations. In addition to this the key results indicators will be
revised and used to follow up as stipulated in the SSRP extension document.
17. A simplified accounting manual will be developed and implemented for schools and
training will be conducted on the new accounting manual for teacher/staff.
18. Financial and Social Audits will be carried out on a regular basis. An independent review
of the school level financial audits will be conducted working very closely with REDs on a
sample basis to improve the quality of school audit reports.
19. Governance, accountability and transparency in the textbook printing and distribution
system will be improved at all levels on a regular basis.
20. The recommendations made by the comprehensive studies of textbook policy and
practices will be referenced to take corrective actions to enhance the textbook printing
and distribution system.
21. Institutional cooperation with I/NGOs will be formalized at both central and district levels
in line with SSRP goals and priorities to strengthen service delivery.
22. A joint monitoring mechanism will be introduced and strengthened comprised of key
stakeholders, journalists, CSOs, etc. in order to ensure the transparency, accountability,
sustainability, timeliness, efficiency, and effectiveness of the implementation of
educational plans and programmes at district, RC and school levels.
2.4.3 Achievement against Indicators
Quality is an overarching concept, which is linked with all the components of SSRP. Activities
and priorities in ASIP/AWPB are directed towards enhancing quality in education. This section
focuses mainly on indicators related to the internal efficiency of the basic education system.
Table 60 below shows the achievements made so far.

Status Report -2015 Page 111
Table No. 60 Achievement Against Annual Targets
Indicators 2009 2010 2011 2012 2013 2014 2015
Repetition Rate Grade1 26.5 22.6 21.3 19.9 17.5 15.2 12.3
Drop Out Rate Grade 1 9.9 8.3 7.9 7.7 7.1 4.69 4.69
Promotion Rate Grade 1 63.5 69.1 70.7 72.5 75.4 78.4 83.1
Repetition Rate Grade 5 6.7 5.7 5.4 5.3 5.3 5.3 5.3
Drop Out Grade 5 7.4 6.5 6.2 6 4.5 3.1 4.1
Promotion Rate Grade 5 85.8 87.8 88.4 88.7 90.2 91.6 91
Drop Out Primary Level 6.5 6 5.4 5.2 4.7 4.2 3.8
Promotion Rate Primary Level 79.1 81.9 83.1 84.2 85.5 86.7 88.2
Repetition Rate Primary Level 14.4 12.1 11.5 10.6 9.8 9.1 8
Promotion Rate Grades 6-8 89.4 90.1 89.9
Repetition Rate Grades 6-8 4.9 4.6 4.8
Drop Out Grades 6-8 5.7 5.3 5.3
Source: Flash Report 2009 to 2015.
Repetition rates in Grades 1 and 5 are decreasing; the Grade 1 repetition rate declined
significantly from 26.5% in 2009 to 12.3% in 2015. This would suggest that the promotion rate
has also increased continuously; the promotion rate in Grade 1 increased from 63.5% in 2009 to
83.1% in 2015. The dropout rate also declined from 9.9% in 2009 to 4.69% in 2015. Figure 46
shows the trend of Promotions, Repetition and Dropout (PRD) in class 1 over last five years.
Figure No. 46 Trend of Promotion, Repetition and Dropout Rate in Grade 1
Similar trends can be observed in Grade 5 and the entire Primary level. The repetition rate in
Grade 5 has declined from 6.7% to 5.3%, the dropout rate from 7.4% to 4.1% and the promotion
rate has increased to 91% from 85.8% over the last seven years. Figure 47 below shows the
comparative status of PRD in Grade 5.

Status Report -2015 Page 112
Figure No. 47 Trend of Promotion, Repetition and Dropout Rates in Grade 5
Similar trends can be observed in Grades 6-8 at Lower Secondary level. The repetition rate in
Grades 6-8 has decreased from 4.9% from 2013 to 4.8% in 2015, the dropout rate from 5.7%
from 2013 to 5.3% in 2015 and the promotion rate has increased to 84.4% from 2013 to 89.9%
in 2015. Figure 48 shows the comparative status of PRD in Grades 6-8.
Figure No. 48 Trend of Promotion, Repetition and Dropout Rate in Grades 6-8
According to Flash I (2015-2016), the completion rate to Grade 5 increased from 85.4% in 2014
to 89.4% in 2015 and in Grades 6-8 increased from 73.3% in 2014 to 77.2% in 2015. The
improvements have been the result of grant support to schools with SIPs; free textbooks;
scholarships; PCF teacher support; midday meal programs and implementation of CAS over
recent years.

Status Report -2015 Page 113
2.4.4 Achievement against Annual Targets
Table No. 61 Physical Progress Achieved Against Annual Targets
Targeted activities in ASIP/ABPB Targets Achievements
Grant support to schools
Management cost support to purchase teaching materials
for multi-Grade teaching in previous schools. 103 schools
91 (88.35%) schools received grants to
implement multi-Grade teaching
Management cost support to purchase teaching materials
for multi-Grade teaching in newly identified schools. 376 schools
340 (90.43%) schools received grants to
implement multi-language teaching.
Management cost support to purchase teaching material for
multi-language teaching in newly identified schools. 96 schools
59 (61.46%) schools received grants to
implement multilanguage teaching
Management cost support to purchase teaching material for
multi-language teaching. 24 schools 23 (95.83%) received grants.
Midday meal program for Karnali zone [ ECD & class (1-5) ] 79,147
students
88,213 (11.45%) students received midday
meals.
Midday meal program for other 14 Districts [ ECD &
classes 1-5 ]
283,696
students
192,233 (67.76%) students received midday
meals
Continuous student assessment and strengthening CAS for
class 1 new enrollment.
908,570
students
641,545 (70.61%) students of Grade 1 were
covered within CAS system.
Completion and improvement of Grade 8 District level
examinations
504,970
students
Grade 8 final examinations of 452,639
(89.64%) students were conducted in all
Districts
Free text book distribution for Grades 1-5 students based on
per child cost.
3,039,816
students
2,797,389 (92.06%) students received free
textbooks.
Free text book distribution for Grades 6-8 students based on
per child cost
14,39,679
students
1,337,484 (92.94%) students were benefited to
get free textbooks.
Free text book distribution for Grades 9-10 students based
on per child cost
6,73,384
students
660,240 (98.01%) students received free
textbooks.
Free text book distribution for Grades 11-12, all girls and
Dalit students based on per child cost 134,584
125,437 (82%) students received free
textbooks.
PCF salary (Per child cost) grant to schools based on Flash
Report II.
249,920
students.
233,189 (93.3%) students received PCF
teaching facilities.
Grants to DEOs NPR
186,369,000 170,282,000 (91.3%)
Flash Report, FMR report, Status Report, teacher record
update- preparation, publishing and dissemination. 80 times 79 (98.75%) DEOs and REDs prepared
Management cost for curriculum implementation committee
at DEO & RED. 80 times
80 (100%) DEOs and REDs conducted
meetings.
Incentive to DEO, SS, RP and teacher based on
achievement 2,043 persons 983 (48.12%) persons received incentives.
Action research support program for RED and DEO 80 times 63 (78.75%) DEOs and REDs conducted
actions research.
Teacher training on action research 4,583 persons 4,111 (89.7%) teacher received orientation on
action research.
Measurement of learning achievement of Grades 3-5 test
administration. (National Assessment of Student
achievement, NASA)
7,121 students NASA test was taken by 7,121 (100%)
students.
3 days orientation to markers/ examiners (in 5 RED)
persons 1,000 persons 800 (80%) persons were involved in orientation
Development of Item Bank for Class 8 3,000 persons Capacity Building of 2,680 (89.33%) persons
for item bank construction
Development of Item Bank for class 5 1,600 persons Capacity Building of 1,461 (91.31%) persons
for item bank construction.
Library and Information center 80 77 (96.25%) centers were established
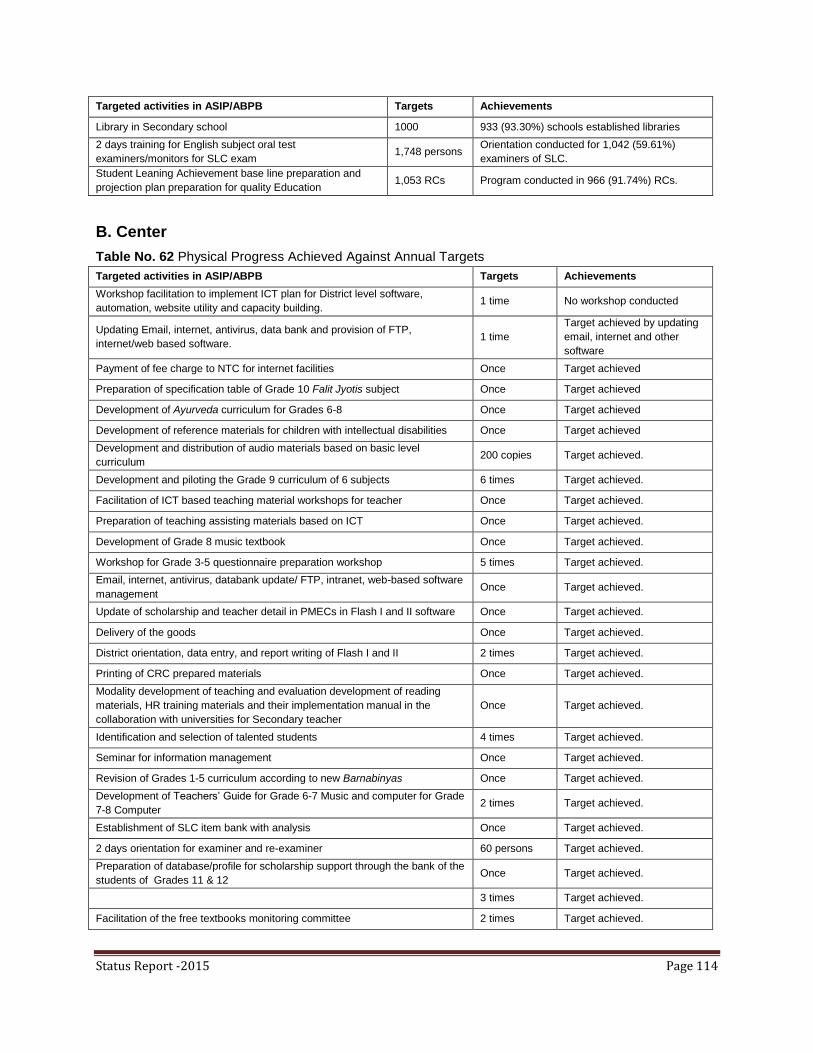
Status Report -2015 Page 114
Targeted activities in ASIP/ABPB Targets Achievements
Library in Secondary school 1000 933 (93.30%) schools established libraries
2 days training for English subject oral test
examiners/monitors for SLC exam 1,748 persons
Orientation conducted for 1,042 (59.61%)
examiners of SLC.
Student Leaning Achievement base line preparation and
projection plan preparation for quality Education 1,053 RCs Program conducted in 966 (91.74%) RCs.
B. Center
Table No. 62 Physical Progress Achieved Against Annual Targets
Targeted activities in ASIP/ABPB Targets Achievements
Workshop facilitation to implement ICT plan for District level software,
automation, website utility and capacity building. 1 time No workshop conducted
Updating Email, internet, antivirus, data bank and provision of FTP,
internet/web based software. 1 time
Target achieved by updating
email, internet and other
software
Payment of fee charge to NTC for internet facilities Once Target achieved
Preparation of specification table of Grade 10 Falit Jyotis subject Once Target achieved
Development of Ayurveda curriculum for Grades 6-8 Once Target achieved
Development of reference materials for children with intellectual disabilities Once Target achieved
Development and distribution of audio materials based on basic level
curriculum 200 copies Target achieved.
Development and piloting the Grade 9 curriculum of 6 subjects 6 times Target achieved.
Facilitation of ICT based teaching material workshops for teacher Once Target achieved.
Preparation of teaching assisting materials based on ICT Once Target achieved.
Development of Grade 8 music textbook Once Target achieved.
Workshop for Grade 3-5 questionnaire preparation workshop 5 times Target achieved.
Email, internet, antivirus, databank update/ FTP, intranet, web-based software
management Once Target achieved.
Update of scholarship and teacher detail in PMECs in Flash I and II software Once Target achieved.
Delivery of the goods Once Target achieved.
District orientation, data entry, and report writing of Flash I and II 2 times Target achieved.
Printing of CRC prepared materials Once Target achieved.
Modality development of teaching and evaluation development of reading
materials, HR training materials and their implementation manual in the
collaboration with universities for Secondary teacher
Once Target achieved.
Identification and selection of talented students 4 times Target achieved.
Seminar for information management Once Target achieved.
Revision of Grades 1-5 curriculum according to new Barnabinyas Once Target achieved.
Development of Teachers‟ Guide for Grade 6-7 Music and computer for Grade
7-8 Computer 2 times Target achieved.
Establishment of SLC item bank with analysis Once Target achieved.
2 days orientation for examiner and re-examiner 60 persons Target achieved.
Preparation of database/profile for scholarship support through the bank of the
students of Grades 11 & 12 Once Target achieved.
3 times Target achieved.
Facilitation of the free textbooks monitoring committee 2 times Target achieved.

Status Report -2015 Page 115
Targeted activities in ASIP/ABPB Targets Achievements
Development of digitized curriculum for ICT in education in collaboration with
organizations Once Target achieved.
Consultancy services from third parties for monitoring and reporting of
supporting scholarship and teacher salary Once Target achieved.
Use of internet facility by DOE Once Target achieved.
Development of prototype item for SLC exam for printing and distribution Once Target achieved.
Revision of the NASA guidelines and printing report Once Target achieved.
Collaboration with CERID for formative research Once Target achieved.
Communication and co-ordination with stakeholders to facilitate redeployment
of teacher quota Once Target achieved.
Capacity building of school level library management in coordination with the
Nepal National Library Once Target achieved.
Workshop on questionnaire development 1 time Target achieved.
Agencies achievement test 1 Time Target achieved.
Schools achievement test Once Target achieved.
Finalization of curriculum for students with IDs through feedback collection 1Time Target achieved.
Dissemination of reports (IPR, Status Report, Monitoring report) 1 Time Target achieved
Role of stakeholders in institutional schools Once Target achieved.
Souvenir publication for Education Day 1 Time Target achieved.
Consultancy services for national quality test (NASA) Grade 3-5 Once Target achieved.
Longitudinal study on student achievement Once Target achieved.
TOT Grade 8 curriculum, textbooks evaluation and dissemination 160 persons Target achieved.
Finalization of Grade 4 textbook (Magar and Dhimal), Grade 5 (Tamang-
Sambhota) and Grade 2 Bajjika developed last year Once Target achieved.
Finalization of Grade 4 and 5 gurukul textbook of Tamang language and
Grade 2 gurukul Bajjika language developed last year Once Target achieved.
Finalization of music textbook of Grade 7 Once Target achieved.
2.4.5 Analysis of Progress 2.4.5.1 Major Achievements
At Central level, there were 91 activities planned under this component. Of these activities, 45
activities were not performed such as development of curriculum and textbooks of different
Grades of different subjects/languages, feedback collection on Grade 8 piloted textbook, testing
items of SLC examination, development and distribution of materials on teaching and learning,
partnerships with different organizations for promotion of ICT in education, grants for related
organizations, conducting student evaluation activities, partnership with universities, auditing the
achievement of different organizations, auditing the achievement of schools, developing the
capacity of ERO and updating NASA guidelines and tools, preparing and printing reports, etc.
The overall PPR and FPR for this component were 67.72% and 49.01% respectively, whereas
in the last year these rates were 86.70% and 65.75%. The huge decline in progress was due to
unimplementation of some of the activities to be performed by DOE, ERO and OCE.

Status Report -2015 Page 116
At the District level, this component consisted of eight major subcomponents. All of the activities
developed under this component were aimed at enhancing the quality of school education and it
represents the largest portion of the recurrent budget allocated to the districts. These sub-
components consists of grants to schools for managing multilingual education; midday meals;
strengthening evaluation systems and CAS; strengthening Grade 5 and 8 examinations;
promotion of reading skills; grants for free textbooks to students of Grades 1-10 and targeted
students of Grades 11-12; PCF salary grants; support to districts for different activities; student
learning achievement baseline, and projection and preparation of plans.
In 2014/2015, about 80 percent of students received a complete textbook set within the first two
weeks of the academic session. Compared to previous years, students received the complete
set of textbooks for all classes at a time in this year.
The overall PPR and FPR were 90.54% and 83.22% respectively, whereas these rates were
92.99% and 84.60% in the previous year 2014. All activities implemented were in accordance
with the differing requirements of each district. The progress slowed compared to the previous
year because of the damage caused by the earthquake in more than 14 districts across the
country. Most of the activities entailed school support based on student numbers and
predetermined norms and standards. Due to the increasing reliability of verification mechanisms
of actual student numbers and strictly followed norms and standards, actual numbers declined
compared to last year's projection, hence the PPR and FPR did not reach 100%.
The first sub-component "Enhancing Educational Quality" focused mainly on quality issues,
such as; grants to manage educational materials for schools; to conduct multi-Grade teaching;
for multilingual education; for midday meals for the Karnali zone and another 14 Districts;
strengthening of CAS; strengthening Grade 8 examinations and promotion of reading skills.
Districts reported that some programs such as "Grants for best performing Basic schools &
grants to fulfill MECs”, encouraged schools to focus on best practice and motivated them to
perform better. The item bank for Grade 5 and 8 examinations was prepared/up-dated by all
Districts in FY 2014/2015. According to responses received, it contributed to Districts
conducting the exam effectively, increasing the reliability and validity of test items and
strengthening the capacity of subject teacher to prepare better items for their school level
examinations.
Implementation of some of the activities yielded average results only. It was expected that
action research conducted by teachers based on teaching and learning activities would
contribute to improving teaching and learning in the classroom. According to reports from many
Districts, teachers weren't motivated to perform action research and some additional instruction
will be needed in the future. Similarly, additional reinforcement for teacher motivation to
implement CAS is needed even though some Districts and schools have performed well.
There was provision for a District Curriculum Coordination Committee and these were formed in
all Districts. However, the role of the committee was not as well-defined as expected. Minor
problems related to implementing the national/local curriculum were sent to each center and
sometimes these were publicized in the media, drawing unnecessary attention from concerned
parties.

Status Report -2015 Page 117
It was observed that the management of Flash, Status, Financial and Monitoring reports is
improving in most of the Districts except in some mid-Terai Districts (which had not developed a
systematic record keeping system).
2.4.5.1.1 Gap analysis between ASIP priorities and annual targets The data for 2014/15 on achievement against the annual target set by ASIP/ABPB indicated the
following:
Only 42% of students in Grade 1 had been covered within the CAS system. Assessing
student assessment and strengthening the CAS for Grade 1 new enrolments needs to
be increased to a minimum 50% in 2016.
Against the incentives to DEO, SS, RP and teacher on achievement' target, not many
individuals (29%) received incentives. The reasons for not providing more incentives
should be examined.
Every year a number of initiatives are undertaken to enhance the quality and relevance
of school education. The clear outcomes of these initiatives are not identified. There is a
need to construct a set of quantitative measures of progress.
2.4.5.2 Innovations and Case Studies
Every DEO is to reference their average learning achievement in setting goals for the
next year. Every teacher, school and RC are required to determine the learning
achievement in every subject.
In DEO Manang, teachers have started to use teacher diaries to ensure quality in
school education. This District has also started team supervision in all community
schools to provide technical assistance to the teacher. DEO Manang further carried out
action research into the declining number of students in community schools.
DEO Sankhuwasabha prepared an RC level educational calendar and teaching
improvement program.
DEO Salyan clearly detailed extracurricular and co-curricular activities to be performed
by schools once each yearly educational calendar, ensuring the learning opportunities
took place.
DEO Solukhumbu prepared and used listening cassettes in English at Lower
Secondary level.
DEO Dhankuta prepared 114 points of commitment in the District to ensure quality
education and teaching/learning improvements. After successful implementation of this
commitment, the average learning achievement of students increased by 4.47%, 3.12%
and 0.17% respectively at Primary, Lower Secondary and Secondary level. Similarly, a
learning improvement planning workshop was organized in collaboration with SMC
Status Report -2015 Page 118
chairpersons, Head Teacher and stakeholders.
Performance contract with DEOs, RPs, School Supervisors and Head
Teacher
The MOE introduced a performance contract system to ensure quality and increase
responsibility and accountability. In that context, the RED Central region entered into a
performance contract with the DEOs of this region. Subsequently, all DEOs signed
performance contracts with RPs, Supervisors and Head Teacher, followed by many
other Districts including Salyan, Dhading, Dang, Bardiya, and Darchula. The initiative
was directly related to improving learning achievements, ensuring quality, enhancing
school support, monitoring and career development.
Planning of Learning Achievement by Students (PLAS)
DEOs Dang and Dhading conducted PLAS programs with students, whereby students set their
own learning goals and identify necessary strategies to improve their performance. Schools and
teachers assist students to prepare well-structured strategies. After their final exam, students
review their achievement and make further improvements to their plan. The report indicates that
the strategy significantly improved learning achievement.
DEO Kaski, Palpa and Manang developed a teacher's diary and provided it to schools.
Teachers use individual diary in preparing teaching notes and lesson plans. Feedback
from DEOs, Head Teacher, teacher and SMC members was exceedingly positive. DEO
Kaski analyzed learning achievements of students RC-wise and subject-wise. In many
districts, School Improvement Plans and guidelines have been developed and
distributed.
A dictionary of Nepali-English-Mugali (a local language) was developed by DEO
Mugu.
A dictionary of Nepali - Bhot Lama Language (a local language) was developed by DEO
Humla.
DEO Kaski developed and used the CAS record book. DOE Syangja developed and
distributed necessary tools required for CAS.
DEO Palpa and Manang developed a teacher's diary and provided it to schools. The
diary is used by individual teacher for preparation of teaching notes and lesson plans.
Feedback from DEOs, Head Teacher, teacher and SMC members was favorable.
To motivate parents to visit and monitor their respective schools, DEO Palpa made
provision for keeping records of parents' attendance at schools during monitoring &
inspection at RC and District level.
DEO Syangja initiated the practice of dissemination of educational programs by holding
meetings of HTs at Secondary levels in District and those of Basic levels in RCs.
DEO Gorkha formulated VEC/ MEC, thereby facilitating the development of VEP. This
District also developed an RC profile.
DEO Dhading conducted a SLC support program. Each RC has 5 model schools and
each model school provides an SLC support program for underperforming schools.
Status Report -2015 Page 119
Learning groups were formed by some schools in villages in Mugu District.
DEO Mygdi implemented potato farming within the local curriculum and also introduced
a program of opening the school library on public holidays and during the long (summer)
vacation.
Result Oriented Service Delivery
DEO Rukum has focused on 'service with a smile' and service delivery has been promoted with
the spirit of “Better Rukum- Our Campaign”.
"Teacher can make a difference"
A program related to enhancing the quality of school education entitled "Teacher can make a
difference" was conducted in Dhanusa, and Dadeldhura Districts by the Suryodaya Saikshik
Pratisthan (Sunrise Education Foundation), in collaboration with the teacher' Union of Nepal
(TUN), Education Journalists' Group, Education Policy and Practice Center, teacher Monthly
(magazine), the Department of Education and District Education Offices. The organizers
established it as a campaign, which was conducted in Dang and Dolakha last year.
2.4.5.3 Areas of Under-Performance
Observations from joint collaborations with Development Partners and stakeholders are noted
below:
Benchmarks for 'quality education' in our context have not been defined. The quality of
education is being discussed and practiced on the basis of subjective perception.
Despite various interventions the dropout and repetition rates could were not reduced
significantly.
Learning achievement remains one of the greatest challenges, with achievement at
every level still less than 50%.
Many Districts reported problems finding teacher of math‟s and science subjects at
Lower Secondary and Secondary level in mountain Districts (as teacher licenses are
mandatory), hindering consistent teaching/learning in many schools.
teacher's guides and resource materials for all levels & subjects are not sufficiently
available in the marketplace, so teacher depend only on textbook centered teaching.
2.4.5.4 Constraints
It is difficult to change our teaching/learning paradigm significantly. The majority of
teacher and parents believe in schooling rather than educating - rote learning rather than
creativity, cheating in exams rather than originality, and achieving a Certificate
regardless of knowledge and skills.
The establishment of libraries in secondary schools does not necessarily create a
reading and research cultures within schools.
The budget release was delayed which significantly affected the effective
implementation of the programs.

Status Report -2015 Page 120
Salary PCF to schools, especially at secondary level, is too low to redress the gap in
fulfillment of teacher positions.
A research report conducted by DOE, Sanothimi Bhaktapur (2011) revealed that the role
of RP was not as effective as anticipated.
2.4.5.5 Addressing Constraints and Maximizing Achievements
Regular monitoring and follow up support to schools and teacher through RCs should be
strengthened.
The role and responsibility of RPs should be redefined.
To fill the gap in teacher conscription, especially in Lower Secondary and Secondary
levels, the present salary provision for the PCF should be increased.

Status Report -2015 Page 121
Chapter 5
Soft Skills and Community School Capacity Development Program (TEVT)
(A) Soft Skills
2.5.1 Introduction
The SSRP provides policy direction, for both general and vocational streams in Secondary
education, to expand opportunities for skills development across the country. The Technical
and Vocational Education and Training (TVET) component of SSRP aims to equip students
with employable skills to assist and accelerate their transition from school to work and help
them explore a variety of career opportunities both in Nepal and in the global market.
The Ministry of Education has set up a unit, supported by the TSSP system of the Finnish
Ministry of Foreign Affairs, which is currently piloting the integration of soft skills within the
Grade 9 and 10 curricula. CDC had already developed curricula and resources for Grades 6-
8, including a separate subject 'Occupation, Business and Technology'.
Based on the experience gained from piloting TVET, further expansion will be undertaken in
secondary schools, and expansion up to higher secondary level is being explored. Expansion
and consolidation of TVET programs will require significant resource mobilization for
technical capacity building, teacher preparation & management, and infrastructure
development in schools.
2.5.2 ASIP Priorities
The following priority refers to soft skills:
"The piloting of the soft skills content integrated textbooks in Grade 9, designed as per
the competency-based curriculum, will be carried out".
2.5.3 Achievement against Indicators
In the SSRP Extension Plan Chapter 5, no specific indicators are defined for soft skills.
However, the key objective is “Intensive piloting of soft skills enhancement of teaching 24
schools across 10 Districts” (p. 24).
Regarding the achievements of the TSSP against indicators, during FY2014, Grades 9 and 10
curricula for core subjects were revised. Also, by the end of the FY 2014/2015, the TSSP had
completed 80% of District level piloting and training activities for teachers in 10 Districts. During
the project teacher training, and the testing of teacher training & learning activities in soft skills
development in classrooms, was piloted in 80 schools in 10 Districts. The number of schools
was increased in September 2014. Of these schools 24 (the originally selected pilot schools)
are vocational and the remaining 56 schools provide general stream education. The piloting
reached approximately 800 teachers, 22 teacher trainers and 16,000 students.

Status Report -2015 Page 122
2.5.4 Achievement against Annual Targets
Table No. 63 Major programme activities, target and Budget allocation for the FY 2015/16 (TVET)
Activities Unit Allocated Budget
Target Unit Cost Budget
Develpoment of soft skills
teaching materials for 6 subjects
in Grade 9 & 10 (2 from each
subject)
Subject 1 5000
Revision of curriculum of TEVT
stream Times 2 1500
2.5.5 Analysis of Progress
While the 6 core subject curricula for Grades 9-10 were approved in the Summer 2014, the
challenge now is to mainstream the curricula across all of Nepal. This relates in particular to
translating soft skills learning into practice in classrooms and through teacher training.
2.5.5.1 Major Achievements
Competence-based soft skills‟ enhanced curricula developed for 6 core subjects in
Grades 9 and 10 (Nepali, English, Maths, Science, Social Studies and Health,
Population & Environment Studies).
Capacity of CDC staff developed regarding curriculum review of competence-based soft
skills.
Capacity of NCED staff in developing training at Central level enhanced.
Textbook writers trained in integrating competence based soft skills approach into Grade
9 textbooks
Textbooks for Grade 9 piloted in TSSP pilot schools
Modular teacher training programme and materials developed and implemented for
competence-based soft skills teaching and learning
Over 800 teachers trained in the competence based soft skills approach to teaching.
80 schools in 10 Districts have implemented the competence-based soft skills approach
in Grades 9 and 10.
Action Learning Groups for teacher support and professional development established in
schools in 10 Districts
22 Trainers from NCED including ETCs and LRCs trained in competence-based soft
skills approach to teaching
Textbooks for Grade 9 piloted in 22 schools in 11 Districts, of which 6 were in TSSP
piloting Districts.
2.5.5.1.1. Gap analysis between ASIP Priorities and Annual Targets
Status Report -2015 Page 123
TSSP and soft skills are currently not sufficiently aligned with or covered by ASIP priorities to be
able to make such an analysis.
2.5.5.2 Innovations and Case Studies
The TSSP project developed innovative teaching and learning methods in classrooms, as well
as new teacher training methods aimed at increasing the level of soft skills development in
Grades 9-10. The Action Learning Groups established provided a platform for sharing of new
and innovative approaches to teaching and learning.
2.5.5.3 Areas of Under -Performance
Teachers need support via teacher‟s guides and textbooks and other similar
materials on helping students learn soft skills to achieve the learning outcomes
stipulated in the revised curriculum.
2.5.5.4 Constraints - Lack of set indicators and lack of integration of TSSP in ASIP
Competence and skills development are fragmented and do not form a cohesive
whole. This is because there are different skills taxonomies and terms being used at
different levels and in different types of education. This creates challenges in
education and curriculum development from a holistic point of view.
Clustering TEVT and soft skills in the same chapter of the SSRP has caused
confusion. The Soft Skills content covers the general stream.
2.5.5.5 Addressing Constraints and Maximizing Achievements
Teachers and their trainers mention the underlying constraints during open
discussions in district workshops. Typical constraints encountered were large class
sizes inhibiting group work; lack of teaching materials and stationary in classrooms;
limit to the level of student involvement; and lack of locally developed teaching
materials making soft skills teaching difficult. The Central and District team of TSSP
has supported teachers for addressing these problems.
2.5.5.6 Lessons Learned
Closer adaptation of TSSP to ASIP will ensure a coordinated approach to implementing
the overall curriculum reform across all levels of general education
Mainstreaming of the soft skills approach to curriculum implementation requires
additional trained resources in all Districts.
2.5.5.7 Reflection Based on experience gained through implementation of project activities, there needs to be smooth coordination and cooperation between implementing agencies from Central to District levels. Best practice needs to be mainstreamed for sustainability.

Status Report -2015 Page 124
(B) Community School Capacity Development Program (Technical Education and
Vocational Training - TEVT)
3.2.1.1 Introduction
Technical Education and Vocational Training is one of the most important means of
addressing the aspirations of people and demands of time, which is also strongly
emphasized in the SSRP, and the Government is strongly committed to operate the
program. The Technical Education and Vocational Training (TVET) programme has been
operating in selected community schools in 70 Districts from academic year 2070 in new
modality.
Department of Education started the vocational education program in Grade 9 in FY 2012-13
(from academic year 2070), selecting 100 schools from 71 Districts (except Sarlani, Manang,
Dolpa and Mugu) to conduct the program. Among the 100 schools, one school is not in
operation. Two more community schools for the blind have received permission to conduct
TEVT program from academic year 2071 (the TEVT program has been conducted with the help
of PLAN Nepal). Altogether, this program has now been conducted at 101 schools of 70
Districts (except Sarlani, Manang, Dolpa, Mugu and Sankhuwasabha). In this academic year
2072, 83 schools have received approval to conduct 10 + 2 level in the TEVT stream from
HSEB and 7 schools have received affiliation to conduct 3 years Diploma program from CTEVT.
All these HSEB and CTEVT affiliated schools are from the 101 TEVT schools.
The list below, which is kept in index, shows the total number of Technical and Vocational
schools opened, total number of students enrolled in Grade 9 &10, school wise TSLC-2071
student pass number, and choice of subjects taught across the country.
Table No.64 students enrolled in Grade 9 &10 and school wise TSLC-2072
District
Serial # District name School Name
Total No of Students In 2072
Subject Area TSLC-2071
passed student
number
Class
10 Class 9
Boy Girl
01 Taplejung Bhanu Jana Higher
Secondary School 13 14 28 29 Civil Engineering
02 Panchthar Prithivi Uchcha Ma Vi 12 14 27 40 Plant Science
03 Ilam Amar Ma Vi 15 11 22 38 Computer
Engineering
04 Jhapa Himalaya Ma Vi 26 10 46 48 Computer
Engineering
04 Jhapa Saraswati Ma Vi 8 12 23 48 Computer
Engineering
04 Jhapa Dhulabari Ma Vi 16 12 32 43 Animal Science
05 Tehrathum Basanta U Ma Vi 17 16 19 28 Plant Science
06 Dhankuta Tribeni Ma Vi 9 6 28 47 Computer
Engineering
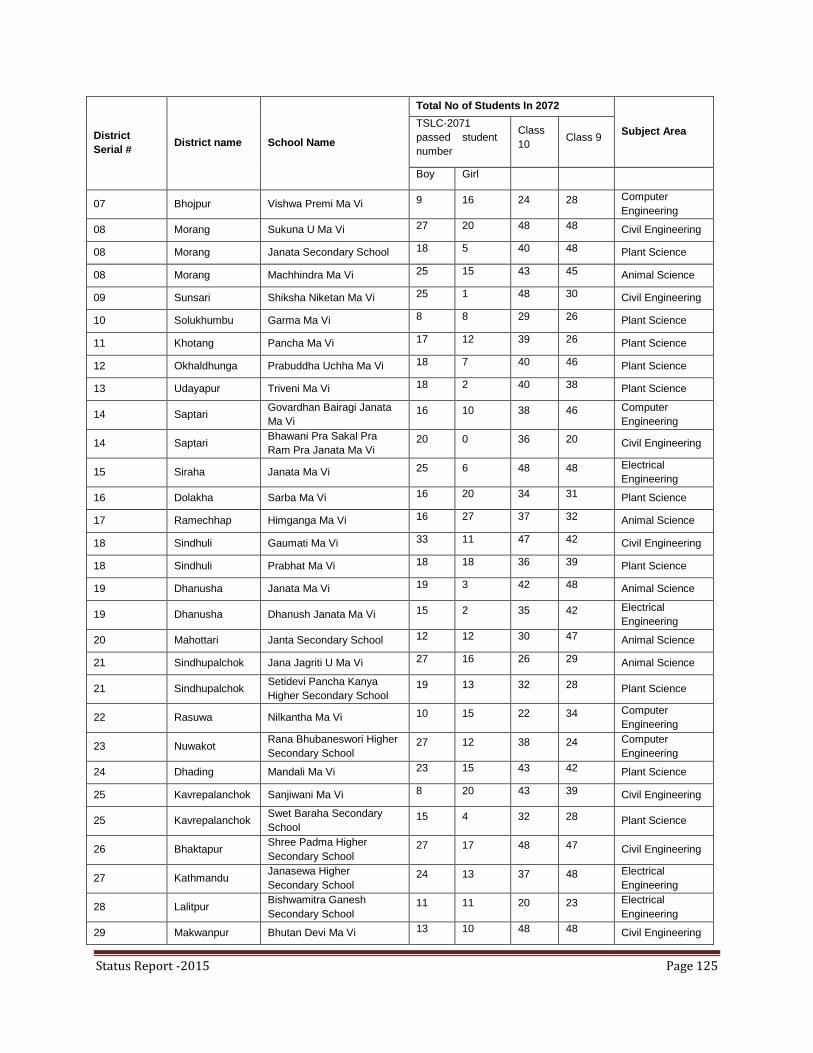
Status Report -2015 Page 125
District
Serial # District name School Name
Total No of Students In 2072
Subject Area TSLC-2071
passed student
number
Class
10 Class 9
Boy Girl
07 Bhojpur Vishwa Premi Ma Vi 9 16 24 28 Computer
Engineering
08 Morang Sukuna U Ma Vi 27 20 48 48 Civil Engineering
08 Morang Janata Secondary School 18 5 40 48 Plant Science
08 Morang Machhindra Ma Vi 25 15 43 45 Animal Science
09 Sunsari Shiksha Niketan Ma Vi 25 1 48 30 Civil Engineering
10 Solukhumbu Garma Ma Vi 8 8 29 26 Plant Science
11 Khotang Pancha Ma Vi 17 12 39 26 Plant Science
12 Okhaldhunga Prabuddha Uchha Ma Vi 18 7 40 46 Plant Science
13 Udayapur Triveni Ma Vi 18 2 40 38 Plant Science
14 Saptari Govardhan Bairagi Janata
Ma Vi 16 10 38 46 Computer
Engineering
14 Saptari Bhawani Pra Sakal Pra
Ram Pra Janata Ma Vi 20 0 36 20 Civil Engineering
15 Siraha Janata Ma Vi 25 6 48 48 Electrical
Engineering
16 Dolakha Sarba Ma Vi 16 20 34 31 Plant Science
17 Ramechhap Himganga Ma Vi 16 27 37 32 Animal Science
18 Sindhuli Gaumati Ma Vi 33 11 47 42 Civil Engineering
18 Sindhuli Prabhat Ma Vi 18 18 36 39 Plant Science
19 Dhanusha Janata Ma Vi 19 3 42 48 Animal Science
19 Dhanusha Dhanush Janata Ma Vi 15 2 35 42 Electrical
Engineering
20 Mahottari Janta Secondary School 12 12 30 47 Animal Science
21 Sindhupalchok Jana Jagriti U Ma Vi 27 16 26 29 Animal Science
21 Sindhupalchok Setidevi Pancha Kanya
Higher Secondary School 19 13 32 28 Plant Science
22 Rasuwa Nilkantha Ma Vi 10 15 22 34 Computer
Engineering
23 Nuwakot Rana Bhubaneswori Higher
Secondary School 27 12 38 24 Computer
Engineering
24 Dhading Mandali Ma Vi 23 15 43 42 Plant Science
25 Kavrepalanchok Sanjiwani Ma Vi 8 20 43 39 Civil Engineering
25 Kavrepalanchok Swet Baraha Secondary
School 15 4 32 28 Plant Science
26 Bhaktapur Shree Padma Higher
Secondary School 27 17 48 47 Civil Engineering
27 Kathmandu Janasewa Higher
Secondary School 24 13 37 48 Electrical
Engineering
28 Lalitpur Bishwamitra Ganesh
Secondary School 11 11 20 23 Electrical
Engineering
29 Makwanpur Bhutan Devi Ma Vi 13 10 48 48 Civil Engineering

Status Report -2015 Page 126
District
Serial # District name School Name
Total No of Students In 2072
Subject Area TSLC-2071
passed student
number
Class
10 Class 9
Boy Girl
30 Chitwan Nepal Ma Vi Ratna 13 14 28 35 Plant Science
31 Rautahat Nemdhari Basudev Ma Vi 39 5 41 48 Civil Engineering
32 Bara Nepal Rastriya Ma Vi 29 0 26 44 Electrical
Engineering
32 Bara Nepal Rastriya Ma Vi 16 11 44 48 Plant Science
33 Parsa Nrisingh Ma Vi Pipramath 32 13 48 48 Computer
Engineering
34 Gorkha Gyanmarga Ma Vi 18 14 32 34 Animal Science
35 Lamjung Sailaputri Ma Vi 20 6 24 20 Animal Science
36 Kaski Brahma Rupa Higher
Secondary School 18 20 32 45 Computer
Engineering
36 Kaski Shukra Raj Ma Vi 13 11 23 14 Animal Science
37 Tanahun Satyawati Ma Vi 31 12 45 48 Computer
Engineering
38 Syangja Purnamrit Bhawani Ma Vi 16 17 31 48 Plant Science
38 Syangja Tri-Shaheed Ma Vi 8 11 31 29 Computer
Engineering
39 Nawalparasi Prithvi Secondary School 19 16 21 23 Plant Science
39 Nawalparasi Dedhgaun Ma Vi 14 18 47 36 Plant Science
39 Nawalparasi Devchuli Ma Vi 32 11 26 31 Civil Engineering
40 Palpa Laxmi Ma Vi 18 17 28 35 Plant Science
40 Palpa Mohan Kanya Ma Vi 0 27 23 23 Computer
Engineering
41 Gulmi Uday Ma Vi 16 8 26 34 Plant Science
41 Gulmi Jana Jyoti Ma Vi Rimuwa 17 16 25 29 Civil Engineering
42 Arghakhanchi Harihar San Tatha
Sadharan Ma Vi 8 17 19 32 Plant Science
42 Arghakhanchi Saraswoti Ma Vi 17 14 23 31 Civil Engineering
43 Rupandehi Kalika Higher Secondary
School 28 17 47 48 Computer
Engineering
43 Rupandehi
Nabin Audhyogic Kadar
Bahadur Rita Secondary
School
16 14 36 46 Civil Engineering
43 Rupandehi Shree Nawaratna Higher
Secondary School 16 29 28 40 Plant Science
44 Kapilvastu Nepal Adarsha Ma Vi 19 11 40 40 Animal Science
45 Mustang Jana Adarsha Ma Vi 12 7 22 25 Plant Science
46 Myagdi Galeswar Higher Secondary
School 33 14 24 25 Civil Engineering
47 Baglung Galkot Ma Vi 15 15 26 24 Plant Science
47 Baglung Bhimsen Ma Vi 31 11 44 48 Civil Engineering

Status Report -2015 Page 127
District
Serial # District name School Name
Total No of Students In 2072
Subject Area TSLC-2071
passed student
number
Class
10 Class 9
Boy Girl
47 Baglung Shanti Ma Vi 9 13 17 29 Computer
Engineering
48 Parbat Mate Dewal Jana Sahayogi
Ma Vi 24 6 33 21 Plant Science
49 Rukum Shital Ma Vi 32 14 29 36 Civil Engineering
50 Rolpa Nepal Rastriya Secondary
School 6 11 18 33 Plant Science
51 Salyan Janakalyan Ma Vi 17 22 39 45 Plant Science
52 Pyuthan Bhanu Bhakta Uchha Ma Vi 24 16 41 48 Plant Science
53 Dang Saraswati Ma Vi 31 15 29 48 Plant Science
54 Humla Mansarobar Ma Vi 30 16 41 48 Plant Science
55 Kalikot Panchdewal Ma Vi 27 5 41 48 Computer
Engineering
56 Jumla Janata Ma Vi 24 24 30 40 Civil Engineering
57 Jajarkot Narayani Ma Vi 16 11 43 42 Plant Science
58 Dailekh Tribhuvan Ma Vi 23 16 48 46 Computer
Engineering
58 Dailekh Vijaya Ma Vi 33 15 48 48 Plant Science
59 Surkhet Nepal Rastriya Ma Vi 28 20 48 48 Plant Science
59 Surkhet Shiva Ma Vi 12 5 29 48 Plant Science
60 Banke Dhumbojhi Ma Vi 17 12 45 48 Computer
Engineering
61 Bardia Dhruba Ma Vi 22 12 30 46 Animal Science
61 Bardia Tribhuvan Ma Vi 24 21 48 42 Animal Science
62 Bajura Bhanodaya Ma Vi 30 17 43 48 Animal Science
63 Bajhang SatyaBadi Ma Vi 26 21 48 48 Plant Science
64 Achham Mangala Nepal Rastriya Ma
Vi 26 4 35 40 Civil Engineering
65 Doti Ghanteshwar Ma Vi 31 10 37 0 Plant Science
66 Kailali Raghunath Adarsha Ma Vi 22 21 48 46 Plant Science
66 Kailali Durga Laxmi Ma Vi 13 8 36 48 Computer
Engineering
67 Darchula Malikarjun Ma Vi 26 17 36 48 Civil Engineering
67 Darchula Jan Bikash Ma Vi 14 11 36 48 Plant Science
68 Baitadi Manilek Uchha Ma Vi 41 5 43 48 Civil Engineering
68 Baitadi Shree Krishna Uchha Ma Vi 27 10 48 48 Computer
Engineering
69 Dandeldhura Mahendra Ma Vi 39 7 48 48 Civil Engineering
69 Dandeldhura Balkalyan Ma Vi 23 10 39 46 Plant Science
70 Kanchanpur Baijanath Ma Vi 20 11 28 44 Plant Science

Status Report -2015 Page 128
District
Serial # District name School Name
Total No of Students In 2072
Subject Area TSLC-2071
passed student
number
Class
10 Class 9
Boy Girl
70 Kanchanpur Bhanu Ma Vi 32 14 31 47 Computer
Engineering
70 Districts Total 2008 1242 3471 3843 Total 5 Subjects
GRAND TOTAL 3250
3.2.1.2. Concise information about students, instructors and lab assistants
The total enrollment of students in Technical and Vocational schools (except Grade 11) is 7,389
in 2015-2016. Of the total enrollment, 3,878 students are in Grade 9 and 3,511 students Grade
10. In academic year 2071, 3,250 students passed TSLC from 99 TEVT schools.
One hundred and ninety eight (198) instructors and 198 assistant instructors have been
appointed across 99 schools at Grades 9 and 10 for teaching the major Vocational and
Technical subjects and other compulsory subjects are taught by Secondary level teachers in the
general stream.
One instructor and one teacher grant is provided for Grade 11 for teaching the major Technical
and Vocational subjects and pure science subjects respectively, and two instructors are in the
first year Diploma program for teaching the major Technical and Vocational subjects.
Lab. assistant salary grants for one assistant each is provided to all 99 schools.
3.2.1.2. Strategies Priorities
The Ministry of Education formulated and implemented the major goals and initiatives taken with
the TEVT program. Strategies are overall directions designed to achieve the objectives of TEVT
and allocate resources to implement the TEVT plans and activities and budget. The School
Sector Reform Plan (2009-2015) has determined the following strategies to achieve the goals
and objectives of TEVT.
1. Testing/ piloting will be carried out between 2009 and 2012, prior to the start of the full
integration of the Secondary education programme.
2. Introduction of TVET in Secondary schools, including soft skills, on a pilot basis
with subsequent integration into school education.
3. At Secondary & Higher Secondary level, Certificates will be issued as follows: a)
Secondary Level Certificate (SLC) or Technical Secondary Level Certificate (TSLC), and
b) Higher Secondary Level Certificate (HSLC) or Technical Higher Secondary Level
Certificate (THSLC).
4. Under the national examination framework, provided by the National Examination
Board, the Council for Technical Education and Vocational Training (CTEVT) will

Status Report -2015 Page 129
conduct certification examinations (including skills testing) for students in the short-term
vocational, technical and traditional skills schemes.
5. Constitution of a National Examination Board as a coordinating apex body,
responsible for regulating and carrying out all public examinations, certification and
accreditation functions for Grades 8, 10 and 12, including TVET certification.
3.2.1.3. Achievements
1. Technical and Vocational Education in Schools operating guideline -2069 has been
approved by the Government of Nepal, Ministry of Education.
2. Notice of application issued to those schools interested in moving to the Technical and
Vocational Education model.
3. The District Working Committee recommended school names to the Regional
Coordination Committee, based on schools geographical, social and economic situation.
4. The Regional Coordination Committee recommended schools to the Central Director
Committee based on criteria prepared by Central Director Committee.
5. The Central Director Committee selected schools based on District-wise demand and
recommendation of the Regional Coordination Committee in 2069/12/20.
6. TEVT is not conducted in Mugu, Dolpa, Manang, Sarlahi and Sankhuwasava District yet
now.
7. Selected schools educate on different disciplines and subjects, as follows
Engineering (Civil) - 22 schools
Computer- 22 schools
Electrical - 5 schools
Agriculture (Animal husbandry) - 13 schools
Plant Science - 39 schools
8. One-day orientation programs were conducted for selected school principals and school
management committee members in their respective regions. They were instructed on
the importance of the program and their responsibilities towards its success. Permission
for operation was then given to selected schools by the Department of Education. Prior to
this, an agreement occurred between DOE and schools.
9. TEVT schools incur lab and equipment management costs. The total of grants in two
fiscal years 2069/070 and 2070/071 to respective disciplines for materials management
are given as follows:
Table No.65 TEVT schools incur lab and equipment management costs
SN Five Subject Area Amount NPR
1 Civil engineering 50,00,000
2 Computer engineering 31,00,000

Status Report -2015 Page 130
3 Electronic engineering 20,00,000
4 Plant science 26,00,000
5 Animal husbandry 26,00,000
10. The National Center for Educational Development (NCED) conducted “Instructional
Skill 1 Training” through TITI for 200 people (instructor and sub-instructor) in fiscal
year 2069/070 and 2070/2071.
11. The Department of Education launched a one-day “Learning Centered Orientation
Program” in 48 technical stream schools in FY 2070/071.
12. The Government of Nepal Budget for fiscal year 2071/2072, in its policy statement
under Education, declared:
“One technical school will be established in every electoral constituency".
13. During academic year 2070, one/one Instructor and Sub-Instructor‟s salaries were
provided and in academic year 2071 an extra one/one instructor and sub-instructor
salary was given to selected schools as a grant. The selected schools, which teach
Classes 9 and 10, now have two instructors and two sub-instructors salaries.
Instructor and Sub-Instructor salaries are equal to third class Secondary teachers
and third class Lower Secondary teachers respectively. Instructors and Sub-
Instructors also receive an additional Rs.3000/- as a technical allowance.
14. For this academic year 2072, one instructor and one teacher grant is provided for
Grade 11 for teaching major Technical and Vocational subjects and pure science
subjects respectively. Two Instructors are for the Diploma program for teaching the
major Technical and Vocational subjects. Instructors salary is equal to that of a
second class Secondary teachers and they receive an additional Rs.3000/- as
technical allowance.
15. Lab assistant salary grant for one assistant each is provided to all 99 schools. Their
salary is equal to that of a third class Primary teachers'. So all 99 TEVT schools
have at least one lab assistant.
16. For the first time in the history of Nepal, SLC results were published using the letter
grading system in 2071 (for the TEVT stream only). TVET stream students have
taken the TSLC exam from academic year 2071. Exam results are shown in the
following table:
Table No. 66 Exam results of TSLC 2071
Grade Number of Students
A+ 215
A 779
B 2131
C 124
D 1

Status Report -2015 Page 131
3.2.1.4. Lessons Learned and Best Practice.
Skills are a global currency. Technical and Vocational Education provides relevant knowledge,
skills and competencies. At least one school in every electoral constituency should be
established as having a Vocational and Technical stream within the general stream of
education, so that the demand for science and Vocational and Technical Education will be
addressed in accordance with the needs of the country. Adept TEVT schools are better
prepared to address the needs of the people, changing the approach of over-expansion of
Secondary education toward the conversion of Secondary schools to parallel streams of general
SLC and TSLC. This has satisfied both the demand and choice of parents and students to
select one option from Grade 9.
These schools have attracted talented students from other schools within their Districts. Initially
the purpose was to give opportunities to those students who were likely fail within the general
education system, instead pursuing the Vocational and Technical stream to learn life skills to
survive. But with choice parents and students are aware of the need for Vocational and
Technical Education and have decided to take part in Vocational and Technical Education from
the early stages of Secondary education. They have high expectations of the Vocational and
Technical stream in the future; as a result there is strong competition among talented students
for admission. They hope to complete their Higher Secondary education Grades 11-12 from the
Vocational and Technical stream. Most of the institutions offering Vocational and Technical
Education at Higher Secondary level is conducted by the private sector. It is expensive and
difficult to make accessible to rural settlements and poor people after passing the SLC
examination in Nepal. The Government of Nepal introduced the best practice policy of imparting
the Vocational and Technical Education stream from Grades 9-12 within traditional schools'
general stream. These schools are popular among poor people across the entire country,
facilitating their right to easy access, low cost Vocational and Technical Education in their own
Districts.
Schools have established laboratory rooms for practical classes, and have equipped the labs
with the purchase of tools and materials. They have established computer laboratories for
teaching TEVT subjects. Some schools have used ICT within the Vocational and Technical
stream. They have taken great initiative and contributed to rapid change within the three year
period, improving the quality of Vocational and Technical Education.
General subjects (Nepali, English, Mathematics, and Science) have been taught by Secondary
level subject teacher and Vocational and Technical subjects have been taught by the 4
instructors in each school. There is no need for separate administration and management of the
TEVT program. There is no need for separate schools with large investments in infrastructure,
tools and equipment to start the program. Traditional schools of the general stream can be
modified to provide diversified, multi-dimensional and multidisciplinary education with the
maximum use of recent resources in the country.

Status Report -2015 Page 132
The testing/piloting experiences of and success stories from Vocational and Technical
Education in 5 pilot Districts transpired between 2009 and 2012, prior to the start of the full
integration of the Secondary education program. These experiences were shared and
implemented among 99 schools after 2013 and 2014, covering the whole country at once.
Introduction of TVET, including soft skills, occurred on a pilot basis at Lower Secondary level
Grades 6-8 and Secondary level Grades 9-10, with subsequent integration into the new reform
agenda of the SSRP structure for school education.
At the Secondary level Grades 9-10, two Certificates have been awarded since 2071: the
Secondary Level Certificate (SLC) and the short term Technical Secondary Level Certificate
(TSLC). The Ministry of Education and Curriculum Development Center decided upon a letter
grading system for the final TSLC exam in 2071, after which the Government will decide the
next phase for implementation of the long term policy related to the Higher Secondary Level
Certificate (HSLC) and Technical Higher Secondary Level Certificate (THSLC).
The Ministry of Education has already submitted a bill to amend the Education Act going
forward, addressing the SSRP's reform agenda regarding the composition and formulation of
the National Examination Board and the Council for Technical Education and Vocational
Training (CTEVT). The bill also proposes legalizing the structure of education and conducting
certification examinations (including skills testing) for students in the short-term vocational,
technical and traditional skills schemes. The Technical and Vocational Education in Schools
Operating Guideline 2069 was approved by the Government of Nepal, Ministry of Education.
The CTEVT developed the Secondary Level Curriculum (Technical Stream) 2013 for six
subjects. The course structure for five subject‟s curriculum for Grade 9 & 10 is as follows:
Table No. 67 Course Structure (Animal Science)
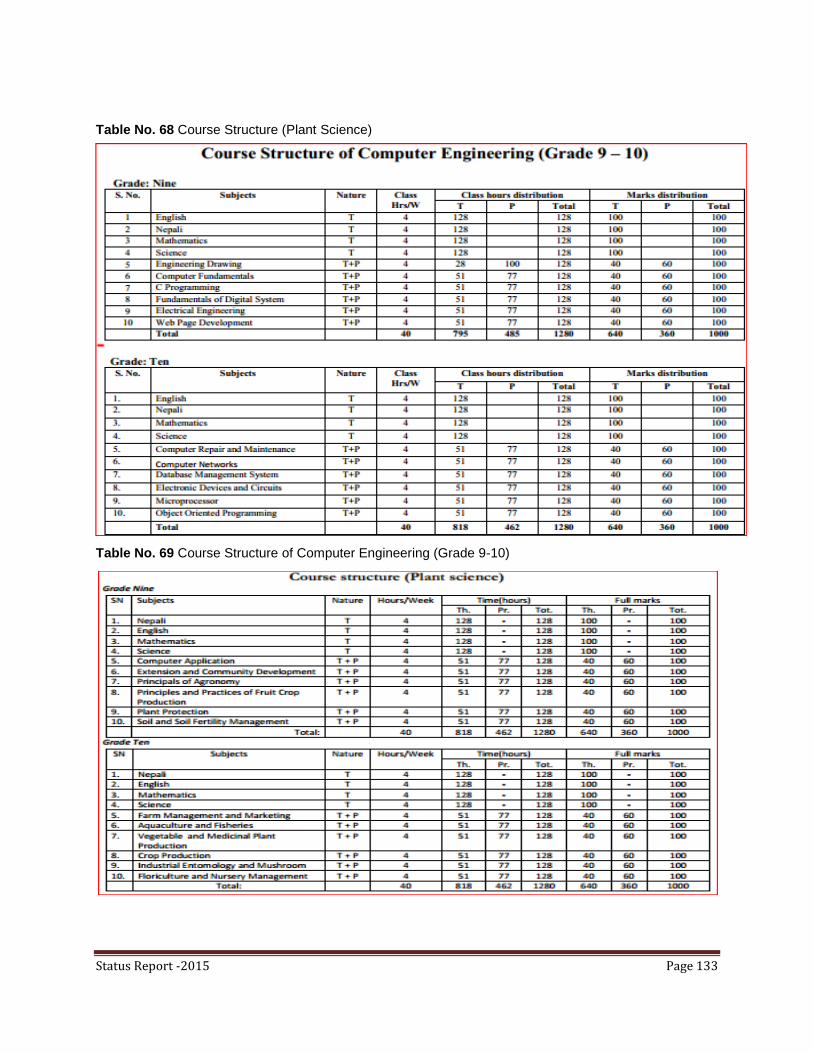
Status Report -2015 Page 133
Table No. 68 Course Structure (Plant Science)
Table No. 69 Course Structure of Computer Engineering (Grade 9-10)

Status Report -2015 Page 134
Table No. 70 Course Structure of Civil Engineering (Grade 9-10)
Table No. 71 Course Structure of Electrical Engineering (Grade 9-10)

Status Report -2015 Page 135
3.2.1.5. Constraints
We can categorize the major challenges/constraints as follows:
Equity and Participation: The TEVT program faces numerous equity & participation problems,
among which geography, language, economics, technology, teaching & learning moDalities,
physical and gender issues, culture, and delivery moDalities are the major hindrances.
Quality and Learning Environment: Quality and learning environment related problems are
also very clear in this program, among which curriculum and subject streams, learning materials
for teachers and students, teacher management, school permission, assessment systems,
materials, equipment and labs, on-the-job training, unification, joint supervision, and teaching
moDalities are the highlighted problems in establishing quality and a better learning
environment in the TEVT program.
3.2.1.6 Addressing Constraints and Maximizing Achievements
The following chart shows the major constraints and suggested ways for betterment.
Constraint/problem area Suggested ways for betterment
1 Curriculum and subject
stream
Technical and Vocational subject stream and curriculum has to
develop and improve on the basis of student‟s age, interests & level,
and local and national resources and needs.
2 Learning materials for
teachers and students
Text books, reference materials, TGs etc should be managed
3 Teacher management
The Government should make a clear policy statement in the
Education Act addressing the needs and requirements of Instructors
and teachers, with specified job descriptions, academic qualifications,
minimum salary, allowances and other fringe benefits, tenure
(permanent) status of teachers, approved teacher posts and tenure for
the Vocational and Technical stream.
4 School Permission
Consideration should be given to the resources of the state and local
governance, local needs, equal distribution of state benefits, efficiency
and commitment of the community and schools etc., when giving
permission to conduct the TEVT program.
5 Student Assessment
We have to utilize a different moDality of assessment.
We need to be serious in addressing the gap between theoretical and
practical achievements, and cleary stipulate teacher responsibility for
the theoretical and practical achievements of students.
6 Material, Equipment, Lab We must be serious about the timely delivery of physical management
(materials and lab management, text books etc.).
7 On-the-job Training On-the-job training is greatly needed after TSLC and THSLC, and
needs to be managed by the government.

Status Report -2015 Page 136
8 Geographical‟ Hostel facility holder schools are needed to address the inequitable
participation in different geographical regions.
9 Language
The English language is seen as a barrier for students, and the
teaching and learning environment needs to be managed properly to
reduce the negative effects of any language.
10 Economic The Government needs to provide hostels, learning material & other
facilities to students from poorer financial backgrounds.
11 Technology The most essential technological hardware and instruction should be
provided to both teachers and students.
12 Teaching Learning
MoDality
Student centers with a modern, pedagogical based approach to
planned teaching are needed.
13 Physical and Gender
Government should manage & deliver the TEVT program, with
suitable facilities, to physically handicapped students.
There is a need to establish female-friendly physical environments,
scholarship programs and job opportunity policies.
14 Cultural Establishment of a culture of respect for work, people's labor, and the
sharing of knowledge and skills.
15 Delivery Modality Public-private partnerships need to ensue in this field.

Status Report -2015 Page 137
Chapter 6
Teacher Education and Development
Introduction
The professional development of teachers is one of the key factors in improving their
opportunities and has a significant positive effect on students‟ achievement and learning. Thus,
the SSRP aims to increase students‟ learning and improve their performance by developing the
professional capacity of teachers.
Quality education primarily depends upon a teacher‟s performance in the classroom. The level
of professional development among teachers correlates directly to students' performance and
learning. The SSRP aims to improve students‟ learning and classroom performance through the
professional development of teachers and therefore takes an integrated approach to teachers‟
professional development and student learning. The table below shows the total number of
teachers working in teacher posts at community schools in Nepal that have been approved by
the DOE.
Teacher information at Primary, Lower Secondary and Basic levels
This section presents information on teachers at Primary, Lower Secondary and Basic levels by
school type, level, sex and other specific indicators.
Table No. 72 Total number of teachers in all types of community schools by levels (based on approved
positions)
Level Female1 Male Total
Primary (1-5) 39,461 62,489 101,950
Lower Secondary (6-8) 5,374 20,398 25,772
Basic(1-8) 44,835 82,887 127,722
Secondary (9-10) 2,859 1,6725 19,584
Higher Secondary (11-12) 3,869
Total number of teachers in all types of community schools (based on approved positions) 151,175
Source : Flash I - 2014/015

Status Report -2015 Page 138
TPD design summary
1. Part-1: Training cum workshop
(5 Day Face-to-face event to be conducted at the training hub (RCs for Basic level and ETCs/LRCs for
secondary leve))
2. Part-2: Self-study exercise
(School-based event upon completion of part-1of the course- runs for 30 days engaging participants
independently in a structured set of assignments and counts towards credits to the equivalient of 3
days)
3. Part-3: Instructional Counseling
(School-based event upon completion of part-2 of the course- runs for 2 days under close guidance
from the same set of trainers mobilized to check and collect assignments and provide on-site
professional support)
{Whole module combines input/training event (part-1) followed by application and constructive learning
(part-2) and on-site follow up support (part-3)}
Figure No. 49 Total number of teachers in all types of community schools by levels (based on approved
positions)
Source: Flash Report 2072
6.1 The Teacher Professional Development (TPD) course was designed & is being
implemented by the NCED, based on guidelines approved by the Ministry of Education
in January 2011. The TPD initiative constitutes a 30-day certified training course,
comprised of three independent 10 days modules. The TPD course aims primarily at
addressing the immediate pedagogical needs of teachers and at providing them with
continuous learning opportunities. According to the policy, every working teacher
irrespective of his or her 24/11/2015 terms of tenure will have an opportunity to
participate in all three TPD modules within a five year period from 2009/2010 to
2013/2014. The TPD design summary is presented in the table below.
Table No. 73 TPD design
0
20,000
40,000
60,000
80,000
100,000
120,000
140,000
Primary (1-5)
Lower Secondary
(6-8)
Basic(1-8) Secondary (9-10)
Higher Secondary
(11-12)
Female
Male
Total

Status Report -2015 Page 139
6.2 Every training module is designed on the basis of individual teachers' needs (self-
reported), organizational (school) needs; and system (national
priorities/policies/plans/curriculum.) needs. Certification in each module culminates in the
TPD Certificate. With regard to implementation, Resource Centers (RCs) have been
authorized and empowered to conduct TPD modules for Basic level teachers and Lead
Resource Centers/Educational Training Centers have been authorized and empowered
to conduct the course for Secondary school teachers. In terms of where the training
takes place, the TPD programme is theoretically characterized as a "field-based" teacher
training model, which is based on the combined approach of the two popular models of
school-based and cluster-based training.
The following strategic priorities were set for FY 2014/2015 Teacher Professional Development
1. Field-based TPD modules will be strengthened by creating continuous learning
opportunities to address the immediate pedagogical problems teachers' experience.
SSs, RPs and roster trainers will be jointly mobilized for close monitoring and on-site
support of teachers.
2. The targets for teacher training will be increased for FY 2014/2015 as much as possible
to provide training for remaining teachers.
3. ETCs and LRCs will be mobilized to provide subject-based training for Grades 6-8 and
Grades 9-10 teachers. RCs will be responsible for Basic level Grades 1-5 teachers.
4. Piloting of training modules on the CAS, curriculum, ECED training, and training for
Grades 11-12 teachers will be conducted.
5. The Child Friendly Schools (CFS) training module will be developed to be integrated into
the regular National Center for Educational Development (NCED) teacher training
framework.
6. The ongoing collaboration programme between NCED/FOE will continue to upgrade the
qualification of teachers in collaboration with universities. Implementation of the Teacher
Preparation Course (TPC) will be expanded in collaboration with Tribhuvan
University/Faculty of Education.
7. The physical setting and training environment of ETCs/LRCs/RCs will be strengthened
by taking into consideration the minimum prerequisites of training institutes.
8. Institutional coordination and linkages among RCs, LRCs, ETCs, and DEOs, and
channel support systems will be established for effective implementation of the TPD
programmes.
9. The ongoing programme relating to capacity development trainings and institutional
performance management systems, with improved design for distance/open learning
programmes for managers, shall be continued.

Status Report -2015 Page 140
10. Findings of the teacher development study will be utilized for the betterment of teacher
management. Based on the findings of the study a system will be developed for teacher
selection and career development.
Teacher Management
1. Outstanding achievers will be motivated to join the teaching profession. In collaboration
with the TSC, the MoE will make provision by revisiting the existing recruitment criteria.
2. A mapping exercise will be conducted to determine current teacher vacancies and
redistribution of teacher posts. The District Education Committee (DEC) will conduct
teacher transfer/re-deployment based on STR and school mapping. Teachers will be
transferred from surplus Districts to other Districts where teacher shortages exist using
the concept of a national pool. The MoE will make provision to convert one level
teacher position to another level within the District.
3. The TSC will revise teacher licensing, the curriculum, and examination grids, requiring
candidates to achieve a minimum 50% mark in the examination.
4. In collaboration with the TSC, the DoE will make provision for competitive recruitment of
temporary/contract canditates for vacant positions in Science, Mathematics, English and
Vocational/Technical subjects such as Accountancy, Computer Science and Agriculture
where teaching license-holding candidates are not available. Newly recruited teachers
appointed through this provision should be able to receive a permanent teaching license
within three years of their appointment.
5. Adequate distribution of teachers to achieve and maintain envisioned teacher student
ratios.
6. The Teacher Service Commission (TSC) will conduct a competitive examination, publish
the list of successful candidates for permanent teacher positions and publish the
additional teachers list as a roster for temporary school appointments. The list will be
published on a subject basis for Lower Secondary and Secondary levels.
7. SMCs will identify candidates for teacher selection only from the pool approved by the
TSC. Where candidates with required qualifications are not available within the pool (in
subjects such as Science, Accounting, Mathematics and English), SMCs will request the
DEO that the TSC initiate a District-wide search for appropriate candidates. In doing so
strict adherence to the merit list will be ensured.
8. Teacher unions/professional organizations will be involved in more professional activities
and will be invited to serve on the teacher licensing body (Teachers Council) as
proposed.
9. A separate management position for Head Teachers will be created at Basic and
Secondary levels and the promotion mechanism for Head Teachers and development of
professional career paths will be explored.

Status Report -2015 Page 141
10. Generally, all transfers will be done under a schedule, either at the start or end of school
year or during the vacation period, to minimize the burden on the system and mitigate
any academic loss for children.
11. Teachers working in out-of-subject assignments (for example a history teacher teaching
mathematics) will be given first consideration for subject vacancies as they occur.
12. A school-based pedagogical support system will be developed with appointment of a
lead school within the VDC. The leader school will be the highest level school.
13. Necessary preparation will be carried out to link the four categories of teacher envisaged
in the SSRP for the purpose of career development and promotion.
14. Considering the decrease in student numbers especially in remote areas, a single
teacher school concept will be piloted. The Multi Grade Multi Level (MGML) concept
could be a good alternative in such situation as well as an initiative for enhancing the
quality teaching/learnig.
15. Each District will develop teacher profiles to include all administrative and academic
information, such as qualifications, training, existing professional needs, appointments,
postings, transfers, performance appraisal results, and promotions.
16. Necessary preparation will be made for all permanent teachers to successfully complete
the courses and programmes for promotion at each level. They must achieve at least
50% score for Beginner level, 60% for Experienced Level, 75% for Master Level and
80% for Expert Level.
17. Teacher performance appraisals, course completion, qualifications and years of
experience will be taken into consideration for promotion.
18. Clear job descriptions and responsibilities in line with the existing teachers' professional
code will be provided for all teachers (permanent and temporary) to create a more
accountable system and form the basis of the appraisal and monitoring of teacher
performance.
19. Highly qualified, trained and competent teachers/facilitators will be recruited for Primary
and pre-Primary level.
20. Teachers will be sufficiently prepared, having been provided opportunities for training
and qualification upgrading. Additionally, the existing curriculum content and formulation
of license examinations pass marks and the validity period of teacher licenses will be
reviewed.
21. All temporary teacher recruitment to approved positions will be guided by a Central
policy stipulating the minimum salary scale and leave benefits as for permanent
teachers.
22. The teaching licensing provision will be waived for the recruitment of vocational and soft
technical skills teachers and science, mathematics, computer science and traditional
school teachers where there is no provision in the teacher education programme.
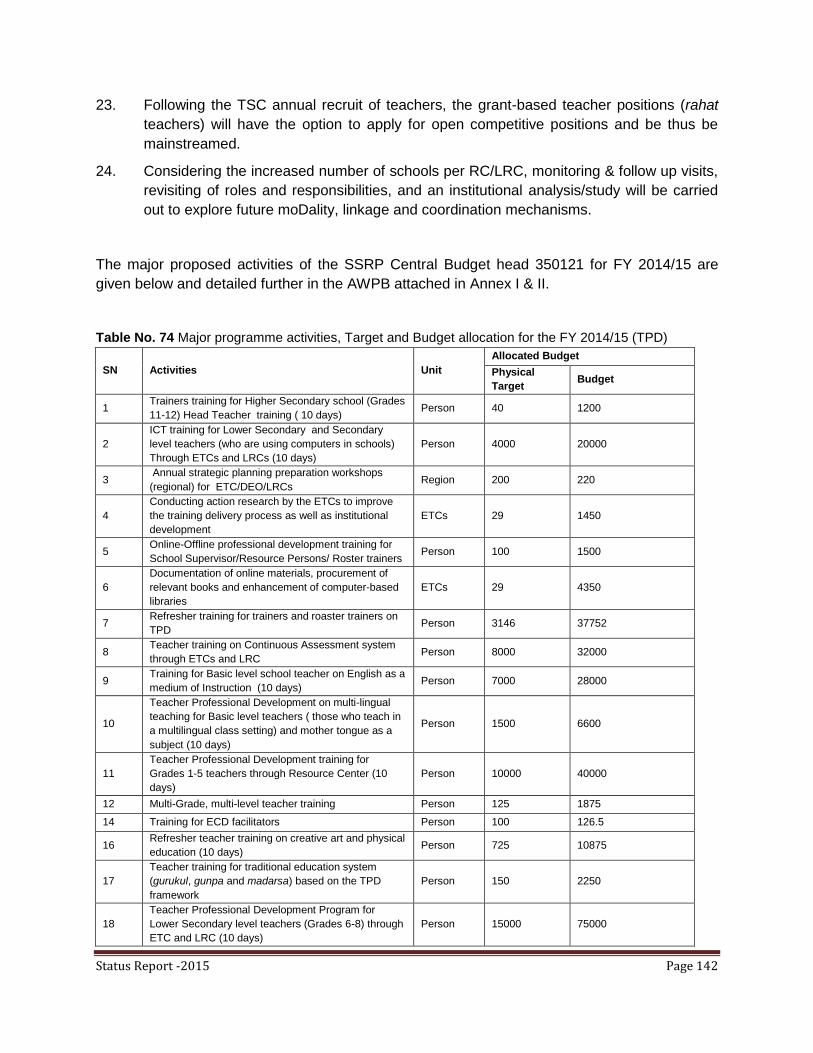
Status Report -2015 Page 142
23. Following the TSC annual recruit of teachers, the grant-based teacher positions (rahat
teachers) will have the option to apply for open competitive positions and be thus be
mainstreamed.
24. Considering the increased number of schools per RC/LRC, monitoring & follow up visits,
revisiting of roles and responsibilities, and an institutional analysis/study will be carried
out to explore future moDality, linkage and coordination mechanisms.
The major proposed activities of the SSRP Central Budget head 350121 for FY 2014/15 are
given below and detailed further in the AWPB attached in Annex I & II.
Table No. 74 Major programme activities, Target and Budget allocation for the FY 2014/15 (TPD)
SN Activities Unit
Allocated Budget
Physical
Target Budget
1 Trainers training for Higher Secondary school (Grades
11-12) Head Teacher training ( 10 days) Person 40 1200
2
ICT training for Lower Secondary and Secondary
level teachers (who are using computers in schools)
Through ETCs and LRCs (10 days)
Person 4000 20000
3 Annual strategic planning preparation workshops
(regional) for ETC/DEO/LRCs Region 200 220
4
Conducting action research by the ETCs to improve
the training delivery process as well as institutional
development
ETCs 29 1450
5 Online-Offline professional development training for
School Supervisor/Resource Persons/ Roster trainers Person 100 1500
6
Documentation of online materials, procurement of
relevant books and enhancement of computer-based
libraries
ETCs 29 4350
7 Refresher training for trainers and roaster trainers on
TPD Person 3146 37752
8 Teacher training on Continuous Assessment system
through ETCs and LRC Person 8000 32000
9 Training for Basic level school teacher on English as a
medium of Instruction (10 days) Person 7000 28000
10
Teacher Professional Development on multi-lingual
teaching for Basic level teachers ( those who teach in
a multilingual class setting) and mother tongue as a
subject (10 days)
Person 1500 6600
11
Teacher Professional Development training for
Grades 1-5 teachers through Resource Center (10
days)
Person 10000 40000
12 Multi-Grade, multi-level teacher training Person 125 1875
14 Training for ECD facilitators Person 100 126.5
16 Refresher teacher training on creative art and physical
education (10 days) Person 725 10875
17
Teacher training for traditional education system
(gurukul, gunpa and madarsa) based on the TPD
framework
Person 150 2250
18
Teacher Professional Development Program for
Lower Secondary level teachers (Grades 6-8) through
ETC and LRC (10 days)
Person 15000 75000
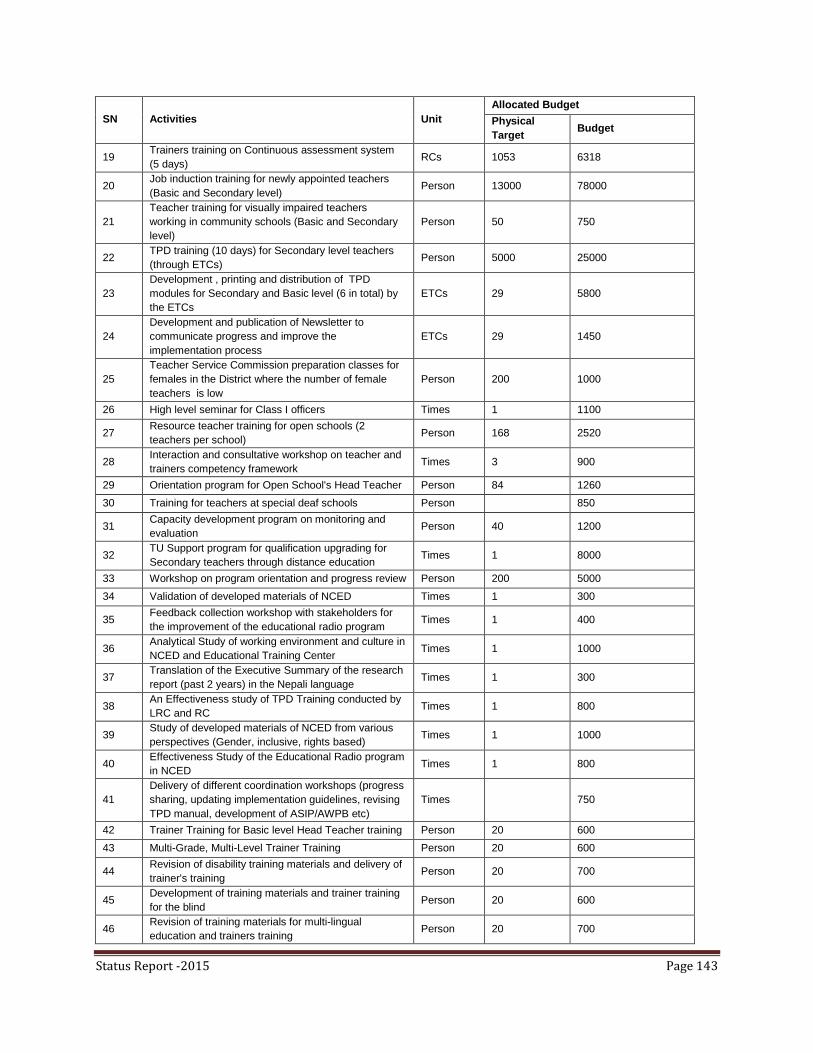
Status Report -2015 Page 143
SN Activities Unit
Allocated Budget
Physical
Target Budget
19 Trainers training on Continuous assessment system
(5 days) RCs 1053 6318
20 Job induction training for newly appointed teachers
(Basic and Secondary level) Person 13000 78000
21
Teacher training for visually impaired teachers
working in community schools (Basic and Secondary
level)
Person 50 750
22 TPD training (10 days) for Secondary level teachers
(through ETCs) Person 5000 25000
23
Development , printing and distribution of TPD
modules for Secondary and Basic level (6 in total) by
the ETCs
ETCs 29 5800
24
Development and publication of Newsletter to
communicate progress and improve the
implementation process
ETCs 29 1450
25
Teacher Service Commission preparation classes for
females in the District where the number of female
teachers is low
Person 200 1000
26 High level seminar for Class I officers Times 1 1100
27 Resource teacher training for open schools (2
teachers per school) Person 168 2520
28 Interaction and consultative workshop on teacher and
trainers competency framework Times 3 900
29 Orientation program for Open School's Head Teacher Person 84 1260
30 Training for teachers at special deaf schools Person
850
31 Capacity development program on monitoring and
evaluation Person 40 1200
32 TU Support program for qualification upgrading for
Secondary teachers through distance education Times 1 8000
33 Workshop on program orientation and progress review Person 200 5000
34 Validation of developed materials of NCED Times 1 300
35 Feedback collection workshop with stakeholders for
the improvement of the educational radio program Times 1 400
36 Analytical Study of working environment and culture in
NCED and Educational Training Center Times 1 1000
37 Translation of the Executive Summary of the research
report (past 2 years) in the Nepali language Times 1 300
38 An Effectiveness study of TPD Training conducted by
LRC and RC Times 1 800
39 Study of developed materials of NCED from various
perspectives (Gender, inclusive, rights based) Times 1 1000
40 Effectiveness Study of the Educational Radio program
in NCED Times 1 800
41
Delivery of different coordination workshops (progress
sharing, updating implementation guidelines, revising
TPD manual, development of ASIP/AWPB etc)
Times
750
42 Trainer Training for Basic level Head Teacher training Person 20 600
43 Multi-Grade, Multi-Level Trainer Training Person 20 600
44 Revision of disability training materials and delivery of
trainer's training Person 20 700
45 Development of training materials and trainer training
for the blind Person 20 600
46 Revision of training materials for multi-lingual
education and trainers training Person 20 700
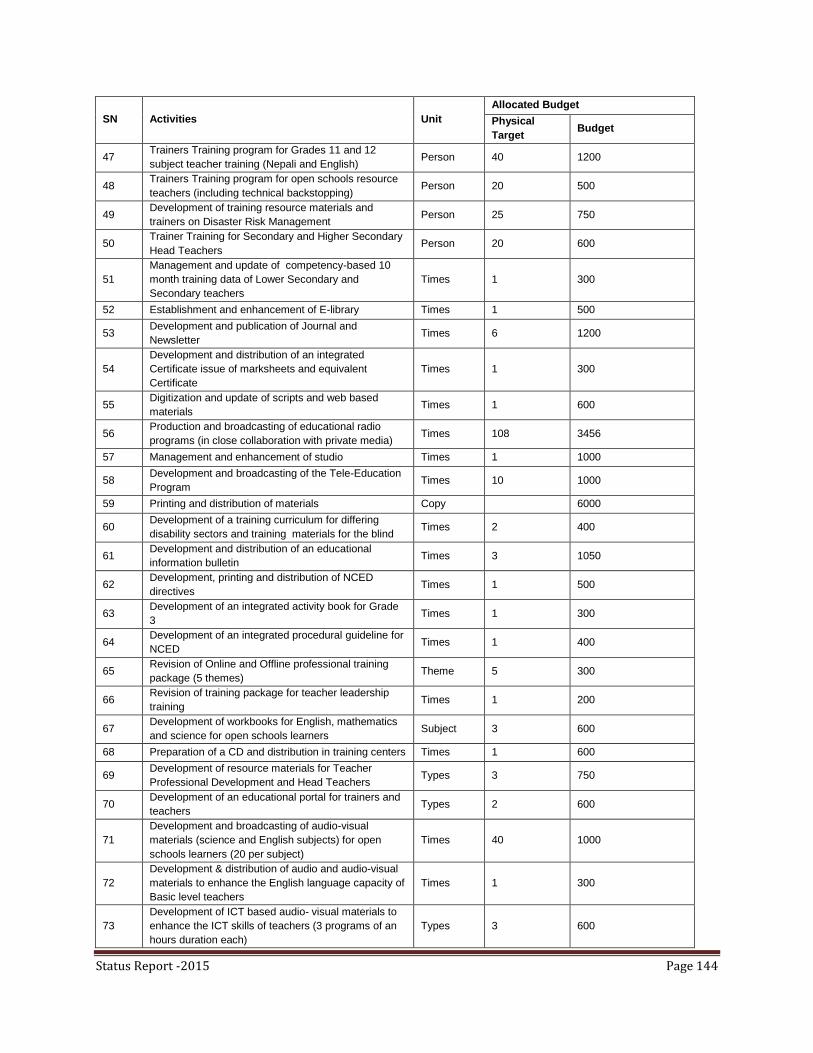
Status Report -2015 Page 144
SN Activities Unit
Allocated Budget
Physical
Target Budget
47 Trainers Training program for Grades 11 and 12
subject teacher training (Nepali and English) Person 40 1200
48 Trainers Training program for open schools resource
teachers (including technical backstopping) Person 20 500
49 Development of training resource materials and
trainers on Disaster Risk Management Person 25 750
50 Trainer Training for Secondary and Higher Secondary
Head Teachers Person 20 600
51
Management and update of competency-based 10
month training data of Lower Secondary and
Secondary teachers
Times 1 300
52 Establishment and enhancement of E-library Times 1 500
53 Development and publication of Journal and
Newsletter Times 6 1200
54
Development and distribution of an integrated
Certificate issue of marksheets and equivalent
Certificate
Times 1 300
55 Digitization and update of scripts and web based
materials Times 1 600
56 Production and broadcasting of educational radio
programs (in close collaboration with private media) Times 108 3456
57 Management and enhancement of studio Times 1 1000
58 Development and broadcasting of the Tele-Education
Program Times 10 1000
59 Printing and distribution of materials Copy
6000
60 Development of a training curriculum for differing
disability sectors and training materials for the blind Times 2 400
61 Development and distribution of an educational
information bulletin Times 3 1050
62 Development, printing and distribution of NCED
directives Times 1 500
63 Development of an integrated activity book for Grade
3 Times 1 300
64 Development of an integrated procedural guideline for
NCED Times 1 400
65 Revision of Online and Offline professional training
package (5 themes) Theme 5 300
66 Revision of training package for teacher leadership
training Times 1 200
67 Development of workbooks for English, mathematics
and science for open schools learners Subject 3 600
68 Preparation of a CD and distribution in training centers Times 1 600
69 Development of resource materials for Teacher
Professional Development and Head Teachers Types 3 750
70 Development of an educational portal for trainers and
teachers Types 2 600
71
Development and broadcasting of audio-visual
materials (science and English subjects) for open
schools learners (20 per subject)
Times 40 1000
72
Development & distribution of audio and audio-visual
materials to enhance the English language capacity of
Basic level teachers
Times 1 300
73
Development of ICT based audio- visual materials to
enhance the ICT skills of teachers (3 programs of an
hours duration each)
Types 3 600
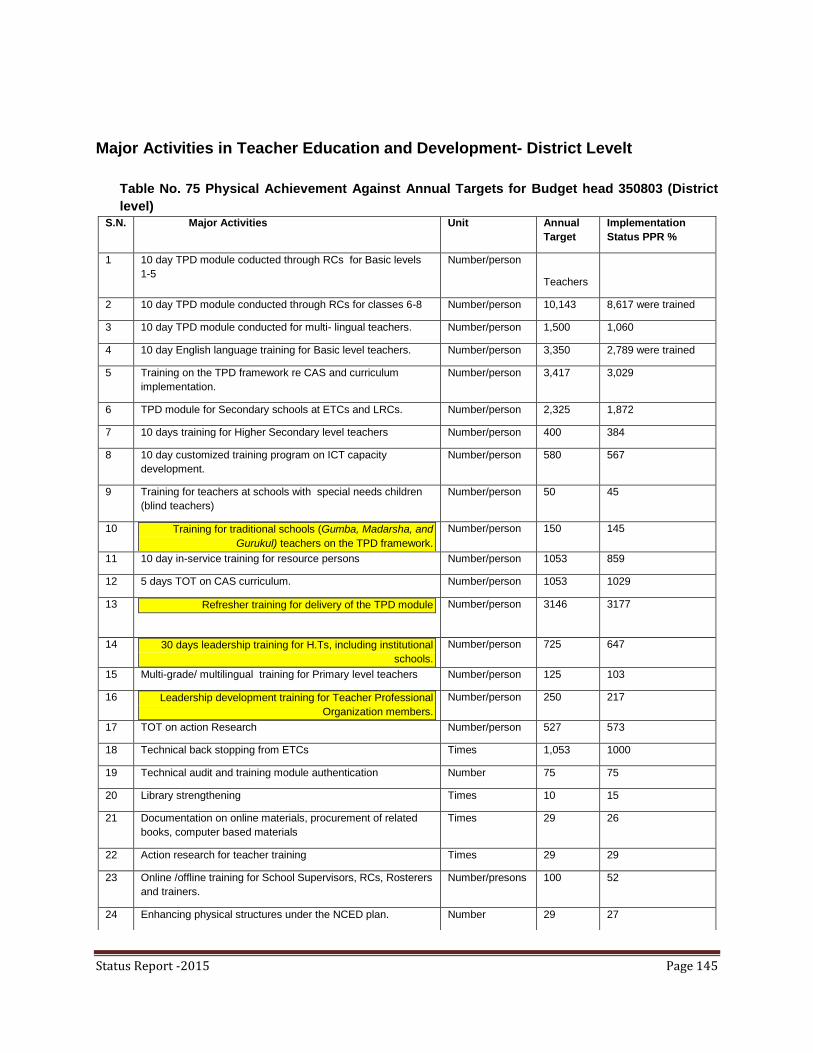
Status Report -2015 Page 145
Major Activities in Teacher Education and Development- District Levelt
Table No. 75 Physical Achievement Against Annual Targets for Budget head 350803 (District
level)
S.N. Major Activities Unit Annual
Target
Implementation
Status PPR %
1 10 day TPD module coducted through RCs for Basic levels
1-5
Number/person
Teachers
2 10 day TPD module conducted through RCs for classes 6-8 Number/person 10,143 8,617 were trained
3 10 day TPD module conducted for multi- lingual teachers. Number/person 1,500 1,060
4 10 day English language training for Basic level teachers. Number/person 3,350 2,789 were trained
5 Training on the TPD framework re CAS and curriculum
implementation.
Number/person 3,417 3,029
6 TPD module for Secondary schools at ETCs and LRCs. Number/person 2,325 1,872
7 10 days training for Higher Secondary level teachers Number/person 400 384
8 10 day customized training program on ICT capacity
development.
Number/person 580 567
9 Training for teachers at schools with special needs children
(blind teachers)
Number/person 50 45
10 Training for traditional schools (Gumba, Madarsha, and
Gurukul) teachers on the TPD framework.
Number/person 150 145
11 10 day in-service training for resource persons Number/person 1053 859
12 5 days TOT on CAS curriculum. Number/person 1053 1029
13 Refresher training for delivery of the TPD module Number/person 3146 3177
14 30 days leadership training for H.Ts, including institutional
schools.
Number/person 725 647
15 Multi-grade/ multilingual training for Primary level teachers Number/person 125 103
16 Leadership development training for Teacher Professional
Organization members.
Number/person 250 217
17 TOT on action Research Number/person 527 573
18 Technical back stopping from ETCs Times 1,053 1000
19 Technical audit and training module authentication Number 75 75
20 Library strengthening Times 10 15
21 Documentation on online materials, procurement of related
books, computer based materials
Times 29 26
22 Action research for teacher training Times 29 29
23 Online /offline training for School Supervisors, RCs, Rosterers
and trainers.
Number/presons 100 52
24 Enhancing physical structures under the NCED plan. Number 29 27
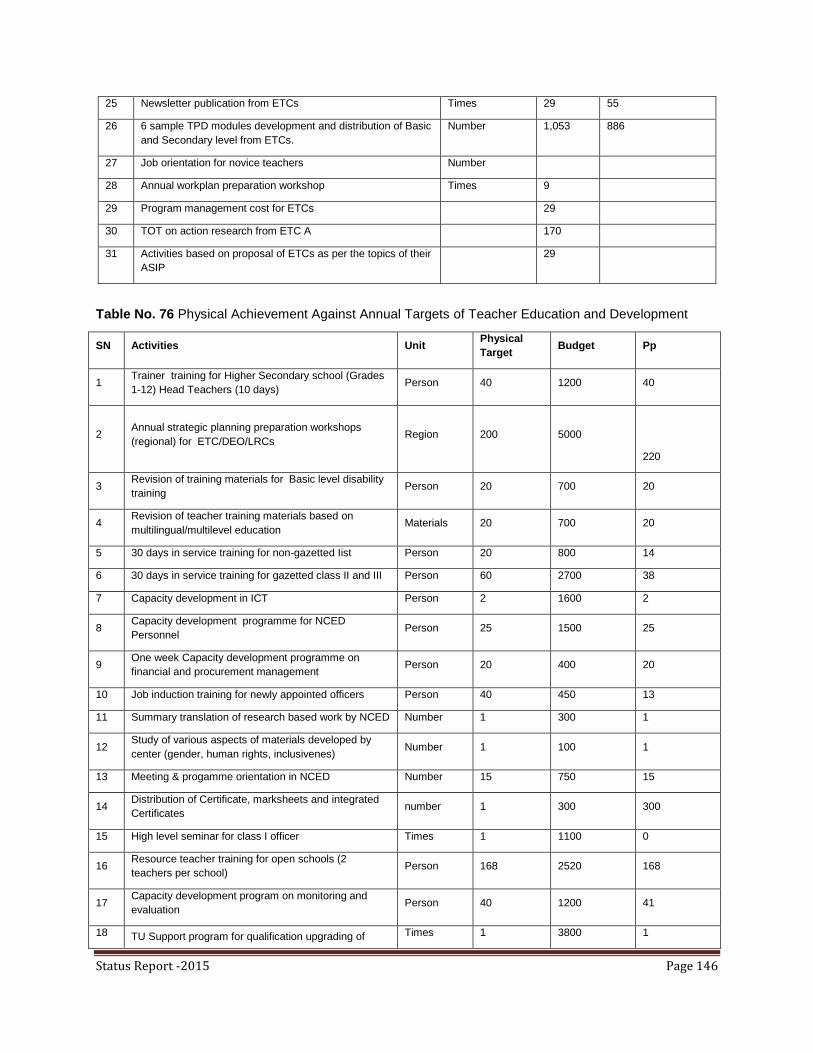
Status Report -2015 Page 146
Table No. 76 Physical Achievement Against Annual Targets of Teacher Education and Development
SN Activities Unit Physical
Target Budget Pp
1 Trainer training for Higher Secondary school (Grades
1-12) Head Teachers (10 days) Person 40 1200 40
2 Annual strategic planning preparation workshops
(regional) for ETC/DEO/LRCs Region 200 5000
220
3 Revision of training materials for Basic level disability
training Person 20 700 20
4 Revision of teacher training materials based on
multilingual/multilevel education Materials 20 700 20
5 30 days in service training for non-gazetted Iist Person 20 800 14
6 30 days in service training for gazetted class II and III Person 60 2700 38
7 Capacity development in ICT Person 2 1600 2
8 Capacity development programme for NCED
Personnel Person 25 1500 25
9 One week Capacity development programme on
financial and procurement management Person 20 400 20
10 Job induction training for newly appointed officers Person 40 450 13
11 Summary translation of research based work by NCED Number 1 300 1
12 Study of various aspects of materials developed by
center (gender, human rights, inclusivenes) Number 1 100 1
13 Meeting & progamme orientation in NCED Number 15 750 15
14 Distribution of Certificate, marksheets and integrated
Certificates number 1 300 300
15 High level seminar for class I officer Times 1 1100 0
16 Resource teacher training for open schools (2
teachers per school) Person 168 2520 168
17 Capacity development program on monitoring and
evaluation Person 40 1200 41
18 TU Support program for qualification upgrading of Times 1 3800 1
25 Newsletter publication from ETCs Times 29 55
26 6 sample TPD modules development and distribution of Basic
and Secondary level from ETCs.
Number 1,053 886
27 Job orientation for novice teachers Number
28 Annual workplan preparation workshop Times 9
29 Program management cost for ETCs 29
30 TOT on action research from ETC A 170
31 Activities based on proposal of ETCs as per the topics of their
ASIP
29

Status Report -2015 Page 147
SN Activities Unit Physical
Target Budget Pp
Secondary teachers through distance mode
19 Workshop on program orientation and progress review Person 200 5000 220
20 Validation of developed materials by NCED Times 1 300 1
21 Training for employees under MOE Times 1 400 1
22 Capacity development of employees working on the
educational Radio Programme Times 1 150 1
23 Gender audit training Times 1 800 0.03
24 Multi-Grade Multi-Level Trainer Training Person 20 600 20
25 Delivery of TSC preparation classes for women Number/
times 1 1000 0
26 Programme monitoring Person 1 1600 1
27
Management and update of training data for
competency-based 10 month training of Lower
Secondary and Secondary teachers
Times 1 300 1
28 Establishment and enhancement of E-library Times 1 500 1
29
Development and distribution of an integrated
Certificate issue of mark sheet, and equivalent
Certificate (needs re-wording/clarifcation)
Times 1 300 1
30 Digitization and update of scripts and web based
materials Times 1 600 0
31 Production and broadcasting of educational radio
programs (close collaboration with private media) Times 108 3456 108
32 Management and enhancement of studio Times 1 1000 1
33 Development and broadcasting of Tele-Education
Programs Times 10 1000 10
34 Printing and distribution of different materials Copy 1 6000 1
35 Development of a training curriculum for different
disability sectors and training materials for the blind Times 2 400 2
36 Development and distribution of an educational
information bulletin Times 3 1050 3
37 Development, printing and distribution of NCED
Directives Times 1 500 1
38 Development of an integrated procedural guideline for
NCED Times 1 400 1
39 Revision of online and offline professional training
package (5 theme) Theme 5 300 5
40 Revision of training package for Teacher Leaders
Training Times 1 200 1
41 Development English, mathematics, and science
workbooks for open schools learners Subject 3 600 3
42 Preparation of CD and distribution to training centers Times 1 600 2
43 Development of resource materials for Teacher Types 3 750 2

Status Report -2015 Page 148
SN Activities Unit Physical
Target Budget Pp
Professional Development and Head Teachers
44 Development of an education portal for trainers and
teachers Types 2 600 2
45
Development and broadcasting of audio-visual
materials (for science and English subjects) foir open
schools learners (20 per subject)
Times 20 1000 20
46
Development & distribution of audio and audio-visual
materials to enhance the English language capacity of
Basic level teachers
Times 1 300 1
47
Development of ICT based Audio-visual materials to
enhance the ICT skills of teachers (an hour duration's
3 program)
Types 3 600 3
Achievement against SSRP Indicators
The main role and responsibility of teachers is to engage in professional activities of classroom
instruction or teaching-learning. Teachers convey knowledge, skills and attitudes to students as
per the approved curriculum and textbooks in schools.
According to Flash Report 2071, the percentage of fully-trained teachers in all community
schools is 96.4 % at Primary level, 83.8% at Lower Secondary level and 93.0% at Secondary
level. The student-teacher ratio (based on approved teacher positions) in community schools is
36:1 at Primary level, 60:1 at Lower Secondary level and 30:1at Secondary level.
Table No. 77 Summary of the Current Status in Key Performance Indicators (TPD) in 2014/2015
Indicators Base
Years Status
20
08
/09
20
09
/01
0
20
10
/01
1
20
11
/01
2
20
12
/01
3
20
13
/14
20
14
/15
20
15
/16
Teachers with required
qualifications and training in Basic
education
66 75 79 91.1 91.9 91.4 92.0
Teachers with the required
qualifications and training in
Secondary Education
79 85 88 90.1 82 90.4 95.5
Pupil/teacher ratio (based on
teacher position in community
schools) in Primary level
education
43 44 46 44 44 37.1 36.1 35
Pupil/teacher ratio (based on
teacher position in community
schools) in Basic level education
43 44 46 44 42 41 41 40

Status Report -2015 Page 149
Indicators Base
Years Status
20
08
/09
20
09
/01
0
20
10
/01
1
20
11
/01
2
20
12
/01
3
20
13
/14
20
14
/15
20
15
/16
Pupil/teacher ratio (based on
teacher position in community
schools) in Secondary Education
(Grades 9-10 only: based on
teacher position in community
schools)
39 34 35 36 31 37 39
Source: Flash I 2015-16
According to Flash Report 2072, at Primary level 97.3% teachers are fully trained, 1.9%
teachers are partially trained and 0.8% are untrained. At Lower Secondary level 88.6% of
teachers are trained, 4.1% are partially trained and 7.3% are untrained. Similarly, at Basic level,
95.5% (93.7% in the last school year) are trained, 2.4% are partially trained and 2.2% teachers
are untrained. The numbers of trained teachers are increasing each year and Figure 50 below
presents the percentage of teachers trained in community schools by level.
Figure No. 50 Teachers trained in community schools
According to Flash Report 2072, of the teachers trained in Secondary level community schools
(9-10), 95.5% are fully trained, 3.4% are partically trained, and 1.3% are untrained. At Higher
Secondary level 84.5% of teachers are trained, 5.1% are partially trained and 10.4% are
untrained. Similarly, at Secondary level (9-12) of the total number of teachers 91.2% are trained,

Status Report -2015 Page 150
4.1% are partially trained and 4.8% are untrained. Achievement against the national target has
been attained. There is a lack of math, science, computer, vocational and English teaching in
schools; due to the lack of job permanency, more experienced teachers, those with teaching
licenses, are leaving the job. As a result; the number of qualified and trained teachers is
decreasing each year, although some novice teachers were appointed in approved posts in
2015-2016. The percentages of trained teachers in community schools at Secondary level are
shown in Figure 51 below.
Figure No. 51 Trained teachers in community schools at Secondary level
According to Flash Report 2072, the Student/Teacher Ratios (STRs) at Primary, Lower
Secondary and Basic levels of all community schools are 35:1, 60:1 and 40:1 (compared to
36:1, 60:1 and 41:1 in the previous school year) respectively. The Terai belt shows the highest
STR 53:1; 82:1; and 58:1 at Primary, Lower Secondary and Basic levels for 2072. In
subsequent years achievement has fallen short of the national target for STR in Basic education
for all community schools. The STR for Lower Secondary level is too high compared to Primary
and Basic levels. The enrollment of students in Lower Secondary and Basic level is increasing
but the number of approved teachers' posts is the same as in previous years. So, the STR is not
decreasing. Figure 52 below shows the STR for all types of community schools based on
approved teacher positions by level in school year 2072.

Status Report -2015 Page 151
Figure No. 52 STR of community schools Basic Education
According to Flash I, 2015-016, on average, the STR of all community schools of Secondary
level is 39:1, Higher Secondary level 54:1 and the Secondary (Grades 9-12) level 42:1
respectively. Achievement against the national target for STR for each year was not met except
in FY 2009/010. The number of new schools and enrollment of students in Secondary level is
increasing but the number of approved teacher posts is the same as in previous years.
Figure No. 53 STR of community schools Secondary Education
Teacher Training Status
The overall training status of teachers based on the TPD model is given below in Table 78

Status Report -2015 Page 152
Table No. 78 Teacher Training Status in 2015-2016
Training
status
Primary Lower Secondary Secondary Higher Secondary
Female Male Total Femal
e Male Total
Femal
e Male Total
Femal
e Male Total
Trained 97.6 97.0 97.3 88.5 88.7 88.6 94.2 95.9 95.3 78.5 85.7 84.5
Partially
trained 1.6 2.1 1.9 3.7 4.2 4.1 4.5 3.2 3.4 6.1 4.9 5.1
Untrained 0.8 0.9 0.8 7.8 7.1 7.3 1.3 1.2 1.3 15.4 9.4 10.4
Source: Flash I, 2015-16
Greater numbers of Primary level teachers are trained than other level teachers; 84.5% of
Higher Secondary level teachers are trained, representing the lowest number of trained
teachers in schools; 95.5% of Secondary level teachers are trained. More training is needed for
Lower Secondary (88.6%) and Higher Secondary level than other levels in 2015-2016.
Figure No. 54 Teacher Training Status in 2015-2016
2.6.4 Achievement against Annual Targets
Major teacher education activities and development at center level
There were six components under this area at center level. Details of the program are stated
below.
Materials development and training for trainers
i. Conducted progress review meeting for Senior instructor, instructor, section officer,
ADO, working in ETCs and DEOs (220 persons)
ii. Conducted a TOT program on ECD class management for 40 ECD trainers.

Status Report -2015 Page 153
iii. Conducted a TOT program for Grade 11 and 12 Nepali and English. Altogether 40
teachers received TOT in the program.
iv. Conducted a TOT program on disabilities for 20 resource trainers.
v. Developed training materials for a mother tongue/multilanguage training manual.
vi. Developed resource materials for Lower Secondary and Secondary level compulsory
subjects for TPD training.
vii. Revision and orientation of competency framework for teachers
viii. Training for trainers on MGML (for 20 trainers).
ix. Development of a set of training materials for the disabled (sectorwise curriculum)
x. Publication of information for NCED bulletin (3 times)
xi. Development and printing of NCEDs management guidelines
xii. Development of integrated procedural guideline of NCED
xiii. Development of resource materials for TPD and Head Teacher training
xiv. Revision of professional development of online & off line programme.
Management trainings
i. Conducted in-service 30 working day training for 38 gazetted 2nd and 3rd class officers
of MOE.
ii. Provided job induction training for 13 novice gazetted 3rd class officers of MOE.
iii. One month's inservice training for 20 technical assistants
iv. Ten days capacity development training on ICT
v. One week capacity development training for ETCs personnel (procurement and financial
management training for 20 personnel)
Teacher professional development and training facilitation
i. Capacity development program on monitoring & evaluation for 41 personnel.
ii. Collaboration between TU and NCED for qualification upgrade programme for
Secondary level teachers
iii. Printing and supply of different training manuals, planning and research.
Certification of training
i. Certificate integration of TPD and equivalence certification.
ii. Documentation and update of teacher records received from TPD hubs.

Status Report -2015 Page 154
Distance and Open learning
i. Development of NCED portal for trainers and teachers.
ii. Development and production of audio-visual materials and DVD for open school
students
iii. Developed and distribution of audio-visual materials of Basic level for English medium
community schools
iv. Self-study revision materials for six compulsory subjects.
v. Production and broadcast of educational programs coordinating with media.
vi. One weeks training for resource teachers of open schools.
vii. Study and guideline development to conduct distance and open learning for Grades 11
and 12.
viii. Educational programs developed and broadcast weekly through television.
ix. Published educational bulletin 3 times a year, as well as teacher's education and
distance education journal yearly.
x. Establishment of e-library
xi. 108 educational radio programmes produced and broadcast.
Research on Teacher Training and Development
Conducted the following research
i. Certification of materials developed by NCED.
ii. Translation of materials in Nepali developed by NCED over the last two years
iii. Study of materials develop by NCED from various perspectives (gender lens, human
rights, inclusiveness etc.)
2.6.5 Analysis of Progress 2.6.5.1 Major Achievements
At Central level, the program consisted of 49 activities under six major components during the
fiscal year 2071/72 (2014/15). These activities were accomplished with 85% physical and 75%
Financial Progress rates overall.
TOT on training materials development, establishment of e-libraries, novice officer's orientation
training, monitoring and evaluation training, 30 working days in service training for gazetted
officers, TOT programme, and other programmes were accomplished. The overall
accomplishment rate shows satisfactory progress under this component. Some activities were
not completed due to earthquake impediments.

Status Report -2015 Page 155
At District level, 28 activities were planned under this component. They were designed for
ETCs, DEOs, RCs, and LRCs level. The overall PPR and FPRs of this component were 89%
and 86% respectively. Most of the activities were successfully implemented with higher PPRs.
Progress at District level has been satisfactory.
In conclusion, the following points were the major achievements under this component as per
ETCS' and DEO' reporting:
i. Teacher capacity developed in the reading culture of teachers to some extent.
ii. Relations between teachers, students, education leaders and stakeholders developed
through trained teachers.
iii. Teachers are becoming researchers, creators, motivators, counselors and dynamic
education leaders.
2.6.5.1.1 Gap analysis between annual achievement and ASIP priorities
Efforts must be made to increase the number of participants in the 10day training program to
meet required targets.
Although the 10 day TPD modules conducted through RCs at all levels have been successful in
achieving over 89% PPR, only 86% of the annual target of 6,061 were trained in Basic level
English and about 36% of the target was achieved for CAS and curriculum development
frameworks. The data also indicated that:
i. About half of the target was met on the 10 day customized training program on ICT
capacity development.
ii. Capacity development training for Higher Secondary level Head Teachers was not well
attended. Less than 30% attended.
iii. There is an urgent requirement for Secondary school teachers to attend the prescribed
courses for their own development and schools are to be encouraged to release
teachers for the duration of such short-term courses.
iv. It is encouraging that the number of teachers with the required training qualifications in
Basic and Secondary education has steadily increased over the years and the student-
teacher ratio has declined.
It is, however, acknowledged that some schools have taken a number of initiatives in
teacher development. For example in order to identify teaching gaps teachers are
required to keep a daily diary for self-evaluation to see where improvements to their
teaching practices can be made; in other schools teachers are required to prepare a
compulsory Teaching Improvement Plan. Unfortunately only a small number of schools
have taken these initiatives on board. Therefore there is a requirement that additional
schools are encouraged to undertake initiatives such as self-evaluation of teaching
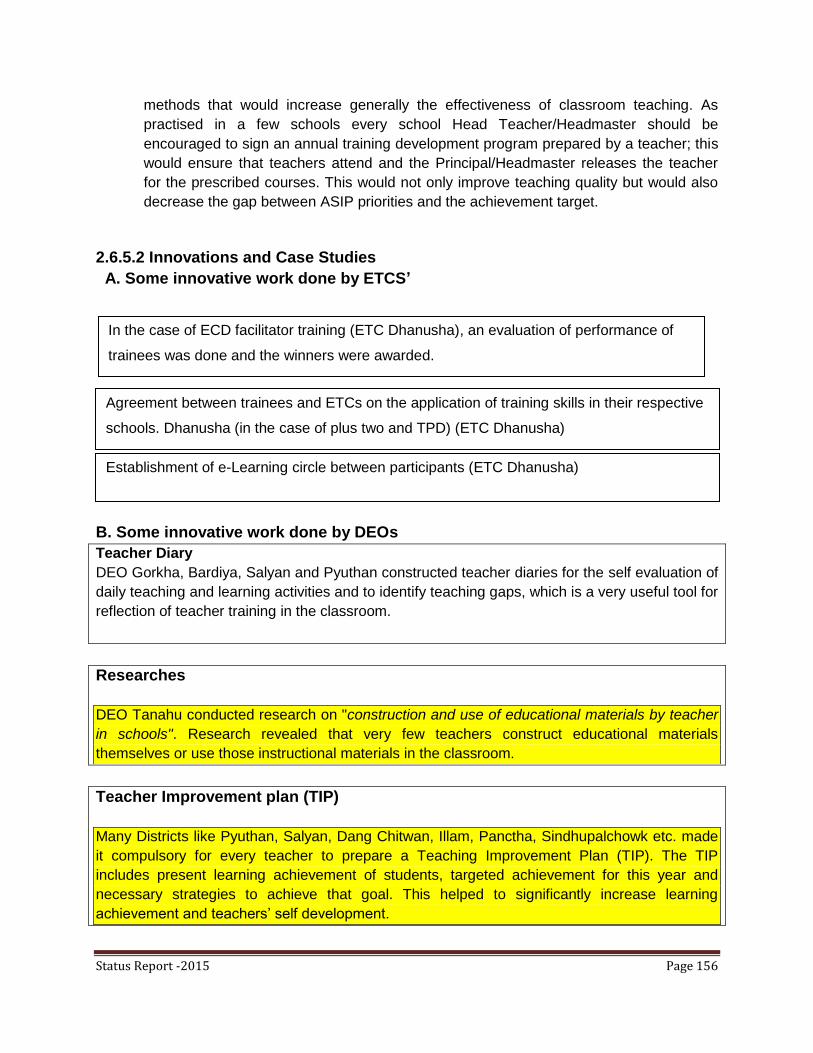
Status Report -2015 Page 156
methods that would increase generally the effectiveness of classroom teaching. As
practised in a few schools every school Head Teacher/Headmaster should be
encouraged to sign an annual training development program prepared by a teacher; this
would ensure that teachers attend and the Principal/Headmaster releases the teacher
for the prescribed courses. This would not only improve teaching quality but would also
decrease the gap between ASIP priorities and the achievement target.
2.6.5.2 Innovations and Case Studies
A. Some innovative work done by ETCS’
B. Some innovative work done by DEOs
Teacher Diary
DEO Gorkha, Bardiya, Salyan and Pyuthan constructed teacher diaries for the self evaluation of
daily teaching and learning activities and to identify teaching gaps, which is a very useful tool for
reflection of teacher training in the classroom.
Researches
DEO Tanahu conducted research on "construction and use of educational materials by teacher
in schools". Research revealed that very few teachers construct educational materials
themselves or use those instructional materials in the classroom.
Teacher Improvement plan (TIP)
Many Districts like Pyuthan, Salyan, Dang Chitwan, Illam, Panctha, Sindhupalchowk etc. made
it compulsory for every teacher to prepare a Teaching Improvement Plan (TIP). The TIP
includes present learning achievement of students, targeted achievement for this year and
necessary strategies to achieve that goal. This helped to significantly increase learning
achievement and teachers‟ self development.
Agreement between trainees and ETCs on the application of training skills in their respective
schools. Dhanusha (in the case of plus two and TPD) (ETC Dhanusha)
In the case of ECD facilitator training (ETC Dhanusha), an evaluation of performance of
trainees was done and the winners were awarded.
Establishment of e-Learning circle between participants (ETC Dhanusha)

Status Report -2015 Page 157
Digital teaching and learning materials preparation
The NCED has prepared digital teaching and learning materials and online
resource materials for Secondary level and uploaded them on the website, which
proved to be very helpful for teachers wishing to apply training skills in the
classroom.
DEO Sindhupalchowk added an extra topic "multiple intelligence" in teacher's professional
development training and similarly included "critical thinking" in Lower Secondary and
Secondary level. The topic has increased the performance of teachers in the classroom.
2.6.5.3 Areas of Under-Performance
i. The 3-day self-learning and 2 days counselling exercises are poorly practiced in schools.
ii. The nature and design of TPD training is demand based, but at the grassroots level, it
has been practiced as a supply based model.
iii. Training norms for TPD are very low; this affects the uniformity and standardization of
training in all Districts.
iv. Post-training activities were ineffective as most of the mobilised roster trainers were from
the Higher Secondary level. Leaving school for a long time as a roster trainer caused
difficulties in teaching and learning activities of the schools.
v. Lack of coordination between central level TOT programs and district level programs.
vi. Lack of adequate research activities on reflection of training in classrooms.
vii. Efforts to empower teachers for self-study, and to conduct action research for the
improvement of teaching and learning, have not been effective.
viii. Poor reflection of teacher training and TIP in the classroom.
ix. Plagiarism by teachers in project work and action research during and after training
activities.
x. Poor presence of SMC members during training counselling workshops.
xi. In remote areas counselling by rostered trainers is still poorly performed.
xii. Teacher's motivation for learning and creating is poor.
xiii. Positive attitude development towards training has not been succeeding.
2.6.5.4 Constraints
i. Lack of a strong mechanism and expert human resource for monitoring and assessing
training reflection in the classrooms.

Status Report -2015 Page 158
ii. Lack of sufficient and up to date instructional materials in schools to reflect the learning
through training into the classrooms.
iii. Teachers still have inadequate skills to identify their training needs to overcome their
teaching/learning problems.
iv. Most of the trainers at District level have exercised supply based training models in the
past. So in fact they reflect their past experiences on TPD trainings. Reports indicate
that even teacher and trainers feel it is easy to use a supply based moDality.
v. Teachers not motivated to carry out action research activities.
vi. Reports from Districts indicate that in a limited time frame a large number of activities
(demand collection, needs identification and package development) could not be well
managed due to which the quality of the package and delivery of training was not be as
effective as expected.
vii. Lack of experienced and competent trainers in remote districts.
viii. Training policy and budget limitations meant failure to ensure the inclusion of internally
recruited teachers in training.
2.6.5.5 Addressing Constraints and Maximizing Achievements
i. Monitoring mechanisms developed by many Districts for teachers‟ self-study and action
research.
ii. Publication of action research and project work prepared by teachers to motivate
teachers to be creators.
iii. Selection of capable teachers as roster trainers.
iv. Roster trainers and RPs should be provided with needs collection, identification and
package development training.
v. Teachers and trainers feel more comfortable with demand based training moDality.
vi. Regular monitoring, follow-up and support mechanism from ETCs is necessary.
vii. Further strengthening of LRCs in Districts is a must.
viii. Programs on subject-wise action research practice, development and publication should
be conducted at District level.
ix. Resource Centers should be made training friendly and resourceful in terms of physical
facilities as well as human resources.
Status Report -2015 Page 159
Chapter 7
Capacity Development for Effective Service Delivery
2.7.1 Introduction
The Capacity Development (CD) component aims to improve the performance of the SSRP
implementing agencies like DOE (leading agency), CDC, NCED, OCE, STRO, and NFEC and
their service delivery systems. There are three important aspects for CD envisioned by SSRP:
an enabling institutional framework through endorsement of the Act, regulations, rules and
guidelines; organizational mandates, structures and relationships aligned with improved work
performance; and improved individual competencies and working conditions through training,
awareness raising, research activities and provisions for incentives.
In this chapter, institutional, organizational and individual capacity development strategies and
programs are included. The Teacher Professional Development (TPD) is one of the most
important areas of capacity development, and is included as a separate component (ASIP,
2013/14).
All programs at central and district levels conducted under this component will be analyzed and
evaluated against the annual target in this chapter.
2.7.2 ASIP Priorities
Strategic priorities for FY 2014/2015 are:
1. The CD component is structurally included in SIP development
2. Capacity building of soft-skills, vocational training, ICT, disability, and inclusiveness
3. Development of a CD plan to specifically address gaps at Central level and in the linkage
between Central and District level
4. Strengthening ERO and EPC‟s capacity for reviewing quality of educational institutions,
schools, student assessments and policy functions respectively
5. Strengthening capacity of the EMIS section in the development and management of an
on-line database
6. Identified gaps need to be addressed in line with recommendations from the Institutional
Analysis (IA) with regard to restructuring of the system, to enable sufficient capacity to
respond to expanded tasks and functions in implementation of the SSRP.
7. To build on the findings and recommendations that have been presented under the
implementation of the NASA.
8. The ICT master plan and directives developed need to be implemented taking into
account learnings from ICT based training of teacher & policy level personnel.
Mobilization of agencies I/NGOs, to collate and share these practices and lessons
learned, needs to happen to strengthen management and planning at school level.

Status Report -2015 Page 160
9. The more practical CD activities will be implemented, especially those directed at local
level. The priority areas will be; linkage between Central and local level; gender equality
at all levels; inclusiveness education; ICT and digital literacy; quality school support for
the attainment of the intended learning outcomes; coaching and mentoring; School
Improvement Planning; school safety; Social Audits, and financial record keeping.
10. The Education Review Office (ERO) will link to the quality sections in all ETCs and
QRTCs to provide guidance with regard to measuring the quality of education in Districts.
11. Dissemination of existing CD-related guidelines, tools and manuals to Districts, RCs and
schools will be carried out, and Basic orientation for its effective utilization will be
provided.
12. Communication and use of mass media to inform school communities of changes in the
school system through the SSRP.
13. Ensuring systemic enhancement to establish accountability frameworks is also a concern.
14. Periodic review of institutional arrangements in need of performance-linked evaluation
and rewards mechanisms is crucial for ensuring better service delivery.
15. The RPs capacity will be further strengthened to support schools in planning based on
the PMECs and CFS criteria, Social Audit and other contemporary issues.
2.7.3 Achievement Against Annual Targets
Major capacity development activities at center level for effective service delivery, annual
targets and their implementation status are shown below:
Table No. 79 Physical Achievement Against Annual Targets
S.N. Major activities Annual target Implementation status
1 Delivery of donor mission Two times Conducted donor mission two times
2 Expert service hire for implementation and delivery of
programs One Met the target
3 Educational planning, ASIP, AWPB, MTEF preparation. 1 time yearly Report prepared
4 Repair and maintainance of equipment of DOE 1 time Repaired
5 Program for supervision and good governance 1 time Conducted.
6 Workshop and discussions for foreign aid coordination and
mobilizations 1 time Coordinated and mobilized
7 Gender mainstreaming program. 1 time Program not implemented.
8 Capacity building on LMBIS 1 time Conducted.
9 Discuss and interaction on policy issues of education by
high level leadership 10 times
Workshop was organized and discussion
output was publicized.
10 Hireing expert services for school earthquake safety
program 75 Districts Completed
11
Hireing expert service for the preparation of guidelines &
alternative design after earthquake school building
construction
Once annually Conducted as per target.
12 Improvement of public library management Once annually Conducted as per target.

Status Report -2015 Page 161
Physical Progress Achieved Against Annual Targets
Table No. 80 Physical Progress Achieved Against Annual Targets
Major Program Activities
Annual targets Implementation Status
Capacity development for stakeholders (SMC, PTA, RCMC and HTs) for
improvement of school management, governance and preparation of SIP 29,272 schools
28,346 (96.84%) stakeholders‟
capacity developed
Management cost of EQ safety program implemented in Districts 3 DEOs 3 DEOs completed tasks
Data update and analysis of School mapping based on GIS 2,249 schools 1,808 (80.39%) schools were
mapped through GIS
Talent hunt through extra/co-curricular activities (Regional and District levels)
in 4 areas 300 students 260 (86.67%) 4 disciplines
Utilizing mass media to enhance educational quality at District and Regional
level 80 DEOs/RED
75(93.75%) DEOs/REDs
accomplished
Educational exhibitions of school level activities in 75 Districts 75 DEOs 68 (90.67%) Districts conducted
exhibitions.
TOT of capacity development for schools improvement, school management
and preparation of SIP 774 persons 841 (108.66%) persons received
Program management cost for physical facilities 80 DEO/RED 80 DEO/RED
Support of RED/DEO for action plan 80 DEO/RED 63 (78.75%) completed
2.7.4 Analysis of Progress
2.7.4.1 Major Achievements
At Central level, twenty-three subcomponents formed the component "Capacity development
for effective service delivery". Eleven subcomponents out of twenty-three were conducted.
Major activities were: library management, LMBIS capacity building, MTEF/ASIP/AWPB
preparation, expert service hiring, and high level consultation for education policy.
The overall PPR and FPRs of this component were 67.62% and 53.23% respectively. Last year,
the PPR and FPR were 98.25% and 50.80% respectively.
At District level, the capacity development component consisted of nine activities most of
which were designed to develop capacity for effective service delivery. The major capacity
development programs were capacity development of SMC, PTA, FTS, the VDC chairpersons
and school stakeholders. The three days' program was mainly focused on financial
management, crisis management, SIP, VEP, Social Audit, school management and physical
facility expansion. School management through GIS was another major program. GIS data
collected from schools was updated and reported. Some of the programs were Talent Hunt
through extra/co-curricular activities; educational exhibitions; utilization of mass media to
enhance quality education; management costs for EQ safety programs implemented; District
level TOT for school improvement; and school management and preparation of SIP. The overall
physical implementation rate for this component was 96.69% (last year 88.04%) and financial
Status Report -2015 Page 162
rate was 94.85% (last year 83.03%). This figure shows that the implementation rate has slightly
increased. The implemented activities therefore achieved highly satisfactory progress.
2.7.4.2 Gap Analysis between Annual Achievement and ASIP Priorities
Most of the activities described in the ASIP priorities did not meet the targets. Many activities
were not conducted - for example in capacity development on effective service delivery at
Central level; concept development on a unified school examination system; procurement
planning; procurement for physical facilities; and unified guidelines to manage all non-formal,
open alternative and adult schools. These are important priorities and every effort should be
made to evaluate these activities. The Status Report 2015 acknowledged that some of these
activities were conducted in that year and that school programs were developed to do so. There
is a requirement that these activities also be undertaken in 2015/16. Also the numbers against
the second column in Table 54 „Implementation status‟ should be shown where possible, as this
would assist further analysis & comparison with previous years.
At District level, however most of the major activities were implemented satisfactorily with
achievement at over 90% or better, with the exception of; data update and analysis of school
mapping based on GIS; „talent hunt‟ through extra/co-curricular activities; and support of
RED/DEOs for action plan. The activity for the „talent hunt‟ should be extended to cover other
Districts and more than four areas. Similarly, the program should continue with technical support
to enhance the capacity of RED/DEOs to make an action plan.
2.7.4.3 Innovations and Case Studies
Mobilization, Involvement, Coordination with Local Media, Organizations and
Stakeholders
DEO Dolkha, Sindhupalchok, Dhading and many others mobilized local FM to create awareness
and share information for enhancing capacity of stakeholders (SMC/PTA, HTs). Similarly, DEO
Dolakha handed over running of the talent hunt program to local organizations.
Many Districts publicized the annual program, budget and resource allocation to schools, which
increased transparency, enhanced service delivery, promoted accountability and hence
increased schools effectiveness.
Development of Training Manual
DEO Jhapa developed a training manual and conducted training in better school management
for capacity development of SMC, PTA and HTs.
Website creation of every RC
All RCs of DEO Dhading, Sindhupalchowk and Dang prepared their own websites to ensure
effective service delivery. The websites include all recent information on teaching and learning
activities and other useful information.

Status Report -2015 Page 163
Preparation and Dissemination of GIS Report
DEO Baglung prepared and disseminated GIS reports to local stakeholders including upgrading,
merging, downsizing, and teacher management.
Publication of allocated resources and Budget through media DEO Solukhumbu, Terhathum, Panchthar, Ilam, Salyan, Pyuthan and many other Districts publicized the annual program, budget and resource allocation to schools, which increased transparency, enhanced service delivery, promoted accountability and hence increased school effectiveness. Digital notice board A digital notice board has been used as an effective and efficient tool for public service information delivery by DEO Bajura, Baglung, Palpa and many other Districts. Compulsory provision on payment of teacher’s salary through bank account DOE provisioned compulsorily payment of teacher‟s salaries only through bank accounts. Many DEOs have completed this task and others are making progress towards this goal. 2.7.4.4 Areas of Under-Performance i. REDs/DEOs could not develop and implement their action plan due to a lack of technical
capacity. ii. „Talent hunt‟ through extra/co-curricular activities program did not attract all students in
their interest areas. iii. Institutional development was not effective.
iv. Insufficient budget was allocated for the program "media for effective service delivery", which affected maximal use of media for service delivery.
2.7.4.5 Constraints i. Grants for schools financial and Social Audits were insufficient, and affected quality output.
ii. Management capacity of local stakeholders is poor, which has affected quality management of schools.
iii. Lack of training programs for novice accountants in schools.
iv. Lack of capacity development of DEO‟s officials on current trends for effective service delivery.
v. Budget allocated for educational exhibitions was not sufficient.
vi. Lack of parental awareness at the local level.
vii. Involvement of community and local agencies in educational service delivery was not as effective as hoped.
2.7.4.6 Addressing Constraints and Maximizing Achievements i. Use of ICT and media for educational service delivery has been very effective. ii. Each DEO has a website as an efficient service delivery medium. iii. Activation of VECs in every VDC. iv. Teacher redeployment implementation, and school merging and coordination with different
community based organizations, NGO/INGOs and local bodies for quality service delivery
were the main strategies.

Status Report -2015 Page 164
Status Report -2015 Page 165
Chapter 8
School Management and Monitoring
2.8.1 Introduction
Monitoring and Evaluation (M&E) plays an important role in the effective and meaningful
implementation of plans, policies, programs and projects. M&E is also the major component of
SSRP which ensures effective program implementation to achieve expected outcomes on time.
Post implementation appraisal is also an integral part of M&E, helping to objectively assess
impact. The monitoring program under SSRP facilitates decision making processes by ensuring
quick access to relevant and reliable information within time and provides strategic options for
efficiency and quality of service delivery. It ensures internal and external accountability of
resources used in the program. Key outputs of the monitoring component exist in a number of
forms, such as the FMR, Flash Reports, Status Reports, Research reports and so on. The
immediate objective is to monitor program inputs, processes, and outputs and evaluate the
impact of the resources used. This component integrates monitoring with school management.
So the program and activities were designed both for monitoring activities and essential
activities for the management of schools.
In this chapter, all initiatives of the MOE system for better school management and effective
monitoring are analyzed in detail. With the collective efforts of central and district level
programs, and local initiatives, our educational management and monitoring system is
becoming more formal, professional, organized and results oriented.
2.8.2 ASIP Priorities
The following strategic priorities were adopted to implement the program for achieving the
objectives of school management and monitoring:
1. Initiatives will be undertaken to establish results oriented monitoring from Central level
through to community and school levels. Rewards will be linked with job performance.
2. A clear linkage between planning and monitoring activities will be established and level-
wise sets of monitoring indicators will be reviewed and utilized. Findings and
recommendations of monitoring reports will be utilized in programme implementation and
for informed decision making processes at various levels. Resource allocation will also be
tied to the monitoring plan.
3. Central level and other agencies under MOE will be encouraged to prepare and implement
M&E plans in line with the ASIP/AWPB in order to reduce duplication and to ensure the
efficiency, effectiveness, sustainability and timeliness of service delivery to better serve
beneficiaries. The ASIP/AWPB will be used as one of the basic instruments for
performance and progress monitoring against the stated priorities, targets, and budgets.
4. Assessing the school level status against SSRP indicators is the key priority of monitoring
and reporting.
Status Report -2015 Page 166
5. The Flash Reporting system, NASA reports, the NFEC, HSEB, OCE database and the
census report will be considered as a foundation for reviewing and revising the KPIs of
SSRP to make it more contextual.
6. Capacity development activities from schools at Central level will be strengthened in order
to enhance the quality of monitoring, supervision and reporting mechanisms.
7. REDs will be strengthened to carry out monitoring activities on a regular basis and support
the District for the proper implementation of educational plans and programs.
8. The capacity of School Supervisors and RPs will be enhanced to carry out supervision
activities in order to ensure professional support for the teacher.
9. Level-wise, class-wise, subject-wise, and teacher-wise average achievement scores will
be calculated and compiled in order to ensure accountability mechanisms at all levels.
10. In order to ensure the appropriate utilization of provided funds, the practices of financial
and Social Auditing will be tied up with trimester funds release to the schools as a
mandatory provision.
11. A preparatory action will be carried out for establishing a financial management
information system in the education system at Central, Regional and District levels.
12. Monitoring reports will be utilized for timely adjustments to program implementation and for
informed decision making processes at various levels.
13. IEMIS will be strengthened by improving and integrating existing databases, introducing
technological innovations.
14. Improving internal control and compliance mechanisms at DEOs and schools through
improved accounting procedures at the school level.
15. A simplified accounting manual will be developed and implemented at schools and training
and will be provided for the teachers/staff who look after school accounts.
16. Financial and Social Audits will be carried out on a regular basis. An independent review
of school level financial audits will be conducted working very closely with REDs on a
sample basis to improve the quality of school audit reports.
17. Governance, accountability and transparency in the textbook printing and distribution
system will be improved at all levels on a regular basis.
18. Recommendations from the recently commissioned study of textbook policy and practices
will referenced when taking corrective actions to enhance the textbook printing and
distribution system.
19. Institutional cooperation with I/NGOs will be formalized at both Central and District levels
in line with SSRP goals and priorities to strengthen service delivery.
20. A joint monitoring mechanism will be introduced, comprised of key stakeholders,
journalists, CSOs, and so forth, in order to ensure the transparency, accountability,
sustainability, timeliness, efficiency, and effectiveness of the implementation of
educational plans and programs at District, RC and School level. Existing supervision and
monitoring systems will be strengthened to provide general and instructional support to
integrated Secondary schools.

Status Report -2015 Page 167
2.8.3 Achievement against Indicators Table No. 81 Physical Achievement Against Annual Targets
Indicators Unit Base Years Achievement
2007-
2008
2008-
2009
2009-
2010
2010-
2011
2011-
2012
2011-
2012
2012/13 2013-14
(Target) (Achieve
ment)
(Achieve
ment)
(Achieve
ment)
1.Share of Education
Budget
GNP % 2 2.1 2.1 NA 2.3
GDP % 3.5 3.6 3.6 5.39 3.7
2. Share in Education
Budget
Basic Education % 70 71 71 63.99 73 68.9 64.53
Secondary Education % 9 9 9 16.94 9 16.7 17.87
3. Enrolment at Grade 1
New entrants with
ECEDCS experience
% 33 36 41 52.1 51 55.6
56.9
59.6
Gross intake rate % 141 148 144 142.4 137 137.7 141.8
Net Intake rate % 78 81 83 89 88 91.2 91.6
4. Gross Enrolment Rate
ECEDCS/Pre-Primary % 60 63 67 70 77 73.7 76.7
77.7
Basic Education (1-8) % 116 123 125 124.4 130 120.1 115.7
117.1
Secondary Education % 36 40 43 46.2 52 51.7 50.4
51.6
5. Net Enrolment Rate
Primary Education % 89 92 94 94.5 97 95.3 95.5
96.2
Basic education % 71 73 75 86 80 87.5 86.3
87.6
Secondary Education % 20 21 22 27.1 24 32.4 33.2
34.7
6. Teacher with Required
Qualification and training
Basic Education % 62 66 70 79.3 79 91.5 92.5
Secondary Education % 74 77 80 75.3 86 90.7 91.1
7. Teacher with Required
Certification
Basic Education % 90 91 92 95 95 96.9 97.7
Secondary Education % 90 91 92 95 95 98 98.6
8. Pupil/teacher Ratio
Basic Education Ratio 44 43 41 30 39 42
41
Pri. 36
L. Sec.60
Secondary Education Ratio 42 39 37 44.4 32 31 31
30
9.Repetition Rate
Grade 1 % 28 18 12 22.6 5 19.9 17.5
15.2
Grade 8 % 13 11 9 6.6 6 6 5.1
4.5

Status Report -2015 Page 168
Indicators Unit Base Years Achievement
2007-
2008
2008-
2009
2009-
2010
2010-
2011
2011-
2012
2011-
2012
2012/13 2013-14
(Target) (Achieve
ment)
(Achieve
ment)
(Achieve
ment)
10. Survival Rate by
cohort Method
Grade 5 % 54 58 61 80.6 70 84.2 85.4
86.8
Grade 8 % 37 41 45 66 54 69.6 70.1
74.7
Basic(1-8)
11. Coefficient of
Efficiency
Basic education Ratio 0.46 0.49 0.52 0.65 0.59 0.76 70.7
73.1
Secondary Education Ratio 0.3 0.33 0.36 NA
12. Learning
Achievement
Grade 5 % 50 53 56 49.6 63 English –
54
Grade 3
-
Nepali –
59
Grade 3
- 62.6
Maths –
53
Grade 3
- 59.4
Grade 8 % 44 46 48 43.5 51 Maths-43
Nepali-
49
Social -
49
13. Pass rate
SLC % 60 62 64 55.5 67 41.7
Higher Secondary(11-12) % 23 25 28 41 34
14. Literacy rate
Age group 15-24 % 73 75 78 NA 83
Age group 6+ years % 63 69 76 NA 80 65.9
Age group 15+ years % 52 56 60 NA 64
15. Literacy GPI (15+) Ratio 0.61 0.74 0.92 NA 0.93
2.8.4 Achievement against Annual Targets
Major activities on school management and monitoring at Center level
Table No. 82 Physical Achievement Against Annual Targets
S.N. Major Activities Annual target Implementation Status
1 FMIS update and PFM Action Plan implementation 1 time annually Achieved at PPR 100% and FPR 56.5%
2 Monitoring report publication Quarterly Published with 100%
3 Monthly progress workshops for all sections of DOE and
Central agencies. Twelve publications
Conducted as per target with 100%
Financial Progress.
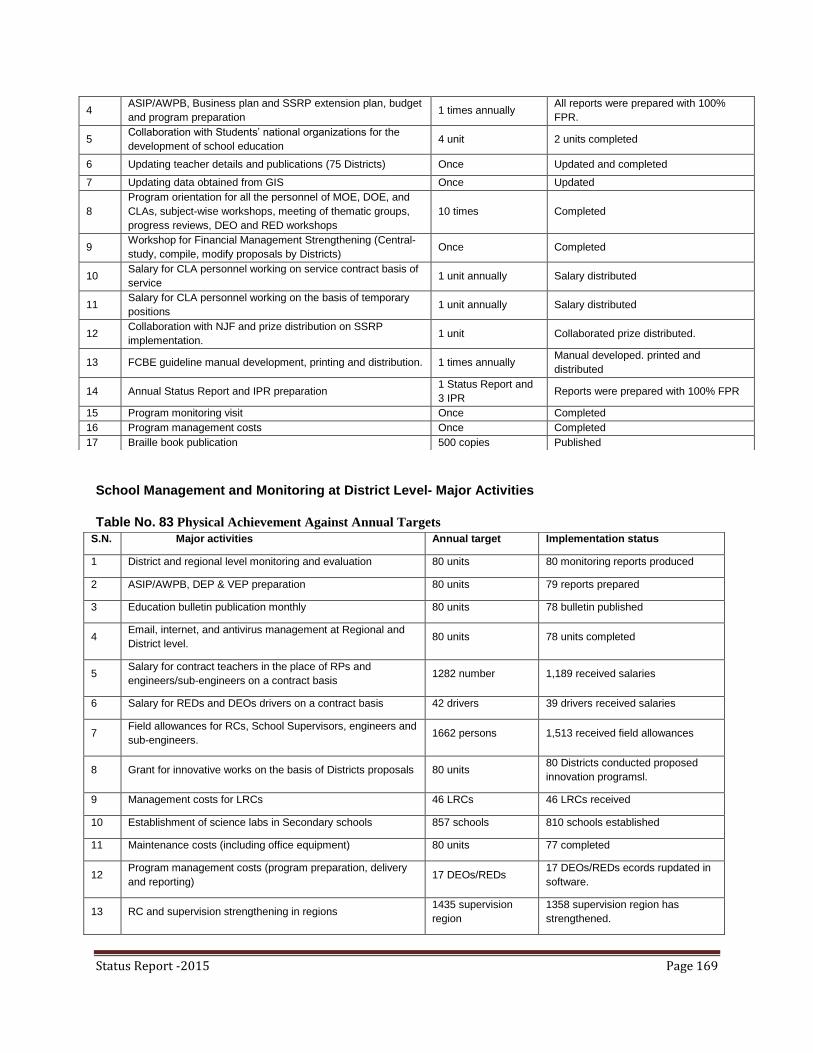
Status Report -2015 Page 169
School Management and Monitoring at District Level- Major Activities
Table No. 83 Physical Achievement Against Annual Targets
4 ASIP/AWPB, Business plan and SSRP extension plan, budget
and program preparation 1 times annually
All reports were prepared with 100%
FPR.
5 Collaboration with Students‟ national organizations for the
development of school education 4 unit 2 units completed
6 Updating teacher details and publications (75 Districts) Once Updated and completed
7 Updating data obtained from GIS Once Updated
8
Program orientation for all the personnel of MOE, DOE, and
CLAs, subject-wise workshops, meeting of thematic groups,
progress reviews, DEO and RED workshops
10 times Completed
9 Workshop for Financial Management Strengthening (Central-
study, compile, modify proposals by Districts) Once Completed
10 Salary for CLA personnel working on service contract basis of
service 1 unit annually Salary distributed
11 Salary for CLA personnel working on the basis of temporary
positions 1 unit annually Salary distributed
12 Collaboration with NJF and prize distribution on SSRP
implementation. 1 unit Collaborated prize distributed.
13 FCBE guideline manual development, printing and distribution. 1 times annually Manual developed. printed and
distributed
14 Annual Status Report and IPR preparation 1 Status Report and
3 IPR Reports were prepared with 100% FPR
15 Program monitoring visit Once Completed
16 Program management costs Once Completed
17 Braille book publication 500 copies Published
S.N. Major activities Annual target Implementation status
1 District and regional level monitoring and evaluation 80 units 80 monitoring reports produced
2 ASIP/AWPB, DEP & VEP preparation 80 units 79 reports prepared
3 Education bulletin publication monthly 80 units 78 bulletin published
4 Email, internet, and antivirus management at Regional and
District level. 80 units 78 units completed
5 Salary for contract teachers in the place of RPs and
engineers/sub-engineers on a contract basis 1282 number 1,189 received salaries
6 Salary for REDs and DEOs drivers on a contract basis 42 drivers 39 drivers received salaries
7 Field allowances for RCs, School Supervisors, engineers and
sub-engineers. 1662 persons 1,513 received field allowances
8 Grant for innovative works on the basis of Districts proposals 80 units 80 Districts conducted proposed
innovation programsl.
9 Management costs for LRCs 46 LRCs 46 LRCs received
10 Establishment of science labs in Secondary schools 857 schools 810 schools established
11 Maintenance costs (including office equipment) 80 units 77 completed
12 Program management costs (program preparation, delivery
and reporting) 17 DEOs/REDs
17 DEOs/REDs ecords rupdated in
software.
13 RC and supervision strengthening in regions 1435 supervision
region
1358 supervision region has
strengthened.
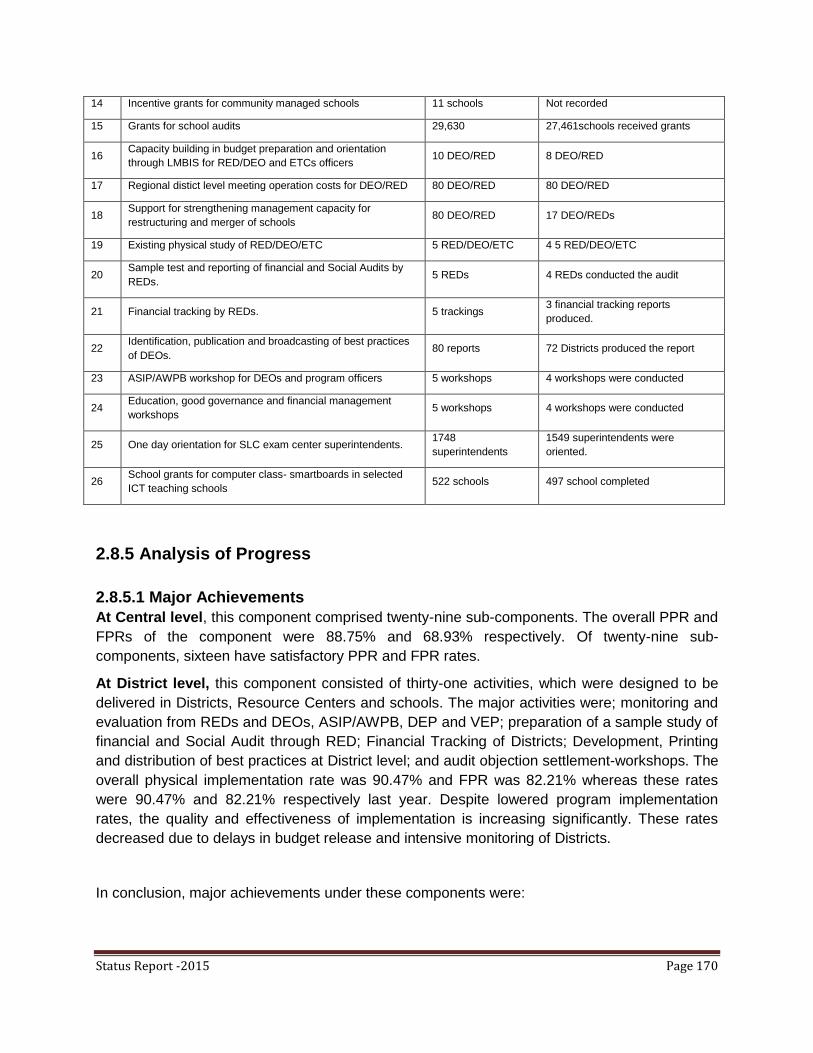
Status Report -2015 Page 170
2.8.5 Analysis of Progress
2.8.5.1 Major Achievements
At Central level, this component comprised twenty-nine sub-components. The overall PPR and
FPRs of the component were 88.75% and 68.93% respectively. Of twenty-nine sub-
components, sixteen have satisfactory PPR and FPR rates.
At District level, this component consisted of thirty-one activities, which were designed to be
delivered in Districts, Resource Centers and schools. The major activities were; monitoring and
evaluation from REDs and DEOs, ASIP/AWPB, DEP and VEP; preparation of a sample study of
financial and Social Audit through RED; Financial Tracking of Districts; Development, Printing
and distribution of best practices at District level; and audit objection settlement-workshops. The
overall physical implementation rate was 90.47% and FPR was 82.21% whereas these rates
were 90.47% and 82.21% respectively last year. Despite lowered program implementation
rates, the quality and effectiveness of implementation is increasing significantly. These rates
decreased due to delays in budget release and intensive monitoring of Districts.
In conclusion, major achievements under these components were:
14 Incentive grants for community managed schools 11 schools Not recorded
15 Grants for school audits 29,630 27,461schools received grants
16 Capacity building in budget preparation and orientation
through LMBIS for RED/DEO and ETCs officers 10 DEO/RED 8 DEO/RED
17 Regional distict level meeting operation costs for DEO/RED 80 DEO/RED 80 DEO/RED
18 Support for strengthening management capacity for
restructuring and merger of schools 80 DEO/RED 17 DEO/REDs
19 Existing physical study of RED/DEO/ETC 5 RED/DEO/ETC 4 5 RED/DEO/ETC
20 Sample test and reporting of financial and Social Audits by
REDs. 5 REDs 4 REDs conducted the audit
21 Financial tracking by REDs. 5 trackings 3 financial tracking reports
produced.
22 Identification, publication and broadcasting of best practices
of DEOs. 80 reports 72 Districts produced the report
23 ASIP/AWPB workshop for DEOs and program officers 5 workshops 4 workshops were conducted
24 Education, good governance and financial management
workshops 5 workshops 4 workshops were conducted
25 One day orientation for SLC exam center superintendents. 1748
superintendents
1549 superintendents were
oriented.
26 School grants for computer class- smartboards in selected
ICT teaching schools 522 schools 497 school completed

Status Report -2015 Page 171
i. Schools opened for 220 days yearly and teaching activities were conducted for 192
days. Due to the earthquake, schools in the 14 most affected Districts were closed for
one month.
ii. A child friendly school environment has been created after coordination with relevant
organizations.
iii. There has been significant coordination with stakeholders to achieve quality education.
iv. Average learning achievement of students has improved.
2.8.5.2 GAP Analysis Between Annual Achievement and ASIP Priorities
Some of the activities at central level were not conducted in 2014/15. Most importantly, norms
for quality education and learning development together with strategies for forecast
development and publication were not conducted this year. At the district level, activities were
conducted, with the exception of facilitation of school management handover to community
programs.
To improve the quality of teaching/learning, some schools have implemented student log books
to record teachers‟ attendance at school on a regular basis. This initiative resulted in increased
presence of teachers at schools.
Another initiative that was undertaken by some schools preparing a school profile to ensure
objective based resource allocation and most importantly transparency.
2.8.5.3 Innovations and Case Studies
DEO Makwanpur, Sankhuwasava, Chitwan and many other Districts used budget release
software ensuring accurate budget imbursement to schools.
Team supervision
Team supervision is an important factor for effective and results based monitoring. Such team
may consist of DEO personnel, RPs, School Supervisors, journalists, educationists, parents,
SMC members and other interested and related stakeholders. DEOs of Lalitpur, Surkhet,
Sindhupalchowk, Pyuthan, Jhapa, Chitwan, Dhading, Panchthar, Dadeldhura, Lamjung, Khotang
performed team supervision.
SMS monitoring
RED Surkhet continued a mobile SMS monitoring system in Karnali zone. This was also
practiced by REDs in western and eastern regions. The system requires all RPs of the specified

Status Report -2015 Page 172
region to send the schools‟ name and opening days, teaching days, number of teachers and
students attending through mobile messages on monthly basis following the reporting format
developed by the RED. Then the DEO and RED feed the information into database, analyze
and randomly verify the data sent.
Preparing schools profile books
DEO Khotang prepared and publicized schools profile books of Khotang, from physical through
to academic aspects, of every school, ensuring objectively based resource allocation, and
transparency.
Preparation for disaster reduction
DEO Kaski prepared and implemented disaster reduction strategies in Pokhara submetropolitan
city in collaboration with Siddhartha Bal club.
Peae zone model district mission
DEO Okhaldhunga and Dolakha declared and implemented a peace zone and community
school innovation roadmap.
DEO Jhapa released the ECD budget through mother schools for the better management of
ECDs.
DEO Lalitpur, Bajura, Salyan and Makwanpur published flash data which they requested
stakeholders to verify.
Inter-school supervision and experience sharing
DEO Darchula initiated interschool supervision with the coordination of RC. According to this
program all the schools‟ headteacher, supervises all schools in the R.C. and organize a
workshop jointly with stakeholders, School Supervisors, DEOs and other professionals to
identify gaps and necessary improvement strategies.
School management guideline publication
DEO Morang published a school management guideline book to increase the capacity of the
school management committee, including topics such as education rules, acts and regulations,
responsibilities of the SMC, the process of Social Audits, school management techniques, and
managing resources among others.
Intensive monitoring of Terai region Districts
The MOE and DOE continued intensive monitoring in districts of the Terai region. Monitoring
teams examined all aspects of DEOs at school level and submitted reports with recommended
actions to address abuses of authority.
Status Report -2015 Page 173
2.8.5.4 Areas of Under-Performance
i. School performance did not improve significantly as per expectations.
ii. Decreasing number of students in community schools.
iii. Abuses of authority related to school management has not improved.
iv. Community involvement and ownership in managing schools was not embraced with
enthusiasm..
v. Local education managers lack of awareness and professional competencies.
vi. Management of student admission records is below expectation.
vii. Lack of trained accountants in the schools.
viii. RCs and region supervision enhancement programs did not perform as per expectation.
2.8.5.5 Constraints
i. Village Education Committees are not active.
ii. Lack of results based monitoring and team supervision in all districts.
iii. The budget allocated for monitoring at District level is very low for result based
monitoring.
iv. Monitoring, evaluation and supervisory competencies of RPs are poor.
v. Stakeholders focus more on educational access and administration rather than
classroom activities and quality issues.
2.8.5.6 Addressing Constraints and Maximizing Achievements
i. Capacity development training was conducted for stakeholders, four persons from each
school covering all schools.
ii. VECs were actively involved in FCBE declaration and illiterate free VDCs declaration
programs.
iii. Institutionalization of team supervision and intensive RC level monitoring were
introduced.
iv. There were coordination and networking practices between local bodies, NGO/INGOs,
CBOs and educational institutions.
v. Mobile monitoring, SMS monitoring and other innovative strategies were applied.
vi. A strong monitoring system has been developed.
vii. Commencement of performance contracts with DEOs, Supervisors, RPs, and Head
Teachers, including rewards and penalties based on the results of performance
monitoring reports.
viii. Institution based quality measurement tools were developed.

Status Report -2015 Page 174
Chapter 9
Incentives and Support
2.9.1 Introduction
There is no separate chapter for incentives and support in SSRP document and ASIP
2013/2014. This component is connected with Basic and Secondary education in both of the
documents. But in AWPB there is a separate heading on incentives and support. There is
provision for different types of grants, firstly there are scholarships for martyrs' children, mukta
kamalari, conflict affected children, feeder hostel students, Dalit and disabled students, and
students from marginalized groups. The second category of grants is for intensive programs for
public Higher Secondary schools running science programs, matching grants to support ICT
based education, matching grants for establishing libraries, and incentives for schools obtaining
the best SLC results. The grants are provided through schools to targeted groups to ensure
access of Dalits, girls, and children of disadvantaged /marginalized groups.
2.9.2 ASIP Priorities
Basic Education
The ASIP/AWPB (2013/014) has expressed ongoing annual strategic priorities as follows.
1. Incentives and scholarship schemes will continue for the schooling of girls, Dalits, and
children with disabilities including other disadvantaged and marginalized communities.
Increasing access and promoting equity and social inclusion in school education will be
at the core of incentives and the scholarship programs.
2. Scholarship distribution criteria and guidelines will be revised based on study
recommendations to be provided.
3. Scholarships for targeted groups (22 Janajati including marginalized groups) and girls'
scholarship (Grades 1-8) including Karnali will continue.
4. Student learning will be facilitated through use of ICT in education.
Secondary Education
1. Scholarships for children of martyrs, dalit, conflict affected children, and Mukta
Kamlari as well as hostel management costs for Mukta Kamlahari children, remote
mountain hostel students, feeder hostel students, model schools students and model
residential students in remote mountain areas will be provided.
2. Remote mountain hostel operation cost, feeder hostel operation cost, model schools
operation cost and operation costs for mountain residential school hostels will be
provided.
3. Secondary education scholarships, Dalit scholarships (Grades 9-10), scholarships
for disabled students in Grades 9-10, scholarships for marginalized and targeted
students in Grades 9-10 (22 Janajati and Mukta Kamiyaa, Badi, Haliya, Charuwa
etc.) and scholarships for targeted science students at Grade 11 and 12 will be
provided.
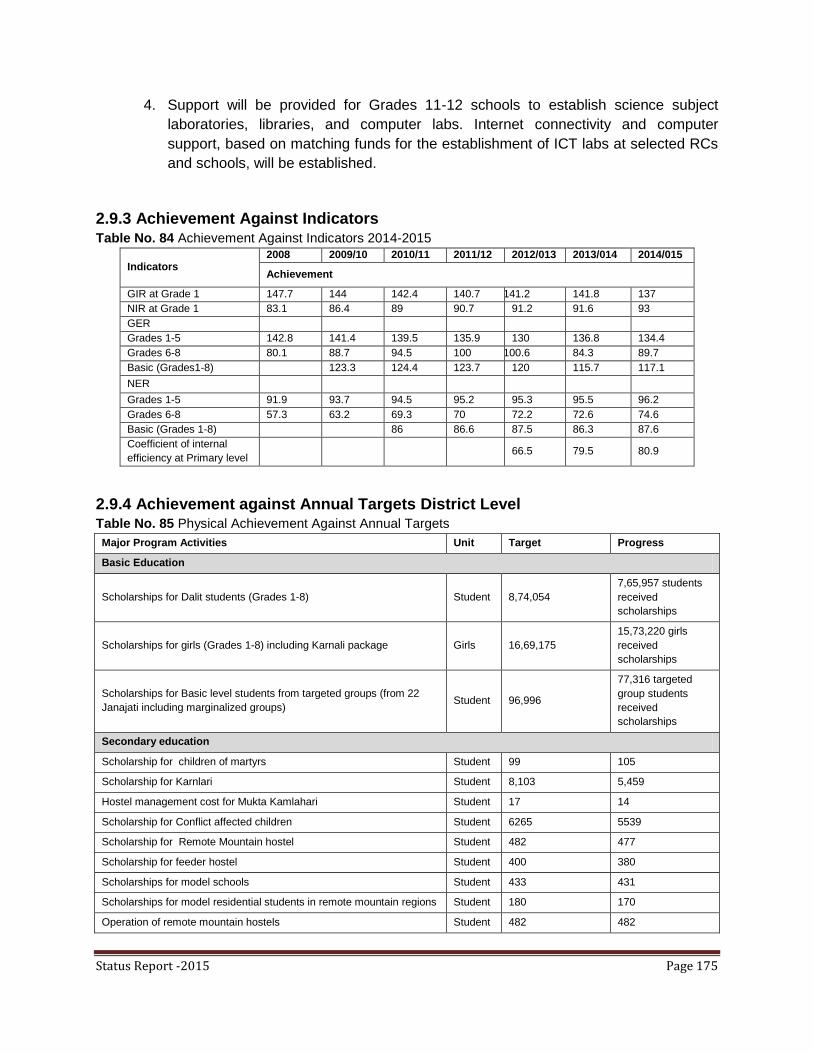
Status Report -2015 Page 175
4. Support will be provided for Grades 11-12 schools to establish science subject
laboratories, libraries, and computer labs. Internet connectivity and computer
support, based on matching funds for the establishment of ICT labs at selected RCs
and schools, will be established.
2.9.3 Achievement Against Indicators Table No. 84 Achievement Against Indicators 2014-2015
Indicators 2008 2009/10 2010/11 2011/12 2012/013 2013/014 2014/015
Achievement
GIR at Grade 1 147.7 144 142.4 140.7 141.2 141.8 137
NIR at Grade 1 83.1 86.4 89 90.7 91.2 91.6 93
GER
Grades 1-5 142.8 141.4 139.5 135.9 130 136.8 134.4
Grades 6-8 80.1 88.7 94.5 100 100.6 84.3 89.7
Basic (Grades1-8) 123.3 124.4 123.7 120 115.7 117.1
NER
Grades 1-5 91.9 93.7 94.5 95.2 95.3 95.5 96.2
Grades 6-8 57.3 63.2 69.3 70 72.2 72.6 74.6
Basic (Grades 1-8) 86 86.6 87.5 86.3 87.6
Coefficient of internal
efficiency at Primary level 66.5 79.5 80.9
2.9.4 Achievement against Annual Targets District Level Table No. 85 Physical Achievement Against Annual Targets
Major Program Activities Unit Target Progress
Basic Education
Scholarships for Dalit students (Grades 1-8) Student 8,74,054
7,65,957 students
received
scholarships
Scholarships for girls (Grades 1-8) including Karnali package Girls 16,69,175
15,73,220 girls
received
scholarships
Scholarships for Basic level students from targeted groups (from 22
Janajati including marginalized groups) Student 96,996
77,316 targeted
group students
received
scholarships
Secondary education
Scholarship for children of martyrs Student 99 105
Scholarship for Karnlari Student 8,103 5,459
Hostel management cost for Mukta Kamlahari Student 17 14
Scholarship for Conflict affected children Student 6265 5539
Scholarship for Remote Mountain hostel Student 482 477
Scholarship for feeder hostel Student 400 380
Scholarships for model schools Student 433 431
Scholarships for model residential students in remote mountain regions Student 180 170
Operation of remote mountain hostels Student 482 482
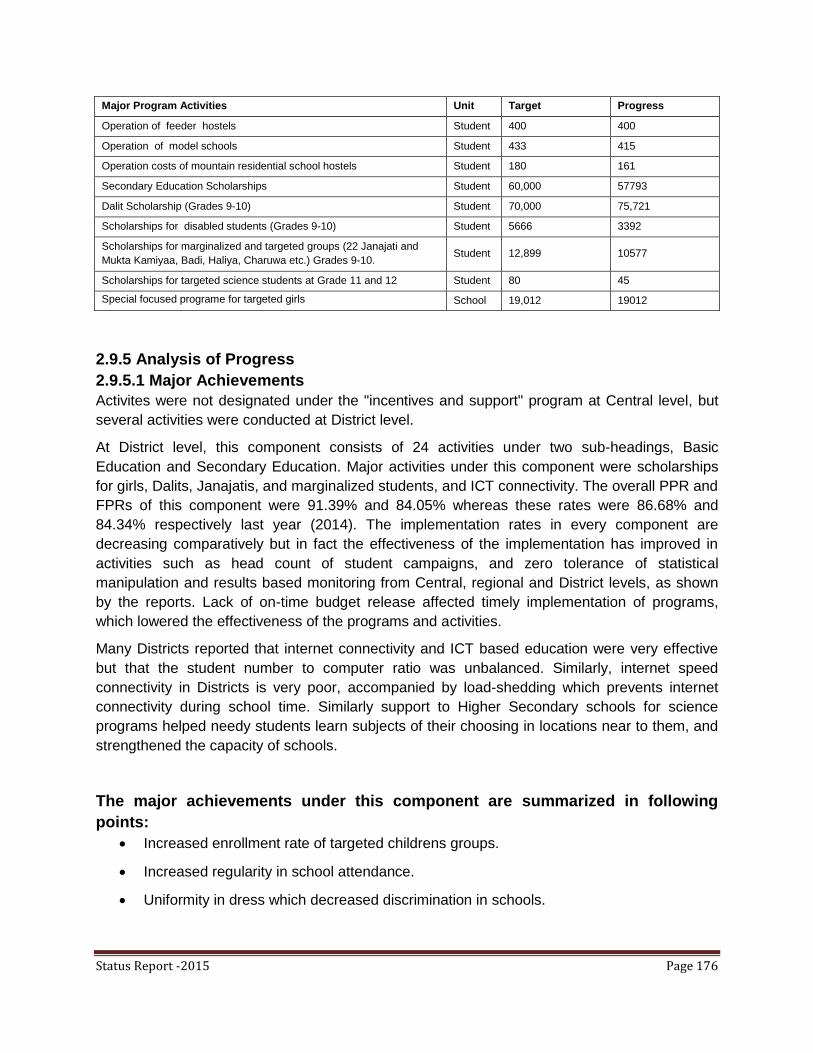
Status Report -2015 Page 176
Major Program Activities Unit Target Progress
Operation of feeder hostels Student 400 400
Operation of model schools Student 433 415
Operation costs of mountain residential school hostels Student 180 161
Secondary Education Scholarships Student 60,000 57793
Dalit Scholarship (Grades 9-10) Student 70,000 75,721
Scholarships for disabled students (Grades 9-10) Student 5666 3392
Scholarships for marginalized and targeted groups (22 Janajati and
Mukta Kamiyaa, Badi, Haliya, Charuwa etc.) Grades 9-10. Student 12,899 10577
Scholarships for targeted science students at Grade 11 and 12 Student 80 45
Special focused programe for targeted girls School 19,012 19012
2.9.5 Analysis of Progress
2.9.5.1 Major Achievements
Activites were not designated under the "incentives and support" program at Central level, but
several activities were conducted at District level.
At District level, this component consists of 24 activities under two sub-headings, Basic
Education and Secondary Education. Major activities under this component were scholarships
for girls, Dalits, Janajatis, and marginalized students, and ICT connectivity. The overall PPR and
FPRs of this component were 91.39% and 84.05% whereas these rates were 86.68% and
84.34% respectively last year (2014). The implementation rates in every component are
decreasing comparatively but in fact the effectiveness of the implementation has improved in
activities such as head count of student campaigns, and zero tolerance of statistical
manipulation and results based monitoring from Central, regional and District levels, as shown
by the reports. Lack of on-time budget release affected timely implementation of programs,
which lowered the effectiveness of the programs and activities.
Many Districts reported that internet connectivity and ICT based education were very effective
but that the student number to computer ratio was unbalanced. Similarly, internet speed
connectivity in Districts is very poor, accompanied by load-shedding which prevents internet
connectivity during school time. Similarly support to Higher Secondary schools for science
programs helped needy students learn subjects of their choosing in locations near to them, and
strengthened the capacity of schools.
The major achievements under this component are summarized in following
points:
Increased enrollment rate of targeted childrens groups.
Increased regularity in school attendance.
Uniformity in dress which decreased discrimination in schools.

Status Report -2015 Page 177
Use of English medium and ICT in education decreased the gap between institutional
and community schools.
Positive competition developed between schools.
Libraries in schools developed a reading culture amongst teachers and students.
2.9.5.1.1 Gap analysis between annual achievement and ASIP priorities
The major activities under the „incentives and support‟ component involved assessing the
scholarship scheme. Comparing the 2014 target with 2015, the number of overall targets for
scholarship was increased by 4.71%.
2.9.5.2 Innovations and Case Studies
Reward and punishment system
DEO Panchthar and Salyan started result based reward and punishment system. Declaration of
"Year Teacher 2070/71" (Year of the Teacher?) was the reward and delivered by DEO. Similarly
45 teacher of Salyan District were rewarded on a public program on the basis of their
performance in FY 2070.
Many Districts like Salyan, Dang, Pyuthan, Chitwan, and Sindhupalchowk verified actual
students of all schools by one at a time head counting campaigns.
DEO Bajura published Flash data for the public to verify actual numbers of students.
2.9.5.3 Areas of Under-Performance
Scholarships misused by parents could not be prevented through MOE‟s mechanisms.
The target for payment of conflict victims scholarships through bank accounts was not
able to be met.
Despite strict directions, schools used non-salary PCF in teacher's salaries.
Student ID card and tracking program has not become institutionalized.
Coordination with NGOs in scholarship distribution was not as effective as expectated.
Schools used scholarships funds for teachers' salaries in spite of strong directions to the
contrary.
Poor school leadership and SMC performance.
Lack of coordination between SMC, PTA, teachers and Head Teachers.
Belief of stakeholders in community school education is still poor.
Status Report -2015 Page 178
2.9.5.4 Constraints
Lack of community and parent awareness.
Mobility of conflict victim scholarship holder students from one District to another has
hindered to exact verification of numbers.
Lack of an accurate mechanism to control scholarship duplication.
Lack of follow up, impact, output and outcomes research on scholarship distribution.
2.9.5.5 Addressing Constraints and Maximizing Achievements
Reward and punishment system has been made effective in terms of school support and
incentives.
Most of the Districts practicing scholarship distribution organized a public program in
schools.
English language teaching and learning applied in many schools to increase student
numbers and to enhance parents‟ beliefs in community schools.
Fund flow tracking analysis was conducted.
Qualitative field based auditing with some sample cases has been conducted by the
auditor general's office.
Monitoring school incentives utility by media and stakeholders.

Status Report -2015 Page 179
Chapter 10
School Operation/Management and School Employee Remuneration Costs
2.10.1 Introduction
There is no separate chapter for School Operation/Management and School Employee
Remuneration Costs in the SSRP document or in ASIP 2014/15. This component is connected
in AWPB (2014/15). There is a separate heading School Operation/Management and School
Employee Remuneration Costs. The grant includes PCF non-salaried grants for learning
material for schools to achieve the PMECs (provided to schools on the basis of number of
students), school employee remuneration costs and school management costs (grants provided
in specified amounts according to level of school).
2.10.2 ASIP Priorities
ECEDCS
1. Minimum norms and standards of service will be strengthened. (component-wise
strategic priorities)
2. The support for ECEDCS will continue to maintain the national minimum norms and
standards.
3. Efforts will be made to make materials available by mobilizing government organizations,
communities and non-government resources. ECD centers will be supported by non-
salary PCF grants on the basis of number of children. Local bodies and communities will
be encouraged to support centers in terms of financial and non-financial resources.
4. To ensure minimum standards of ECEDCS, 1,053 centers will be developed as model
centers. Criteria for the Model ECEDCS centers will be developed and incorporated in
the DOE‟s Program Implementation Manual.
Basic education
1. Priority will be given in terms of resource allocation and mobilization to fulfil the GON
commitment to the implementation of compulsory Basic education.
2. In order to ensure quality education at Basic level, resources will be channelled to
schools based on the PMECs survey reports.
3. Schools will be supported by non-salary PCF grants on the basis of student enrolment
and PCF funds will be utilized to implement SIP with the decision made by SMCs.
4. School operation/management costs and costs for school employee remuneration
incentives will be indirectly delivered to run the school.

Status Report -2015 Page 180
Secondary education
1. A minimum of eight teachers will be identified to pilot the District's integrated Secondary
level for Grades 9-12. This includes the redeployment and management of existing
positions. Attention will be given to deploy teachers by considering the school as a unit.
1. Schools will be supported by non-salary PCF grants on the basis of student enrolment.
2. School operation, management costs and incentives for school employee remuneration
costs will be delivered to run the school.
2.10.3 Achievement against Annual Target
Table No. 86 Physical Achievement Against Annual Targets
Major Program Activities Unit Target Progress
PCF non-salary Grant for Learning materiasl for school to achieve the PMEC
ECEDCS Class Student 5,85,440 4,28,637
Primary Level Student 41,11,679 32,24,994
Lower Secondary Level Student 15,46,647 14,22,894
Secondary Level (targeted group) Student 7,08,157 6,54,006
Higher Secondary Level Student 3,11,070 2,35,501
School stationery deliveries
Primary Level School 18,421 16,978
Lower Secondary Level School 5,046 4,718
Secondary and Higher Secondary Level School 5,805 5,502
School Employee remuneration Cost School 29,272 28,068
2.10.4 Analysis of Progress
2.10.4.1 Major Achievements
No activities were recorded under this component at the Central level in FY 2014/15.
At the District level, there were three subcomponents and nine activities under this component.
The overall PPR and FPRs of this component were 91.37% and 89.99%. The PCF non-salary
school stationery and educational materials grants were provided for schools on the basis of
specified norms. Due to intensive monitoring, the expected number of students has decreased.
So the PPR and FPRs of this component were lower than expected. The district report mentions
that several RPs and Head Teacher were disciplined for data manipulation this year during
intensive monitoring from DOE.
In conclusion this component achieved the following objectives.
Enhanced school governance and effectiveness.
Availability of instructional materials in classrooms.
ECEDCS center learning environments were furnished.

Status Report -2015 Page 181
2.10.4.2 Innovations and Case Studies
DEO Salyan prepared sample internal teacher and personnel appointment regulations and
distributed them to all schools, which schools used to prepare their regulations, which were then
approved by the SMC, DEO and District Education Committee. Follow up study found that
issues related to schools decreased by 80%.
2.10.4.3 Areas of Under-Performance
Most of the DEOs had not implemented 'internal teacher and personnel appointment regulations' to legalize and regularize internal appointments.
Low remuneration failed to motivate accountants and school helpers.
Lack of capacity development programs for school accountants, which was directly proportional to financial corruption in schools.
The exact number and accurate records of employees working in schools in the Districts‟ has not been established in the database.
2.10.4.4 Constraints According to the reports, resources provided to District schools became insufficient to
implement completely free Basic education, and to manage ECED.
Despite various efforts, 100% accuracy in school statistics has still not been achieved.
Delay in budget release affected implementation.
School running costs and personnel management costs were not sufficient to address the needs of schools.
2.10.4.5 Addressing Constraints and Maximizing Achievements Statistics verification campaign conducted.
Additional support received from NGOs/INGOs, community forests, CBOs and local bodies.
Activation of RCs and School Supervisors to maximize learning achievement and accuracy of statistics.
Activation of PTAs to engage parents.
Activation of SMC, PTAs, students clubs, reading clubs, teacher subject clubs etc. to maximize school performance.
Guidelines for the management of school employees should be prepared so that their career paths become clear.
Provision of grants to manage school employees has been made. Sufficient budget should be allocated for this purpose.
Many Districts started team monitoring/supervision focusing on utilization of grants in schools. This initiative made schools aware of the need to use the available grants in specified work.
Status Report -2015 Page 182
PART III
COMPLEMENTARY INTERVENTIONS
3.1 National Early Grade Reading Programme
3.1.1 Introduction
Implementation of the School Sector Reform Progarmme since 2009 has demonstrated that
acceptable achievement has been attained in education access especially in Primary enrolment
and girls' enrollment ratios. But quality education is still an unfinished issue, and comprehensive
efforts to improve needs to be a major priority for the future direction of educational intervention.
As a part and partial programme recommended by the MTR 2012 and the SSRP, the Ministry of
Education has been implementing National Early Grade Programme (NEGRP) since 2014/15
for five years period.
3.1.2 Achievements
Starting last year, only some preparatory works have been carried out for building system
development necessary for implementing NEGRP. Several wider consultations and review of
the programme document have been carried out with development partners, civil societies and
other concerned stakeholders. Regional dissemination seminars on NEGRP, EGRA and NASA
reports have also been completed for Ministry system personnel, especially those working in the
Regional Education Directorates and District Education Offices (District Education Officers,
Programme Officers, School Supervisors, Resource Persons, Head Teachers, teachers and
SMC members) and also local CBO members.
In addition, three main assessments (TOS, EMES & EGRA) related to reading competency and
present system efficiency have been administered and disseminated to concernedld parties.
The tools of CB-EGRA have been adapted to the Nepalese context and finalized through the
related subject committee.
The reason behind the low achievements are as follows:
Late on-board of Technical team as agreed to provide by USAID
Lack of capacity building for implementing programmes
Late release of the budget (at the end of the 2nd trimester)
The earthquake of Baishakh 12, 2072 (April 2015)
3.1.3 Constraints
Lack of a capacity development plan
Duplication of programmes being implemented by different agencies- difficulties in
coordination
Medium of instruction & mother tongues
Budget release process
Lack of continuous professional development for teachers

Status Report -2015 Page 183
Inadequate monitoring, supervision and academic support
Management of resource teachers
Lack of supplementary materials especially for early grades
Distribution of supplementary materials
3.1.4 Lessons Learned
Since it is in the early stage of implementation, we need to wait to learn.
3.1.5 Reflection
After consultation and dissemination of programmes on NEGRP to stakeholders and
implementing agencies, the importance of reading programmes has been acknowledged and
policy and implemention aims to focus on reading in order to improve childrens learning.
3.2.2 Enhancing Vocational Education and Training (EVENT)
3.2.2.1 Introduction
EVENT was established with financial assistance from the World Bank to improve access to
quality training, facilitating the supply of skilled human resource as per demand of the job
market, and strengthening Technical Education and Vocational Training in Nepal. The duration
of this project is 2011-2015. The main objective of the project is to increase access to Techinical
Education and Vocational training for people from disadvantaged groups, females, Dalits, and
marginalized ethnic groups.
3.2.2.2 Achievements
Achievements made in FY 2014/15 are given in the following table:
Table No. 87, Achievements made in FY 2014/15
S.
N. Major activities
Target ( FY 2014/15) Commulative achievement
Physical Financial physical % Financial %
1 Skill test manager Training 100 1650 105 105 100
2 Skill test Assessors Training 1250 26600 1324 106 100
3 Master training 45 6700 45 100 100
4 Lead and Assistant Trainer training 600 24900 672 112 100
5 Matching grant 35 130000 35 100 59.82
6 Performance grant 60 213129 60 100 99.99
7 Provision of Scholarship for TSLC 15
AND 29 Months and Diploma 1500 38800 1268 84.53 94.80
8 Result based short term training 35000 311074 34429 98.37 99.98
9 Voucher based short term training 6000 96000 5939 98.98 92.32
10 Recognition of prior Learning 6000 16600 6320 103.78 89.5
11 Media campaign by NSTB for RPL 2 4900 2 100 73.19
12 Project management (technical
support 1 30000 2 100 19.46
13 Project management (Monitoring and
evaluation) 12 5000 12 100 77.52
14 MIS development 1 2000 1 100 33
Status Report -2015 Page 184
Component 1: Strengthening TEVT Regulatory Activities and Capacity
Development
The key achievements under this component are:
20 master trainer and 25 special master trainers were trained.
672 lead and assistant trainers were trained of the target 600.
105 skills test managers and 1,324 skills test assessors received training.
36 managers of TESP were given Training Institution Management Training.
18 curriculum experts were given on DACUM training.
21 Curriculums were revised and 6 curriculums were developed.
A firm has been hired to prepare integrated TMIS system for CTEVT (examination,
affiliation and TMIS).
Component 2: Strengthening Technical Education, Support for Short Term
Training and Recognition of Prior Learning.
Key Achievements for this component are as follows:
Matching and performance grants
35 technical schools received matching grants on the basis of their expenditure on
activities of IIP.
60 technical schools received performance grants on the basis of achieved performance
(enrollment of girls, Dalits, marginalized Janajaties, tracer study, pass rate increment,
establishment of counseling and placement cell etc)
Scholarships
663 TSLC 15 month and 172 TSLC 29 month students were selected for scholarships
which were deposited to their bank accounts.
172 Diploma level students received the 5th and 6th installments for their 3rd academic
year of study.
200 Diploma and 28 TSLC 29 month students received the 3rd and 4th installments for
their 2nd academic year.
RBST
5,731 trainees out of 6,924 (i.e. 83%) of RBST 1st round passed skills test exams
conducted
NSTB.

Status Report -2015 Page 185
6,284 trainees received employment out of 6,924 trainees trained in RBST 1st round and
gainful employment was 71 percent against the claim.
61 training and employment service providers (TESPs) signed agreements and
conducted RBST 2nd rounds in 44 Districts.
14,715 trainees enrolled for RBST 2nd round and 14,324 trainees attended the skills
test.
90 EOI were collected, 71 institutions were shortlisted for results based short term
training in FY 2070/71.
VBST
612 trainees out of 938 (i.e. 65%) of VBST 1st round passed skills test exams conducted
by NSTB.
777 trainees received employment out of 938 trainees trained in VBST 1st round.
Employment percent was 67 against the claim.
32 training and employment service providers (TESPs) were enlisted for Voucher based
short term training and 30 TESPs conducted VBST 2nd.
4,653 trainees enrolled for voucher based short term training 2nd round and 4,465
trainees attended the skills test.
25,134 applications were collected, 11,740 candidates were short listed for interview,
8,837 candidates were selected.
Three days ''TESP and occupation selection fair (MELA)'' was delivered on 25, 26 and
27 Magh 2070 (7, 8 and 9 February 2014).
4,692 trainees took vouchers and enrolled in 30 TESPs in 3 Districts for 31 different
occupations.
Recognition of Prior learning and media campaign.
6,320 youths participated in skills tests for recognition of prior learned skill.
A media campaign for results based and voucher based short term training and
scholarship was conducted.
Workshops and Monitoring
Monitoring and evaluation of implemented activities were completed.
Regional workshops (monitoring workshops and database workshops, scholarships, joint
monitors workshop, workshops for PG/MG, tripartite interaction with
TESP/Monitors/EVENT PS) and meetings were conducted,
72 monitoring officers (members of District monitoring teams) were oriented on results
based short term training monitoring system s.

Status Report -2015 Page 186
Component 3: Project Management, Monitoring and Evaluation (Procurement of
Goods and Operational Expenses)
Under this component, running of PS and staffing were the focus. The component dealt with
printing of brochures/PIM, calendars, update of Project websites and MIS, as well as
procurement of furniture and fixtures, and electronic equipment. The major achievements for
under this component are:
The Project Secretariat implemented planned activities,
Brochures, posters, and trainee selection guidelines were printed and distributed,
Matching grant, performance grant and ESMF manuals were printed and distributed
EVENT website was updated,
Development and update of various software for PS was completed.
MIS and database system were upgraded and updated,
Component 4: Project Management (Consultant cost, training and workshop),
Monitoring and Evaluation
Under this component, hiring consultants and midterm reviews and researches were targeted in
the second trimester. The major achievements for this component are:
6 consultants hired to support the PS for Procurement, FM, Vocational Training
facilitation, and M & E related tasks,
The monitoring of project activities was conducted,
The third Joint Review Consultation Meeting was completed.
3.2.2.3. Lesson Learned
Monitoring mechanisms (joint monitoring including the DEO, CTEVT/ETC/TECS, and
EF) have been effective.
The EVENT database system and FAMAS has accelerated the payment of various
installments to TESPs.
3.2.2.4. Key Challenges
Participation of target groups.
Coordination among implementing institutions.
Large number of institutions and TESP.
Capacity building of EVENT staff and District monitors.
Transfer of District monitors (DEO focal person).

Status Report -2015 Page 187
Expansion of the training program in remote areas.
Spending the matching funds by CTEVT constituent schools.
3.2.3 Technical Education in Community School (Annex Project)
3.2.3.1 Introduction
The Technical school programs attached to general Secondary schools are called TECS
(Annex) Programs. The TECS (Annex) program is an additional program, attached to general
(Higher) Secondary schools, which provide Technical Education and Vocational Training to
unemployed and none college bound/dropout youths through maximum utilization of existing
physical facilities, human resources and management of the high school.
The local School Management Committee (SMC) has authority to hire technical instructional
staff for TECS (Annex) Program, as stipulated by CTEVT. The committee can also terminate
staff if performance is not satisfactory. The TECS (Annex) Program is a community owned
technical education program operated and managed by the community. The headmaster of the
general school will be responsible for administration, and the SMC will be responsible body for
the management and operation of the program. The SMC is also responsible for creating a
Local Training Fund (LTF) by mobilizing local resources. The high school, with help of the local
community in the long run, is expected to contribute 50% of resources, for which the strong
commitment of people participating is essential. CTEVT will bear the remaining 50% of the
operational cost of TECS (Annex) Program.
Technical Education in Community Schools (formerly Annex Schools) started in FY 058/59, with
the purpose of expanding Technical Education and Vocational Training programs to remote
areas of the country. TECS was introduced on an experimental basis in 15 TECS (Annex)
schools (three in each development region), and evaluation of the effectiveness of the program
was carried out after five years, with findings showing the program is very effective within the
sector of technical education. According to the recommendations of the evaluation the program
should be expanded to all 75 Districts, but is currently running in 73 Districts, with the exception
of Manang & Mustang. The TECS program conducts classes in subjects such as Auto-
Mechanics, Mechanical (mechanical what?), Electrical (electric what? electronics?), Animal
Science, Plant Science, Civil (civil what?), and Information Technology. Each TECS (Annex)
program will provide needs-based short course training every year. Table 88 shows the general
schools that have been selected to operate the TECS (Annex) program.
Table No.88 TECS (Annex) School Status of FY 2014/2015
S.N Subject Number of
School
Affiliated
Program
Totalrunn
ing
Quota/
class
Total
Capacity
Diploma
Program
Quota
/class
Total
Capacity

Status Report -2015 Page 188
Program (students) (students)
1 Plant Science 32 17 49 40 1,960 15 40 600
2 Animal Science 8 10 18 40 720 3 40 120
3 Civil Engineering 9 2 11 40 440 5 48 240
4 Electrical Engineering 5 4 9 40 360 2 48 96
5 Computer (JCT) 17 2 19 40 760 5 48 240
6 Mechanical 1 0 1 24 24 0 0 0
7 Auto Mechanics 1 0 1 24 24 0 0 0
TSLC 73 35 108
4,288 30 1,296
DIPLOMA 1,296
Total 5,584
3.2.3.2 Major achievements
The TECS program provides access and opportunities to disadvantaged groups and those in
remote areas such as drop outs, the unemployed and underemployed, by providing Technical
Education in seven different trades across 73 Districts. Local people now have an opportunity to
develop their skills in technical education. It has changed socio-economic conditions of the
people and created employment and self- employment, and has also helped to increase
remittance on a small scale too.
Likewise, TECS graduates pass rate for fiscal year 2070/071 is 63%, an increase from the
previous years' 57% pass rate.
3.2.3.3 Constraints
While the TECS program has enabled access to otherwise deprived groups and provided many
opportunities, it also faces many constraints and challenges, such as:
i. Lack of budget
ii. Lack of instructors
iii. Lack of training for instructors
iv. Permanency of instructors
v. Lack of retention policy (allowances, incentives)
vi. Lack of latest technology, tools and equipment
vii. Lack of coordination between technical and general teachers
viii. Local training funds not created yet
ix. Communication gap between community and TECS school
x. Mismatched budget
xi. Mismatches in student enrollments
Way forward for better performance
Previous experience has led to the following observations as to ways forward for better
performance:
i. Sufficient budget allocation required
Status Report -2015 Page 189
ii. Requirement of motivation (retention plans, incentives, rewards, opportunities and
permanency)
iii. Requirement of well managed physical facilities, laboratory and field (for fieldwork)
iv. Requirement of trained instructors
v. Introduction of latest technology, tools and equipment
vi. Industry-based curriculum should be developed and implemented.
3.2.3.4 Lessons learned
During the 12-year period of TECS programming, some lessons learned are as follows:
i. Instructor retention plan and policy should be developed.
ii. Selection of school locations and programs should be needs based.
iii. TECS program should be situated near District headquarters.
iv. Curriculum modifications have been mismatched with jobs.
3.2.3.5 Reflection
Some of the reflections we have found from the community and TECS graduates are as follows:
i. Self-employment and employment
ii. Most graduates gained permanent Government jobs
iii. Change in socio-economic status
iv. High demand for the Vocational and Technical program: The western region has a
higher demand for Technical and Vocational Education than the eastern region.
v. Contribution to national GDP through remittances
vi. Support in poverty reduction.
3.3 UNESCO Supported Programmes
3.3.1 Introduction
UNESCO‟s education strategy consisted of supporting national efforts for achieving
goals and targets of Education for All (EFA) 2015, constantly moving towards
education sector development, addressing the education system holistically, including
early childhood development and pre-Primary; Primary/Basic; Secondary and Tertiary
education and EFA monitoring. Promoting Education for Sustainable Development
through inclusive lifelong learning with a focus on girls and women and disadvantaged
population groups through both formal and non-formal approaches is the policy
priority. Supporting the Literate Nepal Mission to ensure universal literacy through
mother tongue, with a focus on women's literacy is crucial. Capacity building in
diverse aspects of education is a further critical area of priority for comprehensive
education sector development.
3.3.2 Achievements
Following are the key achievements resulting from UNESCO‟s programmes in 2015:
3.3.2.1 Improving the Education Management Information System (EMIS) at

Status Report -2015 Page 190
DOE/MOE
Constantly supporting improvement of EMIS since 2004 with a view to enabling the
DOE/MOE to systematically monitor and evaluate the progress and achievements
with regard to EFA goals and targets was the most significant achievement. The
overall achievement in this area has been to support capacity development to
manage EMIS for school sector development in a better way, contributing to make
evidence-based decisions for credible planning, allocation of resources, monitoring
and reporting. A comprehensive M&E system, encompassing the whole education
sector, to systematically monitor the implementation of education policies, strategies
and programmes, including classroom teaching and learning assessment, capable of
assessing the entire sector performance is crucial. Some of the significant needs and
areas requiring further support are:
Improve EMIS for the whole education sector, including better disaster
management before, during and after the event;
Capacity building of key education officials in policy planning, monitoring and
evaluation for the entire education sector development, keeping in mind
Education 2030;
Establishment of a computerized information system for school records
management, starting with Secondary schools, gradually moving towards
Primary schools; and
Use education data in the enhancement of teaching and learning
achievements.
3.3.2.2 Literacy in mother tongue
UNESCO supported the NFEC/MOE in its Literate Nepal Mission to achieve universal
literacy within three years (2012-2015). In this regard, the Capacity Building for
Education for All (CapEFA) programme provided considerable support to ensure
literacy in the mother tongue (for instance, Maithili, Bhojpuri, Awadhi, etc.) through
CLCs; establishment of Non-formal Education Management Information System (NFE
MIS) and capacity development in data analysis and reporting with regard to the
status of literacy for all. Some of the pertinent needs and further areas requiring
support are:
Strengthen CLCs and extend comprehensive support to achieve Literacy for All
in the mother tongue, with a focus on women and disadvantaged social groups,
and
Establish a functional NFE MIS at NFEC, with linkages and integration to
comprehensive EMIS at DOE/MOE.
Status Report -2015 Page 191
Planning effective delivery of education in a federal state (April 2013 - October
2015)
The project, “Planning effective delivery of education in a federal state”, contributed to
peace building and making an education sector development process by organizing
informed discussions on various relevant educational themes. They are teacher
management and development; financing education; currculum and use of mother
tongue in teaching and learning; Technical and Vocational Education; etc. in federal
Nepal.
3.3.2.3 UNESCO’s response to post-earthquake activities included
Support to undertake Post-Disaster Needs Assessment with regard to
education,
Providing education in emergencies – A self study book for NFE learners
through CLCs,
Providing immediate psychosocial support to parents and community members
through CLCs,
Developing a community based Disaster Risk Reduction Management (DRRM)
toolkit on preparedness and prevention (ongoing), and
Integration of DRR in school curricula (ongoing)
3.3.2.4 USE of ICT in education development included:
Developing an ICT competency framework for teachers in view of the ICT
Master Plan in Education;
A Study on ICT readiness of schools in Nepal; and
Use of ICT in classroom teaching and learning assessment
3.3.2.5 Empowering adolescent girls and women: Promoting equitable
education, literacy and lifelong learning (Malala Funds for Girls’
Education) included:
Providing training to female Head/teachers on leadership, gender equity,
countering violence and sexual harassment both inside and outside of schools,
Organizing FM Radio technicians training for neo-literate adolescents, and
Providing life skills training to adolescent girls in and out of schools.
3.3.2.6 Supporting processes for post-2015 education development in Nepal
The project aimed to achieve:
Organizing informed discussions on the Incheon Declaration on Education
2030,
Reshaping the vision for education with a human rights perspective to “Ensure

Status Report -2015 Page 192
the provision of 12 years of publicly-funded, equitable quality Primary and
Secondary education, of which at least nine years are Free and Compulsory,
leading to relevant learning outcomes”, and
Supporting the preparation of a credible School Sector Development Plan
(SSDP), with new goals and targets for Education.
3.3.2.7 Inform policy through relevant research and study to develop national
capacities
In view of supporting national efforts to inform policies and strategies for ensuring
inclusive, quality Basic education for all, UNESCO organized a series of national and
regional consultations to develop national capacities on a variety of themes related to
education and federalism, as well as some other relevant research, study, review and
assessment, as follows:
Research and study on themes related to education and federalism in Nepal:
Proposing use of mother tongue in education;
Technical and Vocational Education and training;
Financing education in the federal system;
Adult and lifelong learning;
Curriculum in federalism;
Early childhood care and education (ECCE) in the federal system;
Managing Basic education; and
Teacher management and development within a federal system of government
in Nepal
Research and study conducted during 2014- 2015 (completed or ongoing):
Education for All: National Review Report 2001-2015 (completed);
Review of the right to education in Nepal (completed);
A comparative study on policies and practices on M&E of education systems: A
case study of Nepal in the Asia-Pacific Region (completed);
Improving cognitive development of students in public and private schools of
Nepal (ongoing);
Improving governance of Tribhuvan University to ensure quality higher
education (ongoing); and
Nepal: A country report on school finance in the Asia-Pacific Region (ongoing)
3.3.3 Constraints
No particular constraints have been observed during the design, implementation and
management of the programmes (this sentence is then followed by mention of several
particular constraints- doesn't make sense). Despite progress, one of the most
Status Report -2015 Page 193
common constraints is lack of women‟s effective participation in various interventions
that contribute to empower them to raise their voices. Concerted efforts are needed to
achieve sustainability in the pertinent programmes related to education sector
development. Other equally common constraints, such as unstable security situations
including strikes and protests, also weaken coordination between implementing
partners, affecting the timely implementation of activities.
3.3.4 Addressing Constraints and Maximizing Achievements
It has been frequently observed that the challenges that remain are more difficult. For
instance, one of the most complex challenges is that a large number of girls and
disadvantaged children, even if their percentage (percentage, as in numbers, in
society overall?) has been declining, remain excluded from the framework of
schooling. Most of the excluded belong to highly disadvantaged and marginalized
groups and generally live in hard to reach locations. Ensuring such girls and
disadvantaged children complete Basic education and move through Secondary and
Tertiary levels is not an easy task. It demands a better understanding of the complex
situation with respect to identifying and addressing constraints, and maximizing
achievements by designing more innovative strategies.
Exclusion from schooling is not just an event or a statistic; neither is it merely a
monetary decision, but a complex process involving many factors in the personal life
of the child and the family. When a girl drops of the school, many events precede
shaping the course of action – some concerning the family, some the community and
the peer group, and many involving the school where the girl is supposed to be
studying. Understanding exclusion demands exploring ups and downs in the personal
life history of the child. Such an exploration requires tracking children individually and
in groups as they join the school, move up through the grades or leave the school.
This is critical for building a comprehensive description of the complex processes
involved in exclusion and demarcation of the underlying causes to improve/promote
the situation aiming at maximizing achievement of universal Primary/Basic education
and literacy for all.
3.3.5 Lessons Learned
The Jomtiene (Thailand) and the Dakar (Senegal) decades (1990 -2015) provide a
clear path to proceed in addressing the issues of gender equality, social equity,
inclusion and quality in education at all levels. The processes to achieve the above
should be linked to local dynamics and parameters that surround girls and
disadvantaged children at home, in the community and at school. Support for these
children and girls needs to be for a sustained/constant period of time to transform the
events that surround their lives.
It should be noted that bringing all girls and disadvantaged children to school is not
Status Report -2015 Page 194
merely an educational action; it is an imperative aimed at transforming the attitude
and behavioral dynamics of society such that gender equality is considered as a value
to be pursued. This cannot be achieved by following 'business as usual' approaches
and/or implementing traditional short term programmes. Rather it demands sustained
and long term engagement between the state and Development Partners, including
UN agencies and I/NGOs as well as civil society.
3.3.6 Way Forward
Based on experience over the past two and half decades with regard to EFA from
1990 to 2015, and in view of shaping the new agenda for Education-2030, there is a
need to consider how successful interventions/experiences can continue to ensure
equity, inclusion and quality in overall education system development. Constructive
partnerships between government and Development Partners, including UN agencies,
need to be encouraged, promoted and sustained. In light of supporting the MOE, the
following points form the way forward, combining four priorities:
i) Broad investment to support, strengthen and develop education systems,
ii) A new set of equity-based indicators addressing each of the seven goals of
Education 2030, with a sharp focus on equity, inclusion and quality of
education at all levels,
iii) Targeted interventions with regard to pre-Primary, Primary/Basic,
Secondary and Tertiary education, especially for the children who are
hardest to reach, and
iv) An implementable action plan to ensure gender equality, with equal
participation of girls and women at all levels of education.
3.4 WFP Supported School Feeding Program
3.4.1. Introduction
Nepal is a landlocked country situated between India and China. People have low per
capita income. People in Nepal, especially in hilly and mountainous regions, are facing a
food deficit. About 22 percent of the 27 million population fall below the poverty line. One
third of the population consumes less than 2250 kilo calories a day.
The Food for Education Project operates under the Government of Nepal, Ministry of
Education with the support of the UN World Food Program. The UN World Food
Program launched in Nepal on 30th August 1967. In the past, the project delivered
programs providing nutritious food by way of day meals, girls‟ incentives and the MCHC
program in 36 Districts. Now it runs the project providing day meals in 10 selected
Districts, of which 7 Districts are in the Far- Western Region and 3 Districts are in the
Mid- Western Region.
Long term objectives of the project to increase access in Primary education, and the

Status Report -2015 Page 195
status of students‟ health and nutrition, will be improved especially in the Districts
experiencing food deficits, and in the having low access rates in education.
Short term objectives of the project are: to improve the enrollment and attendance rate
of students; to decrease dropout and bunking students; to increase the learning capacity
of students; to remove gender discrimination and maximize womens' (Mothers)
participation, with the joint efforts of school, family and community; and to help remove
the social stigma of 'untouchability'.
It also aims to bring qualitative and quantitative improvements to Primary education,
increasing girls‟ enrollment in community Primary schools and achieving sustainable
improvements in food security for the most disadvantaged groups, particularly women
and children in highly food insecure areas, mainly in the far and mid−western, hill and
mountain regions of Nepal.
Through the Extended Primary School Food Support Program, total student enrollment
rates, girl's enrollment rates, attendance rates and learning achievement rates
increased, and dropout and bunking rates decreased. With these results, the running
project was considered for extension from 2002 to December 2006, with additional
programs and with the name of Food for Education Project. For this, an agreement was
reached with the World Food Program in November 2002. The Food for Education
Program, Global Food for Education Program, MCHC Program and Girls‟ Incentive
programs were successfully and effectively conducted. As per the agreement, during
2007, except for the Global Food for Education Program, the other programs were
continuously implemented.
As per the agreement reached on the 26th September 2007 between the GoN and WFP,
the project was extended from 2008 to 2012 to provide day meals to 194,000 students.
In 2013, donor agency the WFP stated that day meals would continue for the fiscal year
2071/72 (2014/2015) for 194,000 students and the project would continue through to
2017. In the same way, the day meal program will continue to be delivered to 190,000
students for the fiscal year 2072/073 (2015-2016).
According to the program, per day, per student of each school, 110 grams of midday
meals consists of Corn and Soya Blend (CSB), flour (90 gm), sugar (10 gm,) and
ghee/oil (10 gm) and is prepared as a mid- day meal at each school to feed students. In
the CSB, the meals consist of 73 percent vitamins & minerals, oils (19 percent) and
sugar (8 percent) nutritional content and a student receives 470 calories (KCAL) from
the above combination.
3.4.2. Achievements
Midday Meals were provided for Grades 1-5 children of selected schools from 10
Districts (1,608 schools and 864 ECEDCSs). A bowl of Haluwa, a nutritious porridge-like
meal for children in Grades 1-5 (including ECEDCS) was provided.

Status Report -2015 Page 196
Table No. 89 Annual Progress Report of Day Meal Program F/Y 2071/72 (2014/2015)
S.
N. District
Midday meal
Target Progress %
1 Rukum 19,200 17,700 92
2 Dailekh 20,100 18,089 90
3 Dadeldhura 9,500 6,817 72
4 Doti 17,000 15,851 93
5 Achham 31,000 27,020 87
6 Baitadi 22,300 19,403 87
7 Darchula 11,200 9,181 82
8 Bajhang 26,200 19,189 73
9 Bajura 15,000 9,289 62
10 Jajarkot 22,500 22,145 98
Total 194,000 164,684 85
Total Program Budget (Rs.) 540,597,000.00 400,218,000.00 74
According to follow up studies:
i. Average daily attendance at program schools for boys: 93%
ii. Average daily attendance at program schools for girls: 97%
iii. Achievement of students increased significantly.
iv. Enrollment rates increased.
v. Gender and caste discrimination among students decreased.
vi. Hygiene and nutrition related awareness has increased among parents and
students.
3.4.3. Major problems
i. Transportation of food and other materials to remote areas is difficult due to
humidity in rainy season. Decaying of materials is another problem.
ii. Food was not available in accordance with the commitment of the donor
organization.
iii. Demand increased but availability decreased.
iv. Lack of continual support program.
v. Probable misuse of materials at grass roots level.
vi. Lack of proper incentives for FMC and SMCs; transportation of food, preparing
food management, and monitoring and supervision activities are not effective.
vii. Lack of awareness and ownership among local agencies, parents and schools.
.
3.4.4. Way forward for better performance
i. Day meal management committees and parents should be active.
ii. Parents should be active in preparing day meals on rotation.
Status Report -2015 Page 197
iii. DEOs should monitor and discuss day meal activities in regular program
implementation workshops.
iv. Sustainability of this program from concerned organizations is must.
v. Priority should be given to using local materials and foods.
vi. Parent's contributions and local sources such as schools internal sources,
community forests, VDCs, local NGOs, and personal donors may be sustainable
sources of day meals.
vii. Availability of proper incentives to concerned stakeholders.
viii. Capacity building programme should be launched for all female FMC
members.
ix. National and international exposure visit of FFEP staff.
3.4.5 Lesson Learned
i. Alternative food items should be provided to students as per their interests and
tastes.
ii. Along with the food programme, other programs like washing, cleanliness,
toileting, and sanitation should be launched simultaneously.
iii. Providing food is more effective than providing cash.
iv. In the context of Nepal, nutritious food programme's should be expanded in the
areas of low HDI and marginalized and disadvanged groups like Raute,
Kamlahari, Chepang, Dusad, Satar, Khatwe, Dhanuk, Chamar etc.
3.4.6. Reflection
i. Access of students to schools reduced dropouts learning achievement rates and
increased retention rates.
ii. After launching the FFEP, parents recognized the concept of providing essential
nutritious food to their children.
iii. Helped reduce poverty of parents.
(Source: Food for Education Project, MOE 2015)
3.5 International and National NGO Supported Programs (Excluding UNICEF)
SISM2 Project Status Report, 2014/15
3.5.1 Introduction
“Support for Improvement of School Management 1 (SISM1) as pilot project” was initiated with
the technical assistance of the Japan International Cooperation Agency (JICA), in February
2008 to February 2011 in Dhading and Rasuwa. The project promoted community management
and the School Improvement Plan (SIP) through strengthening the capacity of School
Management Committees', contributing to the improvement of access to quality Basic education
in Nepal. It has seen significant improvements to SIP formulation and updating with community
participation. Considering various best practices, lessons learned and experiences in

Status Report -2015 Page 198
institutional strengthening and capacity development for improving school-based management,
the DoE requested the Government of Japan (GoJ) provide technical assistance for expansion
of the SISM project as phase 2 (SISM2). As a result the project was implemented by the DOE
from June 2013 with the technical assistance of JICA. It was agreed that “the Project for
Support for Improvement of School Management Phase II (SISM2)” would be implemented from
June 2013 to June 2017.
3.5.2. Objective and Target Area
The overall objective of the project is to improve school-based management through further
verification, update and dissemination of the SISM Model, and ultimately to contribute to the
improvement of access to quality Basic education. SISM2 develops and disseminates a
practical, simple, user-friendly and implementable, refined SISM Model in all 75 District
Education Offices, the result of best practices in the 4 Testing Districts of Solukhumbu,
Rupandehi, Jumla and Doti during the first year of the project. It also aims to support teaching
and provision of learning materials to schools which were affected by the Gorkha Earthquake in
Sindhuli, Ramechhap and Okhaldhunga.
3.5.3. Overall Progress of the 2nd Project Year and the Gorkha Earthquake
As mentioned above, during the 1st Project Year, SISM2 achieved Output 2: “Effective and
practical model for training and monitoring mechanism/contents is validated in the target area”
as in the original SISM2 Project Design Matrix (PDM Version-0). In the 2nd Project Year, SISM2
continued its challenge to achieve the other two expected outputs: namely, “Output 1:
refinement of SISM Model” and “Output 3: capacity development of the Central/local education
authorities” mainly through nation-wide dissemination of “SISM Model” for revitalizing and
strengthening the SIP process.
Project Summary of SISM2
Overall Goal Access to and quality of school education is improved.
Project
Purpose
Schools are managed through the SIP process nationwide for improving
access to and quality of Basic education. Expected Outputs Output 1: Refined model to make effective use of the SIP process for improving access to and
quality of Basic education is developed.
Output 2: Effective and practical model for training and monitoring mechanism/contents is validated
in the target area.
Output 3: Capacity of Central and local education authorities to support school management through
SIP process is strengthened.
Output 4: Emergency support (providing teaching and learning materials) for all community schools
located in the three earthquake-affected Districts- Sindhuli, Ramechhap and Okhaldhunga- is
properly and timely executed based on the schools needs.
(Source: Extract from the SISM2 PDM)
1) The lessons learned from testing conducted in the first Project Year of SISM2 were
reflected in the revision of training materials
2) Adjustments to outlines of the training program to fit with the national dissemination plan
were completed.

Status Report -2015 Page 199
3) The national dissemination program was included in the Program Implementation
Manual (PIM), produced by DoE each year.
4) The key training materials, SIP Formulation Guidebook (SIP-FGB), SLW Manual and
SSA-Checklist as well as two supplementary materials were printed, distributed and
used during every level of ToT and at every school in 69 Districts.
5) Operational Guides (OGs) for conducting training at different levels were prepared and
used in every level of ToTs:
- Regional level ToT in 5 regional Educational Directorates.
- District level ToT in 69 Districts to prepare Resource Center workshops and School
level workshops.
6) Monitoring was conducted in the regular system as well as by the joint monitoring team
consisting of Counterpart officers and the SISM2 team.
District D-ToT RC-W Monitoring Review Meeting
DoE, RED, SISM2 T5, DEO, SISM2 T5, RED, DEO, SISM2
Dadeldhura 25 - 27 Dec 2014 - 19 July 2015
Kalikot 30 Jan -1 Feb 2015 - (Postponed)
Kapilbastu 3 - 5 Feb 2015 - 26 July 2015
Bhaktapur 29-31 Jan 2015 - 23 Sep 2015
Sankhuwasabha 6 - 8 Jan 2015 17 - 21 April 2015 (Postponed)
7) Education materials were provided to all community schools of Sindhuli, Ramechhap
and Okhaldhunga Districts as emergency support after the Gorkha Earthquake.
Findings in nation-wide dissemination of SISM Model are as follows;
- Schools have gradually realized that the SIPs are for schools, HTs and teachers, SMCs,
guardians, students and community members to develop a better educational environment.
- School-level Workshops (SLW) were effective in persuading school stakeholders that each
school needs the SIP. The fact that they had prepared the SIP helped them develop a
feeling of “OUR” school. After the workshops, some parents began to contribute to the
schools.
- Awareness created at the school level resulted in increased accountability of the SMC,
teachers and parents toward students.
- Resource mapping has been done very clearly.
- The schools have visualized their status through the SSA checklist.
- After the workshop stakeholders were more concerned about the quality of education than
infrastructure development while preparing the SIP.
- The stakeholders were aware of the SIP so they became very enthusiastic for their active
participation in SIP formulation.
3.6 Local Government Funded Interventions
3.6.1 Introduction
Status Report -2015 Page 200
Local bodies (DDC/Municipality/VDCs) have been contributing to the education sector in various
ways. These bodies have been assisting with; facilitators and supplementing teachers‟
remuneration in ECD centers and privately managed teachers in community schools; schools
physical facilities; block grants; and in many other ways. However, their contribution is not
properly recorded at the District level.
3.6.2 Achievements
All Districts were requested to include the contributions of local bodies, and I/NGOs to school
education in the District in their Status Reports. Most of them attempted to state the information
collectively in their reports and the initiations taken/contributions made by local bodies for school
education are stated below, though details of programs conducted and budgetary information
were not obtained as expected:
i. DEO Taplejung has carried out the survey in one municipality and 48 VDCs to
identify out-of-school children in collaboration with NGO and VDCs.
ii. DDC and VDCs have assisted ECD classrooms and provided extra incentives for
facilitators in Myagdi and many other Districts.
iii. In conjunction with VDC and political parties, school welcome and enrollment
campaigns have been effectively run in Panchthar District. Provision has been
made for retention of children in schools brought through FCBE as per the
provision of monitoring and strategy formulated by VDC meetings.
iv. CLCs have been established and are functioning in six VDCs in Mustang District.
DDC Mustang assisted in the development of school buildings and physical
infrastructure as well as assisting the scholarship programs. VDCs have provided
support for educational materials in DEO Mustang and many other Districts.
3.6.3 Constraints
There is no certainty of continued provision of assistance.
Coordination between the Ministry of Education and Ministry of Local Development is not
effective; expected contributions from local bodies are not always forthcoming.
3.6.4 Addressing Constraints and Maximizing Achievements
The initiation of coordination at local level (with DDC and I/NGOs working in the Districts) was
undertaken by different Districts.

Status Report -2015 Page 201
PART IV
MEETING MANDATORY REQUIREMENTS
4.1 Introduction
The GoN/MoE has been making considerable effort to achieve the SSRP goals. Bottom-up
approach of planning has been adopted. Schools at the grassroots level have been considered
core units in the formulation, update and implementation of the School Improvement Plan (SIP).
A large portion of the education budget has been channeled through school units via grants
under various headings and subheadings. In order to achieve the SSRP goals, objectives and
targets, several programs and activities with implementation strategies have been designed and
delivered from Central to grassroots level. Good governance, effectiveness and efficiency of
education service delivery, responsiveness, accountability, compliance of prevailing rules and
regulations, and other key areas have been identified as mandatory requirements. Carrying out
social and financial audits, preparation and implementation of the School Improvement Plan
(SIP) and provision of girls' toilets have been made mandatory at school level. Moreover, school
mapping, teacher deployment, provision of grants to schools in meeting the PMECs, and
monitoring and reporting are some of the mandatory requirements associated with the
implementation of program activities.
4.2 Status of Implementation
Resource allocation is on a priority basis, with regular follow up technical backstopping to the
Districts being undertaken to meet the aforementioned mandatory requirements. The overall
status of implementation of mandatory requirements is summarized in the table below:
Table No. 90 Status of implementation against mandatory requirements
SN Mandatory Requirements Status of Implementation
Carrying out social and financial
audits
Education Rules have made provision for parent teacher associations (PTA) to be
responsible for carrying out schools Social Audits once a year.
Carrying out Social Audits continues based on the School Social Audit Manual that
was developed in 2009. Schools are encouraged and empowered to maintain the
accounts for financial transactions at the school level guided by the School
Accounting Manual that was developed in 2009.
Carrying out and submission of the School Social Audit report by schools to the
DEO has been made mandatory and linked with the first trimester school grants
release.
Most of the schools carried out the Social Audits annually.
Budget has been allocated to schools annually to carry out financial audits.
Financial and Social Audits have been made mandatory for every school and have
been institutionalized so as to receive grants and other support.
Provision of separate girls' toilets
Provision has been made for separate toilets for girls in the Child Friendly School
National Framework–2067 (2010) as one of important indicators for creating
enabling conditions in schools.
10,215 separate girls' toilets were constructed up to FY 2013/14. 2,280 girls'
toilets, of the target of 2,500, were constructed in FY 2014/15 to meet the PMEC in
schools. Altogether 12,495 separate girls' toilets were constructed. Still much
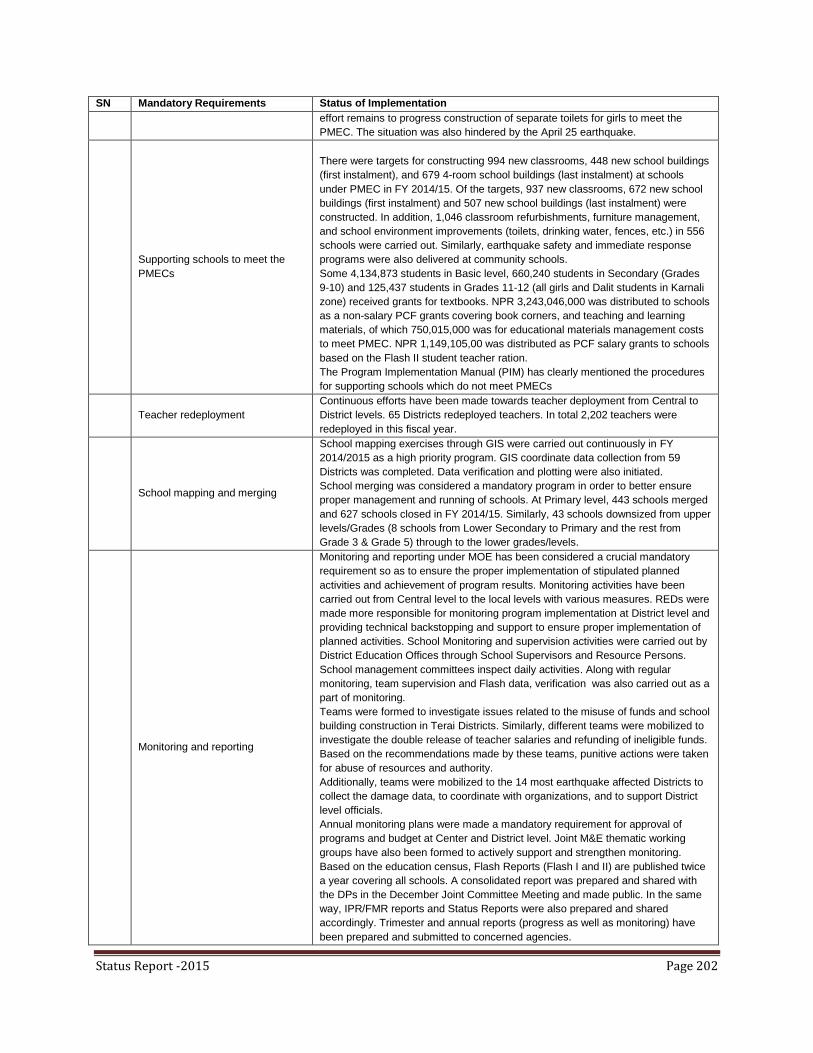
Status Report -2015 Page 202
SN Mandatory Requirements Status of Implementation
effort remains to progress construction of separate toilets for girls to meet the
PMEC. The situation was also hindered by the April 25 earthquake.
Supporting schools to meet the
PMECs
There were targets for constructing 994 new classrooms, 448 new school buildings
(first instalment), and 679 4-room school buildings (last instalment) at schools
under PMEC in FY 2014/15. Of the targets, 937 new classrooms, 672 new school
buildings (first instalment) and 507 new school buildings (last instalment) were
constructed. In addition, 1,046 classroom refurbishments, furniture management,
and school environment improvements (toilets, drinking water, fences, etc.) in 556
schools were carried out. Similarly, earthquake safety and immediate response
programs were also delivered at community schools.
Some 4,134,873 students in Basic level, 660,240 students in Secondary (Grades
9-10) and 125,437 students in Grades 11-12 (all girls and Dalit students in Karnali
zone) received grants for textbooks. NPR 3,243,046,000 was distributed to schools
as a non-salary PCF grants covering book corners, and teaching and learning
materials, of which 750,015,000 was for educational materials management costs
to meet PMEC. NPR 1,149,105,00 was distributed as PCF salary grants to schools
based on the Flash II student teacher ration.
The Program Implementation Manual (PIM) has clearly mentioned the procedures
for supporting schools which do not meet PMECs
Teacher redeployment
Continuous efforts have been made towards teacher deployment from Central to
District levels. 65 Districts redeployed teachers. In total 2,202 teachers were
redeployed in this fiscal year.
School mapping and merging
School mapping exercises through GIS were carried out continuously in FY
2014/2015 as a high priority program. GIS coordinate data collection from 59
Districts was completed. Data verification and plotting were also initiated.
School merging was considered a mandatory program in order to better ensure
proper management and running of schools. At Primary level, 443 schools merged
and 627 schools closed in FY 2014/15. Similarly, 43 schools downsized from upper
levels/Grades (8 schools from Lower Secondary to Primary and the rest from
Grade 3 & Grade 5) through to the lower grades/levels.
Monitoring and reporting
Monitoring and reporting under MOE has been considered a crucial mandatory
requirement so as to ensure the proper implementation of stipulated planned
activities and achievement of program results. Monitoring activities have been
carried out from Central level to the local levels with various measures. REDs were
made more responsible for monitoring program implementation at District level and
providing technical backstopping and support to ensure proper implementation of
planned activities. School Monitoring and supervision activities were carried out by
District Education Offices through School Supervisors and Resource Persons.
School management committees inspect daily activities. Along with regular
monitoring, team supervision and Flash data, verification was also carried out as a
part of monitoring.
Teams were formed to investigate issues related to the misuse of funds and school
building construction in Terai Districts. Similarly, different teams were mobilized to
investigate the double release of teacher salaries and refunding of ineligible funds.
Based on the recommendations made by these teams, punitive actions were taken
for abuse of resources and authority.
Additionally, teams were mobilized to the 14 most earthquake affected Districts to
collect the damage data, to coordinate with organizations, and to support District
level officials.
Annual monitoring plans were made a mandatory requirement for approval of
programs and budget at Center and District level. Joint M&E thematic working
groups have also been formed to actively support and strengthen monitoring.
Based on the education census, Flash Reports (Flash I and II) are published twice
a year covering all schools. A consolidated report was prepared and shared with
the DPs in the December Joint Committee Meeting and made public. In the same
way, IPR/FMR reports and Status Reports were also prepared and shared
accordingly. Trimester and annual reports (progress as well as monitoring) have
been prepared and submitted to concerned agencies.

Status Report -2015 Page 203
4.3 Addressing Constraints and Maximizing Achievements
The MOE is committed and has been directing its efforts towards fulfilling the aforementioned
mandatory requirements. However, there are certain obstacles to attaining the goals.
The PTA was given the responsibility of carrying out the Social Audit every year at school level.
The existing capacity of PTA members to carry out Social Audits as per intent seems to be
inadequate.
Many schools do not have separate personnel to look after financial and other
administrative transactions. Despite efforts made by the MoE/DoE in providing simplified
school account keeping manuals and carrying out capacity development activities with the
Head Teacher and account keeping personnel, some schools were unable to keep school
records properly.
The April earthquake severely damaged school infrastructure (classrooms, toilets, drinking
water facilities, etc.), which has had a serious effect on meeting PMEC in schools.
Teacher's deployment and redeployment at national level has not been taking place
properly.
Despite increased emphasis on monitoring and evaluation, it has not been closely linked
with results from Center to local level. Renewed effort needs to be made to develop a
results-based monitoring mechanism and specific monitoring tools.
Due to capacity constraints among personnel from Center to District level, school mapping
exercises have not occurred, and therefore have not linked with the robust system of EMIS
or merger and establishment of schools.
The Way Forward
The capacity development framework has to be linked to minimizing capacity gaps among
personnel from Center to local level, with special focus on Head Teachers, teachers, SMC
and PTA members.
The existing policy and mechanism of selecting an independent auditor for school auditing
needs to be revisited.
GIS based school mapping exercises need to be finalized and should be made fully
functional, linking with the existing EMIS. Teacher deployment programmes must be seen
to be urgent so that available resources will be redistributed and reallocated properly.
Monitoring and evaluation systems should be made more functional and results based at
various levels; they need to be focused more on the support system that plays a vital role in
implementing education programs effectively and efficiently. Transparency and good
governance can be ensured through effective monitoring. To maximize the opportunity of
meeting all these requirements, monitoring and support systems should be strengthened.

Status Report -2015 Page 204
PART V : CONCLUSION
The School Sector Reform Program and EFA, BPEP, TEP, and SESP alike, have been
implemented together with the joint effort of Government and various Development Partners
through pooled and non-pooled financing modalities. The pooled fund is guided by the Joint
Financial Arrangement (JFA), agreed upon GoN and pooled financing Development Partners
(DPs): ADB, Aus-Aid, EC, Denmark, Finland, Norway, UK, UNICEF, and WB. The non-pooled
funding DPs are the Government of Japan, UNESCO, UNICEF, USAID and WFP. For the
preparation, implementation, monitoring, supervision and reporting of SSRP activities, the DOE
coordinated the Central level educational agencies: the National Center for Educational
Development (NCED), Curriculum Development Center (CDC), Office of the Controller of
Examination (OCE), Non-formal Education Center (NFEC), Higher Secondary Education Board
(HSEB) and Council for Technical Education and Vocational Training (CTEVT).
The SSRP focused on quality education by improving learning achievement of students through
improved teaching and learning activities. In order to assure quality, teacher's professional
development, restructuring and revisiting RC's functions and responsibilities, and capacity
development at all levels, particularly at the local level, has been the main priority of the SSRP,
which was clearly reflected in ASIP/AWPB. Similarly, out-of-school children are of major
concern for the Ministry. By way of addressing these issues an Integrated Strategy for OOSC
has been prepared, and important activities like; operation of mobile schools; alternative
education programs; Open schools, SOP and FSP and mainstreaming of religious schools have
been implemented.
The ECEDCS program has contributed to reducing dropout rates and to increasing retention in
Grade I. Likewise, various scholarship schemes have been instrumental in mainstreaming hard-
core group children in schools. The increasing NER has proved this fact. The concept of Child
Friendly Schools (CFS) is being implemented following the Child Friendly School National
framework. Similarly, special attention has been given to ensure Prioritized Minimum Enabling
Conditions (PMECs) in schools. The budget has been substantially increased for this purpose
across all levels from ECD to Grade 12.
The FY 2014/2015 budget release for the last trimester of the fiscal year was delayed. Despite
these adverse circumstances the Physical and Financial Progress, in given program activities,
made by the Districts during FY 2014/2015 remained encouraging. Ownership of educational
programs was raised through dissemination of the annual budget to programs and participating
stakeholders for planning and implementation. Media mobilization, publication of bulletins and
reports, increased financial and Social Audits, reporting and dissemination and use of web sites
were some good interventions made to maintain transparency and accountability in educational
governance. Furthermore, joint monitoring, mobile SMS monitoring, team supervision systems
undertaken at District and Center level, use of ICT to stream and share information on
educational activities, involvement and mobilization of concerned agencies and issue based
monitoring have been instrumental in improving monitoring and reporting. Similarly, coordination
through mobilization of local bodies (VDC/MC/DDC), partnerships with I/NGOs and CBOs and
mobilization of CLCs seemed both encouraging and satisfactory.

Status Report -2015 Page 205
Despite the aforementioned achievements, there are still some challenges. About 4.7% of
school age children are still out-of-school. They belong to the hard core group families and
communities. It is a major challenge to bring them into the system. The pass rate of SLC
examinations is far below the target set by the SSRP. Quality and achievement levels in school
education are not acceptable. The major prevalent challenges regarding implementing SSRP
are; materials support and retention of ECD facilitators; raising ownership in ECD from
concerned agencies; mainstreaming OOSC; Head Teacher/teacher management; increasing
effectiveness of Social Audits/account keeping in schools; availability of science and math
teachers with licenses especially in remote areas; capacity development for implementing ICT in
education; support to implement FCBE in Districts; on-time budget allocation to Districts and
schools; ensuring the quality of school construction and participation of the community in
construction, and ensuring minimum enabling conditions in all schools with child friendly
environments.
Taking the aforementioned challenges into account, various efforts were made during FY
2014/2015, such as:
- Identification of out-of-school children and preparation of a strategy paper to mainstream them
in school education
- Strengthening school supervision
- Software based financial management
- Maintaining ownership and transparency
- Provision of budget for innovative works
- Mobilization of a joint monitoring system
- Making commitments at Central and District level for educational improvement
- Free and Compulsory Basic education program
- Grant support to schools for learning materials to meet PMEC (from ECD to
Secondary level)
- Mandatory provision for social and financial audits
- Target setting for students learning achievement
- Textbook printing and distribution action plan prepared and implemented
- Collaboration and coordination at local and Central level
- Effective implementation of a child friendly school national framework
- Day meal program in targeted Districts
- Various kinds of scholarships.
Overall Achievement against National Key Performance Indicators (KPIs) from 2007-08 to
2015-016
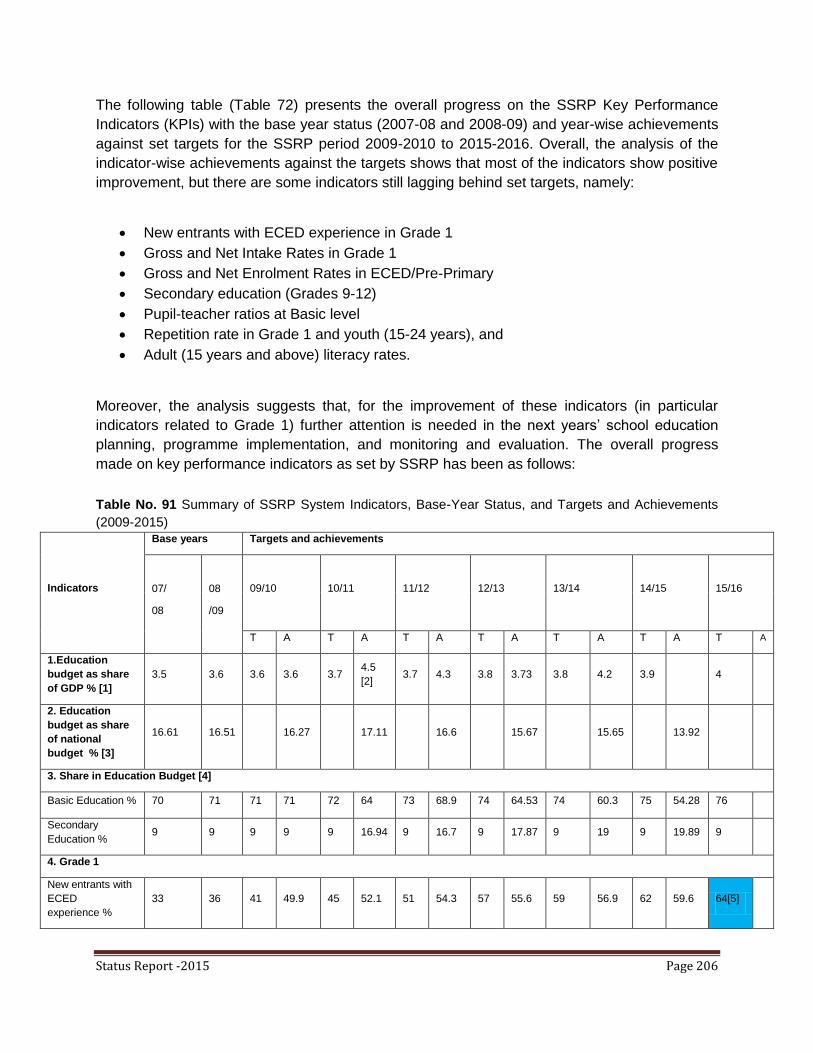
Status Report -2015 Page 206
The following table (Table 72) presents the overall progress on the SSRP Key Performance
Indicators (KPIs) with the base year status (2007-08 and 2008-09) and year-wise achievements
against set targets for the SSRP period 2009-2010 to 2015-2016. Overall, the analysis of the
indicator-wise achievements against the targets shows that most of the indicators show positive
improvement, but there are some indicators still lagging behind set targets, namely:
New entrants with ECED experience in Grade 1
Gross and Net Intake Rates in Grade 1
Gross and Net Enrolment Rates in ECED/Pre-Primary
Secondary education (Grades 9-12)
Pupil-teacher ratios at Basic level
Repetition rate in Grade 1 and youth (15-24 years), and
Adult (15 years and above) literacy rates.
Moreover, the analysis suggests that, for the improvement of these indicators (in particular
indicators related to Grade 1) further attention is needed in the next years‟ school education
planning, programme implementation, and monitoring and evaluation. The overall progress
made on key performance indicators as set by SSRP has been as follows:
Table No. 91 Summary of SSRP System Indicators, Base-Year Status, and Targets and Achievements
(2009-2015)
Indicators
Base years Targets and achievements
07/
08
08
/09
09/10 10/11 11/12 12/13 13/14 14/15 15/16
T A T A T A T A T A T A T A
1.Education
budget as share
of GDP % [1]
3.5 3.6 3.6 3.6 3.7 4.5
[2]
3.7 4.3 3.8 3.73 3.8 4.2 3.9 4
2. Education
budget as share
of national
budget % [3]
16.61 16.51 16.27 17.11 16.6 15.67 15.65 13.92
3. Share in Education Budget [4]
Basic Education % 70 71 71 71 72 64 73 68.9 74 64.53 74 60.3 75 54.28 76
Secondary
Education % 9 9 9 9 9 16.94 9 16.7 9 17.87 9 19 9 19.89 9
4. Grade 1
New entrants with
ECED
experience %
33 36 41 49.9 45 52.1 51 54.3 57 55.6 59 56.9 62 59.6 64[5]

Status Report -2015 Page 207
Gross Intake Rate
% 141 148 144 144 140 142.4 137 140.7 133 137.7 137[6] 141.8 135 137 133
Net Intake Rate % 78 81 83 86.4 86 89 88 90.7 91 91.2 94 91.6 95 93 96
5. Gross Enrolment Rate
ECED/Pre-
Primary % 60 63 67 66.2 72 70 77 72.9 78 73.7 79 76.7 80 77.7 82 [7]
Primary education
% 142.8 141.4 139.5 135.9 130.1 135 136.8 133 134.4 131
Basic education %
[6] 116 123 125 123.3 128 124.4 130 123.7 132 120.1 122 115.7 121 117.1
115
[8]
Grades 9-10 % 65.7 66.3 70.1 71.7 73 68.7 76 70.1 80
Grades 11-12 % 23.6 26 28.9 31.6 34 32 37 32.9 40
Secondary
education % [6] 36 40 43 44.7 47 46.2 52 49.4 53 51.7 55 50.4 58 51.6 61[9]
Table No. 92: Summary of the SSRP Key Performance Indicators (base year status, progress
status and targets)
Indicators
Base years Targets and achievements
07/
08
08
/09
09/10 10/11 11/12 12/13 13/14 14/15 15/16 09/10 10/11 11/12 12/13 13/14 14/15
T A T A T A T A T A T A T A
6. Net Enrolment Rate
Primary
education % 89 92 94 93.7 96 94.5 97 95.1 98 95.3 96 95.6 98 96.2
100
[10]
Basic
education % 71 73 75 83.2 77 86 80 86.6 82 87.5 87.7 86.3 88 87.6
90
[11]
Grades 9-10
% 40.8 46.5 52.1 54.3 56 54.9 57 56.1 60
Grades 11-12
% 6.8 7.8 9.4 10.4 15 11.5 17 13.1 20
Secondary
education % 20 21 22 23.9 23 27.1 24 30.6 26 32.4 35 33.2 38 34.7
40
[12]
7. Gender Parity Index
Primary based
on NER 0.98 0.98 0.99 0.99 0.99 0.99 0.99 0.99 1.00
Basic based
on NER 0.99 0.98 0.99 0.99 0.99 1.00 0.99 1.00 1.00
Secondary
based on NER
(G9-12)
0.98 0.98 0.99 0.99 0.99 1.00 0.99 1.00 1.00
8. Teacher with required qualification and training
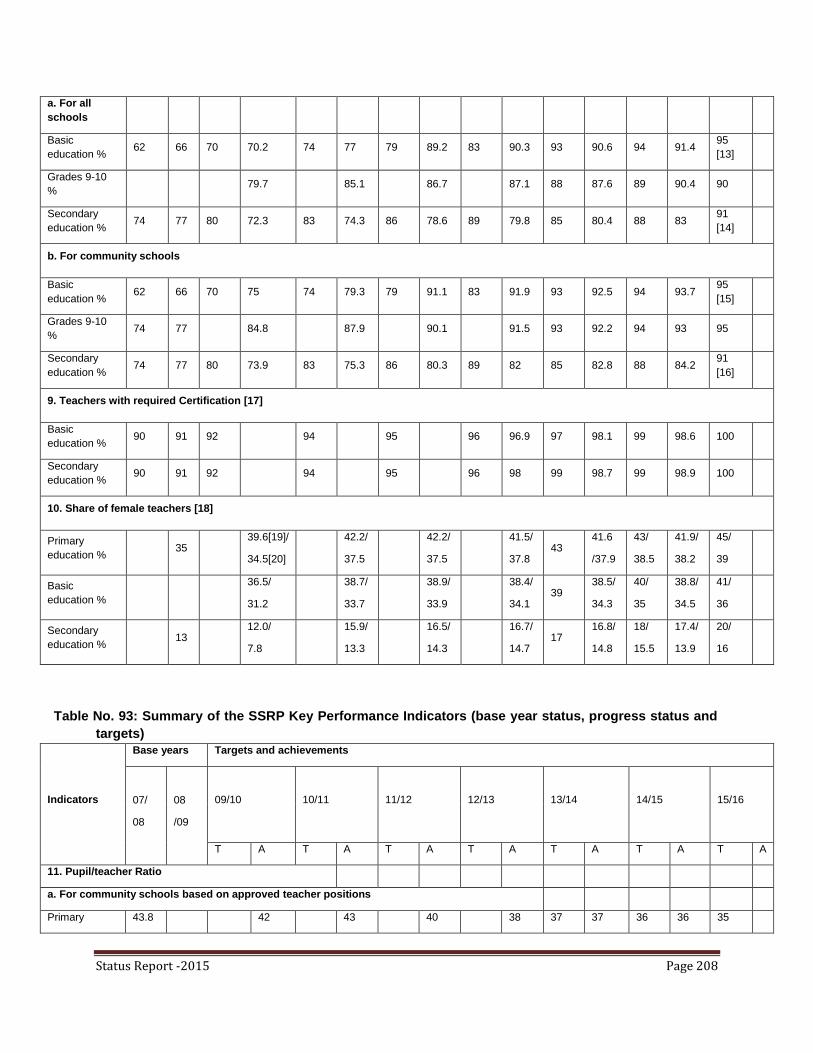
Status Report -2015 Page 208
a. For all
schools
Basic
education % 62 66 70 70.2 74 77 79 89.2 83 90.3 93 90.6 94 91.4
95
[13]
Grades 9-10
% 79.7 85.1 86.7 87.1 88 87.6 89 90.4 90
Secondary
education % 74 77 80 72.3 83 74.3 86 78.6 89 79.8 85 80.4 88 83
91
[14]
b. For community schools
Basic
education % 62 66 70 75 74 79.3 79 91.1 83 91.9 93 92.5 94 93.7
95
[15]
Grades 9-10
% 74 77 84.8 87.9 90.1 91.5 93 92.2 94 93 95
Secondary
education % 74 77 80 73.9 83 75.3 86 80.3 89 82 85 82.8 88 84.2
91
[16]
9. Teachers with required Certification [17]
Basic
education % 90 91 92 94 95 96 96.9 97 98.1 99 98.6 100
Secondary
education % 90 91 92 94 95 96 98 99 98.7 99 98.9 100
10. Share of female teachers [18]
Primary
education % 35
39.6[19]/
34.5[20]
42.2/
37.5
42.2/
37.5
41.5/
37.8 43
41.6
/37.9
43/
38.5
41.9/
38.2
45/
39
Basic
education %
36.5/
31.2
38.7/
33.7
38.9/
33.9
38.4/
34.1 39
38.5/
34.3
40/
35
38.8/
34.5
41/
36
Secondary
education % 13
12.0/
7.8
15.9/
13.3
16.5/
14.3
16.7/
14.7 17
16.8/
14.8
18/
15.5
17.4/
13.9
20/
16
Table No. 93: Summary of the SSRP Key Performance Indicators (base year status, progress status and
targets)
Indicators
Base years Targets and achievements
07/
08
08
/09
09/10 10/11 11/12 12/13 13/14 14/15 15/16
T A T A T A T A T A T A T A
11. Pupil/teacher Ratio
a. For community schools based on approved teacher positions
Primary 43.8 42 43 40 38 37 37 36 36 35
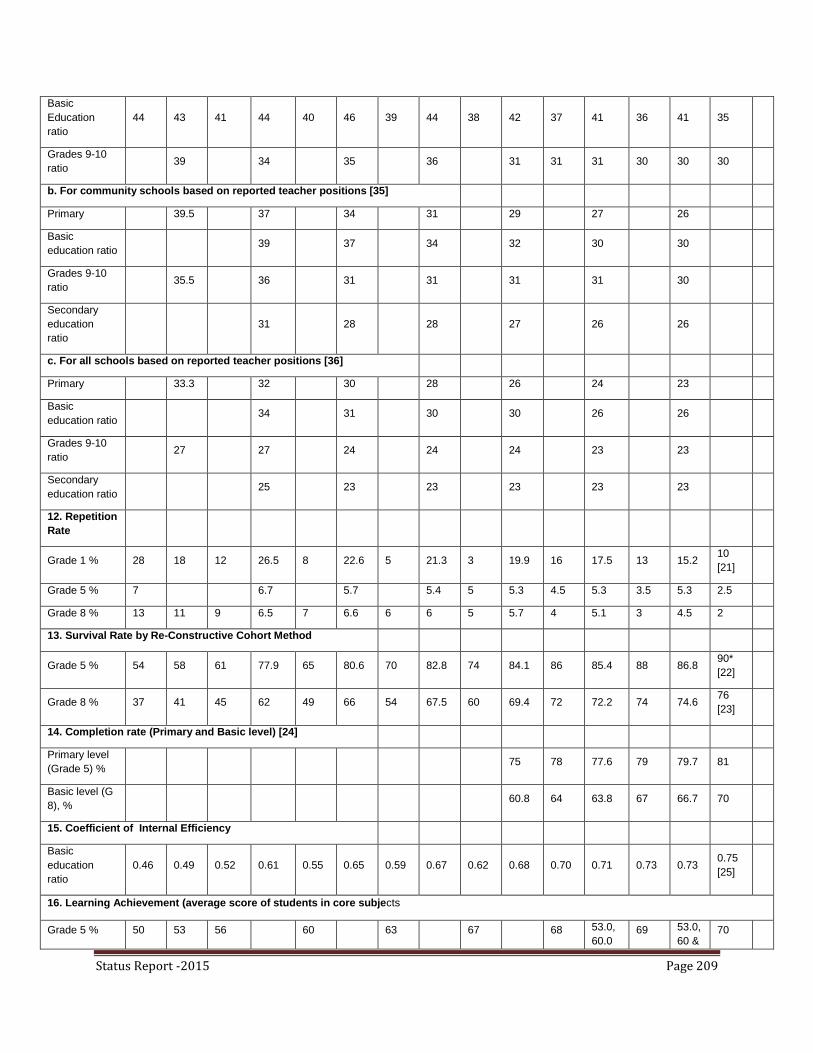
Status Report -2015 Page 209
Basic
Education
ratio
44 43 41 44 40 46 39 44 38 42 37 41 36 41 35
Grades 9-10
ratio 39 34 35 36 31 31 31 30 30 30
b. For community schools based on reported teacher positions [35]
Primary 39.5 37 34 31 29 27 26
Basic
education ratio 39 37 34 32 30 30
Grades 9-10
ratio 35.5 36 31 31 31 31 30
Secondary
education
ratio
31 28 28 27 26 26
c. For all schools based on reported teacher positions [36]
Primary 33.3 32 30 28 26 24 23
Basic
education ratio 34 31 30 30 26 26
Grades 9-10
ratio 27 27 24 24 24 23 23
Secondary
education ratio 25 23 23 23 23 23
12. Repetition
Rate
Grade 1 % 28 18 12 26.5 8 22.6 5 21.3 3 19.9 16 17.5 13 15.2 10
[21]
Grade 5 % 7 6.7 5.7 5.4 5 5.3 4.5 5.3 3.5 5.3 2.5
Grade 8 % 13 11 9 6.5 7 6.6 6 6 5 5.7 4 5.1 3 4.5 2
13. Survival Rate by Re-Constructive Cohort Method
Grade 5 % 54 58 61 77.9 65 80.6 70 82.8 74 84.1 86 85.4 88 86.8 90*
[22]
Grade 8 % 37 41 45 62 49 66 54 67.5 60 69.4 72 72.2 74 74.6 76
[23]
14. Completion rate (Primary and Basic level) [24]
Primary level
(Grade 5) % 75 78 77.6 79 79.7 81
Basic level (G
8), % 60.8 64 63.8 67 66.7 70
15. Coefficient of Internal Efficiency
Basic
education
ratio
0.46 0.49 0.52 0.61 0.55 0.65 0.59 0.67 0.62 0.68 0.70 0.71 0.73 0.73 0.75
[25]
16. Learning Achievement (average score of students in core subjects
Grade 5 % 50 53 56 60 63 67 68 53.0,
60.0 69 53.0,
60 & 70
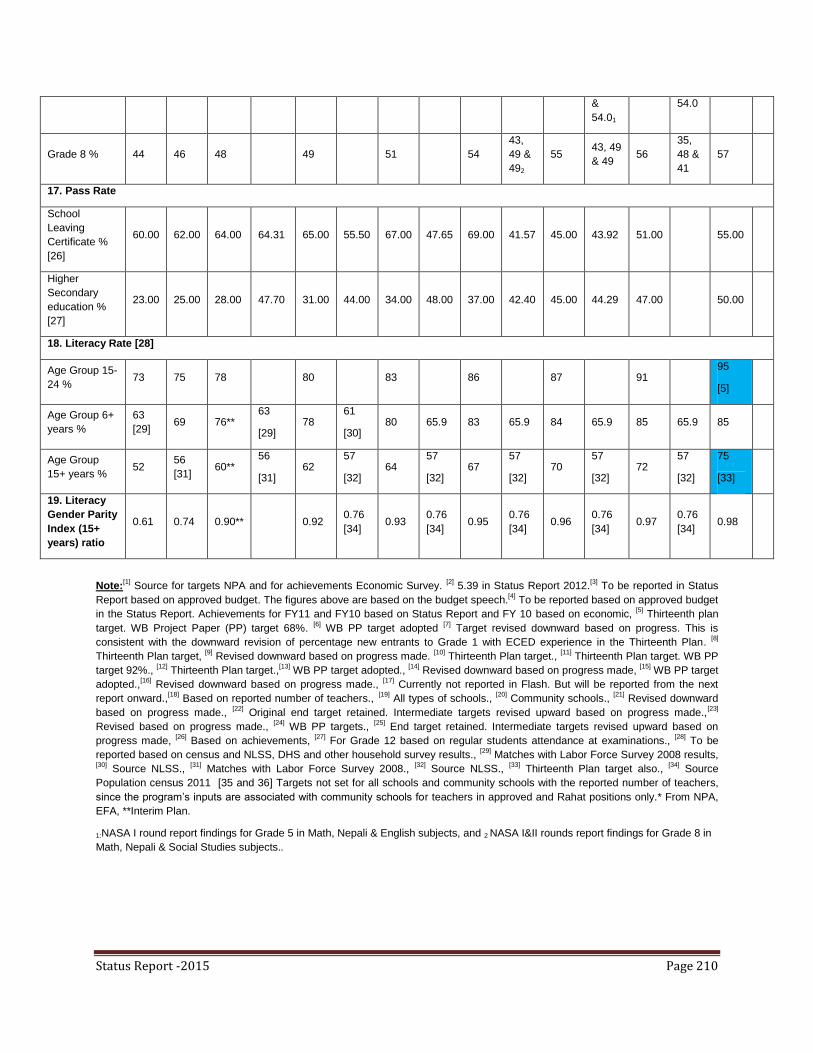
Status Report -2015 Page 210
&
54.01
54.0
Grade 8 % 44 46 48 49 51 54
43,
49 &
492
55 43, 49
& 49 56
35,
48 &
41
57
17. Pass Rate
School
Leaving
Certificate %
[26]
60.00 62.00 64.00 64.31 65.00 55.50 67.00 47.65 69.00 41.57 45.00 43.92 51.00 55.00
Higher
Secondary
education %
[27]
23.00 25.00 28.00 47.70 31.00 44.00 34.00 48.00 37.00 42.40 45.00 44.29 47.00 50.00
18. Literacy Rate [28]
Age Group 15-
24 % 73 75 78 80 83 86 87 91
95
[5]
Age Group 6+
years %
63
[29]
69 76** 63
[29]
78 61
[30]
80 65.9 83 65.9 84 65.9 85 65.9 85
Age Group
15+ years % 52
56
[31]
60** 56
[31]
62 57
[32]
64 57
[32]
67 57
[32]
70 57
[32]
72 57
[32]
75
[33]
19. Literacy
Gender Parity
Index (15+
years) ratio
0.61 0.74 0.90** 0.92 0.76
[34]
0.93 0.76
[34]
0.95 0.76
[34]
0.96 0.76
[34]
0.97 0.76
[34]
0.98
Note:[1]
Source for targets NPA and for achievements Economic Survey. [2]
5.39 in Status Report 2012.[3]
To be reported in Status
Report based on approved budget. The figures above are based on the budget speech.[4]
To be reported based on approved budget
in the Status Report. Achievements for FY11 and FY10 based on Status Report and FY 10 based on economic, [5]
Thirteenth plan
target. WB Project Paper (PP) target 68%. [6]
WB PP target adopted [7]
Target revised downward based on progress. This is
consistent with the downward revision of percentage new entrants to Grade 1 with ECED experience in the Thirteenth Plan. [8]
Thirteenth Plan target, [9]
Revised downward based on progress made. [10]
Thirteenth Plan target., [11]
Thirteenth Plan target. WB PP
target 92%., [12]
Thirteenth Plan target.,[13]
WB PP target adopted., [14]
Revised downward based on progress made, [15]
WB PP target
adopted.,[16]
Revised downward based on progress made., [17]
Currently not reported in Flash. But will be reported from the next
report onward.,[18]
Based on reported number of teachers., [19]
All types of schools., [20]
Community schools., [21]
Revised downward
based on progress made., [22]
Original end target retained. Intermediate targets revised upward based on progress made.,[23]
Revised based on progress made., [24]
WB PP targets., [25]
End target retained. Intermediate targets revised upward based on
progress made, [26]
Based on achievements, [27]
For Grade 12 based on regular students attendance at examinations., [28]
To be
reported based on census and NLSS, DHS and other household survey results., [29]
Matches with Labor Force Survey 2008 results, [30]
Source NLSS., [31]
Matches with Labor Force Survey 2008., [32]
Source NLSS., [33]
Thirteenth Plan target also., [34]
Source
Population census 2011 [35 and 36] Targets not set for all schools and community schools with the reported number of teachers,
since the program‟s inputs are associated with community schools for teachers in approved and Rahat positions only.* From NPA,
EFA, **Interim Plan.
1:NASA I round report findings for Grade 5 in Math, Nepali & English subjects, and 2 NASA I&II rounds report findings for Grade 8 in
Math, Nepali & Social Studies subjects..

Status Report -2015 Page 211
REFERENCES
CDC & MOE (2005). National curriculum framework for school education (Pre-Primary-12) in
Nepal. Sanothimi: CDC.
Central Bureau of Statistics (2004). Nepal living standard survey. Kathmandu: CBS.
Central Bureau of Statistics (2011). Preliminary census report. Kathmandu: Central Bureau of
Statistics.
DEOs & REDs (2014). Status Report. 75 Districts & 5 REDs.
Department of Education (2011). Status Report: Fiscal year (2010-2011). Sanothimi:
Department of Education.
Department of Education (2012). Status Report: Fiscal year (2011-2012). Sanothimi:
Department of Education.
Department of Education (2013). Status Report: Fiscal year (2012-013). Sanothimi: Department
of Education.
Department of Education (2013). Annual approved program and Budget, Fiscal year (2013-
2014). Sanothimi: DOE, Sanothimi, Bhaktapur.
Department of Education (2013). Annual strategic implementation plan, Annual work plan and
Budget, fiscal year (2013-2014). Sanothimi: DOE, Sanothimi, Bhaktapur.
Department of Education (2013). Monitoring report (2013-2014). Sanothimi: DOE, Sanothimi,
Bhaktapur.
Department of Education (2012). Financial monitoring report (2011-2012). Sanothimi: DOE,
Sanothimi, Bhaktapur.
Department of Education (2013). Financial monitoring report (2012-2013). Sanothimi: DOE,
Sanothimi, Bhaktapur.
Department of Education (2014). Financial monitoring report (2013-2014). Sanothimi: DOE,
Sanothimi, Bhaktapur.
Government of Nepal (1990). Basic and Primary education programme: Master plan.
Kathmandu: Ministry of Education.
Government of Nepal (2000). Local self-governance regulation. Kathmandu: Ministry of Local
Development.
Government of Nepal (2001). Education for all: National plan of action (2001-2015). Kathmandu:
Ministry of Education.
Government of Nepal (2002). Secondary education support programme (2002-2008): core
document. Kathmandu: Ministry of Education.
Government of Nepal (2003). Education for all programme (2004-2009): Core document.
Kathmandu: Ministry of Education.
Government of Nepal (2004). Strategy paper for early childhood development in Nepal.
Sanothimi: Department of Education, Bhaktapur.
Government of Nepal (1999). Local self-governance act. Kathmandu: Ministry of Local
Development.
Government of Nepal (2002). Human resource development plan (2002-2006). Kathmandu:
Ministry of Education.
Government of Nepal (2013). Mid-term evaluation of fiscal Year 2013/014. Kathmandu: Ministry
of Finance.
Status Report -2015 Page 212
Government of Nepal (2001). Education Act (with amendment). Kathmandu: Ministry of
Education.
Government of Nepal (2059). Education regulation (with amendment). Kathmandu: Ministry of
Education.
Government of Nepal (2006). National demographic and health survey. Kathmandu: Ministry of
Health and Population.
Government of Nepal (2010). EMIS Flash Report (2010-2011). Sanothimi: Department of
Education. Sanothimi, Bhaktapur.
Government of Nepal (2011). EMIS Flash Report (2011-2012). Sanothimi: Department of
Education. Sanothimi, Bhaktapur.
Government of Nepal (2012). EMIS Flash Report (2012-2013). Sanothimi: Department of
Education. Sanothimi, Bhaktapur.
Government of Nepal (2013). EMIS Flash Report (2013-2014). Sanothimi: Department of
Education. Sanothimi, Bhaktapur.
Government of Nepal (2014). Emis Flash Report (2014/2015). Sanothimi: Department of
Education. Sanothimi, Bhaktapur.
Government of Nepal (2007). Interim constitution of Nepal 2007. Kathmandu: GON.
Government of Nepal (2009). School Sector Reform Programme (2009-2015) core document.
Kathmandu: Ministry of Education.
Government of Nepal (2013). Budget speech: fiscal year (2013/014). Kathmandu: Ministry of
Finance.
Government of Nepal (2013). Economic survey: fiscal year (2013/014). Kathmandu: Ministry of
Finance.
Government of Nepal (2013). Flash Report (2013/014). Sanothimi: Department of Education.
Sanothimi, Bhaktapur.
Government of Nepal (2013-014). Non-Formal education in Nepal. Sanothimi: Non-formal
Education Center.
Government of Nepal (2014). Flash Report (2014-2015). Sanothimi: Department of Education.
DOE (2013). Annual strategic implementation plan (2013–014). Sanothimi: Department of
Education. Sanothimi: DOE, Sanothimi, Bhaktapur.
National Planning Commission (2007). Three-year interim plan (2007-2009). Kathmandu: NPC.
National Planning Commission (2070). Thirteenth five-year plan (2070/071-2072/073).
Kathmandu: NPC.
National Planning Commission (2007). Human development report. Kathmandu: NPC.
Poudyal, L. (2055BS). Educational process and education in Nepal (5thed.). Kathmandu: Web
printer's pvt. Ltd, Tahachal, Kathmandu, Nepal.

Status Report -2015 Page 213
Annex 1
Annual Program and Progress for School Sector Reform Program (District), FY. 2014/015
S.N. Program/ Activities Unit Annual Taeget 2071/072 Annual Progress 2071/072
Physical weight Budget Physical PPR Expenditu
re FPR Weightage
Capital cost (3508034)
0.43
78,299.00
84.89
51,780.65
66.13 0.36
Ensuring access to school education
0.43
78,299.00
84.89
51,780.65
66.13
0.36
Physical facilities improvement
0.43
78,299.00
84.89
51,780.65
66.13 0.36
8.3.4.1 Furniture for DEO and RED
DEO/RED
30.00
0.02
4,299.00
27.00
90.00
3,349.44
77.91 0.02
8.2.2.1 DEO Building Construction
DEO/RED
13.00
0.23
42,300.00
12.00
92.31
21,211.07
50.14 0.21
8.2.9.9 RED, DEO,and ETC building maintance
DEO/RED
79.00
0.05
8,700.00
25.00
31.65
6,800.73
78.17 0.02
8.5.1.1 Purchasing of laptop and LCD Projector
DEO/RED
184.00
0.11
19,300.00
163.00
88.59
16,741.87
86.75 0.09
8.5.15.1 Power Backup
DEO/RED
37.00
0.02
3,700.00
37.00
100.00
3,677.55
99.39 0.02
1. Total capital cost
0.43
78,299.00
84.89
51,780.65
66.13 0.36
Recurrent cost (3508033)
99.01
18,233,437.82
89.36
15,728,49
8.23
86.26 88.48
ECED
6.63
1,213,464.00
96.44
1,130,592.
80
93.17 6.39
Old ECEDs
6.57
1,203,734.00
96.63
1,124,258.
98
93.40 6.35
1.1.2.3.2 Remunaration for facilitators (Himali) person
1,412.00
0.32
58,739.20
1,369.16
96.97
55,908.23
95.18 0.31
1.1.2.3.1
Remunaration for facilitators (others) person
28,536.00
6.09
1,115,046.80
27,603.4
0
96.73
1,041,217.
51
93.38 5.89
2.15.12.1
.2
Education materials management cost centre
29,948.00
0.16
29,948.00
27,550.0
91.99
27,133.23
90.60 0.15
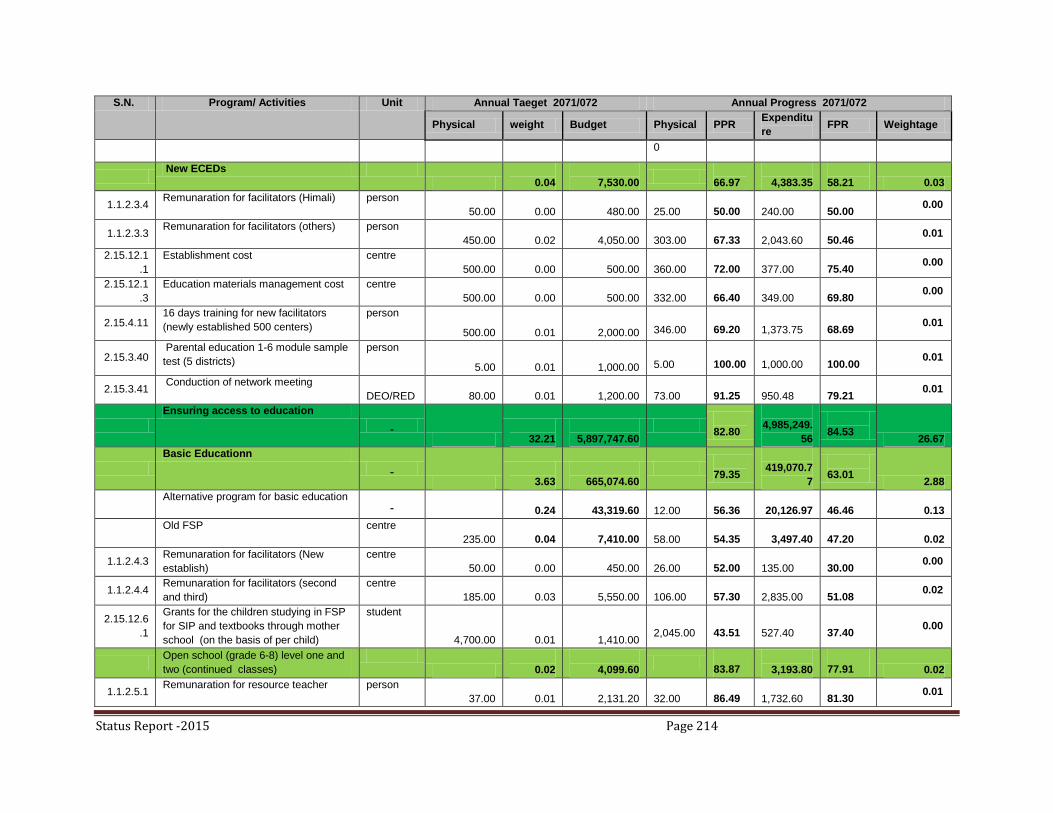
Status Report -2015 Page 214
S.N. Program/ Activities Unit Annual Taeget 2071/072 Annual Progress 2071/072
Physical weight Budget Physical PPR Expenditu
re FPR Weightage
0
New ECEDs
0.04
7,530.00
66.97
4,383.35
58.21 0.03
1.1.2.3.4 Remunaration for facilitators (Himali) person
50.00
0.00
480.00
25.00
50.00
240.00
50.00 0.00
1.1.2.3.3 Remunaration for facilitators (others) person
450.00
0.02
4,050.00
303.00
67.33
2,043.60
50.46 0.01
2.15.12.1
.1
Establishment cost centre
500.00
0.00
500.00
360.00
72.00
377.00
75.40 0.00
2.15.12.1
.3
Education materials management cost centre
500.00
0.00
500.00
332.00
66.40
349.00
69.80 0.00
2.15.4.11 16 days training for new facilitators
(newly established 500 centers)
person
500.00
0.01
2,000.00
346.00
69.20
1,373.75
68.69 0.01
2.15.3.40 Parental education 1-6 module sample
test (5 districts)
person
5.00
0.01
1,000.00
5.00
100.00
1,000.00
100.00 0.01
2.15.3.41 Conduction of network meeting
DEO/RED
80.00
0.01
1,200.00
73.00
91.25
950.48
79.21 0.01
Ensuring access to education
32.21
5,897,747.60
82.80
4,985,249.
56
84.53 26.67
Basic Educationn
3.63
665,074.60
79.35
419,070.7
7
63.01 2.88
Alternative program for basic education
0.24
43,319.60
12.00
56.36
20,126.97
46.46 0.13
Old FSP centre
235.00
0.04
7,410.00
58.00
54.35
3,497.40
47.20 0.02
1.1.2.4.3 Remunaration for facilitators (New
establish)
centre
50.00
0.00
450.00
26.00
52.00
135.00
30.00 0.00
1.1.2.4.4 Remunaration for facilitators (second
and third)
centre
185.00
0.03
5,550.00
106.00
57.30
2,835.00
51.08 0.02
2.15.12.6
.1
Grants for the children studying in FSP
for SIP and textbooks through mother
school (on the basis of per child)
student
4,700.00
0.01
1,410.00
2,045.00
43.51
527.40
37.40 0.00
Open school (grade 6-8) level one and
two (continued classes)
0.02
4,099.60
83.87
3,193.80
77.91 0.02
1.1.2.5.1 Remunaration for resource teacher person
37.00
0.01
2,131.20
32.00
86.49
1,732.60
81.30 0.01

Status Report -2015 Page 215
S.N. Program/ Activities Unit Annual Taeget 2071/072 Annual Progress 2071/072
Physical weight Budget Physical PPR Expenditu
re FPR Weightage
1.2.8.1.5 HT allowance person
37.00
0.00
222.00
32.00
86.49
172.00
77.48 0.00
1.1.2.5.2 Remunaration for office assistants
(staff)
person
37.00
0.00
266.40
31.00
83.78
200.20
75.15 0.00
2.15.12.2
.5
Stationery for students centre
37.00
0.00
370.00
31.00
83.78
280.00
75.68 0.00
2.15.12.2
.4
Stationery for schools centre
37.00
0.00
185.00
31.00
83.78
144.00
77.84 0.00
2.15.12.2
.6
Education material management cost centre
37.00
0.00
185.00
31.00
83.78
145.00
78.38 0.00
2.15.12.2
.1
Support for library management to
ensure access of textbooks for every
students (level one and two)
centre
37.00
0.00
740.00
28.00
75.68
520.00
70.27 0.00
2.15.12.6
.5
Nonformal school (household women)
(grade 1-8)
centre
304.00
0.15
27,360.00
160.00
52.63
10,176.20
37.19 0.08
2.15.12.5 Operation of open school school
7.00
0.01
2,450.00
2.00
28.57
1,400.00
57.14 0.00
2.15.6.4 Student admission, continuity and
achievement improvement campaign
DEO/RED
80.00
0.01
2,000.00
74.00
92.50
1,859.57
92.98 0.01
Inclusive Education Program
1.45
266,101.00
73.17
193,625.7
8
72.76 1.06
2.15.12.9
.2
Operation of resource class class
380.00
0.17
31,540.00
359.00
94.47
27,961.75
88.65 0.16
2.15.12.9
.3
Grants for management cost for
resource class
class
380.00
0.02
3,800.00
337.00
88.68
3,356.95
88.34 0.02
2.15.12.9
.4
Assessment center operation centre
62.00
0.02
3,100.00
60.00
96.77
2,945.49
95.02 0.02
6.3.1.2
Scholarship for the children with
disability (grade 1-8)
person
46,476.00
1.22
224,281.00
32,258.4
4
69.41
156,556.6
0
69.80 0.85
2.15.3.43
.1
Operation of extracurricular activities DEO
74.00
0.01
1,480.00
66.00
89.19
1,304.99
88.17 0.01
2.15.1.40 Training for teachers of deaf resource
class
school
20.00
0.01
1,000.00
16.00
80.00
750.00
75.00 0.00

Status Report -2015 Page 216
S.N. Program/ Activities Unit Annual Taeget 2071/072 Annual Progress 2071/072
Physical weight Budget Physical PPR Expenditu
re FPR Weightage
2.15.3.44
Gender related management cost
(Preparation of profile of organizations
working in the field of girls education
and dissemination and empowering
girls education network)
DEO/RED
80.00
0.00
800.00
66.00
82.50
642.35
80.29 0.00
2.15.3.45
Compulsory basic education operation
(excluding free and basic education
running districts)
person
50.00
0.00
180.00
50.00
100.00
180.00
100.00 0.00
2.15.3.47 Compulsory basic education operation
implementation 21 districts
school
113.00
0.22
40,152.00
113.00
100.00
18,556.05
46.21 0.22
2.15.3.46
Special educational program for the
cildren with disadvantaged groups
including Raute, Badi, Musahar,
Chepang,
person
29.00
0.00
522.00
7.00
24.14
108.00
20.69 0.00
2.15.12.1
0.1
Grants for basic religious schools
(Gurukul/Ashram, Madarasa,
Gumba/Bihar)
school
1,256.00
1.71
314,000.00
1,070.00
85.19
185,831.6
3
59.18 1.46
2.15.34.2
2
Computer based assistance to the
blind children from grade 6
school
3.00
0.00
450.00
2.00
66.67
300.00
66.67 0.00
2.15.34.2
3
Computer based learning support
program to the deaf students in
secondary level
school
3.00
0.00
450.00
3.00
100.00
450.00
100.00 0.00
Secondary Education
0.77
140,184.00
97.49
124,299.3
4
88.67 0.75
Alternative Education for Secondary
Education
0.17
31,674.00
85.44
25,675.20
81.06 0.15
2.15.12.2
.2
Open school operation grants (grade 9-
10)
school
84.00
0.05
9,240.00
83.00
98.81
9,050.00
97.94 0.05
2.15.34.2
8
Grants for the special schools (schools
for the deaf-6 , and school for the blind-
6)
school
12.00
0.03
5,294.00
11.00
91.67
4,617.00
87.21 0.03
2.15.34.2
9
Secondary education (grade 9-10)
Adult (household women)
centre
34.00
0.03
5,100.00
31.00
91.18
4,500.00
88.24 0.03
2.15.12.1
0.2
Grants for the religious school (Gurukul,
Madarasa, Ashram, Gumba, Bihar)
school
20.00
0.07
12,040.00
14.00
70.00
7,508.20
62.36 0.05
2.15.16.1
4.1
Curriculum dissemination (grade 8) person
21,702.00
0.59
108,510.00
21,922.1
101.01
98,624.14
90.89 0.60

Status Report -2015 Page 217
S.N. Program/ Activities Unit Annual Taeget 2071/072 Annual Progress 2071/072
Physical weight Budget Physical PPR Expenditu
re FPR Weightage
3
2.15.12.2
.3
Upgrade of grade 9-10 running 5 open
school
school
-
-
-
-
- -
Grants for teaching learning
activities on earthquake safety
8.87
1,624,990.00
61.55
1,321,531.
57
81.33 5.46
1.00
Pre-plan grants to run damaged school
or classroom
-
1.99
364,500.00
3,127.00
316,836.0
0
86.92 -
2.00
Grants for Temporary Learning Center
(TLCs)
3,446.00
3.76
689,384.00
2,367.00
68.69
484,030.5
2
70.21 2.59
3.00 Grants for Toilet
1,098.00
0.60
109,800.00
919.00
83.70
90,000.00
81.97 0.50
4.00
Grants for school dress and bag
461,306.00
2.52
461,306.00
434,743.
90
94.24
430,665.0
5
93.36 2.37
-
-
-
-
- -
School physical facilities expansion
program
18.94
3,467,499.00
92.83
3,120,347.
87
89.99 17.58
8.2.3.1
New classroom construction (Below
PMEC and community managed
schools)
classroom
844.00
1.68
307,860.00
787.00
93.25
281,860.0
0
91.55 1.57
8.2.3.2
New classroom construction (below
PMEC and community managed
schools) for Remote areas
classroom
150.00
0.33
60,000.00
150.00
100.00
57,750.00
96.25 0.33
8.2.3.3
School building construction (4 rooms) building
448.00
2.49
456,000.00
430.00
95.98
431,500.0
0
94.63 2.39
8.2.3.4
School building construction 4 rooms
(continuation of last FY)
building
679.00
5.19
950,600.00
672.00
98.97
936,180.0
0
98.48 5.14
8.2.9.2
School building construction building
540.00
1.47
270,000.00
507.00
93.89
251,550.0
0
93.17 1.38

Status Report -2015 Page 218
S.N. Program/ Activities Unit Annual Taeget 2071/072 Annual Progress 2071/072
Physical weight Budget Physical PPR Expenditu
re FPR Weightage
8.2.3.17 School earthquake safefty program school
204.00
1.49
272,089.00
120.76
59.19
98,067.87
36.04 0.88
8.3.3.1
Classroom rehabilitation and furniture
management
school
1,000.00
1.09
200,000.00
1,046.15
104.61
200,000.0
0
100.00 1.14
8.2.3.16
Improvement in school environment
(toilet, drinking water, fence)
school
600.00
0.82
150,000.00
556.00
92.67
136,875.0
0
91.25 0.76
8.2.3.5
Girls toilet (below PMEC) building
2,500.00
3.41
625,000.00
2,280.50
91.22
564,965.0
0
90.39 3.11
8.2.9.3 Maintanance of resource center
building
building
50.00
0.05
10,000.00
58.00
116.00
10,000.00
100.00 0.06
8.2.3.6
Immediate response to the community
schools with natural disaster
school
40.00
0.81
148,950.00
40.00
100.00
147,350.0
0
98.93 0.81
8.2.3.11 Retrofitting school
10.00
0.09
17,000.00
-
-
4,250.00
25.00 -
Literacy and continuing education
1.10
200,887.50
88.92
167,259.5
7
83.26 0.98
Income generating program through
community learning centers
0.25
44,900.00
77.74
32,564.05
72.53 0.19
2.15.1.17 Training for loan and saving Teams
5,000.00
0.02
3,100.00
3,543.00
70.86
2,194.55
70.79 0.01
2.15.1.18 Subjectwise training Teams
5,000.00
0.09
16,800.00
4,035.00
80.70
12,159.50
72.38 0.07
2.15.1.3 Seed money Teams
2,500.00
0.14
25,000.00
1,915.00
76.60
18,210.00
72.84 0.10
Post literacy class through
community learning center
0.85
155,987.50
92.14
134,695.5
2
86.35 0.78
2.15.4.7
Training for volunteers person
12,000.00
0.13
24,000.00
11,244.0
0
93.70
21,520.43
89.67 0.12
1.2.7.1
Incentives for volunteers person
12,000.00
0.39
72,000.00
11,037.0
0
91.98
62,710.00
87.10 0.36
2.19.1.1. Supervision through community cluster 0.04
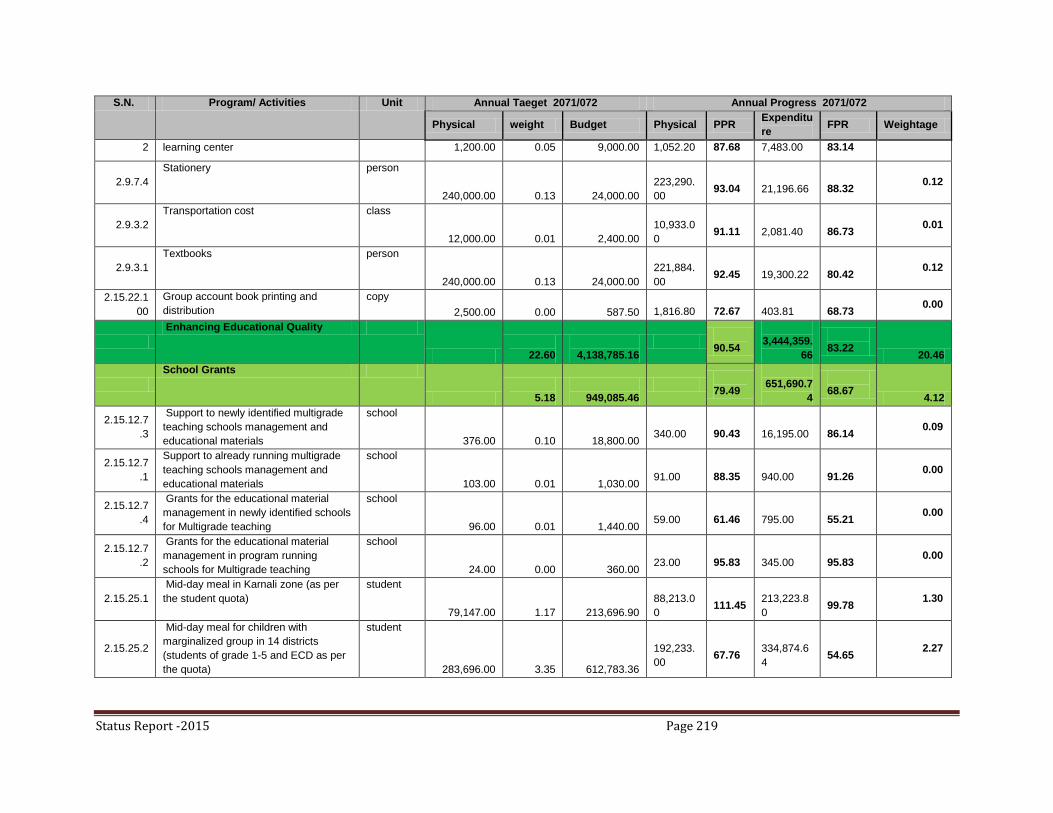
Status Report -2015 Page 219
S.N. Program/ Activities Unit Annual Taeget 2071/072 Annual Progress 2071/072
Physical weight Budget Physical PPR Expenditu
re FPR Weightage
2 learning center 1,200.00 0.05 9,000.00 1,052.20 87.68 7,483.00 83.14
2.9.7.4
Stationery person
240,000.00
0.13
24,000.00
223,290.
00
93.04
21,196.66
88.32 0.12
2.9.3.2
Transportation cost class
12,000.00
0.01
2,400.00
10,933.0
0
91.11
2,081.40
86.73 0.01
2.9.3.1
Textbooks person
240,000.00
0.13
24,000.00
221,884.
00
92.45
19,300.22
80.42 0.12
2.15.22.1
00
Group account book printing and
distribution
copy
2,500.00
0.00
587.50
1,816.80
72.67
403.81
68.73 0.00
Enhancing Educational Quality
22.60
4,138,785.16
90.54
3,444,359.
66
83.22 20.46
School Grants
5.18
949,085.46
79.49
651,690.7
4
68.67 4.12
2.15.12.7
.3
Support to newly identified multigrade
teaching schools management and
educational materials
school
376.00
0.10
18,800.00
340.00
90.43
16,195.00
86.14 0.09
2.15.12.7
.1
Support to already running multigrade
teaching schools management and
educational materials
school
103.00
0.01
1,030.00
91.00
88.35
940.00
91.26 0.00
2.15.12.7
.4
Grants for the educational material
management in newly identified schools
for Multigrade teaching
school
96.00
0.01
1,440.00
59.00
61.46
795.00
55.21 0.00
2.15.12.7
.2
Grants for the educational material
management in program running
schools for Multigrade teaching
school
24.00
0.00
360.00
23.00
95.83
345.00
95.83 0.00
2.15.25.1
Mid-day meal in Karnali zone (as per
the student quota)
student
79,147.00
1.17
213,696.90
88,213.0
0
111.45
213,223.8
0
99.78 1.30
2.15.25.2
Mid-day meal for children with
marginalized group in 14 districts
(students of grade 1-5 and ECD as per
the quota)
student
283,696.00
3.35
612,783.36
192,233.
00
67.76
334,874.6
4
54.65 2.27

Status Report -2015 Page 220
S.N. Program/ Activities Unit Annual Taeget 2071/072 Annual Progress 2071/072
Physical weight Budget Physical PPR Expenditu
re FPR Weightage
2.15.3.51
Strengthening student evaluation and
CAS (For new admission in Grade 1)
student
908,570.00
0.25
45,428.50
641,545.
11
70.61
31,662.12
69.70 0.18
2.15.14.1
8.1
sIff * sf] k/LIff ;'b[9Ls/0f tyf
;~rfngStrengthening administering the
examination in grade 8
student
504,970.00
0.30
55,546.70
452,638.
91
89.64
53,655.18
96.59 0.27
School grants for free textbooks (
on the basis of per child cost to
grade 1-5 students)
3,039,815.76
3.36
615,015.65
2,797,38
9.29
92.06
491,376.2
4
79.90
3.09
2.9.1.1
School grants for free textbooks ( per
child cost to grade 1 students)
student
802,242.15
0.88
161,044.97
754,011.
63
93.99
114,833.4
0
71.31 0.83
2.9.1.2
School grants for free textbooks ( per
child cost to grade 2 students)
student
562,125.85
0.53
96,325.89
506,659.
06
90.13
74,505.63
77.35 0.47
2.9.1.3
School grants for free textbooks ( per
child cost to grade 3 students)
student
584,987.57
0.60
109,322.48
535,007.
75
91.46
91,487.39
83.69 0.55
2.9.1.4
School grants for free textbooks ( per
child cost to grade 4 students)
student
549,925.13
0.66
120,323.62
511,614.
25
93.03
102,486.9
2
85.18 0.61
2.9.1.5
School grants for free textbooks ( per
child cost to grade 5 students)
student
540,535.06
0.70
127,998.70
490,096.
60
90.67
108,062.9
0
84.42 0.63
School grants for free textbooks (
per child cost to grade 6-8 students)
1,439,678.65
3.48
637,229.40
1,337,48
4.35
92.94
560,574.8
6
87.97 3.23
2.9.1.6
School grants for free textbooks ( per
child cost to grade 6 students)
student
533,608.92
1.26
230,519.05
469,365.
16
87.96
187,294.2
4
81.25 1.11
2.9.1.7
School grants for free textbooks ( per
child cost to grade 7 students)
student
446,434.34
1.05
193,145.35
433,954.
89
97.20
179,503.3
3
92.94 1.03
2.9.1.8
School grants for free textbooks ( per
child cost to grade 8 students)
student
459,635.39
1.17
213,564.99
434,164.
30
94.46
193,777.3
0
90.73 1.10
School grants for free textbooks ( per
child cost to grade 9-10 students)
673,384.27
2.00
366,502.53
660,240.
18
98.01
309,786.3
6
84.53 1.96

Status Report -2015 Page 221
S.N. Program/ Activities Unit Annual Taeget 2071/072 Annual Progress 2071/072
Physical weight Budget Physical PPR Expenditu
re FPR Weightage
2.9.2.1
School grants for free textbooks ( per
child cost to grade 9 students)
student
381,979.43
1.16
211,708.28
369,080.
28
96.62
177,152.6
7
83.68 1.12
2.9.2.2
School grants for free textbooks ( per
child cost to grade 10 students)
student
291,404.84
0.85
154,794.25
291,159.
91
99.92
132,633.6
9
85.68 0.84
2.9.2.3
School grants for free textbooks ( per
child cost to grade 11-12 all girls and
dalit students)
student
134,584.00
0.73
134,584.00
125,437.
40
93.20
111,544.4
7
82.88 0.69
School grants (on the base of Flash
II student teacher ratio)
6.83
1,249,998.96
94.93
1,149,105.
15
91.93 6.48
1.1.2.12.
1
Basic Level student
208,290.00
4.31
789,234.96
191,559.
00
91.97
716,006.9
4
90.72 3.96
1.1.2.12.
2
Secondary level student
41,630.00
2.52
460,764.00
41,630.0
0
100.00
433,098.2
1
94.00 2.52
Grants support to districts
1.02
186,369.16
87.55
170,281.8
4
91.37 0.89
2.15.3.54
EMIS preparation, publication and
dissemination on the basis of Flash
report, FMR report ,Status report,
Teachers records digitization, data
verification report, student scholarship
database
DEO
80.00
0.17
30,907.16
79.00
98.75
29,743.89
96.24 0.17
2.15.3.14 Meeting expense of free textbook
monitoring committee
DEO/RED
80.00
0.01
1,200.00
80.00
100.00
948.80
79.07 0.01
2.15.3.57 { Curriculum committee management
expense in regional and district level
DEO/RED
80.00
0.01
1,200.00
80.00
100.00
984.20
82.02 0.01
2.15.13.6
Incentives to DEO, School Supervisor,
Resource Center, Resource Peron and
Teachers on the basis of performance
person
2,043.00
0.06
10,215.00
983.00
48.12
4,124.49
40.38 0.03
2.15.22.1
09
Item Bank construction grade 5 DEO
1,600.00
0.02
3,200.00
1,461.00
91.31
2,860.00
89.38 0.02
2.15.3.60 Item Bank construction grade 8 DEO/RED
3,000.00
0.03
6,000.00
2,680.00
89.33
5,707.49
95.12 0.03
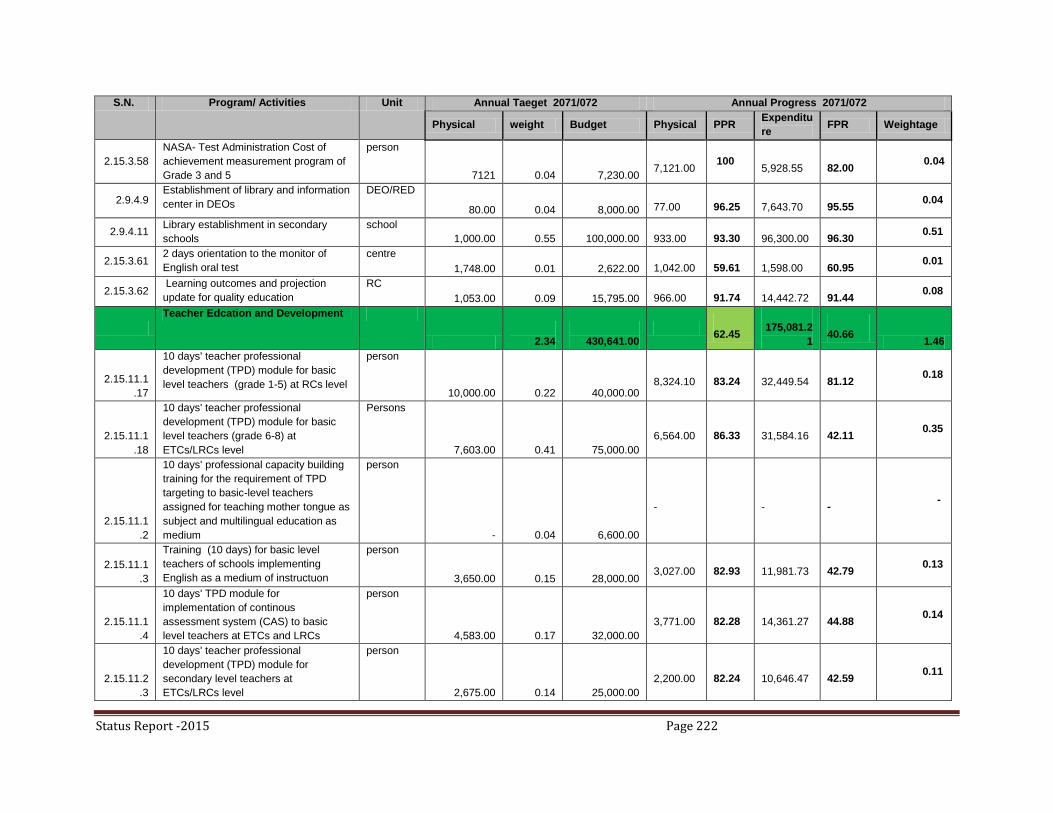
Status Report -2015 Page 222
S.N. Program/ Activities Unit Annual Taeget 2071/072 Annual Progress 2071/072
Physical weight Budget Physical PPR Expenditu
re FPR Weightage
2.15.3.58
NASA- Test Administration Cost of
achievement measurement program of
Grade 3 and 5
person
7121
0.04
7,230.00
7,121.00 100
5,928.55
82.00 0.04
2.9.4.9 Establishment of library and information
center in DEOs
DEO/RED
80.00
0.04
8,000.00
77.00
96.25
7,643.70
95.55 0.04
2.9.4.11 Library establishment in secondary
schools
school
1,000.00
0.55
100,000.00
933.00
93.30
96,300.00
96.30 0.51
2.15.3.61 2 days orientation to the monitor of
English oral test
centre
1,748.00
0.01
2,622.00
1,042.00
59.61
1,598.00
60.95 0.01
2.15.3.62 Learning outcomes and projection
update for quality education
RC
1,053.00
0.09
15,795.00
966.00
91.74
14,442.72
91.44 0.08
Teacher Edcation and Development
2.34
430,641.00
62.45
175,081.2
1
40.66 1.46
2.15.11.1
.17
10 days' teacher professional
development (TPD) module for basic
level teachers (grade 1-5) at RCs level
person
10,000.00
0.22
40,000.00
8,324.10
83.24
32,449.54
81.12 0.18
2.15.11.1
.18
10 days' teacher professional
development (TPD) module for basic
level teachers (grade 6-8) at
ETCs/LRCs level
Persons
7,603.00
0.41
75,000.00
6,564.00
86.33
31,584.16
42.11 0.35
2.15.11.1
.2
10 days' professional capacity building
training for the requirement of TPD
targeting to basic-level teachers
assigned for teaching mother tongue as
subject and multilingual education as
medium
person
-
0.04
6,600.00
-
-
- -
2.15.11.1
.3
Training (10 days) for basic level
teachers of schools implementing
English as a medium of instructuon
person
3,650.00
0.15
28,000.00
3,027.00
82.93
11,981.73
42.79 0.13
2.15.11.1
.4
10 days' TPD module for
implementation of continous
assessment system (CAS) to basic
level teachers at ETCs and LRCs
person
4,583.00
0.17
32,000.00
3,771.00
82.28
14,361.27
44.88 0.14
2.15.11.2
.3
10 days' teacher professional
development (TPD) module for
secondary level teachers at
ETCs/LRCs level
person
2,675.00
0.14
25,000.00
2,200.00
82.24
10,646.47
42.59 0.11

Status Report -2015 Page 223
S.N. Program/ Activities Unit Annual Taeget 2071/072 Annual Progress 2071/072
Physical weight Budget Physical PPR Expenditu
re FPR Weightage
2.15.11.2
.7
10 days training for teachers of higher
secondary level (grade 11 and 12)
person
-
0.03
6,000.00
-
-
- -
2.15.1.41
.1
Conduction of customized training
package (up to 10 days) at ETCs and
LRCs to lower secondary and
secondary level teachers of the schools
implementing ICT education for
developing IT capacity
person
420.00
0.03
5,000.00
398.00
94.76
2,000.00
40.00 0.03
2.15.11.2
.5
Conduction of 10 days in-service
training in ETC A
RC
-
0.09
16,848.00
-
-
- -
2.15.11.1
.20
Conduction of appropriate training on
TPD module for the teachers of
religious schools (Gurukul, Madarasa,
Gumba)
person
-
2,250.00
-
-
- -
2.15.11.2
.13
Conduction of job induction training to
newly appointed teachers
person
9,100.00
0.25
45,500.00
9,575.00
105.22
43,320.73
95.21 0.26
2.15.11.2
.12
Conduction of training for basic and
secondary students with blind students
person
-
0.00
750.00
-
-
- -
2.15.11.1
.12
5 days TOT on CAS Curriculum person
-
0.03
6,318.00
-
-
- -
2.15.11.1
.6
Refresher training for trainers and
roaster trainers on TPD
person
-
0.21
37,752.00
-
-
- -
2.15.11.2
.2
Professional development training (30
working days) for school head teachers
including institutional school (Through
ETCs)
person
-
0.06
10,875.00
-
-
- -
2.15.11.1
.25
Multi grade multi level teacher training person
-
0.01
1,875.00
-
-
- -
2.15.11.2
.4
Leadership development training for
leaders from different professional
teachers unions
person
-
0.02
3,000.00
-
-
- -
2.15.11.2
.9
Trainers training on action research
through ETCs
person
-
0.04
7,905.00
-
-
- -
2.19.1.1.
10
On-site technical backstopping through
LRCs for TPD activities conducted at
training hub and clusters by Resource
Persons/ Roaster trainers
person
-
0.03
6,318.00
-
154.00
2.44 -

Status Report -2015 Page 224
S.N. Program/ Activities Unit Annual Taeget 2071/072 Annual Progress 2071/072
Physical weight Budget Physical PPR Expenditu
re FPR Weightage
2.19.1.1.
9
On-site technical audit, approval of TPD
module/materials and monitoring by
training coordination committee on TPD
activities conducted at training hub and
clusters
person
75.00
0.02
4,500.00
62.00
82.67
3,679.72
81.77 0.02
2.9.4.8
Strengthening library for NCED centre
-
0.00
800.00
-
-
- -
2.15.3.66
Online-Offline professional
development training for School
supervisor/Resource Persons/ Roaster
trainers
person
-
0.01
1,500.00
-
-
- -
2.15.3.67
Physical capacity improvement
program of the NCED based up on the
procurement plan
centre
-
0.03
5,800.00
-
-
- -
2.15.22.9
2.1
Publishing news-letter including
implementing guideline, necessary
information to improve implementation
of annual program
centre
-
0.01
1,450.00
-
-
- -
2.15.22.9
1.1
Printing of 6 model TPD modules
materials of basic and secondary level
and distributing to all training hubs
centre
-
0.03
5,800.00
-
-
- -
2.15.3.68
.1
Strengthening library by documentation
of onling materials, managing books
and computer based activities
centre
-
0.02
4,350.00
-
-
- -
2.15.31.2
.10
Program management cost centre
-
0.01
1,450.00
-
-
- -
2.15.11.2
.10
Teacher training on action research centre
4,583.00
0.26
48,000.00
4,111.00
89.70
24,903.60
51.88 0.24
Capacity development for the
effective service delivery
0.71
131,583.00
76.56
124,801.2
0
94.85 0.55
2.15.11.2
.15
TOT of Capacity development for
School improvement, school
management and preparation of SIP
person
774.00
0.02
3,870.00
841.00
108.66
3,748.72
96.87 0.02
2.15.3.19
4.1
Capacity development for stakeholders
(SMC, PTA, RCMC and HTs) for
improvement of school management,
goverrnance and preparation of SIP
school
29,272.00
0.46
83,956.00
28,346.0
0
96.84
80,185.63
95.51 0.44

Status Report -2015 Page 225
S.N. Program/ Activities Unit Annual Taeget 2071/072 Annual Progress 2071/072
Physical weight Budget Physical PPR Expenditu
re FPR Weightage
2.15.3.39 Data update and analsis of School
mapping based on GIS
DEO
2,249.00
0.01
1,352.00
1,808.00
80.39
997.40
73.77 0.01
2.15.31.2
.16
Management cost for earthquake safety
program implemented districts
DEO
3.00
695.00
3.00
100.00
695.00
100.00 -
2.15.3.43
.2
Talent Hunt through extra/co curricular
activities ( Regional and district level ) 4
areas
student
300.00
0.03
6,000.00
260.00
86.67
5,393.61
89.89 0.03
2.15.3.86 Program management cost for physical
facilities
DEO
-
0.14
26,360.00
116.00
25,510.75
96.78 -
2.15.6.15 Utilizing mass media to enhance
educational quality at district level
DEO/RED
80.00
0.02
4,000.00
75.00
93.75
3,651.96
91.30 0.02
2.15.6.16 Educational Exhibition of school level
activities
DEO
75.00
0.02
3,750.00
68.00
90.67
3,338.14
89.02 0.02
2.15.8.22 Support of RED/DEOs for action plan DEO/RED
80.00
0.01
1,600.00
63.00
78.75
1,280.00
80.00 0.01
School Management & Monitoring
6.94
1,273,346.40
93.62
1,133,048.
31
88.98 6.50
Districts
2.80
514,508.40
93.25
415,894.0
1
80.83 2.61
2.19.1.1.
1
Monitoring and evaluation By district
and REDs
DEO/RED
80.00
0.09
16,000.00
80.00
100.00
13,263.53
82.90 0.09
2.15.3.78 ASIP, DEP, VEP, SIP preparation and
update
DEO/RED
80.00
0.04
8,000.00
79.00
98.75
7,717.06
96.46 0.04
2.15.22.2
1.2
Educational bulletin and newsletter
development, printing and distribution
DEO/RED
80.00
0.01
2,400.00
78.00
97.50
2,343.92
97.66 0.01
2.15.31.2
4
Management of email, internet, website
security , webhosting and Antivirus
setup
DEO/RED
80.00
0.01
2,400.00
80.00
100.00
2,400.00
100.00 0.01
2.13.5.2
Remuneration for RP substitute
teachers,( service contracts)
person
1,053.00
1.89
346,617.00
979.00
92.97
269,060.1
7
77.62 1.76
2.13.4.3 Salary for engineers, (service contracts) person
29.00
0.05
9,193.00
25.00
86.21
7,077.51
76.99 0.04
2.13.4.2 Salary for Sub engineers, (service
contracts)
person
200.00
0.27
49,067.00
185.00
92.50
43,716.68
89.10 0.25

Status Report -2015 Page 226
S.N. Program/ Activities Unit Annual Taeget 2071/072 Annual Progress 2071/072
Physical weight Budget Physical PPR Expenditu
re FPR Weightage
2.13.2.4 Salary for drivers working in DEOs,
REDs
person
42.00
0.04
8,022.00
39.00
92.86
7,075.86
88.21 0.04
1.2.3.2 Allowances for SS, RP teachers,
engineers and sub-engineers
person
1,662.00
0.26
48,524.40
1,513.00
91.03
42,077.92
86.71 0.24
2.15.3.19
3
Innovative activities based on district
level proposal including incentive
support to districts based on ranking
identified by REDs
DEO/RED
8.00
0.05
8,550.00
8.00
100.00
7,557.79
88.40 0.05
2.15.12.8
Innovative activities based on district
level proposal including incentive
support to districts based on ranking
identified by REDs
centre
46.00
0.02
3,680.00
46.00
100.00
3,481.56
94.61 0.02
2.15.12.1
3
Program management cost (Program
preparation, conduction and reporting)
DEO/RED
17.00
0.04
8,000.00
17.00
100.00
6,461.72
80.77 0.04
2.5.3.4 Maintenance cost (including office
equipment)
DEO/RED
80.00
1,600.00
77.00
96.25
1,485.92
92.87 -
2.15.22.2
2
Identification of best practices,
publication and distribution
DEO/RED
80.00
0.01
2,455.00
72.00
90.00
2,174.36
88.57 0.01
Resource Center
-
0.39
71,750.00
94.63
66,987.18
93.36 0.37
2.15.14.2
0
Strengthening school supervision RC
1,435.00
0.39
71,750.00
1,358.00
94.63
66,987.18
93.36 0.37
School
-
0.22
40,090.00
88.17
32,027.38
79.89 0.19
2.15.12.4
.1
Incentive grant support for community
managed schools ( Management taken
by community)
school
11.00
0.01
1,100.00
-
-
-
- -
2.15.12.4
.2
Grant to schools for financial audit school
29,630.00
0.16
29,630.00
27,461.0
0
92.68
26,664.00
89.99 0.15
2.15.3.24
5
Capacity building on budget preparation
and orientation through LMBIS for RED,
DEO and ETC officers
DEO/RED
10.00
0.03
4,860.00
8.00
80.00
2,087.96
42.96 0.02
2.15.3.85 Regional/ district level meeting operatin
cost
DEO/RED
80.00
0.01
2,000.00
80.00
100.00
1,792.80
89.64 0.01
2.15.8.17 Existing Physical study of RED, DEO
and ETC
DEO/RED
5.00
0.01
2,500.00
4.00
80.00
1,482.63
59.31 0.01
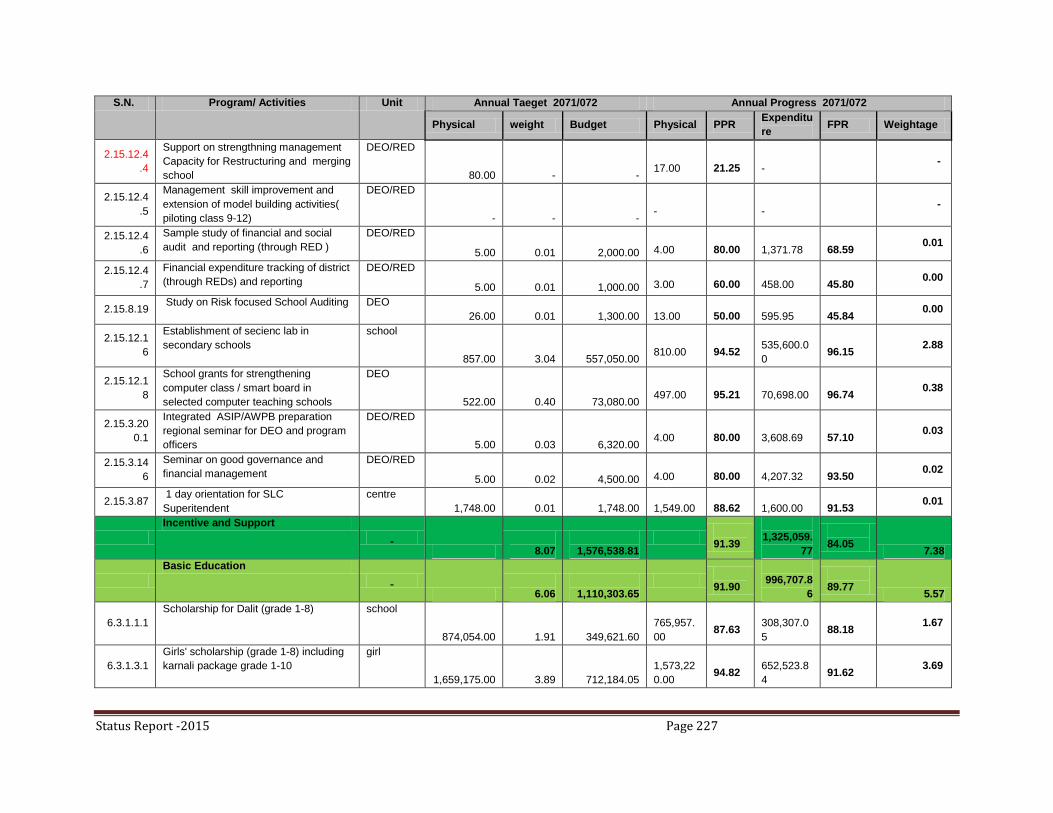
Status Report -2015 Page 227
S.N. Program/ Activities Unit Annual Taeget 2071/072 Annual Progress 2071/072
Physical weight Budget Physical PPR Expenditu
re FPR Weightage
2.15.12.4
.4
Support on strengthning management
Capacity for Restructuring and merging
school
DEO/RED
80.00
-
-
17.00
21.25
- -
2.15.12.4
.5
Management skill improvement and
extension of model building activities(
piloting class 9-12)
DEO/RED
-
-
-
-
- -
2.15.12.4
.6
Sample study of financial and social
audit and reporting (through RED )
DEO/RED
5.00
0.01
2,000.00
4.00
80.00
1,371.78
68.59 0.01
2.15.12.4
.7
Financial expenditure tracking of district
(through REDs) and reporting
DEO/RED
5.00
0.01
1,000.00
3.00
60.00
458.00
45.80 0.00
2.15.8.19 Study on Risk focused School Auditing DEO
26.00
0.01
1,300.00
13.00
50.00
595.95
45.84 0.00
2.15.12.1
6
Establishment of secienc lab in
secondary schools
school
857.00
3.04
557,050.00
810.00
94.52
535,600.0
0
96.15 2.88
2.15.12.1
8
School grants for strengthening
computer class / smart board in
selected computer teaching schools
DEO
522.00
0.40
73,080.00
497.00
95.21
70,698.00
96.74 0.38
2.15.3.20
0.1
Integrated ASIP/AWPB preparation
regional seminar for DEO and program
officers
DEO/RED
5.00
0.03
6,320.00
4.00
80.00
3,608.69
57.10 0.03
2.15.3.14
6
Seminar on good governance and
financial management
DEO/RED
5.00
0.02
4,500.00
4.00
80.00
4,207.32
93.50 0.02
2.15.3.87 1 day orientation for SLC
Superitendent
centre
1,748.00
0.01
1,748.00
1,549.00
88.62
1,600.00
91.53 0.01
Incentive and Support
8.07
1,576,538.81
91.39
1,325,059.
77
84.05 7.38
Basic Education
6.06
1,110,303.65
91.90
996,707.8
6
89.77 5.57
6.3.1.1.1
Scholarship for Dalit (grade 1-8) school
874,054.00
1.91
349,621.60
765,957.
00
87.63
308,307.0
5
88.18 1.67
6.3.1.3.1
Girls' scholarship (grade 1-8) including
karnali package grade 1-10
girl
1,659,175.00
3.89
712,184.05
1,573,22
0.00
94.82
652,523.8
4
91.62 3.69

Status Report -2015 Page 228
S.N. Program/ Activities Unit Annual Taeget 2071/072 Annual Progress 2071/072
Physical weight Budget Physical PPR Expenditu
re FPR Weightage
6.3.1.4.1
Scholarship for basic level students
from targeted groups (from 22 janajati
including marginalized groups)
student
96,996.00
0.26
48,498.00
77,316.0
0
79.71
35,876.97
73.98 0.21
Secondary Education
2.01
466,235.16
89.88
328,351.9
1
70.43 1.81
6.3.1.5.5 Scholarship for the children of martyrs student
99.00
0.03
4,785.00
105.00
106.06
2,764.00
57.76 0.03
6.3.1.6 Scholarship for mukta kamalari student
8,103.00
0.20
36,229.50
5,459.00
67.37
19,604.50
54.11 0.13
2.15.12.3
.3
Hostel management cost for mukta
kamalari{
student
17.00
0.03
5,077.00
14.00
82.35
2,983.00
58.76 0.02
6.3.2.7 Scholarship for conflict affected children student
6,265.00
0.45
81,693.00
5,539.33
88.42
67,559.66
82.70 0.39
6.3.2.11 Scholarship for remote mountain hostel
students
student
482.00
0.08
14,460.00
477.00
98.96
12,693.00
87.78 0.08
6.3.2.10 Scholarship for feeder hostel students student
400.00
0.07
12,000.00
380.00
95.00
11,010.00
91.75 0.06
6.3.2.8 Scholarship for model school students student
433.00
0.08
14,792.00
431.00
99.54
13,697.00
92.60 0.08
6.3.4.1 Scholarship for model residential
students in remote mountain
student
180.00
0.03
5,400.00
170.00
94.44
5,037.00
93.28 0.03
2.15.12.3
.1
Romote mountain hostel operation cost student
482.00
0.02
3,374.00
482.00
100.00
3,192.50
94.62 0.02
2.15.12.3
.2
FFeeder hostel operation cost student
400.00
0.02
2,800.00
400.00
100.00
2,732.00
97.57 0.02
2.15.12.3
.5
Model school operation cost student
433.00
0.02
4,330.00
415.00
95.84
4,240.00
97.92 0.02
2.15.12.3
.4
{ Operation cost for mountain
residential schools
student
180.00
0.01
1,800.00
161.00
89.44
1,770.00
98.33 0.01
6.3.2.9
Secondary education scholarship
(grade 7-10)
student
60,000.00
0.56
102,000.00
57,793.0
0
96.32
100,357.3
3
98.39 0.54
6.3.2.1.1
Dalit scholarship (grade 9-10) student
70,000.00
0.19
35,000.00
75,721.0
0
108.17
33,816.43
96.62 0.21
6.3.2.2 Scholarship for disabled students
(grade 9-10)
student
5,666.00
0.11
19,831.00
3,392.00
59.87
10,024.57
50.55 0.06
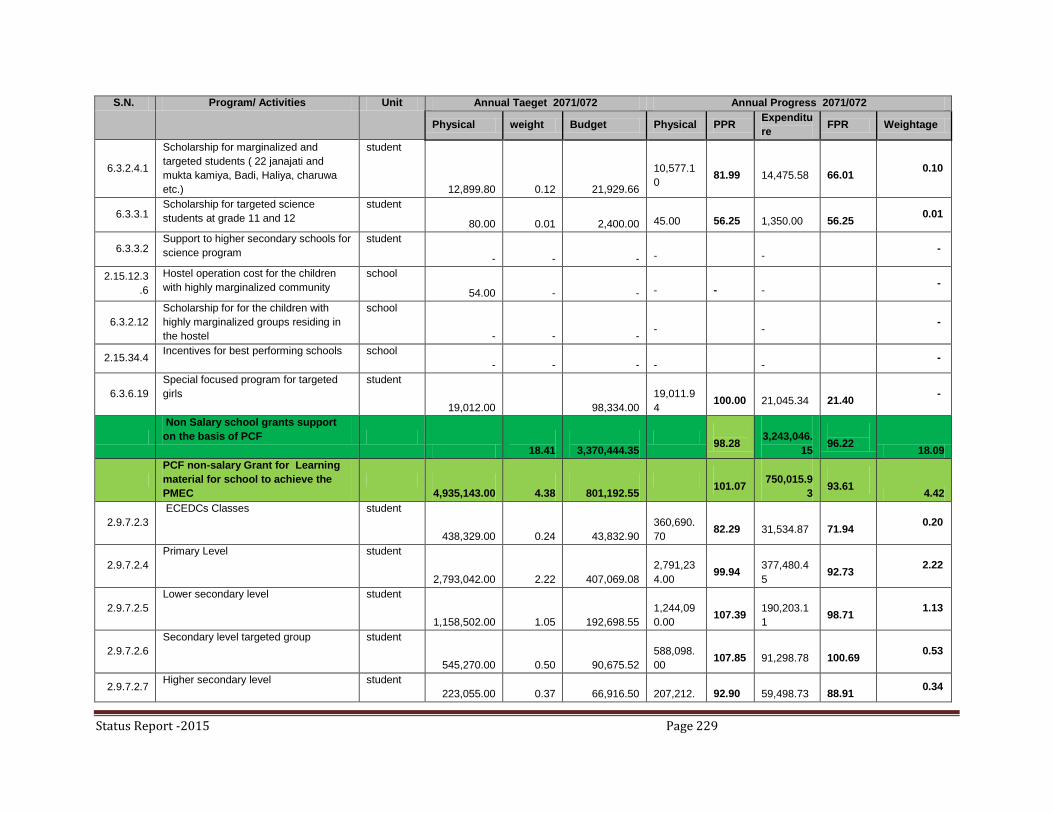
Status Report -2015 Page 229
S.N. Program/ Activities Unit Annual Taeget 2071/072 Annual Progress 2071/072
Physical weight Budget Physical PPR Expenditu
re FPR Weightage
6.3.2.4.1
Scholarship for marginalized and
targeted students ( 22 janajati and
mukta kamiya, Badi, Haliya, charuwa
etc.)
student
12,899.80
0.12
21,929.66
10,577.1
0
81.99
14,475.58
66.01 0.10
6.3.3.1 Scholarship for targeted science
students at grade 11 and 12
student
80.00
0.01
2,400.00
45.00
56.25
1,350.00
56.25 0.01
6.3.3.2 Support to higher secondary schools for
science program
student
-
-
-
-
- -
2.15.12.3
.6
Hostel operation cost for the children
with highly marginalized community
school
54.00
-
-
-
-
- -
6.3.2.12
Scholarship for for the children with
highly marginalized groups residing in
the hostel
school
-
-
-
-
- -
2.15.34.4 Incentives for best performing schools school
-
-
-
-
- -
6.3.6.19
Special focused program for targeted
girls
student
19,012.00
98,334.00
19,011.9
4
100.00
21,045.34
21.40 -
Non Salary school grants support
on the basis of PCF
18.41
3,370,444.35
98.28
3,243,046.
15
96.22 18.09
PCF non-salary Grant for Learning
material for school to achieve the
PMEC
4,935,143.00
4.38
801,192.55
101.07
750,015.9
3
93.61 4.42
2.9.7.2.3
ECEDCs Classes student
438,329.00
0.24
43,832.90
360,690.
70
82.29
31,534.87
71.94 0.20
2.9.7.2.4
Primary Level student
2,793,042.00
2.22
407,069.08
2,791,23
4.00
99.94
377,480.4
5
92.73 2.22
2.9.7.2.5
Lower secondary level student
1,158,502.00
1.05
192,698.55
1,244,09
0.00
107.39
190,203.1
1
98.71 1.13
2.9.7.2.6
Secondary level targeted group student
545,270.00
0.50
90,675.52
588,098.
00
107.85
91,298.78
100.69 0.53
2.9.7.2.7 Higher secondary level student
223,055.00
0.37
66,916.50
207,212.
92.90
59,498.73
88.91 0.34
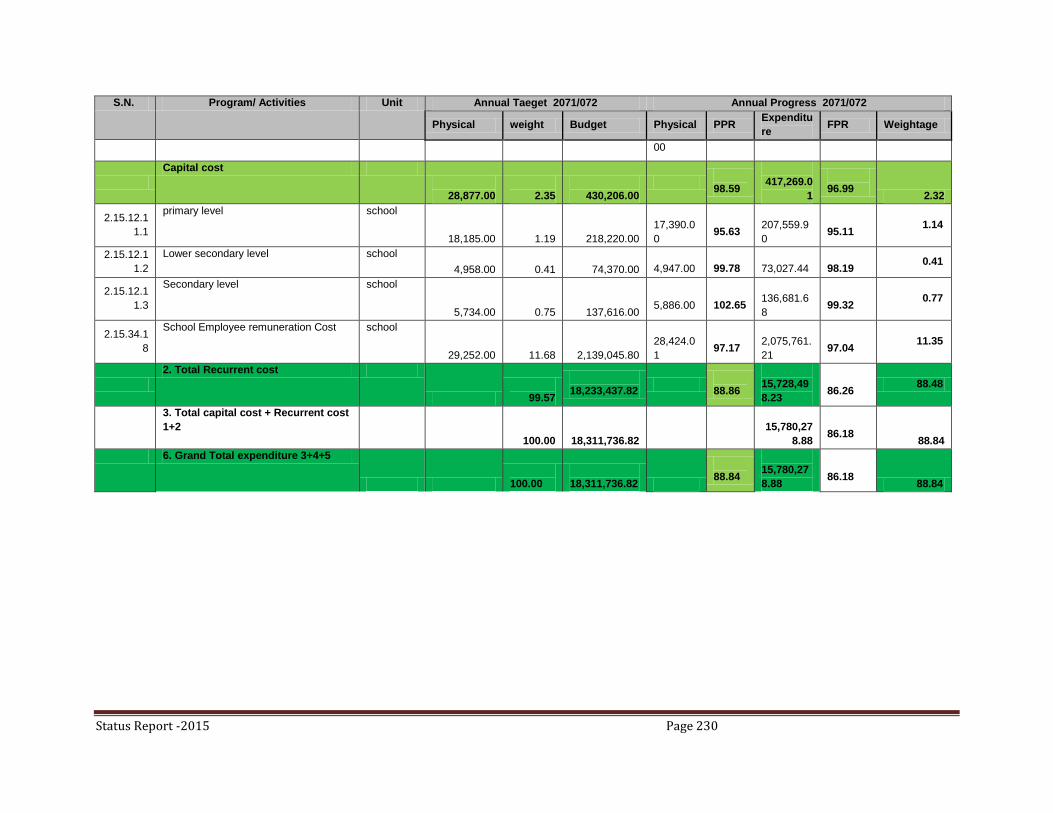
Status Report -2015 Page 230
S.N. Program/ Activities Unit Annual Taeget 2071/072 Annual Progress 2071/072
Physical weight Budget Physical PPR Expenditu
re FPR Weightage
00
Capital cost
28,877.00
2.35
430,206.00
98.59
417,269.0
1
96.99 2.32
2.15.12.1
1.1
primary level school
18,185.00
1.19
218,220.00
17,390.0
0
95.63
207,559.9
0
95.11 1.14
2.15.12.1
1.2
Lower secondary level school
4,958.00
0.41
74,370.00
4,947.00
99.78
73,027.44
98.19 0.41
2.15.12.1
1.3
Secondary level school
5,734.00
0.75
137,616.00
5,886.00
102.65
136,681.6
8
99.32 0.77
2.15.34.1
8
School Employee remuneration Cost school
29,252.00
11.68
2,139,045.80
28,424.0
1
97.17
2,075,761.
21
97.04 11.35
2. Total Recurrent cost
99.57
18,233,437.82
88.86
15,728,49
8.23
86.26 88.48
3. Total capital cost + Recurrent cost
1+2
100.00
18,311,736.82
15,780,27
8.88
86.18 88.84
6. Grand Total expenditure 3+4+5
100.00
18,311,736.82
88.84
15,780,27
8.88
86.18 88.84

Status Report -2015 Page 231
Annex 2
Annual Program and Progress for School Sector Reform Program (Center), FY. 2014/015
Program
code
Programs Unit Annual goal of FY 2014/015 Annual progress
Phys
ical
qty
Unit cost Weitage budget Phys
ical
qty
physical
percenta
ge
Expenditure
Expen
diture
Perce
ntage
weitage
A Capital cost (3501214)
1.32 3770.00 20.29 590.99 15.68 0.27
6 Capaciy development for effective service
delivery
1.32 3770.00 20.29 590.99 15.68 0.27
8.5.1.28 A3 Printer purchase (DOE)
Number 1 0.11 300.00
1 100.00 30.51 10.17 0.11
8.5.1.3 Computer purchase (DOE) Number 10 0.18 500.00
2 20.00 186.45 37.29 0.04
8.5.1.4 Laptop purchase (DOE) Number 20 0.46 1300.00
1 5.00 80.23 6.17 0.02
8.5.1.5 Printer purchase (DOE) number 2 0.02 50.00 0.00 0.00 0.00
8.5.1.7 Fax machine purchase (DOE) number 5 0.09 250.00 0.00 0.00 0.00
8.5.1.8 Scanner purchase (DOE) Number 5 0.09 250.00 0.00 0.00 0.00
8.5.13.1 Phone Set purchase (DOE) Number 10 0.01 20.00 0.00 0.00 0.00
8.8.16.6 Software development for Reporting Number 1
300 0.11 300.00
1 100.00 293.80 97.93 0.11
Installation of solar pannel in DOE 1 0.28 800.00 0.00 0.00 0.00
1. Total Capital cost
1.32 3770.00 20.29 590.99 15.68 0.27
B. Recurrent cost -3501231)
98.68 280898.96 74.83 159209.22 56.68 73.84
1 ECDC 1.71 4857.00 6.18 342.73 7.06 0.11
2.15.3.4 National ECDC meeting times 1
200 0.07 200.00 0.00 0.00 0.00
2.15.22.1
11 printing and distribution of ECDC materials per 1500
0.3 0.23 657.00 0.00 0.00 0.00
2.15.3.5 ECDC national network meeting times 4
50 0.07 200.00 0.00 6.11 3.06 0.00
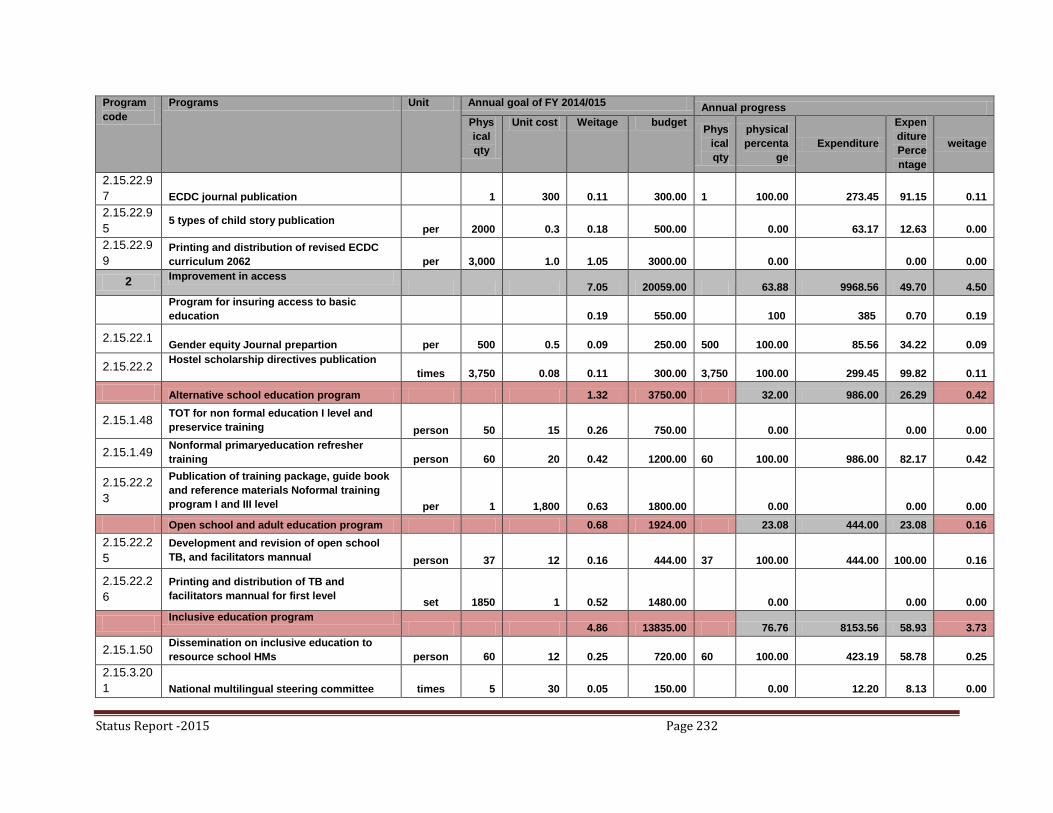
Status Report -2015 Page 232
Program
code
Programs Unit Annual goal of FY 2014/015 Annual progress
Phys
ical
qty
Unit cost Weitage budget Phys
ical
qty
physical
percenta
ge
Expenditure
Expen
diture
Perce
ntage
weitage
2.15.22.9
7 ECDC journal publication 1
300 0.11 300.00
1 100.00 273.45 91.15 0.11
2.15.22.9
5 5 types of child story publication
per 2000
0.3 0.18 500.00 0.00 63.17 12.63 0.00
2.15.22.9
9 Printing and distribution of revised ECDC
curriculum 2062 per 3,000
1.0 1.05 3000.00 0.00 0.00 0.00
2 Improvement in access
7.05 20059.00 63.88 9968.56 49.70 4.50
Program for insuring access to basic
education 0.19 550.00 100 385 0.70 0.19
2.15.22.1 Gender equity Journal prepartion per 500
0.5 0.09 250.00
500 100.00 85.56 34.22 0.09
2.15.22.2 Hostel scholarship directives publication
times 3,750
0.08 0.11 300.00
3,750 100.00 299.45 99.82 0.11
Alternative school education program 1.32 3750.00 32.00 986.00 26.29 0.42
2.15.1.48 TOT for non formal education I level and
preservice training person 50
15 0.26 750.00 0.00 0.00 0.00
2.15.1.49 Nonformal primaryeducation refresher
training person 60
20 0.42 1200.00
60 100.00 986.00 82.17 0.42
2.15.22.2
3
Publication of training package, guide book
and reference materials Noformal training
program I and III level per 1
1,800 0.63 1800.00 0.00 0.00 0.00
Open school and adult education program 0.68 1924.00 23.08 444.00 23.08 0.16
2.15.22.2
5
Development and revision of open school
TB, and facilitators mannual person 37
12 0.16 444.00
37 100.00 444.00 100.00 0.16
2.15.22.2
6
Printing and distribution of TB and
facilitators mannual for first level set 1850
1 0.52 1480.00 0.00 0.00 0.00
Inclusive education program
4.86 13835.00 76.76 8153.56 58.93 3.73
2.15.1.50 Dissemination on inclusive education to
resource school HMs person 60
12 0.25 720.00
60 100.00 423.19 58.78 0.25
2.15.3.20
1 National multilingual steering committee times 5
30 0.05 150.00 0.00 12.20 8.13 0.00
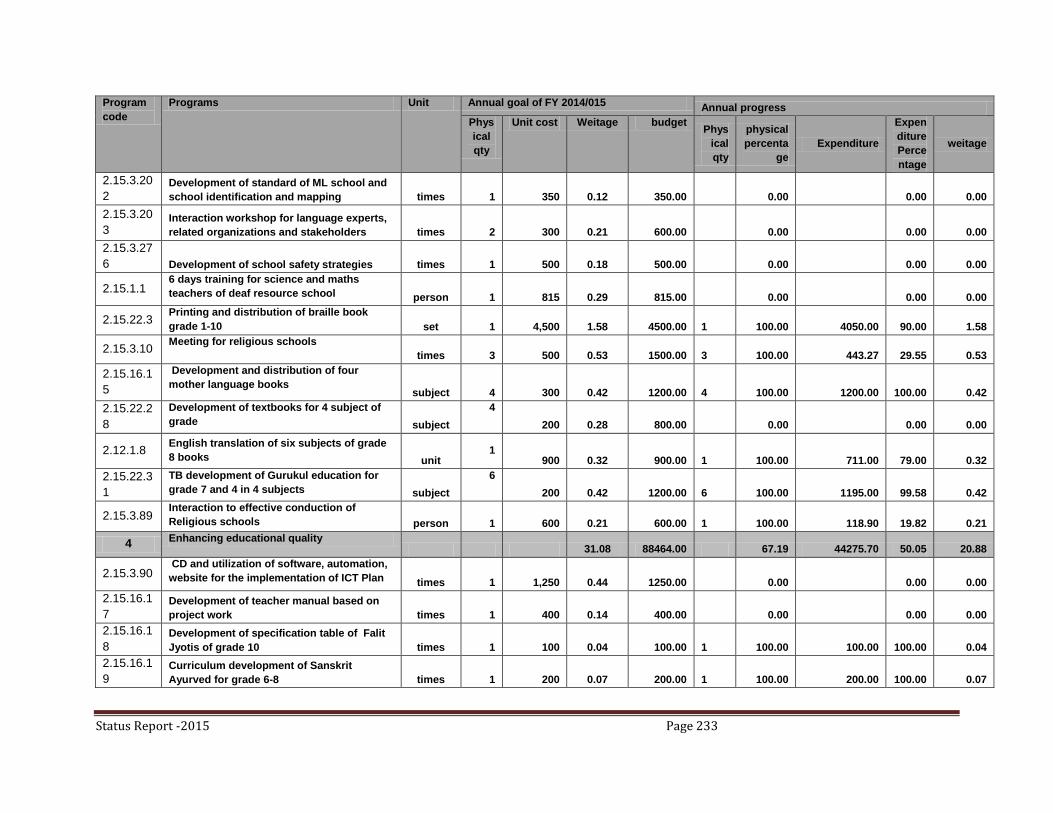
Status Report -2015 Page 233
Program
code
Programs Unit Annual goal of FY 2014/015 Annual progress
Phys
ical
qty
Unit cost Weitage budget Phys
ical
qty
physical
percenta
ge
Expenditure
Expen
diture
Perce
ntage
weitage
2.15.3.20
2 Development of standard of ML school and
school identification and mapping times 1
350 0.12 350.00 0.00 0.00 0.00
2.15.3.20
3 Interaction workshop for language experts,
related organizations and stakeholders times 2
300 0.21 600.00 0.00 0.00 0.00
2.15.3.27
6 Development of school safety strategies times 1
500 0.18 500.00 0.00 0.00 0.00
2.15.1.1 6 days training for science and maths
teachers of deaf resource school person 1
815 0.29 815.00 0.00 0.00 0.00
2.15.22.3 Printing and distribution of braille book
grade 1-10 set 1
4,500 1.58 4500.00
1 100.00 4050.00 90.00 1.58
2.15.3.10 Meeting for religious schools
times 3
500 0.53 1500.00
3 100.00 443.27 29.55 0.53
2.15.16.1
5
Development and distribution of four
mother language books subject 4
300 0.42 1200.00
4 100.00 1200.00 100.00 0.42
2.15.22.2
8
Development of textbooks for 4 subject of
grade subject
4
200 0.28 800.00 0.00 0.00 0.00
2.12.1.8 English translation of six subjects of grade
8 books unit 1
900 0.32 900.00
1 100.00 711.00 79.00 0.32
2.15.22.3
1
TB development of Gurukul education for
grade 7 and 4 in 4 subjects subject
6
200 0.42 1200.00
6 100.00 1195.00 99.58 0.42
2.15.3.89 Interaction to effective conduction of
Religious schools person 1
600 0.21 600.00
1 100.00 118.90 19.82 0.21
4 Enhancing educational quality
31.08 88464.00 67.19 44275.70 50.05 20.88
2.15.3.90 CD and utilization of software, automation,
website for the implementation of ICT Plan times 1
1,250 0.44 1250.00 0.00 0.00 0.00
2.15.16.1
7 Development of teacher manual based on
project work times 1
400 0.14 400.00 0.00 0.00 0.00
2.15.16.1
8 Development of specification table of Falit
Jyotis of grade 10 times 1
100 0.04 100.00
1 100.00 100.00 100.00 0.04
2.15.16.1
9 Curriculum development of Sanskrit
Ayurved for grade 6-8 times 1
200 0.07 200.00
1 100.00 200.00 100.00 0.07

Status Report -2015 Page 234
Program
code
Programs Unit Annual goal of FY 2014/015 Annual progress
Phys
ical
qty
Unit cost Weitage budget Phys
ical
qty
physical
percenta
ge
Expenditure
Expen
diture
Perce
ntage
weitage
2.15.16.2
0 Development of reference materials for
Intellectual Disability times 1
500 0.18 500.00
1 100.00 500.00 100.00 0.18
2.15.16.2
1 Development and distribution of audio
materials based basic level curriculum per 200
2 0.14 400.00
200 100.00 400.00 100.00 0.14
2.15.16.2
2 Development ant experimentation of
compulsory 6 subjects of grade 9 subject 6
500 1.05 3000.00
6 100.00 3000.00 100.00 1.05
2.15.16.2
8 Teacher workshop on the development of
ICT Based materials times 1
500 0.18 500.00
1 100.00 318.00 63.60 0.18
2.15.16.2
9 Development of ICT Based teacher manual times 1
300 0.11 300.00
1 100.00 287.00 95.67 0.11
2.15.16.6 Development of grade 8 music TB times 1
300 0.11 300.00
1 100.00 293.00 97.67 0.11
2.16.9.17 Development of integrated learning
activities based on grade 3 curriculum times 1
300 0.11 300.00 0.00 0.00 0.00
2.15.17.1
3 Pre test and experimentation of grade 8
question bank per 6,000
1 1.05 3000.00 0.00 0.00 0.00
2.15.18.7 Development of questionnare and update
for grade 3 and 5 per 5
100 0.18 500.00
5 100.00 491.99 98.40 0.18
2.15.8.8 Situation analysis of MLE program in
district level per 1
- 0.00 0.00 0.00
2.15.31.1
.1
Email, internet, antivirus, databank, update /
FTP, intranet/ web based software
management
cotinuou
s 1
1,000 0.35 1000.00
1 100.00 868.68 86.87 0.35
2.7.5.4 Material transportation DOE cont 1
1,500 0.53 1500.00
1 100.00 530.31 35.35 0.53
2.15.22.4
Update of detalis of the Database,PMECs,
teachers, scholarship in Flash software of
Flash Report I and II times 1
1,500 0.53 1500.00
1 100.00 291.37 19.42 0.53
2.15.3.11 District orientation, data entry, and report
writing in Flash Report I and II times 2
2,050 1.44 4100.00
2 100.00 737.68 17.99 1.44
2.15.22.5 Printing of CRCprepared materials
times 1
1,000 0.35 1000.00
1 100.00 494.34 49.43 0.35
2.15.6.
1
Broadcasting in monthly basis in medias in
educational polici and strategies related
matters 0.07 190.00 0.00

Status Report -2015 Page 235
Program
code
Programs Unit Annual goal of FY 2014/015 Annual progress
Phys
ical
qty
Unit cost Weitage budget Phys
ical
qty
physical
percenta
ge
Expenditure
Expen
diture
Perce
ntage
weitage
2.15.6.
2
Production and broadcasting of educational
program in Shikshako Chautari through
radio nepal times
1
500 0.18 500.00
1 100.00 480.82 96.16 0.18
2.15.6.
3 Regular publication of DOE activities in
Gorkhapatra times
11
218 0.84 2400.00
11 100.00 1620.76 67.53 0.84
2.15.3.
139
Development of Teaching and evaluation
modality in the collaboration with
universities times 1 2,508 0.88 2508.00
1 100.00 2490.13 99.29 0.88
2.15.22.7 Record management and publication of
executive summary of the research report per 1500
0 0.18 510.00 0.00 0.00 0.00
2.15.3.21
4 Workshop for SS and SS on contemporary
issues person 200
12 0.84 2400.00 0.00 34.96 1.46 0.00
2.15.3.21
5 Selection and identification of the tallency
person 4
450 0.63 1800.00
4 100.00 1136.00 63.11 0.63
2.15.1.58 Leadership development orientation on
inclusive education for HMs (5 days) person 100
12 0.42 1200.00 0.00 0.00 0.00
2.15.1.59 5 days orientation for coordinator of the
assessment center times 62
12 0.26 744.00 0.00 0.00 0.00
2.15.3.11
1 Workshop/seminar on information
management times 1
300 0.11 300.00
1 100.00 241.64 80.55 0.11
2.15.16.1
1
Revision of grade 1-5 TBs according new
grammetical rules times 1
500 0.18 500.00
1 100.00 500.00 100.00 0.18
2.15.16.1
6
Teacher manual development for grade 6
and 7 music and grade 7 and 8 computer
subject subject
2
200 0.14 400.00
2 100.00 350.00 87.50 0.14
2.15.3.22
0
Analysis and establishment of SLC Item
bank times 1
900 0.32 900.00
1 100.00 671.87 74.65 0.32
2.15.3.24
9
2 days orientation to examiner and re-
examinar for new centers person
60.00
10 0.21 600.00
60 100.00 465.96 77.66 0.21
2.15.3.21
6
2 days orientation for section officer of
REDs person 15
20 0.11 300.00
15 100.00 260.00 86.67 0.11
2.15.3.21Model school selectionand incentives on
use and management of educational times 1
550 0.19 550.00 0.00 0.00 0.00

Status Report -2015 Page 236
Program
code
Programs Unit Annual goal of FY 2014/015 Annual progress
Phys
ical
qty
Unit cost Weitage budget Phys
ical
qty
physical
percenta
ge
Expenditure
Expen
diture
Perce
ntage
weitage
7 materials
2.15.22.8 Development and distribution of MGML
materials times 1
1,200 0.42 1200.00 0.00 0.00 0.00
2.15.22.9 Development and distribution of expansion
of MGML program set 1
3,000 1.05 3000.00 0.00 0.00 0.00
2.15.3.11
7
Preparation of database/profile ro release
the scholarship through bank for grade 11
and 12 times 1
500 0.18 500.00
1 100.00 228.22 45.64 0.18
2.15.3.13 Recognition of talent hunt on the basis of
information for education development times 3
180 0.19 540.00
1 33.33 243.00 45.00 0.06
2.15.3.14 Meeting for free textbook monitoring
times 2
200 0.14 400.00
2 100.00 177.95 44.49 0.14
2.15.3.15
Development of digitised curricular
materials using ICT in education for
teaching learning times 1
1,000 0.35 1000.00 0.00 0.00 0.00
2.15.3.22
4
Finalization, printing and distribution of
norms and standards for education service
delivery per 1
700 0.25 700.00 0.00 0.00 0.00
2.15.22.1
0
Library with E-library development in school
level and dissemination of guidelines on
MEC per 1
500 0.18 500.00 0.00 0.00 0.00
2.12.3.2
Reporting, Monitoring and counselling
service from third partyto release the
scholarship and teacher salary through
bank times 1 0.67 1900.00
1 100.00 1000.00 52.63 0.67
2.12.3.7 Internet facilities for DOE times 1
500 0.18 500.00
1 100.00 500.00 100.00 0.18
2.15.3.16 Facilitation of activities related to Early
grade reading skills times 1
500 0.18 500.00 0.00 0.00 0.00
2.12.3.21
Expert counselling service for quality
technical assistance through experts -
includingERO /NASA, Preformance Audit_ times
0.00 0.00
2.15.22.1
01 Development of equivalency directives
times
1
200 0.07 200.00 0.00 0.00 0.00

Status Report -2015 Page 237
Program
code
Programs Unit Annual goal of FY 2014/015 Annual progress
Phys
ical
qty
Unit cost Weitage budget Phys
ical
qty
physical
percenta
ge
Expenditure
Expen
diture
Perce
ntage
weitage
2.15.22.1
02 development of MTB and printing
times
1
300 0.11 300.00 0.00 0.00 0.00
2.15.22.1
05
Prototype item development, printing and
distribution for SLC examination times
1
1,200 0.42 1200.00
1 100.00 763.69 63.64 0.42
2.15.22.1
08 Revision of NASA Guideline
times
1
500 0.18 500.00
1 100.00 412.45 82.49 0.18
2.15.22.1
17
Development of audio materials of basic
level and grade 1-5 English times
1
450 0.16 450.00 0.00 0.00 0.00
2.15.22.1
24 Development of disability awareness book
per 200
3 0.18 500.00 0.00 0.00 0.00
2.15.22.1
25 Printing of Signlanguage and dissemination
times
1
300 0.11 300.00 0.00 0.00 0.00
2.15.22.1
26
Development of inclusive education
introductory book per
1,500
0 0.16 450.00 0.00 0.00 0.00
2.15.22.1
30 Revision of NASA testing tools
times
4
125 0.18 500.00 0.00 0.00 0.00
2.15.3.37 Collaboration with TU CERID for Formative
research times
1
500 0.18 500.00
1 100.00 500.00 100.00 0.18
2.15.3.73 Cooperation with stakeholders for the
schoolwise teacher position redeployment times
1
1,000 0.35 1000.00
1 100.00 125.99 12.60 0.35
2.15.1.20
.3
Training for the teachers of deaf resource
school times
1
850 0.30 850.00 0.00 0.00 0.00
2.15.3.22
7
Program for CD on library management in
the collaboration with Nepal National
Library times
1
1,000 0.35 1000.00
1 100.00 521.57 52.16 0.35
2.15.3.13
1
Workshop for questionnaire development
times
1
600 0.21 600.00
1 100.00 533.28 88.88 0.21
2.15.3.13
2
Student evaluation activities cooperating
with the Universities times
1
200 0.07 200.00 0.00 0.00 0.00
1.2.4.15 Meeting to EROsteering committee, and
other technical committees times
10
50 0.18 500.00 0.00 0.00 0.00
2.15.3.23
0 Levelwise achievement test
times
1
2,100 0.74 2100.00
1 100.00 355.19 16.91 0.74
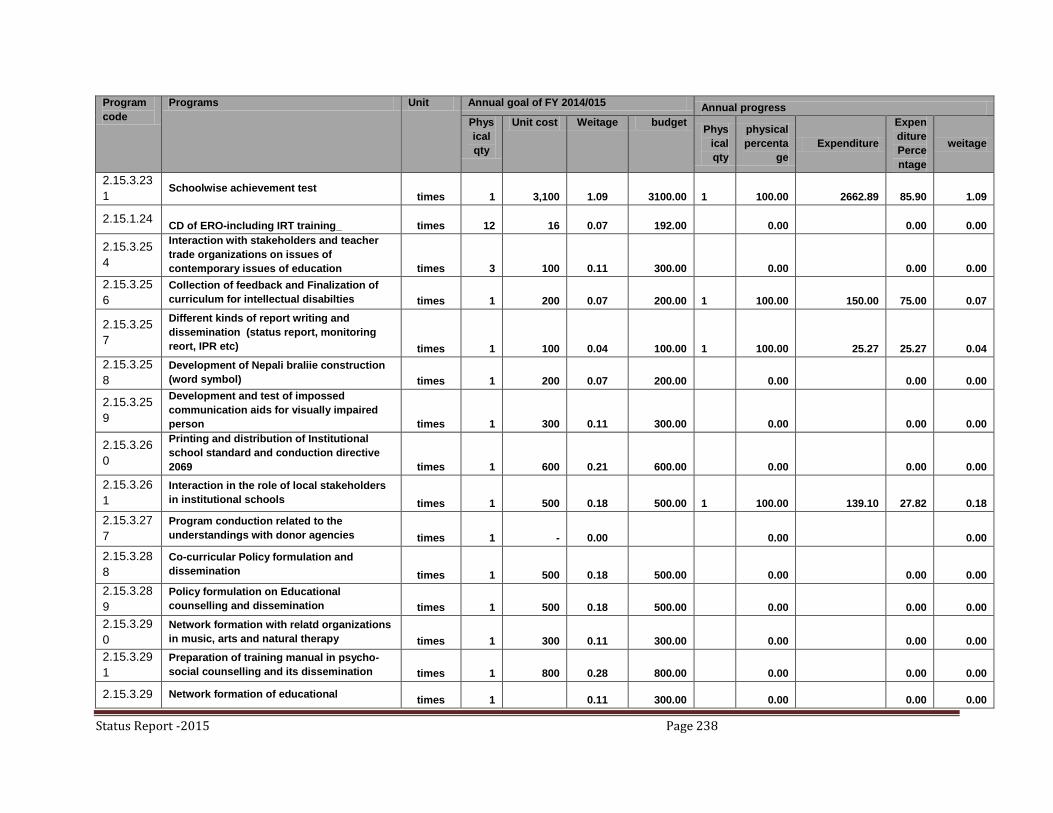
Status Report -2015 Page 238
Program
code
Programs Unit Annual goal of FY 2014/015 Annual progress
Phys
ical
qty
Unit cost Weitage budget Phys
ical
qty
physical
percenta
ge
Expenditure
Expen
diture
Perce
ntage
weitage
2.15.3.23
1 Schoolwise achievement test
times 1
3,100 1.09 3100.00
1 100.00 2662.89 85.90 1.09
2.15.1.24 CD of ERO-including IRT training_ times 12
16 0.07 192.00 0.00 0.00 0.00
2.15.3.25
4
Interaction with stakeholders and teacher
trade organizations on issues of
contemporary issues of education times 3
100 0.11 300.00 0.00 0.00 0.00
2.15.3.25
6
Collection of feedback and Finalization of
curriculum for intellectual disabilties times 1
200 0.07 200.00
1 100.00 150.00 75.00 0.07
2.15.3.25
7
Different kinds of report writing and
dissemination (status report, monitoring
reort, IPR etc) times 1
100 0.04 100.00
1 100.00 25.27 25.27 0.04
2.15.3.25
8
Development of Nepali braliie construction
(word symbol) times 1
200 0.07 200.00 0.00 0.00 0.00
2.15.3.25
9
Development and test of impossed
communication aids for visually impaired
person times 1
300 0.11 300.00 0.00 0.00 0.00
2.15.3.26
0
Printing and distribution of Institutional
school standard and conduction directive
2069 times 1
600 0.21 600.00 0.00 0.00 0.00
2.15.3.26
1
Interaction in the role of local stakeholders
in institutional schools times 1
500 0.18 500.00
1 100.00 139.10 27.82 0.18
2.15.3.27
7
Program conduction related to the
understandings with donor agencies times 1
- 0.00 0.00 0.00
2.15.3.28
8
Co-curricular Policy formulation and
dissemination times 1
500 0.18 500.00 0.00 0.00 0.00
2.15.3.28
9
Policy formulation on Educational
counselling and dissemination times 1
500 0.18 500.00 0.00 0.00 0.00
2.15.3.29
0
Network formation with relatd organizations
in music, arts and natural therapy times 1
300 0.11 300.00 0.00 0.00 0.00
2.15.3.29
1
Preparation of training manual in psycho-
social counselling and its dissemination times 1
800 0.28 800.00 0.00 0.00 0.00
2.15.3.29 Network formation of educational times 1 0.11 300.00 0.00 0.00 0.00
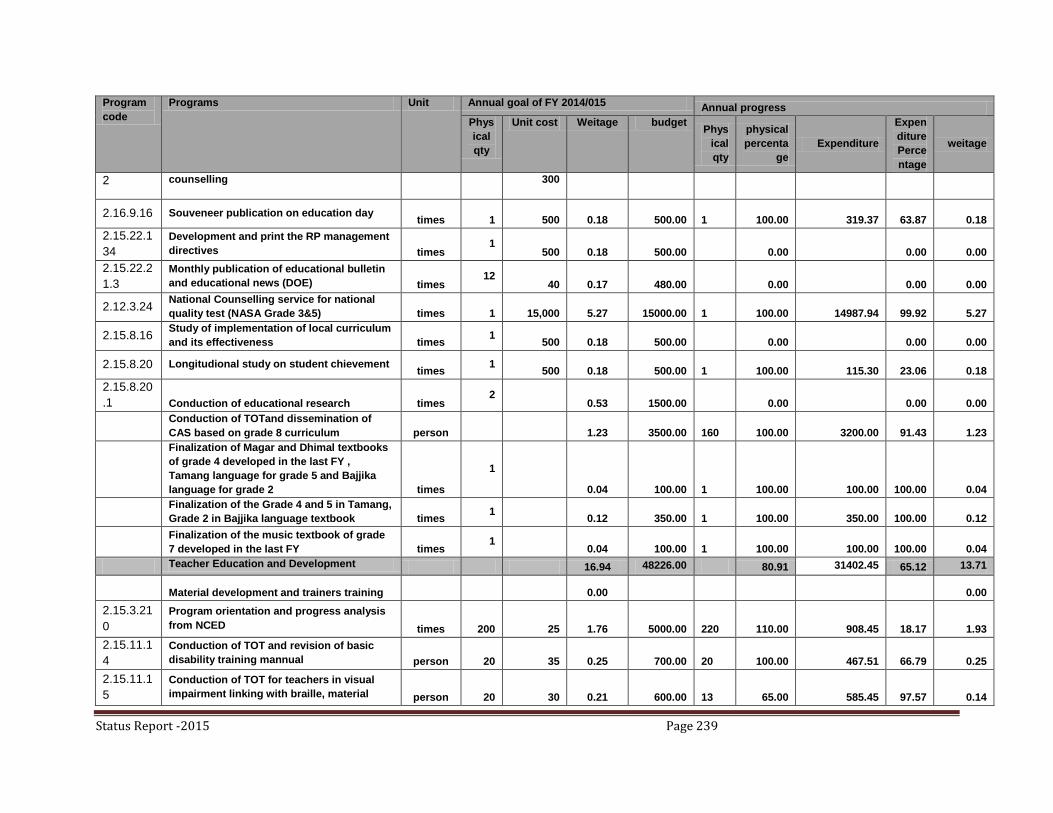
Status Report -2015 Page 239
Program
code
Programs Unit Annual goal of FY 2014/015 Annual progress
Phys
ical
qty
Unit cost Weitage budget Phys
ical
qty
physical
percenta
ge
Expenditure
Expen
diture
Perce
ntage
weitage
2 counselling 300
2.16.9.16 Souveneer publication on education day times 1
500 0.18 500.00
1 100.00 319.37 63.87 0.18
2.15.22.1
34
Development and print the RP management
directives times 1
500 0.18 500.00 0.00 0.00 0.00
2.15.22.2
1.3
Monthly publication of educational bulletin
and educational news (DOE) times 12
40 0.17 480.00 0.00 0.00 0.00
2.12.3.24 National Counselling service for national
quality test (NASA Grade 3&5) times 1
15,000 5.27 15000.00
1 100.00 14987.94 99.92 5.27
2.15.8.16 Study of implementation of local curriculum
and its effectiveness times 1
500 0.18 500.00 0.00 0.00 0.00
2.15.8.20 Longitudional study on student chievement times
1
500 0.18 500.00
1 100.00 115.30 23.06 0.18
2.15.8.20
.1 Conduction of educational research times 2
0.53 1500.00 0.00 0.00 0.00
Conduction of TOTand dissemination of
CAS based on grade 8 curriculum person
1.23 3500.00
160 100.00 3200.00 91.43 1.23
Finalization of Magar and Dhimal textbooks
of grade 4 developed in the last FY ,
Tamang language for grade 5 and Bajjika
language for grade 2 times
1
0.04 100.00
1 100.00 100.00 100.00 0.04
Finalization of the Grade 4 and 5 in Tamang,
Grade 2 in Bajjika language textbook times 1
0.12 350.00
1 100.00 350.00 100.00 0.12
Finalization of the music textbook of grade
7 developed in the last FY times 1
0.04 100.00
1 100.00 100.00 100.00 0.04
Teacher Education and Development 16.94 48226.00 80.91 31402.45 65.12 13.71
Material development and trainers training 0.00 0.00
2.15.3.21
0
Program orientation and progress analysis
from NCED times 200
25 1.76 5000.00
220 110.00 908.45 18.17 1.93
2.15.11.1
4
Conduction of TOT and revision of basic
disability training mannual person 20
35 0.25 700.00
20 100.00 467.51 66.79 0.25
2.15.11.1
5
Conduction of TOT for teachers in visual
impairment linking with braille, material person 20
30 0.21 600.00
13 65.00 585.45 97.57 0.14
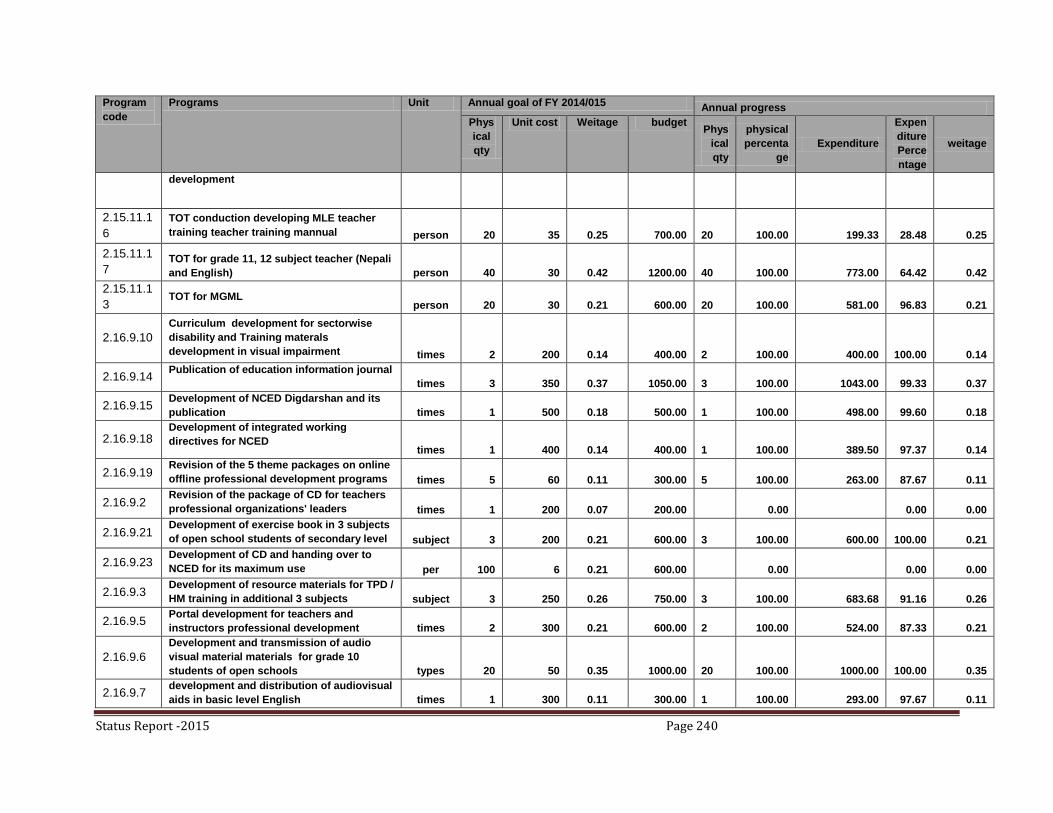
Status Report -2015 Page 240
Program
code
Programs Unit Annual goal of FY 2014/015 Annual progress
Phys
ical
qty
Unit cost Weitage budget Phys
ical
qty
physical
percenta
ge
Expenditure
Expen
diture
Perce
ntage
weitage
development
2.15.11.1
6
TOT conduction developing MLE teacher
training teacher training mannual person 20
35 0.25 700.00
20 100.00 199.33 28.48 0.25
2.15.11.1
7 TOT for grade 11, 12 subject teacher (Nepali
and English) person 40
30 0.42 1200.00
40 100.00 773.00 64.42 0.42
2.15.11.1
3 TOT for MGML
person 20
30 0.21 600.00
20 100.00 581.00 96.83 0.21
2.16.9.10
Curriculum development for sectorwise
disability and Training materals
development in visual impairment times 2
200 0.14 400.00
2 100.00 400.00 100.00 0.14
2.16.9.14 Publication of education information journal
times 3
350 0.37 1050.00
3 100.00 1043.00 99.33 0.37
2.16.9.15 Development of NCED Digdarshan and its
publication times 1
500 0.18 500.00
1 100.00 498.00 99.60 0.18
2.16.9.18 Development of integrated working
directives for NCED times 1
400 0.14 400.00
1 100.00 389.50 97.37 0.14
2.16.9.19 Revision of the 5 theme packages on online
offline professional development programs times 5
60 0.11 300.00
5 100.00 263.00 87.67 0.11
2.16.9.2 Revision of the package of CD for teachers
professional organizations' leaders times 1
200 0.07 200.00 0.00 0.00 0.00
2.16.9.21 Development of exercise book in 3 subjects
of open school students of secondary level subject 3
200 0.21 600.00
3 100.00 600.00 100.00 0.21
2.16.9.23 Development of CD and handing over to
NCED for its maximum use per 100
6 0.21 600.00 0.00 0.00 0.00
2.16.9.3 Development of resource materials for TPD /
HM training in additional 3 subjects subject 3
250 0.26 750.00
3 100.00 683.68 91.16 0.26
2.16.9.5 Portal development for teachers and
instructors professional development times 2
300 0.21 600.00
2 100.00 524.00 87.33 0.21
2.16.9.6
Development and transmission of audio
visual material materials for grade 10
students of open schools types 20
50 0.35 1000.00
20 100.00 1000.00 100.00 0.35
2.16.9.7 development and distribution of audiovisual
aids in basic level English times 1
300 0.11 300.00
1 100.00 293.00 97.67 0.11

Status Report -2015 Page 241
Program
code
Programs Unit Annual goal of FY 2014/015 Annual progress
Phys
ical
qty
Unit cost Weitage budget Phys
ical
qty
physical
percenta
ge
Expenditure
Expen
diture
Perce
ntage
weitage
2.16.9.9
Development of audiovisual aids to develop
teachers' ICT skills - 3 materials
development for 1 hour times 3
200 0.21 600.00
3 100.00 600.00 100.00 0.21
Teacher Management
0.00 0.00
2.14.2.6 30 days Inservice training for class II and III
officers of education service person 60
45 0.95 2700.00
38 63.33 2643.00 97.89 0.60
2.14.1.13
.1
Job induction training for novice class III
officers person 13
35 0.16 450.00
13 100.00 414.00 92.00 0.16
2.14.2.8 5 days high level seminar on educational
policy issues for class I officers times 1
1,100 0.39 1100.00 0.00 0.00 0.00
2.14.2.9 One month training for technical assistant person 20
40 0.28 800.00
14 70.00 800.00 100.00 0.20
2.14.2.14 Capacity development on ICT use times 2
800 0.56 1600.00
2 100.00 725.56 45.35 0.56
2.15.1.28 Capacity development of NCED staff person 25
60 0.53 1500.00
25 100.00 356.00 23.73 0.53
2.14.2.15 Capacity development on financial and
procurement management person 20
20 0.14 400.00
20 100.00 353.00 88.25 0.14
2.15.7.2 Quality Certification of centrally developed
materials times 1
300 0.11 300.00
1 100.00 300.00 100.00 0.11
2.15.8.3 Nepali translation of executive summary of
last two years research times 1
300 0.11 300.00
1 100.00 299.45 99.82 0.11
2.15.8.5
Study of centrally developed materials with
respect to different aspects- gender,
language, human right, inclusion etc times 1
1,000 0.35 1000.00
1 100.00 286.00 28.60 0.35
2.15.3.13
7
Capacity development for monitoring and
evaluation person 40
30 0.42 1200.00
41 102.50 1027.00 85.58 0.43
2.15.9.10
Guidelines development for coordination
meeting, program dissemination, monthly
and quarterly publication, annual progress
review, update TPD plan, and ASIP times 15
50 0.26 750.00
15 100.00 750.00 100.00 0.26
2.15.14.3
5 Communication coordination consolidation
times 1
500 0.18 500.00 0.00 0.00 0.00
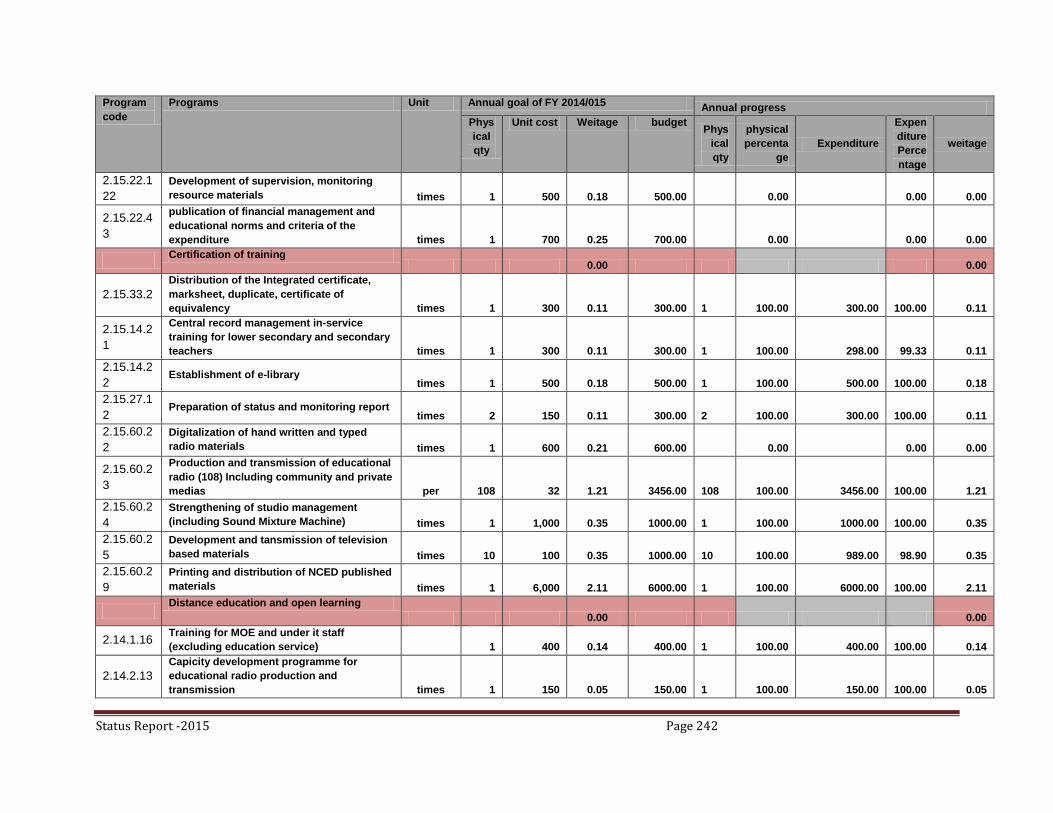
Status Report -2015 Page 242
Program
code
Programs Unit Annual goal of FY 2014/015 Annual progress
Phys
ical
qty
Unit cost Weitage budget Phys
ical
qty
physical
percenta
ge
Expenditure
Expen
diture
Perce
ntage
weitage
2.15.22.1
22
Development of supervision, monitoring
resource materials times 1
500 0.18 500.00 0.00 0.00 0.00
2.15.22.4
3
publication of financial management and
educational norms and criteria of the
expenditure times 1
700 0.25 700.00 0.00 0.00 0.00
Certification of training
0.00 0.00
2.15.33.2
Distribution of the Integrated certificate,
marksheet, duplicate, certificate of
equivalency times 1
300 0.11 300.00
1 100.00 300.00 100.00 0.11
2.15.14.2
1
Central record management in-service
training for lower secondary and secondary
teachers times 1
300 0.11 300.00
1 100.00 298.00 99.33 0.11
2.15.14.2
2 Establishment of e-library
times 1
500 0.18 500.00
1 100.00 500.00 100.00 0.18
2.15.27.1
2 Preparation of status and monitoring report
times 2
150 0.11 300.00
2 100.00 300.00 100.00 0.11
2.15.60.2
2
Digitalization of hand written and typed
radio materials times 1
600 0.21 600.00 0.00 0.00 0.00
2.15.60.2
3
Production and transmission of educational
radio (108) Including community and private
medias per 108
32 1.21 3456.00
108 100.00 3456.00 100.00 1.21
2.15.60.2
4
Strengthening of studio management
(including Sound Mixture Machine) times 1
1,000 0.35 1000.00
1 100.00 1000.00 100.00 0.35
2.15.60.2
5
Development and tansmission of television
based materials times 10
100 0.35 1000.00
10 100.00 989.00 98.90 0.35
2.15.60.2
9
Printing and distribution of NCED published
materials times 1
6,000 2.11 6000.00
1 100.00 6000.00 100.00 2.11
Distance education and open learning
0.00 0.00
2.14.1.16 Training for MOE and under it staff
(excluding education service) 1
400 0.14 400.00
1 100.00 400.00 100.00 0.14
2.14.2.13
Capicity development programme for
educational radio production and
transmission times 1
150 0.05 150.00
1 100.00 150.00 100.00 0.05
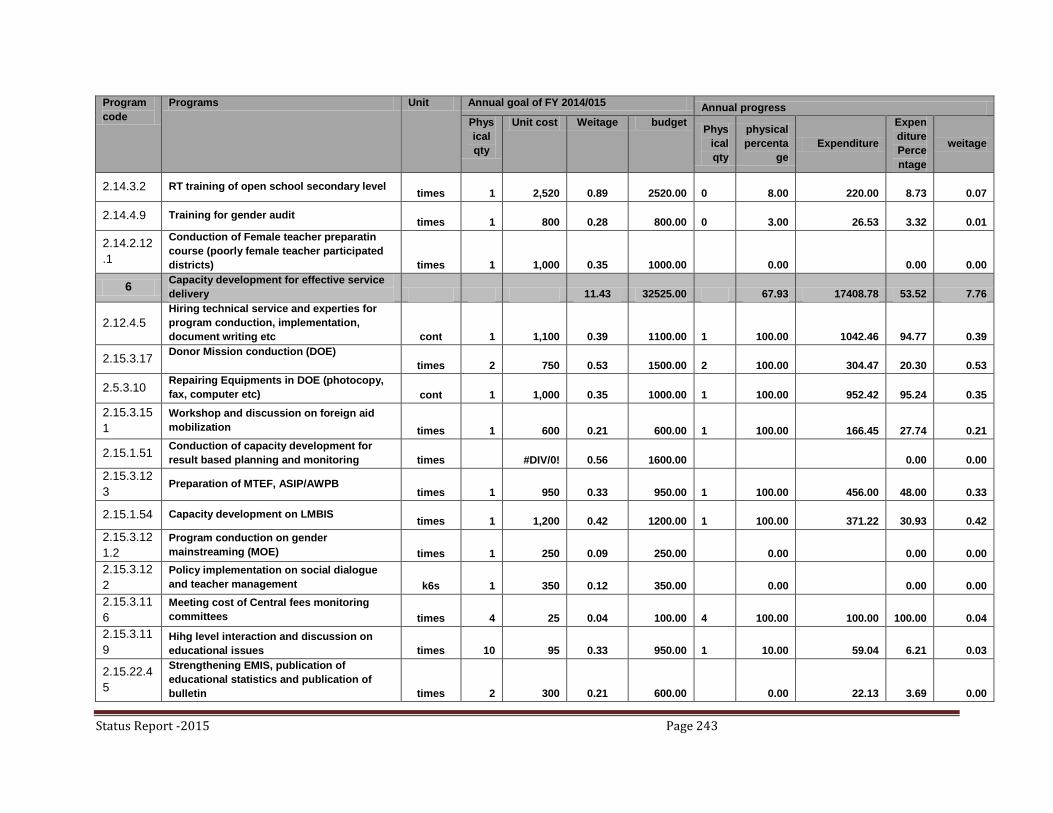
Status Report -2015 Page 243
Program
code
Programs Unit Annual goal of FY 2014/015 Annual progress
Phys
ical
qty
Unit cost Weitage budget Phys
ical
qty
physical
percenta
ge
Expenditure
Expen
diture
Perce
ntage
weitage
2.14.3.2 RT training of open school secondary level times 1
2,520 0.89 2520.00
0 8.00 220.00 8.73 0.07
2.14.4.9 Training for gender audit times 1
800 0.28 800.00
0 3.00 26.53 3.32 0.01
2.14.2.12
.1
Conduction of Female teacher preparatin
course (poorly female teacher participated
districts) times 1
1,000 0.35 1000.00 0.00 0.00 0.00
6 Capacity development for effective service
delivery 11.43 32525.00 67.93 17408.78 53.52 7.76
2.12.4.5
Hiring technical service and experties for
program conduction, implementation,
document writing etc cont 1
1,100 0.39 1100.00
1 100.00 1042.46 94.77 0.39
2.15.3.17 Donor Mission conduction (DOE)
times 2
750 0.53 1500.00
2 100.00 304.47 20.30 0.53
2.5.3.10 Repairing Equipments in DOE (photocopy,
fax, computer etc) cont 1
1,000 0.35 1000.00
1 100.00 952.42 95.24 0.35
2.15.3.15
1
Workshop and discussion on foreign aid
mobilization times 1
600 0.21 600.00
1 100.00 166.45 27.74 0.21
2.15.1.51 Conduction of capacity development for
result based planning and monitoring times #DIV/0! 0.56 1600.00 0.00 0.00
2.15.3.12
3 Preparation of MTEF, ASIP/AWPB
times 1
950 0.33 950.00
1 100.00 456.00 48.00 0.33
2.15.1.54 Capacity development on LMBIS times 1
1,200 0.42 1200.00
1 100.00 371.22 30.93 0.42
2.15.3.12
1.2
Program conduction on gender
mainstreaming (MOE) times 1
250 0.09 250.00 0.00 0.00 0.00
2.15.3.12
2
Policy implementation on social dialogue
and teacher management k6s 1
350 0.12 350.00 0.00 0.00 0.00
2.15.3.11
6
Meeting cost of Central fees monitoring
committees times 4
25 0.04 100.00
4 100.00 100.00 100.00 0.04
2.15.3.11
9 Hihg level interaction and discussion on
educational issues times 10
95 0.33 950.00
1 10.00 59.04 6.21 0.03
2.15.22.4
5
Strengthening EMIS, publication of
educational statistics and publication of
bulletin times 2
300 0.21 600.00 0.00 22.13 3.69 0.00

Status Report -2015 Page 244
Program
code
Programs Unit Annual goal of FY 2014/015 Annual progress
Phys
ical
qty
Unit cost Weitage budget Phys
ical
qty
physical
percenta
ge
Expenditure
Expen
diture
Perce
ntage
weitage
2.15.3.11
8 Program for inspection and good
governance times 1
350 0.12 350.00
1 100.00 291.83 83.38 0.12
2.9.4.2 improvement of public library management times 1
200 0.07 200.00
1 100.00 180.86 90.43 0.07
2.15.3.19
Program implementation on School
restructuring/ merging program and
disseminations of guidelines times 1
500 0.18 500.00 0.00 0.00 0.00
2.15.3.27
5
Update of integrated result oriented
monitoring and evaluation system times 1
400 0.14 400.00 0.00 0.00 0.00
2.15.3.20 Interaction on school physical facilities (for
enginers and sub-engineers) person 180
15 0.95 2700.00 0.00 0.00 0.00
2.12.3.3 Hiring expert service for school EQ safety
programme
purchas
e ७५
180 4.74 13500.00
75 100.00 13068.11 96.80 4.74
2.12.3.4
Hiring expert service to develop guidelines
with alternative design of after earthquake
school construction
purchas
e
1
1,500 0.53 1500.00
1 100.00 393.80 26.25 0.53
2.12.3.5 Purchasing consultation service for
Drawing, design, of DEO buildings purchas
e 1
500 0.18 500.00 0.00 0.00 0.00
2.15.3.12
0
Interaction and discussion among
stakeholders on educational issues times 1
350 0.12 350.00 0.00 0.00 0.00
2.15.3.21 Personnel capacity development person 100
15 0.54 1525.00 0.00 0.00 0.00
2.3.3.3 Staff bus hire (for central level) agency 2
400 0.28 800.00 0.00 0.00 0.00
7 School management and monitoring 30.48 86767.96 88.82 56196.01 64.77 27.07
2.15.3.34 Preparation of FMR and Project Account times 4
150 0.21 600.00 0.00 0.00 0.00
2.15.3.35 Update of FMIS and PFM Action Plan
activities times 1
500 0.18 500.00
1 100.00 282.50 56.50 0.18
2.15.22.1
2
Quarterly publication of program monitoring
report times 3
200 0.21 600.00
3 100.00 125.00 20.83 0.21
2.15.3.22 Monthly progress report review of central
level agencies times 12
60 0.25 720.00
12 100.00 43.57 6.05 0.25
2.15.3.23 Development of integrated monitoring plan
tools times 1
400 0.14 400.00 0.00 0.00 0.00

Status Report -2015 Page 245
Program
code
Programs Unit Annual goal of FY 2014/015 Annual progress
Phys
ical
qty
Unit cost Weitage budget Phys
ical
qty
physical
percenta
ge
Expenditure
Expen
diture
Perce
ntage
weitage
2.15.3.24 ASIP/AWPB, Business Plan preparation cont 1
600 0.21 600.00
1 100.00 17.65 2.94 0.21
2.15.3.31
Co- work with national level students'
organizations for the development of school
education number 4
100 0.14 400.00
2 50.00 27.71 6.93 0.07
2.15.3.32 Teacher details update and publication times 1
350 0.12 350.00
1 100.00 280.54 80.15 0.12
2.15.3.39 Analysis and update of GIS based mapping
and data cont 1
1,000 0.35 1000.00 0.00 0.00 0.00
2.15.3.24
6
Program conduction for ICT promotion,
improvement of school governance, and
raising awareness in the collaboration with
educational medias times 3
933 0.98 2800.00 0.00 0.00 0.00
2.15.3.25
5 School property record and dissemination times 1
850 0.30 850.00 0.00 0.00 0.00
2.15.3.24
3
Joint workshop on effective mobilization
and coordination of I?NGOs times #DIV/0! 0.28 800.00 0.00 0.00
2.15.3.26
Awareness program in the collaboration
with journalist group, education network,
and other organizations working in the field
of education times 1
500 0.18 500.00 0.00 0.00 0.00
2.15.3.27
Conduction of program dissemination,
workshop, thematic team meeting, DEO
workshop times 10
620 2.18 6200.00
10 100.00 5510.66 88.88 2.18
2.15.3.28
Workshop on strengthening financial
management (central level study, compile,
modify the proposals of districts) times 1
500 0.18 500.00
1 100.00 492.90 98.58 0.18
2.15.3.29
Periodic discussion and interaction on
educational issues with NPC, MOF, MOE,
and development partners cont 1
1,100 0.39 1100.00 0.00 0.00
2.13.2.1,
3.1,4.3,5.
3
Salary for the staff working in contract in
the central level
cont 420
47 6.91 19672.00
420 100.00 16136.02 82.03 6.91
1.1.1.1.1
2,14,
Salary for the staff (permanent but working
in temporary position in central level) cont 1
18,039 6.34 18039.00
1 100.00 13585.39 75.31 6.34

Status Report -2015 Page 246
Program
code
Programs Unit Annual goal of FY 2014/015 Annual progress
Phys
ical
qty
Unit cost Weitage budget Phys
ical
qty
physical
percenta
ge
Expenditure
Expen
diture
Perce
ntage
weitage
15,16
2.15.23.1
Collaboration with Nepal Journalists'
Federation and prize distribution on
implementation of SSRP times 1
1,000 0.35 1000.00
1 100.00 1000.00 100.00 0.35
2.15.22.1
4
lImplementation of ASIP for free and
compulsory education times 1
750 0.26 750.00
1 100.00 317.44 42.33 0.26
2.15.22.1
5
Development of collection and publice
community managed schools' good practice per 500
1 0.09 250.00 0.00 0.00 0.00
2.15.22.2
2
Publication and distribution of good
practice from districts and regions per 1,500
- 0.00 0.00 0.00 0.00
2.15.22.1
6
Standard of quality education,
determination of learning achievement and
projection guidelines times 1
300 0.11 300.00 0.00 0.00 0.00
2.15.22.1
33
Social audit guidelines revision and
dissemination times 1
500 0.18 500.00 0.00 0.00 0.00
2.15.22.1
10
Update of the guidelines of Volunteer
mobilization and PPP guidelines times 1
400 0.14 400.00 0.00 0.00 0.00
2.15.27.4 Preparation of Annual status report and IPR times 1
800 0.28 800.00
1 100.00 546.07 68.26 0.28
2.19.1.7 Program monitoring cost
cont 1 7500 2.63 7500.00
1 100.00 6175.64 82.34 2.63
2.15.3.88 Program management expenditure
cont 1
19,637 6.90 19636.96
1 100.00 11654.92 59.35 6.90
1. Capital cost
1.32 3770.00
- 20.29 590.99 15.68 0.27
2. Total recurrent cost
98.68 280898.96 74.83 159209.22 56.68 73.84
3. Total cost for capital and recurrent
100.00 284668.96 74.10 159800.21 56.14 74.10
4. Utility cost
0.00 0.00
5. Office operation cost
0.00
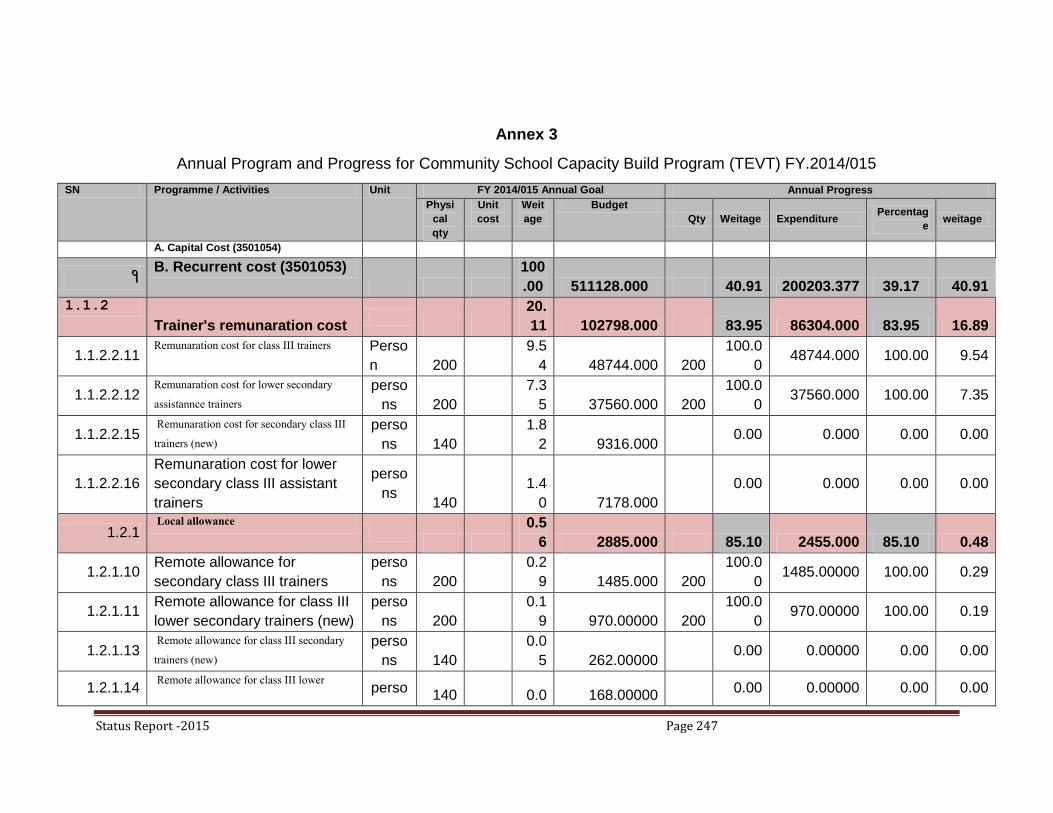
Status Report -2015 Page 247
Annex 3
Annual Program and Progress for Community School Capacity Build Program (TEVT) FY.2014/015
SN Programme / Activities Unit FY 2014/015 Annual Goal Annual Progress
Physi
cal
qty
Unit
cost
Weit
age
Budget
Qty Weitage Expenditure Percentag
e weitage
A. Capital Cost (3501054)
1 B. Recurrent cost (3501053)
100
.00 511128.000 40.91 200203.377 39.17 40.91 1.1.2
Trainer's remunaration cost
20.
11 102798.000 83.95 86304.000 83.95 16.89
1.1.2.2.11 Remunaration cost for class III trainers Perso
n 200
9.5
4 48744.000
200
100.0
0 48744.000 100.00 9.54
1.1.2.2.12 Remunaration cost for lower secondary
assistannce trainers
perso
ns 200
7.3
5 37560.000
200
100.0
0 37560.000 100.00 7.35
1.1.2.2.15 Remunaration cost for secondary class III
trainers (new)
perso
ns 140
1.8
2 9316.000 0.00 0.000 0.00 0.00
1.1.2.2.16
Remunaration cost for lower
secondary class III assistant
trainers
perso
ns 140
1.4
0 7178.000
0.00 0.000 0.00 0.00
1.2.1 Local allowance
0.5
6 2885.000 85.10 2455.000 85.10 0.48
1.2.1.10 Remote allowance for
secondary class III trainers
perso
ns 200
0.2
9 1485.000
200
100.0
0 1485.00000 100.00 0.29
1.2.1.11 Remote allowance for class III
lower secondary trainers (new)
perso
ns 200
0.1
9 970.00000
200
100.0
0 970.00000 100.00 0.19
1.2.1.13 Remote allowance for class III secondary
trainers (new)
perso
ns 140
0.0
5 262.00000 0.00 0.00000 0.00 0.00
1.2.1.14 Remote allowance for class III lower
perso140 0.0 168.00000 0.00 0.00000 0.00 0.00
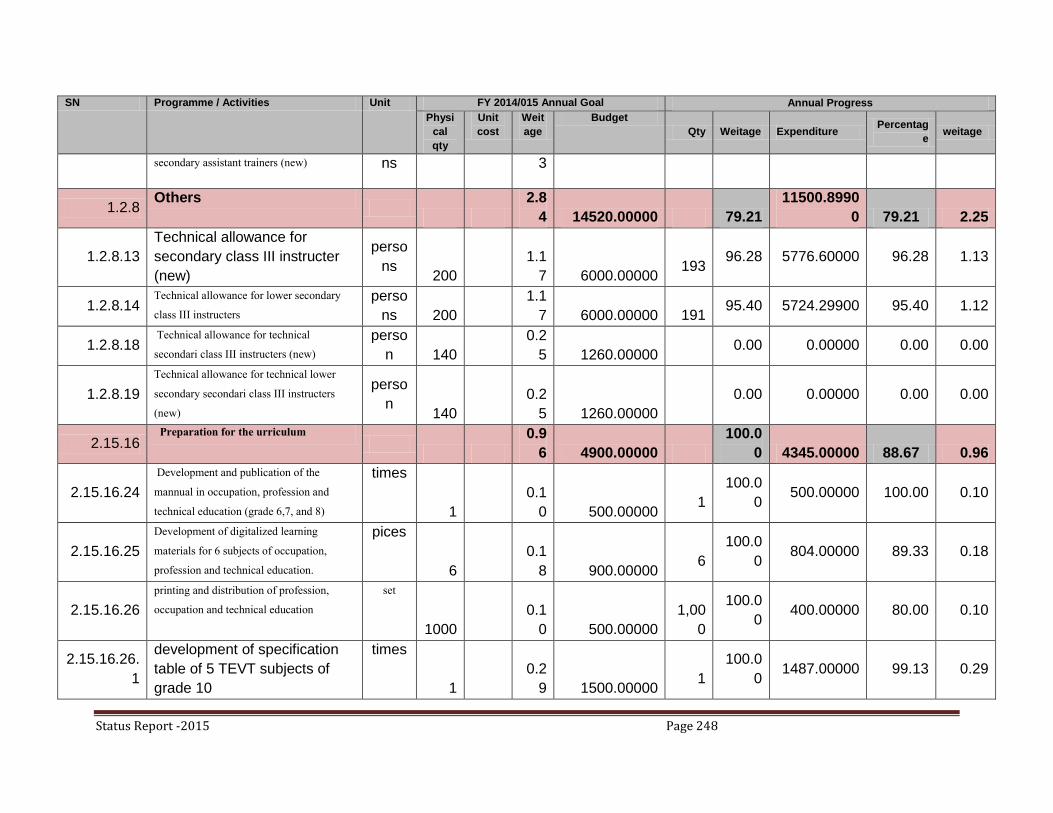
Status Report -2015 Page 248
SN Programme / Activities Unit FY 2014/015 Annual Goal Annual Progress
Physi
cal
qty
Unit
cost
Weit
age
Budget
Qty Weitage Expenditure Percentag
e weitage
secondary assistant trainers (new) ns 3
1.2.8 Others
2.8
4 14520.00000 79.21
11500.8990
0 79.21 2.25
1.2.8.13
Technical allowance for
secondary class III instructer
(new)
perso
ns 200
1.1
7 6000.00000
193 96.28 5776.60000 96.28 1.13
1.2.8.14 Technical allowance for lower secondary
class III instructers
perso
ns 200
1.1
7 6000.00000
191 95.40 5724.29900 95.40 1.12
1.2.8.18 Technical allowance for technical
secondari class III instructers (new)
perso
n 140
0.2
5 1260.00000 0.00 0.00000 0.00 0.00
1.2.8.19
Technical allowance for technical lower
secondary secondari class III instructers
(new)
perso
n 140
0.2
5 1260.00000
0.00 0.00000 0.00 0.00
2.15.16 Preparation for the urriculum
0.9
6 4900.00000
100.0
0 4345.00000 88.67 0.96
2.15.16.24
Development and publication of the
mannual in occupation, profession and
technical education (grade 6,7, and 8)
times
1
0.1
0 500.00000
1
100.0
0 500.00000 100.00 0.10
2.15.16.25
Development of digitalized learning
materials for 6 subjects of occupation,
profession and technical education.
pices
6
0.1
8 900.00000
6
100.0
0 804.00000 89.33 0.18
2.15.16.26
printing and distribution of profession,
occupation and technical education
set
1000
0.1
0 500.00000
1,00
0
100.0
0 400.00000 80.00 0.10
2.15.16.26.
1
development of specification
table of 5 TEVT subjects of
grade 10
times
1
0.2
9 1500.00000
1
100.0
0 1487.00000 99.13 0.29

Status Report -2015 Page 249
SN Programme / Activities Unit FY 2014/015 Annual Goal Annual Progress
Physi
cal
qty
Unit
cost
Weit
age
Budget
Qty Weitage Expenditure Percentag
e weitage
2.15.16.4.1 Development of 5 optional subject in
secondary level
distric
ts 3
0.2
9 1500.00000
3
100.0
0 1154.00000 76.93 0.29
Material development
printing and distribution
0.1
2 600.00000
1,00
0
100.0
0 600.00000 100.00 0.12
2.15.22.10
6
case study, research work, hand book on
profession, occupation and technical
education
set
1000
0.1
2 600.00000
1,00
0
100.0
0 600.00000 100.00 0.12
2.15.3 Interaction/
orientation/workshop/seminar
2.7
4 14025.00000 32.86 3662.50900 26.11 0.90
2.15.3.223
Orientation on occupation, profession and
technology on TVET soft skill tested
schools
districts
18
0.2
9 1500.00000
1 5.56 23.33300 1.56 0.02
2.15.3.226.
1
Development of monitoring and evaluation
form on TVET soft skill
times
1
0.0
4 200.00000
1
100.0
0 39.03500 19.52 0.04
2.15.3.228 sports base on local and Indigenous
Technology
times
3
0.1
2 600.00000
1 33.33 97.00000 16.17 0.04
2.15.3.236 2 days Orientation for district level focal
person
perso
ns 80
0.3
9 2000.00000 0.00 0.00 0.00
2.15.3.237 Program orientation at the end of grade 10
On the job training
perso
ns 100
0.4
9 2500.00000
100
100.0
0 2425.00000 97.00 0.49
2.15.3.238 Central TEVT steering committee meeting times
1
0.1
0 500.00000
1
100.0
0 195.11500 39.02 0.10
2.15.3.239 TEVT district implementation committee
meeting
districts
70
0.2
2 1125.00000
70
100.0
0 883.02600 78.49 0.22
2.15.3.281 Program implementation for technical
education consolidation
times
1
0.0
2 100.00000 0.00 0.00000 0.00 0.00
2.15.3.331 Orientation to trainers of HM of TVET times 1 1.0 5500.00000 0.00 0.00000 0.00 0.00

Status Report -2015 Page 250
SN Programme / Activities Unit FY 2014/015 Annual Goal Annual Progress
Physi
cal
qty
Unit
cost
Weit
age
Budget
Qty Weitage Expenditure Percentag
e weitage
newly established schools 8
2.15.8 Study/survey/research
0.4
9 2500.00000
0.00 0.00000 0.00 0.00
2.15.8.21 effectiveness study on technical and
vocational education
pices
1
0.4
9 2500.00000 0.00 0.00000 0.00 0.00
2.15.34 School grants
70.
33 359500.00000 25.03
84460.0590
0 23.49 17.61
2.15.34.20 Grants for lab materials pices
100
1.9
6 10000.00000
100
100.0
0 9700.00000 97.00 1.96
2.15.34.21 Per school On the job training (
Internship)
schools
100
7.35
3
9.7
8 50000.00000
100
100.0
0
49492.0600
0 98.98 9.78
2.15.34.24 grants for alternative energy schools
100
3.9
1 20000.00000
100
100.0
0
19677.9990
0 98.39 3.91
2.15.34.25 school cooperations with agencies
(subjectwise technical)
schools
100 100
1.9
6 10000.00000
100
100.0
0 5590.00000 55.90 1.96
2.15.34.46 Lab grants (new)
schools 140
52.
73 269500.00000 0.00 0.00 0.00
2.9.7 Educational materials
1.3
3 6800.00000 90.11 6127.40000 90.11 1.20
2.9.7.7
Educational material for TVET schools perso
ns 6800
1.3
3 6800.00000
6,12
7
90.11 6127.40000 90.11 1.20
2.15.60 program management xpense
0.2
0 1000.00000
100.0
0 369.90000 36.99 0.20
2.15.60.30 program management and preparation times
1
0.2
0 1000.00000
1
100.0
0 369.90000 36.99 0.20
2.19.1 Monitoring evaluation
0.3
1 1600.00000
100.0
0 378.61000 23.66 0.31
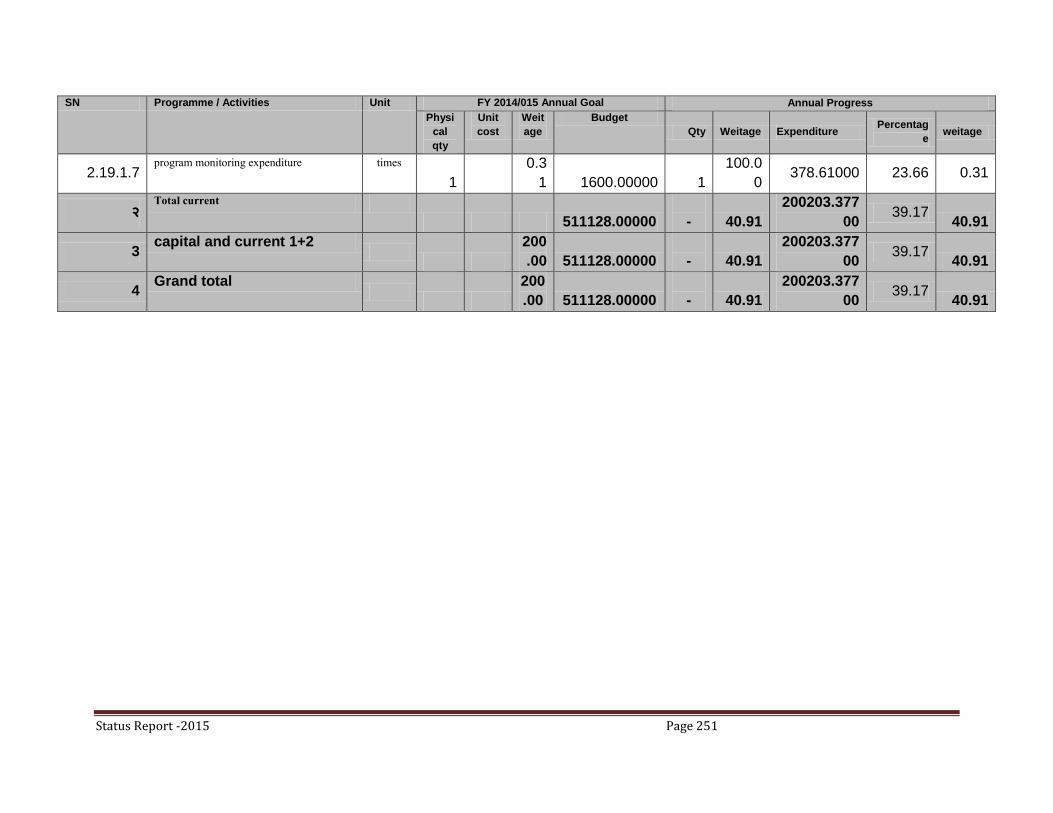
Status Report -2015 Page 251
SN Programme / Activities Unit FY 2014/015 Annual Goal Annual Progress
Physi
cal
qty
Unit
cost
Weit
age
Budget
Qty Weitage Expenditure Percentag
e weitage
2.19.1.7 program monitoring expenditure times
1
0.3
1 1600.00000
1
100.0
0 378.61000 23.66 0.31
२ Total current
511128.00000
- 40.91
200203.377
00 39.17
40.91
3 capital and current 1+2
200
.00 511128.00000
- 40.91
200203.377
00 39.17
40.91
4 Grand total
200
.00 511128.00000
- 40.91
200203.377
00 39.17
40.91

Status Report -2015 Page 252
Annex 4
Annual Program and Progress for Shishubikash Karyakram ECED Program (UNCEF Funded), FY.2014/015
SN
Program/activities Unit
Annual goal of FY 2014/2015 Annual progress line
item Phy
Qty
Unit
cost weitage Budget Qty % Eependiture % weitage
१ २ ३ ४ ५ ६ 7 १७
A. Total capital cost 0.000
B. Current expenditure
Central level programs 10 48405.000 23.68 11444.083 23.6 2.27
ECD & Non-formal programs 10 48405.000 23.68 11444.083 23.6 2.27
१. National equity strategy development 2.6 13065.000 0.00 920.660 7.0 0.00
2.15.3.282 Implementation of National equity strategy activities
2.15.3.282.1 Budget analysis from annual program and budget and ASIP times 1 300 0.1 300.000 0.00 0.000 0.0 0.00 २२५१२
2.15.3.282.2 Analysis of disaster and emergency education strategies times 1 100 0.0 100.000 0.00 0.000 0.0 0.00 २२५१२
2.15.3.282.3 celebration of Global Campaign Week (GAW), SZOP, Violence
against children, "First 1,000 days" of life launched) times 4 100 0.1 400.000 0.00 0.000 0.0 0.00 २२५१२
2.15.3.282.4 conduction of activities related with integrated equity strategy times 2 400 0.2 800.000 0.00 10.660 1.3 0.00 २२५१२
2.15.3.282.5 Finalization and printing of integrated equity strategy strategy number 1500 0.25 0.1 375.000 0.00 0.000 0.0 0.00 २२५१२
2.15.3.282.6 Technical assistanct to orientation of equity strategy in district
level district 15 30 0.1 450.000 0.00 0.000 0.0 0.00 २२५१२
2.15.3.282.7 ICT mobilization for learning improvement, equity strategy,
school as peace zone, and child protection region 5 400 0.4 2000.000 0.00 510.000 25.5 0.00 २२५१२
2.15.3.282.8 CD of gender focal point central level person 40 15 0.1 600.000 0.00 0.000 0.0 0.00 २२५१२
2.15.3.282.9 CD of gender focal point regional level person 80 35 0.6 2800.000 0.00 0.000 0.0 0.00 २२५१२
2.15.3.282.10 Conduction of partnership program with gender related I/NGOs times 1 100 0.0 100.000 0.00 0.000 0.0 0.00 २२५१२
2.15.3.282.11 Meeting conduction of children, education and gender equity
network times 12 20 0.0 240.000 0.00 0.000 0.0 0.00 २२५१२
2.15.3.282.12 Material development on child education and gender equity number 1000 0.2 0.0 200.000 0.00 0.000 0.0 0.00 २२५१२
2.15.3.282.13 Programs related to implementation of suggestions from
stakeholders on the basis of SSR Extention Plan times 1 250 0.0 250.000 0.00 0.000 0.0 0.00 २२५१२
2.15.3.282.14 Interaction with educationionists on Post 2015 education times 1 300 0.1 300.000 0.00 0.000 0.0 0.00 २२५१२
2.15.3.282.15 Orientation to teacher trade unions on contemporary education
policy and program implementation area 2 350 0.1 700.000 0.00 0.000 0.0 0.00 २२५१२
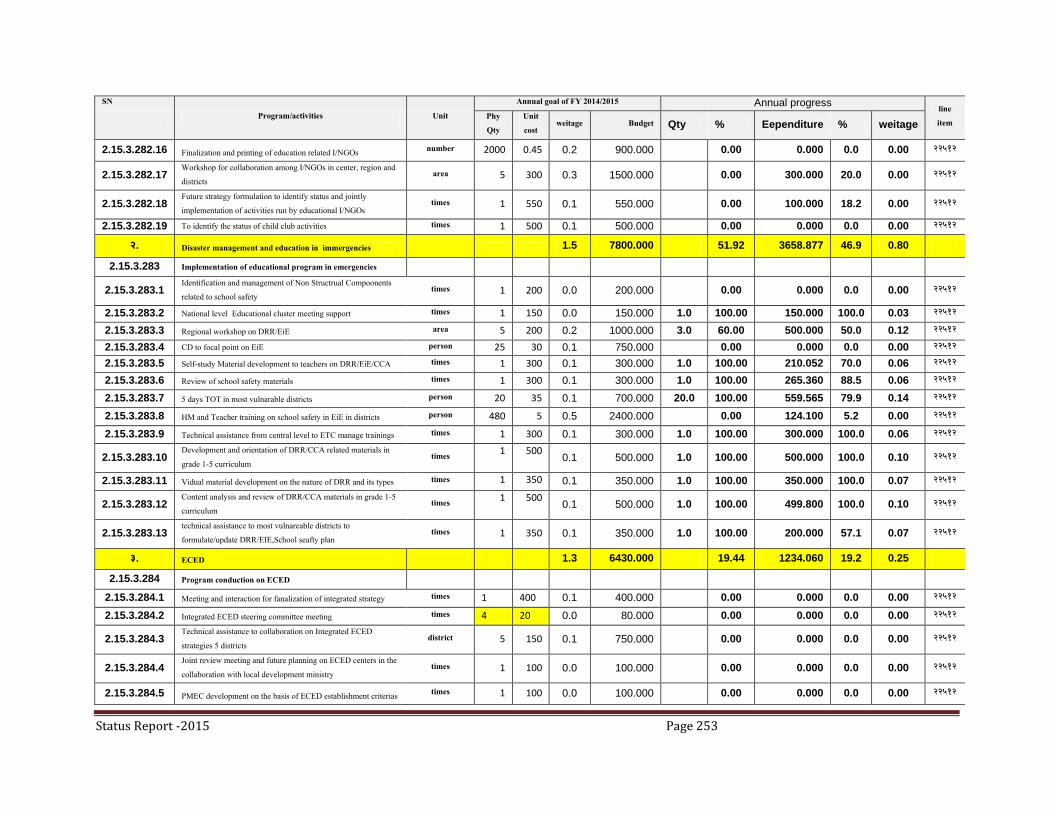
Status Report -2015 Page 253
SN
Program/activities Unit
Annual goal of FY 2014/2015 Annual progress line
item Phy
Qty
Unit
cost weitage Budget Qty % Eependiture % weitage
2.15.3.282.16 Finalization and printing of education related I/NGOs number 2000 0.45 0.2 900.000 0.00 0.000 0.0 0.00 २२५१२
2.15.3.282.17 Workshop for collaboration among I/NGOs in center, region and
districts area 5 300 0.3 1500.000 0.00 300.000 20.0 0.00 २२५१२
2.15.3.282.18 Future strategy formulation to identify status and jointly
implementation of activities run by educational I/NGOs times 1 550 0.1 550.000 0.00 100.000 18.2 0.00 २२५१२
2.15.3.282.19 To identify the status of child club activities times 1 500 0.1 500.000 0.00 0.000 0.0 0.00 २२५१२
२. Disaster management and education in immergencies
1.5 7800.000 51.92 3658.877 46.9 0.80
2.15.3.283 Implementation of educational program in emergencies
2.15.3.283.1 Identification and management of Non Structrual Compoonents
related to school safety times 1 200 0.0 200.000 0.00 0.000 0.0 0.00 २२५१२
2.15.3.283.2 National level Educational cluster meeting support times 1 150 0.0 150.000 1.0 100.00 150.000 100.0 0.03 २२५१२
2.15.3.283.3 Regional workshop on DRR/EiE area 5 200 0.2 1000.000 3.0 60.00 500.000 50.0 0.12 २२५१२
2.15.3.283.4 CD to focal point on EiE person 25 30 0.1 750.000 0.00 0.000 0.0 0.00 २२५१२
2.15.3.283.5 Self-study Material development to teachers on DRR/EiE/CCA times 1 300 0.1 300.000 1.0 100.00 210.052 70.0 0.06 २२५१२
2.15.3.283.6 Review of school safety materials times 1 300 0.1 300.000 1.0 100.00 265.360 88.5 0.06 २२५१२
2.15.3.283.7 5 days TOT in most vulnarable districts person 20 35 0.1 700.000 20.0 100.00 559.565 79.9 0.14 २२५१२
2.15.3.283.8 HM and Teacher training on school safety in EiE in districts person 480 5 0.5 2400.000 0.00 124.100 5.2 0.00 २२५१२
2.15.3.283.9 Technical assistance from central level to ETC manage trainings times 1 300 0.1 300.000 1.0 100.00 300.000 100.0 0.06 २२५१२
2.15.3.283.10 Development and orientation of DRR/CCA related materials in
grade 1-5 curriculum times
1 500 0.1 500.000 1.0 100.00 500.000 100.0 0.10 २२५१२
2.15.3.283.11 Vidual material development on the nature of DRR and its types times 1 350 0.1 350.000 1.0 100.00 350.000 100.0 0.07 २२५१२
2.15.3.283.12 Content analysis and review of DRR/CCA materials in grade 1-5
curriculum times
1 500 0.1 500.000 1.0 100.00 499.800 100.0 0.10 २२५१२
2.15.3.283.13 technical assistance to most vulnareable districts to
formulate/update DRR/EIE,School seafty plan times 1 350 0.1 350.000 1.0 100.00 200.000 57.1 0.07 २२५१२
३. ECED 1.3 6430.000 19.44 1234.060 19.2 0.25
2.15.3.284 Program conduction on ECED
2.15.3.284.1 Meeting and interaction for fanalization of integrated strategy times 1 400 0.1 400.000 0.00 0.000 0.0 0.00 २२५१२
2.15.3.284.2 Integrated ECED steering committee meeting times 4 20 0.0 80.000 0.00 0.000 0.0 0.00 २२५१२
2.15.3.284.3 Technical assistance to collaboration on Integrated ECED
strategies 5 districts district 5 150 0.1 750.000 0.00 0.000 0.0 0.00 २२५१२
2.15.3.284.4 Joint review meeting and future planning on ECED centers in the
collaboration with local development ministry times 1 100 0.0 100.000 0.00 0.000 0.0 0.00 २२५१२
2.15.3.284.5 PMEC development on the basis of ECED establishment criterias times 1 100 0.0 100.000 0.00 0.000 0.0 0.00 २२५१२
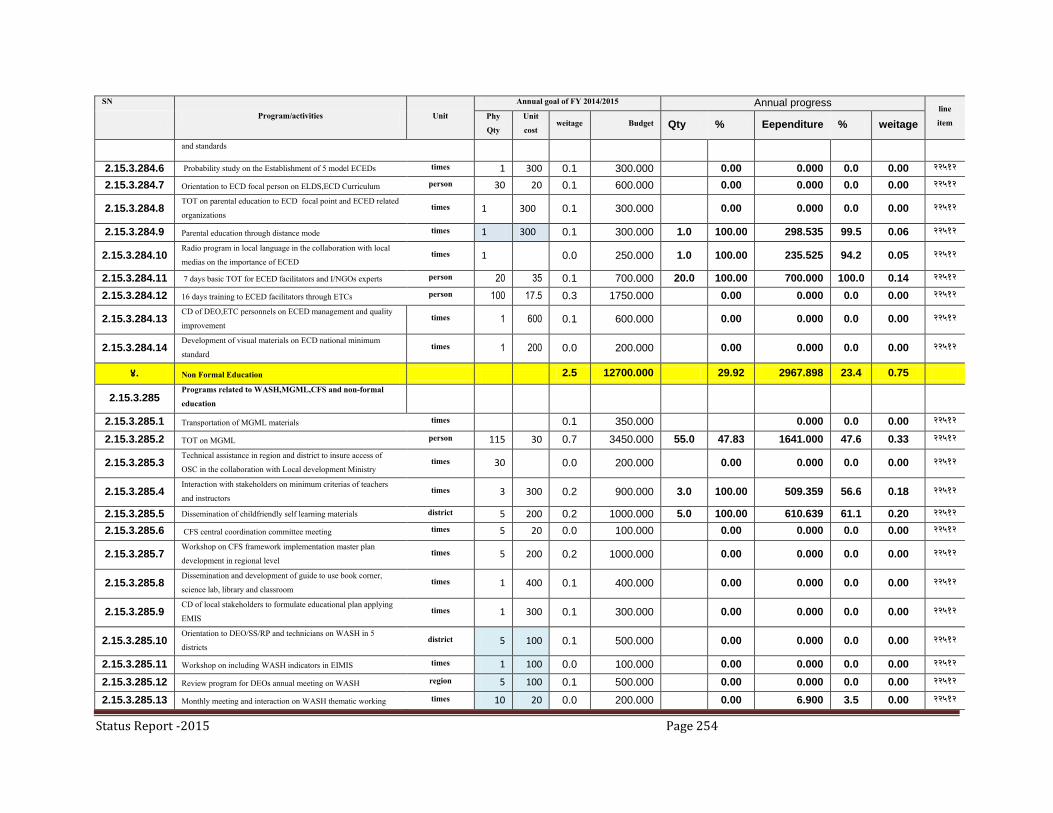
Status Report -2015 Page 254
SN
Program/activities Unit
Annual goal of FY 2014/2015 Annual progress line
item Phy
Qty
Unit
cost weitage Budget Qty % Eependiture % weitage
and standards
2.15.3.284.6 Probability study on the Establishment of 5 model ECEDs times 1 300 0.1 300.000 0.00 0.000 0.0 0.00 २२५१२
2.15.3.284.7 Orientation to ECD focal person on ELDS,ECD Curriculum person 30 20 0.1 600.000 0.00 0.000 0.0 0.00 २२५१२
2.15.3.284.8 TOT on parental education to ECD focal point and ECED related
organizations times 1 300 0.1 300.000 0.00 0.000 0.0 0.00 २२५१२
2.15.3.284.9 Parental education through distance mode times 1 300 0.1 300.000 1.0 100.00 298.535 99.5 0.06 २२५१२
2.15.3.284.10 Radio program in local language in the collaboration with local
medias on the importance of ECED times 1 0.0 250.000 1.0 100.00 235.525 94.2 0.05 २२५१२
2.15.3.284.11 7 days basic TOT for ECED facilitators and I/NGOs experts person 20 35 0.1 700.000 20.0 100.00 700.000 100.0 0.14 २२५१२
2.15.3.284.12 16 days training to ECED facilitators through ETCs person 100 17.5 0.3 1750.000 0.00 0.000 0.0 0.00 २२५१२
2.15.3.284.13 CD of DEO,ETC personnels on ECED management and quality
improvement times 1 600 0.1 600.000 0.00 0.000 0.0 0.00 २२५१२
2.15.3.284.14 Development of visual materials on ECD national minimum
standard times 1 200 0.0 200.000 0.00 0.000 0.0 0.00 २२५१२
४. Non Formal Education 2.5 12700.000 29.92 2967.898 23.4 0.75
2.15.3.285 Programs related to WASH,MGML,CFS and non-formal
education
2.15.3.285.1 Transportation of MGML materials times 0.1 350.000 0.000 0.0 0.00 २२५१२
2.15.3.285.2 TOT on MGML person 115 30 0.7 3450.000 55.0 47.83 1641.000 47.6 0.33 २२५१२
2.15.3.285.3 Technical assistance in region and district to insure access of
OSC in the collaboration with Local development Ministry times 30 0.0 200.000 0.00 0.000 0.0 0.00 २२५१२
2.15.3.285.4 Interaction with stakeholders on minimum criterias of teachers
and instructors times 3 300 0.2 900.000 3.0 100.00 509.359 56.6 0.18 २२५१२
2.15.3.285.5 Dissemination of childfriendly self learning materials district 5 200 0.2 1000.000 5.0 100.00 610.639 61.1 0.20 २२५१२
2.15.3.285.6 CFS central coordination committee meeting times 5 20 0.0 100.000 0.00 0.000 0.0 0.00 २२५१२
2.15.3.285.7 Workshop on CFS framework implementation master plan
development in regional level times 5 200 0.2 1000.000 0.00 0.000 0.0 0.00 २२५१२
2.15.3.285.8 Dissemination and development of guide to use book corner,
science lab, library and classroom times 1 400 0.1 400.000 0.00 0.000 0.0 0.00 २२५१२
2.15.3.285.9 CD of local stakeholders to formulate educational plan applying
EMIS times 1 300 0.1 300.000 0.00 0.000 0.0 0.00 २२५१२
2.15.3.285.10 Orientation to DEO/SS/RP and technicians on WASH in 5
districts district 5 100 0.1 500.000 0.00 0.000 0.0 0.00 २२५१२
2.15.3.285.11 Workshop on including WASH indicators in EIMIS times 1 100 0.0 100.000 0.00 0.000 0.0 0.00 २२५१२
2.15.3.285.12 Review program for DEOs annual meeting on WASH region 5 100 0.1 500.000 0.00 0.000 0.0 0.00 २२५१२
2.15.3.285.13 Monthly meeting and interaction on WASH thematic working times 10 20 0.0 200.000 0.00 6.900 3.5 0.00 २२५१२
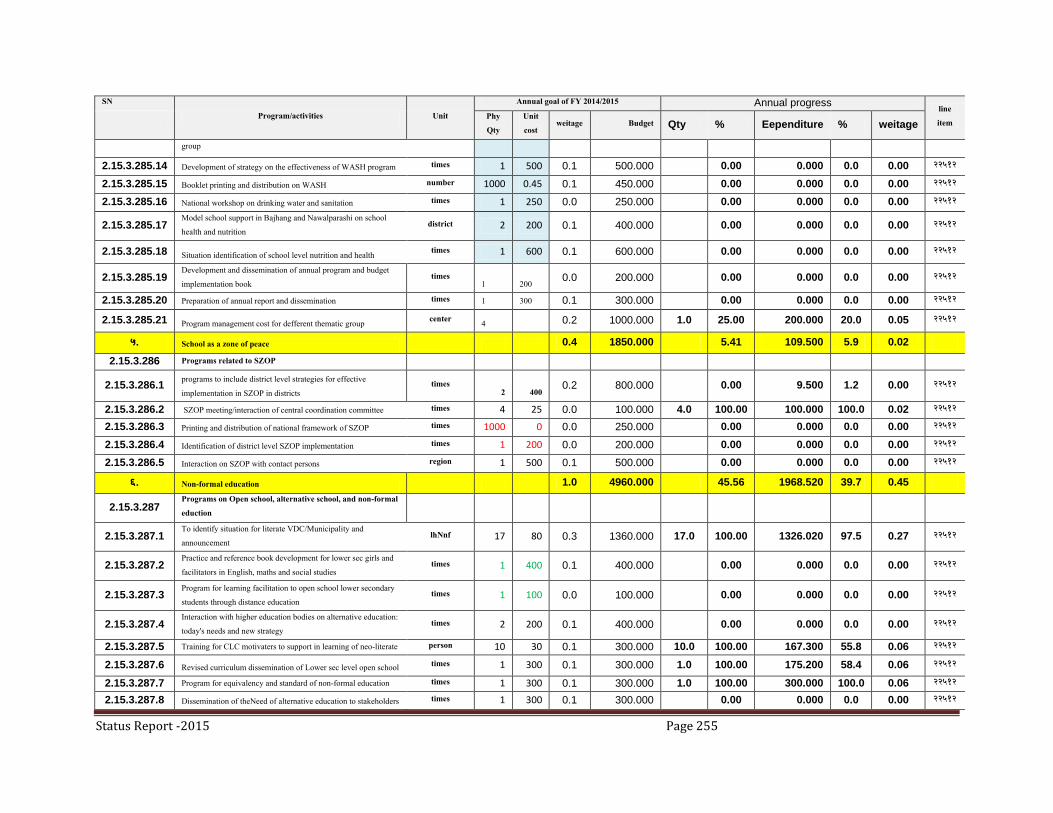
Status Report -2015 Page 255
SN
Program/activities Unit
Annual goal of FY 2014/2015 Annual progress line
item Phy
Qty
Unit
cost weitage Budget Qty % Eependiture % weitage
group
2.15.3.285.14 Development of strategy on the effectiveness of WASH program times 1 500 0.1 500.000 0.00 0.000 0.0 0.00 २२५१२
2.15.3.285.15 Booklet printing and distribution on WASH number 1000 0.45 0.1 450.000 0.00 0.000 0.0 0.00 २२५१२
2.15.3.285.16 National workshop on drinking water and sanitation times 1 250 0.0 250.000 0.00 0.000 0.0 0.00 २२५१२
2.15.3.285.17 Model school support in Bajhang and Nawalparashi on school
health and nutrition district 2 200 0.1 400.000 0.00 0.000 0.0 0.00 २२५१२
2.15.3.285.18 Situation identification of school level nutrition and health times 1 600 0.1 600.000 0.00 0.000 0.0 0.00 २२५१२
2.15.3.285.19 Development and dissemination of annual program and budget
implementation book times
1 200 0.0 200.000 0.00 0.000 0.0 0.00 २२५१२
2.15.3.285.20 Preparation of annual report and dissemination times 1 300 0.1 300.000 0.00 0.000 0.0 0.00 २२५१२
2.15.3.285.21 Program management cost for defferent thematic group center
4 0.2 1000.000 1.0 25.00 200.000 20.0 0.05 २२५१२
५. School as a zone of peace 0.4 1850.000 5.41 109.500 5.9 0.02
2.15.3.286 Programs related to SZOP
2.15.3.286.1 programs to include district level strategies for effective
implementation in SZOP in districts
times 2 400
0.2 800.000 0.00 9.500 1.2 0.00 २२५१२
2.15.3.286.2 SZOP meeting/interaction of central coordination committee times 4 25 0.0 100.000 4.0 100.00 100.000 100.0 0.02 २२५१२
2.15.3.286.3 Printing and distribution of national framework of SZOP times 1000 0 0.0 250.000 0.00 0.000 0.0 0.00 २२५१२
2.15.3.286.4 Identification of district level SZOP implementation times 1 200 0.0 200.000 0.00 0.000 0.0 0.00 २२५१२
2.15.3.286.5 Interaction on SZOP with contact persons region 1 500 0.1 500.000 0.00 0.000 0.0 0.00 २२५१२
६. Non-formal education 1.0 4960.000 45.56 1968.520 39.7 0.45
2.15.3.287 Programs on Open school, alternative school, and non-formal
eduction
2.15.3.287.1 To identify situation for literate VDC/Municipality and
announcement lhNnf 17 80 0.3 1360.000 17.0 100.00 1326.020 97.5 0.27 २२५१२
2.15.3.287.2 Practice and reference book development for lower sec girls and
facilitators in English, maths and social studies times 1 400 0.1 400.000 0.00 0.000 0.0 0.00 २२५१२
2.15.3.287.3 Program for learning facilitation to open school lower secondary
students through distance education times 1 100 0.0 100.000 0.00 0.000 0.0 0.00 २२५१२
2.15.3.287.4 Interaction with higher education bodies on alternative education:
today's needs and new strategy times 2 200 0.1 400.000 0.00 0.000 0.0 0.00 २२५१२
2.15.3.287.5 Training for CLC motivaters to support in learning of neo-literate person 10 30 0.1 300.000 10.0 100.00 167.300 55.8 0.06 २२५१२
2.15.3.287.6 Revised curriculum dissemination of Lower sec level open school times 1 300 0.1 300.000 1.0 100.00 175.200 58.4 0.06 २२५१२
2.15.3.287.7 Program for equivalency and standard of non-formal education times 1 300 0.1 300.000 1.0 100.00 300.000 100.0 0.06 २२५१२
2.15.3.287.8 Dissemination of theNeed of alternative education to stakeholders times 1 300 0.1 300.000 0.00 0.000 0.0 0.00 २२५१२
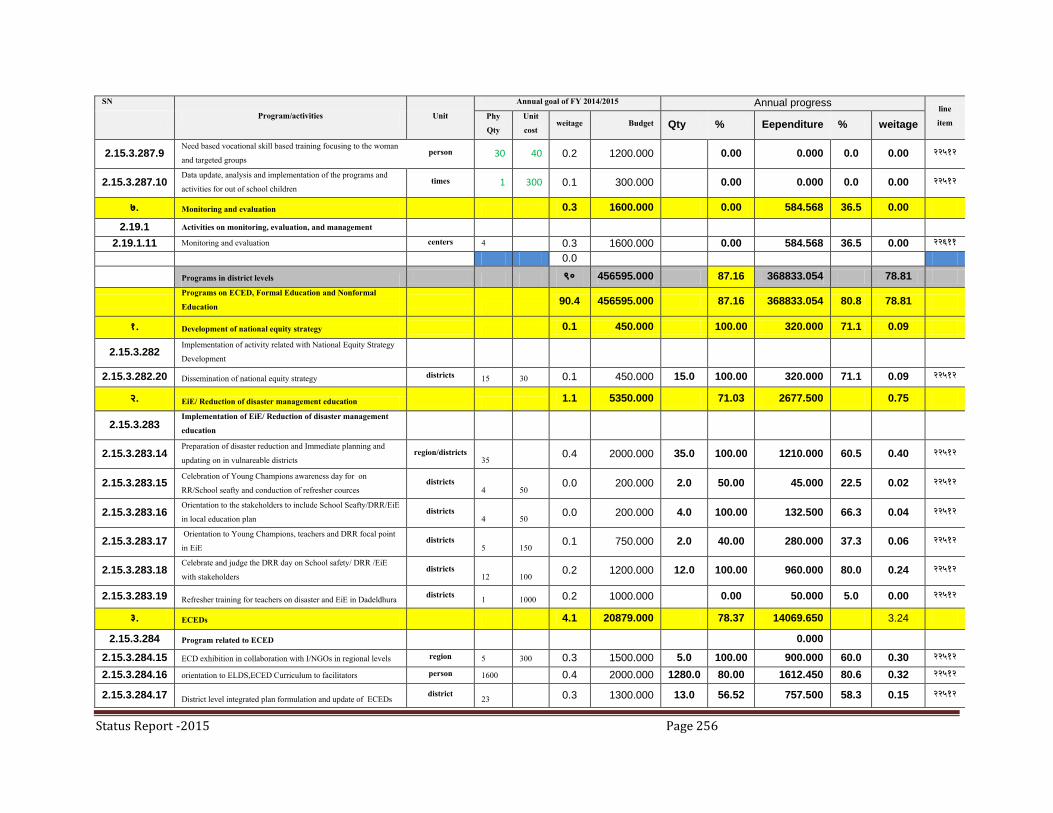
Status Report -2015 Page 256
SN
Program/activities Unit
Annual goal of FY 2014/2015 Annual progress line
item Phy
Qty
Unit
cost weitage Budget Qty % Eependiture % weitage
2.15.3.287.9 Need based vocational skill based training focusing to the woman
and targeted groups person 30 40 0.2 1200.000 0.00 0.000 0.0 0.00 २२५१२
2.15.3.287.10 Data update, analysis and implementation of the programs and
activities for out of school children times 1 300 0.1 300.000 0.00 0.000 0.0 0.00 २२५१२
७. Monitoring and evaluation 0.3 1600.000 0.00 584.568 36.5 0.00
2.19.1 Activities on monitoring, evaluation, and management
2.19.1.11 Monitoring and evaluation centers 4 0.3 1600.000 0.00 584.568 36.5 0.00 २२६११
0.0
Programs in district levels ९० 456595.000 87.16 368833.054 78.81
Programs on ECED, Formal Education and Nonformal
Education
90.4 456595.000 87.16 368833.054 80.8 78.81
१. Development of national equity strategy 0.1 450.000 100.00 320.000 71.1 0.09
2.15.3.282 Implementation of activity related with National Equity Strategy
Development
2.15.3.282.20 Dissemination of national equity strategy districts 15 30 0.1 450.000 15.0 100.00 320.000 71.1 0.09 २२५१२
२. EiE/ Reduction of disaster management education
1.1 5350.000 71.03 2677.500 0.75
2.15.3.283 Implementation of EiE/ Reduction of disaster management
education
2.15.3.283.14 Preparation of disaster reduction and Immediate planning and
updating on in vulnareable districts region/districts
35 0.4 2000.000 35.0 100.00 1210.000 60.5 0.40 २२५१२
2.15.3.283.15 Celebration of Young Champions awareness day for on
RR/School seafty and conduction of refresher cources districts
4 50 0.0 200.000 2.0 50.00 45.000 22.5 0.02 २२५१२
2.15.3.283.16 Orientation to the stakeholders to include School Seafty/DRR/EiE
in local education plan districts
4 50 0.0 200.000 4.0 100.00 132.500 66.3 0.04 २२५१२
2.15.3.283.17 Orientation to Young Champions, teachers and DRR focal point
in EiE districts
5 150 0.1 750.000 2.0 40.00 280.000 37.3 0.06 २२५१२
2.15.3.283.18 Celebrate and judge the DRR day on School safety/ DRR /EiE
with stakeholders districts
12 100 0.2 1200.000 12.0 100.00 960.000 80.0 0.24 २२५१२
2.15.3.283.19 Refresher training for teachers on disaster and EiE in Dadeldhura districts
1 1000 0.2 1000.000 0.00 50.000 5.0 0.00 २२५१२
३. ECEDs 4.1 20879.000 78.37 14069.650 3.24
2.15.3.284 Program related to ECED 0.000
2.15.3.284.15 ECD exhibition in collaboration with I/NGOs in regional levels region 5 300 0.3 1500.000 5.0 100.00 900.000 60.0 0.30 २२५१२
2.15.3.284.16 orientation to ELDS,ECED Curriculum to facilitators person 1600 0.4 2000.000 1280.0 80.00 1612.450 80.6 0.32 २२५१२
2.15.3.284.17 District level integrated plan formulation and update of ECEDs district
23 0.3 1300.000 13.0 56.52 757.500 58.3 0.15 २२५१२
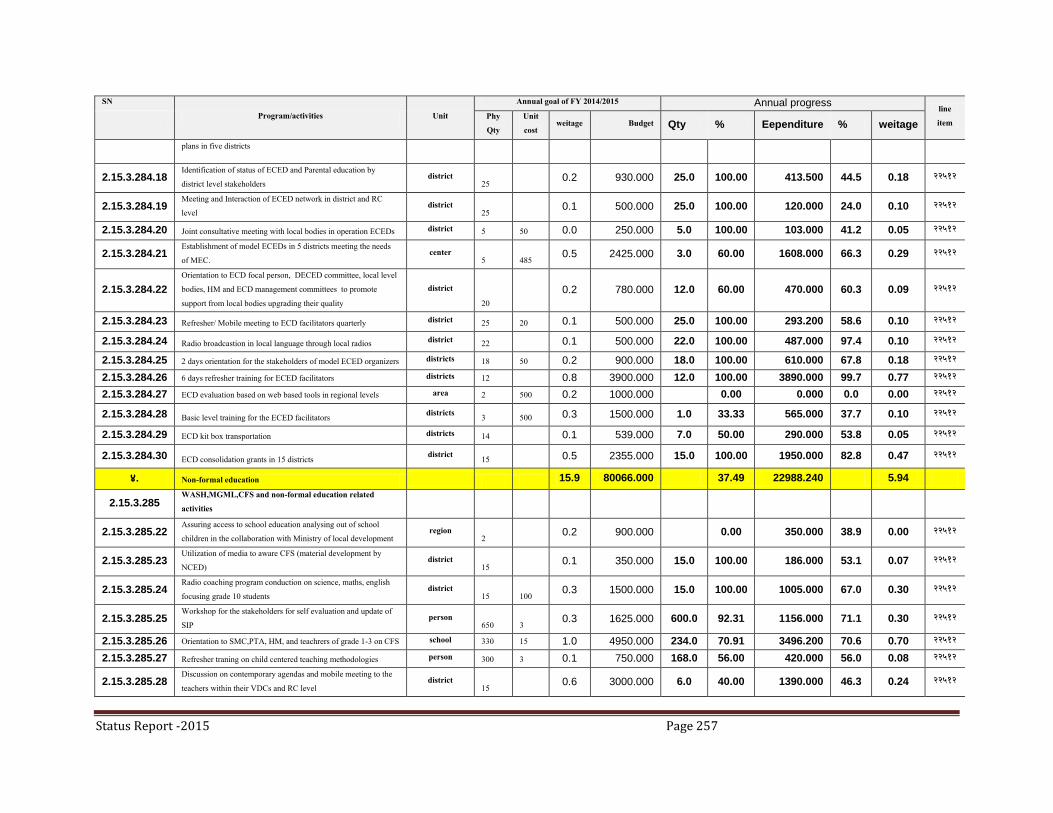
Status Report -2015 Page 257
SN
Program/activities Unit
Annual goal of FY 2014/2015 Annual progress line
item Phy
Qty
Unit
cost weitage Budget Qty % Eependiture % weitage
plans in five districts
2.15.3.284.18 Identification of status of ECED and Parental education by
district level stakeholders district
25 0.2 930.000 25.0 100.00 413.500 44.5 0.18 २२५१२
2.15.3.284.19 Meeting and Interaction of ECED network in district and RC
level district
25 0.1 500.000 25.0 100.00 120.000 24.0 0.10 २२५१२
2.15.3.284.20 Joint consultative meeting with local bodies in operation ECEDs district 5 50 0.0 250.000 5.0 100.00 103.000 41.2 0.05 २२५१२
2.15.3.284.21 Establishment of model ECEDs in 5 districts meeting the needs
of MEC. center
5 485 0.5 2425.000 3.0 60.00 1608.000 66.3 0.29 २२५१२
2.15.3.284.22
Orientation to ECD focal person, DECED committee, local level
bodies, HM and ECD management committees to promote
support from local bodies upgrading their quality
district
20
0.2 780.000 12.0 60.00 470.000 60.3 0.09 २२५१२
2.15.3.284.23 Refresher/ Mobile meeting to ECD facilitators quarterly district 25 20 0.1 500.000 25.0 100.00 293.200 58.6 0.10 २२५१२
2.15.3.284.24 Radio broadcastion in local language through local radios district
22 0.1 500.000 22.0 100.00 487.000 97.4 0.10 २२५१२
2.15.3.284.25 2 days orientation for the stakeholders of model ECED organizers districts 18 50 0.2 900.000 18.0 100.00 610.000 67.8 0.18 २२५१२
2.15.3.284.26 6 days refresher training for ECED facilitators districts 12 0.8 3900.000 12.0 100.00 3890.000 99.7 0.77 २२५१२
2.15.3.284.27 ECD evaluation based on web based tools in regional levels area 2 500 0.2 1000.000 0.00 0.000 0.0 0.00 २२५१२
2.15.3.284.28 Basic level training for the ECED facilitators districts
3 500 0.3 1500.000 1.0 33.33 565.000 37.7 0.10 २२५१२
2.15.3.284.29 ECD kit box transportation districts 14 0.1 539.000 7.0 50.00 290.000 53.8 0.05 २२५१२
2.15.3.284.30 ECD consolidation grants in 15 districts district
15 0.5 2355.000 15.0 100.00 1950.000 82.8 0.47 २२५१२
४. Non-formal education 15.9 80066.000 37.49 22988.240 5.94
2.15.3.285 WASH,MGML,CFS and non-formal education related
activities
2.15.3.285.22 Assuring access to school education analysing out of school
children in the collaboration with Ministry of local development region
2 0.2 900.000 0.00 350.000 38.9 0.00 २२५१२
2.15.3.285.23 Utilization of media to aware CFS (material development by
NCED) district
15 0.1 350.000 15.0 100.00 186.000 53.1 0.07 २२५१२
2.15.3.285.24 Radio coaching program conduction on science, maths, english
focusing grade 10 students district
15 100 0.3 1500.000 15.0 100.00 1005.000 67.0 0.30 २२५१२
2.15.3.285.25 Workshop for the stakeholders for self evaluation and update of
SIP person
650 3 0.3 1625.000 600.0 92.31 1156.000 71.1 0.30 २२५१२
2.15.3.285.26 Orientation to SMC,PTA, HM, and teachrers of grade 1-3 on CFS school 330 15 1.0 4950.000 234.0 70.91 3496.200 70.6 0.70 २२५१२
2.15.3.285.27 Refresher traning on child centered teaching methodologies person 300 3 0.1 750.000 168.0 56.00 420.000 56.0 0.08 २२५१२
2.15.3.285.28 Discussion on contemporary agendas and mobile meeting to the
teachers within their VDCs and RC level district
15 0.6 3000.000 6.0 40.00 1390.000 46.3 0.24 २२५१२
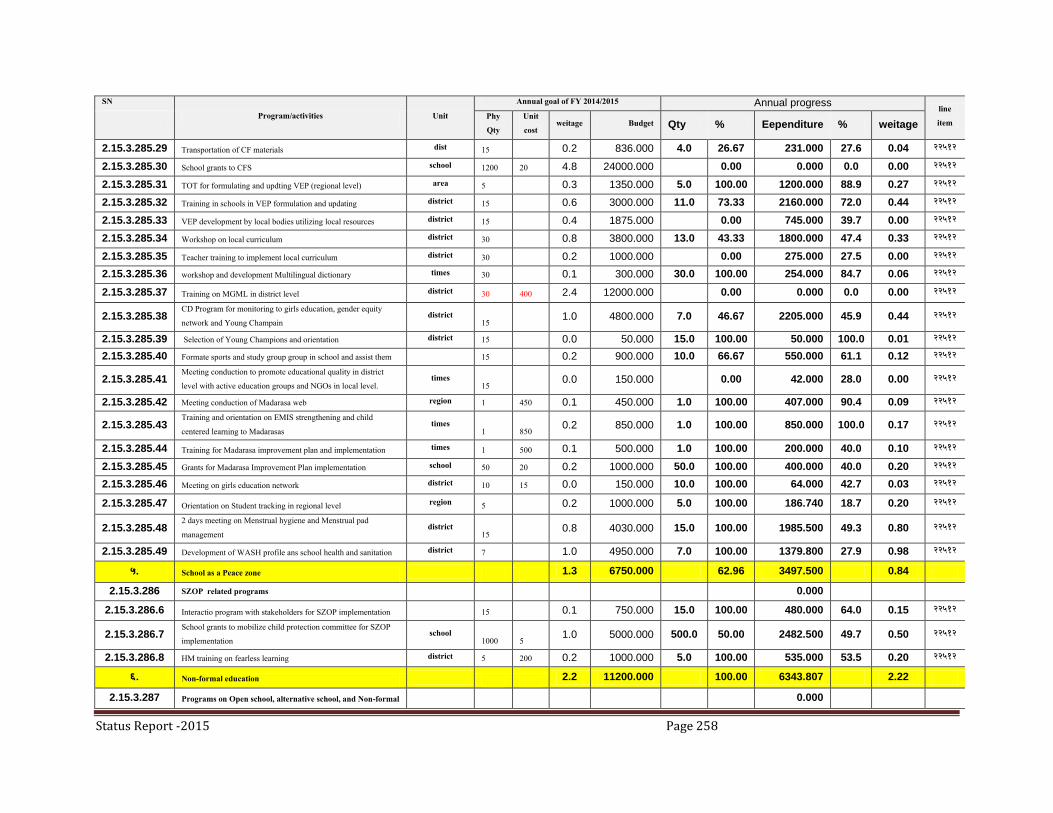
Status Report -2015 Page 258
SN
Program/activities Unit
Annual goal of FY 2014/2015 Annual progress line
item Phy
Qty
Unit
cost weitage Budget Qty % Eependiture % weitage
2.15.3.285.29 Transportation of CF materials dist 15 0.2 836.000 4.0 26.67 231.000 27.6 0.04 २२५१२
2.15.3.285.30 School grants to CFS school 1200 20 4.8 24000.000 0.00 0.000 0.0 0.00 २२५१२
2.15.3.285.31 TOT for formulating and updting VEP (regional level) area 5 0.3 1350.000 5.0 100.00 1200.000 88.9 0.27 २२५१२
2.15.3.285.32 Training in schools in VEP formulation and updating district 15 0.6 3000.000 11.0 73.33 2160.000 72.0 0.44 २२५१२
2.15.3.285.33 VEP development by local bodies utilizing local resources district 15 0.4 1875.000 0.00 745.000 39.7 0.00 २२५१२
2.15.3.285.34 Workshop on local curriculum district 30 0.8 3800.000 13.0 43.33 1800.000 47.4 0.33 २२५१२
2.15.3.285.35 Teacher training to implement local curriculum district 30 0.2 1000.000 0.00 275.000 27.5 0.00 २२५१२
2.15.3.285.36 workshop and development Multilingual dictionary times 30 0.1 300.000 30.0 100.00 254.000 84.7 0.06 २२५१२
2.15.3.285.37 Training on MGML in district level district 30 400 2.4 12000.000 0.00 0.000 0.0 0.00 २२५१२
2.15.3.285.38 CD Program for monitoring to girls education, gender equity
network and Young Champain district
15 1.0 4800.000 7.0 46.67 2205.000 45.9 0.44 २२५१२
2.15.3.285.39 Selection of Young Champions and orientation district 15 0.0 50.000 15.0 100.00 50.000 100.0 0.01 २२५१२
2.15.3.285.40 Formate sports and study group group in school and assist them 15 0.2 900.000 10.0 66.67 550.000 61.1 0.12 २२५१२
2.15.3.285.41 Meeting conduction to promote educational quality in district
level with active education groups and NGOs in local level. times
15 0.0 150.000 0.00 42.000 28.0 0.00 २२५१२
2.15.3.285.42 Meeting conduction of Madarasa web region 1 450 0.1 450.000 1.0 100.00 407.000 90.4 0.09 २२५१२
2.15.3.285.43 Training and orientation on EMIS strengthening and child
centered learning to Madarasas times
1 850 0.2 850.000 1.0 100.00 850.000 100.0 0.17 २२५१२
2.15.3.285.44 Training for Madarasa improvement plan and implementation times 1 500 0.1 500.000 1.0 100.00 200.000 40.0 0.10 २२५१२
2.15.3.285.45 Grants for Madarasa Improvement Plan implementation school 50 20 0.2 1000.000 50.0 100.00 400.000 40.0 0.20 २२५१२
2.15.3.285.46 Meeting on girls education network district 10 15 0.0 150.000 10.0 100.00 64.000 42.7 0.03 २२५१२
2.15.3.285.47 Orientation on Student tracking in regional level region
5 0.2 1000.000 5.0 100.00 186.740 18.7 0.20 २२५१२
2.15.3.285.48 2 days meeting on Menstrual hygiene and Menstrual pad
management district
15 0.8 4030.000 15.0 100.00 1985.500 49.3 0.80 २२५१२
2.15.3.285.49 Development of WASH profile ans school health and sanitation district 7 1.0 4950.000 7.0 100.00 1379.800 27.9 0.98 २२५१२
५. School as a Peace zone 1.3 6750.000 62.96 3497.500 0.84
2.15.3.286 SZOP related programs 0.000
2.15.3.286.6 Interactio program with stakeholders for SZOP implementation 15 0.1 750.000 15.0 100.00 480.000 64.0 0.15 २२५१२
2.15.3.286.7 School grants to mobilize child protection committee for SZOP
implementation school
1000 5 1.0 5000.000 500.0 50.00 2482.500 49.7 0.50 २२५१२
2.15.3.286.8 HM training on fearless learning district 5 200 0.2 1000.000 5.0 100.00 535.000 53.5 0.20 २२५१२
६. Non-formal education 2.2 11200.000 100.00 6343.807 2.22
2.15.3.287 Programs on Open school, alternative school, and Non-formal 0.000

Status Report -2015 Page 259
SN
Program/activities Unit
Annual goal of FY 2014/2015 Annual progress line
item Phy
Qty
Unit
cost weitage Budget Qty % Eependiture % weitage
school
2.15.3.287.11 Awareness campaign through local medias on literate Nepal and
its effectiveness districts
5 50 0.0 250.000 5.0 100.00 170.000 68.0 0.05 २२५१२
2.15.3.287.12 Refresher training for Non-formal primary school facilitators region
1 500 0.1 500.000 1.0 100.00 140.000 28.0 0.10 २२५१२
2.15.3.287.13 Program for continuing education to neo literates in CLCs CLC 10 0.2 1000.000 10.0 100.00 900.000 90.0 0.20 २२५१२
2.15.3.287.14 One day workshop on non-formal education region/districts
30 50 0.3 1500.000 30.0 100.00 331.727 22.1 0.30 २२५१२
2.15.3.287.15 Situation identification of non formal education programs by
DDC, and DEOs jointly districts
5 30 0.0 150.000 5.0 100.00 85.000 56.7 0.03 २२५१२
2.15.3.287.16 Continual support to the girls of open school center 10 50 0.1 500.000 10.0 100.00 200.000 40.0 0.10 २२५१२
2.15.3.287.17 Identification and Broadcasting of best practices of alternative
education graduates district
17 50 0.2 850.000 17.0 100.00 185.000 21.8 0.17 २२५१२
2.15.3.287.18 Meeting for SS,RP and other stakeholders to the effectiveness of
Literate Nepal Campaign region/districts
35 50 0.3 1750.000 35.0 100.00 703.910 40.2 0.35 २२५१२
2.15.3.287.19 Program through RED for the retention of and increase access to
education for out of school children region
2 0.2 1200.000 2.0 100.00 1200.000 100.0 0.24 २२५१२
2.15.3.287.20 Program implementation for out of school children analysing and
updating the data district
10 85 0.2 850.000 10.0 100.00 360.000 42.4 0.17 २२५१२
2.15.3.287.21 Pogram for retention and enrollment in the collaboration with
local bodies district
5 30 0.0 150.000 5.0 100.00 123.000 82.0 0.03 २२५१२
2.15.3.287.22 Interaction program and network meeting for the effectiveness of
nonformal education in the participation of local NGOs. region
5 500 0.5 2500.000 5.0 100.00 1945.170 77.8 0.50 २२५१२
७. Monitoring and Evaluation 0.7 3400.000 100.00 2352.357 69.2 0.67
2.19.1 Activities related to monitoring, evaluation and management 0.000
2.19.1.11 Monitoring expenditure Region/district 35 0.7 3400.000 35.0 100.00 2352.357 69.2 0.67 २२६११
8.2.3 School construction purpose 65.0 328500.000 100.00 316584.000 96.4 65.05
8.2.3.19 Toilet construction with water school 810 65.0 328500.000 810.0 100.00 316584.000 96.37 65.05 २६४२३
२. Total capital cost 0.0 0.000 0.000 0.00
४. Total recurrent cost 100.0 505000.000 81.08 380277.137 75.30 81.08
५. Total capital and recurrent 100.0 505000.000 81.08 380277.137 75.30 81.08
६. Grand Total
100 505000.000 380277.137 75.30 81.08

Status Report -2015 Page 260
Copyright © 2022 FDOKUMEN