Statistical methods for network surveillance - James D. Wilson
22
See discussions, stats, and author profiles for this publication at: https://www.researchgate.net/publication/324575252 Statistical methods for network surveillance Article in Applied Stochastic Models in Business and Industry · April 2018 DOI: 10.1002/asmb.2326 CITATIONS 16 READS 815 4 authors, including: Some of the authors of this publication are also working on these related projects: Red Palm Weevil View project Measurement System Comparison View project Daniel R. Jeske University of California, Riverside 142 PUBLICATIONS 1,709 CITATIONS SEE PROFILE Nathaniel Stevens University of San Francisco 23 PUBLICATIONS 125 CITATIONS SEE PROFILE James D. Wilson University of San Francisco 32 PUBLICATIONS 231 CITATIONS SEE PROFILE All content following this page was uploaded by James D. Wilson on 20 April 2018. The user has requested enhancement of the downloaded file.
-
Upload
khangminh22 -
Category
Documents
-
view
3 -
download
0
Transcript of Statistical methods for network surveillance - James D. Wilson

See discussions, stats, and author profiles for this publication at: https://www.researchgate.net/publication/324575252
Statistical methods for network surveillance
Article in Applied Stochastic Models in Business and Industry · April 2018
DOI: 10.1002/asmb.2326
CITATIONS
16READS
815
4 authors, including:
Some of the authors of this publication are also working on these related projects:
Red Palm Weevil View project
Measurement System Comparison View project
Daniel R. Jeske
University of California, Riverside
142 PUBLICATIONS 1,709 CITATIONS
SEE PROFILE
Nathaniel Stevens
University of San Francisco
23 PUBLICATIONS 125 CITATIONS
SEE PROFILE
James D. Wilson
University of San Francisco
32 PUBLICATIONS 231 CITATIONS
SEE PROFILE
All content following this page was uploaded by James D. Wilson on 20 April 2018.
The user has requested enhancement of the downloaded file.
Received: 26 September 2017 Revised: 23 February 2018 Accepted: 24 February 2018
DOI: 10.1002/asmb.2326
D I S C U S S I O N PA P E R
Statistical methods for network surveillance
Daniel R. Jeske1 Nathaniel T. Stevens2 Alexander G. Tartakovsky3,4 James D. Wilson2
1Department of Statistics, University ofCalifornia, Riverside, CA, USA2Department of Mathematics andStatistics, University of San Francisco, SanFrancisco, CA, USA3Moscow Institute of Physics andTechnology, Moscow, Russia4AGT StatConsult, Los Angeles, CA, USA
CorrespondenceDaniel R. Jeske, Department of Statistics,University of California, Riverside, CA92521, USA.Email: [email protected]
Funding informationUS Army Research Office, Grant/AwardNumber: W911NF-14-1-0246; USDepartment of Energy Phase I SBIR;Ministry of Education and Science of theRussian Federation
The term network surveillance is defined in general terms and illustrated withmany examples. Statistical methodologies that can be used as tools for networksurveillance are discussed. Details for 3 illustrative examples that address net-work security, surveillance for data network failures, and surveillance of emailtraffic flows are presented. Some open areas of research are identified.
KEYWORDS
change point, control charts, dynamic networks, reliability, security
1 INTRODUCTION
Generally speaking, network surveillance is a term that means monitoring a network to detect abnormal behavior. Appli-cations where network surveillance is employed vary considerably, since the term network itself has a broad meaning:in telecommunications, a data network is infrastructure that enables point-to-point information transfer; a biologicalnetwork describes how different regions of the human brain communicate with each other; an artificial neural networkis a type of statistical prediction algorithm; social networks study the way individuals or communities of individualsinteract with one another; gene regulatory networks describe the interplay between different genes in the humandevelopmental process.
Interest in monitoring a network is driven by a desire to identify transitions away from normal, or baseline, operatingconditions. Such a transition may be associated with an interesting cause. In the case of a data network, the transitionmay signal a failure of a key piece of equipment or possibly a malicious attack. For biological neural networks or generegulatory networks, the transition may provide insight for understanding how a disease originates and/or evolves. Insocial networks, the transition may coincide with changes in other types of social or antisocial behavior.
In this review, we will reveal some of the underlying challenges of network surveillance. Specific examples where sta-tistical methods for monitoring networks have been developed will be presented, and some open areas of research on thistopic will be discussed.
Appl Stochastic Models Bus Ind. 2018;1–21. wileyonlinelibrary.com/journal/asmb Copyright © 2018 John Wiley & Sons, Ltd. 1
2 JESKE ET AL.
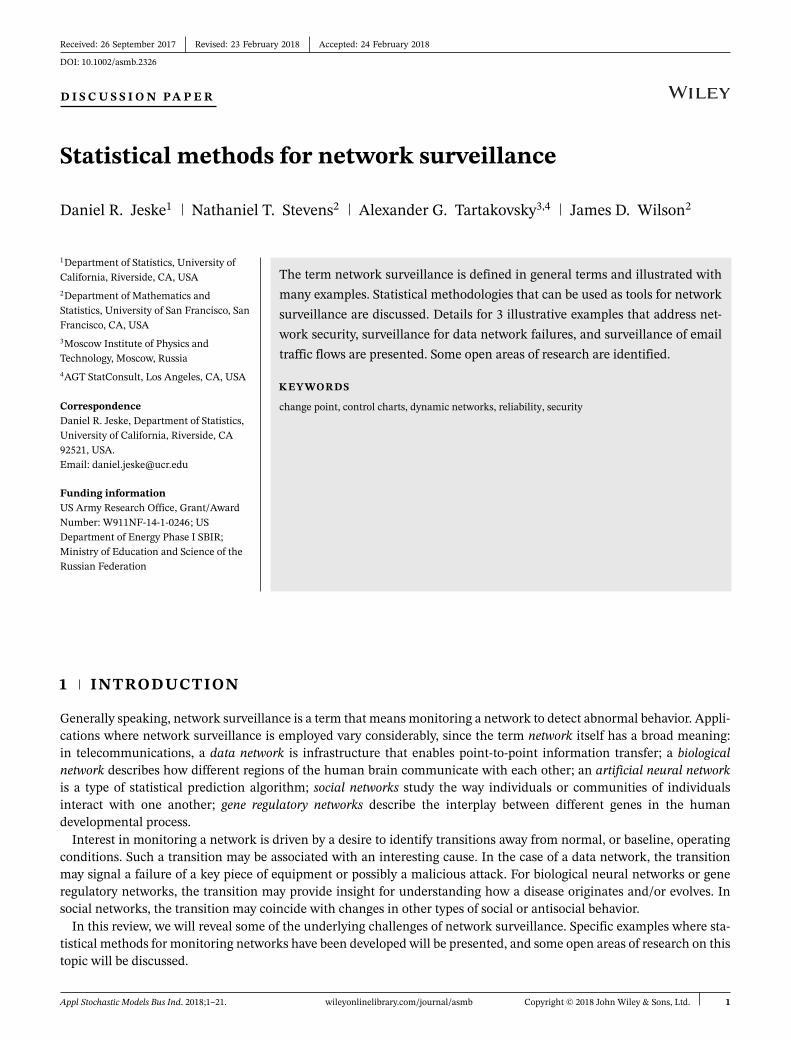
FIGURE 1 Graphical user interface with real attack and its detection by the hybrid anomaly-signature intrusion detection system [Colourfigure can be viewed at wileyonlinelibrary.com]
2 ILLUSTRATIVE CONTEXTS
2.1 Network securityMalicious intrusion attempts such as spam campaigns, phishing, personal data theft, worms, distributed denial-of-service(DDoS) attacks, man-in-the-middle attacks, and fast flux occur practically every day and have become commonplace incontemporary computer networks. These threats can incur significant financial damage and are a severe harm to theintegrity of personal information. It is therefore essential to devise automated techniques to detect such events as quicklyas possible so that an appropriate response can be provided and the negative consequences for the users are eliminated.Moreover, even routine behavior of users could generate anomalous events requiring the attention of network opera-tors and managers. A good example would be flash crowds. Efficient operation and management of computer networksdepend heavily on a relatively precise analysis of anomalies produced by both malicious and legitimate normal behavior.
The ability of change point detection techniques to run at high speeds and with low detection delays presents an inter-esting opportunity. What if one could combine such techniques with others that offer a very low false alarm rate (FAR) butare too heavy to use at line speeds? Do such systems exist? How can they be integrated? Figure 1 shows a graphical userinterface with the results of detecting a real DDoS attack with false alarm filtering using the hybrid anomaly-signatureintrusion detection system that will be described in detail in Section 3.3.
2.2 Data networksData networks provide an infrastructure to rapidly move information around the globe. An information technology (IT)group is usually responsible for monitoring the health of a data network and maintaining its ability to provide the ser-vices it delivers. Within this context, data network surveillance means defining metrics that describe the health of a datanetwork and using them to detect unusual patterns that might indicate a failure in the network.

JESKE ET AL. 3
FIGURE 2 Two weeks of 5-minute counts of users logged into a data network server
Often the metrics that will be used to monitor the health of a data network will be various measures of traffic flow overthe network. Figure 2 from the work of Fu and Jeske1 illustrates 5-minute counts of the number of users on a particulardata network server. The volume of traffic that crosses over a network link during a specified time of day is anotherexample. We return to this example in Section 4.3.
2.3 Dynamic networksSome applications require monitoring a dynamic network or a network whose topology changes through time. In par-ticular, a dynamic network is a temporally ordered sequence of networks whose node set and/or edge set varies throughtime. Dynamic network models provide insights about the relational structure of evolving complex systems. These mod-els are commonly used in a variety of fields, ranging from political science to analyze the polarization of US Senators2 tobiology for analyzing gene-to-gene interactions over time and their relationship with breast cancer.3
Dynamic network models have been particularly useful in analyzing social dynamics among groups of individuals.For a concrete example, consider the Enron email network illustrated in Figure 3. Nodes in this network represent 184employees at Enron, and edges between a pair of nodes quantify the number of emails exchanged between the 2 employ-ees. One can readily see from Figure 3 that the email communication among employees dramatically changed betweenJune 1999 and June 2001. Notably, in 2001, the network was much more densely connected than at other points in time.It turns out that this high level of email activity occurred at the time at which fraud investigations of the company beganand activity subsided with the ultimate filing of bankruptcy from the company in December of 2001. By monitoring theglobal and local connections in the Enron dynamic network, one can readily detect this anomalous behavior among theEnron employees. We return to this example in Section 5.3.
FIGURE 3 Weekly snapshots of the Enron email communication network [Colour figure can be viewed at wileyonlinelibrary.com]
4 JESKE ET AL.
3 MONITORING NETWORK SECURITY
3.1 ObjectivesDetection of traffic anomalies is performed by employing intrusion detection systems (IDSs). Such systems in one way oranother capitalize on the fact that maltraffic is noticeably different from legitimate traffic. Depending on the principle ofoperation, there are 2 categories of IDSs: either signature or anomaly based. For an overview, see the works of Debar et al4
and Kent.5 A signature-based IDS inspects passing traffic with the intent to find matches against already known maliciouspatterns. In contrast, an anomaly-based IDS is first trained to recognize the normal network behavior and then watchesfor any deviation from the normal profile, classifying deviations as potential attacks.6-10
As an example, consider DDoS attacks. These DDoS attacks typically involve many traffic streams resulting in a largenumber of packets aimed at congesting the target's server or network. As a result, these attacks usually lead to abruptchanges in network traffic and can be detected by noticing a change in the average number of packets sent through thevictim's link per unit time. Therefore, it is appealing to formulate the problem of detecting DDoS as a quickest changepoint detection problem: to detect changes in statistical models as rapidly as possible (i.e., with minimal expected delays)while maintaining the FAR at a given level.
Currently, both anomaly- and signature-based IDSs are plagued by a high rate of false positives and are susceptibleto carefully crafted attacks that “blend” themselves into normal traffic. Clearly, these 2 systems are complementary,and neither alone is sufficient to detect and isolate the myriad of malicious or legitimate network anomalies. For thisreason, many different types of IDSs have been developed, each better suited for a particular attack type. As networkspeeds increase and applications get more complex, rapid intrusion detection with a low FAR becomes increasinglymore difficult.
Solutions must focus on 2 main objectives: (i) development of an efficient adaptive anomaly-based IDS based on changedetection techniques and (ii) integration of 2 detection techniques—anomaly IDS and signature-spectral detection tech-niques. The resulting hybrid anomaly-signature IDS is synergistic and performs better than any of the individual systemsalone. The hybrid anomaly-signature IDS, described in Section 3.3, was tested on real attacks, and the results demonstratethe benefits of integrating anomaly and signature IDSs.
3.2 Literature reviewTypical computer network attacks include IP fragments, malformed packets, SYN floods, ICMP redirect messages, per-petual echo, restricted IP options and restricted IPs. IDSs also have to be capable of detecting other unwanted activitiessuch as scans and traffic regulation anomalies for TCP and UDP. As we discussed in Section 2.1, the 2 main classes ofdetection methodologies are signature-based and anomaly-based. Both classes of systems have certain advantages anddisadvantages.4-6,11
Specifically, signature-based detection technologies have little understanding of many network or application protocolsand cannot track and understand the state of complex communications. They also lack the ability to remember previousrequests when processing the current request. This limitation prevents these methods from detecting attacks that com-prise multiple events if none of the events contains a clear indication of an attack. Signature methods are also unableto detect attacks within encrypted network traffic, including VPN, HTTPS, and SSH sessions. Performance evaluationsshowed that such IDSs are sensitive to both packet and ruleset content. For example, analysis of SNORT (www.snort.org)shows that as much as 31% of total processing is due to string matching, and in the case of Web-intensive traffic, this costis increased to 80% of the total processing time. Clearly, this is a very serious drawback for ultra-high-speed networks.
Anomaly-based detection is the process of comparing definitions of what activity is considered normal against observedevents to identify significant deviations. The major benefit of anomaly-based detection methods is that they can be veryeffective at detecting previously unknown threats. However, anomaly IDSs often produce many false positives, especiallyin more diverse or dynamic environments. Another noteworthy problem is that it is often difficult to determine why aparticular alert was generated and to validate that an alert is not false.
For DDoS detection, Cheng et al12 examined individual flows and applied spectral analysis to characterize periodicitiesand to separate normal TCP traffic during a DDoS attack. Barford et al13 used wavelets to investigate anomaly detectiontechniques that make use of IP flow-level and SNMP information to identify frequency characteristics of DDoS attacks andother anomalous network traffic. Hussain et al14 used signal processing techniques to differentiate between single-sourceand multi-source DDoS attacks but examined attack traffic in isolation of background traffic. Lakhina et al15 discovered

JESKE ET AL. 5
anomalies in network traffic by studying entropy in packet IP addresses and ports. Partridge et al.16 used signal processingtechniques to analyze wireless traffic. Wavelets have also been used to study self-similarity in network traffic and to detectsome network problems.17 Li and Lee18 utilized energy distribution-based wavelet analysis to detect DDoS attack traffic.
The results of the work of He et al19 suggest that a careful choice of training approaches yields good detection perfor-mance at moderate “signal-to-noise ratio” (SNR), where traffic of interest is only 5% to 10% of the total traffic, and excellentdetection performance (98%) at SNR where target traffic is over 10% of total. Additional research has further studiedthese issues.11,20-24
For cyber-security applications, several nonparametric and adaptive parametric change detection methods based oncumulative sum (CUSUM)–type and Shiryaev-Roberts (SR)–type statistics were developed and tested based on realdata by Tartakovsky,7,25 Tartakovsky and Polunchenko,26 Tartakovsky and Veeravalli,8,27 Tartakovsky et al,9,10,28-30 andPolunchenko et al.31 A sample of results from these works is presented in the next section.
Research has shown that neither anomaly-based nor signature-based security solutions provide adequate protection bythemselves.32,33 Hence, a new approach is required. Such an approach based on combining statistical change detectionmethods with spectral-signature signal processing techniques is discussed in Section 3.3.2.
3.3 Spotlight methodIn this section, we outline approaches for designing 2 efficient IDSs (the anomaly IDS and hybrid anomaly-signature IDS)proposed by Tartakovsky,7,25 Tartakovsky and Polunchenko,26 Tartakovsky and Veeravalli,8,27 Tartakovsky et al,9,10,28-30 andPolunchenko et al.31 Results from testing the IDSs on data sets that captured real attacks are also presented.
3.3.1 Change point detection-based anomaly IDSWe begin by describing the adaptive semiparametric detection method proposed in the works of Tartakovsky et al,9,10,28-30
which is applicable to the detection of any changes of statistical patterns in the monitored data flows, both abrupt andgradual. It is capable of detecting a wide variety of internal and external intrusions, including stealthy attacks, with smalldelays to detection for a fixed prescribed FAR.
Consider a multichannel (or multistream) scenario where data Xn = (X (1)n ,… ,X (N)
n ), n ≥ 1, are used for identify-ing the presence of anomalies. Here, X (i)
n is a sample obtained at time n in the ith channel. The importance of usingmultiple channels for detecting DDoS attacks has been shown.8-10 For example, in the case of UDP flooding attacks,the channels correspond to packet sizes, whereas, for TCP SYN attacks, they correspond to IP addresses. When theprechange and the postchange models are completely specified, efficient detection procedures with certain optimal prop-erties can be constructed based on the log-likelihood ratio (LLR)–based CUSUM and SR rules (see, eg, the works ofTartakovsky et al29). However, in intrusion detection applications, these models are usually unknown. For this reason,we undertake a semiparametric approach. More specifically, the unknown LLRs in channels are replaced by appropriatescore functions Si(n), i = 1,… , n that have negative mean values E∞[Si(n)] before the change occurs and positive meanvalues Ek[Si(n)] after the change occurs. Here, Ek stands for expectation when the point of change is k and E∞ correspondsto the no-change scenario.
While no assumptions are made in terms of probability distributions, some assumptions on the change should be made.In intrusion detection applications, the detection problem can be usually reduced to detecting changes in mean values orin variance or in both mean and variance. In the works of Tartakovsky et al,9,10 a linear memoryless score was introducedfor detecting changes in the mean, and in other works of Tartakovsky25 and Tartakovsky et al,28,29 this score was generalizedto linear quadratic in order to be able to handle changes in both mean and variance.
Specifically, let 𝜇i,∞ = E∞[X (i)n ], 𝜎2
i,∞ = Var∞[X (i)n ] and 𝜃i = E0[X (i)
n ], 𝜎2i = Var0[X (i)
n ] denote the prechange andpostchange mean values and variances in the ith channel. Write Y (i)
n = (X (i)n − 𝜇i,∞)∕𝜎i,∞ for i = 1,… , N, introduce the
following linear-quadratic score functions
S(i)n = aiY (i)
n + bi
(Y (i)
n
)2− ci,
where ai, bi, and ci are the design parameters. Introduce recursively the score-based CUSUM and SR statistics
W (i)n = max
{0 ,W (i)
n−1 + S (i)n
}, R(i)
n =(
1 + R(i)n−1
)exp
(S(i)
n
).

6 JESKE ET AL.
Typically, these statistics remain close to zero in normal conditions; when the change occurs in the ith channel, the ithstatistics starts rapidly drifting upward eventually crossing a threshold, at which time the change is declared.
The MAX algorithm9,10 is based on the maximal statistic, Wmax (n) = max1≤i≤N
W (i)n (n), which is compared to a threshold
that controls the FAR, i.e., the algorithm stops and declares the attack at
Tmax (h) = min {n ∶ Wmax (n) ≥ h} , h > 0.
This method shows very high performance and is the best one can do when attacks are visible in either one or veryfew channels. The most general and realistic case is where the number of affected channels is a priori unknown andmay vary from small to large. This challenging problem was considered in the work of Tartakovsky et al29 where severalasymptotically optimal likelihood ratio-based detection procedures were suggested for known prechange and postchangemodels. When models are unknown, similar procedures can be used with the LLRs replaced with the scores. In particular,the reasonable detection statistic is
∑Ni=1W (i)
n (n).A similar approach can be used to form the SR-type multichannel detection procedure given by the stopping time
TSR = min{
n ∶∑N
i=1log R(i)
n ≥ h}.
Yet another approach is to exploit a nonparametric algorithm with binary quantization and optimization of the quan-tization threshold. In this case, it is possible to implement optimal binary quantized CUSUM and SR algorithms that arebased on true likelihood ratios for Bernoulli sequences at the output of quantizers.25
Note that the parameters 𝜇i,∞ and 𝜎i,∞ are unknown and should be estimated from the data and the post parameters 𝜃iand 𝜎2
i are usually unknown. In order to make the IDS fully adaptive, the following 2 procedures might be used for evalu-ation of unknown parameters, which is performed online. Since the estimation is performed identically for all channels,we omit the subscripts i,∞ when describing these procedures.
Fixed window zero-reflection estimation procedure: Form a pilot estimate based on initial data if available. Periodicallyreestimate, using a retrospective sliding window back from the point when the statistic Wn hits a zero reflecting barrier.
Exponentially weighted moving average (EWMA) estimation procedure: Define 𝜇n = 𝜇n−1 (1 − 𝜌) + Xn 𝜌 and 𝜎2n =
𝜎2n−1 (1 − 𝜌) + (Xn − 𝜇n)2𝜌, where 0 < 𝜌 < 1 is a smoothing factor, which is usually taken in the range from 0.005 to
0.1. This procedure shows extremely high performance and, based on a preliminary analysis, is recommended for theimplementation in the anomaly IDS.
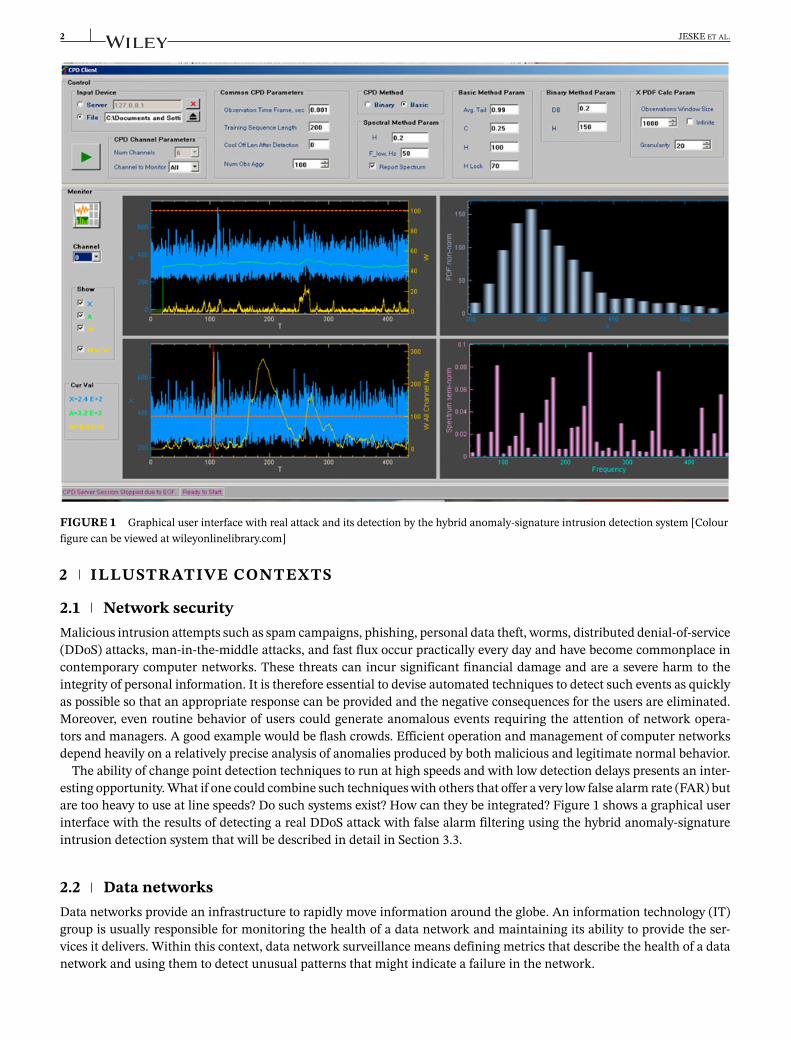
Figure 4 illustrates the EWMA estimation procedure along with the behavior of the fully adaptive CUSUM statisticbased on the linear-quadratic score with parameters estimated by the EWMA procedure for a real data set that capturesan ICMP DDoS attack. The solid black region in the plot corresponds to the detection of the attack when the CUSUMexceeds its threshold and further resets to zero and continually flags the attack. Figure 4 shows that the proposed EWMAestimation algorithm allows us to track the change in the mean very accurately: both prechange and postchange meanvalues are estimated very accurately and the detection statistic increases very rapidly after the attack starts while imme-diately decreases after the attack stops. However, we can also see quite a few false alarms prior to the attack and in thepost-attack segment. These false alarms are being filtered by the spectral algorithm at the second stage in the hybrid IDS,as will be discussed in Section 3.3.2.
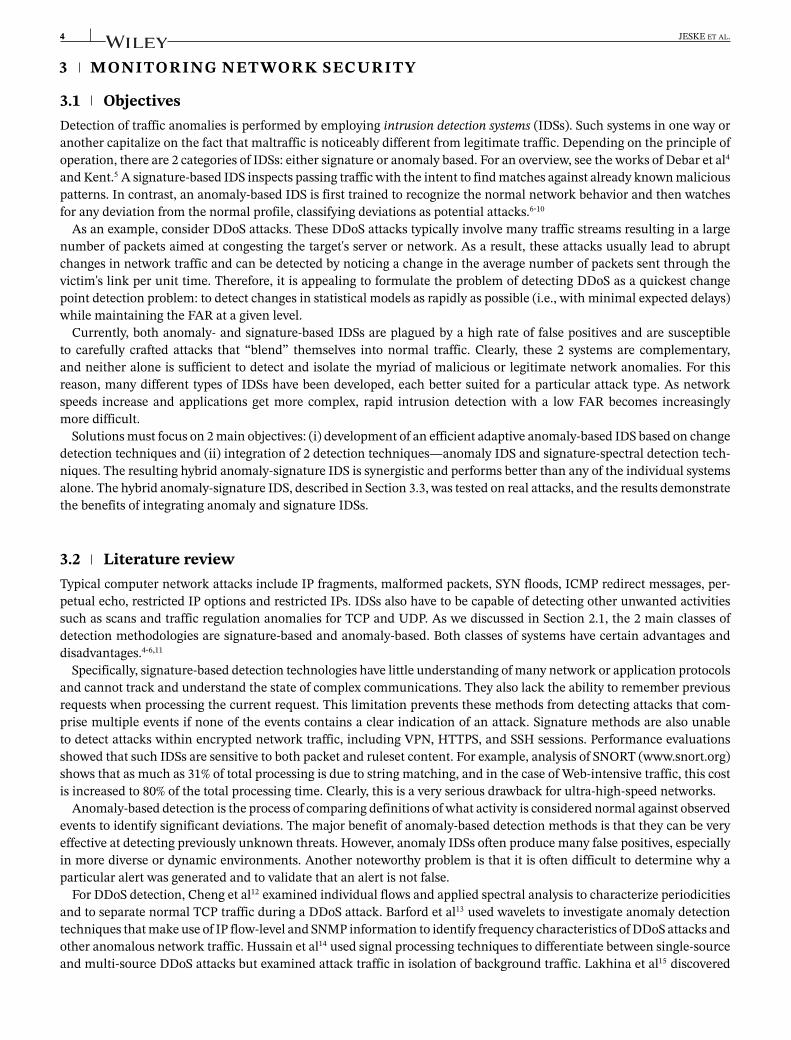
Figure 5 compares the multicyclic adaptive CUSUM and SR detection procedures (renewed after each alarm) for yetanother real data set. This data set contains real background traffic and a UDP packet storm DDoS attack. The SRprocedure detects this attack slightly earlier than CUSUM, but the difference is almost negligible.
It is impossible to develop a single detection algorithm that is optimal in all possible conditions. The reason for thisis that the network environment is highly changing and both legitimate traffic models and attack models are not com-pletely specified. Therefore, a real IDS has to exploit a bank of detection filters that includes the algorithms describedabove. This bank should also be supplemented with a nonparametric multichannel algorithm based on the optimal binaryquantization. In the interest of brevity, we omit further details regarding the latter algorithm.
3.3.2 An adaptive hybrid IDSThis section describes a hybrid approach to network intrusion detection, proposed by Tartakovsky,25 that can effectivelydeal with stealthy (slow and low-contrast) attacks. The system has a 2-stage cascade architecture, utilizing the changepoint detection methodology for preliminary detection of attacks and a discrete Fourier transform or a wavelet transformto reveal periodic patterns in network traffic, which are then used to confirm the presence of attacks and reject falsepositives prior to attack occurrence. In other words, the methodology is based on using the change point detection method
JESKE ET AL. 7
FIGURE 4 Exponentially weighted moving average estimate of the mean value (left) and the adaptive cumulative sum statistic (right) foran ICMP distributed denial-of-service attack [Colour figure can be viewed at wileyonlinelibrary.com]
FIGURE 5 Top—real data; bottom—multicyclic CUSUM statistic (black) and log of SR statistic (gray) [Colour figure can be viewed atwileyonlinelibrary.com]
for preliminary detection of attacks with low threshold values. When detection thresholds are low, the anomaly IDSproduces intense flows of false alarms. However, these frequent false alarms can be tolerated, since they do not lead toreal false alarms that pass the whole system. Once an alarm is raised, a spectral analyzer is triggered. This alarm is eitherrejected or confirmed as a true detection, in which case, a final alarm is raised.
We begin with explaining the idea of flow-based signature detection techniques that are used for false alarm filtering.These techniques examine patterns embedded in packet arrivals rather than packet contents. Note that this is differentthan anomaly detection systems that examine packet and bit rates, protocol, port and address decomposition, and dailyvariations of such quantities. In the signature-spectral approach, we first define important events, then create time seriesof these events, and finally apply spectral analysis techniques on the time series to characterize traffic. Examples include

8 JESKE ET AL.
FIGURE 6 Power spectral density for a UDP distributed denial-of-service attack [Colour figure can be viewed at wileyonlinelibrary.com]
simple events such as packet arrivals and retransmissions, but also higher-level events such as connection attempts andfailed service requests. Detecting a higher-level event is preferable for complex traffic because it reduces false positivesand processing loads.
We now illustrate this idea using an example of an SSH dictionary attack. The spectral detection approach works asfollows. When an SSH dictionary attack takes place, a large amount of SSH authorization requests is directed to the targetserver from the hacker. These requests are usually sent in a periodic manner. This time regularity is mixed with othernon-attack traffic toward the target's network but, nonetheless, can be readily detected by spectral analysis because itcauses a spike in energy at the frequency of the victim's link.
Another typical example where a spectral approach can be effectively used is detecting DDoS attacks. A DDoS attacksends a large number of packets from several compromised machines (called zombies) with the goal of knocking thetarget off the network or seriously degrading the service it provides (saturate links). The attack is typically easy to detectat the target where its strength is the highest and sometimes at the source where each zombie blasts the target as fastas possible. However, recently, a new attack tactic has emerged that produces stealthy attacks. Specifically, a very largeset of zombies is used, but each zombie attacks with a very low packet rate in order to hide the traffic from the localIDS. Spectral techniques can be used to detect stealthy low-rate attacks, especially when combining with change pointdetection methods.
Yet another problem is encrypted attacks. Traffic can be obscured if it is either encrypted or if it uses a proxy. Encryptedor proxied traffic does not pose a problem for spectral analysis techniques. Since we do not rely on packet contents, spectraltechniques work with any type of traffic.
The spectral-signature technique requires a time series of packet arrivals. The power spectral density (PSD) for station-ary segments is computed by performing a discrete-time fast Fourier transform (FFT) on the autocorrelation function ofthe attack stream, which is a measure of how similar the attack is to itself shifted in time by a certain offset. The PSD cap-tures the power or strength of individual observable frequencies embedded in the time series formed by the observations.Figure 6 plots the FFT (i.e., PSD vs frequency) for the real network traffic that contains a UDP packet storm DDoS attack.Normal traffic does not produce visible peaks, while when the UDP storm starts a contrast peak immediately appears.
As we stated above, this spectral signature method is combined with the change point anomaly detection method fordesigning a hybrid anomaly-signature IDS with false alarm filtering and true attack confirmation capability.
To summarize, the hybrid IDS is based on the following principles.1. Anomaly IDS—quick detection with high FAR: In order to detect attacks quickly, the detection threshold in the change
point detection module is lowered, which leads to frequent false alarms that are filtered by a signature-spectral IDS block.Thus, the change point detection block is used for quick detection with relatively high FAR and for triggering spectralanalysis algorithms.
2. Signature IDS—false alarm filtering: To reject false detections, a spectral-based approach is used, eg, Fourier or waveletspectral analysis module. Therefore, the spectral-signature IDS block is used for false alarm filtering/rejection and trueattack confirmation.
As mentioned above, detecting intrusions rapidly and with low intensity of false positives becomes exceedinglyharder when attackers use encryption or when attack and legitimate traffic are mixed behind a proxy. Most traditional
JESKE ET AL. 9
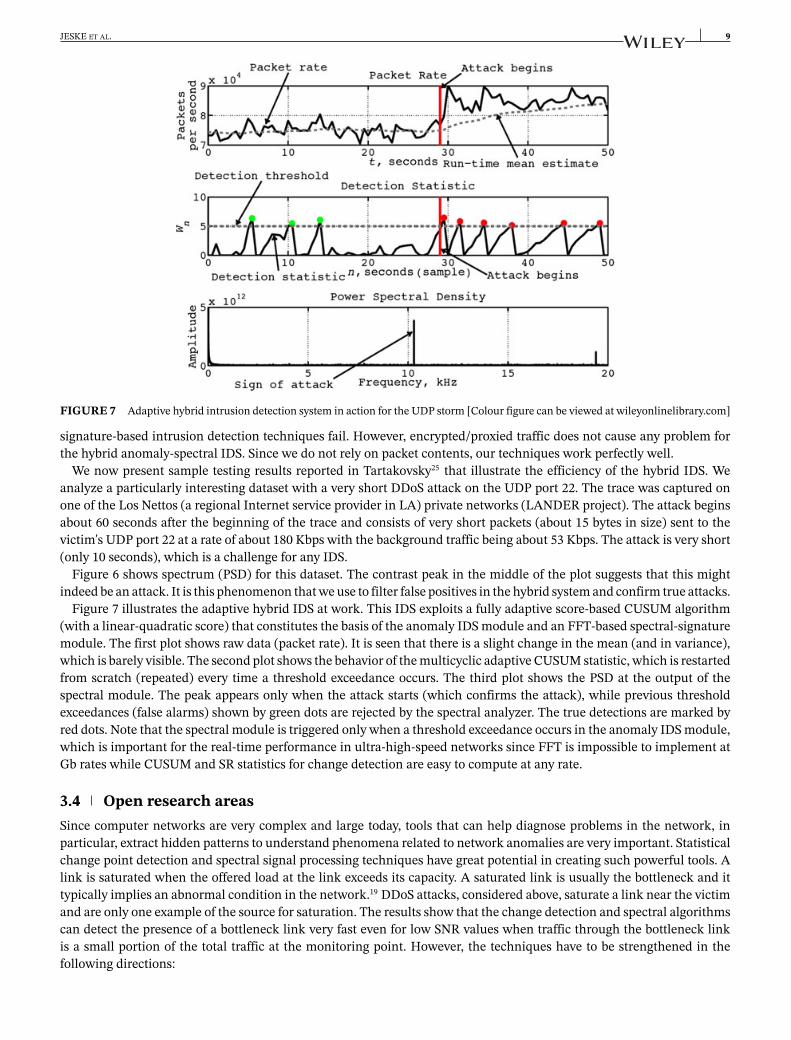
FIGURE 7 Adaptive hybrid intrusion detection system in action for the UDP storm [Colour figure can be viewed at wileyonlinelibrary.com]
signature-based intrusion detection techniques fail. However, encrypted/proxied traffic does not cause any problem forthe hybrid anomaly-spectral IDS. Since we do not rely on packet contents, our techniques work perfectly well.
We now present sample testing results reported in Tartakovsky25 that illustrate the efficiency of the hybrid IDS. Weanalyze a particularly interesting dataset with a very short DDoS attack on the UDP port 22. The trace was captured onone of the Los Nettos (a regional Internet service provider in LA) private networks (LANDER project). The attack beginsabout 60 seconds after the beginning of the trace and consists of very short packets (about 15 bytes in size) sent to thevictim's UDP port 22 at a rate of about 180 Kbps with the background traffic being about 53 Kbps. The attack is very short(only 10 seconds), which is a challenge for any IDS.
Figure 6 shows spectrum (PSD) for this dataset. The contrast peak in the middle of the plot suggests that this mightindeed be an attack. It is this phenomenon that we use to filter false positives in the hybrid system and confirm true attacks.
Figure 7 illustrates the adaptive hybrid IDS at work. This IDS exploits a fully adaptive score-based CUSUM algorithm(with a linear-quadratic score) that constitutes the basis of the anomaly IDS module and an FFT-based spectral-signaturemodule. The first plot shows raw data (packet rate). It is seen that there is a slight change in the mean (and in variance),which is barely visible. The second plot shows the behavior of the multicyclic adaptive CUSUM statistic, which is restartedfrom scratch (repeated) every time a threshold exceedance occurs. The third plot shows the PSD at the output of thespectral module. The peak appears only when the attack starts (which confirms the attack), while previous thresholdexceedances (false alarms) shown by green dots are rejected by the spectral analyzer. The true detections are marked byred dots. Note that the spectral module is triggered only when a threshold exceedance occurs in the anomaly IDS module,which is important for the real-time performance in ultra-high-speed networks since FFT is impossible to implement atGb rates while CUSUM and SR statistics for change detection are easy to compute at any rate.
3.4 Open research areasSince computer networks are very complex and large today, tools that can help diagnose problems in the network, inparticular, extract hidden patterns to understand phenomena related to network anomalies are very important. Statisticalchange point detection and spectral signal processing techniques have great potential in creating such powerful tools. Alink is saturated when the offered load at the link exceeds its capacity. A saturated link is usually the bottleneck and ittypically implies an abnormal condition in the network.19 DDoS attacks, considered above, saturate a link near the victimand are only one example of the source for saturation. The results show that the change detection and spectral algorithmscan detect the presence of a bottleneck link very fast even for low SNR values when traffic through the bottleneck linkis a small portion of the total traffic at the monitoring point. However, the techniques have to be strengthened in thefollowing directions:
10 JESKE ET AL.
1. To model the processes that govern the generation of bottleneck traffic signatures and use these models to designmore sophisticated detection algorithms that take time-varying and correlated factors into account. In particular, moregeneral statistical models with dependent observations governed by hidden Markov models are in order.
2. To apply the detection algorithms in more diversified environments, including different monitoring points anddifferent bottleneck locations.
3. To study other periodic patterns such as protocol behavior, spam campaigns, and unauthorized break-ins.
Most organizations run some version of spam filters at their local networks.34 These filters examine the content of eachmessage as well as the IP address where the message came from, and if they match known spam signatures, the messageis marked as spam. These techniques work quite well, but they are typically expensive both in initial and operationalcosts. In addition, block lists rely on information that was gathered ahead of time and thus might be stale.
Fighting spam at the network level and looking for spam behavior is a challenge. Monitoring network traffic has sev-eral advantages: (i) it requires no message content examination and thus guards privacy; (ii) spammers can be detectedalmost instantly based on their network behavior; (iii) collateral damage is reduced because dynamic addresses released byspammers can be removed from block lists quickly; and (iv) IP addresses can be blocked before connections are accepted,saving resources at the mail server.
An important question is what features are useful for detecting spammers? We propose to investigate such features asthe autonomous system the IP address belongs to, message size, blocked connections, and message length, which can bedetermined from network traffic. Then, change point detection methods can be used to detect when traffic patterns from aparticular host match known spammer patterns. Combining these features is, of course, important, and multiple detectionprocesses may need to be active at the same time. In summary, change point detection techniques can be used to learn anddetect patterns in network traffic from spammers. Detecting spammers at the network level has several advantages, suchas no privacy issues, near real-time detection, and minimizing collateral damage. This is an open and novel research area.
Yet another open challenging problem is the rapid detection of unauthorized break-ins. Indeed, unauthorized tamper-ing with, or breaking into, a system represents a high computer security risk. Such a scenario usually involves 2 stages. Inthe first stage, the hacker launches a dictionary attack attempting to guess a username and password. In the second stage(assuming that the hacker was successful in gaining access to the machine), the hacker performs suspicious activities onthe machine, including downloading malware and opening up a backdoor. Potentially, both stages can be detected by theanomaly IDS or anomaly-signature IDS. The initial study was performed by Tartakovsky,25 where an approach correlatingchanges in network traffic to detect attempted and successful break-ins was proposed. Attempted break-ins are detectedby searching for traffic patterns corresponding to dictionary attacks. Successful break-ins are detected by noting whena user successfully logs in (signified by a successful connection and exchange of application data), and then detectingsubsequent suspicious network activity using the anomaly-signature IDS. The important problem of how to distinguishmalicious activity from normal user logins remains open.
4 MONITORING RELIABILITY OF DATA NETWORKS
4.1 ObjectivesSurveillance of data networks involves the use of algorithms to determine when a perceived anomaly in the monitoredmetrics is a significant departure from what could be expected due to natural randomness. An algorithm might be con-structed for each metric that will be monitored, and for each metric, a threshold is also specified. When a metric crosses itsthreshold, an alarm is raised that alerts the IT staff to the possibility of a failure. Investigations then proceed to determineif the alarm is a false alarm or if a failure condition exists that needs to be cleared. Effective data network surveillancealgorithms maintain a FAR that is manageable for the IT staff and, at the same time, give fast signals of true out ofcontrol conditions.
4.2 Literature reviewData network surveillance algorithms can be rule-based or statistical-based. In rule-based approaches, the formulationof metrics and their thresholds rely on subject matter expertise from data network managers. Barford et al13 mentionedthat a common technique for handling data network surveillance is periodically plotting data and using subject matterexpert rules to determine if those data are consistent with expectations. Rules derived this way can be effective but they

JESKE ET AL. 11
can also be skewed by the experience of the subject matter experts involved. Feather et al35 used historical data to establishin-control thresholds for the data stream. The thresholds are used to encode a feature vector that represents the currentbehavior of the system. The feature vector is input to a pattern matching system to determine if it resembles a pattern thatis a priori known to be associated with a specific fault. The adequacy of this approach will rely heavily on how consistentlya given fault will reproduce the same pattern and on the depth of the library of fault patterns.
Data network surveillance can alternatively be viewed through the lens of statistical process monitoring (SPM) methods.In this way, a variety of SPM tools become available for potential use, such as Shewhart, EWMA, and CUSUM controlcharts. The characteristics of data network traffic hamper a conventional use of these charts. Specifically, data networktraffic is highly correlated and is nonstationary, and the data are often counts. The nonstationarity is seen in day-to-dayand hour-to-hour trends. It is often possible to define a suitable level of periodicity in data network traffic. However, datanetwork traffic metrics may not consistently follow a known distribution. Brutlag36 discussed these points. Finding a datatransformation that deals with these characteristics simultaneously is extremely challenging.
Thottan and Ji37 presumed that a stream of data network traffic can be divided into batches that follow piecewise normaltheory autoregressive models. Likelihood ratio tests (LRTs) on residuals from these models are used to detect changes inthe data stream. The plausibility that observations within a batch can be modeled as a stationary normal process is a keyassumption with this method. Cao et al38 developed a state-space model to describe a time-varying data network stream.After an application-dependent transformation, monitoring statistics are considered as following a normal distributionwith a constant variance. The time-dependent patterns in the data are captured by B-spline functions. A CUSUM statisticis used to monitor deviations of the data stream relative to baseline forecasts. A concern with this approach is that trafficcounts with time-varying mean and variance are not easily transformed into data that follows a normal distribution.
Jeske et al39 and Montes de Oca et al40 defined a time slot structure on the data stream and assumed that after a suit-able application-dependent transformation, the data within a time slot are independent and identically distributed (iid).Historical data are used to estimate the time slot distributions nonparametrically, and then, a CUSUM tracking statis-tic based on the empirical probability integral transformations is proposed. The plausibility of finding an iid inducingtransformation within each time slot is a potential concern with this method.
Rather than trying to transform the data to accommodate model assumptions, a different approach directly modelsthe data network traffic with discrete models. Lambert and Liu41 used a time-varying negative binomial distribution forthe data within each time slot. They argue that using time-varying parameters for the negative binomial distributionsmitigates the need to account for correlation in the data. An EWMA tracking statistic based on an approximate probabilityintegral transformation is proposed. A potential concern with this approach is the premise that modeling correlation inthe data is not necessary.
Fu and Jeske1 used a generalized linear mixed model (GLMM) to model the data stream. A similar time slot structureis used, with negative binomial distributions, but the time slots are associated with an autocorrelated sequence of latentrandom effects. Repeated LRTs are used to detect change. The importance of explicitly employing an autocorrelationstructure in the random effects was demonstrated.
Readers are also referred to US patent literature for a number of additional monitoring methods. Marvasti and Jeske42
and Gluhovsky et al,43 and references therein, described a variety of approaches ranging from empirical based patternrecognition systems to systems that utilize statistical predictive modeling. The work of Gluhovsky et al43 is an interestingimplementation where probes are sent into the network to measure user experience with response times. The measuredresponse times are modeled with generalized additive models, from which thresholds that control FAR are developed.
4.3 Spotlight methodIn this section, we elaborate on the methodology proposed in the work of Fu and Jeske.1 In that paper, GLMMs wereproposed as models for data network traffic counts. The random effects in GLMMs can be used to capture both overdis-persion and autocorrelation in the data, and Poisson or negative binomial conditional distributions are a natural choicefor count data
4.3.1 Data network traffic modelFigure 2 introduced a data set that was used to motivate modeling counts with a Poisson GLMM that incorporates anhourly time slot structure. Let Yi j denote the jth count with the ith time hour. Here, i = 1,… , 168 (the number of hours
12 JESKE ET AL.
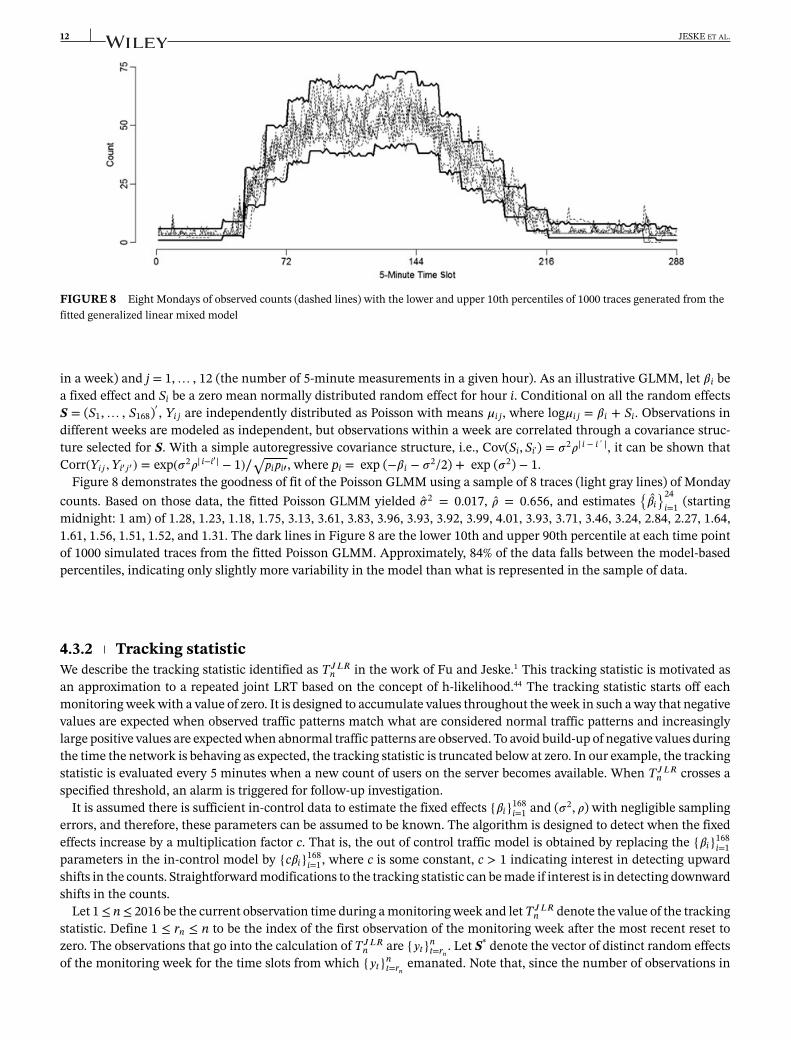
FIGURE 8 Eight Mondays of observed counts (dashed lines) with the lower and upper 10th percentiles of 1000 traces generated from thefitted generalized linear mixed model
in a week) and j = 1,… , 12 (the number of 5-minute measurements in a given hour). As an illustrative GLMM, let 𝛽 i bea fixed effect and Si be a zero mean normally distributed random effect for hour i. Conditional on all the random effectsS = (S1,… , S168)′ , Yi j are independently distributed as Poisson with means 𝜇i j, where log𝜇i j = 𝛽 i + Si. Observations indifferent weeks are modeled as independent, but observations within a week are correlated through a covariance struc-ture selected for S. With a simple autoregressive covariance structure, i.e., Cov(Si, Si') = 𝜎2𝜌∣ i − i ' ∣, it can be shown thatCorr(Y𝑖𝑗 ,Yi′𝑗′ ) = exp(𝜎2𝜌∣ i−i′∣ − 1)∕
√𝑝i𝑝i′, where pi = exp (−𝛽 i − 𝜎2/2) + exp (𝜎2) − 1.
Figure 8 demonstrates the goodness of fit of the Poisson GLMM using a sample of 8 traces (light gray lines) of Mondaycounts. Based on those data, the fitted Poisson GLMM yielded �̂�2 = 0.017, �̂� = 0.656, and estimates
{𝛽i}24
i=1 (startingmidnight: 1 am) of 1.28, 1.23, 1.18, 1.75, 3.13, 3.61, 3.83, 3.96, 3.93, 3.92, 3.99, 4.01, 3.93, 3.71, 3.46, 3.24, 2.84, 2.27, 1.64,1.61, 1.56, 1.51, 1.52, and 1.31. The dark lines in Figure 8 are the lower 10th and upper 90th percentile at each time pointof 1000 simulated traces from the fitted Poisson GLMM. Approximately, 84% of the data falls between the model-basedpercentiles, indicating only slightly more variability in the model than what is represented in the sample of data.
4.3.2 Tracking statisticWe describe the tracking statistic identified as T𝐽𝐿𝑅
n in the work of Fu and Jeske.1 This tracking statistic is motivated asan approximation to a repeated joint LRT based on the concept of h-likelihood.44 The tracking statistic starts off eachmonitoring week with a value of zero. It is designed to accumulate values throughout the week in such a way that negativevalues are expected when observed traffic patterns match what are considered normal traffic patterns and increasinglylarge positive values are expected when abnormal traffic patterns are observed. To avoid build-up of negative values duringthe time the network is behaving as expected, the tracking statistic is truncated below at zero. In our example, the trackingstatistic is evaluated every 5 minutes when a new count of users on the server becomes available. When T𝐽𝐿𝑅
n crosses aspecified threshold, an alarm is triggered for follow-up investigation.
It is assumed there is sufficient in-control data to estimate the fixed effects {𝛽i}168i=1 and (𝜎2, 𝜌) with negligible sampling
errors, and therefore, these parameters can be assumed to be known. The algorithm is designed to detect when the fixedeffects increase by a multiplication factor c. That is, the out of control traffic model is obtained by replacing the {𝛽i}168
i=1parameters in the in-control model by {c𝛽i}168
i=1, where c is some constant, c > 1 indicating interest in detecting upwardshifts in the counts. Straightforward modifications to the tracking statistic can be made if interest is in detecting downwardshifts in the counts.
Let 1≤ n ≤ 2016 be the current observation time during a monitoring week and let T𝐽𝐿𝑅n denote the value of the tracking
statistic. Define 1 ≤ rn ≤ n to be the index of the first observation of the monitoring week after the most recent reset tozero. The observations that go into the calculation of T𝐽𝐿𝑅
n are {𝑦t}nt=rn
. Let S* denote the vector of distinct random effectsof the monitoring week for the time slots from which {𝑦t}n
t=rnemanated. Note that, since the number of observations in
JESKE ET AL. 13
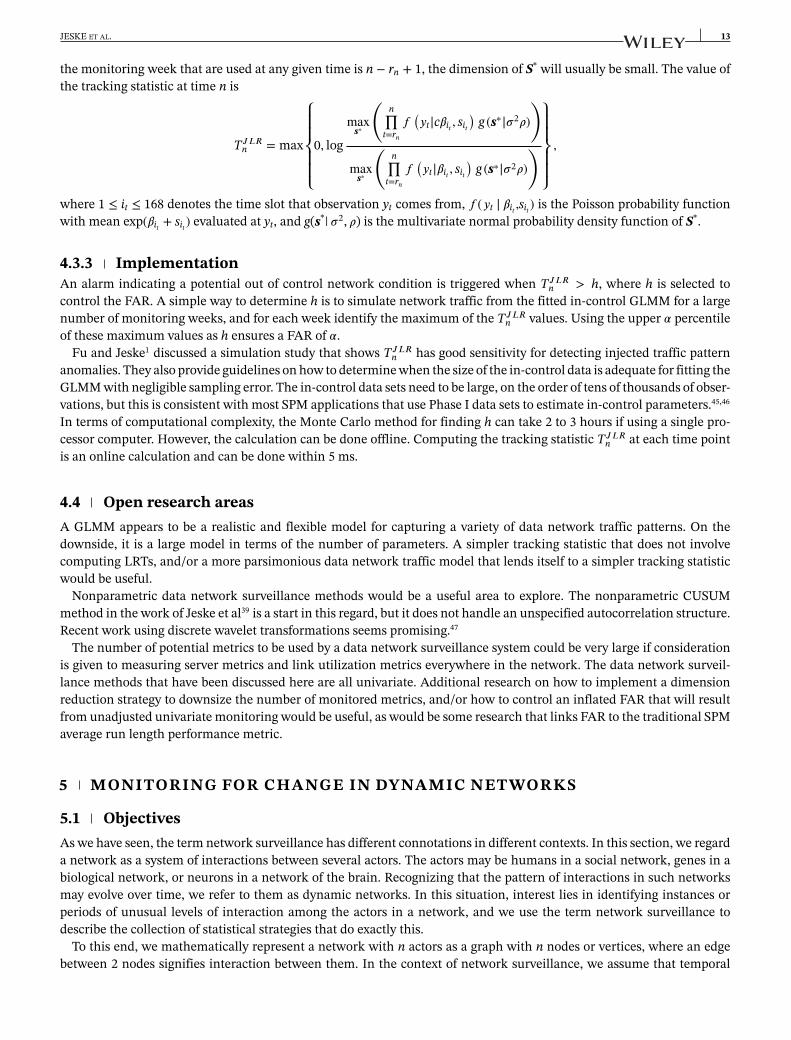
the monitoring week that are used at any given time is n − rn + 1, the dimension of S* will usually be small. The value ofthe tracking statistic at time n is
T𝐽𝐿𝑅n = max
⎧⎪⎪⎨⎪⎪⎩0, log
maxs∗
(n∏
t=rn
𝑓(𝑦t|c𝛽it , sit
)g (s∗|𝜎2𝜌)
)
maxs∗
(n∏
t=rn
𝑓(𝑦t|𝛽it , sit
)g (s∗|𝜎2𝜌)
)⎫⎪⎪⎬⎪⎪⎭,
where 1 ≤ it ≤ 168 denotes the time slot that observation yt comes from, 𝑓 (𝑦t | 𝛽it ,sit ) is the Poisson probability functionwith mean exp(𝛽it + sit ) evaluated at yt, and g(s*| 𝜎2, 𝜌) is the multivariate normal probability density function of S*.
4.3.3 ImplementationAn alarm indicating a potential out of control network condition is triggered when T𝐽𝐿𝑅
n > h, where h is selected tocontrol the FAR. A simple way to determine h is to simulate network traffic from the fitted in-control GLMM for a largenumber of monitoring weeks, and for each week identify the maximum of the T𝐽𝐿𝑅
n values. Using the upper 𝛼 percentileof these maximum values as h ensures a FAR of 𝛼.
Fu and Jeske1 discussed a simulation study that shows T𝐽𝐿𝑅n has good sensitivity for detecting injected traffic pattern
anomalies. They also provide guidelines on how to determine when the size of the in-control data is adequate for fitting theGLMM with negligible sampling error. The in-control data sets need to be large, on the order of tens of thousands of obser-vations, but this is consistent with most SPM applications that use Phase I data sets to estimate in-control parameters.45,46
In terms of computational complexity, the Monte Carlo method for finding h can take 2 to 3 hours if using a single pro-cessor computer. However, the calculation can be done offline. Computing the tracking statistic T𝐽𝐿𝑅
n at each time pointis an online calculation and can be done within 5 ms.
4.4 Open research areasA GLMM appears to be a realistic and flexible model for capturing a variety of data network traffic patterns. On thedownside, it is a large model in terms of the number of parameters. A simpler tracking statistic that does not involvecomputing LRTs, and/or a more parsimonious data network traffic model that lends itself to a simpler tracking statisticwould be useful.
Nonparametric data network surveillance methods would be a useful area to explore. The nonparametric CUSUMmethod in the work of Jeske et al39 is a start in this regard, but it does not handle an unspecified autocorrelation structure.Recent work using discrete wavelet transformations seems promising.47
The number of potential metrics to be used by a data network surveillance system could be very large if considerationis given to measuring server metrics and link utilization metrics everywhere in the network. The data network surveil-lance methods that have been discussed here are all univariate. Additional research on how to implement a dimensionreduction strategy to downsize the number of monitored metrics, and/or how to control an inflated FAR that will resultfrom unadjusted univariate monitoring would be useful, as would be some research that links FAR to the traditional SPMaverage run length performance metric.
5 MONITORING FOR CHANGE IN DYNAMIC NETWORKS
5.1 ObjectivesAs we have seen, the term network surveillance has different connotations in different contexts. In this section, we regarda network as a system of interactions between several actors. The actors may be humans in a social network, genes in abiological network, or neurons in a network of the brain. Recognizing that the pattern of interactions in such networksmay evolve over time, we refer to them as dynamic networks. In this situation, interest lies in identifying instances orperiods of unusual levels of interaction among the actors in a network, and we use the term network surveillance todescribe the collection of statistical strategies that do exactly this.
To this end, we mathematically represent a network with n actors as a graph with n nodes or vertices, where an edgebetween 2 nodes signifies interaction between them. In the context of network surveillance, we assume that temporal

14 JESKE ET AL.
“snapshots” of the dynamic network are available, and we let Gt = ([n], Wt) denote a network at time point t. Here, [n]represents the collection of nodes and Wt = {wt(u, v) : u, v ∈ [n]} represents the edge weights that quantify the strength ofthe relationship between nodes u, v ∈ [n]. Depending on the context and available data, the edge weights wt(u, v) may berecorded as binary indicators taking on the value of 1 only if nodes u and v share a specified level of interaction at time t.In other situations, the edge weights may be discrete valued and count the number of interactions between nodes u andv at time t. Here, we consider undirected graphs, meaning that no information regarding the direction of interaction isstored in the edge weights.
Supposing we observe a dynamic network prospectively through time (i.e., G1, G2, G3,… ), network surveillance pro-vides a formal methodology for identifying the time point(s), i.e., t*, at which the level of interaction between a small orlarge number of actors in the network has significantly changed. Network surveillance strategies are typically used for thedetection of periods of increased interaction, though they may also be used to identify unusually low levels of interactionas well.
In Section 5.2, we review a few existing methods of network surveillance, and in Section 5.3, we highlight one surveil-lance strategy in particular that follows a 2-stage framework based on SPM techniques. Specifically, we discuss theapproach proposed by Wilson et al48 that utilizes Shewhart and EWMA control charts to monitor parameter estimatesfrom the degree-corrected stochastic block model (DCSBM)49 for the fast detection of a variety of local and globalnetwork changes.
5.2 Literature reviewIt is important to note a distinction between our focus of prospectively detecting change in a dynamic network as newinformation becomes available versus identifying a point in time when a significant change occurred in a dynamic net-work by considering only historical data. Notable works on the latter include the work of Peel and Clauset,50 who describeda Bayes factor testing approach under the generalized hierarchical random graph model, and the work of Bhamidi et al,51
who investigated the preferential attachment dynamic network model. The remainder of this section will be devoted toprospective network surveillance strategies.
Several review papers have recently been published that discuss available methods, current challenges, and futureresearch in the field of network surveillance. In this section, we review a handful of network surveillance methodolo-gies that were chosen specifically to exemplify different areas of emphasis in network surveillance applications. For amore comprehensive review of this topic, see the works of Savage et al,52 Ranshous et al,53 Bindu and Thilagam,54 andWoodall et al.55
An example of a 2-stage network surveillance framework is proposed by McCulloh and Carley.56 These authors useda SPM methodology to monitor topological metrics such as average closeness and average betweenness with CUSUMand EWMA control charts. In their strategy, they suggest that five or more graphs should be used to establish a baselinefor the dynamic network, but realistically many more graphs are required to accurately characterize the distribution oftypical behavior.
Priebe et al57 similarly monitor topological summary statistics that they refer to as “scan statistics,” which describethe density of the graph. However, rather than using a fixed Phase I period to establish a baseline of typical variation,they recommend using a moving window of length 20. The advantage of a moving window approach is that the limitsof typical variation can adapt to the network as it evolves over time. However, as the window moves along, observationscorresponding to an undetected network change will be incorporated into the baseline, making it nearly impossible todetect a significant change in the network if the change is not identified almost immediately.
Sparks and Wilson58 generalized the univariate EWMA strategies for Poisson counts considered in the works of Weiß,59,60
Sparks et al,61,62 and Zhou et al63 to a multivariate setting for network surveillance. Similar EWMA control charts havebeen successfully applied to space-time monitoring of crime (see the works of Zeng et al,64 Kim and O'Kelly,65 Neill,66 andNakaya and Yano67). Sparks and Wilson58 and Mei68 are motivated by the identification of significant changes in teams ofactors, where the team is possibly unknown.
Azarnoush et al69 proposed a surveillance strategy for detecting anomalies in attributed dynamic networks, which arenetworks with covariate information (i.e., attributes) associated with each node. Their methodology uses logistic regres-sion to predict the probability of the existence of an edge between 2 nodes and then applies a LRT to compare the fittedlogistic regression models from one time point to the next. A significantly large value of the LRT statistic indicates asignificant change in the network.
JESKE ET AL. 15
Wilson et al48 proposed a surveillance approach that applies well-known SPM techniques to the estimated parametersof a dynamic random graph model for the observed network. The authors specifically describe surveillance of a degreecorrected stochastic block model; however, the chosen random graph model is a member of a larger family of possiblerandom graph models. We describe this technique in more detail in Section 5.3.
5.3 Spotlight methodIn this section, we highlight the approach proposed by Wilson et al48 in which a DCSBM49 is used to model each snapshotGt of the dynamic network, and Shewhart and EWMA control charts70 are used to monitor estimates of the parametersassociated with the DCSBM. In Section 5.3.1, we provide an overview of control charts and SPM, and in Section 5.3.2, weprovide details about the DCSBM and the surveillance methodology. Then, in Section 5.3.3, we illustrate its use on theEnron data introduced in Section 2.3.
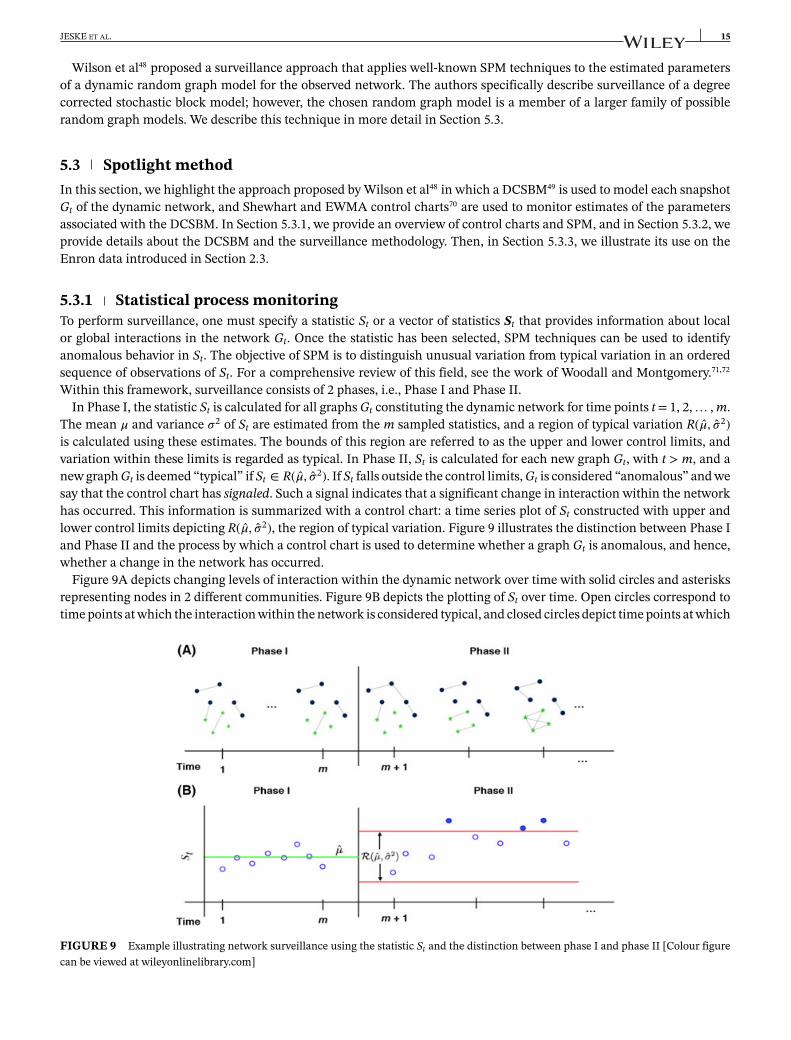
5.3.1 Statistical process monitoringTo perform surveillance, one must specify a statistic St or a vector of statistics St that provides information about localor global interactions in the network Gt. Once the statistic has been selected, SPM techniques can be used to identifyanomalous behavior in St. The objective of SPM is to distinguish unusual variation from typical variation in an orderedsequence of observations of St. For a comprehensive review of this field, see the work of Woodall and Montgomery.71,72
Within this framework, surveillance consists of 2 phases, i.e., Phase I and Phase II.In Phase I, the statistic St is calculated for all graphs Gt constituting the dynamic network for time points t = 1, 2,… , m.
The mean 𝜇 and variance 𝜎2 of St are estimated from the m sampled statistics, and a region of typical variation R(�̂�, �̂�2)is calculated using these estimates. The bounds of this region are referred to as the upper and lower control limits, andvariation within these limits is regarded as typical. In Phase II, St is calculated for each new graph Gt, with t > m, and anew graph Gt is deemed “typical” if St ∈ R(�̂�, �̂�2). If St falls outside the control limits, Gt is considered “anomalous” and wesay that the control chart has signaled. Such a signal indicates that a significant change in interaction within the networkhas occurred. This information is summarized with a control chart: a time series plot of St constructed with upper andlower control limits depicting R(�̂�, �̂�2), the region of typical variation. Figure 9 illustrates the distinction between Phase Iand Phase II and the process by which a control chart is used to determine whether a graph Gt is anomalous, and hence,whether a change in the network has occurred.
Figure 9A depicts changing levels of interaction within the dynamic network over time with solid circles and asterisksrepresenting nodes in 2 different communities. Figure 9B depicts the plotting of St over time. Open circles correspond totime points at which the interaction within the network is considered typical, and closed circles depict time points at which
FIGURE 9 Example illustrating network surveillance using the statistic St and the distinction between phase I and phase II [Colour figurecan be viewed at wileyonlinelibrary.com]

16 JESKE ET AL.
the level of interaction is anomalous since they lie outside R(�̂�, �̂�2), indicated by horizontal red lines. In both Figures,the sequence of networks and, hence, the sequence of statistics St, are partitioned into 2 time periods corresponding toPhase I and Phase II.
The performance of the control chart in Phase II depends largely on the definition of R(�̂�, �̂�2) and the accuracy withwhich it characterizes typical behavior. The definition of R(�̂�, �̂�2) will depend on the type of control chart and the typeof data being plotted, which, in turn, are guided by the types of changes one wishes to detect. We discuss these choicesfurther in Section 5.3.2. To ensure that the control limits accurately represent typical variation in St, we require that thePhase I data provide precise estimates of 𝜇 and 𝜎2. The importance of effectively collecting and analyzing baseline dataduring Phase I is discussed in the works of Jones-Farmer et al45 and Jeske.46
Note that the choice of statistic St is flexible; one may choose a topological metric that summarizes the connectivity ofthe nodes in the network such as density, centrality, or modularity measures, or one may choose to model the dynamicnetwork using a random graph model and take St to be an estimator of one or more parameters that govern the model.These 2 approaches can be thought of as nonparametric and parametric alternatives of one another. The spotlight methodemploys the parametric approach as it has 2 distinct advantages. First, the parameters of a random graph model typicallyhave useful interpretations, and a significant change in these parameters provides more information than just whenthe network has changed, it also provides valuable insight into where and how the network has changed. Second, theperformance of a network surveillance strategy should be tested using computer simulation in which the time and natureof the change are controlled by the investigators. Random graph models provide a means to easily simulate complex andrealistic networks for these types of investigations.
Thus, the spotlight network surveillance methodology is carried out in 2 stages. First, one chooses a suitable statistic Stthat adequately summarizes salient features of the dynamic network. In particular, estimates of the parameters associatedwith some appropriately chosen parametric random graph model are proposed. Next, one chooses a SPM strategy that isappropriate for the chosen statistic St and that is capable of quickly detecting the types of changes of interest.
5.3.2 The surveillance methodologyWe begin by describing the degree corrected stochastic block model, which is used to model the interactions amongactors within a dynamic network. The DCSBM itself is a probability distribution on the family of undirected graphswith discrete-valued edge weights, and it is characterized by parameters that capture 2 important aspects of real-worldnetworks: (i) community structure and (ii) degree heterogeneity.
The communities of a network refer to subgraphs (i.e., subsets of nodes) that are more densely connected to eachother than to the other nodes in the network. Empirically, a network G can be partitioned into k ≥ 1 disjoint vertex setsn = V1 ∪ V2 ∪ · · · ∪ Vk, where the level of interaction between actors within communities is larger than between commu-nities. The DCSBM easily accounts for this type of structure with a k × k connectivity matrix P, where the entries Pr, s > 0express the propensity of connection between nodes in communities r and s. Note that, for purposes of network surveil-lance, the community membership of each node is assumed known, but in practice, an appropriately chosen communitydetection algorithm must determine it. See the works of Porter et al73 and Fortuno74 for reviews of available methods.
While it is realistic to believe that community membership influences an actor's propensity to interact, it is also rea-sonable to assume that not all actors within a given community have the same propensity to interact. The degree d(u) ofa node u ∈ [n] is the total number of interactions that u takes part in
d (u) =∑
v∈[n]w (u, v) .
The DCSBM accommodates degree heterogeneity with the degree parameter 𝜽 = (𝜃1, 𝜃2,… , 𝜃n), which allows for a dif-ferent interaction propensity for each of the n actors in the network. Note that the DCSBM is not identifiable withoutsome constraint on 𝜽, and different authors impose different constraints. Wilson et al48 require the sum of 𝜃u in the samecommunity to equal the number of nodes in that community, namely,∑
u∶cu=r𝜃u = nr
for all r = 1, 2,… , k, where nr denotes the number of nodes in community r and cu denotes the community that node ubelongs to. Yu et al,75 on the other hand, requires
∑u∶cu=r
𝜃u = 1.

JESKE ET AL. 17
The choice of constraint simply scales the value of each 𝜃u and affects the value of the expectation and variability of anedge weight between nodes. For instance, the value of 𝜃u can be viewed as a probability that an edge connects to node ugiven that an edge connects to community r.
Given 𝜽, P and the community assignment of each node, the edge weights {w(u, v) : u, v ∈ [n]} are modeled using aPoisson distribution
w (u, v) ∼POI(𝜃u𝜃vPcu,cv
).
For a more detailed treatment of the degree corrected stochastic block model, see the work of Karrer and Newman.49
Maximum likelihood estimation may be used to obtain the following estimates of the DCSBM parameters
�̂�u = d (u)n−1
r∑
v∶cv=cud (v)
, P̂r,s =mr,s
nr ns,
wheremr,s =
∑u∶cu=r
∑v∶cv=s
w (u, v)
is the total weight of edges between communities r and s (twice the weight of edges when r = s).
The surveillance strategy we spotlight here monitors these estimates in the following manner. Each of the(
k2
)unique entries of P̂ is monitored via control charts. Signals on these control charts indicate changes in the level ofinteraction within and between communities. To monitor changes in the communities without monitoring each �̂�u indi-vidually, the following statistic is monitored to capture changes in the overall variability of interactions within communityr = 1, 2,… , k:
sr =√
1nr − 1
∑u∶cu=r
(�̂�u − 1
)2.
Alternatively, one may monitor the vector 𝜽 using a multivariate control chart as proposed by Yu et al.75 Thus, a total of(k2
)+k statistics (and hence, control charts) are monitored. To detect sudden large changes in each St, Shewhart control
chart for individual observations is used with control limits calculated as
R(�̂�, �̂�2) = �̂� ± 3�̂�.
Here, 𝜇 and 𝜎 are estimated using the m Phase I graphs as described in Section 5.3.1. In particular, �̂� is the samplemean of these statistics and �̂� is a moving range estimate of the standard deviation of the m statistics available from thePhase I graphs.
To detect small- to medium-sized changes that are persistent, an EWMA control chart is recommended. Instead ofmonitoring the statistics St directly, the EWMA control chart is a time series plot of Zt, an EWMA of the St is
Zt = 𝜆St + (1 − 𝜆) Zt−1,
where 0 < 𝜆 ≤ 1 is a smoothing constant and Z0 = �̂� is commonly chosen as the starting point for the moving average.The control limits associated with this control chart are calculated as
R(�̂�, �̂�2) = �̂� ± 3�̂�
√𝜆
2 − 𝜆,
where values 0.05 ≤ 𝜆 ≤ 0.25 have been found to work well in practice.A signal on any of these charts indicates that the interaction patterns within the network have changed in some way.
The particular statistic that signals provides information about the type and location of this change. Run length analyseshave shown that this methodology is able to quickly and accurately identify local and global changes in interaction levelsas well as community merges. However, the methodology in its current form does not account for inflated FAR that mayoccur due to the fact that many metrics are simultaneously being monitored. Extensions to this work should strive toimprove upon this shortcoming. We discuss other areas of future research in Section 5.4.
5.3.3 The Enron exampleAs an illustration of the spotlight methodology, we apply the DCSBM method to the Enron email corpus described inSection 2.3. We first estimated the communities of the aggregate network, which consists of the sum of each edge weightover all 143 weeks of email communication, using the walktrap community detection method76 available in the R package
18 JESKE ET AL.
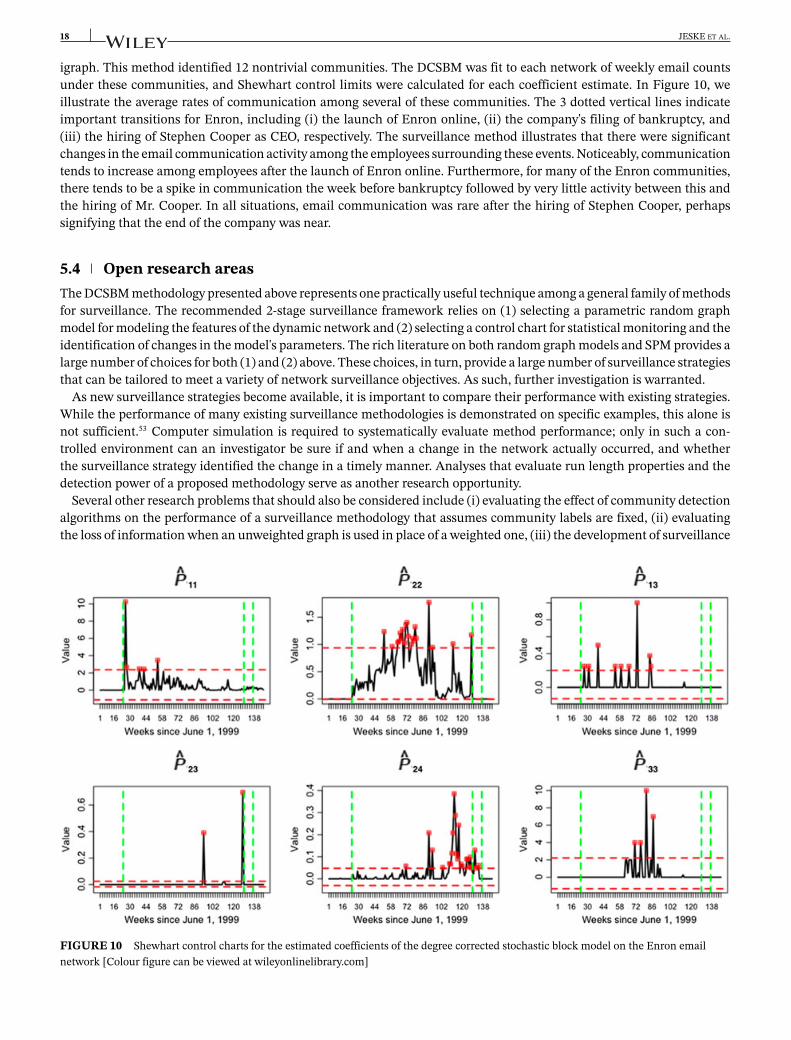
igraph. This method identified 12 nontrivial communities. The DCSBM was fit to each network of weekly email countsunder these communities, and Shewhart control limits were calculated for each coefficient estimate. In Figure 10, weillustrate the average rates of communication among several of these communities. The 3 dotted vertical lines indicateimportant transitions for Enron, including (i) the launch of Enron online, (ii) the company's filing of bankruptcy, and(iii) the hiring of Stephen Cooper as CEO, respectively. The surveillance method illustrates that there were significantchanges in the email communication activity among the employees surrounding these events. Noticeably, communicationtends to increase among employees after the launch of Enron online. Furthermore, for many of the Enron communities,there tends to be a spike in communication the week before bankruptcy followed by very little activity between this andthe hiring of Mr. Cooper. In all situations, email communication was rare after the hiring of Stephen Cooper, perhapssignifying that the end of the company was near.
5.4 Open research areasThe DCSBM methodology presented above represents one practically useful technique among a general family of methodsfor surveillance. The recommended 2-stage surveillance framework relies on (1) selecting a parametric random graphmodel for modeling the features of the dynamic network and (2) selecting a control chart for statistical monitoring and theidentification of changes in the model's parameters. The rich literature on both random graph models and SPM provides alarge number of choices for both (1) and (2) above. These choices, in turn, provide a large number of surveillance strategiesthat can be tailored to meet a variety of network surveillance objectives. As such, further investigation is warranted.
As new surveillance strategies become available, it is important to compare their performance with existing strategies.While the performance of many existing surveillance methodologies is demonstrated on specific examples, this alone isnot sufficient.53 Computer simulation is required to systematically evaluate method performance; only in such a con-trolled environment can an investigator be sure if and when a change in the network actually occurred, and whetherthe surveillance strategy identified the change in a timely manner. Analyses that evaluate run length properties and thedetection power of a proposed methodology serve as another research opportunity.
Several other research problems that should also be considered include (i) evaluating the effect of community detectionalgorithms on the performance of a surveillance methodology that assumes community labels are fixed, (ii) evaluatingthe loss of information when an unweighted graph is used in place of a weighted one, (iii) the development of surveillance
FIGURE 10 Shewhart control charts for the estimated coefficients of the degree corrected stochastic block model on the Enron emailnetwork [Colour figure can be viewed at wileyonlinelibrary.com]

JESKE ET AL. 19
strategies that account for the direction of interaction (i.e., directed as opposed to undirected graphs), and (iv) the devel-opment of surveillance strategies that account for the dependence between graphs at different time points, as opposed toassuming they are iid.
Furthermore, future work should further investigate network monitoring of attributed networks—networks with pos-sibly dynamic node and edge covariates—as well as complex multiplex networks that change through time. Finally, thetheoretical analysis of online surveillance methods for dynamic networks is lacking. This analysis will require appropriatemodeling of dynamic networks with change, which the DCSBM provides an initial effort.
6 SUMMARY
Network surveillance is a broad term, but it generally refers to monitoring a network of interconnected entities, lookingfor unexpected changes that precipitate a root cause investigation. We have illustrated network surveillance applicationsin the context of network security, network reliability, and social networks.
To a large extent, the statistical tools used for network surveillance are the same type of tools used in SPM applications.However, network surveillance contexts usually bring unique challenges that inhibit a straightforward application of thefamiliar SPM tools. It was seen in our examples that data network applications are challenged by how to characterizenonstationary and correlated count data, as well as unknown prechange and postchange parameters and even unknownmodels. Social networks have similar traffic characteristics and, furthermore, often have rapidly changing architectures.Network security applications are fraught with a wide variety of masking techniques employed by would-be perpetrators.Selecting appropriate metrics and dealing with high-dimensional and high-frequency data structures will be typical.
Development and implementation of the monitoring methods needed in network surveillance applications can beexpected to be an iterative and custom process. Our hope is that our review of the field, particularly our illustrativeapplications, can serve as a useful starting point for practitioners who are interested in developing network surveillancealgorithms.
ACKNOWLEDGEMENTS
In the past, the work of Alexander G. Tartakovsky related to network security was supported in part by the US ArmyResearch Office under grant W911NF-14-1-0246 at the University of Southern California and in part by the US Departmentof Energy Phase I SBIR contract at Argo Science Corp. Currently, his work is supported in part by the Ministry of Educationand Science of the Russian Federation through the Russian Academic Excellence Project 5-100 and the Arctic Project atMoscow Institute of Physics and Technology.
REFERENCES1. Fu Y, Jeske DR. SPC methods for non-stationary correlated count data with application to network surveillance. Appl Stoch Models Bus
Ind. 2014;30(6):708-722.2. Moody J, Mucha PJ. Portrait of political party polarization. Netw Sci. 2013;1(1):119-121.3. Taylor IW, Linding R, Warde-Farley D, et al. Dynamic modularity in protein interaction networks predicts breast cancer outcome. Nat
Biotechnol. 2009;27:199-204.4. Debar H, Dacier M, Wespi A. Toward a taxonomy of intrusion detection systems. Comput Netw. 1999;31(8):805-822.5. Kent S. On the trial of intrusions into information systems. IEEE Spectr. 2000;37(12):52-56.6. Scarfone K, Mell P. Guide to Intrusion Detection and Prevention Systems (IDPS). Gaithersburg, MD: National Institute of Standards and
Technology; 2007. NIST SP 800-94.7. Tartakovsky AG. Rapid detection of attacks in computer networks by quickest changepoint detection methods. In: Adams N, Heard N,
eds. Data Analysis for Network Cyber-Security. London, UK: Imperial College Press; 2014:33-70.8. Tartakovsky AG, Veeravalli VV. Asymptotically optimal quickest change detection in distributed sensor systems. Seq Anal.
2008;27(4):441-475.9. Tartakovsky AG, Rozovskii BL, Shah K. A nonparametric multichart CUSUM test for rapid intrusion detection. Paper presented at: Joint
Statistical Meetings; 2005; Minneapolis, MN.10. Tartakovsky AG, Rozovskii BL, Blažek R, Kim H. Detection of intrusions in information systems by sequential change-point methods. Stat
Methodol. 2006;3(3):252-340.11. Mirkovic J, Dietrich S, Dittrich D, Reiher P. Internet Denial of Service: Attack and Defense Mechanisms. Upper Saddle River, NJ: Prentice
Hall; 2005.

20 JESKE ET AL.
12. Cheng C-M, Kung HT, Tan K-S. Use of spectral analysis in defense against DoS attacks. Paper presented at: IEEE Global CommunicationsConference; 2002; Taipei, Taiwan.
13. Barford B, Kline J, Plonka D, Ron A. A signal analysis of network traffic anomalies. Paper presented at: Internet Measurement Workshop;2002; Marseille, France.
14. Hussain A, Heidemann J, Papadopoulos C. A framework for classifying denial of service attacks. Paper presented at: ACM SIGCOMMConference; 2003; Karlsruhe, Germany.
15. Lakhina A, Crovella M, Diot C. Mining anomalies using traffic feature distributions. Paper presented at: ACM SIGCOMM Conference;2005; Philadelphia, PA.
16. Partridge C, Cousins D, Jackson AW, Krishnan R, Saxena T, Strayer WT. Using signal processing to analyze wireless data traffic. Paperpresented at: ACM Workshop on Wireless Security; 2002; Atlanta, GA.
17. Huang P, Feldmann A, Willinger W. A non-intrusive, wavelet-based approach to detecting network performance problems. Paperpresented at: ACM SIGCOMM Internet Measurement Workshop; 2001; San Francisco, CA.
18. Li L, Lee G. DDoS attack detection and wavelets. Paper presented at: 12th International Conference on Computer Communications andNetworks; 2003; San Francisco, CA.
19. He X, Papadopoulos C, Heidemann J, Mitra U, Riaz U. Remote detection of bottleneck links using spectral and statistical methods. ComputNetw. 2009;53(3):279-298.
20. Bartlett G, Heidemann J. Papadopoulos C. Understanding passive and active service discovery. Paper presented at: 6th AMC SIGCOMMConference on Internet Measurement Conference; 2007; San Diego, CA.
21. Hussain A, Heidemann J, Papadopoulos C. Identification of repeated denial of service attacks. Paper presented at: IEEE Conference onComputer Communications; 2006; Barcelona, Spain.
22. Mirkovic J, Reiher P, Papadopoulos C, et al. Testings a collaborative DDoS defense in a red team/blue team exercise. IEEE Trans Comput.2008;57(8):1098-1112.
23. Mitra U, Heidemann J, Ortega A, Papadopoulos C. Detecting and identifying malware: a new signal processing goal. IEEE Signal ProcessMag. 2006;23(5):107-111.
24. Marchette D. Computer Intrusion Detection and Network Monitoring: A Statistical View-point. New York, NY: Springer; 2001.25. Tartakovsky AG. Hybrid Intrusion Detection System Integrating Anomaly and Signature Intrusion Detection Methods. Rolling Hills Estates,
CA: Argo Science Corp; 2010. Phase I Final Technical Report.26. Tartakovsky AG, Polunchenko AS. Decentralized quickest change detection in distributed sensor systems with applications to information
assurance and counter terrorism. Paper presented at: 13th Annual Army Conference on Applied Statistics; 2007; Houston, TX.27. Tartakovsky AG, Veeravalli V. Change-point detection in multichannel and distributed systems with applications. In: Mukhopadhyay N,
Datta S, Chattopadhyay S, eds. Applications of Sequential Methodologies. New York, NY: Marcel Dekker; 2004.28. Tartakovsky AG, Rozovskii BL, Blažek R, Kim H. A novel approach to detection of intrusions in computer networks via adaptive sequential
and batch-sequential change-point detection methods. IEEE Trans Signal Process. 2006;54(9):3372-3382.29. Tartakovsky AG, Polunchenko AS, Sokolov G. Efficient computer network anomaly detection by changepoint detection methods. IEEE J
Sel Top Signal Process. 2013;7(1):4-11.30. Tartakovsky AG, Nikiforov I, Basseville M. Sequential Analysis: Hypothesis Testing and Changepoint Detection. Boca Raton, FL: CRC Press;
2014.31. Polunchenko AS, Tartakovsky AG, Mukhopadhhyay N. Nearly optimal change-point detection with an application to cybersecurity. Seq
Anal. 2010;31(3):409-435.32. Antonatos S, Anagnostakis KG, Markatos EP. Polychronakis M. Performance analysis of content matching intrusion detection systems.
Paper presented at: Symposium on Applications and the Internet; 2004; Tokyo, Japan.33. Xinidis K, Charitakis I, Antonatos S, Anagnostakis KG, Markatos EP. An active splitter architecture for intrusion detection and prevention.
IEEE Trans Dependable Secure Comput. 2006;3(1):31-44.34. DiBenedetto S, Massey D, Papadopoulos C, Walsh P. Analyzing the Aftermath of the McColo Shutdown. Paper presented at: Workshop
on Trust and Security in the Future Internet in conjunction with SAINT 2009; 2009; Seattle, WA.35. Feather FW, Siewiorek R, Maxion D. Fault detection in ethernet networks using anomaly signature matching. Paper presented at: ACM
SIGCOMM '93 Conference on Communications Architectures, Protocols and Applications; 1993; San Francisco, CA.36. Brutlag JD. Aberrant behavior detection in time series for network monitoring. Paper presented at: 14th Systems Administration
Conference; 2000; New Orleans, LA.37. Thottan M, Ji C. Adaptive thresholding for proactive network problem detection. Paper presented at: IEEE 3rd International Workshop
on Systems Management. 1998; Newport, RI.38. Cao J, Chen A, Bu T, Buvaneswari A. Monitoring time-varying network streams using state-space models. Paper presented at: IEEE
INFOCOM. 2009; Rio de Janeiro, Brazil.39. Jeske DR, Montes de Oca V, Bischoff W, Marvasti M. CUSUM techniques for timeslot sequences with applications to network surveillance.
Comput Stat Data Anal. 2009;53:4332-4344.40. Montes de Oca V, Jeske DR, Zhang Q, Rendon C, Marvasti M. A CUSUM changepoint detection algorithm for non-stationary sequences
with application to network surveillance. J Softw Syst. 2010;83:1288-1298.41. Lambert D, Liu C. Adaptive thresholds: monitoring streams of network counts. J Am Stat Assoc. 2006;101(473):78-88.42. Marvasti M, Jeske DR. Nonparametric method for determination of anomalous event states in complex systems exhibiting non-stationarity.
US patent 8,275,563. September 25, 2012.

JESKE ET AL. 21
43. Gluhovsky I, Hoffman AJ, Lee HM, Yashchin E. System and method of predicting future behavior of a battery of end-to-end probes toanticipate and prevent computer network performance degradation. US patent 7,081,823. July 25, 2006.
44. Lee Y, Nelder JA, Noh M. H-likelihood: problems and solutions. Stat Comput. 2007;17(1):49-55.45. Jones-Farmer LA, Woodall WH, Steiner SH, Champ CW. An overview of phase I analysis for process improvement and monitoring. J Qual
Technol. 2014;46(3:265-280.46. Jeske DR. Determining the phase 1 study sample size to control the accuracy of the conditional in-control ARL of a normal-theory CUSUM.
Qual Reliab Eng Int. 2016;32:2499-2504.47. Zhou Y, Li J, Jeske DR. A wavelet-based nonparametric CUSUM control chart for Autocorrelated processes with applications to network
surveillance. Paper presented at: Joint Statistical Meetings; 2017; Baltimore, MD.48. Wilson JD, Stevens NT, Woodall WH. Modeling and estimating change in temporal networks via a dynamic degree corrected stochastic
block model. 2016. https://arxiv.org/abs/1605.0404949. Karrer B, Newman ME. Stochastic block models and community structure in networks. Phys Review E. 2011;83(1). https://doi.org/10.
1103/PhysRevE.83.01610750. Peel L, Clauset A. Detecting change points in the large-scale structure of evolving networks. Paper presented at: 29th AAAI Conference
on Artificial Intelligence; 2015; Austin, TX.51. Bhamidi S, Jin J, Nobel AB. Change point detection in network models: Preferential attachment and long-range dependence. 2015. https://
arxiv.org/abs/1508.0204352. Savage D, Zhang X, Yu X, Chou P, Wang Q. Anomaly detection in online social networks. Soc Netw. 2014;39:62-70.53. Ranshous S, Shen S, Koutra D, Harenberg S, Faloutsos C, Samatova NF. Anomaly detection in dynamic networks: a survey. Wiley
Interdiscip Rev Comput Stat. 2015;7(3):223-247.54. Bindu PV, Thilagam PS. Mining social networks for anomalies: methods and challenges. J Netw Comput Appl. 2016;68:213-229.55. Woodall WH, Zhao MJ, Paynabar K, Sparks R, Wilson JD. An overview and perspective on social network monitoring. IISE Trans.
2017;49(3):354-365.56. McCulloh I, Carley KM. Detecting change in longitudinal social networks. J Soc Struct. 2011;12:1-37.57. Priebe CE, Conroy JM, Marchette DJ, Park Y. Scan statistics on Enron graphs. Comput Math Organ Theory. 2005;11(3):229-247.58. Sparks R, Wilson, JD. Monitoring communication outbreaks among an unknown team of actors in dynamic networks. 2016. https://arxiv.
org/abs/1606.0930859. Weiß CH. Controlling processes of Poisson counts. Qual Reliab Eng Int. 2007;23(6):741-754.60. Weiß CH. EWMA monitoring of correlated processes of Poisson counts. Qual Technol Quant Manag. 2009;6(2):137-153.61. Sparks RS, Keighley T, Muscatello D. Improving EWMA plans for detecting unusual increases in Poisson counts. Adv Decis Sci.
2009;2009:1-16.62. Sparks RS, Carter C, Graham PL, et al. A strategy for understanding the sources of variation in syndromic surveillance for bioterrorism
and public health incidence. IIE Trans. 2010;42:613-631.63. Zhou Q, Zou C, Wang Z, Jiang W. Likelihood-based EWMA charts for monitoring Poisson count data with time-varying sample sizes. J
Am Stat Assoc. 2012;107(499):1049-1062.64. Zeng D, Chang W, Chen H. A comparative study of spatio-temporal hotspot analysis techniques in security informatics. Paper presented
at: 7th International IEEE Conference on Intelligent Transportation Systems; 2004; Washington, WA.65. Kim Y, O'Kelly M. A bootstrap based space–time surveillance model with an application to crime occurrences. J Geogr Syst.
2008;10(2):141-165.66. Neill DB. Expectation-based scan statistics for monitoring spatial time series data. Int J Forecasting. 2009;25(3):498-517.67. Nakaya T, Yano K. Visualizing crime clusters in a space-time cube: an exploratory data-analysis approach using space-time kernel density
estimation and scan statistics. Trans GIS. 2010;14(3):223-239.68. Mei, Y. Quickest detection in censoring sensor networks. Paper presented at: IEEE International Symposium on Information Theory;
2011; Saint Petersburg, Russia.69. Azarnoush B, Paynabar K, Bekki J, Runger G. Monitoring temporal homogeneity in attributed network streams. J Qual Technol.
2016;48:28-43.70. Montgomery DC. Introduction to statistical quality control. 7th ed. New York, NY: John Wiley & Sons; 2013.71. Woodall WH, Montgomery DC. Research issues and ideas in statistical process control. J Qual Technol. 1999;31(4):376-386.72. Woodall WH, Montgomery DC. Some current directions in the theory and application of statistical process monitoring. J Quality
Technology. 2014;46(1):78-94.73. Porter MA, Onnela J-P, Mucha PJ. Communities in networks. Notices Am Math Soc. 2009;56:1082-1097.74. Fortunato S. Community detection in graphs. Phys Rep. 2010;486(3):75-174.75. Yu L, Woodall WH, Tsui KL. Detecting node propensity changes in dynamic degree corrected stochastic block models. Paper presented
at: 5th International Symposium on Statistical Process Monitoring; 2017; Seoul, South Korea.76. Pons P, Latapy M. Computing communities in large networks using random walks. Paper presented at: International Symposium on
Computer and Information Sciences; 2005; Istanbul, Turkey.
How to cite this article: Jeske DR, Stevens NT, Tartakovsky AG, Wilson JD. Statistical methods for networksurveillance. Appl Stochastic Models Bus Ind. 2018;1–21. https://doi.org/10.1002/asmb.2326
View publication statsView publication stats