Statistical Digest of Rural England - GOV.UK
221
Statistical Digest of Rural England March 2021 Edition
-
Upload
khangminh22 -
Category
Documents
-
view
5 -
download
0
Transcript of Statistical Digest of Rural England - GOV.UK
Statistical Digest of Rural England
March 2021 Edition

© Crown copyright 2021
You may re-use this information (excluding logos) free of charge in any format or medium, under the terms of the Open Government Licence v.3. To view this licence visit www.nationalarchives.gov.uk/doc/open-government-licence/version/3/ or email [email protected]
This publication is available at www.gov.uk/government/publications
Any enquiries regarding this publication should be sent to us at
PB14659
www.gov.uk/defra
3
Contents
Statistical Digest of Rural England .................................................................................. 1 Introduction ........................................................................................................................5 Official Statistics ................................................................................................................5 Defining rural areas ...........................................................................................................6 Rural population and migration ...................................................................................... 11
Mid-year population 2019 ......................................................................................................... 11 Population by age ..................................................................................................................... 12 Average age of the population ................................................................................................. 16 Population change .................................................................................................................... 18 Ethnicity .................................................................................................................................... 20 Population at local authority level ............................................................................................. 22 Internal migration ...................................................................................................................... 28 Internal migration by age .......................................................................................................... 31
Rural economy ................................................................................................................. 34 Employment and earnings .............................................................................................. 34
Employment rate ...................................................................................................................... 35 Unemployment rate .................................................................................................................. 36 Economic inactivity ................................................................................................................... 37 Earnings ................................................................................................................................... 39
Home working ................................................................................................................ 43 Productivity measured by Gross Value Added (GVA) .................................................... 49
Contribution to England's Gross Value Added (GVA) .............................................................. 50 Gross Value Added (GVA) per Workforce Job ......................................................................... 52 Productivity by Industry ............................................................................................................ 54
Businesses ..................................................................................................................... 58 Business composition ............................................................................................................... 58 Businesses by industry type ..................................................................................................... 61 Employment by industry type ................................................................................................... 68 Businesses by size band .......................................................................................................... 71 Small and medium businesses ................................................................................................. 74 Business count ......................................................................................................................... 84 Business start-ups .................................................................................................................... 85
Innovation and investment .............................................................................................. 86 Businesses engaged in innovation ........................................................................................... 86 Capital investment per employee ............................................................................................. 88
Rural accessibility ........................................................................................................... 90 Transport and travel ....................................................................................................... 90
Distance travelled ..................................................................................................................... 91 Trips made ............................................................................................................................... 97 Journey to School ................................................................................................................... 101
Accessibility to services ................................................................................................ 106 Average minimum travel times ............................................................................................... 107 Access to key services ........................................................................................................... 110 Average number of key services available ............................................................................. 113
Sections of the Digest are updated throughout the year. In this edition the following section(s) have been updated:
• Businesses: counts and start-ups
4
Overall measure of accessibility of services ........................................................................... 116 Broadband .................................................................................................................... 124
Broadband speed ................................................................................................................... 125 Broadband coverage .............................................................................................................. 127
Tourism ........................................................................................................................ 132 Gross Value Added (GVA) from Tourism ............................................................................... 132 Tourism: business counts and employment ........................................................................... 132
Rural living ..................................................................................................................... 134 Housing ........................................................................................................................ 134
Housing completions .............................................................................................................. 134 Net additions to housing stock ............................................................................................... 138 Residential housing transactions ............................................................................................ 142 Additions to affordable housing stock ..................................................................................... 148 Housing and accommodation affordability ............................................................................. 151 Housing affordability ............................................................................................................... 151 Homelessness and temporary accommodation ..................................................................... 154
Household expenditure ................................................................................................ 156 Nominal expenditure and disposable income ......................................................................... 156 Expenditure on commodity or service groups ........................................................................ 158
Deprivation ................................................................................................................... 161 Poverty ......................................................................................................................... 164 Fuel poverty .................................................................................................................. 170 Education and skills ...................................................................................................... 174
Childcare provision ................................................................................................................. 174 Secondary education .............................................................................................................. 179 Pupils leaving school with English and Maths at A* to C grades at GCSE level, based on residency of pupils .................................................................................................................. 179 Pupils leaving school with English and Maths A* to C grades or equivalent at GCSE level, based on Income Deprivation Affecting Children Indices (IDACI) decile and residency of pupils .... 180 Pupils leaving school with English and Maths at 9 to 4 pass at GCSE level, by Local Authority District areas based on residency of pupils ............................................................................ 182 Pupils leaving school with English and Maths A* to C grades or equivalent at GCSE level, based on school location ................................................................................................................... 185 School inspection outcomes, based on school location ......................................................... 186 Higher education .................................................................................................................... 188 Full-time entrants to higher education .................................................................................... 188 Part-time entrants to higher education ................................................................................... 189 Skills ....................................................................................................................................... 190 Workplace based skills ........................................................................................................... 190 Residence based skills ........................................................................................................... 195 Apprenticeships ...................................................................................................................... 200
Health and Wellbeing ................................................................................................... 202 Life expectancy ...................................................................................................................... 203 Potential years of life lost (PYLL) ........................................................................................... 205 Infant mortality rate ................................................................................................................. 206 Wellbeing ................................................................................................................................ 207
Crime ............................................................................................................................ 213 Commercial Victimisation Survey ........................................................................................... 216 Crime Survey for England & Wales ........................................................................................ 217
5
Introduction The Statistical Digest of Rural Statistics is a collection of statistics on a range of social and economic subject areas. The statistics are split by rural and urban areas, allowing for comparisons between the different rural and urban area classifications. The Digest includes high level statistics which present an overall picture for England. However, there is likely to be considerable variation in individual towns, villages and hamlets.
The Digest starts with a section on the rural and urban populations in England. This is followed by a rural economy section containing indicators on economic activity, earnings, productivity as well as a selection of indicators relating to economic growth. The Rural accessibility section includes data on transport, measuring accessibility to services and broadband. The final section of the Digest includes a selection of rural living statistics on housing, household expenditure, poverty, education, health and crime.
Sections of the Digest are updated throughout the year. In this edition the following section(s) have been updated:
• Businesses: counts and start-ups
Official Statistics These statistics have been produced to the high professional standards set out in the Code of Practice for Official Statistics, which sets out eight principles including meeting user needs, impartiality and objectivity, integrity, sound methods and assured quality, frankness and accessibility.
More information on the Official Statistics Code of Practice can be found at http://www.statisticsauthority.gov.uk/assessment/code-of-practice/index.html.
This publication has been compiled by Rural Evidence (Statistics), within Rural Policy in Defra:
Stephen Hall Sarah Harriss Ruth Dickson Tasmia Choudhury Fergus Walden
There is a special Census 2011 version of the Digest which looks at the data from the 2011 census and where possible makes comparisons to the 2001 census results.
This can be found at https://www.gov.uk/government/statistics/2011-census-results-for-rural-england
6
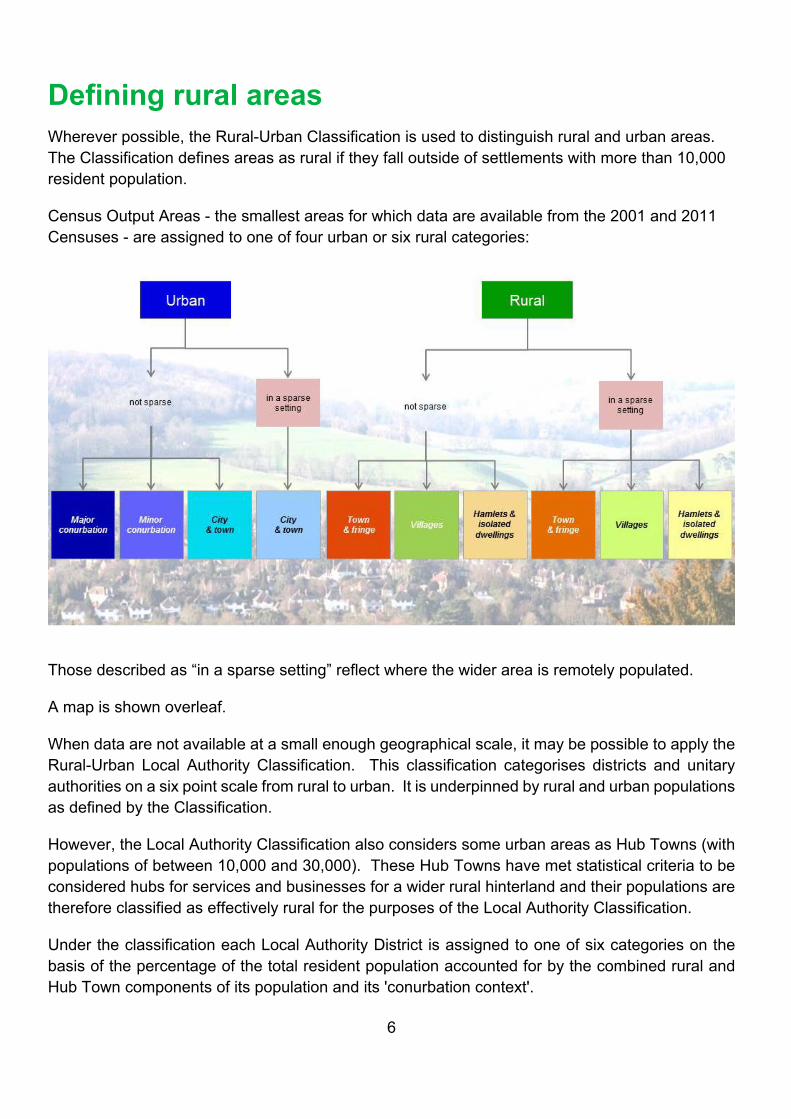
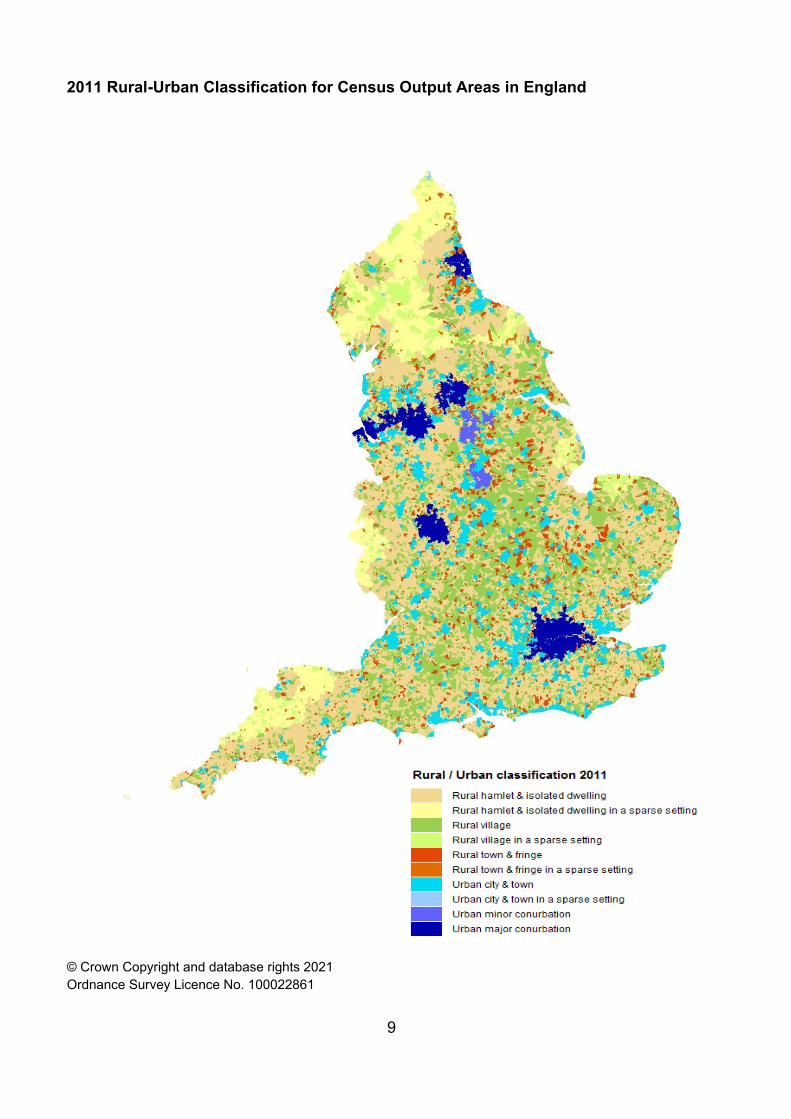
Defining rural areas Wherever possible, the Rural-Urban Classification is used to distinguish rural and urban areas. The Classification defines areas as rural if they fall outside of settlements with more than 10,000 resident population.
Census Output Areas - the smallest areas for which data are available from the 2001 and 2011 Censuses - are assigned to one of four urban or six rural categories:
Those described as “in a sparse setting” reflect where the wider area is remotely populated.
A map is shown overleaf.
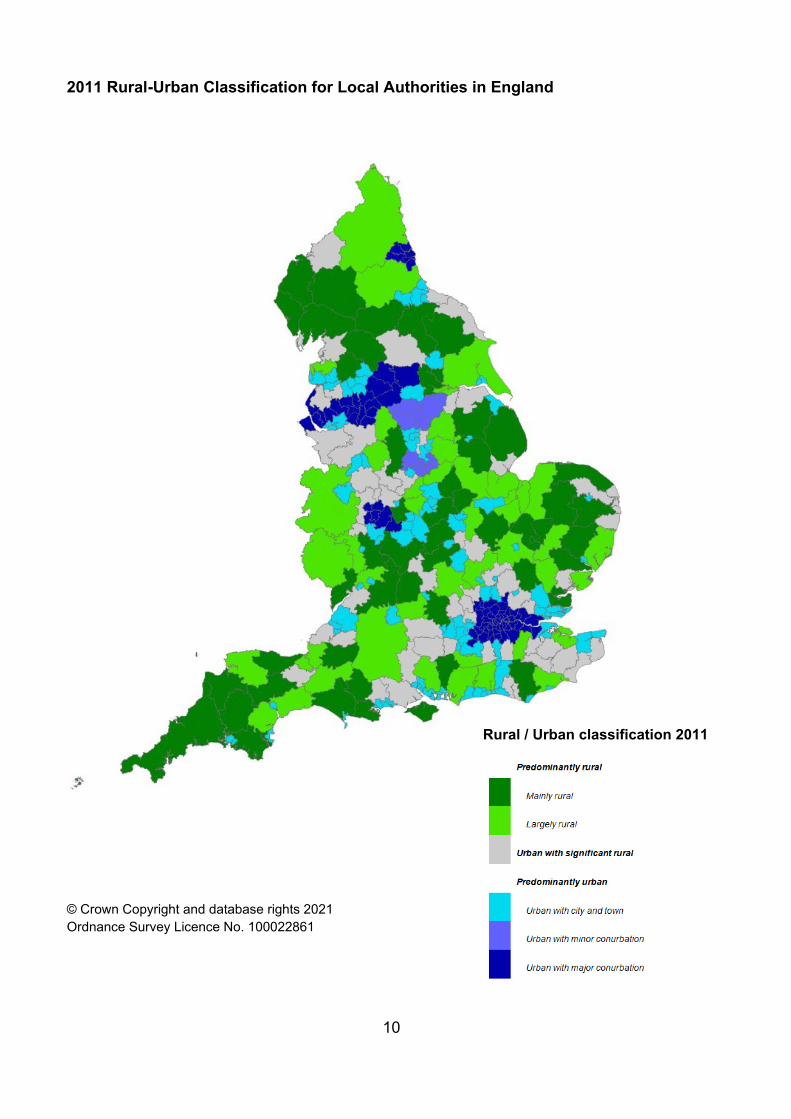
When data are not available at a small enough geographical scale, it may be possible to apply the Rural-Urban Local Authority Classification. This classification categorises districts and unitary authorities on a six point scale from rural to urban. It is underpinned by rural and urban populations as defined by the Classification.
However, the Local Authority Classification also considers some urban areas as Hub Towns (with populations of between 10,000 and 30,000). These Hub Towns have met statistical criteria to be considered hubs for services and businesses for a wider rural hinterland and their populations are therefore classified as effectively rural for the purposes of the Local Authority Classification.
Under the classification each Local Authority District is assigned to one of six categories on the basis of the percentage of the total resident population accounted for by the combined rural and Hub Town components of its population and its 'conurbation context'.
7
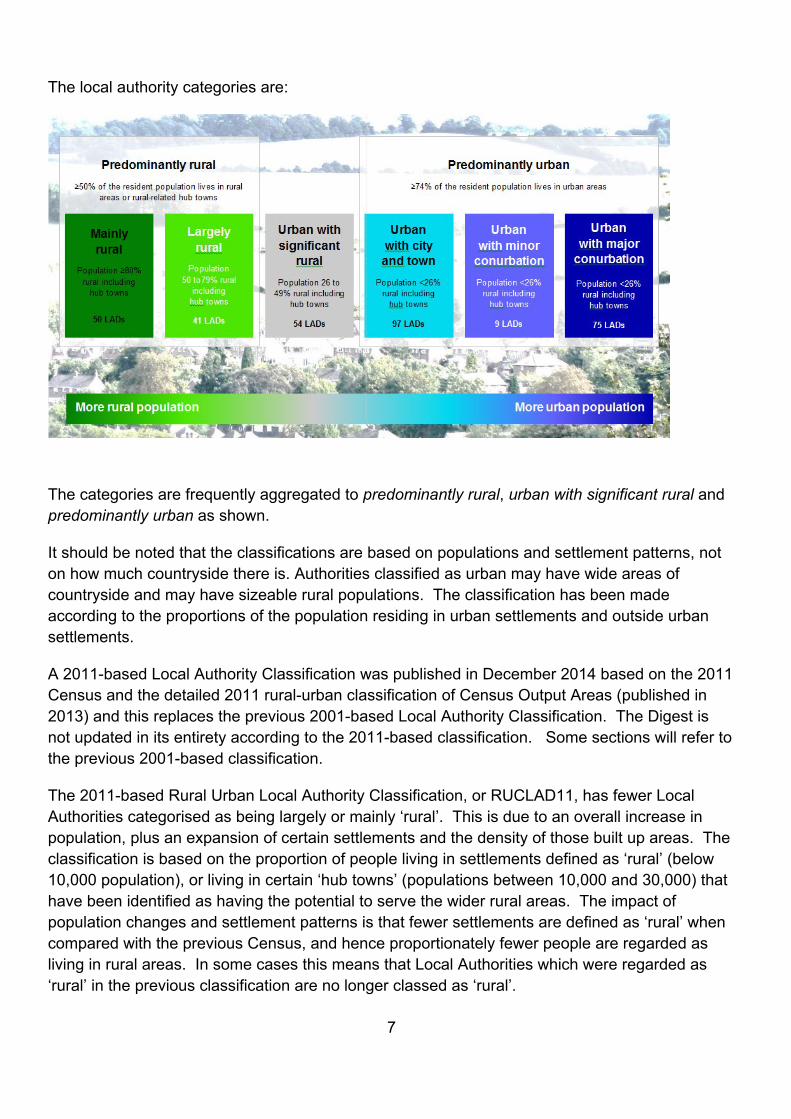
The local authority categories are:
The categories are frequently aggregated to predominantly rural, urban with significant rural and predominantly urban as shown.
It should be noted that the classifications are based on populations and settlement patterns, not on how much countryside there is. Authorities classified as urban may have wide areas of countryside and may have sizeable rural populations. The classification has been made according to the proportions of the population residing in urban settlements and outside urban settlements.
A 2011-based Local Authority Classification was published in December 2014 based on the 2011 Census and the detailed 2011 rural-urban classification of Census Output Areas (published in 2013) and this replaces the previous 2001-based Local Authority Classification. The Digest is not updated in its entirety according to the 2011-based classification. Some sections will refer to the previous 2001-based classification.
The 2011-based Rural Urban Local Authority Classification, or RUCLAD11, has fewer Local Authorities categorised as being largely or mainly ‘rural’. This is due to an overall increase in population, plus an expansion of certain settlements and the density of those built up areas. The classification is based on the proportion of people living in settlements defined as ‘rural’ (below 10,000 population), or living in certain ‘hub towns’ (populations between 10,000 and 30,000) that have been identified as having the potential to serve the wider rural areas. The impact of population changes and settlement patterns is that fewer settlements are defined as ‘rural’ when compared with the previous Census, and hence proportionately fewer people are regarded as living in rural areas. In some cases this means that Local Authorities which were regarded as ‘rural’ in the previous classification are no longer classed as ‘rural’.
8
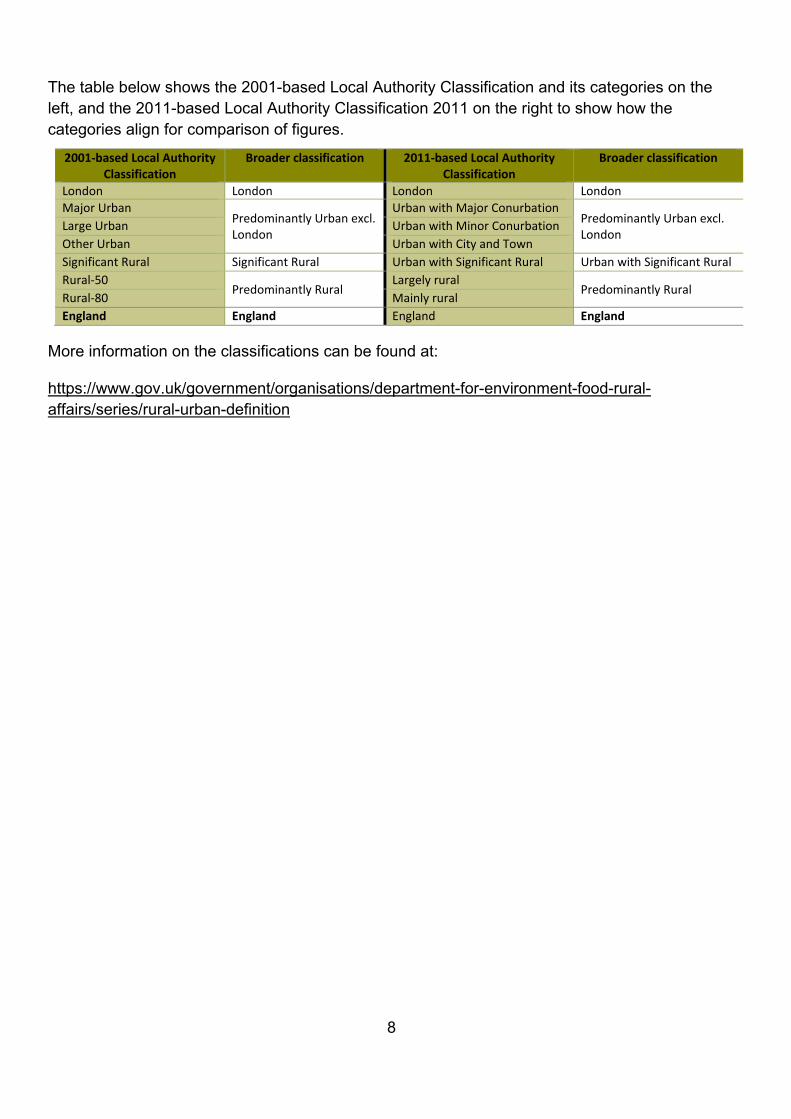
The table below shows the 2001-based Local Authority Classification and its categories on the left, and the 2011-based Local Authority Classification 2011 on the right to show how the categories align for comparison of figures.
2001-based Local Authority Classification
Broader classification 2011-based Local Authority Classification
Broader classification
London London London London Major Urban
Predominantly Urban excl. London
Urban with Major Conurbation Predominantly Urban excl. London
Large Urban Urban with Minor Conurbation Other Urban Urban with City and Town Significant Rural Significant Rural Urban with Significant Rural Urban with Significant Rural Rural-50
Predominantly Rural Largely rural
Predominantly Rural Rural-80 Mainly rural England England England England
More information on the classifications can be found at:
https://www.gov.uk/government/organisations/department-for-environment-food-rural-affairs/series/rural-urban-definition
9
2011 Rural-Urban Classification for Census Output Areas in England
© Crown Copyright and database rights 2021 Ordnance Survey Licence No. 100022861
10
2011 Rural-Urban Classification for Local Authorities in England
© Crown Copyright and database rights 2021 Ordnance Survey Licence No. 100022861
Rural / Urban classification 2011
11
Rural population and migration Mid-year population 2019 • In 2019 the mid-year population estimate (based on Lower Super Output Areas, LSOAs) for
England was 56.3 million, of which 9.6 million (17.1 per cent) lived in rural areas and 46.7 million (82.9 per cent) lived in urban areas.
• In 2011 the more detailed Census output area-based rural population was 9.3 million (17.6 per cent) while the mid-year population estimate based on LSOAs was 9.1 million (17.2 per cent). Further explanation can be found in footnote 1
• In comparing population estimates at LSOA level there was an increase in the rural population from 9.1 million in 2011 (LSOA-based) to 9.6 million in 2019 (LSOA-based), however the proportion of the total population has fallen from 17.2 per cent to 17.1 per cent over the same time period, as the urban population has increased at a faster rate.
• Within rural areas, 0.5 million people lived in sparse settings in 2019.
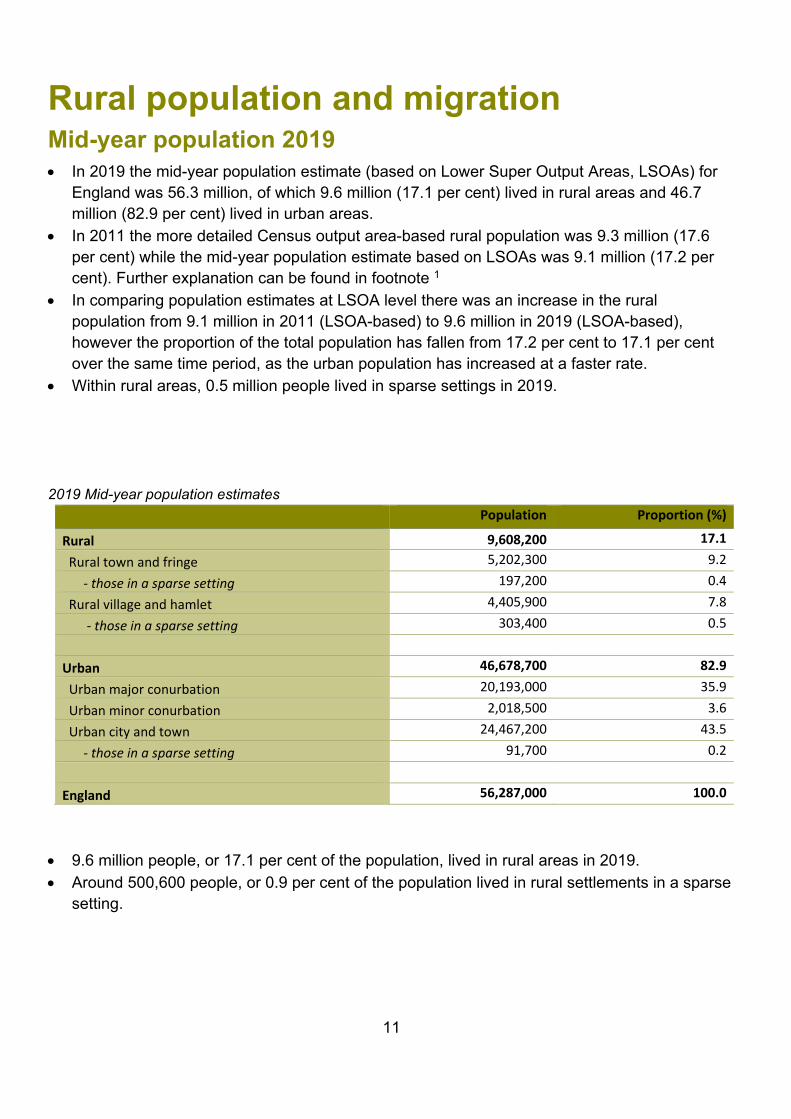
2019 Mid-year population estimates Population Proportion (%)
Rural 9,608,200 17.1
Rural town and fringe 5,202,300 9.2
- those in a sparse setting 197,200 0.4
Rural village and hamlet 4,405,900 7.8
- those in a sparse setting 303,400 0.5
Urban 46,678,700 82.9
Urban major conurbation 20,193,000 35.9
Urban minor conurbation 2,018,500 3.6
Urban city and town 24,467,200 43.5
- those in a sparse setting 91,700 0.2
England 56,287,000 100.0
• 9.6 million people, or 17.1 per cent of the population, lived in rural areas in 2019. • Around 500,600 people, or 0.9 per cent of the population lived in rural settlements in a sparse
setting.
12
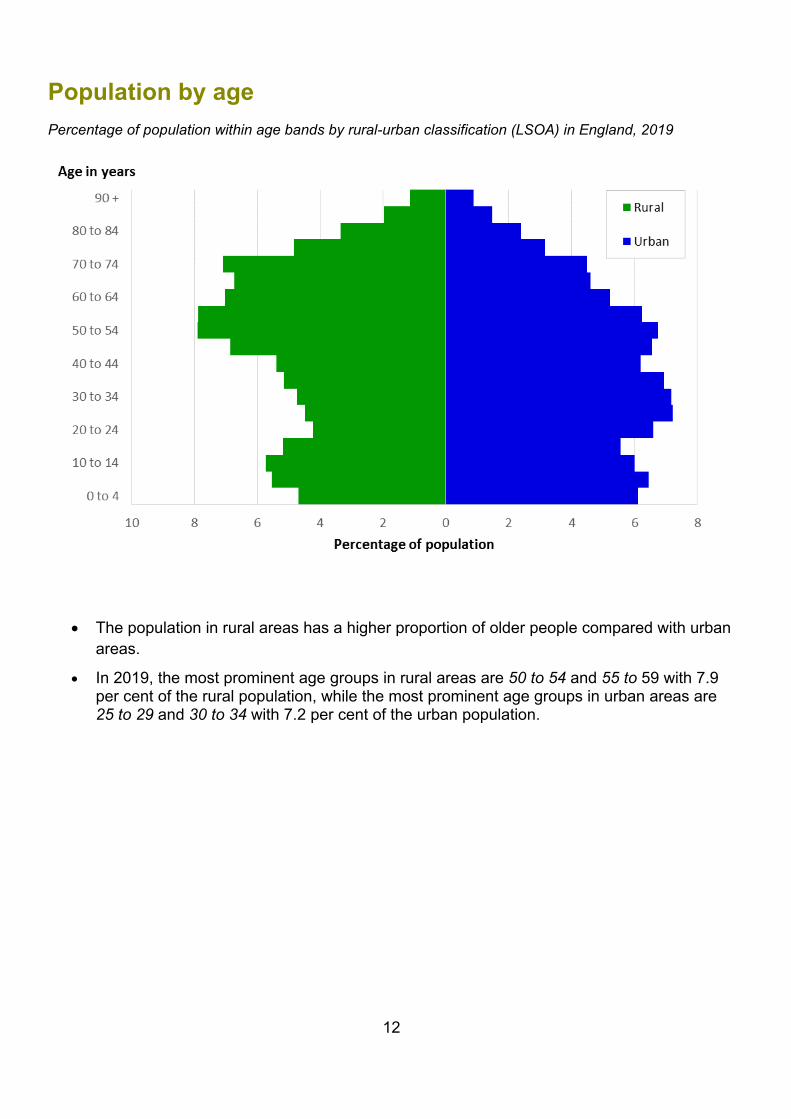
Population by age Percentage of population within age bands by rural-urban classification (LSOA) in England, 2019
• The population in rural areas has a higher proportion of older people compared with urban areas.
• In 2019, the most prominent age groups in rural areas are 50 to 54 and 55 to 59 with 7.9 per cent of the rural population, while the most prominent age groups in urban areas are 25 to 29 and 30 to 34 with 7.2 per cent of the urban population.
13
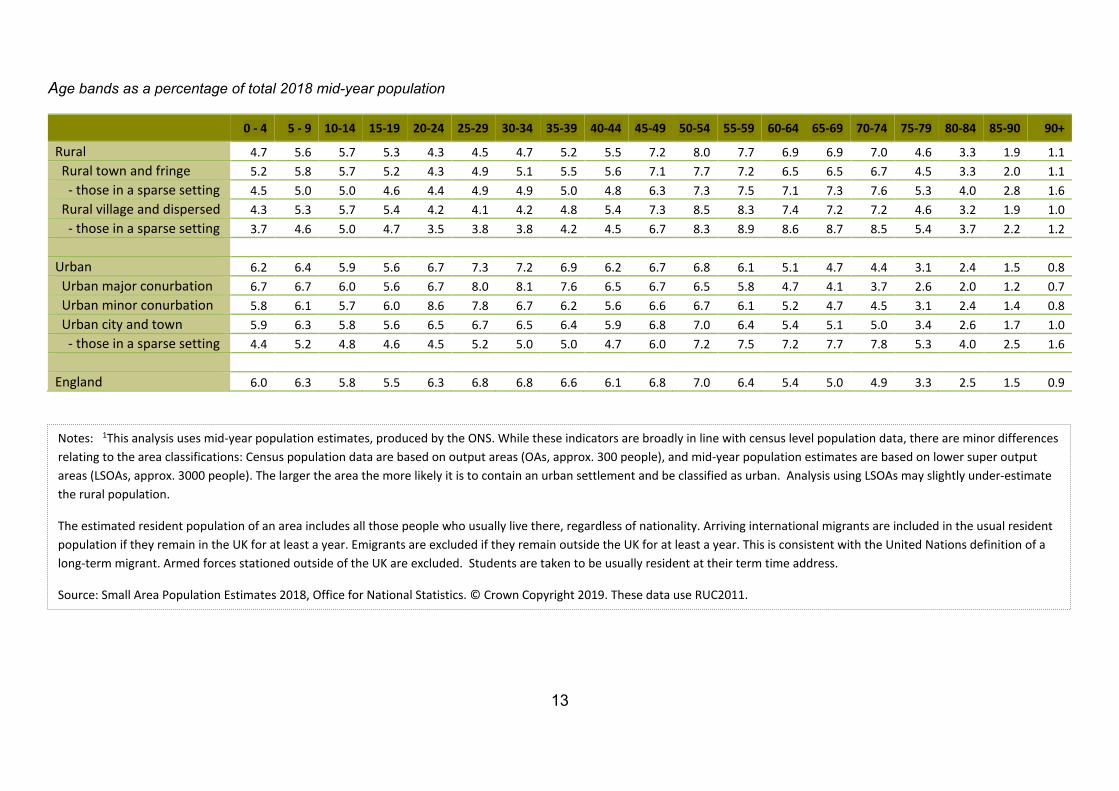
Age bands as a percentage of total 2018 mid-year population
0 - 4 5 - 9 10-14 15-19 20-24 25-29 30-34 35-39 40-44 45-49 50-54 55-59 60-64 65-69 70-74 75-79 80-84 85-90 90+
Rural 4.7 5.6 5.7 5.3 4.3 4.5 4.7 5.2 5.5 7.2 8.0 7.7 6.9 6.9 7.0 4.6 3.3 1.9 1.1 Rural town and fringe 5.2 5.8 5.7 5.2 4.3 4.9 5.1 5.5 5.6 7.1 7.7 7.2 6.5 6.5 6.7 4.5 3.3 2.0 1.1 - those in a sparse setting 4.5 5.0 5.0 4.6 4.4 4.9 4.9 5.0 4.8 6.3 7.3 7.5 7.1 7.3 7.6 5.3 4.0 2.8 1.6 Rural village and dispersed 4.3 5.3 5.7 5.4 4.2 4.1 4.2 4.8 5.4 7.3 8.5 8.3 7.4 7.2 7.2 4.6 3.2 1.9 1.0 - those in a sparse setting 3.7 4.6 5.0 4.7 3.5 3.8 3.8 4.2 4.5 6.7 8.3 8.9 8.6 8.7 8.5 5.4 3.7 2.2 1.2 Urban 6.2 6.4 5.9 5.6 6.7 7.3 7.2 6.9 6.2 6.7 6.8 6.1 5.1 4.7 4.4 3.1 2.4 1.5 0.8 Urban major conurbation 6.7 6.7 6.0 5.6 6.7 8.0 8.1 7.6 6.5 6.7 6.5 5.8 4.7 4.1 3.7 2.6 2.0 1.2 0.7 Urban minor conurbation 5.8 6.1 5.7 6.0 8.6 7.8 6.7 6.2 5.6 6.6 6.7 6.1 5.2 4.7 4.5 3.1 2.4 1.4 0.8 Urban city and town 5.9 6.3 5.8 5.6 6.5 6.7 6.5 6.4 5.9 6.8 7.0 6.4 5.4 5.1 5.0 3.4 2.6 1.7 1.0 - those in a sparse setting 4.4 5.2 4.8 4.6 4.5 5.2 5.0 5.0 4.7 6.0 7.2 7.5 7.2 7.7 7.8 5.3 4.0 2.5 1.6 England 6.0 6.3 5.8 5.5 6.3 6.8 6.8 6.6 6.1 6.8 7.0 6.4 5.4 5.0 4.9 3.3 2.5 1.5 0.9
Notes: 1This analysis uses mid-year population estimates, produced by the ONS. While these indicators are broadly in line with census level population data, there are minor differences relating to the area classifications: Census population data are based on output areas (OAs, approx. 300 people), and mid-year population estimates are based on lower super output areas (LSOAs, approx. 3000 people). The larger the area the more likely it is to contain an urban settlement and be classified as urban. Analysis using LSOAs may slightly under-estimate the rural population. The estimated resident population of an area includes all those people who usually live there, regardless of nationality. Arriving international migrants are included in the usual resident population if they remain in the UK for at least a year. Emigrants are excluded if they remain outside the UK for at least a year. This is consistent with the United Nations definition of a long-term migrant. Armed forces stationed outside of the UK are excluded. Students are taken to be usually resident at their term time address. Source: Small Area Population Estimates 2018, Office for National Statistics. © Crown Copyright 2019. These data use RUC2011.
14
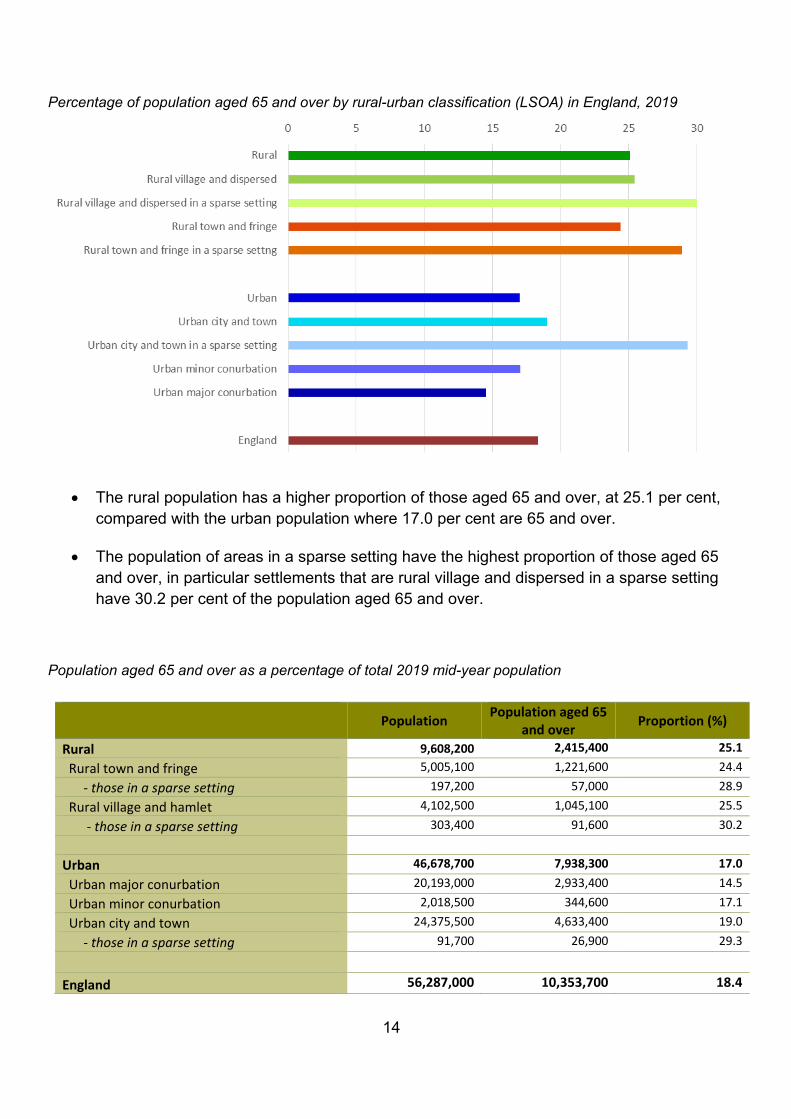
Percentage of population aged 65 and over by rural-urban classification (LSOA) in England, 2019
• The rural population has a higher proportion of those aged 65 and over, at 25.1 per cent, compared with the urban population where 17.0 per cent are 65 and over.
• The population of areas in a sparse setting have the highest proportion of those aged 65 and over, in particular settlements that are rural village and dispersed in a sparse setting have 30.2 per cent of the population aged 65 and over.
Population aged 65 and over as a percentage of total 2019 mid-year population
Population Population aged 65 and over Proportion (%)
Rural 9,608,200 2,415,400 25.1
Rural town and fringe 5,005,100 1,221,600 24.4
- those in a sparse setting 197,200 57,000 28.9
Rural village and hamlet 4,102,500 1,045,100 25.5
- those in a sparse setting 303,400 91,600 30.2
Urban 46,678,700 7,938,300 17.0
Urban major conurbation 20,193,000 2,933,400 14.5
Urban minor conurbation 2,018,500 344,600 17.1
Urban city and town 24,375,500 4,633,400 19.0
- those in a sparse setting 91,700 26,900 29.3
England 56,287,000 10,353,700 18.4
15
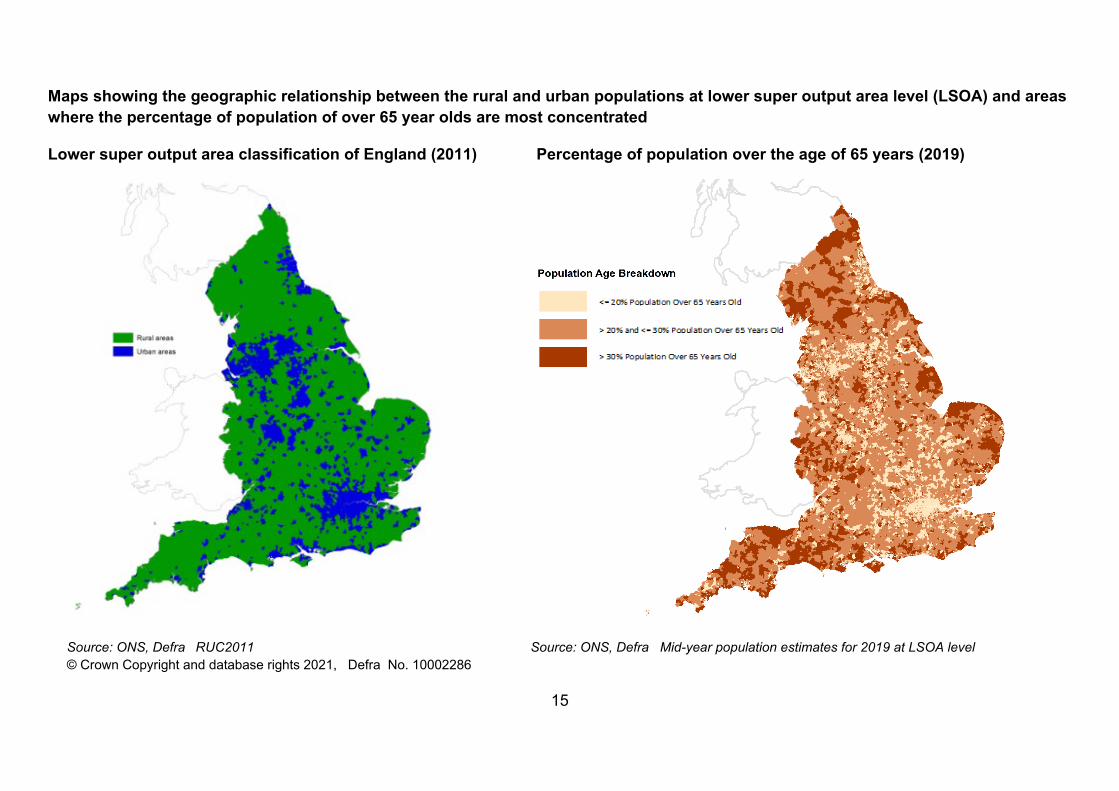
Maps showing the geographic relationship between the rural and urban populations at lower super output area level (LSOA) and areas where the percentage of population of over 65 year olds are most concentrated
Lower super output area classification of England (2011) Percentage of population over the age of 65 years (2019)
Source: ONS, Defra RUC2011 Source: ONS, Defra Mid-year population estimates for 2019 at LSOA level © Crown Copyright and database rights 2021, Defra No. 10002286
16
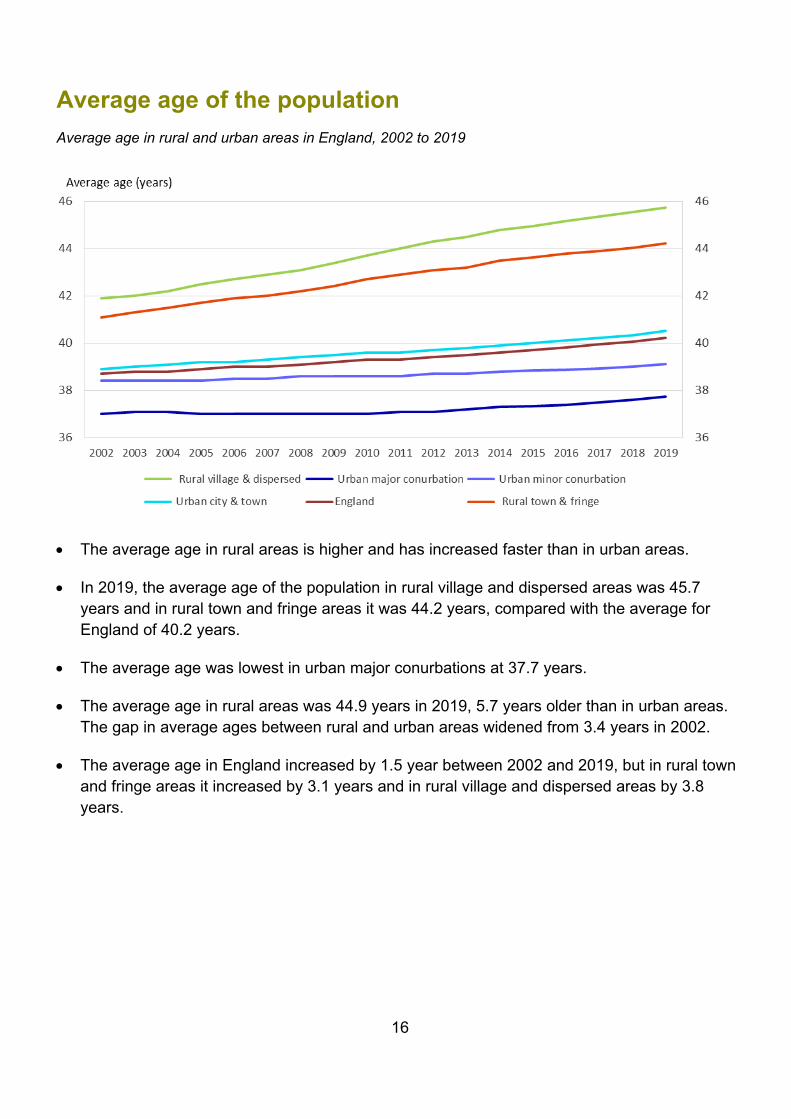
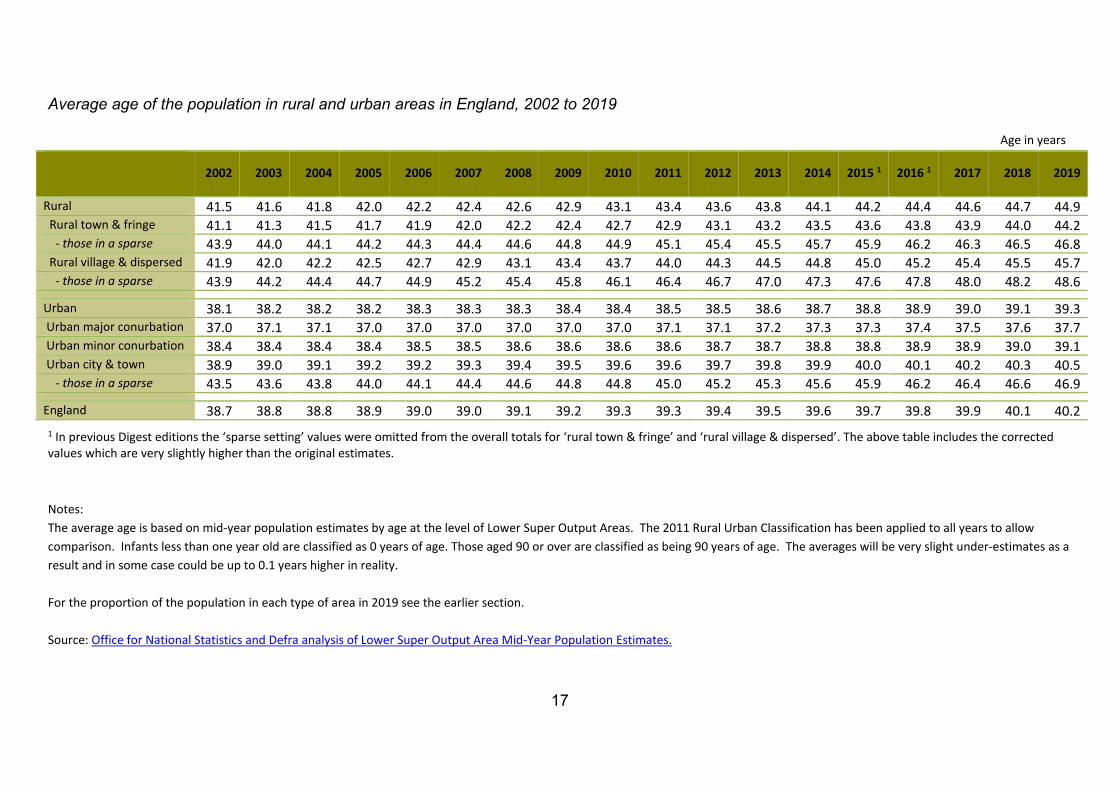
Average age of the population Average age in rural and urban areas in England, 2002 to 2019
• The average age in rural areas is higher and has increased faster than in urban areas.
• In 2019, the average age of the population in rural village and dispersed areas was 45.7 years and in rural town and fringe areas it was 44.2 years, compared with the average for England of 40.2 years.
• The average age was lowest in urban major conurbations at 37.7 years.
• The average age in rural areas was 44.9 years in 2019, 5.7 years older than in urban areas. The gap in average ages between rural and urban areas widened from 3.4 years in 2002.
• The average age in England increased by 1.5 year between 2002 and 2019, but in rural town and fringe areas it increased by 3.1 years and in rural village and dispersed areas by 3.8 years.
17
Average age of the population in rural and urban areas in England, 2002 to 2019
Age in years
2002 2003 2004 2005 2006 2007 2008 2009 2010 2011 2012 2013 2014 2015 1 2016 1 2017 2018 2019
Rural
41.5 41.6 41.8 42.0 42.2 42.4 42.6 42.9 43.1 43.4 43.6 43.8 44.1 44.2 44.4 44.6 44.7 44.9 Rural town & fringe
41.1 41.3 41.5 41.7 41.9 42.0 42.2 42.4 42.7 42.9 43.1 43.2 43.5 43.6 43.8 43.9 44.0 44.2 - those in a sparse
43.9 44.0 44.1 44.2 44.3 44.4 44.6 44.8 44.9 45.1 45.4 45.5 45.7 45.9 46.2 46.3 46.5 46.8
Rural village & dispersed
41.9 42.0 42.2 42.5 42.7 42.9 43.1 43.4 43.7 44.0 44.3 44.5 44.8 45.0 45.2 45.4 45.5 45.7 - those in a sparse
43.9 44.2 44.4 44.7 44.9 45.2 45.4 45.8 46.1 46.4 46.7 47.0 47.3 47.6 47.8 48.0 48.2 48.6
Urban
38.1 38.2 38.2 38.2 38.3 38.3 38.3 38.4 38.4 38.5 38.5 38.6 38.7 38.8 38.9 39.0 39.1 39.3 Urban major conurbation 37.0 37.1 37.1 37.0 37.0 37.0 37.0 37.0 37.0 37.1 37.1 37.2 37.3 37.3 37.4 37.5 37.6 37.7 Urban minor conurbation 38.4 38.4 38.4 38.4 38.5 38.5 38.6 38.6 38.6 38.6 38.7 38.7 38.8 38.8 38.9 38.9 39.0 39.1 Urban city & town
38.9 39.0 39.1 39.2 39.2 39.3 39.4 39.5 39.6 39.6 39.7 39.8 39.9 40.0 40.1 40.2 40.3 40.5 - those in a sparse
43.5 43.6 43.8 44.0 44.1 44.4 44.6 44.8 44.8 45.0 45.2 45.3 45.6 45.9 46.2 46.4 46.6 46.9
England
38.7 38.8 38.8 38.9 39.0 39.0 39.1 39.2 39.3 39.3 39.4 39.5 39.6 39.7 39.8 39.9 40.1 40.2 1 In previous Digest editions the ‘sparse setting’ values were omitted from the overall totals for ‘rural town & fringe’ and ‘rural village & dispersed’. The above table includes the corrected values which are very slightly higher than the original estimates.
Notes: The average age is based on mid-year population estimates by age at the level of Lower Super Output Areas. The 2011 Rural Urban Classification has been applied to all years to allow comparison. Infants less than one year old are classified as 0 years of age. Those aged 90 or over are classified as being 90 years of age. The averages will be very slight under-estimates as a result and in some case could be up to 0.1 years higher in reality. For the proportion of the population in each type of area in 2019 see the earlier section. Source: Office for National Statistics and Defra analysis of Lower Super Output Area Mid-Year Population Estimates.
18
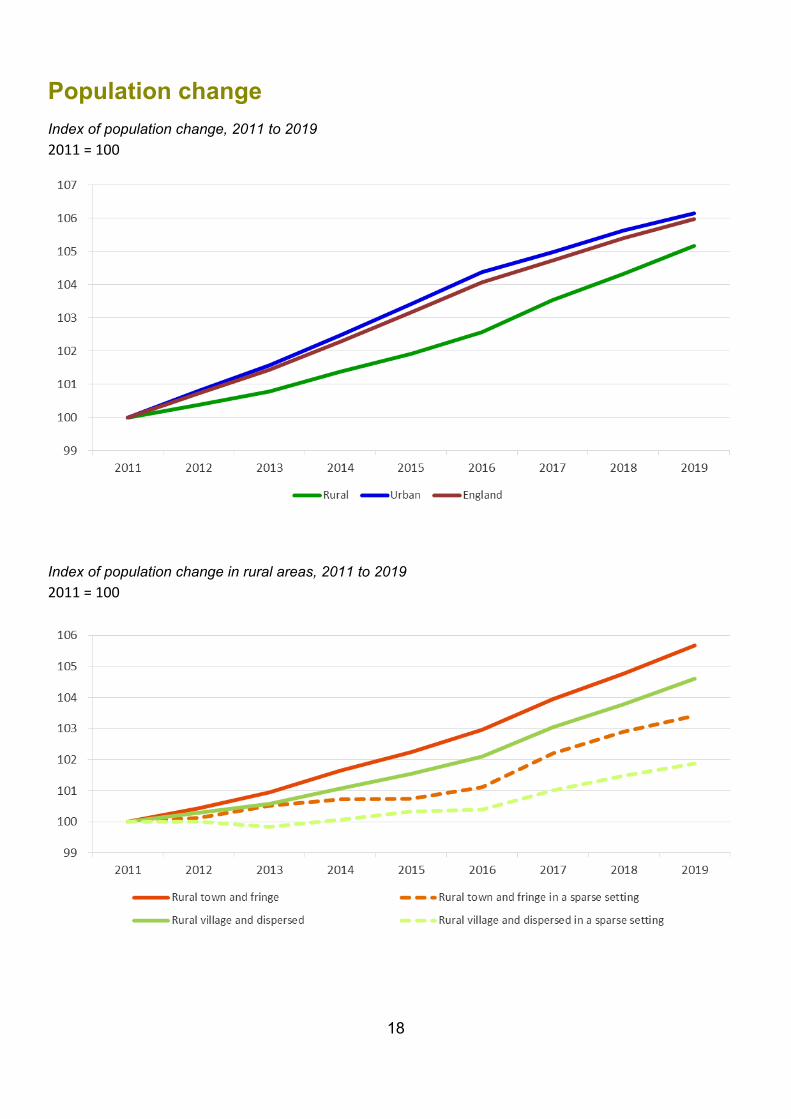
Population change Index of population change, 2011 to 2019 2011 = 100
Index of population change in rural areas, 2011 to 2019 2011 = 100
19
• Both rural and urban areas have seen an increase in overall population between 2011 and 2019. Rural has increased by 5.2 per cent and urban by 6.2 per cent.
• Within rural areas, the greatest rate of population increase was in rural town and fringe areas (5.7 per cent), within urban areas it was in urban major conurbation (6.9 per cent).
• Rural villages and hamlets in sparse settings showed the smallest rate of population increase within rural areas (1.9 per cent), in urban areas it was urban city and town in a sparse setting (1.2 per cent).
Index of population change, 2011 to 2019 2011 = 100
2012 2013 2014 2015 2016 2017 2018 2019 Population Index Population Index Population Index Population Index Population Index Population Index Population Index Population Index Rural town and fringe 4,944,500 100.4 4,970,200 101.0 5,004,000 101.6 5,033,600 102.2 5,069,300 103.0 5,118,100 104.0 5,158,400 104.8 5,202,300 105.7
those in a sparse setting
191,000 100.1 191,700 100.5 192,100 100.7 192,100 100.7 192,800 101.1 194,900 102.2 196,200 102.9 197,200 103.4
Rural village and hamlet
4,224,600 100.3 4,236,200 100.6 4,256,900 101.1 4,277,400 101.5 4,300,900 102.1 4,340,000 103.0 4,371,300 103.8 4,405,900 104.6
those in a sparse setting
297,800 100.0 297,400 99.8 298,000 100.1 298,800 100.3 299,000 100.4 300,800 101.0 302,200 101.5 303,400 101.9
Urban major conurbation
19,061,100 100.9 19,224,000 101.8 19,415,700 102.8 19,626,100 103.9 19,831,400 105.0 19,937,000 105.5 20,078,100 106.3 20,193,000 106.9
Urban minor conurbation
1,924,900 100.8 1,935,400 101.3 1,948,500 102.0 1,963,200 102.8 1,981,400 103.7 1,995,200 104.4 2,008,300 105.1 2,018,500 105.7
Urban city and town
23,338,600 100.7 23,499,900 101.4 23,691,500 102.2 23,886,100 103.1 24,085,000 103.9 24,229,100 104.6 24,361,100 105.1 24,467,200 105.6
those in a sparse setting
90,500 99.9 90,600 100.0 90,400 99.8 90,400 99.7 90,200 99.6 91,100 100.6 91,200 100.6 91,700 101.2
Rural 9,169,100 100.4 9,206,500 100.8 9,260,900 101.4 9,311,000 101.9 9,370,200 102.6 9,458,100 103.5 9,529,700 104.3 9,608,200 105.2
Urban 44,324,600 100.8 44,659,400 101.6 45,055,700 102.5 45,475,300 103.4 45,897,800 104.4 46,161,300 105.0 46,447,500 105.6 46,678,700 106.2
England 53,493,700 100.7 53,865,800 101.4 54,316,600 102.3 54,786,300 103.2 55,268,100 104.1 55,619,400 104.7 55,977,200 105.4 56,287,000 106.0
20
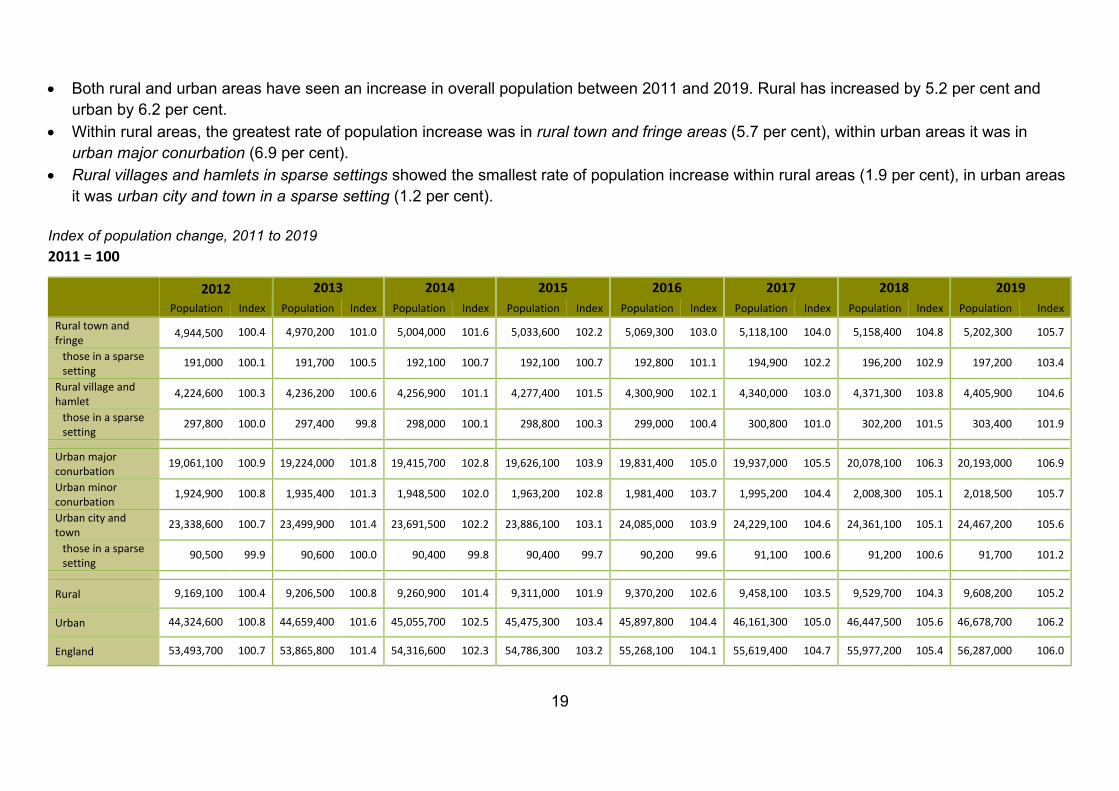
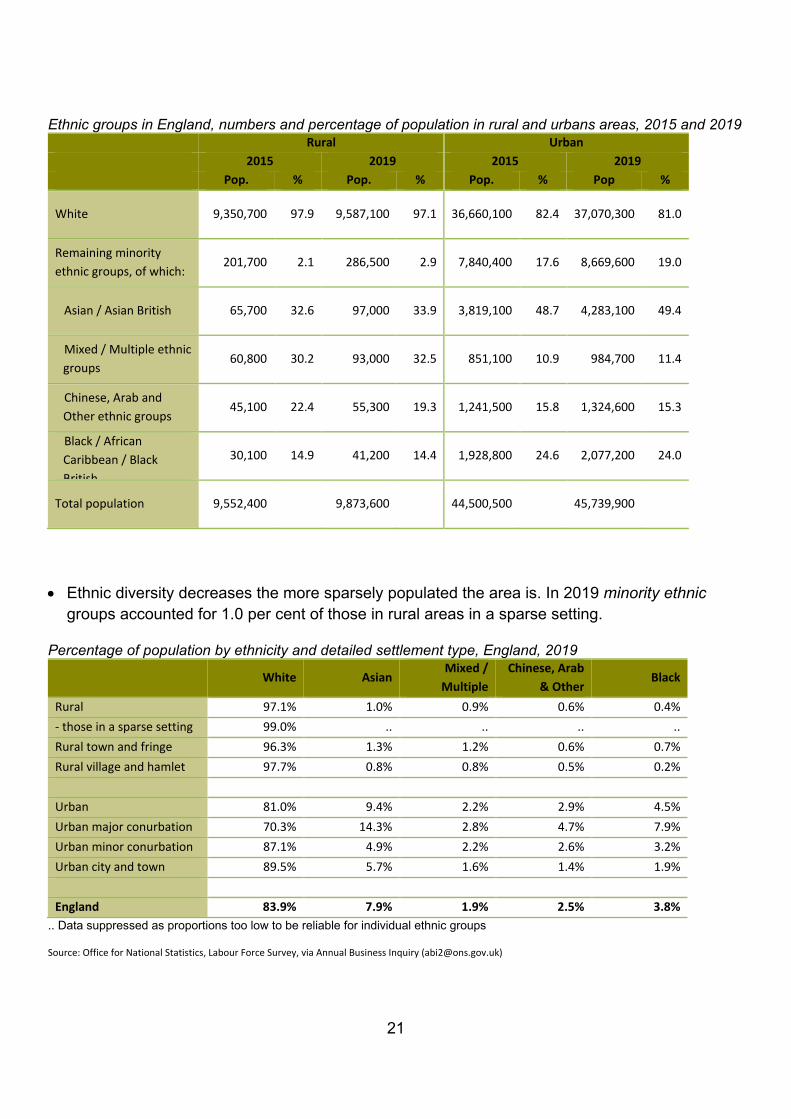
Ethnicity • Overall, white is the majority ethnic group in both rural and urban areas, however urban areas
are more ethnically diverse than rural areas. • In 2019, the white ethnic group accounted for 97.1 per cent of the rural population, compared
with 81.0 per cent in urban areas. • The proportion of minority ethnic groups has risen slightly over the last 5 years in both rural
and urban areas, rising by 0.8 and 1.4 percentage points respectively since 2015. • Diversity of minority ethnic groups differs between rural and urban areas. The Asian ethnic
group is the second largest group in both rural and urban areas, however in rural areas proportionally more of the minority ethnic group population are of mixed race and Chinese, Arab and other origin than in the minority ethnic group population in urban areas, while urban areas have a proportionally greater black, African, Caribbean or black British population in the minority ethnic group population.
Ethnic groups as a percentage of population in rural and urbans areas, England, 2015 and 2019
Detail for all minority ethnic group population in rural and urban areas, England, 2015 & 2019
21
Ethnic groups in England, numbers and percentage of population in rural and urbans areas, 2015 and 2019
Rural Urban 2015 2019 2015 2019 Pop. % Pop. % Pop. % Pop %
White 9,350,700 97.9 9,587,100 97.1 36,660,100 82.4 37,070,300 81.0
Remaining minority ethnic groups, of which:
201,700 2.1 286,500 2.9 7,840,400 17.6 8,669,600 19.0
Asian / Asian British 65,700 32.6 97,000 33.9 3,819,100 48.7 4,283,100 49.4
Mixed / Multiple ethnic --groups
60,800 30.2 93,000 32.5 851,100 10.9 984,700 11.4
Chinese, Arab and --------Other ethnic groups
45,100 22.4 55,300 19.3 1,241,500 15.8 1,324,600 15.3
Black / African / -----------Caribbean / Black ---------British
30,100 14.9 41,200 14.4 1,928,800 24.6 2,077,200 24.0
Total population 9,552,400 9,873,600 44,500,500 45,739,900
• Ethnic diversity decreases the more sparsely populated the area is. In 2019 minority ethnic groups accounted for 1.0 per cent of those in rural areas in a sparse setting.
Percentage of population by ethnicity and detailed settlement type, England, 2019
White Asian Mixed /
Multiple Chinese, Arab
& Other Black
Rural 97.1% 1.0% 0.9% 0.6% 0.4% - those in a sparse setting 99.0% .. .. .. .. Rural town and fringe 96.3% 1.3% 1.2% 0.6% 0.7% Rural village and hamlet 97.7% 0.8% 0.8% 0.5% 0.2% Urban 81.0% 9.4% 2.2% 2.9% 4.5% Urban major conurbation 70.3% 14.3% 2.8% 4.7% 7.9% Urban minor conurbation 87.1% 4.9% 2.2% 2.6% 3.2% Urban city and town 89.5% 5.7% 1.6% 1.4% 1.9% England 83.9% 7.9% 1.9% 2.5% 3.8%
.. Data suppressed as proportions too low to be reliable for individual ethnic groups Source: Office for National Statistics, Labour Force Survey, via Annual Business Inquiry ([email protected])
22
Population at local authority level Often statistics have to be compiled at the local authority level, when that is the level of the original data, and the rural urban classification for local authorities is used, as defined by April 2020 Local Authority boundaries.
This is different from looking at the population using the more detailed rural-urban classification as it is based on whole local authorities. The whole population in an authority will be attributed to the class assigned to the authority. So an authority that is mainly rural or largely rural and hence classed as predominantly rural will have the whole population counted as being in a predominantly rural area, even those living in an urban settlement within that authority, while all those living in a rural area but within an authority classed as urban with significant rural or predominantly urban will not be counted in the predominantly rural figure.
• In 2019, 12.1 million people lived in a predominantly rural area, 21.6 per cent of the England population.
• 52 per cent of the population in predominantly rural areas are over the age of 44, which is the same as in 2018.
• In comparison, 40 per cent of the population in predominantly urban areas are over the age of 44, which is the same as in 2018 as well.
• The population in predominantly rural areas has increased by 5.9 per cent between 2011 and 2019, compared with 6.0 per cent for England as a whole and 6.2 per cent in predominantly urban areas.
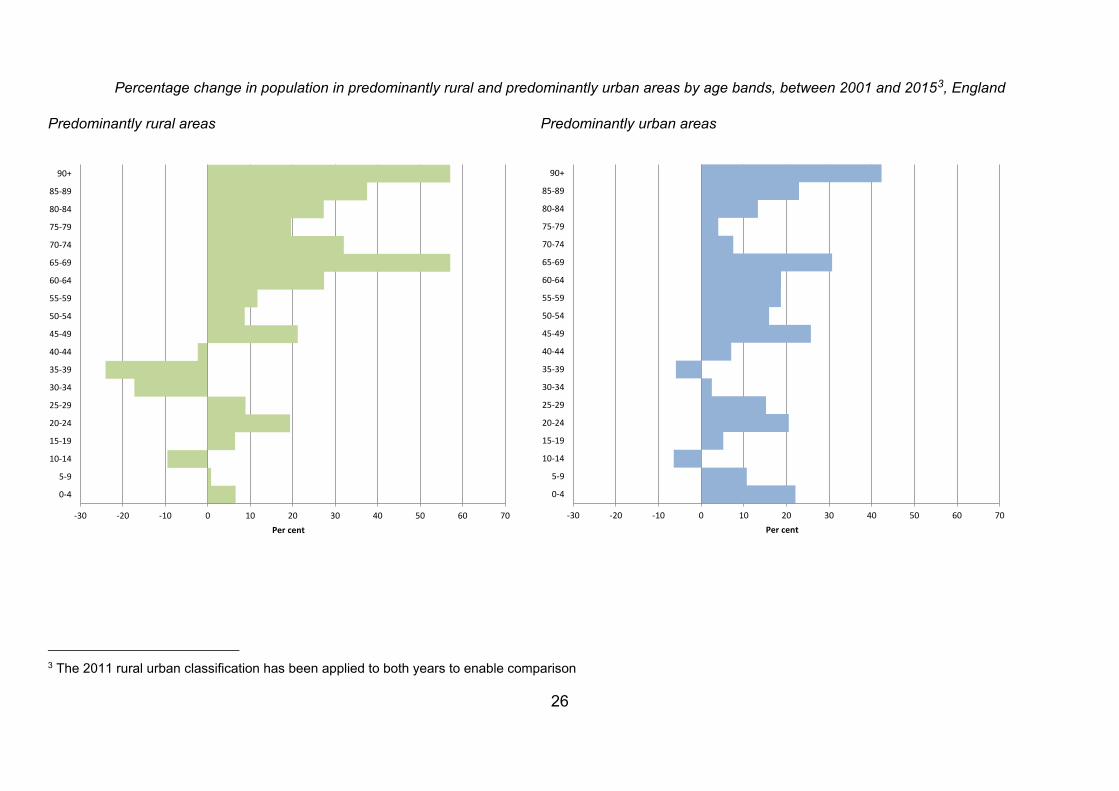
• However, it is longer-term comparisons that highlight significant shifts in the age structure. Comparisons have been made between 2001 and 2015 to show this.
• Predominantly rural areas have proportionately seen large falls in the population aged 30 to 39 and higher proportional increases in the older population.
• The population aged 65 and over increased by 37 per cent in predominantly rural areas between 2001 and 2015, compared with 17 per cent in predominantly urban areas.
• Predominantly rural areas have seen an increase of 7 per cent in infants (0-4 year olds) compared with a 22 per cent increase in predominantly urban areas.
23
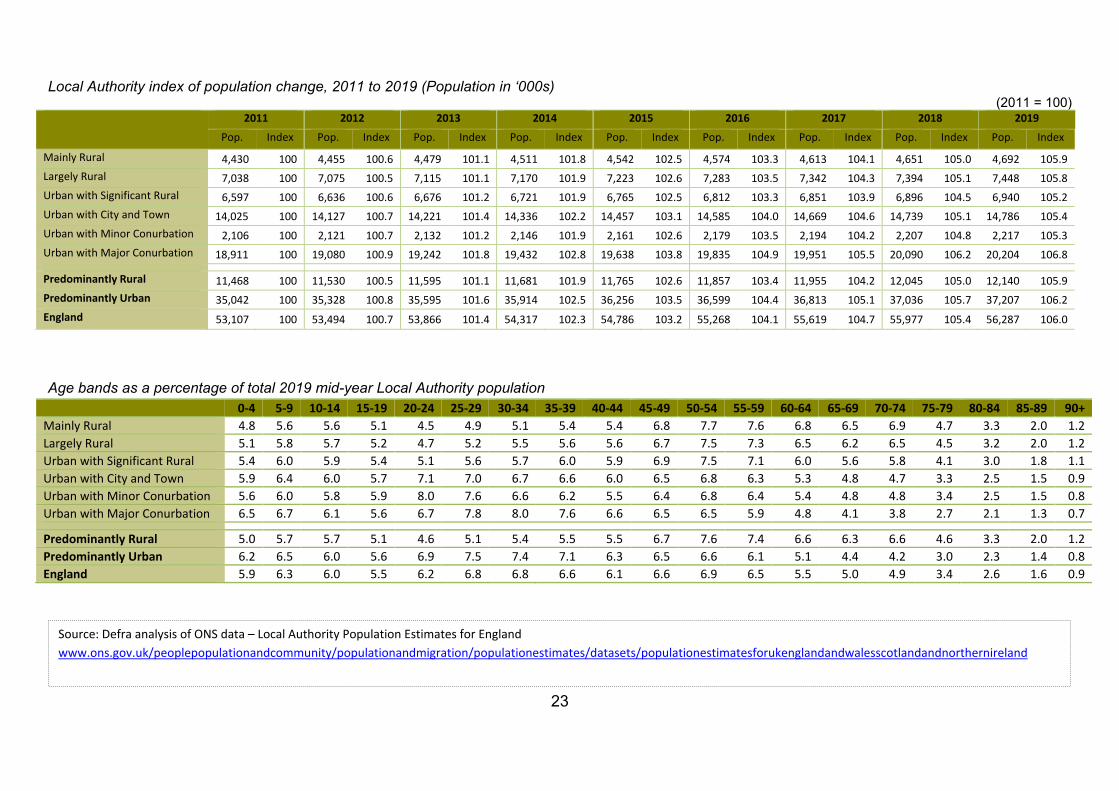
Local Authority index of population change, 2011 to 2019 (Population in ‘000s) (2011 = 100)
2011 2012 2013 2014 2015 2016 2017 2018 2019
Pop. Index Pop. Index Pop. Index Pop. Index Pop. Index Pop. Index Pop. Index Pop. Index Pop. Index
Mainly Rural 4,430 100 4,455 100.6 4,479 101.1 4,511 101.8 4,542 102.5 4,574 103.3 4,613 104.1 4,651 105.0 4,692 105.9 Largely Rural 7,038 100 7,075 100.5 7,115 101.1 7,170 101.9 7,223 102.6 7,283 103.5 7,342 104.3 7,394 105.1 7,448 105.8 Urban with Significant Rural 6,597 100 6,636 100.6 6,676 101.2 6,721 101.9 6,765 102.5 6,812 103.3 6,851 103.9 6,896 104.5 6,940 105.2 Urban with City and Town 14,025 100 14,127 100.7 14,221 101.4 14,336 102.2 14,457 103.1 14,585 104.0 14,669 104.6 14,739 105.1 14,786 105.4 Urban with Minor Conurbation 2,106 100 2,121 100.7 2,132 101.2 2,146 101.9 2,161 102.6 2,179 103.5 2,194 104.2 2,207 104.8 2,217 105.3 Urban with Major Conurbation 18,911 100 19,080 100.9 19,242 101.8 19,432 102.8 19,638 103.8 19,835 104.9 19,951 105.5 20,090 106.2 20,204 106.8
Predominantly Rural 11,468 100 11,530 100.5 11,595 101.1 11,681 101.9 11,765 102.6 11,857 103.4 11,955 104.2 12,045 105.0 12,140 105.9 Predominantly Urban 35,042 100 35,328 100.8 35,595 101.6 35,914 102.5 36,256 103.5 36,599 104.4 36,813 105.1 37,036 105.7 37,207 106.2 England 53,107 100 53,494 100.7 53,866 101.4 54,317 102.3 54,786 103.2 55,268 104.1 55,619 104.7 55,977 105.4 56,287 106.0
Age bands as a percentage of total 2019 mid-year Local Authority population 0-4 5-9 10-14 15-19 20-24 25-29 30-34 35-39 40-44 45-49 50-54 55-59 60-64 65-69 70-74 75-79 80-84 85-89 90+ Mainly Rural 4.8 5.6 5.6 5.1 4.5 4.9 5.1 5.4 5.4 6.8 7.7 7.6 6.8 6.5 6.9 4.7 3.3 2.0 1.2 Largely Rural 5.1 5.8 5.7 5.2 4.7 5.2 5.5 5.6 5.6 6.7 7.5 7.3 6.5 6.2 6.5 4.5 3.2 2.0 1.2 Urban with Significant Rural 5.4 6.0 5.9 5.4 5.1 5.6 5.7 6.0 5.9 6.9 7.5 7.1 6.0 5.6 5.8 4.1 3.0 1.8 1.1 Urban with City and Town 5.9 6.4 6.0 5.7 7.1 7.0 6.7 6.6 6.0 6.5 6.8 6.3 5.3 4.8 4.7 3.3 2.5 1.5 0.9 Urban with Minor Conurbation 5.6 6.0 5.8 5.9 8.0 7.6 6.6 6.2 5.5 6.4 6.8 6.4 5.4 4.8 4.8 3.4 2.5 1.5 0.8 Urban with Major Conurbation 6.5 6.7 6.1 5.6 6.7 7.8 8.0 7.6 6.6 6.5 6.5 5.9 4.8 4.1 3.8 2.7 2.1 1.3 0.7
Predominantly Rural 5.0 5.7 5.7 5.1 4.6 5.1 5.4 5.5 5.5 6.7 7.6 7.4 6.6 6.3 6.6 4.6 3.3 2.0 1.2 Predominantly Urban 6.2 6.5 6.0 5.6 6.9 7.5 7.4 7.1 6.3 6.5 6.6 6.1 5.1 4.4 4.2 3.0 2.3 1.4 0.8 England 5.9 6.3 6.0 5.5 6.2 6.8 6.8 6.6 6.1 6.6 6.9 6.5 5.5 5.0 4.9 3.4 2.6 1.6 0.9 Source: Defra analysis of ONS data – Local Authority Population Estimates for England
www.ons.gov.uk/peoplepopulationandcommunity/populationandmigration/populationestimates/datasets/populationestimatesforukenglandandwalesscotlandandnorthernireland
24
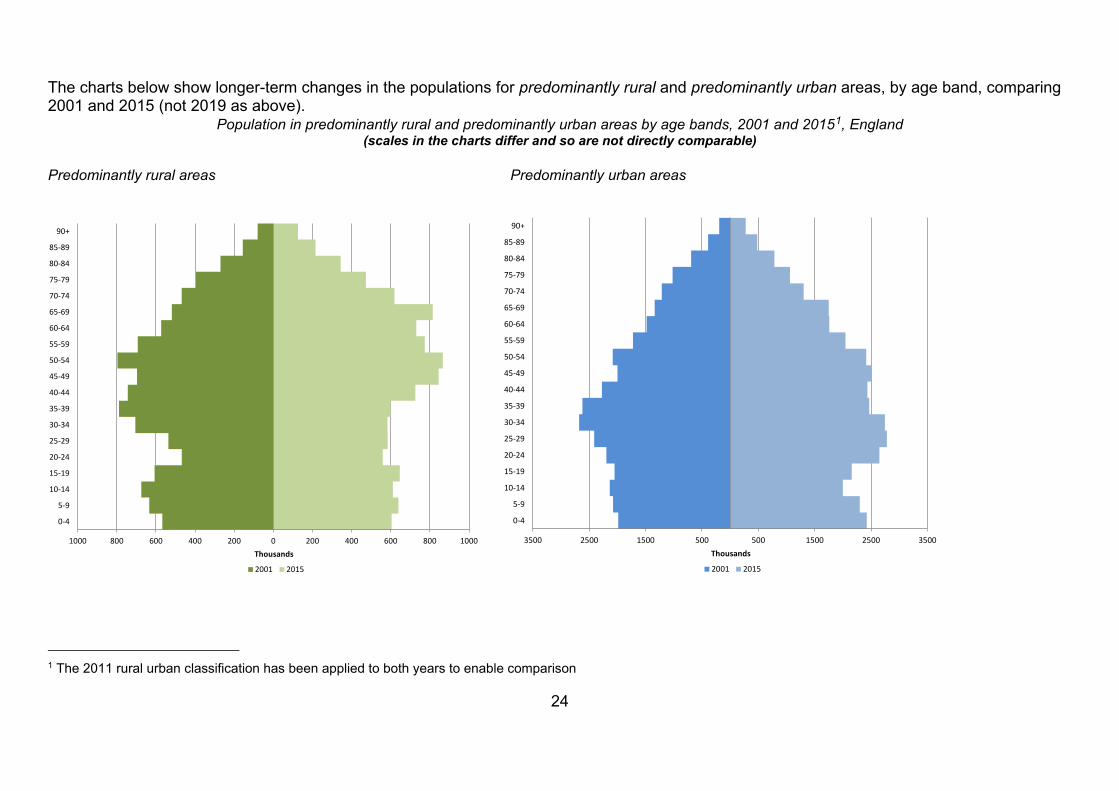
The charts below show longer-term changes in the populations for predominantly rural and predominantly urban areas, by age band, comparing 2001 and 2015 (not 2019 as above).
Population in predominantly rural and predominantly urban areas by age bands, 2001 and 20151, England (scales in the charts differ and so are not directly comparable)
Predominantly rural areas Predominantly urban areas
1 The 2011 rural urban classification has been applied to both years to enable comparison
1000 800 600 400 200 0 200 400 600 800 1000
0-4
5-9
10-14
15-19
20-24
25-29
30-34
35-39
40-44
45-49
50-54
55-59
60-64
65-69
70-74
75-79
80-84
85-89
90+
Thousands
2001 2015
3500 2500 1500 500 500 1500 2500 3500
0-4
5-9
10-14
15-19
20-24
25-29
30-34
35-39
40-44
45-49
50-54
55-59
60-64
65-69
70-74
75-79
80-84
85-89
90+
Thousands
2001 2015

25
Population in predominantly rural and predominantly urban areas by age bands, 2001 and 20152, England (combined chart showing rural and urban at the same scale)
2 The 2011 rural urban classification has been applied to both years to enable comparison
3500 2500 1500 500 500 1500 2500 3500
0-45-9
10-1415-1920-2425-2930-3435-3940-4445-4950-5455-5960-6465-6970-7475-7980-8485-89
90+
Thousands
2015 Predominantly rural 2015 Predominantly urban
2001 Predominantly rural 2001 Predominantly urban
26
Percentage change in population in predominantly rural and predominantly urban areas by age bands, between 2001 and 20153, England
Predominantly rural areas Predominantly urban areas
3 The 2011 rural urban classification has been applied to both years to enable comparison
-30 -20 -10 0 10 20 30 40 50 60 70
0-4
5-9
10-14
15-19
20-24
25-29
30-34
35-39
40-44
45-49
50-54
55-59
60-64
65-69
70-74
75-79
80-84
85-89
90+
Per cent-30 -20 -10 0 10 20 30 40 50 60 70
0-4
5-9
10-14
15-19
20-24
25-29
30-34
35-39
40-44
45-49
50-54
55-59
60-64
65-69
70-74
75-79
80-84
85-89
90+
Per cent
27
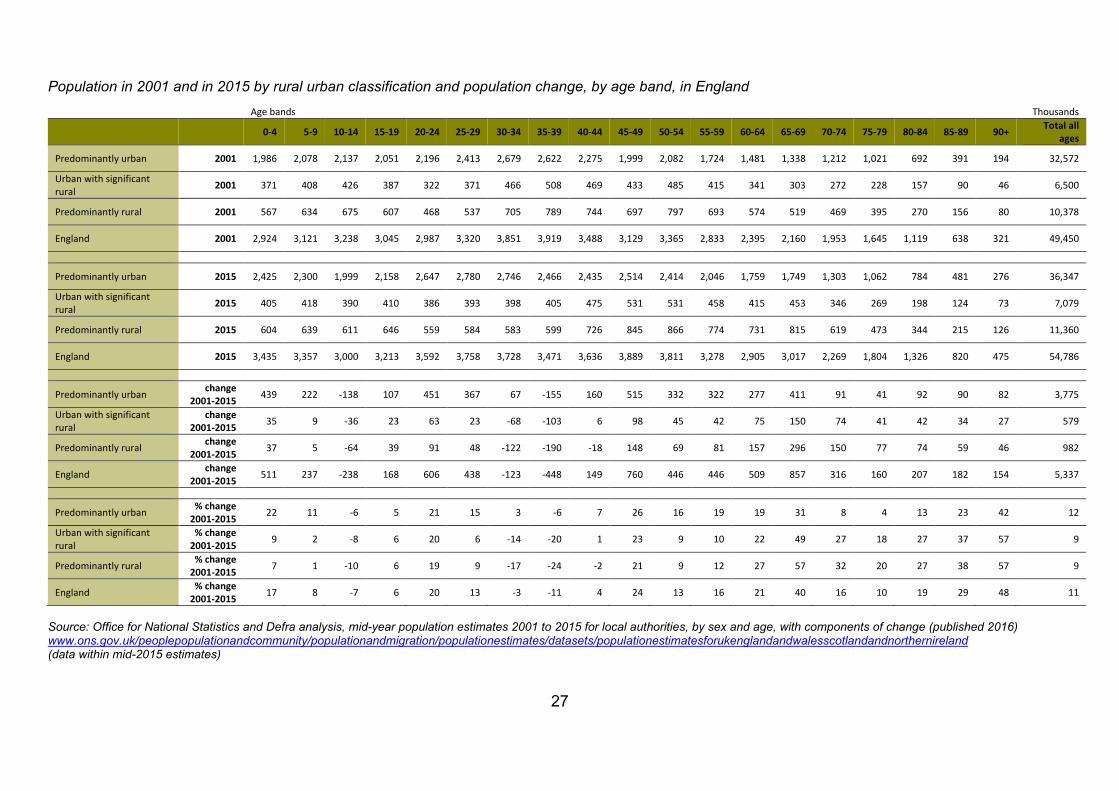
Population in 2001 and in 2015 by rural urban classification and population change, by age band, in England Age bands Thousands
0-4 5-9 10-14 15-19 20-24 25-29 30-34 35-39 40-44 45-49 50-54 55-59 60-64 65-69 70-74 75-79 80-84 85-89 90+ Total all ages
Predominantly urban 2001 1,986 2,078 2,137 2,051 2,196 2,413 2,679 2,622 2,275 1,999 2,082 1,724 1,481 1,338 1,212 1,021 692 391 194 32,572
Urban with significant rural 2001 371 408 426 387 322 371 466 508 469 433 485 415 341 303 272 228 157 90 46 6,500
Predominantly rural 2001 567 634 675 607 468 537 705 789 744 697 797 693 574 519 469 395 270 156 80 10,378
England 2001 2,924 3,121 3,238 3,045 2,987 3,320 3,851 3,919 3,488 3,129 3,365 2,833 2,395 2,160 1,953 1,645 1,119 638 321 49,450
Predominantly urban 2015 2,425 2,300 1,999 2,158 2,647 2,780 2,746 2,466 2,435 2,514 2,414 2,046 1,759 1,749 1,303 1,062 784 481 276 36,347
Urban with significant rural 2015 405 418 390 410 386 393 398 405 475 531 531 458 415 453 346 269 198 124 73 7,079
Predominantly rural 2015 604 639 611 646 559 584 583 599 726 845 866 774 731 815 619 473 344 215 126 11,360
England 2015 3,435 3,357 3,000 3,213 3,592 3,758 3,728 3,471 3,636 3,889 3,811 3,278 2,905 3,017 2,269 1,804 1,326 820 475 54,786
Predominantly urban change 2001-2015 439 222 -138 107 451 367 67 -155 160 515 332 322 277 411 91 41 92 90 82 3,775
Urban with significant rural
change 2001-2015 35 9 -36 23 63 23 -68 -103 6 98 45 42 75 150 74 41 42 34 27 579
Predominantly rural change 2001-2015 37 5 -64 39 91 48 -122 -190 -18 148 69 81 157 296 150 77 74 59 46 982
England change 2001-2015 511 237 -238 168 606 438 -123 -448 149 760 446 446 509 857 316 160 207 182 154 5,337
Predominantly urban % change 2001-2015 22 11 -6 5 21 15 3 -6 7 26 16 19 19 31 8 4 13 23 42 12
Urban with significant rural
% change 2001-2015 9 2 -8 6 20 6 -14 -20 1 23 9 10 22 49 27 18 27 37 57 9
Predominantly rural % change 2001-2015 7 1 -10 6 19 9 -17 -24 -2 21 9 12 27 57 32 20 27 38 57 9
England % change 2001-2015 17 8 -7 6 20 13 -3 -11 4 24 13 16 21 40 16 10 19 29 48 11
Source: Office for National Statistics and Defra analysis, mid-year population estimates 2001 to 2015 for local authorities, by sex and age, with components of change (published 2016) www.ons.gov.uk/peoplepopulationandcommunity/populationandmigration/populationestimates/datasets/populationestimatesforukenglandandwalesscotlandandnorthernireland (data within mid-2015 estimates)
28
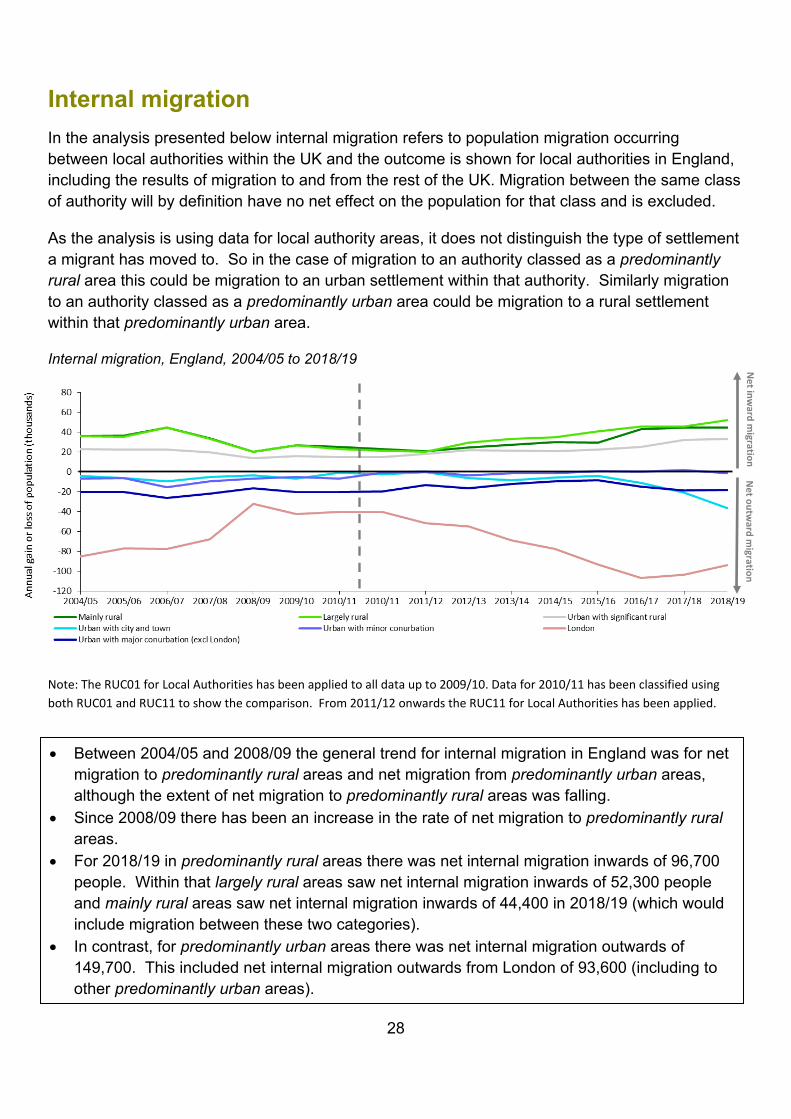
Internal migration In the analysis presented below internal migration refers to population migration occurring between local authorities within the UK and the outcome is shown for local authorities in England, including the results of migration to and from the rest of the UK. Migration between the same class of authority will by definition have no net effect on the population for that class and is excluded.
As the analysis is using data for local authority areas, it does not distinguish the type of settlement a migrant has moved to. So in the case of migration to an authority classed as a predominantly rural area this could be migration to an urban settlement within that authority. Similarly migration to an authority classed as a predominantly urban area could be migration to a rural settlement within that predominantly urban area.
Internal migration, England, 2004/05 to 2018/19
Note: The RUC01 for Local Authorities has been applied to all data up to 2009/10. Data for 2010/11 has been classified using both RUC01 and RUC11 to show the comparison. From 2011/12 onwards the RUC11 for Local Authorities has been applied.
Net outw
ard migration
• Between 2004/05 and 2008/09 the general trend for internal migration in England was for net migration to predominantly rural areas and net migration from predominantly urban areas, although the extent of net migration to predominantly rural areas was falling.
• Since 2008/09 there has been an increase in the rate of net migration to predominantly rural areas.
• For 2018/19 in predominantly rural areas there was net internal migration inwards of 96,700 people. Within that largely rural areas saw net internal migration inwards of 52,300 people and mainly rural areas saw net internal migration inwards of 44,400 in 2018/19 (which would include migration between these two categories).
• In contrast, for predominantly urban areas there was net internal migration outwards of 149,700. This included net internal migration outwards from London of 93,600 (including to other predominantly urban areas).
Net inw
ard migration
29
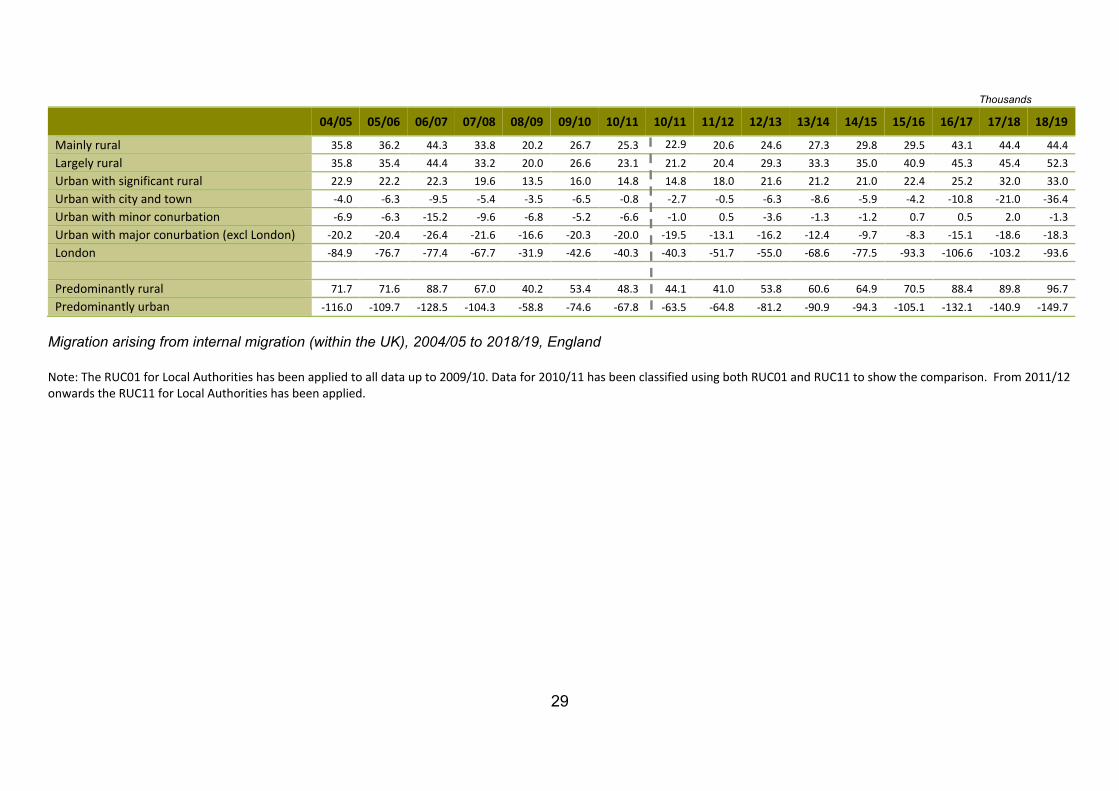
Migration arising from internal migration (within the UK), 2004/05 to 2018/19, England Note: The RUC01 for Local Authorities has been applied to all data up to 2009/10. Data for 2010/11 has been classified using both RUC01 and RUC11 to show the comparison. From 2011/12 onwards the RUC11 for Local Authorities has been applied.
Thousands
04/05 05/06 06/07 07/08 08/09 09/10 10/11 10/11 11/12 12/13 13/14 14/15 15/16 16/17 17/18 18/19
Mainly rural 35.8 36.2 44.3 33.8 20.2 26.7 25.3 22.9 20.6 24.6 27.3 29.8 29.5 43.1 44.4 44.4 Largely rural 35.8 35.4 44.4 33.2 20.0 26.6 23.1 21.2 20.4 29.3 33.3 35.0 40.9 45.3 45.4 52.3 Urban with significant rural 22.9 22.2 22.3 19.6 13.5 16.0 14.8 14.8 18.0 21.6 21.2 21.0 22.4 25.2 32.0 33.0 Urban with city and town -4.0 -6.3 -9.5 -5.4 -3.5 -6.5 -0.8 -2.7 -0.5 -6.3 -8.6 -5.9 -4.2 -10.8 -21.0 -36.4 Urban with minor conurbation -6.9 -6.3 -15.2 -9.6 -6.8 -5.2 -6.6 -1.0 0.5 -3.6 -1.3 -1.2 0.7 0.5 2.0 -1.3 Urban with major conurbation (excl London) -20.2 -20.4 -26.4 -21.6 -16.6 -20.3 -20.0 -19.5 -13.1 -16.2 -12.4 -9.7 -8.3 -15.1 -18.6 -18.3 London -84.9 -76.7 -77.4 -67.7 -31.9 -42.6 -40.3 -40.3 -51.7 -55.0 -68.6 -77.5 -93.3 -106.6 -103.2 -93.6 Predominantly rural 71.7 71.6 88.7 67.0 40.2 53.4 48.3 44.1 41.0 53.8 60.6 64.9 70.5 88.4 89.8 96.7 Predominantly urban -116.0 -109.7 -128.5 -104.3 -58.8 -74.6 -67.8 -63.5 -64.8 -81.2 -90.9 -94.3 -105.1 -132.1 -140.9 -149.7
30
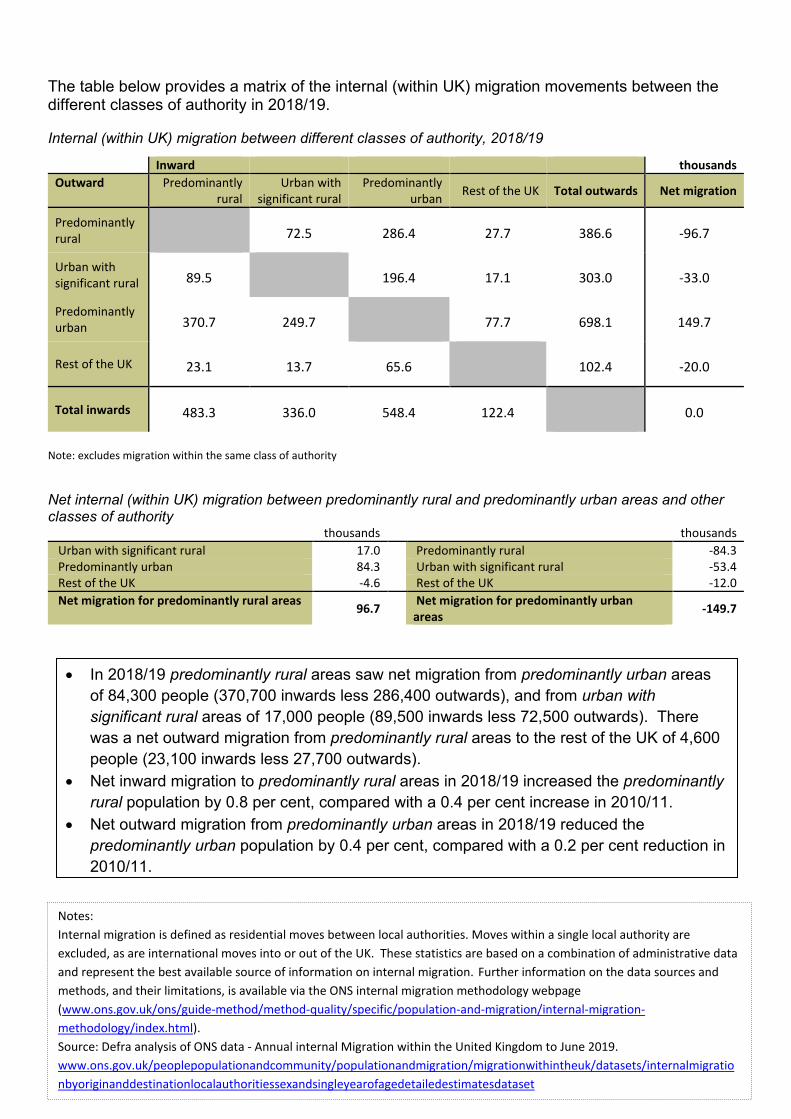
The table below provides a matrix of the internal (within UK) migration movements between the different classes of authority in 2018/19.
Internal (within UK) migration between different classes of authority, 2018/19 Inward thousands Outward Predominantly
rural Urban with
significant rural Predominantly
urban Rest of the UK Total outwards Net migration
Predominantly rural 72.5 286.4 27.7 386.6 -96.7
Urban with significant rural 89.5 196.4 17.1 303.0 -33.0
Predominantly urban 370.7 249.7 77.7 698.1 149.7
Rest of the UK 23.1 13.7 65.6 102.4 -20.0
Total inwards 483.3 336.0 548.4 122.4 0.0
Note: excludes migration within the same class of authority
Net internal (within UK) migration between predominantly rural and predominantly urban areas and other classes of authority
thousands thousands Urban with significant rural 17.0 Predominantly rural -84.3 Predominantly urban 84.3 Urban with significant rural -53.4 Rest of the UK -4.6 Rest of the UK -12.0 Net migration for predominantly rural areas 96.7 Net migration for predominantly urban
areas -149.7
Notes:
Internal migration is defined as residential moves between local authorities. Moves within a single local authority are excluded, as are international moves into or out of the UK. These statistics are based on a combination of administrative data and represent the best available source of information on internal migration. Further information on the data sources and methods, and their limitations, is available via the ONS internal migration methodology webpage (www.ons.gov.uk/ons/guide-method/method-quality/specific/population-and-migration/internal-migration-methodology/index.html). Source: Defra analysis of ONS data - Annual internal Migration within the United Kingdom to June 2019. www.ons.gov.uk/peoplepopulationandcommunity/populationandmigration/migrationwithintheuk/datasets/internalmigrationbyoriginanddestinationlocalauthoritiessexandsingleyearofagedetailedestimatesdataset
• In 2018/19 predominantly rural areas saw net migration from predominantly urban areas of 84,300 people (370,700 inwards less 286,400 outwards), and from urban with significant rural areas of 17,000 people (89,500 inwards less 72,500 outwards). There was a net outward migration from predominantly rural areas to the rest of the UK of 4,600 people (23,100 inwards less 27,700 outwards).
• Net inward migration to predominantly rural areas in 2018/19 increased the predominantly rural population by 0.8 per cent, compared with a 0.4 per cent increase in 2010/11.
• Net outward migration from predominantly urban areas in 2018/19 reduced the predominantly urban population by 0.4 per cent, compared with a 0.2 per cent reduction in 2010/11.
31
Internal migration by age
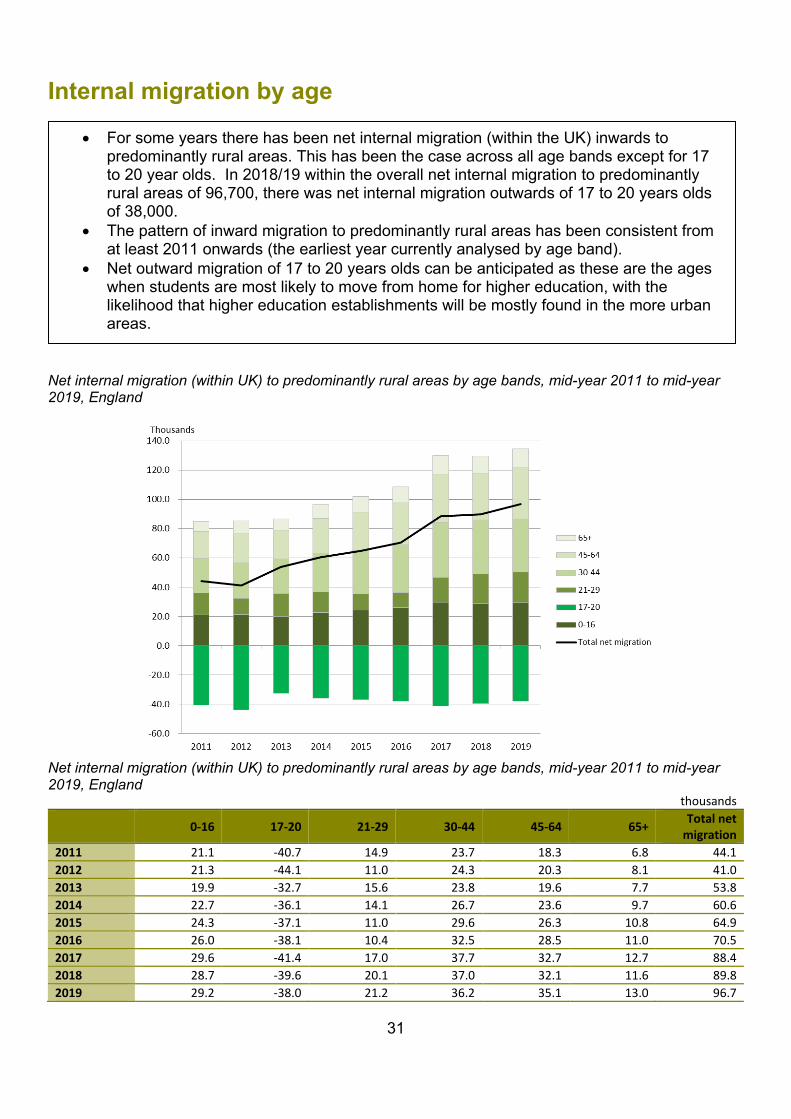
Net internal migration (within UK) to predominantly rural areas by age bands, mid-year 2011 to mid-year 2019, England
Net internal migration (within UK) to predominantly rural areas by age bands, mid-year 2011 to mid-year 2019, England
thousands 0-16 17-20 21-29 30-44 45-64 65+ Total net
migration 2011 21.1 -40.7 14.9 23.7 18.3 6.8 44.1 2012 21.3 -44.1 11.0 24.3 20.3 8.1 41.0 2013 19.9 -32.7 15.6 23.8 19.6 7.7 53.8 2014 22.7 -36.1 14.1 26.7 23.6 9.7 60.6 2015 24.3 -37.1 11.0 29.6 26.3 10.8 64.9 2016 26.0 -38.1 10.4 32.5 28.5 11.0 70.5 2017 29.6 -41.4 17.0 37.7 32.7 12.7 88.4 2018 28.7 -39.6 20.1 37.0 32.1 11.6 89.8 2019 29.2 -38.0 21.2 36.2 35.1 13.0 96.7
• For some years there has been net internal migration (within the UK) inwards to predominantly rural areas. This has been the case across all age bands except for 17 to 20 year olds. In 2018/19 within the overall net internal migration to predominantly rural areas of 96,700, there was net internal migration outwards of 17 to 20 years olds of 38,000.
• The pattern of inward migration to predominantly rural areas has been consistent from at least 2011 onwards (the earliest year currently analysed by age band).
• Net outward migration of 17 to 20 years olds can be anticipated as these are the ages when students are most likely to move from home for higher education, with the likelihood that higher education establishments will be mostly found in the more urban areas.
32
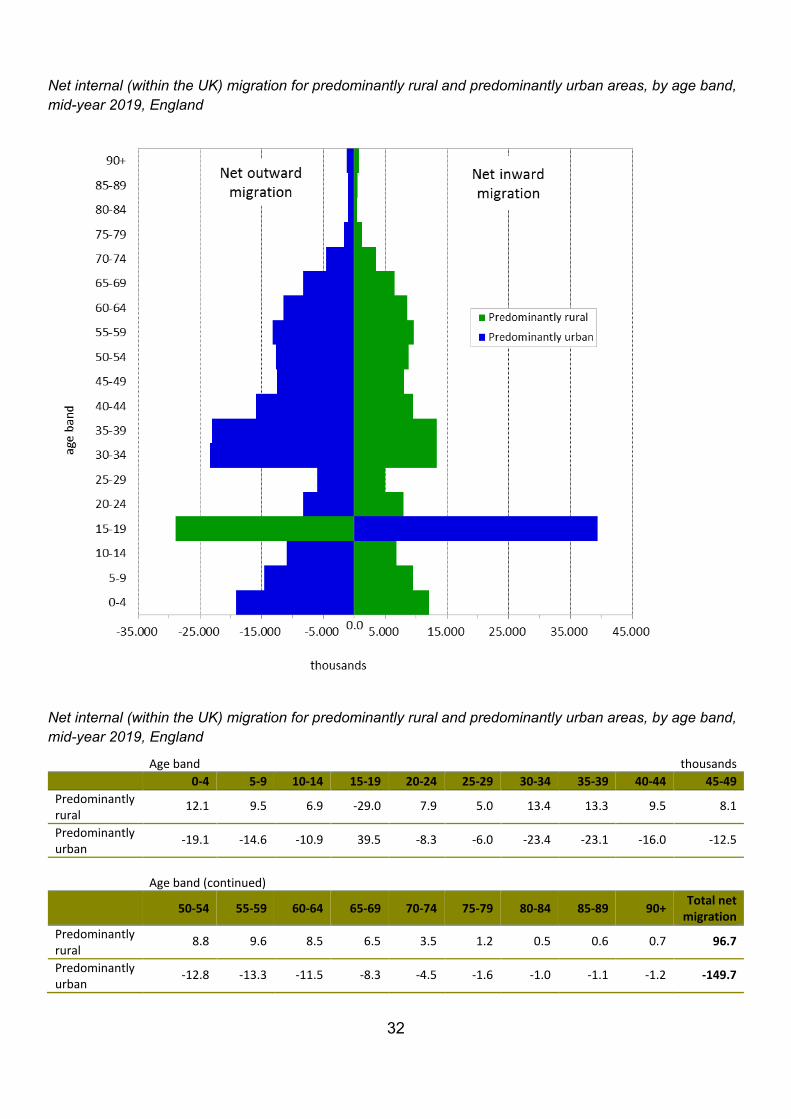
Net internal (within the UK) migration for predominantly rural and predominantly urban areas, by age band, mid-year 2019, England
Net internal (within the UK) migration for predominantly rural and predominantly urban areas, by age band, mid-year 2019, England
Age band thousands 0-4 5-9 10-14 15-19 20-24 25-29 30-34 35-39 40-44 45-49 Predominantly rural
12.1 9.5 6.9 -29.0 7.9 5.0 13.4 13.3 9.5 8.1
Predominantly urban
-19.1 -14.6 -10.9 39.5 -8.3 -6.0 -23.4 -23.1 -16.0 -12.5
Age band (continued) 50-54 55-59 60-64 65-69 70-74 75-79 80-84 85-89 90+ Total net
migration Predominantly rural
8.8 9.6 8.5 6.5 3.5 1.2 0.5 0.6 0.7 96.7
Predominantly urban
-12.8 -13.3 -11.5 -8.3 -4.5 -1.6 -1.0 -1.1 -1.2 -149.7
33
Notes: Internal migration is defined as residential moves between local authorities. Moves within a single local authority are excluded, as are international moves into or out of the UK. These statistics are based on a combination of administrative data and represent the best available source of information on internal migration. Further information on the data sources and methods, and their limitations, is available via the ONS internal migration methodology webpage (www.ons.gov.uk/ons/guide-method/method-quality/specific/population-and-migration/internal-migration-methodology/index.html). Source: Defra analysis of ONS data - Annual internal Migration within the United Kingdom to June 2019. www.ons.gov.uk/peoplepopulationandcommunity/populationandmigration/migrationwithintheuk/datasets/internalmigrationbyoriginanddestinationlocalauthoritiessexandsingleyearofagedetailedestimatesdataset
• Breaking the migration patterns down to equal 5-year age bands, in 2018/19 there was net outward migration for 15 to 19 year olds from predominantly rural areas of 29,000 which would include, as above, students moving elsewhere for higher education. For the 20 to 24 year old age bracket the pattern of movement reverts to net inward migration of 7,900 to predominantly rural areas. There was net inward migration for 25 to 29 year olds of around 5,000.
• The largest net inward migration to predominantly rural areas for adults occurred for 30-34 year olds (13,400 people) and 35 to 39 year olds (13,300 people). Net inward migration for the age bands from 40 to 44 year olds - 65 to 69 year olds, was between 6,500 and 9,600 people for each five-year age band.
• Migration occurred between predominantly rural areas and urban with significant rural areas and the rest of the UK, but the largest net inward migration to predominantly rural areas was from predominantly urban areas. Not surprisingly, the opposite migration patterns were therefore seen for predominantly urban areas. Indeed for most age bands the equivalent opposite net migration was greater, reflecting migration also occurring between predominantly urban areas and urban with significant rural areas and the rest of the UK.
34
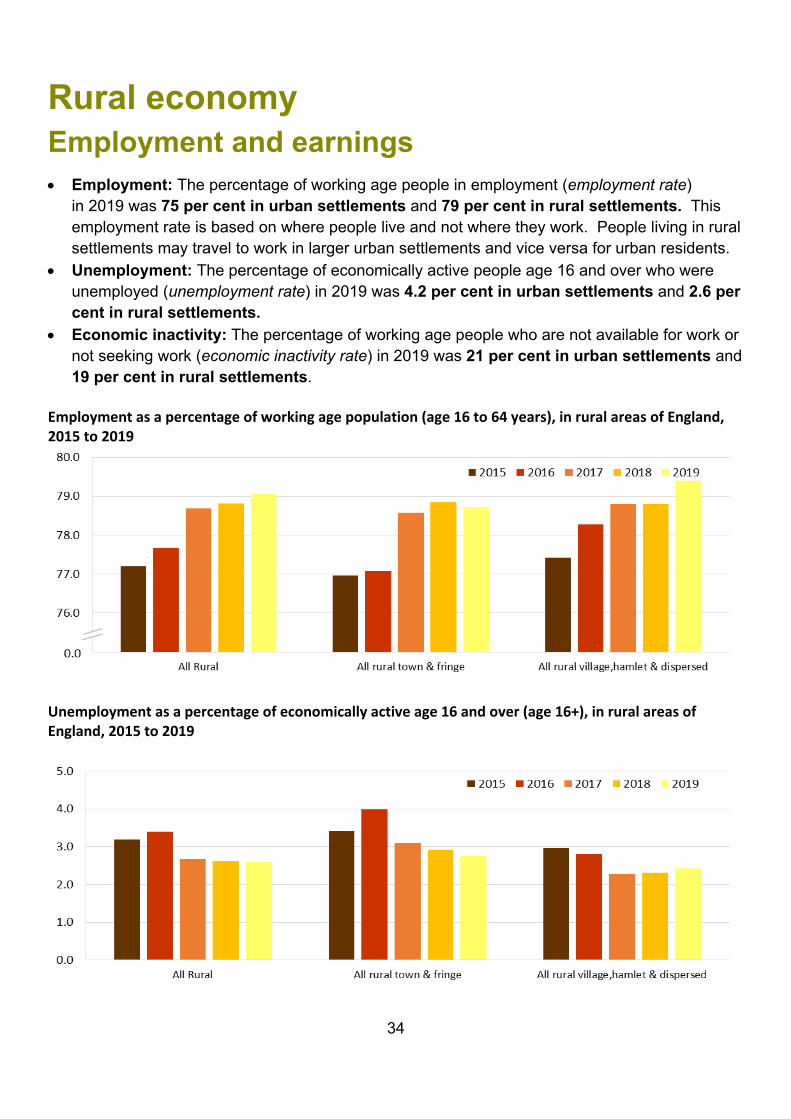
Rural economy Employment and earnings • Employment: The percentage of working age people in employment (employment rate)
in 2019 was 75 per cent in urban settlements and 79 per cent in rural settlements. This employment rate is based on where people live and not where they work. People living in rural settlements may travel to work in larger urban settlements and vice versa for urban residents.
• Unemployment: The percentage of economically active people age 16 and over who were unemployed (unemployment rate) in 2019 was 4.2 per cent in urban settlements and 2.6 per cent in rural settlements.
• Economic inactivity: The percentage of working age people who are not available for work or not seeking work (economic inactivity rate) in 2019 was 21 per cent in urban settlements and 19 per cent in rural settlements.
Employment as a percentage of working age population (age 16 to 64 years), in rural areas of England, 2015 to 2019
Unemployment as a percentage of economically active age 16 and over (age 16+), in rural areas of England, 2015 to 2019
35
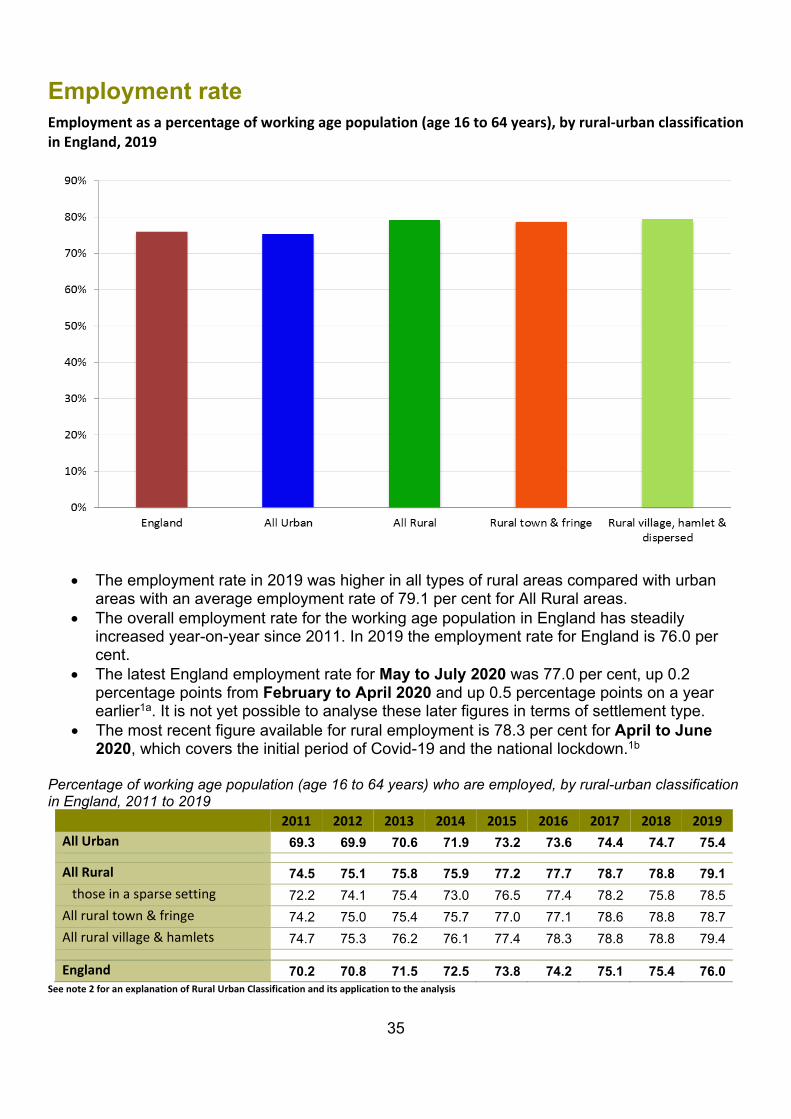
Employment rate Employment as a percentage of working age population (age 16 to 64 years), by rural-urban classification in England, 2019
• The employment rate in 2019 was higher in all types of rural areas compared with urban areas with an average employment rate of 79.1 per cent for All Rural areas.
• The overall employment rate for the working age population in England has steadily increased year-on-year since 2011. In 2019 the employment rate for England is 76.0 per cent.
• The latest England employment rate for May to July 2020 was 77.0 per cent, up 0.2 percentage points from February to April 2020 and up 0.5 percentage points on a year earlier1a. It is not yet possible to analyse these later figures in terms of settlement type.
• The most recent figure available for rural employment is 78.3 per cent for April to June 2020, which covers the initial period of Covid-19 and the national lockdown.1b
Percentage of working age population (age 16 to 64 years) who are employed, by rural-urban classification in England, 2011 to 2019
2011 2012 2013 2014 2015 2016 2017 2018 2019 All Urban 69.3 69.9 70.6 71.9 73.2 73.6 74.4 74.7 75.4
All Rural 74.5 75.1 75.8 75.9 77.2 77.7 78.7 78.8 79.1 those in a sparse setting 72.2 74.1 75.4 73.0 76.5 77.4 78.2 75.8 78.5 All rural town & fringe 74.2 75.0 75.4 75.7 77.0 77.1 78.6 78.8 78.7 All rural village & hamlets 74.7 75.3 76.2 76.1 77.4 78.3 78.8 78.8 79.4
England 70.2 70.8 71.5 72.5 73.8 74.2 75.1 75.4 76.0 See note 2 for an explanation of Rural Urban Classification and its application to the analysis
36
Unemployment rate
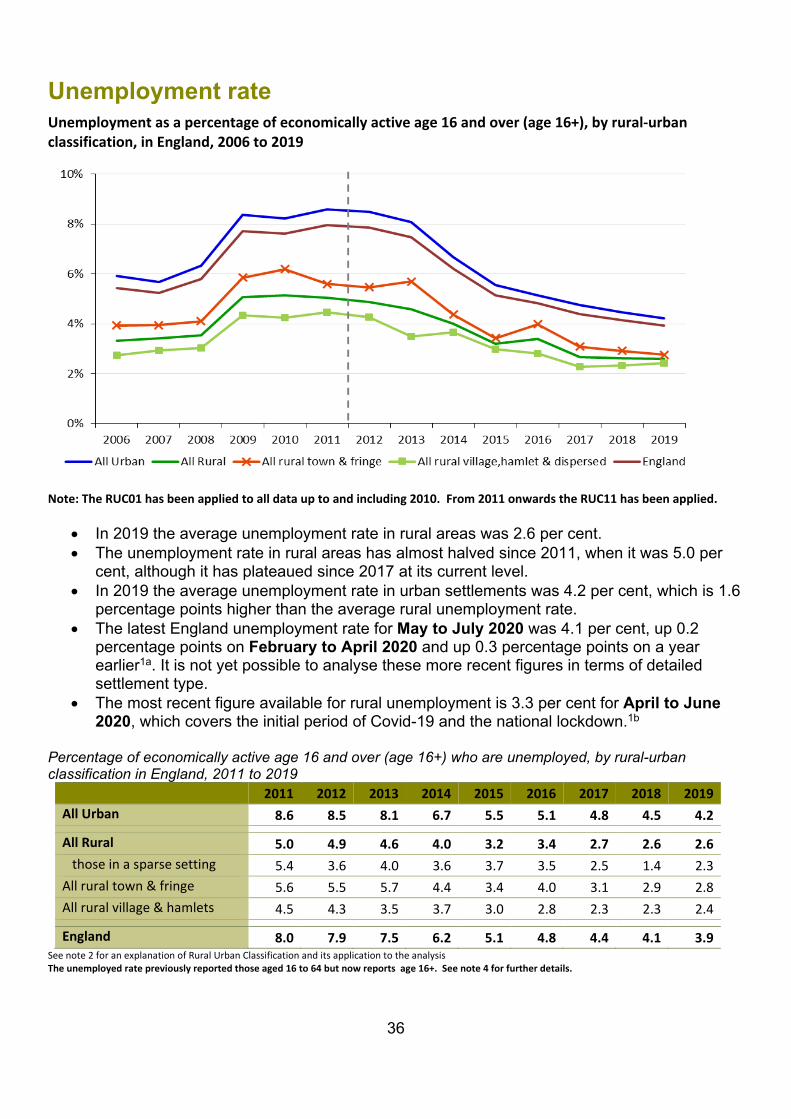
Unemployment as a percentage of economically active age 16 and over (age 16+), by rural-urban classification, in England, 2006 to 2019
Note: The RUC01 has been applied to all data up to and including 2010. From 2011 onwards the RUC11 has been applied.
• In 2019 the average unemployment rate in rural areas was 2.6 per cent. • The unemployment rate in rural areas has almost halved since 2011, when it was 5.0 per
cent, although it has plateaued since 2017 at its current level. • In 2019 the average unemployment rate in urban settlements was 4.2 per cent, which is 1.6
percentage points higher than the average rural unemployment rate. • The latest England unemployment rate for May to July 2020 was 4.1 per cent, up 0.2
percentage points on February to April 2020 and up 0.3 percentage points on a year earlier1a. It is not yet possible to analyse these more recent figures in terms of detailed settlement type.
• The most recent figure available for rural unemployment is 3.3 per cent for April to June 2020, which covers the initial period of Covid-19 and the national lockdown.1b
Percentage of economically active age 16 and over (age 16+) who are unemployed, by rural-urban classification in England, 2011 to 2019
2011 2012 2013 2014 2015 2016 2017 2018 2019 All Urban 8.6 8.5 8.1 6.7 5.5 5.1 4.8 4.5 4.2
All Rural 5.0 4.9 4.6 4.0 3.2 3.4 2.7 2.6 2.6 those in a sparse setting 5.4 3.6 4.0 3.6 3.7 3.5 2.5 1.4 2.3 All rural town & fringe 5.6 5.5 5.7 4.4 3.4 4.0 3.1 2.9 2.8 All rural village & hamlets 4.5 4.3 3.5 3.7 3.0 2.8 2.3 2.3 2.4
England 8.0 7.9 7.5 6.2 5.1 4.8 4.4 4.1 3.9 See note 2 for an explanation of Rural Urban Classification and its application to the analysis The unemployed rate previously reported those aged 16 to 64 but now reports age 16+. See note 4 for further details.

37
Economic inactivity Percentage of working age population (16 to 64 years) who are economically inactive, by rural-urban classification in England, 2019
• People who are economically inactive are not available for work or not seeking work and will include students, retirees and those unable to work due to sickness or disability. People who are officially unemployed are considered to be economically active.
• In 2019, the rate of economic inactivity in urban areas was 2.5 percentage points greater than the rate of economic inactivity in rural areas of 18.8 per cent of working age people. Within rural areas, the percentage of economic inactivity was highest in rural in a sparse setting at 19.5 per cent of the working age population.
• Economic inactivity as a percentage of working age population has shown an overall decline since 2011 in both rural and urban areas.
• The latest England inactivity rate for May to July 2020 was 19.6 per cent, down 0.3 percentage points on February to April 2020 and down 0.8 percentage points on a year earlier1a. It is not yet possible to analyse these later figures in terms of settlement type.
• The most recent figure available for rural economic inactivity is 39.4 per cent for April to June 2020, which covers the initial period of Covid-19 and the national lockdown.1b
Percentage of working age population (age 16 to 64 years) who are economically inactive, by rural-urban classification in England, 2011 to 2019
2011 2012 2013 2014 2015 2016 2017 2018 2019 All Urban 24.0 23.5 23.0 22.9 22.4 22.4 21.8 21.8 21.2
All Rural 21.4 20.9 20.5 20.8 20.2 19.5 19.1 19.0 18.8 those in a sparse setting 23.4 23.0 21.4 24.2 20.6 19.6 19.5 23.0 19.5 All rural town & fringe 21.3 20.6 20.0 20.7 20.2 19.6 18.9 18.7 19.0 All village & hamlets 21.6 21.2 20.9 20.8 20.1 19.3 19.2 19.2 18.5
England 23.6 23.1 22.6 22.6 22.1 21.9 21.4 21.3 20.8 See note 2 for an explanation of Rural Urban Classification and its application to the analysis

38
Notes: 1a) ONS Labour Market Statistics September 2020, see table 22 of the dataset:
https://www.ons.gov.uk/employmentandlabourmarket/peopleinwork/employmentandemployeetypes/datasets/summaryoflabourmarketstatistics
1b) Labour Force Survey, Q2 2020 (April – June 2020) 2) The RUC01 has been applied to all data up to and including 2010. From 2011 onwards the RUC11 has been applied. Although a key difference between the 2001 and 2011 version of the classification is that a distinction between major conurbations, lesser conurbations and other urban areas has been introduced, the urban categories are comparable in concept. Similarly the rural 2001 and 2011 categories are comparable in concept. However, the classification of a settlement may have changed between 2001 and 2011 owing to changes in population and settlement pattern. 3) In 2009 and before, working age was defined as 16-64 for males and 16-59 for females. In September 2010 the definition for working age was altered to be 16-64 for both males and females. The statistics shown here have been adjusted to this new definition for all years shown. 4) Unemployment rate is expressed as a percentage of the economically active ‘age 16 and over’ population, this is a departure from previous analyses and is consistent with ONS Labour Market Statistics. The employment rate and economically inactive rate are expressed as a percentage of the entire working age population. Therefore the rates should not be expected to sum to 100%. Source: Office for National Statistics, Annual Business Inquiry via [email protected]
39
Earnings
• Average annual employee earnings (based on the median value, or middle of the earnings distribution) give an indication of living standards people are able to enjoy through their disposable income (see Expenditure).
• As people do not necessarily work in the same settlement as they live, workplace and residence based average earnings may differ.
• For example, average residence based earnings are lower than workplace based earnings in major urban areas, whilst average residence based earnings in rural areas are higher than workplace earnings because people living in rural areas may work in urban areas in higher paid jobs.
• Average workplace based earnings are lowest in mainly rural areas along with urban with minor conurbation areas and highest in the London area.
• All areas have seen an increase in workplace-based median earnings in 2019, with a 4.2 per cent increase in predominantly urban areas (excluding London) and a 3.4 per cent increase in predominantly rural areas in comparison with 2018. These compare with a change in the Consumer Price Index including housing costs (a measure of inflation) of 1.8 per cent in the year ending March 2019.
In April 2019 there were some changes to Local Authorities boundaries where some Local Authority Districts merged to form single Unitary Authorities. This reduces the number of Local Authorities Districts and Unitary Authorities in England from 326 to 317. The impact of these changes on rural urban comparisons is that some Local Authority Districts originally categorised as Urban with city and town or Urban with significant rural now form part of Unitary Authorities categorised as Largely rural. This change has been applied to figures from 2018 onwards.

40
Workplace based median gross annual earnings (current prices), 2009 to 2019
Note: Data to 2017 uses the Rural Urban Classification (RUC) based on 327 Local Authority Districts (LAD’s) and Unitary Authorities (UA’s). From 2018 the RUC is based on revised boundaries as at April 2019, reducing the number of LAD’s and UA’s from 326 to 317.
Workplace based median gross annual earnings (current prices), (£), 2010 to 20191 2010 2011 2012 2013 2014 2015 2016 2017 2018 2019 London 29,500 31,800 32,100 32,500 32,300 32,800 34,000 34,800 36,000 36,800 Urban with Major Conurbation 20,500 20,500 20,900 21,200 21,300 21,700 22,400 22,800 23,100 24,100 Urban with Minor Conurbation 19,400 19,500 20,300 20,200 20,300 20,800 21,100 21,300 21,700 22,400 Urban with City and Town 21,000 21,100 21,400 21,900 21,900 22,400 22,900 23,200 23,700 24,700 Urban with significant rural 20,800 20,600 21,000 21,100 21,400 21,500 22,300 21,800 23,300 24,400 Largely Rural 19,300 19,200 19,600 19,900 19,900 20,400 21,000 21,400 21,700 22,500 Mainly Rural 18,900 18,900 19,000 19,400 19,500 20,000 20,700 21,300 22,000 22,700
Predominantly urban (excl. London) 20,700 20,700 21,100 21,500 21,600 22,000 22,600 22,900 23,300 24,300
Predominantly rural 19,100 19,100 19,300 19,700 19,700 20,300 20,900 21,400 21,800 22,500
England* 21,600 21,500 21,800 22,200 22,300 22,700 23,300 23,800 24,300 25,100
* Results for England are not comparable with the data for the rural – urban categories presented above. Results for rural – urban categories have been weighted by the number of people employed aged 16-64 based on Annual Population Survey and Annual Population Survey – workplace analysis: www.nomisweb.co.uk/articles/1066.aspx Results for England come from the original ONS publication (table 7.7a): www.ons.gov.uk/employmentandlabourmarket/peopleinwork/earningsandworkinghours/datasets/placeofworkbylocalauthorityashetable7
• In 2019, median workplace-based earnings in predominantly urban areas (excluding London) were £24,300 while predominantly rural areas were lower at £22,500.
• Between 2009 and 2019 median workplace based earnings increased for all settlement types. Excluding London, the rate of increase was greatest for workplaces in mainly rural areas, increasing by 18.8 per cent, followed by largely rural areas (16.8 per cent).
• The rate of increase was lowest in urban with minor conurbation areas where median earnings increased by 12.4 per cent in the same period.
• For England, the rate of increase between 2009 and 2019 was 16.0 per cent. • Over the same time period (2009 to 2019) the Consumer Price Index (including housing
costs) has increased by 20 per cent.
£0
41
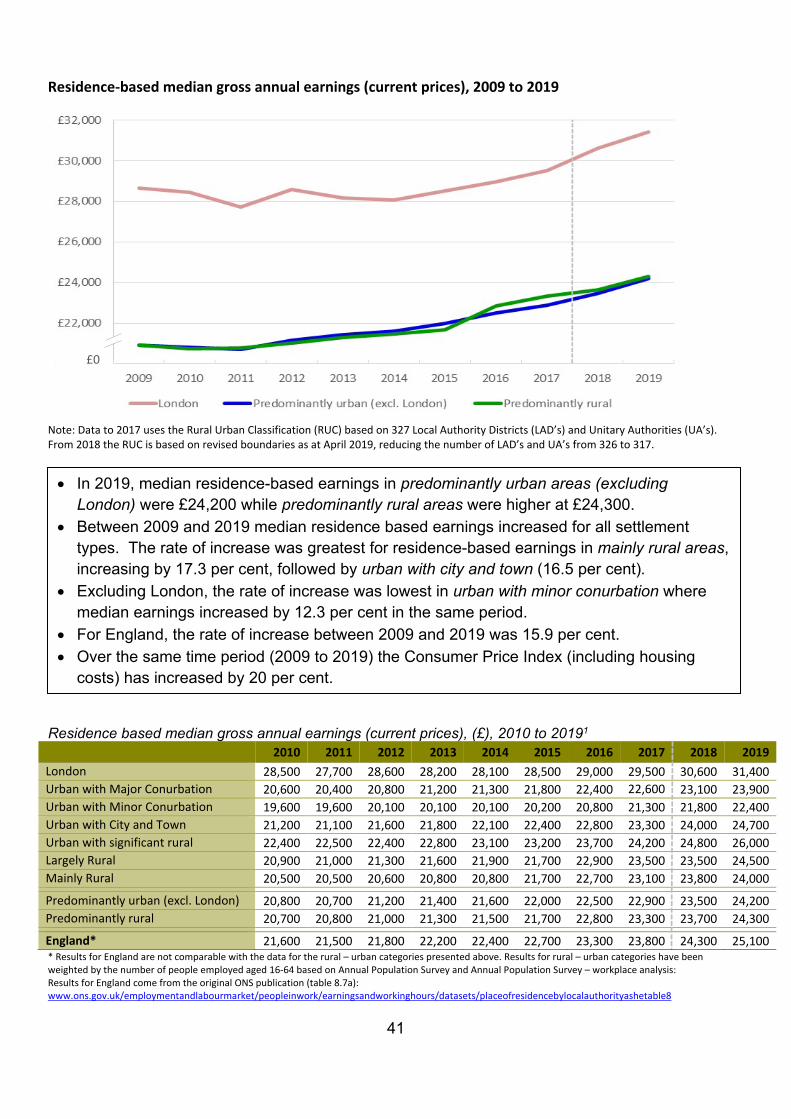
Residence-based median gross annual earnings (current prices), 2009 to 2019
Note: Data to 2017 uses the Rural Urban Classification (RUC) based on 327 Local Authority Districts (LAD’s) and Unitary Authorities (UA’s). From 2018 the RUC is based on revised boundaries as at April 2019, reducing the number of LAD’s and UA’s from 326 to 317.
Residence based median gross annual earnings (current prices), (£), 2010 to 20191 2010 2011 2012 2013 2014 2015 2016 2017 2018 2019 London 28,500 27,700 28,600 28,200 28,100 28,500 29,000 29,500 30,600 31,400 Urban with Major Conurbation 20,600 20,400 20,800 21,200 21,300 21,800 22,400 22,600 23,100 23,900 Urban with Minor Conurbation 19,600 19,600 20,100 20,100 20,100 20,200 20,800 21,300 21,800 22,400 Urban with City and Town 21,200 21,100 21,600 21,800 22,100 22,400 22,800 23,300 24,000 24,700 Urban with significant rural 22,400 22,500 22,400 22,800 23,100 23,200 23,700 24,200 24,800 26,000 Largely Rural 20,900 21,000 21,300 21,600 21,900 21,700 22,900 23,500 23,500 24,500 Mainly Rural 20,500 20,500 20,600 20,800 20,800 21,700 22,700 23,100 23,800 24,000
Predominantly urban (excl. London) 20,800 20,700 21,200 21,400 21,600 22,000 22,500 22,900 23,500 24,200
Predominantly rural 20,700 20,800 21,000 21,300 21,500 21,700 22,800 23,300 23,700 24,300
England* 21,600 21,500 21,800 22,200 22,400 22,700 23,300 23,800 24,300 25,100
* Results for England are not comparable with the data for the rural – urban categories presented above. Results for rural – urban categories have been weighted by the number of people employed aged 16-64 based on Annual Population Survey and Annual Population Survey – workplace analysis: Results for England come from the original ONS publication (table 8.7a): www.ons.gov.uk/employmentandlabourmarket/peopleinwork/earningsandworkinghours/datasets/placeofresidencebylocalauthorityashetable8
• In 2019, median residence-based earnings in predominantly urban areas (excluding London) were £24,200 while predominantly rural areas were higher at £24,300.
• Between 2009 and 2019 median residence based earnings increased for all settlement types. The rate of increase was greatest for residence-based earnings in mainly rural areas, increasing by 17.3 per cent, followed by urban with city and town (16.5 per cent).
• Excluding London, the rate of increase was lowest in urban with minor conurbation where median earnings increased by 12.3 per cent in the same period.
• For England, the rate of increase between 2009 and 2019 was 15.9 per cent. • Over the same time period (2009 to 2019) the Consumer Price Index (including housing
costs) has increased by 20 per cent.
£0
42
Notes: 1 Full time-series from 2009 are available on the ‘Rural economy – statistical indicators’ page: www.gov.uk/government/collections/rural-economy-statistical-indicators 2018 figures are revised, 2019 are provisional. Source: Office for National Statistics, Annual Survey of Hours and Earnings: Table 7: Place of Work by Local Authority and Table 8: Place of Residence by Local Authority: www.ons.gov.uk/employmentandlabourmarket/peopleinwork/earningsandworkinghours/bulletins/annualsurveyofhoursandearnings/2019/relateddata Figures in the tables have been rounded to the nearest £100. Figures are on a current prices basis and have not been adjusted for inflation. Results for rural – urban categories have been weighted by the number of people employed aged 16-64 based on Annual Population Survey and Annual Population Survey – workplace analysis: www.nomisweb.co.uk/articles/1066.aspx Consumer Price Index: www.ons.gov.uk/economy/inflationandpriceindices/timeseries/d7bt/mm23
43
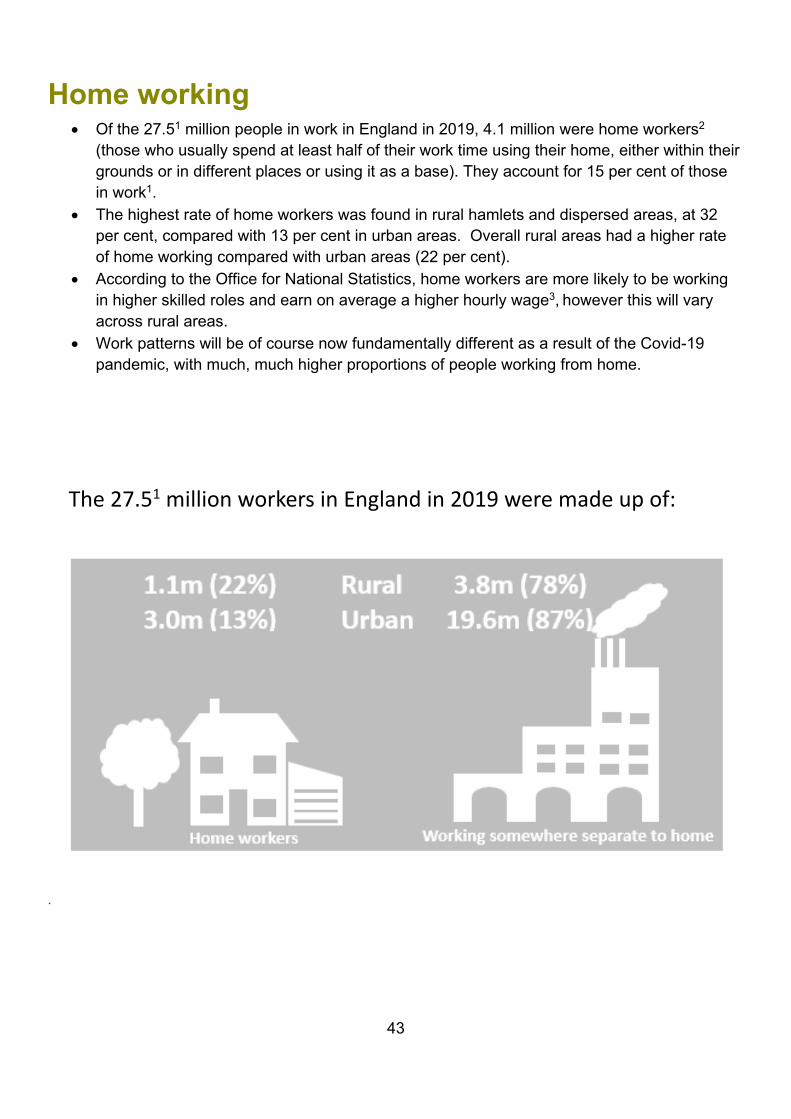
Home working • Of the 27.51 million people in work in England in 2019, 4.1 million were home workers2
(those who usually spend at least half of their work time using their home, either within their grounds or in different places or using it as a base). They account for 15 per cent of those in work1.
• The highest rate of home workers was found in rural hamlets and dispersed areas, at 32 per cent, compared with 13 per cent in urban areas. Overall rural areas had a higher rate of home working compared with urban areas (22 per cent).
• According to the Office for National Statistics, home workers are more likely to be working in higher skilled roles and earn on average a higher hourly wage3, however this will vary across rural areas.
• Work patterns will be of course now fundamentally different as a result of the Covid-19 pandemic, with much, much higher proportions of people working from home.
.
The 27.51 million workers in England in 2019 were made up of:
44
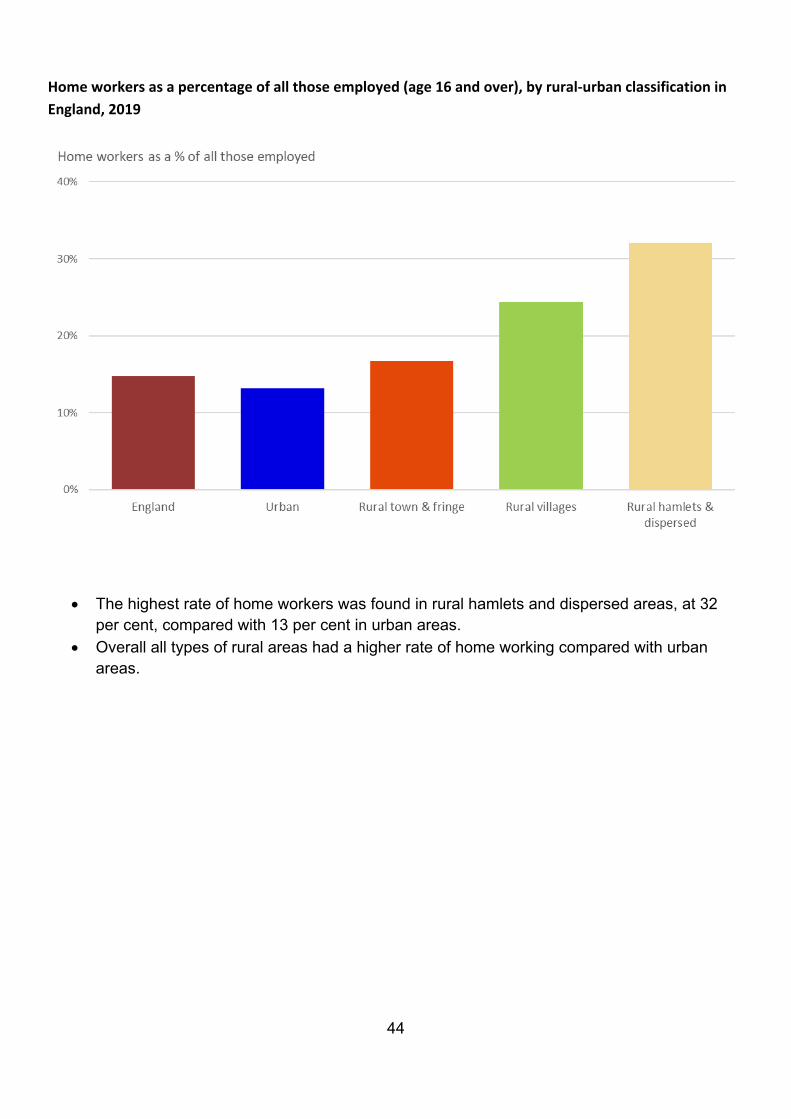
Home workers as a percentage of all those employed (age 16 and over), by rural-urban classification in England, 2019
• The highest rate of home workers was found in rural hamlets and dispersed areas, at 32
per cent, compared with 13 per cent in urban areas. • Overall all types of rural areas had a higher rate of home working compared with urban
areas.
45
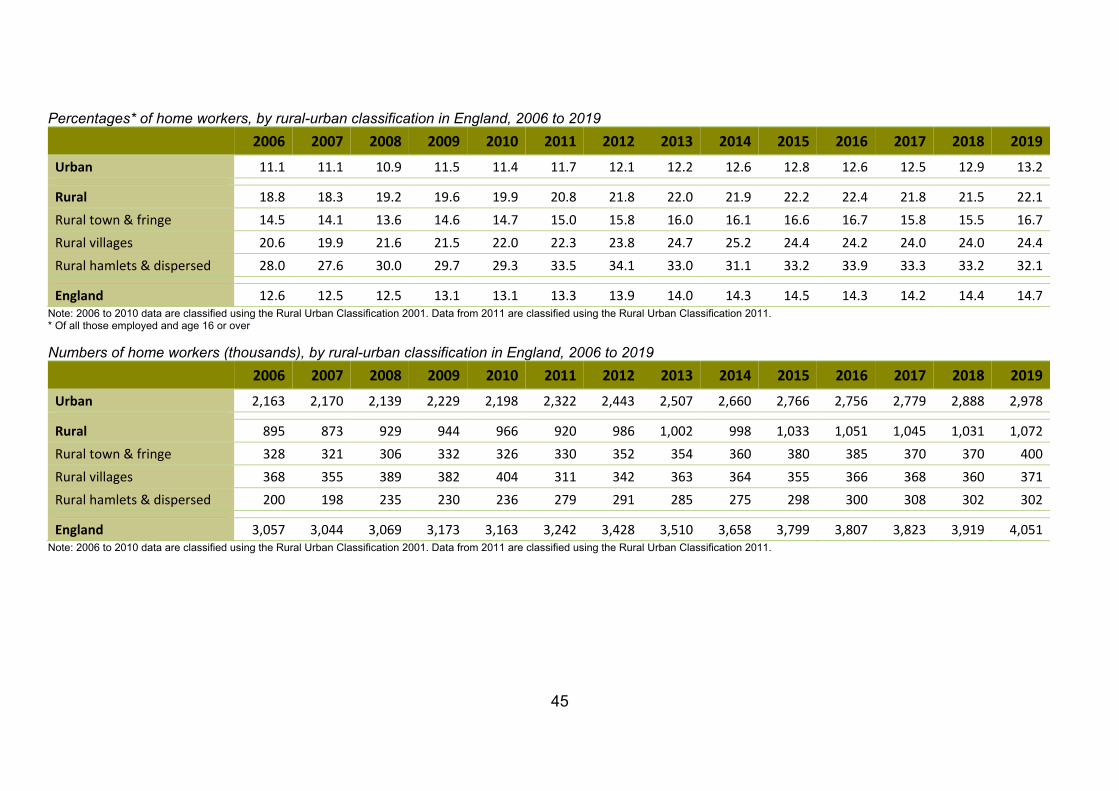
Percentages* of home workers, by rural-urban classification in England, 2006 to 2019 2006 2007 2008 2009 2010 2011 2012 2013 2014 2015 2016 2017 2018 2019 Urban 11.1 11.1 10.9 11.5 11.4 11.7 12.1 12.2 12.6 12.8 12.6 12.5 12.9 13.2
Rural 18.8 18.3 19.2 19.6 19.9 20.8 21.8 22.0 21.9 22.2 22.4 21.8 21.5 22.1 Rural town & fringe 14.5 14.1 13.6 14.6 14.7 15.0 15.8 16.0 16.1 16.6 16.7 15.8 15.5 16.7 Rural villages 20.6 19.9 21.6 21.5 22.0 22.3 23.8 24.7 25.2 24.4 24.2 24.0 24.0 24.4 Rural hamlets & dispersed 28.0 27.6 30.0 29.7 29.3 33.5 34.1 33.0 31.1 33.2 33.9 33.3 33.2 32.1
England 12.6 12.5 12.5 13.1 13.1 13.3 13.9 14.0 14.3 14.5 14.3 14.2 14.4 14.7 Note: 2006 to 2010 data are classified using the Rural Urban Classification 2001. Data from 2011 are classified using the Rural Urban Classification 2011. * Of all those employed and age 16 or over Numbers of home workers (thousands), by rural-urban classification in England, 2006 to 2019
2006 2007 2008 2009 2010 2011 2012 2013 2014 2015 2016 2017 2018 2019
Urban 2,163 2,170 2,139 2,229 2,198 2,322 2,443 2,507 2,660 2,766 2,756 2,779 2,888 2,978
Rural 895 873 929 944 966 920 986 1,002 998 1,033 1,051 1,045 1,031 1,072 Rural town & fringe 328 321 306 332 326 330 352 354 360 380 385 370 370 400 Rural villages 368 355 389 382 404 311 342 363 364 355 366 368 360 371 Rural hamlets & dispersed 200 198 235 230 236 279 291 285 275 298 300 308 302 302
England 3,057 3,044 3,069 3,173 3,163 3,242 3,428 3,510 3,658 3,799 3,807 3,823 3,919 4,051 Note: 2006 to 2010 data are classified using the Rural Urban Classification 2001. Data from 2011 are classified using the Rural Urban Classification 2011.

46
Percentage of home workers from all those employed and age 16 or over, by rural-urban classification, in England (2006 to 2019)
2019 homeworking rate:
Note: 2006 to 2010 data are classified using the Rural Urban Classification 2001. Data from 2011 are classified using the Rural Urban Classification 2011.
• In 2019 there were 1,072,000 home workers in rural areas, accounting for 22 per cent of all workers living in rural areas. There were 2,978,000 home workers in urban areas, accounting for 13 per cent of all workings living in urban areas.
• Between 2006 and 2019 the rate of home working increased across all areas. The highest increase was in rural hamlets and dispersed areas at 4.1 per cent and the lowest increase was in urban areas at 2.0 per cent. However, it should be known that the classification of settlements was updated for 2011 onwards, and some settlements would have changed category.
47
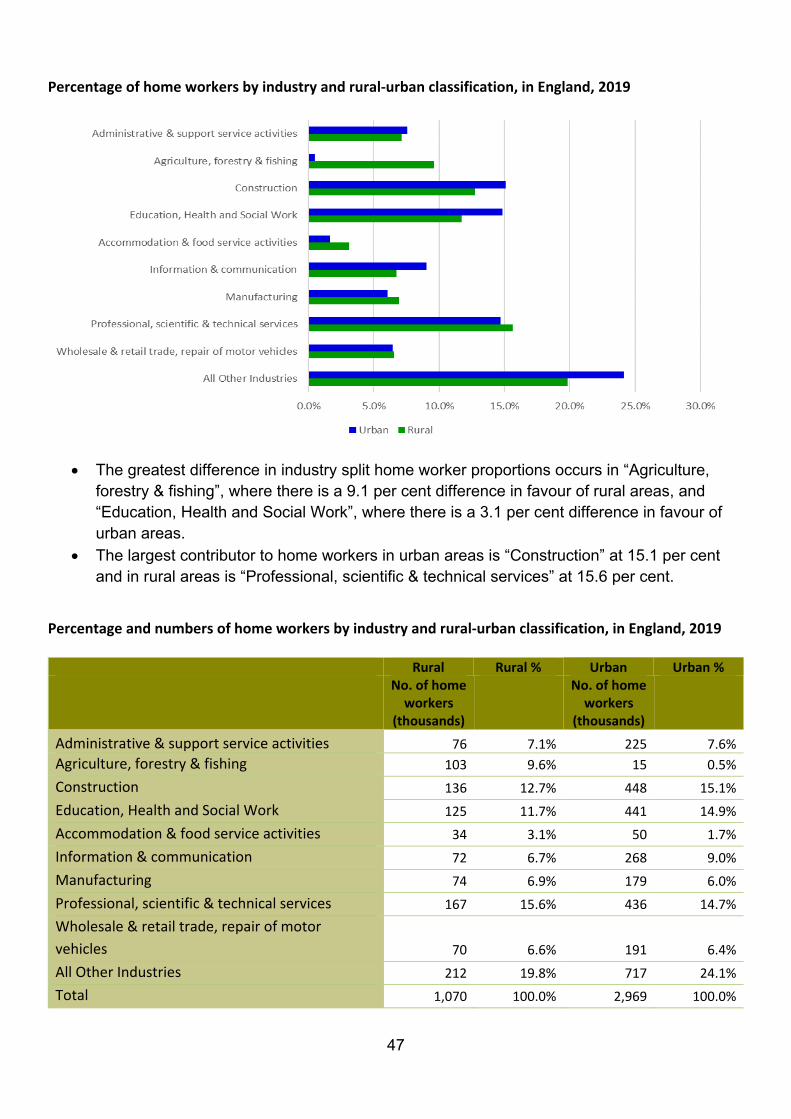
Percentage of home workers by industry and rural-urban classification, in England, 2019
• The greatest difference in industry split home worker proportions occurs in “Agriculture, forestry & fishing”, where there is a 9.1 per cent difference in favour of rural areas, and “Education, Health and Social Work”, where there is a 3.1 per cent difference in favour of urban areas.
• The largest contributor to home workers in urban areas is “Construction” at 15.1 per cent and in rural areas is “Professional, scientific & technical services” at 15.6 per cent.
Percentage and numbers of home workers by industry and rural-urban classification, in England, 2019
Rural Rural % Urban Urban % No. of home
workers (thousands)
No. of home
workers (thousands)
Administrative & support service activities 76 7.1% 225 7.6% Agriculture, forestry & fishing 103 9.6% 15 0.5% Construction 136 12.7% 448 15.1% Education, Health and Social Work 125 11.7% 441 14.9% Accommodation & food service activities 34 3.1% 50 1.7% Information & communication 72 6.7% 268 9.0% Manufacturing 74 6.9% 179 6.0% Professional, scientific & technical services 167 15.6% 436 14.7% Wholesale & retail trade, repair of motor vehicles 70 6.6% 191 6.4% All Other Industries 212 19.8% 717 24.1% Total 1,070 100.0% 2,969 100.0%

48
Notes: 1) This figure is for all those who reported their working status. It differs slightly from the total number employed as some respondents have not reported their home working status. 2) Home workers are defined as those who usually spend at least half of their work time using their home, either within their grounds or in different places or using it as a base. Home workers will include both those who are employees of organisations and those who are self-employed. The category for home workers includes the following; those who work within their home; those who work in the same grounds or buildings of their home; and those who work in different places but use their home as a base. 3) Further information can be found in the ONS document, Characteristics of Home Workers, 2014 4) The levels and rates are based on people age 16 and over who are in employment. 5) The RUC01 has been applied to all data up to and including 2010. From 2011 onwards the RUC11 has been applied. Although a key difference between the 2001 and 2011 version of the classification is that a distinction between major conurbations, lesser conurbations and other urban areas has been introduced, the urban categories are comparable in concept. Similarly the rural 2001 and 2011 categories are comparable in concept. However, the classification of a settlement may have changed between 2001 and 2011 owing to changes in population and settlement pattern. Source: Office for National Statistics, Labour Force Survey, via Annual Business Inquiry ([email protected])
49
Productivity measured by Gross Value Added (GVA) Productivity measures are often used to indicate how well a country can use its human and physical resources to generate economic growth. Strong economic growth will generally mean an improvement in living standards. However, productivity alone does not tell us everything about the economic wellbeing of different areas. The potential of any given place depends on the mix of industries, the infrastructure and the size of settlements there. Based on these circumstances, even an area with low productivity might be performing as well as it can.
Gross Value Added (GVA) measures the contribution to the economy of each individual producer, industry or sector. Simplistically it is the value of the amount of goods and services that have been produced, less the cost of all inputs and raw materials that are directly attributable to that production.
In previous years the ONS have produced two separate measures of GVA, one based on income and one based on production. These two measures have been weighted and combined to produce a new balanced measure of GVA4.
• In 2018, GVA from Predominantly Rural areas contributed 15.9 per cent of England’s GVA,
and was worth an estimated £261 billion. This compares with 45.6 per cent from Predominantly Urban areas (excluding London) (£749 billion), 27.4 per cent from London (£450 billion) and 11.2 per cent from Urban with Significant Rural areas (£184 billion).
• The proportional contribution from Predominantly Rural areas to England’s GVA has declined slightly between 2001 and 2018 (from 17.3 per cent to 15.9 per cent).
• However this has been affected by an increase in London’s contribution. The proportional contribution of Predominantly Rural areas to the GVA of England excluding London has shown a much smaller decline between 2001 and 2018 (from 22.7 per cent to 21.8 per cent).
• In 2018, the GVA per workforce job in Predominantly Rural areas was £43,900 and in
Predominantly Urban areas (excluding London) it was £49,400 (provisional estimates). • In 2018, the productivity of Predominantly Rural areas was around 82 per cent of that for
England as whole (provisional estimate). This had fallen from 90 per cent in 2001 but it is affected by the increase in London’s contribution to England’s overall productivity.
4 For further information see the ONS website: www.consultations.ons.gov.uk/national-accounts/consultation-on-balanced-estimates-of-regional-gva/
In April 2019 there were some changes to Local Authorities boundaries where some Local Authority Districts merged to form single Unitary Authorities. This reduces the number of Local Authorities Districts and Unitary Authorities in England from 326 to 317. The impact of these changes on rural urban comparisons is that some Local Authority Districts originally categorised as Urban with city and town or Urban with significant rural now form part of Unitary Authorities categorised as Largely rural. This change has been backdated across the full time-series.

50
Contribution to England's Gross Value Added (GVA) Contribution to England’s Gross Value Added (GVA), by 2011-based local authority rural-urban classification in England (data broadly at county level apportioned at local district level), 2018 (provisional)
2011 Local Authority Classification
GVA (£m) share Broader classification GVA (£m) share
London 450,300 27.4% London 450,300 27.4% Urban with Major Conurbation 282,100 17.2%
Predominantly Urban excl. London
748,800
45.6% Urban with Minor Conurbation 45,800 2.8%
Urban with City and Town 421,000 25.6% Urban with Significant Rural 183,500 11.2% Urban with Significant Rural 183,500 11.2% Largely Rural 159,900 9.7%
Predominantly Rural 260,600 15.9% Mainly Rural 100,700 6.1% England 1,643,300 100.0% England 1,643,300 100.0%
Gross Value Added (GVA) by Local Authority Classification as a percentage of England GVA, 2001 to 2018 (provisional)
• Predominantly Urban areas (excluding London) make the largest contribution to England’s GVA, estimated at £749 billion (45.6 per cent), followed by London’s £450 billion (27.4 per cent). Predominantly Rural areas contributed an estimated £261 billion (15.9 per cent) in 2018.
• These GVA figures are based on GVA at broadly county level apportioned at local district level to provide a more refined analysis of GVA across the local authority classification. The total GVA for rural and urban areas in the table above is different to the industry breakdown following this (based on 2017 data), and is less finely detailed being based on data at broadly county level.
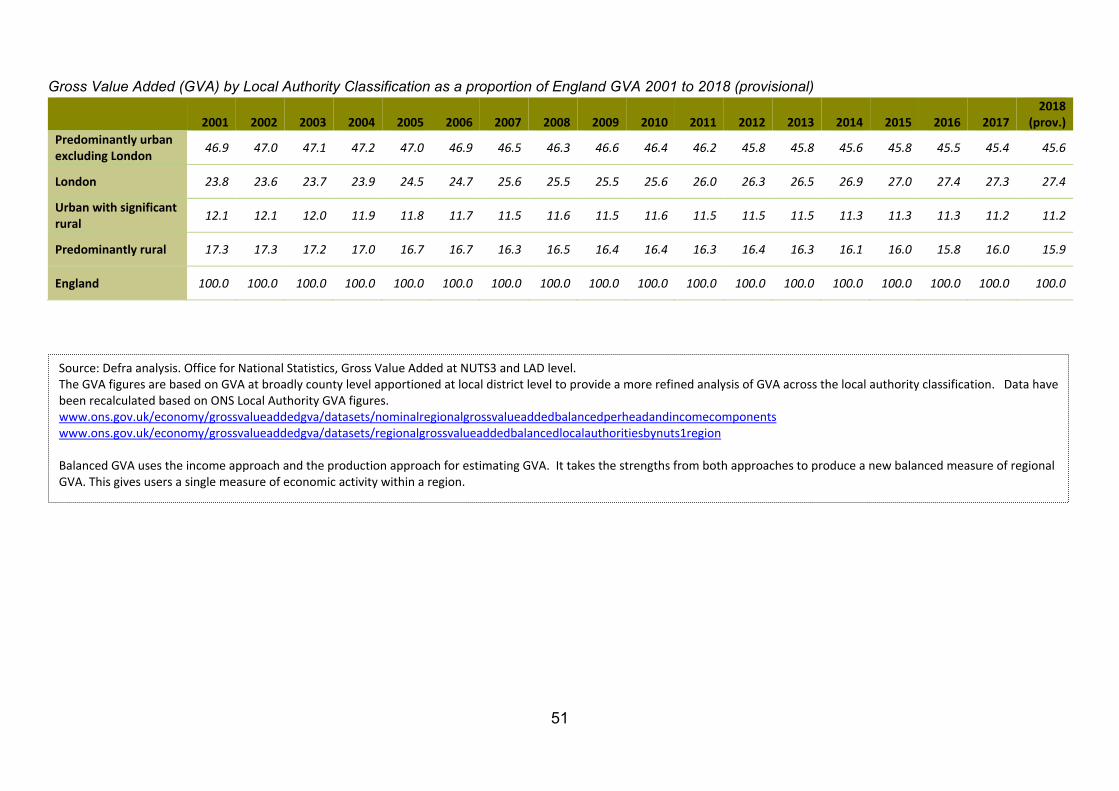
51
Gross Value Added (GVA) by Local Authority Classification as a proportion of England GVA 2001 to 2018 (provisional)
2001 2002 2003 2004 2005 2006 2007 2008 2009 2010 2011 2012 2013 2014 2015 2016 2017 2018
(prov.) Predominantly urban excluding London 46.9 47.0 47.1 47.2 47.0 46.9 46.5 46.3 46.6 46.4 46.2 45.8 45.8 45.6 45.8 45.5 45.4 45.6
London 23.8 23.6 23.7 23.9 24.5 24.7 25.6 25.5 25.5 25.6 26.0 26.3 26.5 26.9 27.0 27.4 27.3 27.4
Urban with significant rural 12.1 12.1 12.0 11.9 11.8 11.7 11.5 11.6 11.5 11.6 11.5 11.5 11.5 11.3 11.3 11.3 11.2 11.2
Predominantly rural 17.3 17.3 17.2 17.0 16.7 16.7 16.3 16.5 16.4 16.4 16.3 16.4 16.3 16.1 16.0 15.8 16.0 15.9
England 100.0 100.0 100.0 100.0 100.0 100.0 100.0 100.0 100.0 100.0 100.0 100.0 100.0 100.0 100.0 100.0 100.0 100.0
Source: Defra analysis. Office for National Statistics, Gross Value Added at NUTS3 and LAD level. The GVA figures are based on GVA at broadly county level apportioned at local district level to provide a more refined analysis of GVA across the local authority classification. Data have been recalculated based on ONS Local Authority GVA figures. www.ons.gov.uk/economy/grossvalueaddedgva/datasets/nominalregionalgrossvalueaddedbalancedperheadandincomecomponents www.ons.gov.uk/economy/grossvalueaddedgva/datasets/regionalgrossvalueaddedbalancedlocalauthoritiesbynuts1region Balanced GVA uses the income approach and the production approach for estimating GVA. It takes the strengths from both approaches to produce a new balanced measure of regional GVA. This gives users a single measure of economic activity within a region.
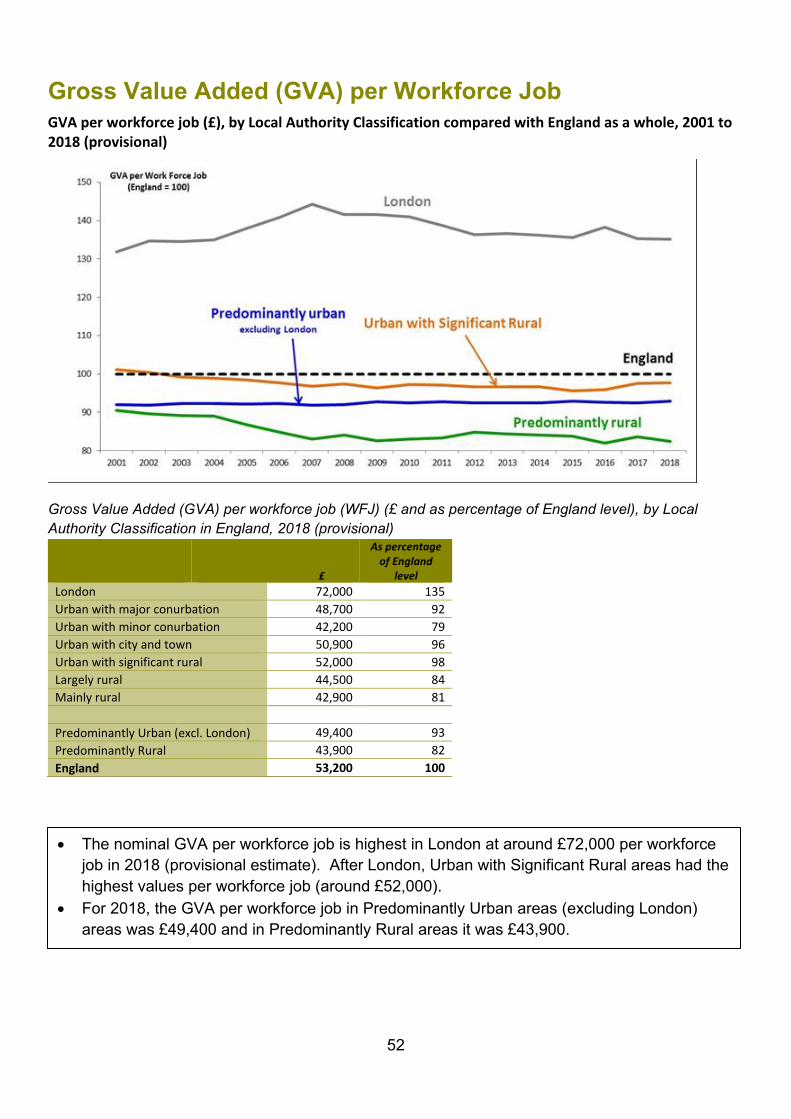
52
Gross Value Added (GVA) per Workforce Job GVA per workforce job (£), by Local Authority Classification compared with England as a whole, 2001 to 2018 (provisional)
Gross Value Added (GVA) per workforce job (WFJ) (£ and as percentage of England level), by Local Authority Classification in England, 2018 (provisional)
£
As percentage of England
level London 72,000 135 Urban with major conurbation 48,700 92 Urban with minor conurbation 42,200 79 Urban with city and town 50,900 96 Urban with significant rural 52,000 98 Largely rural 44,500 84 Mainly rural 42,900 81 Predominantly Urban (excl. London) 49,400 93 Predominantly Rural 43,900 82 England 53,200 100
• The nominal GVA per workforce job is highest in London at around £72,000 per workforce job in 2018 (provisional estimate). After London, Urban with Significant Rural areas had the highest values per workforce job (around £52,000).
• For 2018, the GVA per workforce job in Predominantly Urban areas (excluding London) areas was £49,400 and in Predominantly Rural areas it was £43,900.
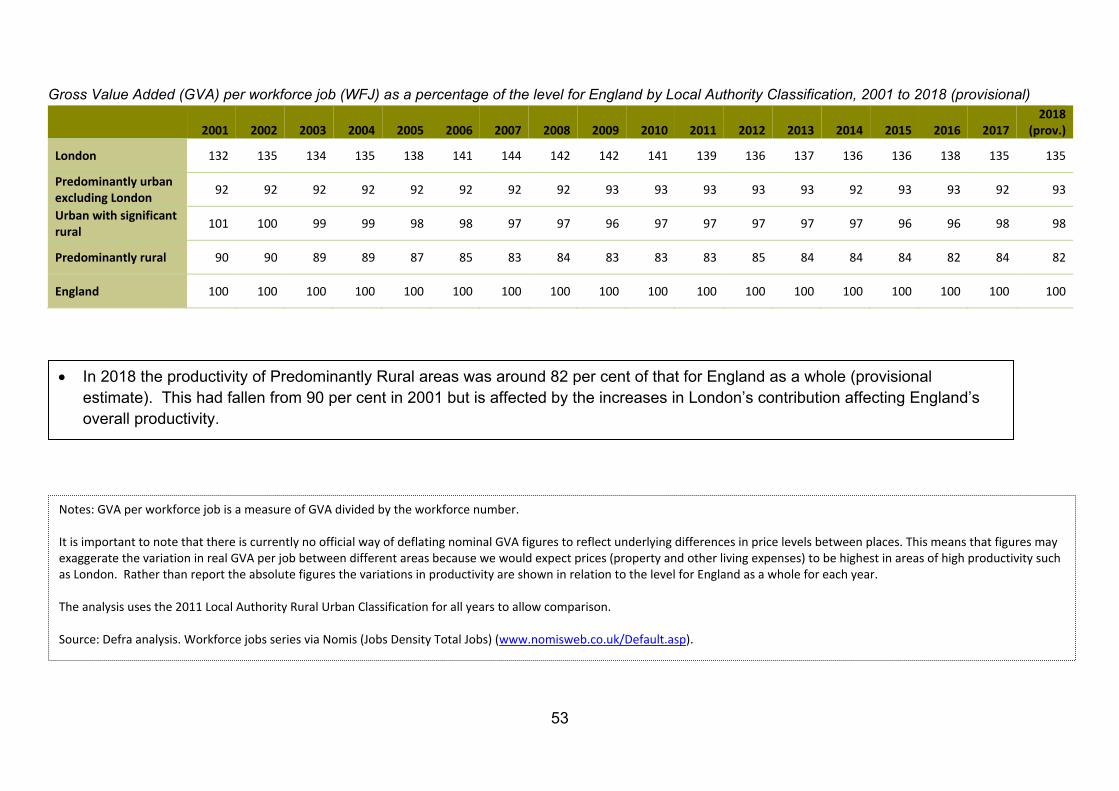
53
Gross Value Added (GVA) per workforce job (WFJ) as a percentage of the level for England by Local Authority Classification, 2001 to 2018 (provisional)
2001 2002 2003 2004 2005 2006 2007 2008 2009 2010 2011 2012 2013 2014 2015 2016 2017 2018
(prov.)
London 132 135 134 135 138 141 144 142 142 141 139 136 137 136 136 138 135 135
Predominantly urban excluding London 92 92 92 92 92 92 92 92 93 93 93 93 93 92 93 93 92 93
Urban with significant rural 101 100 99 99 98 98 97 97 96 97 97 97 97 97 96 96 98 98
Predominantly rural 90 90 89 89 87 85 83 84 83 83 83 85 84 84 84 82 84 82
England 100 100 100 100 100 100 100 100 100 100 100 100 100 100 100 100 100 100
• In 2018 the productivity of Predominantly Rural areas was around 82 per cent of that for England as a whole (provisional estimate). This had fallen from 90 per cent in 2001 but is affected by the increases in London’s contribution affecting England’s overall productivity.
Notes: GVA per workforce job is a measure of GVA divided by the workforce number. It is important to note that there is currently no official way of deflating nominal GVA figures to reflect underlying differences in price levels between places. This means that figures may exaggerate the variation in real GVA per job between different areas because we would expect prices (property and other living expenses) to be highest in areas of high productivity such as London. Rather than report the absolute figures the variations in productivity are shown in relation to the level for England as a whole for each year. The analysis uses the 2011 Local Authority Rural Urban Classification for all years to allow comparison. Source: Defra analysis. Workforce jobs series via Nomis (Jobs Density Total Jobs) (www.nomisweb.co.uk/Default.asp).
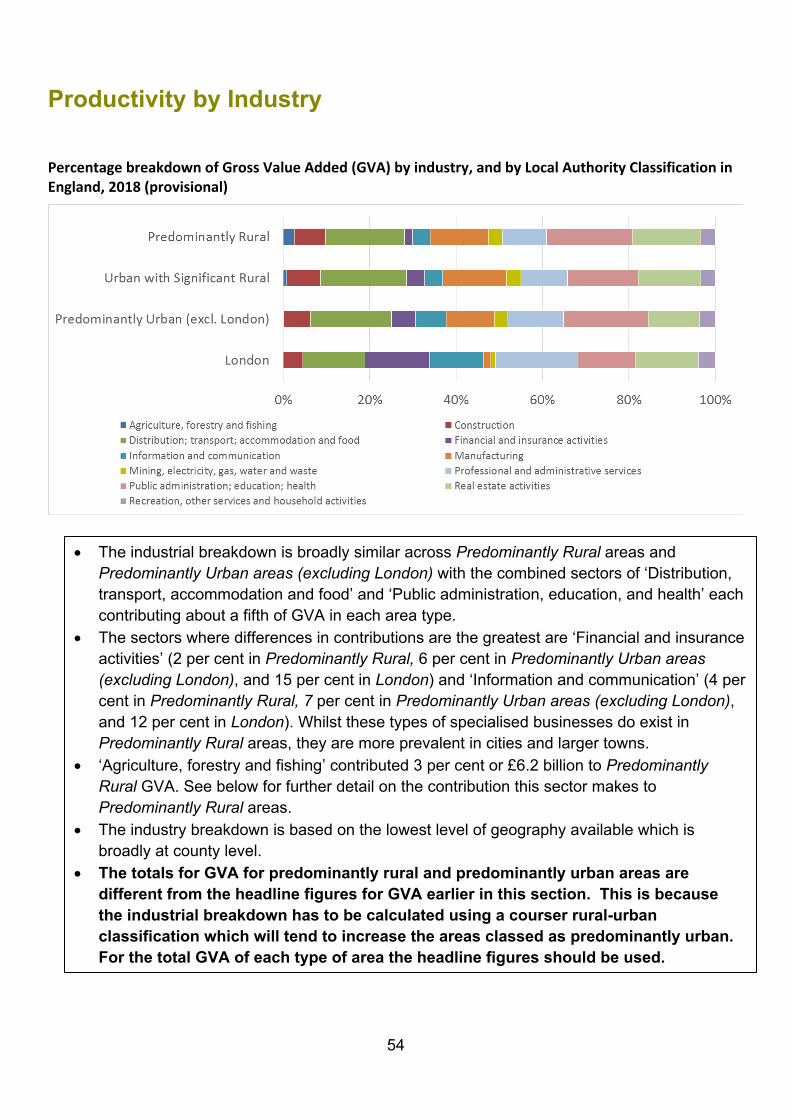
54
Productivity by Industry
Percentage breakdown of Gross Value Added (GVA) by industry, and by Local Authority Classification in England, 2018 (provisional)
• The industrial breakdown is broadly similar across Predominantly Rural areas and Predominantly Urban areas (excluding London) with the combined sectors of ‘Distribution, transport, accommodation and food’ and ‘Public administration, education, and health’ each contributing about a fifth of GVA in each area type.
• The sectors where differences in contributions are the greatest are ‘Financial and insurance activities’ (2 per cent in Predominantly Rural, 6 per cent in Predominantly Urban areas (excluding London), and 15 per cent in London) and ‘Information and communication’ (4 per cent in Predominantly Rural, 7 per cent in Predominantly Urban areas (excluding London), and 12 per cent in London). Whilst these types of specialised businesses do exist in Predominantly Rural areas, they are more prevalent in cities and larger towns.
• ‘Agriculture, forestry and fishing’ contributed 3 per cent or £6.2 billion to Predominantly Rural GVA. See below for further detail on the contribution this sector makes to Predominantly Rural areas.
• The industry breakdown is based on the lowest level of geography available which is broadly at county level.
• The totals for GVA for predominantly rural and predominantly urban areas are different from the headline figures for GVA earlier in this section. This is because the industrial breakdown has to be calculated using a courser rural-urban classification which will tend to increase the areas classed as predominantly urban. For the total GVA of each type of area the headline figures should be used.
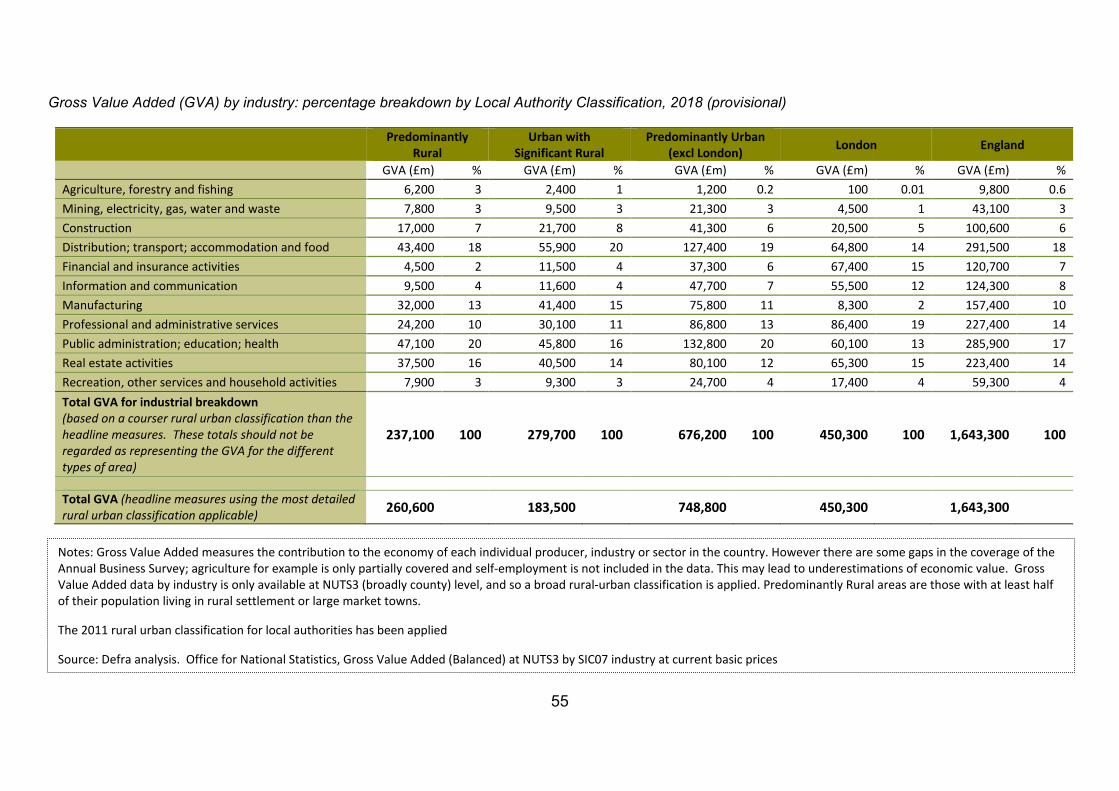
55
Gross Value Added (GVA) by industry: percentage breakdown by Local Authority Classification, 2018 (provisional)
Predominantly Rural
Urban with Significant Rural
Predominantly Urban (excl London) London England
GVA (£m) % GVA (£m) % GVA (£m) % GVA (£m) % GVA (£m) % Agriculture, forestry and fishing 6,200 3 2,400 1 1,200 0.2 100 0.01 9,800 0.6 Mining, electricity, gas, water and waste 7,800 3 9,500 3 21,300 3 4,500 1 43,100 3 Construction 17,000 7 21,700 8 41,300 6 20,500 5 100,600 6 Distribution; transport; accommodation and food 43,400 18 55,900 20 127,400 19 64,800 14 291,500 18 Financial and insurance activities 4,500 2 11,500 4 37,300 6 67,400 15 120,700 7 Information and communication 9,500 4 11,600 4 47,700 7 55,500 12 124,300 8 Manufacturing 32,000 13 41,400 15 75,800 11 8,300 2 157,400 10 Professional and administrative services 24,200 10 30,100 11 86,800 13 86,400 19 227,400 14 Public administration; education; health 47,100 20 45,800 16 132,800 20 60,100 13 285,900 17 Real estate activities 37,500 16 40,500 14 80,100 12 65,300 15 223,400 14 Recreation, other services and household activities 7,900 3 9,300 3 24,700 4 17,400 4 59,300 4 Total GVA for industrial breakdown (based on a courser rural urban classification than the headline measures. These totals should not be regarded as representing the GVA for the different types of area)
237,100 100 279,700 100 676,200 100 450,300 100 1,643,300 100
Total GVA (headline measures using the most detailed rural urban classification applicable) 260,600 183,500 748,800 450,300 1,643,300
Notes: Gross Value Added measures the contribution to the economy of each individual producer, industry or sector in the country. However there are some gaps in the coverage of the Annual Business Survey; agriculture for example is only partially covered and self-employment is not included in the data. This may lead to underestimations of economic value. Gross Value Added data by industry is only available at NUTS3 (broadly county) level, and so a broad rural-urban classification is applied. Predominantly Rural areas are those with at least half of their population living in rural settlement or large market towns. The 2011 rural urban classification for local authorities has been applied Source: Defra analysis. Office for National Statistics, Gross Value Added (Balanced) at NUTS3 by SIC07 industry at current basic prices

56
• In 2018 ‘Agriculture, forestry and fishing’ contributed 3 per cent or £6.2 billion to GVA in Predominantly Rural areas. The ‘Agriculture, forestry and fishing’ sector has previously been reported as contributing 2 per cent. This does not represent a genuine growth in these sectors, rather a change in methodology1 has resulted in a reallocation of GVA. The reallocation means that ‘Agriculture, forestry and fishing’ sectors account for around 3 per cent of the GVA in Predominantly rural areas since 2001 instead of the 2 per cent previously reported.
• The following chart and table show that sectoral contributions to GVA in Predominantly rural areas have changed very little since 2001. • Tables for Urban with significant rural, Predominantly urban (excluding London) and London can be found on our ‘Rural productivity and
Gross Value Added (GVA) statistics’ web page. Industry sector contribution to Gross Value Added (GVA) in Predominantly Rural areas only, 2001 to 2018
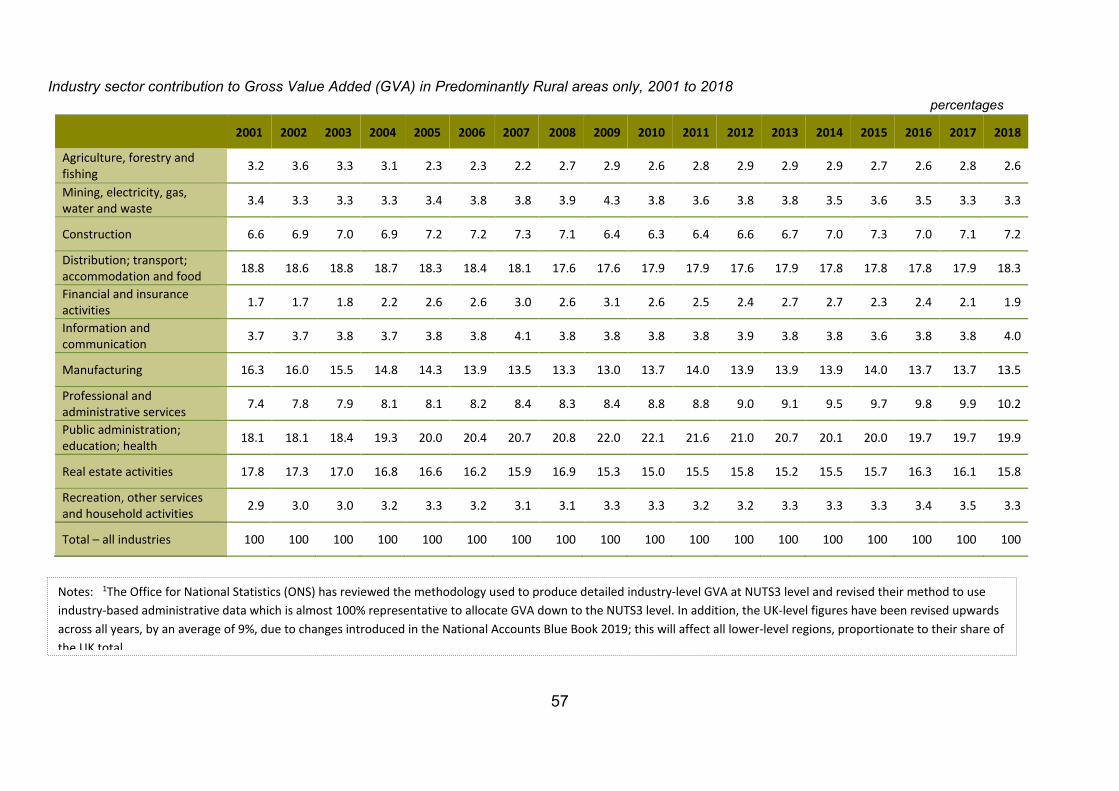
57
Industry sector contribution to Gross Value Added (GVA) in Predominantly Rural areas only, 2001 to 2018 percentages
2001 2002 2003 2004 2005 2006 2007 2008 2009 2010 2011 2012 2013 2014 2015 2016 2017 2018
Agriculture, forestry and fishing 3.2 3.6 3.3 3.1 2.3 2.3 2.2 2.7 2.9 2.6 2.8 2.9 2.9 2.9 2.7 2.6 2.8 2.6
Mining, electricity, gas, water and waste 3.4 3.3 3.3 3.3 3.4 3.8 3.8 3.9 4.3 3.8 3.6 3.8 3.8 3.5 3.6 3.5 3.3 3.3
Construction 6.6 6.9 7.0 6.9 7.2 7.2 7.3 7.1 6.4 6.3 6.4 6.6 6.7 7.0 7.3 7.0 7.1 7.2
Distribution; transport; accommodation and food 18.8 18.6 18.8 18.7 18.3 18.4 18.1 17.6 17.6 17.9 17.9 17.6 17.9 17.8 17.8 17.8 17.9 18.3
Financial and insurance activities 1.7 1.7 1.8 2.2 2.6 2.6 3.0 2.6 3.1 2.6 2.5 2.4 2.7 2.7 2.3 2.4 2.1 1.9
Information and communication 3.7 3.7 3.8 3.7 3.8 3.8 4.1 3.8 3.8 3.8 3.8 3.9 3.8 3.8 3.6 3.8 3.8 4.0
Manufacturing 16.3 16.0 15.5 14.8 14.3 13.9 13.5 13.3 13.0 13.7 14.0 13.9 13.9 13.9 14.0 13.7 13.7 13.5
Professional and administrative services 7.4 7.8 7.9 8.1 8.1 8.2 8.4 8.3 8.4 8.8 8.8 9.0 9.1 9.5 9.7 9.8 9.9 10.2
Public administration; education; health 18.1 18.1 18.4 19.3 20.0 20.4 20.7 20.8 22.0 22.1 21.6 21.0 20.7 20.1 20.0 19.7 19.7 19.9
Real estate activities 17.8 17.3 17.0 16.8 16.6 16.2 15.9 16.9 15.3 15.0 15.5 15.8 15.2 15.5 15.7 16.3 16.1 15.8
Recreation, other services and household activities 2.9 3.0 3.0 3.2 3.3 3.2 3.1 3.1 3.3 3.3 3.2 3.2 3.3 3.3 3.3 3.4 3.5 3.3
Total – all industries 100 100 100 100 100 100 100 100 100 100 100 100 100 100 100 100 100 100
Notes: 1The Office for National Statistics (ONS) has reviewed the methodology used to produce detailed industry-level GVA at NUTS3 level and revised their method to use industry-based administrative data which is almost 100% representative to allocate GVA down to the NUTS3 level. In addition, the UK-level figures have been revised upwards across all years, by an average of 9%, due to changes introduced in the National Accounts Blue Book 2019; this will affect all lower-level regions, proportionate to their share of the UK total.
58
Businesses
Business composition Important note: ‘Business composition’ is based on Enterprises, which is the level at which businesses are registered for Value Added Tax and or PAYE. In the case of a business operating at only one address, it will be registered at that address, but for businesses operating in several locations, it will be the location of the headquarters that is registered. If a business has branches in rural areas, but the headquarters are registered within an urban area, then the statistics for all the outlets will be registered at the headquarters, and not counted as “rural”. The later sections on ‘Businesses by industry type’, ‘Employment by industry type’ and ‘Businesses by size band’ are based on Local Unit data, which distinguishes the location of branches.
• In 2019/20 there were 551,000 businesses registered in rural areas, accounting for 23 per cent of all registered businesses in England.
• Businesses registered in rural areas employed 3.7 million people, accounting for 13 per cent of all those employed by registered businesses in England.
• There are more registered businesses per head of population in predominantly rural areas than in predominantly urban areas (excluding London).
• There are proportionately more small businesses in rural areas. • In 2019 there were 56 registered business start-ups per 10,000 population in predominantly
urban areas (excluding London) compared with 45 per 10,000 population in predominantly rural areas.
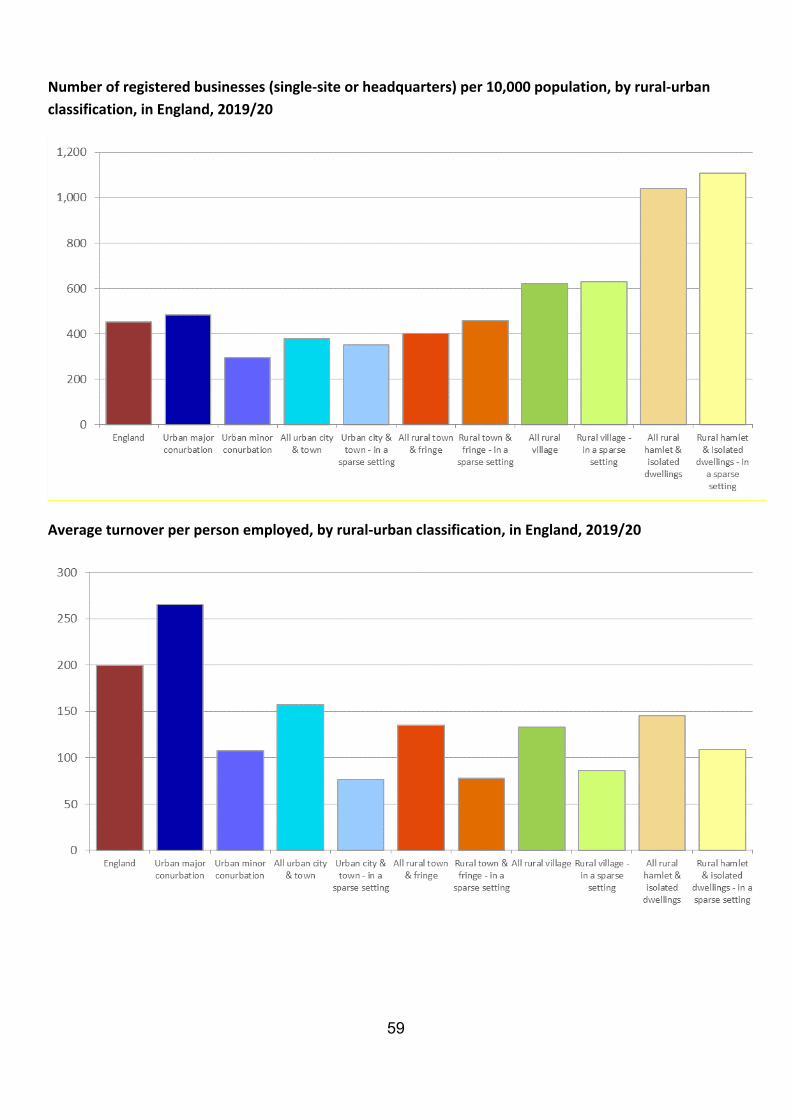
59
Number of registered businesses (single-site or headquarters) per 10,000 population, by rural-urban classification, in England, 2019/20
Average turnover per person employed, by rural-urban classification, in England, 2019/20
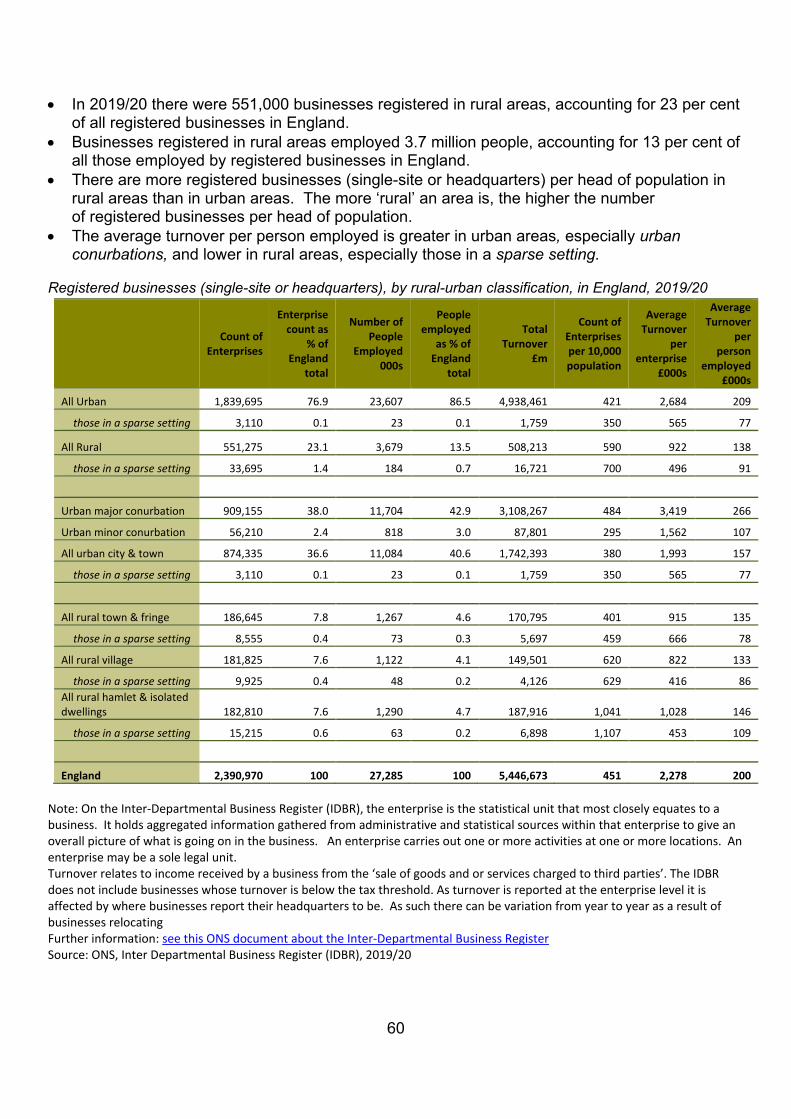
60
• In 2019/20 there were 551,000 businesses registered in rural areas, accounting for 23 per cent
of all registered businesses in England. • Businesses registered in rural areas employed 3.7 million people, accounting for 13 per cent of
all those employed by registered businesses in England. • There are more registered businesses (single-site or headquarters) per head of population in
rural areas than in urban areas. The more ‘rural’ an area is, the higher the number of registered businesses per head of population.
• The average turnover per person employed is greater in urban areas, especially urban conurbations, and lower in rural areas, especially those in a sparse setting.
Registered businesses (single-site or headquarters), by rural-urban classification, in England, 2019/20
Count of Enterprises
Enterprise count as
% of England
total
Number of People
Employed 000s
People employed
as % of England
total
Total Turnover
£m
Count of Enterprises per 10,000 population
Average Turnover
per enterprise
£000s
Average Turnover
per person
employed £000s
All Urban 1,839,695 76.9 23,607 86.5 4,938,461 421 2,684 209
those in a sparse setting 3,110 0.1 23 0.1 1,759 350 565 77
All Rural 551,275 23.1 3,679 13.5 508,213 590 922 138
those in a sparse setting 33,695 1.4 184 0.7 16,721 700 496 91
Urban major conurbation 909,155 38.0 11,704 42.9 3,108,267 484 3,419 266
Urban minor conurbation 56,210 2.4 818 3.0 87,801 295 1,562 107
All urban city & town 874,335 36.6 11,084 40.6 1,742,393 380 1,993 157
those in a sparse setting 3,110 0.1 23 0.1 1,759 350 565 77
All rural town & fringe 186,645 7.8 1,267 4.6 170,795 401 915 135
those in a sparse setting 8,555 0.4 73 0.3 5,697 459 666 78
All rural village 181,825 7.6 1,122 4.1 149,501 620 822 133
those in a sparse setting 9,925 0.4 48 0.2 4,126 629 416 86 All rural hamlet & isolated dwellings 182,810 7.6 1,290 4.7 187,916 1,041 1,028 146
those in a sparse setting 15,215 0.6 63 0.2 6,898 1,107 453 109
England 2,390,970 100 27,285 100 5,446,673 451 2,278 200 Note: On the Inter-Departmental Business Register (IDBR), the enterprise is the statistical unit that most closely equates to a business. It holds aggregated information gathered from administrative and statistical sources within that enterprise to give an overall picture of what is going on in the business. An enterprise carries out one or more activities at one or more locations. An enterprise may be a sole legal unit. Turnover relates to income received by a business from the ‘sale of goods and or services charged to third parties’. The IDBR does not include businesses whose turnover is below the tax threshold. As turnover is reported at the enterprise level it is affected by where businesses report their headquarters to be. As such there can be variation from year to year as a result of businesses relocating Further information: see this ONS document about the Inter-Departmental Business Register Source: ONS, Inter Departmental Business Register (IDBR), 2019/20
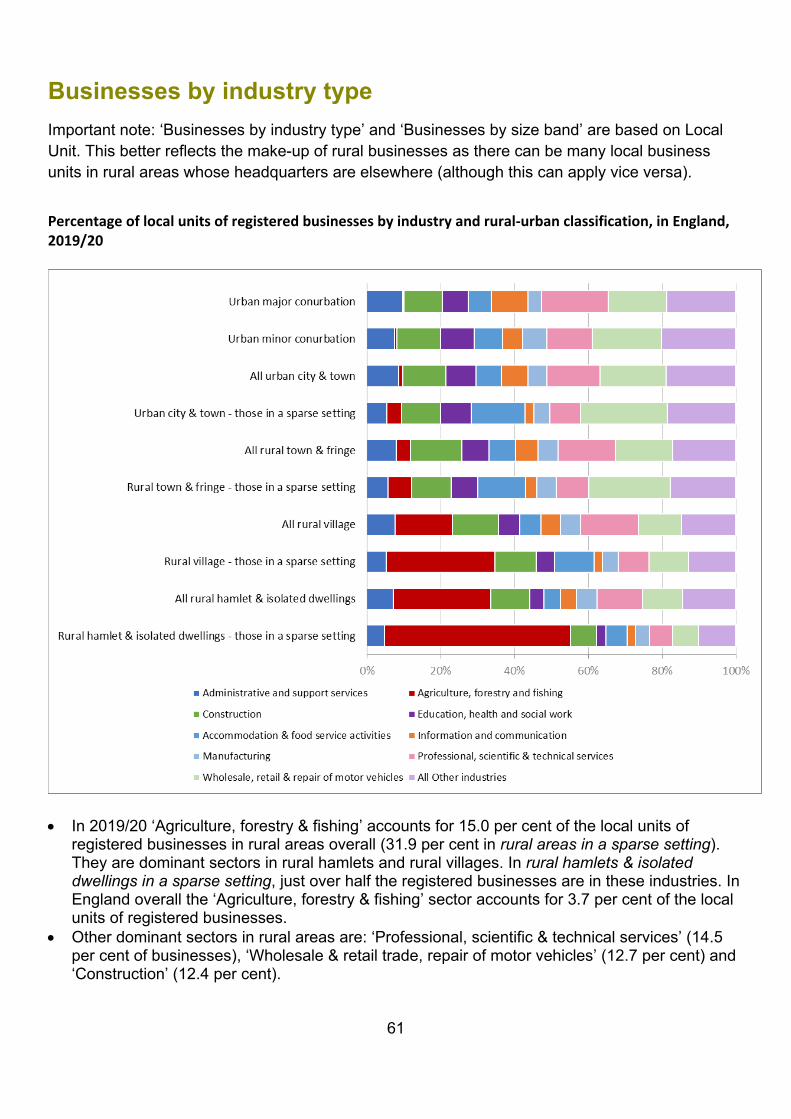
61
Businesses by industry type Important note: ‘Businesses by industry type’ and ‘Businesses by size band’ are based on Local Unit. This better reflects the make-up of rural businesses as there can be many local business units in rural areas whose headquarters are elsewhere (although this can apply vice versa).
Percentage of local units of registered businesses by industry and rural-urban classification, in England, 2019/20
• In 2019/20 ‘Agriculture, forestry & fishing’ accounts for 15.0 per cent of the local units of
registered businesses in rural areas overall (31.9 per cent in rural areas in a sparse setting). They are dominant sectors in rural hamlets and rural villages. In rural hamlets & isolated dwellings in a sparse setting, just over half the registered businesses are in these industries. In England overall the ‘Agriculture, forestry & fishing’ sector accounts for 3.7 per cent of the local units of registered businesses.
• Other dominant sectors in rural areas are: ‘Professional, scientific & technical services’ (14.5 per cent of businesses), ‘Wholesale & retail trade, repair of motor vehicles’ (12.7 per cent) and ‘Construction’ (12.4 per cent).
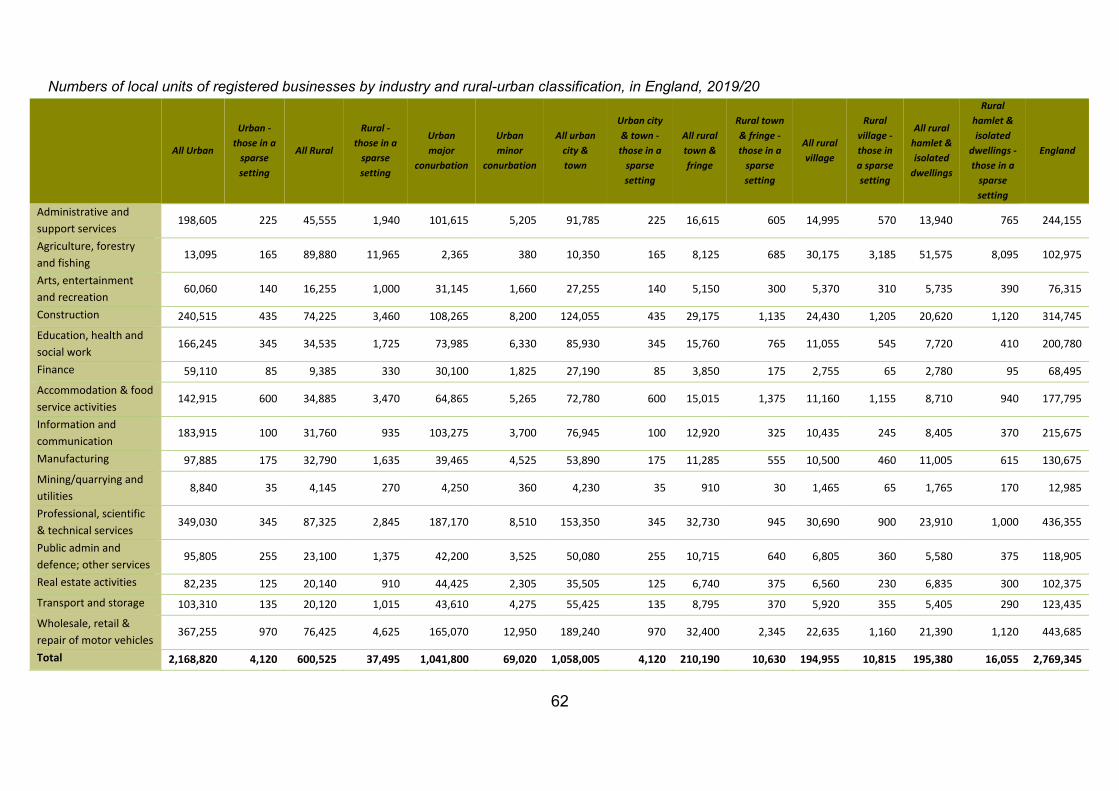
62
Numbers of local units of registered businesses by industry and rural-urban classification, in England, 2019/20
All Urban
Urban - those in a
sparse setting
All Rural
Rural - those in a
sparse setting
Urban major
conurbation
Urban minor
conurbation
All urban city & town
Urban city & town - those in a
sparse setting
All rural town & fringe
Rural town & fringe - those in a
sparse setting
All rural village
Rural village - those in a sparse setting
All rural hamlet & isolated
dwellings
Rural hamlet & isolated
dwellings - those in a
sparse setting
England
Administrative and support services
198,605 225 45,555 1,940 101,615 5,205 91,785 225 16,615 605 14,995 570 13,940 765 244,155
Agriculture, forestry and fishing
13,095 165 89,880 11,965 2,365 380 10,350 165 8,125 685 30,175 3,185 51,575 8,095 102,975
Arts, entertainment and recreation
60,060 140 16,255 1,000 31,145 1,660 27,255 140 5,150 300 5,370 310 5,735 390 76,315
Construction 240,515 435 74,225 3,460 108,265 8,200 124,055 435 29,175 1,135 24,430 1,205 20,620 1,120 314,745
Education, health and social work
166,245 345 34,535 1,725 73,985 6,330 85,930 345 15,760 765 11,055 545 7,720 410 200,780
Finance 59,110 85 9,385 330 30,100 1,825 27,190 85 3,850 175 2,755 65 2,780 95 68,495
Accommodation & food service activities
142,915 600 34,885 3,470 64,865 5,265 72,780 600 15,015 1,375 11,160 1,155 8,710 940 177,795
Information and communication
183,915 100 31,760 935 103,275 3,700 76,945 100 12,920 325 10,435 245 8,405 370 215,675
Manufacturing 97,885 175 32,790 1,635 39,465 4,525 53,890 175 11,285 555 10,500 460 11,005 615 130,675
Mining/quarrying and utilities
8,840 35 4,145 270 4,250 360 4,230 35 910 30 1,465 65 1,765 170 12,985
Professional, scientific & technical services
349,030 345 87,325 2,845 187,170 8,510 153,350 345 32,730 945 30,690 900 23,910 1,000 436,355
Public admin and defence; other services
95,805 255 23,100 1,375 42,200 3,525 50,080 255 10,715 640 6,805 360 5,580 375 118,905
Real estate activities 82,235 125 20,140 910 44,425 2,305 35,505 125 6,740 375 6,560 230 6,835 300 102,375
Transport and storage 103,310 135 20,120 1,015 43,610 4,275 55,425 135 8,795 370 5,920 355 5,405 290 123,435
Wholesale, retail & repair of motor vehicles
367,255 970 76,425 4,625 165,070 12,950 189,240 970 32,400 2,345 22,635 1,160 21,390 1,120 443,685
Total 2,168,820 4,120 600,525 37,495 1,041,800 69,020 1,058,005 4,120 210,190 10,630 194,955 10,815 195,380 16,055 2,769,345
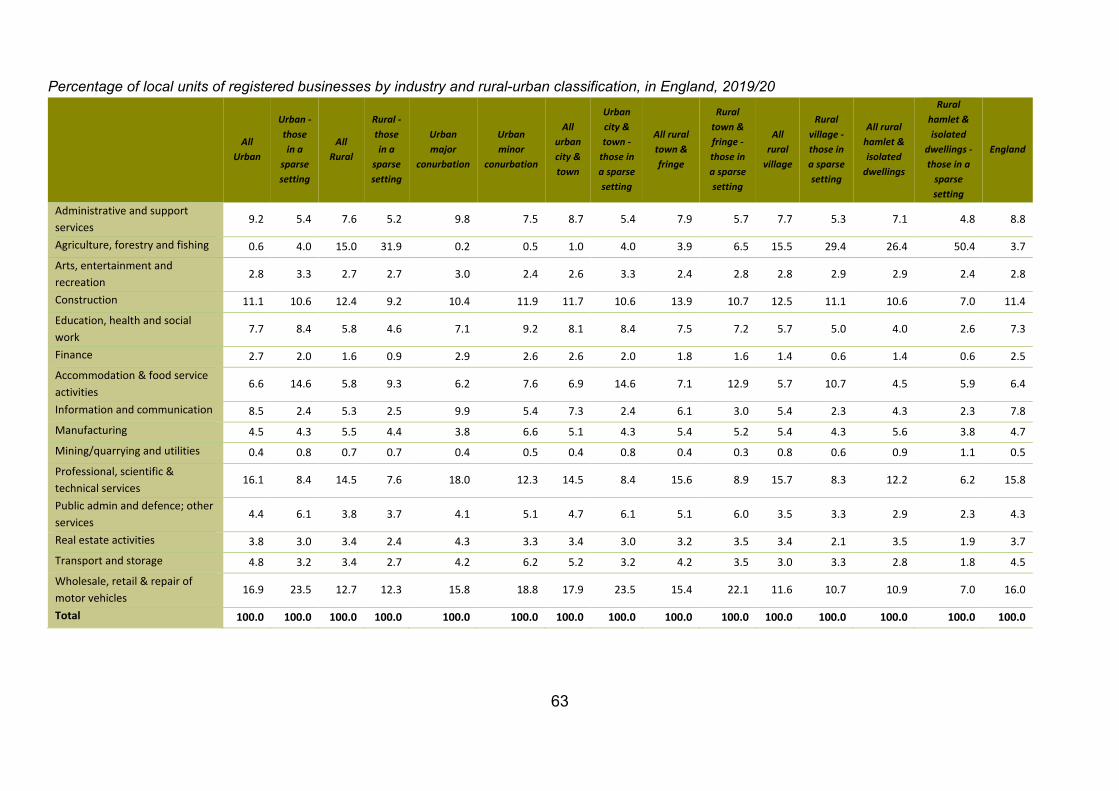
63
Percentage of local units of registered businesses by industry and rural-urban classification, in England, 2019/20
All Urban
Urban - those in a
sparse setting
All Rural
Rural - those in a
sparse setting
Urban major
conurbation
Urban minor
conurbation
All urban city & town
Urban city & town -
those in a sparse setting
All rural town & fringe
Rural town & fringe - those in a sparse setting
All rural
village
Rural village - those in a sparse setting
All rural hamlet & isolated
dwellings
Rural hamlet & isolated
dwellings - those in a
sparse setting
England
Administrative and support services
9.2 5.4 7.6 5.2 9.8 7.5 8.7 5.4 7.9 5.7 7.7 5.3 7.1 4.8 8.8
Agriculture, forestry and fishing 0.6 4.0 15.0 31.9 0.2 0.5 1.0 4.0 3.9 6.5 15.5 29.4 26.4 50.4 3.7
Arts, entertainment and recreation
2.8 3.3 2.7 2.7 3.0 2.4 2.6 3.3 2.4 2.8 2.8 2.9 2.9 2.4 2.8
Construction 11.1 10.6 12.4 9.2 10.4 11.9 11.7 10.6 13.9 10.7 12.5 11.1 10.6 7.0 11.4
Education, health and social work
7.7 8.4 5.8 4.6 7.1 9.2 8.1 8.4 7.5 7.2 5.7 5.0 4.0 2.6 7.3
Finance 2.7 2.0 1.6 0.9 2.9 2.6 2.6 2.0 1.8 1.6 1.4 0.6 1.4 0.6 2.5
Accommodation & food service activities
6.6 14.6 5.8 9.3 6.2 7.6 6.9 14.6 7.1 12.9 5.7 10.7 4.5 5.9 6.4
Information and communication 8.5 2.4 5.3 2.5 9.9 5.4 7.3 2.4 6.1 3.0 5.4 2.3 4.3 2.3 7.8
Manufacturing 4.5 4.3 5.5 4.4 3.8 6.6 5.1 4.3 5.4 5.2 5.4 4.3 5.6 3.8 4.7
Mining/quarrying and utilities 0.4 0.8 0.7 0.7 0.4 0.5 0.4 0.8 0.4 0.3 0.8 0.6 0.9 1.1 0.5
Professional, scientific & technical services
16.1 8.4 14.5 7.6 18.0 12.3 14.5 8.4 15.6 8.9 15.7 8.3 12.2 6.2 15.8
Public admin and defence; other services
4.4 6.1 3.8 3.7 4.1 5.1 4.7 6.1 5.1 6.0 3.5 3.3 2.9 2.3 4.3
Real estate activities 3.8 3.0 3.4 2.4 4.3 3.3 3.4 3.0 3.2 3.5 3.4 2.1 3.5 1.9 3.7
Transport and storage 4.8 3.2 3.4 2.7 4.2 6.2 5.2 3.2 4.2 3.5 3.0 3.3 2.8 1.8 4.5
Wholesale, retail & repair of motor vehicles
16.9 23.5 12.7 12.3 15.8 18.8 17.9 23.5 15.4 22.1 11.6 10.7 10.9 7.0 16.0
Total 100.0 100.0 100.0 100.0 100.0 100.0 100.0 100.0 100.0 100.0 100.0 100.0 100.0 100.0 100.0
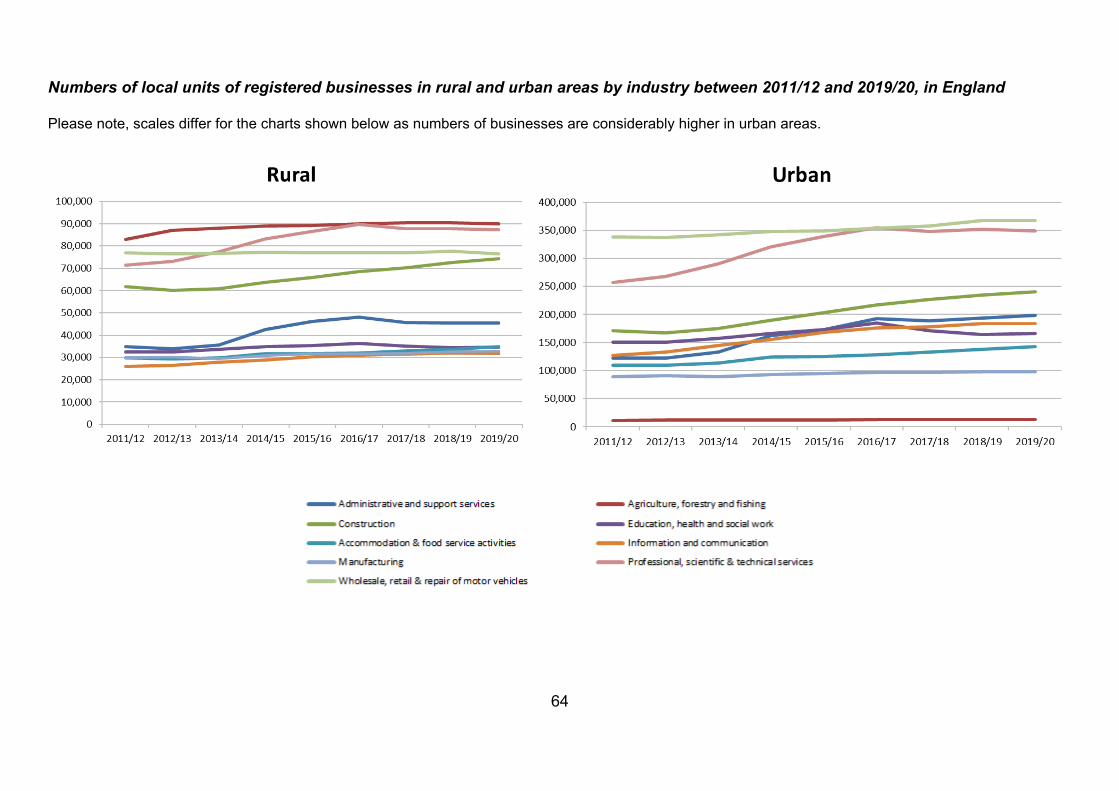
64
Numbers of local units of registered businesses in rural and urban areas by industry between 2011/12 and 2019/20, in England
Please note, scales differ for the charts shown below as numbers of businesses are considerably higher in urban areas.
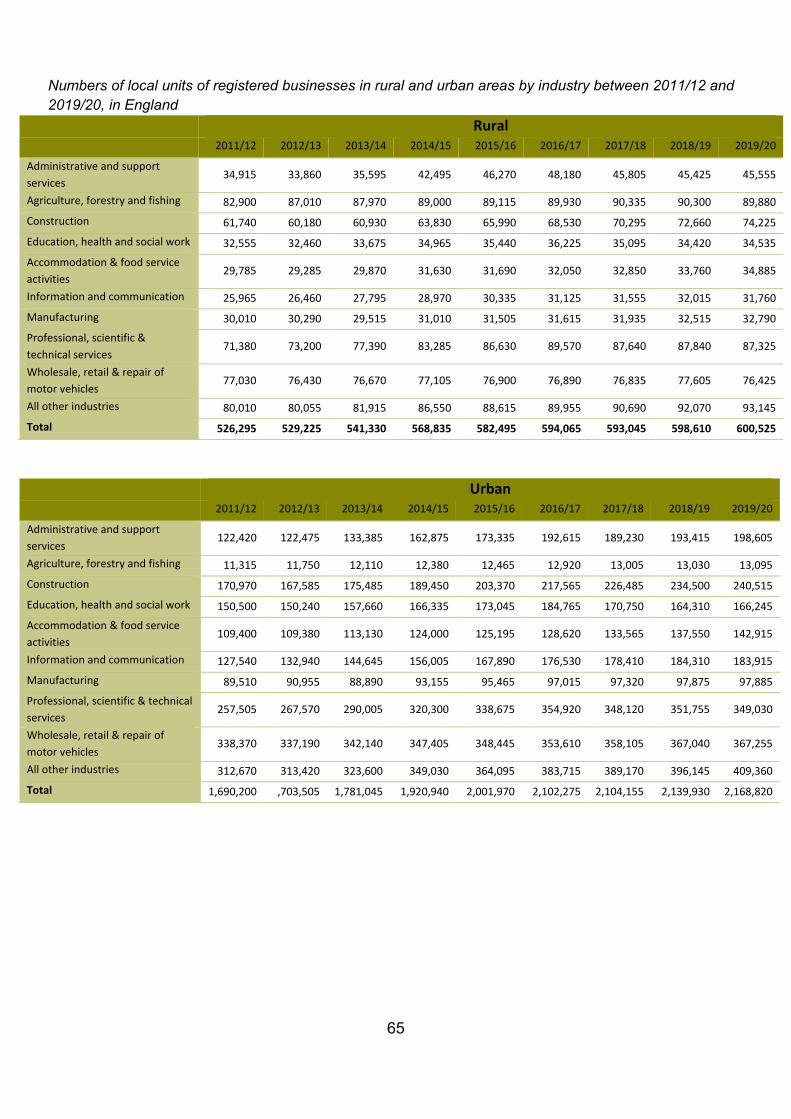
65
Numbers of local units of registered businesses in rural and urban areas by industry between 2011/12 and 2019/20, in England
Rural 2011/12 2012/13 2013/14 2014/15 2015/16 2016/17 2017/18 2018/19 2019/20
Administrative and support services
34,915 33,860 35,595 42,495 46,270 48,180 45,805 45,425 45,555
Agriculture, forestry and fishing 82,900 87,010 87,970 89,000 89,115 89,930 90,335 90,300 89,880
Construction 61,740 60,180 60,930 63,830 65,990 68,530 70,295 72,660 74,225
Education, health and social work 32,555 32,460 33,675 34,965 35,440 36,225 35,095 34,420 34,535
Accommodation & food service activities
29,785 29,285 29,870 31,630 31,690 32,050 32,850 33,760 34,885
Information and communication 25,965 26,460 27,795 28,970 30,335 31,125 31,555 32,015 31,760
Manufacturing 30,010 30,290 29,515 31,010 31,505 31,615 31,935 32,515 32,790
Professional, scientific & technical services
71,380 73,200 77,390 83,285 86,630 89,570 87,640 87,840 87,325
Wholesale, retail & repair of motor vehicles
77,030 76,430 76,670 77,105 76,900 76,890 76,835 77,605 76,425
All other industries 80,010 80,055 81,915 86,550 88,615 89,955 90,690 92,070 93,145
Total 526,295 529,225 541,330 568,835 582,495 594,065 593,045 598,610 600,525
Urban 2011/12 2012/13 2013/14 2014/15 2015/16 2016/17 2017/18 2018/19 2019/20
Administrative and support services
122,420 122,475 133,385 162,875 173,335 192,615 189,230 193,415 198,605
Agriculture, forestry and fishing 11,315 11,750 12,110 12,380 12,465 12,920 13,005 13,030 13,095
Construction 170,970 167,585 175,485 189,450 203,370 217,565 226,485 234,500 240,515
Education, health and social work 150,500 150,240 157,660 166,335 173,045 184,765 170,750 164,310 166,245
Accommodation & food service activities
109,400 109,380 113,130 124,000 125,195 128,620 133,565 137,550 142,915
Information and communication 127,540 132,940 144,645 156,005 167,890 176,530 178,410 184,310 183,915
Manufacturing 89,510 90,955 88,890 93,155 95,465 97,015 97,320 97,875 97,885
Professional, scientific & technical services
257,505 267,570 290,005 320,300 338,675 354,920 348,120 351,755 349,030
Wholesale, retail & repair of motor vehicles
338,370 337,190 342,140 347,405 348,445 353,610 358,105 367,040 367,255
All other industries 312,670 313,420 323,600 349,030 364,095 383,715 389,170 396,145 409,360
Total 1,690,200 ,703,505 1,781,045 1,920,940 2,001,970 2,102,275 2,104,155 2,139,930 2,168,820
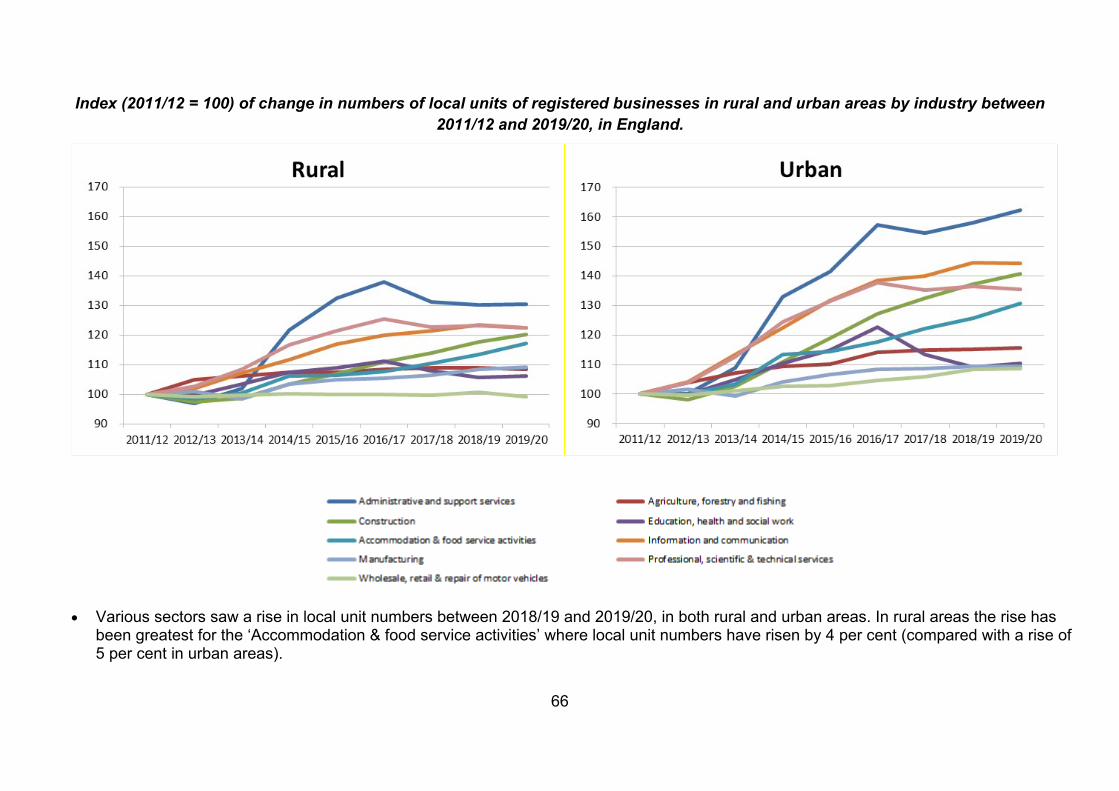
66
Index (2011/12 = 100) of change in numbers of local units of registered businesses in rural and urban areas by industry between 2011/12 and 2019/20, in England.
• Various sectors saw a rise in local unit numbers between 2018/19 and 2019/20, in both rural and urban areas. In rural areas the rise has
been greatest for the ‘Accommodation & food service activities’ where local unit numbers have risen by 4 per cent (compared with a rise of 5 per cent in urban areas).
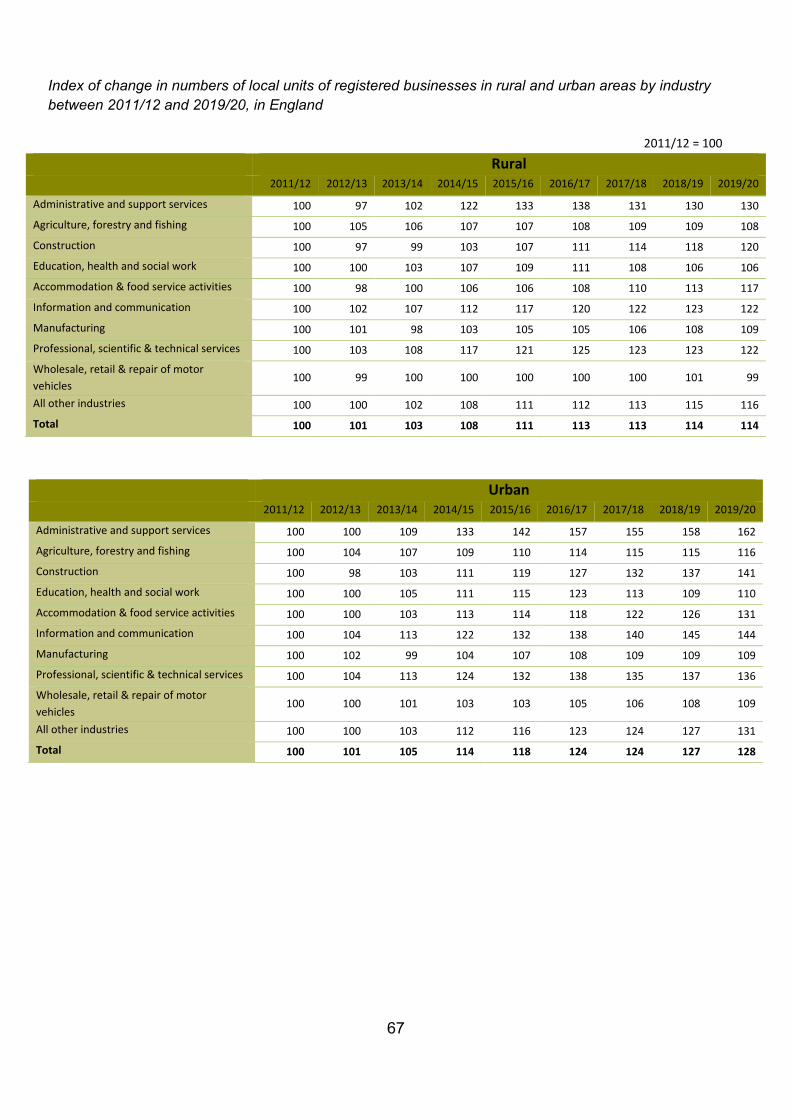
67
Index of change in numbers of local units of registered businesses in rural and urban areas by industry between 2011/12 and 2019/20, in England
2011/12 = 100
Rural 2011/12 2012/13 2013/14 2014/15 2015/16 2016/17 2017/18 2018/19 2019/20
Administrative and support services 100 97 102 122 133 138 131 130 130
Agriculture, forestry and fishing 100 105 106 107 107 108 109 109 108
Construction 100 97 99 103 107 111 114 118 120
Education, health and social work 100 100 103 107 109 111 108 106 106
Accommodation & food service activities 100 98 100 106 106 108 110 113 117
Information and communication 100 102 107 112 117 120 122 123 122
Manufacturing 100 101 98 103 105 105 106 108 109
Professional, scientific & technical services 100 103 108 117 121 125 123 123 122
Wholesale, retail & repair of motor vehicles
100 99 100 100 100 100 100 101 99
All other industries 100 100 102 108 111 112 113 115 116
Total 100 101 103 108 111 113 113 114 114
Urban 2011/12 2012/13 2013/14 2014/15 2015/16 2016/17 2017/18 2018/19 2019/20
Administrative and support services 100 100 109 133 142 157 155 158 162
Agriculture, forestry and fishing 100 104 107 109 110 114 115 115 116
Construction 100 98 103 111 119 127 132 137 141
Education, health and social work 100 100 105 111 115 123 113 109 110
Accommodation & food service activities 100 100 103 113 114 118 122 126 131
Information and communication 100 104 113 122 132 138 140 145 144
Manufacturing 100 102 99 104 107 108 109 109 109
Professional, scientific & technical services 100 104 113 124 132 138 135 137 136
Wholesale, retail & repair of motor vehicles
100 100 101 103 103 105 106 108 109
All other industries 100 100 103 112 116 123 124 127 131
Total 100 101 105 114 118 124 124 127 128
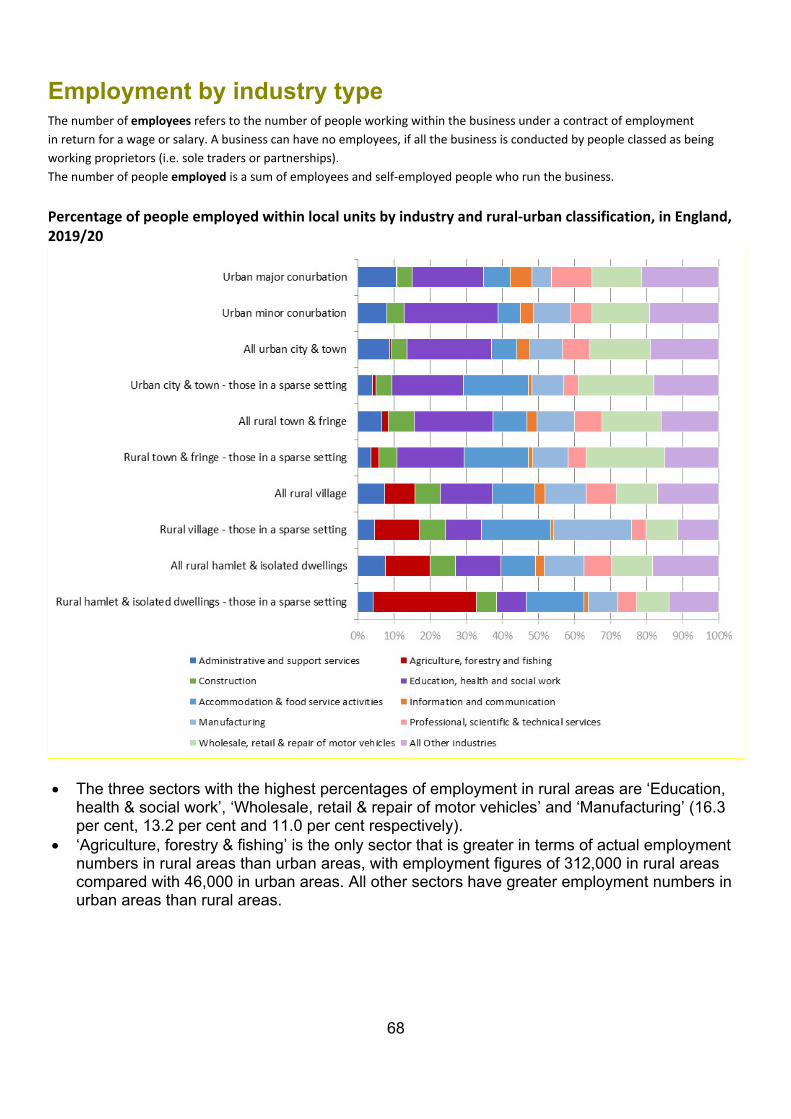
68
Employment by industry type The number of employees refers to the number of people working within the business under a contract of employment in return for a wage or salary. A business can have no employees, if all the business is conducted by people classed as being working proprietors (i.e. sole traders or partnerships). The number of people employed is a sum of employees and self-employed people who run the business.
Percentage of people employed within local units by industry and rural-urban classification, in England, 2019/20
• The three sectors with the highest percentages of employment in rural areas are ‘Education,
health & social work’, ‘Wholesale, retail & repair of motor vehicles’ and ‘Manufacturing’ (16.3 per cent, 13.2 per cent and 11.0 per cent respectively).
• ‘Agriculture, forestry & fishing’ is the only sector that is greater in terms of actual employment numbers in rural areas than urban areas, with employment figures of 312,000 in rural areas compared with 46,000 in urban areas. All other sectors have greater employment numbers in urban areas than rural areas.
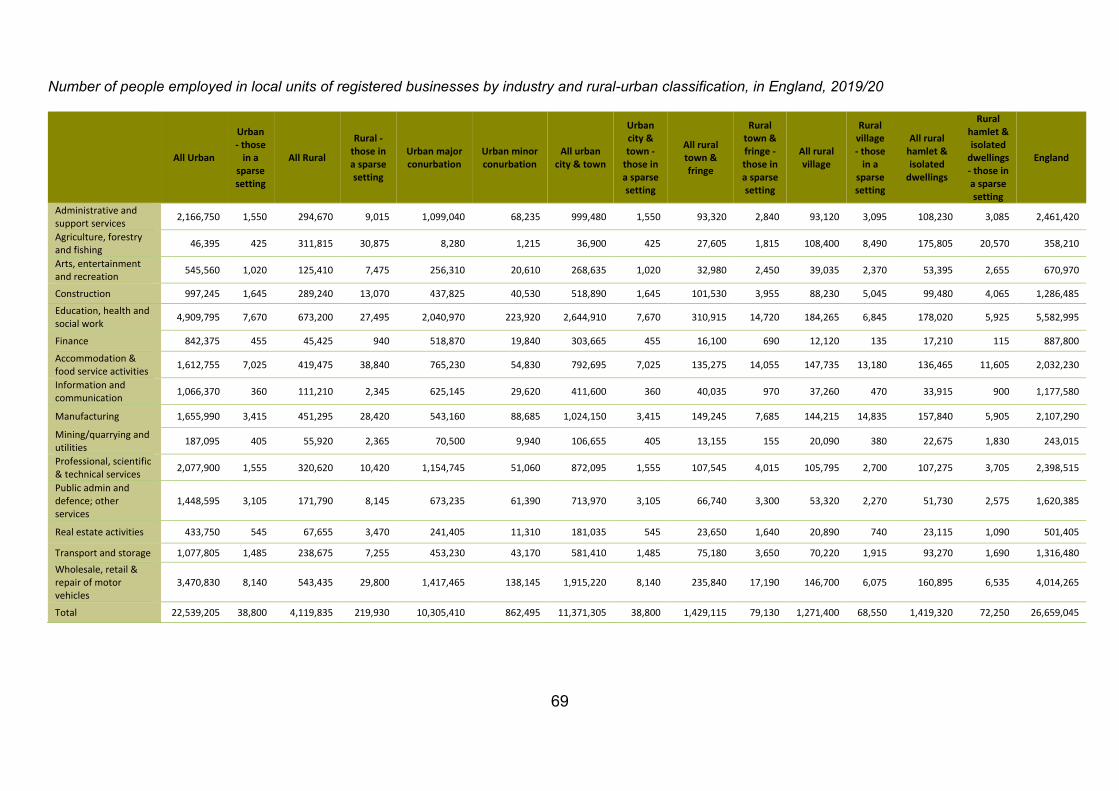
69
Number of people employed in local units of registered businesses by industry and rural-urban classification, in England, 2019/20
All Urban
Urban - those
in a sparse setting
All Rural
Rural - those in a sparse setting
Urban major conurbation
Urban minor conurbation
All urban city & town
Urban city & town -
those in a sparse setting
All rural town & fringe
Rural town & fringe - those in a sparse setting
All rural village
Rural village - those
in a sparse setting
All rural hamlet & isolated
dwellings
Rural hamlet & isolated
dwellings - those in a sparse setting
England
Administrative and support services 2,166,750 1,550 294,670 9,015 1,099,040 68,235 999,480 1,550 93,320 2,840 93,120 3,095 108,230 3,085 2,461,420
Agriculture, forestry and fishing 46,395 425 311,815 30,875 8,280 1,215 36,900 425 27,605 1,815 108,400 8,490 175,805 20,570 358,210
Arts, entertainment and recreation 545,560 1,020 125,410 7,475 256,310 20,610 268,635 1,020 32,980 2,450 39,035 2,370 53,395 2,655 670,970
Construction 997,245 1,645 289,240 13,070 437,825 40,530 518,890 1,645 101,530 3,955 88,230 5,045 99,480 4,065 1,286,485
Education, health and social work 4,909,795 7,670 673,200 27,495 2,040,970 223,920 2,644,910 7,670 310,915 14,720 184,265 6,845 178,020 5,925 5,582,995
Finance 842,375 455 45,425 940 518,870 19,840 303,665 455 16,100 690 12,120 135 17,210 115 887,800
Accommodation & food service activities 1,612,755 7,025 419,475 38,840 765,230 54,830 792,695 7,025 135,275 14,055 147,735 13,180 136,465 11,605 2,032,230
Information and communication 1,066,370 360 111,210 2,345 625,145 29,620 411,600 360 40,035 970 37,260 470 33,915 900 1,177,580
Manufacturing 1,655,990 3,415 451,295 28,420 543,160 88,685 1,024,150 3,415 149,245 7,685 144,215 14,835 157,840 5,905 2,107,290
Mining/quarrying and utilities 187,095 405 55,920 2,365 70,500 9,940 106,655 405 13,155 155 20,090 380 22,675 1,830 243,015
Professional, scientific & technical services 2,077,900 1,555 320,620 10,420 1,154,745 51,060 872,095 1,555 107,545 4,015 105,795 2,700 107,275 3,705 2,398,515
Public admin and defence; other services
1,448,595 3,105 171,790 8,145 673,235 61,390 713,970 3,105 66,740 3,300 53,320 2,270 51,730 2,575 1,620,385
Real estate activities 433,750 545 67,655 3,470 241,405 11,310 181,035 545 23,650 1,640 20,890 740 23,115 1,090 501,405
Transport and storage 1,077,805 1,485 238,675 7,255 453,230 43,170 581,410 1,485 75,180 3,650 70,220 1,915 93,270 1,690 1,316,480 Wholesale, retail & repair of motor vehicles
3,470,830 8,140 543,435 29,800 1,417,465 138,145 1,915,220 8,140 235,840 17,190 146,700 6,075 160,895 6,535 4,014,265
Total 22,539,205 38,800 4,119,835 219,930 10,305,410 862,495 11,371,305 38,800 1,429,115 79,130 1,271,400 68,550 1,419,320 72,250 26,659,045
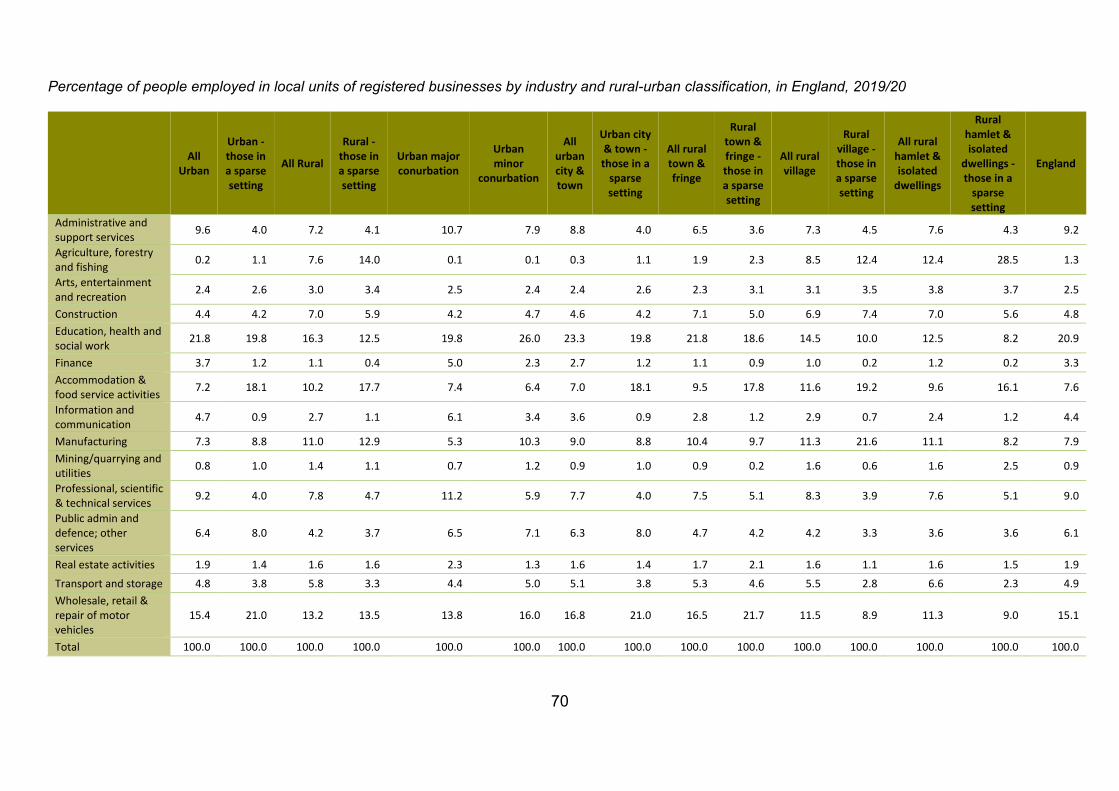
70
Percentage of people employed in local units of registered businesses by industry and rural-urban classification, in England, 2019/20
All Urban
Urban - those in a sparse setting
All Rural
Rural - those in a sparse setting
Urban major conurbation
Urban minor
conurbation
All urban city & town
Urban city & town - those in a
sparse setting
All rural town & fringe
Rural town & fringe - those in a sparse setting
All rural village
Rural village - those in a sparse setting
All rural hamlet & isolated
dwellings
Rural hamlet & isolated
dwellings - those in a
sparse setting
England
Administrative and support services 9.6 4.0 7.2 4.1 10.7 7.9 8.8 4.0 6.5 3.6 7.3 4.5 7.6 4.3 9.2
Agriculture, forestry and fishing 0.2 1.1 7.6 14.0 0.1 0.1 0.3 1.1 1.9 2.3 8.5 12.4 12.4 28.5 1.3
Arts, entertainment and recreation 2.4 2.6 3.0 3.4 2.5 2.4 2.4 2.6 2.3 3.1 3.1 3.5 3.8 3.7 2.5
Construction 4.4 4.2 7.0 5.9 4.2 4.7 4.6 4.2 7.1 5.0 6.9 7.4 7.0 5.6 4.8 Education, health and social work 21.8 19.8 16.3 12.5 19.8 26.0 23.3 19.8 21.8 18.6 14.5 10.0 12.5 8.2 20.9
Finance 3.7 1.2 1.1 0.4 5.0 2.3 2.7 1.2 1.1 0.9 1.0 0.2 1.2 0.2 3.3 Accommodation & food service activities 7.2 18.1 10.2 17.7 7.4 6.4 7.0 18.1 9.5 17.8 11.6 19.2 9.6 16.1 7.6
Information and communication 4.7 0.9 2.7 1.1 6.1 3.4 3.6 0.9 2.8 1.2 2.9 0.7 2.4 1.2 4.4
Manufacturing 7.3 8.8 11.0 12.9 5.3 10.3 9.0 8.8 10.4 9.7 11.3 21.6 11.1 8.2 7.9 Mining/quarrying and utilities 0.8 1.0 1.4 1.1 0.7 1.2 0.9 1.0 0.9 0.2 1.6 0.6 1.6 2.5 0.9
Professional, scientific & technical services 9.2 4.0 7.8 4.7 11.2 5.9 7.7 4.0 7.5 5.1 8.3 3.9 7.6 5.1 9.0
Public admin and defence; other services
6.4 8.0 4.2 3.7 6.5 7.1 6.3 8.0 4.7 4.2 4.2 3.3 3.6 3.6 6.1
Real estate activities 1.9 1.4 1.6 1.6 2.3 1.3 1.6 1.4 1.7 2.1 1.6 1.1 1.6 1.5 1.9
Transport and storage 4.8 3.8 5.8 3.3 4.4 5.0 5.1 3.8 5.3 4.6 5.5 2.8 6.6 2.3 4.9 Wholesale, retail & repair of motor vehicles
15.4 21.0 13.2 13.5 13.8 16.0 16.8 21.0 16.5 21.7 11.5 8.9 11.3 9.0 15.1
Total 100.0 100.0 100.0 100.0 100.0 100.0 100.0 100.0 100.0 100.0 100.0 100.0 100.0 100.0 100.0
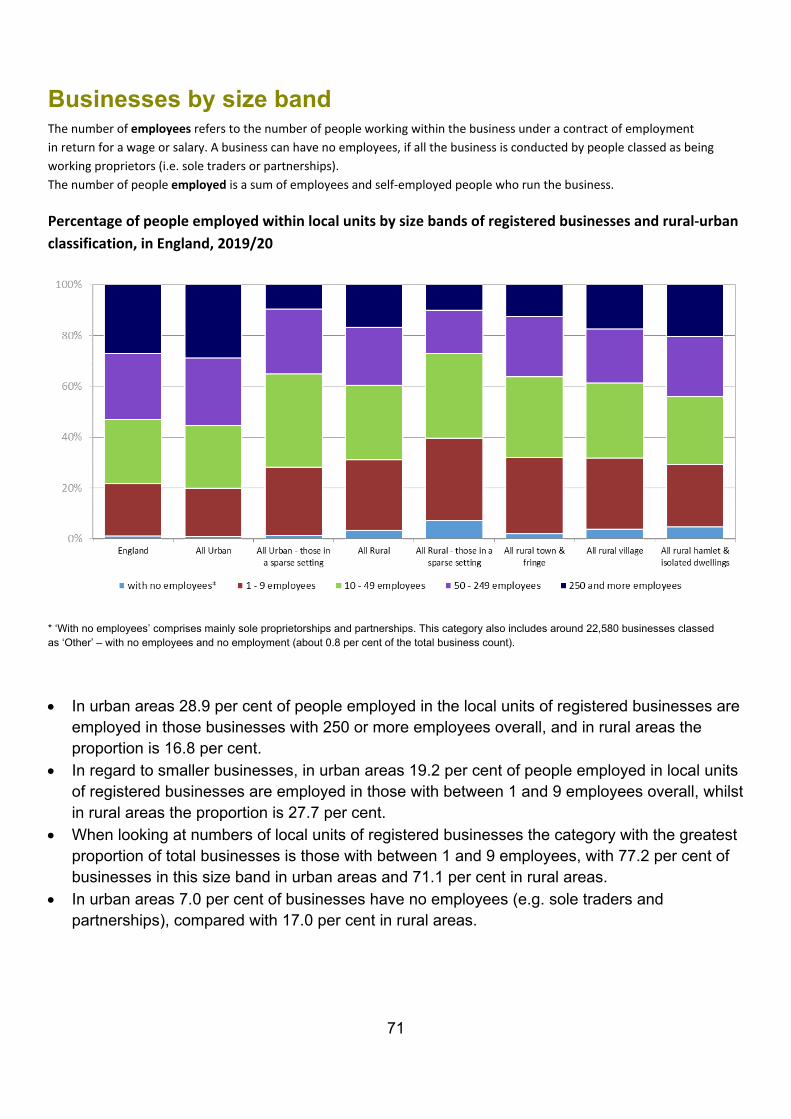
71
Businesses by size band The number of employees refers to the number of people working within the business under a contract of employment in return for a wage or salary. A business can have no employees, if all the business is conducted by people classed as being working proprietors (i.e. sole traders or partnerships). The number of people employed is a sum of employees and self-employed people who run the business.
Percentage of people employed within local units by size bands of registered businesses and rural-urban classification, in England, 2019/20
* ‘With no employees’ comprises mainly sole proprietorships and partnerships. This category also includes around 22,580 businesses classed as ‘Other’ – with no employees and no employment (about 0.8 per cent of the total business count).
• In urban areas 28.9 per cent of people employed in the local units of registered businesses are employed in those businesses with 250 or more employees overall, and in rural areas the proportion is 16.8 per cent.
• In regard to smaller businesses, in urban areas 19.2 per cent of people employed in local units of registered businesses are employed in those with between 1 and 9 employees overall, whilst in rural areas the proportion is 27.7 per cent.
• When looking at numbers of local units of registered businesses the category with the greatest proportion of total businesses is those with between 1 and 9 employees, with 77.2 per cent of businesses in this size band in urban areas and 71.1 per cent in rural areas.
• In urban areas 7.0 per cent of businesses have no employees (e.g. sole traders and partnerships), compared with 17.0 per cent in rural areas.
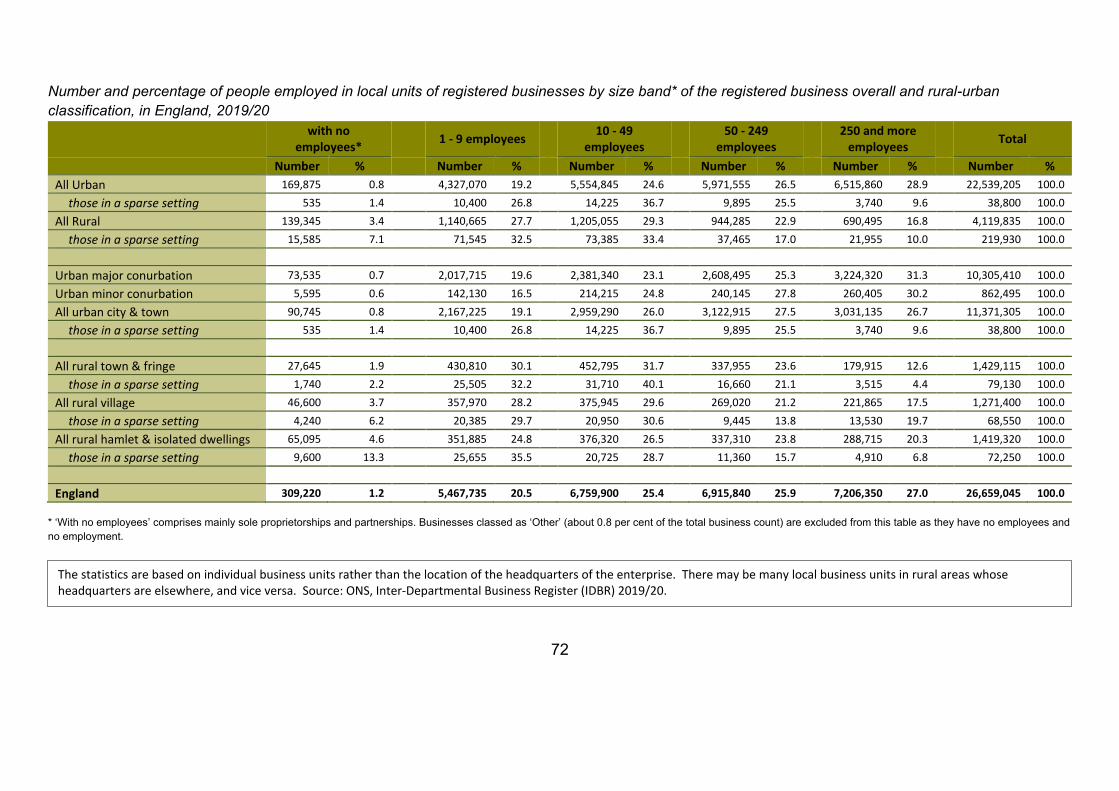
72
Number and percentage of people employed in local units of registered businesses by size band* of the registered business overall and rural-urban classification, in England, 2019/20
with no
employees* 1 - 9 employees 10 - 49
employees 50 - 249 employees 250 and more
employees Total
Number % Number % Number % Number % Number % Number % All Urban 169,875 0.8 4,327,070 19.2 5,554,845 24.6 5,971,555 26.5 6,515,860 28.9 22,539,205 100.0
those in a sparse setting 535 1.4 10,400 26.8 14,225 36.7 9,895 25.5 3,740 9.6 38,800 100.0
All Rural 139,345 3.4 1,140,665 27.7 1,205,055 29.3 944,285 22.9 690,495 16.8 4,119,835 100.0
those in a sparse setting 15,585 7.1 71,545 32.5 73,385 33.4 37,465 17.0 21,955 10.0 219,930 100.0
Urban major conurbation 73,535 0.7 2,017,715 19.6 2,381,340 23.1 2,608,495 25.3 3,224,320 31.3 10,305,410 100.0
Urban minor conurbation 5,595 0.6 142,130 16.5 214,215 24.8 240,145 27.8 260,405 30.2 862,495 100.0
All urban city & town 90,745 0.8 2,167,225 19.1 2,959,290 26.0 3,122,915 27.5 3,031,135 26.7 11,371,305 100.0
those in a sparse setting 535 1.4 10,400 26.8 14,225 36.7 9,895 25.5 3,740 9.6 38,800 100.0
All rural town & fringe 27,645 1.9 430,810 30.1 452,795 31.7 337,955 23.6 179,915 12.6 1,429,115 100.0
those in a sparse setting 1,740 2.2 25,505 32.2 31,710 40.1 16,660 21.1 3,515 4.4 79,130 100.0
All rural village 46,600 3.7 357,970 28.2 375,945 29.6 269,020 21.2 221,865 17.5 1,271,400 100.0
those in a sparse setting 4,240 6.2 20,385 29.7 20,950 30.6 9,445 13.8 13,530 19.7 68,550 100.0
All rural hamlet & isolated dwellings 65,095 4.6 351,885 24.8 376,320 26.5 337,310 23.8 288,715 20.3 1,419,320 100.0
those in a sparse setting 9,600 13.3 25,655 35.5 20,725 28.7 11,360 15.7 4,910 6.8 72,250 100.0
England 309,220 1.2 5,467,735 20.5 6,759,900 25.4 6,915,840 25.9 7,206,350 27.0 26,659,045 100.0
* ‘With no employees’ comprises mainly sole proprietorships and partnerships. Businesses classed as ‘Other’ (about 0.8 per cent of the total business count) are excluded from this table as they have no employees and no employment.
The statistics are based on individual business units rather than the location of the headquarters of the enterprise. There may be many local business units in rural areas whose headquarters are elsewhere, and vice versa. Source: ONS, Inter-Departmental Business Register (IDBR) 2019/20.
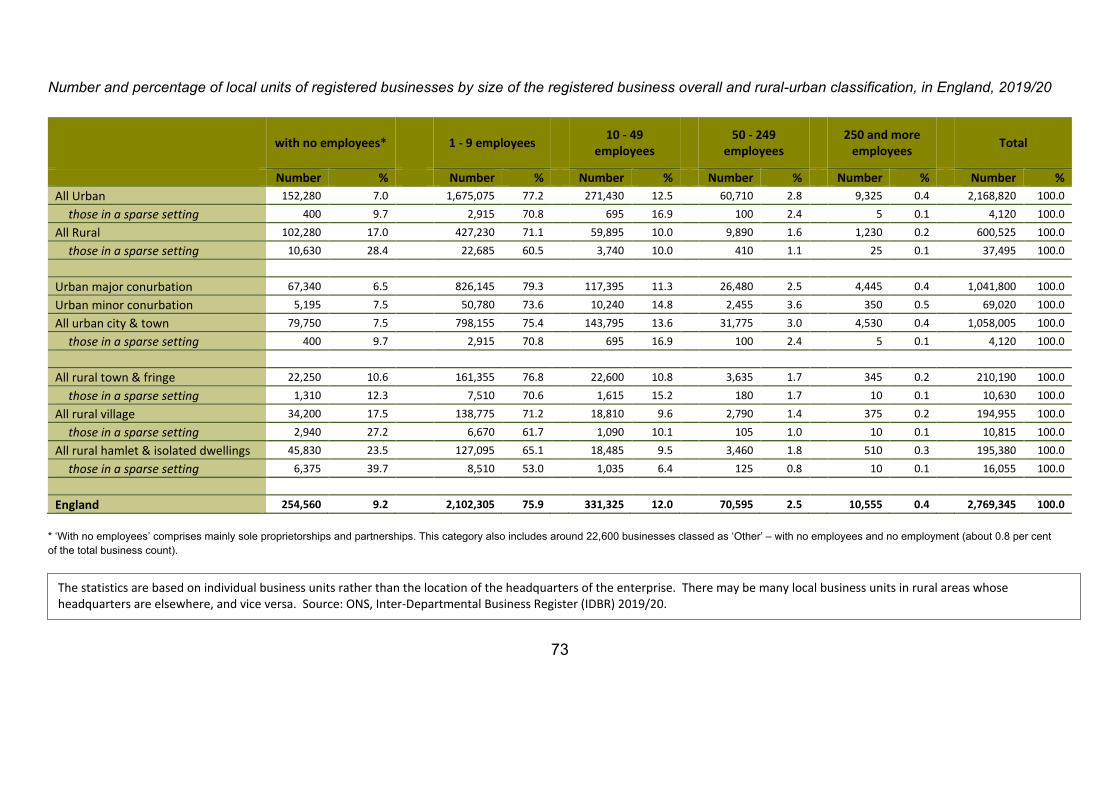
73
Number and percentage of local units of registered businesses by size of the registered business overall and rural-urban classification, in England, 2019/20
with no employees*
1 - 9 employees 10 - 49
employees 50 - 249 employees 250 and more
employees Total
Number % Number % Number % Number % Number % Number % All Urban 152,280 7.0 1,675,075 77.2 271,430 12.5 60,710 2.8 9,325 0.4 2,168,820 100.0
those in a sparse setting 400 9.7 2,915 70.8 695 16.9 100 2.4 5 0.1 4,120 100.0
All Rural 102,280 17.0 427,230 71.1 59,895 10.0 9,890 1.6 1,230 0.2 600,525 100.0
those in a sparse setting 10,630 28.4 22,685 60.5 3,740 10.0 410 1.1 25 0.1 37,495 100.0
Urban major conurbation 67,340 6.5 826,145 79.3 117,395 11.3 26,480 2.5 4,445 0.4 1,041,800 100.0
Urban minor conurbation 5,195 7.5 50,780 73.6 10,240 14.8 2,455 3.6 350 0.5 69,020 100.0
All urban city & town 79,750 7.5 798,155 75.4 143,795 13.6 31,775 3.0 4,530 0.4 1,058,005 100.0
those in a sparse setting 400 9.7 2,915 70.8 695 16.9 100 2.4 5 0.1 4,120 100.0
All rural town & fringe 22,250 10.6 161,355 76.8 22,600 10.8 3,635 1.7 345 0.2 210,190 100.0
those in a sparse setting 1,310 12.3 7,510 70.6 1,615 15.2 180 1.7 10 0.1 10,630 100.0
All rural village 34,200 17.5 138,775 71.2 18,810 9.6 2,790 1.4 375 0.2 194,955 100.0
those in a sparse setting 2,940 27.2 6,670 61.7 1,090 10.1 105 1.0 10 0.1 10,815 100.0
All rural hamlet & isolated dwellings 45,830 23.5 127,095 65.1 18,485 9.5 3,460 1.8 510 0.3 195,380 100.0
those in a sparse setting 6,375 39.7 8,510 53.0 1,035 6.4 125 0.8 10 0.1 16,055 100.0
England 254,560 9.2 2,102,305 75.9 331,325 12.0 70,595 2.5 10,555 0.4 2,769,345 100.0
* ‘With no employees’ comprises mainly sole proprietorships and partnerships. This category also includes around 22,600 businesses classed as ‘Other’ – with no employees and no employment (about 0.8 per cent of the total business count).
The statistics are based on individual business units rather than the location of the headquarters of the enterprise. There may be many local business units in rural areas whose headquarters are elsewhere, and vice versa. Source: ONS, Inter-Departmental Business Register (IDBR) 2019/20.
74
Small and medium businesses • Small and Medium Enterprises (SMEs) are businesses employing fewer than 250 people.
• In England, there are 2.4 million SMEs registered for PAYE and/or VAT, providing employment
for 12.4 million people.
• However, it is estimated that in England there are an additional 2.7 million unregistered businesses i.e. those who are not registered for VAT and do not have employees registered for PAYE. Such businesses are estimated to provide employment for 2.9 million people and are likely to be mainly one person traders.
• For registered businesses, information is available on their location, principal activity, employment and turnover, and for those who operate on multiple sites, the location and employment in individual business units. Information on registered SMEs is presented below.
• Less is known of unregistered businesses and in particular hitherto there have been no estimates of how many are based in rural areas. However new analysis of data from the Longitudinal Small Business Survey, which included unregistered businesses, provides further insights on SMEs in rural areas. Some results from the analysis are presented later in this section. These suggest that 73 per cent of SMEs in rural areas have no employees (including both registered and unregistered businesses).
Registered Small and Medium Enterprises • Enterprises are considered rural registered businesses if their single site of operation or their
head-quarters, as registered for PAYE (Pay-As-You-Earn tax) and/or VAT (Value Added Tax) purposes, are located in a rural area. Enterprises where the head-quarters are in an urban area are regarded as urban registered businesses, even if some business units are in rural areas.
• In 2019/20, there was 550,000 registered rural SMEs, representing 99.8 per cent of all registered rural enterprises, and 23 per cent of all registered SMEs in England. In urban areas SMEs represent 99.6 per cent of registered businesses.
• In 2019/20, 2.6 million people were employed in registered rural SMEs, representing 71 per cent of all those employed by registered rural enterprises. SMEs account for 41 per cent of those employed in registered urban enterprises.
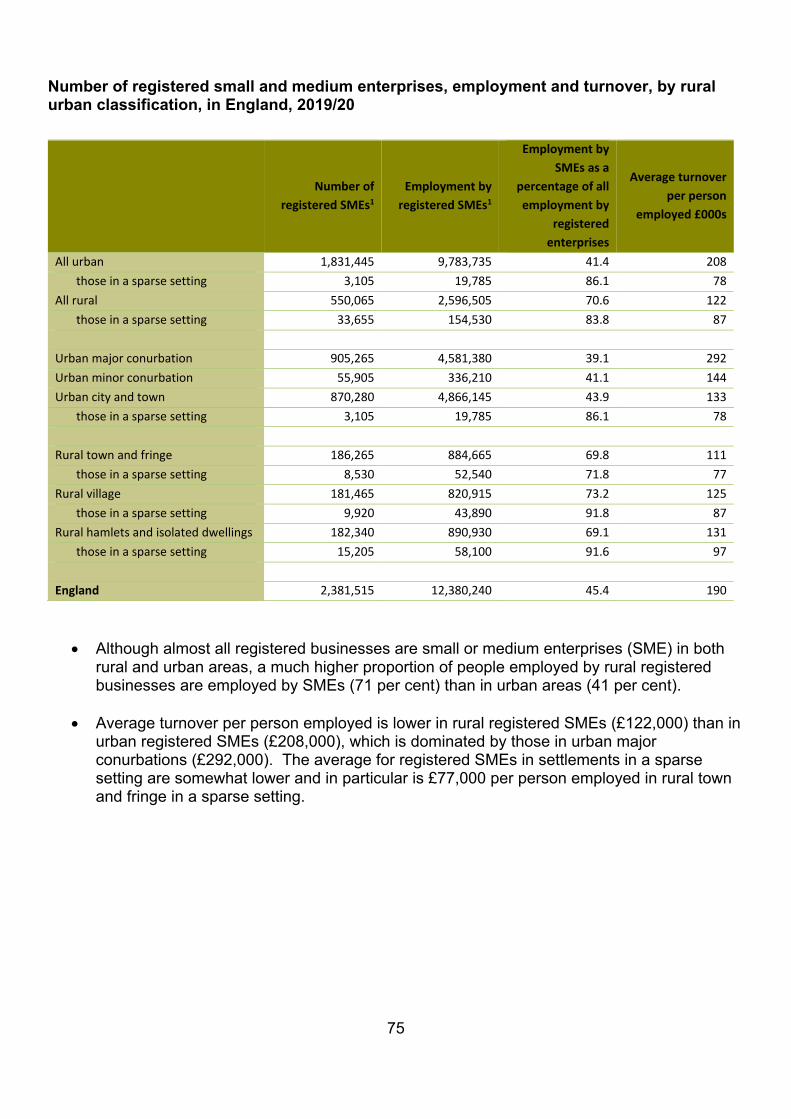
75
Number of registered small and medium enterprises, employment and turnover, by rural urban classification, in England, 2019/20
Number of
registered SMEs1 Employment by
registered SMEs1
Employment by SMEs as a
percentage of all employment by
registered enterprises
Average turnover per person
employed £000s
All urban 1,831,445 9,783,735 41.4 208 those in a sparse setting 3,105 19,785 86.1 78 All rural 550,065 2,596,505 70.6 122 those in a sparse setting 33,655 154,530 83.8 87 Urban major conurbation 905,265 4,581,380 39.1 292 Urban minor conurbation 55,905 336,210 41.1 144 Urban city and town 870,280 4,866,145 43.9 133 those in a sparse setting 3,105 19,785 86.1 78 Rural town and fringe 186,265 884,665 69.8 111 those in a sparse setting 8,530 52,540 71.8 77 Rural village 181,465 820,915 73.2 125 those in a sparse setting 9,920 43,890 91.8 87 Rural hamlets and isolated dwellings 182,340 890,930 69.1 131 those in a sparse setting 15,205 58,100 91.6 97 England 2,381,515 12,380,240 45.4 190
• Although almost all registered businesses are small or medium enterprises (SME) in both rural and urban areas, a much higher proportion of people employed by rural registered businesses are employed by SMEs (71 per cent) than in urban areas (41 per cent).
• Average turnover per person employed is lower in rural registered SMEs (£122,000) than in urban registered SMEs (£208,000), which is dominated by those in urban major conurbations (£292,000). The average for registered SMEs in settlements in a sparse setting are somewhat lower and in particular is £77,000 per person employed in rural town and fringe in a sparse setting.
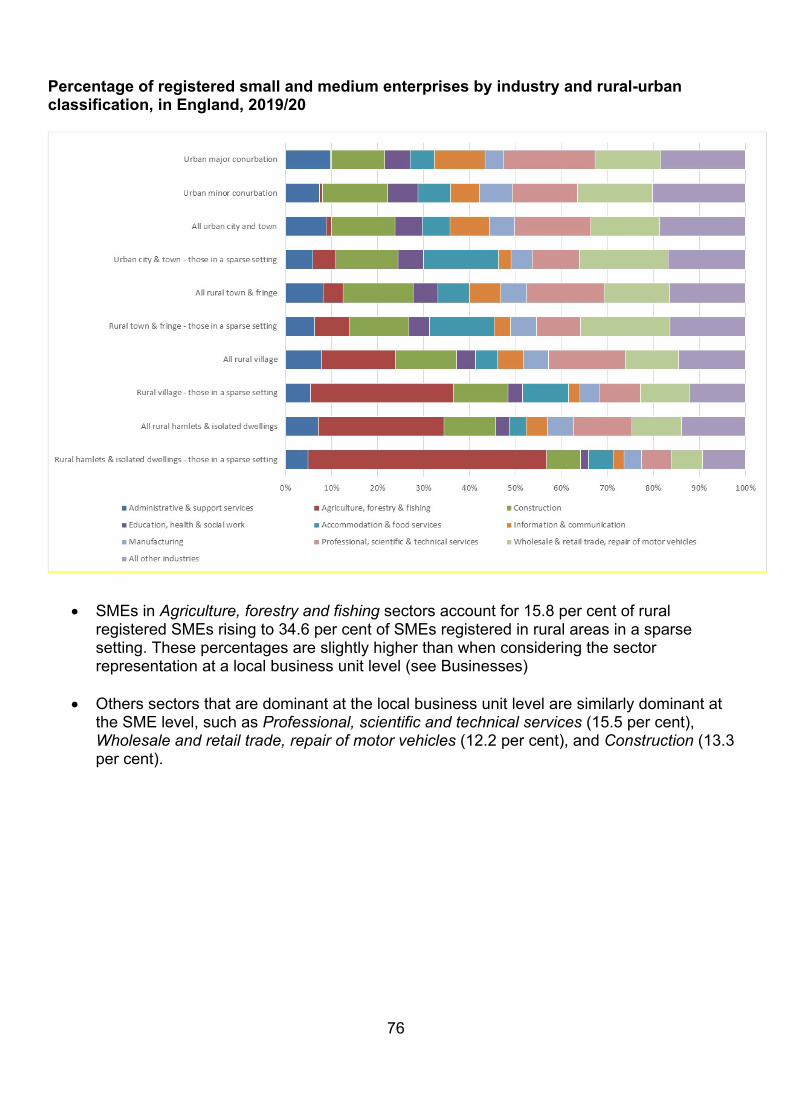
76
Percentage of registered small and medium enterprises by industry and rural-urban classification, in England, 2019/20
• SMEs in Agriculture, forestry and fishing sectors account for 15.8 per cent of rural registered SMEs rising to 34.6 per cent of SMEs registered in rural areas in a sparse setting. These percentages are slightly higher than when considering the sector representation at a local business unit level (see Businesses)
• Others sectors that are dominant at the local business unit level are similarly dominant at the SME level, such as Professional, scientific and technical services (15.5 per cent), Wholesale and retail trade, repair of motor vehicles (12.2 per cent), and Construction (13.3 per cent).
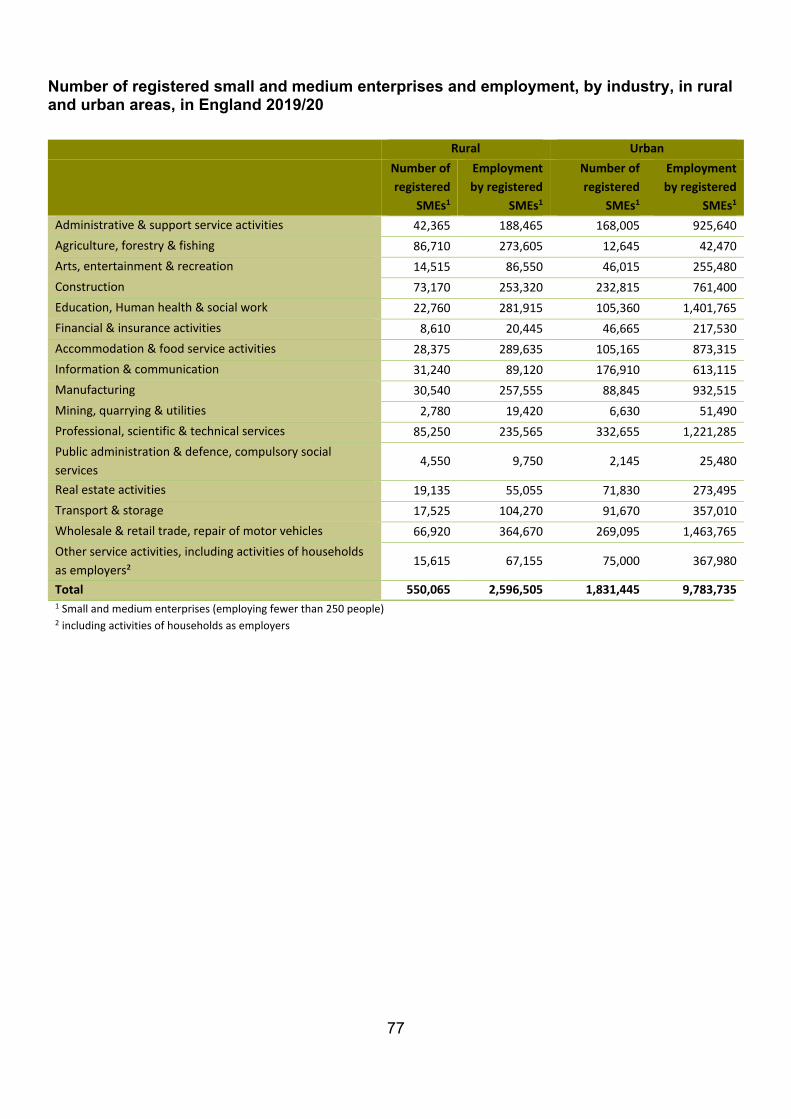
77
Number of registered small and medium enterprises and employment, by industry, in rural and urban areas, in England 2019/20
Rural Urban
Number of registered
SMEs1
Employment by registered
SMEs1
Number of registered
SMEs1
Employment by registered
SMEs1 Administrative & support service activities 42,365 188,465 168,005 925,640 Agriculture, forestry & fishing 86,710 273,605 12,645 42,470 Arts, entertainment & recreation 14,515 86,550 46,015 255,480 Construction 73,170 253,320 232,815 761,400 Education, Human health & social work 22,760 281,915 105,360 1,401,765 Financial & insurance activities 8,610 20,445 46,665 217,530 Accommodation & food service activities 28,375 289,635 105,165 873,315 Information & communication 31,240 89,120 176,910 613,115 Manufacturing 30,540 257,555 88,845 932,515 Mining, quarrying & utilities 2,780 19,420 6,630 51,490 Professional, scientific & technical services 85,250 235,565 332,655 1,221,285 Public administration & defence, compulsory social services
4,550 9,750 2,145 25,480
Real estate activities 19,135 55,055 71,830 273,495 Transport & storage 17,525 104,270 91,670 357,010 Wholesale & retail trade, repair of motor vehicles 66,920 364,670 269,095 1,463,765 Other service activities, including activities of households as employers²
15,615 67,155 75,000 367,980
Total 550,065 2,596,505 1,831,445 9,783,735 1 Small and medium enterprises (employing fewer than 250 people) 2 including activities of households as employers
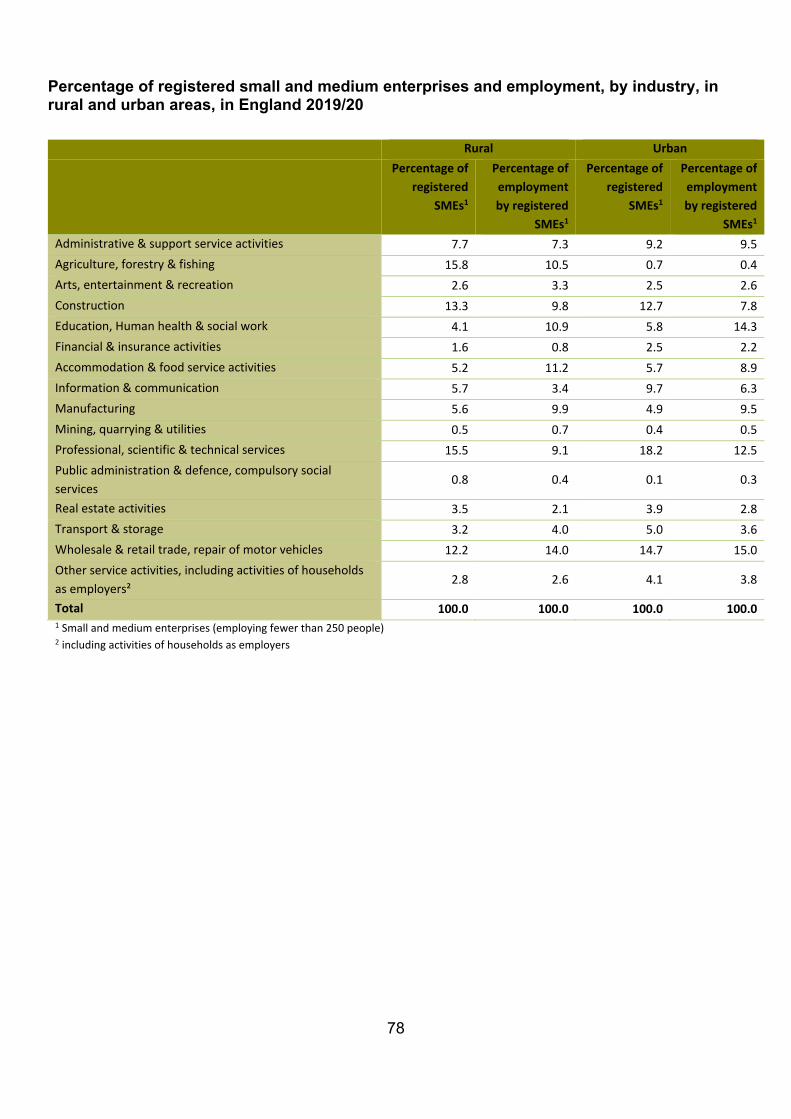
78
Percentage of registered small and medium enterprises and employment, by industry, in rural and urban areas, in England 2019/20
Rural Urban Percentage of
registered SMEs1
Percentage of employment by registered
SMEs1
Percentage of registered
SMEs1
Percentage of employment by registered
SMEs1 Administrative & support service activities 7.7 7.3 9.2 9.5 Agriculture, forestry & fishing 15.8 10.5 0.7 0.4 Arts, entertainment & recreation 2.6 3.3 2.5 2.6 Construction 13.3 9.8 12.7 7.8 Education, Human health & social work 4.1 10.9 5.8 14.3 Financial & insurance activities 1.6 0.8 2.5 2.2 Accommodation & food service activities 5.2 11.2 5.7 8.9 Information & communication 5.7 3.4 9.7 6.3 Manufacturing 5.6 9.9 4.9 9.5 Mining, quarrying & utilities 0.5 0.7 0.4 0.5 Professional, scientific & technical services 15.5 9.1 18.2 12.5 Public administration & defence, compulsory social services
0.8 0.4 0.1 0.3
Real estate activities 3.5 2.1 3.9 2.8 Transport & storage 3.2 4.0 5.0 3.6 Wholesale & retail trade, repair of motor vehicles 12.2 14.0 14.7 15.0 Other service activities, including activities of households as employers²
2.8 2.6 4.1 3.8
Total 100.0 100.0 100.0 100.0 1 Small and medium enterprises (employing fewer than 250 people) 2 including activities of households as employers
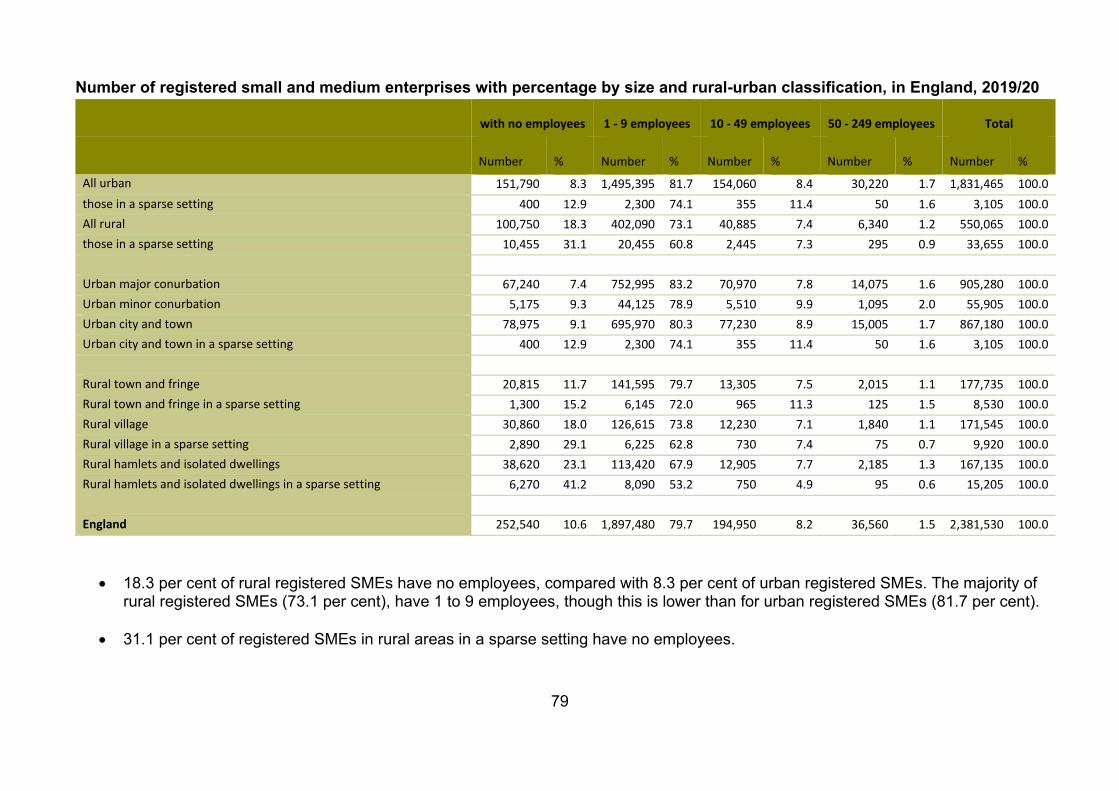
79
Number of registered small and medium enterprises with percentage by size and rural-urban classification, in England, 2019/20
• 18.3 per cent of rural registered SMEs have no employees, compared with 8.3 per cent of urban registered SMEs. The majority of rural registered SMEs (73.1 per cent), have 1 to 9 employees, though this is lower than for urban registered SMEs (81.7 per cent).
• 31.1 per cent of registered SMEs in rural areas in a sparse setting have no employees.
with no employees 1 - 9 employees 10 - 49 employees 50 - 249 employees Total
Number % Number % Number % Number % Number %
All urban 151,790 8.3 1,495,395 81.7 154,060 8.4 30,220 1.7 1,831,465 100.0 those in a sparse setting 400 12.9 2,300 74.1 355 11.4 50 1.6 3,105 100.0 All rural 100,750 18.3 402,090 73.1 40,885 7.4 6,340 1.2 550,065 100.0 those in a sparse setting 10,455 31.1 20,455 60.8 2,445 7.3 295 0.9 33,655 100.0
Urban major conurbation 67,240 7.4 752,995 83.2 70,970 7.8 14,075 1.6 905,280 100.0 Urban minor conurbation 5,175 9.3 44,125 78.9 5,510 9.9 1,095 2.0 55,905 100.0 Urban city and town 78,975 9.1 695,970 80.3 77,230 8.9 15,005 1.7 867,180 100.0 Urban city and town in a sparse setting 400 12.9 2,300 74.1 355 11.4 50 1.6 3,105 100.0
Rural town and fringe 20,815 11.7 141,595 79.7 13,305 7.5 2,015 1.1 177,735 100.0 Rural town and fringe in a sparse setting 1,300 15.2 6,145 72.0 965 11.3 125 1.5 8,530 100.0 Rural village 30,860 18.0 126,615 73.8 12,230 7.1 1,840 1.1 171,545 100.0 Rural village in a sparse setting 2,890 29.1 6,225 62.8 730 7.4 75 0.7 9,920 100.0 Rural hamlets and isolated dwellings 38,620 23.1 113,420 67.9 12,905 7.7 2,185 1.3 167,135 100.0 Rural hamlets and isolated dwellings in a sparse setting 6,270 41.2 8,090 53.2 750 4.9 95 0.6 15,205 100.0
England 252,540 10.6 1,897,480 79.7 194,950 8.2 36,560 1.5 2,381,530 100.0
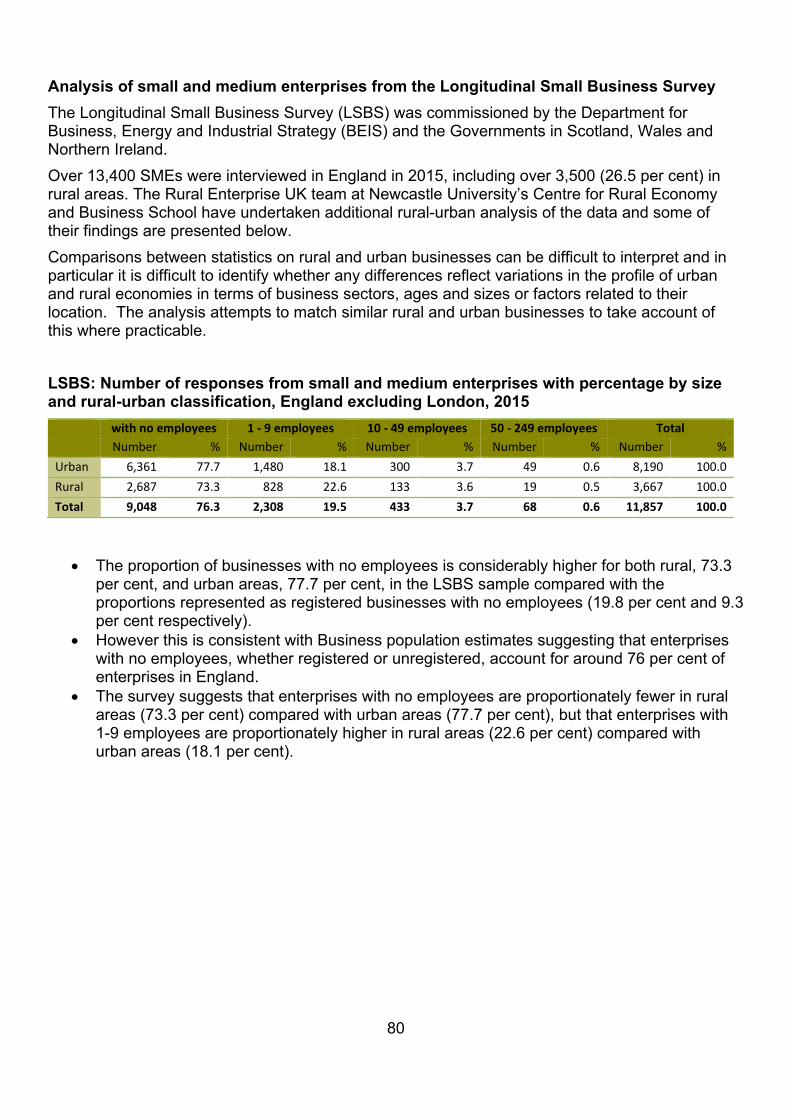
80
Analysis of small and medium enterprises from the Longitudinal Small Business Survey The Longitudinal Small Business Survey (LSBS) was commissioned by the Department for Business, Energy and Industrial Strategy (BEIS) and the Governments in Scotland, Wales and Northern Ireland. Over 13,400 SMEs were interviewed in England in 2015, including over 3,500 (26.5 per cent) in rural areas. The Rural Enterprise UK team at Newcastle University’s Centre for Rural Economy and Business School have undertaken additional rural-urban analysis of the data and some of their findings are presented below. Comparisons between statistics on rural and urban businesses can be difficult to interpret and in particular it is difficult to identify whether any differences reflect variations in the profile of urban and rural economies in terms of business sectors, ages and sizes or factors related to their location. The analysis attempts to match similar rural and urban businesses to take account of this where practicable. LSBS: Number of responses from small and medium enterprises with percentage by size and rural-urban classification, England excluding London, 2015
with no employees 1 - 9 employees 10 - 49 employees 50 - 249 employees Total Number % Number % Number % Number % Number % Urban 6,361 77.7 1,480 18.1 300 3.7 49 0.6 8,190 100.0 Rural 2,687 73.3 828 22.6 133 3.6 19 0.5 3,667 100.0 Total 9,048 76.3 2,308 19.5 433 3.7 68 0.6 11,857 100.0
• The proportion of businesses with no employees is considerably higher for both rural, 73.3 per cent, and urban areas, 77.7 per cent, in the LSBS sample compared with the proportions represented as registered businesses with no employees (19.8 per cent and 9.3 per cent respectively).
• However this is consistent with Business population estimates suggesting that enterprises with no employees, whether registered or unregistered, account for around 76 per cent of enterprises in England.
• The survey suggests that enterprises with no employees are proportionately fewer in rural areas (73.3 per cent) compared with urban areas (77.7 per cent), but that enterprises with 1-9 employees are proportionately higher in rural areas (22.6 per cent) compared with urban areas (18.1 per cent).
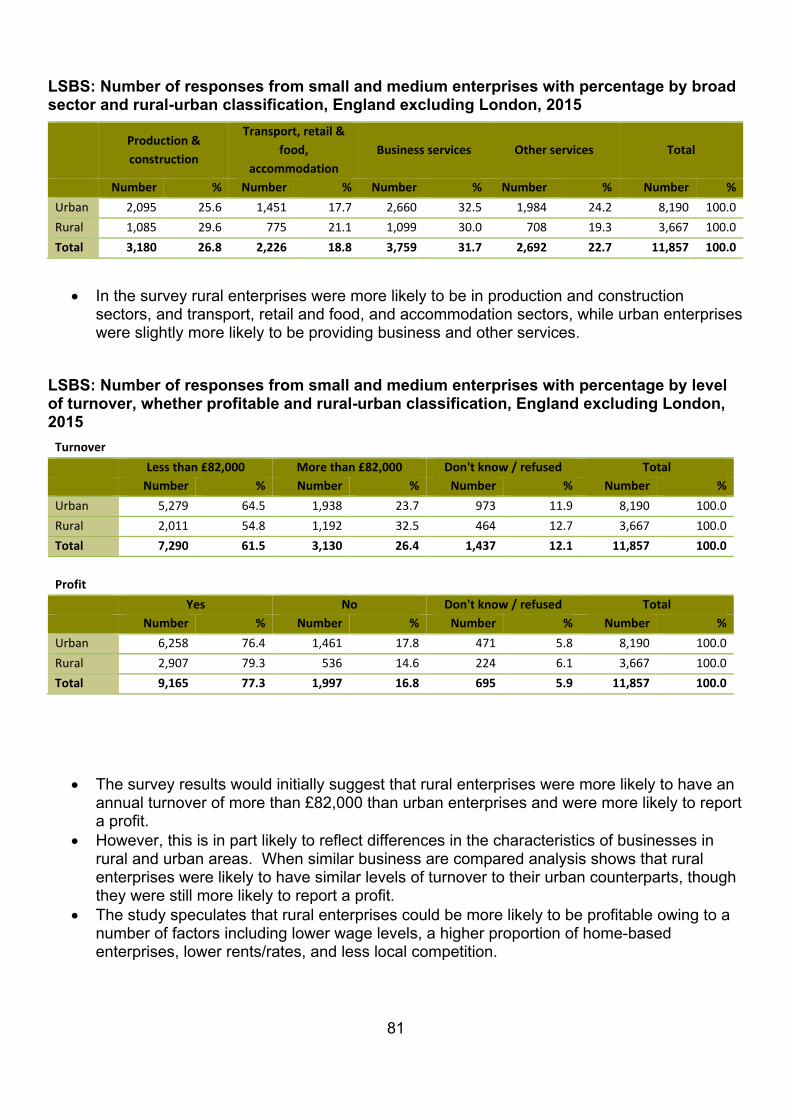
81
LSBS: Number of responses from small and medium enterprises with percentage by broad sector and rural-urban classification, England excluding London, 2015
Production & construction
Transport, retail & food,
accommodation Business services Other services Total
Number % Number % Number % Number % Number % Urban 2,095 25.6 1,451 17.7 2,660 32.5 1,984 24.2 8,190 100.0 Rural 1,085 29.6 775 21.1 1,099 30.0 708 19.3 3,667 100.0 Total 3,180 26.8 2,226 18.8 3,759 31.7 2,692 22.7 11,857 100.0
• In the survey rural enterprises were more likely to be in production and construction sectors, and transport, retail and food, and accommodation sectors, while urban enterprises were slightly more likely to be providing business and other services.
LSBS: Number of responses from small and medium enterprises with percentage by level of turnover, whether profitable and rural-urban classification, England excluding London, 2015
Turnover Less than £82,000 More than £82,000 Don't know / refused Total Number % Number % Number % Number % Urban 5,279 64.5 1,938 23.7 973 11.9 8,190 100.0 Rural 2,011 54.8 1,192 32.5 464 12.7 3,667 100.0 Total 7,290 61.5 3,130 26.4 1,437 12.1 11,857 100.0 Profit Yes No Don't know / refused Total Number % Number % Number % Number % Urban 6,258 76.4 1,461 17.8 471 5.8 8,190 100.0 Rural 2,907 79.3 536 14.6 224 6.1 3,667 100.0 Total 9,165 77.3 1,997 16.8 695 5.9 11,857 100.0
• The survey results would initially suggest that rural enterprises were more likely to have an annual turnover of more than £82,000 than urban enterprises and were more likely to report a profit.
• However, this is in part likely to reflect differences in the characteristics of businesses in rural and urban areas. When similar business are compared analysis shows that rural enterprises were likely to have similar levels of turnover to their urban counterparts, though they were still more likely to report a profit.
• The study speculates that rural enterprises could be more likely to be profitable owing to a number of factors including lower wage levels, a higher proportion of home-based enterprises, lower rents/rates, and less local competition.
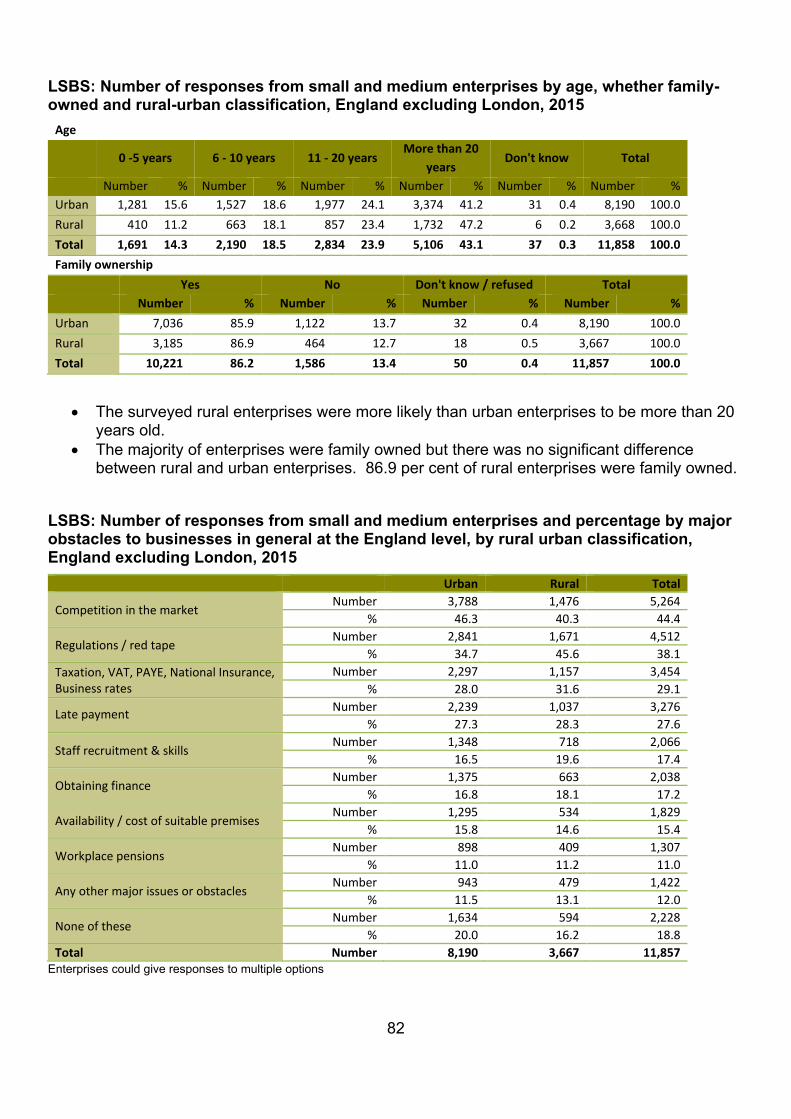
82
LSBS: Number of responses from small and medium enterprises by age, whether family-owned and rural-urban classification, England excluding London, 2015
Age
0 -5 years 6 - 10 years 11 - 20 years More than 20
years Don't know Total
Number % Number % Number % Number % Number % Number % Urban 1,281 15.6 1,527 18.6 1,977 24.1 3,374 41.2 31 0.4 8,190 100.0 Rural 410 11.2 663 18.1 857 23.4 1,732 47.2 6 0.2 3,668 100.0 Total 1,691 14.3 2,190 18.5 2,834 23.9 5,106 43.1 37 0.3 11,858 100.0 Family ownership Yes No Don't know / refused Total Number % Number % Number % Number % Urban 7,036 85.9 1,122 13.7 32 0.4 8,190 100.0 Rural 3,185 86.9 464 12.7 18 0.5 3,667 100.0 Total 10,221 86.2 1,586 13.4 50 0.4 11,857 100.0
• The surveyed rural enterprises were more likely than urban enterprises to be more than 20 years old.
• The majority of enterprises were family owned but there was no significant difference between rural and urban enterprises. 86.9 per cent of rural enterprises were family owned.
LSBS: Number of responses from small and medium enterprises and percentage by major obstacles to businesses in general at the England level, by rural urban classification, England excluding London, 2015
Urban Rural Total
Competition in the market Number 3,788 1,476 5,264
% 46.3 40.3 44.4
Regulations / red tape Number 2,841 1,671 4,512
% 34.7 45.6 38.1 Taxation, VAT, PAYE, National Insurance, Business rates
Number 2,297 1,157 3,454 % 28.0 31.6 29.1
Late payment Number 2,239 1,037 3,276 % 27.3 28.3 27.6
Staff recruitment & skills Number 1,348 718 2,066
% 16.5 19.6 17.4
Obtaining finance Number 1,375 663 2,038
% 16.8 18.1 17.2
Availability / cost of suitable premises Number 1,295 534 1,829
% 15.8 14.6 15.4
Workplace pensions Number 898 409 1,307
% 11.0 11.2 11.0
Any other major issues or obstacles Number 943 479 1,422
% 11.5 13.1 12.0
None of these Number 1,634 594 2,228
% 20.0 16.2 18.8 Total Number 8,190 3,667 11,857
Enterprises could give responses to multiple options
83
• When asked to identify major obstacles to businesses, rural enterprises were more likely than urban enterprises to cite ‘Regulations / red tape’, ‘Taxation, VAT, PAYE, National Insurance, Business rates’, and ‘Staff recruitment and skills’.
The above is a selection of findings from the Newcastle University study. For more details and analysis refer to the full study report (see below).
Note: On the Inter-Departmental Business Register (IDBR), the enterprise is the statistical unit that most closely equates to a business. It holds aggregated information gathered from administrative and statistical sources within that enterprise to give an overall picture of what is going on in the business. An enterprise carries out one or more activities at one or more locations. An enterprise may be a sole legal unit. Turnover relates to income received by a business from the ‘sale of goods and or services charged to third parties’. The IDBR does not include businesses whose turnover is below the tax threshold. Further information: www.ons.gov.uk/aboutus/whatwedo/paidservices/interdepartmentalbusinessregisteridbr
Source: ONS, Inter Departmental Business Register (IDBR), 2015/16
Small Business Survey reports: www.gov.uk/government/collections/small-business-survey-reports
Business Population Estimates: https://www.gov.uk/government/collections/business-population-estimates
Phillipson J, Gorton M, Maioli S, Newbery R, Tiwasing P, Turner R. (2017) Small rural firms in English regions: analysis and key findings from the UK Longitudinal Small Business Survey, 2015. Newcastle upon Tyne: Newcastle University Centre for Rural Economy and Business School, September 2017 update: //research.ncl.ac.uk/ruralenterpriseuk/
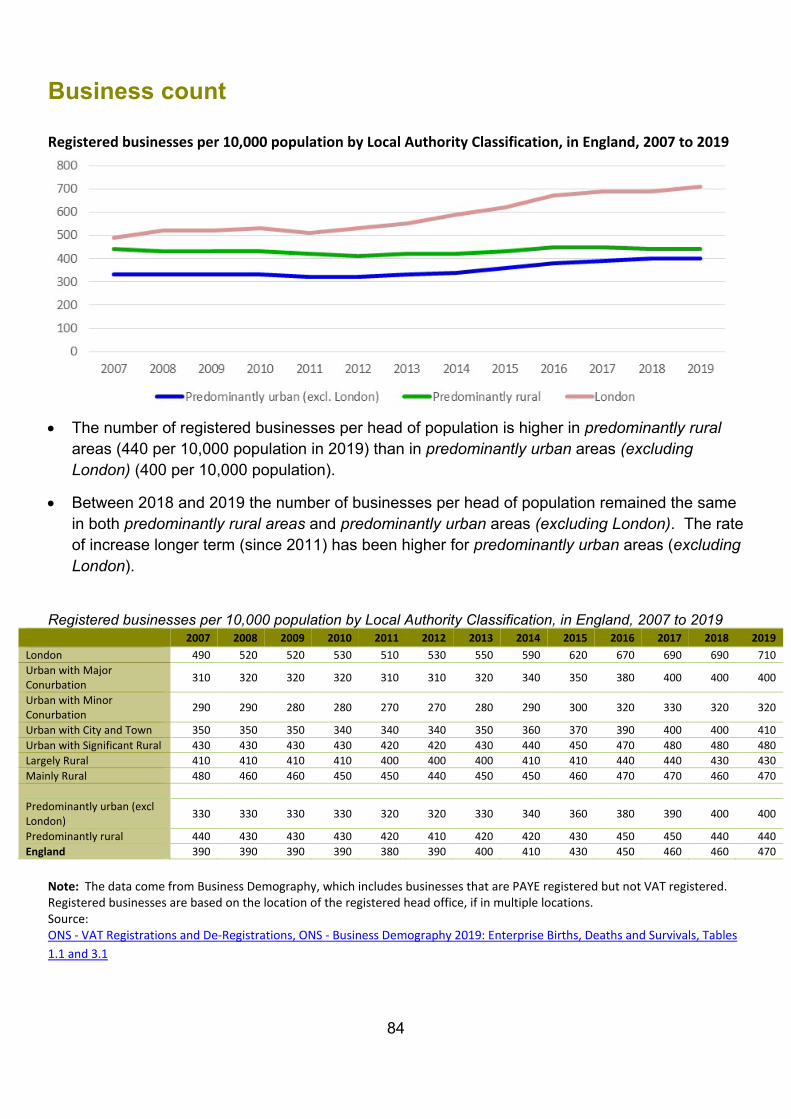
84
Business count Registered businesses per 10,000 population by Local Authority Classification, in England, 2007 to 2019
• The number of registered businesses per head of population is higher in predominantly rural
areas (440 per 10,000 population in 2019) than in predominantly urban areas (excluding London) (400 per 10,000 population).
• Between 2018 and 2019 the number of businesses per head of population remained the same in both predominantly rural areas and predominantly urban areas (excluding London). The rate of increase longer term (since 2011) has been higher for predominantly urban areas (excluding London).
Registered businesses per 10,000 population by Local Authority Classification, in England, 2007 to 2019
2007 2008 2009 2010 2011 2012 2013 2014 2015 2016 2017 2018 2019 London 490 520 520 530 510 530 550 590 620 670 690 690 710 Urban with Major Conurbation 310 320 320 320 310 310 320 340 350 380 400 400 400
Urban with Minor Conurbation 290 290 280 280 270 270 280 290 300 320 330 320 320
Urban with City and Town 350 350 350 340 340 340 350 360 370 390 400 400 410 Urban with Significant Rural 430 430 430 430 420 420 430 440 450 470 480 480 480 Largely Rural 410 410 410 410 400 400 400 410 410 440 440 430 430 Mainly Rural 480 460 460 450 450 440 450 450 460 470 470 460 470 Predominantly urban (excl London) 330 330 330 330 320 320 330 340 360 380 390 400 400
Predominantly rural 440 430 430 430 420 410 420 420 430 450 450 440 440 England 390 390 390 390 380 390 400 410 430 450 460 460 470
Note: The data come from Business Demography, which includes businesses that are PAYE registered but not VAT registered. Registered businesses are based on the location of the registered head office, if in multiple locations. Source: ONS - VAT Registrations and De-Registrations, ONS - Business Demography 2019: Enterprise Births, Deaths and Survivals, Tables 1.1 and 3.1
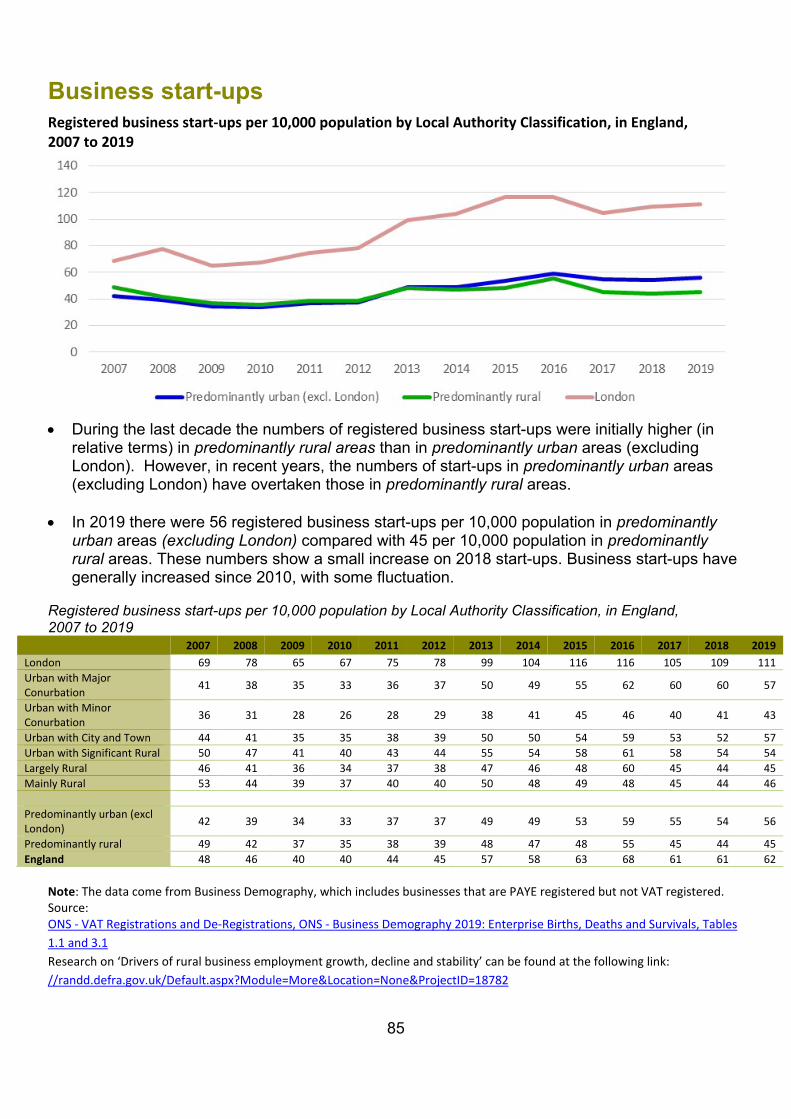
85
Business start-ups Registered business start-ups per 10,000 population by Local Authority Classification, in England, 2007 to 2019
• During the last decade the numbers of registered business start-ups were initially higher (in
relative terms) in predominantly rural areas than in predominantly urban areas (excluding London). However, in recent years, the numbers of start-ups in predominantly urban areas (excluding London) have overtaken those in predominantly rural areas.
• In 2019 there were 56 registered business start-ups per 10,000 population in predominantly
urban areas (excluding London) compared with 45 per 10,000 population in predominantly rural areas. These numbers show a small increase on 2018 start-ups. Business start-ups have generally increased since 2010, with some fluctuation.
Registered business start-ups per 10,000 population by Local Authority Classification, in England, 2007 to 2019
2007 2008 2009 2010 2011 2012 2013 2014 2015 2016 2017 2018 2019 London 69 78 65 67 75 78 99 104 116 116 105 109 111 Urban with Major Conurbation 41 38 35 33 36 37 50 49 55 62 60 60 57
Urban with Minor Conurbation 36 31 28 26 28 29 38 41 45 46 40 41 43
Urban with City and Town 44 41 35 35 38 39 50 50 54 59 53 52 57 Urban with Significant Rural 50 47 41 40 43 44 55 54 58 61 58 54 54 Largely Rural 46 41 36 34 37 38 47 46 48 60 45 44 45 Mainly Rural 53 44 39 37 40 40 50 48 49 48 45 44 46 Predominantly urban (excl London) 42 39 34 33 37 37 49 49 53 59 55 54 56
Predominantly rural 49 42 37 35 38 39 48 47 48 55 45 44 45 England 48 46 40 40 44 45 57 58 63 68 61 61 62
Note: The data come from Business Demography, which includes businesses that are PAYE registered but not VAT registered. Source: ONS - VAT Registrations and De-Registrations, ONS - Business Demography 2019: Enterprise Births, Deaths and Survivals, Tables 1.1 and 3.1 Research on ‘Drivers of rural business employment growth, decline and stability’ can be found at the following link: //randd.defra.gov.uk/Default.aspx?Module=More&Location=None&ProjectID=18782
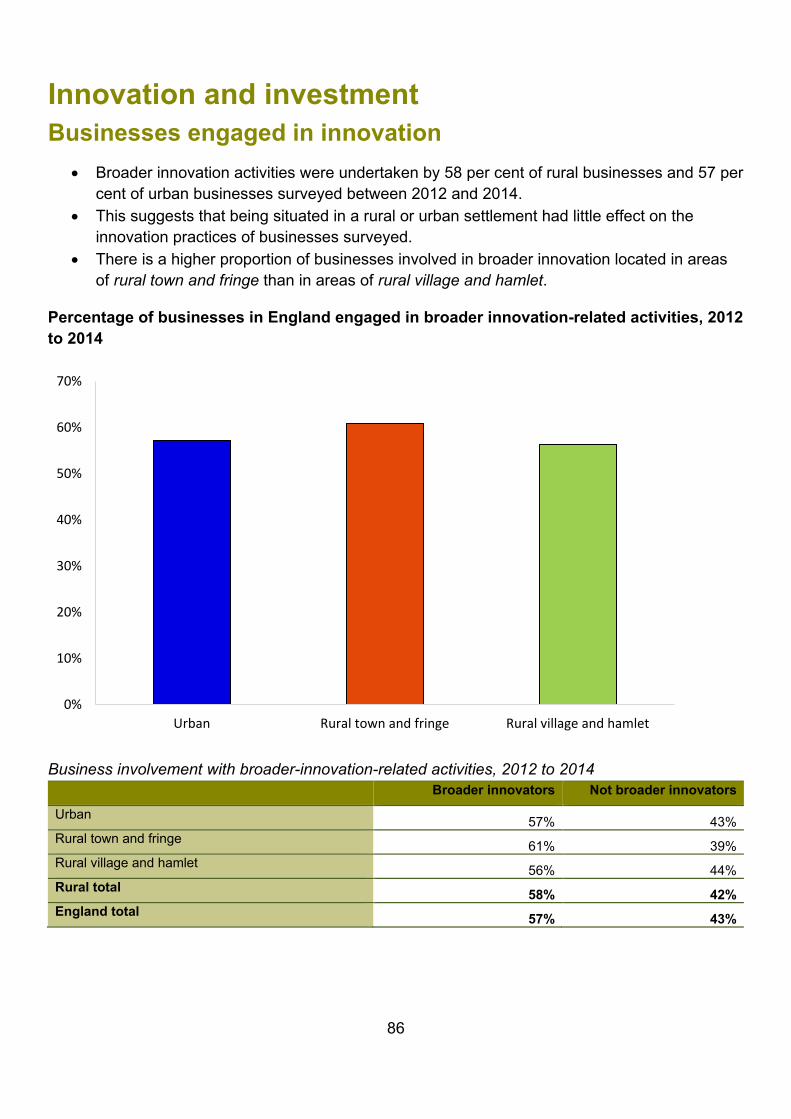
86
Innovation and investment Businesses engaged in innovation
• Broader innovation activities were undertaken by 58 per cent of rural businesses and 57 per cent of urban businesses surveyed between 2012 and 2014.
• This suggests that being situated in a rural or urban settlement had little effect on the innovation practices of businesses surveyed.
• There is a higher proportion of businesses involved in broader innovation located in areas of rural town and fringe than in areas of rural village and hamlet.
Percentage of businesses in England engaged in broader innovation-related activities, 2012 to 2014
Business involvement with broader-innovation-related activities, 2012 to 2014 Broader innovators Not broader innovators
Urban 57% 43% Rural town and fringe 61% 39% Rural village and hamlet 56% 44% Rural total 58% 42% England total 57% 43%
0%
10%
20%
30%
40%
50%
60%
70%
Urban Rural town and fringe Rural village and hamlet
87
Notes:
Data source: BEIS UK Innovation Survey 2015 covering innovation activity during 2012 to 2014.
These results are based on the unweighted sample of businesses surveyed for England only (therefore the England percentage totals may not match the weighted results published by BEIS). The sample mainly includes enterprise units (i.e. headquarters of businesses) but also has a small number of local units (i.e. sites belonging to enterprises).
BEIS sampling methodology is described in their report and accompanying statistics: https://assets.publishing.service.gov.uk/government/uploads/system/uploads/attachment_data/file/506953/bis-16-134-uk-innovation-survey-2015.pdf. Owing to the small sample sizes achieved after application of the rural-urban definition, this analysis has been presented as the unweighted results from the surveyed sample. Some settlement types were underrepresented in the sample and should be treated with caution: rural town & fringe and rural village & hamlet. Furthermore, percentage totals for England may not match those published by BEIS due to minor discrepancies with postcode data.
The description of innovation activity in the chart and table above includes businesses that were engaged in any of the following:
1. introduced a new or significantly improved product (good or service) or process
2. engaged in innovation projects that have been abandoned or are not yet complete
3. undertaken new and significantly improved forms of organisation, business structures or practices, and marketing concepts or strategies
4. undertaken activities in areas such as internal research and development, training, acquisition of external knowledge or machinery, and equipment linked to innovation activities
A business engaged in any of the activities 1 to 4 is described as a ‘broader innovator’.
Data from the 2015 UK Innovation Survey may not be directly comparable with data from previous surveys due to changes in survey mode, methodology, sampling approach, questionnaire design and response rate. The rural-urban analyses presented here were performed by applying RUC11 to the data, RUC01 had been used previously for the 2011 UK Innovation Survey. As a result, a comparison cannot be made with previous rural-urban innovation analyses
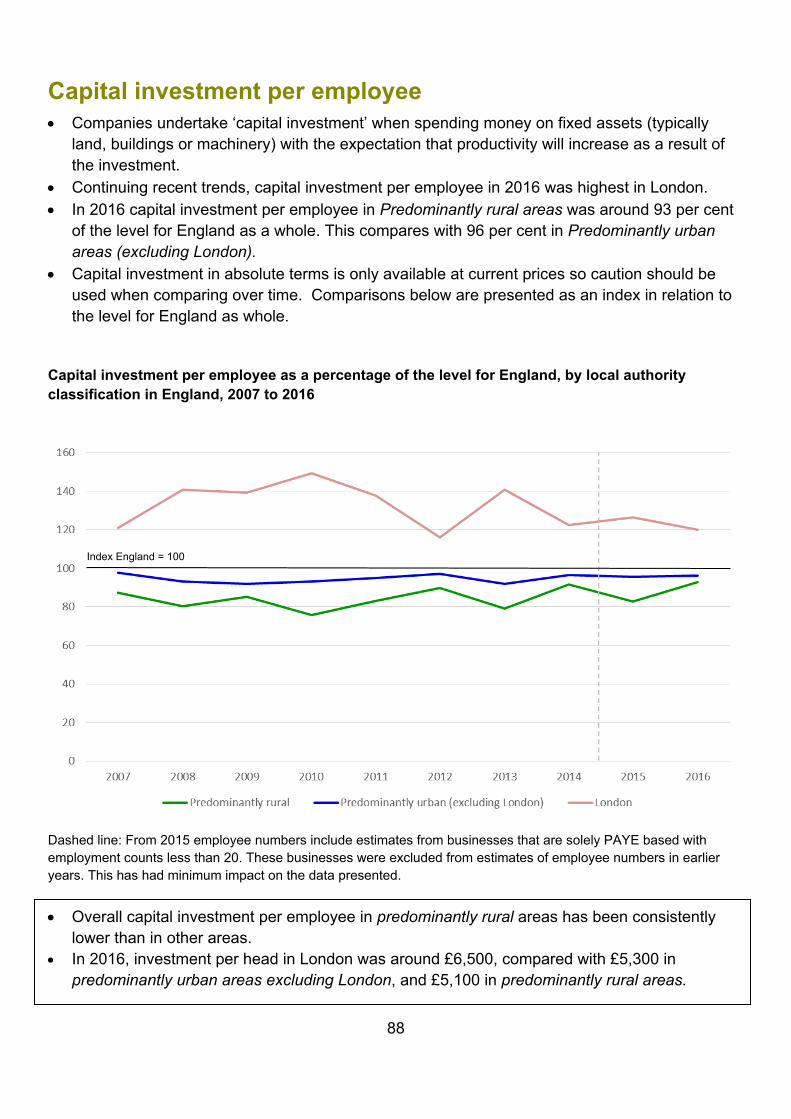
88
Capital investment per employee • Companies undertake ‘capital investment’ when spending money on fixed assets (typically
land, buildings or machinery) with the expectation that productivity will increase as a result of the investment.
• Continuing recent trends, capital investment per employee in 2016 was highest in London. • In 2016 capital investment per employee in Predominantly rural areas was around 93 per cent
of the level for England as a whole. This compares with 96 per cent in Predominantly urban areas (excluding London).
• Capital investment in absolute terms is only available at current prices so caution should be used when comparing over time. Comparisons below are presented as an index in relation to the level for England as whole.
Capital investment per employee as a percentage of the level for England, by local authority classification in England, 2007 to 2016
Dashed line: From 2015 employee numbers include estimates from businesses that are solely PAYE based with employment counts less than 20. These businesses were excluded from estimates of employee numbers in earlier years. This has had minimum impact on the data presented. • Overall capital investment per employee in predominantly rural areas has been consistently
lower than in other areas. • In 2016, investment per head in London was around £6,500, compared with £5,300 in
predominantly urban areas excluding London, and £5,100 in predominantly rural areas.
Index England = 100
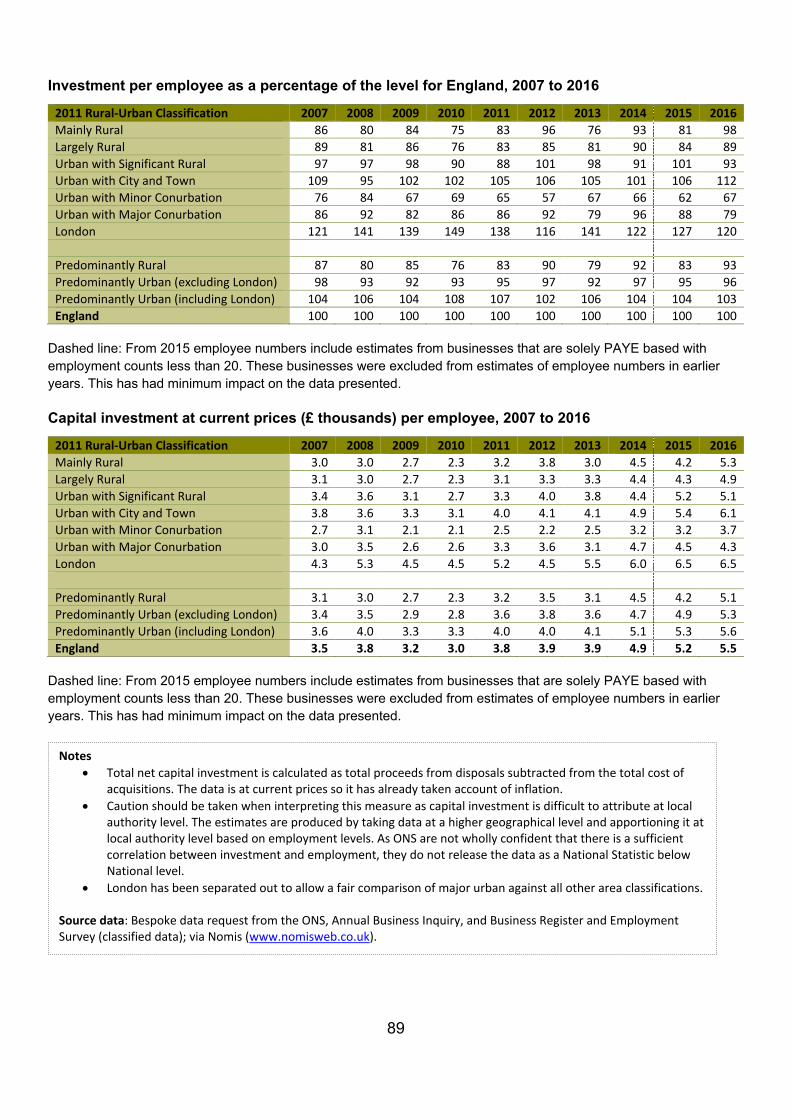
89
Investment per employee as a percentage of the level for England, 2007 to 2016
2011 Rural-Urban Classification 2007 2008 2009 2010 2011 2012 2013 2014 2015 2016 Mainly Rural 86 80 84 75 83 96 76 93 81 98 Largely Rural 89 81 86 76 83 85 81 90 84 89 Urban with Significant Rural 97 97 98 90 88 101 98 91 101 93 Urban with City and Town 109 95 102 102 105 106 105 101 106 112 Urban with Minor Conurbation 76 84 67 69 65 57 67 66 62 67 Urban with Major Conurbation 86 92 82 86 86 92 79 96 88 79 London 121 141 139 149 138 116 141 122 127 120 Predominantly Rural 87 80 85 76 83 90 79 92 83 93 Predominantly Urban (excluding London) 98 93 92 93 95 97 92 97 95 96 Predominantly Urban (including London) 104 106 104 108 107 102 106 104 104 103 England 100 100 100 100 100 100 100 100 100 100
Dashed line: From 2015 employee numbers include estimates from businesses that are solely PAYE based with employment counts less than 20. These businesses were excluded from estimates of employee numbers in earlier years. This has had minimum impact on the data presented.
Capital investment at current prices (£ thousands) per employee, 2007 to 2016
2011 Rural-Urban Classification 2007 2008 2009 2010 2011 2012 2013 2014 2015 2016 Mainly Rural 3.0 3.0 2.7 2.3 3.2 3.8 3.0 4.5 4.2 5.3 Largely Rural 3.1 3.0 2.7 2.3 3.1 3.3 3.3 4.4 4.3 4.9 Urban with Significant Rural 3.4 3.6 3.1 2.7 3.3 4.0 3.8 4.4 5.2 5.1 Urban with City and Town 3.8 3.6 3.3 3.1 4.0 4.1 4.1 4.9 5.4 6.1 Urban with Minor Conurbation 2.7 3.1 2.1 2.1 2.5 2.2 2.5 3.2 3.2 3.7 Urban with Major Conurbation 3.0 3.5 2.6 2.6 3.3 3.6 3.1 4.7 4.5 4.3 London 4.3 5.3 4.5 4.5 5.2 4.5 5.5 6.0 6.5 6.5 Predominantly Rural 3.1 3.0 2.7 2.3 3.2 3.5 3.1 4.5 4.2 5.1 Predominantly Urban (excluding London) 3.4 3.5 2.9 2.8 3.6 3.8 3.6 4.7 4.9 5.3 Predominantly Urban (including London) 3.6 4.0 3.3 3.3 4.0 4.0 4.1 5.1 5.3 5.6 England 3.5 3.8 3.2 3.0 3.8 3.9 3.9 4.9 5.2 5.5
Dashed line: From 2015 employee numbers include estimates from businesses that are solely PAYE based with employment counts less than 20. These businesses were excluded from estimates of employee numbers in earlier years. This has had minimum impact on the data presented.
Notes • Total net capital investment is calculated as total proceeds from disposals subtracted from the total cost of
acquisitions. The data is at current prices so it has already taken account of inflation. • Caution should be taken when interpreting this measure as capital investment is difficult to attribute at local
authority level. The estimates are produced by taking data at a higher geographical level and apportioning it at local authority level based on employment levels. As ONS are not wholly confident that there is a sufficient correlation between investment and employment, they do not release the data as a National Statistic below National level.
• London has been separated out to allow a fair comparison of major urban against all other area classifications. Source data: Bespoke data request from the ONS, Annual Business Inquiry, and Business Register and Employment Survey (classified data); via Nomis (www.nomisweb.co.uk).
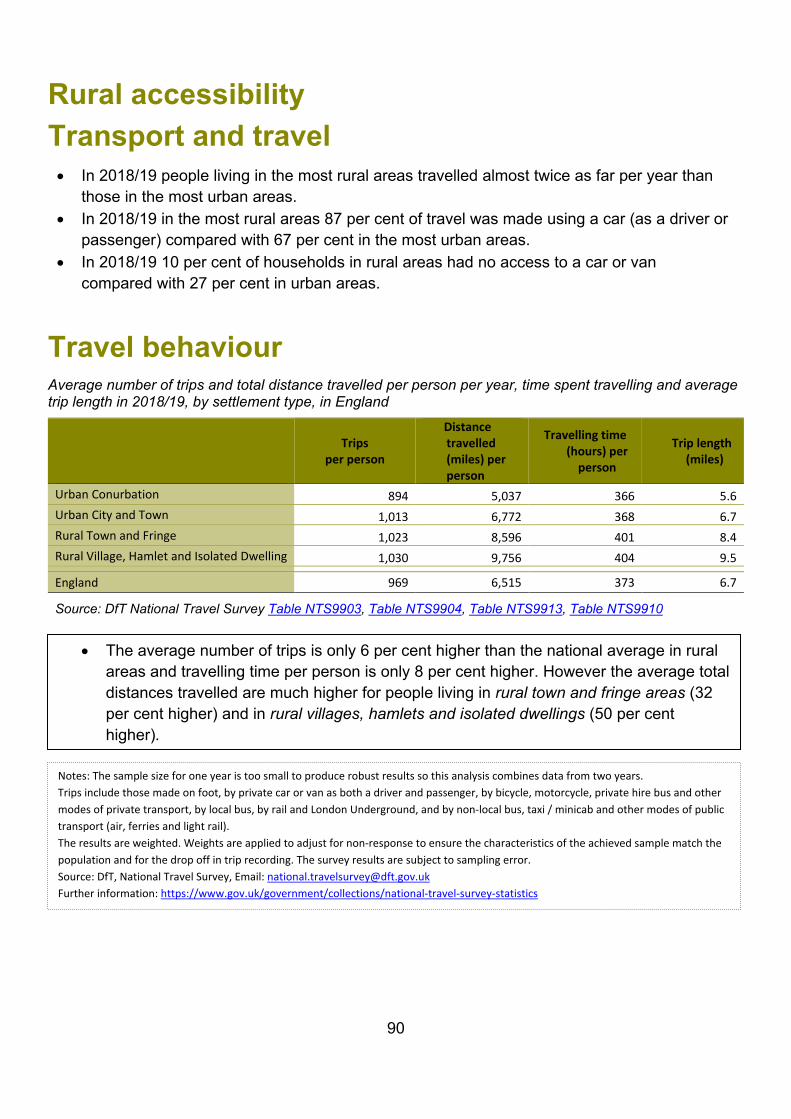
90
Rural accessibility Transport and travel
Travel behaviour Average number of trips and total distance travelled per person per year, time spent travelling and average trip length in 2018/19, by settlement type, in England
Trips per person
Distance travelled (miles) per person
Travelling time (hours) per
person
Trip length (miles)
Urban Conurbation 894 5,037 366 5.6 Urban City and Town 1,013 6,772 368 6.7 Rural Town and Fringe 1,023 8,596 401 8.4 Rural Village, Hamlet and Isolated Dwelling 1,030 9,756 404 9.5
England 969 6,515 373 6.7
Source: DfT National Travel Survey Table NTS9903, Table NTS9904, Table NTS9913, Table NTS9910
• In 2018/19 people living in the most rural areas travelled almost twice as far per year than those in the most urban areas.
• In 2018/19 in the most rural areas 87 per cent of travel was made using a car (as a driver or passenger) compared with 67 per cent in the most urban areas.
• In 2018/19 10 per cent of households in rural areas had no access to a car or van compared with 27 per cent in urban areas.
• The average number of trips is only 6 per cent higher than the national average in rural areas and travelling time per person is only 8 per cent higher. However the average total distances travelled are much higher for people living in rural town and fringe areas (32 per cent higher) and in rural villages, hamlets and isolated dwellings (50 per cent higher).
Notes: The sample size for one year is too small to produce robust results so this analysis combines data from two years. Trips include those made on foot, by private car or van as both a driver and passenger, by bicycle, motorcycle, private hire bus and other modes of private transport, by local bus, by rail and London Underground, and by non-local bus, taxi / minicab and other modes of public transport (air, ferries and light rail). The results are weighted. Weights are applied to adjust for non-response to ensure the characteristics of the achieved sample match the population and for the drop off in trip recording. The survey results are subject to sampling error. Source: DfT, National Travel Survey, Email: [email protected] Further information: https://www.gov.uk/government/collections/national-travel-survey-statistics

91
Distance travelled Average total distance travelled, per person per year, by mode and settlement type, in England, 2018/19
Average total distance travelled, per person per year, by mode and settlement type, in England, 2018/19
Miles per person per year
Walk Car/van
driver Car / van
passenger Local
bus Rail Other All modes
Urban Conurbation 212 2,096 1,277 311 837 303 5,037 Urban City and Town 223 3,434 1,910 178 702 326 6,772 Rural Town and Fringe 183 4,741 2,612 238 477 344 8,596 Rural Village, Hamlet and Isolated Dwelling 131 5,715 2,750 153 599 408 9,756
England 207 3,225 1,798 233 726 326 6,515 Source: DfT National Travel Survey Table NTS9904
• In 2018/19 people living in rural villages, hamlets and isolated dwellings travelled 9,756 miles on average compared with 5,037 in urban conurbation and 6,515 in England as a whole.
• When travel as both a car driver and passenger are taken together, 87 per cent of the distance travelled by people living in rural villages, hamlets and isolated dwellings was made by car compared with 67 per cent in urban conurbations and 77 per cent in England as a whole.
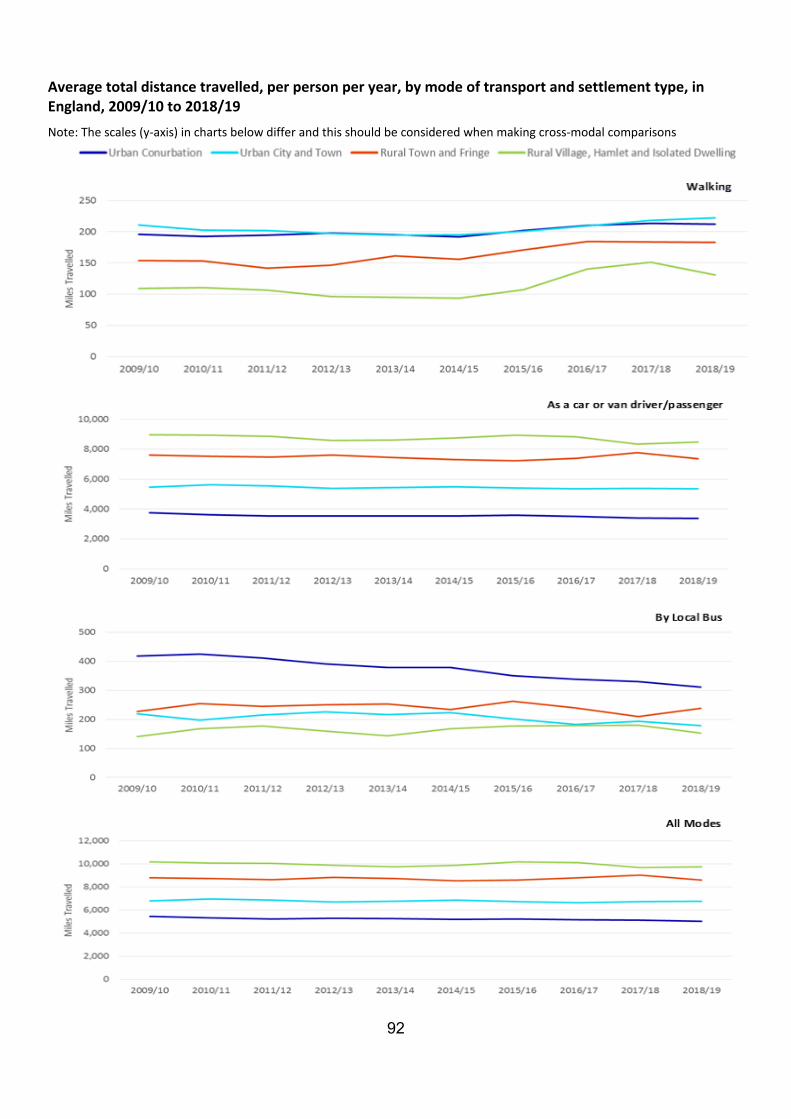
92
Average total distance travelled, per person per year, by mode of transport and settlement type, in England, 2009/10 to 2018/19 Note: The scales (y-axis) in charts below differ and this should be considered when making cross-modal comparisons

93
Average total distance travelled, per person per year, by mode and settlement type, in England, 2009/10 to 2018/19
Miles per person per year 2009/10 2010/11 2011/12 2012/13 2013/14 2014/15 2015/16 2016/17 2017/18 2018/19 Walk
Urban Conurbation 196 192 194 198 195 192 202 210 213 212 Urban City and Town 211 203 202 197 194 195 200 209 218 223 Rural Town and Fringe 154 153 142 146 161 156 171 184 184 183 Rural Village, Hamlet and Isolated Dwelling 109 111 106 97 95 94 107 141 151 131
Car/van Urban Conurbation 3,755 3,629 3,544 3,533 3,531 3,522 3,582 3,507 3,402 3,373 Urban City and Town 5,452 5,636 5,537 5,392 5,441 5,477 5,399 5,351 5,380 5,343 Rural Town and Fringe 7,597 7,539 7,482 7,599 7,455 7,316 7,225 7,395 7,759 7,353 Rural Village, Hamlet and Isolated Dwelling 8,961 8,927 8,844 8,599 8,612 8,738 8,925 8,827 8,345 8,465
Local Bus
Urban Conurbation 418 426 411 391 378 379 350 338 331 311 Urban City and Town 219 198 215 226 216 223 201 183 193 178 Rural Town and Fringe 227 254 245 250 253 235 262 240 210 238 Rural Village, Hamlet and Isolated Dwelling 140 168 178 159 143 168 177 179 180 153
All Modes
Urban Conurbation 5,471 5,324 5,228 5,282 5,253 5,202 5,223 5,175 5,113 5,037 Urban City and Town 6,785 6,966 6,880 6,716 6,753 6,849 6,749 6,639 6,743 6,772 Rural Town and Fringe 8,801 8,730 8,642 8,828 8,727 8,536 8,593 8,787 9,022 8,596 Rural Village, Hamlet and Isolated Dwelling 10,157 10,063 10,034 9,871 9,737 9,867 10,162 10,122 9,665 9,756
Notes: The sample size for one year is too small to produce robust results so this analysis combines data from two years. Distance by mode is based on stage distance. Local Bus includes London buses. Rail includes London Underground. Other includes: bicycle, motorcycle, private hire bus, other modes of private transport, non-local bus, taxi / minicab and other modes of public transport (air, ferries, light rail). These data are available broken down into these more discrete categories in the accompanying Excel document but were presented in this manner in the digest for clarity - https://www.gov.uk/government/statistics/national-travel-survey-2019- National Travel Survey: 2019 Tables, Table NTS9904 . The results are weighted. Weights are applied to adjust for non-response to ensure the characteristics of the achieved sample match the population and for the drop off in trip recording. The survey results are subject to sampling error. Source: DfT, National Travel Survey, Email: [email protected] Further information: https://www.gov.uk/government/collections/national-travel-survey-statistics
• The miles travelled by walking has increased more in rural areas than in urban areas over the period 2009/10 to 2018/19. Average distance travelled by those from rural villages, hamlets and isolated dwellings has increased by 22 miles (17 per cent) and by those living in rural town and fringe by 29 miles (16 per cent).
• The miles travelled by local bus has decreased by 107 miles per person per year urban conurbations over the period 2009/10 to 2018/19. Miles travelled by local bus has increased slightly in rural areas over the same time period.
• The distance travelled by car has remained stable over the period 2009/10 to 2018/19 across all settlement types.
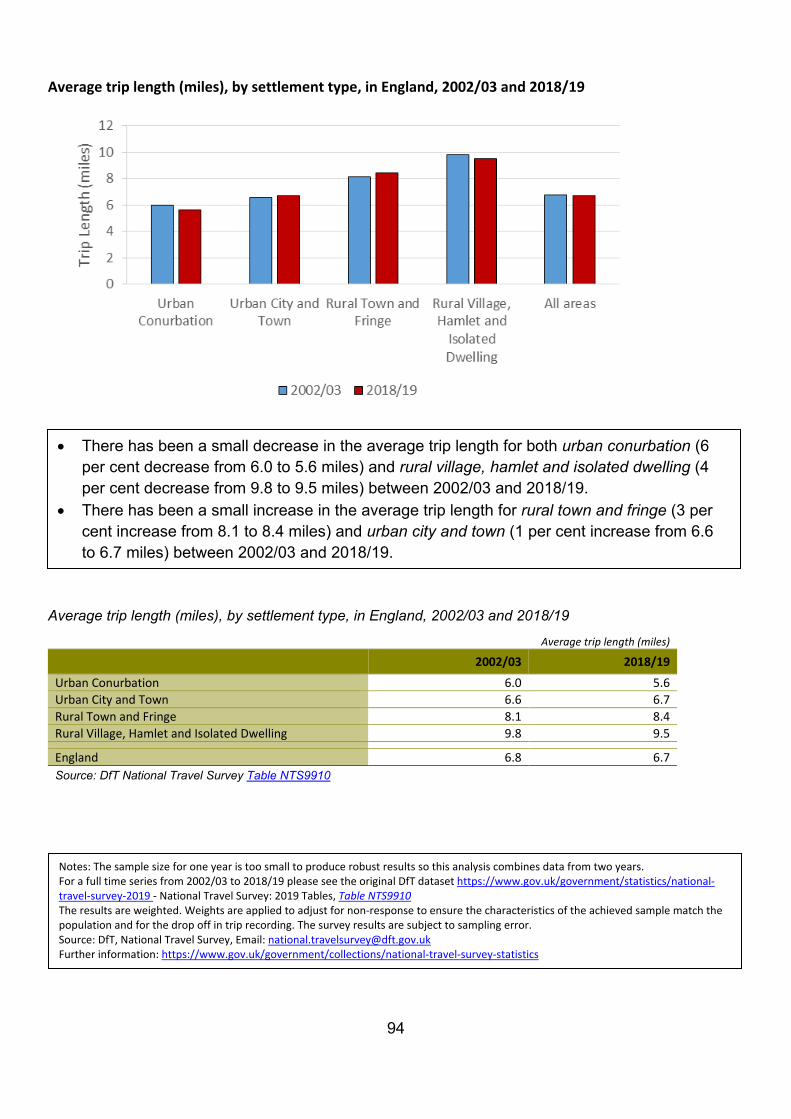
94
Notes: The sample size for one year is too small to produce robust results so this analysis combines data from two years. For a full time series from 2002/03 to 2018/19 please see the original DfT dataset https://www.gov.uk/government/statistics/national-travel-survey-2019 - National Travel Survey: 2019 Tables, Table NTS9910 The results are weighted. Weights are applied to adjust for non-response to ensure the characteristics of the achieved sample match the population and for the drop off in trip recording. The survey results are subject to sampling error. Source: DfT, National Travel Survey, Email: [email protected] Further information: https://www.gov.uk/government/collections/national-travel-survey-statistics
Average trip length (miles), by settlement type, in England, 2002/03 and 2018/19
Average trip length (miles), by settlement type, in England, 2002/03 and 2018/19 Average trip length (miles)
2002/03 2018/19 Urban Conurbation 6.0 5.6 Urban City and Town 6.6 6.7 Rural Town and Fringe 8.1 8.4 Rural Village, Hamlet and Isolated Dwelling 9.8 9.5
England 6.8 6.7 Source: DfT National Travel Survey Table NTS9910
• There has been a small decrease in the average trip length for both urban conurbation (6 per cent decrease from 6.0 to 5.6 miles) and rural village, hamlet and isolated dwelling (4 per cent decrease from 9.8 to 9.5 miles) between 2002/03 and 2018/19.
• There has been a small increase in the average trip length for rural town and fringe (3 per cent increase from 8.1 to 8.4 miles) and urban city and town (1 per cent increase from 6.6 to 6.7 miles) between 2002/03 and 2018/19.
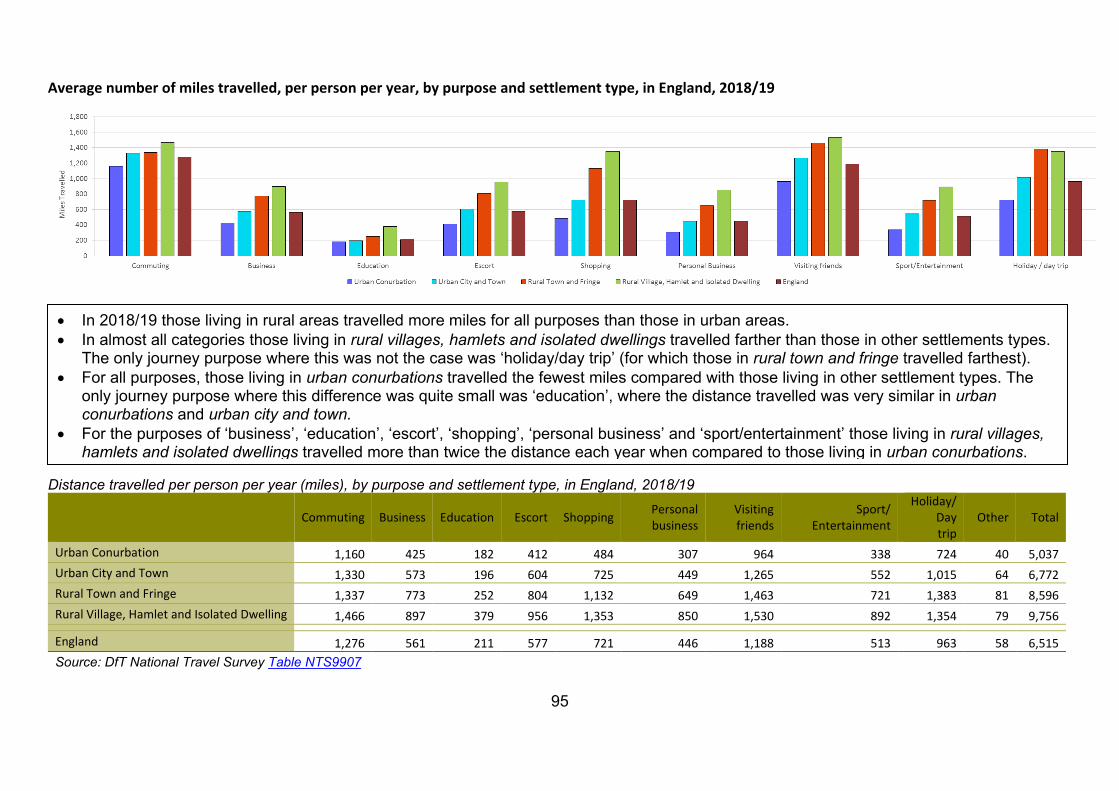
95
Average number of miles travelled, per person per year, by purpose and settlement type, in England, 2018/19
Distance travelled per person per year (miles), by purpose and settlement type, in England, 2018/19
Commuting Business Education Escort Shopping Personal
business Visiting friends
Sport/ Entertainment
Holiday/ Day trip
Other Total
Urban Conurbation 1,160 425 182 412 484 307 964 338 724 40 5,037 Urban City and Town 1,330 573 196 604 725 449 1,265 552 1,015 64 6,772 Rural Town and Fringe 1,337 773 252 804 1,132 649 1,463 721 1,383 81 8,596 Rural Village, Hamlet and Isolated Dwelling 1,466 897 379 956 1,353 850 1,530 892 1,354 79 9,756
England 1,276 561 211 577 721 446 1,188 513 963 58 6,515 Source: DfT National Travel Survey Table NTS9907
• In 2018/19 those living in rural areas travelled more miles for all purposes than those in urban areas. • In almost all categories those living in rural villages, hamlets and isolated dwellings travelled farther than those in other settlements types.
The only journey purpose where this was not the case was ‘holiday/day trip’ (for which those in rural town and fringe travelled farthest). • For all purposes, those living in urban conurbations travelled the fewest miles compared with those living in other settlement types. The
only journey purpose where this difference was quite small was ‘education’, where the distance travelled was very similar in urban conurbations and urban city and town.
• For the purposes of ‘business’, ‘education’, ‘escort’, ‘shopping’, ‘personal business’ and ‘sport/entertainment’ those living in rural villages, hamlets and isolated dwellings travelled more than twice the distance each year when compared to those living in urban conurbations.

96
Notes: The sample size for one year is too small to produce robust results so this analysis combines data from two years. The ‘escort’ category contains both escorting to education institutions and other escorting. The ‘visiting friends’ category contains both visiting friends at a private home and visiting friends elsewhere. These data are available broken down into these more discrete categories in the accompanying Excel document but were presented in this manner in the digest for clarity -https://www.gov.uk/government/statistics/national-travel-survey-2019 - National Travel Survey: 2019 Tables, Table NTS9907 The results are weighted. Weights are applied to adjust for non-response to ensure the characteristics of the achieved sample match the population and for the drop off in trip recording. The survey results are subject to sampling error. Source: DfT, National Travel Survey, Email: [email protected] Further information: https://www.gov.uk/government/collections/national-travel-survey-statistics
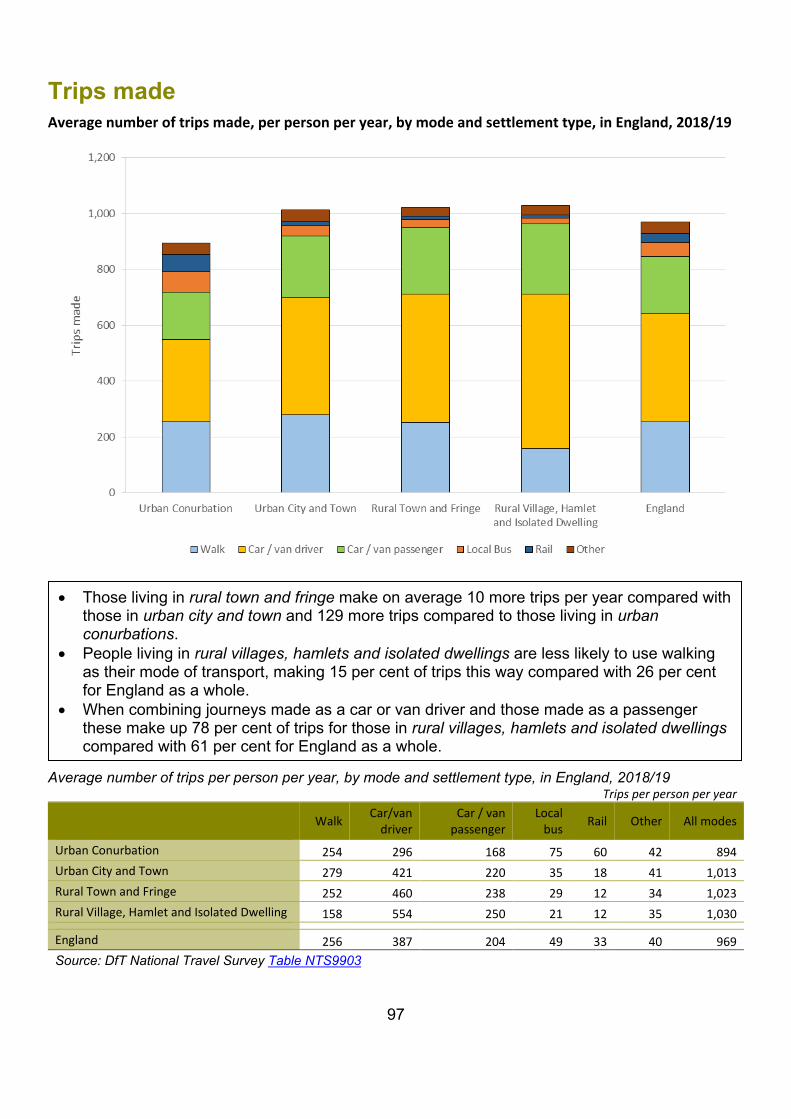
97
Trips made Average number of trips made, per person per year, by mode and settlement type, in England, 2018/19
Average number of trips per person per year, by mode and settlement type, in England, 2018/19
Trips per person per year
Walk Car/van
driver Car / van
passenger Local
bus Rail Other All modes
Urban Conurbation 254 296 168 75 60 42 894 Urban City and Town 279 421 220 35 18 41 1,013 Rural Town and Fringe 252 460 238 29 12 34 1,023 Rural Village, Hamlet and Isolated Dwelling 158 554 250 21 12 35 1,030
England 256 387 204 49 33 40 969 Source: DfT National Travel Survey Table NTS9903
• Those living in rural town and fringe make on average 10 more trips per year compared with those in urban city and town and 129 more trips compared to those living in urban conurbations.
• People living in rural villages, hamlets and isolated dwellings are less likely to use walking as their mode of transport, making 15 per cent of trips this way compared with 26 per cent for England as a whole.
• When combining journeys made as a car or van driver and those made as a passenger these make up 78 per cent of trips for those in rural villages, hamlets and isolated dwellings compared with 61 per cent for England as a whole.
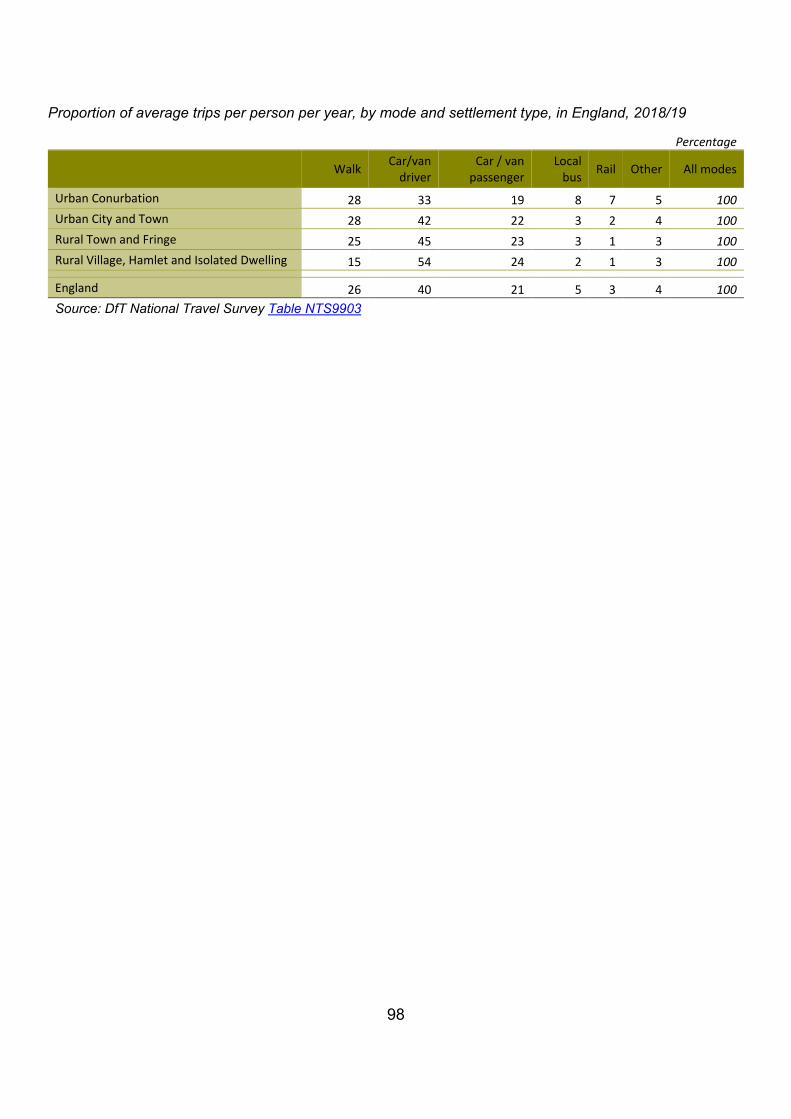
98
Proportion of average trips per person per year, by mode and settlement type, in England, 2018/19
Percentage
Walk Car/van
driver Car / van
passenger Local
bus Rail Other All modes
Urban Conurbation 28 33 19 8 7 5 100 Urban City and Town 28 42 22 3 2 4 100 Rural Town and Fringe 25 45 23 3 1 3 100 Rural Village, Hamlet and Isolated Dwelling 15 54 24 2 1 3 100
England 26 40 21 5 3 4 100 Source: DfT National Travel Survey Table NTS9903
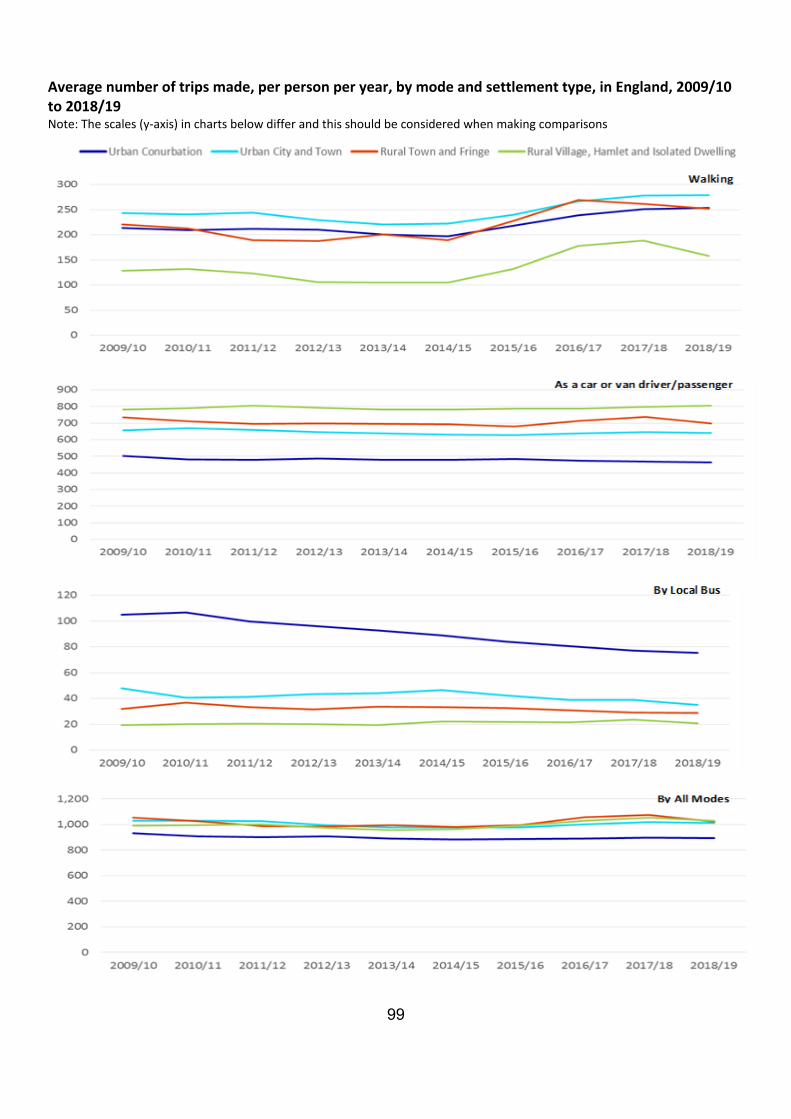
99
Average number of trips made, per person per year, by mode and settlement type, in England, 2009/10 to 2018/19 Note: The scales (y-axis) in charts below differ and this should be considered when making comparisons
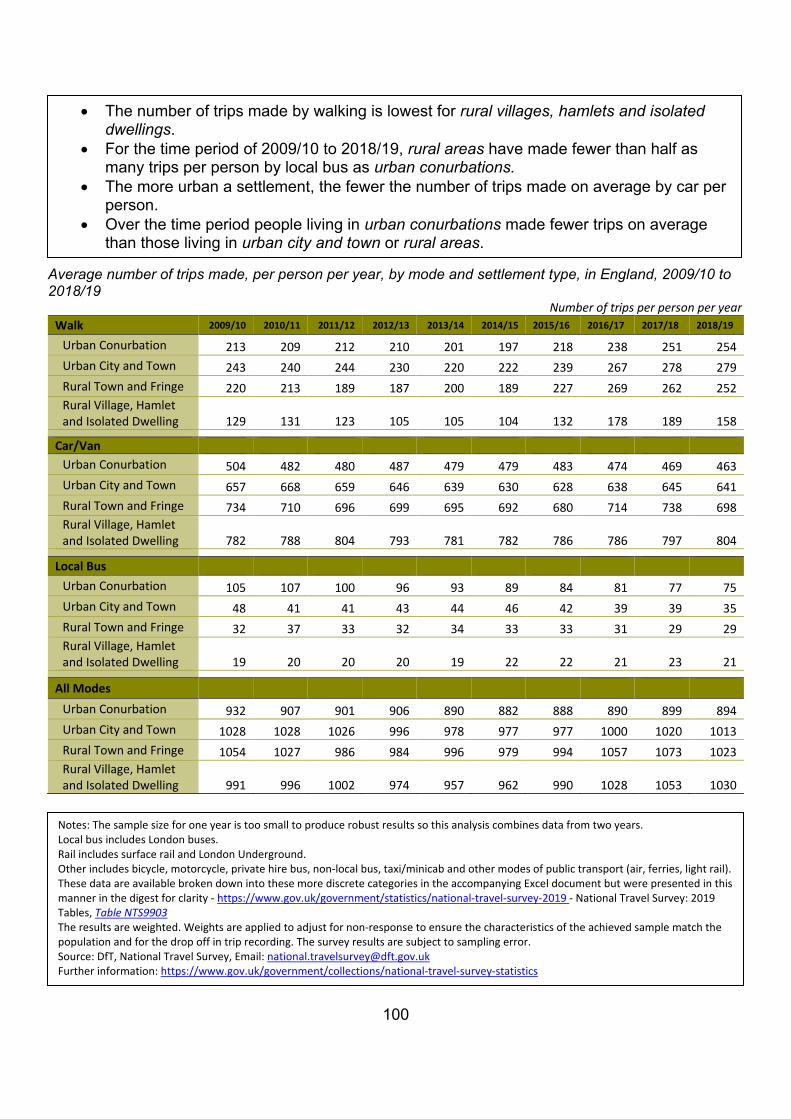
100
Average number of trips made, per person per year, by mode and settlement type, in England, 2009/10 to 2018/19
Number of trips per person per year Walk 2009/10 2010/11 2011/12 2012/13 2013/14 2014/15 2015/16 2016/17 2017/18 2018/19
Urban Conurbation 213 209 212 210 201 197 218 238 251 254 Urban City and Town 243 240 244 230 220 222 239 267 278 279 Rural Town and Fringe 220 213 189 187 200 189 227 269 262 252 Rural Village, Hamlet and Isolated Dwelling 129 131 123 105 105 104 132 178 189 158
Car/Van Urban Conurbation 504 482 480 487 479 479 483 474 469 463 Urban City and Town 657 668 659 646 639 630 628 638 645 641 Rural Town and Fringe 734 710 696 699 695 692 680 714 738 698 Rural Village, Hamlet and Isolated Dwelling 782 788 804 793 781 782 786 786 797 804
Local Bus
Urban Conurbation 105 107 100 96 93 89 84 81 77 75 Urban City and Town 48 41 41 43 44 46 42 39 39 35 Rural Town and Fringe 32 37 33 32 34 33 33 31 29 29 Rural Village, Hamlet and Isolated Dwelling 19 20 20 20 19 22 22 21 23 21
All Modes
Urban Conurbation 932 907 901 906 890 882 888 890 899 894 Urban City and Town 1028 1028 1026 996 978 977 977 1000 1020 1013 Rural Town and Fringe 1054 1027 986 984 996 979 994 1057 1073 1023 Rural Village, Hamlet and Isolated Dwelling 991 996 1002 974 957 962 990 1028 1053 1030
Notes: The sample size for one year is too small to produce robust results so this analysis combines data from two years. Local bus includes London buses. Rail includes surface rail and London Underground. Other includes bicycle, motorcycle, private hire bus, non-local bus, taxi/minicab and other modes of public transport (air, ferries, light rail). These data are available broken down into these more discrete categories in the accompanying Excel document but were presented in this manner in the digest for clarity - https://www.gov.uk/government/statistics/national-travel-survey-2019 - National Travel Survey: 2019 Tables, Table NTS9903 The results are weighted. Weights are applied to adjust for non-response to ensure the characteristics of the achieved sample match the population and for the drop off in trip recording. The survey results are subject to sampling error. Source: DfT, National Travel Survey, Email: [email protected] Further information: https://www.gov.uk/government/collections/national-travel-survey-statistics
• The number of trips made by walking is lowest for rural villages, hamlets and isolated dwellings.
• For the time period of 2009/10 to 2018/19, rural areas have made fewer than half as many trips per person by local bus as urban conurbations.
• The more urban a settlement, the fewer the number of trips made on average by car per person.
• Over the time period people living in urban conurbations made fewer trips on average than those living in urban city and town or rural areas.
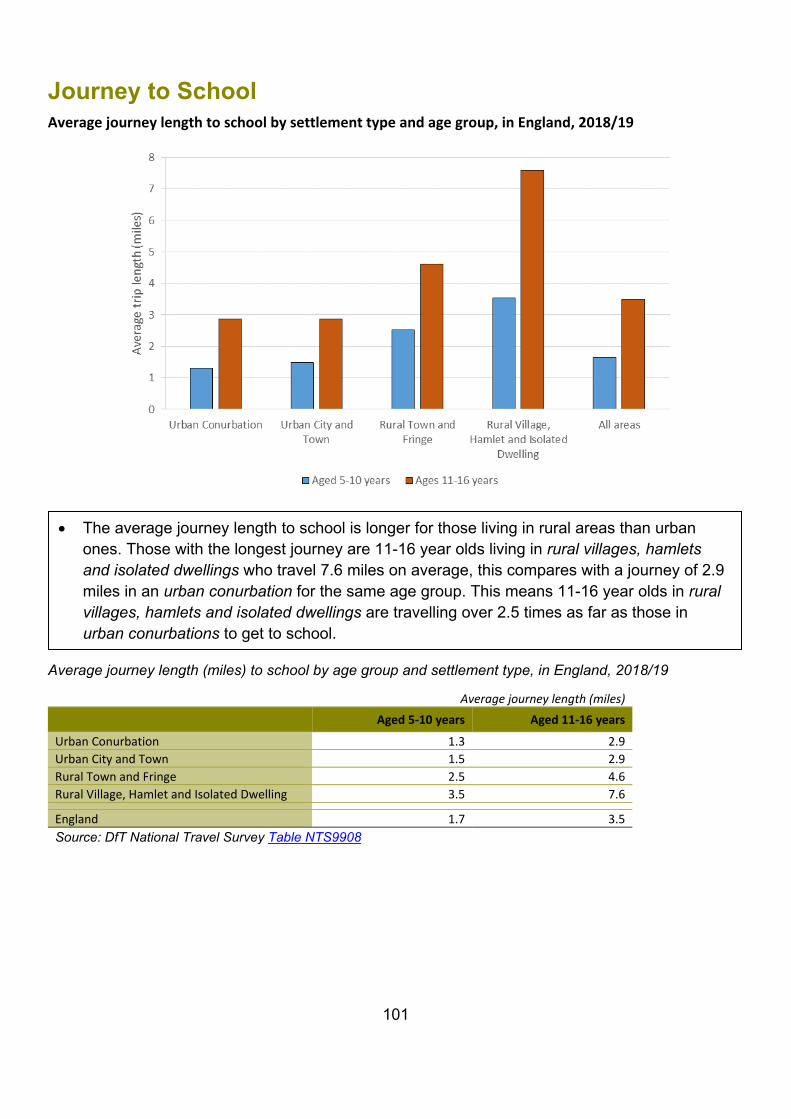
101
Journey to School Average journey length to school by settlement type and age group, in England, 2018/19
Average journey length (miles) to school by age group and settlement type, in England, 2018/19
Average journey length (miles) Aged 5-10 years Aged 11-16 years
Urban Conurbation 1.3 2.9 Urban City and Town 1.5 2.9 Rural Town and Fringe 2.5 4.6 Rural Village, Hamlet and Isolated Dwelling 3.5 7.6
England 1.7 3.5 Source: DfT National Travel Survey Table NTS9908
• The average journey length to school is longer for those living in rural areas than urban ones. Those with the longest journey are 11-16 year olds living in rural villages, hamlets and isolated dwellings who travel 7.6 miles on average, this compares with a journey of 2.9 miles in an urban conurbation for the same age group. This means 11-16 year olds in rural villages, hamlets and isolated dwellings are travelling over 2.5 times as far as those in urban conurbations to get to school.
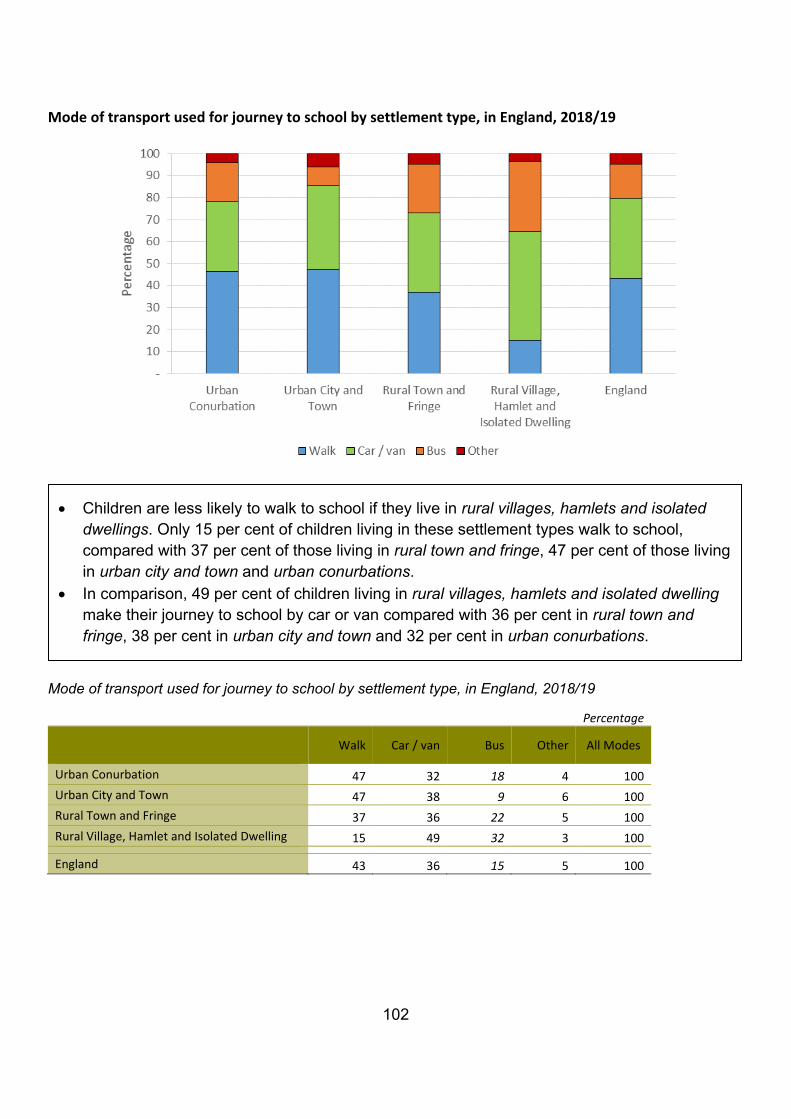
102
Mode of transport used for journey to school by settlement type, in England, 2018/19
Mode of transport used for journey to school by settlement type, in England, 2018/19
Percentage
Walk Car / van Bus Other All Modes
Urban Conurbation 47 32 18 4 100 Urban City and Town 47 38 9 6 100 Rural Town and Fringe 37 36 22 5 100 Rural Village, Hamlet and Isolated Dwelling 15 49 32 3 100
England 43 36 15 5 100
• Children are less likely to walk to school if they live in rural villages, hamlets and isolated dwellings. Only 15 per cent of children living in these settlement types walk to school, compared with 37 per cent of those living in rural town and fringe, 47 per cent of those living in urban city and town and urban conurbations.
• In comparison, 49 per cent of children living in rural villages, hamlets and isolated dwelling make their journey to school by car or van compared with 36 per cent in rural town and fringe, 38 per cent in urban city and town and 32 per cent in urban conurbations.
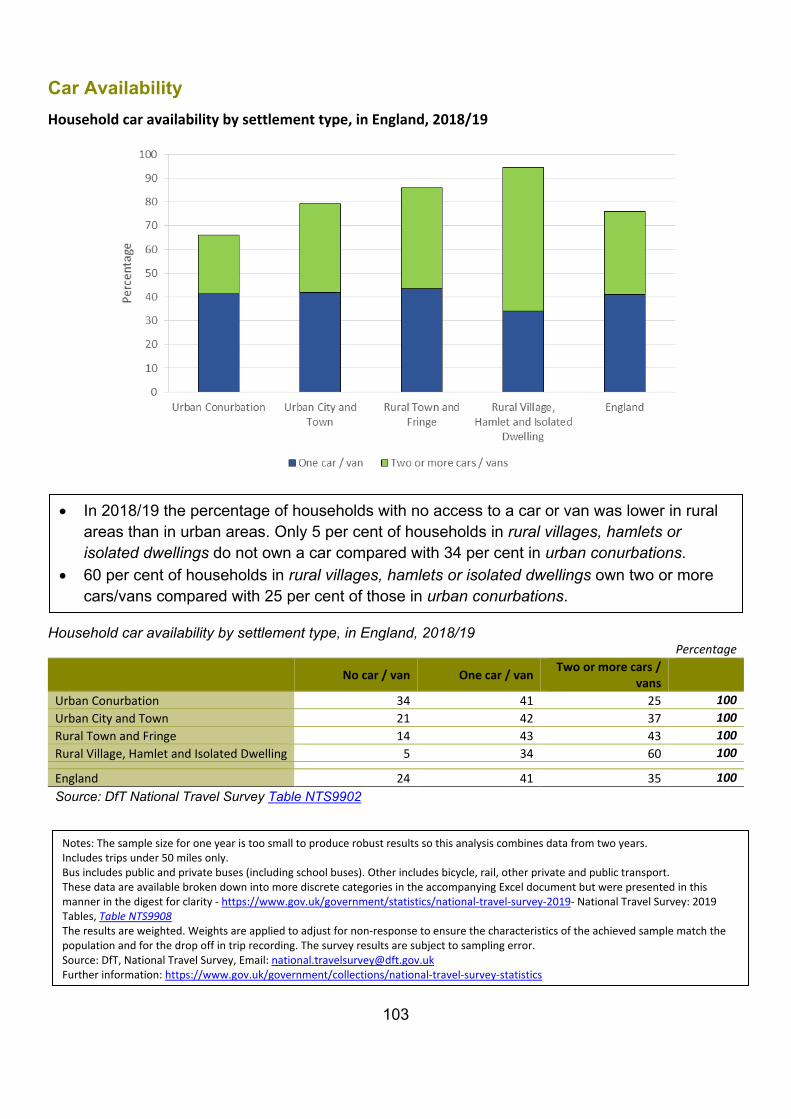
103
Car Availability
Household car availability by settlement type, in England, 2018/19
Household car availability by settlement type, in England, 2018/19
Percentage
No car / van One car / van Two or more cars / vans
Urban Conurbation 34 41 25 100 Urban City and Town 21 42 37 100 Rural Town and Fringe 14 43 43 100 Rural Village, Hamlet and Isolated Dwelling 5 34 60 100
England 24 41 35 100 Source: DfT National Travel Survey Table NTS9902
• In 2018/19 the percentage of households with no access to a car or van was lower in rural areas than in urban areas. Only 5 per cent of households in rural villages, hamlets or isolated dwellings do not own a car compared with 34 per cent in urban conurbations.
• 60 per cent of households in rural villages, hamlets or isolated dwellings own two or more cars/vans compared with 25 per cent of those in urban conurbations.
Notes: The sample size for one year is too small to produce robust results so this analysis combines data from two years. Includes trips under 50 miles only. Bus includes public and private buses (including school buses). Other includes bicycle, rail, other private and public transport. These data are available broken down into more discrete categories in the accompanying Excel document but were presented in this manner in the digest for clarity - https://www.gov.uk/government/statistics/national-travel-survey-2019- National Travel Survey: 2019 Tables, Table NTS9908 The results are weighted. Weights are applied to adjust for non-response to ensure the characteristics of the achieved sample match the population and for the drop off in trip recording. The survey results are subject to sampling error. Source: DfT, National Travel Survey, Email: [email protected] Further information: https://www.gov.uk/government/collections/national-travel-survey-statistics
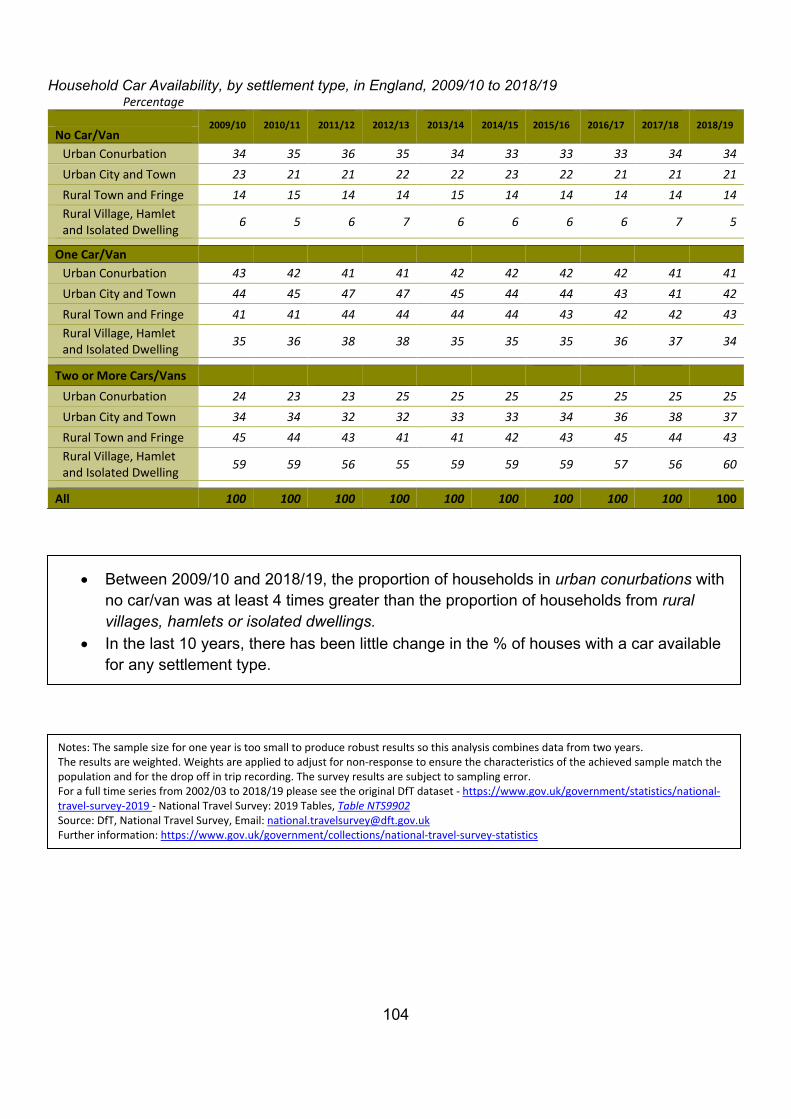
104
Household Car Availability, by settlement type, in England, 2009/10 to 2018/19 Percentage
2009/10 2010/11 2011/12 2012/13 2013/14 2014/15 2015/16 2016/17 2017/18 2018/19 No Car/Van
Urban Conurbation 34 35 36 35 34 33 33 33 34 34 Urban City and Town 23 21 21 22 22 23 22 21 21 21 Rural Town and Fringe 14 15 14 14 15 14 14 14 14 14 Rural Village, Hamlet and Isolated Dwelling 6 5 6 7 6 6 6 6 7 5
One Car/Van Urban Conurbation 43 42 41 41 42 42 42 42 41 41 Urban City and Town 44 45 47 47 45 44 44 43 41 42 Rural Town and Fringe 41 41 44 44 44 44 43 42 42 43 Rural Village, Hamlet and Isolated Dwelling 35 36 38 38 35 35 35 36 37 34
Two or More Cars/Vans
Urban Conurbation 24 23 23 25 25 25 25 25 25 25 Urban City and Town 34 34 32 32 33 33 34 36 38 37 Rural Town and Fringe 45 44 43 41 41 42 43 45 44 43 Rural Village, Hamlet and Isolated Dwelling 59 59 56 55 59 59 59 57 56 60
All 100 100 100 100 100 100 100 100 100 100
Notes: The sample size for one year is too small to produce robust results so this analysis combines data from two years. The results are weighted. Weights are applied to adjust for non-response to ensure the characteristics of the achieved sample match the population and for the drop off in trip recording. The survey results are subject to sampling error. For a full time series from 2002/03 to 2018/19 please see the original DfT dataset - https://www.gov.uk/government/statistics/national-travel-survey-2019 - National Travel Survey: 2019 Tables, Table NTS9902 Source: DfT, National Travel Survey, Email: [email protected] Further information: https://www.gov.uk/government/collections/national-travel-survey-statistics
• Between 2009/10 and 2018/19, the proportion of households in urban conurbations with no car/van was at least 4 times greater than the proportion of households from rural villages, hamlets or isolated dwellings.
• In the last 10 years, there has been little change in the % of houses with a car available for any settlement type.
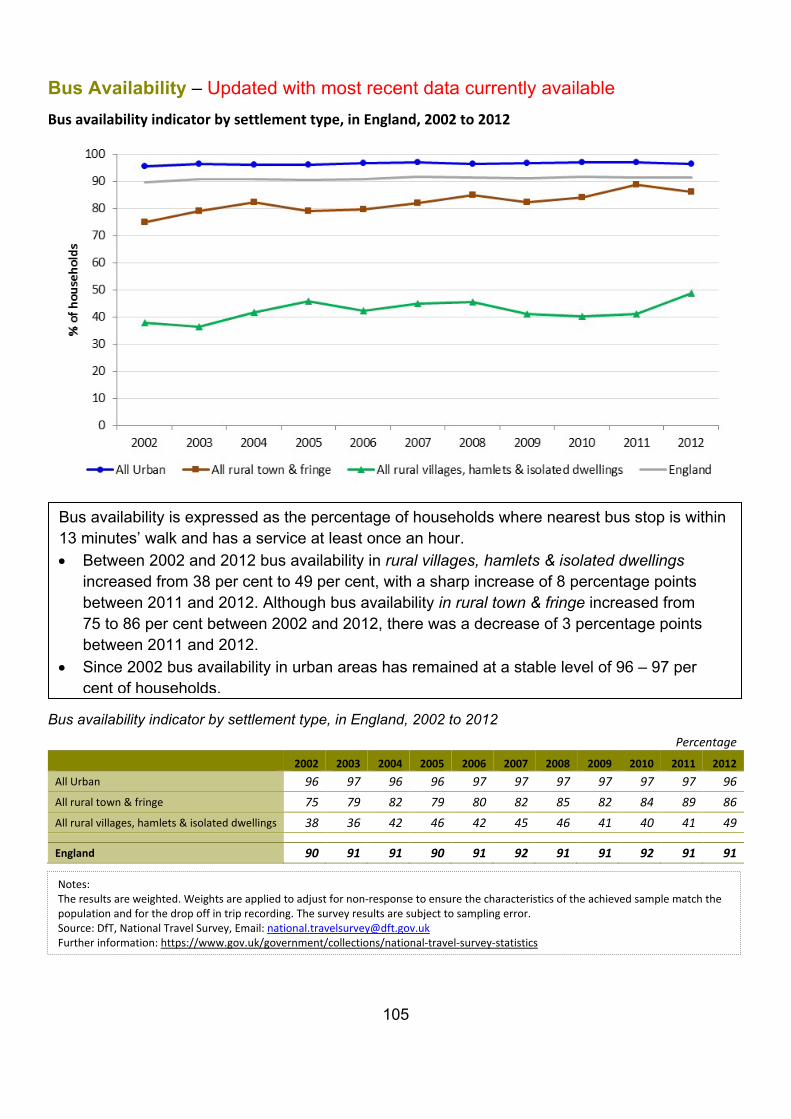
105
Bus Availability – Updated with most recent data currently available Bus availability indicator by settlement type, in England, 2002 to 2012
Bus availability indicator by settlement type, in England, 2002 to 2012
Percentage 2002 2003 2004 2005 2006 2007 2008 2009 2010 2011 2012 All Urban 96 97 96 96 97 97 97 97 97 97 96 All rural town & fringe 75 79 82 79 80 82 85 82 84 89 86 All rural villages, hamlets & isolated dwellings 38 36 42 46 42 45 46 41 40 41 49
England 90 91 91 90 91 92 91 91 92 91 91
Bus availability is expressed as the percentage of households where nearest bus stop is within 13 minutes’ walk and has a service at least once an hour. • Between 2002 and 2012 bus availability in rural villages, hamlets & isolated dwellings
increased from 38 per cent to 49 per cent, with a sharp increase of 8 percentage points between 2011 and 2012. Although bus availability in rural town & fringe increased from 75 to 86 per cent between 2002 and 2012, there was a decrease of 3 percentage points between 2011 and 2012.
• Since 2002 bus availability in urban areas has remained at a stable level of 96 – 97 per cent of households.
Notes: The results are weighted. Weights are applied to adjust for non-response to ensure the characteristics of the achieved sample match the population and for the drop off in trip recording. The survey results are subject to sampling error. Source: DfT, National Travel Survey, Email: [email protected] Further information: https://www.gov.uk/government/collections/national-travel-survey-statistics
106
Accessibility to services
• Monitoring accessibility is important because it can help identify who has access to, and therefore benefits from, services and who might be disadvantaged. Ways of measuring accessibility include assessing the time taken to travel to particular service locations and the number of services reachable within specified travel times.
• Generally, people living in rural settlements have lower overall levels of accessibility to key service locations compared with people living in urban settlements, while people living in rural areas in a sparse setting have the lowest overall accessibility.
o The average minimum travel times to reach the nearest key services were longer for people living in rural areas for all services, compared with people living in urban areas.
o More services were available on average for people living in urban areas for all service types and all journey times compared with those for people living in rural areas, when walking and using public transport.
o For travel by public transport or walking in 2017:
the average minimum travel time to a hospital was a little over one hour in rural areas, compared with a little over half an hour in urban areas.
fewer than half the users living in rural areas have access to places with 5,000 or more jobs within 45 minutes, compared with 90 per cent of users living in urban areas.
43 per cent of users living in rural areas do not have access to their nearest hospital within an hours travel, compared with 6 per cent of users living in urban areas.
the average number of key service locations accessible to people living in rural areas was highest for primary schools and food stores with 9 available within a 60 minute journey time.
the services with the lowest average number of service locations available to people living in rural areas within a 60 minute journey time were hospitals (with around one) and places with 5,000 or more jobs available (with around two).
o For travel by car in 2017:
for people living in rural hamlets and isolated dwellings in a sparse setting, average minimum journey times to centres of employment with 5,000 or more jobs was 47 minutes and it took on average 34 minutes to travel to the nearest hospital.
some users in rural areas do not have access to centres of employment with over 5,000 jobs or hospitals within an hour’s travel by car.
people living in rural areas had on average two General Practices available within a 15 minute journey compared with eight General Practices available for people living in urban areas.
107
Average minimum travel times • For travel by public transport and walking, cycling and by car, the average minimum travel
times to reach the nearest key services were longer for people living in rural areas for all services, compared with people living in urban areas.
• For travel by public transport or walking: In rural areas the services with the lowest level of accessibility were hospitals and centres of employment with 5,000 or more jobs. The average minimum travel time to a hospital was a little over one hour in rural areas, compared with a little over half an hour in urban areas. The average travel time to places with 5,000 or more jobs was 56 minutes in rural areas compared with 27 minutes in urban areas. For all key service types the average minimum rural travel times were around double the average minimum urban travel times.
• For travel by car: For people living in rural areas, making the same journey by car compared
with using public transport or walking, had the effect of halving the average minimum journey times. Urban areas also saw a reduction in travel times when comparing travel by car with public transport or walking but the difference was less pronounced. The average minimum travel time across all eight services was 37 per cent higher in rural areas compared with urban areas overall. For people living in rural hamlets and isolated dwellings in a sparse setting, average minimum journey times by car to centres of employment with 5,000 or more jobs was around 47 minutes and over half an hour to travel to the nearest hospital.
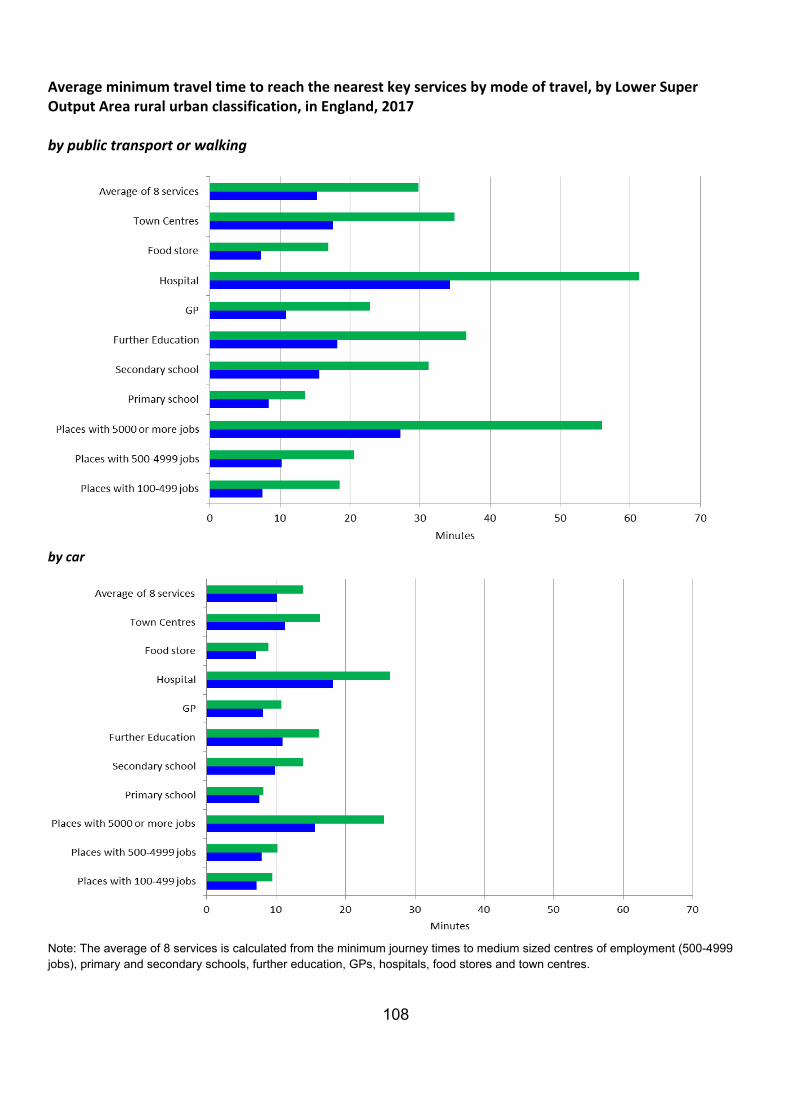
108
Average minimum travel time to reach the nearest key services by mode of travel, by Lower Super Output Area rural urban classification, in England, 2017 by public transport or walking
by car
Note: The average of 8 services is calculated from the minimum journey times to medium sized centres of employment (500-4999 jobs), primary and secondary schools, further education, GPs, hospitals, food stores and town centres.
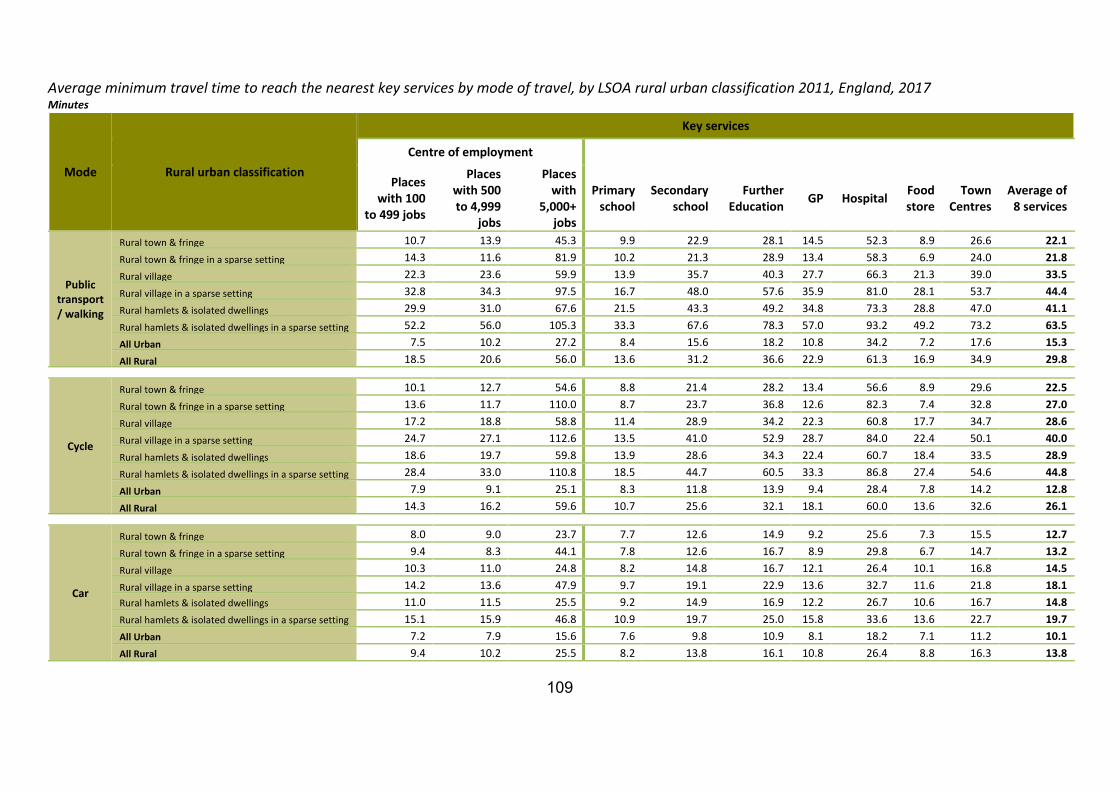
109
Average minimum travel time to reach the nearest key services by mode of travel, by LSOA rural urban classification 2011, England, 2017 Minutes
Mode Rural urban classification
Key services
Centre of employment
Places with 100
to 499 jobs
Places with 500 to 4,999
jobs
Places with
5,000+ jobs
Primary school
Secondary school
Further Education GP Hospital Food
store Town
Centres Average of
8 services
Public transport / walking
Rural town & fringe 10.7 13.9 45.3 9.9 22.9 28.1 14.5 52.3 8.9 26.6 22.1 Rural town & fringe in a sparse setting 14.3 11.6 81.9 10.2 21.3 28.9 13.4 58.3 6.9 24.0 21.8 Rural village 22.3 23.6 59.9 13.9 35.7 40.3 27.7 66.3 21.3 39.0 33.5 Rural village in a sparse setting 32.8 34.3 97.5 16.7 48.0 57.6 35.9 81.0 28.1 53.7 44.4 Rural hamlets & isolated dwellings 29.9 31.0 67.6 21.5 43.3 49.2 34.8 73.3 28.8 47.0 41.1 Rural hamlets & isolated dwellings in a sparse setting 52.2 56.0 105.3 33.3 67.6 78.3 57.0 93.2 49.2 73.2 63.5 All Urban 7.5 10.2 27.2 8.4 15.6 18.2 10.8 34.2 7.2 17.6 15.3 All Rural 18.5 20.6 56.0 13.6 31.2 36.6 22.9 61.3 16.9 34.9 29.8
Cycle
Rural town & fringe 10.1 12.7 54.6 8.8 21.4 28.2 13.4 56.6 8.9 29.6 22.5 Rural town & fringe in a sparse setting 13.6 11.7 110.0 8.7 23.7 36.8 12.6 82.3 7.4 32.8 27.0 Rural village 17.2 18.8 58.8 11.4 28.9 34.2 22.3 60.8 17.7 34.7 28.6 Rural village in a sparse setting 24.7 27.1 112.6 13.5 41.0 52.9 28.7 84.0 22.4 50.1 40.0 Rural hamlets & isolated dwellings 18.6 19.7 59.8 13.9 28.6 34.3 22.4 60.7 18.4 33.5 28.9 Rural hamlets & isolated dwellings in a sparse setting 28.4 33.0 110.8 18.5 44.7 60.5 33.3 86.8 27.4 54.6 44.8 All Urban 7.9 9.1 25.1 8.3 11.8 13.9 9.4 28.4 7.8 14.2 12.8 All Rural 14.3 16.2 59.6 10.7 25.6 32.1 18.1 60.0 13.6 32.6 26.1
Car
Rural town & fringe 8.0 9.0 23.7 7.7 12.6 14.9 9.2 25.6 7.3 15.5 12.7 Rural town & fringe in a sparse setting 9.4 8.3 44.1 7.8 12.6 16.7 8.9 29.8 6.7 14.7 13.2 Rural village 10.3 11.0 24.8 8.2 14.8 16.7 12.1 26.4 10.1 16.8 14.5 Rural village in a sparse setting 14.2 13.6 47.9 9.7 19.1 22.9 13.6 32.7 11.6 21.8 18.1 Rural hamlets & isolated dwellings 11.0 11.5 25.5 9.2 14.9 16.9 12.2 26.7 10.6 16.7 14.8 Rural hamlets & isolated dwellings in a sparse setting 15.1 15.9 46.8 10.9 19.7 25.0 15.8 33.6 13.6 22.7 19.7 All Urban 7.2 7.9 15.6 7.6 9.8 10.9 8.1 18.2 7.1 11.2 10.1 All Rural 9.4 10.2 25.5 8.2 13.8 16.1 10.8 26.4 8.8 16.3 13.8

110
Access to key services • For travel by public transport or walking: Fewer than half the users living in rural areas
have access to places with 5,000 or more jobs within 45 minutes, compared with around 90 per cent of users living in urban areas. 43 per cent of users living in rural areas do not have access to their nearest hospital within an hour’s travel, compared with 6 per cent in urban areas.
• For travel by car: All service users living in rural areas had access to places with 100 to 499
jobs and 500 to 4,999 jobs, town centres, food stores, General Practices, and key places of education within 60 minutes by car. However small proportions of users in rural areas do not have access to places with over 5,000 jobs or hospitals within 60 minutes by car.
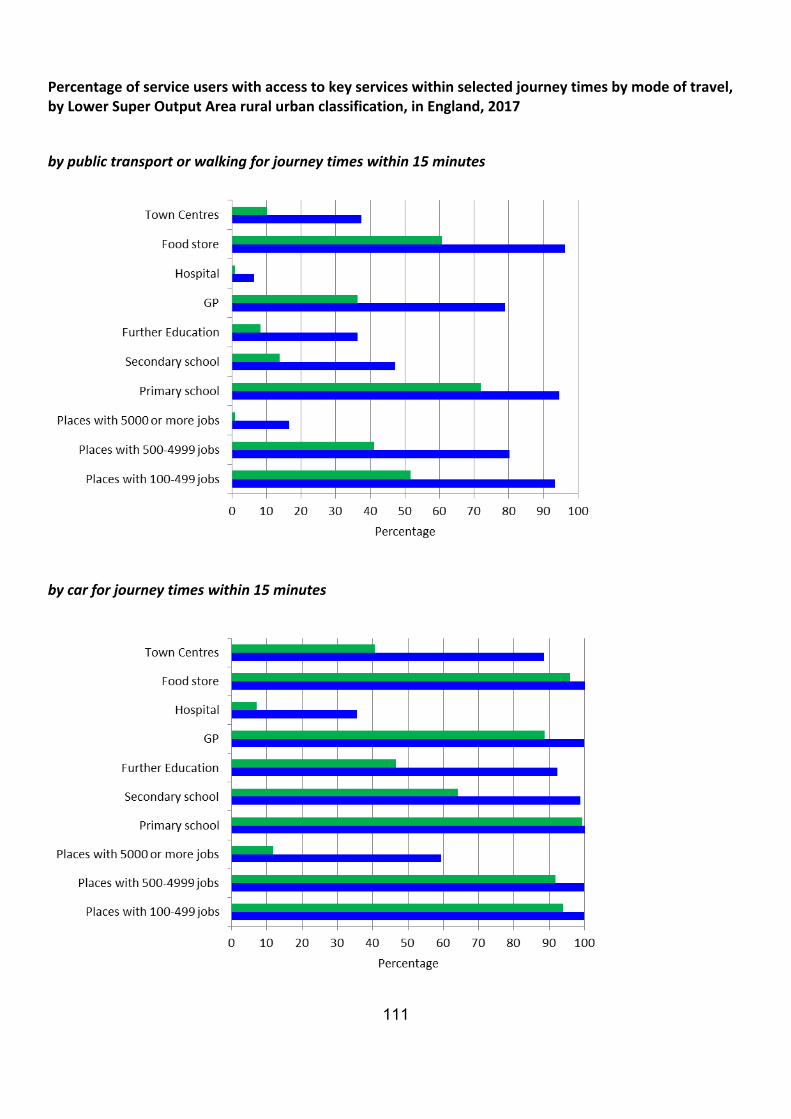
111
Percentage of service users with access to key services within selected journey times by mode of travel, by Lower Super Output Area rural urban classification, in England, 2017
by public transport or walking for journey times within 15 minutes
by car for journey times within 15 minutes
Percent
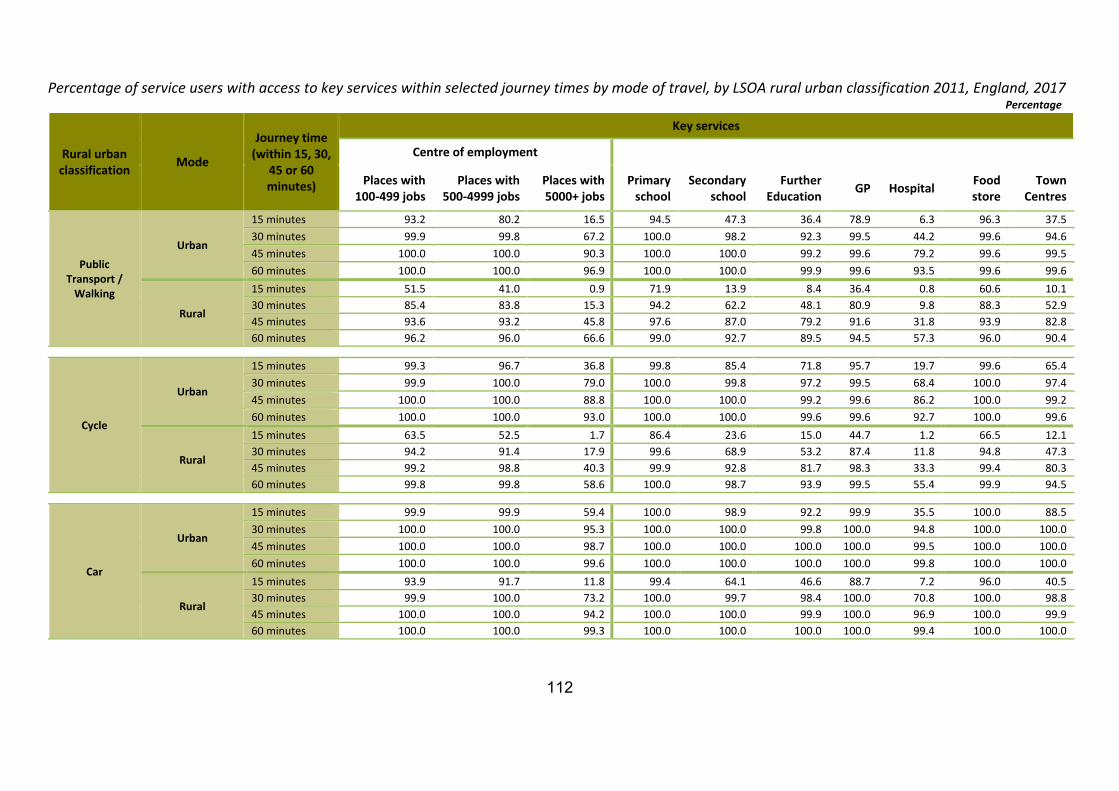
112
Percentage of service users with access to key services within selected journey times by mode of travel, by LSOA rural urban classification 2011, England, 2017 Percentage
Rural urban classification
Mode
Journey time (within 15, 30,
45 or 60 minutes)
Key services
Centre of employment
Places with 100-499 jobs
Places with 500-4999 jobs
Places with 5000+ jobs
Primary school
Secondary school
Further Education GP Hospital Food
store Town
Centres
Public Transport /
Walking
Urban
15 minutes 93.2 80.2 16.5 94.5 47.3 36.4 78.9 6.3 96.3 37.5 30 minutes 99.9 99.8 67.2 100.0 98.2 92.3 99.5 44.2 99.6 94.6 45 minutes 100.0 100.0 90.3 100.0 100.0 99.2 99.6 79.2 99.6 99.5 60 minutes 100.0 100.0 96.9 100.0 100.0 99.9 99.6 93.5 99.6 99.6
Rural
15 minutes 51.5 41.0 0.9 71.9 13.9 8.4 36.4 0.8 60.6 10.1 30 minutes 85.4 83.8 15.3 94.2 62.2 48.1 80.9 9.8 88.3 52.9 45 minutes 93.6 93.2 45.8 97.6 87.0 79.2 91.6 31.8 93.9 82.8 60 minutes 96.2 96.0 66.6 99.0 92.7 89.5 94.5 57.3 96.0 90.4
Cycle
Urban
15 minutes 99.3 96.7 36.8 99.8 85.4 71.8 95.7 19.7 99.6 65.4 30 minutes 99.9 100.0 79.0 100.0 99.8 97.2 99.5 68.4 100.0 97.4 45 minutes 100.0 100.0 88.8 100.0 100.0 99.2 99.6 86.2 100.0 99.2 60 minutes 100.0 100.0 93.0 100.0 100.0 99.6 99.6 92.7 100.0 99.6
Rural
15 minutes 63.5 52.5 1.7 86.4 23.6 15.0 44.7 1.2 66.5 12.1 30 minutes 94.2 91.4 17.9 99.6 68.9 53.2 87.4 11.8 94.8 47.3 45 minutes 99.2 98.8 40.3 99.9 92.8 81.7 98.3 33.3 99.4 80.3 60 minutes 99.8 99.8 58.6 100.0 98.7 93.9 99.5 55.4 99.9 94.5
Car
Urban
15 minutes 99.9 99.9 59.4 100.0 98.9 92.2 99.9 35.5 100.0 88.5 30 minutes 100.0 100.0 95.3 100.0 100.0 99.8 100.0 94.8 100.0 100.0 45 minutes 100.0 100.0 98.7 100.0 100.0 100.0 100.0 99.5 100.0 100.0 60 minutes 100.0 100.0 99.6 100.0 100.0 100.0 100.0 99.8 100.0 100.0
Rural
15 minutes 93.9 91.7 11.8 99.4 64.1 46.6 88.7 7.2 96.0 40.5 30 minutes 99.9 100.0 73.2 100.0 99.7 98.4 100.0 70.8 100.0 98.8 45 minutes 100.0 100.0 94.2 100.0 100.0 99.9 100.0 96.9 100.0 99.9 60 minutes 100.0 100.0 99.3 100.0 100.0 100.0 100.0 99.4 100.0 100.0
113
Average number of key services available • For travel by public transport or walking: The average number of key service locations
accessible to people living in rural areas was highest for places with 100-499 jobs, places with 500-4999 jobs, primary schools and food stores, with around 9 available within a 60 minute journey time. The services with the lowest average number of service locations available were hospitals and centres of employment with 5,000 or more jobs, with none available for either service within a 30 minute journey time, and one hospital and two places with 5,000 or more jobs available within a 60 minute journey time.
• More services were available on average for people living in urban areas for all service types and all journey times compared with those for people living in rural areas when travelling by public transport or walking, or cycling.
• For travel by car: Similar availability of services can be observed for travel by car. For
people living in rural areas the number of General Practices available within a 15 minute journey time by public transport or walking was less than one, however by car this increased to an average of 2.4. For people living in urban areas, the number of General Practices available within a 15 minute journey time by public transport or walking was two and this increased to around eight General Practices when travelling by car.
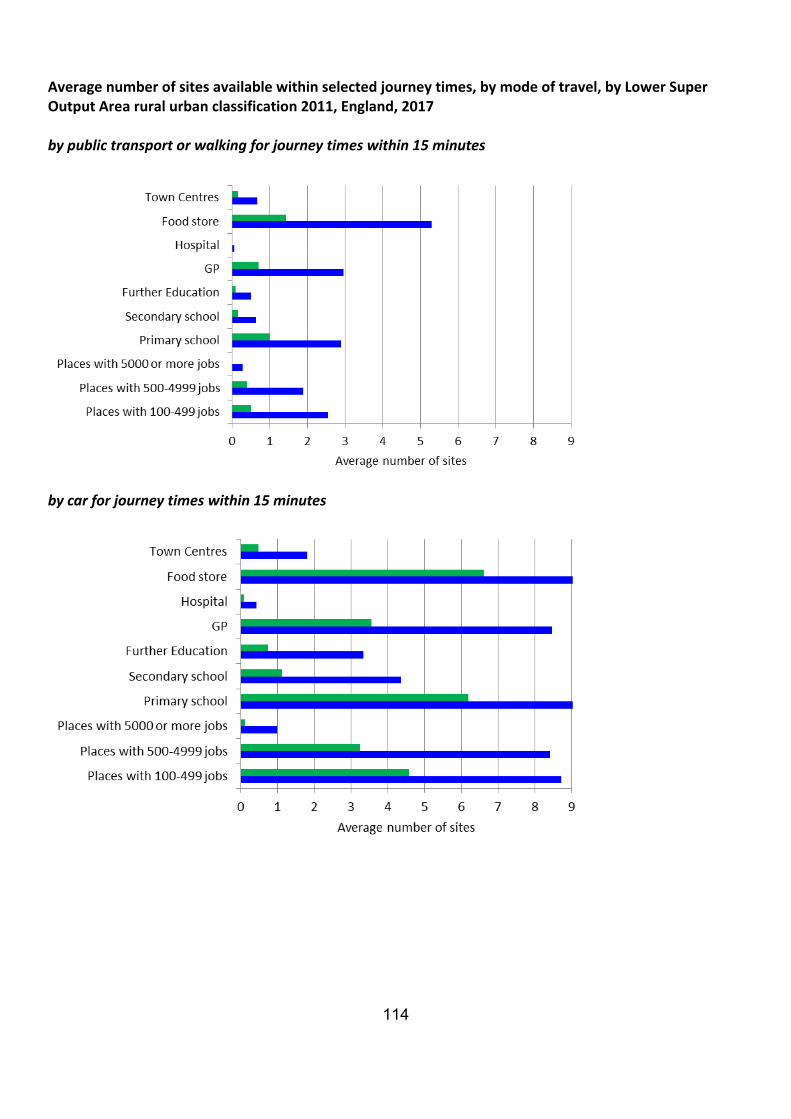
114
Average number of sites available within selected journey times, by mode of travel, by Lower Super Output Area rural urban classification 2011, England, 2017 by public transport or walking for journey times within 15 minutes
by car for journey times within 15 minutes
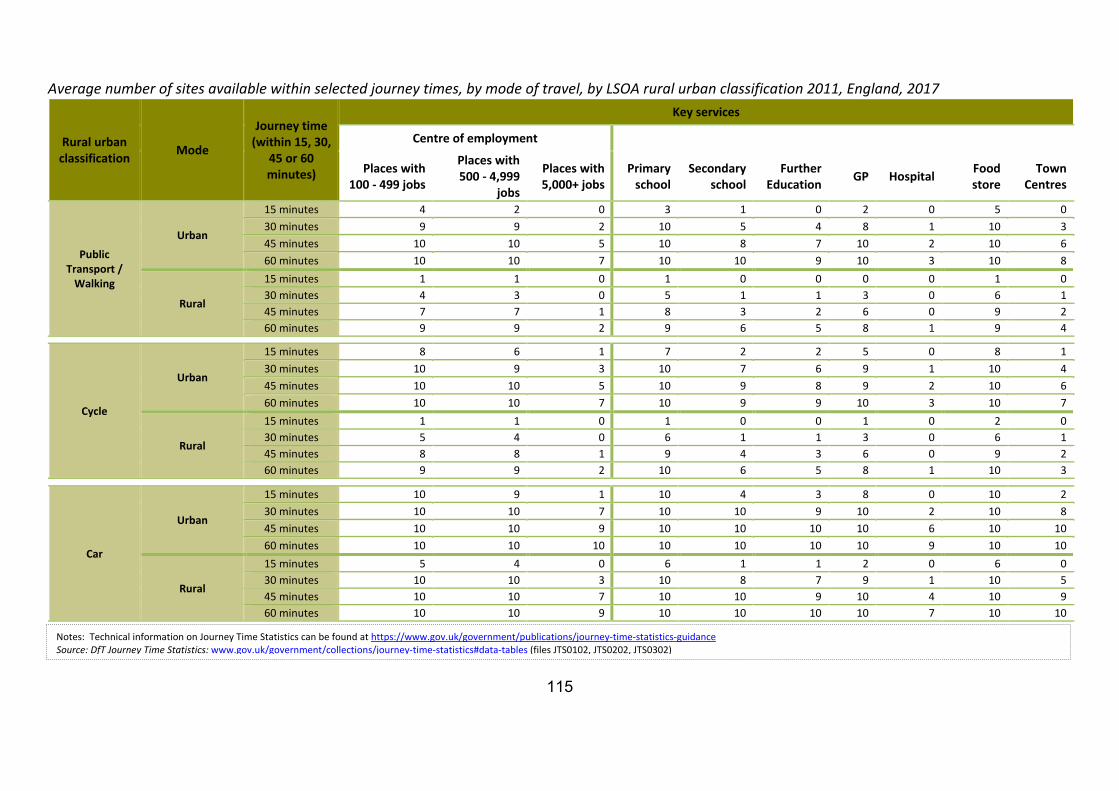
115
Average number of sites available within selected journey times, by mode of travel, by LSOA rural urban classification 2011, England, 2017
Rural urban classification
Mode
Journey time (within 15, 30,
45 or 60 minutes)
Key services
Centre of employment
Places with 100 - 499 jobs
Places with 500 - 4,999
jobs
Places with 5,000+ jobs
Primary school
Secondary school
Further Education GP Hospital Food
store Town
Centres
Public Transport /
Walking
Urban
15 minutes 4 2 0 3 1 0 2 0 5 0 30 minutes 9 9 2 10 5 4 8 1 10 3 45 minutes 10 10 5 10 8 7 10 2 10 6 60 minutes 10 10 7 10 10 9 10 3 10 8
Rural
15 minutes 1 1 0 1 0 0 0 0 1 0 30 minutes 4 3 0 5 1 1 3 0 6 1 45 minutes 7 7 1 8 3 2 6 0 9 2 60 minutes 9 9 2 9 6 5 8 1 9 4
Cycle
Urban
15 minutes 8 6 1 7 2 2 5 0 8 1 30 minutes 10 9 3 10 7 6 9 1 10 4 45 minutes 10 10 5 10 9 8 9 2 10 6 60 minutes 10 10 7 10 9 9 10 3 10 7
Rural
15 minutes 1 1 0 1 0 0 1 0 2 0 30 minutes 5 4 0 6 1 1 3 0 6 1 45 minutes 8 8 1 9 4 3 6 0 9 2 60 minutes 9 9 2 10 6 5 8 1 10 3
Car
Urban
15 minutes 10 9 1 10 4 3 8 0 10 2 30 minutes 10 10 7 10 10 9 10 2 10 8 45 minutes 10 10 9 10 10 10 10 6 10 10 60 minutes 10 10 10 10 10 10 10 9 10 10
Rural
15 minutes 5 4 0 6 1 1 2 0 6 0 30 minutes 10 10 3 10 8 7 9 1 10 5 45 minutes 10 10 7 10 10 9 10 4 10 9 60 minutes 10 10 9 10 10 10 10 7 10 10
Notes: Technical information on Journey Time Statistics can be found at https://www.gov.uk/government/publications/journey-time-statistics-guidance Source: DfT Journey Time Statistics: www.gov.uk/government/collections/journey-time-statistics#data-tables (files JTS0102, JTS0202, JTS0302)
116
Overall measure of accessibility of services This measure of accessibility of services is determined by looking at average minimum travel times to key services, when travelling by either public transport and walking, or by car. To get an assessment of service accessibility the average minimum travel time to the following nine types of service have been used:
• medium and large centres of employment (locations where over 500 people are employed across the businesses and services there, such that a range of jobs are likely to be available)
• primary school • secondary school • further education • doctors’ surgery • hospital • food store • town centre • post office (recent post office data is currently unavailable so these calculations are using
2016 data for post offices rather than 2017)
For each area an overall accessibility index has been calculated by indexing and weighting the minimum travel times to key services. Travel times were indexed in terms of relative travel times and weighted in an attempt to take account of the frequency of use of each service. This means that infrequently used but important services (e.g. hospital) if distant do not disproportionately affect the overall index for an area (see notes for more details).
Accessibility to services (derived from minimum travel times) has been presented on maps based on this overall index for travelling by public transport and walking, and for travelling by car. Rural areas are shown in green and urban areas are shown in blue, the darker the area, the poorer the accessibility of services.
• When using public transport and walking rural areas generally have poorer accessibility to services based on minimum travel times than urban areas.
• Unsurprisingly, travelling by car generally reduces travel times to key services, but overall differences in relative travel times are similar to those experienced when using public transport and walking, and rural areas still tend to have poorer accessibility (in terms of minimum travel times), compared with urban areas.
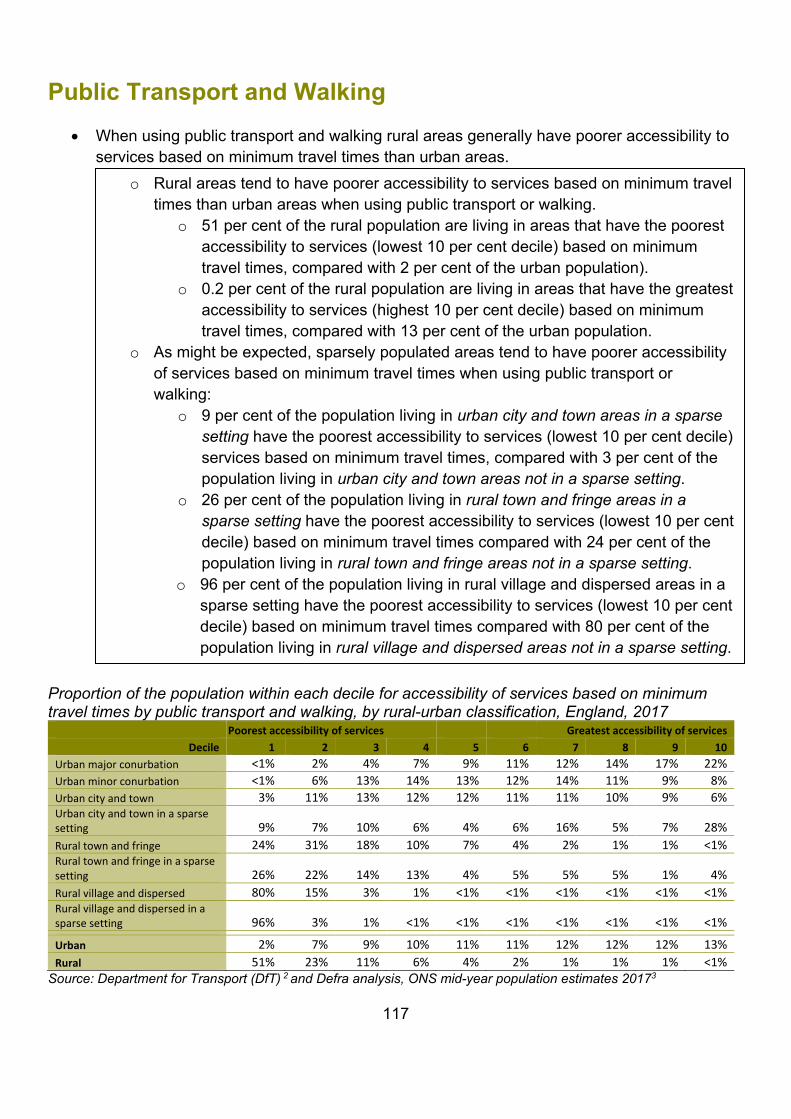
117
Public Transport and Walking • When using public transport and walking rural areas generally have poorer accessibility to
services based on minimum travel times than urban areas.
Proportion of the population within each decile for accessibility of services based on minimum travel times by public transport and walking, by rural-urban classification, England, 2017
Poorest accessibility of services Greatest accessibility of services Decile 1 2 3 4 5 6 7 8 9 10
Urban major conurbation <1% 2% 4% 7% 9% 11% 12% 14% 17% 22% Urban minor conurbation <1% 6% 13% 14% 13% 12% 14% 11% 9% 8% Urban city and town 3% 11% 13% 12% 12% 11% 11% 10% 9% 6% Urban city and town in a sparse setting 9% 7% 10% 6% 4% 6% 16% 5% 7% 28% Rural town and fringe 24% 31% 18% 10% 7% 4% 2% 1% 1% <1% Rural town and fringe in a sparse setting 26% 22% 14% 13% 4% 5% 5% 5% 1% 4% Rural village and dispersed 80% 15% 3% 1% <1% <1% <1% <1% <1% <1% Rural village and dispersed in a sparse setting 96% 3% 1% <1% <1% <1% <1% <1% <1% <1%
Urban 2% 7% 9% 10% 11% 11% 12% 12% 12% 13% Rural 51% 23% 11% 6% 4% 2% 1% 1% 1% <1%
Source: Department for Transport (DfT) 2 and Defra analysis, ONS mid-year population estimates 20173
o Rural areas tend to have poorer accessibility to services based on minimum travel times than urban areas when using public transport or walking.
o 51 per cent of the rural population are living in areas that have the poorest accessibility to services (lowest 10 per cent decile) based on minimum travel times, compared with 2 per cent of the urban population).
o 0.2 per cent of the rural population are living in areas that have the greatest accessibility to services (highest 10 per cent decile) based on minimum travel times, compared with 13 per cent of the urban population.
o As might be expected, sparsely populated areas tend to have poorer accessibility of services based on minimum travel times when using public transport or walking:
o 9 per cent of the population living in urban city and town areas in a sparse setting have the poorest accessibility to services (lowest 10 per cent decile) services based on minimum travel times, compared with 3 per cent of the population living in urban city and town areas not in a sparse setting.
o 26 per cent of the population living in rural town and fringe areas in a sparse setting have the poorest accessibility to services (lowest 10 per cent decile) based on minimum travel times compared with 24 per cent of the population living in rural town and fringe areas not in a sparse setting.
o 96 per cent of the population living in rural village and dispersed areas in a sparse setting have the poorest accessibility to services (lowest 10 per cent decile) based on minimum travel times compared with 80 per cent of the population living in rural village and dispersed areas not in a sparse setting.
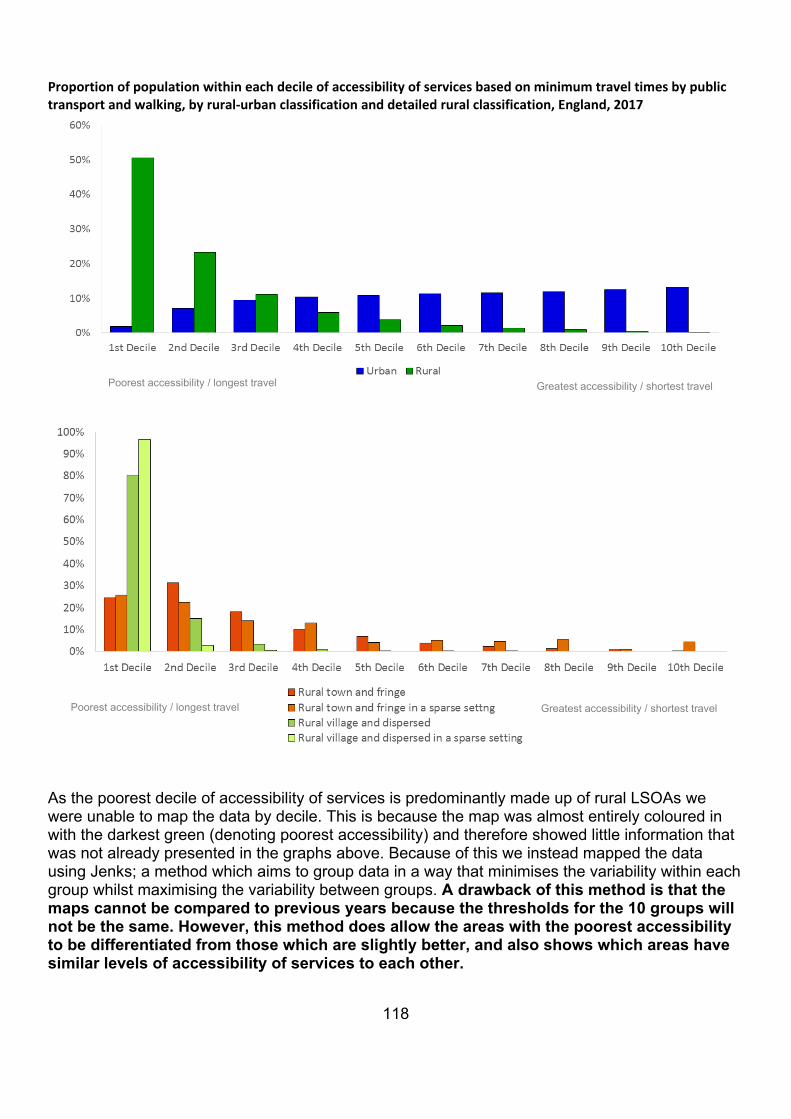
118
Proportion of population within each decile of accessibility of services based on minimum travel times by public transport and walking, by rural-urban classification and detailed rural classification, England, 2017
As the poorest decile of accessibility of services is predominantly made up of rural LSOAs we were unable to map the data by decile. This is because the map was almost entirely coloured in with the darkest green (denoting poorest accessibility) and therefore showed little information that was not already presented in the graphs above. Because of this we instead mapped the data using Jenks; a method which aims to group data in a way that minimises the variability within each group whilst maximising the variability between groups. A drawback of this method is that the maps cannot be compared to previous years because the thresholds for the 10 groups will not be the same. However, this method does allow the areas with the poorest accessibility to be differentiated from those which are slightly better, and also shows which areas have similar levels of accessibility of services to each other.
Poorest accessibility / longest travel i )
Greatest accessibility / shortest travel
Poorest accessibility / longest travel )
Greatest accessibility / shortest travel
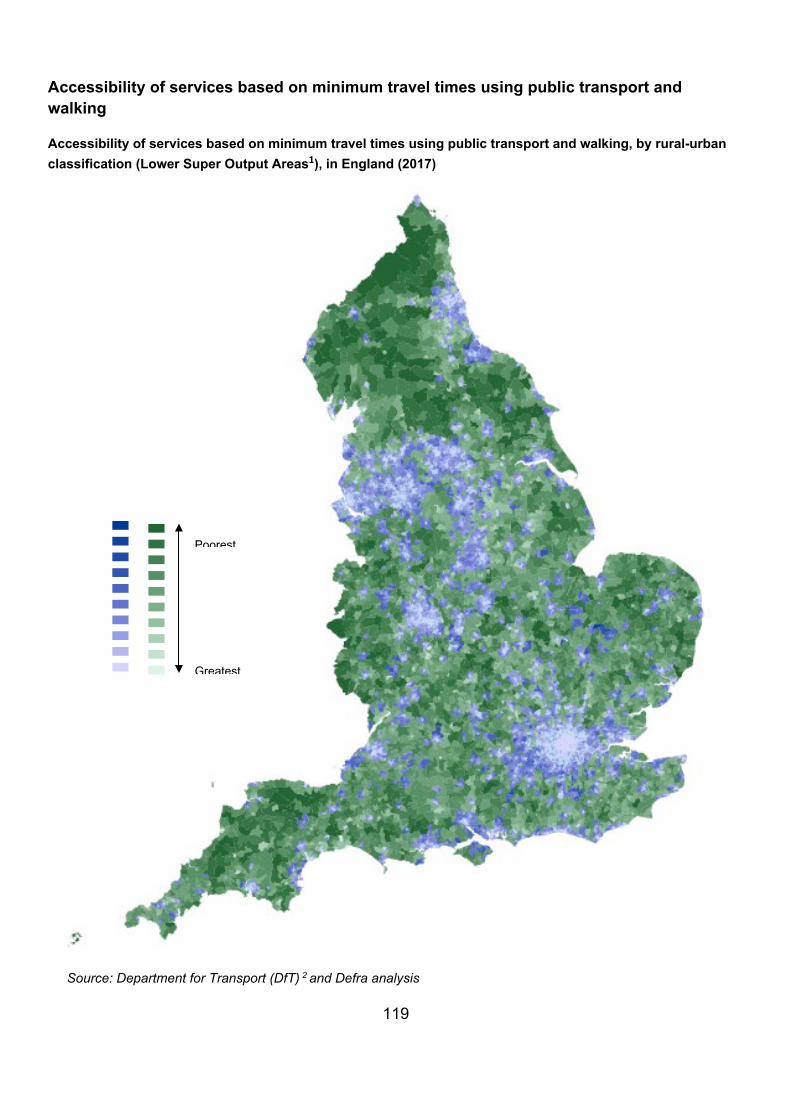
119
Accessibility of services based on minimum travel times using public transport and walking
Accessibility of services based on minimum travel times using public transport and walking, by rural-urban classification (Lower Super Output Areas1), in England (2017)
Source: Department for Transport (DfT) 2 and Defra analysis
Greatest
Poorest
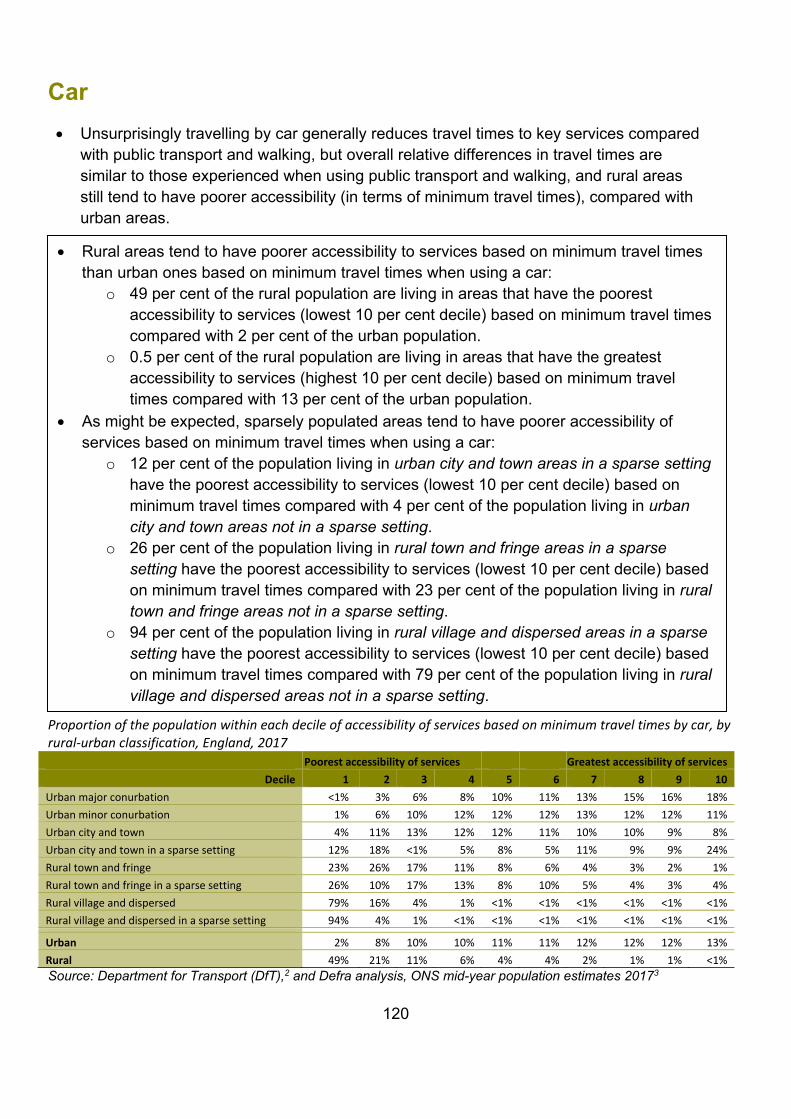
120
Car
Proportion of the population within each decile of accessibility of services based on minimum travel times by car, by rural-urban classification, England, 2017 Poorest accessibility of services Greatest accessibility of services
Decile 1 2 3 4 5 6 7 8 9 10 Urban major conurbation <1% 3% 6% 8% 10% 11% 13% 15% 16% 18% Urban minor conurbation 1% 6% 10% 12% 12% 12% 13% 12% 12% 11% Urban city and town 4% 11% 13% 12% 12% 11% 10% 10% 9% 8% Urban city and town in a sparse setting 12% 18% <1% 5% 8% 5% 11% 9% 9% 24% Rural town and fringe 23% 26% 17% 11% 8% 6% 4% 3% 2% 1% Rural town and fringe in a sparse setting 26% 10% 17% 13% 8% 10% 5% 4% 3% 4% Rural village and dispersed 79% 16% 4% 1% <1% <1% <1% <1% <1% <1% Rural village and dispersed in a sparse setting 94% 4% 1% <1% <1% <1% <1% <1% <1% <1%
Urban 2% 8% 10% 10% 11% 11% 12% 12% 12% 13% Rural 49% 21% 11% 6% 4% 4% 2% 1% 1% <1% Source: Department for Transport (DfT),2 and Defra analysis, ONS mid-year population estimates 20173
• Rural areas tend to have poorer accessibility to services based on minimum travel times than urban ones based on minimum travel times when using a car:
o 49 per cent of the rural population are living in areas that have the poorest accessibility to services (lowest 10 per cent decile) based on minimum travel times compared with 2 per cent of the urban population.
o 0.5 per cent of the rural population are living in areas that have the greatest accessibility to services (highest 10 per cent decile) based on minimum travel times compared with 13 per cent of the urban population.
• As might be expected, sparsely populated areas tend to have poorer accessibility of services based on minimum travel times when using a car:
o 12 per cent of the population living in urban city and town areas in a sparse setting have the poorest accessibility to services (lowest 10 per cent decile) based on minimum travel times compared with 4 per cent of the population living in urban city and town areas not in a sparse setting.
o 26 per cent of the population living in rural town and fringe areas in a sparse setting have the poorest accessibility to services (lowest 10 per cent decile) based on minimum travel times compared with 23 per cent of the population living in rural town and fringe areas not in a sparse setting.
o 94 per cent of the population living in rural village and dispersed areas in a sparse setting have the poorest accessibility to services (lowest 10 per cent decile) based on minimum travel times compared with 79 per cent of the population living in rural village and dispersed areas not in a sparse setting.
• Unsurprisingly travelling by car generally reduces travel times to key services compared with public transport and walking, but overall relative differences in travel times are similar to those experienced when using public transport and walking, and rural areas still tend to have poorer accessibility (in terms of minimum travel times), compared with urban areas.
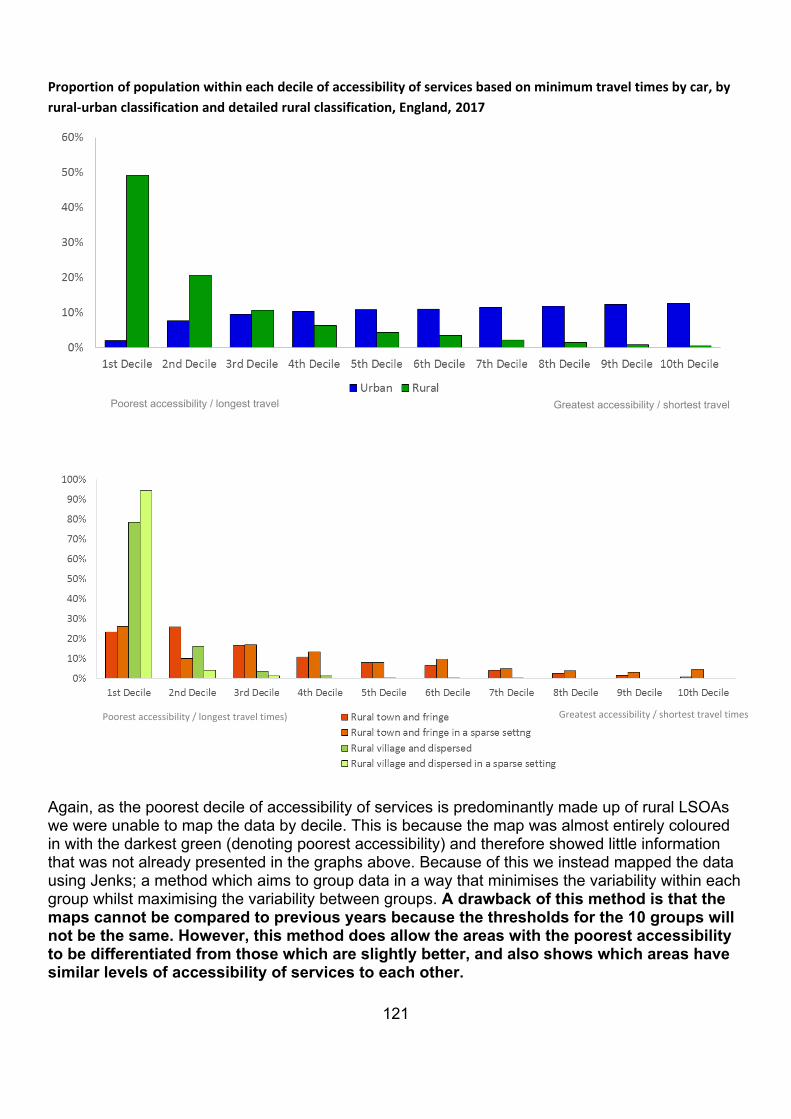
121
Proportion of population within each decile of accessibility of services based on minimum travel times by car, by rural-urban classification and detailed rural classification, England, 2017
Again, as the poorest decile of accessibility of services is predominantly made up of rural LSOAs we were unable to map the data by decile. This is because the map was almost entirely coloured in with the darkest green (denoting poorest accessibility) and therefore showed little information that was not already presented in the graphs above. Because of this we instead mapped the data using Jenks; a method which aims to group data in a way that minimises the variability within each group whilst maximising the variability between groups. A drawback of this method is that the maps cannot be compared to previous years because the thresholds for the 10 groups will not be the same. However, this method does allow the areas with the poorest accessibility to be differentiated from those which are slightly better, and also shows which areas have similar levels of accessibility of services to each other.
Poorest accessibility / longest travel i )
Greatest accessibility / shortest travel
Poorest accessibility / longest travel times) Greatest accessibility / shortest travel times
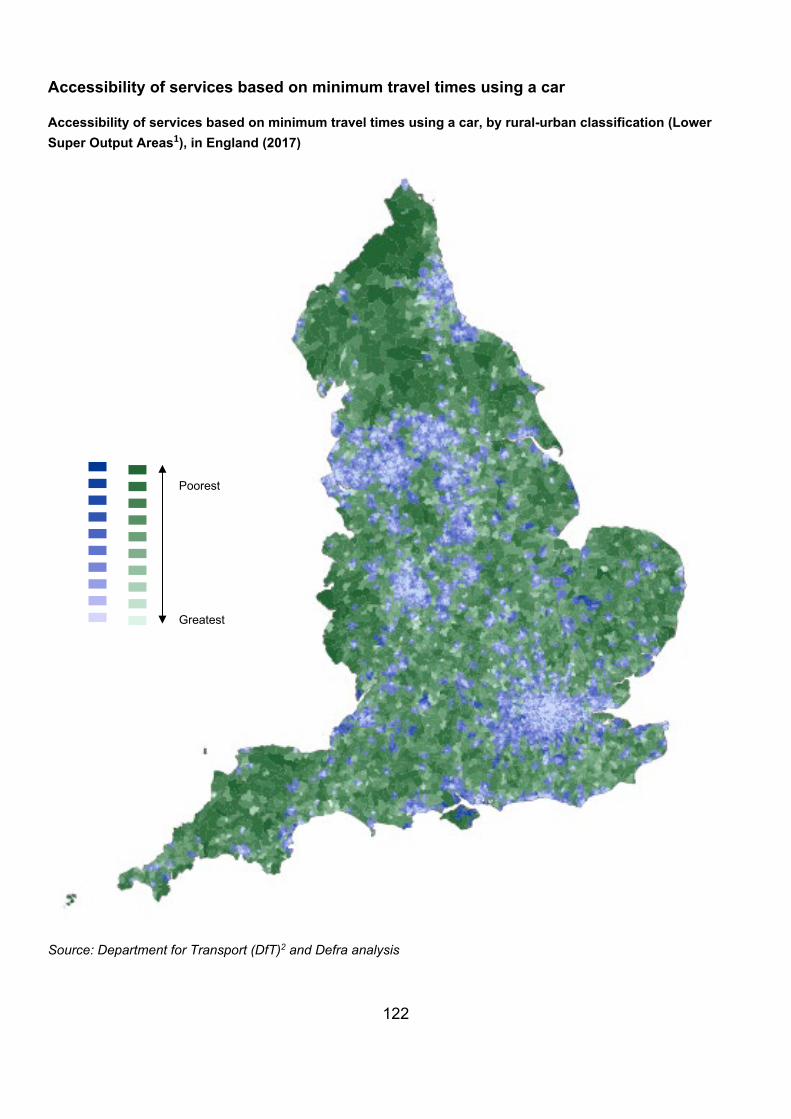
122
Accessibility of services based on minimum travel times using a car
Accessibility of services based on minimum travel times using a car, by rural-urban classification (Lower Super Output Areas1), in England (2017)
Source: Department for Transport (DfT)2 and Defra analysis
Greatest
Poorest
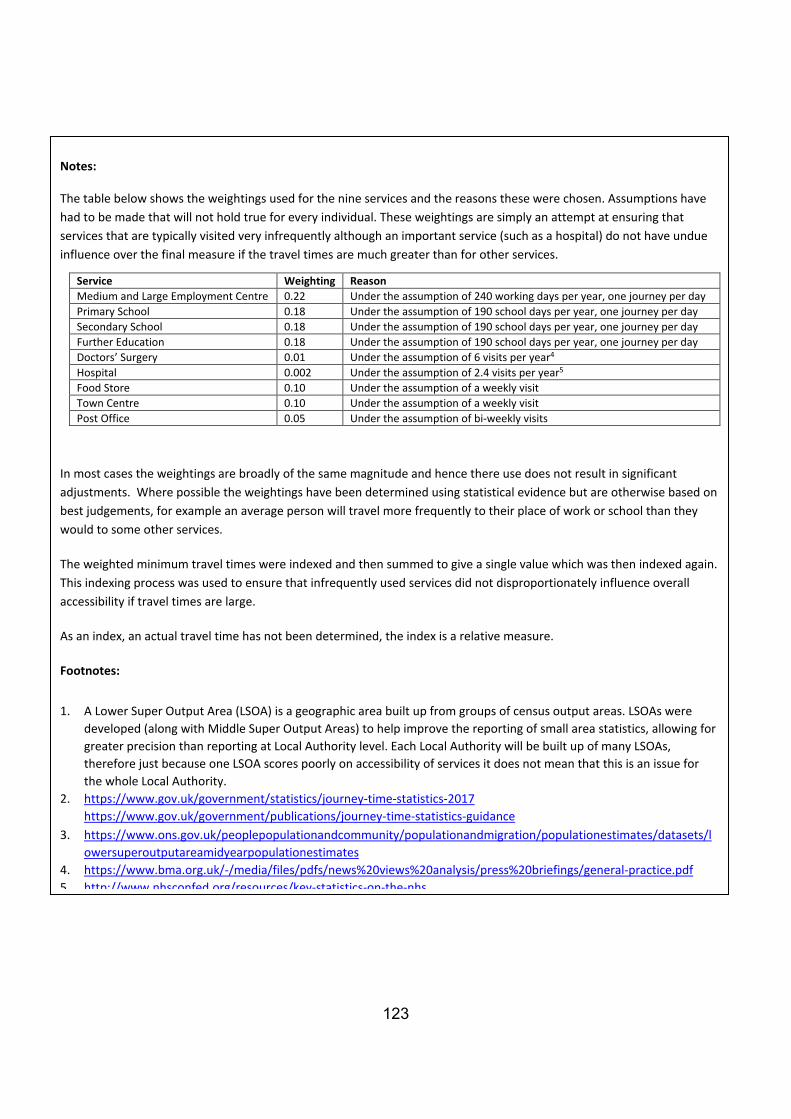
123
Notes:
The table below shows the weightings used for the nine services and the reasons these were chosen. Assumptions have had to be made that will not hold true for every individual. These weightings are simply an attempt at ensuring that services that are typically visited very infrequently although an important service (such as a hospital) do not have undue influence over the final measure if the travel times are much greater than for other services.
Service Weighting Reason Medium and Large Employment Centre 0.22 Under the assumption of 240 working days per year, one journey per day Primary School 0.18 Under the assumption of 190 school days per year, one journey per day Secondary School 0.18 Under the assumption of 190 school days per year, one journey per day Further Education 0.18 Under the assumption of 190 school days per year, one journey per day Doctors’ Surgery 0.01 Under the assumption of 6 visits per year4 Hospital 0.002 Under the assumption of 2.4 visits per year5 Food Store 0.10 Under the assumption of a weekly visit Town Centre 0.10 Under the assumption of a weekly visit Post Office 0.05 Under the assumption of bi-weekly visits
In most cases the weightings are broadly of the same magnitude and hence there use does not result in significant adjustments. Where possible the weightings have been determined using statistical evidence but are otherwise based on best judgements, for example an average person will travel more frequently to their place of work or school than they would to some other services.
The weighted minimum travel times were indexed and then summed to give a single value which was then indexed again. This indexing process was used to ensure that infrequently used services did not disproportionately influence overall accessibility if travel times are large.
As an index, an actual travel time has not been determined, the index is a relative measure.
Footnotes:
1. A Lower Super Output Area (LSOA) is a geographic area built up from groups of census output areas. LSOAs were developed (along with Middle Super Output Areas) to help improve the reporting of small area statistics, allowing for greater precision than reporting at Local Authority level. Each Local Authority will be built up of many LSOAs, therefore just because one LSOA scores poorly on accessibility of services it does not mean that this is an issue for the whole Local Authority.
2. https://www.gov.uk/government/statistics/journey-time-statistics-2017 https://www.gov.uk/government/publications/journey-time-statistics-guidance
3. https://www.ons.gov.uk/peoplepopulationandcommunity/populationandmigration/populationestimates/datasets/lowersuperoutputareamidyearpopulationestimates
4. https://www.bma.org.uk/-/media/files/pdfs/news%20views%20analysis/press%20briefings/general-practice.pdf 5 http://www nhsconfed org/resources/key-statistics-on-the-nhs
124
Broadband
• Availability of broadband is important for a wide range of activities. It can be used to access central services, for social activities, for businesses to operate and hence for economic development.
• Overall, average broadband speeds in rural areas tend to be slower than those in urban areas. In 2018 the average speed in rural areas was 34 Mbit/s compared with 53 Mbit/s in urban areas. This is because: • There is less superfast broadband in rural areas; and • Rural premises are typically further away from cabinets, with long copper line connections,
leading to slower performance. However, there are pockets of excellent broadband availability in rural areas following targeted investment via the Rural Community Broadband Fund and other community led schemes.
• For illustration, for a household with the average broadband speed in rural areas of 34 Mbit/s
downloading a film (via On Demand) would take around 3 minutes and 30 seconds, while for a household with the average broadband speed in urban areas of 53 Mbit/s it would take around 2 minutes and 15 seconds (assuming a size of 858MB for a typical film). For a household with a download speed of 10Mbit/s (the minimum speed to be considered a decent broadband service) the download time jumps to 12 minutes.
• In 2018, 7 per cent of premises in rural areas were not able to access a decent broadband
service (delivering a download speed of at least 10Mbit/s and upload speed of at least 1 Mbit/s). This compares with just 1 per cent of premises in urban areas.
• Superfast broadband (defined as delivering a download speed of at least 30Mbit/s) is available
for 83 per cent of premises in rural areas, compared with 98 per cent in urban areas.
• The following analysis uses data from Ofcom’s Connect Nations report. It should be noted that the definition of ‘rural’ differs between the two publications. Within this Digest the Official Statistics classification is used which defines areas as rural if they are outside settlements below 10,000 resident population and open countryside. The Connected Nations report uses the Locale classification (a third party data source based on analysis of 2011 census output areas) which defines rural areas as those settlements with a population under 2,000. Further information can be found here: www.ofcom.org.uk/research-and-data/multi-sector-research/infrastructure-research/connected-nations-2018
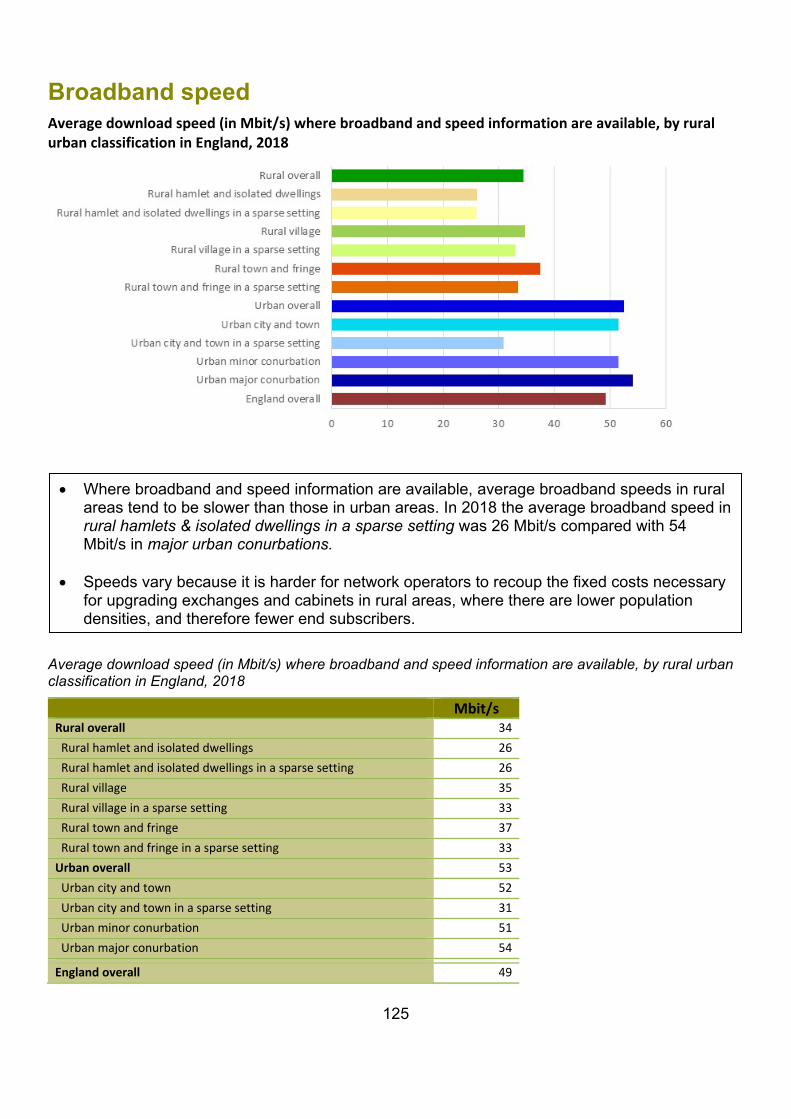
125
Broadband speed Average download speed (in Mbit/s) where broadband and speed information are available, by rural urban classification in England, 2018
Average download speed (in Mbit/s) where broadband and speed information are available, by rural urban classification in England, 2018
Mbit/s Rural overall 34 Rural hamlet and isolated dwellings 26 Rural hamlet and isolated dwellings in a sparse setting 26 Rural village 35 Rural village in a sparse setting 33 Rural town and fringe 37 Rural town and fringe in a sparse setting 33 Urban overall 53 Urban city and town 52 Urban city and town in a sparse setting 31 Urban minor conurbation 51 Urban major conurbation 54 England overall 49
• Where broadband and speed information are available, average broadband speeds in rural areas tend to be slower than those in urban areas. In 2018 the average broadband speed in rural hamlets & isolated dwellings in a sparse setting was 26 Mbit/s compared with 54 Mbit/s in major urban conurbations.
• Speeds vary because it is harder for network operators to recoup the fixed costs necessary
for upgrading exchanges and cabinets in rural areas, where there are lower population densities, and therefore fewer end subscribers.

126
Average download speed (in Mbit/s) where broadband and speed information are available, by Lower Super Output Area and rural urban classification in England, 2018
© Crown Copyright and database rights 2021 Ordnance Survey Licence No. 100022861
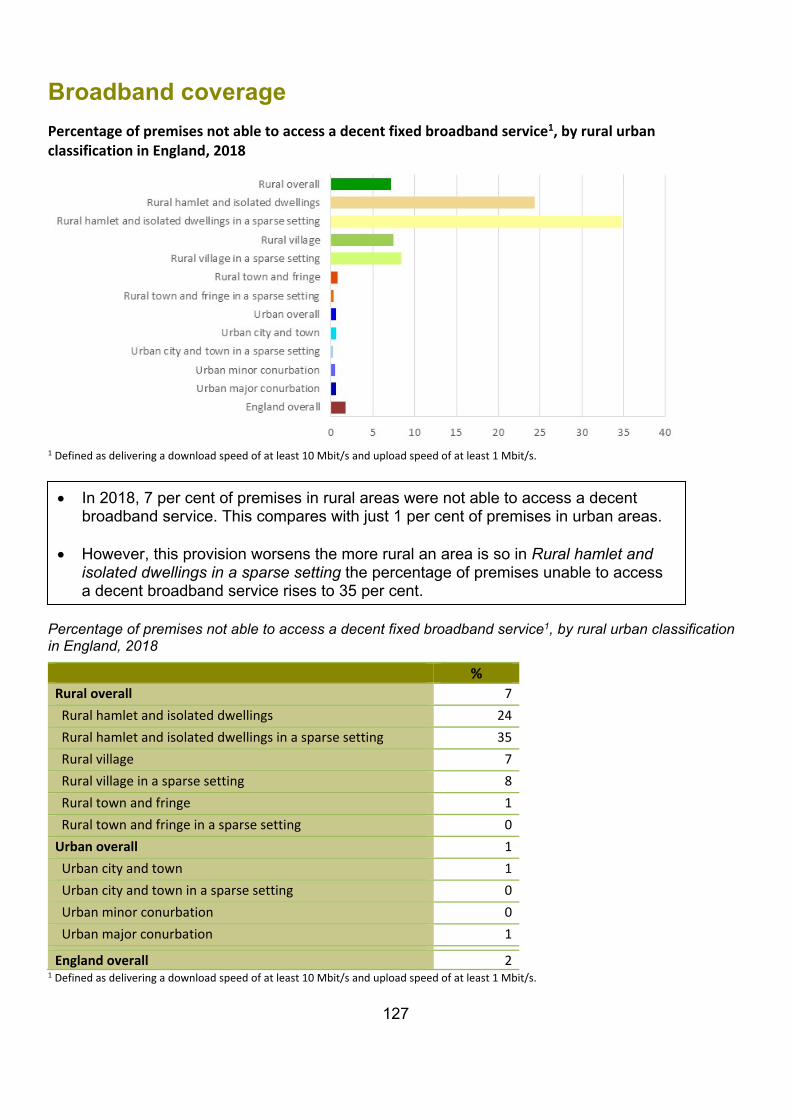
127
Broadband coverage Percentage of premises not able to access a decent fixed broadband service1, by rural urban classification in England, 2018
1 Defined as delivering a download speed of at least 10 Mbit/s and upload speed of at least 1 Mbit/s.
Percentage of premises not able to access a decent fixed broadband service1, by rural urban classification in England, 2018
% Rural overall 7 Rural hamlet and isolated dwellings 24 Rural hamlet and isolated dwellings in a sparse setting 35 Rural village 7 Rural village in a sparse setting 8 Rural town and fringe 1 Rural town and fringe in a sparse setting 0 Urban overall 1 Urban city and town 1 Urban city and town in a sparse setting 0 Urban minor conurbation 0 Urban major conurbation 1 England overall 2
1 Defined as delivering a download speed of at least 10 Mbit/s and upload speed of at least 1 Mbit/s.
• In 2018, 7 per cent of premises in rural areas were not able to access a decent broadband service. This compares with just 1 per cent of premises in urban areas.
• However, this provision worsens the more rural an area is so in Rural hamlet and
isolated dwellings in a sparse setting the percentage of premises unable to access a decent broadband service rises to 35 per cent.
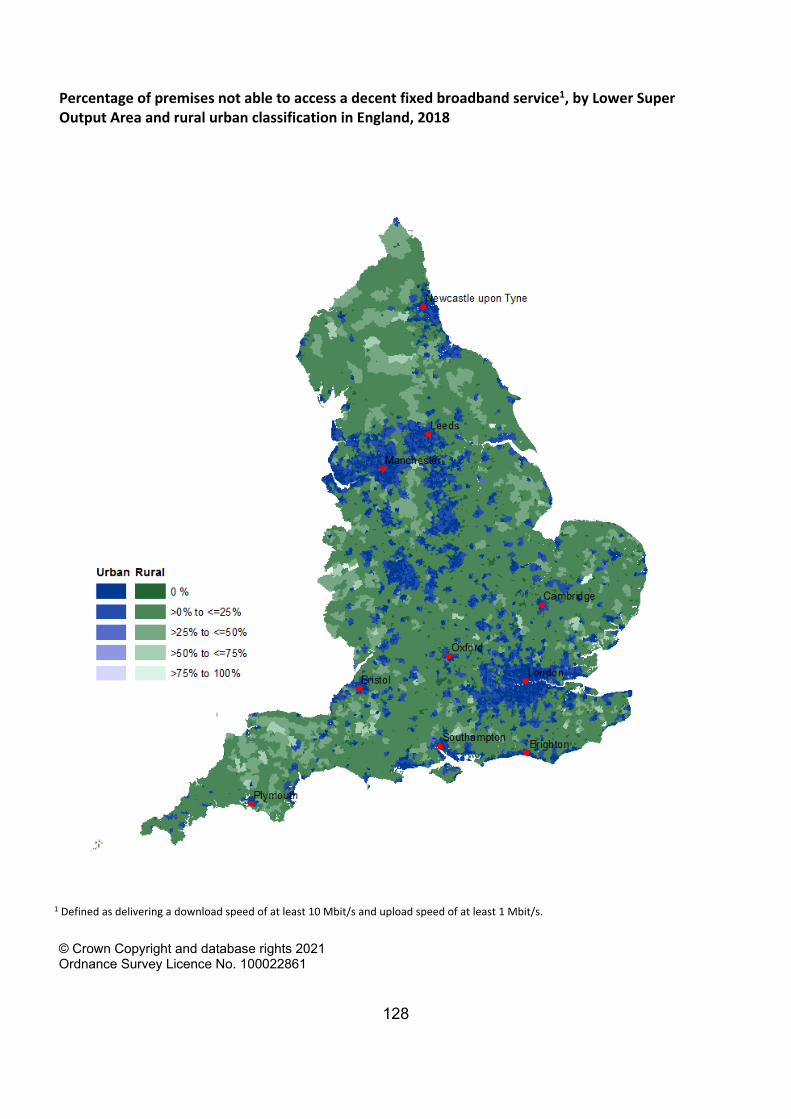
128
Percentage of premises not able to access a decent fixed broadband service1, by Lower Super Output Area and rural urban classification in England, 2018
1 Defined as delivering a download speed of at least 10 Mbit/s and upload speed of at least 1 Mbit/s.
© Crown Copyright and database rights 2021 Ordnance Survey Licence No. 100022861
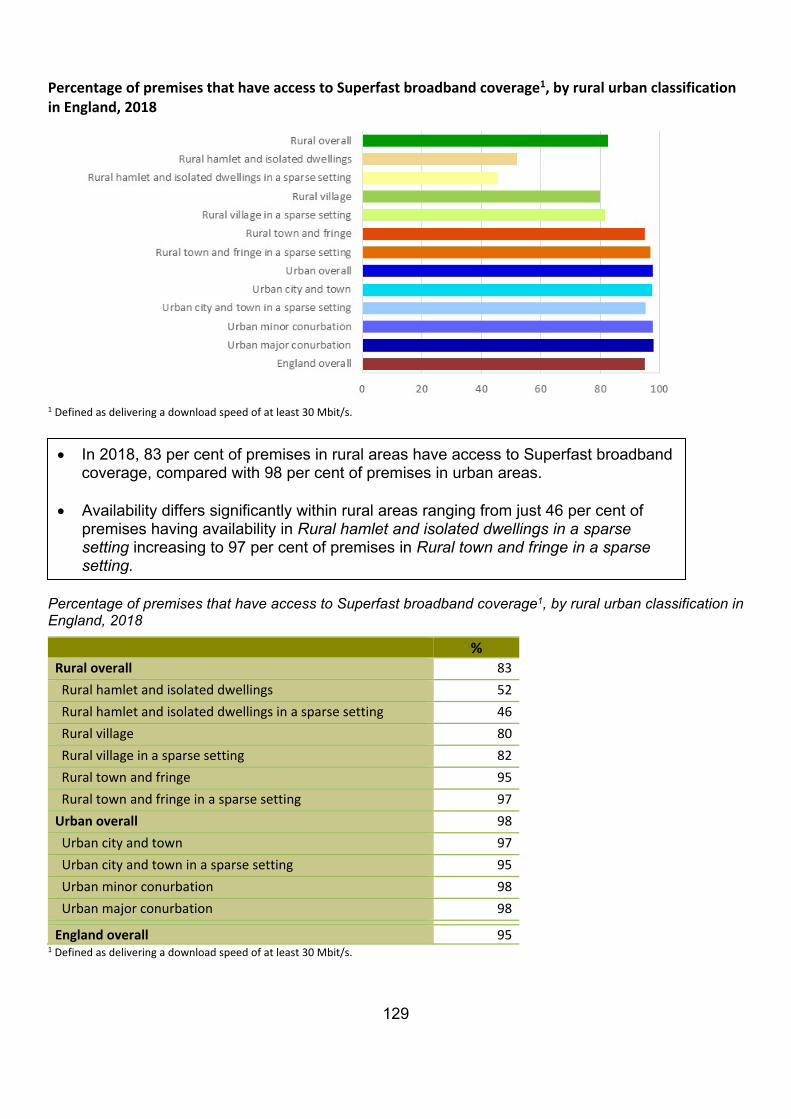
129
Percentage of premises that have access to Superfast broadband coverage1, by rural urban classification in England, 2018
1 Defined as delivering a download speed of at least 30 Mbit/s.
Percentage of premises that have access to Superfast broadband coverage1, by rural urban classification in England, 2018
% Rural overall 83 Rural hamlet and isolated dwellings 52 Rural hamlet and isolated dwellings in a sparse setting 46 Rural village 80 Rural village in a sparse setting 82 Rural town and fringe 95 Rural town and fringe in a sparse setting 97 Urban overall 98 Urban city and town 97 Urban city and town in a sparse setting 95 Urban minor conurbation 98 Urban major conurbation 98 England overall 95
1 Defined as delivering a download speed of at least 30 Mbit/s.
• In 2018, 83 per cent of premises in rural areas have access to Superfast broadband coverage, compared with 98 per cent of premises in urban areas.
• Availability differs significantly within rural areas ranging from just 46 per cent of
premises having availability in Rural hamlet and isolated dwellings in a sparse setting increasing to 97 per cent of premises in Rural town and fringe in a sparse setting.
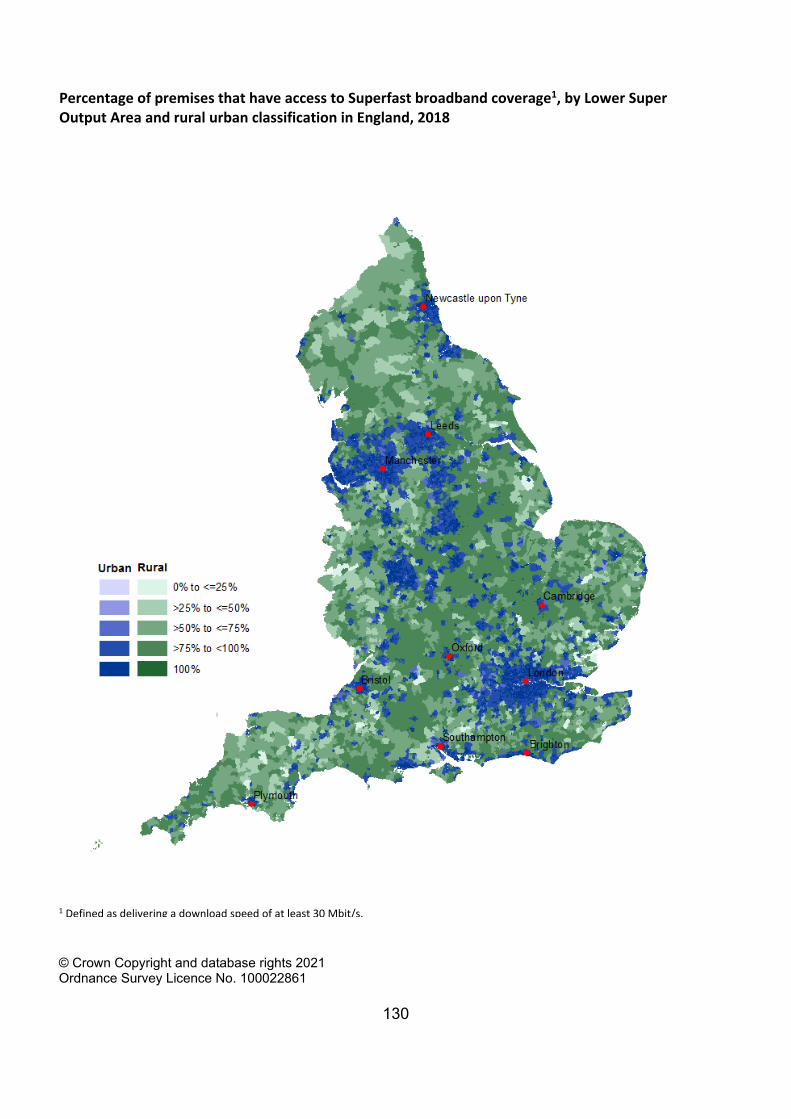
130
Percentage of premises that have access to Superfast broadband coverage1, by Lower Super Output Area and rural urban classification in England, 2018
1 Defined as delivering a download speed of at least 30 Mbit/s.
© Crown Copyright and database rights 2021 Ordnance Survey Licence No. 100022861
131
Ofcom average speed data is provided by the main broadband providers and, due to the completeness of the older datasets, the granular level data is not comparable with data from previous years.
Figures are based on OFCOM postcode level data on average speeds for fixed broadband weighted by the number of premises. Data exclude those postcodes for which there is no average speed data available or where there are fewer than four premises per postcode to protect customer privacy. In England this relates to 14% of all postcodes, the vast majority being where there are fewer than four premises per postcode
The 2018 area classifications are based on the latest RUC11, and as such, are not directly comparable with previous RUC01 based analysis.
Source: OFCOM, www.ofcom.org.uk Ofcom Connected Nations Report, 2018 (infrastructure-2018).
Department for Culture, Media and Sport publish quarterly Broadband Performance Indicators, which are available online: www.gov.uk/government/collections/broadband-performance-indicators They show the number of premises covered per £million of broadband delivery programme expenditure.
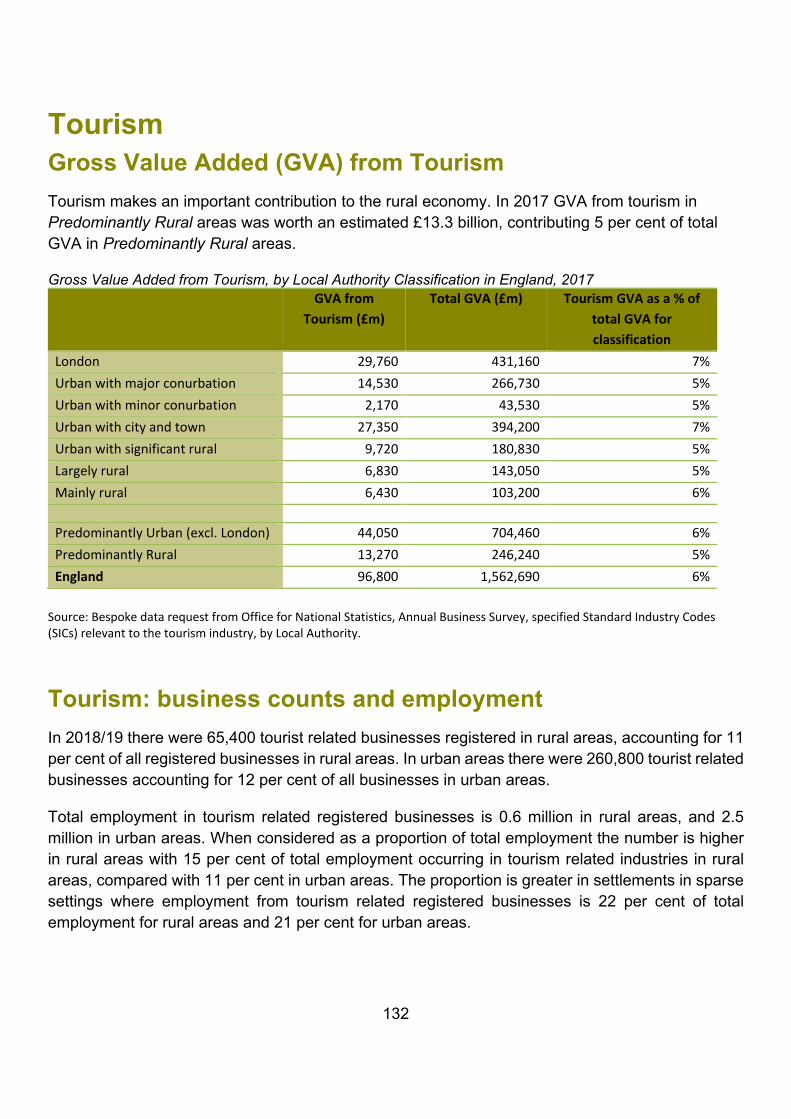
132
Tourism Gross Value Added (GVA) from Tourism Tourism makes an important contribution to the rural economy. In 2017 GVA from tourism in Predominantly Rural areas was worth an estimated £13.3 billion, contributing 5 per cent of total GVA in Predominantly Rural areas.
Gross Value Added from Tourism, by Local Authority Classification in England, 2017 GVA from
Tourism (£m) Total GVA (£m) Tourism GVA as a % of
total GVA for classification
London 29,760 431,160 7% Urban with major conurbation 14,530 266,730 5% Urban with minor conurbation 2,170 43,530 5% Urban with city and town 27,350 394,200 7% Urban with significant rural 9,720 180,830 5% Largely rural 6,830 143,050 5% Mainly rural 6,430 103,200 6%
Predominantly Urban (excl. London) 44,050 704,460 6% Predominantly Rural 13,270 246,240 5% England 96,800 1,562,690 6%
Source: Bespoke data request from Office for National Statistics, Annual Business Survey, specified Standard Industry Codes (SICs) relevant to the tourism industry, by Local Authority.
Tourism: business counts and employment In 2018/19 there were 65,400 tourist related businesses registered in rural areas, accounting for 11 per cent of all registered businesses in rural areas. In urban areas there were 260,800 tourist related businesses accounting for 12 per cent of all businesses in urban areas.
Total employment in tourism related registered businesses is 0.6 million in rural areas, and 2.5 million in urban areas. When considered as a proportion of total employment the number is higher in rural areas with 15 per cent of total employment occurring in tourism related industries in rural areas, compared with 11 per cent in urban areas. The proportion is greater in settlements in sparse settings where employment from tourism related registered businesses is 22 per cent of total employment for rural areas and 21 per cent for urban areas.
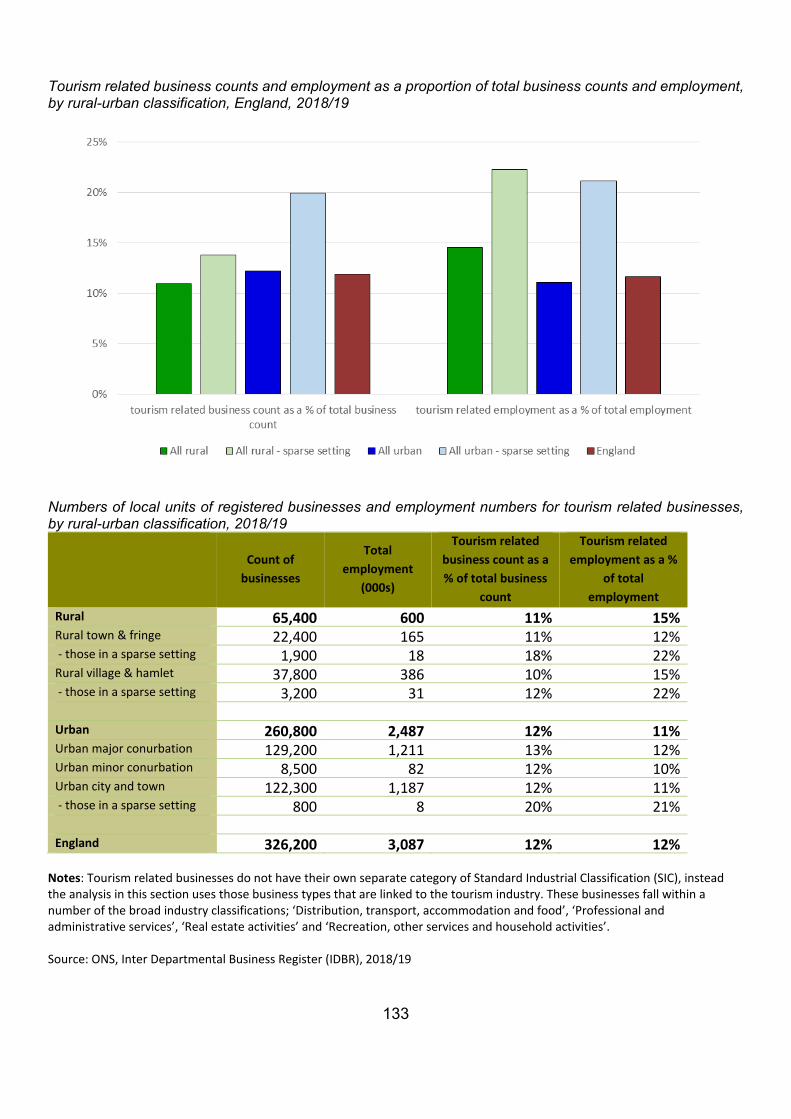
133
Tourism related business counts and employment as a proportion of total business counts and employment, by rural-urban classification, England, 2018/19
Numbers of local units of registered businesses and employment numbers for tourism related businesses, by rural-urban classification, 2018/19
Count of
businesses
Total employment
(000s)
Tourism related business count as a % of total business
count
Tourism related employment as a %
of total employment
Rural 65,400 600 11% 15% Rural town & fringe 22,400 165 11% 12% - those in a sparse setting 1,900 18 18% 22% Rural village & hamlet 37,800 386 10% 15% - those in a sparse setting 3,200 31 12% 22% Urban 260,800 2,487 12% 11% Urban major conurbation 129,200 1,211 13% 12% Urban minor conurbation 8,500 82 12% 10% Urban city and town 122,300 1,187 12% 11% - those in a sparse setting 800 8 20% 21% England 326,200 3,087 12% 12%
Notes: Tourism related businesses do not have their own separate category of Standard Industrial Classification (SIC), instead the analysis in this section uses those business types that are linked to the tourism industry. These businesses fall within a number of the broad industry classifications; ‘Distribution, transport, accommodation and food’, ‘Professional and administrative services’, ‘Real estate activities’ and ‘Recreation, other services and household activities’. Source: ONS, Inter Departmental Business Register (IDBR), 2018/19
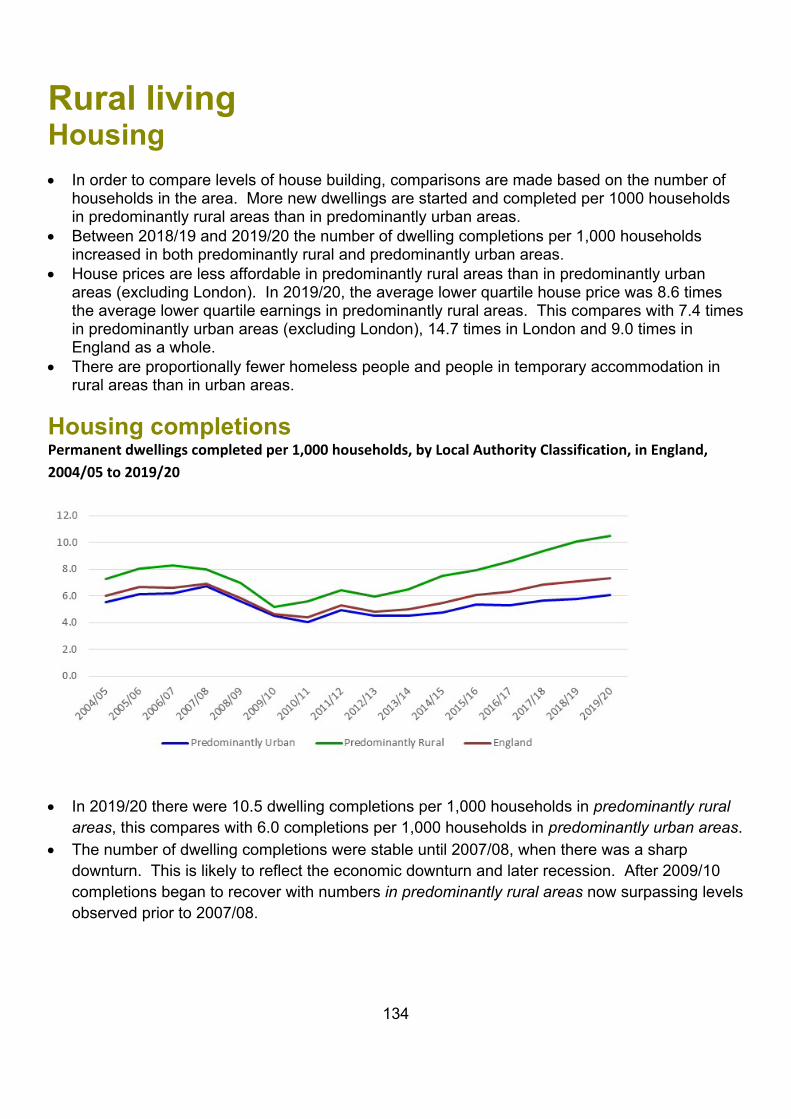
134
Rural living Housing • In order to compare levels of house building, comparisons are made based on the number of
households in the area. More new dwellings are started and completed per 1000 households in predominantly rural areas than in predominantly urban areas.
• Between 2018/19 and 2019/20 the number of dwelling completions per 1,000 households increased in both predominantly rural and predominantly urban areas.
• House prices are less affordable in predominantly rural areas than in predominantly urban areas (excluding London). In 2019/20, the average lower quartile house price was 8.6 times the average lower quartile earnings in predominantly rural areas. This compares with 7.4 times in predominantly urban areas (excluding London), 14.7 times in London and 9.0 times in England as a whole.
• There are proportionally fewer homeless people and people in temporary accommodation in rural areas than in urban areas.
Housing completions Permanent dwellings completed per 1,000 households, by Local Authority Classification, in England, 2004/05 to 2019/20
• In 2019/20 there were 10.5 dwelling completions per 1,000 households in predominantly rural
areas, this compares with 6.0 completions per 1,000 households in predominantly urban areas. • The number of dwelling completions were stable until 2007/08, when there was a sharp
downturn. This is likely to reflect the economic downturn and later recession. After 2009/10 completions began to recover with numbers in predominantly rural areas now surpassing levels observed prior to 2007/08.
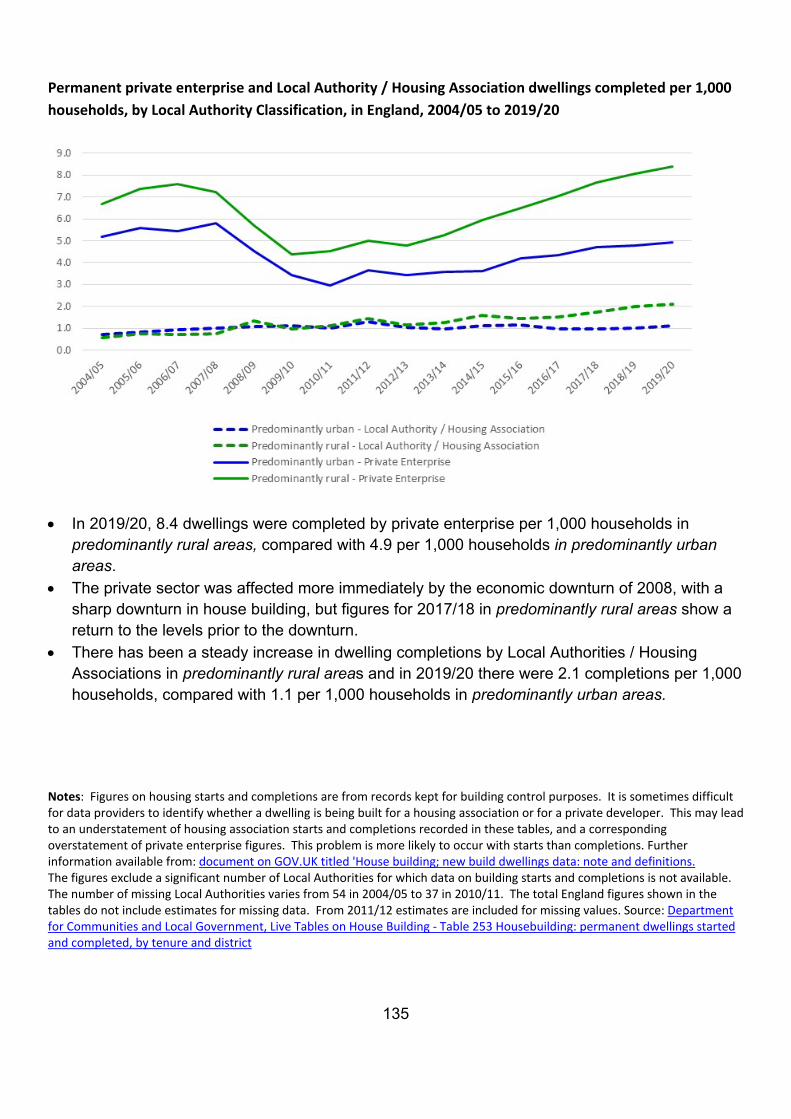
135
Permanent private enterprise and Local Authority / Housing Association dwellings completed per 1,000 households, by Local Authority Classification, in England, 2004/05 to 2019/20
• In 2019/20, 8.4 dwellings were completed by private enterprise per 1,000 households in
predominantly rural areas, compared with 4.9 per 1,000 households in predominantly urban areas.
• The private sector was affected more immediately by the economic downturn of 2008, with a sharp downturn in house building, but figures for 2017/18 in predominantly rural areas show a return to the levels prior to the downturn.
• There has been a steady increase in dwelling completions by Local Authorities / Housing Associations in predominantly rural areas and in 2019/20 there were 2.1 completions per 1,000 households, compared with 1.1 per 1,000 households in predominantly urban areas.
Notes: Figures on housing starts and completions are from records kept for building control purposes. It is sometimes difficult for data providers to identify whether a dwelling is being built for a housing association or for a private developer. This may lead to an understatement of housing association starts and completions recorded in these tables, and a corresponding overstatement of private enterprise figures. This problem is more likely to occur with starts than completions. Further information available from: document on GOV.UK titled 'House building; new build dwellings data: note and definitions. The figures exclude a significant number of Local Authorities for which data on building starts and completions is not available. The number of missing Local Authorities varies from 54 in 2004/05 to 37 in 2010/11. The total England figures shown in the tables do not include estimates for missing data. From 2011/12 estimates are included for missing values. Source: Department for Communities and Local Government, Live Tables on House Building - Table 253 Housebuilding: permanent dwellings started and completed, by tenure and district
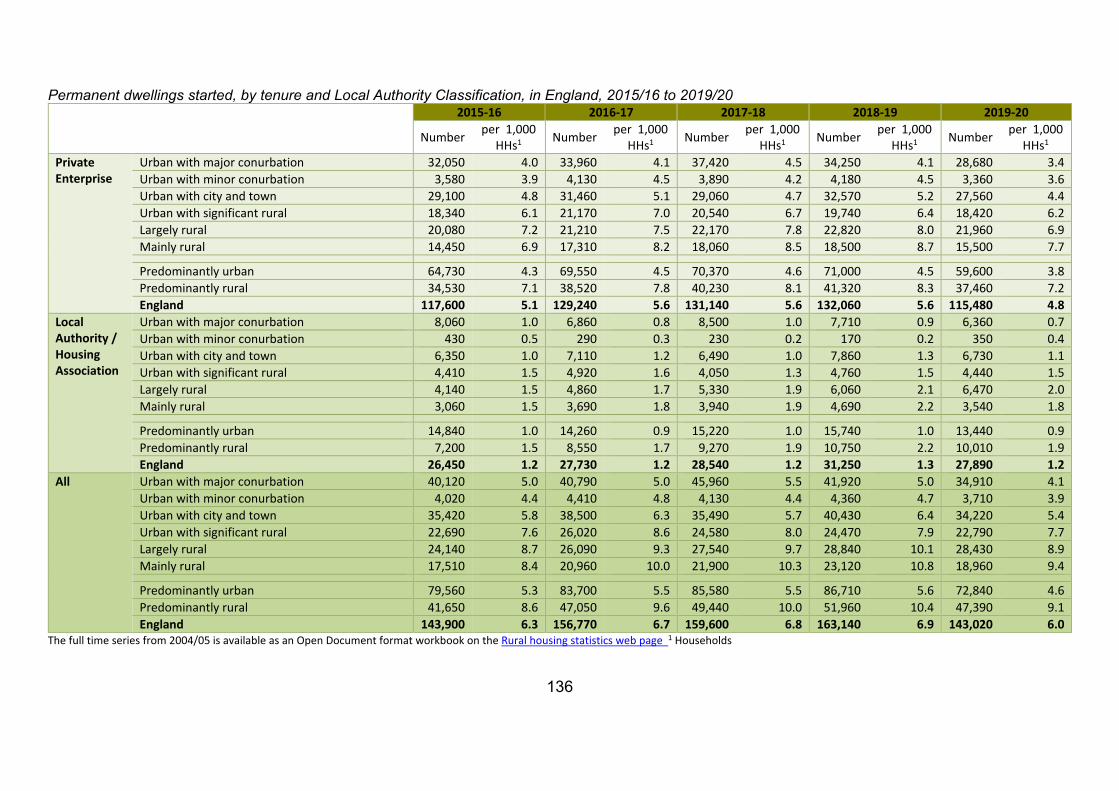
136
Permanent dwellings started, by tenure and Local Authority Classification, in England, 2015/16 to 2019/20 2015-16 2016-17 2017-18 2018-19 2019-20 Number per 1,000
HHs1 Number per 1,000 HHs1 Number per 1,000
HHs1 Number per 1,000 HHs1 Number per 1,000
HHs1 Private Enterprise
Urban with major conurbation 32,050 4.0 33,960 4.1 37,420 4.5 34,250 4.1 28,680 3.4 Urban with minor conurbation 3,580 3.9 4,130 4.5 3,890 4.2 4,180 4.5 3,360 3.6 Urban with city and town 29,100 4.8 31,460 5.1 29,060 4.7 32,570 5.2 27,560 4.4 Urban with significant rural 18,340 6.1 21,170 7.0 20,540 6.7 19,740 6.4 18,420 6.2 Largely rural 20,080 7.2 21,210 7.5 22,170 7.8 22,820 8.0 21,960 6.9 Mainly rural 14,450 6.9 17,310 8.2 18,060 8.5 18,500 8.7 15,500 7.7 Predominantly urban 64,730 4.3 69,550 4.5 70,370 4.6 71,000 4.5 59,600 3.8 Predominantly rural 34,530 7.1 38,520 7.8 40,230 8.1 41,320 8.3 37,460 7.2 England 117,600 5.1 129,240 5.6 131,140 5.6 132,060 5.6 115,480 4.8
Local Authority / Housing Association
Urban with major conurbation 8,060 1.0 6,860 0.8 8,500 1.0 7,710 0.9 6,360 0.7 Urban with minor conurbation 430 0.5 290 0.3 230 0.2 170 0.2 350 0.4 Urban with city and town 6,350 1.0 7,110 1.2 6,490 1.0 7,860 1.3 6,730 1.1 Urban with significant rural 4,410 1.5 4,920 1.6 4,050 1.3 4,760 1.5 4,440 1.5 Largely rural 4,140 1.5 4,860 1.7 5,330 1.9 6,060 2.1 6,470 2.0 Mainly rural 3,060 1.5 3,690 1.8 3,940 1.9 4,690 2.2 3,540 1.8 Predominantly urban 14,840 1.0 14,260 0.9 15,220 1.0 15,740 1.0 13,440 0.9 Predominantly rural 7,200 1.5 8,550 1.7 9,270 1.9 10,750 2.2 10,010 1.9 England 26,450 1.2 27,730 1.2 28,540 1.2 31,250 1.3 27,890 1.2
All Urban with major conurbation 40,120 5.0 40,790 5.0 45,960 5.5 41,920 5.0 34,910 4.1 Urban with minor conurbation 4,020 4.4 4,410 4.8 4,130 4.4 4,360 4.7 3,710 3.9 Urban with city and town 35,420 5.8 38,500 6.3 35,490 5.7 40,430 6.4 34,220 5.4 Urban with significant rural 22,690 7.6 26,020 8.6 24,580 8.0 24,470 7.9 22,790 7.7 Largely rural 24,140 8.7 26,090 9.3 27,540 9.7 28,840 10.1 28,430 8.9 Mainly rural 17,510 8.4 20,960 10.0 21,900 10.3 23,120 10.8 18,960 9.4 Predominantly urban 79,560 5.3 83,700 5.5 85,580 5.5 86,710 5.6 72,840 4.6 Predominantly rural 41,650 8.6 47,050 9.6 49,440 10.0 51,960 10.4 47,390 9.1 England 143,900 6.3 156,770 6.7 159,600 6.8 163,140 6.9 143,020 6.0
The full time series from 2004/05 is available as an Open Document format workbook on the Rural housing statistics web page 1 Households
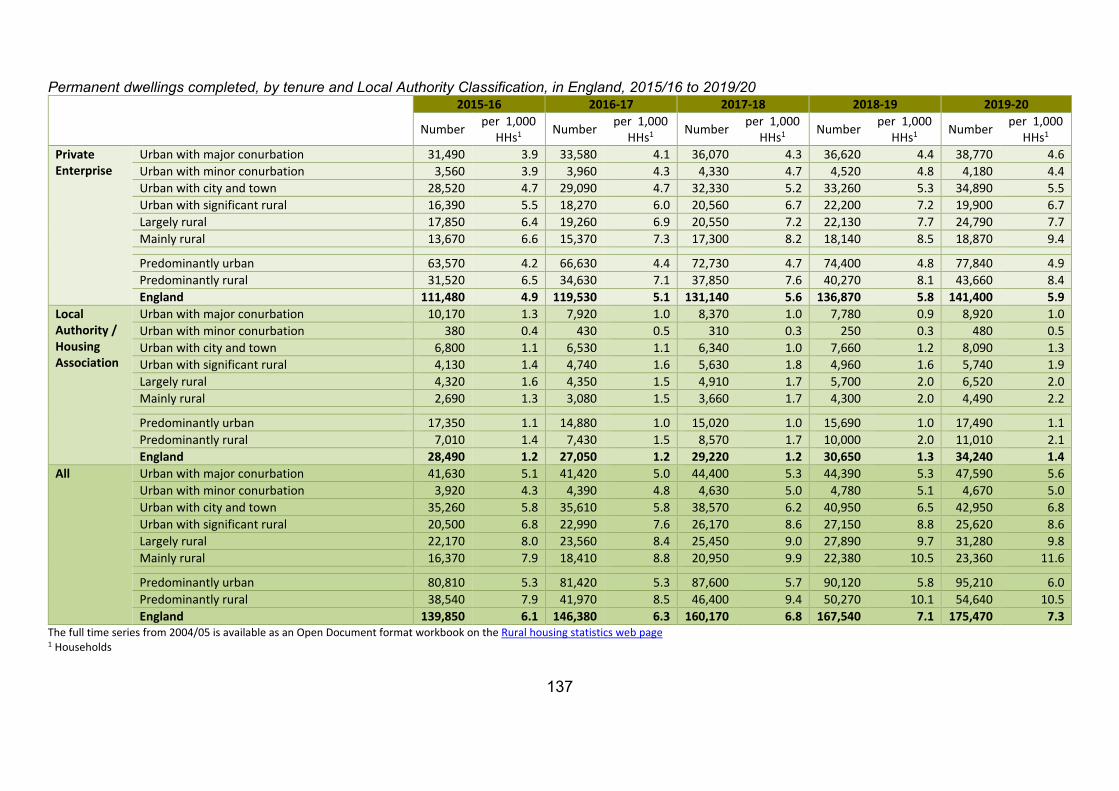
137
Permanent dwellings completed, by tenure and Local Authority Classification, in England, 2015/16 to 2019/20 2015-16 2016-17 2017-18 2018-19 2019-20 Number per 1,000
HHs1 Number per 1,000 HHs1 Number per 1,000
HHs1 Number per 1,000 HHs1 Number per 1,000
HHs1 Private Enterprise
Urban with major conurbation 31,490 3.9 33,580 4.1 36,070 4.3 36,620 4.4 38,770 4.6 Urban with minor conurbation 3,560 3.9 3,960 4.3 4,330 4.7 4,520 4.8 4,180 4.4 Urban with city and town 28,520 4.7 29,090 4.7 32,330 5.2 33,260 5.3 34,890 5.5 Urban with significant rural 16,390 5.5 18,270 6.0 20,560 6.7 22,200 7.2 19,900 6.7 Largely rural 17,850 6.4 19,260 6.9 20,550 7.2 22,130 7.7 24,790 7.7 Mainly rural 13,670 6.6 15,370 7.3 17,300 8.2 18,140 8.5 18,870 9.4 Predominantly urban 63,570 4.2 66,630 4.4 72,730 4.7 74,400 4.8 77,840 4.9 Predominantly rural 31,520 6.5 34,630 7.1 37,850 7.6 40,270 8.1 43,660 8.4 England 111,480 4.9 119,530 5.1 131,140 5.6 136,870 5.8 141,400 5.9
Local Authority / Housing Association
Urban with major conurbation 10,170 1.3 7,920 1.0 8,370 1.0 7,780 0.9 8,920 1.0 Urban with minor conurbation 380 0.4 430 0.5 310 0.3 250 0.3 480 0.5 Urban with city and town 6,800 1.1 6,530 1.1 6,340 1.0 7,660 1.2 8,090 1.3 Urban with significant rural 4,130 1.4 4,740 1.6 5,630 1.8 4,960 1.6 5,740 1.9 Largely rural 4,320 1.6 4,350 1.5 4,910 1.7 5,700 2.0 6,520 2.0 Mainly rural 2,690 1.3 3,080 1.5 3,660 1.7 4,300 2.0 4,490 2.2 Predominantly urban 17,350 1.1 14,880 1.0 15,020 1.0 15,690 1.0 17,490 1.1 Predominantly rural 7,010 1.4 7,430 1.5 8,570 1.7 10,000 2.0 11,010 2.1 England 28,490 1.2 27,050 1.2 29,220 1.2 30,650 1.3 34,240 1.4
All Urban with major conurbation 41,630 5.1 41,420 5.0 44,400 5.3 44,390 5.3 47,590 5.6 Urban with minor conurbation 3,920 4.3 4,390 4.8 4,630 5.0 4,780 5.1 4,670 5.0 Urban with city and town 35,260 5.8 35,610 5.8 38,570 6.2 40,950 6.5 42,950 6.8 Urban with significant rural 20,500 6.8 22,990 7.6 26,170 8.6 27,150 8.8 25,620 8.6 Largely rural 22,170 8.0 23,560 8.4 25,450 9.0 27,890 9.7 31,280 9.8 Mainly rural 16,370 7.9 18,410 8.8 20,950 9.9 22,380 10.5 23,360 11.6 Predominantly urban 80,810 5.3 81,420 5.3 87,600 5.7 90,120 5.8 95,210 6.0 Predominantly rural 38,540 7.9 41,970 8.5 46,400 9.4 50,270 10.1 54,640 10.5 England 139,850 6.1 146,380 6.3 160,170 6.8 167,540 7.1 175,470 7.3
The full time series from 2004/05 is available as an Open Document format workbook on the Rural housing statistics web page 1 Households
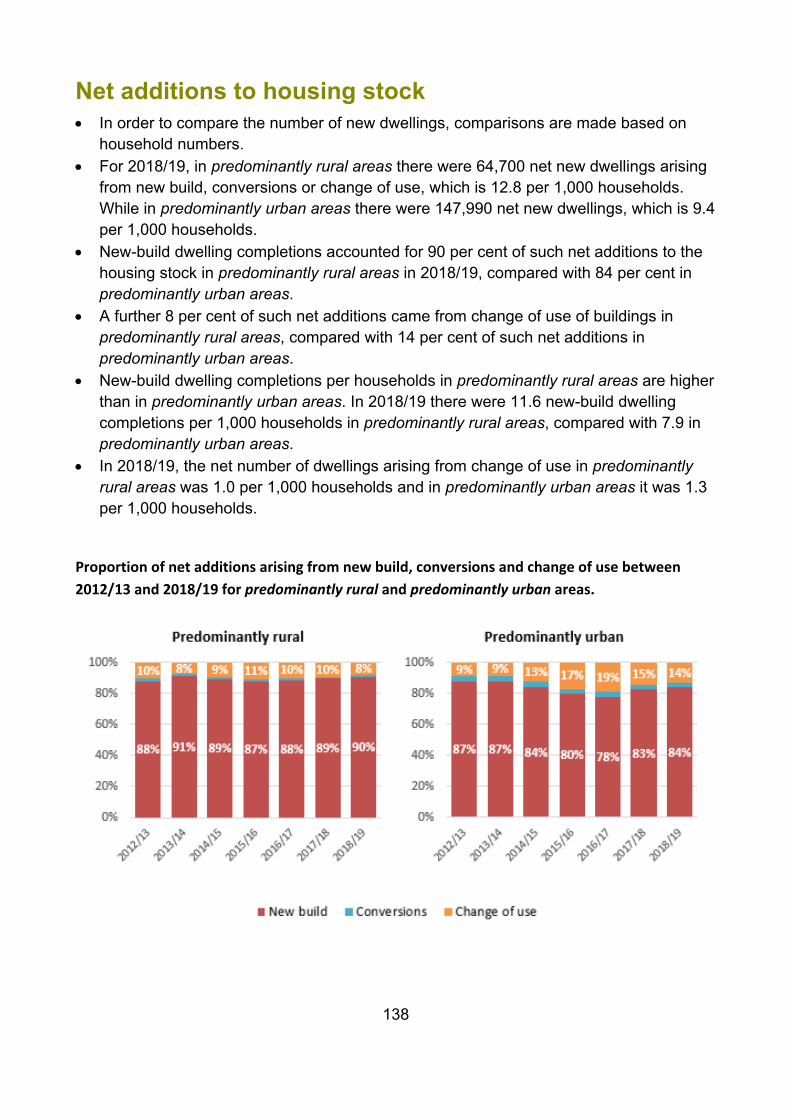
138
Net additions to housing stock • In order to compare the number of new dwellings, comparisons are made based on
household numbers. • For 2018/19, in predominantly rural areas there were 64,700 net new dwellings arising
from new build, conversions or change of use, which is 12.8 per 1,000 households. While in predominantly urban areas there were 147,990 net new dwellings, which is 9.4 per 1,000 households.
• New-build dwelling completions accounted for 90 per cent of such net additions to the housing stock in predominantly rural areas in 2018/19, compared with 84 per cent in predominantly urban areas.
• A further 8 per cent of such net additions came from change of use of buildings in predominantly rural areas, compared with 14 per cent of such net additions in predominantly urban areas.
• New-build dwelling completions per households in predominantly rural areas are higher than in predominantly urban areas. In 2018/19 there were 11.6 new-build dwelling completions per 1,000 households in predominantly rural areas, compared with 7.9 in predominantly urban areas.
• In 2018/19, the net number of dwellings arising from change of use in predominantly rural areas was 1.0 per 1,000 households and in predominantly urban areas it was 1.3 per 1,000 households.
Proportion of net additions arising from new build, conversions and change of use between 2012/13 and 2018/19 for predominantly rural and predominantly urban areas.
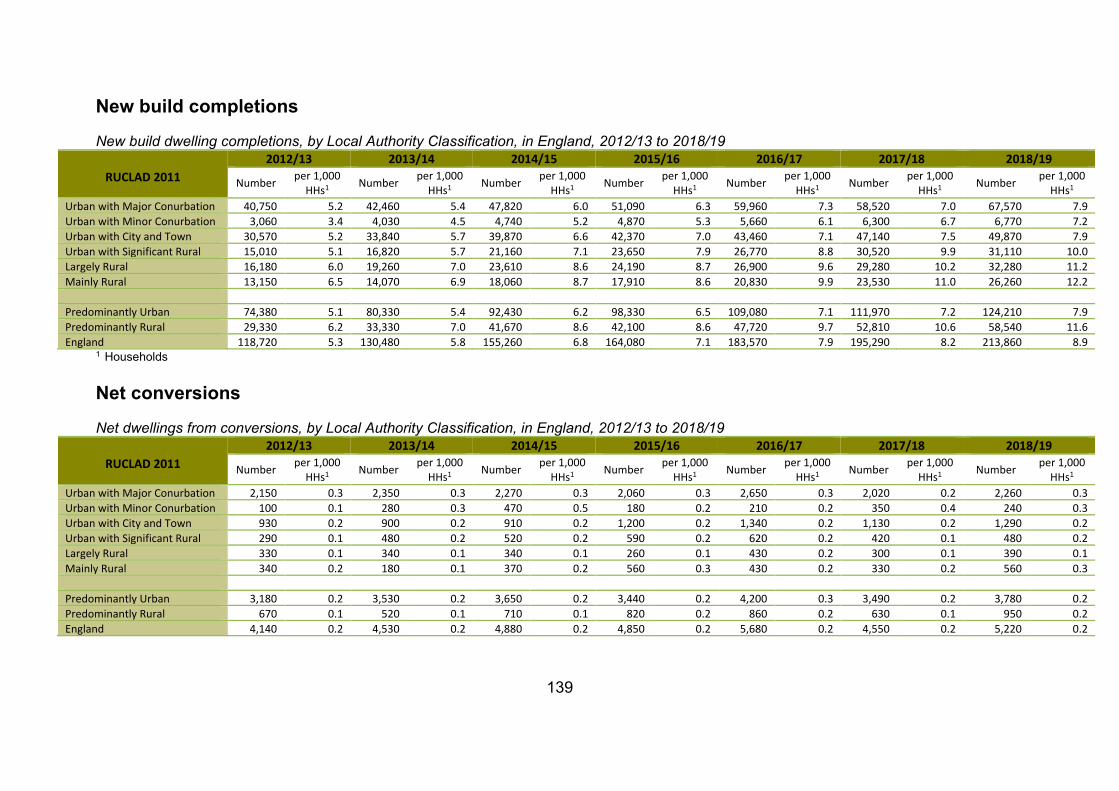
139
New build completions
New build dwelling completions, by Local Authority Classification, in England, 2012/13 to 2018/19
RUCLAD 2011 2012/13 2013/14 2014/15 2015/16 2016/17 2017/18 2018/19
Number per 1,000 HHs1 Number per 1,000
HHs1 Number per 1,000 HHs1 Number per 1,000
HHs1 Number per 1,000 HHs1 Number per 1,000
HHs1 Number per 1,000 HHs1
Urban with Major Conurbation 40,750 5.2 42,460 5.4 47,820 6.0 51,090 6.3 59,960 7.3 58,520 7.0 67,570 7.9 Urban with Minor Conurbation 3,060 3.4 4,030 4.5 4,740 5.2 4,870 5.3 5,660 6.1 6,300 6.7 6,770 7.2 Urban with City and Town 30,570 5.2 33,840 5.7 39,870 6.6 42,370 7.0 43,460 7.1 47,140 7.5 49,870 7.9 Urban with Significant Rural 15,010 5.1 16,820 5.7 21,160 7.1 23,650 7.9 26,770 8.8 30,520 9.9 31,110 10.0 Largely Rural 16,180 6.0 19,260 7.0 23,610 8.6 24,190 8.7 26,900 9.6 29,280 10.2 32,280 11.2 Mainly Rural 13,150 6.5 14,070 6.9 18,060 8.7 17,910 8.6 20,830 9.9 23,530 11.0 26,260 12.2 Predominantly Urban 74,380 5.1 80,330 5.4 92,430 6.2 98,330 6.5 109,080 7.1 111,970 7.2 124,210 7.9 Predominantly Rural 29,330 6.2 33,330 7.0 41,670 8.6 42,100 8.6 47,720 9.7 52,810 10.6 58,540 11.6 England 118,720 5.3 130,480 5.8 155,260 6.8 164,080 7.1 183,570 7.9 195,290 8.2 213,860 8.9
1 Households Net conversions
Net dwellings from conversions, by Local Authority Classification, in England, 2012/13 to 2018/19
RUCLAD 2011 2012/13 2013/14 2014/15 2015/16 2016/17 2017/18 2018/19
Number per 1,000 HHs1 Number per 1,000
HHs1 Number per 1,000 HHs1 Number per 1,000
HHs1 Number per 1,000 HHs1 Number per 1,000
HHs1 Number per 1,000 HHs1
Urban with Major Conurbation 2,150 0.3 2,350 0.3 2,270 0.3 2,060 0.3 2,650 0.3 2,020 0.2 2,260 0.3 Urban with Minor Conurbation 100 0.1 280 0.3 470 0.5 180 0.2 210 0.2 350 0.4 240 0.3 Urban with City and Town 930 0.2 900 0.2 910 0.2 1,200 0.2 1,340 0.2 1,130 0.2 1,290 0.2 Urban with Significant Rural 290 0.1 480 0.2 520 0.2 590 0.2 620 0.2 420 0.1 480 0.2 Largely Rural 330 0.1 340 0.1 340 0.1 260 0.1 430 0.2 300 0.1 390 0.1 Mainly Rural 340 0.2 180 0.1 370 0.2 560 0.3 430 0.2 330 0.2 560 0.3 Predominantly Urban 3,180 0.2 3,530 0.2 3,650 0.2 3,440 0.2 4,200 0.3 3,490 0.2 3,780 0.2 Predominantly Rural 670 0.1 520 0.1 710 0.1 820 0.2 860 0.2 630 0.1 950 0.2 England 4,140 0.2 4,530 0.2 4,880 0.2 4,850 0.2 5,680 0.2 4,550 0.2 5,220 0.2
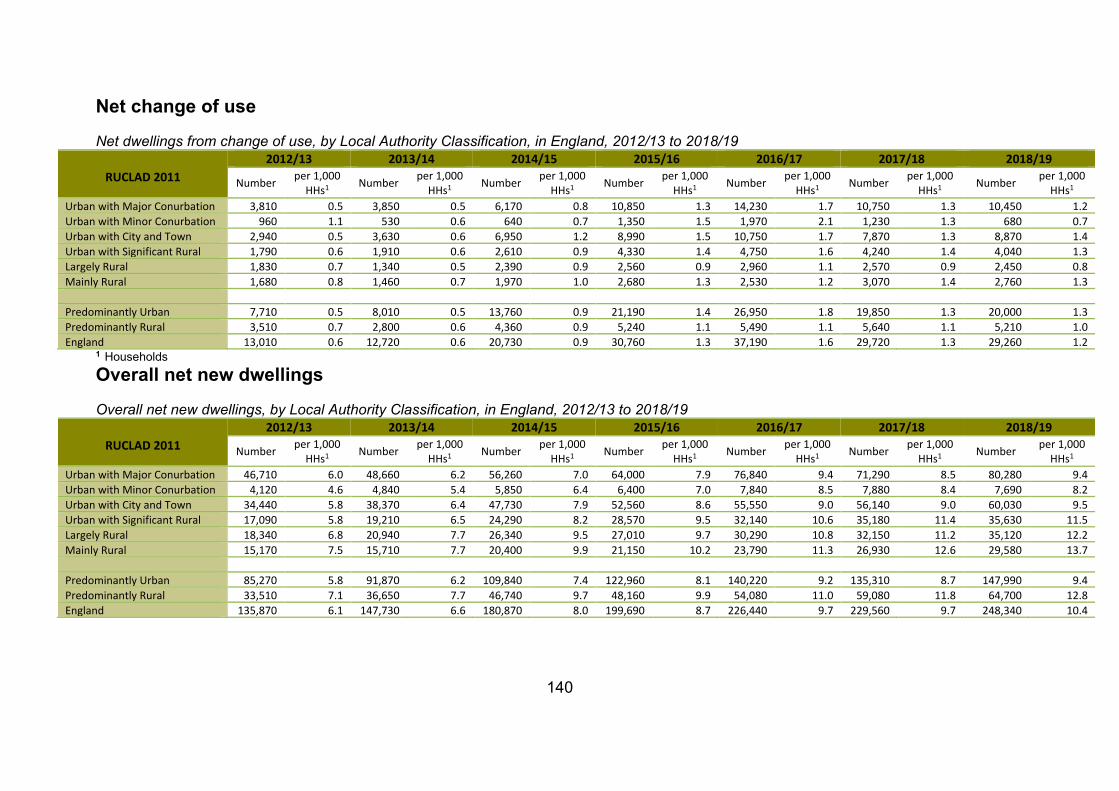
140
Net change of use
Net dwellings from change of use, by Local Authority Classification, in England, 2012/13 to 2018/19
RUCLAD 2011 2012/13 2013/14 2014/15 2015/16 2016/17 2017/18 2018/19
Number per 1,000 HHs1 Number per 1,000
HHs1 Number per 1,000 HHs1 Number per 1,000
HHs1 Number per 1,000 HHs1 Number per 1,000
HHs1 Number per 1,000 HHs1
Urban with Major Conurbation 3,810 0.5 3,850 0.5 6,170 0.8 10,850 1.3 14,230 1.7 10,750 1.3 10,450 1.2 Urban with Minor Conurbation 960 1.1 530 0.6 640 0.7 1,350 1.5 1,970 2.1 1,230 1.3 680 0.7 Urban with City and Town 2,940 0.5 3,630 0.6 6,950 1.2 8,990 1.5 10,750 1.7 7,870 1.3 8,870 1.4 Urban with Significant Rural 1,790 0.6 1,910 0.6 2,610 0.9 4,330 1.4 4,750 1.6 4,240 1.4 4,040 1.3 Largely Rural 1,830 0.7 1,340 0.5 2,390 0.9 2,560 0.9 2,960 1.1 2,570 0.9 2,450 0.8 Mainly Rural 1,680 0.8 1,460 0.7 1,970 1.0 2,680 1.3 2,530 1.2 3,070 1.4 2,760 1.3 Predominantly Urban 7,710 0.5 8,010 0.5 13,760 0.9 21,190 1.4 26,950 1.8 19,850 1.3 20,000 1.3 Predominantly Rural 3,510 0.7 2,800 0.6 4,360 0.9 5,240 1.1 5,490 1.1 5,640 1.1 5,210 1.0 England 13,010 0.6 12,720 0.6 20,730 0.9 30,760 1.3 37,190 1.6 29,720 1.3 29,260 1.2
1 Households Overall net new dwellings
Overall net new dwellings, by Local Authority Classification, in England, 2012/13 to 2018/19
RUCLAD 2011 2012/13 2013/14 2014/15 2015/16 2016/17 2017/18 2018/19
Number per 1,000 HHs1 Number per 1,000
HHs1 Number per 1,000 HHs1 Number per 1,000
HHs1 Number per 1,000 HHs1 Number per 1,000
HHs1 Number per 1,000 HHs1
Urban with Major Conurbation 46,710 6.0 48,660 6.2 56,260 7.0 64,000 7.9 76,840 9.4 71,290 8.5 80,280 9.4 Urban with Minor Conurbation 4,120 4.6 4,840 5.4 5,850 6.4 6,400 7.0 7,840 8.5 7,880 8.4 7,690 8.2 Urban with City and Town 34,440 5.8 38,370 6.4 47,730 7.9 52,560 8.6 55,550 9.0 56,140 9.0 60,030 9.5 Urban with Significant Rural 17,090 5.8 19,210 6.5 24,290 8.2 28,570 9.5 32,140 10.6 35,180 11.4 35,630 11.5 Largely Rural 18,340 6.8 20,940 7.7 26,340 9.5 27,010 9.7 30,290 10.8 32,150 11.2 35,120 12.2 Mainly Rural 15,170 7.5 15,710 7.7 20,400 9.9 21,150 10.2 23,790 11.3 26,930 12.6 29,580 13.7 Predominantly Urban 85,270 5.8 91,870 6.2 109,840 7.4 122,960 8.1 140,220 9.2 135,310 8.7 147,990 9.4 Predominantly Rural 33,510 7.1 36,650 7.7 46,740 9.7 48,160 9.9 54,080 11.0 59,080 11.8 64,700 12.8 England 135,870 6.1 147,730 6.6 180,870 8.0 199,690 8.7 226,440 9.7 229,560 9.7 248,340 10.4

141
Notes: The net supply of housing statistics, also known as ‘net additions’, track changes in the size of dwelling stock due to: New builds (completions), conversions (e.g. a house converted to a number of flats), changes of use (e.g. a residential house to an office), demolitions, and other net gains and losses. Source: Table 123 of the Live tables on dwelling stock series (Department for Communities and Local Government)
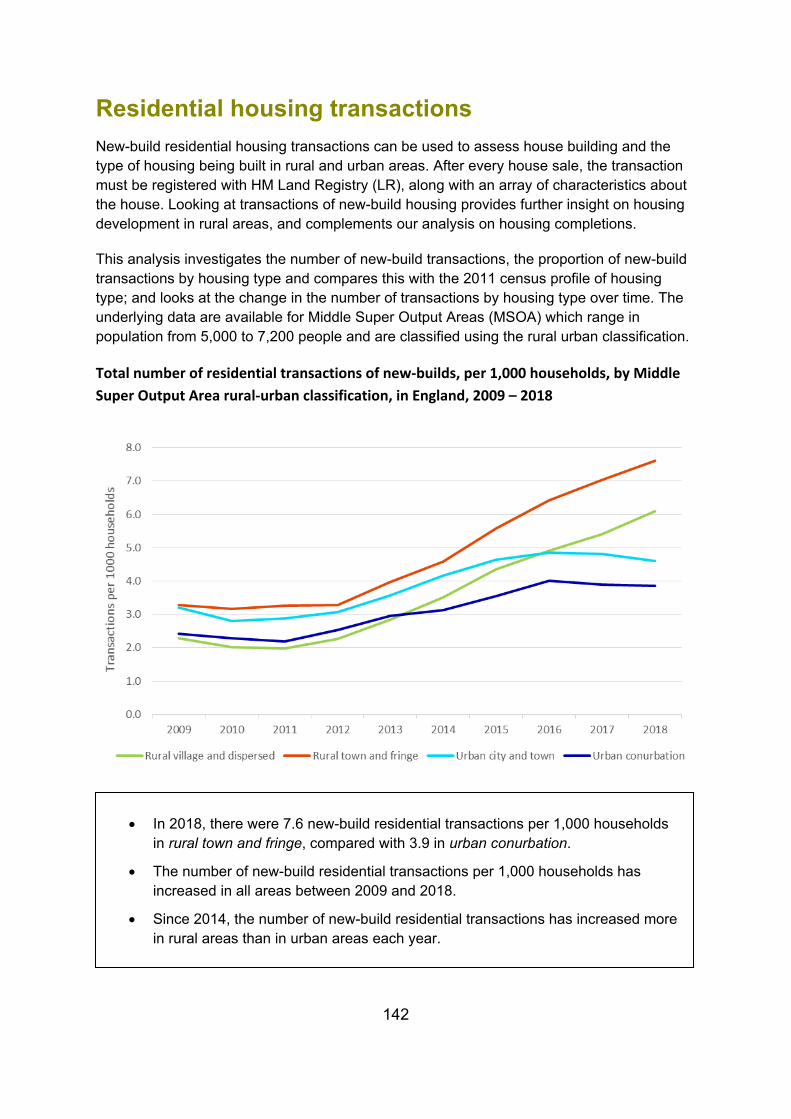
142
Residential housing transactions New-build residential housing transactions can be used to assess house building and the type of housing being built in rural and urban areas. After every house sale, the transaction must be registered with HM Land Registry (LR), along with an array of characteristics about the house. Looking at transactions of new-build housing provides further insight on housing development in rural areas, and complements our analysis on housing completions.
This analysis investigates the number of new-build transactions, the proportion of new-build transactions by housing type and compares this with the 2011 census profile of housing type; and looks at the change in the number of transactions by housing type over time. The underlying data are available for Middle Super Output Areas (MSOA) which range in population from 5,000 to 7,200 people and are classified using the rural urban classification.
Total number of residential transactions of new-builds, per 1,000 households, by Middle Super Output Area rural-urban classification, in England, 2009 – 2018
• In 2018, there were 7.6 new-build residential transactions per 1,000 households in rural town and fringe, compared with 3.9 in urban conurbation.
• The number of new-build residential transactions per 1,000 households has increased in all areas between 2009 and 2018.
• Since 2014, the number of new-build residential transactions has increased more in rural areas than in urban areas each year.
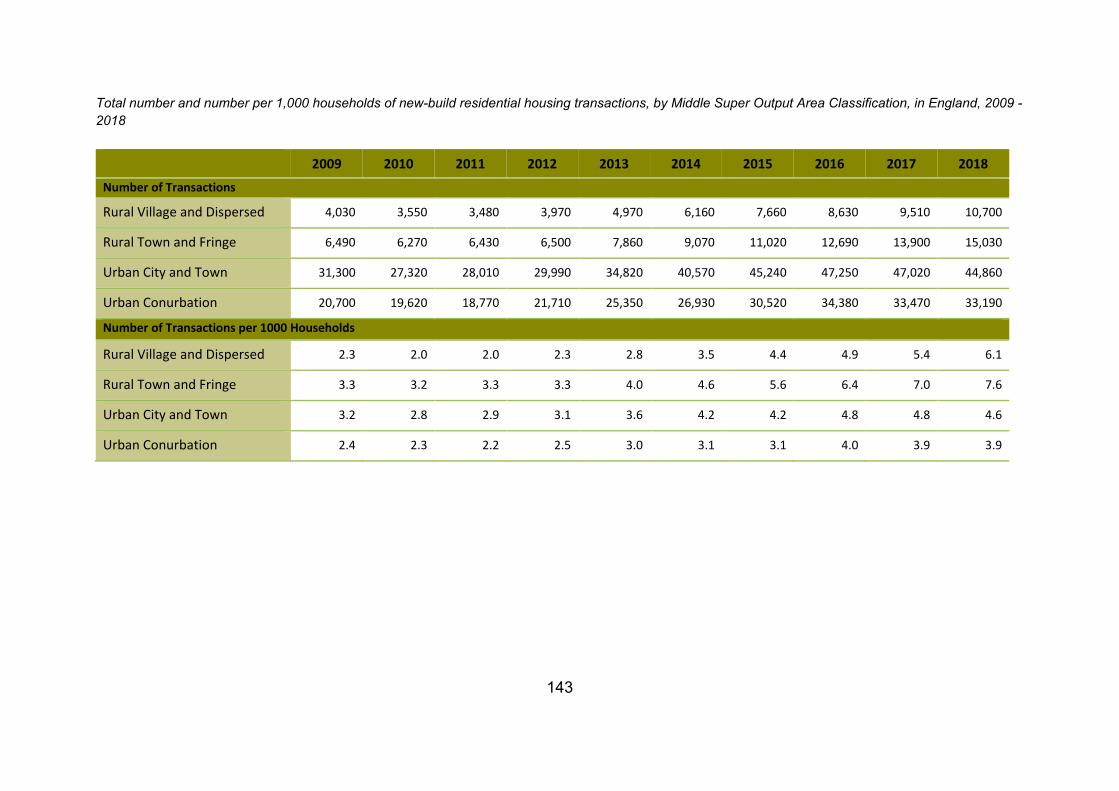
143
Total number and number per 1,000 households of new-build residential housing transactions, by Middle Super Output Area Classification, in England, 2009 - 2018
2009 2010 2011 2012 2013 2014 2015 2016 2017 2018 Number of Transactions
Rural Village and Dispersed 4,030 3,550 3,480 3,970 4,970 6,160 7,660 8,630 9,510 10,700
Rural Town and Fringe 6,490 6,270 6,430 6,500 7,860 9,070 11,020 12,690 13,900 15,030
Urban City and Town 31,300 27,320 28,010 29,990 34,820 40,570 45,240 47,250 47,020 44,860
Urban Conurbation 20,700 19,620 18,770 21,710 25,350 26,930 30,520 34,380 33,470 33,190
Number of Transactions per 1000 Households
Rural Village and Dispersed 2.3 2.0 2.0 2.3 2.8 3.5 4.4 4.9 5.4 6.1
Rural Town and Fringe 3.3 3.2 3.3 3.3 4.0 4.6 5.6 6.4 7.0 7.6
Urban City and Town 3.2 2.8 2.9 3.1 3.6 4.2 4.2 4.8 4.8 4.6
Urban Conurbation 2.4 2.3 2.2 2.5 3.0 3.1 3.1 4.0 3.9 3.9
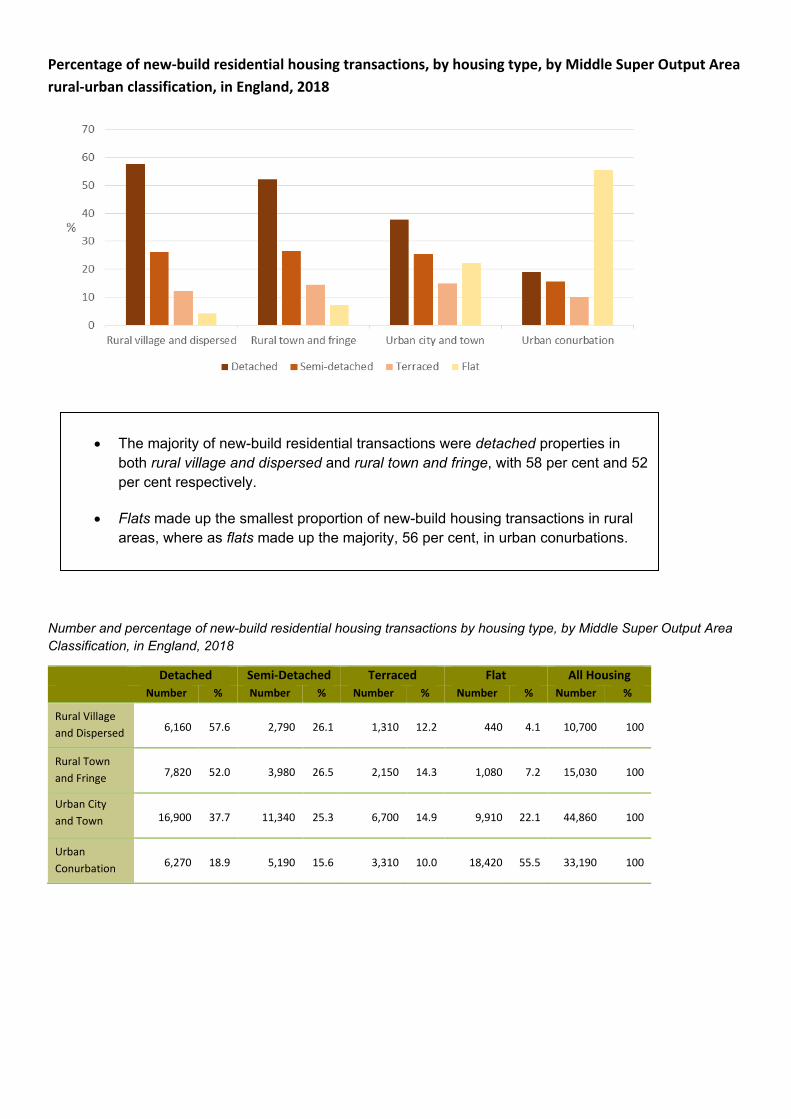
Percentage of new-build residential housing transactions, by housing type, by Middle Super Output Area rural-urban classification, in England, 2018
Number and percentage of new-build residential housing transactions by housing type, by Middle Super Output Area Classification, in England, 2018
Detached Semi-Detached Terraced Flat All Housing Number % Number % Number % Number % Number %
Rural Village and Dispersed 6,160 57.6 2,790 26.1 1,310 12.2 440 4.1 10,700 100
Rural Town and Fringe 7,820 52.0 3,980 26.5 2,150 14.3 1,080 7.2 15,030 100
Urban City and Town 16,900 37.7 11,340 25.3 6,700 14.9 9,910 22.1 44,860 100
Urban Conurbation 6,270 18.9 5,190 15.6 3,310 10.0 18,420 55.5 33,190 100
• The majority of new-build residential transactions were detached properties in both rural village and dispersed and rural town and fringe, with 58 per cent and 52 per cent respectively.
• Flats made up the smallest proportion of new-build housing transactions in rural areas, where as flats made up the majority, 56 per cent, in urban conurbations.
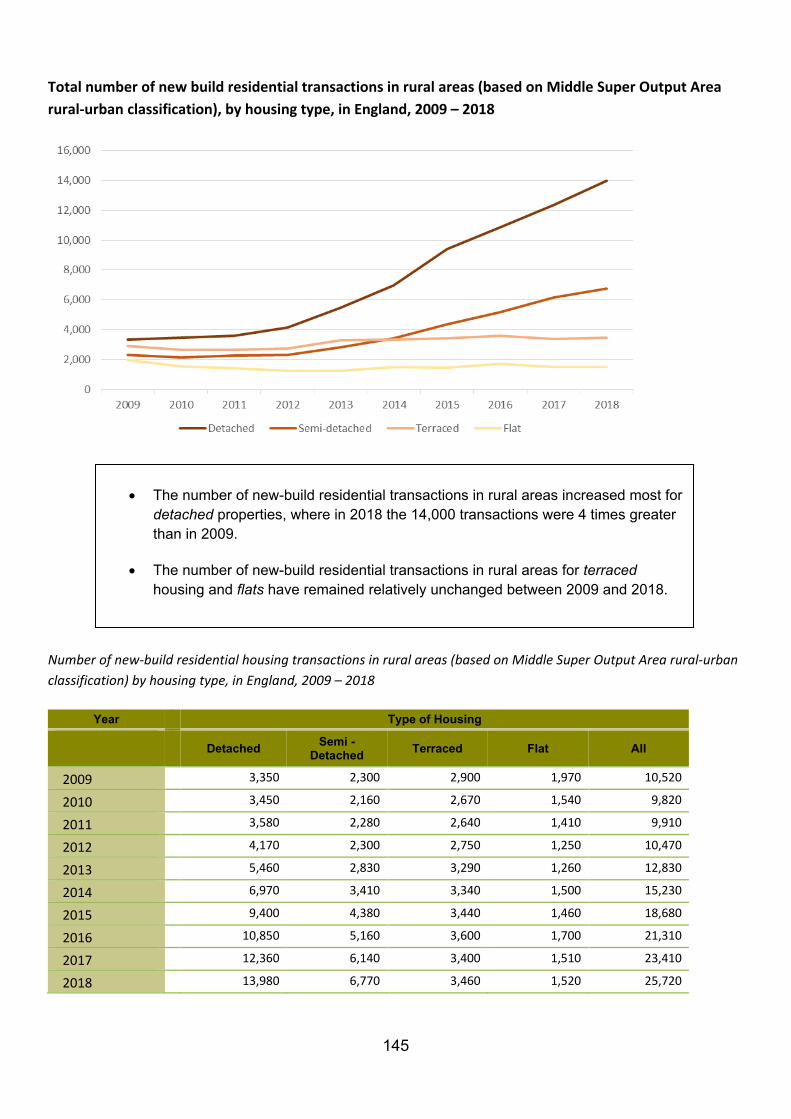
145
Total number of new build residential transactions in rural areas (based on Middle Super Output Area rural-urban classification), by housing type, in England, 2009 – 2018
Number of new-build residential housing transactions in rural areas (based on Middle Super Output Area rural-urban classification) by housing type, in England, 2009 – 2018
Year Type of Housing
Detached Semi -
Detached Terraced Flat All
2009 3,350 2,300 2,900 1,970 10,520
2010 3,450 2,160 2,670 1,540 9,820
2011 3,580 2,280 2,640 1,410 9,910
2012 4,170 2,300 2,750 1,250 10,470
2013 5,460 2,830 3,290 1,260 12,830
2014 6,970 3,410 3,340 1,500 15,230
2015 9,400 4,380 3,440 1,460 18,680
2016 10,850 5,160 3,600 1,700 21,310
2017 12,360 6,140 3,400 1,510 23,410
2018 13,980 6,770 3,460 1,520 25,720
• The number of new-build residential transactions in rural areas increased most for detached properties, where in 2018 the 14,000 transactions were 4 times greater than in 2009.
• The number of new-build residential transactions in rural areas for terraced housing and flats have remained relatively unchanged between 2009 and 2018.
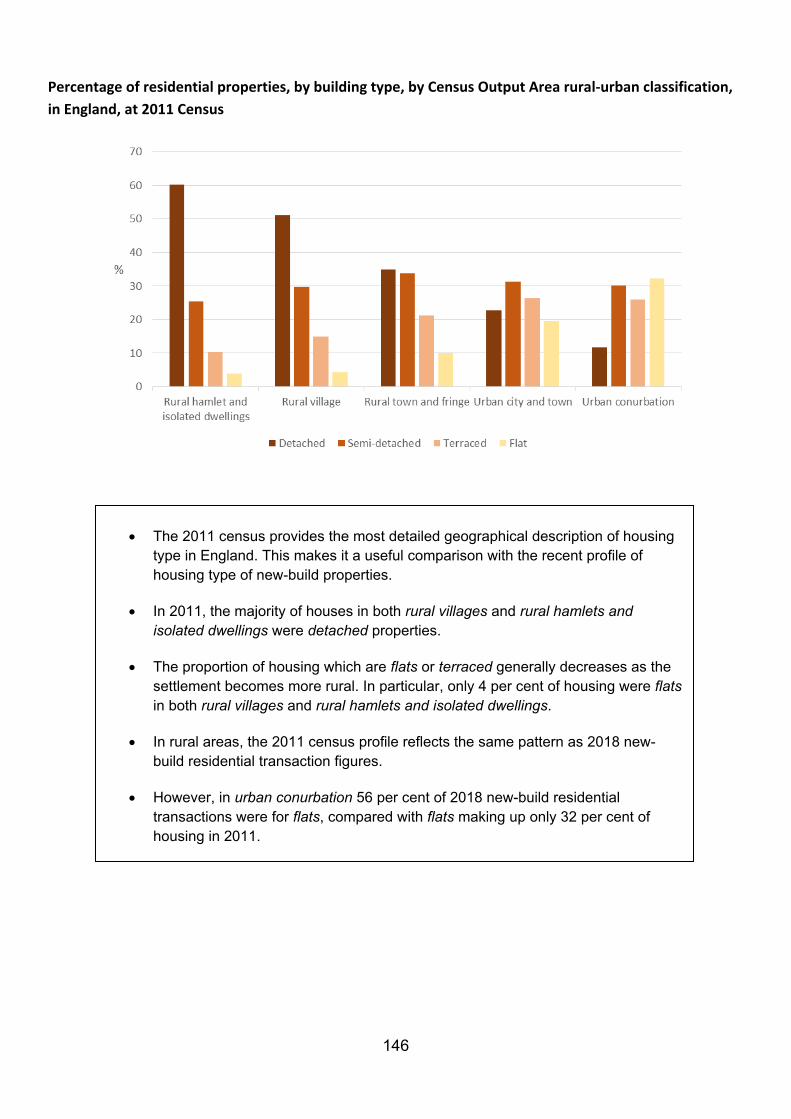
146
Percentage of residential properties, by building type, by Census Output Area rural-urban classification, in England, at 2011 Census
• The 2011 census provides the most detailed geographical description of housing type in England. This makes it a useful comparison with the recent profile of housing type of new-build properties.
• In 2011, the majority of houses in both rural villages and rural hamlets and isolated dwellings were detached properties.
• The proportion of housing which are flats or terraced generally decreases as the settlement becomes more rural. In particular, only 4 per cent of housing were flats in both rural villages and rural hamlets and isolated dwellings.
• In rural areas, the 2011 census profile reflects the same pattern as 2018 new-build residential transaction figures.
• However, in urban conurbation 56 per cent of 2018 new-build residential transactions were for flats, compared with flats making up only 32 per cent of housing in 2011.
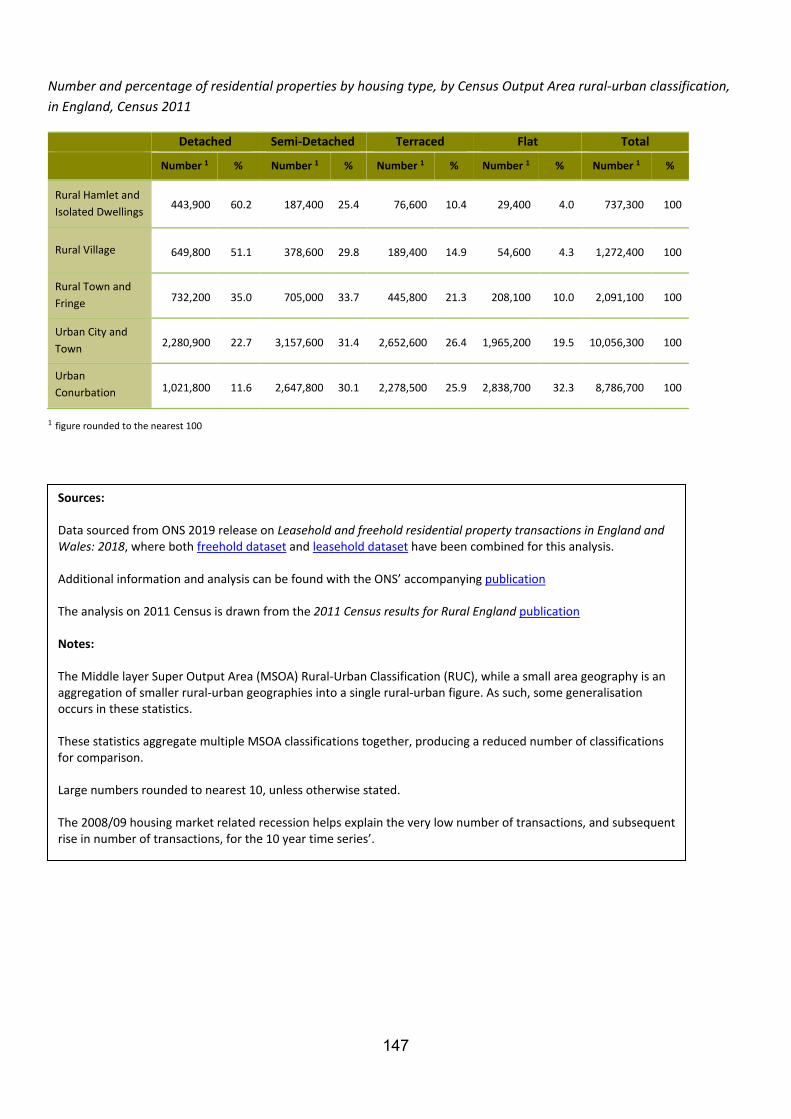
147
Number and percentage of residential properties by housing type, by Census Output Area rural-urban classification, in England, Census 2011
1 figure rounded to the nearest 100
Detached Semi-Detached Terraced Flat Total Number 1 % Number 1 % Number 1 % Number 1 % Number 1 %
Rural Hamlet and Isolated Dwellings 443,900 60.2 187,400 25.4 76,600 10.4 29,400 4.0 737,300 100
Rural Village 649,800 51.1 378,600 29.8 189,400 14.9 54,600 4.3 1,272,400 100
Rural Town and Fringe 732,200 35.0 705,000 33.7 445,800 21.3 208,100 10.0 2,091,100 100
Urban City and Town 2,280,900 22.7 3,157,600 31.4 2,652,600 26.4 1,965,200 19.5 10,056,300 100
Urban Conurbation 1,021,800 11.6 2,647,800 30.1 2,278,500 25.9 2,838,700 32.3 8,786,700 100
Sources: Data sourced from ONS 2019 release on Leasehold and freehold residential property transactions in England and Wales: 2018, where both freehold dataset and leasehold dataset have been combined for this analysis. Additional information and analysis can be found with the ONS’ accompanying publication The analysis on 2011 Census is drawn from the 2011 Census results for Rural England publication Notes: The Middle layer Super Output Area (MSOA) Rural-Urban Classification (RUC), while a small area geography is an aggregation of smaller rural-urban geographies into a single rural-urban figure. As such, some generalisation occurs in these statistics. These statistics aggregate multiple MSOA classifications together, producing a reduced number of classifications for comparison. Large numbers rounded to nearest 10, unless otherwise stated. The 2008/09 housing market related recession helps explain the very low number of transactions, and subsequent rise in number of transactions, for the 10 year time series’.
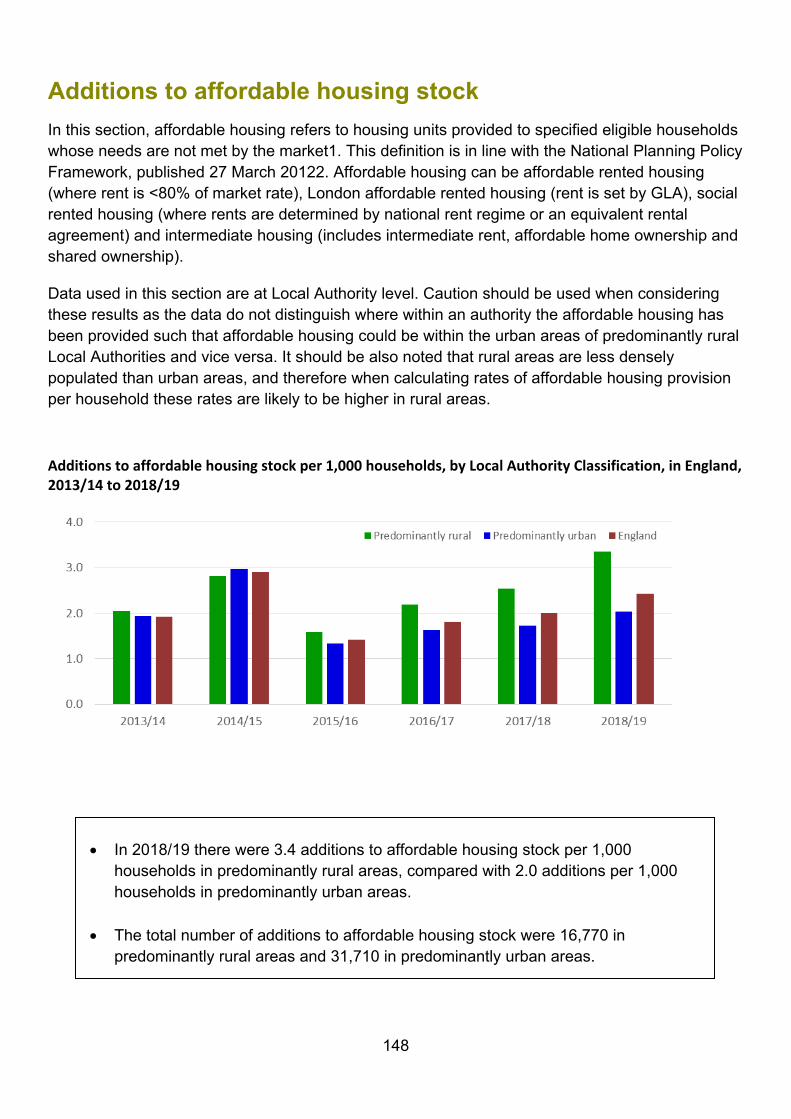
148
Additions to affordable housing stock In this section, affordable housing refers to housing units provided to specified eligible households whose needs are not met by the market1. This definition is in line with the National Planning Policy Framework, published 27 March 20122. Affordable housing can be affordable rented housing (where rent is <80% of market rate), London affordable rented housing (rent is set by GLA), social rented housing (where rents are determined by national rent regime or an equivalent rental agreement) and intermediate housing (includes intermediate rent, affordable home ownership and shared ownership).
Data used in this section are at Local Authority level. Caution should be used when considering these results as the data do not distinguish where within an authority the affordable housing has been provided such that affordable housing could be within the urban areas of predominantly rural Local Authorities and vice versa. It should be also noted that rural areas are less densely populated than urban areas, and therefore when calculating rates of affordable housing provision per household these rates are likely to be higher in rural areas.
Additions to affordable housing stock per 1,000 households, by Local Authority Classification, in England, 2013/14 to 2018/19
• In 2018/19 there were 3.4 additions to affordable housing stock per 1,000 households in predominantly rural areas, compared with 2.0 additions per 1,000 households in predominantly urban areas.
• The total number of additions to affordable housing stock were 16,770 in predominantly rural areas and 31,710 in predominantly urban areas.
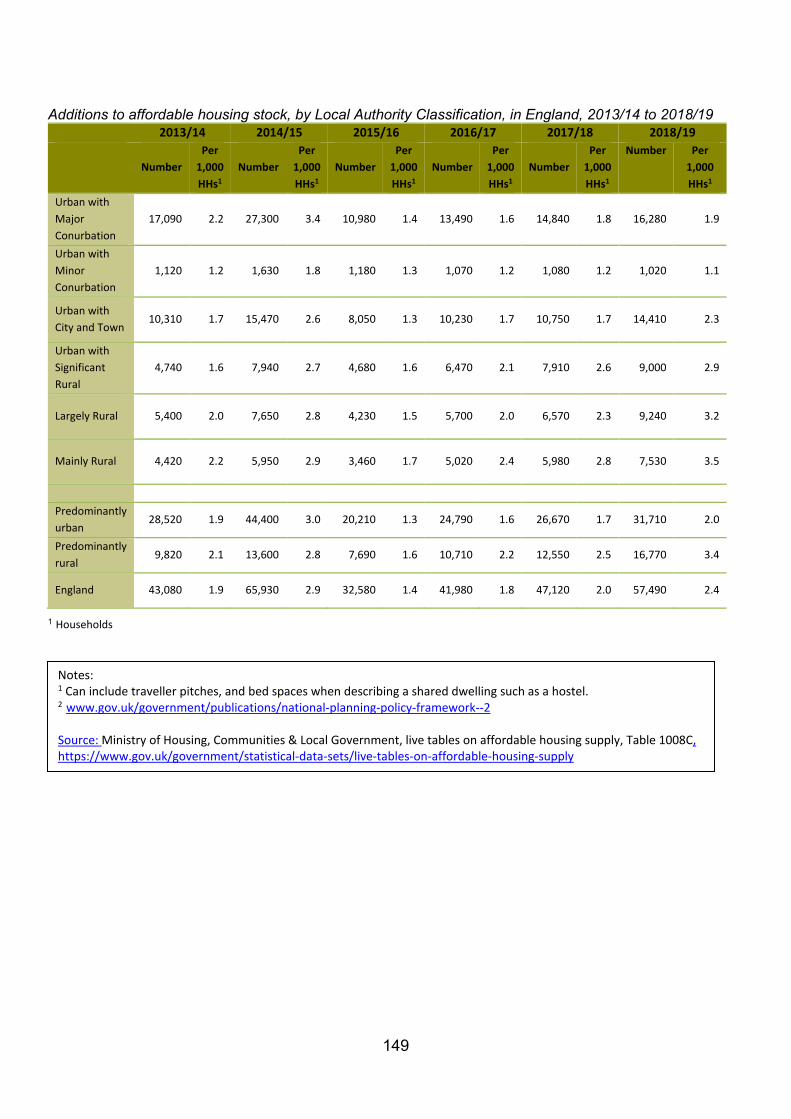
149
Additions to affordable housing stock, by Local Authority Classification, in England, 2013/14 to 2018/19 2013/14 2014/15 2015/16 2016/17 2017/18 2018/19
Number Per
1,000 HHs1
Number Per
1,000 HHs1
Number Per
1,000 HHs1
Number Per
1,000 HHs1
Number Per
1,000 HHs1
Number Per 1,000 HHs1
Urban with Major Conurbation
17,090 2.2 27,300 3.4 10,980 1.4 13,490 1.6 14,840 1.8 16,280 1.9
Urban with Minor Conurbation
1,120 1.2 1,630 1.8 1,180 1.3 1,070 1.2 1,080 1.2 1,020 1.1
Urban with City and Town
10,310 1.7 15,470 2.6 8,050 1.3 10,230 1.7 10,750 1.7 14,410 2.3
Urban with Significant Rural
4,740 1.6 7,940 2.7 4,680 1.6 6,470 2.1 7,910 2.6 9,000 2.9
Largely Rural 5,400 2.0 7,650 2.8 4,230 1.5 5,700 2.0 6,570 2.3 9,240 3.2
Mainly Rural 4,420 2.2 5,950 2.9 3,460 1.7 5,020 2.4 5,980 2.8 7,530 3.5
Predominantly urban
28,520 1.9 44,400 3.0 20,210 1.3 24,790 1.6 26,670 1.7 31,710 2.0
Predominantly rural
9,820 2.1 13,600 2.8 7,690 1.6 10,710 2.2 12,550 2.5 16,770 3.4
England 43,080 1.9 65,930 2.9 32,580 1.4 41,980 1.8 47,120 2.0 57,490 2.4
1 Households
Notes: 1 Can include traveller pitches, and bed spaces when describing a shared dwelling such as a hostel. 2 www.gov.uk/government/publications/national-planning-policy-framework--2 Source: Ministry of Housing, Communities & Local Government, live tables on affordable housing supply, Table 1008C, https://www.gov.uk/government/statistical-data-sets/live-tables-on-affordable-housing-supply
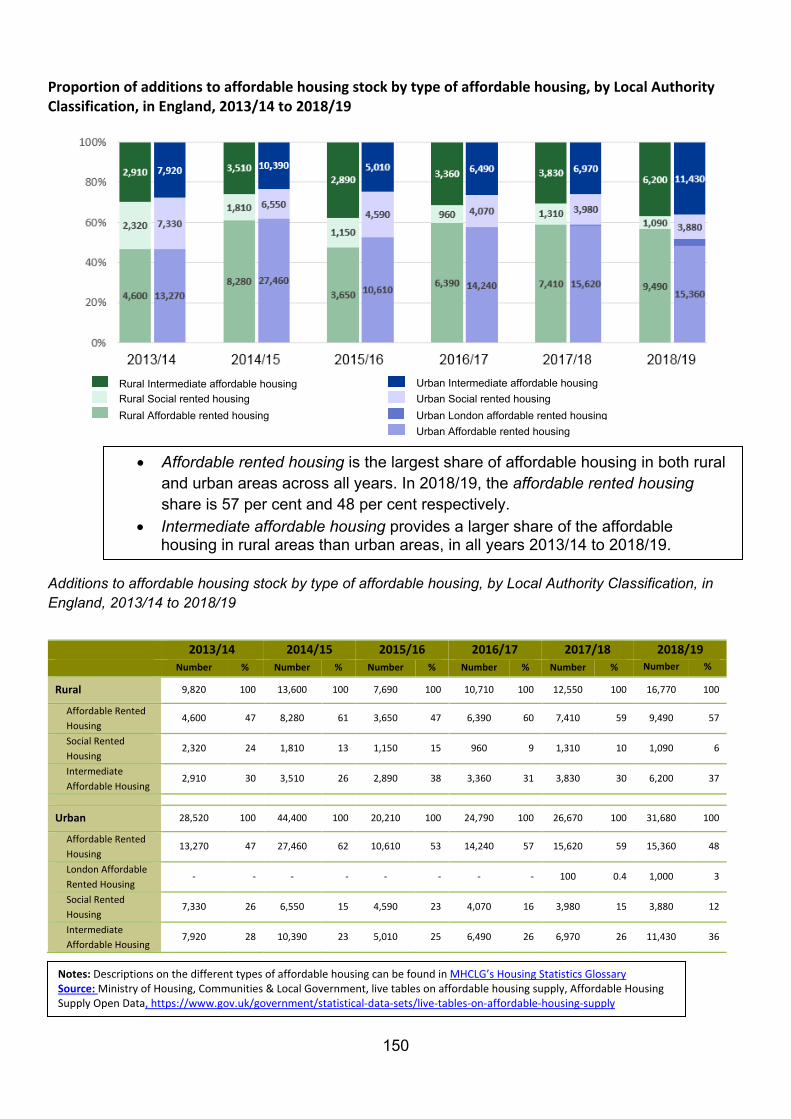
150
Proportion of additions to affordable housing stock by type of affordable housing, by Local Authority Classification, in England, 2013/14 to 2018/19
Additions to affordable housing stock by type of affordable housing, by Local Authority Classification, in England, 2013/14 to 2018/19
2013/14 2014/15 2015/16 2016/17 2017/18 2018/19 Number % Number % Number % Number % Number % Number %
Rural 9,820 100 13,600 100 7,690 100 10,710 100 12,550 100 16,770 100
Affordable Rented Housing
4,600 47 8,280 61 3,650 47 6,390 60 7,410 59 9,490 57
Social Rented Housing
2,320 24 1,810 13 1,150 15 960 9 1,310 10 1,090 6
Intermediate Affordable Housing
2,910 30 3,510 26 2,890 38 3,360 31 3,830 30 6,200 37
Urban 28,520 100 44,400 100 20,210 100 24,790 100 26,670 100 31,680 100
Affordable Rented Housing
13,270 47 27,460 62 10,610 53 14,240 57 15,620 59 15,360 48
London Affordable Rented Housing
- - - - - - - - 100 0.4 1,000 3
Social Rented Housing
7,330 26 6,550 15 4,590 23 4,070 16 3,980 15 3,880 12
Intermediate Affordable Housing
7,920 28 10,390 23 5,010 25 6,490 26 6,970 26 11,430 36
• Affordable rented housing is the largest share of affordable housing in both rural and urban areas across all years. In 2018/19, the affordable rented housing share is 57 per cent and 48 per cent respectively.
• Intermediate affordable housing provides a larger share of the affordable housing in rural areas than urban areas, in all years 2013/14 to 2018/19.
Notes: Descriptions on the different types of affordable housing can be found in MHCLG’s Housing Statistics Glossary Source: Ministry of Housing, Communities & Local Government, live tables on affordable housing supply, Affordable Housing Supply Open Data, https://www.gov.uk/government/statistical-data-sets/live-tables-on-affordable-housing-supply
Rural Intermediate affordable housing
Rural Affordable rented housing Rural Social rented housing Urban Social rented housing
Urban Affordable rented housing
Urban Intermediate affordable housing
Urban London affordable rented housing
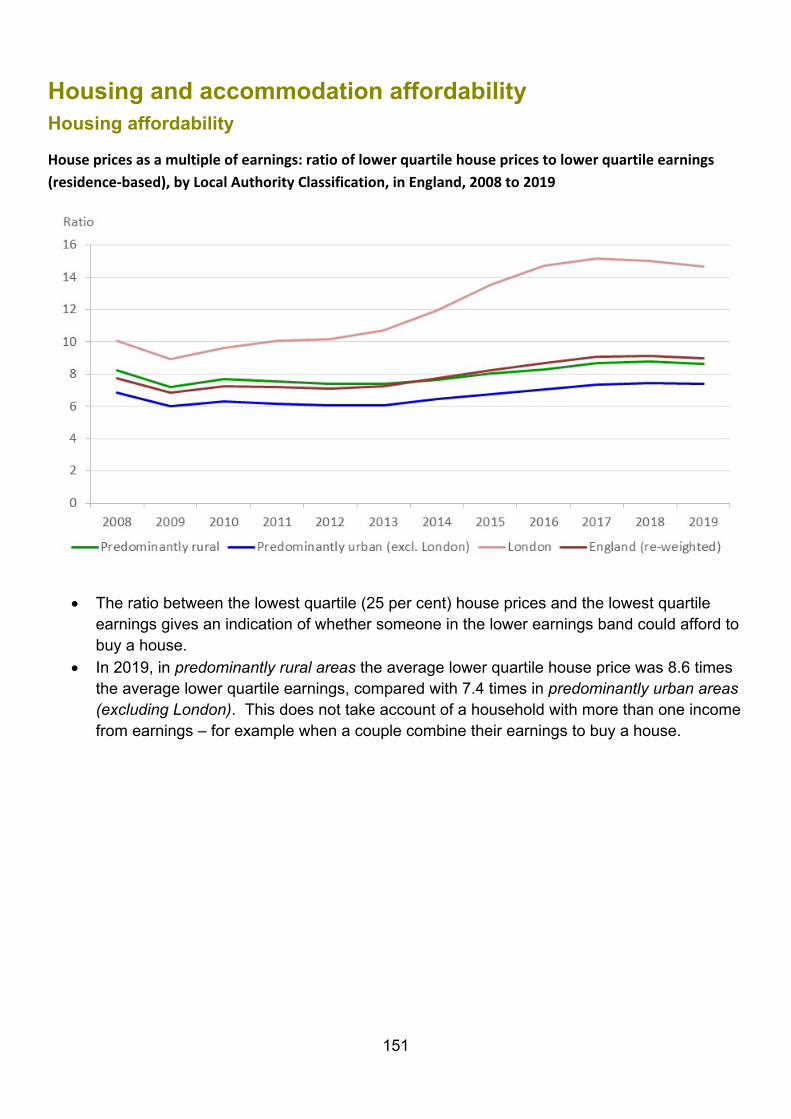
151
Housing and accommodation affordability Housing affordability
House prices as a multiple of earnings: ratio of lower quartile house prices to lower quartile earnings (residence-based), by Local Authority Classification, in England, 2008 to 2019
• The ratio between the lowest quartile (25 per cent) house prices and the lowest quartile earnings gives an indication of whether someone in the lower earnings band could afford to buy a house.
• In 2019, in predominantly rural areas the average lower quartile house price was 8.6 times the average lower quartile earnings, compared with 7.4 times in predominantly urban areas (excluding London). This does not take account of a household with more than one income from earnings – for example when a couple combine their earnings to buy a house.
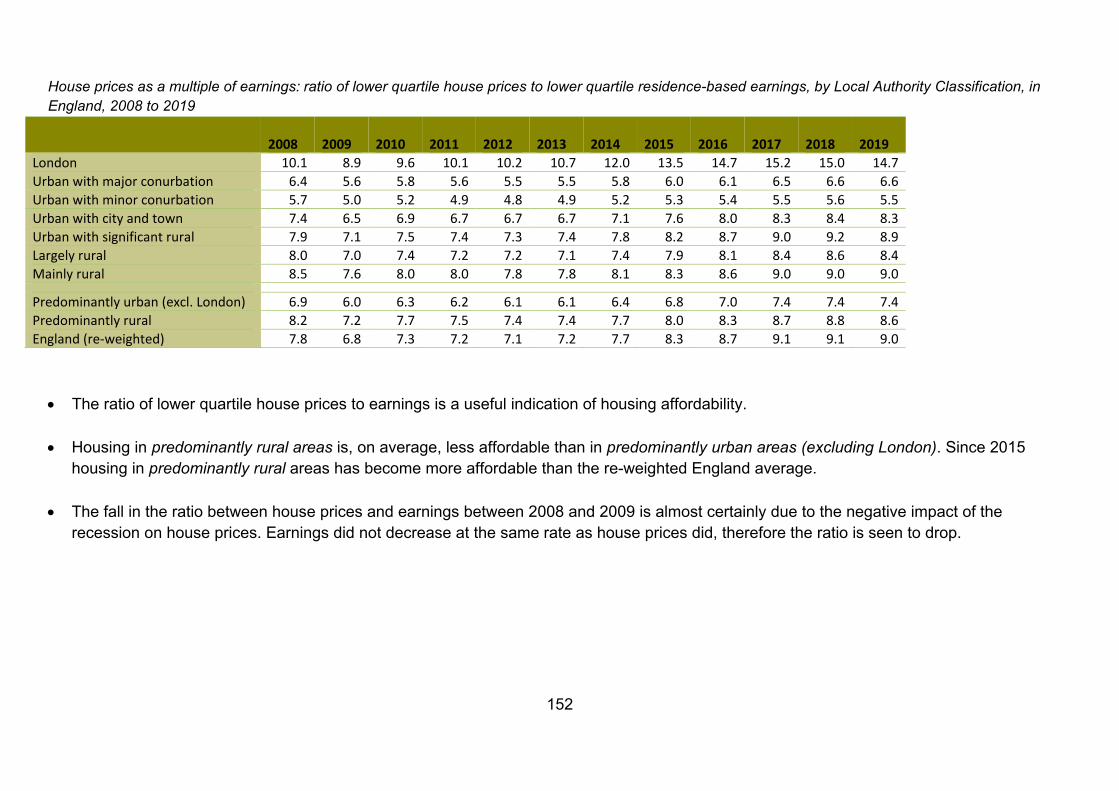
152
House prices as a multiple of earnings: ratio of lower quartile house prices to lower quartile residence-based earnings, by Local Authority Classification, in England, 2008 to 2019
2008
2009
2010
2011
2012
2013
2014
2015
2016
2017
2018
2019
London 10.1 8.9 9.6 10.1 10.2 10.7 12.0 13.5 14.7 15.2 15.0 14.7 Urban with major conurbation 6.4 5.6 5.8 5.6 5.5 5.5 5.8 6.0 6.1 6.5 6.6 6.6 Urban with minor conurbation 5.7 5.0 5.2 4.9 4.8 4.9 5.2 5.3 5.4 5.5 5.6 5.5 Urban with city and town 7.4 6.5 6.9 6.7 6.7 6.7 7.1 7.6 8.0 8.3 8.4 8.3 Urban with significant rural 7.9 7.1 7.5 7.4 7.3 7.4 7.8 8.2 8.7 9.0 9.2 8.9 Largely rural 8.0 7.0 7.4 7.2 7.2 7.1 7.4 7.9 8.1 8.4 8.6 8.4 Mainly rural 8.5 7.6 8.0 8.0 7.8 7.8 8.1 8.3 8.6 9.0 9.0 9.0 Predominantly urban (excl. London) 6.9 6.0 6.3 6.2 6.1 6.1 6.4 6.8 7.0 7.4 7.4 7.4 Predominantly rural 8.2 7.2 7.7 7.5 7.4 7.4 7.7 8.0 8.3 8.7 8.8 8.6 England (re-weighted) 7.8 6.8 7.3 7.2 7.1 7.2 7.7 8.3 8.7 9.1 9.1 9.0
• The ratio of lower quartile house prices to earnings is a useful indication of housing affordability.
• Housing in predominantly rural areas is, on average, less affordable than in predominantly urban areas (excluding London). Since 2015 housing in predominantly rural areas has become more affordable than the re-weighted England average.
• The fall in the ratio between house prices and earnings between 2008 and 2009 is almost certainly due to the negative impact of the recession on house prices. Earnings did not decrease at the same rate as house prices did, therefore the ratio is seen to drop.
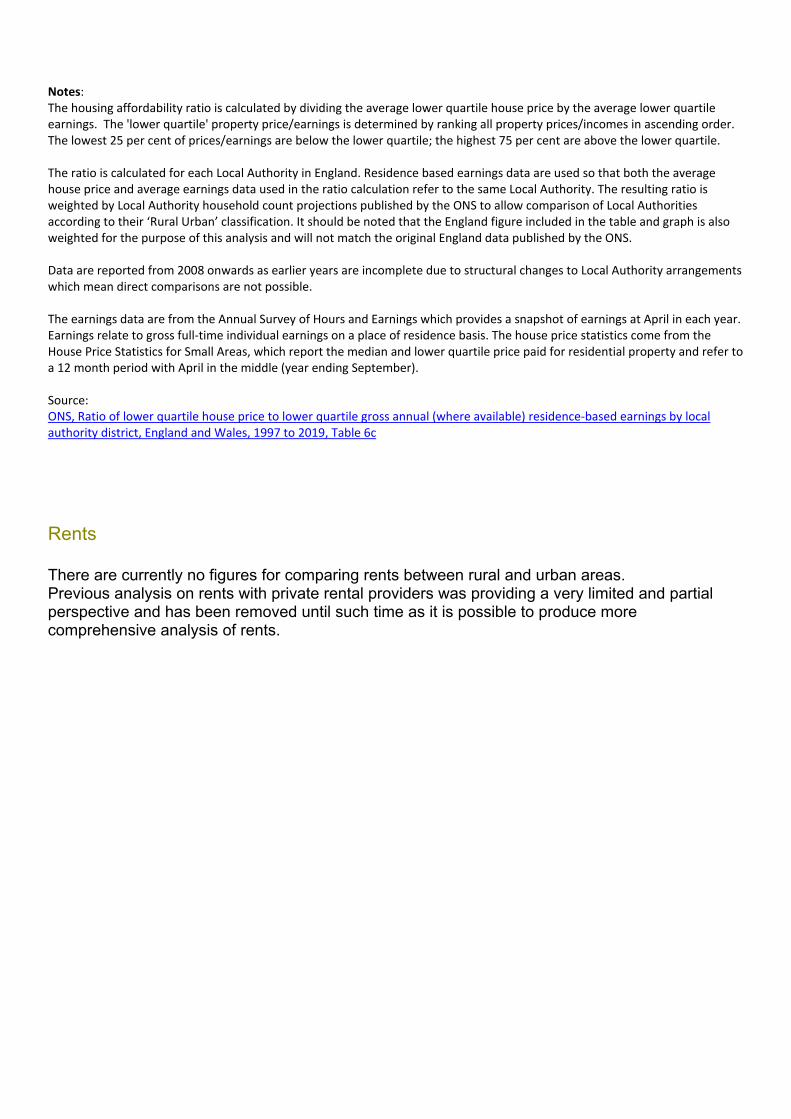
Notes: The housing affordability ratio is calculated by dividing the average lower quartile house price by the average lower quartile earnings. The 'lower quartile' property price/earnings is determined by ranking all property prices/incomes in ascending order. The lowest 25 per cent of prices/earnings are below the lower quartile; the highest 75 per cent are above the lower quartile. The ratio is calculated for each Local Authority in England. Residence based earnings data are used so that both the average house price and average earnings data used in the ratio calculation refer to the same Local Authority. The resulting ratio is weighted by Local Authority household count projections published by the ONS to allow comparison of Local Authorities according to their ‘Rural Urban’ classification. It should be noted that the England figure included in the table and graph is also weighted for the purpose of this analysis and will not match the original England data published by the ONS. Data are reported from 2008 onwards as earlier years are incomplete due to structural changes to Local Authority arrangements which mean direct comparisons are not possible. The earnings data are from the Annual Survey of Hours and Earnings which provides a snapshot of earnings at April in each year. Earnings relate to gross full-time individual earnings on a place of residence basis. The house price statistics come from the House Price Statistics for Small Areas, which report the median and lower quartile price paid for residential property and refer to a 12 month period with April in the middle (year ending September). Source: ONS, Ratio of lower quartile house price to lower quartile gross annual (where available) residence-based earnings by local authority district, England and Wales, 1997 to 2019, Table 6c
Rents There are currently no figures for comparing rents between rural and urban areas. Previous analysis on rents with private rental providers was providing a very limited and partial perspective and has been removed until such time as it is possible to produce more comprehensive analysis of rents.
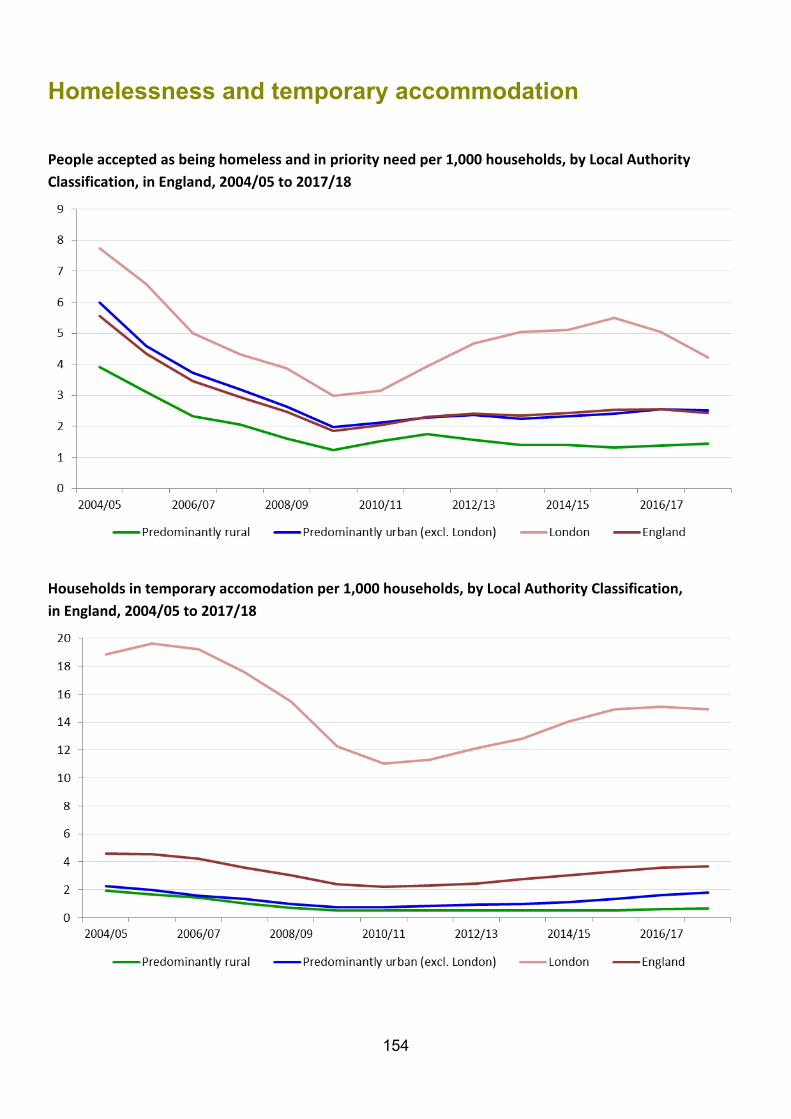
154
Homelessness and temporary accommodation
People accepted as being homeless and in priority need per 1,000 households, by Local Authority Classification, in England, 2004/05 to 2017/18
Households in temporary accomodation per 1,000 households, by Local Authority Classification, in England, 2004/05 to 2017/18

155
People accepted as being homeless and in priority need per 1,000 households, by Local Authority Classification, in England, 2010/11 to 2017/18
2010/11 2011/12 2012/13 2013/14 2014/15 2015/16 2016/17 2017/18 London 3.1 3.9 4.7 5.0 5.1 5.5 5.0 4.2 Urban with major conurbation 2.5 2.6 2.7 2.4 2.4 2.6 2.7 2.7 Urban with minor conurbation 2.3 2.7 2.3 1.8 1.5 1.6 1.7 1.9 Urban with city and town 1.8 2.0 2.1 2.2 2.4 2.4 2.6 2.5 Urban with significant rural 1.2 1.5 1.3 1.2 1.3 1.5 1.5 1.5 Largely Rural 1.5 1.8 1.6 1.5 1.5 1.3 1.4 1.4 Mainly Rural 1.5 1.7 1.5 1.3 1.3 1.3 1.3 1.5
Predominantly urban (excl London) 2.1 2.3 2.4 2.2 2.3 2.4 2.5 2.5 Predominantly rural 1.5 1.7 1.6 1.4 1.4 1.3 1.4 1.4 England 2.0 2.3 2.4 2.3 2.4 2.5 2.6 2.4
Households in temporary accommodation per 1,000 Households, by Local Authority Classification, in England, 2010/11 to 2017/18
2010/11 2011/12 2012/13 2013/14 2014/15 2015/16 2016/17 2017/18 London 11.1 11.3 12.2 12.8 14.0 14.9 15.1 14.9 Urban with major conurbation 0.5 0.6 0.7 0.7 0.8 1.0 1.3 1.5 Urban with minor conurbation 0.4 0.4 0.4 0.3 0.4 0.3 0.5 0.6 Urban with city and town 1.0 1.1 1.2 1.3 1.5 1.8 2.0 2.2 Urban with significant rural 0.6 0.6 0.7 0.7 0.8 0.9 1.0 1.0 Largely Rural 0.4 0.4 0.4 0.4 0.4 0.5 0.6 0.6 Mainly Rural 0.7 0.7 0.6 0.6 0.6 0.6 0.6 0.7 Predominantly urban (excl London) 0.7 0.9 0.9 1.0 1.1 1.3 1.6 1.8 Predominantly rural 0.5 0.5 0.5 0.5 0.5 0.5 0.6 0.7 England 2.2 2.3 2.4 2.8 3.1 3.3 3.6 3.7
The full time series from 2004/05 are available as an Open Document format workbook on the Rural housing statistics web page
• In 2017/18 the proportion of people who were homeless and in priority need of assistance in securing permanent settled accommodation was 2.5 per 1,000 households in predominantly urban areas (excluding London) and 1.4 in predominantly rural areas.
• The number of households in temporary accommodation, per 1,000 households, was 1.8 in predominantly urban areas (excluding London) and 0.7 in predominantly rural areas.
• The number of homeless and in priority need of assistance has remained broadly the same in predominantly rural areas since 2013-14, whilst there has been a small increase in predominantly urban areas (excluding London) over the same time period.
Further information: www.gov.uk/homelessness-data-notes-and-definitions The figures exclude a significant number of Local Authorities who did not supply the data. The number of missing Local Authorities varies from 0 in 2009/10, 2010/11 and 2011/12 to 35 in 2014/15. The England totals do not include estimates for missing data. Source: Department for Communities and Local Government, Live tables on homelessness: table 784 Local authorities' action under the homelessness provisions of the Housing Acts: www.gov.uk/government/statistical-data-sets/live-tables-on-homelessness
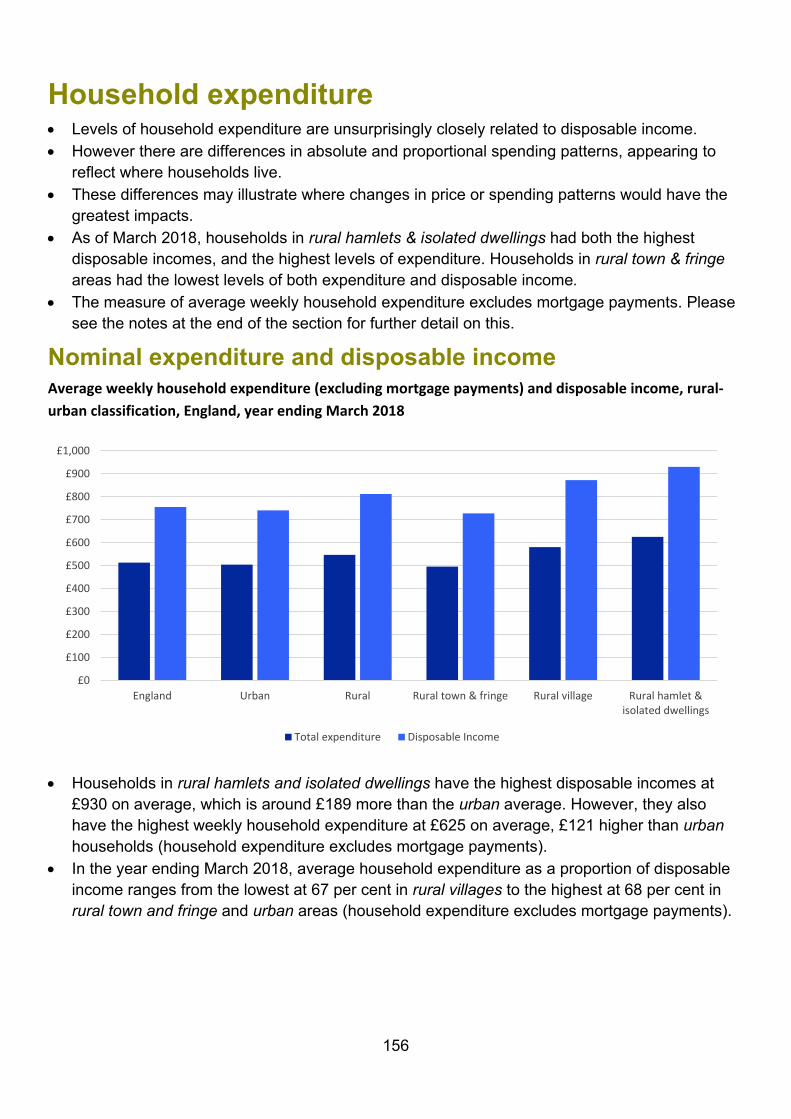
156
Household expenditure • Levels of household expenditure are unsurprisingly closely related to disposable income. • However there are differences in absolute and proportional spending patterns, appearing to
reflect where households live. • These differences may illustrate where changes in price or spending patterns would have the
greatest impacts. • As of March 2018, households in rural hamlets & isolated dwellings had both the highest
disposable incomes, and the highest levels of expenditure. Households in rural town & fringe areas had the lowest levels of both expenditure and disposable income.
• The measure of average weekly household expenditure excludes mortgage payments. Please see the notes at the end of the section for further detail on this.
Nominal expenditure and disposable income Average weekly household expenditure (excluding mortgage payments) and disposable income, rural-urban classification, England, year ending March 2018
• Households in rural hamlets and isolated dwellings have the highest disposable incomes at £930 on average, which is around £189 more than the urban average. However, they also have the highest weekly household expenditure at £625 on average, £121 higher than urban households (household expenditure excludes mortgage payments).
• In the year ending March 2018, average household expenditure as a proportion of disposable income ranges from the lowest at 67 per cent in rural villages to the highest at 68 per cent in rural town and fringe and urban areas (household expenditure excludes mortgage payments).
£0
£100
£200
£300
£400
£500
£600
£700
£800
£900
£1,000
England Urban Rural Rural town & fringe Rural village Rural hamlet &isolated dwellings
Total expenditure Disposable Income
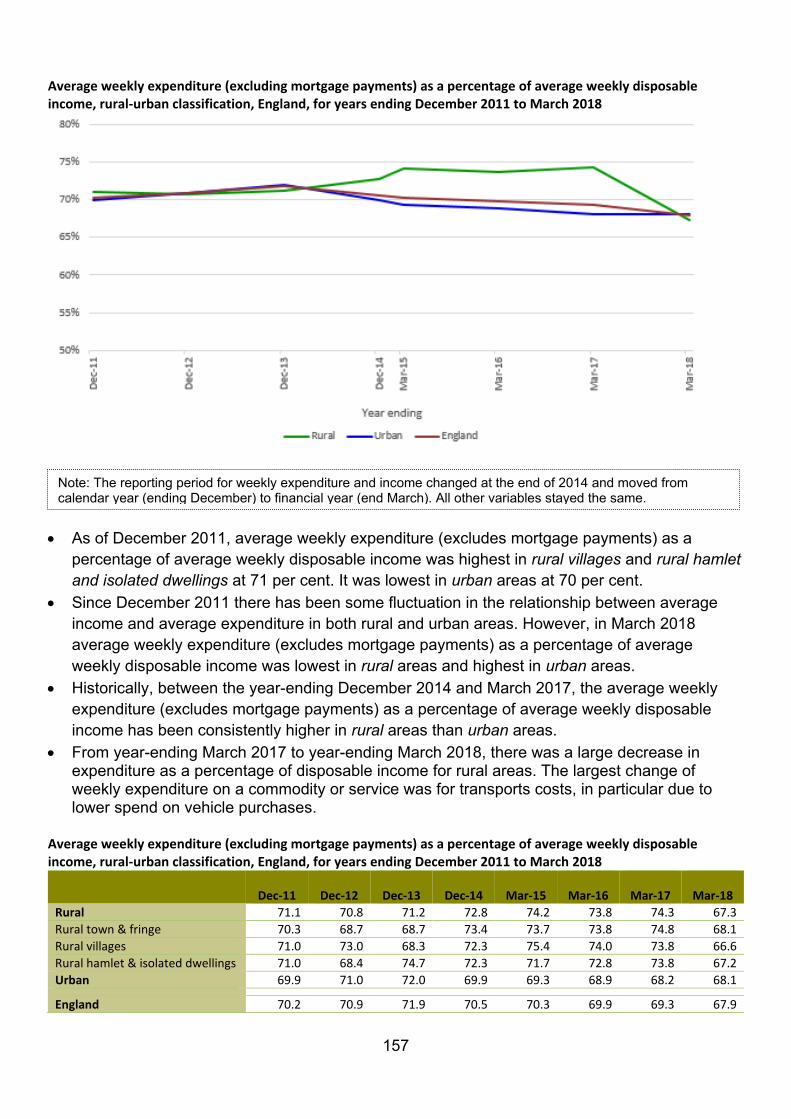
157
Average weekly expenditure (excluding mortgage payments) as a percentage of average weekly disposable income, rural-urban classification, England, for years ending December 2011 to March 2018
• As of December 2011, average weekly expenditure (excludes mortgage payments) as a percentage of average weekly disposable income was highest in rural villages and rural hamlet and isolated dwellings at 71 per cent. It was lowest in urban areas at 70 per cent.
• Since December 2011 there has been some fluctuation in the relationship between average income and average expenditure in both rural and urban areas. However, in March 2018 average weekly expenditure (excludes mortgage payments) as a percentage of average weekly disposable income was lowest in rural areas and highest in urban areas.
• Historically, between the year-ending December 2014 and March 2017, the average weekly expenditure (excludes mortgage payments) as a percentage of average weekly disposable income has been consistently higher in rural areas than urban areas.
• From year-ending March 2017 to year-ending March 2018, there was a large decrease in expenditure as a percentage of disposable income for rural areas. The largest change of weekly expenditure on a commodity or service was for transports costs, in particular due to lower spend on vehicle purchases.
Average weekly expenditure (excluding mortgage payments) as a percentage of average weekly disposable income, rural-urban classification, England, for years ending December 2011 to March 2018
Dec-11
Dec-12
Dec-13
Dec-14
Mar-15
Mar-16
Mar-17
Mar-18
Rural 71.1 70.8 71.2 72.8 74.2 73.8 74.3 67.3 Rural town & fringe 70.3 68.7 68.7 73.4 73.7 73.8 74.8 68.1 Rural villages 71.0 73.0 68.3 72.3 75.4 74.0 73.8 66.6 Rural hamlet & isolated dwellings 71.0 68.4 74.7 72.3 71.7 72.8 73.8 67.2 Urban 69.9 71.0 72.0 69.9 69.3 68.9 68.2 68.1 England 70.2 70.9 71.9 70.5 70.3 69.9 69.3 67.9
Note: The reporting period for weekly expenditure and income changed at the end of 2014 and moved from calendar year (ending December) to financial year (end March). All other variables stayed the same.
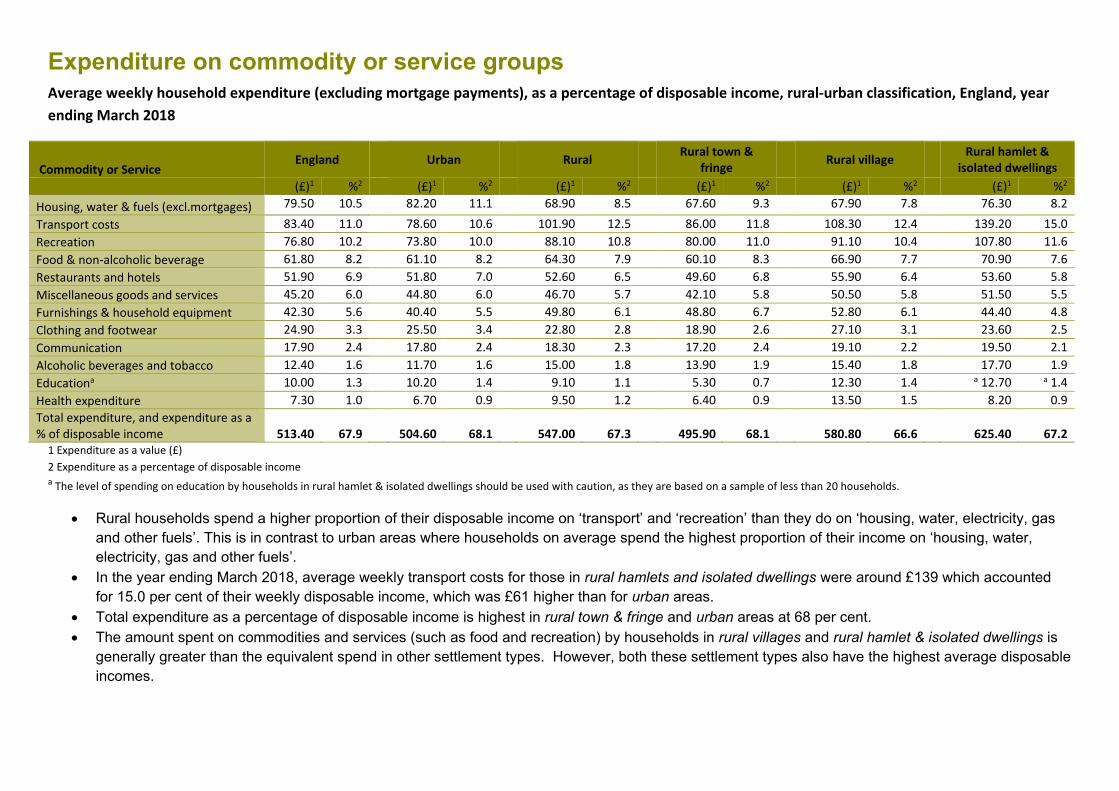
Expenditure on commodity or service groups Average weekly household expenditure (excluding mortgage payments), as a percentage of disposable income, rural-urban classification, England, year ending March 2018
Commodity or Service England
Urban Rural Rural town &
fringe Rural village Rural hamlet & isolated dwellings
(£)1 %2 (£)1 %2 (£)1 %2 (£)1 %2 (£)1 %2 (£)1 %2 Housing, water & fuels (excl.mortgages) 79.50 10.5 82.20 11.1 68.90 8.5 67.60 9.3 67.90 7.8 76.30 8.2
Transport costs 83.40 11.0 78.60 10.6 101.90 12.5 86.00 11.8 108.30 12.4 139.20 15.0 Recreation 76.80 10.2 73.80 10.0 88.10 10.8 80.00 11.0 91.10 10.4 107.80 11.6 Food & non-alcoholic beverage 61.80 8.2 61.10 8.2 64.30 7.9 60.10 8.3 66.90 7.7 70.90 7.6 Restaurants and hotels 51.90 6.9 51.80 7.0 52.60 6.5 49.60 6.8 55.90 6.4 53.60 5.8 Miscellaneous goods and services 45.20 6.0 44.80 6.0 46.70 5.7 42.10 5.8 50.50 5.8 51.50 5.5 Furnishings & household equipment 42.30 5.6 40.40 5.5 49.80 6.1 48.80 6.7 52.80 6.1 44.40 4.8 Clothing and footwear 24.90 3.3 25.50 3.4 22.80 2.8 18.90 2.6 27.10 3.1 23.60 2.5 Communication 17.90 2.4 17.80 2.4 18.30 2.3 17.20 2.4 19.10 2.2 19.50 2.1 Alcoholic beverages and tobacco 12.40 1.6 11.70 1.6 15.00 1.8 13.90 1.9 15.40 1.8 17.70 1.9 Educationa 10.00 1.3 10.20 1.4 9.10 1.1 5.30 0.7 12.30 1.4 a 12.70 a 1.4 Health expenditure 7.30 1.0 6.70 0.9 9.50 1.2 6.40 0.9 13.50 1.5 8.20 0.9 Total expenditure, and expenditure as a % of disposable income
513.40
67.9
504.60
68.1
547.00
67.3
495.90
68.1
580.80
66.6
625.40
67.2
1 Expenditure as a value (£) 2 Expenditure as a percentage of disposable income a The level of spending on education by households in rural hamlet & isolated dwellings should be used with caution, as they are based on a sample of less than 20 households.
• Rural households spend a higher proportion of their disposable income on ‘transport’ and ‘recreation’ than they do on ‘housing, water, electricity, gas and other fuels’. This is in contrast to urban areas where households on average spend the highest proportion of their income on ‘housing, water, electricity, gas and other fuels’.
• In the year ending March 2018, average weekly transport costs for those in rural hamlets and isolated dwellings were around £139 which accounted for 15.0 per cent of their weekly disposable income, which was £61 higher than for urban areas.
• Total expenditure as a percentage of disposable income is highest in rural town & fringe and urban areas at 68 per cent. • The amount spent on commodities and services (such as food and recreation) by households in rural villages and rural hamlet & isolated dwellings is
generally greater than the equivalent spend in other settlement types. However, both these settlement types also have the highest average disposable incomes.
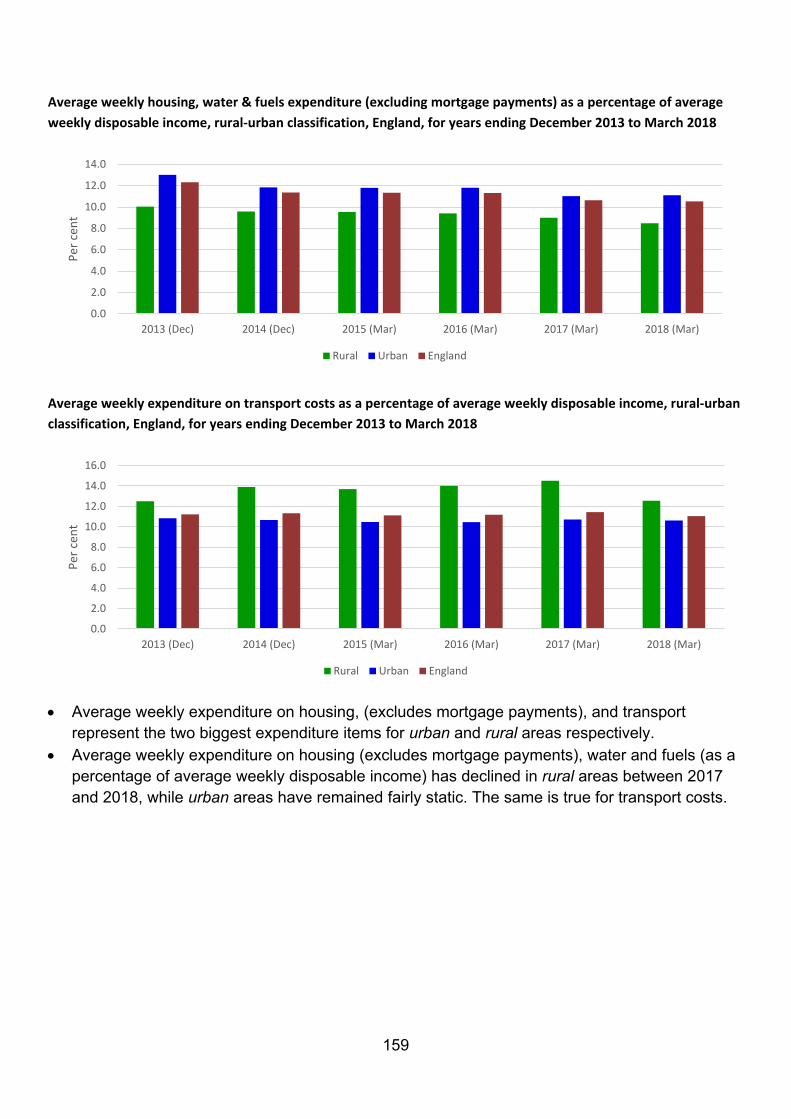
159
Average weekly housing, water & fuels expenditure (excluding mortgage payments) as a percentage of average weekly disposable income, rural-urban classification, England, for years ending December 2013 to March 2018
Average weekly expenditure on transport costs as a percentage of average weekly disposable income, rural-urban classification, England, for years ending December 2013 to March 2018
• Average weekly expenditure on housing, (excludes mortgage payments), and transport
represent the two biggest expenditure items for urban and rural areas respectively. • Average weekly expenditure on housing (excludes mortgage payments), water and fuels (as a
percentage of average weekly disposable income) has declined in rural areas between 2017 and 2018, while urban areas have remained fairly static. The same is true for transport costs.
0.0
2.0
4.0
6.0
8.0
10.0
12.0
14.0
2013 (Dec) 2014 (Dec) 2015 (Mar) 2016 (Mar) 2017 (Mar) 2018 (Mar)
Per c
ent
Rural Urban England
0.0
2.0
4.0
6.0
8.0
10.0
12.0
14.0
16.0
2013 (Dec) 2014 (Dec) 2015 (Mar) 2016 (Mar) 2017 (Mar) 2018 (Mar)
Per c
ent
Rural Urban England
160
Notes: 1. Average weekly expenditure does not include mortgage payments. Data come from the ONS Living Costs and Food Survey which uses the Classification Of Individual COnsumption by Purpose (COICOP) system to classify expenditure items. COICOP is an internationally agreed system of classification for reporting consumption expenditure within National Accounts and is used by other household budget surveys across the European Union. COICOP classified housing costs do not include what is considered to be non-consumption expenditure, for example: mortgage interest payments, mortgage capital repayments, mortgage protection premiums, council tax and domestic rates. 2. The measure of income used here does not include withdrawal of savings, loans and money received in payment of loans, receipts from maturing insurance policies and proceeds from the sale of assets. 3. Transport costs include the purchase and operation of personal vehicles and fares paid on public vehicles. All journeys are recorded within the transport section. Recreation costs include for example sports equipment, admission charges, audio-visual equipment, the purchase of CDs, computer equipment and games, pets and horticultural equipment. Source: Office for National Statistics, Living Costs and Food Survey: www.ons.gov.uk/peoplepopulationandcommunity/personalandhouseholdfinances/incomeandwealth/methodologies/livingcostsandfoodsurvey)
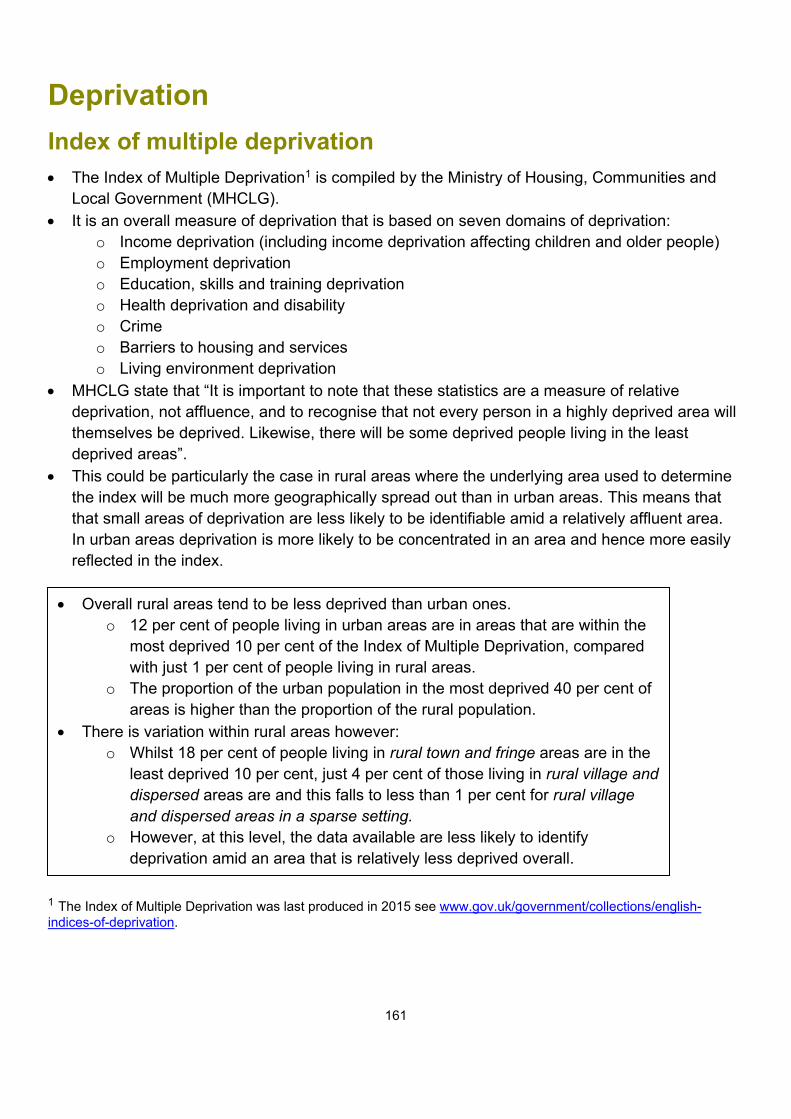
161
Deprivation Index of multiple deprivation
• The Index of Multiple Deprivation1 is compiled by the Ministry of Housing, Communities and Local Government (MHCLG).
• It is an overall measure of deprivation that is based on seven domains of deprivation: o Income deprivation (including income deprivation affecting children and older people) o Employment deprivation o Education, skills and training deprivation o Health deprivation and disability o Crime o Barriers to housing and services o Living environment deprivation
• MHCLG state that “It is important to note that these statistics are a measure of relative deprivation, not affluence, and to recognise that not every person in a highly deprived area will themselves be deprived. Likewise, there will be some deprived people living in the least deprived areas”.
• This could be particularly the case in rural areas where the underlying area used to determine the index will be much more geographically spread out than in urban areas. This means that that small areas of deprivation are less likely to be identifiable amid a relatively affluent area. In urban areas deprivation is more likely to be concentrated in an area and hence more easily reflected in the index.
1 The Index of Multiple Deprivation was last produced in 2015 see www.gov.uk/government/collections/english-indices-of-deprivation.
• Overall rural areas tend to be less deprived than urban ones. o 12 per cent of people living in urban areas are in areas that are within the
most deprived 10 per cent of the Index of Multiple Deprivation, compared with just 1 per cent of people living in rural areas.
o The proportion of the urban population in the most deprived 40 per cent of areas is higher than the proportion of the rural population.
• There is variation within rural areas however: o Whilst 18 per cent of people living in rural town and fringe areas are in the
least deprived 10 per cent, just 4 per cent of those living in rural village and dispersed areas are and this falls to less than 1 per cent for rural village and dispersed areas in a sparse setting.
o However, at this level, the data available are less likely to identify deprivation amid an area that is relatively less deprived overall.
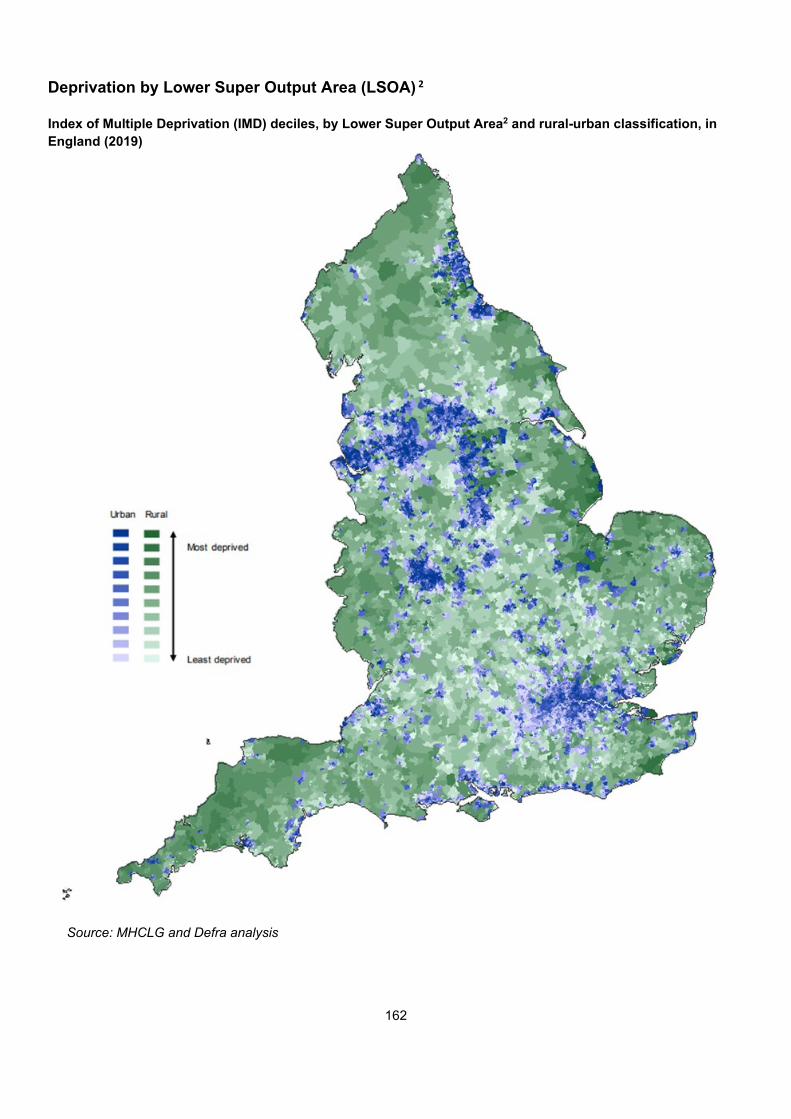
162
Deprivation by Lower Super Output Area (LSOA) 2
Index of Multiple Deprivation (IMD) deciles, by Lower Super Output Area2 and rural-urban classification, in England (2019)
Source: MHCLG and Defra analysis
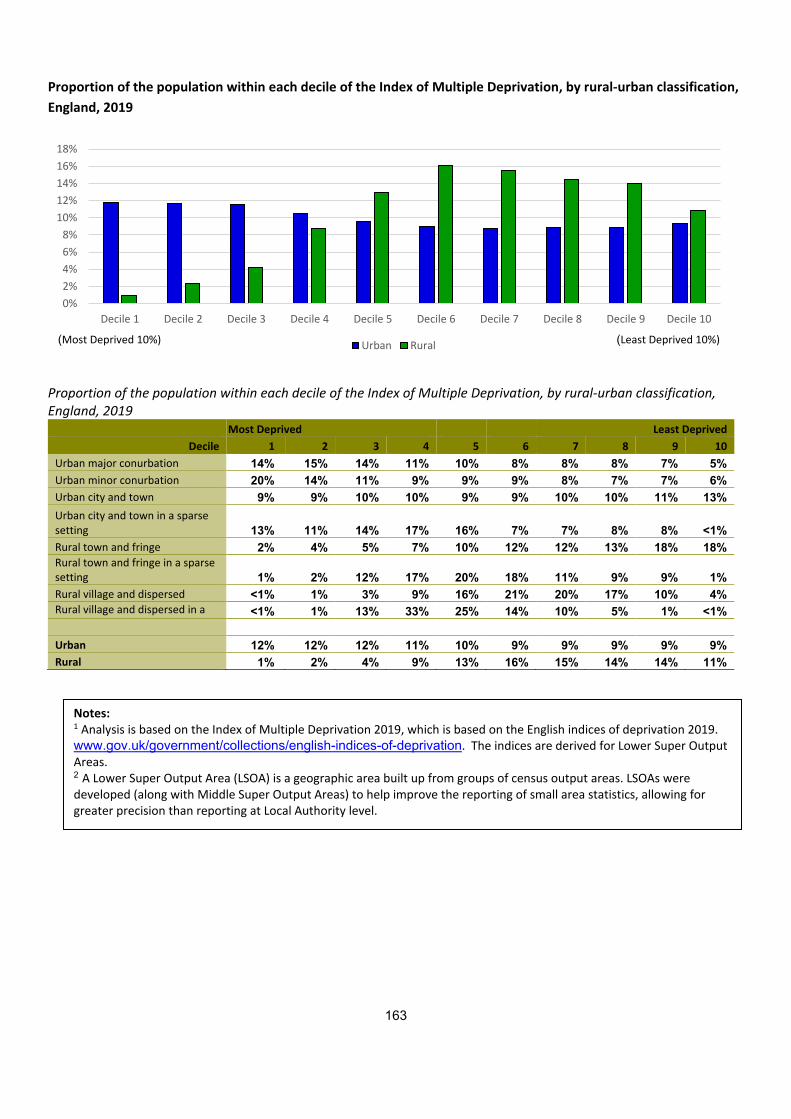
163
Proportion of the population within each decile of the Index of Multiple Deprivation, by rural-urban classification, England, 2019
Proportion of the population within each decile of the Index of Multiple Deprivation, by rural-urban classification, England, 2019
Most Deprived Least Deprived Decile 1 2 3 4 5 6 7 8 9 10
Urban major conurbation 14% 15% 14% 11% 10% 8% 8% 8% 7% 5% Urban minor conurbation 20% 14% 11% 9% 9% 9% 8% 7% 7% 6% Urban city and town 9% 9% 10% 10% 9% 9% 10% 10% 11% 13% Urban city and town in a sparse setting 13% 11% 14% 17% 16% 7% 7% 8% 8% <1% Rural town and fringe 2% 4% 5% 7% 10% 12% 12% 13% 18% 18% Rural town and fringe in a sparse setting 1% 2% 12% 17% 20% 18% 11% 9% 9% 1% Rural village and dispersed <1% 1% 3% 9% 16% 21% 20% 17% 10% 4% Rural village and dispersed in a
<1% 1% 13% 33% 25% 14% 10% 5% 1% <1%
Urban 12% 12% 12% 11% 10% 9% 9% 9% 9% 9% Rural 1% 2% 4% 9% 13% 16% 15% 14% 14% 11%
0%2%4%6%8%
10%12%14%16%18%
Decile 1 Decile 2 Decile 3 Decile 4 Decile 5 Decile 6 Decile 7 Decile 8 Decile 9 Decile 10
Urban Rural
Notes: 1 Analysis is based on the Index of Multiple Deprivation 2019, which is based on the English indices of deprivation 2019. www.gov.uk/government/collections/english-indices-of-deprivation. The indices are derived for Lower Super Output Areas. 2 A Lower Super Output Area (LSOA) is a geographic area built up from groups of census output areas. LSOAs were developed (along with Middle Super Output Areas) to help improve the reporting of small area statistics, allowing for greater precision than reporting at Local Authority level.
(Least Deprived 10%) (Most Deprived 10%)
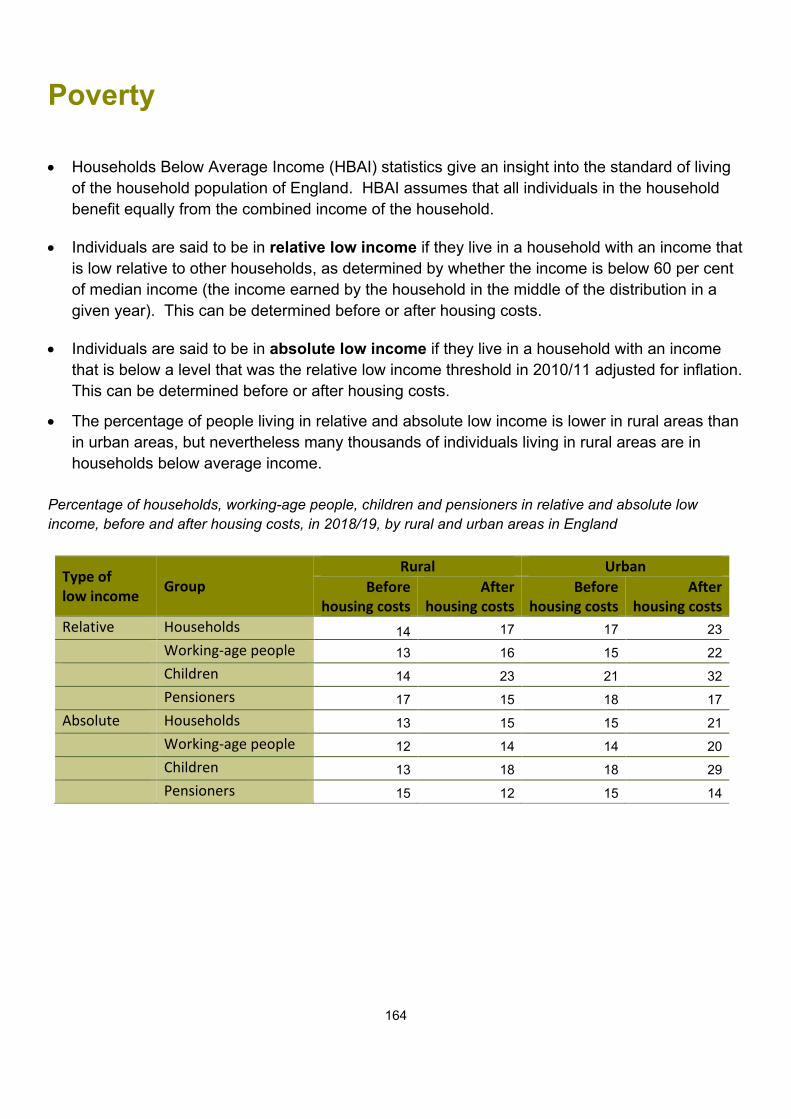
164
Poverty
• Households Below Average Income (HBAI) statistics give an insight into the standard of living of the household population of England. HBAI assumes that all individuals in the household benefit equally from the combined income of the household.
• Individuals are said to be in relative low income if they live in a household with an income that is low relative to other households, as determined by whether the income is below 60 per cent of median income (the income earned by the household in the middle of the distribution in a given year). This can be determined before or after housing costs.
• Individuals are said to be in absolute low income if they live in a household with an income that is below a level that was the relative low income threshold in 2010/11 adjusted for inflation. This can be determined before or after housing costs.
• The percentage of people living in relative and absolute low income is lower in rural areas than in urban areas, but nevertheless many thousands of individuals living in rural areas are in households below average income.
Percentage of households, working-age people, children and pensioners in relative and absolute low income, before and after housing costs, in 2018/19, by rural and urban areas in England
Type of low income Group
Rural Urban Before
housing costs After
housing costs Before
housing costs After
housing costs Relative Households 14 17 17 23 Working-age people 13 16 15 22 Children 14 23 21 32 Pensioners 17 15 18 17 Absolute Households 13 15 15 21 Working-age people 12 14 14 20 Children 13 18 18 29 Pensioners 15 12 15 14

165
Relative low income in 2018/19
• The percentage of households in rural areas in relative low income was 14 per cent before housing costs and 17 per cent after housing costs. In comparison, the percentage of households in urban areas in relative low income was 17 per cent before housing costs and 23 per cent after housing costs.
• The percentage of working-age people in rural areas in relative low income was 13 per cent before housing costs and 16 per cent after housing costs. In comparison, the percentage of working-age people in urban areas in relative low income was 15 per cent before housing costs and 22 per cent after housing costs.
• The percentage of children in rural areas in relative low income was 14 per cent before housing costs, and 23 per cent after housing costs. In comparison, the percentage of children in urban areas in relative low income was 21 per cent before housing costs and 32 per cent after housing costs.
• The percentage of pensioners in rural areas in relative low income was 17 per cent before housing costs, and 15 per cent after housing costs. In comparison, the percentage of pensioners in urban areas in relative low income was 18 per cent before housing costs and 17 per cent after housing costs.
Absolute low income in 2018/19
• The percentage of households in rural areas in absolute low income was 13 per cent before housing costs and 15 per cent after housing costs. The percentage of households in urban areas in absolute low income was 15 per cent before housing costs and 21 per cent after housing costs.
• The percentage of working-age people in rural areas in absolute low income was 12 per cent before housing costs and 14 per cent after housing costs. In comparison, the percentage of working-age people in urban areas in relative low income was 14 per cent before housing costs and 20 per cent after housing costs.
• The percentage of children in rural areas in absolute low income was 13 per cent before housing costs and 18 per cent after housing costs. In comparison, the percentage of children in urban areas in absolute low income was 18 per cent before housing costs and 29 per cent after housing costs.
• The percentage of pensioners in rural areas in absolute low income was 15 per cent before housing costs and 12 per cent after housing costs. In comparison, the percentage of pensioners in urban areas in absolute low income was 15 per cent before housing costs and 14 per cent after housing costs.
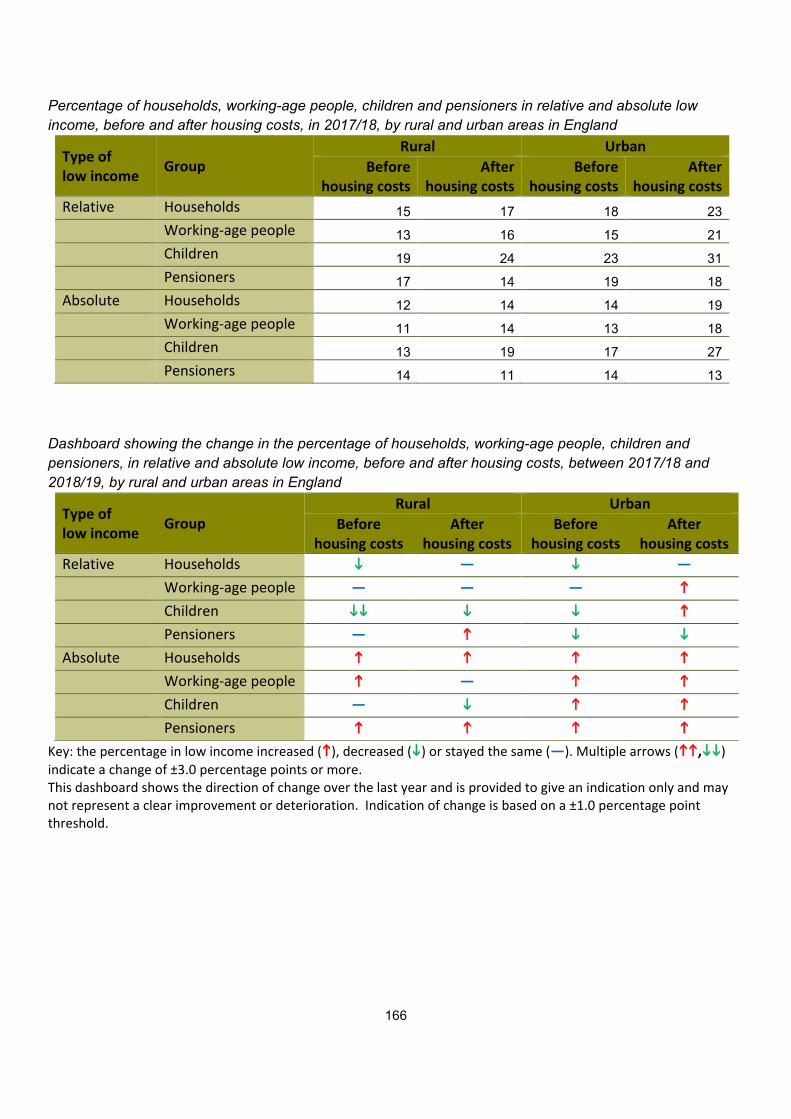
166
Percentage of households, working-age people, children and pensioners in relative and absolute low income, before and after housing costs, in 2017/18, by rural and urban areas in England
Type of low income Group
Rural Urban Before
housing costs After
housing costs Before
housing costs After
housing costs Relative Households 15 17 18 23 Working-age people 13 16 15 21 Children 19 24 23 31 Pensioners 17 14 19 18 Absolute Households 12 14 14 19 Working-age people 11 14 13 18 Children 13 19 17 27 Pensioners 14 11 14 13
Dashboard showing the change in the percentage of households, working-age people, children and pensioners, in relative and absolute low income, before and after housing costs, between 2017/18 and 2018/19, by rural and urban areas in England
Type of low income Group
Rural Urban Before
housing costs After
housing costs Before
housing costs After
housing costs Relative Households — — Working-age people — — — Children Pensioners — Absolute Households Working-age people — Children — Pensioners
Key: the percentage in low income increased (), decreased () or stayed the same (—). Multiple arrows (,) indicate a change of ±3.0 percentage points or more. This dashboard shows the direction of change over the last year and is provided to give an indication only and may not represent a clear improvement or deterioration. Indication of change is based on a ±1.0 percentage point threshold.
167
Changes between 2017/18 and 2018/19 In rural areas:
• The percentage of children in relative low income, has seen a strong decrease before housing costs and a smaller decrease after housing costs.
• The percentage of pensioners in relative low income has increased after housing costs. • The percentage of people in absolute low income has increased before housing costs for
households, working-age people and pensioners and after housing costs for households and pensioners.
In urban areas:
• The percentages of households, working-age people, children and pensioners in absolute low income have all increased both before and after housing costs.
• The percentage of households, children and pensioners in relative low income has decreased before housing costs.
• The percentage of working-age people and children in relative low income has increased after housing costs.
Technical note This report presents figures on the percentage living in relative and absolute low income for households overall, and separately for working-age adults, children and pensioners. These statistics are one of the measures used to assess changes to living standards by examining low income, income inequality and poverty. Figures are presented as before and after housing costs.
The Department for Work and Pensions (DWP) reports that before housing costs1 measures allow an assessment of the relative standard of living of those individuals who were actually benefiting from a better quality of housing by paying more for better accommodation, and income growth over time incorporates improvements in living standards where higher costs reflected improvements in the quality of housing.
After housing costs1 measures allow an assessment of living standards of individuals whose housing costs are high relative to the quality of their accommodation, and income growth over time may also overstate improvements in living standards for low-income groups, as a rise in housing benefit to offset higher rents (for a given quality of accommodation) would be counted as an income rise.
Both before and after housing costs measures can be used to examine relative and absolute low income for households.
DWP report that the preferred measure to examine relative and absolute low income for the working-age population (those aged between 16 and 64) is before housing costs. This is because after housing costs measures can underestimate the true living standard of families who choose to spend more on housing to attain a higher standard of accommodation.
DWP report that the preferred measure of low income for children is based on incomes measured before housing costs, as after housing costs measures can underestimate the true living standard of families who choose to spend more on housing to attain a higher standard of accommodation.
DWP report that the preferred measure of low income for pensioners is based on incomes measured after housing costs, as a significant percentage of pensioners own their own home. The figures for both urban and rural areas show that the percentage of pensioners in relative or absolute low income was lower after housing costs, than before housing costs.
These rural statistics are based on relative low income and absolute low income2. DWP also report on measures of ‘low income and material deprivation’ and ‘persistent poverty’. 1 See Note (a) for explanation of what is included in before and after housing costs. 2 See Note (b) for explanation of relative low income and absolute low income.
168
Source: Department for Work and Pensions (DWP), bespoke data request. Notes: (a) HBAI statistics – background information Households Below Average Income (HBAI) uses net disposable weekly household income, after adjusting for the household size and composition, as an assessment for material living standards - the level of consumption of goods and services that people could attain given the net income of the household in which they live. In order to allow comparisons of the living standards of different types of households, income is adjusted to take into account variations in the size and composition of the households in a process known as equivalisation. The unit of analysis is the individual. Housing costs are made up of: rent (gross of housing benefit); water rates, community water charges and council water charges; mortgage interest payments (net of tax relief); structural insurance premiums (for owner occupiers); and ground rent and service charges. Further information on HBAI statistics can be found at: Households below average income (HBAI) statistics document on GOV.UK. (b) HBAI statistics – definitions of relative and absolute low income Relative low income sets the threshold as a percentage of the average income, so it moves each year as average income moves. It is used to measure the number and percentage of individuals who have incomes that are a certain percentage below the average. The percentage of individuals in relative low income will increase if the average income:
• stays the same or rises and, relative to this, individuals on lowest incomes see their income fall, or rise to a lesser extent • falls and individuals with the lowest incomes see their income fall more than the average income
The percentage of individuals in relative low income will decrease if the average income:
• stays the same or rises, while those with the lowest incomes see their income rise more than the average income • falls and, relative to this, individuals with the lowest incomes see their income rise, fall to a lesser extent, or show no
change Absolute low income sets the low income line in a given year, here in 2010/11 then adjusts it each year with inflation as measured by variants of the Retail Prices Index (RPI). This measures the percentage of individuals who are below a certain standard of living in the UK (as measured by income). The percentage of individuals in absolute low income will:
• increase if individuals with the lowest incomes see their income fall or rise less than inflation • decrease if individuals with the lowest incomes see their incomes rise more than inflation
HBAI uses variants of the RPI to adjust for inflation to look at how incomes are changing over real time in real terms. In accordance with the Statistics and Registration Service Act 2007, the RPI and its derivatives have been assessed against the Code of Practice for Official Statistics and found not to meet the required standard for designation as National Statistics. A full report can be found on the UK Statistics Authority website. (c) The Child Poverty Act 2010, Social Mobility and Child Poverty Commission The relative low income target in the Child Poverty Act 2010, (section 3), is that less than 10% of children who live in qualifying households live in households that fall within the relevant income group. For the purposes of this analysis, a household falls within the relevant income group – in relation to a financial year – if its equivalised net income for the financial year is less than 60% of median equivalised net household income for the financial year.

169
(d) Rounding In the tables, figures are rounded to the nearest 1.0 per cent whereas the dashboard shows change based on a ±1.0 percentage point threshold. Increases or decreases in figures between years as noted in the tables and dashboard may therefore not match and these changes may not represent a clear improvement or deterioration.
170
Fuel poverty
Fuel poverty or being fuel poor is where a household is living on a low income in a home that cannot be kept warm at reasonable cost without bringing their residual income below the poverty threshold.
• There were 2.4 million fuel poor households in England in 2018. Historically fuel poverty was proportionately more prevalent in rural areas. This trend reversed in 2017 with urban areas now having a slightly greater proportion of fuel poor households.
• In 2018, 10.3 per cent of households in urban areas (1.98 million) were fuel poor. In rural areas 9.9 per cent of households (425,000) were fuel poor – this has decreased between 2011 and 2018.
• Homes in rural areas are typically less energy efficient and can be more reliant on potentially more expensive heating fuels.
• The fuel poverty gap is the additional income which would be needed to bring a household to the point of not being fuel poor.
• Overall the average fuel poverty gap for households that were fuel poor in 2018 was £334. However the average fuel poverty gap for fuel poor households in rural villages, hamlets and isolated dwellings was £690.
• The average fuel poverty gap for both rural and urban households decreased between 2011 and 2017.
• The Fuel Poverty Energy Efficiency Rating (FPEER) is a measure of the energy efficiency of a property. Rural village, hamlet and isolated dwelling households with the poorest FPEER rating of F or G had an average fuel poverty gap of £1,663 compared with an average fuel poverty gap of £836 for urban households of the same energy rating.
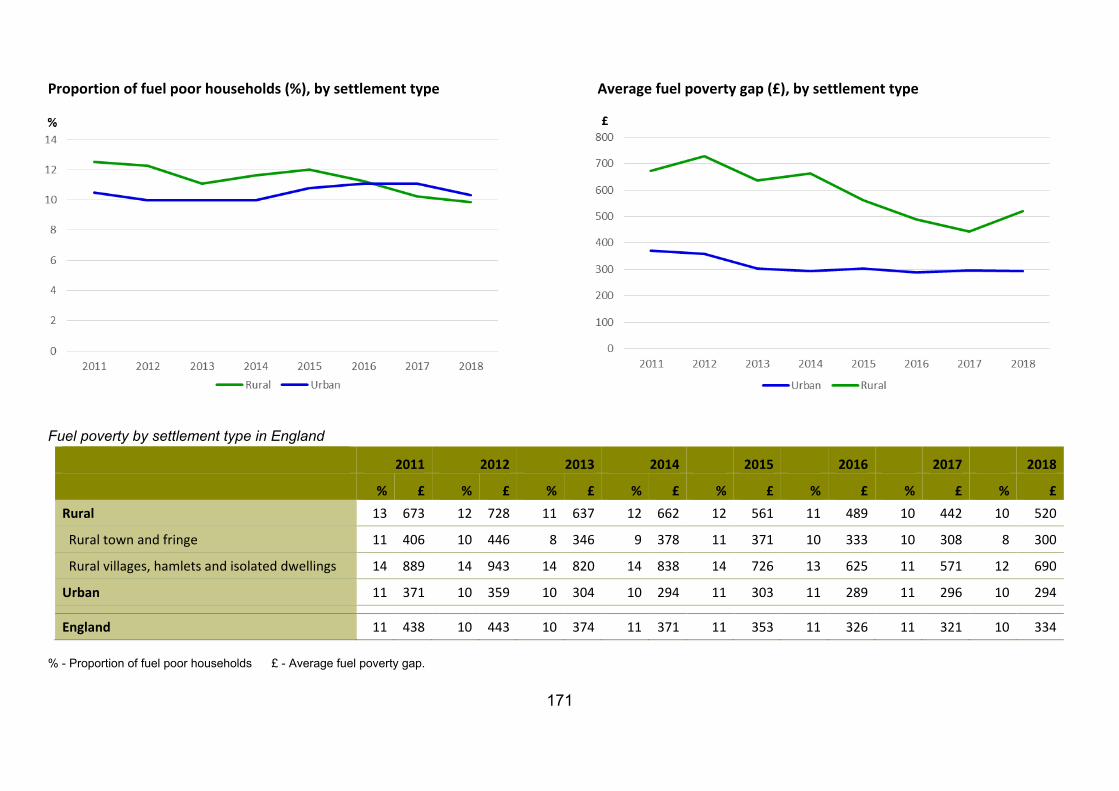
171
Proportion of fuel poor households (%), by settlement type Average fuel poverty gap (£), by settlement type
Fuel poverty by settlement type in England
2011 2012 2013 2014 2015 2016 2017 2018 % £ % £ % £ % £ % £ % £ % £ % £ Rural 13 673 12 728 11 637 12 662 12 561 11 489 10 442 10 520
Rural town and fringe 11 406 10 446 8 346 9 378 11 371 10 333 10 308 8 300
Rural villages, hamlets and isolated dwellings 14 889 14 943 14 820 14 838 14 726 13 625 11 571 12 690
Urban 11 371 10 359 10 304 10 294 11 303 11 289 11 296 10 294
England 11 438 10 443 10 374 11 371 11 353 11 326 11 321 10 334 % - Proportion of fuel poor households £ - Average fuel poverty gap.
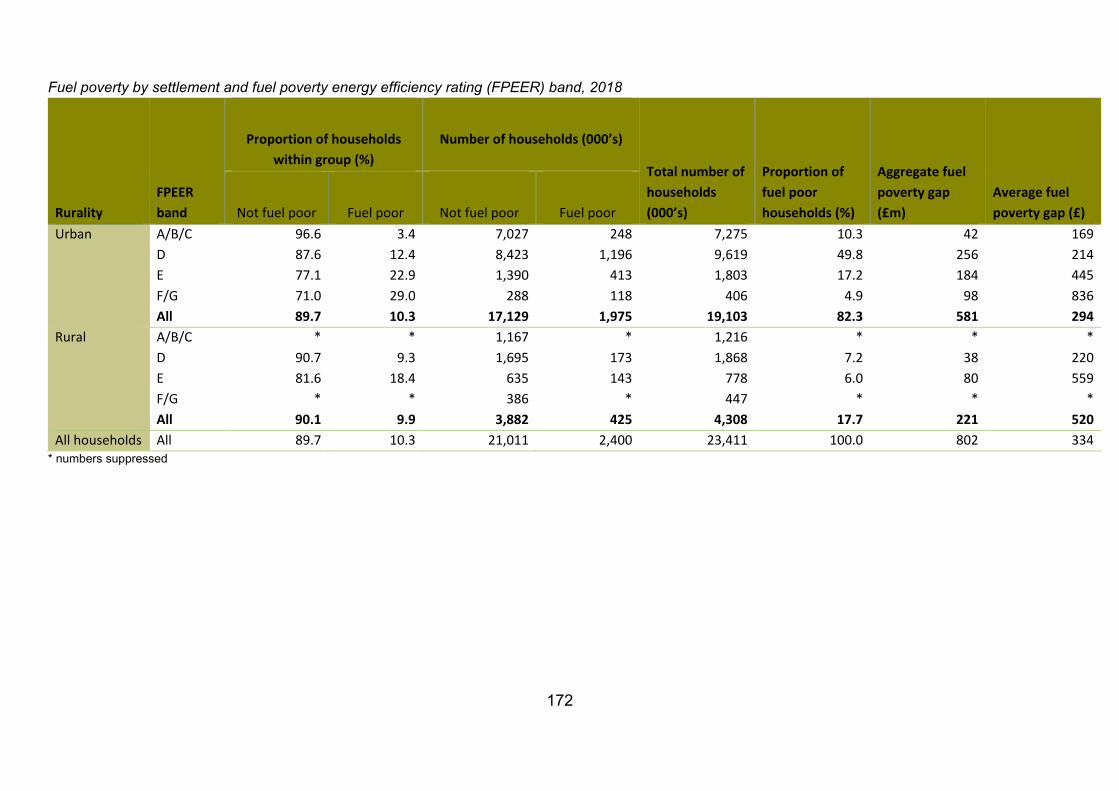
172
Fuel poverty by settlement and fuel poverty energy efficiency rating (FPEER) band, 2018
Rurality FPEER band
Proportion of households within group (%)
Number of households (000’s)
Total number of households (000’s)
Proportion of fuel poor households (%)
Aggregate fuel poverty gap (£m)
Average fuel poverty gap (£) Not fuel poor Fuel poor Not fuel poor Fuel poor
Urban A/B/C 96.6 3.4 7,027 248 7,275 10.3 42 169 D 87.6 12.4 8,423 1,196 9,619 49.8 256 214 E 77.1 22.9 1,390 413 1,803 17.2 184 445 F/G 71.0 29.0 288 118 406 4.9 98 836 All 89.7 10.3 17,129 1,975 19,103 82.3 581 294
Rural A/B/C * * 1,167 * 1,216 * * * D 90.7 9.3 1,695 173 1,868 7.2 38 220 E 81.6 18.4 635 143 778 6.0 80 559 F/G * * 386 * 447 * * * All 90.1 9.9 3,882 425 4,308 17.7 221 520
All households All 89.7 10.3 21,011 2,400 23,411 100.0 802 334 * numbers suppressed

173
Technical note: A household is said to be in fuel poverty if they have required fuel costs that are above average (the national median level), and were they to spend that amount, they would be left with a residual income below the official poverty line. This low income high cost indicator consists of two parts; firstly the number of households that have low incomes and high fuel costs; and secondly the depth of fuel poverty amongst these households. The depth of fuel poverty is measured by the ‘fuel poverty gap’ which is the difference (in pounds) between the required energy costs for each fuel poor household and the nearest fuel poverty threshold. There are three key elements in determining whether a household is fuel poor, which are household income, household energy requirements and fuel prices Fuel Poverty Energy Efficiency Rating (FPEER) is a measure of the energy efficiency of a property based on the Standard Assessment Procedure (SAP) but accounts for policies that directly affect the cost of energy. The FPEER methodology generates a rating between 1 and 100, which is then translated into an energy efficiency Band from G (lowest) to A (highest). Source: BEIS fuel poverty statistics www.gov.uk/government/collections/fuel-poverty-statistics
174
Education and skills
Childcare provision • The type of childcare provider is proportionally similar in both Rural and Urban areas, with
almost half of providers being Childminders in both settings. • The number of active childcare providers in Rural areas and Urban with Significant Rural
areas has decreased by 20 per cent since 2015, while the in Urban areas there has a 13 per cent fall.
• Ofsted notes that despite the fall in the number of providers since 2015, the number of places on the Early Years Register (EYR) has remained broadly stable.
• The overall quality of childcare providers has improved in both Rural and Urban areas since 2015. The proportion of providers judged to be Good or Outstanding has increased by 10 per cent in Rural areas and by 13 per cent in Urban areas.
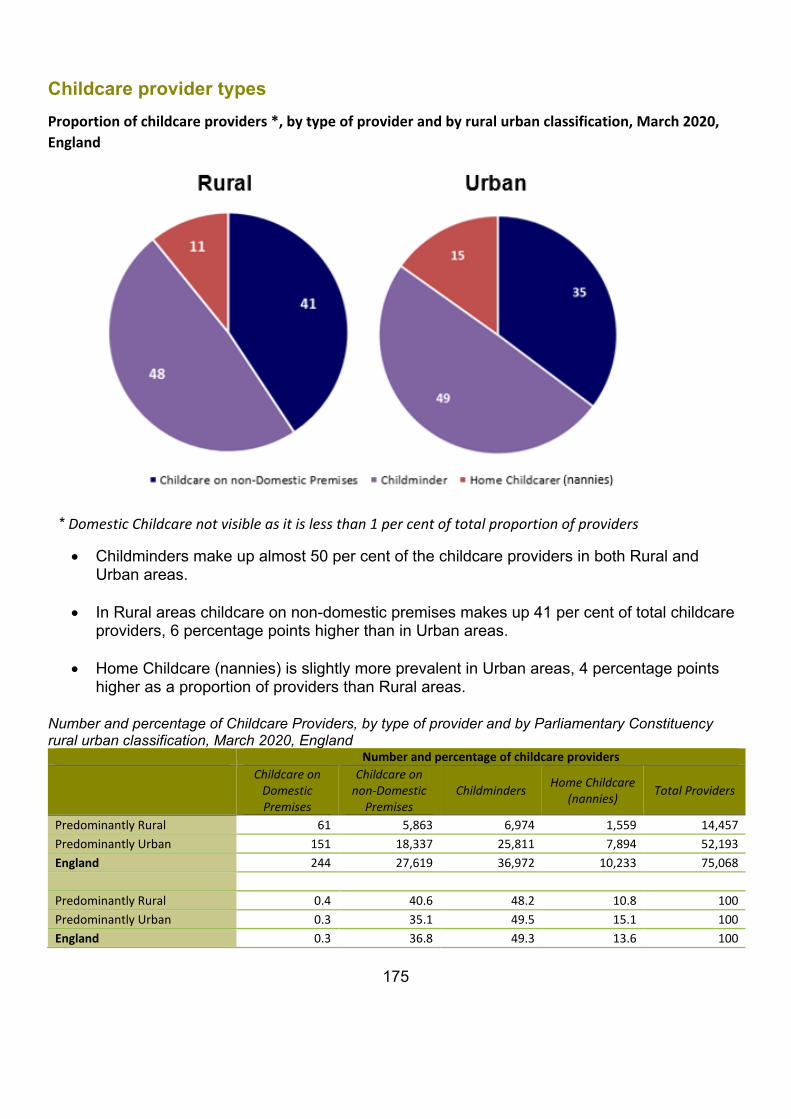
175
Childcare provider types Proportion of childcare providers *, by type of provider and by rural urban classification, March 2020, England
* Domestic Childcare not visible as it is less than 1 per cent of total proportion of providers
• Childminders make up almost 50 per cent of the childcare providers in both Rural and Urban areas.
• In Rural areas childcare on non-domestic premises makes up 41 per cent of total childcare providers, 6 percentage points higher than in Urban areas.
• Home Childcare (nannies) is slightly more prevalent in Urban areas, 4 percentage points higher as a proportion of providers than Rural areas.
Number and percentage of Childcare Providers, by type of provider and by Parliamentary Constituency rural urban classification, March 2020, England
Number and percentage of childcare providers Childcare on
Domestic Premises
Childcare on non-Domestic
Premises Childminders Home Childcare
(nannies) Total Providers
Predominantly Rural 61 5,863 6,974 1,559 14,457 Predominantly Urban 151 18,337 25,811 7,894 52,193 England 244 27,619 36,972 10,233 75,068 Predominantly Rural 0.4 40.6 48.2 10.8 100 Predominantly Urban 0.3 35.1 49.5 15.1 100 England 0.3 36.8 49.3 13.6 100
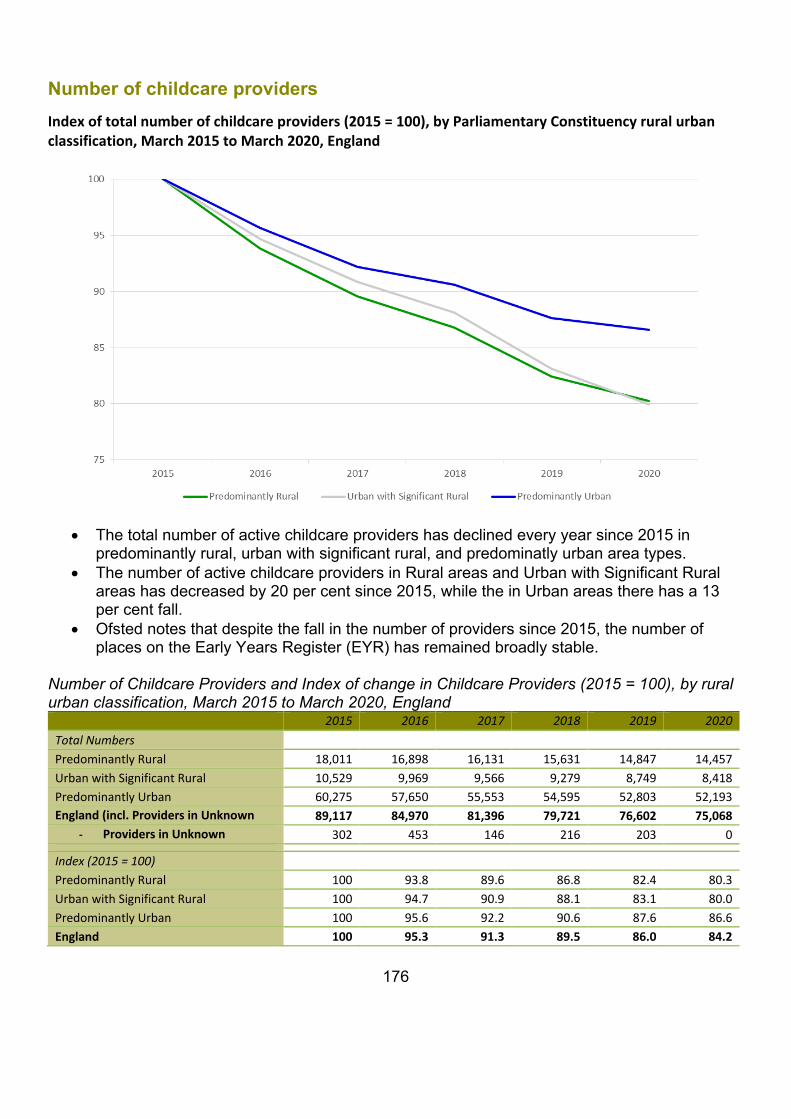
176
Number of childcare providers Index of total number of childcare providers (2015 = 100), by Parliamentary Constituency rural urban classification, March 2015 to March 2020, England
• The total number of active childcare providers has declined every year since 2015 in
predominantly rural, urban with significant rural, and predominatly urban area types. • The number of active childcare providers in Rural areas and Urban with Significant Rural
areas has decreased by 20 per cent since 2015, while the in Urban areas there has a 13 per cent fall.
• Ofsted notes that despite the fall in the number of providers since 2015, the number of places on the Early Years Register (EYR) has remained broadly stable.
Number of Childcare Providers and Index of change in Childcare Providers (2015 = 100), by rural urban classification, March 2015 to March 2020, England
2015 2016 2017 2018 2019 2020 Total Numbers Predominantly Rural 18,011 16,898 16,131 15,631 14,847 14,457 Urban with Significant Rural 10,529 9,969 9,566 9,279 8,749 8,418 Predominantly Urban 60,275 57,650 55,553 54,595 52,803 52,193 England (incl. Providers in Unknown
89,117 84,970 81,396 79,721 76,602 75,068
- Providers in Unknown
302 453 146 216 203 0 Index (2015 = 100) Predominantly Rural 100 93.8 89.6 86.8 82.4 80.3 Urban with Significant Rural 100 94.7 90.9 88.1 83.1 80.0 Predominantly Urban 100 95.6 92.2 90.6 87.6 86.6 England 100 95.3 91.3 89.5 86.0 84.2
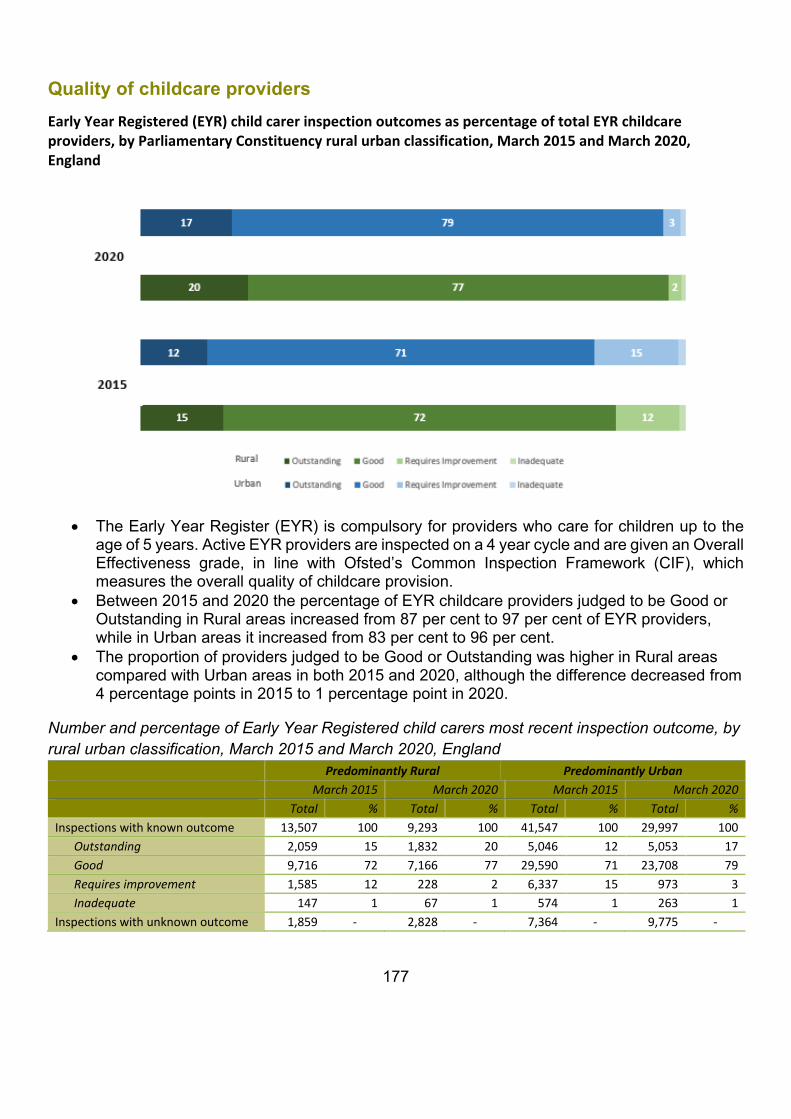
177
Quality of childcare providers Early Year Registered (EYR) child carer inspection outcomes as percentage of total EYR childcare providers, by Parliamentary Constituency rural urban classification, March 2015 and March 2020, England
• The Early Year Register (EYR) is compulsory for providers who care for children up to the
age of 5 years. Active EYR providers are inspected on a 4 year cycle and are given an Overall Effectiveness grade, in line with Ofsted’s Common Inspection Framework (CIF), which measures the overall quality of childcare provision.
• Between 2015 and 2020 the percentage of EYR childcare providers judged to be Good or Outstanding in Rural areas increased from 87 per cent to 97 per cent of EYR providers, while in Urban areas it increased from 83 per cent to 96 per cent.
• The proportion of providers judged to be Good or Outstanding was higher in Rural areas compared with Urban areas in both 2015 and 2020, although the difference decreased from 4 percentage points in 2015 to 1 percentage point in 2020.
Number and percentage of Early Year Registered child carers most recent inspection outcome, by rural urban classification, March 2015 and March 2020, England
Predominantly Rural Predominantly Urban March 2015 March 2020 March 2015 March 2020 Total % Total % Total % Total % Inspections with known outcome 13,507 100 9,293 100 41,547 100 29,997 100
Outstanding 2,059 15 1,832 20 5,046 12 5,053 17 Good 9,716 72 7,166 77 29,590 71 23,708 79 Requires improvement 1,585 12 228 2 6,337 15 973 3 Inadequate 147 1 67 1 574 1 263 1
Inspections with unknown outcome 1,859 - 2,828 - 7,364 - 9,775 -
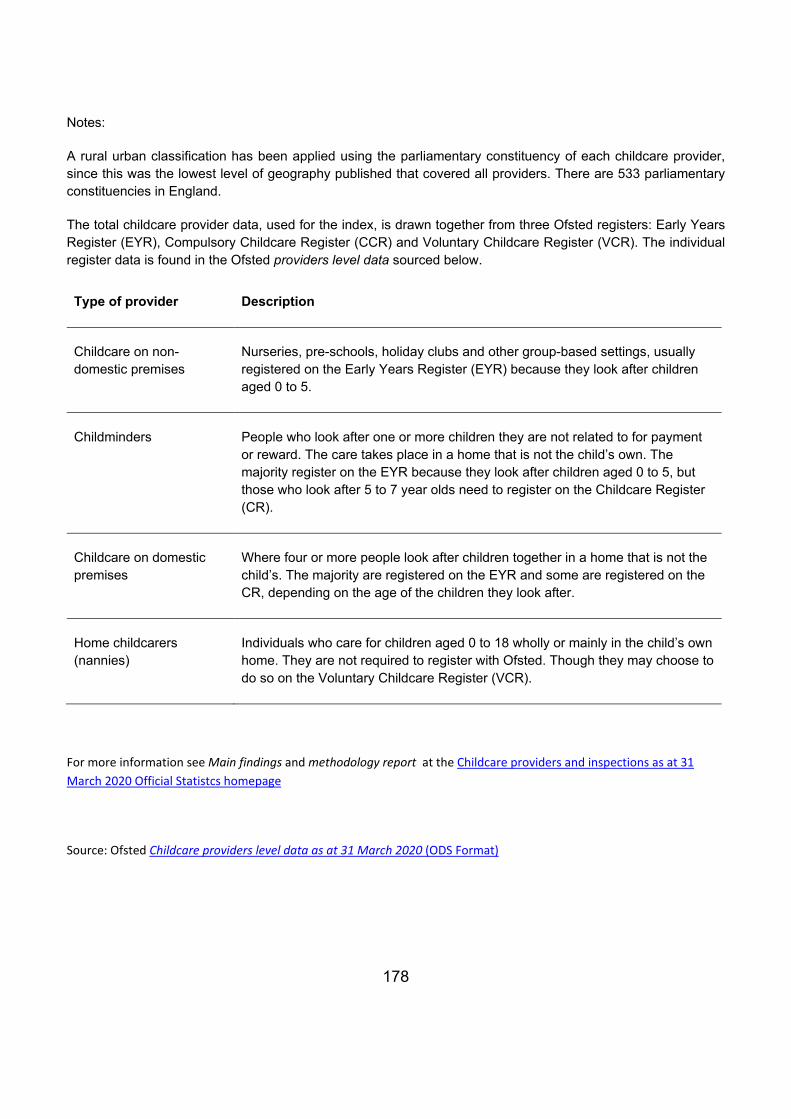
178
Notes:
A rural urban classification has been applied using the parliamentary constituency of each childcare provider, since this was the lowest level of geography published that covered all providers. There are 533 parliamentary constituencies in England.
The total childcare provider data, used for the index, is drawn together from three Ofsted registers: Early Years Register (EYR), Compulsory Childcare Register (CCR) and Voluntary Childcare Register (VCR). The individual register data is found in the Ofsted providers level data sourced below.
Type of provider Description
Childcare on non-domestic premises
Nurseries, pre-schools, holiday clubs and other group-based settings, usually registered on the Early Years Register (EYR) because they look after children aged 0 to 5.
Childminders People who look after one or more children they are not related to for payment or reward. The care takes place in a home that is not the child’s own. The majority register on the EYR because they look after children aged 0 to 5, but those who look after 5 to 7 year olds need to register on the Childcare Register (CR).
Childcare on domestic premises
Where four or more people look after children together in a home that is not the child’s. The majority are registered on the EYR and some are registered on the CR, depending on the age of the children they look after.
Home childcarers (nannies)
Individuals who care for children aged 0 to 18 wholly or mainly in the child’s own home. They are not required to register with Ofsted. Though they may choose to do so on the Voluntary Childcare Register (VCR).
For more information see Main findings and methodology report at the Childcare providers and inspections as at 31 March 2020 Official Statistcs homepage
Source: Ofsted Childcare providers level data as at 31 March 2020 (ODS Format)
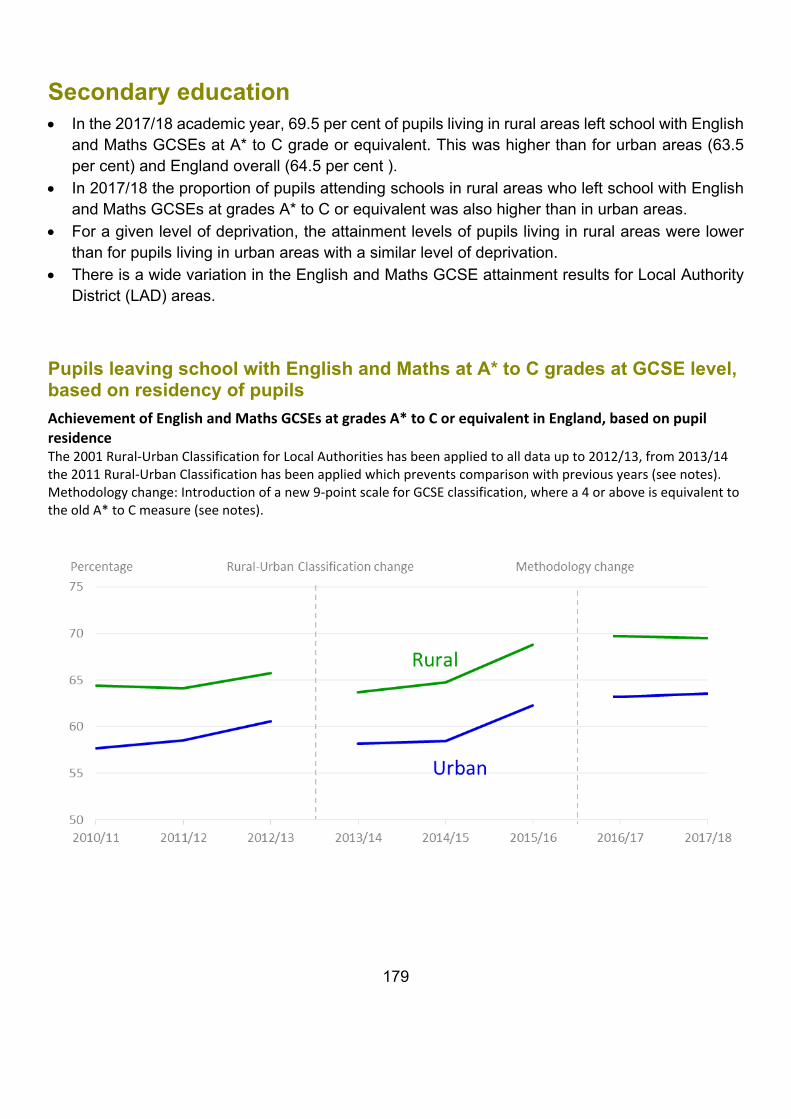
179
Secondary education • In the 2017/18 academic year, 69.5 per cent of pupils living in rural areas left school with English
and Maths GCSEs at A* to C grade or equivalent. This was higher than for urban areas (63.5 per cent) and England overall (64.5 per cent ).
• In 2017/18 the proportion of pupils attending schools in rural areas who left school with English and Maths GCSEs at grades A* to C or equivalent was also higher than in urban areas.
• For a given level of deprivation, the attainment levels of pupils living in rural areas were lower than for pupils living in urban areas with a similar level of deprivation.
• There is a wide variation in the English and Maths GCSE attainment results for Local Authority District (LAD) areas.
Pupils leaving school with English and Maths at A* to C grades at GCSE level, based on residency of pupils Achievement of English and Maths GCSEs at grades A* to C or equivalent in England, based on pupil residence The 2001 Rural-Urban Classification for Local Authorities has been applied to all data up to 2012/13, from 2013/14 the 2011 Rural-Urban Classification has been applied which prevents comparison with previous years (see notes). Methodology change: Introduction of a new 9-point scale for GCSE classification, where a 4 or above is equivalent to the old A* to C measure (see notes).
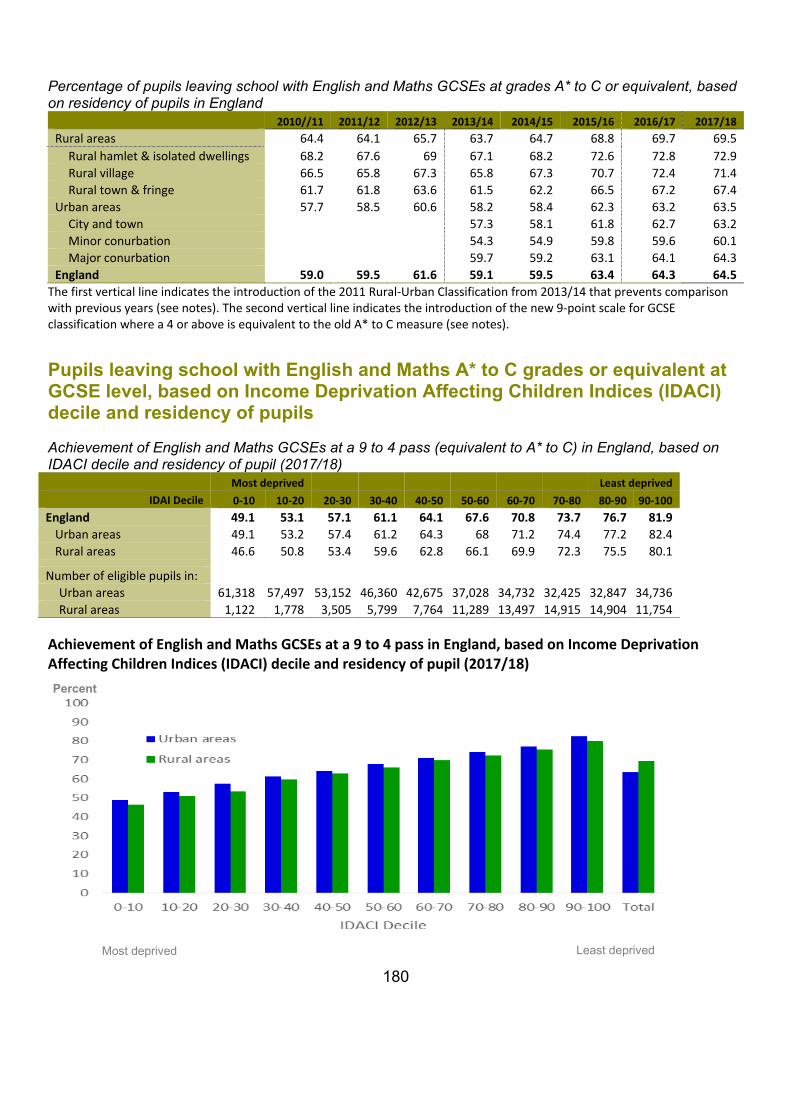
180
Percentage of pupils leaving school with English and Maths GCSEs at grades A* to C or equivalent, based on residency of pupils in England
2010//11 2011/12 2012/13 2013/14 2014/15 2015/16 2016/17 2017/18 Rural areas 64.4 64.1 65.7 63.7 64.7 68.8 69.7 69.5
Rural hamlet & isolated dwellings 68.2 67.6 69 67.1 68.2 72.6 72.8 72.9 Rural village 66.5 65.8 67.3 65.8 67.3 70.7 72.4 71.4 Rural town & fringe 61.7 61.8 63.6 61.5 62.2 66.5 67.2 67.4
Urban areas 57.7 58.5 60.6 58.2 58.4 62.3 63.2 63.5 City and town 57.3 58.1 61.8 62.7 63.2 Minor conurbation 54.3 54.9 59.8 59.6 60.1 Major conurbation 59.7 59.2 63.1 64.1 64.3
England 59.0 59.5 61.6 59.1 59.5 63.4 64.3 64.5 The first vertical line indicates the introduction of the 2011 Rural-Urban Classification from 2013/14 that prevents comparison with previous years (see notes). The second vertical line indicates the introduction of the new 9-point scale for GCSE classification where a 4 or above is equivalent to the old A* to C measure (see notes).
Pupils leaving school with English and Maths A* to C grades or equivalent at GCSE level, based on Income Deprivation Affecting Children Indices (IDACI) decile and residency of pupils
Achievement of English and Maths GCSEs at a 9 to 4 pass (equivalent to A* to C) in England, based on IDACI decile and residency of pupil (2017/18) Most deprived Least deprived
IDAI Decile 0-10 10-20 20-30 30-40 40-50 50-60 60-70 70-80 80-90 90-100 England 49.1 53.1 57.1 61.1 64.1 67.6 70.8 73.7 76.7 81.9
Urban areas 49.1 53.2 57.4 61.2 64.3 68 71.2 74.4 77.2 82.4 Rural areas 46.6 50.8 53.4 59.6 62.8 66.1 69.9 72.3 75.5 80.1
Number of eligible pupils in: Urban areas 61,318 57,497 53,152 46,360 42,675 37,028 34,732 32,425 32,847 34,736 Rural areas 1,122 1,778 3,505 5,799 7,764 11,289 13,497 14,915 14,904 11,754
Achievement of English and Maths GCSEs at a 9 to 4 pass in England, based on Income Deprivation Affecting Children Indices (IDACI) decile and residency of pupil (2017/18)
Most deprived Least deprived
Percent
181
• The introduction of a new secondary school accountability system in 2016 has changed how GCSE performance is measured. A 9 to 1 point measure was introduced to replace the A* to G system, where a 9 to 4 score is equivalent to the previous A* to C measure. Data from 2016/17 presents the new 9 to 4 measure, whereas data prior to 2016/17 presents the previous A* to C measure.
• The proportion of pupils achieving English and Maths A* to C grades or equivalent in their GCSEs at the end of Key Stage 4 (end of secondary-level education), based on residency of pupil:
o increased between 2010/11 and 2017/18 for both rural and urban areas o was 6.0 percentage points higher in rural than urban areas in 2017/18 o was lower for all rural areas for each level of deprivation (IDACI decile group)
compared with urban areas • When the data are considered at an aggregated rural level then the rural English and Maths
attainment results are on average better than the urban ones. • However, results by the level of deprivation in the area where the pupil lives (using the Income
Deprivation Affecting Children Index (IDACI) adds context to the results by taking into account the circumstances of children outside the influence of the school. When comparing results using deprivation level (IDACI decile bands), rural areas had lower achievement levels in English and Maths for all levels of deprivation compared with urban areas.
• The differing outcome at the aggregated rural level (rural areas seeing higher levels of attainment) and individual deprivation levels is explained by the different proportions of deprivation within rural and urban areas overall. In rural areas in 2017/18, 23 per cent of pupils were in areas with the highest levels of deprivation (decile bands 0 to 50) compared with 60 per cent of pupils in urban areas. Those pupils in these more deprived areas generally had lower achievement levels compared with those in less deprived areas (decile bands 50 to 100) where there are proportionately more pupils in rural areas. This factor results in a higher attainment average overall for rural pupils and the converse for urban pupils.
• It is also useful to consider geographical differences by comparing the results at Local Authority District level and region.
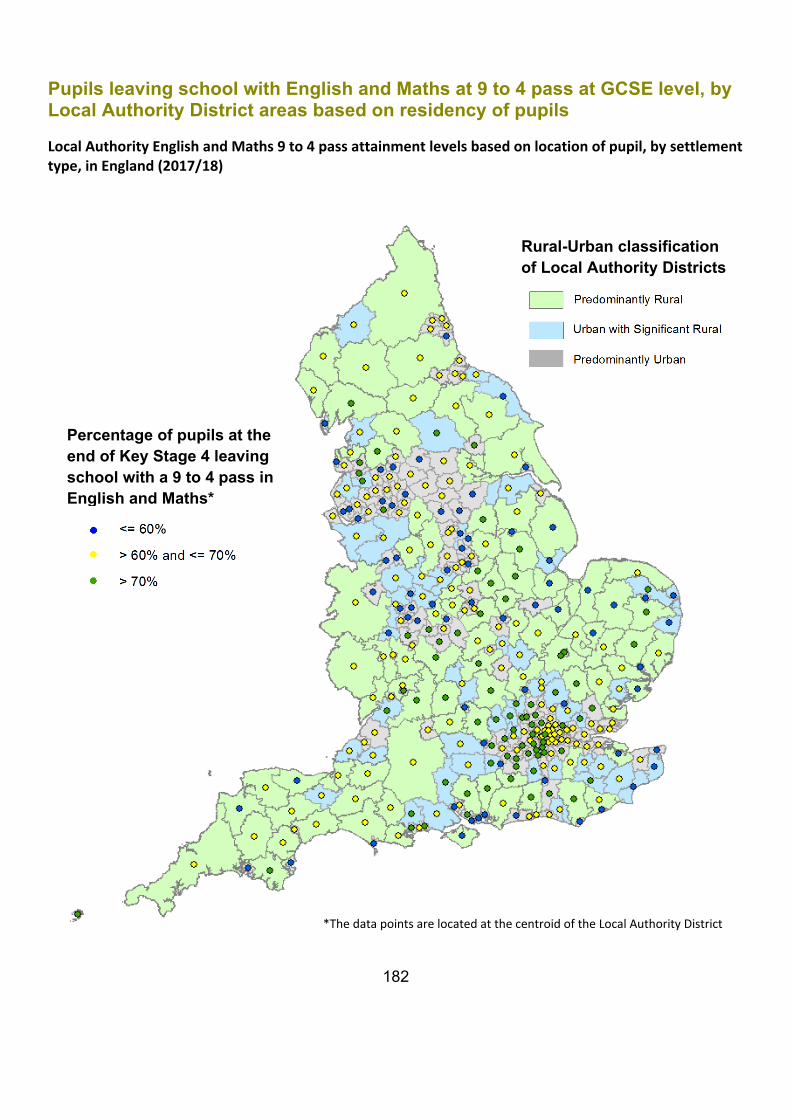
182
Pupils leaving school with English and Maths at 9 to 4 pass at GCSE level, by Local Authority District areas based on residency of pupils
Local Authority English and Maths 9 to 4 pass attainment levels based on location of pupil, by settlement type, in England (2017/18)
Rural-Urban classification of Local Authority Districts
Percentage of pupils at the end of Key Stage 4 leaving school with a 9 to 4 pass in English and Maths*
*The data points are located at the centroid of the Local Authority District
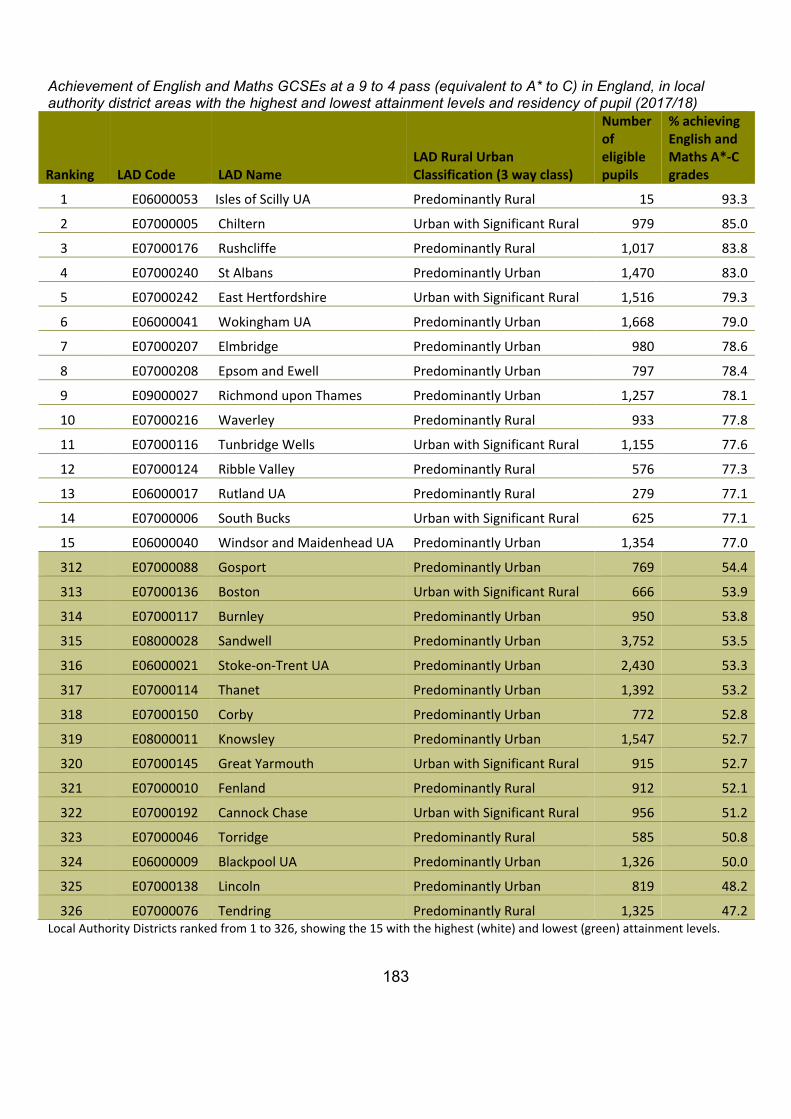
183
Achievement of English and Maths GCSEs at a 9 to 4 pass (equivalent to A* to C) in England, in local authority district areas with the highest and lowest attainment levels and residency of pupil (2017/18)
Ranking LAD Code LAD Name LAD Rural Urban Classification (3 way class)
Number of eligible pupils
% achieving English and Maths A*-C grades
1 E06000053 Isles of Scilly UA Predominantly Rural 15 93.3
2 E07000005 Chiltern Urban with Significant Rural 979 85.0
3 E07000176 Rushcliffe Predominantly Rural 1,017 83.8
4 E07000240 St Albans Predominantly Urban 1,470 83.0
5 E07000242 East Hertfordshire Urban with Significant Rural 1,516 79.3
6 E06000041 Wokingham UA Predominantly Urban 1,668 79.0
7 E07000207 Elmbridge Predominantly Urban 980 78.6
8 E07000208 Epsom and Ewell Predominantly Urban 797 78.4
9 E09000027 Richmond upon Thames Predominantly Urban 1,257 78.1
10 E07000216 Waverley Predominantly Rural 933 77.8
11 E07000116 Tunbridge Wells Urban with Significant Rural 1,155 77.6
12 E07000124 Ribble Valley Predominantly Rural 576 77.3
13 E06000017 Rutland UA Predominantly Rural 279 77.1
14 E07000006 South Bucks Urban with Significant Rural 625 77.1
15 E06000040 Windsor and Maidenhead UA Predominantly Urban 1,354 77.0
312 E07000088 Gosport Predominantly Urban 769 54.4
313 E07000136 Boston Urban with Significant Rural 666 53.9
314 E07000117 Burnley Predominantly Urban 950 53.8
315 E08000028 Sandwell Predominantly Urban 3,752 53.5
316 E06000021 Stoke-on-Trent UA Predominantly Urban 2,430 53.3
317 E07000114 Thanet Predominantly Urban 1,392 53.2
318 E07000150 Corby Predominantly Urban 772 52.8
319 E08000011 Knowsley Predominantly Urban 1,547 52.7
320 E07000145 Great Yarmouth Urban with Significant Rural 915 52.7
321 E07000010 Fenland Predominantly Rural 912 52.1
322 E07000192 Cannock Chase Urban with Significant Rural 956 51.2
323 E07000046 Torridge Predominantly Rural 585 50.8
324 E06000009 Blackpool UA Predominantly Urban 1,326 50.0
325 E07000138 Lincoln Predominantly Urban 819 48.2
326 E07000076 Tendring Predominantly Rural 1,325 47.2 Local Authority Districts ranked from 1 to 326, showing the 15 with the highest (white) and lowest (green) attainment levels.
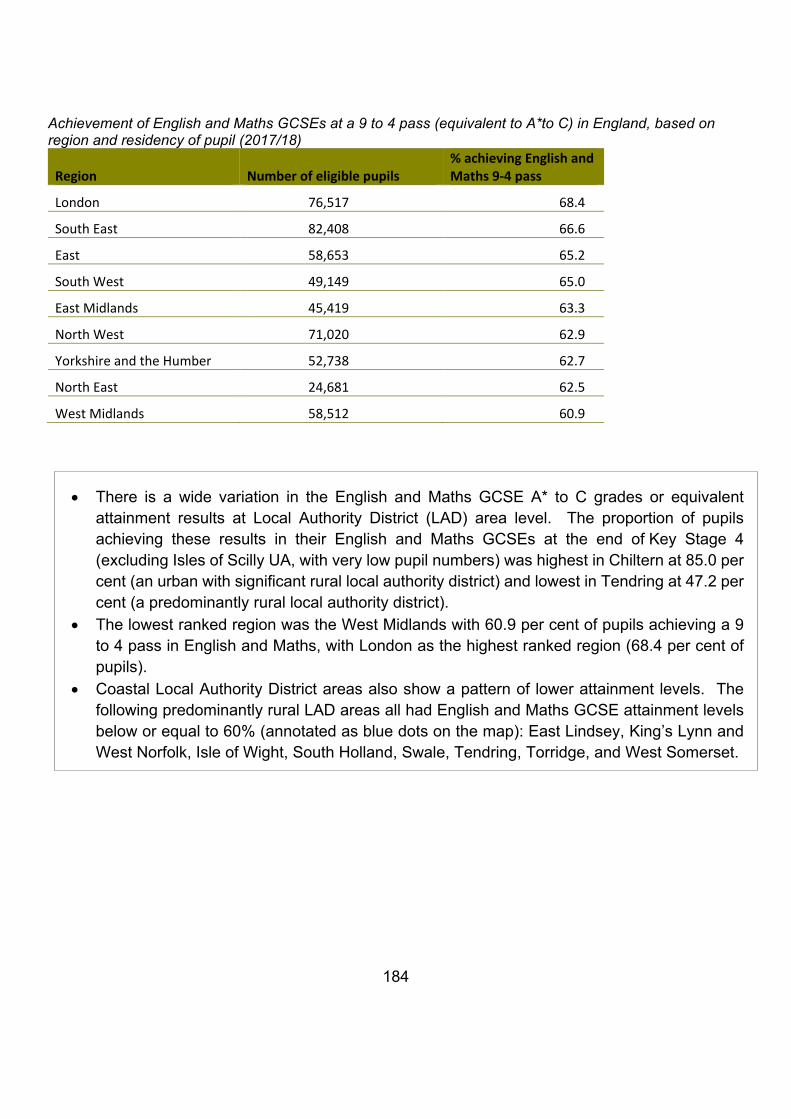
184
Achievement of English and Maths GCSEs at a 9 to 4 pass (equivalent to A*to C) in England, based on region and residency of pupil (2017/18)
Region Number of eligible pupils % achieving English and Maths 9-4 pass
London 76,517 68.4
South East 82,408 66.6
East 58,653 65.2
South West 49,149 65.0
East Midlands 45,419 63.3
North West 71,020 62.9
Yorkshire and the Humber 52,738 62.7
North East 24,681 62.5
West Midlands 58,512 60.9
• There is a wide variation in the English and Maths GCSE A* to C grades or equivalent attainment results at Local Authority District (LAD) area level. The proportion of pupils achieving these results in their English and Maths GCSEs at the end of Key Stage 4 (excluding Isles of Scilly UA, with very low pupil numbers) was highest in Chiltern at 85.0 per cent (an urban with significant rural local authority district) and lowest in Tendring at 47.2 per cent (a predominantly rural local authority district).
• The lowest ranked region was the West Midlands with 60.9 per cent of pupils achieving a 9 to 4 pass in English and Maths, with London as the highest ranked region (68.4 per cent of pupils).
• Coastal Local Authority District areas also show a pattern of lower attainment levels. The following predominantly rural LAD areas all had English and Maths GCSE attainment levels below or equal to 60% (annotated as blue dots on the map): East Lindsey, King’s Lynn and West Norfolk, Isle of Wight, South Holland, Swale, Tendring, Torridge, and West Somerset.
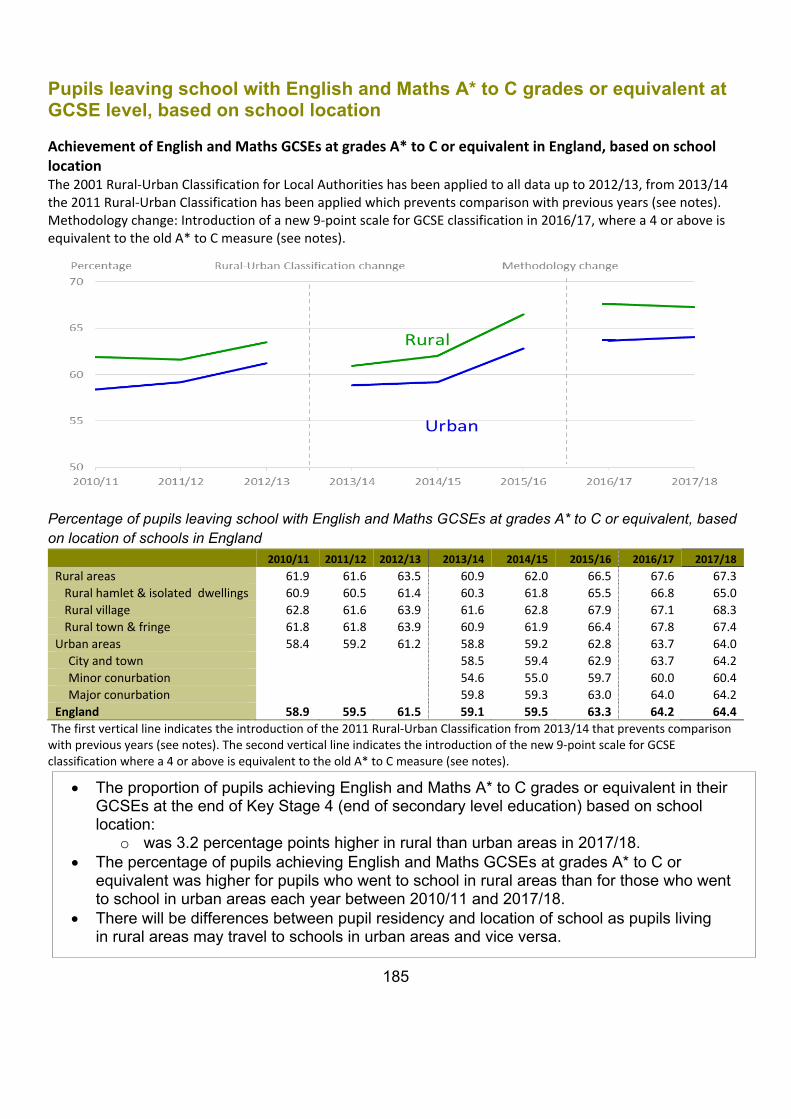
185
Pupils leaving school with English and Maths A* to C grades or equivalent at GCSE level, based on school location
Achievement of English and Maths GCSEs at grades A* to C or equivalent in England, based on school location The 2001 Rural-Urban Classification for Local Authorities has been applied to all data up to 2012/13, from 2013/14 the 2011 Rural-Urban Classification has been applied which prevents comparison with previous years (see notes). Methodology change: Introduction of a new 9-point scale for GCSE classification in 2016/17, where a 4 or above is equivalent to the old A* to C measure (see notes).
Percentage of pupils leaving school with English and Maths GCSEs at grades A* to C or equivalent, based on location of schools in England
2010/11 2011/12 2012/13 2013/14 2014/15 2015/16 2016/17 2017/18 Rural areas 61.9 61.6 63.5 60.9 62.0 66.5 67.6 67.3
Rural hamlet & isolated dwellings 60.9 60.5 61.4 60.3 61.8 65.5 66.8 65.0 Rural village 62.8 61.6 63.9 61.6 62.8 67.9 67.1 68.3 Rural town & fringe 61.8 61.8 63.9 60.9 61.9 66.4 67.8 67.4
Urban areas 58.4 59.2 61.2 58.8 59.2 62.8 63.7 64.0 City and town 58.5 59.4 62.9 63.7 64.2 Minor conurbation 54.6 55.0 59.7 60.0 60.4 Major conurbation 59.8 59.3 63.0 64.0 64.2
England 58.9 59.5 61.5 59.1 59.5 63.3 64.2 64.4 The first vertical line indicates the introduction of the 2011 Rural-Urban Classification from 2013/14 that prevents comparison with previous years (see notes). The second vertical line indicates the introduction of the new 9-point scale for GCSE classification where a 4 or above is equivalent to the old A* to C measure (see notes).
• The proportion of pupils achieving English and Maths A* to C grades or equivalent in their GCSEs at the end of Key Stage 4 (end of secondary level education) based on school location:
o was 3.2 percentage points higher in rural than urban areas in 2017/18. • The percentage of pupils achieving English and Maths GCSEs at grades A* to C or
equivalent was higher for pupils who went to school in rural areas than for those who went to school in urban areas each year between 2010/11 and 2017/18.
• There will be differences between pupil residency and location of school as pupils living in rural areas may travel to schools in urban areas and vice versa.
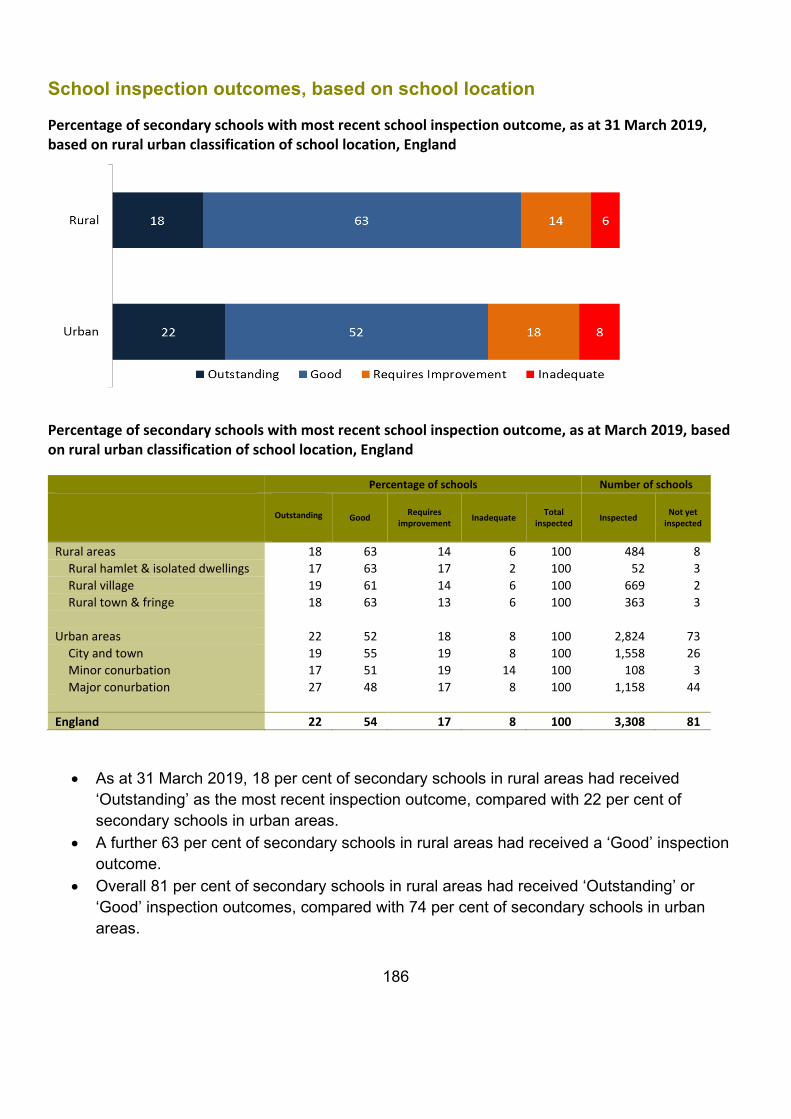
186
School inspection outcomes, based on school location
Percentage of secondary schools with most recent school inspection outcome, as at 31 March 2019, based on rural urban classification of school location, England
Percentage of secondary schools with most recent school inspection outcome, as at March 2019, based on rural urban classification of school location, England
Percentage of schools Number of schools
Outstanding
Good Requires improvement Inadequate Total
inspected Inspected Not yet inspected
Rural areas 18 63 14 6 100 484 8 Rural hamlet & isolated dwellings 17 63 17 2 100 52 3 Rural village 19 61 14 6 100 669 2 Rural town & fringe 18 63 13 6 100 363 3
Urban areas 22 52 18 8 100 2,824 73
City and town 19 55 19 8 100 1,558 26 Minor conurbation 17 51 19 14 100 108 3 Major conurbation 27 48 17 8 100 1,158 44
England 22 54 17 8 100 3,308 81
• As at 31 March 2019, 18 per cent of secondary schools in rural areas had received ‘Outstanding’ as the most recent inspection outcome, compared with 22 per cent of secondary schools in urban areas.
• A further 63 per cent of secondary schools in rural areas had received a ‘Good’ inspection outcome.
• Overall 81 per cent of secondary schools in rural areas had received ‘Outstanding’ or ‘Good’ inspection outcomes, compared with 74 per cent of secondary schools in urban areas.

187
Notes Data includes pupils at the end of Key Stage 4 in each academic year and those taking International GCSEs. Pupils with a missing or incorrect residential postcode have been excluded so percentages for school-location and pupil-location are not the same. A small number of pupils resident in Scotland or Wales who attended a school in England are included in the school-location analysis, but not the pupil-location analysis. The Income Deprivation Affecting Children Index (IDAC) is a subset of the Income of Multiple Deprivation, with the Index showing the proportion of children in each Lower-layer Super Output Area that live in families that are income deprived. IDACI bands are based on 2010 IDACI scores. Information on the latest IDACI can be found at www.gov.uk/government/statistics/english-indices-of-deprivation-2015.
Methodological changes mean that from 2013/14 onwards data aren’t comparable with previous years. This is due to incorporation of the recommendations of Professor Wolf’s independent review of vocational education and new early entry rules. For a summary of these changes, see Quality and methodology information: SFR41/2014, (www.gov.uk/government/uploads/system/uploads/attachment_data/file/366555/SFR41_2014_QualityandMethodology.pdf)
The Department for Education hosts the independent Wolf Report (www.gov.uk/government/publications/review-of-vocational-education-the-wolf-report) and the final progress report (www.gov.uk/government/publications/wolf-recommendations-progress-report).
Source: Department for Education Pupil residency and school location tables: SFR 01/2016, part of Revised GCSE and equivalent results in England: 2014 to 2015 (www.gov.uk/government/statistics/revised-gcse-and-equivalent-results-in-england-2014-to-2015) and table SFR01/2016: GCSE and equivalent results in England 2014/15 (Revised) (www.gov.uk/government/uploads/system/uploads/attachment_data/file/493479/SFR01_2016_Pupil_Residency_and_School_Location_Tables.xls).
Ofsted Schools Management Information: www.gov.uk/government/statistical-data-sets/monthly-management-information-ofsteds-school-inspections-outcomes and Defra analysis. For one secondary school, which had not been inspected, it was not possible to match its location and apply a rural urban classification. It has not been included in the table.
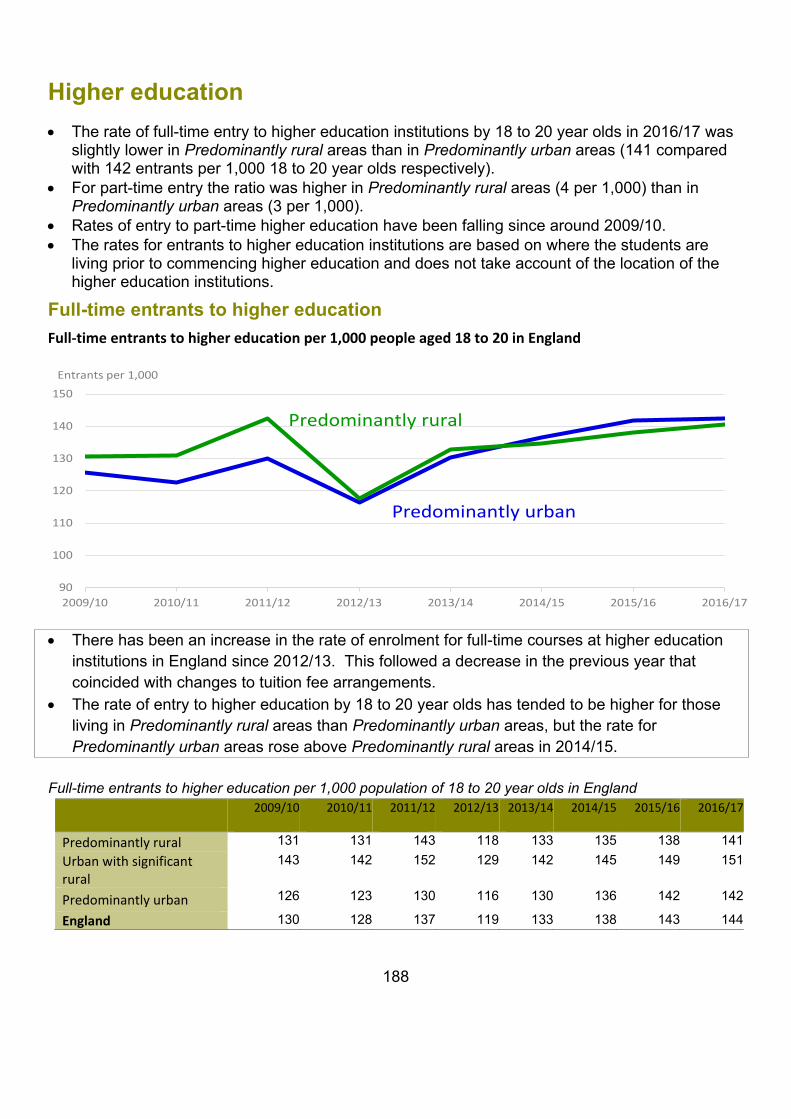
188
Higher education
• The rate of full-time entry to higher education institutions by 18 to 20 year olds in 2016/17 was slightly lower in Predominantly rural areas than in Predominantly urban areas (141 compared with 142 entrants per 1,000 18 to 20 year olds respectively).
• For part-time entry the ratio was higher in Predominantly rural areas (4 per 1,000) than in Predominantly urban areas (3 per 1,000).
• Rates of entry to part-time higher education have been falling since around 2009/10. • The rates for entrants to higher education institutions are based on where the students are
living prior to commencing higher education and does not take account of the location of the higher education institutions.
Full-time entrants to higher education Full-time entrants to higher education per 1,000 people aged 18 to 20 in England
• There has been an increase in the rate of enrolment for full-time courses at higher education
institutions in England since 2012/13. This followed a decrease in the previous year that coincided with changes to tuition fee arrangements.
• The rate of entry to higher education by 18 to 20 year olds has tended to be higher for those living in Predominantly rural areas than Predominantly urban areas, but the rate for Predominantly urban areas rose above Predominantly rural areas in 2014/15.
Full-time entrants to higher education per 1,000 population of 18 to 20 year olds in England
2009/10
2010/11
2011/12
2012/13
2013/14
2014/15 2015/16 2016/17
Predominantly rural 131 131 143 118 133 135 138 141 Urban with significant rural
143 142 152 129 142 145 149 151
Predominantly urban 126 123 130 116 130 136 142 142
England 130 128 137 119 133 138 143 144
90
100
110
120
130
140
150
2009/10 2010/11 2011/12 2012/13 2013/14 2014/15 2015/16 2016/17
Predominantly rural
Predominantly urban
Entrants per 1,000
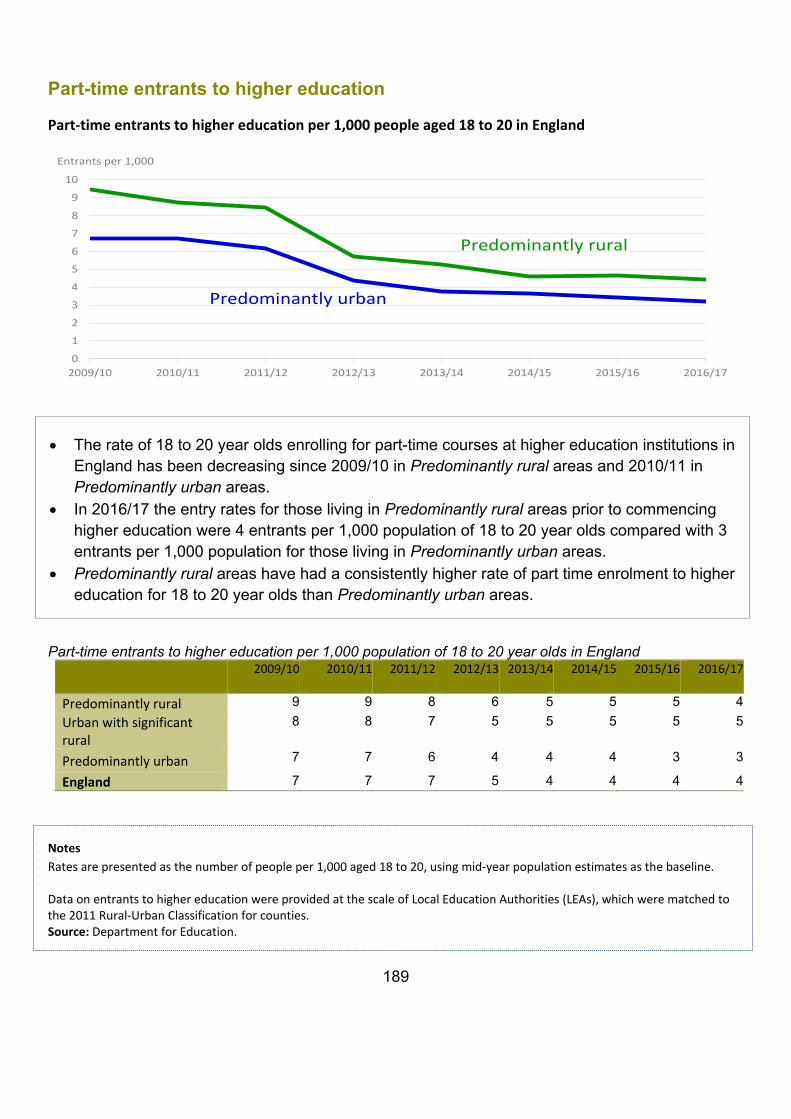
189
Part-time entrants to higher education
Part-time entrants to higher education per 1,000 people aged 18 to 20 in England
• The rate of 18 to 20 year olds enrolling for part-time courses at higher education institutions in England has been decreasing since 2009/10 in Predominantly rural areas and 2010/11 in Predominantly urban areas.
• In 2016/17 the entry rates for those living in Predominantly rural areas prior to commencing higher education were 4 entrants per 1,000 population of 18 to 20 year olds compared with 3 entrants per 1,000 population for those living in Predominantly urban areas.
• Predominantly rural areas have had a consistently higher rate of part time enrolment to higher education for 18 to 20 year olds than Predominantly urban areas.
Part-time entrants to higher education per 1,000 population of 18 to 20 year olds in England
2009/10
2010/11
2011/12
2012/13
2013/14
2014/15 2015/16 2016/17
Predominantly rural 9 9 8 6 5 5 5 4 Urban with significant rural
8 8 7 5 5 5 5 5
Predominantly urban 7 7 6 4 4 4 3 3
England 7 7 7 5 4 4 4 4
Notes Rates are presented as the number of people per 1,000 aged 18 to 20, using mid-year population estimates as the baseline. Data on entrants to higher education were provided at the scale of Local Education Authorities (LEAs), which were matched to the 2011 Rural-Urban Classification for counties. Source: Department for Education.
0
1
2
3
4
5
6
7
8
9
10
2009/10 2010/11 2011/12 2012/13 2013/14 2014/15 2015/16 2016/17
Predominantly rural
Predominantly urban
Entrants per 1,000
190
Skills The skills detailed in this section are National Vocational Qualification (NVQ) Level 2 and above – which is equivalent to 5 General Certificates of Secondary Education (GCSE) at Grade A-C, NVQ4 and above –which measures qualifications at Higher National Certificate (HNC), Higher National Diploma (HND) or degree level and people with at least one qualification- including GCSEs at Grade D or E.
Many people who live in rural areas will travel to urban areas for work and the skills that these people have are most likely to be utilised in their place of work rather than in the rural areas where they live.
Workplace based skills
• When skill levels are looked at from a workplace based perspective, a higher proportion of
people working in predominantly urban areas have qualifications at NVQ4 or above than those working in predominantly rural areas. One reason for this is that businesses that can utilise these skills are based in urban areas where they can benefit from better infrastructure and a larger potential workforce.
• The proportion of working age population with at least one qualification was similar for those working in predominantly rural areas and in predominantly urban areas, but the proportion for predominantly rural areas was higher in 2 of the last 3 years. In 2019 the proportions of working age population with at least one qualification was 95.7 per cent and 95.4 per cent for predominantly rural areas and predominantly urban areas respectively.
• In 2019, the proportion of working age population with NVQ Level 2 or above working in
predominantly rural areas was 77.9 per cent which was lower than predominantly urban areas at 80.4 per cent.
• In 2019, the proportion of working age population with NVQ Level 4 or above working in
predominantly rural areas was 37.3 per cent, which was lower than the 47.8 per cent of people working in predominantly urban areas.
• In 2019, the proportion of employees, self-employed people and trainees who had received
on the job training in the previous 4 weeks working in predominantly rural areas was 12.9 per cent compared with 13.5 per cent in predominantly urban areas.
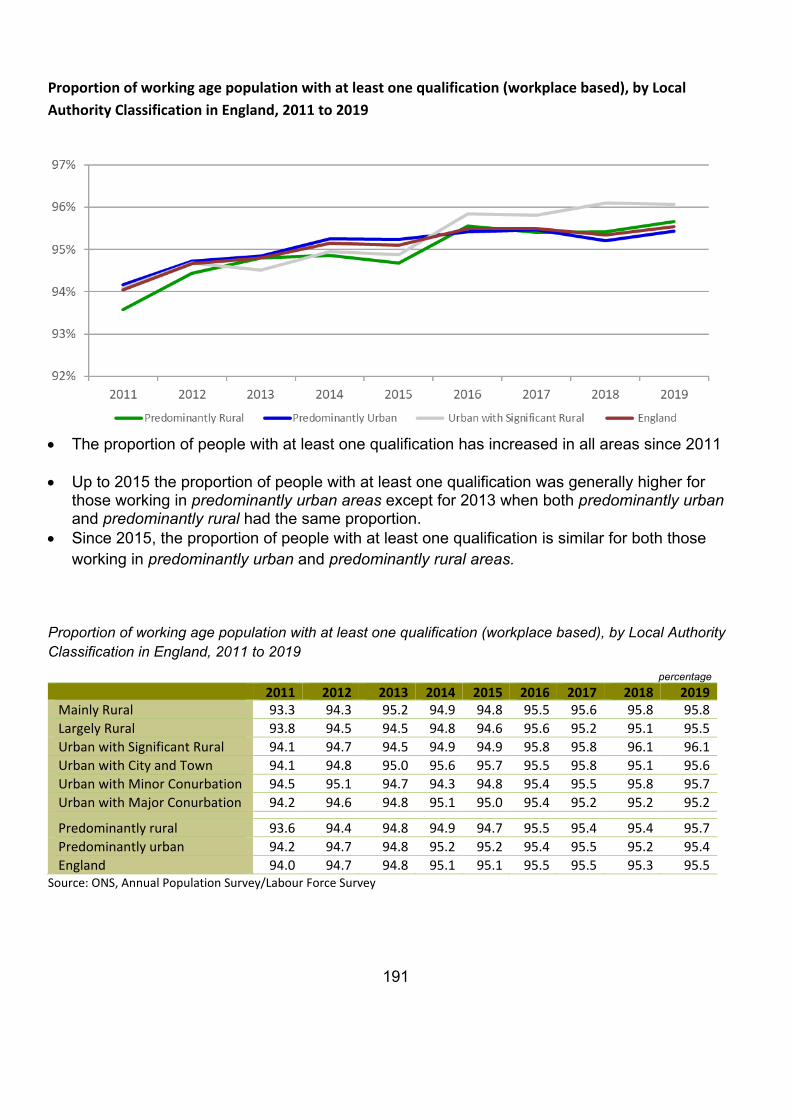
191
Proportion of working age population with at least one qualification (workplace based), by Local Authority Classification in England, 2011 to 2019
• The proportion of people with at least one qualification has increased in all areas since 2011 • Up to 2015 the proportion of people with at least one qualification was generally higher for
those working in predominantly urban areas except for 2013 when both predominantly urban and predominantly rural had the same proportion.
• Since 2015, the proportion of people with at least one qualification is similar for both those working in predominantly urban and predominantly rural areas.
Proportion of working age population with at least one qualification (workplace based), by Local Authority Classification in England, 2011 to 2019
percentage 2011 2012 2013 2014 2015 2016 2017 2018 2019 Mainly Rural 93.3 94.3 95.2 94.9 94.8 95.5 95.6 95.8 95.8 Largely Rural 93.8 94.5 94.5 94.8 94.6 95.6 95.2 95.1 95.5 Urban with Significant Rural 94.1 94.7 94.5 94.9 94.9 95.8 95.8 96.1 96.1 Urban with City and Town 94.1 94.8 95.0 95.6 95.7 95.5 95.8 95.1 95.6 Urban with Minor Conurbation 94.5 95.1 94.7 94.3 94.8 95.4 95.5 95.8 95.7 Urban with Major Conurbation 94.2 94.6 94.8 95.1 95.0 95.4 95.2 95.2 95.2
Predominantly rural 93.6 94.4 94.8 94.9 94.7 95.5 95.4 95.4 95.7 Predominantly urban 94.2 94.7 94.8 95.2 95.2 95.4 95.5 95.2 95.4 England 94.0 94.7 94.8 95.1 95.1 95.5 95.5 95.3 95.5
Source: ONS, Annual Population Survey/Labour Force Survey
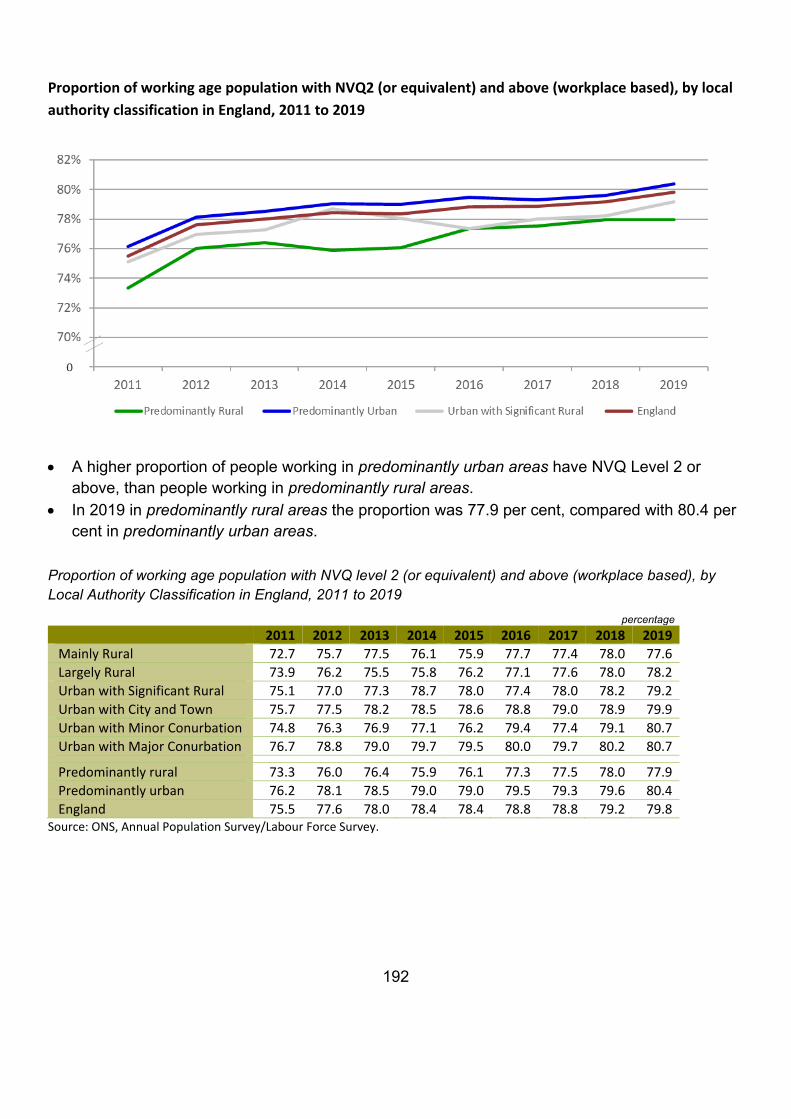
192
Proportion of working age population with NVQ2 (or equivalent) and above (workplace based), by local authority classification in England, 2011 to 2019
• A higher proportion of people working in predominantly urban areas have NVQ Level 2 or
above, than people working in predominantly rural areas. • In 2019 in predominantly rural areas the proportion was 77.9 per cent, compared with 80.4 per
cent in predominantly urban areas.
Proportion of working age population with NVQ level 2 (or equivalent) and above (workplace based), by Local Authority Classification in England, 2011 to 2019
percentage 2011 2012 2013 2014 2015 2016 2017 2018 2019 Mainly Rural 72.7 75.7 77.5 76.1 75.9 77.7 77.4 78.0 77.6 Largely Rural 73.9 76.2 75.5 75.8 76.2 77.1 77.6 78.0 78.2 Urban with Significant Rural 75.1 77.0 77.3 78.7 78.0 77.4 78.0 78.2 79.2 Urban with City and Town 75.7 77.5 78.2 78.5 78.6 78.8 79.0 78.9 79.9 Urban with Minor Conurbation 74.8 76.3 76.9 77.1 76.2 79.4 77.4 79.1 80.7 Urban with Major Conurbation 76.7 78.8 79.0 79.7 79.5 80.0 79.7 80.2 80.7
Predominantly rural 73.3 76.0 76.4 75.9 76.1 77.3 77.5 78.0 77.9 Predominantly urban 76.2 78.1 78.5 79.0 79.0 79.5 79.3 79.6 80.4 England 75.5 77.6 78.0 78.4 78.4 78.8 78.8 79.2 79.8
Source: ONS, Annual Population Survey/Labour Force Survey.
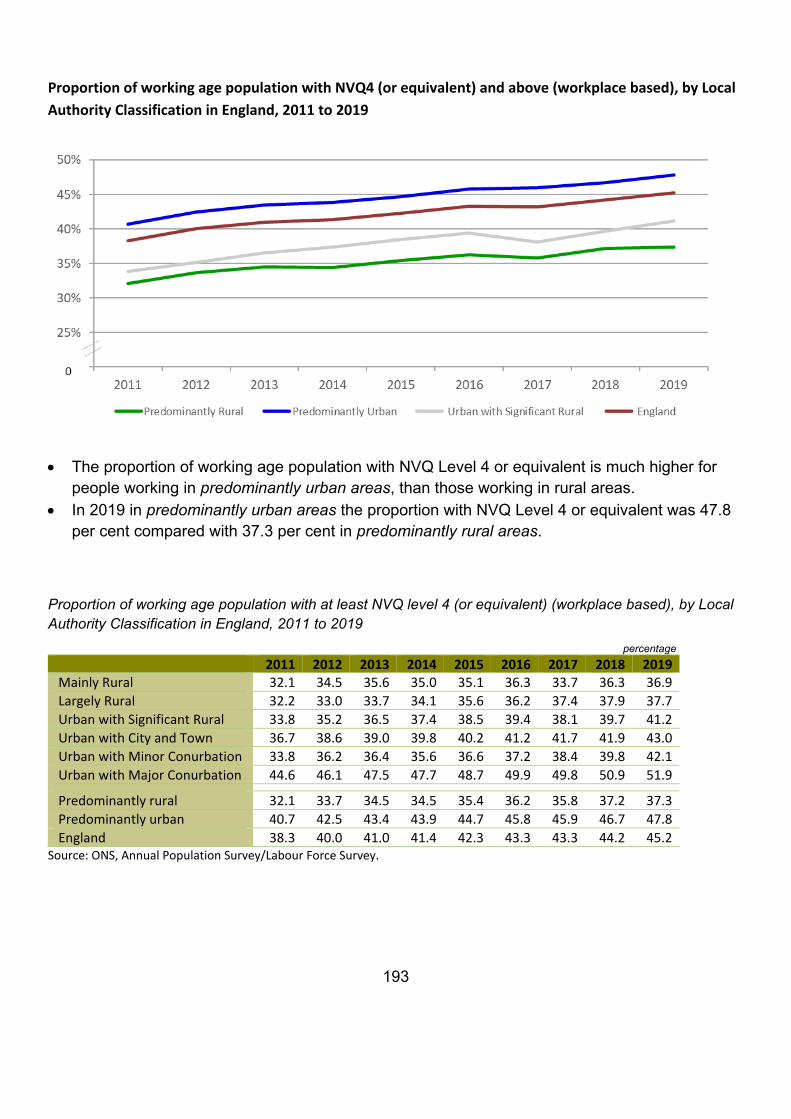
193
Proportion of working age population with NVQ4 (or equivalent) and above (workplace based), by Local Authority Classification in England, 2011 to 2019
• The proportion of working age population with NVQ Level 4 or equivalent is much higher for
people working in predominantly urban areas, than those working in rural areas. • In 2019 in predominantly urban areas the proportion with NVQ Level 4 or equivalent was 47.8
per cent compared with 37.3 per cent in predominantly rural areas.
Proportion of working age population with at least NVQ level 4 (or equivalent) (workplace based), by Local Authority Classification in England, 2011 to 2019
percentage 2011 2012 2013 2014 2015 2016 2017 2018 2019 Mainly Rural 32.1 34.5 35.6 35.0 35.1 36.3 33.7 36.3 36.9 Largely Rural 32.2 33.0 33.7 34.1 35.6 36.2 37.4 37.9 37.7 Urban with Significant Rural 33.8 35.2 36.5 37.4 38.5 39.4 38.1 39.7 41.2 Urban with City and Town 36.7 38.6 39.0 39.8 40.2 41.2 41.7 41.9 43.0 Urban with Minor Conurbation 33.8 36.2 36.4 35.6 36.6 37.2 38.4 39.8 42.1 Urban with Major Conurbation 44.6 46.1 47.5 47.7 48.7 49.9 49.8 50.9 51.9
Predominantly rural 32.1 33.7 34.5 34.5 35.4 36.2 35.8 37.2 37.3 Predominantly urban 40.7 42.5 43.4 43.9 44.7 45.8 45.9 46.7 47.8 England 38.3 40.0 41.0 41.4 42.3 43.3 43.3 44.2 45.2
Source: ONS, Annual Population Survey/Labour Force Survey.
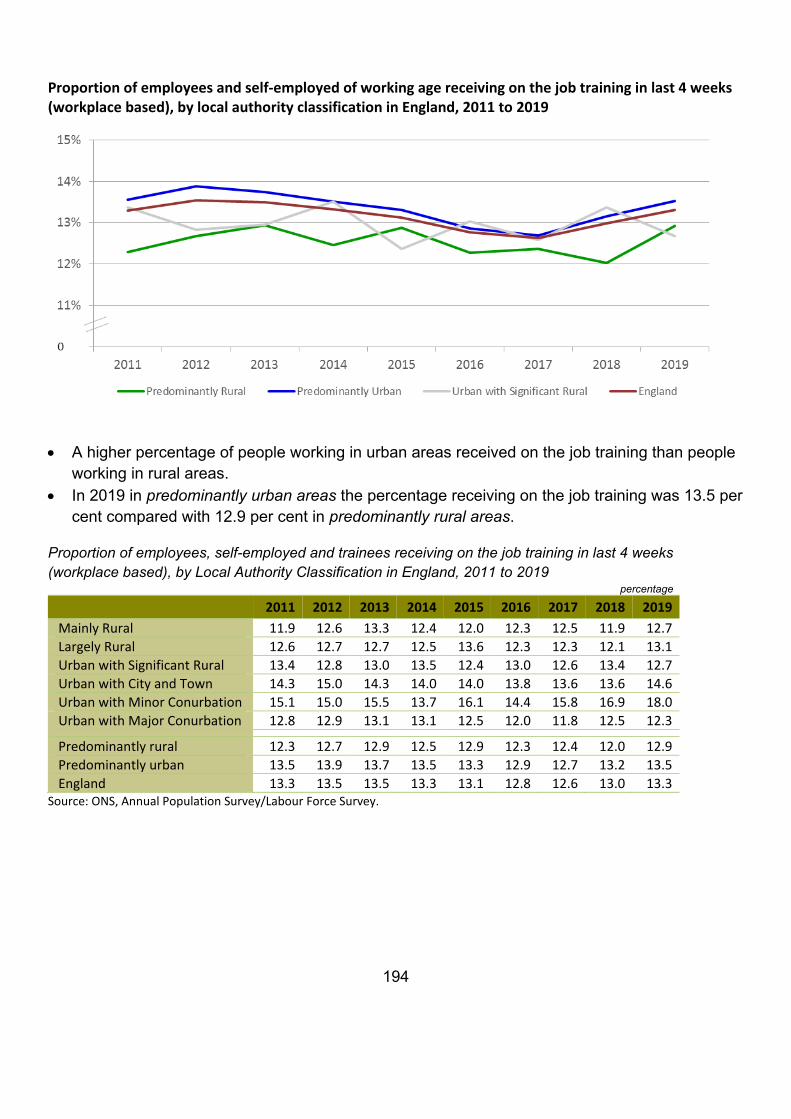
194
Proportion of employees and self-employed of working age receiving on the job training in last 4 weeks (workplace based), by local authority classification in England, 2011 to 2019
• A higher percentage of people working in urban areas received on the job training than people
working in rural areas. • In 2019 in predominantly urban areas the percentage receiving on the job training was 13.5 per
cent compared with 12.9 per cent in predominantly rural areas.
Proportion of employees, self-employed and trainees receiving on the job training in last 4 weeks (workplace based), by Local Authority Classification in England, 2011 to 2019
percentage
2011 2012 2013 2014 2015 2016 2017 2018 2019 Mainly Rural 11.9 12.6 13.3 12.4 12.0 12.3 12.5 11.9 12.7 Largely Rural 12.6 12.7 12.7 12.5 13.6 12.3 12.3 12.1 13.1 Urban with Significant Rural 13.4 12.8 13.0 13.5 12.4 13.0 12.6 13.4 12.7 Urban with City and Town 14.3 15.0 14.3 14.0 14.0 13.8 13.6 13.6 14.6 Urban with Minor Conurbation 15.1 15.0 15.5 13.7 16.1 14.4 15.8 16.9 18.0 Urban with Major Conurbation 12.8 12.9 13.1 13.1 12.5 12.0 11.8 12.5 12.3
Predominantly rural 12.3 12.7 12.9 12.5 12.9 12.3 12.4 12.0 12.9 Predominantly urban 13.5 13.9 13.7 13.5 13.3 12.9 12.7 13.2 13.5 England 13.3 13.5 13.5 13.3 13.1 12.8 12.6 13.0 13.3
Source: ONS, Annual Population Survey/Labour Force Survey.
195
Residence based skills
• When comparing rural and urban areas overall, the proportion of working age population with at least one qualification has been consistently highest in rural areas for the last nine years. In 2019, 96.6 per cent of working age people living in all rural areas had at least one qualification compared to 95.0 per cent in all urban areas.
• The proportion of working age population with NVQ2 or above was consistently higher for people living in rural areas than for those living in the urban areas for the last nine years.
• The proportion of working age population with NVQ4 was consistently higher for people living in rural areas between 2012 and 2016, between 2017 and 2019 the proportion for urban areas rose above that for rural areas.
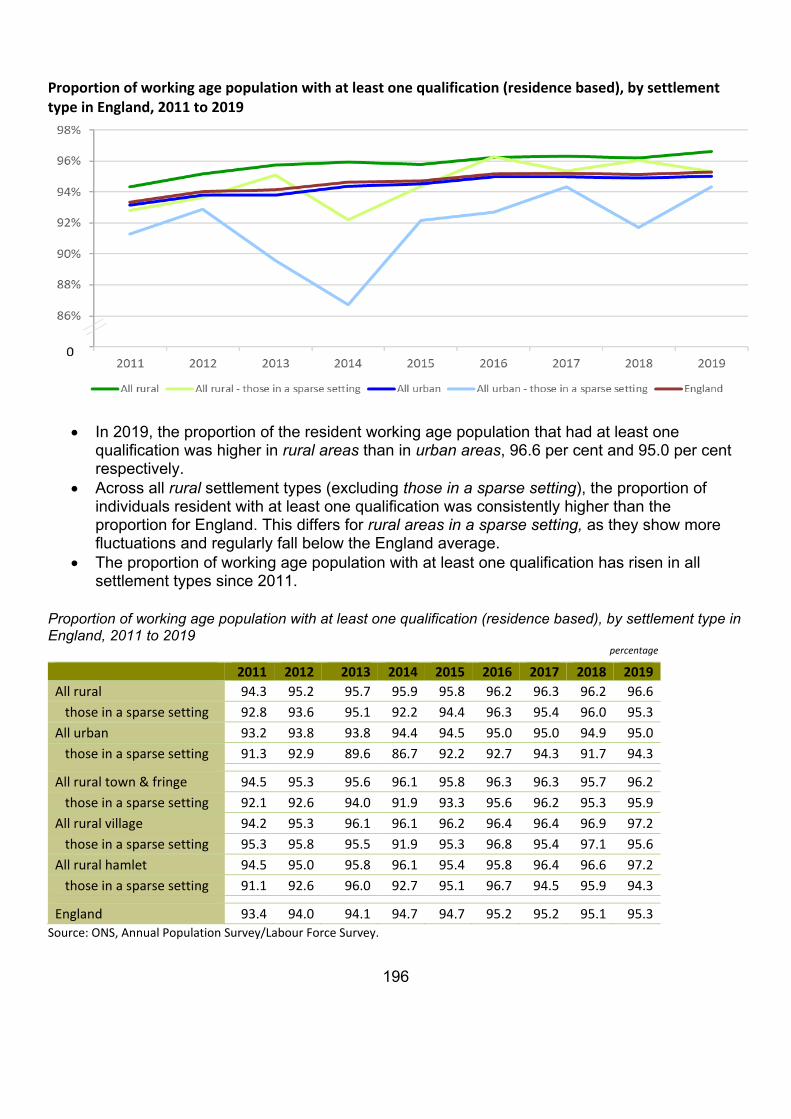
196
Proportion of working age population with at least one qualification (residence based), by settlement type in England, 2011 to 2019
• In 2019, the proportion of the resident working age population that had at least one qualification was higher in rural areas than in urban areas, 96.6 per cent and 95.0 per cent respectively.
• Across all rural settlement types (excluding those in a sparse setting), the proportion of individuals resident with at least one qualification was consistently higher than the proportion for England. This differs for rural areas in a sparse setting, as they show more fluctuations and regularly fall below the England average.
• The proportion of working age population with at least one qualification has risen in all settlement types since 2011.
Proportion of working age population with at least one qualification (residence based), by settlement type in England, 2011 to 2019
percentage
2011 2012 2013 2014 2015 2016 2017 2018 2019 All rural 94.3 95.2 95.7 95.9 95.8 96.2 96.3 96.2 96.6 those in a sparse setting 92.8 93.6 95.1 92.2 94.4 96.3 95.4 96.0 95.3 All urban 93.2 93.8 93.8 94.4 94.5 95.0 95.0 94.9 95.0 those in a sparse setting 91.3 92.9 89.6 86.7 92.2 92.7 94.3 91.7 94.3 All rural town & fringe 94.5 95.3 95.6 96.1 95.8 96.3 96.3 95.7 96.2 those in a sparse setting 92.1 92.6 94.0 91.9 93.3 95.6 96.2 95.3 95.9 All rural village 94.2 95.3 96.1 96.1 96.2 96.4 96.4 96.9 97.2 those in a sparse setting 95.3 95.8 95.5 91.9 95.3 96.8 95.4 97.1 95.6 All rural hamlet 94.5 95.0 95.8 96.1 95.4 95.8 96.4 96.6 97.2 those in a sparse setting 91.1 92.6 96.0 92.7 95.1 96.7 94.5 95.9 94.3 England 93.4 94.0 94.1 94.7 94.7 95.2 95.2 95.1 95.3
Source: ONS, Annual Population Survey/Labour Force Survey.
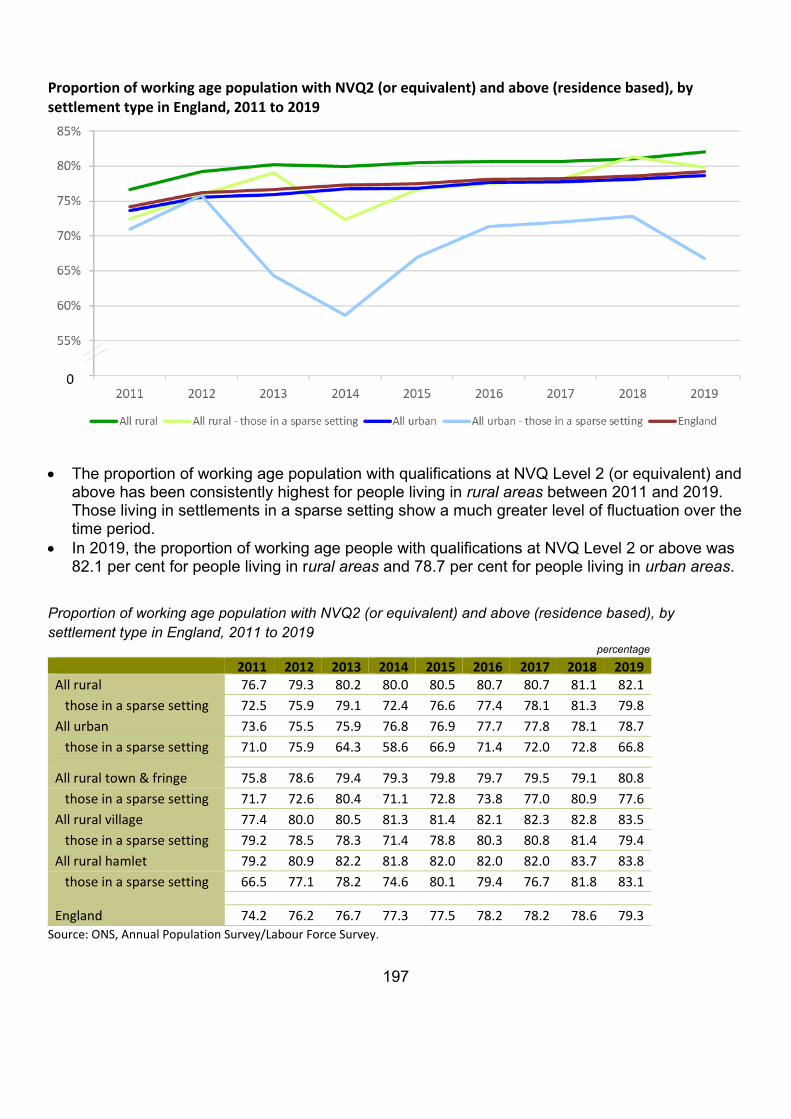
197
Proportion of working age population with NVQ2 (or equivalent) and above (residence based), by settlement type in England, 2011 to 2019
• The proportion of working age population with qualifications at NVQ Level 2 (or equivalent) and
above has been consistently highest for people living in rural areas between 2011 and 2019. Those living in settlements in a sparse setting show a much greater level of fluctuation over the time period.
• In 2019, the proportion of working age people with qualifications at NVQ Level 2 or above was 82.1 per cent for people living in rural areas and 78.7 per cent for people living in urban areas.
Proportion of working age population with NVQ2 (or equivalent) and above (residence based), by settlement type in England, 2011 to 2019 percentage
2011 2012 2013 2014 2015 2016 2017 2018 2019 All rural 76.7 79.3 80.2 80.0 80.5 80.7 80.7 81.1 82.1 those in a sparse setting 72.5 75.9 79.1 72.4 76.6 77.4 78.1 81.3 79.8 All urban 73.6 75.5 75.9 76.8 76.9 77.7 77.8 78.1 78.7 those in a sparse setting 71.0 75.9 64.3 58.6 66.9 71.4 72.0 72.8 66.8 All rural town & fringe 75.8 78.6 79.4 79.3 79.8 79.7 79.5 79.1 80.8 those in a sparse setting 71.7 72.6 80.4 71.1 72.8 73.8 77.0 80.9 77.6 All rural village 77.4 80.0 80.5 81.3 81.4 82.1 82.3 82.8 83.5 those in a sparse setting 79.2 78.5 78.3 71.4 78.8 80.3 80.8 81.4 79.4 All rural hamlet 79.2 80.9 82.2 81.8 82.0 82.0 82.0 83.7 83.8 those in a sparse setting 66.5 77.1 78.2 74.6 80.1 79.4 76.7 81.8 83.1 England 74.2 76.2 76.7 77.3 77.5 78.2 78.2 78.6 79.3
Source: ONS, Annual Population Survey/Labour Force Survey.
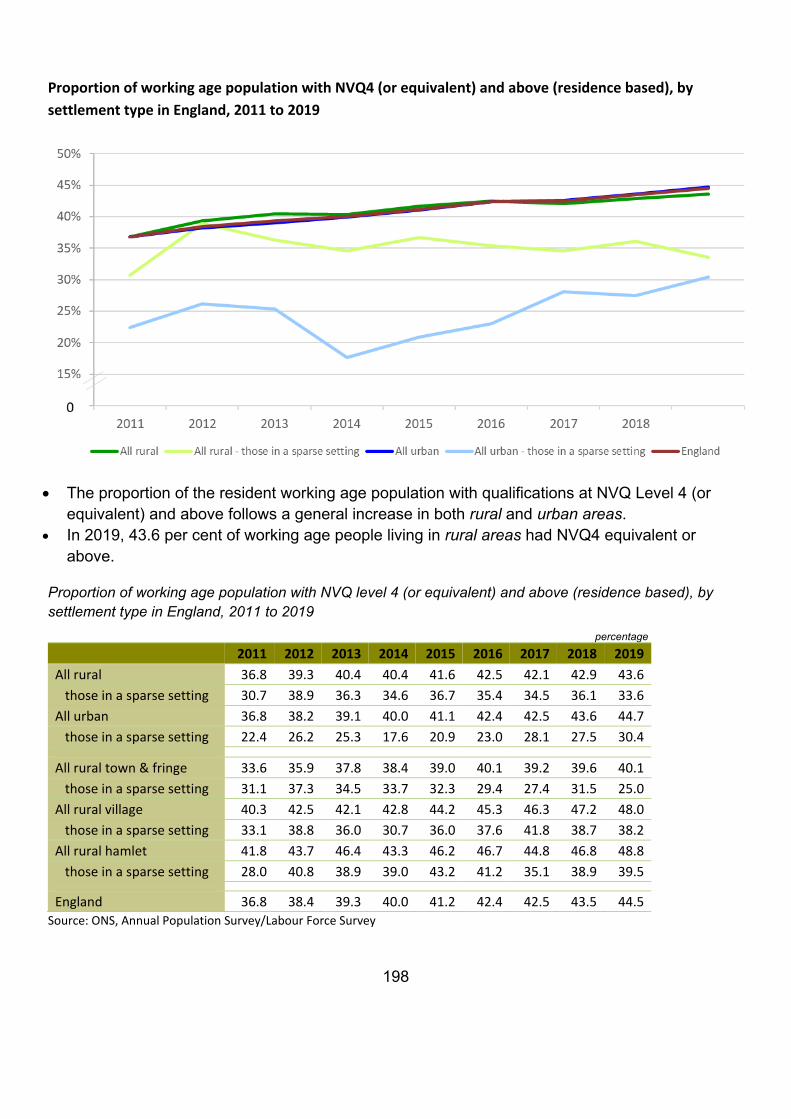
198
Proportion of working age population with NVQ4 (or equivalent) and above (residence based), by settlement type in England, 2011 to 2019
• The proportion of the resident working age population with qualifications at NVQ Level 4 (or
equivalent) and above follows a general increase in both rural and urban areas. • In 2019, 43.6 per cent of working age people living in rural areas had NVQ4 equivalent or
above.
Proportion of working age population with NVQ level 4 (or equivalent) and above (residence based), by settlement type in England, 2011 to 2019
percentage
2011 2012 2013 2014 2015 2016 2017 2018 2019 All rural 36.8 39.3 40.4 40.4 41.6 42.5 42.1 42.9 43.6 those in a sparse setting 30.7 38.9 36.3 34.6 36.7 35.4 34.5 36.1 33.6 All urban 36.8 38.2 39.1 40.0 41.1 42.4 42.5 43.6 44.7 those in a sparse setting 22.4 26.2 25.3 17.6 20.9 23.0 28.1 27.5 30.4 All rural town & fringe 33.6 35.9 37.8 38.4 39.0 40.1 39.2 39.6 40.1 those in a sparse setting 31.1 37.3 34.5 33.7 32.3 29.4 27.4 31.5 25.0 All rural village 40.3 42.5 42.1 42.8 44.2 45.3 46.3 47.2 48.0 those in a sparse setting 33.1 38.8 36.0 30.7 36.0 37.6 41.8 38.7 38.2 All rural hamlet 41.8 43.7 46.4 43.3 46.2 46.7 44.8 46.8 48.8 those in a sparse setting 28.0 40.8 38.9 39.0 43.2 41.2 35.1 38.9 39.5 England 36.8 38.4 39.3 40.0 41.2 42.4 42.5 43.5 44.5
Source: ONS, Annual Population Survey/Labour Force Survey
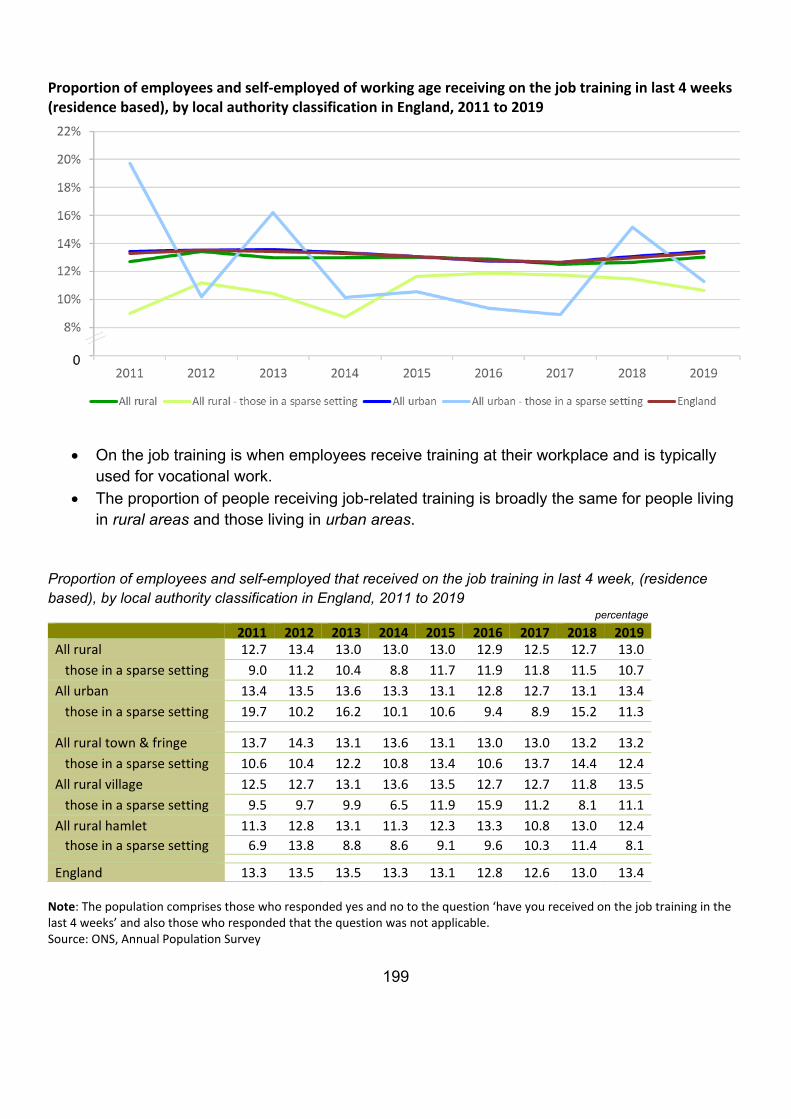
199
Proportion of employees and self-employed of working age receiving on the job training in last 4 weeks (residence based), by local authority classification in England, 2011 to 2019
• On the job training is when employees receive training at their workplace and is typically
used for vocational work. • The proportion of people receiving job-related training is broadly the same for people living
in rural areas and those living in urban areas. Proportion of employees and self-employed that received on the job training in last 4 week, (residence based), by local authority classification in England, 2011 to 2019
percentage
2011 2012 2013 2014 2015 2016 2017 2018 2019 All rural 12.7 13.4 13.0 13.0 13.0 12.9 12.5 12.7 13.0 those in a sparse setting 9.0 11.2 10.4 8.8 11.7 11.9 11.8 11.5 10.7 All urban 13.4 13.5 13.6 13.3 13.1 12.8 12.7 13.1 13.4 those in a sparse setting 19.7 10.2 16.2 10.1 10.6 9.4 8.9 15.2 11.3 All rural town & fringe 13.7 14.3 13.1 13.6 13.1 13.0 13.0 13.2 13.2 those in a sparse setting 10.6 10.4 12.2 10.8 13.4 10.6 13.7 14.4 12.4 All rural village 12.5 12.7 13.1 13.6 13.5 12.7 12.7 11.8 13.5 those in a sparse setting 9.5 9.7 9.9 6.5 11.9 15.9 11.2 8.1 11.1 All rural hamlet 11.3 12.8 13.1 11.3 12.3 13.3 10.8 13.0 12.4 those in a sparse setting 6.9 13.8 8.8 8.6 9.1 9.6 10.3 11.4 8.1
England 13.3 13.5 13.5 13.3 13.1 12.8 12.6 13.0 13.4 Note: The population comprises those who responded yes and no to the question ‘have you received on the job training in the last 4 weeks’ and also those who responded that the question was not applicable. Source: ONS, Annual Population Survey
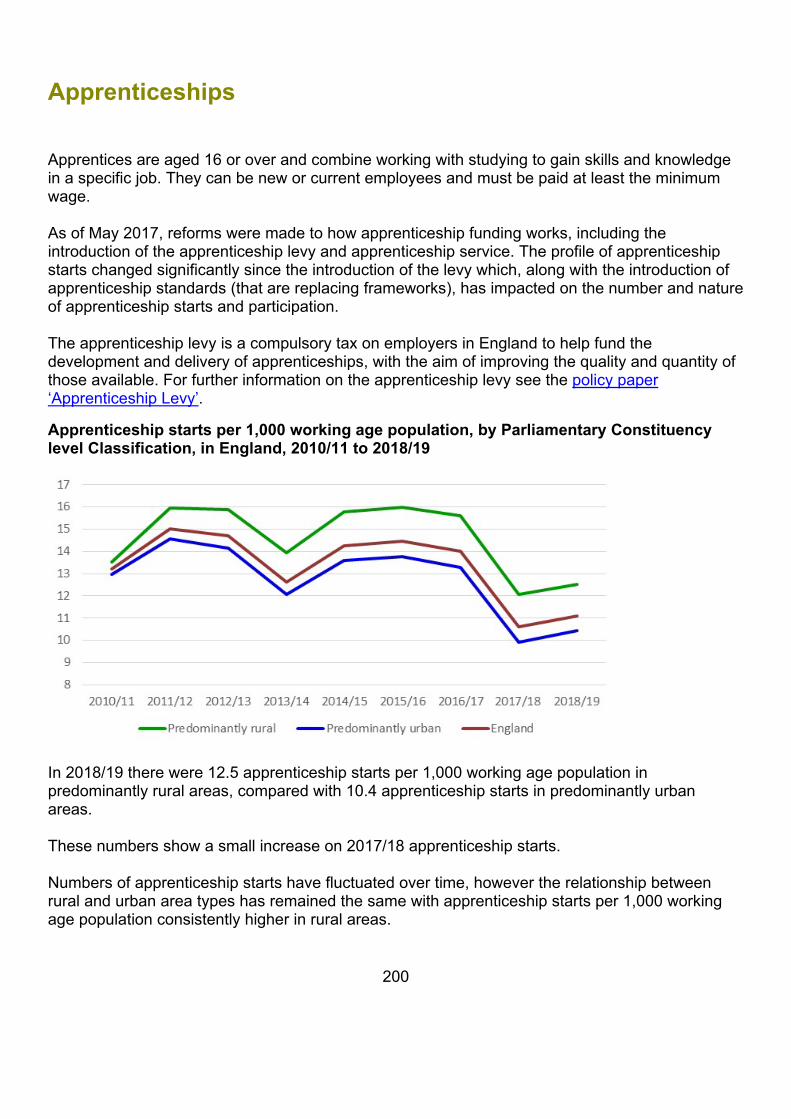
200
Apprenticeships
Apprentices are aged 16 or over and combine working with studying to gain skills and knowledge in a specific job. They can be new or current employees and must be paid at least the minimum wage. As of May 2017, reforms were made to how apprenticeship funding works, including the introduction of the apprenticeship levy and apprenticeship service. The profile of apprenticeship starts changed significantly since the introduction of the levy which, along with the introduction of apprenticeship standards (that are replacing frameworks), has impacted on the number and nature of apprenticeship starts and participation. The apprenticeship levy is a compulsory tax on employers in England to help fund the development and delivery of apprenticeships, with the aim of improving the quality and quantity of those available. For further information on the apprenticeship levy see the policy paper ‘Apprenticeship Levy’.
Apprenticeship starts per 1,000 working age population, by Parliamentary Constituency level Classification, in England, 2010/11 to 2018/19
In 2018/19 there were 12.5 apprenticeship starts per 1,000 working age population in predominantly rural areas, compared with 10.4 apprenticeship starts in predominantly urban areas. These numbers show a small increase on 2017/18 apprenticeship starts. Numbers of apprenticeship starts have fluctuated over time, however the relationship between rural and urban area types has remained the same with apprenticeship starts per 1,000 working age population consistently higher in rural areas.
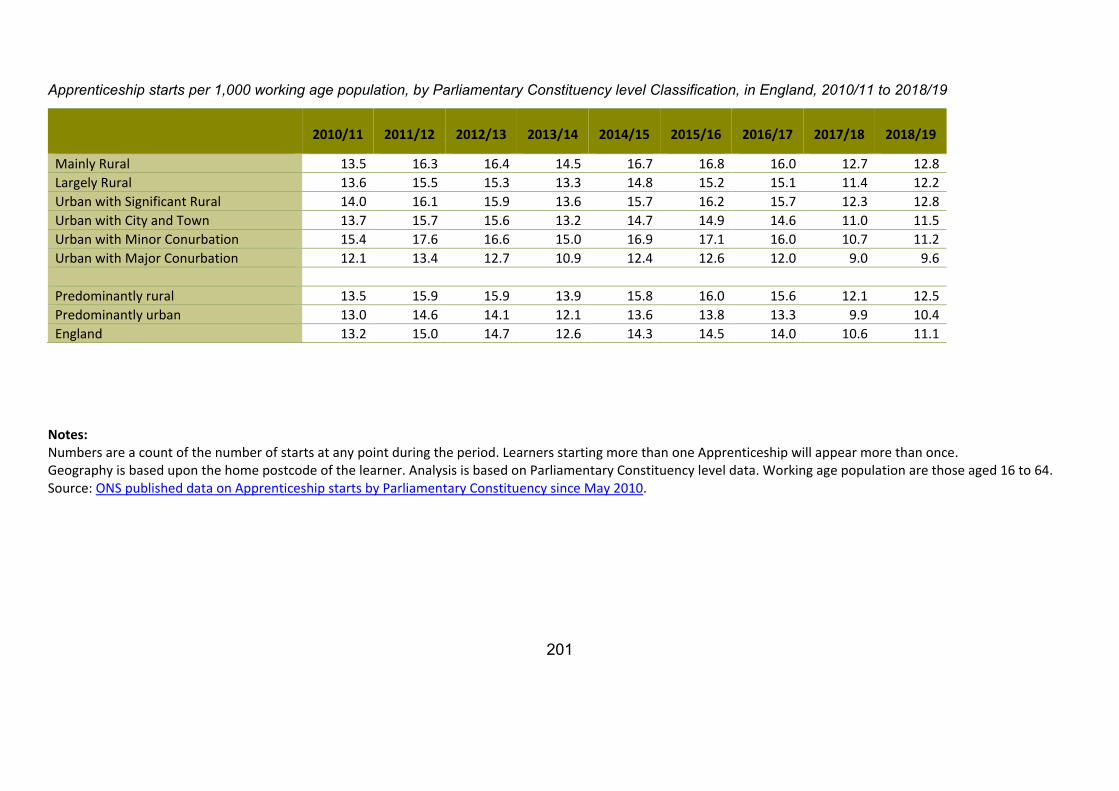
201
Apprenticeship starts per 1,000 working age population, by Parliamentary Constituency level Classification, in England, 2010/11 to 2018/19
2010/11 2011/12 2012/13 2013/14 2014/15 2015/16 2016/17 2017/18 2018/19
Mainly Rural 13.5 16.3 16.4 14.5 16.7 16.8 16.0 12.7 12.8 Largely Rural 13.6 15.5 15.3 13.3 14.8 15.2 15.1 11.4 12.2 Urban with Significant Rural 14.0 16.1 15.9 13.6 15.7 16.2 15.7 12.3 12.8 Urban with City and Town 13.7 15.7 15.6 13.2 14.7 14.9 14.6 11.0 11.5 Urban with Minor Conurbation 15.4 17.6 16.6 15.0 16.9 17.1 16.0 10.7 11.2 Urban with Major Conurbation 12.1 13.4 12.7 10.9 12.4 12.6 12.0 9.0 9.6 Predominantly rural 13.5 15.9 15.9 13.9 15.8 16.0 15.6 12.1 12.5 Predominantly urban 13.0 14.6 14.1 12.1 13.6 13.8 13.3 9.9 10.4 England 13.2 15.0 14.7 12.6 14.3 14.5 14.0 10.6 11.1
Notes: Numbers are a count of the number of starts at any point during the period. Learners starting more than one Apprenticeship will appear more than once. Geography is based upon the home postcode of the learner. Analysis is based on Parliamentary Constituency level data. Working age population are those aged 16 to 64. Source: ONS published data on Apprenticeship starts by Parliamentary Constituency since May 2010.
202
Health and Wellbeing • Average life expectancy was highest in Mainly Rural areas: On average, people born
in Mainly Rural areas in 2016-18 are expected to live two years longer than people born in Urban with Minor Conurbation areas.
• The average life expectancy in 2016-18 was 79.6 years for men and 83.2 years for women in England.
• Potential years of life lost (PYLL) from all causes of death was lower in predominantly rural areas than predominantly urban areas. For the period 2016-2018, the highest rate of PYLL was in Urban with Minor Conurbation areas at 478 years of life lost per 10,000 population. The lowest rate of PYLL was in Mainly Rural areas, at 371 years of life lost per 10,000 population.
• Infant mortality is lower in rural areas than in urban areas: In 2015, the infant mortality rate in rural areas was 3.1 deaths per 1,000 live births, compared with 4.0 deaths per 1,000 live births in urban areas.
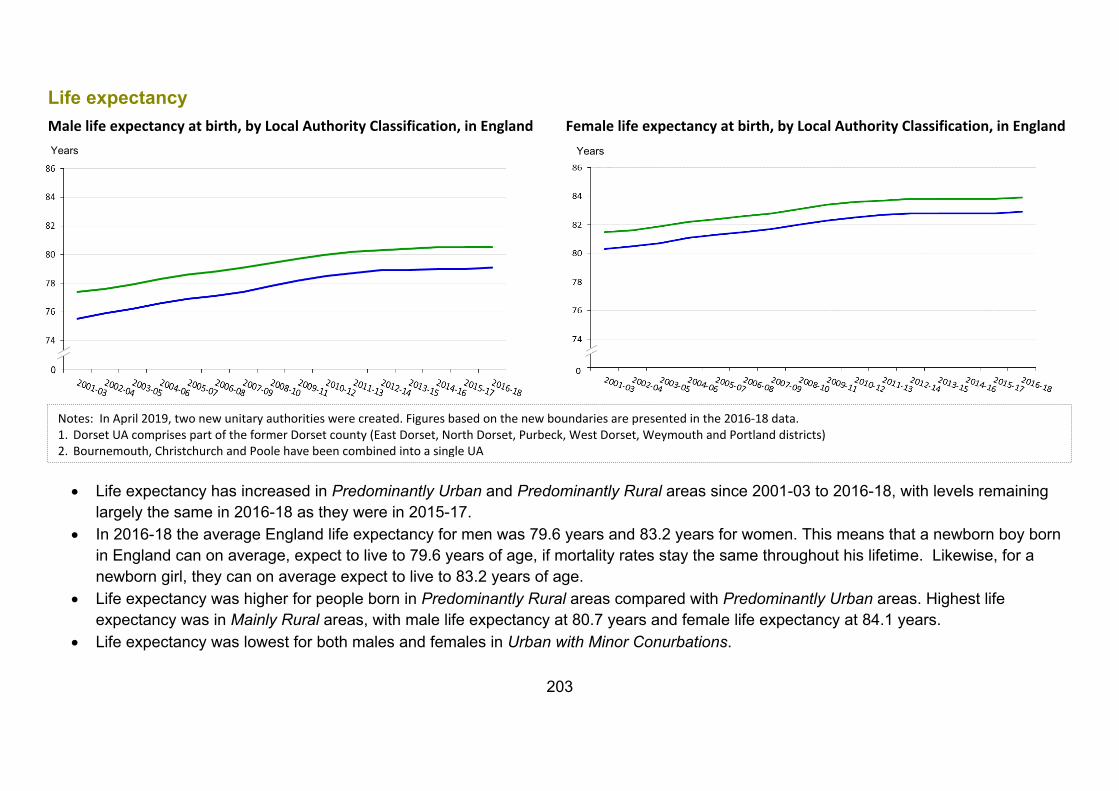
203
Life expectancy Male life expectancy at birth, by Local Authority Classification, in England Female life expectancy at birth, by Local Authority Classification, in England
• Life expectancy has increased in Predominantly Urban and Predominantly Rural areas since 2001-03 to 2016-18, with levels remaining largely the same in 2016-18 as they were in 2015-17.
• In 2016-18 the average England life expectancy for men was 79.6 years and 83.2 years for women. This means that a newborn boy born in England can on average, expect to live to 79.6 years of age, if mortality rates stay the same throughout his lifetime. Likewise, for a newborn girl, they can on average expect to live to 83.2 years of age.
• Life expectancy was higher for people born in Predominantly Rural areas compared with Predominantly Urban areas. Highest life expectancy was in Mainly Rural areas, with male life expectancy at 80.7 years and female life expectancy at 84.1 years.
• Life expectancy was lowest for both males and females in Urban with Minor Conurbations.
Years
Years
Notes: In April 2019, two new unitary authorities were created. Figures based on the new boundaries are presented in the 2016-18 data. 1. Dorset UA comprises part of the former Dorset county (East Dorset, North Dorset, Purbeck, West Dorset, Weymouth and Portland districts) 2. Bournemouth, Christchurch and Poole have been combined into a single UA
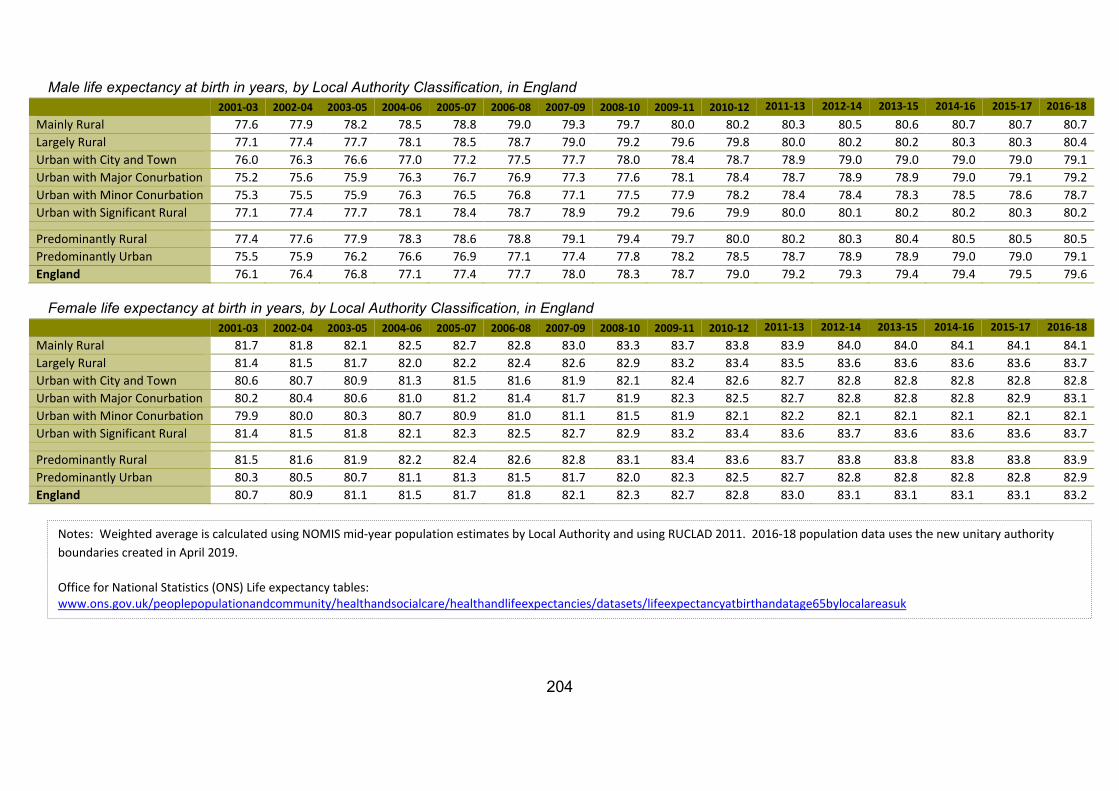
204
Male life expectancy at birth in years, by Local Authority Classification, in England 2001-03 2002-04 2003-05 2004-06 2005-07 2006-08 2007-09 2008-10 2009-11 2010-12 2011-13 2012-14 2013-15 2014-16 2015-17 2016-18 Mainly Rural 77.6 77.9 78.2 78.5 78.8 79.0 79.3 79.7 80.0 80.2 80.3 80.5 80.6 80.7 80.7 80.7 Largely Rural 77.1 77.4 77.7 78.1 78.5 78.7 79.0 79.2 79.6 79.8 80.0 80.2 80.2 80.3 80.3 80.4 Urban with City and Town 76.0 76.3 76.6 77.0 77.2 77.5 77.7 78.0 78.4 78.7 78.9 79.0 79.0 79.0 79.0 79.1 Urban with Major Conurbation 75.2 75.6 75.9 76.3 76.7 76.9 77.3 77.6 78.1 78.4 78.7 78.9 78.9 79.0 79.1 79.2 Urban with Minor Conurbation 75.3 75.5 75.9 76.3 76.5 76.8 77.1 77.5 77.9 78.2 78.4 78.4 78.3 78.5 78.6 78.7 Urban with Significant Rural 77.1 77.4 77.7 78.1 78.4 78.7 78.9 79.2 79.6 79.9 80.0 80.1 80.2 80.2 80.3 80.2
Predominantly Rural 77.4 77.6 77.9 78.3 78.6 78.8 79.1 79.4 79.7 80.0 80.2 80.3 80.4 80.5 80.5 80.5 Predominantly Urban 75.5 75.9 76.2 76.6 76.9 77.1 77.4 77.8 78.2 78.5 78.7 78.9 78.9 79.0 79.0 79.1 England 76.1 76.4 76.8 77.1 77.4 77.7 78.0 78.3 78.7 79.0 79.2 79.3 79.4 79.4 79.5 79.6
Female life expectancy at birth in years, by Local Authority Classification, in England 2001-03 2002-04 2003-05 2004-06 2005-07 2006-08 2007-09 2008-10 2009-11 2010-12 2011-13 2012-14 2013-15 2014-16 2015-17 2016-18 Mainly Rural 81.7 81.8 82.1 82.5 82.7 82.8 83.0 83.3 83.7 83.8 83.9 84.0 84.0 84.1 84.1 84.1 Largely Rural 81.4 81.5 81.7 82.0 82.2 82.4 82.6 82.9 83.2 83.4 83.5 83.6 83.6 83.6 83.6 83.7 Urban with City and Town 80.6 80.7 80.9 81.3 81.5 81.6 81.9 82.1 82.4 82.6 82.7 82.8 82.8 82.8 82.8 82.8 Urban with Major Conurbation 80.2 80.4 80.6 81.0 81.2 81.4 81.7 81.9 82.3 82.5 82.7 82.8 82.8 82.8 82.9 83.1 Urban with Minor Conurbation 79.9 80.0 80.3 80.7 80.9 81.0 81.1 81.5 81.9 82.1 82.2 82.1 82.1 82.1 82.1 82.1 Urban with Significant Rural 81.4 81.5 81.8 82.1 82.3 82.5 82.7 82.9 83.2 83.4 83.6 83.7 83.6 83.6 83.6 83.7
Predominantly Rural 81.5 81.6 81.9 82.2 82.4 82.6 82.8 83.1 83.4 83.6 83.7 83.8 83.8 83.8 83.8 83.9 Predominantly Urban 80.3 80.5 80.7 81.1 81.3 81.5 81.7 82.0 82.3 82.5 82.7 82.8 82.8 82.8 82.8 82.9 England 80.7 80.9 81.1 81.5 81.7 81.8 82.1 82.3 82.7 82.8 83.0 83.1 83.1 83.1 83.1 83.2
Notes: Weighted average is calculated using NOMIS mid-year population estimates by Local Authority and using RUCLAD 2011. 2016-18 population data uses the new unitary authority boundaries created in April 2019. Office for National Statistics (ONS) Life expectancy tables: www.ons.gov.uk/peoplepopulationandcommunity/healthandsocialcare/healthandlifeexpectancies/datasets/lifeexpectancyatbirthandatage65bylocalareasuk
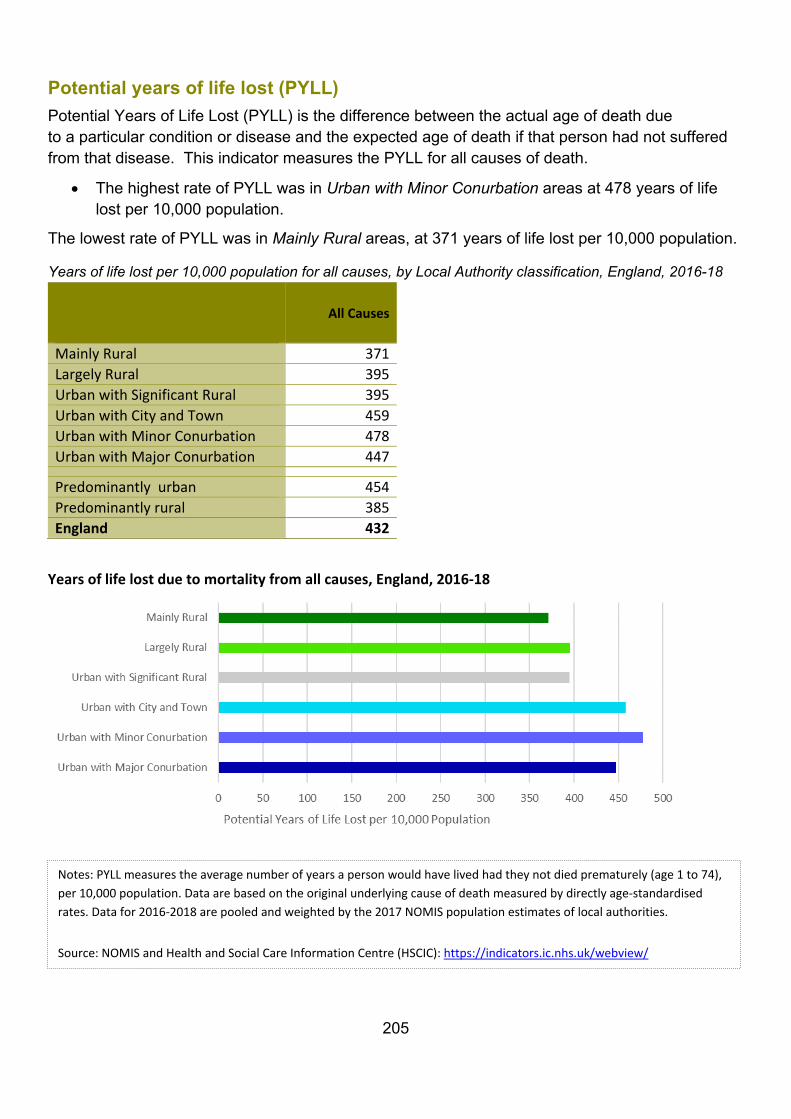
205
Potential years of life lost (PYLL) Potential Years of Life Lost (PYLL) is the difference between the actual age of death due to a particular condition or disease and the expected age of death if that person had not suffered from that disease. This indicator measures the PYLL for all causes of death.
• The highest rate of PYLL was in Urban with Minor Conurbation areas at 478 years of life lost per 10,000 population.
The lowest rate of PYLL was in Mainly Rural areas, at 371 years of life lost per 10,000 population.
Years of life lost per 10,000 population for all causes, by Local Authority classification, England, 2016-18
All Causes
Mainly Rural 371 Largely Rural 395 Urban with Significant Rural 395 Urban with City and Town 459 Urban with Minor Conurbation 478 Urban with Major Conurbation 447
Predominantly urban 454 Predominantly rural 385 England 432
Years of life lost due to mortality from all causes, England, 2016-18
Notes: PYLL measures the average number of years a person would have lived had they not died prematurely (age 1 to 74), per 10,000 population. Data are based on the original underlying cause of death measured by directly age-standardised rates. Data for 2016-2018 are pooled and weighted by the 2017 NOMIS population estimates of local authorities. Source: NOMIS and Health and Social Care Information Centre (HSCIC): https://indicators.ic.nhs.uk/webview/
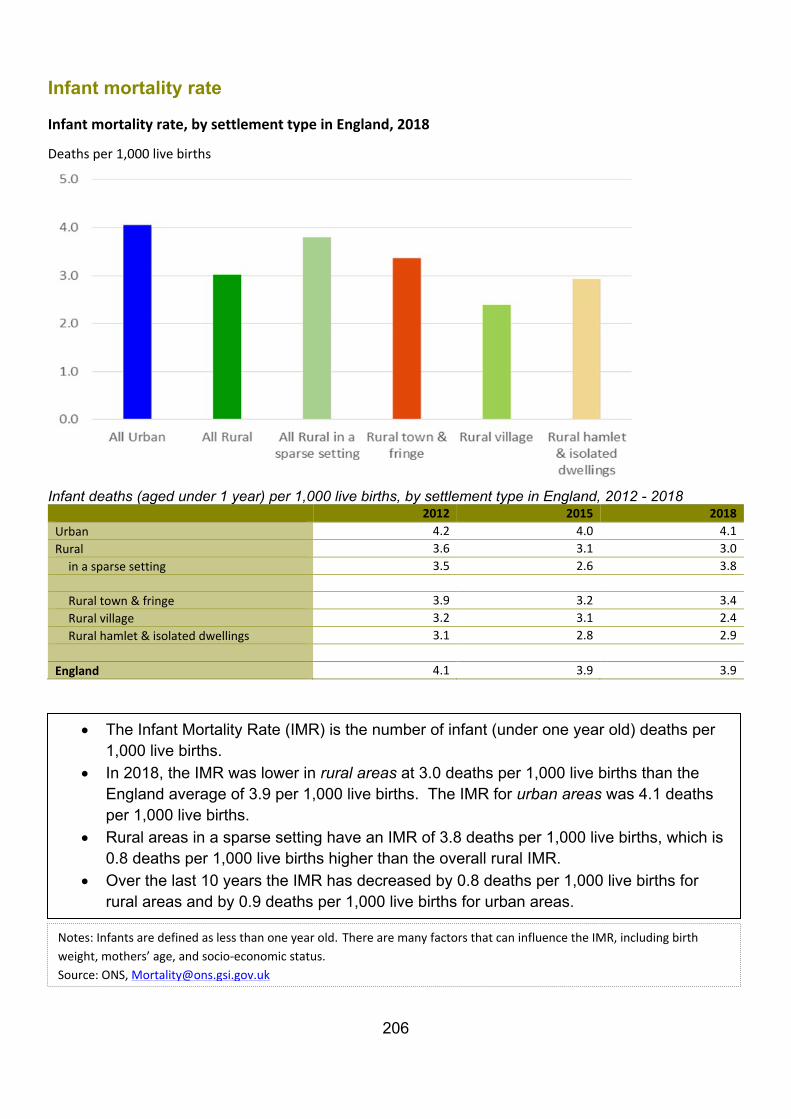
206
Infant mortality rate
Infant mortality rate, by settlement type in England, 2018
Deaths per 1,000 live births
Infant deaths (aged under 1 year) per 1,000 live births, by settlement type in England, 2012 - 2018
2012 2015 2018 Urban 4.2 4.0 4.1 Rural 3.6 3.1 3.0
in a sparse setting 3.5 2.6 3.8 Rural town & fringe 3.9 3.2 3.4 Rural village 3.2 3.1 2.4 Rural hamlet & isolated dwellings 3.1 2.8 2.9
England 4.1 3.9 3.9
• The Infant Mortality Rate (IMR) is the number of infant (under one year old) deaths per 1,000 live births.
• In 2018, the IMR was lower in rural areas at 3.0 deaths per 1,000 live births than the England average of 3.9 per 1,000 live births. The IMR for urban areas was 4.1 deaths per 1,000 live births.
• Rural areas in a sparse setting have an IMR of 3.8 deaths per 1,000 live births, which is 0.8 deaths per 1,000 live births higher than the overall rural IMR.
• Over the last 10 years the IMR has decreased by 0.8 deaths per 1,000 live births for rural areas and by 0.9 deaths per 1,000 live births for urban areas.
Notes: Infants are defined as less than one year old. There are many factors that can influence the IMR, including birth weight, mothers’ age, and socio-economic status. Source: ONS, [email protected]
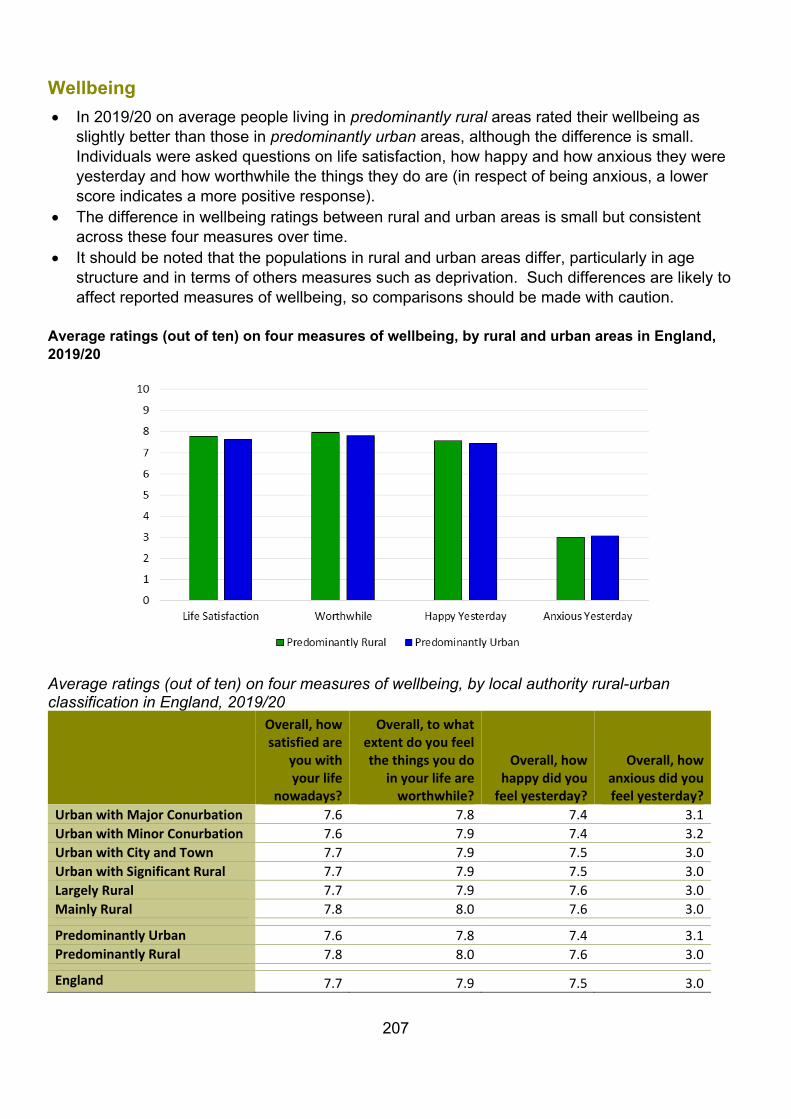
207
Wellbeing • In 2019/20 on average people living in predominantly rural areas rated their wellbeing as
slightly better than those in predominantly urban areas, although the difference is small. Individuals were asked questions on life satisfaction, how happy and how anxious they were yesterday and how worthwhile the things they do are (in respect of being anxious, a lower score indicates a more positive response).
• The difference in wellbeing ratings between rural and urban areas is small but consistent across these four measures over time.
• It should be noted that the populations in rural and urban areas differ, particularly in age structure and in terms of others measures such as deprivation. Such differences are likely to affect reported measures of wellbeing, so comparisons should be made with caution.
Average ratings (out of ten) on four measures of wellbeing, by rural and urban areas in England, 2019/20
Average ratings (out of ten) on four measures of wellbeing, by local authority rural-urban classification in England, 2019/20
Overall, how satisfied are
you with your life
nowadays?
Overall, to what extent do you feel the things you do
in your life are worthwhile?
Overall, how happy did you
feel yesterday?
Overall, how anxious did you feel yesterday?
Urban with Major Conurbation 7.6 7.8 7.4 3.1 Urban with Minor Conurbation 7.6 7.9 7.4 3.2 Urban with City and Town 7.7 7.9 7.5 3.0 Urban with Significant Rural 7.7 7.9 7.5 3.0 Largely Rural 7.7 7.9 7.6 3.0 Mainly Rural 7.8 8.0 7.6 3.0
Predominantly Urban 7.6 7.8 7.4 3.1 Predominantly Rural 7.8 8.0 7.6 3.0
England 7.7 7.9 7.5 3.0
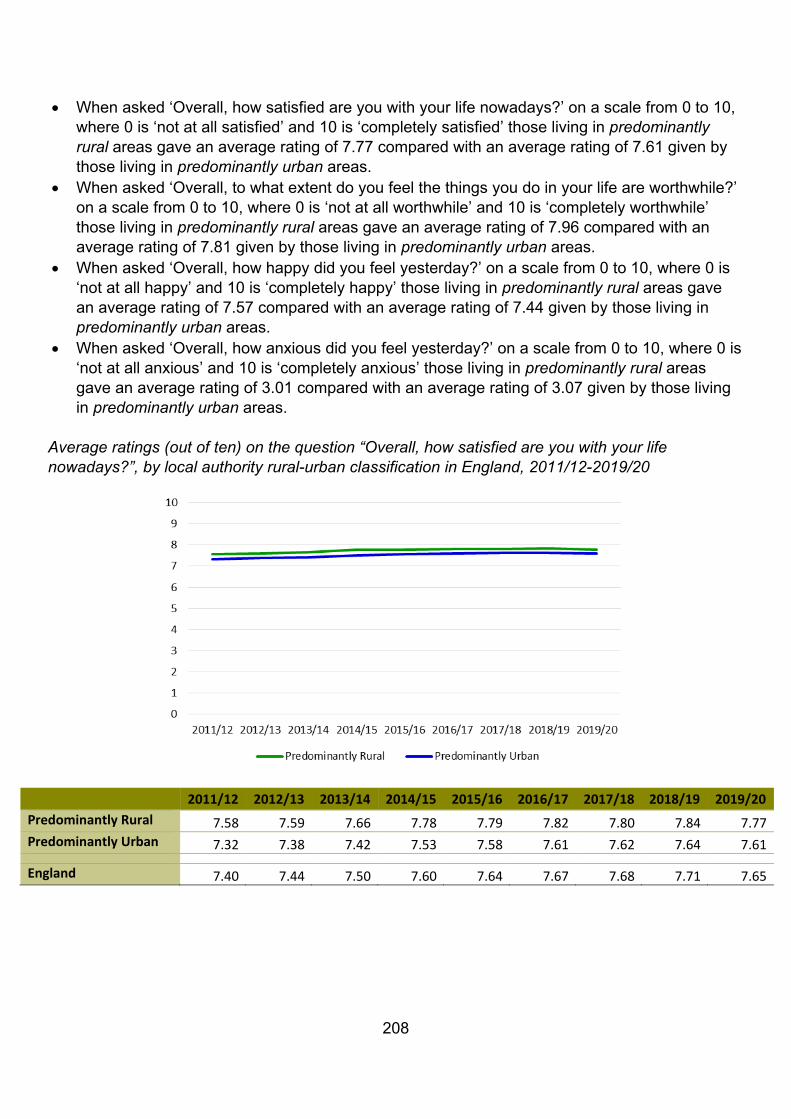
208
• When asked ‘Overall, how satisfied are you with your life nowadays?’ on a scale from 0 to 10,
where 0 is ‘not at all satisfied’ and 10 is ‘completely satisfied’ those living in predominantly rural areas gave an average rating of 7.77 compared with an average rating of 7.61 given by those living in predominantly urban areas.
• When asked ‘Overall, to what extent do you feel the things you do in your life are worthwhile?’ on a scale from 0 to 10, where 0 is ‘not at all worthwhile’ and 10 is ‘completely worthwhile’ those living in predominantly rural areas gave an average rating of 7.96 compared with an average rating of 7.81 given by those living in predominantly urban areas.
• When asked ‘Overall, how happy did you feel yesterday?’ on a scale from 0 to 10, where 0 is ‘not at all happy’ and 10 is ‘completely happy’ those living in predominantly rural areas gave an average rating of 7.57 compared with an average rating of 7.44 given by those living in predominantly urban areas.
• When asked ‘Overall, how anxious did you feel yesterday?’ on a scale from 0 to 10, where 0 is ‘not at all anxious’ and 10 is ‘completely anxious’ those living in predominantly rural areas gave an average rating of 3.01 compared with an average rating of 3.07 given by those living in predominantly urban areas.
Average ratings (out of ten) on the question “Overall, how satisfied are you with your life nowadays?”, by local authority rural-urban classification in England, 2011/12-2019/20
2011/12 2012/13 2013/14 2014/15 2015/16 2016/17 2017/18 2018/19 2019/20 Predominantly Rural 7.58 7.59 7.66 7.78 7.79 7.82 7.80 7.84 7.77 Predominantly Urban 7.32 7.38 7.42 7.53 7.58 7.61 7.62 7.64 7.61
England 7.40 7.44 7.50 7.60 7.64 7.67 7.68 7.71 7.65
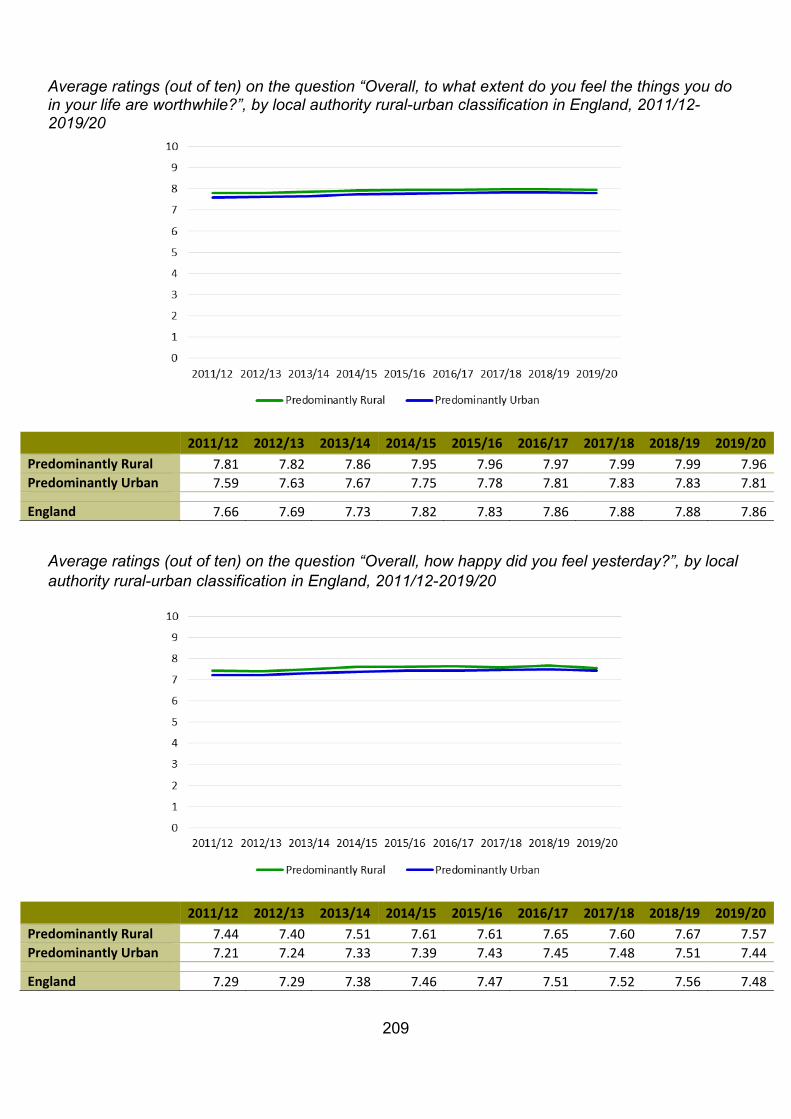
209
Average ratings (out of ten) on the question “Overall, to what extent do you feel the things you do in your life are worthwhile?”, by local authority rural-urban classification in England, 2011/12-2019/20
2011/12 2012/13 2013/14 2014/15 2015/16 2016/17 2017/18 2018/19 2019/20 Predominantly Rural 7.81 7.82 7.86 7.95 7.96 7.97 7.99 7.99 7.96 Predominantly Urban 7.59 7.63 7.67 7.75 7.78 7.81 7.83 7.83 7.81
England 7.66 7.69 7.73 7.82 7.83 7.86 7.88 7.88 7.86
Average ratings (out of ten) on the question “Overall, how happy did you feel yesterday?”, by local authority rural-urban classification in England, 2011/12-2019/20
2011/12 2012/13 2013/14 2014/15 2015/16 2016/17 2017/18 2018/19 2019/20 Predominantly Rural 7.44 7.40 7.51 7.61 7.61 7.65 7.60 7.67 7.57 Predominantly Urban 7.21 7.24 7.33 7.39 7.43 7.45 7.48 7.51 7.44
England 7.29 7.29 7.38 7.46 7.47 7.51 7.52 7.56 7.48
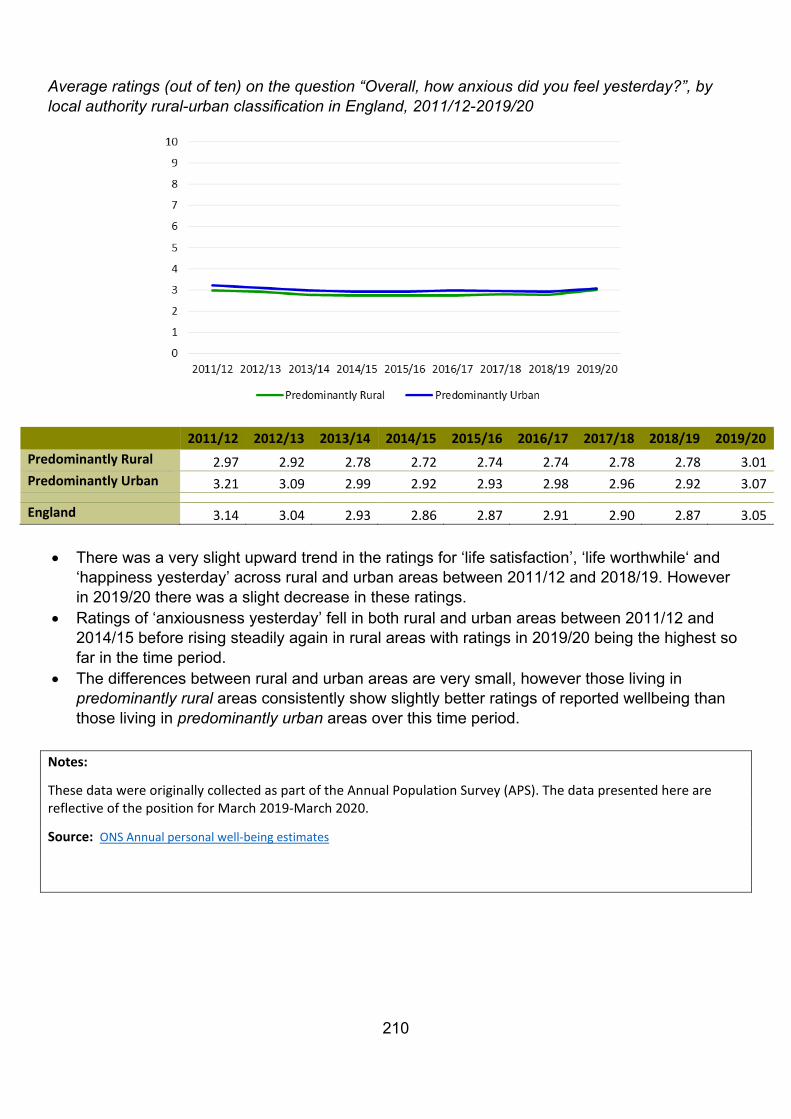
210
Average ratings (out of ten) on the question “Overall, how anxious did you feel yesterday?”, by local authority rural-urban classification in England, 2011/12-2019/20
2011/12 2012/13 2013/14 2014/15 2015/16 2016/17 2017/18 2018/19 2019/20 Predominantly Rural 2.97 2.92 2.78 2.72 2.74 2.74 2.78 2.78 3.01 Predominantly Urban 3.21 3.09 2.99 2.92 2.93 2.98 2.96 2.92 3.07
England 3.14 3.04 2.93 2.86 2.87 2.91 2.90 2.87 3.05
• There was a very slight upward trend in the ratings for ‘life satisfaction’, ‘life worthwhile‘ and ‘happiness yesterday’ across rural and urban areas between 2011/12 and 2018/19. However in 2019/20 there was a slight decrease in these ratings.
• Ratings of ‘anxiousness yesterday’ fell in both rural and urban areas between 2011/12 and 2014/15 before rising steadily again in rural areas with ratings in 2019/20 being the highest so far in the time period.
• The differences between rural and urban areas are very small, however those living in predominantly rural areas consistently show slightly better ratings of reported wellbeing than those living in predominantly urban areas over this time period.
Notes:
These data were originally collected as part of the Annual Population Survey (APS). The data presented here are reflective of the position for March 2019-March 2020.
Source: ONS Annual personal well-being estimates

211
• In 2011/12 a higher proportion of people living in rural areas reported a sense of belonging and safety in their local neighbourhood compared with those living in urban areas across several measures of ‘neighbourliness’, such as trust in those in their neighbourhood, helpfulness of those in the neighbourhood, a sense of belonging to the neighbourhood and feeling safe walking alone after dark. When asked whether they felt that people in the neighbourhood did not get along with one another, those living in urban areas were more likely to feel this way than those living in rural ones.
Percentage of people who agreed with each statement, by rural and urban areas in England, 2011/12
Percentage of people who agreed with each statement, by rural-urban classification in England, 2011/12
Proportion who feel that people
in their neighbourhood can be trusted
Proportion who feel that people around where they live are willing to help their
neighbours
Proportion of people who feel like they belong
to their neighbourhood
Proportion of people who feel
safe walking alone in their local area
after dark
Proportion who feel that people in their neighbourhood do not get along with
each other Rural 78% 80% 70% 81% 5% Urban 60% 67% 60% 71% 9% England 64% 69% 62% 73% 8%
• When asked whether they felt that people in their neighbourhood could be trusted 78% of people living in rural areas agreed or strongly agreed with this statement, compared with 60% living in urban areas.
• When asked whether they felt that the people around where they lived were willing to help their neighbours 80% of people living in rural areas agreed or strongly agreed with this statement, compared with 67% living in urban areas.
0102030405060708090
100
Proportion who feelthat people in their
neighbourhood can betrusted
Proportion who feelthat people aroundwhere they live arewilling to help their
neighbours
Proportion of peoplewho feel like they
belong to theirneighbourhood
Proportion of peoplewho feel safe walking
alone in their localarea after dark
Proportion who feelthat people in their
neighbourhood do notget along with each
other
Rural Urban
212
• When asked whether they felt like they belonged to their neighbourhood 70% of people living in rural areas agreed or strongly agreed with this statement, compared with 60% living in urban areas.
• When asked whether they felt safe walking alone in their local area after dark 81% of people living in rural areas felt safe or fairly safe, compared with 71% living in urban areas.
• When asked whether they felt that the people in their neighbourhood did not get along with each other 5% of people living in rural areas agreed or strongly agreed with this statement, compared with 9% in urban areas.
Notes:
These data were originally collected as part of the Longitudinal Household Survey (UKHLS) which is an annual survey that captures information about 40,000 households. These data were released by the ONS in May 2016 and are currently the most up-to-date data published for these measures.
Source: ONS www.ons.gov.uk/peoplepopulationandcommunity/wellbeing/datasets/5measuresofsocialcapitalbyregionandurbanandrural
213
Crime • Average crime rates are lower in rural areas than urban areas. • In 2019/20, the rate of violence against the person was 23.1 per 1,000 population in
predominantly rural areas compared with 30.4 per 1,000 population in predominantly urban areas.
• The rate of sexual offences in predominantly rural areas was 2.3 per 1,000 population in 2019/20, compared with 2.7 per 1,000 population in predominantly urban areas.
• The rate of recorded crime was also lower in rural areas than urban areas for crimes such as robbery, domestic burglary and vehicle offences (theft of, theft from or vehicle interference). For example, there were 4.3 vehicle offences per 1,000 population in predominantly rural areas and 9.1 per 1,000 population in predominantly urban areas in 2019/20.
The way crimes are recorded by the police and the likelihood of victims reporting crimes may change over time. Figures on recorded crime may not be a reliable measure of year on year trends. This analysis compares the rural and urban crime numbers as rates per head of population for only the latest year available. However, the relative differences between crime rates in rural and urban areas have been broadly consistent in previous years. Further information can be found in the ONS publication ‘Crime in England and Wales: year ending March 2020': https://www.ons.gov.uk/peoplepopulationandcommunity/crimeandjustice/bulletins/crimeinenglandandwales/yearendingmarch2020
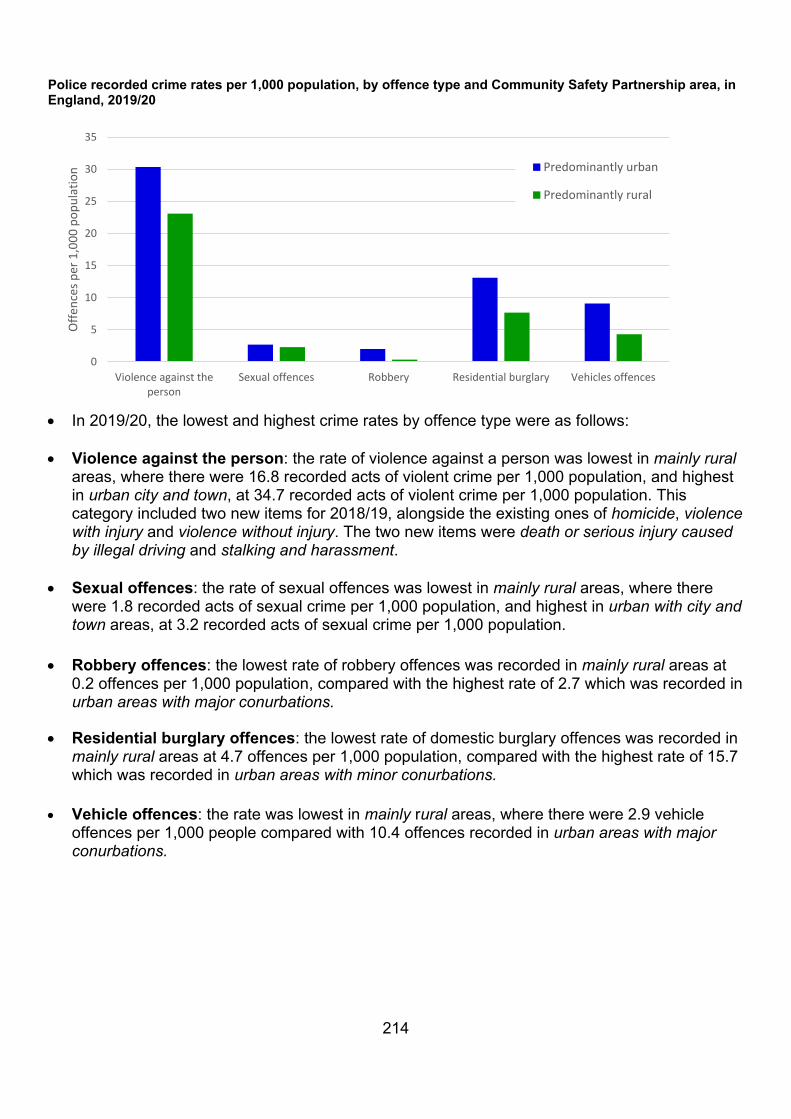
214
Police recorded crime rates per 1,000 population, by offence type and Community Safety Partnership area, in England, 2019/20
• In 2019/20, the lowest and highest crime rates by offence type were as follows: • Violence against the person: the rate of violence against a person was lowest in mainly rural
areas, where there were 16.8 recorded acts of violent crime per 1,000 population, and highest in urban city and town, at 34.7 recorded acts of violent crime per 1,000 population. This category included two new items for 2018/19, alongside the existing ones of homicide, violence with injury and violence without injury. The two new items were death or serious injury caused by illegal driving and stalking and harassment.
• Sexual offences: the rate of sexual offences was lowest in mainly rural areas, where there
were 1.8 recorded acts of sexual crime per 1,000 population, and highest in urban with city and town areas, at 3.2 recorded acts of sexual crime per 1,000 population.
• Robbery offences: the lowest rate of robbery offences was recorded in mainly rural areas at
0.2 offences per 1,000 population, compared with the highest rate of 2.7 which was recorded in urban areas with major conurbations.
• Residential burglary offences: the lowest rate of domestic burglary offences was recorded in
mainly rural areas at 4.7 offences per 1,000 population, compared with the highest rate of 15.7 which was recorded in urban areas with minor conurbations.
• Vehicle offences: the rate was lowest in mainly rural areas, where there were 2.9 vehicle
offences per 1,000 people compared with 10.4 offences recorded in urban areas with major conurbations.
0
5
10
15
20
25
30
35
Violence against theperson
Sexual offences Robbery Residential burglary Vehicles offences
Offe
nces
per
1,0
00 p
opul
atio
n Predominantly urban
Predominantly rural
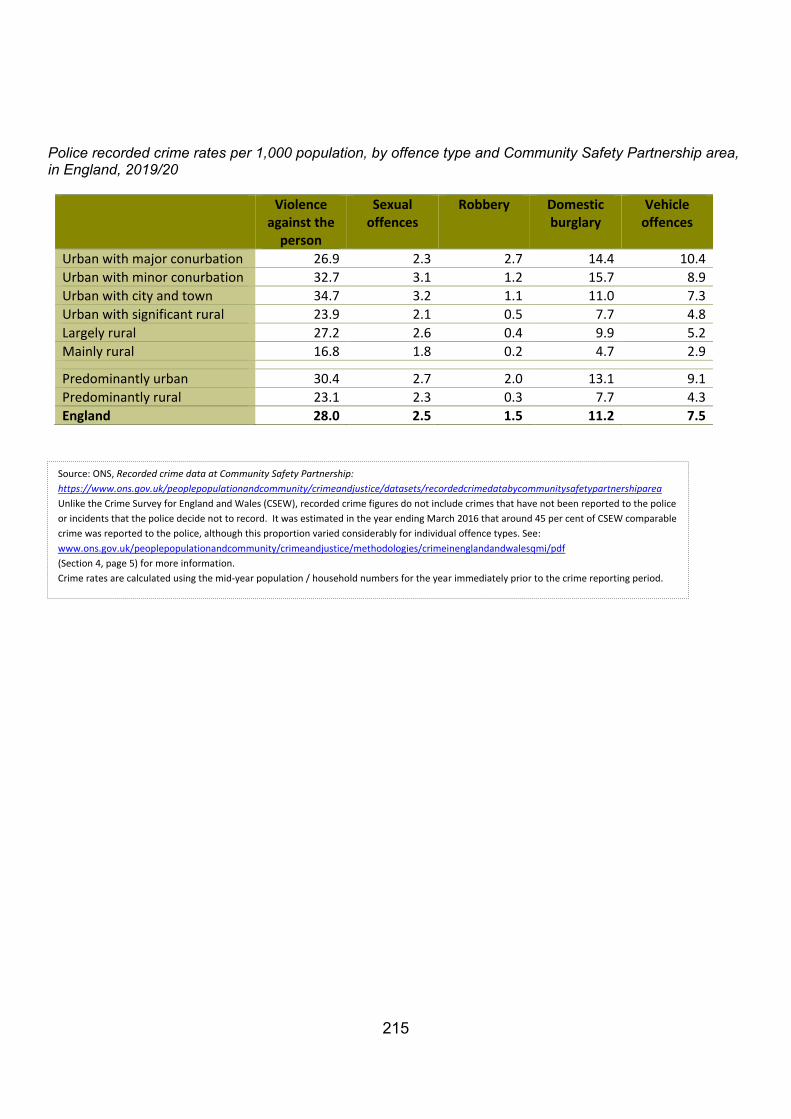
215
Police recorded crime rates per 1,000 population, by offence type and Community Safety Partnership area, in England, 2019/20
Violence against the
person
Sexual offences
Robbery Domestic burglary
Vehicle offences
Urban with major conurbation 26.9 2.3 2.7 14.4 10.4 Urban with minor conurbation 32.7 3.1 1.2 15.7 8.9 Urban with city and town 34.7 3.2 1.1 11.0 7.3 Urban with significant rural 23.9 2.1 0.5 7.7 4.8 Largely rural 27.2 2.6 0.4 9.9 5.2 Mainly rural 16.8 1.8 0.2 4.7 2.9
Predominantly urban 30.4 2.7 2.0 13.1 9.1 Predominantly rural 23.1 2.3 0.3 7.7 4.3 England 28.0 2.5 1.5 11.2 7.5
Source: ONS, Recorded crime data at Community Safety Partnership: https://www.ons.gov.uk/peoplepopulationandcommunity/crimeandjustice/datasets/recordedcrimedatabycommunitysafetypartnershiparea Unlike the Crime Survey for England and Wales (CSEW), recorded crime figures do not include crimes that have not been reported to the police or incidents that the police decide not to record. It was estimated in the year ending March 2016 that around 45 per cent of CSEW comparable crime was reported to the police, although this proportion varied considerably for individual offence types. See: www.ons.gov.uk/peoplepopulationandcommunity/crimeandjustice/methodologies/crimeinenglandandwalesqmi/pdf (Section 4, page 5) for more information. Crime rates are calculated using the mid-year population / household numbers for the year immediately prior to the crime reporting period.
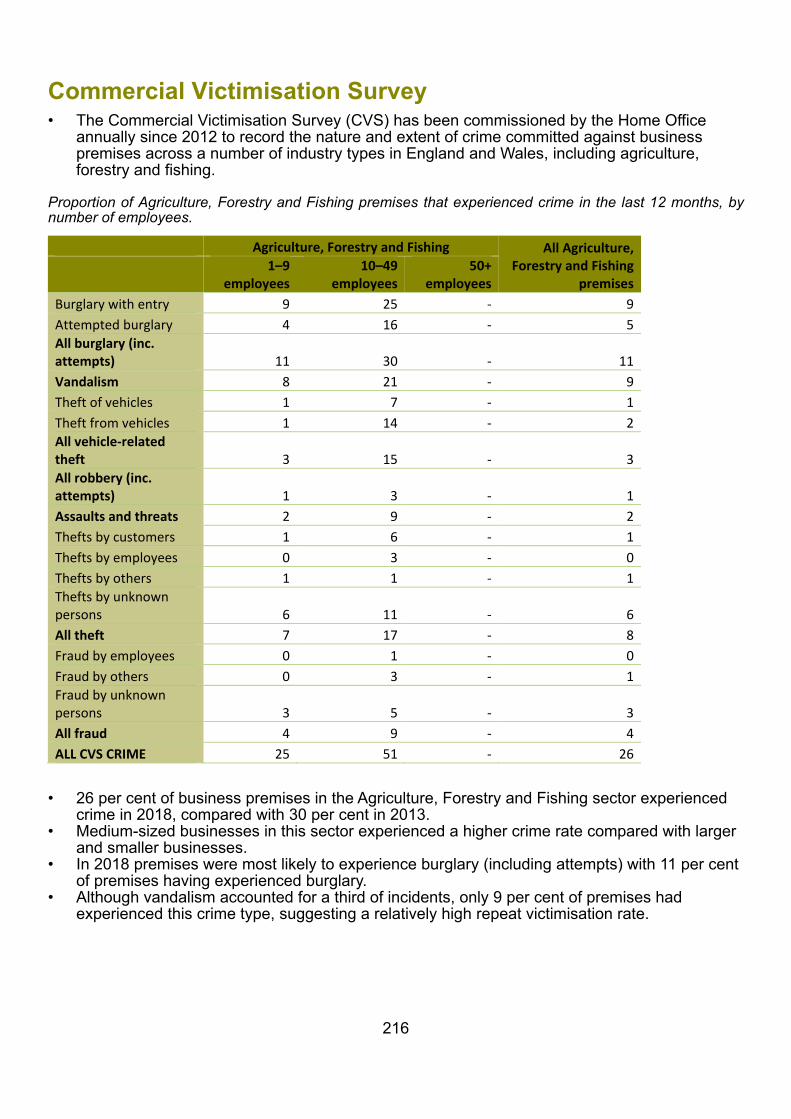
216
Commercial Victimisation Survey • The Commercial Victimisation Survey (CVS) has been commissioned by the Home Office
annually since 2012 to record the nature and extent of crime committed against business premises across a number of industry types in England and Wales, including agriculture, forestry and fishing.
Proportion of Agriculture, Forestry and Fishing premises that experienced crime in the last 12 months, by number of employees.
Agriculture, Forestry and Fishing All Agriculture, Forestry and Fishing
premises 1–9
employees 10–49
employees 50+
employees Burglary with entry 9 25 - 9 Attempted burglary 4 16 - 5 All burglary (inc. attempts) 11 30 - 11 Vandalism 8 21 - 9 Theft of vehicles 1 7 - 1 Theft from vehicles 1 14 - 2 All vehicle-related theft 3 15 - 3 All robbery (inc. attempts) 1 3 - 1 Assaults and threats 2 9 - 2 Thefts by customers 1 6 - 1 Thefts by employees 0 3 - 0 Thefts by others 1 1 - 1 Thefts by unknown persons 6 11 - 6 All theft 7 17 - 8 Fraud by employees 0 1 - 0 Fraud by others 0 3 - 1 Fraud by unknown persons 3 5 - 3 All fraud 4 9 - 4 ALL CVS CRIME 25 51 - 26
• 26 per cent of business premises in the Agriculture, Forestry and Fishing sector experienced crime in 2018, compared with 30 per cent in 2013.
• Medium-sized businesses in this sector experienced a higher crime rate compared with larger and smaller businesses.
• In 2018 premises were most likely to experience burglary (including attempts) with 11 per cent of premises having experienced burglary.
• Although vandalism accounted for a third of incidents, only 9 per cent of premises had experienced this crime type, suggesting a relatively high repeat victimisation rate.
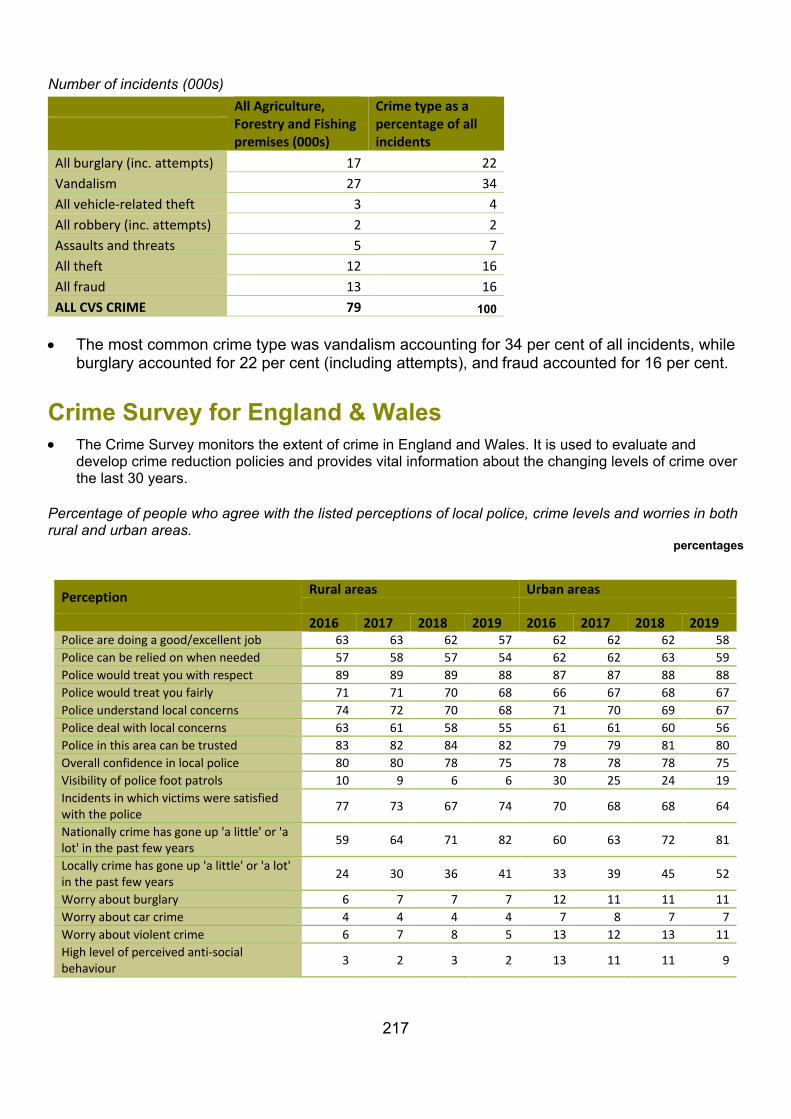
217
Number of incidents (000s)
• The most common crime type was vandalism accounting for 34 per cent of all incidents, while burglary accounted for 22 per cent (including attempts), and fraud accounted for 16 per cent.
Crime Survey for England & Wales • The Crime Survey monitors the extent of crime in England and Wales. It is used to evaluate and
develop crime reduction policies and provides vital information about the changing levels of crime over the last 30 years.
Percentage of people who agree with the listed perceptions of local police, crime levels and worries in both rural and urban areas.
percentages
All Agriculture, Forestry and Fishing premises (000s)
Crime type as a percentage of all incidents
All burglary (inc. attempts) 17 22 Vandalism 27 34 All vehicle-related theft 3 4 All robbery (inc. attempts) 2 2 Assaults and threats 5 7 All theft 12 16 All fraud 13 16 ALL CVS CRIME 79 100
Perception Rural areas Urban areas
2016 2017 2018 2019 2016 2017 2018 2019 Police are doing a good/excellent job 63 63 62 57 62 62 62 58 Police can be relied on when needed 57 58 57 54 62 62 63 59 Police would treat you with respect 89 89 89 88 87 87 88 88 Police would treat you fairly 71 71 70 68 66 67 68 67 Police understand local concerns 74 72 70 68 71 70 69 67 Police deal with local concerns 63 61 58 55 61 61 60 56 Police in this area can be trusted 83 82 84 82 79 79 81 80 Overall confidence in local police 80 80 78 75 78 78 78 75 Visibility of police foot patrols 10 9 6 6 30 25 24 19 Incidents in which victims were satisfied with the police 77 73 67 74 70 68 68 64
Nationally crime has gone up 'a little' or 'a lot' in the past few years 59 64 71 82 60 63 72 81
Locally crime has gone up 'a little' or 'a lot' in the past few years 24 30 36 41 33 39 45 52
Worry about burglary 6 7 7 7 12 11 11 11 Worry about car crime 4 4 4 4 7 8 7 7 Worry about violent crime 6 7 8 5 13 12 13 11 High level of perceived anti-social behaviour 3 2 3 2 13 11 11 9
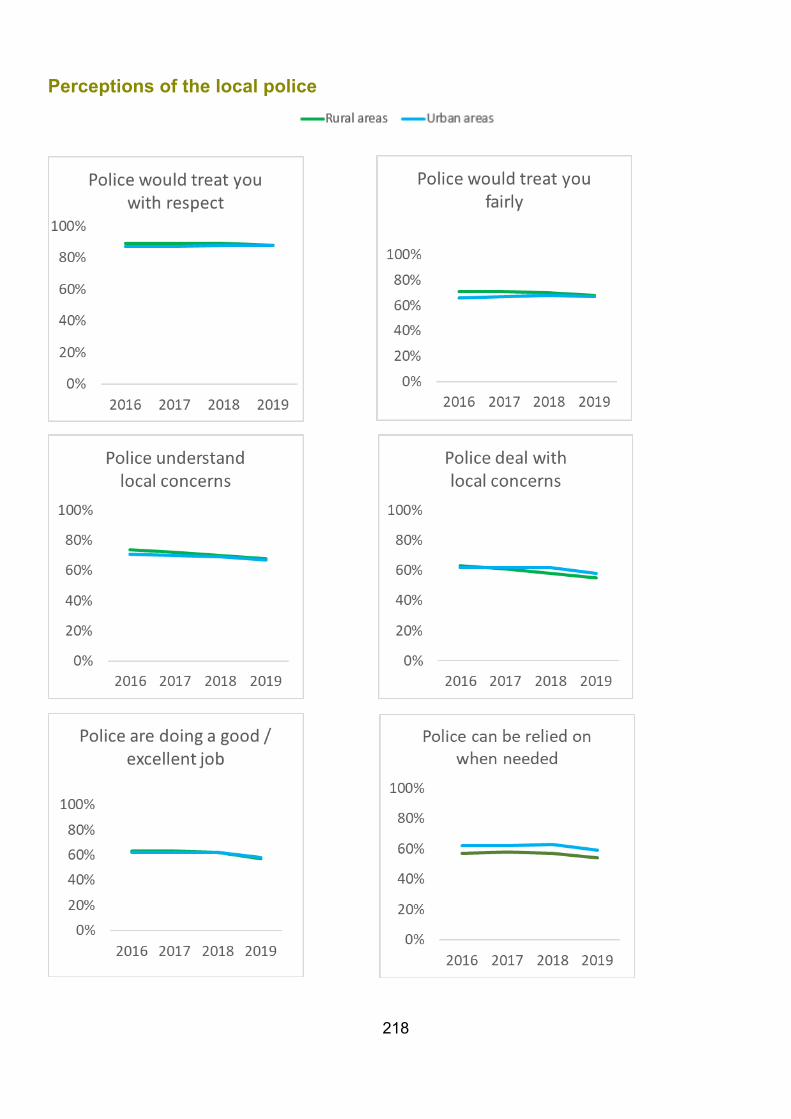
218
Perceptions of the local police
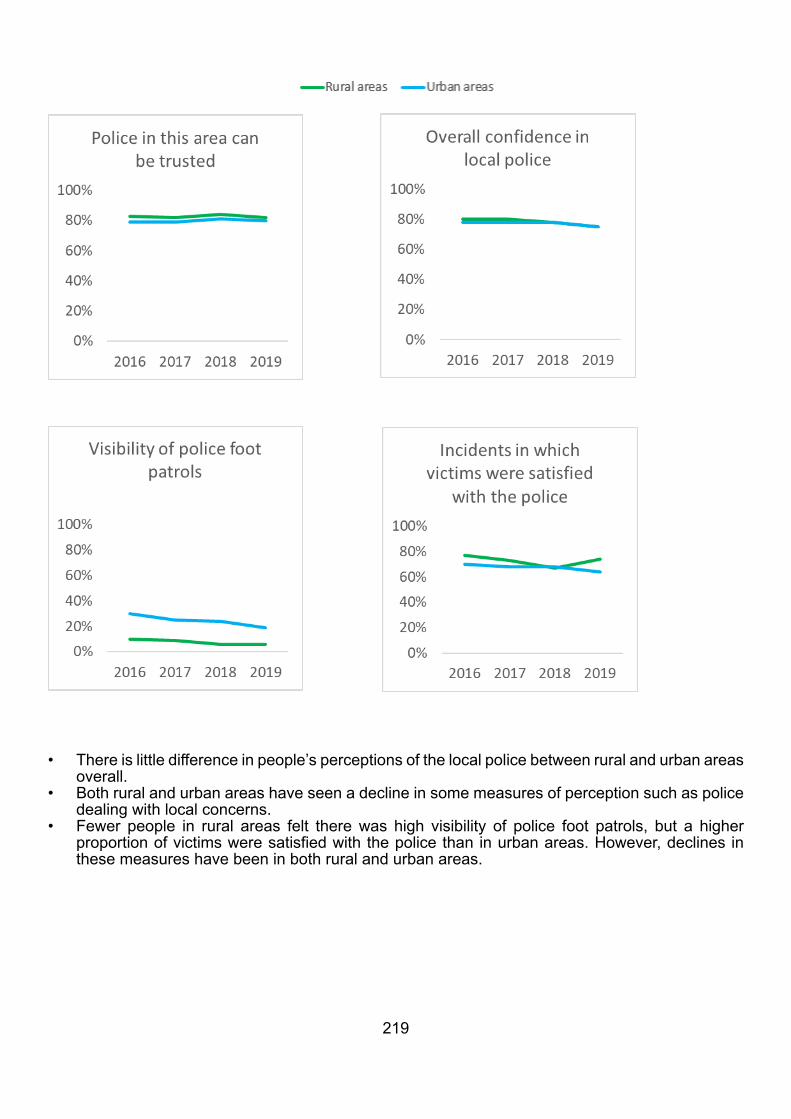
219
• There is little difference in people’s perceptions of the local police between rural and urban areas overall.
• Both rural and urban areas have seen a decline in some measures of perception such as police dealing with local concerns.
• Fewer people in rural areas felt there was high visibility of police foot patrols, but a higher proportion of victims were satisfied with the police than in urban areas. However, declines in these measures have been in both rural and urban areas.
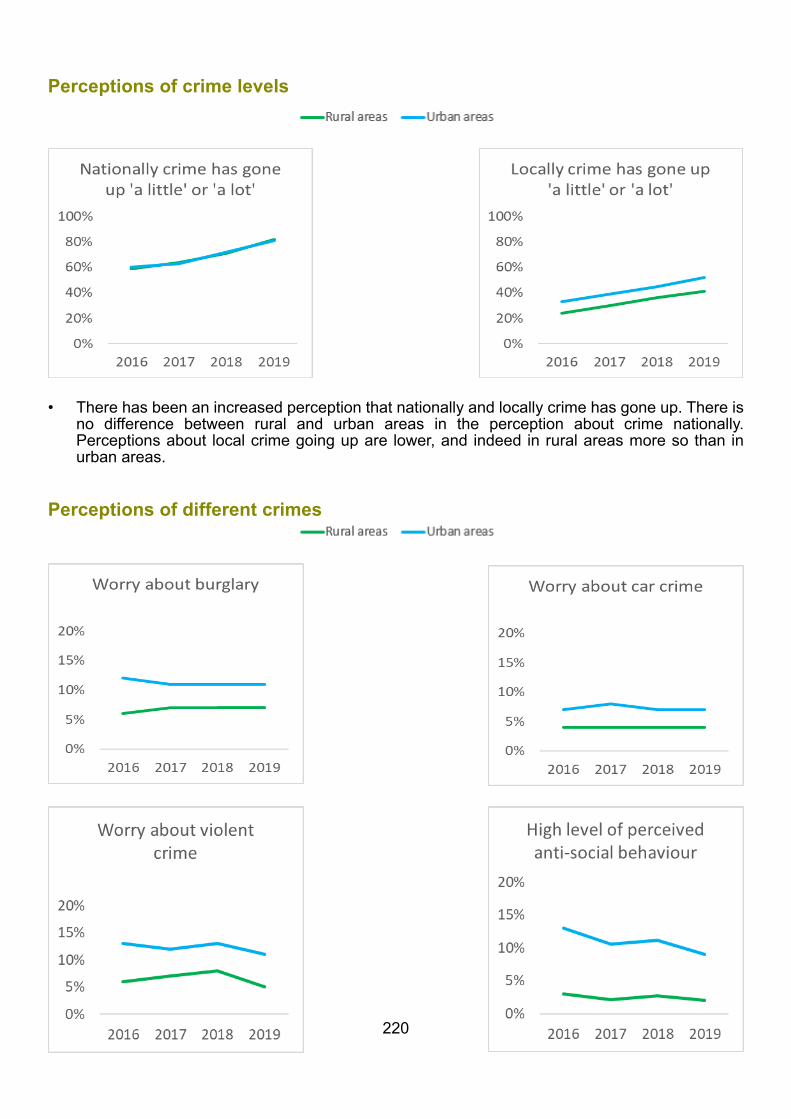
220
Perceptions of crime levels
• There has been an increased perception that nationally and locally crime has gone up. There is no difference between rural and urban areas in the perception about crime nationally. Perceptions about local crime going up are lower, and indeed in rural areas more so than in urban areas.
Perceptions of different crimes
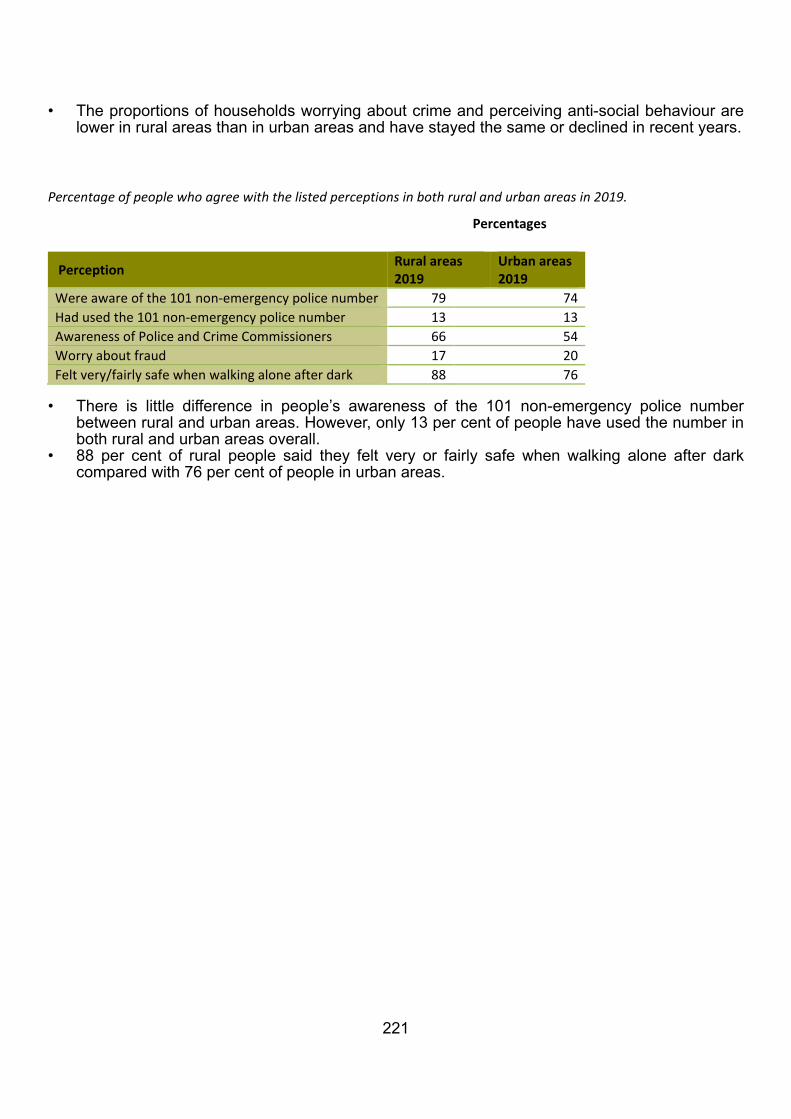
221
• The proportions of households worrying about crime and perceiving anti-social behaviour are lower in rural areas than in urban areas and have stayed the same or declined in recent years.
Percentage of people who agree with the listed perceptions in both rural and urban areas in 2019.
Percentages
• There is little difference in people’s awareness of the 101 non-emergency police number between rural and urban areas. However, only 13 per cent of people have used the number in both rural and urban areas overall.
• 88 per cent of rural people said they felt very or fairly safe when walking alone after dark compared with 76 per cent of people in urban areas.
Perception Rural areas 2019
Urban areas 2019
Were aware of the 101 non-emergency police number 79 74 Had used the 101 non-emergency police number 13 13 Awareness of Police and Crime Commissioners 66 54 Worry about fraud 17 20 Felt very/fairly safe when walking alone after dark 88 76