STATEMENT OF ACCOUNTS - Li & Fung
95
79 LI & FUNG LIMITED | ANNUAL REPORT 2013 80 Consolidated Profit and Loss Account of the Group 81 Consolidated Statement of Comprehensive Income of the Group 82 Consolidated Balance Sheet of the Group 84 Balance Sheet of the Company 85 Consolidated Statement of Changes in Equity of the Group 87 Consolidated Cash Flow Statement of the Group Notes to the Accounts 88 1 Basis of Preparation and Principal Accounting Policies 106 2 Critical Accounting Estimates and Judgments 107 3 Segment Information 111 4 Operating Profit 112 5 Interest Expenses 112 6 Taxation 114 7 Profit Attributable to Shareholders of the Company 114 8 Earnings per Share 115 9 Dividends 115 10 Staff Costs Including Directors’ Emoluments 116 11 Directors’ and Senior Management’s Emoluments 119 12 Intangible Assets 122 13 Property, Plant and Equipment 123 14 Prepaid Premium for Land Leases 124 15 Interests in Subsidiaries 124 16 Associated Companies 124 17 Joint Ventures 125 18 Available-for-sale Financial Assets 126 19 Inventories 126 20 Due from/(to) Related Companies 126 21 Derivative Financial Instruments 127 22 Trade and Other Receivables 129 23 Cash and Cash Equivalents 129 24 Trade and Other Payables 130 25 Bank Borrowings 131 26 Share Capital and Options 134 27 Reserves 137 28 Perpetual Capital Securities 138 29 Long-term Liabilities 139 30 Post-employment Benefit Obligations 144 31 Deferred Taxation 147 32 Notes to the Consolidated Cash Flow Statement 149 33 Business Combinations 152 34 Contingent Liabilities 153 35 Commitments 153 36 Charges on Assets 153 37 Related Party Transactions 155 38 Financial Risk Management 158 39 Capital Risk Management 159 40 Fair Value Estimation 161 41 Events after Balance Sheet Date 161 42 Approval of Accounts 162 43 Principal Subsidiaries, Associated Companies and Joint Venture STATEMENT OF ACCOUNTS
-
Upload
khangminh22 -
Category
Documents
-
view
0 -
download
0
Transcript of STATEMENT OF ACCOUNTS - Li & Fung

79LI & FUNG LIMITED | ANNUAL REPORT 2013
80 Consolidated Profit and Loss Account of the Group
81 Consolidated Statement of Comprehensive Income of the Group
82 Consolidated Balance Sheet of the Group
84 Balance Sheet of the Company
85 Consolidated Statement of Changes in Equity of the Group
87 Consolidated Cash Flow Statement of the Group
Notes to the Accounts
88 1 Basis of Preparation and Principal Accounting Policies
106 2 Critical Accounting Estimates and Judgments
107 3 Segment Information
111 4 Operating Profit
112 5 Interest Expenses
112 6 Taxation
114 7 Profit Attributable to Shareholders of the Company
114 8 Earnings per Share
115 9 Dividends
115 10 Staff Costs Including Directors’ Emoluments
116 11 Directors’ and Senior Management’s Emoluments
119 12 Intangible Assets
122 13 Property, Plant and Equipment
123 14 Prepaid Premium for Land Leases
124 15 Interests in Subsidiaries
124 16 Associated Companies
124 17 Joint Ventures
125 18 Available-for-sale Financial Assets
126 19 Inventories
126 20 Due from/(to) Related Companies
126 21 Derivative Financial Instruments
127 22 Trade and Other Receivables
129 23 Cash and Cash Equivalents
129 24 Trade and Other Payables
130 25 Bank Borrowings
131 26 Share Capital and Options
134 27 Reserves
137 28 Perpetual Capital Securities
138 29 Long-term Liabilities
139 30 Post-employment Benefit Obligations
144 31 Deferred Taxation
147 32 Notes to the Consolidated Cash Flow Statement
149 33 Business Combinations
152 34 Contingent Liabilities
153 35 Commitments
153 36 Charges on Assets
153 37 Related Party Transactions
155 38 Financial Risk Management
158 39 Capital Risk Management
159 40 Fair Value Estimation
161 41 Events after Balance Sheet Date
161 42 Approval of Accounts
162 43 Principal Subsidiaries, Associated Companies and Joint Venture
STATEMENT OF ACCOUNTS

80 LI & FUNG LIMITED | ANNUAL REPORT 2013
CONSOLIDATED PROFIT AND LOSS ACCOUNT OF THE GROUPFor the year ended 31 December 2013
2013 2012
Note US$’000 US$’000
Turnover 3 20,745,410 20,221,806
Cost of sales (17,530,953) (17,353,483)
Gross profit 3,214,457 2,868,323
Other income 89,581 95,472
Total margin 3,304,038 2,963,795
Selling and distribution expenses (972,946) (946,951)
Merchandising and administrative expenses (1,460,301) (1,505,671)
Core operating profit 3 870,791 511,173
Gain on remeasurement of contingent consideration payable 4 187,400 325,591
Amortization of other intangible assets 4 (78,263) (64,944)
Gain on disposals of businesses/licensing right 32(c), 37 5,317 29,635
Other non-core operating expenses 4 (9,421) (10,752)
Operating profit 4 975,824 790,703
Interest income 18,530 20,385
Interest expenses 5
Non-cash interest expenses (29,118) (24,656)
Cash interest expenses (112,438) (110,453)
(141,556) (135,109)
Share of profits less losses of associated companies 16 442 638
Share of profits less losses of joint ventures 17 409 –
Profit before taxation 853,649 676,617
Taxation 6 (98,362) (54,053)
Net profit for the year 755,287 622,564
Attributable to:
Shareholders of the Company 7 725,337 617,416
Holders of perpetual capital securities 30,000 4,415
Non-controlling interests (50) 733
755,287 622,564
Earnings per share for profit attributable to the shareholders of the Company
during the year 8
– basic 67.7 HK cents 58.1 HK cents
(equivalent to) 8.68 US cents 7.45 US cents
– diluted 67.7 HK cents 58.1 HK cents
(equivalent to) 8.68 US cents 7.44 US cents
Details of dividends to Shareholders of the Company are set out in Note 9. The notes on pages 88 to 173 are an integral part of these
consolidated accounts.
81LI & FUNG LIMITED | ANNUAL REPORT 2013
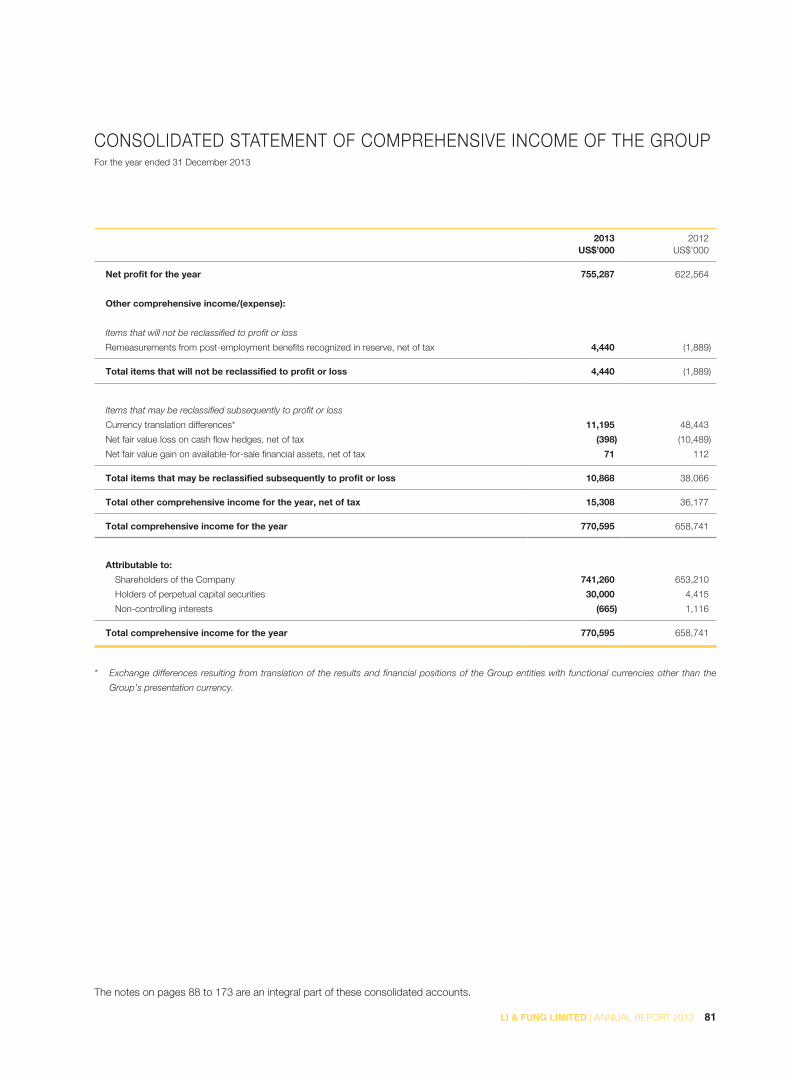
CONSOLIDATED STATEMENT OF COMPREHENSIVE INCOME OF THE GROUPFor the year ended 31 December 2013
2013 2012
US$’000 US$’000
Net profit for the year 755,287 622,564
Other comprehensive income/(expense):
Items that will not be reclassified to profit or loss
Remeasurements from post-employment benefits recognized in reserve, net of tax 4,440 (1,889)
Total items that will not be reclassified to profit or loss 4,440 (1,889)
Items that may be reclassified subsequently to profit or loss
Currency translation differences* 11,195 48,443
Net fair value loss on cash flow hedges, net of tax (398) (10,489)
Net fair value gain on available-for-sale financial assets, net of tax 71 112
Total items that may be reclassified subsequently to profit or loss 10,868 38,066
Total other comprehensive income for the year, net of tax 15,308 36,177
Total comprehensive income for the year 770,595 658,741
Attributable to:
Shareholders of the Company 741,260 653,210
Holders of perpetual capital securities 30,000 4,415
Non-controlling interests (665) 1,116
Total comprehensive income for the year 770,595 658,741
* Exchange differences resulting from translation of the results and financial positions of the Group entities with functional currencies other than the
Group’s presentation currency.
The notes on pages 88 to 173 are an integral part of these consolidated accounts.
82 LI & FUNG LIMITED | ANNUAL REPORT 2013
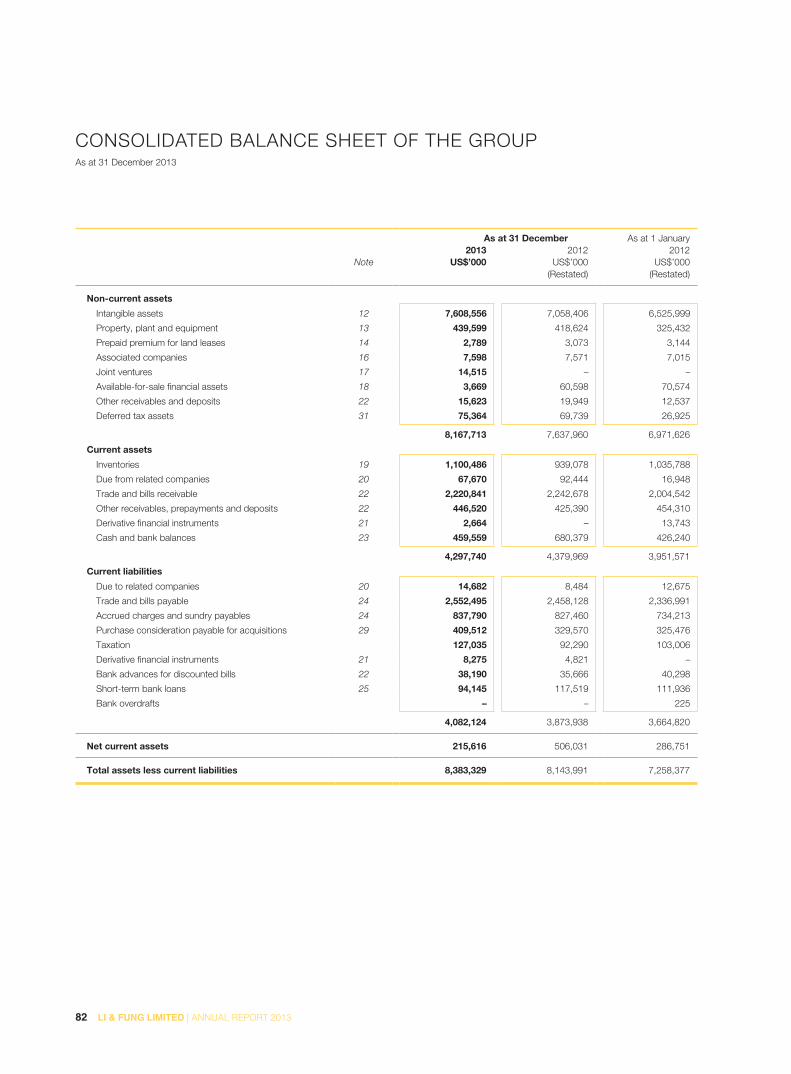
CONSOLIDATED BALANCE SHEET OF THE GROUPAs at 31 December 2013
As at 31 December As at 1 January
2013 2012 2012Note US$’000 US$’000 US$’000
(Restated) (Restated)
Non-current assets
Intangible assets 12 7,608,556 7,058,406 6,525,999
Property, plant and equipment 13 439,599 418,624 325,432
Prepaid premium for land leases 14 2,789 3,073 3,144
Associated companies 16 7,598 7,571 7,015
Joint ventures 17 14,515 – –
Available-for-sale financial assets 18 3,669 60,598 70,574
Other receivables and deposits 22 15,623 19,949 12,537
Deferred tax assets 31 75,364 69,739 26,925
8,167,713 7,637,960 6,971,626
Current assets
Inventories 19 1,100,486 939,078 1,035,788
Due from related companies 20 67,670 92,444 16,948
Trade and bills receivable 22 2,220,841 2,242,678 2,004,542
Other receivables, prepayments and deposits 22 446,520 425,390 454,310
Derivative financial instruments 21 2,664 – 13,743
Cash and bank balances 23 459,559 680,379 426,240
4,297,740 4,379,969 3,951,571
Current liabilities
Due to related companies 20 14,682 8,484 12,675
Trade and bills payable 24 2,552,495 2,458,128 2,336,991
Accrued charges and sundry payables 24 837,790 827,460 734,213
Purchase consideration payable for acquisitions 29 409,512 329,570 325,476
Taxation 127,035 92,290 103,006
Derivative financial instruments 21 8,275 4,821 –
Bank advances for discounted bills 22 38,190 35,666 40,298
Short-term bank loans 25 94,145 117,519 111,936
Bank overdrafts – – 225
4,082,124 3,873,938 3,664,820
Net current assets 215,616 506,031 286,751
Total assets less current liabilities 8,383,329 8,143,991 7,258,377

83LI & FUNG LIMITED | ANNUAL REPORT 2013
CONSOLIDATED BALANCE SHEET OF THE GROUP (CONTINUED)
As at 31 December 2013
As at 31 December As at 1 January
2013 2012 2012Note US$’000 US$’000 US$’000
(Restated) (Restated)
Financed by:
Share capital 26 13,398 13,396 12,987
Reserves 4,658,811 4,437,301 3,558,588
Proposed dividend 364,428 171,495 354,611
5,023,239 4,608,796 3,913,199
Shareholders’ funds attributable to the Company’s
shareholders 5,036,637 4,622,192 3,926,186
Perpetual capital securities 28 503,000 504,415 –
Non-controlling interests 10,048 10,713 4,813
Total equity 5,549,685 5,137,320 3,930,999
Non-current liabilities
Long term notes 29 1,254,915 1,255,461 1,256,007
Purchase consideration payable for acquisitions 29 988,487 1,318,705 1,646,664
Other long-term liabilities 29 471,779 332,651 348,351
Post-employment benefit obligations 30 24,330 28,770 23,480
Deferred tax liabilities 31 94,133 71,084 52,876
2,833,644 3,006,671 3,327,378
8,383,329 8,143,991 7,258,377
William Fung Kwok Lun Bruce Philip Rockowitz
Director Director
The notes on pages 88 to 173 are an integral part of these consolidated accounts.

84 LI & FUNG LIMITED | ANNUAL REPORT 2013
BALANCE SHEET OF THE COMPANYAs at 31 December 2013
As at 31 December
2013 2012Note US$’000 US$’000
Interests in subsidiaries 15 1,339,604 1,339,604
Current assets
Due from related companies 20 5,001,637 4,728,264
Other receivables, prepayments and deposits 22 313 250
Cash and bank balances 23 110 1,553
5,002,060 4,730,067
Current liabilities
Accrued charges and sundry payables 24 9,715 10,406
9,715 10,406
Net current assets 4,992,345 4,719,661
Total assets less current liabilities 6,331,949 6,059,265
Financed by:
Share capital 26 13,398 13,396
Reserves 27(b) 4,196,208 4,114,498
Proposed dividend 27(b) 364,428 171,495
4,560,636 4,285,993
Shareholders’ funds 4,574,034 4,299,389
Perpetual capital securities 28 503,000 504,415
5,077,034 4,803,804
Non-current liabilities
Long-term notes 29 1,254,915 1,255,461
6,331,949 6,059,265
William Fung Kwok Lun Bruce Philip Rockowitz
Director Director
The notes on pages 88 to 173 are an integral part of these consolidated accounts.

85LI & FUNG LIMITED | ANNUAL REPORT 2013
CONSOLIDATED STATEMENT OF CHANGES IN EQUITY OF THE GROUPFor the year ended 31 December 2013
Attributable to shareholders of the Company Perpetual
capital securities
Non-controlling
interestsTotal
equity
Share
capitalShare
premiumOther
reservesRetained earnings Total
US$’000 US$’000 US$’000 US$’000 US$’000 US$’000 US$’000 US$’000Note 26 Note 27(a) Note 28
Balance at 1 January 2013,
as previously reported 13,396 3,697,012 (3,164) 922,555 4,629,799 504,415 10,713 5,144,927Impact of adoption of HKAS 19 (2011) – – (9,340) 1,733 (7,607) – – (7,607)
Balance at 1 January 2013,
as restated 13,396 3,697,012 (12,504) 924,288 4,622,192 504,415 10,713 5,137,320
Comprehensive income Profit or loss – – – 725,337 725,337 30,000 (50) 755,287
Other comprehensive income Currency translation differences – – 11,810 – 11,810 – (615) 11,195Net fair value gain on available-for-sale
financial assets, net of tax – – 71 – 71 – – 71Net fair value loss on cash flow hedges,
net of tax – – (398) – (398) – – (398)Remeasurements from post-
employment benefits recognized in reserve – – 4,440 – 4,440 – – 4,440
Total other comprehensive income – – 15,923 – 15,923 – (615) 15,308
Total comprehensive income – – 15,923 725,337 741,260 30,000 (665) 770,595
Transactions with owners Employee share option scheme:
– value of employee services – – 3,522 – 3,522 – – 3,522– proceeds from shares issued 2 1,933 – – 1,935 – – 1,935– transfer to share premium – 531 (531) – – – – –
Distribution to holders of perpetual capital securities – – – – – (31,415) – (31,415)
Transfer to capital reserve – – 93 (93) – – – –2012 final dividend paid – – – (171,495) (171,495) – – (171,495)2013 interim dividend paid – – – (160,777) (160,777) – – (160,777)
Total transactions with owners 2 2,464 3,084 (332,365) (326,815) (31,415) – (358,230)
Balance at 31 December 2013 13,398 3,699,476 6,503 1,317,260 5,036,637 503,000 10,048 5,549,685

86 LI & FUNG LIMITED | ANNUAL REPORT 2013
CONSOLIDATED STATEMENT OF CHANGES IN EQUITY OF THE GROUP (CONTINUED)
For the year ended 31 December 2013
Attributable to shareholders of the Company Perpetual
capital securities
Non-controlling
interestsTotal
equity
Share capital
Share premium
Other reserves
Retained earnings Total
US$’000 US$’000 US$’000 US$’000 US$’000 US$’000 US$’000 US$’000Note 26 Note 27(a) Note 28
Balance at 1 January 2012,
as previously reported 12,987 3,114,097 (27,439) 834,148 3,933,793 – 4,813 3,938,606Impact of adoption of HKAS 19 (2011) – – (9,340) 1,733 (7,607) – – (7,607)
Balance at 1 January 2012,
as restated 12,987 3,114,097 (36,779) 835,881 3,926,186 – 4,813 3,930,999
Comprehensive income Profit or loss – – – 617,416 617,416 4,415 733 622,564
Other comprehensive income Currency translation differences – – 48,060 – 48,060 – 383 48,443Net fair value gain on available-for-sale
financial assets, net of tax – – 112 – 112 – – 112Net fair value loss on cash flow hedges,
net of tax – – (10,489) – (10,489) – – (10,489)Remeasurements from post-
employment benefits recognized in reserve – – (1,889) – (1,889) – – (1,889)
Total other comprehensive income – – 35,794 – 35,794 – 383 36,177
Total comprehensive income – – 35,794 617,416 653,210 4,415 1,116 658,741
Transactions with owners Issue of shares upon a private placing 337 497,923 – – 498,260 – – 498,260Employee share option scheme:
– value of employee services – – 2,248 – 2,248 – – 2,248– proceeds from shares issued 72 69,337 – – 69,409 – – 69,409– transfer to share premium – 15,655 (15,655) – – – – –
Release of shares held by escrow agent for settlement of acquisition consideration – – 1,764 – 1,764 – – 1,764
Issuance of perpetual capital securities – – – – – 500,000 – 500,000Transaction costs related to issuance
of perpetual capital securities – – – (4,165) (4,165) – – (4,165)Transfer to capital reserve – – 124 (124) – – – –Capitalization of loan from non-
controlling interests – – – – – – 4,893 4,8932011 final dividend paid – – – (363,999) (363,999) – – (363,999)2012 interim dividend paid – – – (160,721) (160,721) – (109) (160,830)
Total transactions with owners 409 582,915 (11,519) (529,009) 42,796 500,000 4,784 547,580
Balance at 31 December 2012,
as restated 13,396 3,697,012 (12,504) 924,288 4,622,192 504,415 10,713 5,137,320
The notes on pages 88 to 173 are an integral part of these consolidated accounts.

87LI & FUNG LIMITED | ANNUAL REPORT 2013
CONSOLIDATED CASH FLOW STATEMENT OF THE GROUPFor the year ended 31 December 2013
2013 2012
Note US$’000 US$’000
Operating activities
Net cash inflow generated from operations 32(a) 1,008,701 665,183
Hong Kong profits tax paid (9,878) (15,540)
Overseas taxation paid (56,050) (63,522)
Net cash inflow from operating activities 942,773 586,121
Investing activities
Purchases of property, plant and equipment 13 (124,638) (175,806)
Payments for computer software and system development costs 12 (21,751) (12,026)
Purchases of intangible assets (30,000) –
Settlement of consideration payable for prior years acquisitions of businesses (408,853) (358,755)
Acquisitions of businesses 33 (178,061) (292,441)
Proceeds from disposal of businesses/licensing right 32(c) 9,589 41,657
Proceeds from disposal of property, plant and equipment 275 3,440
Interest income 18,530 20,385
Repayment of debt security 18 57,000 10,000
Investment in joint ventures (7,836) –
Dividends received from associated companies 16 516 124
Addition of premium for land leases 14 (71) –
Net cash outflow from investing activities (685,300) (763,422)
Net cash inflow/(outflow) before financing activities 257,473 (177,301)
Financing activities
Interest paid (112,438) (110,453)
Net proceeds from issuance of shares upon exercise of share options 32(b) 1,935 69,409
Issue of shares upon a private placing 32(b) – 498,260
Net proceeds from issuance of perpetual capital securities, net of transaction cost – 495,835
Distributions made to holders of perpetual capital securities (31,415) –
Dividends paid (332,272) (524,829)
Net (repayment)/drawdown of bank loans 32(b) (6,734) 94
Net cash (outflow)/inflow from financing activities (480,924) 428,316
(Decrease)/increase in cash and cash equivalents (223,451) 251,015
Cash and cash equivalents at 1 January 680,379 426,015
Effect of foreign exchange rate changes 2,631 3,349
Cash and cash equivalents at 31 December 459,559 680,379
Analysis of the balances of cash and cash equivalents
Cash and bank balances 23 459,559 680,379
The notes on pages 88 to 173 are an integral part of these consolidated accounts.
88 LI & FUNG LIMITED | ANNUAL REPORT 2013
NOTES TO THE ACCOUNTS
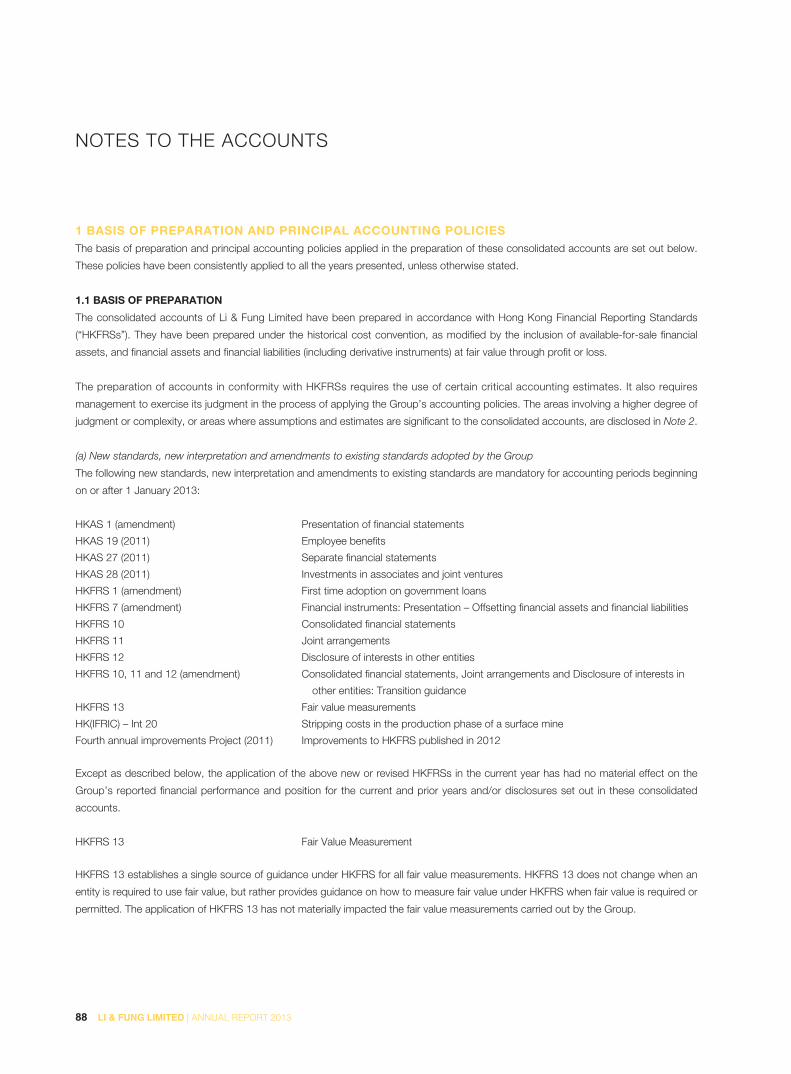
1 BASIS OF PREPARATION AND PRINCIPAL ACCOUNTING POLICIESThe basis of preparation and principal accounting policies applied in the preparation of these consolidated accounts are set out below.
These policies have been consistently applied to all the years presented, unless otherwise stated.
1.1 BASIS OF PREPARATION
The consolidated accounts of Li & Fung Limited have been prepared in accordance with Hong Kong Financial Reporting Standards
(“HKFRSs”). They have been prepared under the historical cost convention, as modified by the inclusion of available-for-sale financial
assets, and financial assets and financial liabilities (including derivative instruments) at fair value through profit or loss.
The preparation of accounts in conformity with HKFRSs requires the use of certain critical accounting estimates. It also requires
management to exercise its judgment in the process of applying the Group’s accounting policies. The areas involving a higher degree of
judgment or complexity, or areas where assumptions and estimates are significant to the consolidated accounts, are disclosed in Note 2.
(a) New standards, new interpretation and amendments to existing standards adopted by the Group
The following new standards, new interpretation and amendments to existing standards are mandatory for accounting periods beginning
on or after 1 January 2013:
HKAS 1 (amendment) Presentation of financial statements
HKAS 19 (2011) Employee benefits
HKAS 27 (2011) Separate financial statements
HKAS 28 (2011) Investments in associates and joint ventures
HKFRS 1 (amendment) First time adoption on government loans
HKFRS 7 (amendment) Financial instruments: Presentation – Offsetting financial assets and financial liabilities
HKFRS 10 Consolidated financial statements
HKFRS 11 Joint arrangements
HKFRS 12 Disclosure of interests in other entities
HKFRS 10, 11 and 12 (amendment) Consolidated financial statements, Joint arrangements and Disclosure of interests in
other entities: Transition guidance
HKFRS 13 Fair value measurements
HK(IFRIC) – Int 20 Stripping costs in the production phase of a surface mine
Fourth annual improvements Project (2011) Improvements to HKFRS published in 2012
Except as described below, the application of the above new or revised HKFRSs in the current year has had no material effect on the
Group’s reported financial performance and position for the current and prior years and/or disclosures set out in these consolidated
accounts.
HKFRS 13 Fair Value Measurement
HKFRS 13 establishes a single source of guidance under HKFRS for all fair value measurements. HKFRS 13 does not change when an
entity is required to use fair value, but rather provides guidance on how to measure fair value under HKFRS when fair value is required or
permitted. The application of HKFRS 13 has not materially impacted the fair value measurements carried out by the Group.
89LI & FUNG LIMITED | ANNUAL REPORT 2013
NOTES TO THE ACCOUNTS (CONTINUED)
1 BASIS OF PREPARATION AND PRINCIPAL ACCOUNTING POLICIES (CONTINUED)
1.1 BASIS OF PREPARATION (CONTINUED)
(a) New standards, new interpretation and amendments to existing standards adopted by the Group (continued)
HKFRS 13 also requires specific disclosures on fair values, some of which replace existing disclosure requirements in other standards,
including HKFRS 7 Financial Instruments: Disclosures. Some of these disclosures are specifically required in annual financial statements
for financial instruments; accordingly, the Group provides these disclosures in Note 40 to the accounts.
HKAS 1 (amendment) Presentation of financial statements
The amendments to HKAS 1 introduce a grouping of items presented in other comprehensive income (“OCI”). Items that could be
reclassified to profit or loss at a future point in time now have to be presented separately from items that will never be reclassified. The
adoption of these amendments only affected presentation and had no impact on the Group’s results of operations or financial position.
HKAS 19 (2011) Employee Benefits
HKAS 19 (2011) amends the accounting for employment benefits. The Group has applied the standard retrospectively in accordance
with the transition provisions of the standard. The impact on the Group has been in the following areas:
(i) There is a new term “remeasurements”. This is made up of actuarial gains and losses, the difference between actual investment
returns and the return implied by the net interest cost. They are recognized in other comprehensive income and not recycled to
income statement. The “corridor” method and the option to spread or recognize immediately in the income statement are no longer
available. This change has resulted in an increase in post-employment obligations and deferred tax assets and decrease in reserves
at 1 January 2012 and 31 December 2012 by US$10,384,000, US$2,777,000 and US$7,607,000 respectively. The standard also
requires the entity to present all actuarial gains and losses previously recognized in profit and loss account in other comprehensive
income. This has resulted in no material impact to either the profit and loss account or comprehensive income for the year ended
31 December 2012. The change has resulted in an increase in retained earnings at 1 January 2012 and 31 December 2012 by
US$897,000 with a decrease in other reserves of same amount.
(ii) The standard replaces the interest cost on the defined benefit obligation and the expected return on plan assets with a net interest
cost based on the net defined benefit asset or liability and the discount rate, measured at the beginning of the year. There is no
change to determining the discount rate; this continues to reflect the yield on high-quality corporate bonds. This has no effect on
total comprehensive income as the charge in profit and loss account is offset by an equivalent amount in other comprehensive
income. This change has resulted in an increase in retained earnings at 1 January 2012 of US$836,000 with a decrease in other
reserves of same amount. The effects of the change in the profit and loss account charge for the year ended 31 December 2012
were immaterial.
(iii) ‘Post-employment benefit obligation’ as previously reported has been restated at the reporting dates to reflect the effect of the
above. Amounts have been restated as at 1 January 2012 as US$23,480,000 (previously US$13,096,000); and 31 December 2012 as
US$28,770,000 (previously US$18,386,000).
(iv) The effects of the change in accounting policy has no effect on the cash flow statement and immaterial effect on earnings per share.

90 LI & FUNG LIMITED | ANNUAL REPORT 2013
NOTES TO THE ACCOUNTS (CONTINUED)
1 BASIS OF PREPARATION AND PRINCIPAL ACCOUNTING POLICIES (CONTINUED)
1.1 BASIS OF PREPARATION (CONTINUED)
(b) New standards, new interpretation and amendments to existing standards that have been issued but are not yet effective and have
not been early adopted by the Group
The following new standards, new interpretation and amendments to existing standards have been issued and are mandatory for the
Group’s accounting periods beginning on or after 1 January 2014 or later periods, but the Group has not early adopted them:
HKFRS 10, 12 and 27 (2011) (amendment) Investment entities1
Amendments to HKAS 32 Offsetting Financial Assets and Financial Liabilities1
Amendments to HKAS 36 Recoverable amount disclosures for non-financial assets1
HK (IFRIC) – Int 21 Levis1
HKAS 19 (2011) (amendment) Defined benefit plans: Employee contributions1
HKFRS 7 and 9 (amendment) Mandatory effective date and transition disclosures2
HKFRS 9 Financial instruments2
HKAS 39 (amendment) Financial instruments: Recognition and Measurement – Novation of derivatives1
HKFRS 14 Regulatory Deferral Accounts3
NOTES:1 Effective for annual periods beginning on or after 1 January 2014
2 Effective for annual periods beginning on or after 1 January 2015
3 Effective for annual periods beginning on or after 1 January 2016
The Group is in the process of making an assessment of the impact of these new standards, new interpretation and amendments to
existing standards upon initial application.
1.2 CONSOLIDATION
The consolidated accounts include the accounts of the Company and all its subsidiaries made up to 31 December 2013.
(a) Subsidiaries
Subsidiaries are all entities (including structured entities) over which the group has control. The group controls an entity when the group
is exposed to, or has rights to, variable returns from its involvement with the entity and has the ability to affect those returns through its
power over the entity.
Subsidiaries are fully consolidated from the date on which control is transferred to the Group. They are de-consolidated from the date
that control ceases.
The Group uses the acquisition method of accounting to account for business combinations. The consideration transferred for the
acquisition of a subsidiary is the aggregate of the fair values of the assets transferred, the liabilities incurred and the equity interests issued
by the Group. The consideration transferred includes the fair value of any asset or liability resulting from a contingent consideration
arrangement. Acquisition-related costs are expensed as incurred. Identifiable assets acquired and liabilities and contingent liabilities
assumed in a business combination are measured initially at their fair values at the acquisition date. On an acquisition-by-acquisition
basis, the Group recognises any non-controlling interest in the acquiree either at fair value or at the non-controlling interest’s
proportionate share of the acquiree’s net assets.

91LI & FUNG LIMITED | ANNUAL REPORT 2013
NOTES TO THE ACCOUNTS (CONTINUED)
1 BASIS OF PREPARATION AND PRINCIPAL ACCOUNTING POLICIES (CONTINUED)
1.2 CONSOLIDATION (CONTINUED)
(a) Subsidiaries (continued)
Any contingent consideration to be transferred by the Group is recognized at fair value at the acquisition date. Subsequent changes to
the fair value of the contingent consideration that is deemed to be an asset or liability is recognized in accordance with HKAS 39 either
in profit or loss or as a change to other comprehensive income. Contingent consideration that is classified as equity is not remeasured,
and its subsequent settlement is accounted for within equity.
The excess of the consideration transferred, the amount of any non-controlling interest in the acquiree and the acquisition-date fair value
of any previous equity interest in the acquiree over the fair value of the identifiable net assets acquired is recorded as goodwill (Note
1.6). If this is less than the fair value of the net assets of the subsidiary acquired in the case of a bargain purchase, the difference is
recognized directly in the statement of comprehensive income.
Inter-company transactions, balances and unrealized gains on transactions between group companies are eliminated. Unrealized losses
are also eliminated unless the transaction provides evidence of an impairment of the asset transferred. Accounting policies and financial
information of subsidiaries have been changed where necessary to ensure consistency with the policies adopted by the Group.
Investments in subsidiaries are accounted for at cost less impairment. Cost is adjusted to reflect changes in consideration arising from
contingent consideration amendments. Cost also includes direct attributable costs of investment.
In the Company’s balance sheet the investments in subsidiaries are stated at cost less provision for impairment losses (Note 1.7). The
results of subsidiaries are accounted for by the Company on the basis of dividend received and receivable.
(b) Transactions with non-controlling interests
The Group treats transactions with non-controlling interests that do not result in loss of control as transactions with equity owners of the
Group. For purchases from non-controlling interests, the difference between any consideration paid and the relevant share acquired of
the carrying value of net assets of the subsidiary is recorded in equity. Gains or losses on disposals to non-controlling interests are also
recorded in equity.
(c) Associated companies
Associated companies are all entities over which the Group has significant influence but not control, generally accompanying a
shareholding of between 20% and 50% of the voting rights. Investments in associated companies are accounted for using the equity
method of accounting and are initially recognized at cost, and the carrying amount is increased or decreased to recognize the investor’s
share of the profit or loss of the investee after the date of acquisition. The Group’s investment in associated companies includes goodwill
(net of any accumulated impairment loss) identified on acquisition (Note 1.6).
The Group’s share of its associated companies’ post-acquisition profits or losses is recognized in the consolidated profit and loss
account, and its share of post-acquisition movements in other comprehensive income is recognized in other comprehensive income.
The cumulative post-acquisition movements are adjusted against the carrying amount of the investment.
When the Group’s share of losses in an associate equals or exceeds its interest in the associate, including any other unsecured
receivables, the Group does not recognise further losses, unless it has incurred legal or constructive obligations or made payments on
behalf of the associate.

92 LI & FUNG LIMITED | ANNUAL REPORT 2013
NOTES TO THE ACCOUNTS (CONTINUED)
1 BASIS OF PREPARATION AND PRINCIPAL ACCOUNTING POLICIES (CONTINUED)
1.2 CONSOLIDATION (CONTINUED)
(c) Associated companies (continued)
The Group determines at each reporting date whether there is any objective evidence that the investment in the associate is impaired. If
this is the case, the Group calculates the amount of impairment as the difference between the recoverable amount of the associate and
its carrying value and recognises the amount adjacent to “share of profits less losses of associated companies” in the consolidated profit
and loss account.
Unrealized gains on transactions between the Group and its associated companies are eliminated to the extent of the Group’s interests
in the associated companies. Unrealized losses are also eliminated unless the transaction provides evidence of an impairment of the
asset transferred. The financial information of associated companies has been changed where necessary to ensure consistency with the
policies adopted by the Group.
Dilution gains and losses in associates are recognized in the consolidated profit and loss account.
(d) Joint ventures
The Group has applied HKFRS 11 to all joint arrangements as of 1 January 2012. Under HKFRS 11 investments in joint arrangements
are classified as either joint operations or joint ventures depending on the contractual rights and obligations of each investor. The Group
has assessed the nature of its joint arrangements and determined it to be a joint venture. Joint venture is accounted for using the equity
method.
Under the equity method of accounting, interests in joint venture is initially recognized at cost and adjusted thereafter to recognise the
Group’s share of the post-acquisition profits or losses and movements in other comprehensive income. When the Group’s share of
losses in a joint venture equals or exceeds its interests in the joint venture (which includes any long-term interests that, in substance,
form part of the Group’s net investment in the joint venture), the Group does not recognise further losses, unless it has incurred
obligations or made payments on behalf of the joint venture.
Unrealized gains on transactions between the Group and its joint ventures are eliminated to the extent of the Group’s interest in the joint
ventures. Unrealized losses are also eliminated unless the transaction provides evidence of an impairment of the asset transferred.
1.3 SEGMENT REPORTING
Operating segments are reported in a manner consistent with the internal reporting provided to the chief operating decision-maker. The
chief operating decision-maker, who is responsible for allocating resources and assessing performance of the operating segments, has
been identified for making strategic decisions.
1.4 FOREIGN CURRENCY TRANSLATION
(a) Functional and presentation currency
Items included in the accounts of each of the Group’s entities are measured using the currency of the primary economic environment
in which the entity operates (“the functional currency”). The consolidated accounts are presented in US dollar, which is the Company’s
functional and presentation currency.

93LI & FUNG LIMITED | ANNUAL REPORT 2013
NOTES TO THE ACCOUNTS (CONTINUED)
1 BASIS OF PREPARATION AND PRINCIPAL ACCOUNTING POLICIES (CONTINUED)
1.4 FOREIGN CURRENCY TRANSLATION (CONTINUED)
(b) Transactions and balances
Foreign currency transactions are translated into the functional currency using the exchange rates prevailing at the dates of the
transactions or revaluation where items are re-measured. Foreign exchange gains and losses resulting from the settlement of such
transactions and from the translation at year-end exchange rates of monetary assets and liabilities denominated in foreign currencies are
recognized in the consolidated profit and loss account, except when deferred in equity as qualifying cash flow hedges or qualifying net
investment hedges.
Changes in the fair value of monetary securities denominated in foreign currency classified as available-for-sale are analyzed between
translation differences resulting from changes in the amortized cost of the security and other changes in the carrying amount of the
security. Translation differences related to changes in the amortized cost are recognized in profit or loss, and other changes in the
carrying amount are recognized in other comprehensive income.
Translation differences on non-monetary financial assets and liabilities such as equities held at fair value through profit or loss are
recognized in profit or loss as part of the fair value gain or loss. Translation differences on non-monetary financial assets such as equities
classified as available-for-sale are included in the available-for-sale reserve in other comprehensive income.
(c) Group companies
The results and financial position of all the Group entities (none of which has the currency of a hyperinflationary economy) that have a
functional currency different from the presentation currency are translated into the presentation currency as follows:
(i) assets and liabilities for each balance sheet presented are translated at the closing rate at the date of that balance sheet;
(ii) income and expenses for each profit and loss account are translated at average exchange rates (unless this average is not a
reasonable approximation of the cumulative effect of the rates prevailing on the transaction dates, in which case income and
expenses are translated at the dates of the transactions); and
(iii) all resulting exchange differences are recognized in other comprehensive income.
On consolidation, exchange differences arising from the translation of the net investment in foreign operations, and of borrowings and
other currency instruments designated as hedges of such investments, are taken to other comprehensive income.
On the disposal of a foreign operation (that is, a disposal of the group’s entire interest in a foreign operation, or a disposal involving loss
of control over a subsidiary that includes a foreign operation, a disposal involving loss of joint control over a jointly controlled entity that
includes a foreign operation, or a disposal involving loss of significant influence over an associate that includes a foreign operation), all
of the exchange differences accumulated in equity in respect of that operation attributable to the equity holders of the Company are
reclassified to profit or loss.
94 LI & FUNG LIMITED | ANNUAL REPORT 2013
NOTES TO THE ACCOUNTS (CONTINUED)
1 BASIS OF PREPARATION AND PRINCIPAL ACCOUNTING POLICIES (CONTINUED)
1.4 FOREIGN CURRENCY TRANSLATION (CONTINUED)
(c) Group companies (continued)
In the case of a partial disposal that does not result in the Group losing control over a subsidiary that includes a foreign operation, the
proportionate share of accumulated exchange differences are re-attributed to non-controlling interests and are not recognized in profit
or loss. For all other partial disposals (that is, reductions in the Group’s ownership interest in associates or jointly controlled entities that
do not result in the Group losing significant influence or joint control) the proportionate share of the accumulated exchange difference is
reclassified to profit or loss.
Goodwill and fair value adjustments arising on the acquisition of a foreign entity are treated as assets and liabilities of the foreign entity
and translated at the closing rate. Exchange differences arising are recognized in equity.
1.5 PROPERTY, PLANT AND EQUIPMENT
(a) Land and buildings
Freehold land is stated at cost less impairment.
Buildings are stated at cost less accumulated depreciation and accumulated impairment losses.
(b) Other property, plant and equipment
Other property, plant and equipment, comprising leasehold improvements, furniture, fixtures and equipment, plant and machinery,
motor vehicles and company boat, are stated at cost less accumulated depreciation and accumulated impairment losses.
(c) Depreciation and impairment
Freehold land is not depreciated. Other classes of property, plant and equipment are depreciated at rates sufficient to allocate their
costs less accumulated impairment losses to their residual values over their estimated useful lives on a straight-line basis. The principal
annual rates are as follows:
Leasehold land shorter of lease term or useful life
Buildings and leasehold improvements 2% – 20%
Furniture, fixtures and equipment 62/3% – 331/3%
Plant and machinery 10% – 15%
Motor vehicles and company boat 15% – 20%
The assets’ residual values and useful lives are reviewed, and adjusted if appropriate, at the end of each reporting period. An asset’s
carrying amount is written down immediately to its recoverable amount if the asset’s carrying amount is greater than its estimated
recoverable amount (Note 1.7). Subsequent costs are included in the asset’s carrying amount or recognized as a separate asset, as
appropriate, only when it is probable that future economic benefits associated with the item will flow to the Group and the cost of the
item can be measured reliably. The carrying amount of the replaced part is derecognized. All other repair and maintenance costs are
expensed in the consolidated profit and loss account during the financial period in which they are incurred.

95LI & FUNG LIMITED | ANNUAL REPORT 2013
NOTES TO THE ACCOUNTS (CONTINUED)
1 BASIS OF PREPARATION AND PRINCIPAL ACCOUNTING POLICIES (CONTINUED)
1.5 PROPERTY, PLANT AND EQUIPMENT (CONTINUED)
(d) Gain or loss on disposal
The gain or loss on disposal of property, plant and equipment is the difference between the net sales proceeds and the carrying amount
of the relevant item, and is recognized in the consolidated profit and loss account.
1.6 INTANGIBLE ASSETS
(a) Goodwill
Goodwill represents the excess of the considerations transferred over the net fair value of the Group’s share of the net identifiable
assets/liabilities and contingent liabilities of the acquired business/associated company/joint venture at the date of acquisition (Note
1.2(a)). Goodwill on acquisitions of subsidiaries is included in intangible assets. Goodwill on acquisitions of associated companies and
joint ventures are included in interests in associated accompanies and joint ventures and are tested annually for impairment as part of
the overall balance. Separately recognized goodwill is tested annually for impairment and carried at cost less accumulated impairment
losses. Impairment losses on goodwill are not reversed. Gains and losses on the disposal of an entity include the carrying amount of
goodwill relating to the entity sold.
Goodwill is allocated to cash-generating units for the purpose of impairment testing. The allocation is made to those cash-generating
units or groups of cash-generating units that are expected to benefit from the business combination in which the goodwill arose
identified according to operating segment. Each unit or groups of units to which the goodwill is allocated represents the lowest level
within the entity at which the goodwill is monitored for internal management purpose.
Goodwill impairment reviews are undertaken annually or more frequently if events or changes in circumstances indicate a potential
impairment. The carrying value of goodwill is compared to the recoverable amount, which is the higher of value in use and the fair value
less costs to sell. Any impairment is recognized immediately as an expense and is not subsequently reversed.
(b) Computer software and system development costs
Acquired computer software licences are capitalized on the basis of the costs incurred to acquire and bring to use the specific software.
These costs are amortized over the estimated useful lives of 3 to 10 years.
Costs associated with developing or maintaining computer software programmes are recognized as an expense as incurred. Costs that
are directly associated with the development of identifiable and unique software products controlled by the Group, and that will probably
generate economic benefits exceeding costs beyond one year, are recognized as intangible assets. Costs include the employee costs
incurred as a result of developing software and an appropriate portion of relevant overheads.
System development costs recognized as assets are amortized over their estimated useful lives of 3 to 10 years.
96 LI & FUNG LIMITED | ANNUAL REPORT 2013
NOTES TO THE ACCOUNTS (CONTINUED)
1 BASIS OF PREPARATION AND PRINCIPAL ACCOUNTING POLICIES (CONTINUED)
1.6 INTANGIBLE ASSETS (CONTINUED)
(c) Other intangible assets arising from business combinations
Intangible assets, other than goodwill, identified on business combinations are capitalized at their fair values. They represent mainly
trademarks, buying agency agreements secured, and relationships with customers and licensors. Intangible assets arising from business
combinations with definite useful lives are amortized on a straight-line basis from the date of acquisition over their estimated useful lives
ranging from 5 to 20 years.
(d) Brand licenses
Brand licenses are license contracts entered into with the brand-holders by the Group in the capacity as licensee. Brand licenses are
capitalized based on the upfront costs incurred and the present value of guaranteed royalty payments to be made subsequent to the
inception of the license contracts. Brand licenses are amortized based on expected usage from the date of first commercial usage over
the remaining licence periods ranging from approximately 1 to 10 years.
1.7 IMPAIRMENT OF INVESTMENTS IN SUBSIDIARIES, ASSOCIATED COMPANIES, JOINT VENTURES AND
NON-FINANCIAL ASSETS
Assets that have an indefinite useful life, for example goodwill, are not subject to amortization and are tested annually for impairment.
Assets are reviewed for impairment whenever events or changes in circumstances indicate that the carrying amount may not be
recoverable. An impairment loss is recognized for the amount by which the asset’s carrying amount exceeds its recoverable amount.
The recoverable amount is the higher of an asset’s fair value less costs to sell and value in use. For the purposes of assessing
impairment, assets are grouped at the lowest levels for which there are separately identifiable cash flows (cash-generating units). Non-
financial assets other than goodwill that suffer an impairment are reviewed for possible reversal of the impairment at each reporting date.
Impairment testing of the investments in subsidiaries, associated companies or joint ventures is required upon receiving dividends from
these investments if the dividend exceeds the total comprehensive income of the subsidiary, associated companies or joint ventures in
the period the dividend is declared or if the carrying amount of the investment in the separate financial statements exceeds the carrying
amount in the consolidated financial statements of the investee’s net assets including goodwill.
1.8 FINANCIAL ASSETS
Classification
The Group classifies its financial assets as either loans and receivables or available-for-sale. The classification depends on the purpose
for which the financial assets were acquired. Management determines the classification of its financial assets at initial recognition.
(a) Loans and receivables
Loans and receivables are non-derivative financial assets with fixed or determinable payments that are not quoted in an active market.
They are included in current assets, except for maturities greater than 12 months after the balance sheet date. These are classified
as non-current assets. The Group’s loans and receivables comprise “trade and bills receivable”, “other receivables, prepayments and
deposits”, “cash and bank balances” and “amount due from related companies” in the balance sheet (Note 1.11).

97LI & FUNG LIMITED | ANNUAL REPORT 2013
NOTES TO THE ACCOUNTS (CONTINUED)
1 BASIS OF PREPARATION AND PRINCIPAL ACCOUNTING POLICIES (CONTINUED)
1.8 FINANCIAL ASSETS (CONTINUED)
Classification (continued)
(b) Available-for-sale financial assets
Available-for-sale financial assets are non-derivatives that are either designated in this category or not classified in any other category.
They are included in non-current assets unless management intends to dispose of the investment within 12 months of the balance sheet
date.
Recognition and measurement
Regular purchases and sales of financial assets are recognized on the trade-date – the date on which the Group commits to purchase
or sell the asset. Investments are initially recognized at fair value plus transaction costs for all financial assets not carried at fair value
through profit or loss. Financial assets are derecognized when the rights to receive cash flows from the investments have expired or
have been transferred and the Group has transferred substantially all risks and rewards of ownership. Available-for-sale financial assets
are subsequently carried at fair value. Loans and receivables are subsequently carried at amortized cost using the effective interest
method.
Changes in the fair value of monetary securities denominated in a foreign currency and classified as available-for-sale are analyzed
between translation differences resulting from changes in amortized cost of the security and other changes in the carrying amount of the
security. The translation differences on monetary securities are recognized in consolidated profit or loss; translation differences on non-
monetary securities are recognized in other comprehensive income. Changes in the fair values of monetary and non-monetary securities
classified as available-for-sale are recognized in other comprehensive income.
When securities classified as available-for-sale are sold or impaired, the accumulated fair value adjustments recognized in equity are
included in the consolidated profit and loss account as net investment loss.
Interest on available-for-sale securities calculated using the effective interest method is recognized in the consolidated profit and loss
account as part of interest income. Dividends on available-for-sale equity instruments are recognized in the consolidated profit and loss
account as part of other revenues when the Group’s right to receive payments is established.

98 LI & FUNG LIMITED | ANNUAL REPORT 2013
NOTES TO THE ACCOUNTS (CONTINUED)
1 BASIS OF PREPARATION AND PRINCIPAL ACCOUNTING POLICIES (CONTINUED)
1.9 IMPAIRMENT OF FINANCIAL ASSETS
(a) Assets classified as loans and receivables carried at amortized cost
The Group assesses at the end of each reporting period whether there is objective evidence that a financial asset or group of financial
assets is impaired. A financial asset or a group of financial assets is impaired and impairment losses are incurred only if there is objective
evidence of impairment as a result of one or more events that occurred after the initial recognition of the asset (a ‘loss event’) and that
loss event (or events) has an impact on the estimated future cash flows of the financial asset or group of financial assets that can be
reliably estimated.
The criteria that the Group uses to determine that there is objective evidence of an impairment loss include:
• Significant financial difficulty of the issuer or obligor;
• A breach of contract, such as a default or delinquency in interest or principal payments;
• The Group, for economic or legal reasons relating to the borrower’s financial difficulty, granting to the borrower a concession that the
lender would not otherwise consider;
• It becomes probable that the borrower will enter bankruptcy or other financial reorganization;
• The disappearance of an active market for that financial asset because of financial difficulties; or
• Observable data indicating that there is a measurable decrease in the estimated future cash flows from a portfolio of financial assets
since the initial recognition of those assets, although the decrease cannot yet be identified with the individual financial assets in the
portfolio, including:
(i) adverse changes in the payment status of borrowers in the portfolio;
(ii) national or local economic conditions that correlate with defaults on the assets in the portfolio.
The Group first assesses whether objective evidence of impairment exists.
99LI & FUNG LIMITED | ANNUAL REPORT 2013
NOTES TO THE ACCOUNTS (CONTINUED)
1 BASIS OF PREPARATION AND PRINCIPAL ACCOUNTING POLICIES (CONTINUED)
1.9 IMPAIRMENT OF FINANCIAL ASSETS (CONTINUED)
(a) Assets classified as loans and receivables carried at amortized cost (continued)
The amount of the loss is measured as the difference between the asset’s carrying amount and the present value of estimated future
cash flows (excluding future credit losses that have not been incurred) discounted at the financial asset’s original effective interest rate.
The asset’s carrying amount is reduced and the amount of the loss is recognized in the consolidated profit and loss account. If a loan
has a variable interest rate, the discount rate for measuring any impairment loss is the current effective interest rate determined under
the contract. As a practical expedient, the Group may measure impairment on the basis of an instrument’s fair value using an observable
market price.
If, in a subsequent period, the amount of the impairment loss decreases and the decrease can be related objectively to an event
occurring after the impairment was recognized (such as an improvement in the debtor’s credit rating), the reversal of the previously
recognized impairment loss is recognized in the consolidated profit and loss account.
(b) Assets classified as available-for-sale
The Group assesses at the end of each reporting period whether there is objective evidence that a financial asset or a group of financial
assets is impaired. For debt securities, the Group uses the criteria refer to (a) above. In the case of equity investments classified as
available-for-sale, a significant or prolonged decline in the fair value of the security below its cost is also evidence that the assets are
impaired. If any such evidence exists for available-for-sale financial assets, the cumulative loss – measured as the difference between
the acquisition cost and the current fair value, less any impairment loss on that financial asset previously recognized in profit or loss – is
removed from equity and recognized in the consolidated profit and loss account. Impairment losses recognized in the consolidated profit
and loss account on equity instruments are not reversed through the consolidated profit and loss account. If, in a subsequent period,
the fair value of a debt instrument classified as available-for-sale increases and the increase can be objectively related to an event
occurring after the impairment loss was recognized in profit or loss, the impairment loss is reversed through the separate consolidated
profit and loss account.
1.10 INVENTORIES
Inventories comprise raw materials and finished goods and are stated at the lower of cost and net realisable value. Cost, calculated on a
first-in, first-out (FIFO) basis, comprises purchase prices of inventories and direct costs (based on normal operating capacity). It excludes
borrowing costs. Net realisable value is the estimated selling price in the ordinary course of business less applicable variable selling
expenses.
1.11 TRADE AND OTHER RECEIVABLES
Trade and other receivables are recognized initially at fair value and subsequently measured at amortized cost using the effective
interest method, less provision for impairment. If collection of trade and other receivables is expected in one year or less (or in the
normal operating cycle of the business if longer), they are classified as current asset. If not, they are presented as non-current assets.
A provision for impairment of trade and other receivables is established when there is objective evidence that the Group will not be able
to collect all amounts due according to the original terms of the receivables. Significant financial difficulties of the debtor, probability that
the debtor will enter bankruptcy or financial reorganisation, and default or delinquency in payments (more than 30 days overdue) are
considered indicators that the trade receivable is impaired. The amount of the provision is the difference between the asset’s carrying
amount and the present value of estimated future cash flows, discounted at the original effective interest rate. The carrying amount of
the assets is reduced through the use of an allowance account, and the amount of the loss is recognized in the consolidated profit and
loss account within selling expenses. When a trade receivable is uncollectible, it is written off against the allowance account for trade
receivables. Subsequent recoveries of amounts previously written off are credited against selling expenses in the consolidated profit and
loss account.

100 LI & FUNG LIMITED | ANNUAL REPORT 2013
NOTES TO THE ACCOUNTS (CONTINUED)
1 BASIS OF PREPARATION AND PRINCIPAL ACCOUNTING POLICIES (CONTINUED)
1.12 SHARE CAPITAL
Ordinary shares are classified as equity.
Incremental costs directly attributable to the issue of new shares or options are shown in equity as a deduction, net of tax, from the
proceeds.
1.13 CASH AND CASH EQUIVALENTS
Cash and cash equivalents include cash in hand, deposits held at call with banks and bank overdrafts. Bank overdrafts are shown within
borrowings in current liabilities on the balance sheet.
1.14 BORROWINGS
Borrowings are recognized initially at fair value, net of transaction costs incurred. Borrowings are subsequently stated at amortized cost;
any difference between the proceeds (net of transaction costs) and the redemption value is recognized in the consolidated profit and
loss account over the period of the borrowings using the effective interest method.
Fees paid on the establishment of loan facilities are recognized as transaction costs of the loan to the extent that it is probable that
some or all of the facility will be drawn down. In this case, the fee is deferred until the draw-down occurs. To the extent there is no
evidence that it is probable that some or all of the facility will be drawn down, the fee is capitalized as a prepayment for liquidity services
and amortized over the period of the facility to which it relates.
Borrowings are classified as current liabilities unless the Group has an unconditional right to defer settlement of the liability for at least 12
months after the balance sheet date.
1.15 CURRENT AND DEFERRED TAX
The tax expense for the period comprises current and deferred tax. Tax is recognized in the consolidated profit and loss account,
except to the extent that it relates to items recognized in other comprehensive income or directly in equity. In this case the tax is also
recognized in other comprehensive income or directly in equity, respectively.
The current tax charge is calculated on the basis of the tax laws enacted or substantively enacted at the balance sheet date in the
countries where the Company’s subsidiaries, associates and joint ventures operate and generate taxable income. Management
periodically evaluates positions taken in tax returns with respect to situations in which applicable tax regulation is subject to interpretation
and establishes provisions where appropriate on the basis of amounts expected to be paid to the tax authorities.
Deferred tax is provided, using the liability method, on temporary differences arising between the tax bases of assets and liabilities and
their carrying amounts in the consolidated accounts. However, the deferred tax is not accounted for if it arises from initial recognition
of an asset or liability in a transaction other than a business combination that at the time of the transaction affects neither accounting
nor taxable profit or loss. Deferred tax is determined using tax rates (and laws) that have been enacted or substantively enacted by the
balance sheet date and are expected to apply when the related deferred tax asset is realized or the deferred tax liability is settled.
Deferred tax assets are recognized to the extent that it is probable that future taxable profit will be available against which the temporary
differences can be utilized.

101LI & FUNG LIMITED | ANNUAL REPORT 2013
NOTES TO THE ACCOUNTS (CONTINUED)
1 BASIS OF PREPARATION AND PRINCIPAL ACCOUNTING POLICIES (CONTINUED)
1.15 CURRENT AND DEFERRED TAX (CONTINUED)
Deferred tax is provided on temporary differences arising on investments in subsidiaries, associates, except for deferred tax liability
where the timing of the reversal of the temporary difference is controlled by the Group and it is probable that the temporary difference
will not reverse in the foreseeable future.
Deferred tax assets and liabilities are offset when there is a legally enforceable right to offset current tax assets against current tax
liabilities and when the deferred taxes assets and liabilities relate to income taxes levied by the same taxation authority on either the
taxable entity or different taxable entities where there is an intention to settle the balances on a net basis.
1.16 EMPLOYEE BENEFITS
(a) Employee leave entitlements
Employee entitlements to annual leave are recognized when they accrue to employees. A provision is made for the estimated liability for
annual leave entitlements as a result of services rendered by employees up to the balance sheet date.
Employee entitlements to sick leave and maternity leave are not recognized until the time of leave.
(b) Discretionary bonus
The expected costs of discretionary bonus payments are recognized as a liability when the Group has a present legal or constructive
obligation as a result of services rendered by employees and a reliable estimate of the obligation can be made.
Liabilities for discretionary bonus are expected to be settled within 12 months and are measured at the amounts expected to be paid
when they are settled.
(c) Post-employment benefit obligations
The Group participates in a number of defined contribution plans and defined benefit plans throughout the world, the assets of which
are generally held in separate trustee – administrated funds. The defined benefit pension plans are generally funded by payments from
employees and by the relevant Group companies, taking into account of the recommendations of independent qualified actuaries.
The Group’s contributions to the defined contribution plans are charged to the consolidated profit and loss account in the year to which
the contributions relate.
For defined benefit plans, pension costs are assessed using the projected unit credit method. Under this method, the cost of providing
pensions is charged to the consolidated profit and loss account so as to spread the regular cost over the service lives of employees
in accordance with the advice of the actuaries who carry out a full valuation of the plans on an annual basis. The pension obligation is
measured as the present value of the estimated future cash outflows, discounted by reference to market yields on high quality corporate
bonds which have terms to maturity approximating the terms of the related liabilities. Actuarial gains and losses arising from experience
adjustments and changes in actuarial assumptions are charged or credited to equity in other comprehensive income in the period in
which they arise. Past-service costs are recognized immediately in the income statement.

102 LI & FUNG LIMITED | ANNUAL REPORT 2013
NOTES TO THE ACCOUNTS (CONTINUED)
1 BASIS OF PREPARATION AND PRINCIPAL ACCOUNTING POLICIES (CONTINUED)
1.16 EMPLOYEE BENEFITS (CONTINUED)
(c) Post employment benefit obligations (continued)
The Group’s net obligation in respect of long service payments on cessation of employment in certain circumstances under the Hong
Kong Employment Ordinance is the amount of future benefit that employees have earned in return for their service in the current
and prior periods; that benefit is discounted to determine the present value and reduced by entitlements accrued under the Group’s
retirement plans that are attributable to contributions made by the Group. The obligation is calculated using the projected unit credit
method by a qualified actuary. The discount rate is determined by reference to market yields on high quality corporate bonds which
have terms to maturity approximating the terms of the related liabilities.
(d) Share-based compensation
The Group operates an equity-settled, share-based compensation plan. The fair value of the employee services received in exchange
for the grant of the options is recognized as an expense. The total amount to be expensed over the vesting period is determined by
reference to the fair value of the options granted:
• including any market performance conditions;
• excluding the impact of any service and non-market performance vesting conditions (for example, profitability, sale, growth targets
and remaining an employee of the entity over a specified time period); and
• including the impact of any non-vesting conditions (for example, the requirement for employees to save).
Non-market performance vesting conditions are included in assumptions about the number of options that are expected to vest. The
total expense is recognized over the vesting period, which is the period over which all of the specified vesting conditions are to be
satisfied. At each balance sheet date, the Group revises its estimates on the number of options that are expected to vest. It recognizes
the impact of the revision of original estimates, if any, in the consolidated profit and loss account, with a corresponding adjustment to
employee share-based compensation reserve.
The proceeds received net of any directly attributable transaction costs are credited to share capital (nominal value) and share premium
when the options are exercised.
1.17 PROVISIONS
Provisions are recognized when: the Group has a present legal or constructive obligation as a result of past events; it is probable that an
outflow of resources will be required to settle the obligation; and the amount has been reliably estimated. Provisions are not recognized
for future operating losses.
Where there are a number of similar obligations, the likelihood that an outflow will be required in settlement is determined by considering
the class of obligations as a whole. A provision is recognized even if the likelihood of an outflow with respect to any one item included in
the same class of obligations may be small.
Provisions are measured at the present value of the expenditures expected to be required to settle the obligation using a pre-tax
discount rate that reflects current market assessments of the time value of money and the risks specific to the obligation. The increase
in the provision due to passage of time is recognized as interest expense.

103LI & FUNG LIMITED | ANNUAL REPORT 2013
NOTES TO THE ACCOUNTS (CONTINUED)
1 BASIS OF PREPARATION AND PRINCIPAL ACCOUNTING POLICIES (CONTINUED)
1.18 CONTINGENT LIABILITIES AND CONTINGENT ASSETS
A contingent liability is a possible obligation that arises from past events and whose existence will only be confirmed by the occurrence
or non-occurrence of one or more uncertain future events not wholly within the control of the Group. It can also be a present obligation
arising from past events that is not recognized because it is not probable that outflow of economic resources will be required or the
amount of obligation cannot be measured reliably.
A contingent liability is not recognized but is disclosed in the notes to the accounts. When a change in the probability of an outflow
occurs so that outflow is probable, it will then be recognized as a provision.
A contingent asset is a possible asset that arises from past events and whose existence will be confirmed only by the occurrence or
non-occurrence of one or more uncertain events not wholly within the control of the Group.
Contingent assets are not recognized but are disclosed in the notes to the accounts when an inflow of economic benefits is probable.
When inflow is virtually certain, an asset is recognized.
1.19 TOTAL MARGIN
Total margin includes gross profit and other income relating to the trading, distribution and logistics businesses.
1.20 CORE OPERATING PROFIT
Core operating profit is the profit before taxation generated from the Group’s trading, distribution and logistics businesses excluding
share of results of associated companies and joint ventures, interest income, interest expenses, tax, costs, material gains or losses
which are of capital nature or non operational related, acquisition related cost. This also excludes gain or loss on remeasurement of
contingent consideration payable and amortization of other intangible assets which are non-cash items.
1.21 REVENUE RECOGNITION
Revenue comprises the fair value of the consideration received or receivable for the sale of goods and services in the ordinary course
of the Group’s activities. Revenue is shown net of value-added tax, returns, rebates and discounts and after eliminating sales within the
Group.
The Group recognizes revenue when the amount of revenue can be reliably measured, it is probable that future economic benefits will
flow to the entity and specific criteria have been met for each of the Group’s activities as described below. The amount of revenue is not
considered to be reliably measurable until all contingencies relating to the sale have been resolved. The Group bases its estimates on
historical results, taking into consideration the type of customer, the type of transaction and the specifics of each arrangement.
Revenue from the sale of goods is recognized on the transfer of risks and rewards of ownership, which generally coincides with the time
when the goods are delivered to customers and title has been passed.
A service income is recognized in the accounting period in which the services are rendered, by reference to completion of the specific
transaction assessed on the basis of the actual service provided as a proportion of the total services to be provided.

104 LI & FUNG LIMITED | ANNUAL REPORT 2013
NOTES TO THE ACCOUNTS (CONTINUED)
1 BASIS OF PREPARATION AND PRINCIPAL ACCOUNTING POLICIES (CONTINUED)
1.21 REVENUE RECOGNITION (CONTINUED)
Interest income is recognized using the effective interest method. When a loan and receivable is impaired, the group reduces the
carrying amount to its recoverable amount, being the estimated future cash flow discounted at the original effective interest rate of the
instrument, and continues unwinding the discount as interest income. Interest income on impaired loan and receivables are recognized
using the original effective interest rate.
Dividend income is recognized when the right to receive payment is established.
Other income incidental to normal operating activities is recognized when the services are rendered or the right to receive payment is
established.
1.22 BORROWING COSTS
Borrowing costs that are directly attributable to the acquisition, construction or production of qualifying asset that necessarily takes a
substantial period of time to get ready for its intended use or sale are capitalized as part of the cost of that asset, until such time as the
assets are substantially ready for their intended use or sale.
Investment income earned on the temporary investment of specific borrowings pending their expenditure on qualifying assets is
deducted from the borrowing costs eligible for capitalisation.
All other borrowing costs are charged to the consolidated profit and loss account in the year in which they are incurred.
1.23 OPERATING LEASES
Leases in which a significant portion of the risks and rewards of ownership are retained by the lessor are classified as operating leases.
Payments made under operating leases (net of any incentives received from the lessor) are charged to the consolidated profit and loss
account on a straight-line basis over the period of the lease. The upfront prepayments made for leasehold land and land use rights
are amortized on a straight-line basis over the period of the lease or where there is impairment, the impairment is expensed in the
consolidated profit and loss account.
1.24 DERIVATIVE FINANCIAL INSTRUMENTS AND HEDGING ACTIVITIES
Derivatives are initially recognized at fair value on the date a derivative contract is entered into and are subsequently remeasured at their
fair value. The method of recognising the resulting gain or loss depends on whether the derivative is designated as a hedging instrument,
and if so, the nature of the item being hedged. The Group designates certain derivatives as hedges of a particular risk associated with a
recognized liability or a highly probable forecast transaction (cash flow hedge).
The Group documents, at the inception of the transaction, the intended relationship between hedging instruments and hedged items,
as well as its risk management objectives and strategy for undertaking various hedge transactions. The Group also documents its
assessment, both at hedge inception and on an ongoing basis, of whether the derivatives that are used in hedging transactions are
highly effective in offsetting changes in fair values or cash flows of hedged items.
Movements in the fair values of hedging derivatives are included within shareholders’ equity. The full fair value of a hedging derivative is
classified as a non-current asset or liability when the remaining maturity of the hedged item is more than 12 months. Trading derivatives
are classified as a current asset or liability.

105LI & FUNG LIMITED | ANNUAL REPORT 2013
NOTES TO THE ACCOUNTS (CONTINUED)
1 BASIS OF PREPARATION AND PRINCIPAL ACCOUNTING POLICIES (CONTINUED)
1.24 DERIVATIVE FINANCIAL INSTRUMENTS AND HEDGING ACTIVITIES (CONTINUED)
(a) Cash flow hedge
The effective portion of changes in the fair value of derivatives that are designated and qualify as cash flow hedges are recognized in
other comprehensive income. The gain or loss relating to the ineffective portion is recognized immediately in the consolidated profit and
loss account.
Amounts accumulated in equity are recycled to the consolidated profit and loss account in the periods when the hedged item affects
profit or loss (for example, when the forecast sale that is hedged takes place). The gain or loss relating to the effective portion of forward
foreign exchange contracts hedging export sales is recognized in the consolidated profit and loss account within sales. The gain or loss
relating to the ineffective portion is recognized in the consolidated profit and loss account within other gains/(losses) – net. However,
when the forecast transaction that is hedged results in the recognition of a non-financial asset (for example, inventory or property, plant
and equipment), the gains and losses previously deferred in equity are transferred from equity and included in the initial measurement
of the cost of the asset. The deferred amounts are ultimately recognized in cost of goods sold in case of inventory, or in depreciation in
case of property, plant and equipment.
When a hedging instrument expires or is sold, or when a hedge no longer meets the criteria for hedge accounting, any cumulative gain
or loss existing in equity at that time remains in equity and is recognized when the forecast transaction is ultimately recognized in the
consolidated profit and loss account. When a forecast transaction is no longer expected to occur, the cumulative gain or loss that was
reported in equity is immediately transferred to the consolidated profit and loss account.
(b) Derivatives at fair value through profit or loss
Derivatives financial instruments recognized at fair value through profit or loss include certain derivative instruments that do not qualify for
hedge accounting and conversion right embedded in convertible promissory note (Note 21). Both are initially recognized at fair value on
the date a derivative contract is entered into and are subsequently remeasured at their fair value. Changes in the fair values of derivative
financial instruments are recognized immediately in the consolidated profit and loss account.
1.25 TRADE PAYABLES
Trade payables are obligations to pay for goods or services that have been acquired in the ordinary course of business from suppliers.
Accounts payable are classified as current liabilities if payment is due within one year or less (or in the normal operating cycle of the
business if longer). If not, they are presented as non-current liabilities.
Trade payables are recognized initially at fair value and subsequently measured at amortized cost using the effective interest method.
1.26 DIVIDEND DISTRIBUTION
Dividend distribution to the Company’s shareholders is recognized as a liability in the Group’s and Company’s accounts in the period in
which the dividends are approved by the Company’s shareholders.
1.27 SHARES HELD BY ESCROW AGENT FOR SETTLEMENT OF ACQUISITION CONSIDERATION
In relation to certain business combinations, the Company may issue shares to escrow agents for the settlement of acquisition
consideration payables. The shares, valued at the agreed upon issue price, including any directly attributable incremental costs, are
presented as “Shares held by escrow agent for settlement of acquisition consideration” and deducted from total equity. The number of
shares held by escrow agent for settlement of acquisition consideration would be eliminated against the corresponding number of share
capital issued in the calculation of the earnings per share for profit attributable to the shareholders of the Company.
106 LI & FUNG LIMITED | ANNUAL REPORT 2013
NOTES TO THE ACCOUNTS (CONTINUED)
1 BASIS OF PREPARATION AND PRINCIPAL ACCOUNTING POLICIES (CONTINUED)
1.28 FINANCIAL GUARANTEE CONTRACT
Financial guarantees are initially recognized in the financial statements at fair value on the date the guarantee was given. The Company’s
liabilities under such guarantees are subsequently measured at the higher of the initial amount, less amortization of fees recognized
in accordance with HKAS 18, and the best estimate of the amount required to settle the guarantee. These estimates are determined
based on experience of similar transactions and history of past losses, supplemented by the judgement of management. The fee income
earned is recognized on a straight-line basis over the life of the guarantee. Any increase in the liability relating to guarantees is reported
in the consolidated profit and loss account within administrative expenses.
2 CRITICAL ACCOUNTING ESTIMATES AND JUDGMENTSEstimates and judgments are continually evaluated and are based on historical experience and other factors, including expectations of
future events that are believed to be reasonable under the circumstances.
The Group makes estimates and assumptions concerning the future. The resulting accounting estimates will, by definition, seldom equal
the related actual results. The estimates and assumptions that have a significant risk of causing a material adjustment to the carrying
amounts of assets and liabilities within the next financial year are discussed below.
(a) ESTIMATED IMPAIRMENT OF INTANGIBLE ASSETS INCLUDING GOODWILL
The Group tests annually whether goodwill has suffered any impairment, in accordance with the accounting policy stated in Note 1.6.
The recoverable amounts of cash-generating units have been determined based on value-in-use calculations. These calculations require
the use of estimates (Note 12).
(b) USEFUL LIVES OF INTANGIBLE ASSETS
The Group amortizes its intangible assets with finite useful lives on a straight-line basis over their estimated useful lives. The estimated
useful lives reflect the management’s estimates of the periods that the Group intends to derive future economic benefits from the use of
these intangible assets.
(c) INCOME TAXES
The Group is subject to income taxes in numerous jurisdictions. Significant judgment is required in determining the worldwide provision
for income taxes. There are many transactions and calculations for which the ultimate tax determination is uncertain during the ordinary
course of business. The Group recognizes liabilities for anticipated tax audit issues based on estimates of whether additional taxes will
be due. Where the final tax outcome of these matters is different from the amounts that were initially recorded, such differences will
impact the income tax and deferred tax provisions in the period in which such determination is made.
(d) CONTINGENT CONSIDERATIONS OF ACQUISITIONS
Certain of the Group’s business acquisitions have involved post-acquisition performance-based contingent considerations. HKFRS 3
(Revised) is effective prospectively to business combinations for which the acquisition date is on or after the beginning of the first annual
reporting period beginning on or after 1 July 2009. The Group follows the requirement of HKFRS 3 (Revised) to recognize the fair value
of those contingent considerations for acquisitions, as of their respective acquisition dates as part of the consideration transferred in
exchange for the acquired businesses/subsidiaries. These fair value measurements require, among other things, significant estimation
of post-acquisition performance of the acquired subsidiaries/business and significant judgment on time value of money. Contingent
considerations shall be re-measured at their fair value resulting from events or factors emerging after the acquisition date, with any
resulting gain or loss recognized in the consolidated profit and loss account in accordance with HKFRS 3 (Revised). For acquisitions
completed prior to 1 January 2010, the effective date of HKFRS 3 (Revised) for the Group, changes in the fair values of contingent
consideration are recognized in goodwill.

107LI & FUNG LIMITED | ANNUAL REPORT 2013
NOTES TO THE ACCOUNTS (CONTINUED)
2 CRITICAL ACCOUNTING ESTIMATES AND JUDGMENTS (CONTINUED)
(d) CONTINGENT CONSIDERATIONS OF ACQUISITIONS (CONTINUED)
The basis of the contingent consideration differs for each acquisition; generally however the contingent consideration reflects a specified
multiple of the post-acquisition financial profitability of the acquired business. Consequently, the actual additional consideration payable
may vary according to the future performance of each individual acquired business, and the liabilities provided reflect estimates of such
future performances.
Due to the number of acquisitions for which additional consideration remains outstanding and the variety of bases of determination, it is
not practicable to provide any meaningful sensitivity in relation to the critical assumptions concerning future profitability of each acquired
business and the potential impact on the gain or loss on remeasurement of contingent consideration payables and goodwill for each
acquired businesses.
However, if the total actual contingent consideration payables are 10% lower or higher than the total contingent consideration payables
estimated by management, the resulting aggregate impact to the gain or loss on remeasurement of contingent consideration payables
for acquisitions made after 2010 would be US$127 million, and the resulting aggregate impact to the goodwill on remeasurement of
contingent consideration payable for acquisitions made prior to 1 January 2010 would be US$12 million.
3 SEGMENT INFORMATIONThe Company is domiciled in Bermuda. The Company is a limited liability company incorporated in Bermuda. The address of its
registered office is Canon’s Court, 22 Victoria Street, Hamilton HM 12, Bermuda and its Hong Kong office is at 11/F, Li Fung Tower, 888
Cheung Sha Wan Road, Kowloon, Hong Kong. The Group is principally engaged in managing the supply chain for retailers and brands
worldwide with over 300 offices and distribution centers in more than 40 economies spanning across the Americas, Europe, Africa and
Asia. Turnover represents revenue generated from sales and services rendered at invoiced value to customers outside the Group less
discounts and returns.
The Group’s management (Chief Operating Decision-Maker) considers the business principally from the perspective of three global
Networks, namely Trading Network, Logistics Network and Distribution Network. Trading Network is the operating segment that focuses
on the global sourcing business. Logistics Network is the operating segment that runs both the Group’s international and domestic
logistics services networks globally. Distribution Network is the operating segment that operates the onshore distribution businesses in
the US, Pan-European and Asian regions.
The Group’s management assesses the performance of the operating segments based on a measure of operating profit, referred to
as core operating profit (see Note 1.20). This measurement basis includes profit of the operating segments before share of results
of associated companies and joint ventures, interest income, interest expenses and tax, but excludes material gains or losses which
are of capital nature or non-recurring nature, and other recurring items such as gain on remeasurement of contingent consideration
payable, amortization of other intangible assets and acquisition-related costs. Other information provided to the Group’s management is
measured in a manner consistent with that in the accounts.
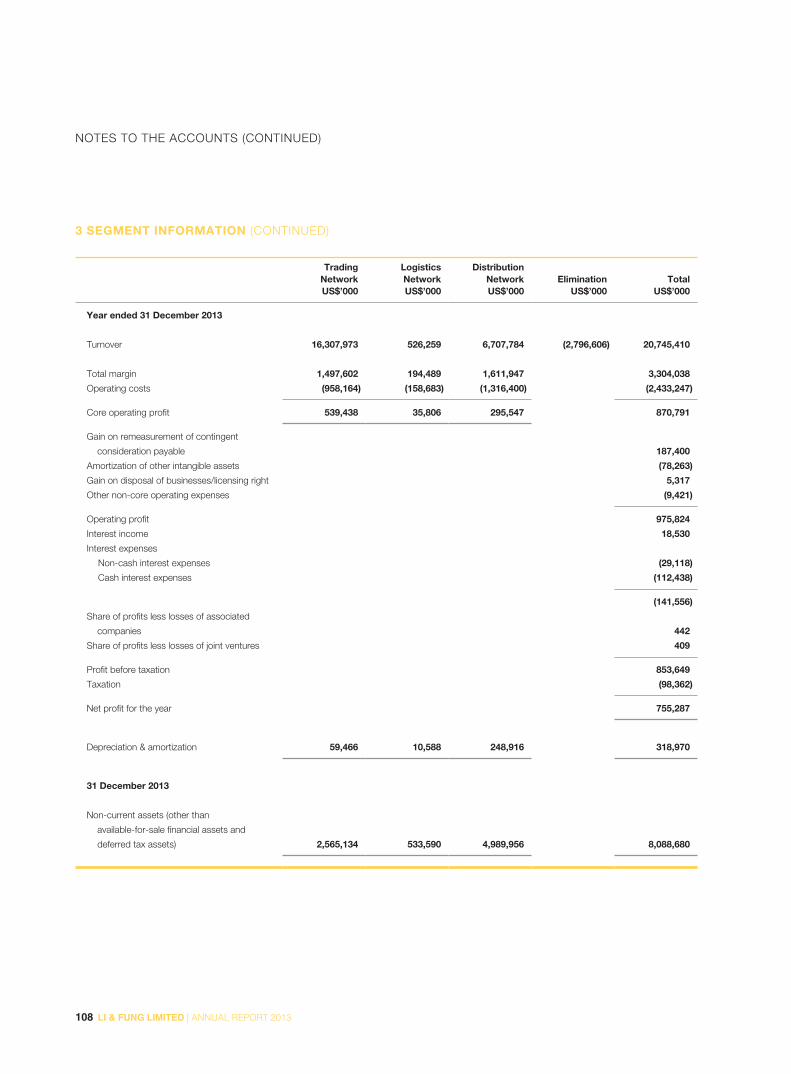
108 LI & FUNG LIMITED | ANNUAL REPORT 2013
NOTES TO THE ACCOUNTS (CONTINUED)
3 SEGMENT INFORMATION (CONTINUED)
Trading
NetworkLogisticsNetwork
DistributionNetwork Elimination Total
US$’000 US$’000 US$’000 US$’000 US$’000
Year ended 31 December 2013
Turnover 16,307,973 526,259 6,707,784 (2,796,606) 20,745,410
Total margin 1,497,602 194,489 1,611,947 3,304,038
Operating costs (958,164) (158,683) (1,316,400) (2,433,247)
Core operating profit 539,438 35,806 295,547 870,791
Gain on remeasurement of contingent
consideration payable 187,400
Amortization of other intangible assets (78,263)
Gain on disposal of businesses/licensing right 5,317
Other non-core operating expenses (9,421)
Operating profit 975,824
Interest income 18,530
Interest expenses
Non-cash interest expenses (29,118)
Cash interest expenses (112,438)
(141,556)
Share of profits less losses of associated
companies 442
Share of profits less losses of joint ventures 409
Profit before taxation 853,649
Taxation (98,362)
Net profit for the year 755,287
Depreciation & amortization 59,466 10,588 248,916 318,970
31 December 2013
Non-current assets (other than
available-for-sale financial assets and
deferred tax assets) 2,565,134 533,590 4,989,956 8,088,680

109LI & FUNG LIMITED | ANNUAL REPORT 2013
NOTES TO THE ACCOUNTS (CONTINUED)
3 SEGMENT INFORMATION (CONTINUED)
Trading
NetworkLogisticsNetwork
DistributionNetwork Elimination Total
US$’000 US$’000 US$’000 US$’000 US$’000
Year ended 31 December 2012
Turnover 16,130,928 403,687 6,435,914 (2,748,723) 20,221,806
Total margin 1,450,817 159,794 1,353,184 2,963,795
Operating costs (924,625) (135,930) (1,392,067) (2,452,622)
Core operating profit/(loss) 526,192 23,864 (38,883) 511,173
Gain on remeasurement of contingent
consideration payable 325,591
Amortization of other intangible assets (64,944)
Gain on disposal of businesses 29,635
Other non-core operating expenses (10,752)
Operating profit 790,703
Interest income 20,385
Interest expenses
Non-cash interest expenses (24,656)
Cash interest expenses (110,453)
(135,109)
Share of profits less losses of associated
companies 638
Profit before taxation 676,617
Taxation (54,053)
Net profit for the year 622,564
Depreciation & amortization 50,169 7,103 228,104 285,376
31 December 2012
Non-current assets (other than
available-for-sale financial assets and
deferred tax assets) 2,361,712 511,304 4,634,607 7,507,623
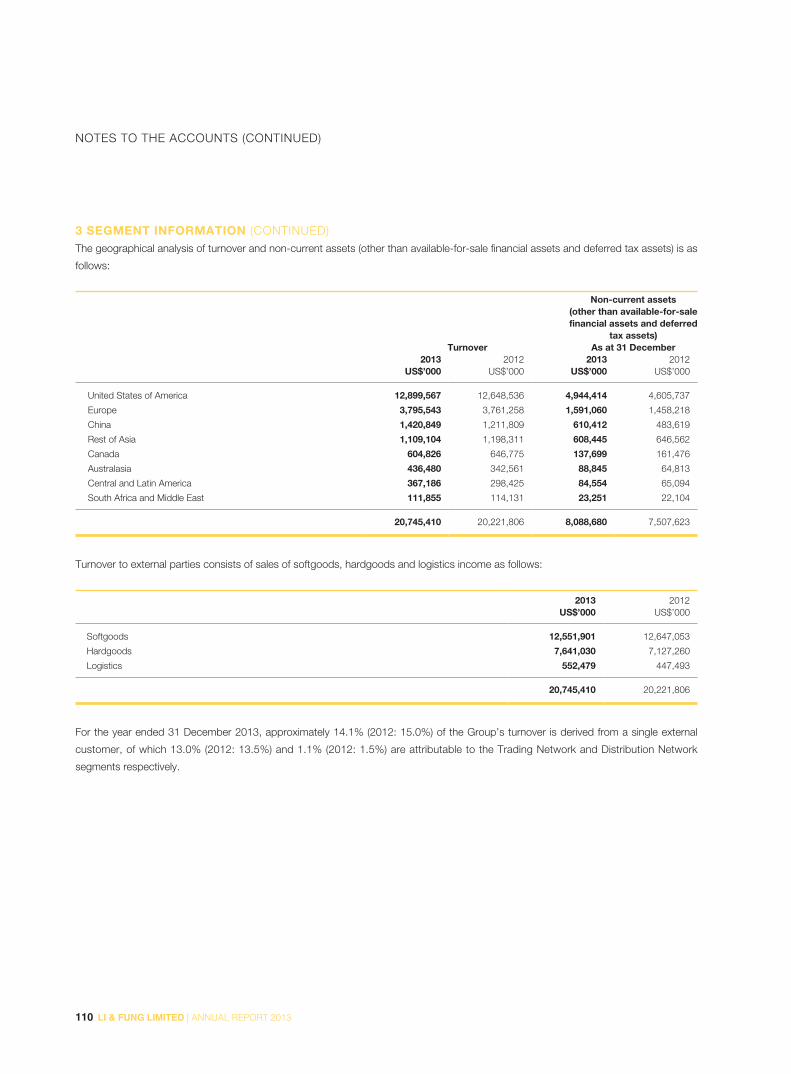
110 LI & FUNG LIMITED | ANNUAL REPORT 2013
NOTES TO THE ACCOUNTS (CONTINUED)
3 SEGMENT INFORMATION (CONTINUED)The geographical analysis of turnover and non-current assets (other than available-for-sale financial assets and deferred tax assets) is as
follows:
Non-current assets
(other than available-for-salefinancial assets and deferred
tax assets)Turnover As at 31 December
2013 2012 2013 2012US$’000 US$’000 US$’000 US$’000
United States of America 12,899,567 12,648,536 4,944,414 4,605,737
Europe 3,795,543 3,761,258 1,591,060 1,458,218
China 1,420,849 1,211,809 610,412 483,619
Rest of Asia 1,109,104 1,198,311 608,445 646,562
Canada 604,826 646,775 137,699 161,476
Australasia 436,480 342,561 88,845 64,813
Central and Latin America 367,186 298,425 84,554 65,094
South Africa and Middle East 111,855 114,131 23,251 22,104
20,745,410 20,221,806 8,088,680 7,507,623
Turnover to external parties consists of sales of softgoods, hardgoods and logistics income as follows:
2013 2012US$’000 US$’000
Softgoods 12,551,901 12,647,053
Hardgoods 7,641,030 7,127,260
Logistics 552,479 447,493
20,745,410 20,221,806
For the year ended 31 December 2013, approximately 14.1% (2012: 15.0%) of the Group’s turnover is derived from a single external
customer, of which 13.0% (2012: 13.5%) and 1.1% (2012: 1.5%) are attributable to the Trading Network and Distribution Network
segments respectively.
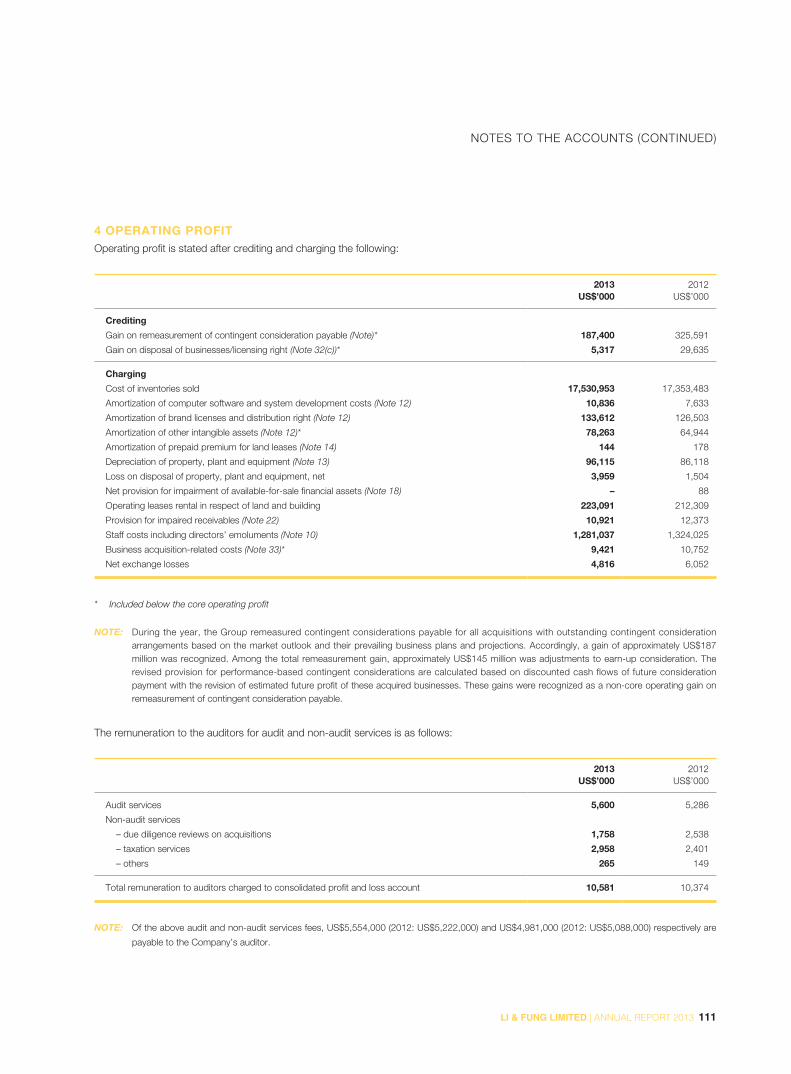
111LI & FUNG LIMITED | ANNUAL REPORT 2013
NOTES TO THE ACCOUNTS (CONTINUED)
4 OPERATING PROFITOperating profit is stated after crediting and charging the following:
2013 2012US$’000 US$’000
Crediting
Gain on remeasurement of contingent consideration payable (Note)* 187,400 325,591
Gain on disposal of businesses/licensing right (Note 32(c))* 5,317 29,635
Charging
Cost of inventories sold 17,530,953 17,353,483
Amortization of computer software and system development costs (Note 12) 10,836 7,633
Amortization of brand licenses and distribution right (Note 12) 133,612 126,503
Amortization of other intangible assets (Note 12)* 78,263 64,944
Amortization of prepaid premium for land leases (Note 14) 144 178
Depreciation of property, plant and equipment (Note 13) 96,115 86,118
Loss on disposal of property, plant and equipment, net 3,959 1,504
Net provision for impairment of available-for-sale financial assets (Note 18) – 88
Operating leases rental in respect of land and building 223,091 212,309
Provision for impaired receivables (Note 22) 10,921 12,373
Staff costs including directors’ emoluments (Note 10) 1,281,037 1,324,025
Business acquisition-related costs (Note 33)* 9,421 10,752
Net exchange losses 4,816 6,052
* Included below the core operating profit
NOTE: During the year, the Group remeasured contingent considerations payable for all acquisitions with outstanding contingent consideration arrangements based on the market outlook and their prevailing business plans and projections. Accordingly, a gain of approximately US$187 million was recognized. Among the total remeasurement gain, approximately US$145 million was adjustments to earn-up consideration. The revised provision for performance-based contingent considerations are calculated based on discounted cash flows of future consideration payment with the revision of estimated future profit of these acquired businesses. These gains were recognized as a non-core operating gain on remeasurement of contingent consideration payable.
The remuneration to the auditors for audit and non-audit services is as follows:
2013 2012US$’000 US$’000
Audit services 5,600 5,286
Non-audit services
– due diligence reviews on acquisitions 1,758 2,538
– taxation services 2,958 2,401
– others 265 149
Total remuneration to auditors charged to consolidated profit and loss account 10,581 10,374
NOTE: Of the above audit and non-audit services fees, US$5,554,000 (2012: US$5,222,000) and US$4,981,000 (2012: US$5,088,000) respectively are
payable to the Company’s auditor.

112 LI & FUNG LIMITED | ANNUAL REPORT 2013
NOTES TO THE ACCOUNTS (CONTINUED)
5 INTEREST EXPENSES
2013 2012US$’000 US$’000
Non-cash interest expenses on purchase consideration payable for acquisitions, brand licenses payable
and long-term notes
– wholly repayable within five years 28,460 24,058
– not wholly repayable within five years 658 598
Cash interest on bank loans and overdrafts, long-term notes
– wholly repayable within five years 73,063 71,078
– not wholly repayable within five years 39,375 39,375
141,556 135,109
6 TAXATIONHong Kong profits tax has been provided for at the rate of 16.5% (2012: 16.5%) on the estimated assessable profit for the year.
Taxation on overseas profits has been calculated on the estimated assessable profits for the year at the rates of taxation prevailing in the
countries in which the Group operates.
The amount of taxation charged/(credited) to the consolidated profit and loss account represents:
2013 2012US$’000 US$’000
Current taxation
– Hong Kong profits tax 12,948 12,978
– Overseas taxation 74,210 57,438
Under/(over)provision in prior years 11,862 (1,960)
Deferred taxation (Note 31) (658) (14,403)
98,362 54,053
The taxation on the Group’s profit before taxation differs from the theoretical amount that would arise using the taxation rate of the home
country of the Company as follows:
2013 2012
% %
Calculated at a taxation rate of 16.5 16.5
Effect of different taxation rates in other countries (3.9) (2.3)
Income net of expenses not subject to taxation (1.5) (7.6)
Under/(over)provision in prior years 1.4 (0.3)
Utilization of previously unrecognized tax losses (2.0) (0.3)
Unrecognized tax losses 1.0 2.0
Effective tax rate 11.5 8.0

113LI & FUNG LIMITED | ANNUAL REPORT 2013
NOTES TO THE ACCOUNTS (CONTINUED)
6 TAXATION (CONTINUED)As at the date of this annual report, the Group has disputes with the Hong Kong Inland Revenue (“HKIR”) Department involving
additional tax assessments amounting to approximately US$249 million on both the non-taxable claim of certain non-Hong Kong
sourced income (“Offshore Claim”) and the deduction claim of marketing expenses (“Deduction Claim”) for the years of assessment from
1992/93 to 2012/13.
The Commissioner of the HKIR issued a determination on 14 June 2004 to one of our subsidiaries, Li & Fung (Trading) Limited (“LFT”),
confirming additional tax assessments totaling US$43 million relating to the years of assessment from 1992/93 to 2001/02. Based
upon professional advice then obtained, the directors believed that the Group had meritorious reasons to justify appealing against the
Commissioner’s determination. Accordingly, LFT lodged a notice of appeal to the Board of Review on 13 July 2004. The appeal was
heard before the Board of Review in January 2006.
The Board of Review issued its decision on 12 June 2009 (“the Board of Review Decision”) and held partially in favour of LFT. It agreed
that the Offshore Claim for the years of assessment from 1992/93 to 2001/02 is valid. In other words, the relevant assessments in
respect of such Offshore Claim should be annulled. On the other hand, the Board of Review disagreed with the Deduction Claim for
the years of assessment from 1992/93 to 2001/02. Therefore, the relevant assessments in respect of such Deduction Claim should be
confirmed.
The Group considered the reasoning of the Board of Review Decision and, having obtained professional advice, decided to lodge an
appeal against the Board of Review Decision in respect of the Deduction Claim.
The HKIR also lodged an appeal against the Board of Review Decision in respect of the Offshore Claim.
On 19 March 2010, the Board of Review stated a case on questions of law in respect of both LFT’s appeal on the Deduction Claim,
and the HKIR’s appeal on the Offshore Claim. On 1 April 2010, both LFT and the HKIR transmitted the stated case to the High Court for
determination.
The appeal by the HKIR in respect of the Board of Review Decision on the Offshore Claim was dismissed by the Court of First Instance
on 18 April 2011, which upheld the Board of Review Decision. LFT was also awarded costs of the appeal by the Court of First Instance.
On 16 May 2011, the HKIR lodged an appeal against the judgment of the Court of First Instance to the Court of Appeal, which appeal
was heard by the Court of Appeal on 14 and 15 February 2012. On 19 March 2012, the Court of Appeal delivered its judgment. It
upheld the judgment of the Court of First Instance, dismissed the HKIR’s appeal and awarded costs of the appeal of LFT. Any appeal
against the judgment of the Court of Appeal to the Court of Final Appeal requires permission of the Court of Appeal or the Court of Final
Appeal. As no application for such permission was submitted by the HKIR within the prescribed time limit, the Court of Appeal judgment
on the Offshore Claim is considered as final.
Regarding LFT’s appeal on the Deduction Claim, upon the consent of the parties, the Court of First Instance has remitted the case
stated to the Board of Review and directed it to make further findings of fact and to determine certain issues. As at the date of this
annual report, further directions/decisions from the Board of Review are awaited.

114 LI & FUNG LIMITED | ANNUAL REPORT 2013
NOTES TO THE ACCOUNTS (CONTINUED)
6 TAXATION (CONTINUED)The Group has also filed objections with the HKIR against the remaining additional tax assessments of US$206 million. The case before
the Board of Review and eventually the Court of Appeal only applies to the additional tax assessments in respect of LFT for the years
of assessment from 1992/93 to 2001/02. The Group’s dispute with the HKIR regarding the remaining additional tax assessments in
respect of certain other subsidiaries for the years of assessment from 1992/93 to 2001/02, and in respect of the Group for the period
after the 2001/02 assessment years, is ongoing and has not yet been determined. Such dispute is therefore not yet before the Board of
Review, and no hearing is currently scheduled.
Based on the assessment of the Group’s professional advisers on the merits of LFT’s further appeal in respect of the Deduction Claim
and the HKIR’s further appeal in respect of the Offshore Claim (which has now been dismissed by the Court of Appeal), and having
taken into account the impact and ramification that the Board of Review Decision has on the tax affairs of LFT, the directors consider
that no material tax liabilities will finally crystallize and sufficient tax provision has been made in the accounts in this regard.
On 11 June 2010, the Group also applied for a judicial review of the decision of the Commissioner of the HKIR rejecting LFT’s
application for an unconditional holdover of tax for the year of assessment 2008/09 pending the determination of the objection lodged
with the HKIR. The Group purchased tax reserve certificates in respect of LFT for the year of assessment 2008/09 as directed by the
Commissioner of the HKIR pending the decision of the judicial review application. As at the date of this annual report, the hearing date
for the judicial review application is yet to be fixed.
7 PROFIT ATTRIBUTABLE TO SHAREHOLDERS OF THE COMPANYProfit attributable to shareholders of the Company is dealt with in the accounts of the Company to the extent of US$601,460,000 (2012:
US$322,606,000) (Note 27).
8 EARNINGS PER SHAREThe calculation of basic earnings per share is based on the Group’s profit attributable to shareholders of US$725,337,000 (2012:
US$617,416,000) and on the weighted average number of 8,356,237,000 (2012: 8,287,162,000) shares in issue during the year.
Diluted earnings per share is calculated by adjusting the weighted average number of 8,356,237,000 (2012: 8,287,162,000) ordinary
shares in issue by 34,000 (2012: 7,633,000) to assume conversion or all dilutive potential ordinary shares granted under the Company’s
Option Scheme. For the determination of dilutive potential ordinary share granted under the Company, a calculation is done to
determine the number of shares that could have been acquired at fair value (determined as the average annual market share price of the
Company’s shares) based on the monetary value of the subscription rights attached to outstanding share options. The number of shares
calculated as above is compared with the number of shares that would have been issued assuming the exercise of the share options.

115LI & FUNG LIMITED | ANNUAL REPORT 2013
NOTES TO THE ACCOUNTS (CONTINUED)
9 DIVIDENDS
2013 2012US$’000 US$’000
Interim, paid, of HK$0.15 (equivalent to US$0.019)
(2012: HK$0.15 (equivalent to US$0.019)) per ordinary share 160,777 160,721
Final, proposed, of HK$0.34 (equivalent to US$0.044)
(2012: HK$0.16 (equivalent to US$0.021)) per ordinary share 364,428 171,495
525,205 332,216
At a meeting held on 20 March 2014, the Directors proposed a final dividend of HK$0.34 (equivalent to US$0.044) per share. The
proposed dividends are not reflected as a dividend payable in these accounts, but will be reflected as an appropriation of retained
earnings for the year ending 31 December 2014 (Note 27).
10 STAFF COSTS INCLUDING DIRECTORS’ EMOLUMENTS
2013 2012US$’000 US$’000
Salaries and bonuses 1,135,553 1,179,166
Staff benefits 83,706 87,556
Pension costs of defined contribution plans (Note) 55,912 51,223
Employee share option expenses 3,522 2,248
Pension costs of defined benefits plans (Note 30) 2,332 3,610
Long service payments 12 222
1,281,037 1,324,025
NOTE: Forfeited contributions totalling US$2,412,000 (2012: US$2,237,000) were utilized during the year and no remaining amount was available at the
year-end to reduce future contributions.

116 LI & FUNG LIMITED | ANNUAL REPORT 2013
NOTES TO THE ACCOUNTS (CONTINUED)
11 DIRECTORS’ AND SENIOR MANAGEMENT’S EMOLUMENTS
(a) DIRECTORS’ AND SENIOR MANAGEMENT EMOLUMENTS
The remuneration of every Director for the year ended 31 December 2013 is set out below:
2013
FeesSalary &
allowance
Discretionarybonuses(Note (i))
Otherbenefits
(Note (ii))
Employer’scontribution to pension
scheme TotalName of Director US$’000 US$’000 US$’000 US$’000 US$’000 US$’000
Executive Directors
William Fung Kwok Lun 39 615 1,878 – 2 2,534Bruce Philip Rockowitz 21 572 2,458 32 2 3,085Spencer Theodore Fung 21 592 426 – 2 1,041
Non-executive Directors
Victor Fung Kwok King 47 – – – – 47Paul Edward Selway-Swift 59 – – – – 59Allan Wong Chi Yun 46 – – – – 46Franklin Warren McFarlan 46 – – – – 46Martin Tang Yue Nien 46 – – – – 46Benedict Chang Yew Teck 20 – – – – 20Fu Yuning 40 – – – – 40Margaret Leung Ko May Yee 25 – – – – 25
NOTES:
(i) The discretionary bonuses paid in 2013 were in relation to performance and services for 2012.
(ii) Other benefits include leave pay, insurance premium and club membership.
2012
FeesSalary &
allowance
Discretionarybonuses(Note (i))
Otherbenefits
(Note (ii))
Employer’scontribution to pension
scheme TotalName of Director US$’000 US$’000 US$’000 US$’000 US$’000 US$’000
Executive Directors
William Fung Kwok Lun 35 615 3,938 – 2 4,590Bruce Philip Rockowitz 21 572 6,322 38 2 6,955Spencer Theodore Fung 21 797 932 31 2 1,783
Non-executive Directors
Victor Fung Kwok King 56 – – – – 56Paul Edward Selway-Swift 59 – – – – 59Allan Wong Chi Yun 46 – – – – 46Franklin Warren McFarlan 46 – – – – 46Martin Tang Yue Nien 46 – – – – 46Benedict Chang Yew Teck 20 – – – – 20Fu Yuning 40 – – – – 40
NOTES:
(i) The discretionary bonuses paid in 2012 were in relation to performance and services for 2011.
(ii) Other benefits include leave pay, insurance premium and club membership.

117LI & FUNG LIMITED | ANNUAL REPORT 2013
NOTES TO THE ACCOUNTS (CONTINUED)
11 DIRECTORS’ AND SENIOR MANAGEMENT’S EMOLUMENTS (CONTINUED)
(a) DIRECTORS’ AND SENIOR MANAGEMENT EMOLUMENTS (CONTINUED)
During the year, no Share (2012: 802,000) was issued to Directors of the Company pursuant to exercise of the Share Options under the
Option Scheme.
As at 31 December 2013, certain Directors held the following Share Options to acquire Shares of the Company:
Exercise Price
Number of Share Options HK$ Exercisable Period
1,440,000 (2012: 1,440,000) 20.21 01/5/2012 – 30/4/2015
1,440,000 (2012: 1,440,000) 20.21 01/5/2013 – 30/4/2015
3,600,000 (2012: 3,600,000) 20.21 01/5/2014 – 30/4/2016
1,000,000 (2012: 1,000,000) 14.50 01/5/2013 – 30/4/2015
1,000,000 (2012: 1,000,000) 14.50 01/5/2014 – 30/4/2016
1,000,000 (2012: 1,000,000) 14.50 01/5/2015 – 30/4/2017
1,000,000 (2012: 1,000,000) 14.50 01/5/2016 – 30/4/2018
1,000,000 (2012: 1,000,000) 14.50 01/5/2017 – 30/4/2019
1,000,000 (2012: 1,000,000) 14.50 01/5/2018 – 30/4/2020
1,000,000 (2012: 1,000,000) 14.50 01/5/2019 – 30/4/2021
1,000,000 (2012: 1,000,000) 14.50 01/5/2020 – 30/4/2022
1,000,000 (2012: 1,000,000) 14.50 01/5/2021 – 30/4/2023
The closing market price of the Shares as at 31 December 2013 was HK$10.

118 LI & FUNG LIMITED | ANNUAL REPORT 2013
NOTES TO THE ACCOUNTS (CONTINUED)
11 DIRECTORS’ AND SENIOR MANAGEMENT’S EMOLUMENTS (CONTINUED)
(b) FIVE HIGHEST PAID INDIVIDUALS
The five individuals whose emoluments were the highest in the Group for the year include two (2012: two) Directors whose emoluments
are reflected in the analysis presented above. The emoluments payable to the remaining three individuals (2012: three) who were senior
management during the year are as follows:
2013 2012
US$’000 US$’000
Basic salaries, housing allowances, other allowances and benefits-in-kind 4,189 4,025
Discretionary bonuses 8,095 7,377
Contributions to pension scheme 5 5
12,289 11,407
Number of individualsEmolument bands 2013 2012
HK$19,000,001 – HK$19,500,000 (approximately US$2,436,001 – US$2,500,000) – 1
HK$21,000,001 – HK$21,500,000 (approximately US$2,692,001 – US$2,756,000) 1 –
HK$29,000,001 – HK$29,500,000 (approximately US$3,718,001 – US$3,782,000) 1 –
HK$30,000,001 – HK$30,500,000 (approximately US$3,846,001 – US$3,910,000) – 1
HK$39,000,001 – HK$39,500,000 (approximately US$5,000,001 – US$5,064,000) – 1
HK$44,500,001 – HK$45,000,000 (approximately US$5,705,001 – US$5,769,000) 1 –
There is no amount paid or payable to the Directors as inducement to join the Group and compensation for loss of office as Directors.
(C) SENIOR MANAGEMENT’S EMOLUMENTS
The emoluments payable to the remaining senior management during the year fell within the following bands:
Number of individualsEmolument bands 2013 2012
Below US$1,000,000 4 2
US$1,000,001 – US$1,500,000 5 4
US$1,500,001 – US$2,000,000 – 1
US$2,000,001 – US$2,500,000 – 1

119LI & FUNG LIMITED | ANNUAL REPORT 2013
NOTES TO THE ACCOUNTS (CONTINUED)
12 INTANGIBLE ASSETS
The Group
Other intangible assets
Goodwill
Brandlicenses anddistribution
right
Computersoftware
and systemdevelopment
costs
Buyingagency
and licenseagreements
Customerrelationships
Licensorrelationships
Patent,trademarks
andbrandnames Others Total
US$’000 US$’000 US$’000 US$’000 US$’000 US$’000 US$’000 US$’000 US$’000
At 1 January 2013
Cost 6,019,569 586,052 73,154 93,967 506,902 126,341 181,476 2,200 7,589,661
Accumulated amortization – (336,217) (27,214) (19,390) (91,069) (29,358) (26,731) (1,276) (531,255)
Net book amount 6,019,569 249,835 45,940 74,577 415,833 96,983 154,745 924 7,058,406
Year ended 31 December 2013
Opening net book amount 6,019,569 249,835 45,940 74,577 415,833 96,983 154,745 924 7,058,406
Exchange differences 20,685 383 13 – 1,071 466 519 – 23,137
Acquisition of businesses/subsidiaries (Note 33) 353,994 515 30 – 67,518 14,937 10,335 1,334 448,663
Adjustments to purchase consideration payable
for acquisitions and net asset value i (4,414) – 270 – 470 3,064 6,797 – 6,187
Adjustments to purchase consideration
payable for acquisitions completed prior to
1 January 2010 ii 867 – – – – – – – 867
Additions – 287,674 21,751 – – – – – 309,425
Disposal of businesses/licensing right (Note 32(c)) – (11,531) – – – – – – (11,531)
Disposals – (3,887) – – – – – – (3,887)
Amortization – (133,612) (10,836) (5,393) (47,825) (11,415) (13,234) (396) (222,711)
Closing net book amount 6,390,701 389,377 57,168 69,184 437,067 104,035 159,162 1,862 7,608,556
At 31 December 2013
Cost 6,390,701 859,835 93,848 93,967 576,284 145,032 199,249 3,534 8,362,450
Accumulated amortization – (470,458) (36,680) (24,783) (139,217) (40,997) (40,087) (1,672) (753,894)
Net book amount 6,390,701 389,377 57,168 69,184 437,067 104,035 159,162 1,862 7,608,556

120 LI & FUNG LIMITED | ANNUAL REPORT 2013
NOTES TO THE ACCOUNTS (CONTINUED)
12 INTANGIBLE ASSETS (CONTINUED)
The Group
Other intangible assets
Goodwill
Brandlicenses and
distributionright
Computersoftware
and systemdevelopment
costs
Buying agencyand licenseagreements
Customerrelationships
Licensorrelationships
Patent,trademarks
andbrandnames Others Total
US$’000 US$’000 US$’000 US$’000 US$’000 US$’000 US$’000 US$’000 US$’000
At 1 January 2012
Cost 5,515,083 495,605 61,037 93,967 427,925 114,904 149,657 2,200 6,860,378
Accumulated amortization – (212,383) (19,607) (14,611) (51,113) (18,532) (17,228) (905) (334,379)
Net book amount 5,515,083 283,222 41,430 79,356 376,812 96,372 132,429 1,295 6,525,999
Year ended 31 December 2012
Opening net book amount 5,515,083 283,222 41,430 79,356 376,812 96,372 132,429 1,295 6,525,999
Exchange differences 38,198 956 159 – 2,466 2,161 506 – 44,446
Acquisition of businesses/subsidiaries 428,935 435 – – 72,180 9,128 28,301 – 538,979
Adjustments to purchase consideration payable
for acquisitions and net asset value i (49,839) 6,320 – – 4,000 – 3,000 – (36,519)
Adjustments to purchase consideration payable
for acquisitions completed prior to
1 January 2010 ii 87,192 – – – – – – – 87,192
Additions – 94,685 12,026 – – – – – 106,711
Disposal of businesses/subsidiary (Note 32(c)) – – (42) – – – – – (42)
Disposals – (9,280) – – – – – – (9,280)
Amortization – (126,503) (7,633) (4,779) (39,625) (10,678) (9,491) (371) (199,080)
Closing net book amount 6,019,569 249,835 45,940 74,577 415,833 96,983 154,745 924 7,058,406
At 31 December 2012
Cost 6,019,569 586,052 73,154 93,967 506,902 126,341 181,476 2,200 7,589,661
Accumulated amortization – (336,217) (27,214) (19,390) (91,069) (29,358) (26,731) (1,276) (531,255)
Net book amount 6,019,569 249,835 45,940 74,577 415,833 96,983 154,745 924 7,058,406
i These are adjustments to purchase consideration payable for acquisitions and net asset values related to certain acquisitions of businesses in the prior
year, which were previously determined on a provisional basis. During the measurement period of twelve months following a transaction, the Company
recognized adjustments to the provisional amounts as if the accounting for the business combination had been completed at the acquisition date. Save
as adjustments to goodwill and other intangible assets arising from business combination stated above, there were corresponding net adjustments to
purchase consideration payable for acquisitions of US$37,019,000 (2012:US$53,681,000) and other assets/liabilities of approximately US$43,206,000
(2012: US$17,162,000).
ii For acquisitions completed prior to 1 January 2010, the effective date of HKFRS 3 (Revised) “Business Combination” being adopted by the Group, the
changes in accrued contingent considerations determined based on post-acquisition performance were made against goodwill.
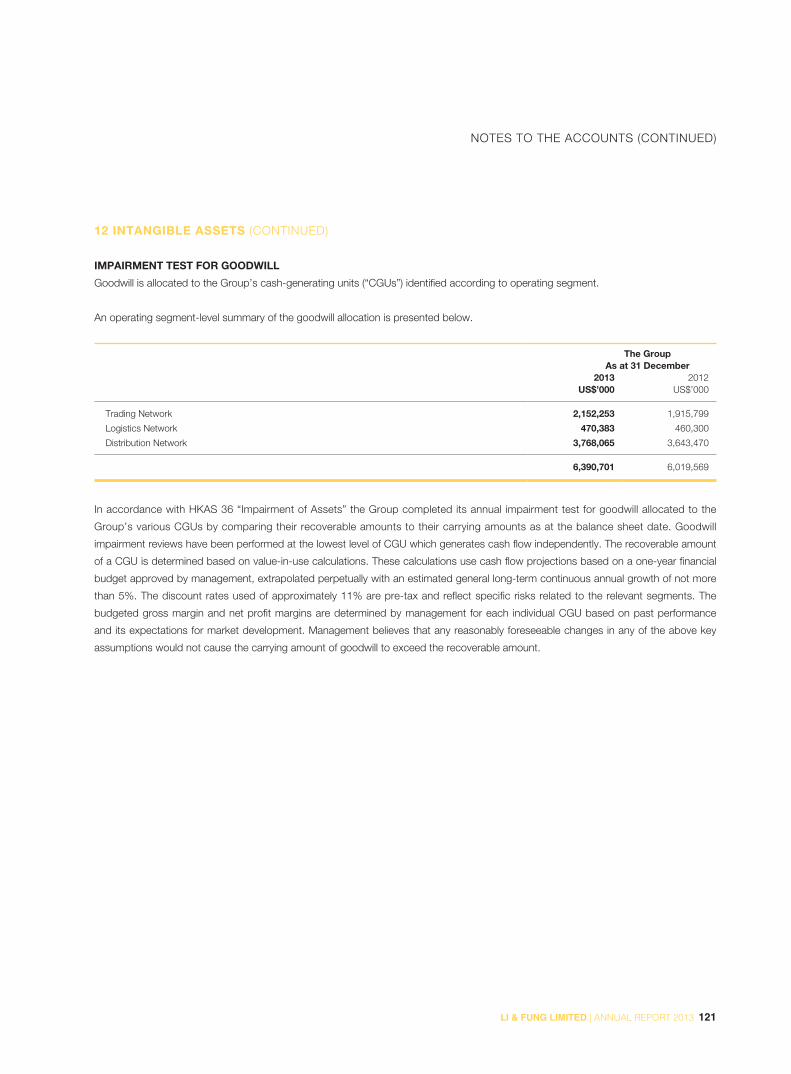
121LI & FUNG LIMITED | ANNUAL REPORT 2013
NOTES TO THE ACCOUNTS (CONTINUED)
12 INTANGIBLE ASSETS (CONTINUED)
IMPAIRMENT TEST FOR GOODWILL
Goodwill is allocated to the Group’s cash-generating units (“CGUs”) identified according to operating segment.
An operating segment-level summary of the goodwill allocation is presented below.
The Group
As at 31 December2013 2012
US$’000 US$’000
Trading Network 2,152,253 1,915,799
Logistics Network 470,383 460,300
Distribution Network 3,768,065 3,643,470
6,390,701 6,019,569
In accordance with HKAS 36 “Impairment of Assets” the Group completed its annual impairment test for goodwill allocated to the
Group’s various CGUs by comparing their recoverable amounts to their carrying amounts as at the balance sheet date. Goodwill
impairment reviews have been performed at the lowest level of CGU which generates cash flow independently. The recoverable amount
of a CGU is determined based on value-in-use calculations. These calculations use cash flow projections based on a one-year financial
budget approved by management, extrapolated perpetually with an estimated general long-term continuous annual growth of not more
than 5%. The discount rates used of approximately 11% are pre-tax and reflect specific risks related to the relevant segments. The
budgeted gross margin and net profit margins are determined by management for each individual CGU based on past performance
and its expectations for market development. Management believes that any reasonably foreseeable changes in any of the above key
assumptions would not cause the carrying amount of goodwill to exceed the recoverable amount.
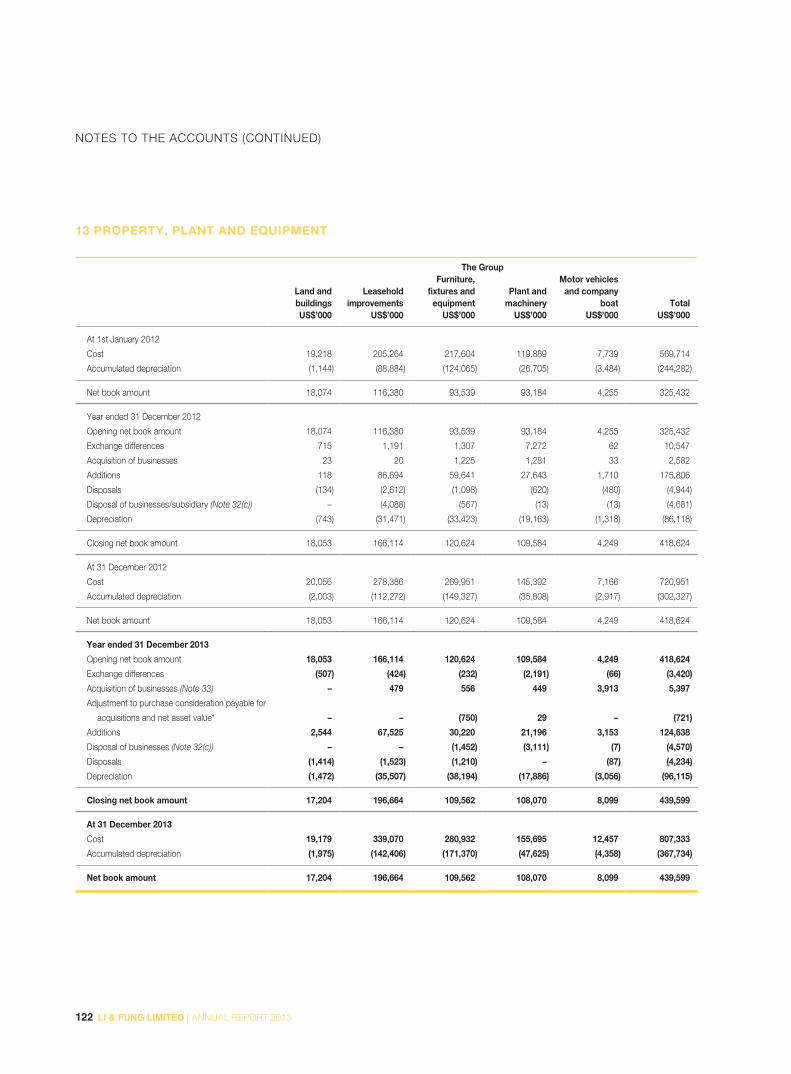
122 LI & FUNG LIMITED | ANNUAL REPORT 2013
NOTES TO THE ACCOUNTS (CONTINUED)
13 PROPERTY, PLANT AND EQUIPMENT
The Group
Land andbuildings
Leaseholdimprovements
Furniture,fixtures and
equipmentPlant and
machinery
Motor vehiclesand company
boat TotalUS$’000 US$’000 US$’000 US$’000 US$’000 US$’000
At 1st January 2012
Cost 19,218 205,264 217,604 119,889 7,739 569,714
Accumulated depreciation (1,144) (88,884) (124,065) (26,705) (3,484) (244,282)
Net book amount 18,074 116,380 93,539 93,184 4,255 325,432
Year ended 31 December 2012
Opening net book amount 18,074 116,380 93,539 93,184 4,255 325,432
Exchange differences 715 1,191 1,307 7,272 62 10,547
Acquisition of businesses 23 20 1,225 1,281 33 2,582
Additions 118 86,694 59,641 27,643 1,710 175,806
Disposals (134) (2,612) (1,098) (620) (480) (4,944)
Disposal of businesses/subsidiary (Note 32(c)) – (4,088) (567) (13) (13) (4,681)
Depreciation (743) (31,471) (33,423) (19,163) (1,318) (86,118)
Closing net book amount 18,053 166,114 120,624 109,584 4,249 418,624
At 31 December 2012
Cost 20,056 278,386 269,951 145,392 7,166 720,951
Accumulated depreciation (2,003) (112,272) (149,327) (35,808) (2,917) (302,327)
Net book amount 18,053 166,114 120,624 109,584 4,249 418,624
Year ended 31 December 2013
Opening net book amount 18,053 166,114 120,624 109,584 4,249 418,624
Exchange differences (507) (424) (232) (2,191) (66) (3,420)
Acquisition of businesses (Note 33) – 479 556 449 3,913 5,397
Adjustment to purchase consideration payable for
acquisitions and net asset value* – – (750) 29 – (721)
Additions 2,544 67,525 30,220 21,196 3,153 124,638
Disposal of businesses (Note 32(c)) – – (1,452) (3,111) (7) (4,570)
Disposals (1,414) (1,523) (1,210) – (87) (4,234)
Depreciation (1,472) (35,507) (38,194) (17,886) (3,056) (96,115)
Closing net book amount 17,204 196,664 109,562 108,070 8,099 439,599
At 31 December 2013
Cost 19,179 339,070 280,932 155,695 12,457 807,333
Accumulated depreciation (1,975) (142,406) (171,370) (47,625) (4,358) (367,734)
Net book amount 17,204 196,664 109,562 108,070 8,099 439,599
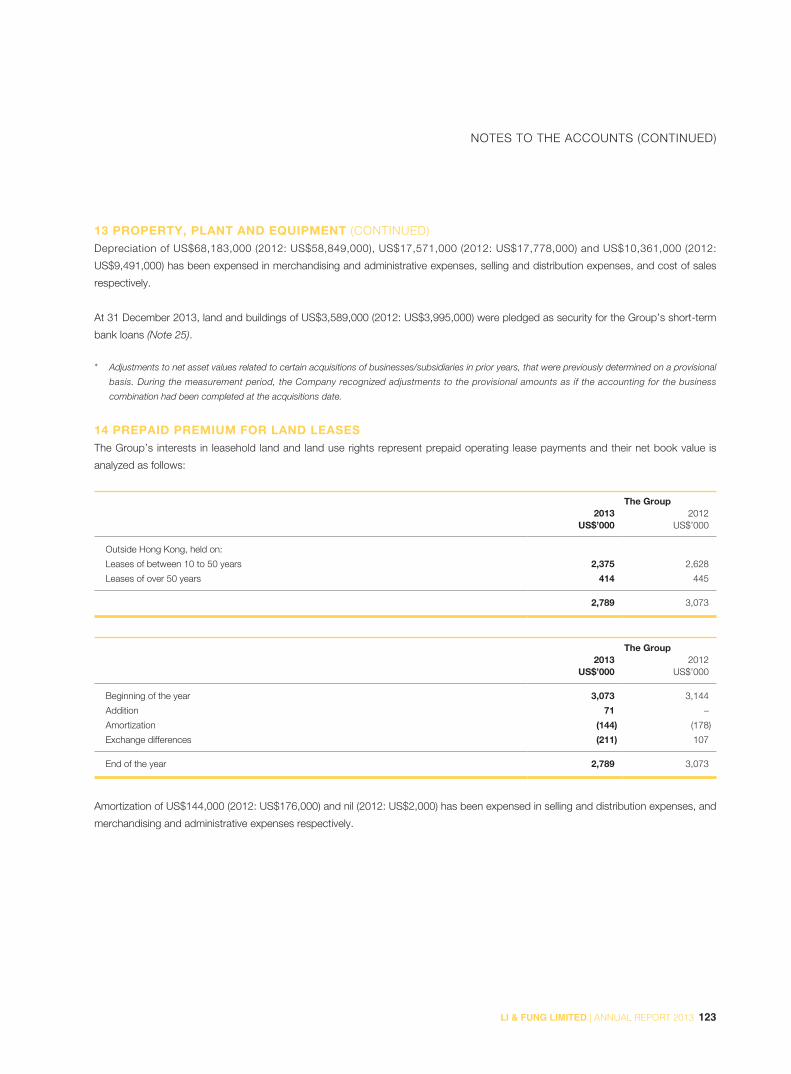
123LI & FUNG LIMITED | ANNUAL REPORT 2013
NOTES TO THE ACCOUNTS (CONTINUED)
13 PROPERTY, PLANT AND EQUIPMENT (CONTINUED)Depreciation of US$68,183,000 (2012: US$58,849,000), US$17,571,000 (2012: US$17,778,000) and US$10,361,000 (2012:
US$9,491,000) has been expensed in merchandising and administrative expenses, selling and distribution expenses, and cost of sales
respectively.
At 31 December 2013, land and buildings of US$3,589,000 (2012: US$3,995,000) were pledged as security for the Group’s short-term
bank loans (Note 25).
* Adjustments to net asset values related to certain acquisitions of businesses/subsidiaries in prior years, that were previously determined on a provisional
basis. During the measurement period, the Company recognized adjustments to the provisional amounts as if the accounting for the business
combination had been completed at the acquisitions date.
14 PREPAID PREMIUM FOR LAND LEASESThe Group’s interests in leasehold land and land use rights represent prepaid operating lease payments and their net book value is
analyzed as follows:
The Group
2013 2012US$’000 US$’000
Outside Hong Kong, held on:
Leases of between 10 to 50 years 2,375 2,628
Leases of over 50 years 414 445
2,789 3,073
The Group
2013 2012US$’000 US$’000
Beginning of the year 3,073 3,144
Addition 71 –
Amortization (144) (178)
Exchange differences (211) 107
End of the year 2,789 3,073
Amortization of US$144,000 (2012: US$176,000) and nil (2012: US$2,000) has been expensed in selling and distribution expenses, and
merchandising and administrative expenses respectively.

124 LI & FUNG LIMITED | ANNUAL REPORT 2013
NOTES TO THE ACCOUNTS (CONTINUED)
15 INTERESTS IN SUBSIDIARIES
The Company
2013 2012US$’000 US$’000
Unlisted shares, at cost 1,089,285 1,089,285
Loan to a subsidiary 250,319 250,319
1,339,604 1,339,604
The loan to a subsidiary is interest free and unsecured. The Company does not have any intention to seek repayment from the
subsidiary.
Details of principal subsidiaries are set out in Note 43.
16 ASSOCIATED COMPANIES
The Group
2013 2012US$’000 US$’000
Beginning of the year 7,571 7,015
Share of profits less losses for the year of associated companies 442 638
Dividend received (516) (124)
Exchange differences 101 42
Total interest in associated companies 7,598 7,571
Details of principal associated companies are set out in Note 43.
17 JOINT VENTURES
The Group
2013 2012US$’000 US$’000
Beginning of the year – –
Additions 14,106 –
Share of profits less losses of joint ventures 409 –
Total interest in joint ventures 14,515 –
Details of principal joint venture is set out in Note 43.

125LI & FUNG LIMITED | ANNUAL REPORT 2013
NOTES TO THE ACCOUNTS (CONTINUED)
18 AVAILABLE-FOR-SALE FINANCIAL ASSETS
The Group
2013 2012US$’000 US$’000
Beginning of the year 60,598 70,574
Repayment of debt security (57,000) (10,000)
Fair value gains on available-for-sale financial assets (Note 27) 71 112
Net impairment provision – (88)
End of the year 3,669 60,598
Available-for-sale financial assets include the following:
The Group
2013 2012US$’000 US$’000
Unlisted securities:
– Debt security (Note) – 57,000
– Others 3,669 3,598
3,669 60,598
NOTE: In November 2009, the Group subscribed for an unlisted debt security (the “Promissory Note”) from an independent third party of US$90,000,000.
The Promissory note is interest bearing at 7.5% per annum and repayable by 30 June 2014. It is secured by, among other things, certain
collaterals such as trademarks, patents and licenses. The maximum exposure to credit risk at the reporting date is the carrying value of the
Promissory Note. The fair value of the Promissory Note is determined with discounted cash flow analysis based on the prevailing required rates of
return at the balance sheet date of certain comparable debt instruments in the market. In 2013, the entire balance was fully settled.
Available-for-sale financial assets are denominated in the following currencies:
The Group
2013 2012US$’000 US$’000
HK dollar 3,669 3,598
US dollar – 57,000
3,669 60,598

126 LI & FUNG LIMITED | ANNUAL REPORT 2013
NOTES TO THE ACCOUNTS (CONTINUED)
19 INVENTORIES
The Group
2013 2012US$’000 US$’000
Finished goods 976,797 782,466
Raw materials 123,689 156,612
1,100,486 939,078
20 DUE FROM/(TO) RELATED COMPANIES
The Group The Company
2013 2012 2013 2012US$’000 US$’000 US$’000 US$’000
Due from:
Subsidiaries – – 5,001,637 4,728,264
Associated companies 9,615 11,499 – –
Other related companies 58,055 80,945 – –
67,670 92,444 5,001,637 4,728,264
Due to:
Associated companies 27 – – –
Other related companies 14,655 8,484 – –
14,682 8,484 – –
The amounts are unsecured, interest free and repayable on demand, except for amounts due from an associated company amounting
to US$9,371,000 (2012: US$11,226,000) which are unsecured but interest bearing at approximately 5% per annum. The fair values of
amounts due from related companies are approximately the same as the carrying values.
21 DERIVATIVE FINANCIAL INSTRUMENTS
The Group
2013 2012US$’000 US$’000
Conversion right embedded in convertible promissory note (Note 40) 2,664 –
Forward foreign exchange contracts – liabilities (Note 40) 8,275 4,821
The conversion right embedded in convertible promissory note referred to the Group’s investment in an unlisted convertible promissory
note issued by British Heritage Brands (“BHB”) mentioned in Note 37.

127LI & FUNG LIMITED | ANNUAL REPORT 2013
NOTES TO THE ACCOUNTS (CONTINUED)
21 DERIVATIVE FINANCIAL INSTRUMENTS (CONTINUED)Losses in equity of US$1,413,000 (2012: US$1,015,000) on forward foreign exchange contracts as of 31 December 2013 will be
released to the consolidated profit and loss account at various dates between one month to one year from the balance sheet date (Note
27).
For the years ended 31 December 2013 and 2012, no material amounts were recognized in the profit or loss account arising from
ineffective cash flow hedges.
22 TRADE AND OTHER RECEIVABLES
The Group The Company
2013 2012 2013 2012US$’000 US$’000 US$’000 US$’000
Trade and bills receivable – net 2,220,841 2,242,678 – –
Other receivables, prepayments and deposits 462,143 445,339 313 250
2,682,984 2,688,017 313 250
Less: non-current portion
Other receivables (Note) (7,326) – – –
Deposits (8,297) (19,949) – –
2,667,361 2,668,068 313 250
NOTE: The balance represents the Group’s investment in an unlisted convertible promissory note issued by BHB mentioned in Note 37.
The convertible promissory note is denominated in US dollars.
The effective interest rate of the convertible promissory note at the balance sheet date was 5.38%.
The fair values of the Group’s and the Company’s trade and other receivables were approximately the same as their carrying values as
at 31 December 2013.
A significant portion of the Group’s business is on sight letter of credit, usance letter of credit up to a tenor of 120 days, documents
against payment or customers’ letter of credit to suppliers. The balance of the business is on open account terms which is often
covered by customers’ standby letters of credit, bank guarantees, credit insurance or under a back-to-back payment arrangement with
suppliers. The ageing of trade and bills receivable based on invoice date is as follows:
The Group
2013 2012US$’000 US$’000
Current to 90 days 2,112,726 2,105,072
91 to 180 days 93,213 105,351
181 to 360 days 9,569 24,766
Over 360 days 5,333 7,489
2,220,841 2,242,678
There is no concentration of credit risk with respect to trade receivables, as the Group has a large number of customers internationally
dispersed.

128 LI & FUNG LIMITED | ANNUAL REPORT 2013
NOTES TO THE ACCOUNTS (CONTINUED)
22 TRADE AND OTHER RECEIVABLES (CONTINUED)As of 31 December 2013, trade receivables of US$2,203,876,000 (2012: US$2,194,418,000) that are current or less than 90 days past
due are not considered impaired. Trade receivables of US$16,965,000 (2012: US$48,260,000) were past due over 90 days but not
considered to be impaired. These relate to a number of independent customers for whom there is no recent history of default. The past
due ageing of these trade receivables is as follows:
The Group
2013 2012US$’000 US$’000
91 to 180 days 7,202 36,246
Over 180 days 9,763 12,014
16,965 48,260
As of 31 December 2013, outstanding trade receivables of US$41,765,000 (2012: US$36,974,000) and other receivables of
US$12,658,000 (2012: US$18,774,000) were considered impaired and were fully provided. The individually impaired receivables mainly
relate to transactions in disputes.
Movements in the Group’s provision for impairment of trade and other receivables are as follows:
The Group
2013 2012US$’000 US$’000
At 1 January 55,748 53,914
Provision for receivable impairment (Note 4) 11,881 13,259
Receivables written off during the year as uncollectible (12,246) (10,539)
Unused amounts reversed (Note 4) (960) (886)
At 31 December 54,423 55,748
The creation and release of provision for impaired receivables have been included in “Selling and distribution expenses” in the
consolidated profit and loss account (Note 4). Amounts charged to the allowance account are generally written off, when there is no
expectation of recovering additional cash.
Save as disclosed as above, the other classes within trade and other receivables do not contain impaired assets.
The maximum exposure to credit risk at the reporting date is the fair value of each class of receivables mentioned above.
Certain subsidiaries of the Group transferred bills receivable balances amounting to US$38,190,000 (2012: US$35,666,000) to banks in
exchange for cash as at 31 December 2013. The transactions have been accounted for as collateralized bank advances.

129LI & FUNG LIMITED | ANNUAL REPORT 2013
NOTES TO THE ACCOUNTS (CONTINUED)
22 TRADE AND OTHER RECEIVABLES (CONTINUED)The carrying amounts of the Group’s and the Company’s trade and other receivables are denominated in the following currencies:
The Group The Company
2013 2012 2013 2012US$’000 US$’000 US$’000 US$’000
HK dollar 292,324 220,601 313 250
US dollar 1,588,874 1,748,336 – –
Euro dollar 318,857 227,337 – –
Pound sterling 90,518 122,154 – –
Renminbi 169,764 156,882 – –
Malaysia Ringgit 50,004 52,297 – –
Thailand Baht 54,724 53,954 – –
Others 102,296 86,507 – –
2,667,361 2,668,068 313 250
23 CASH AND CASH EQUIVALENTS
The Group The Company
2013 2012 2013 2012US$’000 US$’000 US$’000 US$’000
Cash and bank balances 459,559 680,379 110 1,553
The effective interest rate at the balance sheet date on bank balances was 0.4% (2012: 0.4%) per annum; these deposits have an
average maturity period of 10 days (2012: 6 days).
24 TRADE AND OTHER PAYABLES
The Group The Company
2013 2012 2013 2012US$’000 US$’000 US$’000 US$’000
Trade and bills payable 2,552,495 2,458,128 – –
Brand license payable (Note 29) 40,839 25,689 – –
Other accrued charges and sundry payables 796,951 801,771 9,715 10,406
837,790 827,460 9,715 10,406
3,390,285 3,285,588 9,715 10,406
The fair values of the Group’s and the Company’s trade and other payables were approximately the same as their carrying values as at
31 December 2013.

130 LI & FUNG LIMITED | ANNUAL REPORT 2013
NOTES TO THE ACCOUNTS (CONTINUED)
24 TRADE AND OTHER PAYABLES (CONTINUED)At 31 December 2013, the ageing of trade and bills payable based on invoice date is as follows:
The Group
2013 2012US$’000 US$’000
Current to 90 days 2,452,932 2,376,236
91 to 180 days 66,220 67,050
181 to 360 days 6,725 3,007
Over 360 days 26,618 11,835
2,552,495 2,458,128
25 BANK BORROWINGS
The Group
2013 2012US$’000 US$’000
Long-term bank loans
– Unsecured (Note 29) 116,640 100,000
Short-term bank loans
– Secured 4,845 4,200
– Unsecured 89,300 113,319
94,145 117,519
Total bank borrowings 210,785 217,519
As at 31 December 2013 and 2012 the carrying amounts of the Group’s borrowings approximated their fair values.
The effective interest rates at the balance sheet date were as follows:
2013 2012
HKD USD EUR GBP RMB HKD USD EUR GBP RMB
Long-term bank loans – 2.3% – – – – 2.5% – – –
Short-term bank loans – – 3.8% – 5.7% 1.1% 1.7% – – 5.9%
The Group’s contractual repricing dates for borrowings are all three months or less.

131LI & FUNG LIMITED | ANNUAL REPORT 2013
NOTES TO THE ACCOUNTS (CONTINUED)
25 BANK BORROWINGS (CONTINUED)The carrying amounts of the borrowings are denominated in the following currencies:
The Group
2013 2012US$’000 US$’000
HK dollar – 46,252
US dollar 116,640 101,500
Euro dollar 2,341 –
Renminbi 64,926 23,988
Others 26,878 45,779
210,785 217,519
26 SHARE CAPITAL AND OPTIONS
Number of shares Equivalent to
(in thousand) HK$’000 US$’000
Authorized
At 1 January 2012, ordinary shares of HK$0.0125 each 12,000,000 150,000 19,231
At 31 December 2012, ordinary shares of HK$0.0125 each 12,000,000 150,000 19,231
At 1 January 2013, ordinary shares of HK$0.0125 each 12,000,000 150,000 19,231
At 31 December 2013, ordinary shares of HK$0.0125 each 12,000,000 150,000 19,231
Issued and fully paid
At 1 January 2012, ordinary shares of HK$0.0125 each 8,104,154 101,302 12,987
Issue of shares upon a private placing (Note) 210,000 2,625 337
Exercise of Share Options 44,894 561 72
At 31 December 2012, ordinary shares of HK$0.0125 each 8,359,048 104,488 13,396
At 1 January 2013, ordinary shares of HK$0.0125 each 8,359,048 104,488 13,396
Exercise of share options 1,350 17 2
At 31 December 2013, ordinary shares of HK$0.0125 each 8,360,398 104,505 13,398
NOTE: Pursuant to a placing agreement dated 27 March 2012, FH (1937) placed 210,000,000 existing Shares to not less than six independent
professional, institutional and/or individual investors at a price of HK$18.62 per Share and subscribed from the Company for the same number of
Shares at the same price before taking into account the placing commission and other expenses borne or incurred by FH (1937) in relation to the
placing and/or the subscription. The net proceeds of the subscription amounted to approximately US$498,260,000 and were utilized primarily for
the settlement of acquisition considerations, as well as general working capital of the Group. The closing price of the Share quoted on the Stock
Exchange on 27 March 2012 was HK$19.60 per Share.
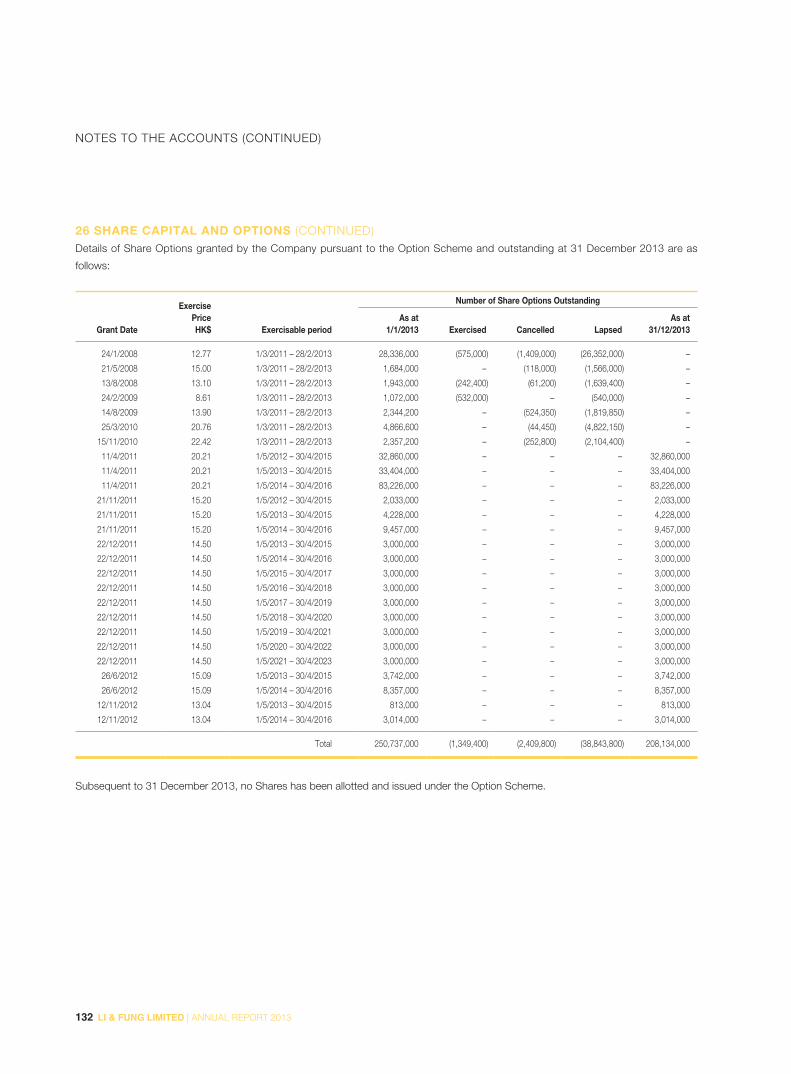
132 LI & FUNG LIMITED | ANNUAL REPORT 2013
NOTES TO THE ACCOUNTS (CONTINUED)
26 SHARE CAPITAL AND OPTIONS (CONTINUED)Details of Share Options granted by the Company pursuant to the Option Scheme and outstanding at 31 December 2013 are as
follows:
ExercisePriceHK$
Number of Share Options Outstanding
Grant Date Exercisable periodAs at
1/1/2013 Exercised Cancelled LapsedAs at
31/12/2013
24/1/2008 12.77 1/3/2011 – 28/2/2013 28,336,000 (575,000) (1,409,000) (26,352,000) –
21/5/2008 15.00 1/3/2011 – 28/2/2013 1,684,000 – (118,000) (1,566,000) –
13/8/2008 13.10 1/3/2011 – 28/2/2013 1,943,000 (242,400) (61,200) (1,639,400) –
24/2/2009 8.61 1/3/2011 – 28/2/2013 1,072,000 (532,000) – (540,000) –
14/8/2009 13.90 1/3/2011 – 28/2/2013 2,344,200 – (524,350) (1,819,850) –
25/3/2010 20.76 1/3/2011 – 28/2/2013 4,866,600 – (44,450) (4,822,150) –
15/11/2010 22.42 1/3/2011 – 28/2/2013 2,357,200 – (252,800) (2,104,400) –
11/4/2011 20.21 1/5/2012 – 30/4/2015 32,860,000 – – – 32,860,000
11/4/2011 20.21 1/5/2013 – 30/4/2015 33,404,000 – – – 33,404,000
11/4/2011 20.21 1/5/2014 – 30/4/2016 83,226,000 – – – 83,226,000
21/11/2011 15.20 1/5/2012 – 30/4/2015 2,033,000 – – – 2,033,000
21/11/2011 15.20 1/5/2013 – 30/4/2015 4,228,000 – – – 4,228,000
21/11/2011 15.20 1/5/2014 – 30/4/2016 9,457,000 – – – 9,457,000
22/12/2011 14.50 1/5/2013 – 30/4/2015 3,000,000 – – – 3,000,000
22/12/2011 14.50 1/5/2014 – 30/4/2016 3,000,000 – – – 3,000,000
22/12/2011 14.50 1/5/2015 – 30/4/2017 3,000,000 – – – 3,000,000
22/12/2011 14.50 1/5/2016 – 30/4/2018 3,000,000 – – – 3,000,000
22/12/2011 14.50 1/5/2017 – 30/4/2019 3,000,000 – – – 3,000,000
22/12/2011 14.50 1/5/2018 – 30/4/2020 3,000,000 – – – 3,000,000
22/12/2011 14.50 1/5/2019 – 30/4/2021 3,000,000 – – – 3,000,000
22/12/2011 14.50 1/5/2020 – 30/4/2022 3,000,000 – – – 3,000,000
22/12/2011 14.50 1/5/2021 – 30/4/2023 3,000,000 – – – 3,000,000
26/6/2012 15.09 1/5/2013 – 30/4/2015 3,742,000 – – – 3,742,000
26/6/2012 15.09 1/5/2014 – 30/4/2016 8,357,000 – – – 8,357,000
12/11/2012 13.04 1/5/2013 – 30/4/2015 813,000 – – – 813,000
12/11/2012 13.04 1/5/2014 – 30/4/2016 3,014,000 – – – 3,014,000
Total 250,737,000 (1,349,400) (2,409,800) (38,843,800) 208,134,000
Subsequent to 31 December 2013, no Shares has been allotted and issued under the Option Scheme.
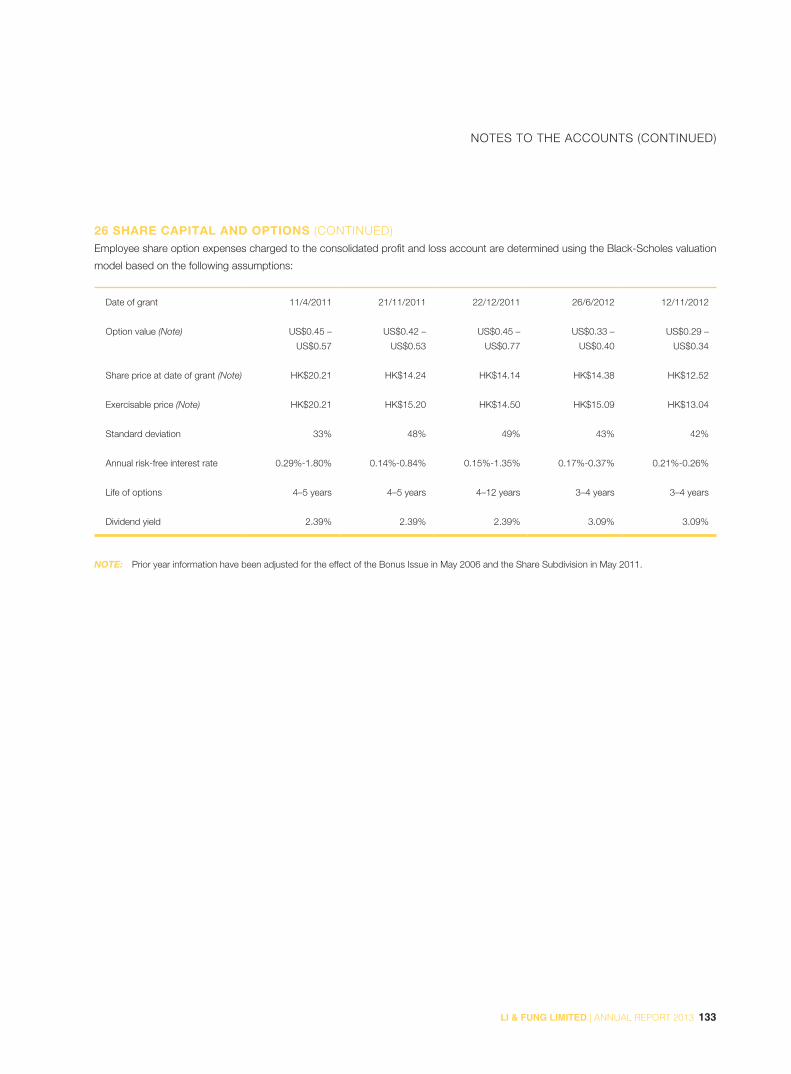
133LI & FUNG LIMITED | ANNUAL REPORT 2013
NOTES TO THE ACCOUNTS (CONTINUED)
26 SHARE CAPITAL AND OPTIONS (CONTINUED)Employee share option expenses charged to the consolidated profit and loss account are determined using the Black-Scholes valuation
model based on the following assumptions:
Date of grant 11/4/2011 21/11/2011 22/12/2011 26/6/2012 12/11/2012
Option value (Note) US$0.45 –
US$0.57
US$0.42 –
US$0.53
US$0.45 –
US$0.77
US$0.33 –
US$0.40
US$0.29 –
US$0.34
Share price at date of grant (Note) HK$20.21 HK$14.24 HK$14.14 HK$14.38 HK$12.52
Exercisable price (Note) HK$20.21 HK$15.20 HK$14.50 HK$15.09 HK$13.04
Standard deviation 33% 48% 49% 43% 42%
Annual risk-free interest rate 0.29%-1.80% 0.14%-0.84% 0.15%-1.35% 0.17%-0.37% 0.21%-0.26%
Life of options 4–5 years 4–5 years 4–12 years 3–4 years 3–4 years
Dividend yield 2.39% 2.39% 2.39% 3.09% 3.09%
NOTE: Prior year information have been adjusted for the effect of the Bonus Issue in May 2006 and the Share Subdivision in May 2011.
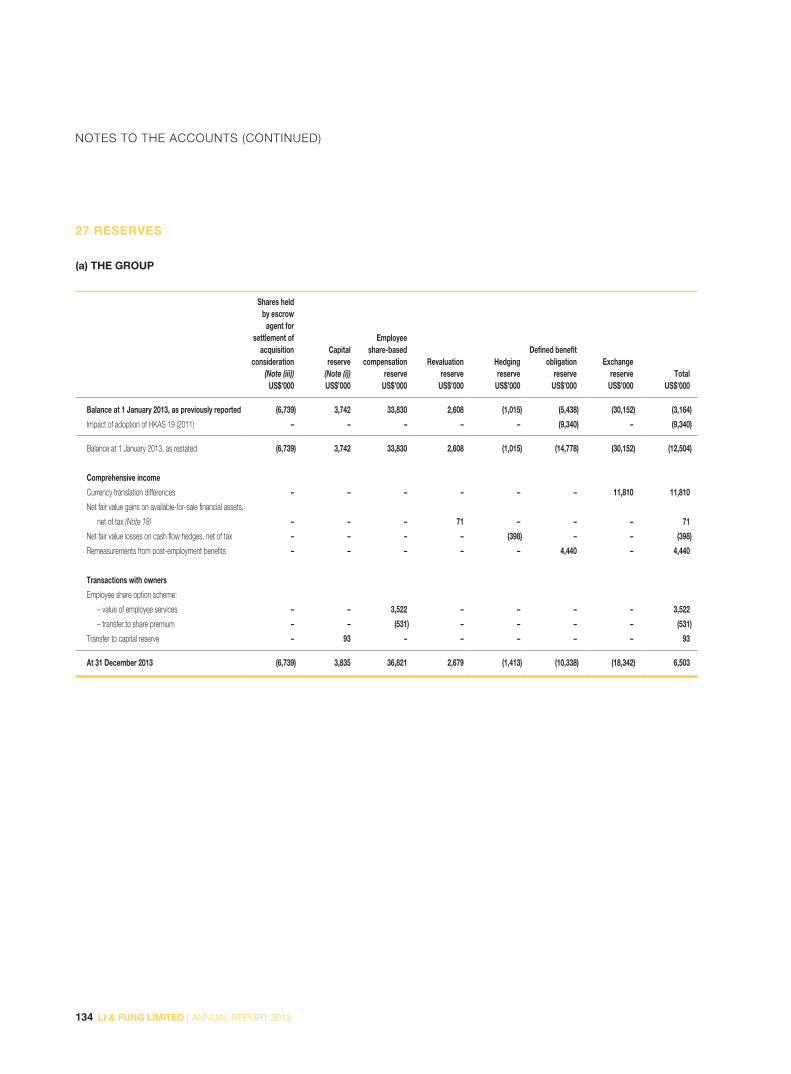
134 LI & FUNG LIMITED | ANNUAL REPORT 2013
NOTES TO THE ACCOUNTS (CONTINUED)
27 RESERVES
(a) THE GROUP
Shares held
by escrowagent for
settlement ofacquisition
consideration(Note (iii))
Capitalreserve
(Note (i))
Employeeshare-based
compensationreserve
Revaluationreserve
Hedgingreserve
Defined benefitobligation
reserveExchange
reserve TotalUS$’000 US$’000 US$’000 US$’000 US$’000 US$’000 US$’000 US$’000
Balance at 1 January 2013, as previously reported (6,739) 3,742 33,830 2,608 (1,015) (5,438) (30,152) (3,164)
Impact of adoption of HKAS 19 (2011) – – – – – (9,340) – (9,340)
Balance at 1 January 2013, as restated (6,739) 3,742 33,830 2,608 (1,015) (14,778) (30,152) (12,504)
Comprehensive income
Currency translation differences – – – – – – 11,810 11,810
Net fair value gains on available-for-sale financial assets,
net of tax (Note 18) – – – 71 – – – 71
Net fair value losses on cash flow hedges, net of tax – – – – (398) – – (398)
Remeasurements from post-employment benefits – – – – – 4,440 – 4,440
Transactions with owners
Employee share option scheme:
– value of employee services – – 3,522 – – – – 3,522
– transfer to share premium – – (531) – – – – (531)
Transfer to capital reserve – 93 – – – – – 93
At 31 December 2013 (6,739) 3,835 36,821 2,679 (1,413) (10,338) (18,342) 6,503

135LI & FUNG LIMITED | ANNUAL REPORT 2013
NOTES TO THE ACCOUNTS (CONTINUED)
27 RESERVES (CONTINUED)
(a) THE GROUP (CONTINUED)
Shares held
by escrowagent for
settlement of acquisition
consideration(Note (iii))
Capitalreserve
(Note (i))
Employeeshare-based
compensationreserve
Revaluationreserve
Hedgingreserve
Defined benefitobligation
reserveExchange
reserve TotalUS$’000 US$’000 US$’000 US$’000 US$’000 US$’000 US$’000 US$’000
Balance at 1 January 2012, as previously reported (8,503) 3,618 47,237 2,496 9,474 (3,549) (78,212) (27,439)
Impact of adoption of HKAS 19 (2011) – – – – – (9,340) – (9,340)
Balance at 1 January 2012, as restated (8,503) 3,618 47,237 2,496 9,474 (12,889) (78,212) (36,779)
Comprehensive income
Currency translation differences – – – – – – 48,060 48,060
Net fair value gains on available-for-sale financial assets,
net of tax (Note 18) – – – 112 – – – 112
Net fair value losses on cash flow hedges, net of tax – – – – (10,489) – – (10,489)
Remeasurements from post-employment benefits – – – – – (1,889) – (1,889)
Transactions with owners
Employee share option scheme:
– value of employee services – – 2,248 – – – – 2,248
– transfer to share premium – – (15,655) – – – – (15,655)
Release of shares held by escrow agent for settlement
of acquisition consideration 1,764 – – – – – – 1,764
Transfer to capital reserve – 124 – – – – – 124
At 31 December 2012, restated (6,739) 3,742 33,830 2,608 (1,015) (14,778) (30,152) (12,504)

136 LI & FUNG LIMITED | ANNUAL REPORT 2013
NOTES TO THE ACCOUNTS (CONTINUED)
27 RESERVES (CONTINUED)
(b) THE COMPANY
Sharepremium
Shares heldby escrow
agent forsettlement of
acquisitionconsideration
(Note (iii))
Contributedsurplus
account(Note (ii))
Employeeshare-based
compensationreserve
Retainedearnings Total
US$’000 US$’000 US$’000 US$’000 US$’000 US$’000
Balance at 1 January 2012 3,114,097 (8,503) 264,189 47,237 499,815 3,916,835
Profit for the year – – – – 322,606 322,606
Issue of shares upon a private placing 497,923 – – – – 497,923
Employee share option scheme:
– value of employee services – – – 2,248 – 2,248
– proceeds from shares issued 69,337 – – – – 69,337
– transfer to share premium 15,655 – – (15,655) – –
Release of shares held by escrow agent for
settlement on acquisition consideration – 1,764 – – – 1,764
2011 final dividend paid – – – – (363,999) (363,999)
2012 interim dividend paid – – – – (160,721) (160,721)
Reserves 3,697,012 (6,739) 264,189 33,830 126,206 4,114,498
Proposed dividend – – – – 171,495 171,495
At 31 December 2012 3,697,012 (6,739) 264,189 33,830 297,701 4,285,993
Balance at 1 January 2013 3,697,012 (6,739) 264,189 33,830 297,701 4,285,993
Profit for the year – – – – 601,460 601,460
Employee share option scheme:
– value of employee services – – – 3,522 – 3,522
– proceeds from shares issued 1,933 – – – – 1,933
– transfer to share premium 531 – – (531) – –
2012 final dividend paid – – – – (171,495) (171,495)
2013 interim dividend paid – – – – (160,777) (160,777)
Reserves 3,699,476 (6,739) 264,189 36,821 202,461 4,196,208
Proposed dividend – – – – 364,428 364,428
At 31 December 2013 3,699,476 (6,739) 264,189 36,821 566,889 4,560,636

137LI & FUNG LIMITED | ANNUAL REPORT 2013
NOTES TO THE ACCOUNTS (CONTINUED)
27 RESERVES (CONTINUED)
(b) THE COMPANY (CONTINUED)NOTES:
(i) Capital reserve represents amount set aside from the profit of certain overseas subsidiaries of the Group in accordance with local statutory
requirements.
(ii) The contributed surplus account of the Company represents:
(1) The difference between the nominal value of the Company’s shares issued in exchange for the issued ordinary shares of Li & Fung (B.V.I.) Limited
and the value of net assets of the underlying subsidiaries acquired as at 2 June 1992 amounting to US$14,232,000. At Group level, the amount is
reclassified into its components of reserves of the underlying subsidiaries.
(2) The difference between the issue price and the nominal value of the Company’s shares issued in connection with the acquisition of Colby in 2000
amounting to US$249,957,000. At Group level, the amount is set off against goodwill arising from the acquisition.
(iii) The Company issued shares for acquisitions of CGroup and Regatta in 2007. These Shares were held by escrow agents and valued at the respective
agreed upon issue price. In 2012, certain portions of these shares amounted to approximately US$1,764,000 were released to the vendors as
the settlement of deferred considerations. At the balance sheet date, the remaining shares held by the escrow agent amounted to approximately
US$6,739,000 and were deducted from total equity. The total amount of deferred consideration for the acquisition of CGroup and Regatta had been
finalized. Accordingly, the remaining shares held by the escrow agent for CGroup and Regatta of approximately US$6,739,000 were considered as
treasury shares of the Company as of 31 December 2013.
28 PERPETUAL CAPITAL SECURITIESOn 8 November 2012, the Company issued perpetual subordinated capital securities (the “Perpetual Capital Securities”) with an
aggregate principal amount of US$500 million, which have been primarily utilized for the new acquisitions in 2013 as well as the
settlement of consideration payable for prior year acquisitions. The Perpetual Capital Securities do not have maturity date and the
distribution payments can be deferred at the discretion of the Company. Therefore, the Perpetual Capital Securities are classified as
equity instruments and recorded in equity in the consolidated balance sheet. The amounts as at 31 December 2013 and 2012 included
the accrued distribution payments.
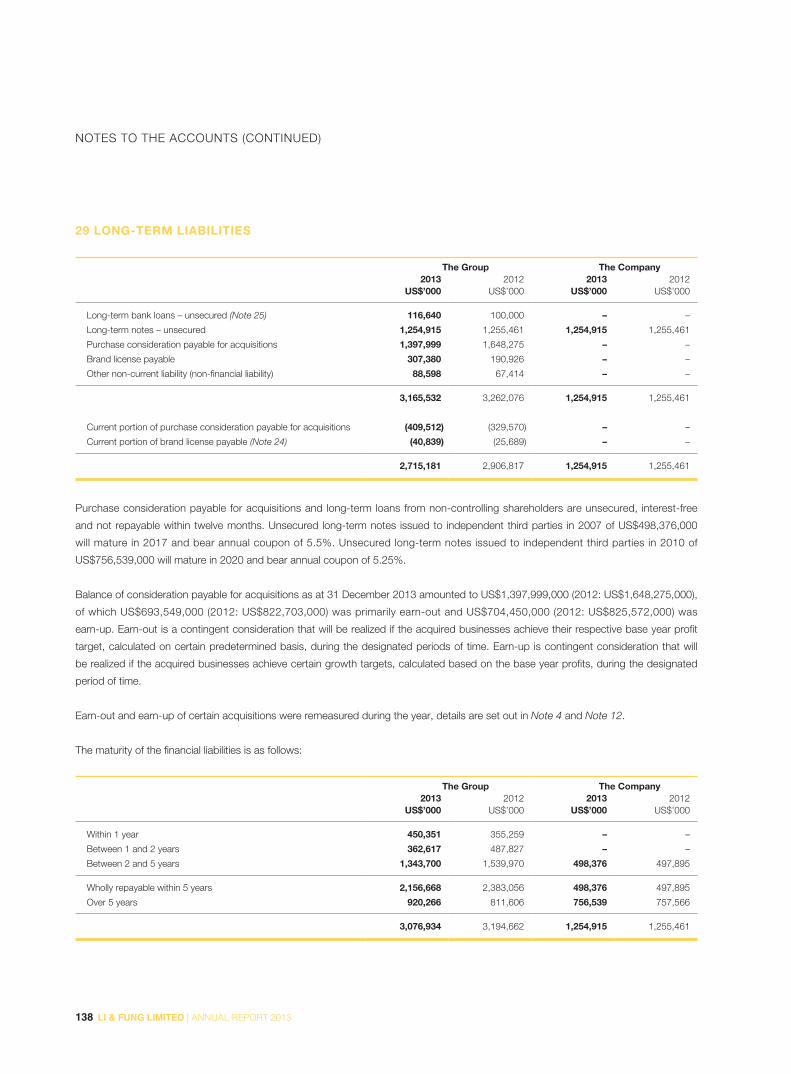
138 LI & FUNG LIMITED | ANNUAL REPORT 2013
NOTES TO THE ACCOUNTS (CONTINUED)
29 LONG-TERM LIABILITIES
The Group The Company
2013 2012 2013 2012US$’000 US$’000 US$’000 US$’000
Long-term bank loans – unsecured (Note 25) 116,640 100,000 – –
Long-term notes – unsecured 1,254,915 1,255,461 1,254,915 1,255,461
Purchase consideration payable for acquisitions 1,397,999 1,648,275 – –
Brand license payable 307,380 190,926 – –
Other non-current liability (non-financial liability) 88,598 67,414 – –
3,165,532 3,262,076 1,254,915 1,255,461
Current portion of purchase consideration payable for acquisitions (409,512) (329,570) – –
Current portion of brand license payable (Note 24) (40,839) (25,689) – –
2,715,181 2,906,817 1,254,915 1,255,461
Purchase consideration payable for acquisitions and long-term loans from non-controlling shareholders are unsecured, interest-free
and not repayable within twelve months. Unsecured long-term notes issued to independent third parties in 2007 of US$498,376,000
will mature in 2017 and bear annual coupon of 5.5%. Unsecured long-term notes issued to independent third parties in 2010 of
US$756,539,000 will mature in 2020 and bear annual coupon of 5.25%.
Balance of consideration payable for acquisitions as at 31 December 2013 amounted to US$1,397,999,000 (2012: US$1,648,275,000),
of which US$693,549,000 (2012: US$822,703,000) was primarily earn-out and US$704,450,000 (2012: US$825,572,000) was
earn-up. Earn-out is a contingent consideration that will be realized if the acquired businesses achieve their respective base year profit
target, calculated on certain predetermined basis, during the designated periods of time. Earn-up is contingent consideration that will
be realized if the acquired businesses achieve certain growth targets, calculated based on the base year profits, during the designated
period of time.
Earn-out and earn-up of certain acquisitions were remeasured during the year, details are set out in Note 4 and Note 12.
The maturity of the financial liabilities is as follows:
The Group The Company
2013 2012 2013 2012US$’000 US$’000 US$’000 US$’000
Within 1 year 450,351 355,259 – –
Between 1 and 2 years 362,617 487,827 – –
Between 2 and 5 years 1,343,700 1,539,970 498,376 497,895
Wholly repayable within 5 years 2,156,668 2,383,056 498,376 497,895
Over 5 years 920,266 811,606 756,539 757,566
3,076,934 3,194,662 1,254,915 1,255,461

139LI & FUNG LIMITED | ANNUAL REPORT 2013
NOTES TO THE ACCOUNTS (CONTINUED)
29 LONG-TERM LIABILITIES (CONTINUED)The fair values of the financial liabilities (non-current portion) are as follows:
The Group
2013 2012US$’000 US$’000
Long-term bank loans – unsecured 116,640 100,000
Long-term notes – unsecured 1,331,675 1,411,800
Purchase consideration payable for acquisitions 988,487 1,318,705
Brand license payable 266,541 165,237
2,703,343 2,995,742
The carrying amounts of financial liabilities are denominated in the following currencies:
The Group
2013 2012US$’000 US$’000
HK dollar 2,675 18,510
US dollar 2,692,348 2,870,710
Pound sterling 109,551 129,087
Euro dollar 211,053 176,355
Others 61,307 –
3,076,934 3,194,662
30 POST-EMPLOYMENT BENEFIT OBLIGATIONS
The Group
As at 31 December As at 1 January2013 2012 2012
US$’000 US$’000 US$’000(Restated) (Restated)
Pension obligations (Note) 16,154 20,498 14,872
Long service payment liabilities 8,176 8,272 8,608
24,330 28,770 23,480
NOTE: The Group participates in a number of defined benefit plans in certain countries. Most of these pension plans are final salary defined benefit plans.
The assets of the funded plans are held independently of the Group’s assets in separate trustee-administered funds. The Group’s defined benefit
plans are valued by qualified actuaries annually using the projected unit credit method.
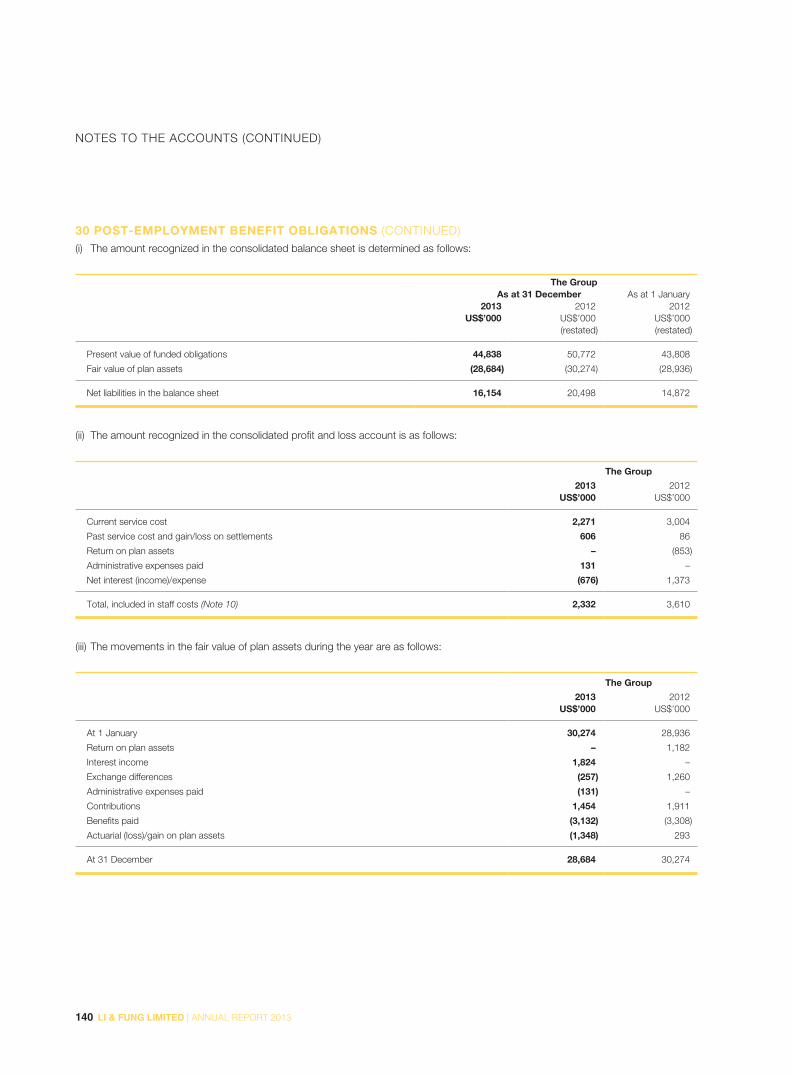
140 LI & FUNG LIMITED | ANNUAL REPORT 2013
NOTES TO THE ACCOUNTS (CONTINUED)
30 POST-EMPLOYMENT BENEFIT OBLIGATIONS (CONTINUED)(i) The amount recognized in the consolidated balance sheet is determined as follows:
The Group
As at 31 December As at 1 January2013 2012 2012
US$’000 US$’000 US$’000(restated) (restated)
Present value of funded obligations 44,838 50,772 43,808
Fair value of plan assets (28,684) (30,274) (28,936)
Net liabilities in the balance sheet 16,154 20,498 14,872
(ii) The amount recognized in the consolidated profit and loss account is as follows:
The Group
2013 2012US$’000 US$’000
Current service cost 2,271 3,004
Past service cost and gain/loss on settlements 606 86
Return on plan assets – (853)
Administrative expenses paid 131 –
Net interest (income)/expense (676) 1,373
Total, included in staff costs (Note 10) 2,332 3,610
(iii) The movements in the fair value of plan assets during the year are as follows:
The Group
2013 2012US$’000 US$’000
At 1 January 30,274 28,936
Return on plan assets – 1,182
Interest income 1,824 –
Exchange differences (257) 1,260
Administrative expenses paid (131) –
Contributions 1,454 1,911
Benefits paid (3,132) (3,308)
Actuarial (loss)/gain on plan assets (1,348) 293
At 31 December 28,684 30,274

141LI & FUNG LIMITED | ANNUAL REPORT 2013
NOTES TO THE ACCOUNTS (CONTINUED)
30 POST-EMPLOYMENT BENEFIT OBLIGATIONS (CONTINUED)(iv) Movements in the defined benefit obligation are as follows:
The Group
2013 2012US$’000 US$’000
At 1 January, as previously reported 43,613 36,649
Adjustment for adoption of HKAS 19 (2011) 7,159 7,159
At 1 January, as restated 50,772 43,808
Current service cost 2,271 3,004
Interest cost 1,148 1,373
Past service cost and loss on settlements 606 86
Actuarial gain from changes in experiences (188) –
Actuarial (gain)/loss from changes in financial assumption (4,983) 2,127
Actuarial loss from changes in demographic assumption 275 –
Exchange differences (1,185) 1,282
Benefits paid (3,878) (3,308)
Liabilities acquired in business combination – 2,400
At 31 December 44,838 50,772
(v) The movements in net defined benefit liabilities recognized in the consolidated balance sheet are as follows:
The Group
2013 2012US$’000 US$’000
At 1 January, as previously reported 13,339 7,713
Adjustment for adoption of HKAS 19 (2011) 7,159 7,159
At 1 January, as restated 20,498 14,872
Exchange differences (928) 22
Total expense charged in the consolidated income statement 2,332 3,610
Remeasurements (gains)/losses recognized in other comprehensive income (3,548) 1,505
Contributions paid (1,454) (1,911)
Benefits paid (746) –
Liabilities acquired in business combination – 2,400
At 31 December 16,154 20,498
(vi) The principal actuarial assumptions used for accounting purposes are:
2013 2012
% %
Discount rate 1.9-9 0.6-6.25
Inflation 2.5-4.5 1.5-5.5
Salary growth rate 3-8 3-8
Pension growth rate 3.3 2.8

142 LI & FUNG LIMITED | ANNUAL REPORT 2013
NOTES TO THE ACCOUNTS (CONTINUED)
30 POST-EMPLOYMENT BENEFIT OBLIGATIONS (CONTINUED)(vi) The principal actuarial assumptions used for accounting purposes are: (continued)
The sensitivity of the defined benefit obligation to changes in the principal assumptions is:
Impact on defined benefit obligation
Change inAssumption
Increase inassumption
Decrease inassumption
Discount rate ±0.25% –2.24% 2.33%
The above sensitivity analyzes are based on a change in an assumption while holding all other assumptions constant. In practice, this
is unlikely to occur, and changes in some of the assumptions may be correlated. When calculating the sensitivity of the defined benefit
obligation to significant actuarial assumptions the same method has been applied as when calculating the pension liability recognized
within the statement of financial position.
The methods and types of assumptions used in preparing the sensitivity analysis did not change compared to the previous period.
(vii) Plan assets comprised follows:
2013 2012
% %
Equity instruments 61 56
Debt instruments 10 11
Other 29 33
100 100
The weighted average duration of the defined benefit obligation ranges from 8.0 to 19.0 years.
(viii) Expected maturity analysis of benefit payments:
The Group
Within 10 years Between 10-20 years Beyond 20 yearsAt 31 December 2013 US$’000 US$’000 US$’000
Expected benefit payments 11,336 22,202 17,602
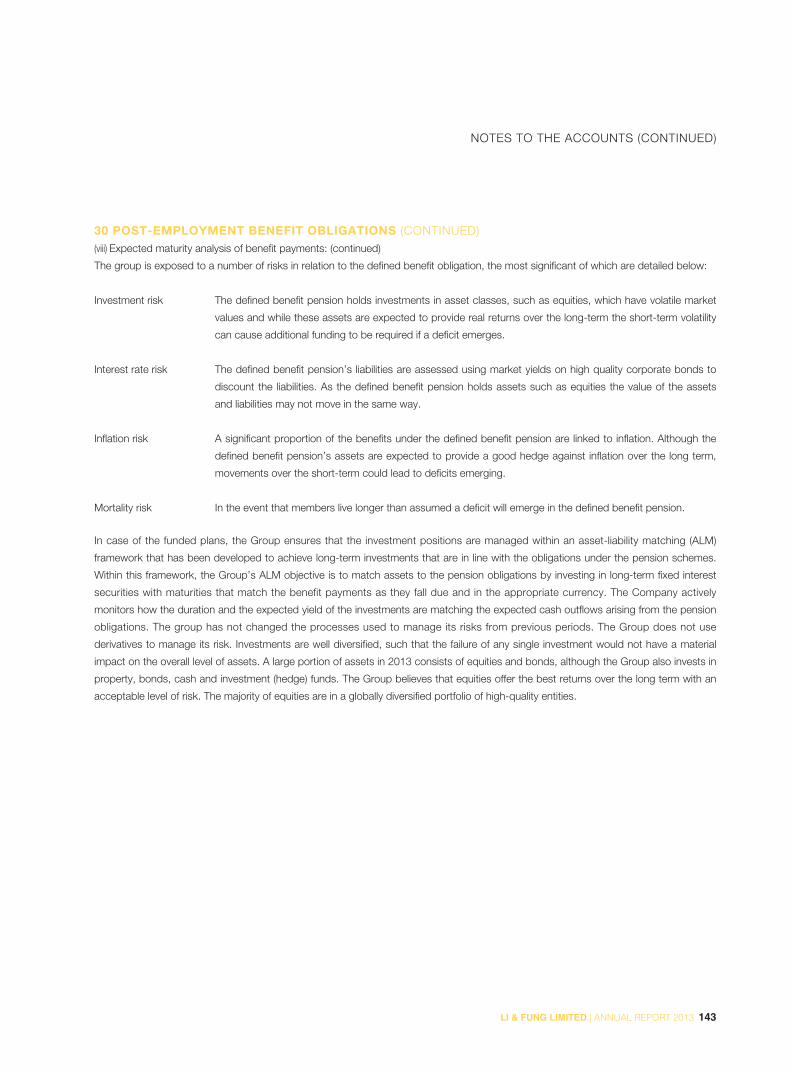
143LI & FUNG LIMITED | ANNUAL REPORT 2013
NOTES TO THE ACCOUNTS (CONTINUED)
30 POST-EMPLOYMENT BENEFIT OBLIGATIONS (CONTINUED)(viii) Expected maturity analysis of benefit payments: (continued)
The group is exposed to a number of risks in relation to the defined benefit obligation, the most significant of which are detailed below:
Investment risk The defined benefit pension holds investments in asset classes, such as equities, which have volatile market
values and while these assets are expected to provide real returns over the long-term the short-term volatility
can cause additional funding to be required if a deficit emerges.
Interest rate risk The defined benefit pension’s liabilities are assessed using market yields on high quality corporate bonds to
discount the liabilities. As the defined benefit pension holds assets such as equities the value of the assets
and liabilities may not move in the same way.
Inflation risk A significant proportion of the benefits under the defined benefit pension are linked to inflation. Although the
defined benefit pension’s assets are expected to provide a good hedge against inflation over the long term,
movements over the short-term could lead to deficits emerging.
Mortality risk In the event that members live longer than assumed a deficit will emerge in the defined benefit pension.
In case of the funded plans, the Group ensures that the investment positions are managed within an asset-liability matching (ALM)
framework that has been developed to achieve long-term investments that are in line with the obligations under the pension schemes.
Within this framework, the Group’s ALM objective is to match assets to the pension obligations by investing in long-term fixed interest
securities with maturities that match the benefit payments as they fall due and in the appropriate currency. The Company actively
monitors how the duration and the expected yield of the investments are matching the expected cash outflows arising from the pension
obligations. The group has not changed the processes used to manage its risks from previous periods. The Group does not use
derivatives to manage its risk. Investments are well diversified, such that the failure of any single investment would not have a material
impact on the overall level of assets. A large portion of assets in 2013 consists of equities and bonds, although the Group also invests in
property, bonds, cash and investment (hedge) funds. The Group believes that equities offer the best returns over the long term with an
acceptable level of risk. The majority of equities are in a globally diversified portfolio of high-quality entities.

144 LI & FUNG LIMITED | ANNUAL REPORT 2013
NOTES TO THE ACCOUNTS (CONTINUED)
31 DEFERRED TAXATIONDeferred taxation is calculated in full on temporary differences under the liability method using a principal taxation rate of 16.5% (2012:
16.5%).
The movements in the net deferred tax liabilities are as follows:
The Group
2013 2012 2011US$’000 US$’000 US$’000
(Restated) (Restated)
At 1 January 1,345 28,728 9,180
Adjustment for adoption of HKAS 19 (2011) – (2,777) (2,777)
1,345 25,951 6,403
(Credited)/charged to consolidated profit and loss account (Note 6) (658) (14,403) 18,886
Acquisition of businesses (Note 33) 10,070 (5,102) (38)
Adjustments to purchase consideration payable for acquisitions
and net asset value 7,893 – 572
Disposal of subsidiaries – – 135
Credited to hedging reserve 8 (4,345) –
Exchange differences 111 (756) (7)
At 31 December 18,769 1,345 25,951
Deferred tax assets are recognized for tax losses carried forward to the extent that realization of the related tax benefit through future
taxable profits is probable. The Group has unrecognized tax losses of US$733,660,000 (2012: US$777,540,000) to carry forward
against future taxable income, out of which US$100,515,000 will expire during 2014–2032. Deferred tax assets for these tax losses are
not recognized as it is not probable that related tax assets will be utilized in the foreseeable future.
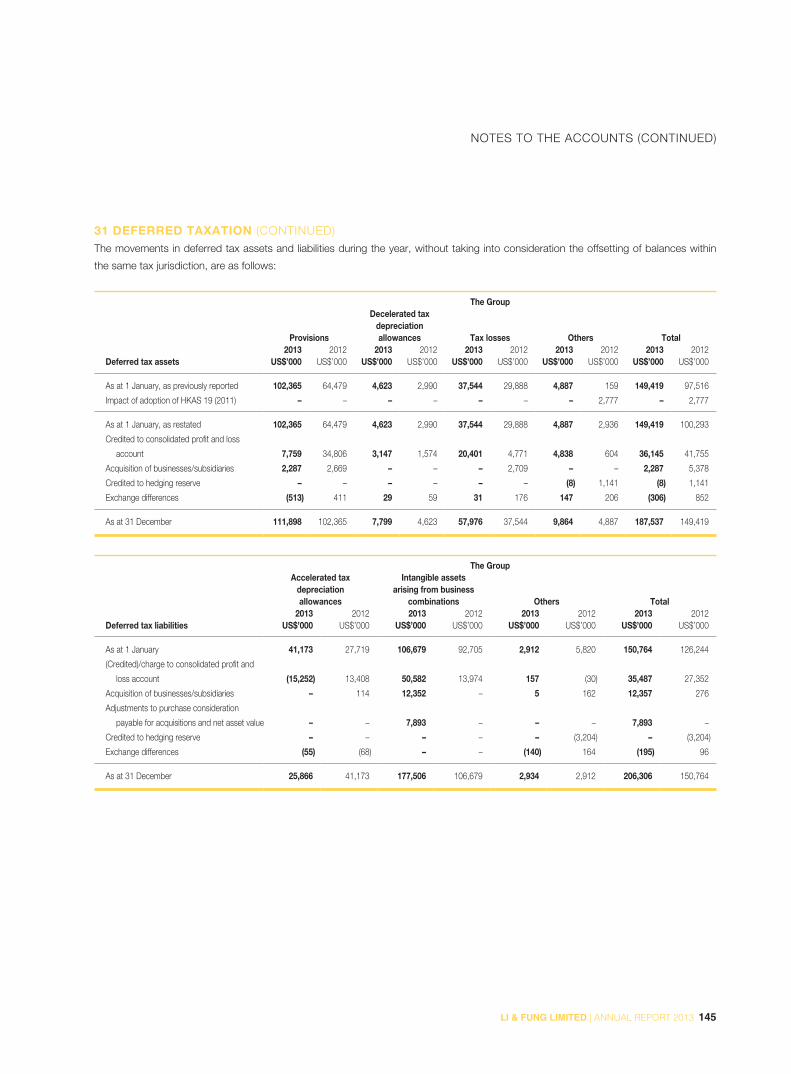
145LI & FUNG LIMITED | ANNUAL REPORT 2013
NOTES TO THE ACCOUNTS (CONTINUED)
31 DEFERRED TAXATION (CONTINUED)The movements in deferred tax assets and liabilities during the year, without taking into consideration the offsetting of balances within
the same tax jurisdiction, are as follows:
The Group
Provisions
Decelerated tax depreciation allowances Tax losses Others Total
2013 2012 2013 2012 2013 2012 2013 2012 2013 2012Deferred tax assets US$’000 US$’000 US$’000 US$’000 US$’000 US$’000 US$’000 US$’000 US$’000 US$’000
As at 1 January, as previously reported 102,365 64,479 4,623 2,990 37,544 29,888 4,887 159 149,419 97,516
Impact of adoption of HKAS 19 (2011) – – – – – – – 2,777 – 2,777
As at 1 January, as restated 102,365 64,479 4,623 2,990 37,544 29,888 4,887 2,936 149,419 100,293
Credited to consolidated profit and loss
account 7,759 34,806 3,147 1,574 20,401 4,771 4,838 604 36,145 41,755
Acquisition of businesses/subsidiaries 2,287 2,669 – – – 2,709 – – 2,287 5,378
Credited to hedging reserve – – – – – – (8) 1,141 (8) 1,141
Exchange differences (513) 411 29 59 31 176 147 206 (306) 852
As at 31 December 111,898 102,365 7,799 4,623 57,976 37,544 9,864 4,887 187,537 149,419
The Group
Accelerated taxdepreciationallowances
Intangible assetsarising from business
combinations Others Total2013 2012 2013 2012 2013 2012 2013 2012
Deferred tax liabilities US$’000 US$’000 US$’000 US$’000 US$’000 US$’000 US$’000 US$’000
As at 1 January 41,173 27,719 106,679 92,705 2,912 5,820 150,764 126,244
(Credited)/charge to consolidated profit and
loss account (15,252) 13,408 50,582 13,974 157 (30) 35,487 27,352
Acquisition of businesses/subsidiaries – 114 12,352 – 5 162 12,357 276
Adjustments to purchase consideration
payable for acquisitions and net asset value – – 7,893 – – – 7,893 –
Credited to hedging reserve – – – – – (3,204) – (3,204)
Exchange differences (55) (68) – – (140) 164 (195) 96
As at 31 December 25,866 41,173 177,506 106,679 2,934 2,912 206,306 150,764
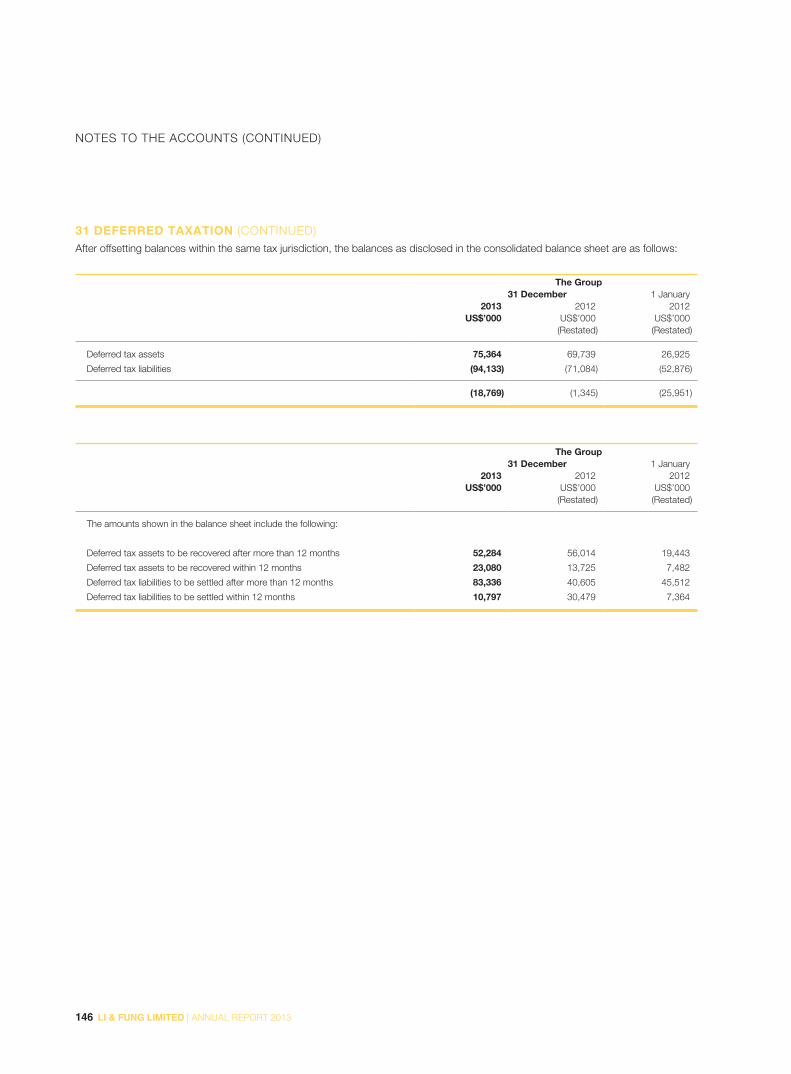
146 LI & FUNG LIMITED | ANNUAL REPORT 2013
NOTES TO THE ACCOUNTS (CONTINUED)
31 DEFERRED TAXATION (CONTINUED)After offsetting balances within the same tax jurisdiction, the balances as disclosed in the consolidated balance sheet are as follows:
The Group
31 December 1 January2013 2012 2012
US$’000 US$’000 US$’000(Restated) (Restated)
Deferred tax assets 75,364 69,739 26,925
Deferred tax liabilities (94,133) (71,084) (52,876)
(18,769) (1,345) (25,951)
The Group
31 December 1 January2013 2012 2012
US$’000 US$’000 US$’000(Restated) (Restated)
The amounts shown in the balance sheet include the following:
Deferred tax assets to be recovered after more than 12 months 52,284 56,014 19,443
Deferred tax assets to be recovered within 12 months 23,080 13,725 7,482
Deferred tax liabilities to be settled after more than 12 months 83,336 40,605 45,512
Deferred tax liabilities to be settled within 12 months 10,797 30,479 7,364
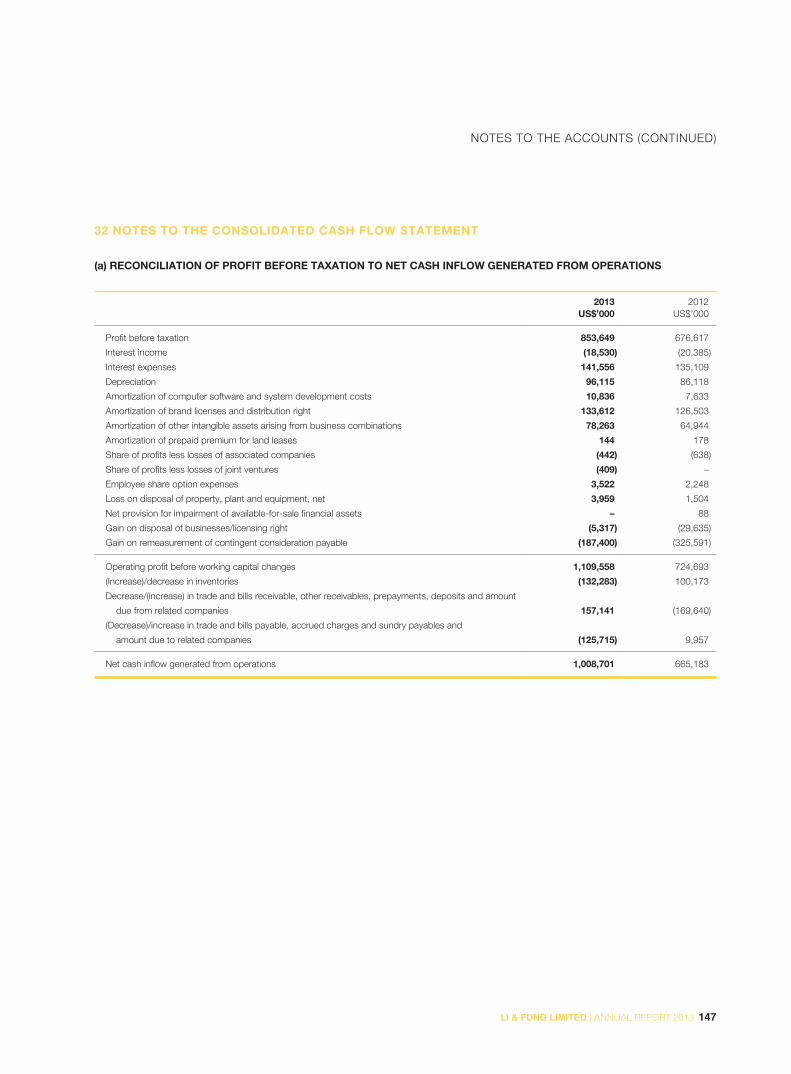
147LI & FUNG LIMITED | ANNUAL REPORT 2013
NOTES TO THE ACCOUNTS (CONTINUED)
32 NOTES TO THE CONSOLIDATED CASH FLOW STATEMENT
(a) RECONCILIATION OF PROFIT BEFORE TAXATION TO NET CASH INFLOW GENERATED FROM OPERATIONS
2013 2012US$’000 US$’000
Profit before taxation 853,649 676,617
Interest income (18,530) (20,385)
Interest expenses 141,556 135,109
Depreciation 96,115 86,118
Amortization of computer software and system development costs 10,836 7,633
Amortization of brand licenses and distribution right 133,612 126,503
Amortization of other intangible assets arising from business combinations 78,263 64,944
Amortization of prepaid premium for land leases 144 178
Share of profits less losses of associated companies (442) (638)
Share of profits less losses of joint ventures (409) –
Employee share option expenses 3,522 2,248
Loss on disposal of property, plant and equipment, net 3,959 1,504
Net provision for impairment of available-for-sale financial assets – 88
Gain on disposal of businesses/licensing right (5,317) (29,635)
Gain on remeasurement of contingent consideration payable (187,400) (325,591)
Operating profit before working capital changes 1,109,558 724,693
(Increase)/decrease in inventories (132,283) 100,173
Decrease/(increase) in trade and bills receivable, other receivables, prepayments, deposits and amount
due from related companies 157,141 (169,640)
(Decrease)/increase in trade and bills payable, accrued charges and sundry payables and
amount due to related companies (125,715) 9,957
Net cash inflow generated from operations 1,008,701 665,183

148 LI & FUNG LIMITED | ANNUAL REPORT 2013
NOTES TO THE ACCOUNTS (CONTINUED)
32 NOTES TO THE CONSOLIDATED CASH FLOW STATEMENT (CONTINUED)
(b) ANALYSIS OF CHANGES IN FINANCING DURING THE YEAR
2013 2012
Share capitalincluding share
premiumBankloans
Share capitalincluding share
premiumBankloans
US$’000 US$’000 US$’000 US$’000(Note 26 & 27) (Note 26 & 27)
At 1 January 3,710,408 217,519 3,127,084 217,425
Non cash movement
Transfer from employee share-based compensation reserve 531 – 15,655 –
3,710,939 217,519 3,142,739 217,425
Issue of shares upon a private placing – – 498,260 –
Net proceeds from issue of shares upon exercise of share options 1,935 – 69,409 –
Net (repayment)/drawdown of bank loans – (6,734) – 94
At 31 December 3,712,874 210,785 3,710,408 217,519
(c) DISPOSAL OF BUSINESSES/LICENSING RIGHT
Details of net (liabilities)/assets of disposed businesses/licensing right at date of disposal are set out below:
2013 2012US$’000 US$’000
Net assets disposed
Intangible assets (Note 12) 11,531 42
Property, plant and equipment (Note 13) 4,570 4,681
Inventories – 26,844
Trade and bills receivable – 14,736
Other receivables, prepayments and deposits – 2,936
Cash and bank balances – 6,448
Trade and bills payables – (4,781)
Accrued charges and sundry payable (1,527) (6,483)
Brand license payable (10,302) –
Taxation – (850)
Book value of net assets disposed 4,272 43,573
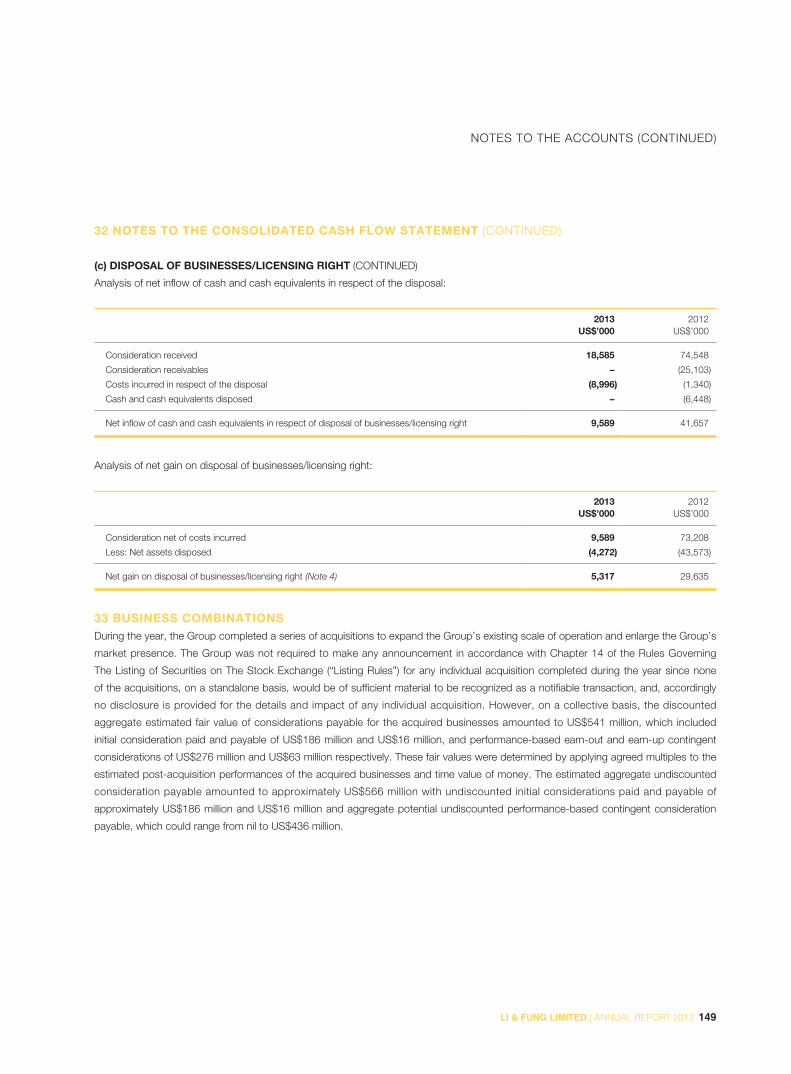
149LI & FUNG LIMITED | ANNUAL REPORT 2013
NOTES TO THE ACCOUNTS (CONTINUED)
32 NOTES TO THE CONSOLIDATED CASH FLOW STATEMENT (CONTINUED)
(c) DISPOSAL OF BUSINESSES/LICENSING RIGHT (CONTINUED)
Analysis of net inflow of cash and cash equivalents in respect of the disposal:
2013 2012US$’000 US$’000
Consideration received 18,585 74,548
Consideration receivables – (25,103)
Costs incurred in respect of the disposal (8,996) (1,340)
Cash and cash equivalents disposed – (6,448)
Net inflow of cash and cash equivalents in respect of disposal of businesses/licensing right 9,589 41,657
Analysis of net gain on disposal of businesses/licensing right:
2013 2012US$’000 US$’000
Consideration net of costs incurred 9,589 73,208
Less: Net assets disposed (4,272) (43,573)
Net gain on disposal of businesses/licensing right (Note 4) 5,317 29,635
33 BUSINESS COMBINATIONSDuring the year, the Group completed a series of acquisitions to expand the Group’s existing scale of operation and enlarge the Group’s
market presence. The Group was not required to make any announcement in accordance with Chapter 14 of the Rules Governing
The Listing of Securities on The Stock Exchange (“Listing Rules”) for any individual acquisition completed during the year since none
of the acquisitions, on a standalone basis, would be of sufficient material to be recognized as a notifiable transaction, and, accordingly
no disclosure is provided for the details and impact of any individual acquisition. However, on a collective basis, the discounted
aggregate estimated fair value of considerations payable for the acquired businesses amounted to US$541 million, which included
initial consideration paid and payable of US$186 million and US$16 million, and performance-based earn-out and earn-up contingent
considerations of US$276 million and US$63 million respectively. These fair values were determined by applying agreed multiples to the
estimated post-acquisition performances of the acquired businesses and time value of money. The estimated aggregate undiscounted
consideration payable amounted to approximately US$566 million with undiscounted initial considerations paid and payable of
approximately US$186 million and US$16 million and aggregate potential undiscounted performance-based contingent consideration
payable, which could range from nil to US$436 million.

150 LI & FUNG LIMITED | ANNUAL REPORT 2013
NOTES TO THE ACCOUNTS (CONTINUED)
33 BUSINESS COMBINATIONS (CONTINUED)The contributions of these acquisitions to the Group in this year, the contributions of these acquisitions and the result of the Group as if
these acquisitions had occurred on 1 January 2013 are as follows:
Contribution of the
acquired businesses
for the year ended
31 December 2013
Contribution of the
acquired businesses
as if the acquisitions
had occurred on
1 January 2013
Group results as
if the acquisitions
had occurred on
1 January 2013
US$’000 US$’000 US$’000
Turnover 329,349 557,418 20,973,479
Total margin 82,538 144,166 3,365,666
Operating costs (45,189) (81,594) (2,469,652)
Core operating profit 37,349 62,572 896,014
Profit after tax 21,154 34,088 762,872
Details of net assets acquired, goodwill and acquisition-related costs are as follows:
US$’000
Purchase consideration 540,881
Less: Aggregate fair values of net assets acquired * (186,887)
Goodwill (Note 12) 353,994
Acquisition-related costs (included in other non-core operating expenses) 9,421
* As at 31 December 2013, verification of individual assets/liabilities of the acquired businesses is in progress and the Group has not finalized the fair
value assessments. The fair value of individual assets/liabilities stated below are provisional.
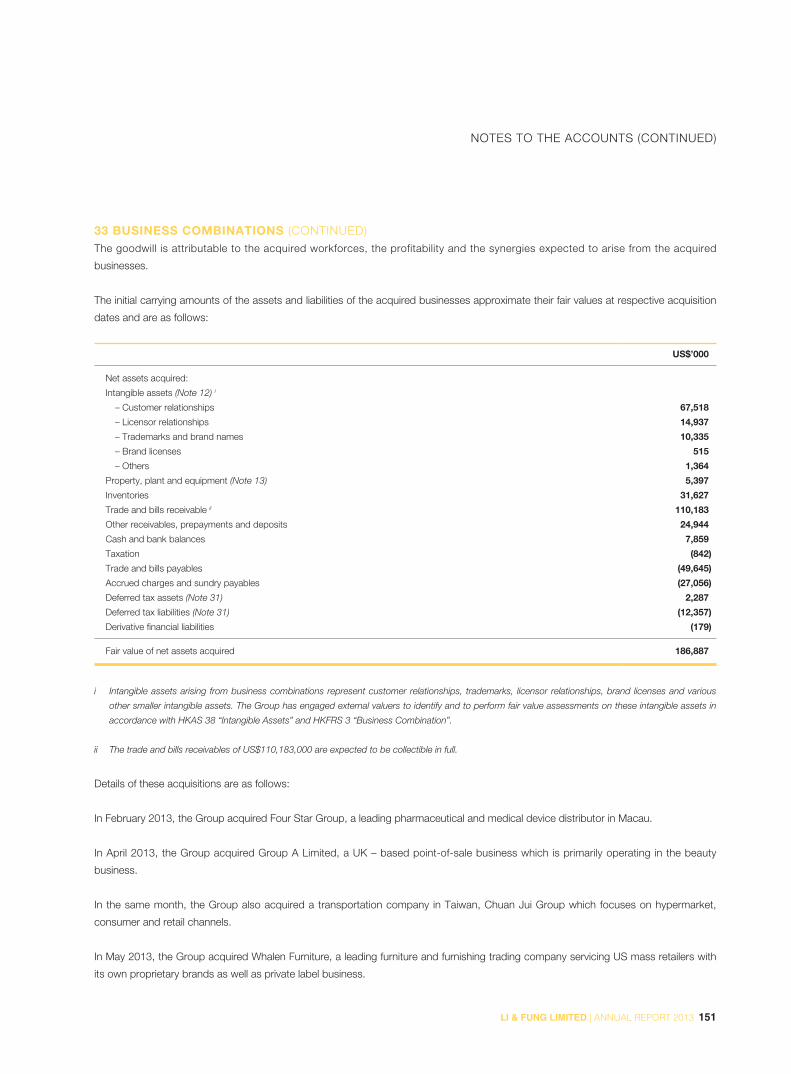
151LI & FUNG LIMITED | ANNUAL REPORT 2013
NOTES TO THE ACCOUNTS (CONTINUED)
33 BUSINESS COMBINATIONS (CONTINUED)The goodwill is attributable to the acquired workforces, the profitability and the synergies expected to arise from the acquired
businesses.
The initial carrying amounts of the assets and liabilities of the acquired businesses approximate their fair values at respective acquisition
dates and are as follows:
US$’000
Net assets acquired:
Intangible assets (Note 12) i
– Customer relationships 67,518
– Licensor relationships 14,937
– Trademarks and brand names 10,335
– Brand licenses 515
– Others 1,364
Property, plant and equipment (Note 13) 5,397
Inventories 31,627
Trade and bills receivable ii 110,183
Other receivables, prepayments and deposits 24,944
Cash and bank balances 7,859
Taxation (842)
Trade and bills payables (49,645)
Accrued charges and sundry payables (27,056)
Deferred tax assets (Note 31) 2,287
Deferred tax liabilities (Note 31) (12,357)
Derivative financial liabilities (179)
Fair value of net assets acquired 186,887
i Intangible assets arising from business combinations represent customer relationships, trademarks, licensor relationships, brand licenses and various
other smaller intangible assets. The Group has engaged external valuers to identify and to perform fair value assessments on these intangible assets in
accordance with HKAS 38 “Intangible Assets” and HKFRS 3 “Business Combination”.
ii The trade and bills receivables of US$110,183,000 are expected to be collectible in full.
Details of these acquisitions are as follows:
In February 2013, the Group acquired Four Star Group, a leading pharmaceutical and medical device distributor in Macau.
In April 2013, the Group acquired Group A Limited, a UK – based point-of-sale business which is primarily operating in the beauty
business.
In the same month, the Group also acquired a transportation company in Taiwan, Chuan Jui Group which focuses on hypermarket,
consumer and retail channels.
In May 2013, the Group acquired Whalen Furniture, a leading furniture and furnishing trading company servicing US mass retailers with
its own proprietary brands as well as private label business.

152 LI & FUNG LIMITED | ANNUAL REPORT 2013
NOTES TO THE ACCOUNTS (CONTINUED)
33 BUSINESS COMBINATIONS (CONTINUED)In June 2013, the Group acquired RM Enterprises Group. It is a leading licensing agency for the development and promotion of
character licensing in Greater China, South Korea, Japan and South East Asia.
In August 2013, the Group acquired New Concept, a high-end soft home company with nationwide distribution in China.
In October 2013, the Group acquired Jiangsu Soho which is a licensee and distributor of Jeep Kids brand in China.
In November 2013, the Group acquired Sicem. It is a leading licensing company specialized in character licenses in Italy.
Also in November 2013, the Group acquired R-Tsion, the exclusive sales agent for TV Mania in France.
In December 2013, the Group acquired a Canadian-based woman footwear company, Marvin Krasnow Enterprises Ltd. It is specialized
in weatherproof, stain resistant technology in Italian leather and suede.
Analysis of the net outflow of cash and cash equivalents in respect of the acquisitions:
US$’000
Purchase consideration 540,881
Purchase consideration payable for acquisitions* (354,961)
Cash and cash equivalents acquired (7,859)
Net outflow of cash and cash equivalents in respect of the acquisitions 178,061
* Balances are the discounted aggregate estimated fair value of deferred considerations payable for the acquired businesses as at respective acquisition
dates, which included initial consideration payable, performance-based earn-out and earn-up contingent considerations of US$16 million, US$276
million and US$63 million, respectively. Final amounts of consideration settlements will be determined based on future performance of the acquired
businesses.
34 CONTINGENT LIABILITIES
The Group The Company
2013 2012 2013 2012US$’000 US$’000 US$’000 US$’000
Guarantees in respect of banking facilities granted to:
Subsidiaries – – 4,644,267 4,356,913
Associated companies 750 750 – –
750 750 4,644,267 4,356,913
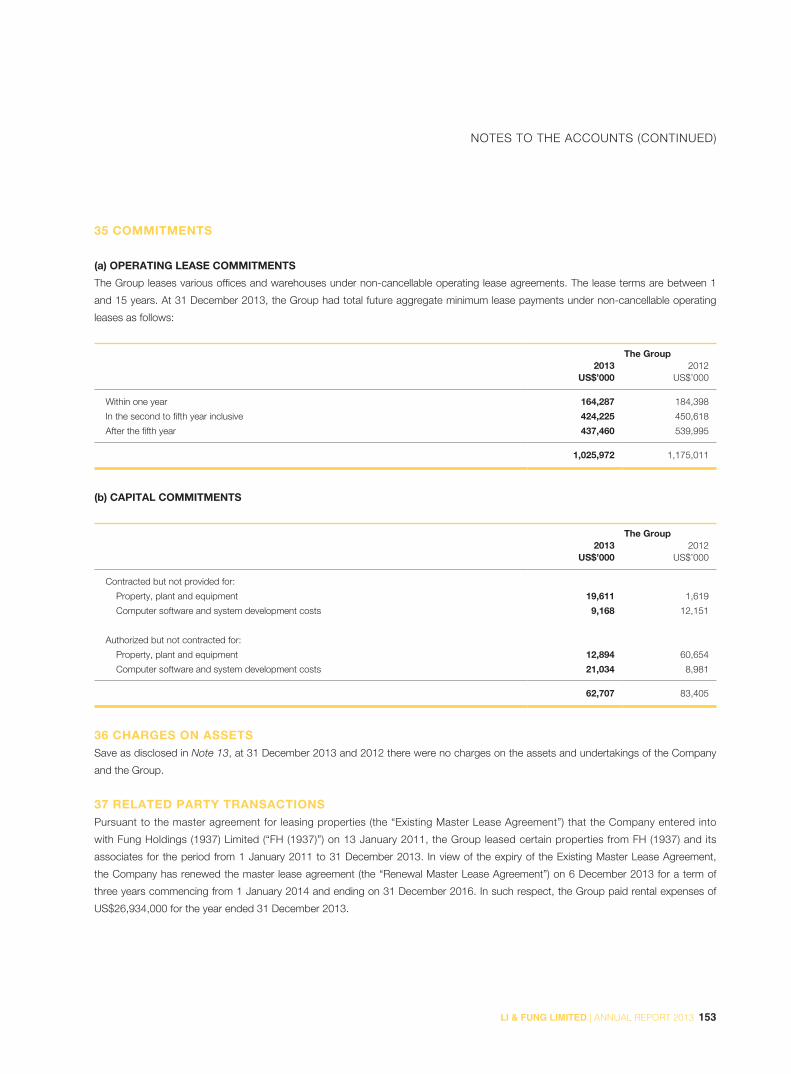
153LI & FUNG LIMITED | ANNUAL REPORT 2013
NOTES TO THE ACCOUNTS (CONTINUED)
35 COMMITMENTS
(a) OPERATING LEASE COMMITMENTS
The Group leases various offices and warehouses under non-cancellable operating lease agreements. The lease terms are between 1
and 15 years. At 31 December 2013, the Group had total future aggregate minimum lease payments under non-cancellable operating
leases as follows:
The Group
2013 2012US$’000 US$’000
Within one year 164,287 184,398
In the second to fifth year inclusive 424,225 450,618
After the fifth year 437,460 539,995
1,025,972 1,175,011
(b) CAPITAL COMMITMENTS
The Group
2013 2012US$’000 US$’000
Contracted but not provided for:
Property, plant and equipment 19,611 1,619
Computer software and system development costs 9,168 12,151
Authorized but not contracted for:
Property, plant and equipment 12,894 60,654
Computer software and system development costs 21,034 8,981
62,707 83,405
36 CHARGES ON ASSETSSave as disclosed in Note 13, at 31 December 2013 and 2012 there were no charges on the assets and undertakings of the Company
and the Group.
37 RELATED PARTY TRANSACTIONSPursuant to the master agreement for leasing properties (the “Existing Master Lease Agreement”) that the Company entered into
with Fung Holdings (1937) Limited (“FH (1937)”) on 13 January 2011, the Group leased certain properties from FH (1937) and its
associates for the period from 1 January 2011 to 31 December 2013. In view of the expiry of the Existing Master Lease Agreement,
the Company has renewed the master lease agreement (the “Renewal Master Lease Agreement”) on 6 December 2013 for a term of
three years commencing from 1 January 2014 and ending on 31 December 2016. In such respect, the Group paid rental expenses of
US$26,934,000 for the year ended 31 December 2013.
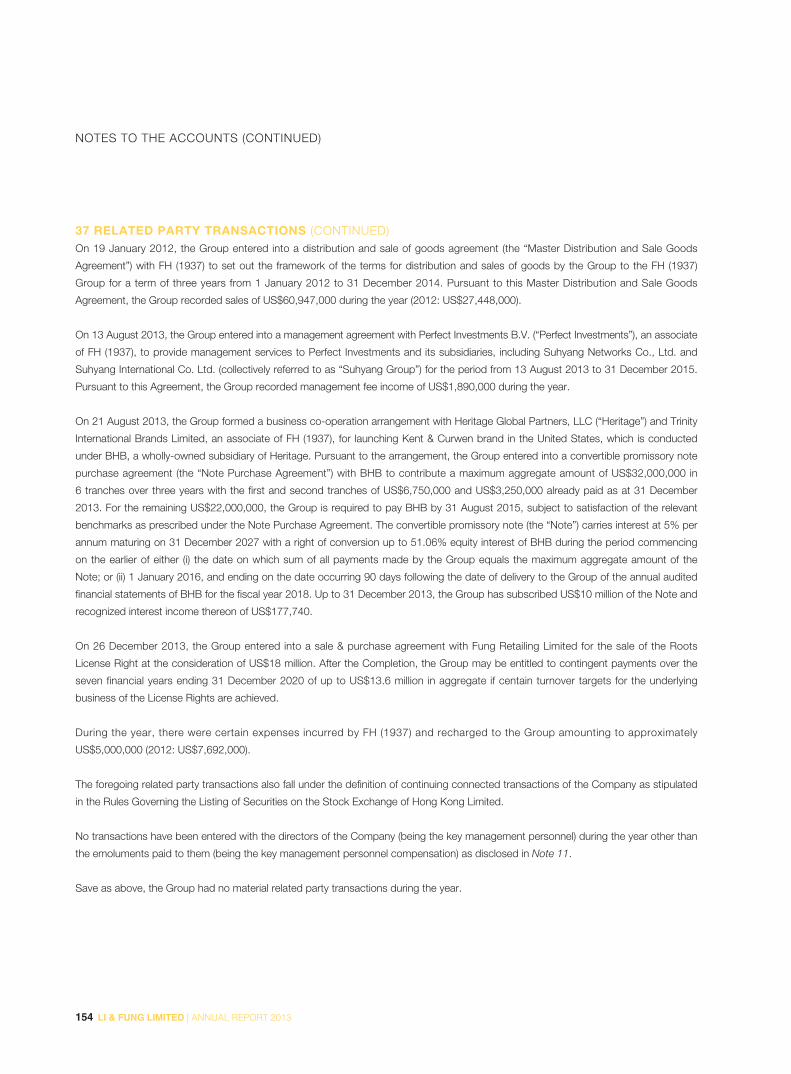
154 LI & FUNG LIMITED | ANNUAL REPORT 2013
NOTES TO THE ACCOUNTS (CONTINUED)
37 RELATED PARTY TRANSACTIONS (CONTINUED)On 19 January 2012, the Group entered into a distribution and sale of goods agreement (the “Master Distribution and Sale Goods
Agreement”) with FH (1937) to set out the framework of the terms for distribution and sales of goods by the Group to the FH (1937)
Group for a term of three years from 1 January 2012 to 31 December 2014. Pursuant to this Master Distribution and Sale Goods
Agreement, the Group recorded sales of US$60,947,000 during the year (2012: US$27,448,000).
On 13 August 2013, the Group entered into a management agreement with Perfect Investments B.V. (“Perfect Investments”), an associate
of FH (1937), to provide management services to Perfect Investments and its subsidiaries, including Suhyang Networks Co., Ltd. and
Suhyang International Co. Ltd. (collectively referred to as “Suhyang Group”) for the period from 13 August 2013 to 31 December 2015.
Pursuant to this Agreement, the Group recorded management fee income of US$1,890,000 during the year.
On 21 August 2013, the Group formed a business co-operation arrangement with Heritage Global Partners, LLC (“Heritage”) and Trinity
International Brands Limited, an associate of FH (1937), for launching Kent & Curwen brand in the United States, which is conducted
under BHB, a wholly-owned subsidiary of Heritage. Pursuant to the arrangement, the Group entered into a convertible promissory note
purchase agreement (the “Note Purchase Agreement”) with BHB to contribute a maximum aggregate amount of US$32,000,000 in
6 tranches over three years with the first and second tranches of US$6,750,000 and US$3,250,000 already paid as at 31 December
2013. For the remaining US$22,000,000, the Group is required to pay BHB by 31 August 2015, subject to satisfaction of the relevant
benchmarks as prescribed under the Note Purchase Agreement. The convertible promissory note (the “Note”) carries interest at 5% per
annum maturing on 31 December 2027 with a right of conversion up to 51.06% equity interest of BHB during the period commencing
on the earlier of either (i) the date on which sum of all payments made by the Group equals the maximum aggregate amount of the
Note; or (ii) 1 January 2016, and ending on the date occurring 90 days following the date of delivery to the Group of the annual audited
financial statements of BHB for the fiscal year 2018. Up to 31 December 2013, the Group has subscribed US$10 million of the Note and
recognized interest income thereon of US$177,740.
On 26 December 2013, the Group entered into a sale & purchase agreement with Fung Retailing Limited for the sale of the Roots
License Right at the consideration of US$18 million. After the Completion, the Group may be entitled to contingent payments over the
seven financial years ending 31 December 2020 of up to US$13.6 million in aggregate if centain turnover targets for the underlying
business of the License Rights are achieved.
During the year, there were certain expenses incurred by FH (1937) and recharged to the Group amounting to approximately
US$5,000,000 (2012: US$7,692,000).
The foregoing related party transactions also fall under the definition of continuing connected transactions of the Company as stipulated
in the Rules Governing the Listing of Securities on the Stock Exchange of Hong Kong Limited.
No transactions have been entered with the directors of the Company (being the key management personnel) during the year other than
the emoluments paid to them (being the key management personnel compensation) as disclosed in Note 11.
Save as above, the Group had no material related party transactions during the year.
155LI & FUNG LIMITED | ANNUAL REPORT 2013
NOTES TO THE ACCOUNTS (CONTINUED)
38 FINANCIAL RISK MANAGEMENTThe Group’s activities expose it to a variety of financial risks: market risk (including foreign exchange risk, fair value interest rate risk,
cash flow interest rate risk and price risk), credit risk, and liquidity risk. The Group’s overall risk management program focuses on the
unpredictability of financial markets and seeks to minimize potential adverse effects on the Group’s financial performance. The Group uses
derivative financial instruments to hedge certain risk exposures.
(a) MARKET RISK
(i) Foreign exchange risk
Most of the Group’s cash balances were deposits in HK$ and US$ with major global financial institutions, and the Group’s revenues
and payments were transacted predominantly in US$. Therefore, it considers there is no significant risk exposure in relation to foreign
exchange rate fluctuations.
There are small portion of sales and purchases transacted in different currencies, for which the Group arranges hedging by means
of foreign exchange forward contracts. Other than this, the Group strictly prohibits any financial derivative arrangement merely for
speculation.
At 31 December 2013, if the major foreign currencies, such as Euro dollar and Sterling Pound, to which the Group had exposure had
strengthened/weakened by 10% (2012: 10%) against US and HK dollar with all other variables held constant, profit for the year and
equity would have been approximately 2.1% (2012: 1.9%) and 1.9% (2012: 1.8%) higher/lower, mainly as a result of foreign exchange
gains/losses on translation of foreign currencies denominated trade receivables, available-for-sale financial assets, borrowings and
intangible assets.
(ii) Price risk
The Group is exposed to equity securities price risk because of investments held by the Group and classified on the consolidated
balance sheet as available-for-sale financial assets. The Group maintains these equity securities investments for long-term strategic
purposes and the Group’s overall exposure to price risk is not significant.
At 31 December 2013 and up to the report date of the accounts, the Group held no material financial derivative instruments except
for certain foreign exchange forward contracts entered into for hedging of foreign exchange risk exposure on sales and purchases
transacted in different currencies. At 31 December 2013, the fair value of foreign exchange forward contracts entered into by the Group
amounted to US$8,275,000 (2012: US$4,821,000), which has been reflected in full in the Group’s consolidated balance sheet as
derivative financial instruments liabilities.
(iii) Cash flow and fair value interest rate risk
As the Group has no significant interest-bearing assets except for available-for-sale debt security, the Group’s income and operating
cash flows are substantially independent of changes in market interest rates.
The Group’s interest rate risk arises mainly from US dollar denominated bank borrowings and the US dollar denominated long-term
notes issued. Bank borrowings at variable rates expose the Group to cash flow interest rate risk. The available-for-sale debt security issued
at a fixed interest rate exposes the Group to fair value interest rate risk. The Group’s policy is to maintain a diversified mix of variable and
fixed rate borrowings based on prevailing market conditions.

156 LI & FUNG LIMITED | ANNUAL REPORT 2013
NOTES TO THE ACCOUNTS (CONTINUED)
38 FINANCIAL RISK MANAGEMENT (CONTINUED)
(a) MARKET RISK (CONTINUED)
(iii) Cash flow and fair value interest rate risk (continued)
At 31 December 2013, if the variable interest rates on the bank borrowings had been 0.1% higher/lower with all other variables held
constant, profit for the year and equity would have been approximately US$1,190,000 (2012: US$1,535,000) lower/higher, mainly as a
result of higher/lower interest expenses on floating rate borrowings. If the prevailing market interest rate on the available-for-sale debt
security had been 0.1% higher/lower with all other variables held constant, the Group’s profit would have increased or decreased by
approximately US$92,000 (2012: US$183,000).
(b) CREDIT RISK
Credit risk mainly arises from trade and other receivables as well as cash and bank balances of the Group.
Most of the Group’s cash and bank balances are held in major global financial institutions.
The Group has stringent policies in place to manage its credit risk with trade and other receivables, which include but are not limited to
the measures set out below:
(i) The Group selects customers in a cautious manner. Its credit control team has implemented a risk assessment system to evaluate
its customers’ financial strengths prior to agreeing at the trade terms with individual customers. It is not uncommon that the Group
requires securities (such as standby or commercial letter of credit, or bank guarantee) from a small number of its customers that fall
short of the required minimum score under its Risk Assessment System;
(ii) A significant portion of trade receivable balances are covered by trade credit insurance or factored to external financial institutions on
a non–recourse basis;
(iii) It has in place a close monitoring system with a dedicated team to ensure on-time recoveries from its trade debtors;
(iv) Internally it has set up rigid policies on provision made for both inventories and receivables to motivate its business managers to step
up efforts in these two areas so as to avoid any significant impact on their financial performance.
The Group’s five largest customers, in aggregate, account for less than 30% of the Group’s business. Transactions with these
customers are entered into within the credit limits designated by the Group.
Except for trade receivables of US$41,765,000 (2012: US$36,974,000) and other receivables of US$12,658,000 (2012:
US$18,774,000), which were considered impaired and fully provided, none of the other financial assets including available-for-sale debt
security (Note 18), due from related companies (Note 20) and other receivables and deposits (Note 22) are considered impaired as there
is no recent history of default of the counterparties. The maximum exposure of these other financial assets to credit risk at the reporting
date is their carrying amounts.

157LI & FUNG LIMITED | ANNUAL REPORT 2013
NOTES TO THE ACCOUNTS (CONTINUED)
38 FINANCIAL RISK MANAGEMENT (CONTINUED)
(c) LIQUIDITY RISK
Prudent liquidity risk management implies maintaining sufficient cash on hand and the availability of funding through an adequate
amount of committed credit facilities from the Group’s bankers.
Management monitors rolling forecasts of the Group’s liquidity reserves (comprises undrawn borrowing facilities and cash and cash
equivalents (Note 23)) on the basis of expected cash flow.
The table below analyzes the liquidity impact of the Group’s long-term liabilities (including annual coupons payable for the long-term
notes) into relevant maturity groupings based on the remaining period at the balance sheet to the contractual maturity date. The
amounts disclosed in the table are the contractual undiscounted cash flows. These amounts will not reconcile to the amounts disclosed
on the balance sheet and in Note 29 for long-term liabilities.
Less than
1 yearBetween 1
and 2 yearsBetween 2
and 5 yearsOver
5 yearsUS$’000 US$’000 US$’000 US$’000
The Group
At 31 December 2013
Long-term bank loans – 99,640 17,000 –
Purchase consideration payable for acquisitions 411,976 249,875 753,235 23,880
Long-term notes – unsecured 66,875 66,875 659,375 809,063
Brand license payable 41,746 23,242 107,283 163,954
Trade and bills payable 2,552,495 – – –
Accrued charges and sundry payables 837,790 – – –
Financial guarantee contract 750 – – –
Due to related companies 14,682 – – –
Bank advances for discounted bills 38,190 – – –
Short-term bank loans 94,145 – – –
At 31 December 2012
Long-term bank loans – – 100,000 –
Purchase consideration payable for acquisitions 330,410 439,680 878,622 37,935
Long-term notes – unsecured 66,875 66,875 686,875 848,438
Brand license payable 26,010 74,270 85,261 18,038
Trade and bills payable 2,458,128 – – –
Accrued charges and sundry payables 827,460 – – –
Financial guarantee contract 750 – – –
Due to related companies 8,484 – – –
Bank advances for discounted bills 35,666 – – –
Short-term bank loans 117,519 – – –
All of the Group’s gross settled derivative financial instruments are in hedge relationships and are due to settle within 12 months of the
balance sheet date. These contracts require undiscounted contractual cash inflows of US$259,531,000 (2012: US$186,559,000) and
undiscounted contractual cash outflows of US$267,167,000 (2012: US$191,076,000).

158 LI & FUNG LIMITED | ANNUAL REPORT 2013
NOTES TO THE ACCOUNTS (CONTINUED)
38 FINANCIAL RISK MANAGEMENT (CONTINUED)
(c) LIQUIDITY RISK (CONTINUED)
Less than
1 yearBetween 1
and 2 yearsBetween 2
and 5 yearsOver
5 yearsUS$’000 US$’000 US$’000 US$’000
The Company
At 31 December 2013
Long-term notes – unsecured 66,875 66,875 659,375 809,063
Financial guarantee contract 4,651,823 – – –
Accrued charges and sundry payables 9,715 – – –
At 31 December 2012
Long-term notes – unsecured 66,875 66,875 686,875 848,438
Financial guarantee contract 4,356,913 – – –
Accrued charges and sundry payables 10,406 – – –
39 CAPITAL RISK MANAGEMENTThe Group’s objectives when managing capital are to safeguard the Group’s ability to continue as a going concern in order to provide
returns for shareholders and benefits for other stakeholders and to maintain an optimal capital structure to reduce the cost of capital.
In order to maintain or adjust the capital structure, the Group may adjust the amount of dividends paid to shareholders, return capital to
shareholders, issue new shares or sell assets to reduce debt.
Consistent with others in the industry, the Group monitors capital on the basis of the gearing ratio. This ratio is calculated as net debt
divided by total capital. Net debt is calculated as total borrowings (including short-term bank loans (Note 25), long-term bank loans (Note
25) and long-term notes (Note 29) less cash and cash equivalents (Note 23)). Total capital is calculated as total equity, as shown in the
consolidated balance sheet, plus net debt.
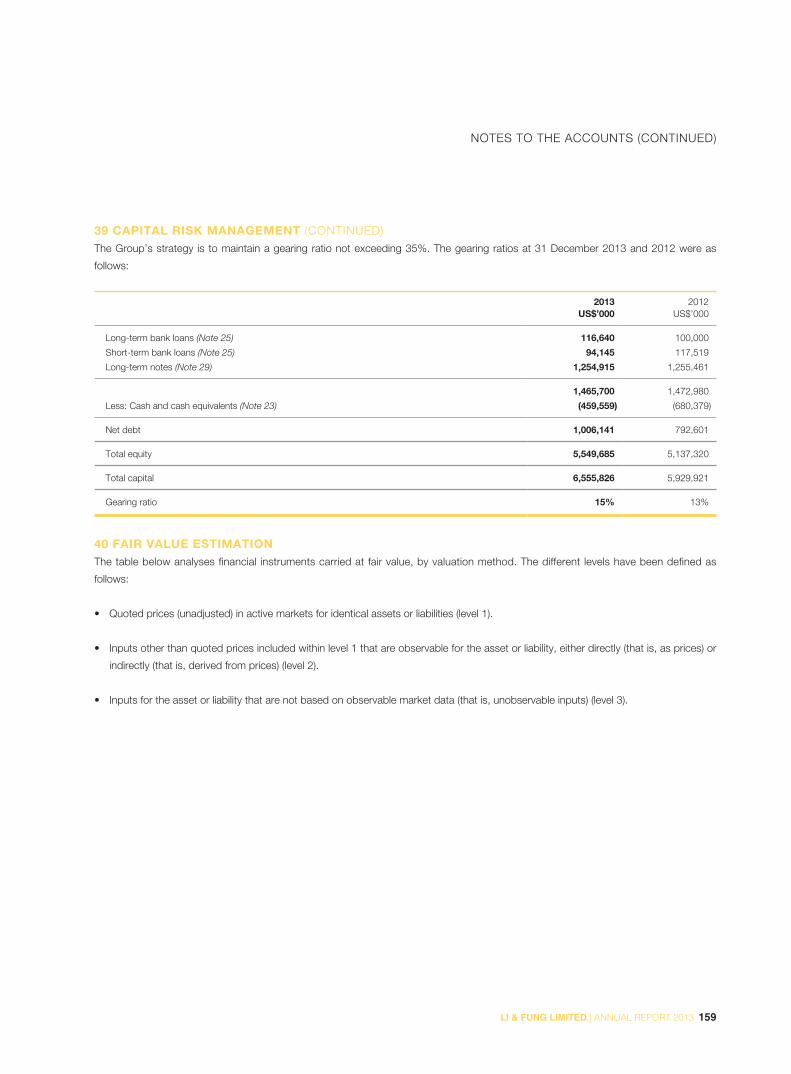
159LI & FUNG LIMITED | ANNUAL REPORT 2013
NOTES TO THE ACCOUNTS (CONTINUED)
39 CAPITAL RISK MANAGEMENT (CONTINUED)The Group’s strategy is to maintain a gearing ratio not exceeding 35%. The gearing ratios at 31 December 2013 and 2012 were as
follows:
2013 2012US$’000 US$’000
Long-term bank loans (Note 25) 116,640 100,000
Short-term bank loans (Note 25) 94,145 117,519
Long-term notes (Note 29) 1,254,915 1,255,461
1,465,700 1,472,980
Less: Cash and cash equivalents (Note 23) (459,559) (680,379)
Net debt 1,006,141 792,601
Total equity 5,549,685 5,137,320
Total capital 6,555,826 5,929,921
Gearing ratio 15% 13%
40 FAIR VALUE ESTIMATIONThe table below analyses financial instruments carried at fair value, by valuation method. The different levels have been defined as
follows:
• Quoted prices (unadjusted) in active markets for identical assets or liabilities (level 1).
• Inputs other than quoted prices included within level 1 that are observable for the asset or liability, either directly (that is, as prices) or
indirectly (that is, derived from prices) (level 2).
• Inputs for the asset or liability that are not based on observable market data (that is, unobservable inputs) (level 3).
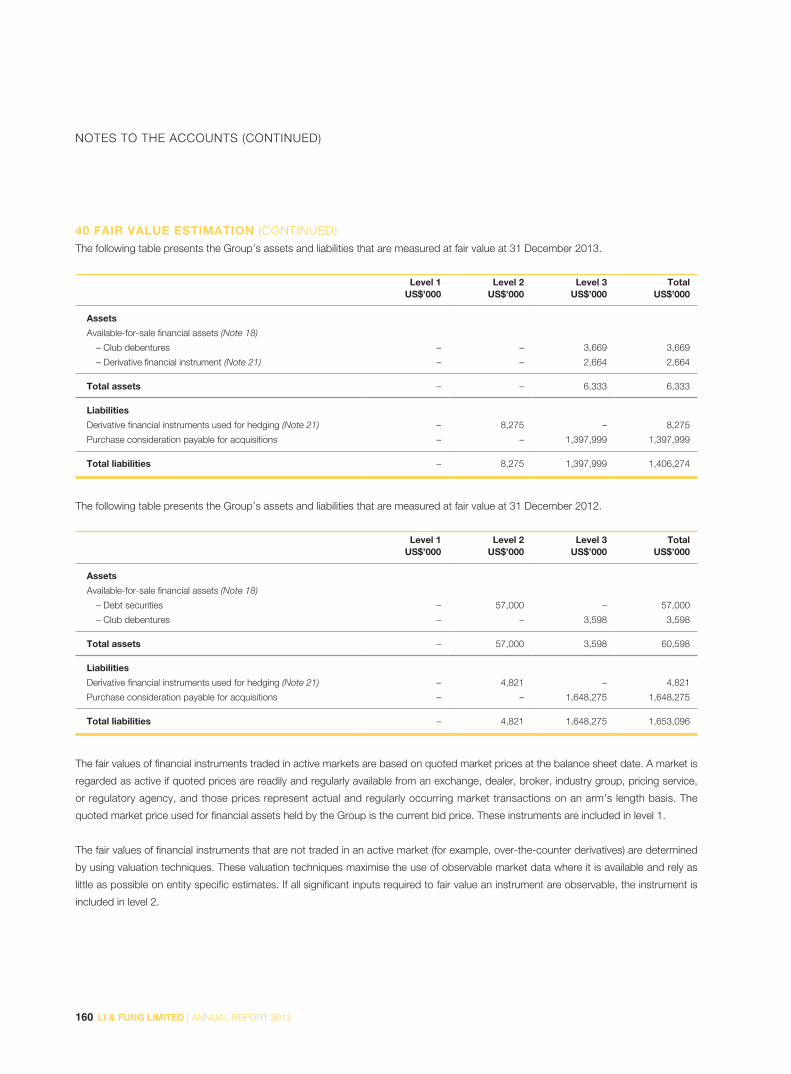
160 LI & FUNG LIMITED | ANNUAL REPORT 2013
NOTES TO THE ACCOUNTS (CONTINUED)
40 FAIR VALUE ESTIMATION (CONTINUED)The following table presents the Group’s assets and liabilities that are measured at fair value at 31 December 2013.
Level 1 Level 2 Level 3 Total
US$’000 US$’000 US$’000 US$’000
Assets
Available-for-sale financial assets (Note 18)
– Club debentures – – 3,669 3,669
– Derivative financial instrument (Note 21) – – 2,664 2,664
Total assets – – 6,333 6,333
Liabilities
Derivative financial instruments used for hedging (Note 21) – 8,275 – 8,275
Purchase consideration payable for acquisitions – – 1,397,999 1,397,999
Total liabilities – 8,275 1,397,999 1,406,274
The following table presents the Group’s assets and liabilities that are measured at fair value at 31 December 2012.
Level 1 Level 2 Level 3 Total
US$’000 US$’000 US$’000 US$’000
Assets
Available-for-sale financial assets (Note 18)
– Debt securities – 57,000 – 57,000
– Club debentures – – 3,598 3,598
Total assets – 57,000 3,598 60,598
Liabilities
Derivative financial instruments used for hedging (Note 21) – 4,821 – 4,821
Purchase consideration payable for acquisitions – – 1,648,275 1,648,275
Total liabilities – 4,821 1,648,275 1,653,096
The fair values of financial instruments traded in active markets are based on quoted market prices at the balance sheet date. A market is
regarded as active if quoted prices are readily and regularly available from an exchange, dealer, broker, industry group, pricing service,
or regulatory agency, and those prices represent actual and regularly occurring market transactions on an arm’s length basis. The
quoted market price used for financial assets held by the Group is the current bid price. These instruments are included in level 1.
The fair values of financial instruments that are not traded in an active market (for example, over-the-counter derivatives) are determined
by using valuation techniques. These valuation techniques maximise the use of observable market data where it is available and rely as
little as possible on entity specific estimates. If all significant inputs required to fair value an instrument are observable, the instrument is
included in level 2.
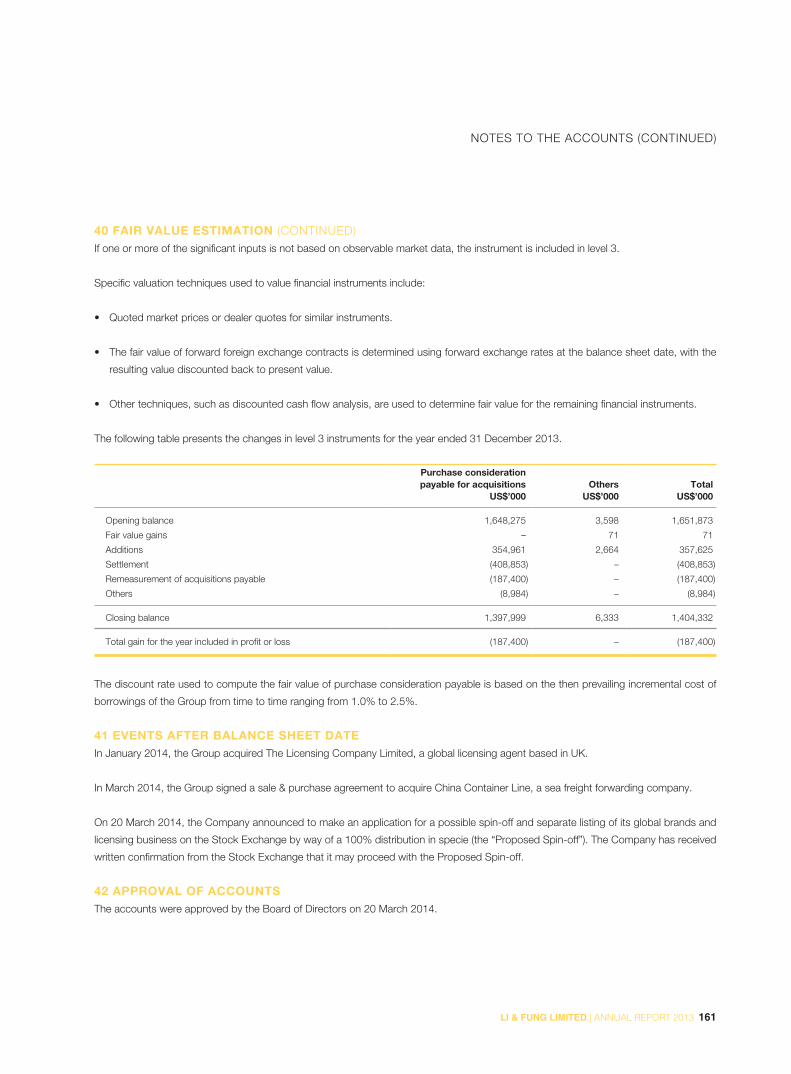
161LI & FUNG LIMITED | ANNUAL REPORT 2013
NOTES TO THE ACCOUNTS (CONTINUED)
40 FAIR VALUE ESTIMATION (CONTINUED)If one or more of the significant inputs is not based on observable market data, the instrument is included in level 3.
Specific valuation techniques used to value financial instruments include:
• Quoted market prices or dealer quotes for similar instruments.
• The fair value of forward foreign exchange contracts is determined using forward exchange rates at the balance sheet date, with the
resulting value discounted back to present value.
• Other techniques, such as discounted cash flow analysis, are used to determine fair value for the remaining financial instruments.
The following table presents the changes in level 3 instruments for the year ended 31 December 2013.
Purchase consideration
payable for acquisitions Others TotalUS$’000 US$’000 US$’000
Opening balance 1,648,275 3,598 1,651,873
Fair value gains – 71 71
Additions 354,961 2,664 357,625
Settlement (408,853) – (408,853)
Remeasurement of acquisitions payable (187,400) – (187,400)
Others (8,984) – (8,984)
Closing balance 1,397,999 6,333 1,404,332
Total gain for the year included in profit or loss (187,400) – (187,400)
The discount rate used to compute the fair value of purchase consideration payable is based on the then prevailing incremental cost of
borrowings of the Group from time to time ranging from 1.0% to 2.5%.
41 EVENTS AFTER BALANCE SHEET DATEIn January 2014, the Group acquired The Licensing Company Limited, a global licensing agent based in UK.
In March 2014, the Group signed a sale & purchase agreement to acquire China Container Line, a sea freight forwarding company.
On 20 March 2014, the Company announced to make an application for a possible spin-off and separate listing of its global brands and
licensing business on the Stock Exchange by way of a 100% distribution in specie (the “Proposed Spin-off”). The Company has received
written confirmation from the Stock Exchange that it may proceed with the Proposed Spin-off.
42 APPROVAL OF ACCOUNTSThe accounts were approved by the Board of Directors on 20 March 2014.

162 LI & FUNG LIMITED | ANNUAL REPORT 2013
NOTES TO THE ACCOUNTS (CONTINUED)
43 PRINCIPAL SUBSIDIARIES, ASSOCIATED COMPANIES AND JOINT VENTURE
Place ofIncorporationand operation
Issued and fully paidshare capital
Percentage ofequity held bythe Company Principal activities
Note Principal subsidiaries
Held directly
(2) Global Brands Group Limited Bermuda Ordinary US$100 100 Investment holding
(2) Integrated Distribution Services Group
Limited
Bermuda Ordinary US$12,000 100 Investment holding
(2) LF Centennial Limited British Virgin Islands Ordinary US$50,000 100 Investment holding
(2) LF Credit Limited Bermuda Ordinary US$12,000 100 Investment holding
(1) Li & Fung (B.V.I.) Limited British Virgin Islands Ordinary US$400,010 100 Marketing services and
investment holding
Held indirectly
888 UK Limited England Ordinary GBP100 100 Service company
Added Extras LLC U.S.A. Capital contribution US$1 100 Wholesaling
AGI Logistics (S) Pte Ltd Singapore Ordinary S$500,000 100 Freight forwarders and other
logistics services
(2) AGI Logistics Foreign Holdings LLC U.S.A. Capital contribution US$1 100 Investment holding
Algreta Solutions Limited England Ordinary GBP10,527 100 Sale and distribution of security
products
Alster International Trading Company
Pte. Ltd.
Singapore Ordinary S$5,000,000 100 Provision of inspection services
and export trading
American Marketing Enterprises Inc. U.S.A. Common stock US$1,000 100 Wholesaling
(2) Appleton Holdings Ltd. British Virgin Islands Ordinary US$1 100 Investment holding
Aquatalia Worldwide Limited Republic of Ireland Ordinary EUR1 100 Wholesaling
Avanguardia S.r.l. Italy Registered capital EUR26,000 100 Research, design and logistical
advice
B.G.S. Limited Thailand Ordinary Baht 288,000
Preference Baht 712,000
100 Marketing and distribution of
healthcare products
Beijing Huaxin New Concept Trading
Co., Ltd.
The People’s Republic of
China
Registered capital RMB100,000 100 Retailing
Black Cat Fireworks Limited England Ordinary GBP15,500,000 100 Wholesaling
Bond Medical Company Limited Macau MOP$100,000 100 Distribution of medical &
pharmaceutical products and
medical equipment
Bossini Fashion GmbH Germany EUR468,000 100 Importer
Bravado Star Manufacturing, LLC U.S.A. Capital contribution US$1 75 Wholesaling
Briefly Stated Holdings, Inc. U.S.A. Common stock US$1,000 100 Investment holding
Briefly Stated, Inc. U.S.A. Common stock US$3,000 100 Wholesaling
BS Direct Limited Hong Kong Ordinary HK$2 100 Export trading
C Group US LLC U.S.A. Capital contribution US$1,000 100 Marketing services
Camberley Enterprises Limited Hong Kong Ordinary HK$250,000 100 Manufacturing and trading
Camberley Trading Service (Shenzhen)
Limited
The People’s Republic of
China
RMB1,500,000 100
foreign-owned
enterprise
Export trading services
Catalyst Direct Sarl France Ordinary EUR10,000 100 Wholesaling
Catalyst Tags Inc. U.S.A. Common stock US$10,000 100 Distribution
(2) Centennial (Luxembourg) S.a.r.l. Luxembourg EUR8,931,250 100 Investment holding
CGroup HK Limited Hong Kong Ordinary HK$2,970,000
Class B Non-voting HK$330,000
100 Export trading
Character Direct Limited Hong Kong Ordinary HK$2 100 Design and marketing
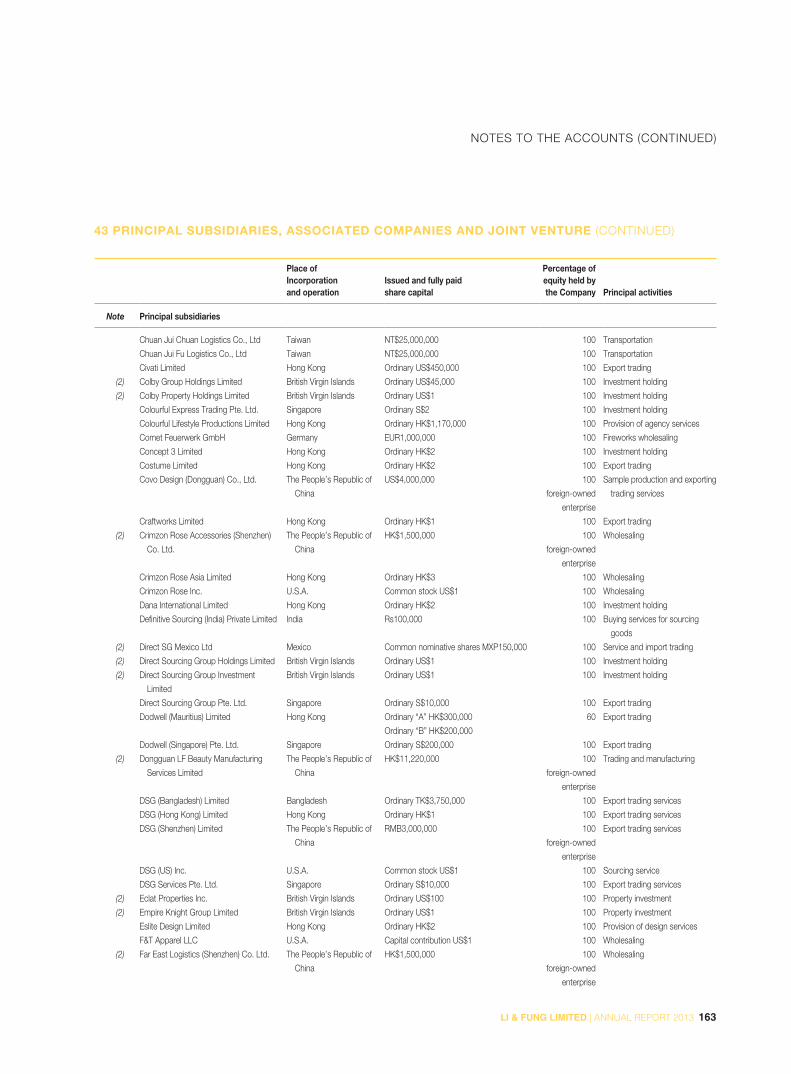
163LI & FUNG LIMITED | ANNUAL REPORT 2013
NOTES TO THE ACCOUNTS (CONTINUED)
Place ofIncorporationand operation
Issued and fully paidshare capital
Percentage ofequity held bythe Company Principal activities
Note Principal subsidiaries
Chuan Jui Chuan Logistics Co., Ltd Taiwan NT$25,000,000 100 Transportation
Chuan Jui Fu Logistics Co., Ltd Taiwan NT$25,000,000 100 Transportation
Civati Limited Hong Kong Ordinary US$450,000 100 Export trading
(2) Colby Group Holdings Limited British Virgin Islands Ordinary US$45,000 100 Investment holding
(2) Colby Property Holdings Limited British Virgin Islands Ordinary US$1 100 Investment holding
Colourful Express Trading Pte. Ltd. Singapore Ordinary S$2 100 Investment holding
Colourful Lifestyle Productions Limited Hong Kong Ordinary HK$1,170,000 100 Provision of agency services
Comet Feuerwerk GmbH Germany EUR1,000,000 100 Fireworks wholesaling
Concept 3 Limited Hong Kong Ordinary HK$2 100 Investment holding
Costume Limited Hong Kong Ordinary HK$2 100 Export trading
Covo Design (Dongguan) Co., Ltd. The People’s Republic of
China
US$4,000,000 100
foreign-owned
enterprise
Sample production and exporting
trading services
Craftworks Limited Hong Kong Ordinary HK$1 100 Export trading
(2) Crimzon Rose Accessories (Shenzhen)
Co. Ltd.
The People’s Republic of
China
HK$1,500,000 100
foreign-owned
enterprise
Wholesaling
Crimzon Rose Asia Limited Hong Kong Ordinary HK$3 100 Wholesaling
Crimzon Rose Inc. U.S.A. Common stock US$1 100 Wholesaling
Dana International Limited Hong Kong Ordinary HK$2 100 Investment holding
Definitive Sourcing (India) Private Limited India Rs100,000 100 Buying services for sourcing
goods
(2) Direct SG Mexico Ltd Mexico Common nominative shares MXP150,000 100 Service and import trading
(2) Direct Sourcing Group Holdings Limited British Virgin Islands Ordinary US$1 100 Investment holding
(2) Direct Sourcing Group Investment
Limited
British Virgin Islands Ordinary US$1 100 Investment holding
Direct Sourcing Group Pte. Ltd. Singapore Ordinary S$10,000 100 Export trading
Dodwell (Mauritius) Limited Hong Kong Ordinary “A” HK$300,000
Ordinary “B” HK$200,000
60 Export trading
Dodwell (Singapore) Pte. Ltd. Singapore Ordinary S$200,000 100 Export trading
(2) Dongguan LF Beauty Manufacturing
Services Limited
The People’s Republic of
China
HK$11,220,000 100
foreign-owned
enterprise
Trading and manufacturing
DSG (Bangladesh) Limited Bangladesh Ordinary TK$3,750,000 100 Export trading services
DSG (Hong Kong) Limited Hong Kong Ordinary HK$1 100 Export trading services
DSG (Shenzhen) Limited The People’s Republic of
China
RMB3,000,000 100
foreign-owned
enterprise
Export trading services
DSG (US) Inc. U.S.A. Common stock US$1 100 Sourcing service
DSG Services Pte. Ltd. Singapore Ordinary S$10,000 100 Export trading services
(2) Eclat Properties Inc. British Virgin Islands Ordinary US$100 100 Property investment
(2) Empire Knight Group Limited British Virgin Islands Ordinary US$1 100 Property investment
Eslite Design Limited Hong Kong Ordinary HK$2 100 Provision of design services
F&T Apparel LLC U.S.A. Capital contribution US$1 100 Wholesaling
(2) Far East Logistics (Shenzhen) Co. Ltd. The People’s Republic of
China
HK$1,500,000 100
foreign-owned
enterprise
Wholesaling
43 PRINCIPAL SUBSIDIARIES, ASSOCIATED COMPANIES AND JOINT VENTURE (CONTINUED)
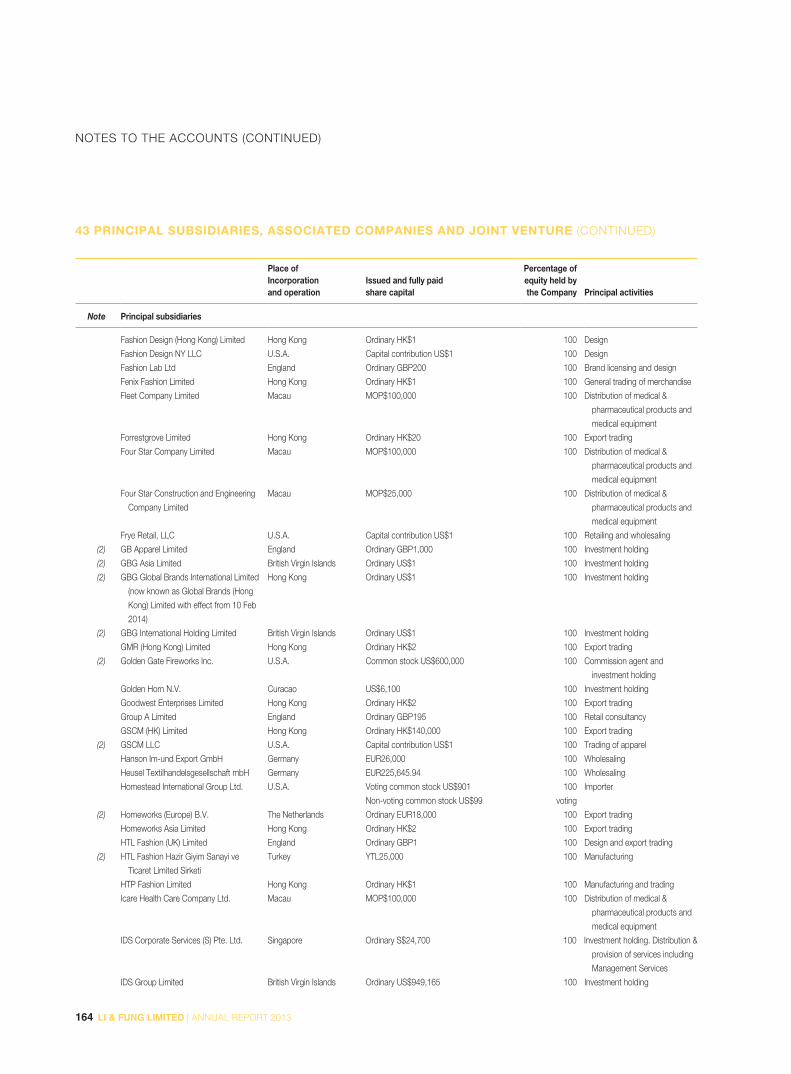
164 LI & FUNG LIMITED | ANNUAL REPORT 2013
NOTES TO THE ACCOUNTS (CONTINUED)
Place ofIncorporationand operation
Issued and fully paidshare capital
Percentage ofequity held bythe Company Principal activities
Note Principal subsidiaries
Fashion Design (Hong Kong) Limited Hong Kong Ordinary HK$1 100 Design
Fashion Design NY LLC U.S.A. Capital contribution US$1 100 Design
Fashion Lab Ltd England Ordinary GBP200 100 Brand licensing and design
Fenix Fashion Limited Hong Kong Ordinary HK$1 100 General trading of merchandise
Fleet Company Limited Macau MOP$100,000 100 Distribution of medical &
pharmaceutical products and
medical equipment
Forrestgrove Limited Hong Kong Ordinary HK$20 100 Export trading
Four Star Company Limited Macau MOP$100,000 100 Distribution of medical &
pharmaceutical products and
medical equipment
Four Star Construction and Engineering
Company Limited
Macau MOP$25,000 100 Distribution of medical &
pharmaceutical products and
medical equipment
Frye Retail, LLC U.S.A. Capital contribution US$1 100 Retailing and wholesaling
(2) GB Apparel Limited England Ordinary GBP1,000 100 Investment holding
(2) GBG Asia Limited British Virgin Islands Ordinary US$1 100 Investment holding
(2) GBG Global Brands International Limited
(now known as Global Brands (Hong
Kong) Limited with effect from 10 Feb
2014)
Hong Kong Ordinary US$1 100 Investment holding
(2) GBG International Holding Limited British Virgin Islands Ordinary US$1 100 Investment holding
GMR (Hong Kong) Limited Hong Kong Ordinary HK$2 100 Export trading
(2) Golden Gate Fireworks Inc. U.S.A. Common stock US$600,000 100 Commission agent and
investment holding
Golden Horn N.V. Curacao US$6,100 100 Investment holding
Goodwest Enterprises Limited Hong Kong Ordinary HK$2 100 Export trading
Group A Limited England Ordinary GBP195 100 Retail consultancy
GSCM (HK) Limited Hong Kong Ordinary HK$140,000 100 Export trading
(2) GSCM LLC U.S.A. Capital contribution US$1 100 Trading of apparel
Hanson Im-und Export GmbH Germany EUR26,000 100 Wholesaling
Heusel Textilhandelsgesellschaft mbH Germany EUR225,645.94 100 Wholesaling
Homestead International Group Ltd. U.S.A. Voting common stock US$901
Non-voting common stock US$99
100
voting
Importer
(2) Homeworks (Europe) B.V. The Netherlands Ordinary EUR18,000 100 Export trading
Homeworks Asia Limited Hong Kong Ordinary HK$2 100 Export trading
HTL Fashion (UK) Limited England Ordinary GBP1 100 Design and export trading
(2) HTL Fashion Hazir Giyim Sanayi ve
Ticaret Limited Sirketi
Turkey YTL25,000 100 Manufacturing
HTP Fashion Limited Hong Kong Ordinary HK$1 100 Manufacturing and trading
Icare Health Care Company Ltd. Macau MOP$100,000 100 Distribution of medical &
pharmaceutical products and
medical equipment
IDS Corporate Services (S) Pte. Ltd. Singapore Ordinary S$24,700 100 Investment holding. Distribution &
provision of services including
Management Services
IDS Group Limited British Virgin Islands Ordinary US$949,165 100 Investment holding
43 PRINCIPAL SUBSIDIARIES, ASSOCIATED COMPANIES AND JOINT VENTURE (CONTINUED)
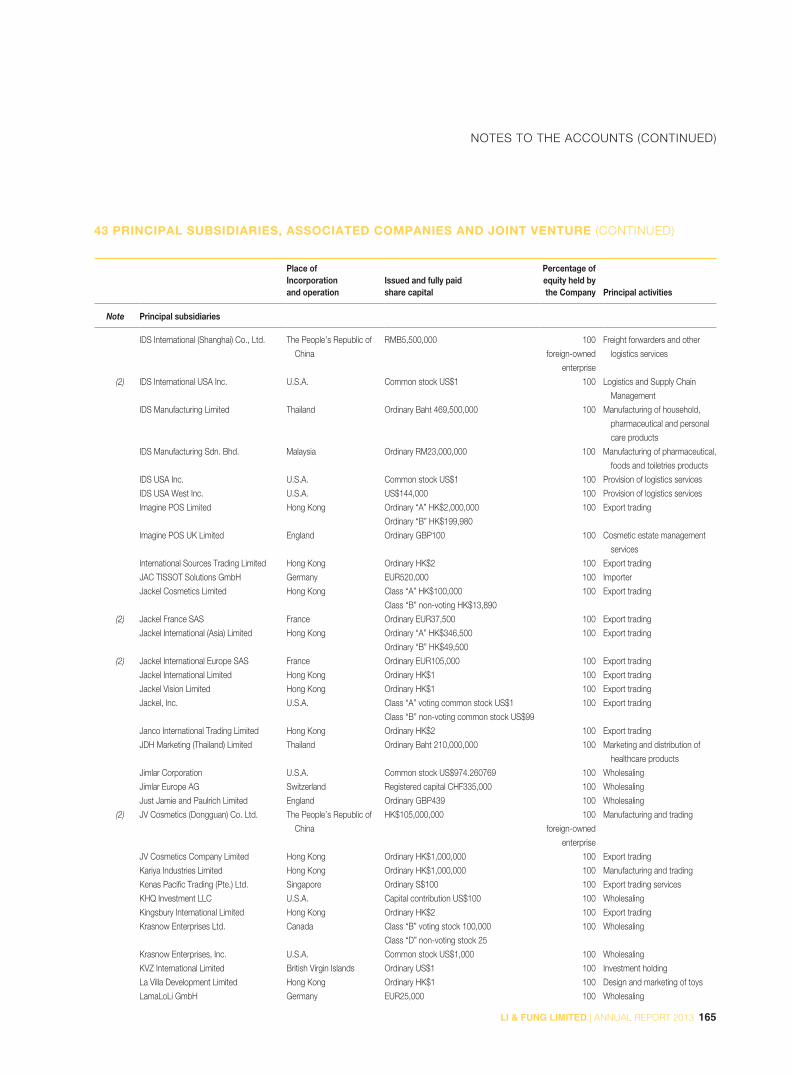
165LI & FUNG LIMITED | ANNUAL REPORT 2013
NOTES TO THE ACCOUNTS (CONTINUED)
Place ofIncorporationand operation
Issued and fully paidshare capital
Percentage ofequity held bythe Company Principal activities
Note Principal subsidiaries
IDS International (Shanghai) Co., Ltd. The People’s Republic of
China
RMB5,500,000 100
foreign-owned
enterprise
Freight forwarders and other
logistics services
(2) IDS International USA Inc. U.S.A. Common stock US$1 100 Logistics and Supply Chain
Management
IDS Manufacturing Limited Thailand Ordinary Baht 469,500,000 100 Manufacturing of household,
pharmaceutical and personal
care products
IDS Manufacturing Sdn. Bhd. Malaysia Ordinary RM23,000,000 100 Manufacturing of pharmaceutical,
foods and toiletries products
IDS USA Inc. U.S.A. Common stock US$1 100 Provision of logistics services
IDS USA West Inc. U.S.A. US$144,000 100 Provision of logistics services
Imagine POS Limited Hong Kong Ordinary “A” HK$2,000,000
Ordinary “B” HK$199,980
100 Export trading
Imagine POS UK Limited England Ordinary GBP100 100 Cosmetic estate management
services
International Sources Trading Limited Hong Kong Ordinary HK$2 100 Export trading
JAC TISSOT Solutions GmbH Germany EUR520,000 100 Importer
Jackel Cosmetics Limited Hong Kong Class “A” HK$100,000
Class “B” non-voting HK$13,890
100 Export trading
(2) Jackel France SAS France Ordinary EUR37,500 100 Export trading
Jackel International (Asia) Limited Hong Kong Ordinary “A” HK$346,500
Ordinary “B” HK$49,500
100 Export trading
(2) Jackel International Europe SAS France Ordinary EUR105,000 100 Export trading
Jackel International Limited Hong Kong Ordinary HK$1 100 Export trading
Jackel Vision Limited Hong Kong Ordinary HK$1 100 Export trading
Jackel, Inc. U.S.A. Class “A” voting common stock US$1
Class “B” non-voting common stock US$99
100 Export trading
Janco International Trading Limited Hong Kong Ordinary HK$2 100 Export trading
JDH Marketing (Thailand) Limited Thailand Ordinary Baht 210,000,000 100 Marketing and distribution of
healthcare products
Jimlar Corporation U.S.A. Common stock US$974.260769 100 Wholesaling
Jimlar Europe AG Switzerland Registered capital CHF335,000 100 Wholesaling
Just Jamie and Paulrich Limited England Ordinary GBP439 100 Wholesaling
(2) JV Cosmetics (Dongguan) Co. Ltd. The People’s Republic of
China
HK$105,000,000 100
foreign-owned
enterprise
Manufacturing and trading
JV Cosmetics Company Limited Hong Kong Ordinary HK$1,000,000 100 Export trading
Kariya Industries Limited Hong Kong Ordinary HK$1,000,000 100 Manufacturing and trading
Kenas Pacific Trading (Pte.) Ltd. Singapore Ordinary S$100 100 Export trading services
KHQ Investment LLC U.S.A. Capital contribution US$100 100 Wholesaling
Kingsbury International Limited Hong Kong Ordinary HK$2 100 Export trading
Krasnow Enterprises Ltd. Canada Class “B” voting stock 100,000
Class “D” non-voting stock 25
100 Wholesaling
Krasnow Enterprises, Inc. U.S.A. Common stock US$1,000 100 Wholesaling
KVZ International Limited British Virgin Islands Ordinary US$1 100 Investment holding
La Villa Development Limited Hong Kong Ordinary HK$1 100 Design and marketing of toys
LamaLoLi GmbH Germany EUR25,000 100 Wholesaling
43 PRINCIPAL SUBSIDIARIES, ASSOCIATED COMPANIES AND JOINT VENTURE (CONTINUED)
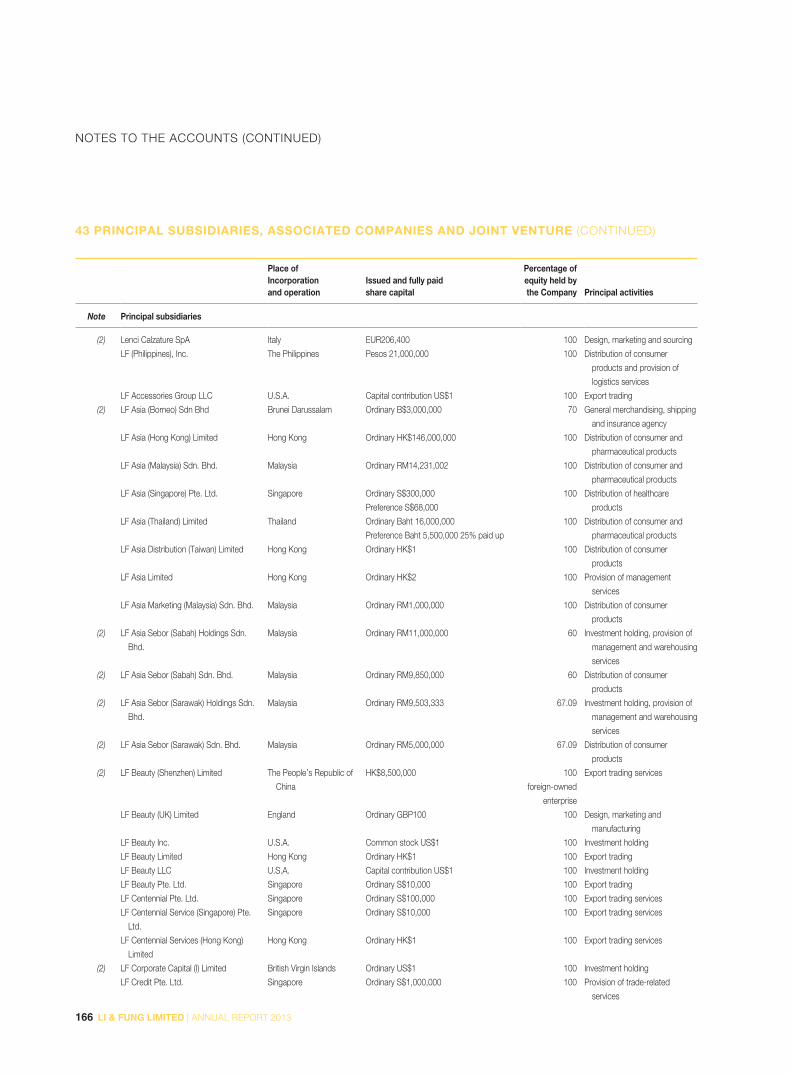
166 LI & FUNG LIMITED | ANNUAL REPORT 2013
NOTES TO THE ACCOUNTS (CONTINUED)
Place ofIncorporationand operation
Issued and fully paidshare capital
Percentage ofequity held bythe Company Principal activities
Note Principal subsidiaries
(2) Lenci Calzature SpA Italy EUR206,400 100 Design, marketing and sourcing
LF (Philippines), Inc. The Philippines Pesos 21,000,000 100 Distribution of consumer
products and provision of
logistics services
LF Accessories Group LLC U.S.A. Capital contribution US$1 100 Export trading
(2) LF Asia (Borneo) Sdn Bhd Brunei Darussalam Ordinary B$3,000,000 70 General merchandising, shipping
and insurance agency
LF Asia (Hong Kong) Limited Hong Kong Ordinary HK$146,000,000 100 Distribution of consumer and
pharmaceutical products
LF Asia (Malaysia) Sdn. Bhd. Malaysia Ordinary RM14,231,002 100 Distribution of consumer and
pharmaceutical products
LF Asia (Singapore) Pte. Ltd. Singapore Ordinary S$300,000
Preference S$68,000
100 Distribution of healthcare
products
LF Asia (Thailand) Limited Thailand Ordinary Baht 16,000,000
Preference Baht 5,500,000 25% paid up
100 Distribution of consumer and
pharmaceutical products
LF Asia Distribution (Taiwan) Limited Hong Kong Ordinary HK$1 100 Distribution of consumer
products
LF Asia Limited Hong Kong Ordinary HK$2 100 Provision of management
services
LF Asia Marketing (Malaysia) Sdn. Bhd. Malaysia Ordinary RM1,000,000 100 Distribution of consumer
products
(2) LF Asia Sebor (Sabah) Holdings Sdn.
Bhd.
Malaysia Ordinary RM11,000,000 60 Investment holding, provision of
management and warehousing
services
(2) LF Asia Sebor (Sabah) Sdn. Bhd. Malaysia Ordinary RM9,850,000 60 Distribution of consumer
products
(2) LF Asia Sebor (Sarawak) Holdings Sdn.
Bhd.
Malaysia Ordinary RM9,503,333 67.09 Investment holding, provision of
management and warehousing
services
(2) LF Asia Sebor (Sarawak) Sdn. Bhd. Malaysia Ordinary RM5,000,000 67.09 Distribution of consumer
products
(2) LF Beauty (Shenzhen) Limited The People’s Republic of
China
HK$8,500,000 100
foreign-owned
enterprise
Export trading services
LF Beauty (UK) Limited England Ordinary GBP100 100 Design, marketing and
manufacturing
LF Beauty Inc. U.S.A. Common stock US$1 100 Investment holding
LF Beauty Limited Hong Kong Ordinary HK$1 100 Export trading
LF Beauty LLC U.S.A. Capital contribution US$1 100 Investment holding
LF Beauty Pte. Ltd. Singapore Ordinary S$10,000 100 Export trading
LF Centennial Pte. Ltd. Singapore Ordinary S$100,000 100 Export trading services
LF Centennial Service (Singapore) Pte.
Ltd.
Singapore Ordinary S$10,000 100 Export trading services
LF Centennial Services (Hong Kong)
Limited
Hong Kong Ordinary HK$1 100 Export trading services
(2) LF Corporate Capital (I) Limited British Virgin Islands Ordinary US$1 100 Investment holding
LF Credit Pte. Ltd. Singapore Ordinary S$1,000,000 100 Provision of trade-related
services
43 PRINCIPAL SUBSIDIARIES, ASSOCIATED COMPANIES AND JOINT VENTURE (CONTINUED)

167LI & FUNG LIMITED | ANNUAL REPORT 2013
NOTES TO THE ACCOUNTS (CONTINUED)
Place ofIncorporationand operation
Issued and fully paidshare capital
Percentage ofequity held bythe Company Principal activities
Note Principal subsidiaries
LF Europe (Germany) GmbH Germany EUR25,000 100 Investment holding
LF Europe (Germany) Services GmbH Germany EUR25,000 100 Provision of accounting services
LF Europe Limited England Ordinary GBP26,788,000 100 Investment holding
LF Fashion (Hong Kong) Limited Hong Kong Ordinary HK$1 100 Export trading services
LF Fashion Pte. Ltd. Singapore Ordinary S$10,000 100 Export trading
LF Fashion Service Pte. Ltd. Singapore Ordinary S$10,000 100 Wholesaling
LF Freight (Hong Kong) Limited Hong Kong Ordinary HK$2 100 Provision of supply chain
management services
LF Freight (Singapore) Pte. Limited Singapore Ordinary S$2 100 Provision of supply chain
management services
(2) LF Freight (USA) LLC U.S.A. Capital contribution US$1 100 Freight forwarders and other
logistics services
LF Grand Corp U.S.A. US$1 100 Property investment
LF Home Limited Hong Kong Ordinary HK$2 100 Export trading
(2) LF International Inc. U.S.A. Common stock US$30,002 100 Investment management
LF Logistics (Bangladesh) Limited Bangladesh Ordinary TK$10,000,000 100 Freight forwarding
LF Logistics (Cambodia) Limited Cambodia Ordinary Riels 20,000,000 100 Freight forwarding and other
logistics services
LF Logistics (China) Co., Ltd. The People’s Republic of
China
Registered capital RMB50,000,000 100
foreign-owned
enterprise
Provision of Freight forwarders
and other logistics services
LF Logistics (Guangzhou) Co., Ltd. The People’s Republic of
China
Registered capital RMB10,000,000 100
foreign-owned
enterprise
Provision of Freight forwarders
and other logistics services
LF Logistics (Hong Kong) Limited Hong Kong Ordinary HK$10,000 100 Provision of logistics services
LF Logistics (India) Private Limited India Ordinary Rs15,000,000 100 Logistics, supply chain
management and freight
forwarding
LF Logistics (Taiwan) Limited Hong Kong Ordinary HK$200 100 Provision of logistics and
packaging services
LF Logistics (Thailand) Limited Thailand Ordinary Baht 307,750,000 100 Provision of logistics services
LF Logistics (UK) Limited England Ordinary GBP50,000 100 Provision of logistics services
LF Logistics Holdings (UK) Limited England Ordinary GBP1 100 Investment holding
LF Logistics Management Limited Hong Kong Ordinary HK$2 100 Provision of management and
consultancy services
(2) LF Logistics Pakistan (Private) Limited Pakistan Ordinary Rs5,000,000 100 Freight forwarders and other
logistics services
LF Logistics Services (M) Sdn. Bhd. Malaysia Ordinary RM2,000,000 100 Provision of logistics services
LF Logistics Services Pte. Ltd. Singapore Ordinary S$28,296,962 100 Provision of logistics services
LF Men’s Group LLC U.S.A. Capital contribution US$1 100 Wholesaling
LF National Brands Group LLC U.S.A. Capital contribution US$1 100 Design and marketing
LF North America Holdings Co., Inc. U.S.A. Common stock US$1 100 Investment holding
LF Performance Services Sdn. Bhd. Malaysia Ordinary RM250,000 70 House Royal Custom’s bonded
warehouse licence
LF Products (Hong Kong) Limited Hong Kong Ordinary HK$1 100 Provision of management
support services
43 PRINCIPAL SUBSIDIARIES, ASSOCIATED COMPANIES AND JOINT VENTURE (CONTINUED)
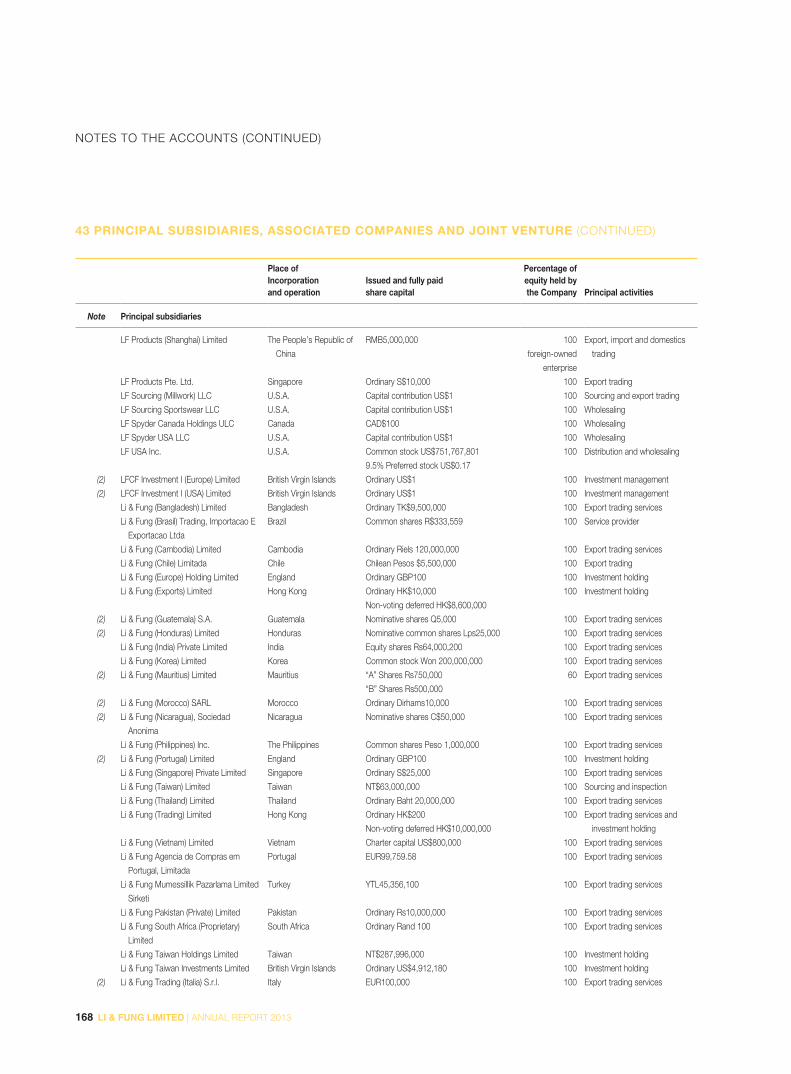
168 LI & FUNG LIMITED | ANNUAL REPORT 2013
NOTES TO THE ACCOUNTS (CONTINUED)
Place ofIncorporationand operation
Issued and fully paidshare capital
Percentage ofequity held bythe Company Principal activities
Note Principal subsidiaries
LF Products (Shanghai) Limited The People’s Republic of
China
RMB5,000,000 100
foreign-owned
enterprise
Export, import and domestics
trading
LF Products Pte. Ltd. Singapore Ordinary S$10,000 100 Export trading
LF Sourcing (Millwork) LLC U.S.A. Capital contribution US$1 100 Sourcing and export trading
LF Sourcing Sportswear LLC U.S.A. Capital contribution US$1 100 Wholesaling
LF Spyder Canada Holdings ULC Canada CAD$100 100 Wholesaling
LF Spyder USA LLC U.S.A. Capital contribution US$1 100 Wholesaling
LF USA Inc. U.S.A. Common stock US$751,767,801
9.5% Preferred stock US$0.17
100 Distribution and wholesaling
(2) LFCF Investment I (Europe) Limited British Virgin Islands Ordinary US$1 100 Investment management
(2) LFCF Investment I (USA) Limited British Virgin Islands Ordinary US$1 100 Investment management
Li & Fung (Bangladesh) Limited Bangladesh Ordinary TK$9,500,000 100 Export trading services
Li & Fung (Brasil) Trading, Importacao E
Exportacao Ltda
Brazil Common shares R$333,559 100 Service provider
Li & Fung (Cambodia) Limited Cambodia Ordinary Riels 120,000,000 100 Export trading services
Li & Fung (Chile) Limitada Chile Chilean Pesos $5,500,000 100 Export trading
Li & Fung (Europe) Holding Limited England Ordinary GBP100 100 Investment holding
Li & Fung (Exports) Limited Hong Kong Ordinary HK$10,000
Non-voting deferred HK$8,600,000
100 Investment holding
(2) Li & Fung (Guatemala) S.A. Guatemala Nominative shares Q5,000 100 Export trading services
(2) Li & Fung (Honduras) Limited Honduras Nominative common shares Lps25,000 100 Export trading services
Li & Fung (India) Private Limited India Equity shares Rs64,000,200 100 Export trading services
Li & Fung (Korea) Limited Korea Common stock Won 200,000,000 100 Export trading services
(2) Li & Fung (Mauritius) Limited Mauritius “A” Shares Rs750,000
“B” Shares Rs500,000
60 Export trading services
(2) Li & Fung (Morocco) SARL Morocco Ordinary Dirhams10,000 100 Export trading services
(2) Li & Fung (Nicaragua), Sociedad
Anonima
Nicaragua Nominative shares C$50,000 100 Export trading services
Li & Fung (Philippines) Inc. The Philippines Common shares Peso 1,000,000 100 Export trading services
(2) Li & Fung (Portugal) Limited England Ordinary GBP100 100 Investment holding
Li & Fung (Singapore) Private Limited Singapore Ordinary S$25,000 100 Export trading services
Li & Fung (Taiwan) Limited Taiwan NT$63,000,000 100 Sourcing and inspection
Li & Fung (Thailand) Limited Thailand Ordinary Baht 20,000,000 100 Export trading services
Li & Fung (Trading) Limited Hong Kong Ordinary HK$200
Non-voting deferred HK$10,000,000
100 Export trading services and
investment holding
Li & Fung (Vietnam) Limited Vietnam Charter capital US$800,000 100 Export trading services
Li & Fung Agencia de Compras em
Portugal, Limitada
Portugal EUR99,759.58 100 Export trading services
Li & Fung Mumessillik Pazarlama Limited
Sirketi
Turkey YTL45,356,100 100 Export trading services
Li & Fung Pakistan (Private) Limited Pakistan Ordinary Rs10,000,000 100 Export trading services
Li & Fung South Africa (Proprietary)
Limited
South Africa Ordinary Rand 100 100 Export trading services
Li & Fung Taiwan Holdings Limited Taiwan NT$287,996,000 100 Investment holding
Li & Fung Taiwan Investments Limited British Virgin Islands Ordinary US$4,912,180 100 Investment holding
(2) Li & Fung Trading (Italia) S.r.l. Italy EUR100,000 100 Export trading services
43 PRINCIPAL SUBSIDIARIES, ASSOCIATED COMPANIES AND JOINT VENTURE (CONTINUED)
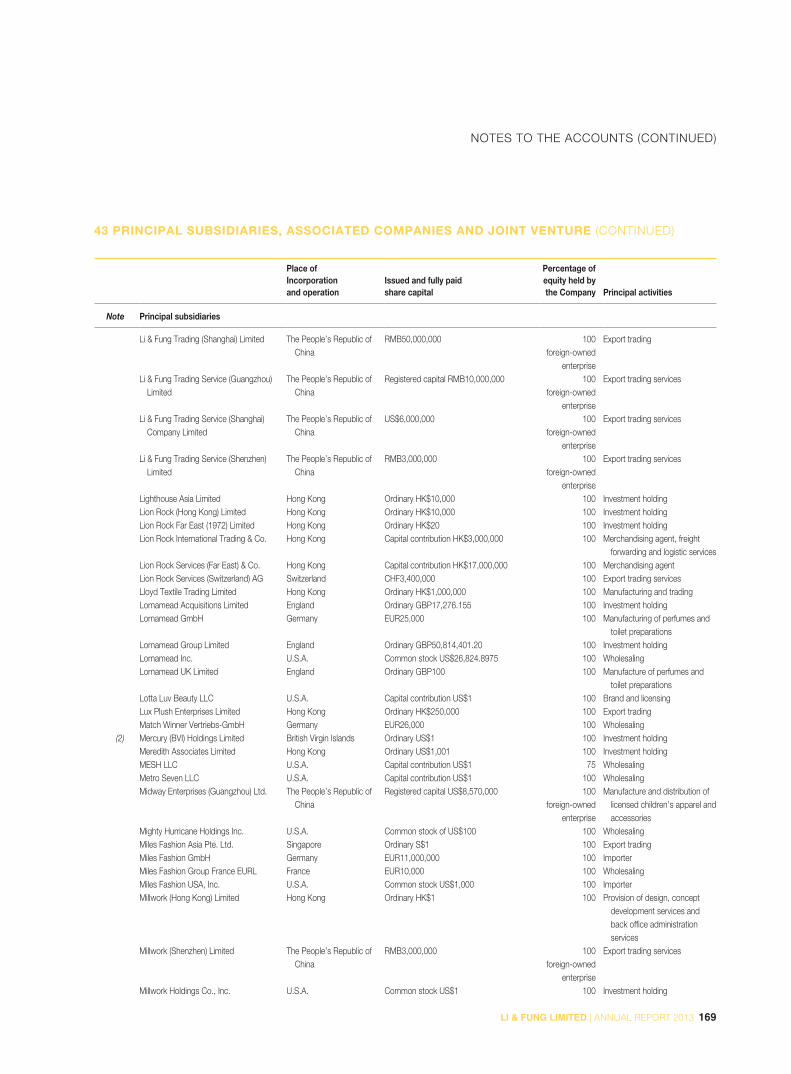
169LI & FUNG LIMITED | ANNUAL REPORT 2013
NOTES TO THE ACCOUNTS (CONTINUED)
Place ofIncorporationand operation
Issued and fully paidshare capital
Percentage ofequity held bythe Company Principal activities
Note Principal subsidiaries
Li & Fung Trading (Shanghai) Limited The People’s Republic of China
RMB50,000,000 100foreign-owned
enterprise
Export trading
Li & Fung Trading Service (Guangzhou) Limited
The People’s Republic of China
Registered capital RMB10,000,000 100foreign-owned
enterprise
Export trading services
Li & Fung Trading Service (Shanghai) Company Limited
The People’s Republic of China
US$6,000,000 100foreign-owned
enterprise
Export trading services
Li & Fung Trading Service (Shenzhen) Limited
The People’s Republic of China
RMB3,000,000 100foreign-owned
enterprise
Export trading services
Lighthouse Asia Limited Hong Kong Ordinary HK$10,000 100 Investment holdingLion Rock (Hong Kong) Limited Hong Kong Ordinary HK$10,000 100 Investment holdingLion Rock Far East (1972) Limited Hong Kong Ordinary HK$20 100 Investment holdingLion Rock International Trading & Co. Hong Kong Capital contribution HK$3,000,000 100 Merchandising agent, freight
forwarding and logistic servicesLion Rock Services (Far East) & Co. Hong Kong Capital contribution HK$17,000,000 100 Merchandising agentLion Rock Services (Switzerland) AG Switzerland CHF3,400,000 100 Export trading servicesLloyd Textile Trading Limited Hong Kong Ordinary HK$1,000,000 100 Manufacturing and tradingLornamead Acquisitions Limited England Ordinary GBP17,276.155 100 Investment holdingLornamead GmbH Germany EUR25,000 100 Manufacturing of perfumes and
toilet preparationsLornamead Group Limited England Ordinary GBP50,814,401.20 100 Investment holdingLornamead Inc. U.S.A. Common stock US$26,824.8975 100 WholesalingLornamead UK Limited England Ordinary GBP100 100 Manufacture of perfumes and
toilet preparationsLotta Luv Beauty LLC U.S.A. Capital contribution US$1 100 Brand and licensingLux Plush Enterprises Limited Hong Kong Ordinary HK$250,000 100 Export tradingMatch Winner Vertriebs-GmbH Germany EUR26,000 100 Wholesaling
(2) Mercury (BVI) Holdings Limited British Virgin Islands Ordinary US$1 100 Investment holdingMeredith Associates Limited Hong Kong Ordinary US$1,001 100 Investment holdingMESH LLC U.S.A. Capital contribution US$1 75 WholesalingMetro Seven LLC U.S.A. Capital contribution US$1 100 WholesalingMidway Enterprises (Guangzhou) Ltd. The People’s Republic of
ChinaRegistered capital US$8,570,000 100
foreign-ownedenterprise
Manufacture and distribution of licensed children’s apparel and accessories
Mighty Hurricane Holdings Inc. U.S.A. Common stock of US$100 100 WholesalingMiles Fashion Asia Pte. Ltd. Singapore Ordinary S$1 100 Export tradingMiles Fashion GmbH Germany EUR11,000,000 100 ImporterMiles Fashion Group France EURL France EUR10,000 100 WholesalingMiles Fashion USA, Inc. U.S.A. Common stock US$1,000 100 ImporterMillwork (Hong Kong) Limited Hong Kong Ordinary HK$1 100 Provision of design, concept
development services and back office administration services
Millwork (Shenzhen) Limited The People’s Republic of China
RMB3,000,000 100foreign-owned
enterprise
Export trading services
Millwork Holdings Co., Inc. U.S.A. Common stock US$1 100 Investment holding
43 PRINCIPAL SUBSIDIARIES, ASSOCIATED COMPANIES AND JOINT VENTURE (CONTINUED)
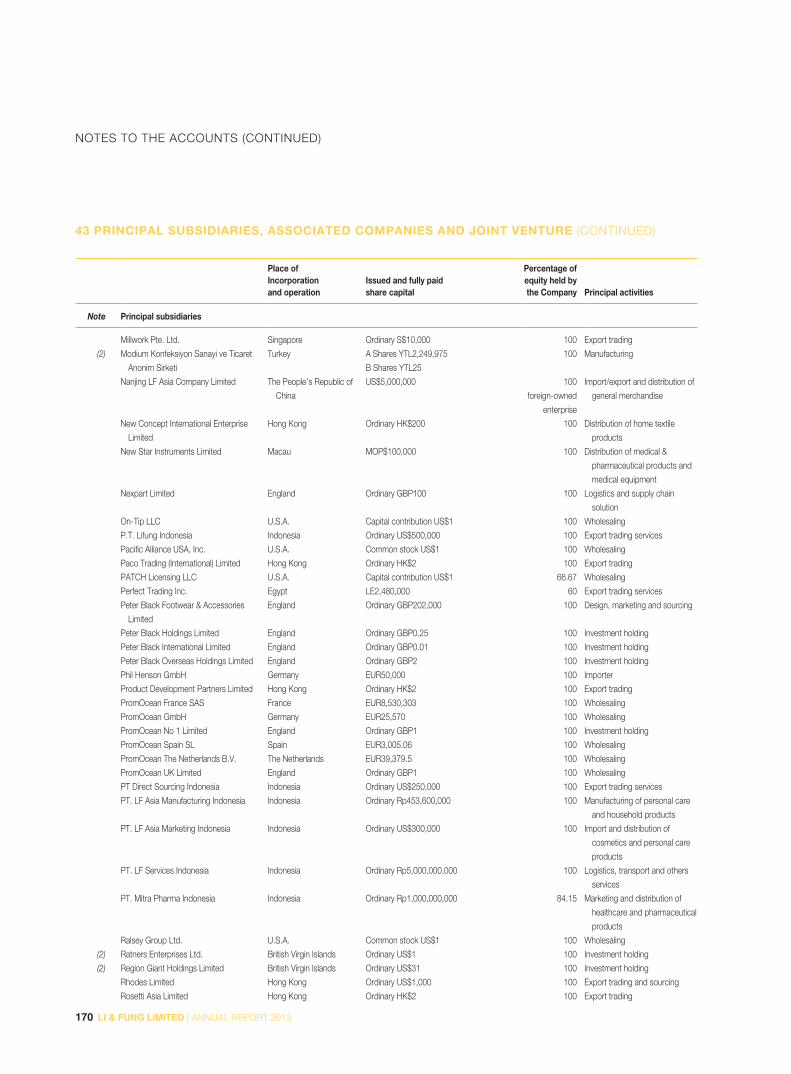
170 LI & FUNG LIMITED | ANNUAL REPORT 2013
NOTES TO THE ACCOUNTS (CONTINUED)
Place ofIncorporationand operation
Issued and fully paidshare capital
Percentage ofequity held bythe Company Principal activities
Note Principal subsidiaries
Millwork Pte. Ltd. Singapore Ordinary S$10,000 100 Export trading
(2) Modium Konfeksiyon Sanayi ve Ticaret
Anonim Sirketi
Turkey A Shares YTL2,249,975
B Shares YTL25
100 Manufacturing
Nanjing LF Asia Company Limited The People’s Republic of
China
US$5,000,000 100
foreign-owned
enterprise
Import/export and distribution of
general merchandise
New Concept International Enterprise
Limited
Hong Kong Ordinary HK$200 100 Distribution of home textile
products
New Star Instruments Limited Macau MOP$100,000 100 Distribution of medical &
pharmaceutical products and
medical equipment
Nexpart Limited England Ordinary GBP100 100 Logistics and supply chain
solution
On-Tip LLC U.S.A. Capital contribution US$1 100 Wholesaling
P.T. Lifung Indonesia Indonesia Ordinary US$500,000 100 Export trading services
Pacific Alliance USA, Inc. U.S.A. Common stock US$1 100 Wholesaling
Paco Trading (International) Limited Hong Kong Ordinary HK$2 100 Export trading
PATCH Licensing LLC U.S.A. Capital contribution US$1 66.67 Wholesaling
Perfect Trading Inc. Egypt LE2,480,000 60 Export trading services
Peter Black Footwear & Accessories
Limited
England Ordinary GBP202,000 100 Design, marketing and sourcing
Peter Black Holdings Limited England Ordinary GBP0.25 100 Investment holding
Peter Black International Limited England Ordinary GBP0.01 100 Investment holding
Peter Black Overseas Holdings Limited England Ordinary GBP2 100 Investment holding
Phil Henson GmbH Germany EUR50,000 100 Importer
Product Development Partners Limited Hong Kong Ordinary HK$2 100 Export trading
PromOcean France SAS France EUR8,530,303 100 Wholesaling
PromOcean GmbH Germany EUR25,570 100 Wholesaling
PromOcean No 1 Limited England Ordinary GBP1 100 Investment holding
PromOcean Spain SL Spain EUR3,005.06 100 Wholesaling
PromOcean The Netherlands B.V. The Netherlands EUR39,379.5 100 Wholesaling
PromOcean UK Limited England Ordinary GBP1 100 Wholesaling
PT Direct Sourcing Indonesia Indonesia Ordinary US$250,000 100 Export trading services
PT. LF Asia Manufacturing Indonesia Indonesia Ordinary Rp453,600,000 100 Manufacturing of personal care
and household products
PT. LF Asia Marketing Indonesia Indonesia Ordinary US$300,000 100 Import and distribution of
cosmetics and personal care
products
PT. LF Services Indonesia Indonesia Ordinary Rp5,000,000,000 100 Logistics, transport and others
services
PT. Mitra Pharma Indonesia Indonesia Ordinary Rp1,000,000,000 84.15 Marketing and distribution of
healthcare and pharmaceutical
products
Ralsey Group Ltd. U.S.A. Common stock US$1 100 Wholesaling
(2) Ratners Enterprises Ltd. British Virgin Islands Ordinary US$1 100 Investment holding
(2) Region Giant Holdings Limited British Virgin Islands Ordinary US$31 100 Investment holding
Rhodes Limited Hong Kong Ordinary US$1,000 100 Export trading and sourcing
Rosetti Asia Limited Hong Kong Ordinary HK$2 100 Export trading
43 PRINCIPAL SUBSIDIARIES, ASSOCIATED COMPANIES AND JOINT VENTURE (CONTINUED)
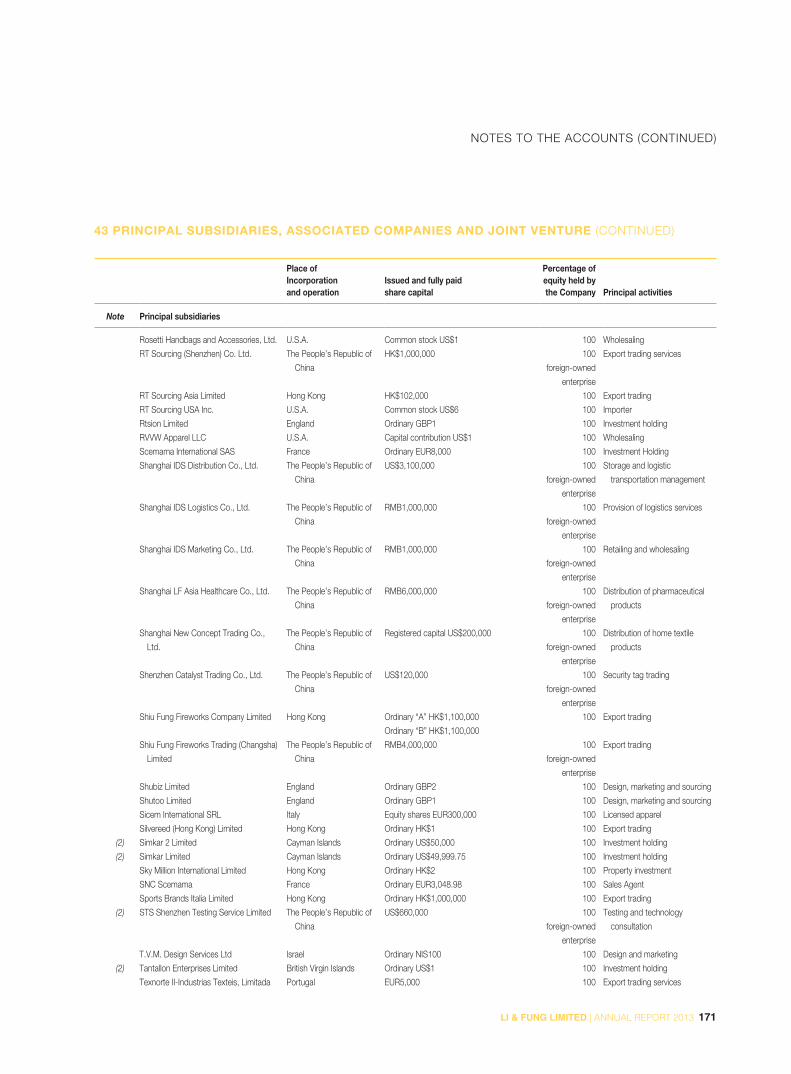
171LI & FUNG LIMITED | ANNUAL REPORT 2013
NOTES TO THE ACCOUNTS (CONTINUED)
Place ofIncorporationand operation
Issued and fully paidshare capital
Percentage ofequity held bythe Company Principal activities
Note Principal subsidiaries
Rosetti Handbags and Accessories, Ltd. U.S.A. Common stock US$1 100 Wholesaling
RT Sourcing (Shenzhen) Co. Ltd. The People’s Republic of
China
HK$1,000,000 100
foreign-owned
enterprise
Export trading services
RT Sourcing Asia Limited Hong Kong HK$102,000 100 Export trading
RT Sourcing USA Inc. U.S.A. Common stock US$6 100 Importer
Rtsion Limited England Ordinary GBP1 100 Investment holding
RVVW Apparel LLC U.S.A. Capital contribution US$1 100 Wholesaling
Scemama International SAS France Ordinary EUR8,000 100 Investment Holding
Shanghai IDS Distribution Co., Ltd. The People’s Republic of
China
US$3,100,000 100
foreign-owned
enterprise
Storage and logistic
transportation management
Shanghai IDS Logistics Co., Ltd. The People’s Republic of
China
RMB1,000,000 100
foreign-owned
enterprise
Provision of logistics services
Shanghai IDS Marketing Co., Ltd. The People’s Republic of
China
RMB1,000,000 100
foreign-owned
enterprise
Retailing and wholesaling
Shanghai LF Asia Healthcare Co., Ltd. The People’s Republic of
China
RMB6,000,000 100
foreign-owned
enterprise
Distribution of pharmaceutical
products
Shanghai New Concept Trading Co.,
Ltd.
The People’s Republic of
China
Registered capital US$200,000 100
foreign-owned
enterprise
Distribution of home textile
products
Shenzhen Catalyst Trading Co., Ltd. The People’s Republic of
China
US$120,000 100
foreign-owned
enterprise
Security tag trading
Shiu Fung Fireworks Company Limited Hong Kong Ordinary “A” HK$1,100,000
Ordinary “B” HK$1,100,000
100 Export trading
Shiu Fung Fireworks Trading (Changsha)
Limited
The People’s Republic of
China
RMB4,000,000 100
foreign-owned
enterprise
Export trading
Shubiz Limited England Ordinary GBP2 100 Design, marketing and sourcing
Shutoo Limited England Ordinary GBP1 100 Design, marketing and sourcing
Sicem International SRL Italy Equity shares EUR300,000 100 Licensed apparel
Silvereed (Hong Kong) Limited Hong Kong Ordinary HK$1 100 Export trading
(2) Simkar 2 Limited Cayman Islands Ordinary US$50,000 100 Investment holding
(2) Simkar Limited Cayman Islands Ordinary US$49,999.75 100 Investment holding
Sky Million International Limited Hong Kong Ordinary HK$2 100 Property investment
SNC Scemama France Ordinary EUR3,048.98 100 Sales Agent
Sports Brands Italia Limited Hong Kong Ordinary HK$1,000,000 100 Export trading
(2) STS Shenzhen Testing Service Limited The People’s Republic of
China
US$660,000 100
foreign-owned
enterprise
Testing and technology
consultation
T.V.M. Design Services Ltd Israel Ordinary NIS100 100 Design and marketing
(2) Tantallon Enterprises Limited British Virgin Islands Ordinary US$1 100 Investment holding
Texnorte II-Industrias Texteis, Limitada Portugal EUR5,000 100 Export trading services
43 PRINCIPAL SUBSIDIARIES, ASSOCIATED COMPANIES AND JOINT VENTURE (CONTINUED)

172 LI & FUNG LIMITED | ANNUAL REPORT 2013
NOTES TO THE ACCOUNTS (CONTINUED)
Place ofIncorporationand operation
Issued and fully paidshare capital
Percentage ofequity held bythe Company Principal activities
Note Principal subsidiaries
Texnorte Industrial Limited Hong Kong Ordinary HK$2 100 Export trading
TH Success Limited Hong Kong Ordinary HK$1,560,000 100 Export trading
The Mint Group Pte. Ltd. Singapore Ordinary S$100 100 Sub-licensing
The Vault Projects Limited England Ordinary GBP1,000 100 Point of sale design and
consultancy
Toonsland Limited Hong Kong Ordinary HK$200,000 100 Distribution of children’s apparel
and accessories
Toy Island (USA) LLC U.S.A. Capital contribution US$100 100 Marketing
TVM Europe GmbH Germany EUR25,000 100 Wholesaling
TVMania Italy S.r.l. Italy EUR10,000 100 Wholesaling
TVMania UK Limited England Ordinary GBP2 100 Wholesaling
Ventana Bekleidungsfabrikation GmbH Germany EUR26,000 100 Wholesaling
Visage (Hong Kong) Limited Hong Kong Ordinary HK$100,000 100 Design and marketing
Visage Group Limited England Ordinary GBP100,000 100 Investment holding
Visage Holdings (2010) Limited England Ordinary GBP2 100 Investment holding
Visage Holdings Limited England Ordinary GBP35,163 100 Investment holding
Visage Limited England Ordinary GBP54,100 100 Design, marketing and sourcing
VZI Investment Corp. U.S.A. Common stock US$1 100 Wholesaling
W S Trading Limited Hong Kong Ordinary HK$1,000,000 100 Export trading
Welmed (Macau) Company Limited Macau MOP$25,000 100 Distribution of medical &
pharmaceutical products and
medical equipment
Whalen Limited
(formerly known as Toy Island
Manufacturing Company Limited)
Hong Kong Ordinary HK$62,000,000 100 Design and marketing
Whalen LLC U.S.A. Capital contribution US$0.01 100 Wholesaling
Wilson Fabric Mart (China) Ltd Hong Kong Ordinary HK$2,000,000 100 Export trading
Wilson Textile Limited Hong Kong Ordinary HK$1 100 Export trading
Wonderful World (HK) Limited Hong Kong Ordinary HK$2 100 Corporate administration and
holding of trademarks
Wonderful World Overseas Limited British Virgin Islands Ordinary US$1 100 Investment holding
NOTES:(1) Li & Fung (B.V.I.) Limited provides the subsidiaries with promotional and marketing services outside Hong Kong.
(2) Subsidiaries not audited by PricewaterhouseCoopers. The aggregate net assets of subsidiaries not audited/reviewed by PricewaterhouseCoopers
amounted to less than 5% of the Group’s total net assets.
The above table lists out the principal subsidiaries of the Company as at 31 December 2013 which, in the opinion of the directors,
principally affected the results for the year or form a substantial portion of the net assets of the Group. To give details of other
subsidiaries would, in the opinion of the directors, result in particulars of excessive length.
43 PRINCIPAL SUBSIDIARIES, ASSOCIATED COMPANIES AND JOINT VENTURE (CONTINUED)
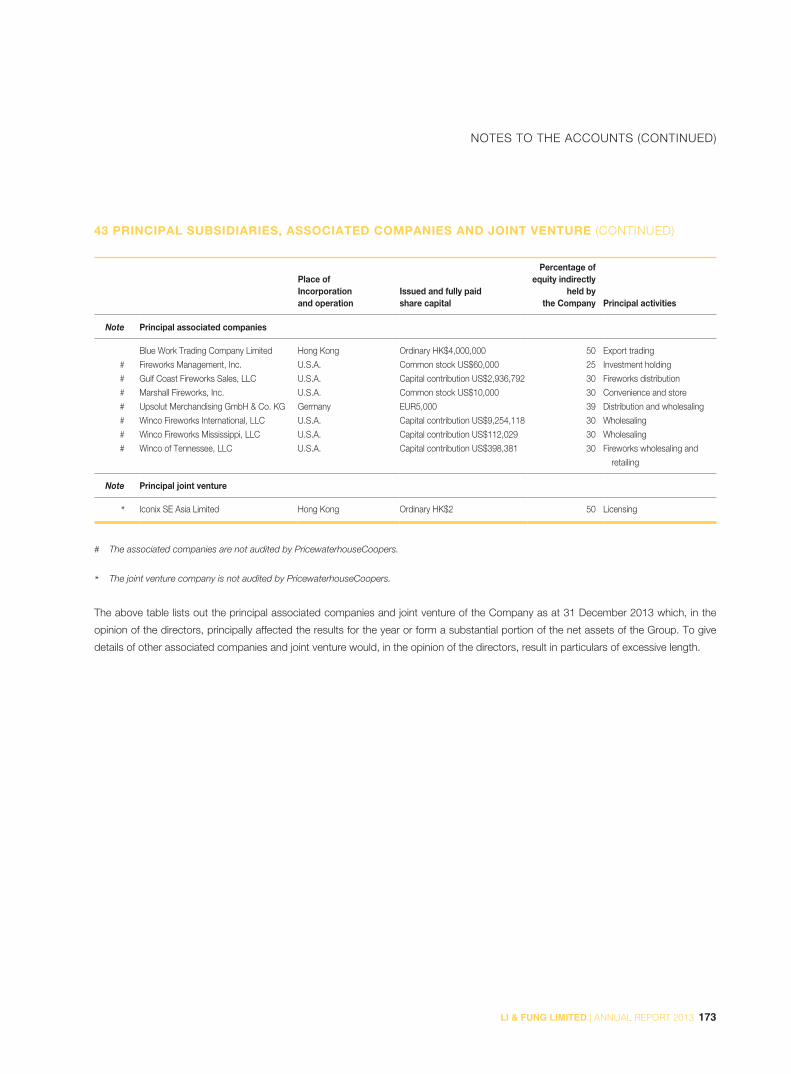
173LI & FUNG LIMITED | ANNUAL REPORT 2013
NOTES TO THE ACCOUNTS (CONTINUED)
43 PRINCIPAL SUBSIDIARIES, ASSOCIATED COMPANIES AND JOINT VENTURE (CONTINUED)
Place ofIncorporationand operation
Issued and fully paidshare capital
Percentage ofequity indirectly
held bythe Company Principal activities
Note Principal associated companies
Blue Work Trading Company Limited Hong Kong Ordinary HK$4,000,000 50 Export trading
# Fireworks Management, Inc. U.S.A. Common stock US$60,000 25 Investment holding
# Gulf Coast Fireworks Sales, LLC U.S.A. Capital contribution US$2,936,792 30 Fireworks distribution
# Marshall Fireworks, Inc. U.S.A. Common stock US$10,000 30 Convenience and store
# Upsolut Merchandising GmbH & Co. KG Germany EUR5,000 39 Distribution and wholesaling
# Winco Fireworks International, LLC U.S.A. Capital contribution US$9,254,118 30 Wholesaling
# Winco Fireworks Mississippi, LLC U.S.A. Capital contribution US$112,029 30 Wholesaling
# Winco of Tennessee, LLC U.S.A. Capital contribution US$398,381 30 Fireworks wholesaling and
retailing
Note Principal joint venture
* Iconix SE Asia Limited Hong Kong Ordinary HK$2 50 Licensing
# The associated companies are not audited by PricewaterhouseCoopers.
* The joint venture company is not audited by PricewaterhouseCoopers.
The above table lists out the principal associated companies and joint venture of the Company as at 31 December 2013 which, in the
opinion of the directors, principally affected the results for the year or form a substantial portion of the net assets of the Group. To give
details of other associated companies and joint venture would, in the opinion of the directors, result in particulars of excessive length.


![Characterization of Li-rich xLi2MnO3·(1−x)Li[MnyNizCo1−y−z]O2ascathode active materials for Li-ion batteries](https://static.fdokumen.com/doc/165x107/6333ab67ce61be0ae50ec31e/characterization-of-li-rich-xli2mno31xlimnynizco1yzo2ascathode-active.jpg)