State Retiree Health Plan Spending - The Pew Charitable Trusts
50
-
Upload
khangminh22 -
Category
Documents
-
view
1 -
download
0
Transcript of State Retiree Health Plan Spending - The Pew Charitable Trusts

A report from The Pew Charitable Trusts and the John D. and Catherine T. MacArthur Foundation May 2016
State Retiree Health Plan SpendingAn examination of funding trends and plan provisions

The Pew Charitable Trusts Susan K. Urahn, executive vice president Thomas P. Conroy, vice president Kil Huh, senior director
This report is a collaboration between the State Health Care Spending Project and The Pew Charitable Trusts’ public sector retirement systems project.
The State Health Care Spending Project, an initiative of The Pew Charitable Trusts and the John D. and Catherine T. MacArthur Foundation, helps policymakers better understand how much money states spend on health care, how and why that amount has changed over time, and which policies are containing costs while maintaining or improving health outcomes.
For additional information, visit pewtrusts.org/healthcarespending.
The Pew Charitable Trusts’ public sector retirement systems project performs research on all aspects of state and city public pension systems, including fiscal health, investment practices, benefits design, retiree health care, and governance, and o�ers technical assistance as they undertake reforms.
For additional information, visit pewtrusts.org/pensions.
External reviewers The report benefited from the valuable insights and expertise of Gail Levenson, R.Ph., a principal at Buck Consultants; John Brouder, a partner at Boston Benefit Partners LLC; and Tom Vicente, a partner at Aon Hewitt.
Acknowledgments Thank you to Robert Carey for providing critical guidance during the research process, and Kavita Choudhry and Diane Lim for their work shaping our methodology. Thank you also to the following Pew colleagues for their contributions to this report: Rica Santos, Tim Cordova, and Dan Berger for their assistance with data checking; Karen Font and Betsy Levine for their help with fact-checking; Jim Jukes, Alan van der Hilst, Gary VanLandingham, and Hassan Burke for their methodological feedback; Jeremy Ratner, Michelle Blackston, Lauren Dickinson, Bernard Ohanian, and Demetra Aposporos for their editorial input; and Gaye Williams, Dan Benderly, Mary Markley, Sara Flood, Laura Woods, Erika Compart, Lisa Plotkin, and Liz Visser for their work preparing this report for publication.
John D. and Catherine T. MacArthur FoundationValerie Chang, managing director, programs Meredith Klein, communications o cer
Maria Schi� Ellyon Bell Samantha Chao Frances McGa�ey Matt McKillop
Gregory Mennis David Draine Aleena Oberthur Ashali Singham Keith Sliwa

Contents
1 Overview
4 State OPEB liabilitiesFigure 1: OPEB Liabilities Are Concentrated Among Several States 4OPEB liability funded ratios 5Figure 2: Most States Pre-Fund Less Than 10% of OPEB Liabilities 5Changes to liabilities over time 6
9 Annual state OPEB spendingAnnual state expenditures 9Annual required contributions 9
10 Provisions of state retiree health insurance plans State contributions to premiums for retiree health insurance plans 10Figure 3: Most States Tie Contributions to Premiums’ Total Cost 12Figure 4: State Premium Contribution Methods for Medicare-Eligible Retirees Drive OPEB Liabilities 13Retirement benefit provisions may di�er for workers hired today 14Figure 5: Most States Prorate Their Contributions to Retiree Premiums 14Figure 6: State Premium Prorating Formulas Vary Significantly 15Eligibility criteria 16Figure 7: States Require a Median of 10 Years of Service for Premium Contribution Eligibility 17Figure 8: Most States O�er Coverage, Premium Contributions for Retirees’ Dependents 18 Health and prescription coverage type for Medicare-eligible retirees 18Figure 9: States’ Methods for Covering Medicare-Eligible Retirees Vary 19Figure 10: Many States O�er EGWPs for Medicare-Eligible Retirees 21State changes to retiree health insurance plan provisions 22
22 Conclusion
23 Appendix A: MethodologyData sources 23Accuracy and comprehensiveness 23Data analyses 24
25 Appendix B: 50-state OPEB financial data tablesTable B.1: State OPEB Liabilities and Funded Ratios, 2010-13 25Table B.2: State OPEB Expenditures and Annual Required Contributions, 2013 27
29 Appendix C: OPEB funding policies and retiree health plan eligibility Table C.1: 50-State Matrix for Early Retirees 29Table C.2: 50-State Matrix for Medicare-Eligible Retirees 31

33 Appendix D: State contributions to retiree health insurance plansTable D: Criteria for State Premium Contributions to Retiree Health Insurance Plans 33
40 Endnotes
Contact: Jeremy Ratner, communications director¤ Email: [email protected]¤ Phone: 202-540-6507
This report is intended for educational and informational purposes. References to specific policymakers or companies have been included solely to advance these purposes and do not constitute an endorsement, sponsorship, or recommendation by The Pew Charitable Trusts or the John D. and Catherine T. MacArthur Foundation.
Cover photo: Getty Images

1
OverviewAll states, with the exception of Idaho, o�er newly hired public workers access to certain retiree health care coverage as part of their benefits package.1 Thirty-eight of these states have committed to making contributions toward health care premiums for such coverage. Retiree health coverage for these state government workers stands in sharp contrast to the private sector, where the proportion of firms with 200 or more workers o�ering health coverage to retirees has plummeted from 66 percent in 1988 to 28 percent in 2013.2 Rising health care costs, changes in accounting standards for reporting the cost of retiree health benefits, competition from overseas firms and small startup companies, and the addition of prescription drug coverage to the Medicare program have contributed to this drop in private sector retiree health benefits. And although facing many of these same circumstances, most states continue to o�er health benefits to their retired public workers, in an e�ort to help attract and retain a talented workforce.3
One of the most significant changes for the states was an adjustment the Governmental Accounting Standards Board (GASB) made to accounting standards that requires states to report liabilities for retiree benefits other than pensions—known as other post-employment benefits (OPEB)—in their financial statements. (See ”Glossary” box.)4 By December 2008, all state governments were required to implement these changes, and the increased financial transparency that resulted prompted states to take a closer look at OPEB obligations and how to fund and pay for them.5 Retiree health insurance benefits account for the majority of states’ OPEB obligations, so many states have implemented policy changes concerning these benefits to address looming OPEB obligations.6 As a result, most states provide varying levels of retiree benefits based on factors such as date of hire, date of retirement, or vesting eligibility. (See Appendices A and D for more information about which groups of retirees were included in this study and why.)
This report, a first-of-its-kind e�ort, provides data on state OPEB liabilities—the cost in today’s dollars of benefits to be paid to current workers and retirees over future years—and funding trends and how they are a�ected by aspects of state retiree health plans. Researchers collected and analyzed updated OPEB financial data and trends since 2010, as well as 50-state data on the eligibility criteria for retiree health plans. (To convey more clear and consistent trends, we report 50-state OPEB data only since 2010, because many states were adjusting to newly implemented GASB reporting standards in 2008 and 2009.) They found that states’ strategies for addressing OPEB liabilities vary greatly and that the methods states choose to contribute to their retirees’ health insurance premiums substantially a�ect the size of their OPEB liabilities. Specifically, the researchers found:
• States’ OPEB liabilities decreased 10 percent, to $627 billion, between 2010 and 2013, after adjusting for inflation. This drop resulted from lower rates of growth in health care costs and changes states made to their OPEB funding policies and retiree health plan provisions.
• State-funded ratios—representing the amount of assets states have set aside to fund their OPEB liabilities—increased from 5 percent in 2010 to 6 percent in 2013.7 However, this trend varied greatly among states—the funded ratio of eight states decreased, and Oregon increased its funded ratio by 25 percentage points.
• States’ actual expenditures for OPEB totaled $18.4 billion in 2013, or 1.6 percent of state-generated revenue. (See “Glossary” box.) If states had instead set aside the amount suggested by actuaries to pay for OPEB liabilities, their total payments that year would have more than doubled to $48 billion—4 percent of state-generated revenue—and spending to fully fund OPEB obligations would have outpaced what states contributed to active state employee health premiums.
• The states that automatically increased their retiree health insurance premium contribution when the total cost of the premium rose had higher OPEB liabilities relative to the size of their economies in 2013, while

2
the states that paid a fixed amount toward retirees’ health insurance premiums had relatively lower OPEB liabilities.
• States varied in how they modified retiree health plan provisions. For example, between 2000 and 2015, Idaho eliminated retiree health coverage for newly hired employees; at least five states stopped making any health premium contribution for certain retirees; and over a dozen states changed the minimum age or the number of state service years required for retirees to be eligible for health benefits.
• 35 states have implemented Medicare Advantage or Employer Group Waiver Plans to provide health or prescription drug benefit coverage for Medicare-eligible retirees since these options were authorized as part of the Medicare Prescription Drug, Improvement, and Modernization Act of 2003.8 These cost-saving programs provide states with financial subsidies from the federal Medicare program to provide Medicare plus wraparound benefits.9 (See “Glossary” box.)
As state policymakers address challenges in providing retiree health care, this report is intended to help them better understand how their spending, long-term liabilities, and criteria for premium contributions and coverage eligibility compare with those of other states.
The State Health Care Spending 50-State Report SeriesThe State Health Care Spending Project, a collaboration between The Pew Charitable Trusts and the John D. and Catherine T. MacArthur Foundation, is examining seven key areas of state health care spending—Medicaid, the Children’s Health Insurance Program, substance use disorder treatment, mental health services, prison health care, active state government employee benefits, and retired state government employee benefits. The project provides a comprehensive examination of each of these health programs that states fund. The programs vary by state in many ways, so the research highlights those variations and some of the key factors driving them. The project concurrently released state-by-state data on 20 key health indicators to complement the programmatic spending analysis. For more information, see pewtrusts.org/healthcarespending.

3
Continued on the next page
Glossary
Annual required contribution. The ARC is an accounting metric and disclosure requirement defined by the Governmental Accounting Standards Board and calculated by each state’s actuary. Using the economic and demographic assumptions of the plans, the ARC calculation includes the expected cost of benefits earned for the current year and an amount to reduce some of the unfunded liability, called an amortization payment. The amortization payment is calculated based on the number of years—or amortization period—assumed to fully pay for the unfunded liability.10
While most states pay only for current benefit costs each year, some of the states that pre-fund their other post-employment benefits (OPEB) liabilities include amortization payments based on ARC calculations.
Dependent. For this analysis, our definition of dependent includes survivors, spouses, dependent children, and other retiree dependents as defined by individual states.
Discount rate. The discount rate is the assumed interest rate used to account for the fact that money invested now will accumulate interest and be worth more later.11
Employer Group Waiver Plan. An EGWP is an option employers have, through the Medicare program, to provide prescription drug coverage to retirees who would otherwise enroll in a commercial Medicare Part D prescription drug plan.12 Most states o�ering an EGWP contract with an insurer to provide prescription drug coverage to their retirees.13 The insurance provider contracts directly with Medicare and receives risk-adjusted capitated payments.14 Alternatively, a state can o�er prescription drug coverage through a self-run (or self-insured) plan and receive risk-adjusted capitated payments directly from Medicare.15
Other post-employment benefits. In addition to pension benefits, state governments o�er other post-employment benefits. Expenditures for these benefits consist primarily of retiree health insurance expenses, but may also include a small percentage of expenditures for other insurance coverage such as dental, vision, life, or disability.16 This analysis focuses on state government OPEB expenditures; however, our source for OPEB financial data may include data on OPEB for local retirees or teachers in localities where those plans are administered by the state and the state maintains a financial interest in them. (See Appendix A: Methodology.)
OPEB liabilities. OPEB liabilities reflect the expected cost of these benefits for current workers and retirees over the course of their lives. These liabilities are self-reported and calculated by each state’s actuary according to the standards set forth by the GASB.17
Retiree Drug Subsidy Plan. An RDS Plan is a traditional prescription drug insurance plan that states can o�er retirees who might otherwise enroll in a Medicare Part D prescription drug

4
State OPEB liabilitiesIn 2013, states reported a combined $627 billion liability for OPEB, representing the expected cost in today’s dollars of benefits to be paid to current workers and retirees over their lifetimes.23
Much of this liability is concentrated in 13 states. (See Figure 1.) Although these states represented about half of the U.S. population in 2013, they accounted for 81 percent of the total OPEB liabilities for all 50 states.
plan.18 As part of the RDS program, states may receive reimbursement of up to 28 percent for allowable prescription claims for RDS Plan enrollees, within a certain dollar threshold.19 The RDS program was created when Medicare Part D was enacted to encourage employers to continue o�ering traditional drug coverage to their Medicare-eligible retirees.20
State-generated revenue. State-generated revenue is money that states raise on their own, primarily through taxes and fees, and does not include any federal revenue, such as matching dollars or grants.21
Wraparound coverage. For the purposes of this analysis, wraparound coverage includes coverage that is secondary to Medicare Parts A and B and may cover Medicare copays, coinsurance, and deductibles. Wraparound coverage may also cover services not covered by Medicare and may reimburse providers for costs above Medicare reimbursement. States may also choose to o�er a Medicare Advantage plan, which is partially paid for by the federal government. This coverage option allows states to coordinate with the federal Medicare program to o�er comprehensive benefits to Medicare-eligible retirees.22
Figure 1
OPEB Liabilities Are Concentrated Among Several States13 states represent 81% of total, 2013
Source: Analysis of data from states’ Comprehensive Annual Financial Reports, the U.S. census, actuarial reports and valuations, other public documents, or from plan o¯cials
© 2016 The Pew Charitable Trusts
AK, CA, CT, GA, IL, MA, MI, NC, NJ, NY, OH, PA, TX All other states
Percentage of U.S. aggregate
0 20% 40% 60% 80% 100%
2013 OPEBliability
2013population 54% 46%
81% 19%

5
OPEB liability funded ratios One strategy states use to manage OPEB liabilities is to set aside assets to pre-fund these costs and leverage the compounded returns these assets may be projected to accrue.24 A state’s funded ratio measures the assets the state has set aside as a percentage of its OPEB liability.25 Pre-funding requires additional resources from the budget in the near-term but can lower long-term costs by generating earnings on the invested assets.26 Most states, however, pay for benefits on a pay-as-you-go basis instead, with no pre-funding.27 In fiscal year 2013, states had only $40 billion in assets—or approximately 6 percent of the $627 billion total—saved to cover the costs associated with their OPEB liabilities. State-funded ratios varied greatly, ranging from less than 1 percent in 22 states to 73 percent in Arizona.
Figure 2 shows that only seven states have an OPEB funded ratio of 30 percent or greater: Alaska, Arizona, North Dakota, Ohio, Oregon, Utah, and Wisconsin. These states typically follow explicit pre-funding policies that are written into state law. Ohio and Arizona, for example, employ 30- and 15-year amortization periods, respectively, to pay down unfunded liabilities over time. (See “Glossary” box definition of annual required contribution for more information on amortization periods.)28 Both states also leverage the expertise of their state’s pension system to invest and manage plan assets; the Ohio Public Employees Retirement System and the Arizona State Retirement System are responsible for day-to-day administration of OPEB and also investing plan assets.29
Figure 2
Most States Pre-Fund Less Than 10% of OPEB LiabilitiesState-funded ratios, 2013
Note: Nebraska does not report an OPEB liability.
Source: Analysis of data from states’ Comprehensive Annual Financial Reports, actuarial reports and valuations, other public documents, or from plan o¯cials
© 2016 The Pew Charitable Trusts
Below 1%1-9%10-29%30% and above No data
AZ NM
NDMT
WY
ID
UT
OR
WA
NV
IA
MN
TN
KY
OHPA
IN
LAMS GA
NC
VA
SC
IL
FL
AL
WI
AK
CA
TX
OK
KS
NE
COMO
AR
NY
ME
WV
SDMI
HI
Below 1%1-9%10-29%30% and above No data
AZ NM
NDMT
WY
ID
UT
OR
WA
NV
IA
MN
TN
KY
OHPA
IN
LA
MS GA
NC
VA
SC
IL
FL
AL
WI
AK
CA
TX
OK
KS
NE
COMO
AR
NY
ME
WV
SDMI
HI

6
Changes to liabilities over timeIn aggregate, states’ reported OPEB liabilities declined by 10 percent between 2010 and 2013, to $627 billion, adjusting for inflation. (See Appendix B.) However, individual state trends varied significantly; 39 states decreased their liability, and 10 states increased theirs, adjusting for inflation.30 A wide variety of factors a�ect whether states’ OPEB liabilities increase or decrease, including health care inflation, changes to retiree health plan design and eligibility criteria, and changes to actuarial assumptions.
In aggregate, states’ reported OPEB liabilities declined by 10 percent between 2010 and 2013, to $627 billion, adjusting for inflation.
• Impact of changes to retiree health plan design. Liabilities were also reduced in some states as a result of changes to the structure of states’ Medicare-eligible retiree prescription drug benefits. Several states transitioned to providing prescription drug benefits to Medicare-eligible retirees through a cost-saving Employer Group Waiver Plan (EGWP) and saw reductions in their OPEB liabilities. (See the “Glossary” box.) In addition to cost savings, states that provide benefits through this structure also enjoy more favorable accounting treatment when calculating OPEB liabilities.35 Louisiana and New Jersey saw OPEB liability reductions of $2 billion and $11 billion, respectively, after adopting an EGWP in 2012.36 Connecticut also adopted an EGWP in addition to amending eligibility requirements in 2011, which reduced its OPEB liability by $4.9 billion.37
In 2013, 13 states accounted for 81 percent of the nation’s total OPEB liabilities.
• Change in health care cost trend. Owing to lower-than-expected rates of growth in health care spending—annual rates were about 5 percentage points lower than expected between 2010 and 2013—actuaries reported lower levels of health care spending in their 2013 OPEB valuations.31 For example, California, Georgia, and Massachusetts—representing over $115 billion in state OPEB liabilities in 2013—cite lower-than-expected health care claims costs in recent valuation reports as a reason that reported OPEB liabilities were either reduced or grew less than the rate of inflation.32 As a result, realized costs—which serve as the base for projecting future costs and, in turn, reported liabilities—have been lower than expected.33
• Impact of changes to retiree health plan eligibility and state premium contribution policies. Several states that experienced lower OPEB liabilities adopted changes to criteria for eligibility and premium contributions related to retiree health plan coverage. All other factors being equal, when these changes apply to current workers and retirees, they have a greater e�ect on OPEB liabilities than does a change a�ecting only newly hired workers. Further, in 2011, West Virginia capped the growth of its contribution to health premiums for eligible retirees by 3 percent annually, shielding itself from the full e�ect of annual retiree health premium increases and lowering its liabilities by $2.6 billion.34 In states where retiree health plan eligibility changes apply primarily to newly hired workers, the impact of these changes is less significant because fewer individuals are a�ected by them.

7
• Changes to actuarial assumptions. Even small changes to actuarial assumptions can have a significant impact on reported liabilities. Many actuarial assumptions are based on historical data; however, assumed rates of return on invested assets, or discount rates, are primarily based on whether the state sets aside assets to pre-fund its OPEB liabilities.47 (See “Glossary” box.) Because pre-funding can lower long-term costs by generating investment returns on the money set aside, states that pre-fund can use a higher discount rate than states that do not. As a result, those that adopt pre-funding policies can expect decreases in OPEB liabilities.48 For instance, Michigan began pre-funding and raised its discount rate for large plans by 4 percentage points in 2012, which contributed to the drop in its reported liabilities by nearly half from 2010 to 2013, adjusting for inflation.49 West Virginia also saw its total OPEB liability drop 58 percent from 2010 to 2013, adjusting for inflation. The state made changes to its policies on health plan premium contributions and raised its assumed discount rate from 3.6 percent to 6.1 percent in connection with a decision to pre-fund.50
In addition to assumed discount rates, other factors, including demographic assumptions, will a�ect reported OPEB liabilities moving forward. Accounting for these shifts could increase OPEB liabilities if actuaries assume benefits will be paid out over a longer period, although this may be o�set by increasingly deferred retirement ages, which also result from increased life spans.
The Medicare Program
Medicare is a federal health insurance program for individuals 65 or older, as well as younger adults with disabilities and/or end-stage kidney disease.38 The Medicare program includes four distinct types of health insurance coverage:
• Medicare Part A covers inpatient hospital stays, nursing home care, hospice care, and some home health care.39 If a retiree paid into the Medicare program while he or she worked, the individual is eligible for this benefit premium-free.40
• Medicare Part B, an optional benefit, covers preventive care, approved outpatient care services, and medical supplies.41 Beneficiaries pay a monthly premium on a sliding scale based on income, commonly through a deduction from their Social Security benefit check.42
• Medicare Part C (Medicare Advantage) is a managed care plan option that combines Part A, Part B, and sometimes Part D benefits.43 Participants choose plans o�ered by commercial insurers, which are required to cover the same benefits as Parts A and B at a minimum but may also include lower cost-sharing responsibilities and/or Part D prescription drug benefits.44
• Medicare Part D, typically provided through a commercial insurance plan, is an optional benefit for prescription drug coverage; it commonly requires recipients to pay an additional monthly premium.45
In addition to the Medicare benefits described above, many retirees also purchase Medicare supplemental insurance, or Medigap, to pay for services not covered by Medicare Parts A and B, as well as all or a portion of Medicare’s coinsurance and deductibles.46

8
GASB Updates on OPEB Accounting Standards
Starting with fiscal years beginning after June 15, 2016, the Governmental Accounting Standards Board will implement new and expanded requirements for reporting on the financial standing of states’ programs on other post-employment benefits (OPEB).51 The updated standards will make comparative analysis of OPEB plans more feasible and increase transparency around state OPEB liabilities as well as public o¯cials’ understanding of OPEB plans’ financial health.52 These requirements will include:
• Greater uniformity in actuarial assumptions. By requiring actuaries to use specific actuarial methodologies when projecting costs and calculating liabilities, the new standards will increase the ability to compare financial statements across states.53 For instance, all states will be required to use a standard method of calculating the present value of benefits.54 Many states presently use a variety of methods, resulting in di¯culties comparing states’ liabilities and funded ratios.55 The discount rate, one of the most important economic assumptions used in the valuation, will now be determined by reference to a specific methodology, improving comparability.56
• New disclosures on OPEB investment trust practices and governance. States will be required to report descriptive information on OPEB plan governance (including the composition of the boards overseeing OPEB plans), the types of state retirees covered by each OPEB plan, and the benefits each plan provides.57 States will also be required to disclose OPEB plan investments, their rate of return, and the state policies governing those investments.58
• Additional financial statements. GASB will require state governments to publish additional financial statements in the state Comprehensive Annual Financial Report to provide stakeholders with more comprehensive OPEB plan data.59 These will include detailed OPEB financial data and investment gains and losses for the 10 most recent fiscal years, allowing stakeholders to have longitudinal data in one place to better study trends.60
As more states move to pre-fund their unfunded OPEB liabilities (the cost of benefits promised to current and future retirees that are not covered by existing assets), this additional information will assist the public in evaluating plan governance and the e�ectiveness of a plan’s investment strategy.
In 2013, states spent approximately $18.4 billion funding their OPEB programs ... less than 2 percent of state-generated revenue.

9
Annual state OPEB spendingMost states’ current spending on OPEB programs is a relatively small proportion of the total revenue they have available from their own sources. However, if they contributed the full actuarially determined amount to a trust fund, it would be more than double their current cash payments and would exceed spending on active state employee health premiums. States must weigh current budget demands against the pressure to reduce unfunded OPEB liabilities by considering pre-funding them.
Annual state expendituresIn 2013, states spent approximately $18.4 billion funding their OPEB programs. This amount was less than 2 percent of state-generated revenue, slightly lower than active state employee premium spending, and much lower than Medicaid, the state’s largest health care expenditure. Individual state spending on OPEB as a percentage of own-source revenue varied widely, from 6 percent in Alaska to less than 1 percent in 25 states.
These numbers reflect states’ actual expenditures for OPEB, which represent how much states paid that year for health insurance and other benefits for current retirees and can also include spending to pre-fund liabilities for these benefits. For states that pay the cost of retiree benefits each year without pre-funding, actual OPEB expenditures are a close approximation of annual spending on retiree health insurance and other benefits.61 For states that set aside assets toward funding the promises they’ve made to retirees, actual OPEB expenditures are greater than annual costs because these expenditures include funding for future years. 62 (See Figure 2.)
Annual required contributionsIn addition to reporting OPEB assets, liabilities, and actual expenditures, states must also report the annual required contribution.63 (See “Glossary” box.) The ARC consists of the cost of benefits earned in the current year plus an additional amount to fully fund the state’s OPEB liability over time.64 The ARC is an accounting metric and disclosure requirement defined by the GASB and calculated by each state’s actuary.65 States that pay the ARC can cut long-term costs substantially because the interest they are likely to earn when investing more money over the long term can be applied to o�set their liabilities.66
In 2013, the national aggregate ARC was $48 billion; actual state expenditures added up to only 39 percent of the ARC. (See Appendix C.) Only three states contributed their entire ARC in 2013: Arizona, Rhode Island, and Utah. When these states contribute their ARC, GASB accounting standards allow them the advantage of assuming a higher return on their invested funds when calculating OPEB liabilities, thereby significantly decreasing these liabilities.67 States that do not pre-fund their OPEB liabilities are required to assume a lower return on investment when reporting OPEB liabilities. States that demonstrate a commitment to pre-funding by gradually ramping up their ARC payments are also allowed to use a higher “blended” assumed rate of return.68
If the remaining states had set aside funding to pay for these long-term benefits based on ARC calculations, their total payments in 2013 would have represented 4 percent of their state-generated revenue—more than double their actual expenditures. Although the national aggregate ARC payment represents a relatively low percentage of state-generated revenue, it varies significantly by state. The ARC payments for Hawaii and New Jersey represented more than 10 percent of each of these states’ own-source revenue in 2013.

10
Provisions of state retiree health insurance plans Although actuarial methods and assumptions are critical to understanding state spending and liabilities for retiree health care, the design of retiree health benefits is also important. States have wide latitude in deciding what benefits to o�er (or even whether to o�er health coverage to retirees), who is eligible, and how the retiree and the state should share the cost of the premium.69 States must decide these policies for two distinct types of retirees: Medicare-eligible retirees and retirees who are not yet eligible for Medicare, or “early retirees” for the purposes of this report.
States periodically modify their policies over time and decide whether these changes apply to current retirees and/or future retirees (i.e., current state workers). In practical terms this means, for example, that we say 48 states (Indiana and Nebraska excluded) provide health insurance coverage or access to coverage to their Medicare-eligible retirees but only 47 states (Idaho, Indiana, and Nebraska excluded) o�er retiree coverage to a public worker hired today who will retire sometime in the future. In the section that follows (including Figures 3 and 4) we report on the benefits for recent retirees, as an indicator of current costs and reported liabilities. Following Figure 4 we report on benefit data that pertains to retirement benefit provisions o�ered to public workers hired today and retiring sometime in the future.
These choices are not made in a vacuum. They are a�ected by fiscal and political pressures and often subject to collective bargaining between states and state employee unions.72 States also use retiree health benefits in an e�ort to help attract and retain talented workers, an additional factor that states consider when weighing costs against the design of benefits.73 Because of these factors and others, state policies change over time. For instance, 35 states have taken advantage of changes to the federal Medicare program that allow them to continue providing supplemental Medicare coverage to eligible retirees at a lower cost. States’ retiree health insurance programs will continue to evolve as states face new challenges and opportunities.74
State contributions to premiums for retiree health insurance plansOur analysis shows that 39 states contribute a portion of the premium for early retirees’ comprehensive health insurance, and the same number—although not necessarily all the same states—provide a portion of the premium for wraparound coverage for Medicare-eligible retirees. Both are significant because comprehensive coverage is more expensive than wraparound coverage.75 However, there are more Medicare-eligible retirees, and these older retirees are likely to have more health care needs than do early retirees. (See “Early Retirees and the A�ordable Care Act” box.) The amount of each state’s premium contribution and the criteria that each state uses to determine that contribution vary. Regardless of how the subsidy is calculated, retirees make up the di�erence between the state’s contribution and the total premium, in addition to paying for any out-of-pocket costs such as deductibles or copays.76
Cost of Early Retiree vs. Medicare-Eligible Retiree Coverage
Although early retirees are likely to be in better health and therefore less expensive to insure than older Medicare-eligible retirees, states pay a higher per-person cost for early retirees than they do for Medicare-eligible retirees.70 This is because federal Medicare covers a large portion of the cost to cover Medicare-eligible retirees.71

11
Premium contribution method. States use various methods to determine how much they contribute to premiums for early and Medicare-eligible retiree health insurance. (See Figure 3.) For the purposes of this analysis, we list and discuss state contribution methods only for Medicare-eligible retirees, although most states use the same premium contribution method for both categories.84
• Fixed-dollar contributions. Twelve states o�er a fixed-dollar contribution toward retirees’ health premiums. Retirees pay the di�erence between the fixed subsidy and actual premiums for their benefits. Because they are shielded from health plan premium increases, states that structure contribution options in this manner have somewhat more predictable retiree health insurance costs from year to year.
• Contribution tied to health insurance premium. Twenty-seven states tie their retiree premium contribution to the cost of health insurance, and therefore have less control over how much their contribution rises each year. States pay either a percentage of the premium for the plan selected or a fixed price set to change when health insurance premiums change. If premium costs increase, states using this contribution method must increase their spending, decrease their contribution, or introduce lower-cost plans.
• Coverage with no state contribution. Nine states do not make a contribution toward premiums for their retirees.85
Early Retirees and the A�ordable Care Act
Before the Patient Protection and A�ordable Care Act (ACA), employer-sponsored health insurance coverage for early retirees was particularly valuable. Such retirees who were no longer eligible for health coverage through their former employer, not eligible for coverage through their spouse, and not yet eligible for Medicare had to purchase coverage on the individual health insurance market if they wanted to be covered.77 However, because retirees of any age are more likely than active employees to have chronic health conditions, they could be denied coverage due to pre-existing conditions before implementation of the ACA’s “guaranteed issue” provision (which prohibits health insurance companies from denying coverage due to an applicant’s pre-existing condition).78 This was not an issue with employer-sponsored early retiree health insurance, however, as it has always been guaranteed issue.79
State retiree health insurance coverage—even in the absence of a state contribution to the premium—is valuable to early retirees in several ways. First, premiums are lower than they are on the individual market, a result of participation in a large group insurance pool that has considerable negotiating power with insurers.80 Second, early retirees with access to the same health insurance and total premium o�ered to their states’ active employees also benefit from an implicit subsidy.81 Based on historical data and trends, these early retirees have higher health care costs, on average, than active employees.82 However, states that o�er the same premium to early retirees and active employees create a “blended” premium, with active employees paying a higher premium and early retirees a lower one than they would otherwise.83

12
No coverageCoverage with no state contribution
Fixed-dollar contribution
Contribution tied to total premium cost
AZ NM
NDMT
WY
ID
UT
OR
WA
NV
IA
MN
TN
KY
OHPA
IN
LA
MS GA
NC
VA
SC
IL
FL
AL
WI
AK
CA
TX
OK
KS
NE
COMO
AR
NY
ME
WV
SDMI
HI
Figure 3
Most States Tie Contributions to Premiums’ Total CostState premium contribution method for Medicare-eligible retirees
Notes: Nevada provides its Medicare-eligible retirees access to health coverage through a private exchange.
Source: Analysis of publicly available data on retiree health benefit plans, verified by states
© 2016 The Pew Charitable Trusts
No coverageCoverage with no state contribution
Fixed-dollar contribution
Contribution tied to total premium cost
AZ NM
NDMT
WY
ID
UT
OR
WA
NV
IA
MN
TN
KY
OHPA
IN
LA
MS GA
NC
VA
SC
IL
FL
AL
WI
AK
CA
TX
OK
KS
NE
COMO
AR
NY
ME
WV
SDMI
HI
Premium contribution method and OPEB liabilities. The methods states use to calculate their contributions to retiree health insurance premiums a�ect their OPEB liabilities in addition to other factors, such as whether the state also manages local government retiree health care benefits. 86 (See Appendix A: Methodology.) Project researchers compared states’ 2013 OPEB liabilities to 2013 state personal income, a ratio that shows these liabilities in relation to the potential resources states have on hand to pay for these costs.87 Figure 4 shows that states that tied their premium contribution to the cost of health care generally had the highest OPEB liabilities as a percentage of state personal income.
States that provide a fixed-dollar premium contribution are clustered around the middle of the range of liabilities. Setting a fixed-dollar premium contribution helps states manage their share of retiree health premium costs by keeping their contribution stable. States that provided no premium contribution to retirees in 2013 tended to have the lowest liabilities as a percentage of state personal income. Although these states do not subsidize coverage, they may have liabilities from the costs of administering the health plans, o�ering nonhealth OPEB benefits (such as life insurance or disability insurance), continuing benefits for “grandfathered” retirees who may still be eligible for premium contributions, or implicitly subsidizing early retiree health premiums. (See “Early Retirees and the A�ordable Care Act” box.)

13
Notes: Consistent with Figure 3, data reflects the benefits for recent retirees as an indicator of current costs and reported liabilities. As of February 2015, five states have made changes to their contribution method for new hires when they become Medicare-eligible retirees: Idaho provides no coverage, Kentucky provides a fixed-dollar contribution, and Nevada, Oregon, and West Virginia provide coverage but no contribution. Nebraska does not report an OPEB liability. Nevada provides access to coverage for its Medicare-eligible retirees through a private exchange.
Source: Analysis of data from states’ Comprehensive Annual Financial Reports and publicly available information on retiree health benefit plans verified by states (see Appendix A), U.S. Census data, actuarial reports and valuations, other public documents, or from plan o¯cials
© 2016 The Pew Charitable Trusts
Figure 4
State Premium Contribution Methods for Medicare-Eligible Retirees Drive OPEB Liabilities2013 OPEB liabilities as a percentage of state personal income by premium contribution method
Nebraska
0 5% 10% 15% 20% 25%
OklahomaIndianaSouth DakotaIdahoIowaNorth DakotaMinnesotaUtahOregonKansasTennesseeMississippiWyomingColoradoArizonaWisconsinFloridaMontanaNevadaMissouriRhode IslandVirginiaArkansasWashingtonMarylandPennsylvaniaMaineNew HampshireKentuckyMassachusettsCaliforniaLouisianaWest VirginiaGeorgiaNew MexicoOhioTexasVermontSouth CarolinaMichiganNew YorkAlabamaNorth CarolinaIllinoisConnecticutNew JerseyDelawareHawaiiAlaska
OPEB liabilities as a percentage of state personal income
Tied to premium cost
Fixed contribution
Coverage with no contributionor no coverage
0.4%
0.2%
0.9%
0.9%
0.4%
0.4%
0.4%
0.4%
0.2%
0.2%
0.0%
0.7%
21.8%
14.6%
13.6%
10.4%
9.4%
7.1%7.1%
6.5%
6.3%
6.0%
5.9%
5.3%
5.3%
5.2%
5.1%5.0%
4.5%
4.4%
4.1%4.1%
3.9%
3.8%
3.2%
2.8%
2.2%
2.0%
1.6%
1.6%
1.4%
1.2%
1.1%
47.4%
0.9%
0.9%
0.8%
0.6%
0.4%
0.0%

14
Retirement benefit provisions may di�er for workers hired todayThe previous analyses looked at benefits for recent retirees as the main driver of current costs. But in light of unfunded OPEB obligations and budget challenges, state policymakers periodically change benefit provisions. The following sections look at the retirement benefit provisions for a public worker hired today. In some instances these benefit provisions have been in place for years, in others they represent recent policy changes. See Appendix D for more data on retiree health benefit provisions for state employees.
Figure 5
Most States Prorate Their Contributions to Retiree PremiumsProrating policies for these contributions
Num
ber o
f sta
tes
0
5
10
15
20
25
30
ProratingNo proratingNo contribution
Early retiree Medicare-eligible retiree
AlabamaArizonaCaliforniaColoradoConnecticutDelawareGeorgiaHawaiiIllinoisIowa*KentuckyLouisianaMarylandMichiganMissouriNew JerseyNew MexicoNew YorkNorth CarolinaNorth DakotaOhioPennsylvaniaRhode IslandSouth CarolinaTennesseeTexasVermontVirginiaWyoming
AlabamaAlaskaArizonaCaliforniaColoradoDelawareGeorgiaHawaiiIllinoisKentuckyLouisianaMaineMarylandMichiganMissouriNew JerseyNew MexicoNew YorkNorth CarolinaNorth DakotaOhioPennsylvaniaSouth CarolinaTennesseeTexasVermontVirginiaWyoming
ArkansasConnecticutMassachusettsNew HampshireOklahomaRhode IslandWashington
ArkansasMaineMassachusettsNew HampshireOklahoma
AlaskaFloridaIdahoIndianaKansasMinnesotaMississippiMontanaNebraskaNevadaOregonSouth DakotaUtahWashingtonWest VirginiaWisconsin
FloridaIdahoIndianaIowaKansasMinnesotaMississippiMontanaNebraskaNevadaOregonSouth DakotaUtahWest VirginiaWisconsin
29
5
1615
7
28
* Iowa provides a credit for unused sick leave.
Note: This reflects the most recent set of benefits as instituted by states at the time of our data collection as of February 2015. See Appendix D to learn to which retirees these data are applicable, by state.
Source: Analysis of publicly available data on retiree health benefit plans, verified by states. (See Appendix A.)
© 2016 The Pew Charitable Trusts

15
Figure 6
State Premium Prorating Formulas Vary SignificantlySelected examples for Medicare-eligible retirees
Note: This reflects the most recent set of benefits as instituted by states at the time of our data collection as of February 2015. See Appendix D to learn to which retirees these data are applicable, by state.
Source: Analysis of publicly available data on retiree health benefit plans, verified by states. (See Appendix A.)
© 2016 The Pew Charitable Trusts
Stat
e pr
emiu
m c
ontr
ibut
ion
Years of service
01 2 3 4 6 8 10 12 14 16 18 20 22 24 26 285 7 9 11 13 15 17 19 21 23 25 27 29 30 31 32
30%
50%
60%
80%
100%
20%
10%
40%
70%
90%
Alaska Maine Michigan
Prorating state premium contributions. Thirty-one states have adopted policies to prorate their premium contributions to early or Medicare-eligible retirees based on a formula that takes into account retirees’ years of service (YOS), age, or other factors.88 Prorating provides incentives to state retirees to retire later or select less comprehensive health plans, often decreasing costs to the state and potentially to the retiree.89 It also aligns the value of this significant benefit and the contribution the participant made to the sponsoring agency while employed there. Figure 5 shows which states provide a premium contribution for their early and Medicare-eligible retirees and which prorate those contributions. Most states that use prorating apply it to both early and Medicare-eligible retirees.
Figure 6 shows how prorating formulas vary for Medicare-eligible retirees in three states that use a retiree’s years of service to calculate the percentage of premium the state will contribute. States such as Alaska use a tiered approach to prorating. Once Alaska state retirees reach 10 years of service, they are eligible for a 70 percent premium contribution. The contribution increases 5 percentage points for each additional five years, maxing out at a 90 percent contribution with 30 years of service. Maine also uses this tiered approach, but after 10 years of service it increases its contribution by 25 percentage points for every five years, up to a 100 percent premium contribution. In addition, a Maine state employee qualifies for coverage—albeit with no state premium contribution—in his or her first year of service, which is not the case with an Alaska state employee. Michigan increases its premium contributions by 3 percentage points with each year of service until maxing out at 27 years.

16
Eligibility criteriaStates set minimum eligibility criteria for retiree health plan coverage based on age and years of service. For about half of the states, minimum age and years of service eligibility criteria were tied to retiree pension eligibility. The remaining states set their health and pension benefit eligibility criteria separately or did not report data.
Age eligibility requirements. Twenty states set minimum eligibility ages for early retirees ranging from 50 to 62. For these states, the median age for benefit eligibility is 55. In contrast, 29 states do not set a specific minimum age for eligibility. For example, Texas applies the “Rule of 80,” meaning that employees may retire at any time so long as their age and years of service add up to 80. Similarly, while Georgia does not have a minimum age requirement, employees must have worked for the state at least 10 years to be eligible for benefits.
Minimum years of service requirements. States usually require retirees to work for the state for a minimum number of years before they are eligible for health care coverage, whether such coverage is state-subsidized or not. Of the 49 states o�ering coverage to early retirees, 46 have years of service requirements for coverage eligibility.90 Forty-seven states o�er coverage or access to coverage to Medicare-eligible retirees, and 39 of these have minimum years of service requirements for such coverage eligibility.91
States also set minimum years of service requirements that retirees must meet to receive a state premium contribution. For the states that o�er a premium contribution, the median number of years of service required for premium contribution eligibility is 10 years for both early and Medicare-eligible retirees. (See Figure 7.) Although most states have the same minimum eligibility criteria for both early and Medicare-eligible retirees, Alaska, Colorado, Iowa, North Dakota, and Washington do not.
• Early retirees. Thirty-four states contribute to early retirees’ health insurance premiums with minimum years of service requirements. This requirement ranges from three years in North Dakota to 25 years in Maine and New Jersey. The remaining 15 states do not o�er premium contributions for their early retirees. (Idaho does not o�er coverage to its early retirees hired after June 30, 2009.)
• Medicare-eligible retirees. Thirty-five states contribute to their Medicare-eligible retirees’ health insurance premiums after these retirees meet minimum years of service requirements, ranging from one month in North Dakota to 25 years in New Jersey. The remaining 12 states do not o�er a premium contribution for Medicare-eligible retirees (Idaho, Indiana, and Nebraska do not o�er coverage for their Medicare-eligible retirees).
Dependent coverage. Many states o�er health insurance to retirees’ dependents and survivors, increasing the number of individuals the state covers and raising state costs. (See Figure 8.) These costs increase when the state contributes toward dependent health insurance premiums. (See “Glossary” box.) Forty-eight states o�er health insurance coverage or access to coverage to early retirees’ dependents, and 46 states o�er such coverage to Medicare-eligible retirees’ dependents.92 Among these states, 25 provide a premium contribution to early retirees’ dependents, and the same number—although not necessarily all the same states—provide a premium contribution to Medicare-eligible retirees’ dependents. The remaining states do not contribute toward dependent premiums.

17
Figure 7
States Require a Median of 10 Years of Service for Premium Contribution EligibilityMinimum years of service required
Note: Florida, Idaho, Indiana, Kansas, Minnesota, Mississippi, Montana, Nebraska, Nevada, Oregon, South Dakota, Utah, West Virginia, and Wisconsin either provide coverage but do not make contributions toward retiree health care premiums or do not provide coverage to either their early or Medicare-eligible retirees. This reflects the most recent set of benefits as instituted by states at the time of our data collection as of February 2015. See Appendix D to learn to which retirees these data are applicable, by state.
Source: Analysis of publicly available data on retiree health benefit plans, verified by states. (See Appendix A.)
© 2016 The Pew Charitable Trusts
Minimum years of service needed for premium contribution eligibility
0 5 10 15 20 25
IowaNorth Dakota
ColoradoWyoming
New MexicoLouisianaArkansas
ArizonaWashington
OklahomaVermont
TexasNorth Carolina
New YorkMissouri
MichiganMassachusetts
MarylandIllinoisHawaii
GeorgiaCaliforniaAlabama
AlaskaVirginia
TennesseeSouth Carolina
KentuckyDelaware
ConnecticutRhode IslandPennsylvania
OhioNew Hampshire
New JerseyMaine
Early retiree
Medicare ageMed
ian

18
No coverage
Coverage with premium contributionCoverage with no premium contribution
AZ NM
NDMT
WY
ID
UT
OR
WA
NV
IA
MN
TN
KY
OHPA
IN
LA
MS GA
NC
VA
SC
IL
FL
AL
WI
AK
CA
TX
OK
KS
NE
COMO
AR
NY
ME
WV
SDMI
HI
Figure 8
Most States O�er Coverage, Premium Contributions for Retirees’ DependentsCoverage of Medicare-eligible retiree dependents
Health and prescription coverage type for Medicare-eligible retireesStates have di�erent health plan coverage structures for Medicare-eligible retirees depending on how they choose to coordinate their benefits with the federal Medicare program, which can a�ect their costs. In addition to the contribution some states make to the cost of state-sponsored coverage, several states also make a contribution toward Medicare-eligible retirees’ Medicare Part B premiums.
Coverage of health benefits. The 47 states providing health coverage or access to coverage to Medicare-eligible retirees o�ered Medicare wraparound health plans to Parts A and B, Medicare Advantage (Part C), or both.93 (See Figure 9 and “The Medicare Program” box.)
• Medicare wraparound plans. Thirty-eight states o�er medical coverage or access to medical coverage to their Medicare-eligible retirees through some type of Medicare wraparound plan. In 25 of these states, this is the only coverage option o�ered by state governments to these retirees. Medicare wraparound coverage includes plans that pay for services not covered by Medicare and plans that reduce Medicare cost sharing, such as deductible and coinsurance payments.94 Because these plans do not pay for costs reimbursed by Medicare, retirees must enroll in Medicare to receive comprehensive health coverage.
No coverage
Coverage with premium contributionCoverage with no premium contribution
AZ NM
NDMT
WY
ID
UT
OR
WA
NV
IA
MN
TN
KY
OHPA
IN
LA
MS GA
NC
VA
SC
IL
FL
AL
WI
AK
CA
TX
OK
KS
NE
COMO
AR
NY
ME
WV
SDMI
HI
Note: Dependents of early retirees in Alaska, Indiana, and Nebraska are eligible for coverage with no premium contribution. In Iowa, such dependents are eligible for coverage with a premium contribution. Nevada o�ers access to coverage for Medicare-eligible dependents through a private exchange. This reflects the most recent set of benefits as instituted by states at the time of our data collection as of February 2015. See Appendix D to learn to which retirees these data are applicable, by state.
Source: Analysis of publicly available data on retiree health benefit plans, verified by states. (See Appendix A.)
© 2016 The Pew Charitable Trusts

19
No coverageMedicare Advantage and wraparoundMedicare Advantage only
Data unavailableWraparound only
AZ NM
NDMT
WY
ID
UT
OR
WA
NV
IA
MN
TN
KY
OHPA
IN
LA
MS GA
NC
VA
SC
IL
FL
AL
WI
AK
CA
TX
OK
KS
NE
COMO
AR
NY
ME
WV
SDMI
HI
• Medicare Advantage health plans. Twenty-one states o�er medical coverage or access to medical coverage to their Medicare-eligible retirees through Medicare Advantage (MA) plans designed to cover benefits under Medicare Parts A and B as well as provide wraparound coverage. This is the only type of coverage o�ered to Medicare-eligible retirees by eight of those 21 states.95 With MA plans, states contract with an insurance company to o�er group health insurance to their retirees.96 The insurance company receives a per-enrollee, per-month payment from the federal Centers for Medicare & Medicaid Services (CMS), and the employer (and potentially the retiree, depending on cost-sharing provisions) pays the insurance company a premium for any additional services not covered by Medicare.97 States benefit from o�ering MA plans because they are generally less expensive than individual wraparound plans.98 However, states may choose not to o�er an MA plan because, while they still make key decisions regarding participating insurance companies and plans o�ered, CMS regulates MA plans, so states have less control over the coverage they provide compared with wraparound plans.99
Figure 9
States’ Methods for Covering Medicare-Eligible Retirees VaryTypes of health coverage
Note: Kentucky provides health coverage for Medicare-eligible retirees, but data on coverage type is unavailable. This reflects the most recent set of benefits as instituted by states at the time of our data collection as of February 2015. See Appendix D to learn to which retirees these data are applicable, by state.
Source: Analysis of publicly available data on retiree health benefit plans, verified by states. (See Appendix A.)
© 2016 The Pew Charitable Trusts
No coverageMedicare Advantage and wraparoundMedicare Advantage only
Data unavailableWraparound only
AZ NM
NDMT
WY
ID
UT
OR
WA
NV
IA
MN
TN
KY
OHPA
IN
LA
MS GA
NC
VA
SC
IL
FL
AL
WI
AK
CA
TX
OK
KS
NE
COMO
AR
NY
ME
WV
SDMI
HI
20
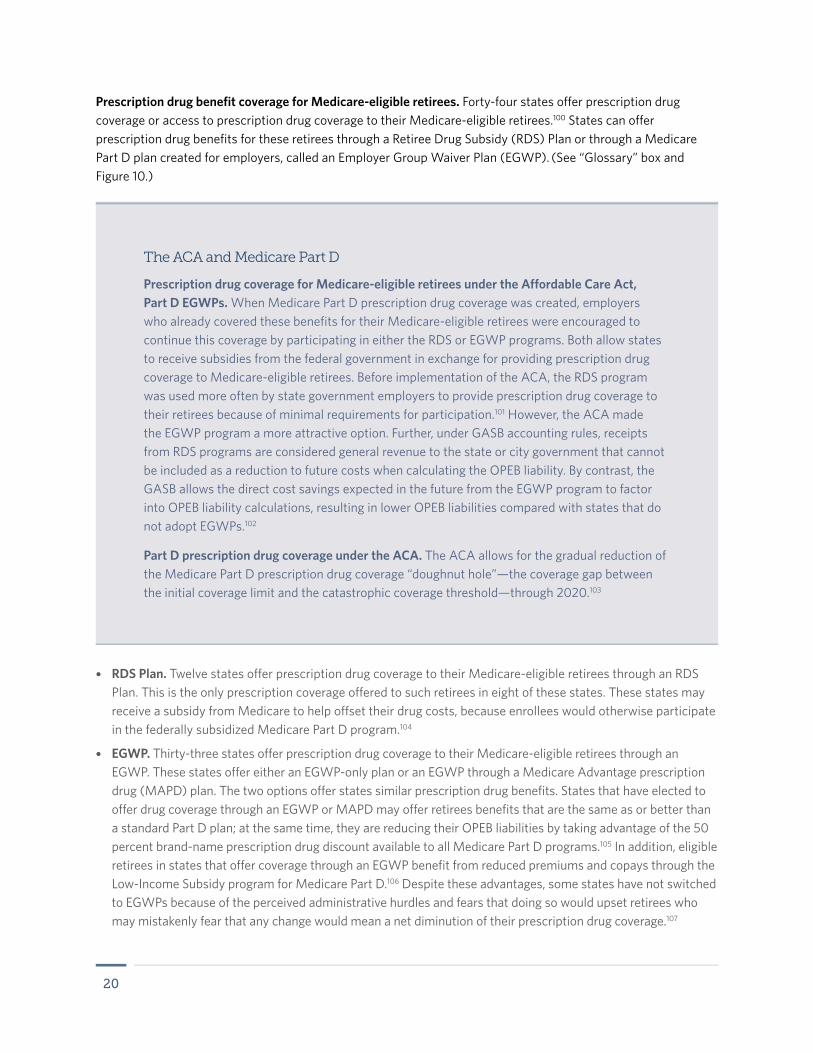
Prescription drug benefit coverage for Medicare-eligible retirees. Forty-four states o�er prescription drug coverage or access to prescription drug coverage to their Medicare-eligible retirees.100 States can o�er prescription drug benefits for these retirees through a Retiree Drug Subsidy (RDS) Plan or through a Medicare Part D plan created for employers, called an Employer Group Waiver Plan (EGWP). (See “Glossary” box and Figure 10.)
The ACA and Medicare Part D
Prescription drug coverage for Medicare-eligible retirees under the A�ordable Care Act, Part D EGWPs. When Medicare Part D prescription drug coverage was created, employers who already covered these benefits for their Medicare-eligible retirees were encouraged to continue this coverage by participating in either the RDS or EGWP programs. Both allow states to receive subsidies from the federal government in exchange for providing prescription drug coverage to Medicare-eligible retirees. Before implementation of the ACA, the RDS program was used more often by state government employers to provide prescription drug coverage to their retirees because of minimal requirements for participation.101 However, the ACA made the EGWP program a more attractive option. Further, under GASB accounting rules, receipts from RDS programs are considered general revenue to the state or city government that cannot be included as a reduction to future costs when calculating the OPEB liability. By contrast, the GASB allows the direct cost savings expected in the future from the EGWP program to factor into OPEB liability calculations, resulting in lower OPEB liabilities compared with states that do not adopt EGWPs.102
Part D prescription drug coverage under the ACA. The ACA allows for the gradual reduction of the Medicare Part D prescription drug coverage “doughnut hole”—the coverage gap between the initial coverage limit and the catastrophic coverage threshold—through 2020.103
• RDS Plan. Twelve states o�er prescription drug coverage to their Medicare-eligible retirees through an RDS Plan. This is the only prescription coverage o�ered to such retirees in eight of these states. These states may receive a subsidy from Medicare to help o�set their drug costs, because enrollees would otherwise participate in the federally subsidized Medicare Part D program.104
• EGWP. Thirty-three states o�er prescription drug coverage to their Medicare-eligible retirees through an EGWP. These states o�er either an EGWP-only plan or an EGWP through a Medicare Advantage prescription drug (MAPD) plan. The two options o�er states similar prescription drug benefits. States that have elected to o�er drug coverage through an EGWP or MAPD may o�er retirees benefits that are the same as or better than a standard Part D plan; at the same time, they are reducing their OPEB liabilities by taking advantage of the 50 percent brand-name prescription drug discount available to all Medicare Part D programs.105 In addition, eligible retirees in states that o�er coverage through an EGWP benefit from reduced premiums and copays through the Low-Income Subsidy program for Medicare Part D.106 Despite these advantages, some states have not switched to EGWPs because of the perceived administrative hurdles and fears that doing so would upset retirees who may mistakenly fear that any change would mean a net diminution of their prescription drug coverage.107

21
Medicare Part B premium contributions for Medicare-eligible retirees. As discussed above, despite having state-sponsored retiree health coverage, Medicare-eligible retirees must still enroll in—and pay a premium for—Medicare Part B health plans to receive comprehensive health coverage. In 2015, Medicare Part B premiums, determined by the federal government, ranged from $104.90 to $335.70 a month, based on the enrollee’s income; however, 94 percent of all Medicare enrollees paid the minimum premium.108 Some states—California, Connecticut, Hawaii, Maine, Nevada, New York, and Utah among them—contribute toward the Medicare Part B premiums for at least some Medicare-eligible retirees, in addition to any contribution they make toward the retirees’ wraparound coverage. California makes a fixed-dollar contribution toward its Medicare-eligible retirees’ wraparound premium. If that contribution exceeds the cost of this premium, the retiree can apply the excess toward his or her Medicare Part B premium. Nevada provides a contribution toward Medicare Part B premiums if the retiree is not eligible for premium-free Medicare Part A or if the retiree covers non-Medicare-eligible dependents and remains on the early retiree plan.
Figure 10
Many States O�er EGWPs for Medicare-Eligible RetireesBreakdown of prescription drug coverage type
Note: Data on prescription drug coverage type for retirees in Kentucky, Nevada, and Rhode Island were not available. This reflects the most recent set of benefits as instituted by states at the time of our data collection as of February 2015. See Appendix D to learn to which retirees these data are applicable, by state.
Source: Analysis of publicly available data on retiree health benefit plans, verified by states. (See Appendix A.)
© 2016 The Pew Charitable Trusts
No coverageEmployer Group Waiver Plan and Retiree Drug Subsidy Plan
Retiree Drug Subsidy Plan only
Employer Group Waiver Plan only
Data unavailable
AZ NM
NDMT
WY
ID
UT
OR
WA
NV
IA
MN
TN
KY
OHPA
IN
LA
MS GA
NC
VA
SC
IL
FL
AL
WI
AK
CA
TX
OK
KS
NE
COMO
AR
NY
ME
WV
SDMI
HI
No coverageEmployer Group Waiver Plan and Retiree Drug Subsidy Plan
Retiree Drug Subsidy Plan only
Employer Group Waiver Plan only
Data unavailable
AZ NM
NDMT
WY
ID
UT
OR
WA
NV
IA
MN
TN
KY
OHPA
IN
LA
MS GA
NC
VA
SC
IL
FL
AL
WI
AK
CA
TX
OK
KS
NE
COMO
AR
NY
ME
WV
SDMI
HI

22
State changes to retiree health insurance plan provisionsAs states continued over the past decade to balance maintaining a competitive workforce with fiscal constraints, they have refined their plan provisions. (See Appendix D.) Researchers analyzed changes to the criteria states use to determine eligibility for retiree health insurance plan coverage and state premium contributions for either early or Medicare-eligible retirees since 2000 and found the following:
• More than a dozen states changed the minimum age eligibility requirement, minimum years of service requirement for coverage, or both. In many cases, these modifications were tied to changes in state pension benefits.
• Based on our analysis, more than a dozen states also changed the minimum years of service requirement for state premium contribution eligibility or reduced the maximum state premium contribution.
• In addition, at least 10 states instituted prorating formulas that varied their levels of premium contribution based on years of service, or altered existing prorating formulas. Thirty-one states now use prorated benefit formulas for either early or Medicare-eligible retirees.
• At least five states—Alaska, Nevada, Oregon, Utah, and West Virginia—have eliminated state contributions to retiree health insurance premiums, whether for early or Medicare-eligible retiree coverage. These states continue to provide retirees with access to health care coverage.
• Idaho eliminated both state retiree health insurance plan coverage and state premium contributions for Medicare-eligible retirees.
ConclusionWhile only 28 percent of large employers in the U.S. o�er retiree health benefits, 49 states continue to include these benefits as a key part of state compensation programs, with years of service and other eligibility requirements set by the states. Many states also contribute to these retirees’ health insurance premiums and set eligibility requirements for these contributions. This commitment over many years has grown into a large liability for states that the GASB recently addressed, imposing reporting requirements that require more accountability and transparency from participating states.
States have several options for addressing these liabilities, including establishing explicit policies to pre-fund their OPEB liabilities, amending retiree health plan provisions, and adopting cost-saving programs to provide medical and prescription drug coverage to Medicare-eligible retirees. States have accelerated their e�orts in these areas, which have been aided over the past few years by a slowing in the growth of health care costs. However, as baby boomers retire in greater numbers and new high-cost, high-demand drugs come to market, costs may begin to rise at increased rates again.109
This 50-state report aims to assist policymakers and legislators in making di¯cult decisions about how best to use limited budget dollars by uncovering what strategies other states are trying and how successful they have been.

23
Appendix A: Methodology
Data sourcesOPEB liabilities, funded ratios, funding policies, actual expenditures, and annual required contributions. The main data sources for this project were the Comprehensive Annual Financial Reports (CAFRs) produced by each state for fiscal 2008-13. The CAFR is published annually and details the state’s financial status and other key state data. The Governmental Accounting Standards Board stipulates that the CAFR should include certain disclosures regarding other post-employment benefit finances.110 Because CAFRs contain standard information in a consistent format, they are a valuable source for data on state-run retirement systems. In addition to the CAFR, many states release the actuarial valuation for their OPEB plans.111 These are financial accounting reports that use actuarial methods and assumptions to calculate OPEB liabilities and fulfill GASB reporting requirements. In many cases, analysts found that the actuarial valuations o�ered more detailed data than did the state CAFRs and used these plan documents when available.
States primarily report costs of retiree health insurance benefits in their OPEB statements but may also include financial data on nonhealth benefits such as life and disability insurance. In addition, they may include financial data on OPEB for local retirees or teachers in localities where those plans are administered by the state or the state maintains a financial interest in them. In such instances, some benefit costs may be paid by a local school board, locality, or other nonstate entity.
Provisions of retiree health insurance plans. Project researchers collected data on provisions of retiree health insurance plans from various sources. When available, our primary sources were states’ OPEB actuarial valuations. These documents outline the calculations made to assess current and future costs of retiree health insurance plans and describe plan provisions. Researchers also used information in state and plan CAFRs as well as documents states make available to stakeholders, including current and future retirees, on their retirement plan and retiree benefit websites. These documents come in several forms, chief among which are annual reports and benefit guides. Finally, in some instances data were not available, and the writers contacted state o¯cials administering retiree health insurance plans or retirement systems directly.
Many states have multiple sets of eligibility rules for specific classes of employees such as teachers, firefighters, and elected o¯cials. Project researchers collected and analyzed health plan provisions for only the main retiree health plans for general state employees.
Accuracy and comprehensivenessTo ensure the accuracy of the data presented in this report, project researchers implemented numerous quality control measures. First, researchers identified and double-checked all instances in which data changed significantly over time in the OPEB financial data and in which there were significant outliers in the health plan provision data, as a means of identifying potential errors in the transcription or interpretation of data. In addition, benefit administrators and retirement and finance o¯cials in each state were given the opportunity to review OPEB and health plan provision data collected by project researchers for accuracy, and in many cases they o�ered useful feedback that was then incorporated into project data. This combined approach helps ensure that our research is based on well-vetted, accurate data.

24
Data analyses Our analysis focused on annual cash payments for the OPEB plans and cost drivers that a�ect spending on retiree health insurance benefits. While project researchers collected data on 167 OPEB plans, each state’s plans were aggregated to provide one set of OPEB numbers per state. Thus Massachusetts—which runs one OPEB plan for state and local employees—can be compared with Arkansas, which runs 22 OPEB plans.112 As a result, our analysis shows broad national trends.
Percent change in OPEB liabilities from 2010 to 2013. To calculate the percent change in each state’s OPEB liabilities from 2010 to 2013, researchers used aggregated data to get one value for each state’s OPEB liability in 2010 and 2013, and adjusted the aggregated 2010 number for inflation using the 2013 gross domestic product deflator from the Bureau of Economic Analysis.113
Funded ratios by state. Project researchers aggregated CAFR data on each OPEB plan to get one value for each state’s OPEB liabilities and OPEB assets. By dividing the total value of plan assets by the total liability, the research team arrived at each state’s funded ratio for OPEB.
State OPEB liabilities and state personal income. To calculate each state’s aggregate OPEB liabilities as a percentage of state personal income, project researchers compared the total actuarial accrued liabilities for all of a state’s OPEB plans in 2013 to the personal income data available online through the Bureau of Economic Analysis, adjusted to match each state’s fiscal year.114
State OPEB liabilities compared with state population. The research team compared states’ annual population estimates with their OPEB liabilities in 2013 to show that a small number of states represent a large portion of the national aggregate OPEB liability.115
State-generated revenue. The research team used State Government Finances data from the U.S. Census Bureau to calculate state-generated revenue for each state.116 Researchers used CAFR data, the Milliman Atlas of Public Employer Health Plans, and data from CMS to calculate the annual required contribution, active state employee health plan spending, and state Medicaid spending as a percentage of state-generated revenue.117
Percentage of annual required contribution paid. The research team used states’ aggregate actual expenditures for OPEB and annual required contributions to OPEB reported in state and plan CAFRs to calculate each state’s actual expenditures as a percentage of the annual required contribution.
Changes to retiree health insurance plans over time. Project researchers reviewed financial documents from 2010 onward as well as other sources to determine recent benefit provisions, generally applicable in or after 2000. In 18 states, documents used to analyze retiree health plan data described a single set of criteria to determine eligibility for coverage and the level of any premium contribution for retirees. For the remaining 32 states, multiple sets of criteria are described, varying by a worker’s date of hire, date of retirement, or vesting eligibility. For these states, we analyzed two representative sets of criteria: the most recent benefits applicable to a cohort of either new retirees or new hires, and a second set of criteria to provide a point of comparison for how benefits have changed in recent years. For each state, we presented the most recent data available as of February 2015.

25
Appendix B: 50-state OPEB financial data tables
Table B.1
State OPEB Liabilities and Funded Ratios, 2010-13
State 2010 liability (in thousands)
2013 liability (in thousands)
Funded ratio
2010 2011 2012 2013
Alabama $15,747,241 $12,459,751 5% 7% 9% 10%
Alaska $12,419,995 $17,403,632 50% 52% 47% 43%
Arizona $2,284,190 $2,201,974 69% 67% 68% 73%
Arkansas $1,857,585 $2,148,523 0% 0% 0% 0%
California $78,357,696 $80,312,348 0% 0% 0% 0%
Colorado $2,014,397 $2,135,758 15% 13% 13% 14%
Connecticut $26,697,800 $22,724,600 0% 0% 0% 1%
Delaware $5,884,000 $5,988,000 2% 2% 3% 4%
Florida $4,545,845 $7,487,707 0% 0% 0% 0%
Georgia $19,844,619 $19,264,310 4% 5% 5% 6%
Hawaii $15,857,429 $13,671,926 0% 0% 0% 0%
Idaho $156,280 $134,980 12% 12% 15% 21%
Illinois $43,949,729 $56,329,888 0% 0% 0% 0%
Indiana $524,859 $387,991 0% 5% 18% 19%
Iowa $538,181 $526,389 0% 0% 0% 0%
Kansas $562,152 $546,750 2% 2% 3% 3%
Kentucky $8,754,555 $6,429,092 15% 15% 19% 25%
Louisiana $11,527,958 $8,543,177 0% 0% 0% 0%
Maine $2,625,058 $2,054,269 6% 7% 9% 11%
Maryland $16,530,102 $9,014,484 1% 2% 2% 2%
Massachusetts $15,166,300 $15,784,100 2% 2% 2% 3%
Michigan $45,476,000 $24,554,500 2% 3% 7% 11%
Minnesota $1,216,649 $1,010,739 0% 0% 0% 0%
Mississippi $727,711 $690,339 0% 0% 0% 0%
Missouri $3,180,260 $3,303,289 3% 4% 4% 4%
Continued on the next page

26
* Nebraska does not report an OPEB liability.
Note: Data are not adjusted for inflation. Numbers reported in this table may di�er from those in the report due to rounding. The national aggregate liability for 2010 in 2013 dollars is $696 billion.
Source: Analysis of data from states’ Comprehensive Annual Financial Reports, actuarial reports and valuations, other public documents, or from plan o¯cials
© 2016 The Pew Charitable Trusts
State 2010 liability (in thousands)
2013 liability (in thousands)
Funded ratio
2010 2011 2012 2013
Montana $540,894 $447,105 0% 0% 0% 0%
Nebraska* — — — — — —
Nevada $1,706,543 $1,271,752 2% 3% 0% 0%
New Hampshire $3,291,683 $2,588,586 2% 1% 1% 1%
New Jersey $71,371,700 $66,804,600 0% 0% 0% 0%
New Mexico $3,523,665 $3,915,114 5% 5% 6% 6%
New York $56,826,000 $69,514,000 0% 0% 0% 0%
North Carolina $33,993,147 $26,943,108 3% 4% 5% 5%
North Dakota $161,982 $153,522 30% 30% 32% 43%
Ohio $39,569,177 $24,887,007 39% 42% 65% 63%
Oklahoma $2,918 $4,621 0% 0% 0% 0%
Oregon $768,865 $639,900 31% 36% 43% 56%
Pennsylvania $17,465,836 $18,875,393 1% 1% 1% 1%
Rhode Island $833,141 $778,322 0% 2% 2% 8%
South Carolina $9,657,947 $10,101,175 5% 5% 6% 7%
South Dakota $70,548 $67,774 0% 0% 0% 0%
Tennessee $1,560,848 $1,442,208 0% 0% 0% 0%
Texas $55,949,044 $61,729,417 1% 2% 1% 1%
Utah $510,765 $428,828 22% 22% 37% 37%
Vermont $1,628,934 $1,660,530 0% 1% 1% 1%
Virginia $6,528,000 $6,539,340 23% 22% 18% 21%
Washington $7,618,372 $7,381,134 0% 0% 0% 0%
West Virginia $7,410,241 $3,262,553 6% 12% 12% 18%
Wisconsin $2,492,932 $2,241,604 40% 48% 47% 52%
Wyoming $246,571 $243,197 0% 0% 0% 0%
National Aggregate $660,176,344 $627,029,306 5% 5% 6% 6%

27
Table B.2
State OPEB Expenditures and Annual Required Contributions, 2013
State Actual expenditures(in thousands)
ARC (in thousands)
Percentage of ARC contributed
Alabama $457,262 $1,054,957 43%
Alaska $535,364 $950,125 56%
Arizona $155,746 $155,746 100%
Arkansas $58,907 $228,302 26%
California $2,196,269 $6,658,035 33%
Colorado $94,807 $149,073 64%
Connecticut $569,655 $1,451,739 39%
Delaware $209,200 $483,800 43%
Florida $128,999 $452,658 28%
Georgia $627,431 $1,683,339 37%
Hawaii $277,900 $994,893 28%
Idaho $10,347 $12,773 81%
Illinois $855,978 $4,003,399 21%
Indiana $19,313 $32,240 60%
Iowa $26,004 $56,691 46%
Kansas $66,001 $87,344 76%
Kentucky $383,596 $528,989 73%
Louisiana $271,002 $583,525 46%
Maine $100,716 $148,644 68%
Maryland $407,225 $704,977 58%
Massachusetts $584,800 $1,250,900 47%
Michigan $1,777,548 $2,270,599 78%
Minnesota $60,447 $116,980 52%
Mississippi $29,490 $44,906 66%
Missouri $107,131 $267,054 40%
Montana* $0 $45,031 0%
Continued on the next page

28
State Actual expenditures(in thousands)
ARC (in thousands)
Percentage of ARC contributed
* Montana did not make an OPEB contribution in 2013.
NA: Nebraska does not report an OPEB liability, annual required contributions to OPEB, or actual OPEB expenditures.
Note: Numbers reported in this table may di�er from those in the report due to rounding.
Source: Analysis of data from states’ Comprehensive Annual Financial Reports, actuarial reports and valuations, other public documents, or from plan o¯cials
© 2016 The Pew Charitable Trusts
Nebraska NA NA NA
Nevada $59,029 $140,846 42%
New Hampshire $101,044 $182,043 56%
New Jersey $1,838,500 $6,351,000 29%
New Mexico $135,388 $353,658 38%
New York $1,446,000 $3,399,000 43%
North Carolina $912,896 $2,085,091 44%
North Dakota $13,543 $16,134 84%
Ohio $329,478 $1,724,138 19%
Oklahoma $187 $328 57%
Oregon $60,651 $72,500 84%
Pennsylvania $831,963 $1,281,086 65%
Rhode Island $58,223 $58,223 100%
South Carolina $416,388 $828,271 50%
South Dakota $3,649 $7,771 47%
Tennessee $69,984 $152,018 46%
Texas $1,271,608 $4,640,128 27%
Utah $40,385 $39,773 102%
Vermont $25,558 $113,435 23%
Virginia $379,941 $592,531 64%
Washington $135,729 $683,798 20%
West Virginia $171,221 $289,725 59%
Wisconsin $95,832 $190,485 50%
Wyoming $9,106 $19,242 47%
National Aggregate $18,417,442 $47,637,945 39%

29
Ap
pen
dix
C: O
PE
B fu
nd
ing
pol
icie
s an
d r
etir
ee h
ealt
h p
lan
elig
ibili
ty
This
app
endi
x de
scrib
es h
ealth
insu
ranc
e be
nefit
s fo
r a p
ublic
wor
ker h
ired
toda
y. In
som
e in
stan
ces
thes
e ha
ve b
een
the
bene
fit p
aram
eter
s in
pla
ce fo
r ye
ars,
in o
ther
s th
ey re
pres
ent r
ecen
t pol
icy
chan
ges.
Tabl
e C
.1
50-S
tate
Mat
rix
for E
arly
Ret
iree
s
Cont
inue
d on
the
next
pag
e
AL
AK
AZ
AR
CACO
CTD
EFL
GA
HI
IDIL
INIA
*KS
KYLA
ME
MD
MA
MI
MN
MS
MO
Fund
ed ra
tios
Belo
w 1%
1-9%
10-2
9%
30%
and
abo
ve
Stat
e pr
emiu
m c
ontr
ibut
ions
Fixe
d-do
llar p
rem
ium
con
trib
utio
ns
Cont
ribut
ion
tied
to to
tal p
rem
ium
cos
t
No
stat
e co
ntrib
utio
n
Prem
ium
con
trib
utio
ns p
rora
ted
Min
imum
yea
rs o
f ser
vice
(YO
S) fo
r pre
miu
m c
ontr
ibut
ion
Less
than
10 y
ears
10 y
ears
11-2
0 ye
ars
Gre
ater
than
20
year
s
Retir
ee d
epen
dent
s
Acc
ess
to h
ealth
car
e co
vera
ge
Prem
ium
con
trib
utio
n pr
ovid
ed
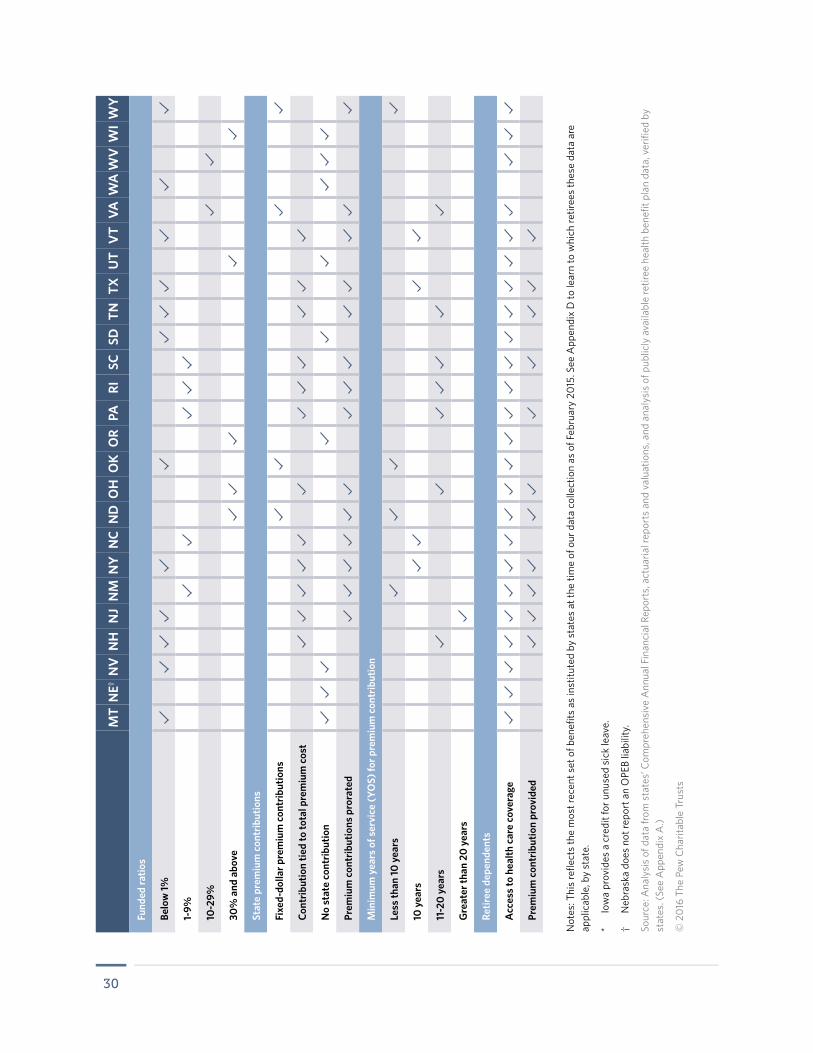
30
Not
es: T
his
refle
cts
the
mos
t rec
ent s
et o
f ben
efits
as
inst
itute
d by
sta
tes
at th
e tim
e of
our
dat
a co
llect
ion
as o
f Feb
ruar
y 20
15. S
ee A
ppen
dix
D to
lear
n to
whi
ch re
tiree
s th
ese
data
are
ap
plic
able
, by
stat
e.
* Io
wa
prov
ides
a c
redi
t for
unu
sed
sick
leav
e.
† N
ebra
ska
does
not
repo
rt a
n O
PEB
liabi
lity.
Sour
ce: A
naly
sis
of d
ata
from
sta
tes’
Com
preh
ensi
ve A
nnua
l Fin
anci
al R
epor
ts, a
ctua
rial r
epor
ts a
nd v
alua
tions
, and
ana
lysi
s of
pub
licly
ava
ilabl
e re
tiree
hea
lth b
enefi
t pla
n da
ta, v
erifi
ed b
y st
ates
. (Se
e A
ppen
dix
A.)
© 2
016
The
Pew
Cha
ritab
le T
rust
s
MT
NE†
NV
NH
NJ
NM
NY
NC
ND
OH
OK
OR
PARI
SCSD
TNTX
UT
VT
VAW
AW
VW
IW
Y
Fund
ed ra
tios
Belo
w 1%
1-9%
10-2
9%
30%
and
abo
ve
Stat
e pr
emiu
m c
ontr
ibut
ions
Fixe
d-do
llar p
rem
ium
con
trib
utio
ns
Cont
ribut
ion
tied
to to
tal p
rem
ium
cos
t
No
stat
e co
ntrib
utio
n
Prem
ium
con
trib
utio
ns p
rora
ted
Min
imum
yea
rs o
f ser
vice
(YO
S) fo
r pre
miu
m c
ontr
ibut
ion
Less
than
10 y
ears
10 y
ears
11-2
0 ye
ars
Gre
ater
than
20
year
s
Retir
ee d
epen
dent
s
Acc
ess
to h
ealth
car
e co
vera
ge
Prem
ium
con
trib
utio
n pr
ovid
ed

31
Tabl
e C
.2
50-S
tate
Mat
rix
for M
edic
are-
Elig
ible
Ret
iree
s
AL
AK
AZ
AR
CACO
CTD
EFL
GA
HI
IDIL
INIA
KSKY
*†LA
ME
MD
MA
MIM
NM
SM
OM
TN
E‡N
V*
Fund
ed ra
tios
Belo
w 1%
1-9%
10-2
9%
30%
and
abo
ve
Stat
e pr
emiu
m c
ontr
ibut
ions
Fixe
d-do
llar p
rem
ium
con
trib
utio
ns
Cont
ribut
ion
tied
to to
tal p
rem
ium
cos
t
No
stat
e co
ntrib
utio
n
Prem
ium
con
trib
utio
ns p
rora
ted
Min
imum
yea
rs o
f ser
vice
(YO
S) fo
r pre
miu
m c
ontr
ibut
ion
Less
than
10 y
ears
10 y
ears
11-2
0 ye
ars
Gre
ater
than
20
year
s
Retir
ee d
epen
dent
s
Acc
ess
to h
ealth
car
e co
vera
ge
Prem
ium
con
trib
utio
n pr
ovid
ed
Hea
lth c
over
age
type
Med
icar
e w
rapa
roun
d
Med
icar
e A
dvan
tage
hea
lth p
lan
No
med
ical
cov
erag
e
Pres
crip
tion
drug
cov
erag
e ty
pe
Empl
oyer
Gro
up W
aive
r Pla
n or
Med
icar
e A
dvan
tage
pre
scrip
tion
drug
pla
n
Retir
ee d
rug
subs
idy
plan
No
pres
crip
tion
drug
cov
erag
e
Cont
inue
d on
the
next
pag
e

32
Not
es: T
his
refle
cts
the
mos
t rec
ent
set o
f ben
efits
as
inst
itute
d by
sta
tes
at th
e tim
e of
our
da
ta c
olle
ctio
n as
of
Feb
ruar
y 20
15.
See
App
endi
x D
to
lear
n to
whi
ch
retir
ees
thes
e da
ta
are
appl
icab
le, b
y st
ate.
* D
ata
on
pres
crip
tion
drug
cov
erag
e ty
pe fo
r M
edic
are-
elig
ible
retir
ees
in K
entu
cky,
N
evad
a, a
nd
Rhod
e Is
land
are
no
t ava
ilabl
e.
† Ke
ntuc
ky d
id
not r
epor
t on
Med
icar
e-el
igib
le re
tiree
he
alth
cov
erag
e ty
pe.
‡ N
ebra
ska
does
no
t rep
ort a
n O
PEB
liabi
lity.
Sour
ce: A
naly
sis
of d
ata
from
sta
tes’
Com
preh
ensi
ve A
nnua
l Fin
anci
al R
epor
ts, a
ctua
rial v
alua
tions
, and
ana
lysi
s of
pub
licly
ava
ilabl
e re
tiree
hea
lth b
enefi
t pla
n da
ta, v
erifi
ed b
y st
ates
. (Se
e A
ppen
dix
A.)
© 2
016
The
Pew
Cha
ritab
le T
rust
s
NH
NJ
NM
NY
NC
ND
OH
OK
OR
PARI
*SC
SDTN
TXU
TV
TVA
WA
WV
WIW
YFu
nded
ratio
s
Belo
w 1%
1-9%
10-2
9%
30%
and
abo
ve
Stat
e pr
emiu
m c
ontr
ibut
ions
Fixe
d-do
llar p
rem
ium
con
trib
utio
ns
Cont
ribut
ion
tied
to to
tal p
rem
ium
cos
t
No
stat
e co
ntrib
utio
n
Prem
ium
con
trib
utio
ns p
rora
ted
Min
imum
yea
rs o
f ser
vice
(YO
S) fo
r pre
miu
m c
ontr
ibut
ion
Less
than
10 y
ears
10 y
ears
11-2
0 ye
ars
Gre
ater
than
20
year
s
Retir
ee d
epen
dent
s
Acc
ess
to h
ealth
car
e co
vera
ge
Prem
ium
con
trib
utio
n pr
ovid
ed
Hea
lth c
over
age
type
Med
icar
e w
rapa
roun
d
Med
icar
e A
dvan
tage
hea
lth p
lan
No
med
ical
cov
erag
e
Pres
crip
tion
drug
cov
erag
e ty
pe
Empl
oyer
Gro
up W
aive
r Pla
n or
Med
icar
e A
dvan
tage
pre
scrip
tion
drug
pla
n
Retir
ee d
rug
subs
idy
plan
No
pres
crip
tion
drug
cov
erag
e

33
Appendix D: State contributions to retiree health insurance plansThis appendix outlines the most recent premium contribution criteria for early and Medicare-eligible retirees in each state at the time of our data collection as of February 2015.118 Most states provide varying levels of retiree benefits based on factors such as date of hire, date of retirement, or vesting eligibility. The table below describes the eligibility and premium contribution criteria analyzed in this report as defined by each state. See Appendix A to review the methodology researchers used to determine which groups were included in the analysis. Data were collected from publicly available documents related to retiree health plans and were verified with states. If a state did not verify a particular plan provision, that is noted.
Table D
Criteria for State Premium Contributions to Retiree Health Insurance Plans
State Hire or retirement date Category Premium contribution
range per retiree per year Prorating description
Alabama
Retired on or after Jan. 1, 2012 Early retirees Average employer contribution:
$5,412
Based on years of creditable coverage and number of years below age 65;
state pays full state share at 65 with 25 YOS
Retired on or after Jan. 1, 2012
Medicare-eligible retirees
Average employer contribution: $4,152
Based on years of creditable coverage; state pays full state share
at 25 YOS
Alaska
Hired after June 30, 2006 Early retirees 0% NA
Hired after June 30, 2006
Medicare-eligible retirees 70-90%
10 YOS = 70%; 15 YOS = 75%; 20 YOS = 80%; 25 YOS = 85%; 30 YOS
= 90%
Arizona
Current retirees Early retirees $900-$1,800
Retirees receive a percentage of a fixed-dollar amount based on YOS: 5 YOS = $900 (50%); each additional YOS adds $180 (10%), up to $1,800
(100%)
Current retirees Medicare-eligible retirees $600-$1,200
5 YOS = $600; each additional YOS adds $120, up to $1,200 (i.e., 5 YOS = 50% of benefit; 6 YOS = 60%; 10
YOS = 100%)
Arkansas
All retirees beginning Jan. 1,
2015Early retirees $1,972 None
All retirees beginning Jan. 1,
2015
Medicare-eligible retirees $2,225 None
California
Hired on or after Jan. 1, 1989 Early retirees 0-100% of a flat subsidy of
$7,70410 YOS = 50% of subsidy; then 5%
per YOS, up to 100%
Hired on or after Jan. 1, 1989
Medicare-eligible retirees
0-100% of a flat subsidy of $7,704
10 YOS = 50% of subsidy; then 5% per YOS, up to 100%
Continued on the next page

34
State Hire or retirement date Category Premium contribution
range per retiree per year Prorating description
Continued on the next page
ColoradoCurrent retirees Early retirees $690 to $2,760 $11.50 per month per YOS, up to
$2,760
Current retirees Medicare-eligible retirees $69 to $1,380 $5.75 per month per YOS, up to
$1,380
Connecticut
Hired on or after July 1, 2011 Early retirees 60-100%
For retirees in “normal retirement,” the state contribution is 98.5% of
the point-of-service benefit plan or 100% of the point-of-enrollment benefit plan. For retirees in “early
retirement,” the state contribution is based on YOS and number of years below normal retirement age (63 or
65 depending on YOS).
Hired on or after July 1, 2011
Medicare-eligible retirees 100% None
Delaware
Hired on or after Jan. 1, 2007 Early retirees 0-100% of 96% premium
contribution
The state share of the contribution is prorated: Less than 15 YOS = 0%; 15-17.5 YOS = 50%; 17.6-19 YOS =
75%; 20 or more YOS = 100% (100% subsidy level is 96% of premium for
retirees)
Hired on or after Jan. 1, 2007 and
retired after July 1, 2012
Medicare-eligible retirees
0-100% of 95% premium contribution
The state share of the contribution is prorated: Less than 15 YOS = 0%; 15-17.5 YOS = 50%; 17.6-19 YOS =
75%; 20 or more YOS = 100% (100% subsidy level is 95% of premium for
retirees)
Florida
Enrolled on or after July 1, 2011* Early retirees 0% NA
Enrolled on or after July 1, 2011*
Medicare-eligible retirees 0% NA
Georgia
Employed on or after Jan. 1, 2009 Early retirees 0-75% 75%-3%*(30-YOS); capped at 75%
Employed on or after Jan. 1, 2009
Medicare-eligible retirees 0-75% 75%-3%*(30-YOS); capped at 75%
Hawaii
Hired on or after July 1, 2012 Early retirees 0-100% of a flat rate of $8,839 10 YOS = 50%; 15 YOS = 75%; 25 or
more YOS = 100%
Hired on or after July 1, 2012
Medicare-eligible retirees 0-100% of a flat rate of $6,297
Part B premium covered at 100%; supplemental premiums are prorated: 10 YOS = 50%; 15 YOS = 75%; 25 or
more YOS = 100%
Idaho
Hired on or after June 30, 2009 Early retirees NA NA
All retirees beginning Jan. 1,
2010
Medicare-eligible retirees NA NA
Illinois
Hired after Dec. 31, 2010 Early retirees 50-100% The state contributes 5% of the
premium for each YOS
Hired after Dec. 31, 2010
Medicare-eligible retirees 50-100% The state contributes 5% of the
premium for each YOS

35
IndianaCurrent retirees Early retirees 0% NA
Current retirees Medicare-eligible retirees NA NA
Iowa
Vested after July 1, 2012 Early retirees 85-100% until sick leave credits
are depleted
Sick Leave Insurance Program: An amount is deposited in the retiree’s account based on the unused sick leave remaining and retiree regular hourly rate of pay upon retirement;
retirees may use this to pay for up to 100% of retiree-only health insurance
premiums until there are no more funds remaining. Then the retiree is
responsible for 100% of the premium.
Vested after July 1, 2012
Medicare-eligible retirees 0% NA
Kansas†
Tier 1: Hired before July 1, 2009; Tier 2:
Hired after July 1, 2009
Early retirees 0% NA
Tier 1: Hired before July 1, 2009; Tier 2:
Hired after July 1, 2009
Medicare-eligible retirees 0% NA
Kentucky
Hired on or after Jan. 1, 2014 Early retirees $1,800 and up (no maximum) $120 times YOS
Hired on or after Jan. 1, 2014
Medicare-eligible retirees $1,800 and up (no maximum) $120 times YOS
Louisiana
Hired after Jan. 1, 2011 Early retirees 19-75%
5-9 YOS = 19%; 10-14 YOS = 38%; 15-19 YOS = 56%; 20 or more YOS
= 75%
Hired after Jan. 1, 2011
Medicare-eligible retirees 19-75% or $2,400 flat rate
5-9 YOS = 19%; 10-14 YOS = 38%; 15-19 YOS = 56%; 20 or more
YOS = 75% (percentage of total premium) or Medicare eligibles
who move to a One Exchange plan receive $200 monthly credited to a
Health Reimbursement Arrangement and forgo the 19-75% premium
contribution.
Maine
Hired on or after July 1, 2011 Early retirees 100% None
Hired on or after July 1, 2011
Medicare-eligible retirees 0-100%
Based on years of medical coverage: 0-9 = 0%; 10-14 = 50%; 15-19 = 75%;
20 or more = 100%
State Hire or retirement date Category Premium contribution
range per retiree per year Prorating description
Continued on the next page

36
State Hire or retirement date Category Premium contribution
range per retiree per year Prorating description
Continued on the next page
Maryland
Hired on or after July 1, 2011 Early retirees 40-100% of flat-rate subsidy
40% of flat subsidy at 10 YOS + 4% more per YOS up to 100%; actual
number of months worked is divided into the number of months needed for
full subsidy (300 months)
Hired on or after July 1, 2011
Medicare-eligible retirees 40-100% of flat-rate subsidy
40% of flat subsidy at 10 YOS + 4% more per YOS up to 100%; actual
number of months worked is divided into the number of months needed for
full subsidy (300 months)
Massachusetts
Retired after Oct. 1, 2009 Early retirees 80% None
Retired after Oct. 1, 2009
Medicare-eligible retirees 80% None
MichiganCurrent retirees Early retirees 30-80% 30% at 10 YOS + (3% times YOS
after 10 YOS), capped at 80%
Current retirees Medicare-eligible retirees 30-80% 30% at 10 YOS + (3% times YOS
after 10 YOS), capped at 80%
MinnesotaCurrent retirees Early retirees 0% NA
Current retirees Medicare-eligible retirees 0% NA
MississippiCurrent retirees Early retirees 0% NA
Current retirees Medicare-eligible retirees 0% NA
Missouri
Hired on or after Jan. 1, 2011 Early retirees 25-65% YOS times 2.5% of PPO 600 Plan
premium, capped at 65%
Hired on or after Jan. 1, 2011
Medicare-eligible retirees 25-65% YOS times 2.5% of PPO 600 Plan
premium, capped at 65%
MontanaCurrent retirees Early retirees 0% NA
Current retirees Medicare-eligible retirees 0% NA
NebraskaCurrent retirees Early retirees 0% NA
Current retirees Medicare-eligible retirees NA NA
Nevada
Hired after Jan. 1, 2012 Early retirees 0% NA
Hired after Jan. 1, 2012
Medicare-eligible retirees 0% NA
New Hampshire
Hired after July 1, 2011 Early retirees 87.5% None
Hired after July 1, 2011
Medicare-eligible retirees 100% None

37
New Jersey
Less than 20 YOS as of July 1, 2011 Early retirees Di�erence between premium and
4.5-35% of retirees’ pension Based on retiree pension
Less than 20 YOS as of July 1, 2011
Medicare-eligible retirees
Di�erence between premium and 4.5-35% of retirees’ pension Based on retiree pension
New Mexico
Current retirees Early retirees 6.25-100% of 65% premium contribution
6.25% at 5 years + (6.25% times YOS after 5 years); maxed at 20
years; (100% subsidy level is 65% of premium for retirees)
Current retirees Medicare-eligible retirees
6.25-100% of 50% premium contribution
6.25% at 5 years + (6.25% times YOS after 5 years); maxed at 20
years; (100% subsidy level is 50% of premium for retirees)
New York
Retired on or after Jan. 1, 2012 Early retirees 84-88% Based on employee grade; grades 1-9
= 88%; grades 10 or higher = 84%
Retired on or after Jan. 1, 2012
Medicare-eligible retirees 84-88% Based on employee grade; grades 1-9
= 88%; grades 10 or higher = 84%
North Carolina
Hired after Oct. 1, 2006 Early retirees 0-100% of state contribution of
$5,378
State contribution $5,378: 5-9 YOS = 0% of contribution; 10-19 YOS = 50%
of contribution; 20 or more YOS = 100% of contribution
Hired after Oct. 1, 2006
Medicare-eligible retirees
0-100% of state contribution of $4,179
State contribution $4,179: 5-9 YOS = 0% of contribution; 10-19 YOS = 50%
of contribution; 20 or more YOS = 100% of contribution
North Dakota
Current retirees Early retirees $77.40 and up (no maximum)
State contribution is $60 per year per YOS up to the total premium amount;
the state’s contribution is reduced based on age
Current retirees Medicare-eligible retirees $60 and up (no maximum) $60 per year per YOS up to the total
premium amount
Ohio
Retired after December 2014/
Jan. 1, 2015Early retirees 51-90%
51% + 2% for each YOS over 20 years + 3% per year of age over 60;
maximum is 90%
Retired after December 2014/
Jan. 1, 2015
Medicare-eligible retirees 66-90% 66% + 2% for each YOS over 20
years; maximum is 90%
Oklahoma
Current retirees Early retirees Lesser of $1,260 flat subsidy or premium amount None
Current retirees Medicare-eligible retirees
Lesser of $1,260 flat subsidy or Medicare Supplemental premium
amountNone
Oregon
Hired on or after Aug. 29, 2003 Early retirees 0% NA
Hired on or after Aug. 29, 2003
Medicare-eligible retirees 0% NA
State Hire or retirement date Category Premium contribution
range per retiree per year Prorating description
Continued on the next page

38
State Hire or retirement date Category Premium contribution
range per retiree per year Prorating description
Continued on the next page
Pennsylvania
Retired on or after July 1, 2011 Early retirees Varies Retirees pay 3% of final average
salary
Retired on or after July 1, 2011
Medicare-eligible retirees Varies Retirees pay 1.5% of final average
salary
Rhode Island†
Less than 5 YOS after June 30, 2012 Early retirees 0-80% 0% for retirees below age 59; 80%
for retirees 59 and older
Less than 5 YOS after June 30, 2012
Medicare-eligible retirees 80% None
South Carolina
Hired on or after May 2, 2008 Early retirees 0-100% of 72% premium
contribution
5-14 YOS = 0%; 15-24 YOS = 50%; 25 YOS =100% (100% subsidy level
is 72% of premium for retirees)
Hired on or after May 2, 2008
Medicare-eligible retirees
0-100% of 72% premium contribution
5-14 YOS = 0%; 15-24 YOS = 50%; 25 YOS =100% (100% subsidy level
is 72% of premium for retirees)
South Dakota
Retired on or after Nov. 1, 2014 Early retirees 0% NA
Retired on or after Nov. 1, 2014
Medicare-eligible retirees 0% NA
Tennessee
Current retirees Early retirees 60-80% of the lowest priced plan 15-19 YOS = 60%; 20-29 YOS = 70%; 30 YOS = 80%
Current retirees Medicare-eligible retirees $300-$600
15-19 YOS = $25 per month; 20-29 YOS = $37.50 per month; 30 YOS =
$50 per month
Texas
Future retirees with less than 5 YOS on
Aug. 31, 2014Early retirees
FY 2015 rates: $235.89 to $541.70 (also varies depending
on plan selected)
The di�erence between the total premium and the annually established
retiree contribution, which varies based on YOS as of Sept. 1, 2014: 10-14 YOS = 50%, 15-19 YOS = 75%; 20
or more YOS = 100%
Future retirees with less than 5 YOS on
Aug. 31, 2014
Medicare-eligible retirees
FY 2015 rates: $235.89 to $541.70 (also varies depending
on plan selected)
The di�erence between the total premium and the annually established
retiree contribution, which varies based on YOS as of Sept. 1, 2014: 10-14 YOS = 50%, 15-19 YOS = 75%; 20
or more YOS = 100%
Utah
Hired on or after Jan. 1, 2014 Early retirees 0% State phasing out contributions
toward any insurance after retirement
Hired on or after Jan. 1, 2014
Medicare-eligible retirees 0% NA
Vermont
Hired on or after July 1, 2008 Early retirees 0-80%
0-9 YOS = 0%; 10-14 YOS = 40%; 15-19 YOS = 60%; 20 or more YOS
= 80%
Hired on or after July 1, 2008
Medicare-eligible retirees 0-80%
0-9 YOS = 0%; 10-14 YOS = 40%; 15-19 YOS = 60%; 20 or more YOS
= 80%
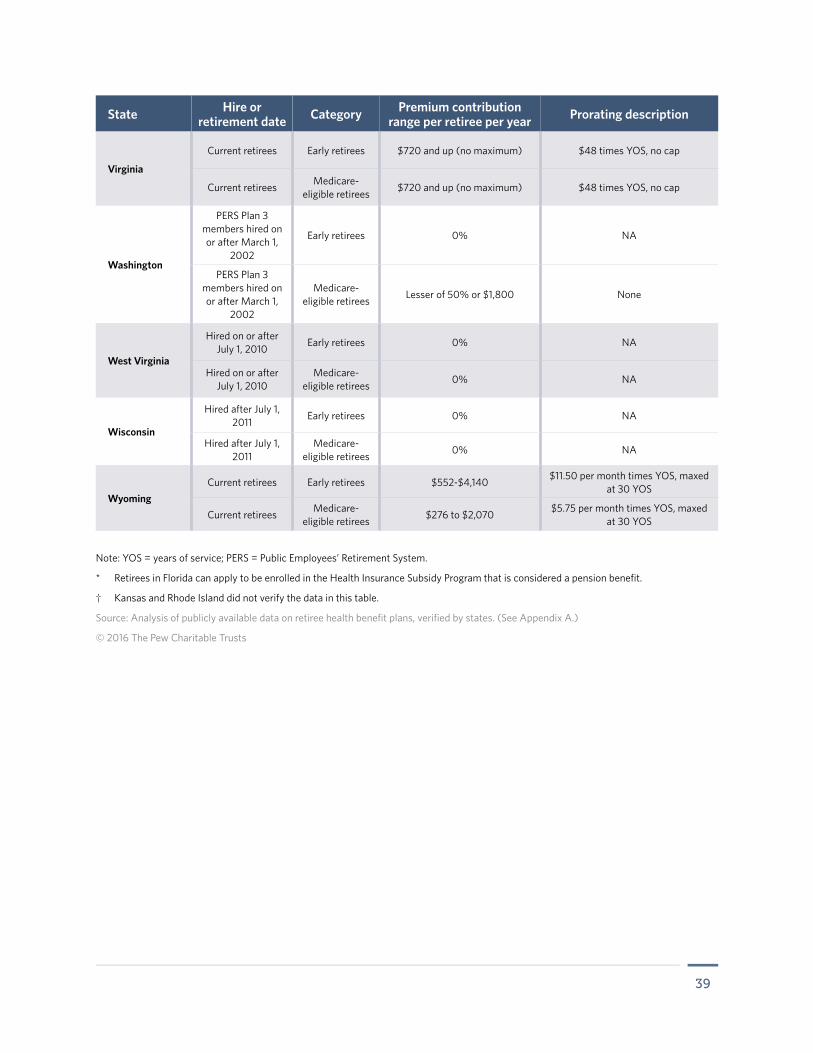
39
Virginia
Current retirees Early retirees $720 and up (no maximum) $48 times YOS, no cap
Current retirees Medicare-eligible retirees $720 and up (no maximum) $48 times YOS, no cap
Washington
PERS Plan 3 members hired on or after March 1,
2002
Early retirees 0% NA
PERS Plan 3 members hired on or after March 1,
2002
Medicare-eligible retirees Lesser of 50% or $1,800 None
West Virginia
Hired on or after July 1, 2010 Early retirees 0% NA
Hired on or after July 1, 2010
Medicare-eligible retirees 0% NA
Wisconsin
Hired after July 1, 2011 Early retirees 0% NA
Hired after July 1, 2011
Medicare-eligible retirees 0% NA
WyomingCurrent retirees Early retirees $552-$4,140 $11.50 per month times YOS, maxed
at 30 YOS
Current retirees Medicare-eligible retirees $276 to $2,070 $5.75 per month times YOS, maxed
at 30 YOS
State Hire or retirement date Category Premium contribution
range per retiree per year Prorating description
Note: YOS = years of service; PERS = Public Employees’ Retirement System.
* Retirees in Florida can apply to be enrolled in the Health Insurance Subsidy Program that is considered a pension benefit.
† Kansas and Rhode Island did not verify the data in this table.
Source: Analysis of publicly available data on retiree health benefit plans, verified by states. (See Appendix A.)
© 2016 The Pew Charitable Trusts

40
EndnotesSee Appendix D to learn to which retirees these data are applicable, by state. See Appendix A to review the methodology researchers used to determine which groups of retirees were included in the analysis.
1 Idaho does not o�er coverage to Medicare-eligible retirees and does not o�er coverage to retirees not yet eligible for Medicare who were hired after June 30, 2009, with less than 10 years of credited state service. However, it does provide coverage and a premium contribution to retirees who were hired before July 1, 2009, and are not yet eligible for Medicare. Most states provide varying levels of retiree benefits based on rules such as date of hire, date of retirement, or vesting eligibility.
2 Frank McArdle, Tricia Neuman, and Jennifer Huang, Retiree Health Benefits at the Crossroads, Henry J. Kaiser Family Foundation (April 2014), http://k�.org/medicare/report/retiree-health-benefits-at-the-crossroads.
3 Jerrell D. Coggburn, Dennis M. Daley, and Richard C. Kearney, “Public Sector Retiree Health Care Benefits: A View From the American States,” Public Personnel Management 41, no. 2 (2012): 219–40, http://ipma-hr.org/sites/default/files/pdf/ppm/ppmsum2012.pdf; and The Pew Charitable Trusts and the Laura and John Arnold Foundation, “Recruiting and Retaining Public Sector Workers: Views From State Personnel Executives” (2014), http://www.pewtrusts.org/~/media/Assets/2014/09/RecruitingandRetainingPublicSectorWorkersIssueBrief.pdf.
4 Governmental Accounting Standards Board, “Summary of Statement No. 45,” accessed May 15, 2015, http://www.gasb.org/st/summary/gstsm45.html. The GASB is an independent organization, not a government entity, that establishes and updates standards of accounting and financial reporting for U.S. state and local governments. Its standards do not have the force of federal law or regulation, nor does GASB have enforcement authority. Compliance with its standards, however, is enforced through the laws of some states.
5 Ibid. Standards were issued in 2004, but implementation requirements for all applicable governmental entities were phased in between 2006 and 2008. Standard & Poor’s Ratings Services, “Diverging Trends Underlie Stable Overall U.S. OPEB Liability” (2014), 2, http://www.nasra.org/Files/Topical%20Reports/OPEB/SandP%20State%20OPEB%20report%2011-17-14.pdf.
6 Standard & Poor’s Ratings Services, “Diverging Trends,” 2.
7 Governmental Accounting Standards Board, Other Postemployment Benefits: A Plain-Language Summary of GASB Statements No. 43 and No. 45, 8, accessed May 15, 2015, http://www.gasb.org/resources/ccurl/553/517/opeb_summary.pdf; and Government Finance O¯cers Association, “Considerations for Prefunding OPEB Obligations,” accessed May 15, 2015, http://www.gfoa.org/considerations-prefunding-opeb-obligations.
8 Medicare Prescription Drug, Improvement, and Modernization Act of 2003, Pub. L. 108-173, 108th Congress (2003), http://www.gpo.gov/fdsys/pkg/PLAW-108publ173/html/PLAW-108publ173.htm.
9 McArdle, Neuman, and Huang, Retiree Health Benefits; and Centers for Medicare & Medicaid Services, “What’s Medicare Supplement Insurance (Medigap)?” accessed May 15, 2015, http://www.medicare.gov/supplement-other-insurance/medigap/whats-medigap.html.
10 Governmental Accounting Standards Board, Other Postemployment Benefits, 4.
11 American Academy of Actuaries, “Measuring Pension Obligations” (2013), 1, http://www.actuary.org/files/IB_Measuring-Pension-Obligations_Nov-21-2013.pdf.
12 Steven P. May and David M. Liner, “EGWP/Wrap: Why Now?” (2011), http://us.milliman.com/uploadedFiles/insight/research/health-rr/egwp-wrap-why-now.pdf.
13 Ibid.
14 Jennifer Rak and Sarika Kasaraneni, “The Value of Medicare Advantage Employer Group Waiver Plans (MA-EGWPs) for Employers and Retirees,” Avalere Health (2014), http://avalere.com/expertise/managed-care/insights/employers-value-medicare-advantage-employer-group-waiver-plans-ma-egwps-as; and American Medical Association, “Capitation,” accessed Oct. 2, 2015, http://www.ama-assn.org/ama/pub/advocacy/state-advocacy-arc/state-advocacy-campaigns/private-payer-reform/state-based-payment-reform/evaluating-payment-options/capitation.page.
15 Rak and Kasaraneni, “The Value of Medicare Advantage”; and American Medical Association, “Capitation.”
16 Governmental Accounting Standards Board, “Summary of Statement No. 45”; and Standard & Poor’s Ratings Services, “Diverging Trends.”
17 Governmental Accounting Standards Board, “Summary of Statement No. 45”; Standard & Poor’s Ratings Services, “Diverging Trends,” 2; and Governmental Accounting Standards Board, Other Postemployment Benefits, 2.
18 Gail Levenson, email communication with The Pew Charitable Trusts, Sept. 22, 2015.

41
19 Centers for Medicare & Medicaid Services, “About RDS,” accessed May 26, 2015, http://www.rds.cms.hhs.gov/about/; and Centers for Medicare & Medicaid Services, “Overview of Retiree Drug Subsidy Option” (2005), https://www.cms.gov/Medicare/Prescription-Drug-Coverage/EmployerRetireeDrugSubsid/Downloads/OviewoftheRDSrev1.pdf.
20 Centers for Medicare & Medicaid Services, “About RDS.”
21 U.S. Census Bureau, “Annual Survey of State Government Finances,” accessed Feb. 3, 2015, http://www.census.gov/govs/state.
22 McArdle, Neuman, and Huang, Retiree Health Benefits; and Centers for Medicare & Medicaid Services, “What’s Medicare Supplement Insurance (Medigap)?”
23 Governmental Accounting Standards Board, “Summary of Statement No. 45”; and Standard & Poor’s Ratings Services, “Diverging Trends.”
24 Government Finance O¯cers Association, “Considerations for Prefunding OPEB Obligations.”
25 Governmental Accounting Standards Board, Other Postemployment Benefits, 11.
26 Government Finance O¯cers Association, “Considerations for Prefunding OPEB Obligations.”
27 Standard & Poor’s Ratings Services, “Diverging Trends,” 1.
28 Ohio Public Employees Retirement System, Navigating the Future: 2013 Comprehensive Annual Financial Report (2014), 74–75, https://www.opers.org/pubs-archive/financial/cafr/2013%20CAFR.pdf; Ohio Public Employees Retirement System, “OPERS Board of Trustees,” accessed May 15, 2015, https://www.opers.org/about/board/index.shtml; and Arizona State Retirement System, 2013 Comprehensive Annual Financial Report, 25, 46, https://www.azasrs.gov/sites/default/files/pdf/2013_CAFR.pdf. Although all states assume an amortization period for GASB reporting purposes, many do not contribute payments to fund their OPEB programs based on this assumption.
29 Ohio Public Employees Retirement System, Navigating the Future: 2013 Comprehensive Annual Financial Report, 52; Ohio Public Employees Retirement System, “OPERS Board of Trustees”; and Arizona State Retirement System, 2013 Comprehensive Annual Financial Report, 25.
30 Nebraska does not report an OPEB liability.
31 From 2010 to 2013, U.S. per-enrollee spending for private health insurance grew less than 2 percent annually, substantially lower than the 7 to 8 percent growth rate assumed by OPEB actuarial valuations in California, Georgia, and Massachusetts. See, for example, Executive O¯ce of the President of the United States, Trends in Health Care Cost Growth and the Role of the A�ordable Care Act (2013), 3, https://www.whitehouse.gov/sites/default/files/docs/healthcostreport_final_noembargo_v2.pdf; Cavanaugh Macdonald Consulting, Georgia State Employees Post-Employment Health Benefit Fund & Georgia School Personnel Post-Employment Health Benefit Fund: Report of the Actuary on the Retiree Medical Valuations, Prepared as of June 30, 2013 (2014), https://dch.georgia.gov/sites/dch.georgia.gov/files/related_files/site_page/GA%20DCH%2006-30-2013%20Report%20.pdf; Cavanaugh Macdonald Consulting, Georgia State Employees Post-Employment Health Benefit Fund & Georgia School Personnel Post-Employment Health Benefit Fund Report of the Actuary on the Retiree Medical Valuations Prepared as of June 30, 2010 (2011), http://dch.georgia.gov/sites/dch.georgia.gov/files/imported/vgn/images/portal/cit_1210/23/30/185683500Retiree_Medical_Valuations_06-30-2010.pdf; Gabriel Roeder Smith & Co., State of California Retiree Health Benefits Program GASB Nos. 43 and 45 Actuarial Valuation Report as of June 30, 2013 (2014), 11, http://www.sco.ca.gov/Files-EO/CalSCO_GASB45_AVReport_2013_Final.pdf; Gabriel Roeder Smith & Co., State of California Retiree Health Benefits Program: GASB Nos. 43 and 45 Actuarial Valuation Report as of June 30, 2010 (2011), 10, http://www.sco.ca.gov/Files-EO/OPEB_2010_actuarial_ealuation_report_03042011.pdf; Aon Hewitt, Commonwealth of Massachusetts Postemployment Benefits Other Than Pensions: Actuarial Valuation Fiscal Year Ending June 30, 2013, January 1, 2013 Valuation Date (2013), 6, http://www.mass.gov/osc/docs/reports-audits/opeb/2013-opeb-valuation.pdf; and Aon Hewitt, Commonwealth of Massachusetts Postemployment Benefits Other Than Pensions: Actuarial Valuation Fiscal Year Ending June 30, 2011, January 1, 2011 Valuation Date (2011), 6, http://www.mass.gov/osc/docs/reports-audits/opeb/2011-opeb-valuation-final.pdf.
32 Cavanaugh Macdonald Consulting, Georgia State Employees Post-Employment Health Benefit Fund & Georgia School Personnel Post-Employment Health Benefit Fund Report of the Actuary on the Retiree Medical Valuations Prepared as of June 30, 2013, 9, 40; Gabriel Roeder Smith & Co., State of California Retiree Health Benefits Program GASB Nos. 43 and 45 Actuarial Valuation Report as of June 30, 2013, 14; and Aon Hewitt, Commonwealth of Massachusetts Postemployment Benefits Other Than Pensions Actuarial Valuation Fiscal Year Ending June 30, 2013, January 1, 2013 Valuation Date, 2.
33 Cavanaugh Macdonald Consulting, Georgia State Employees Post-Employment Health Benefit Fund & Georgia School Personnel Post-Employment Health Benefit Fund Report of the Actuary on the Retiree Medical Valuations Prepared as of June 30, 2013, 9, 40; Gabriel Roeder Smith & Co., State of California Retiree Health Benefits Program GASB Nos. 43 and 45 Actuarial Valuation Report as of June 30, 2013, 14; and Aon Hewitt, Commonwealth of Massachusetts Postemployment Benefits Other Than Pensions Actuarial Valuation Fiscal Year Ending June 30, 2013, January 1, 2013 Valuation Date, 2.
See Appendix D to learn to which retirees these data are applicable, by state. See Appendix A to review the methodology researchers used to determine which groups of retirees were included in the analysis.

42
34 Ernst & Young, Financial Statements, Required Supplementary Information, and Other Financial Information: West Virginia Retiree Health Benefit Trust Fund Years Ended June 30, 2013 and 2012 With Report of Independent Auditors (2013), 12, http://www.peia.wv.gov/Forms-Downloads/Documents/financial_reports/independent%20auditors%20reports/rhbt/Basic_Financial_Statements_Required_Supplementary_Information_Other_Financial_Information_Fiscal_Years_2012-2013.pdf; and CCRC Actuaries, State of West Virginia Public Employees Insurance Agency: Analysis of State of West Virginia Defined Benefit Cost-Sharing Multiple Employer Other Postemployment Benefit Plans, GASB 43 and GASB 45 Compliance as of June 30, 2011 (2011), 5, http://www.peia.wv.gov/Forms-Downloads/Documents/financial_reports/opeb/OPEB_Report_6-30-11.pdf.
35 May and Liner, “EGWP/Wrap.”
36 Aon Hewitt, State of New Jersey Postemployment Benefits Other Than Pension: Actuarial Valuation July 24, 2012 (2012), 2, http://www.state.nj.us/treasury/pensions/pdf/financial/gasb-43-july2011.pdf; and Buck Consultants, GASB 45 Actuarial Valuation at 07/01/2011 of the State of Louisiana Post-Retirement Benefit Plan for the O ce of Group Benefits (2012), ii, http://www.doa.la.gov/osrap/library/afr_packetts/2012OGB_OPEBValuationReport.pdf.
37 The Segal Co., State of Connecticut Other Post-Employment Benefits Program Actuarial Valuation and Review of Other Postemployment Benefits (OPEB) as of June 30, 2011 in Accordance With GASB Statements No. 43 and No. 45 (2012), 2, http://www.osc.ct.gov/empret/OPEBActuarialReports/OPEBReport2012.pdf.
38 Centers for Medicare & Medicaid Services, “Medicare Program—General Information,” accessed May 15, 2015, http://www.cms.gov/medicare/medicare-general-Information/medicareGenInfo/index.html.
39 Ibid.
40 Ibid. To qualify for premium-free Medicare Part A coverage, retirees must have worked and paid into the Medicare program for 40 quarters, or 10 years.
41 Ibid.
42 Centers for Medicare & Medicaid Services, “Part B Costs,” accessed May 15, 2015, http://www.medicare.gov/your-medicare-costs/part-b-costs/part-b-costs.html; and Centers for Medicare & Medicaid Services, “Ways to Pay Part A & Part B Premiums,” accessed May 15, 2015, http://www.medicare.gov/your-medicare-costs/paying-parts-a-and-b/pay-parts-a-and-b-premiums.html.
43 Centers for Medicare & Medicaid Services, “How Do Medicare Advantage Plans Work?” accessed May 15, 2015, http://www.medicare.gov/sign-up-change-plans/medicare-health-plans/medicare-advantage-plans/how-medicare-advantage-plans-work.html.
44 Ibid.
45 Centers for Medicare & Medicaid Services, “How to Get Drug Coverage,” accessed May 15, 2015, https://www.medicare.gov/sign-up-change-plans/get-drug-coverage/get-drug-coverage.html.
46 Centers for Medicare & Medicaid Services, “What’s Medicare Supplement Insurance (Medigap)?”
47 American Academy of Actuaries, Measuring Pension Obligations, 1.
48 Society of Actuaries, “Issues in Selecting the Discount Rate for GASB 45 Valuations,” accessed May 15, 2015, https://www.soa.org/library/newsletters/the-actuary-magazine/2007/june/iss2007june.aspx.
49 Standard & Poor’s Ratings Services, “Diverging Trends,” 3–4.
50 Ibid., 20.
51 Governmental Accounting Standards Board, “Other Postemployment Benefit Accounting and Financial Reporting,” accessed May 26, 2015, http://www.gasb.org/jsp/GASB/GASBContent_C/ProjectPage&cid=1176158482340.
52 Many states have multiple OPEB plans, and researchers aggregated 167 plans to get one set of financial data for each state. (See Appendix A.) GASB Statement 74, “Financial Reporting for Postemployment Benefit Plans Other Than Pension Plans,” and GASB Statement 75, “Accounting and Financial Reporting for Postemployment Benefits Other Than Pensions,” will replace GASB statements 25, 43, 45, 50, and 57. Governmental Accounting Standards Board, Statement No. 75 of the Governmental Accounting Standards Board: Accounting and Financial Reporting for Postemployment Benefits Other Than Pensions (2015), http://www.gasb.org/jsp/GASB/Document_C/GASBDocumentPage?cid=1176166144750&acceptedDisclaimer=true; and Governmental Accounting Standards Board, Statement No. 74 of the Governmental Accounting Standards Board: Financial Reporting for Postemployment Benefit Plans Other Than Pension Plans (2015), http://www.gasb.org/jsp/GASB/Document_C/GASBDocumentPage?cid=1176166143121&acceptedDisclaimer=true.
53 Governmental Accounting Standards Board, “Other Postemployment Benefit Accounting and Financial Reporting.”
54 Ibid.
See Appendix D to learn to which retirees these data are applicable, by state. See Appendix A to review the methodology researchers used to determine which groups of retirees were included in the analysis.

43
55 Paul Zorn, “The GASB’s New OPEB Exposure Drafts,” GRS Insight, October 2014, 1–2, accessed Oct. 7, 2015, http://www.gabrielroeder.com/wp-content/uploads/2014/11/GRS-Insight-2014-Oct-Final.pdf.
56 Ibid., 5.
57 Governmental Accounting Standards Board, “Other Postemployment Benefit Accounting and Financial Reporting.”
58 Ibid.
59 Governmental Accounting Standards Board, Statement No. 75, vi.
60 Ibid.
61 The Pew Charitable Trusts, Promises With a Price: Public Sector Retirement Benefits (2007), 15–16, http://www.pewtrusts.org/~/media/legacy/uploadedfiles/wwwpewtrustsorg/reports/state_policy/pension20reportpdf.pdf.
62 Ibid., 16.
63 Governmental Accounting Standards Board, Other Postemployment Benefits, 4.
64 Ibid.
65 Ibid.
66 Society of Actuaries, “Issues in Selecting the Discount Rate.”
67 Ibid.
68 Ibid.
69 Standard & Poor’s Ratings Services, “Diverging Trends,” 4.
70 McArdle, Neuman, and Huang, Retiree Health Benefits, 3.
71 States that did not begin contributing to the Medicare program for their employees until years after the program was implemented have a small number of Medicare-age retirees who are ineligible for Medicare. The costs for these retirees are similar to the cost of early retirees.
72 Coggburn, Daley, and Kearney, “Public Sector Retiree Health Care Benefits,” 220.
73 Ibid., 220, 23.
74 Ibid., 223.
75 See, for example, Buck Consultants, Actuarial Report on the Valuation of the Plan as of June 30, 2013, Arizona State Retirement System (2014), 86, https://www.azasrs.gov/sites/default/files/pdf/Plan_Valuation.pdf.
76 Gary Claxton and Nirmita Panchal, “Cost-Sharing Subsidies in Federal Marketplace Plans,” Henry J. Kaiser Family Foundation (2015), http://k�.org/health-costs/issue-brief/cost-sharing-subsidies-in-federal-marketplace-plans. Cost sharing includes out-of-pocket costs retirees pay, in addition to their premium costs, to cover medical care, including copays, deductibles, and coinsurance. The data reported in this analysis does not include cost-sharing data.
77 McArdle, Neuman, and Huang, Retiree Health Benefits, 2, 7–8.
78 Ibid.
79 Ibid.
80 Aaron McKethan, Terry Savela, and Wesley Joines, What Public Employee Health Plans Can Do to Improve Health Care Quality: Examples From the States, The Commonwealth Fund (2008), http://www.commonwealthfund.org/usr_doc/McKethan_whatpublicemployeehltplanscando_1097.pdf.
81 David Pratt Ward, Accounting for the Implicit Rate Subsidy in OPEB Plans, Society of Actuaries, accessed May 15, 2015, https://www.soa.org/files/sections/Accounting-for-the-Implicit-Rate-Subsidy-in-OPEB-Plans.pdf.
82 Centers for Medicare & Medicaid Services, “How Marketplace Plans Set Your Health Insurance Premiums,” accessed May 20, 2015, https://www.healthcare.gov/lower-costs/how-plans-set-your-premiums.
83 The di�erence in total premium cost for active employees and early retirees can be substantial. For example, in fiscal 2013, Louisiana did not “blend” its active employee and early retiree health premiums. The total premium for one of its plans was $544 and $1,015 for active employees and early retirees, respectively, for individual coverage. Ward, Accounting for the Implicit Rate Subsidy; The Pew Charitable Trusts and the John D. and Catherine T. MacArthur Foundation, State Employee Health Plan Spending: An Examination of Premiums, Cost Drivers, and Policy Approaches (2014), http://www.pewtrusts.org/~/media/Assets/2014/08/StateEmployeeHealthCareReportSeptemberUpdate.pdf.
See Appendix D to learn to which retirees these data are applicable, by state. See Appendix A to review the methodology researchers used to determine which groups of retirees were included in the analysis.

44
84 Figures 3 and 4 show the contribution method for Medicare-eligible recent retirees. Idaho, Kentucky, Nevada, Oregon, and West Virginia have changed their contribution method for new hires—Idaho provides no coverage, Nevada, Oregon, and West Virginia provide coverage but no contribution, and Kentucky provides a fixed-dollar contribution. See Appendices C and D.
85 Idaho does not o�er health coverage to its existing Medicare-eligible retirees and does not o�er coverage to early retirees who were hired after June 30, 2009. However, it does provide coverage and a premium contribution to the early retirees who were hired before July 1, 2009. Indiana and Nebraska do not o�er health coverage for their Medicare-eligible retirees.
86 Structures for managing state and local government health care and OPEB liabilities vary from state to state. State CAFRs report OPEB liabilities for health care plans that are run, managed, or financed by the state, which may or may not include local government retiree health care benefits. Byron Lutz and Louise Sheiner, The Fiscal Stress Arising From State and Local Retiree Health Obligations, The National Bureau of Economic Research (2014), http://www.nber.org/papers/w19779. Information on the inclusion of local workers in state reports is in their Table A1.
87 Fitch Ratings, U.S. State OPEB Liabilities: Liability Limited for Most; Uncertain Assumptions Drive Calculations (2014).
88 Most of the states that prorate their premium contributions use years of service as a prorating factor. Several of these states, and also the remaining states that prorate, use other prorating factors, such as the health plan selected by the retiree, the retiree’s age (early retirees), years of state medical plan coverage, or the retiree’s final salary.
89 Thomas Buchmueller, “Price and the Health Plan Choices of Retirees,” Journal of Health Economics 25, no. 1 (2006): 81–101, http://www.sciencedirect.com/science/article/pii/S0167629605000548.
90 Idaho does not o�er health coverage to its existing Medicare-eligible retirees and does not o�er coverage to early retirees who were hired after June 30, 2009. However, it does provide coverage and a premium contribution to the early retirees who were hired before July 1, 2009.
91 Idaho, Indiana, and Nebraska do not o�er health coverage to their Medicare-eligible retirees.
92 Idaho and Washington do not o�er coverage to their early or Medicare-eligible retirees’ dependents. Indiana and Nebraska do not o�er coverage to their Medicare-eligible retirees’ dependents.
93 Idaho, Indiana, and Nebraska do not provide coverage for their Medicare-eligible retirees. Kentucky did not report data for its Medicare-eligible retiree health coverage type.
94 McArdle, Neuman, and Huang, Retiree Health Benefits.
95 Georgia, Illinois, Maine, Minnesota, Ohio, Pennsylvania, Texas, and West Virginia o�er only Medicare Advantage plan coverage to their Medicare-eligible retirees.
96 McArdle, Neuman, and Huang, Retiree Health Benefits.
97 Ibid.
98 Rak and Kasaraneni, “The Value of Medicare Advantage Employer Group Waiver Plans (MA-EGWPs).”
99 Gail Levenson, interview with The Pew Charitable Trusts, Jan. 23, 2015.
100 Kentucky, Nevada, and Rhode Island are among the states that o�er prescription drug coverage or access to prescription drug coverage to their Medicare-eligible retirees; however, data on prescription coverage type are unavailable. Prescription drug coverage is not available to Medicare-eligible retirees in Idaho, Indiana, Mississippi, Nebraska, South Dakota, and Tennessee. Rak and Kasaraneni, “The Value of Medicare Advantage Employer Group Waiver Plans (MA-EGWPs).”
101 May and Liner, “EGWP/Wrap.”
102 Ibid.
103 The Medicare Part D coverage gap, known as the “doughnut hole,” lies between the initial coverage limit and the catastrophic coverage threshold. After a Medicare beneficiary’s costs exceed the initial coverage limit, the beneficiary is financially responsible for a higher cost of prescription drugs until he or she reaches the catastrophic coverage threshold. The ACA reduces the beneficiary’s responsibility from 100 percent of prescription drug costs in this coverage gap to 25 percent of the costs. Michael Nadol, Jim Link, and Adam Benson, “Managing Public-Sector Retiree Health-Care Benefits Under the A�ordable Care Act,” Government Finance Review, spring 2014, http://www.gfoa.com/sites/default/files/GFR_APR_14_10.pdf.
104 Centers for Medicare & Medicaid Services, “About RDS.”
See Appendix D to learn to which retirees these data are applicable, by state. See Appendix A to review the methodology researchers used to determine which groups of retirees were included in the analysis.

45
105 Barry Eyre and Mark Whitcher, “OPEB Liability—Does It Matter?” Benefits Magazine, May 2013, http://www.ifebp.org/inforequest/0163756.pdf; and May and Liner, “EGWP/Wrap.” Governmental Accounting Standards Board rules permit states to include subsidies from EGWPs on their balance sheets, reducing their OPEB liabilities.
106 Centers for Medicare & Medicaid Services, Medicare Prescription Drug Benefit Manual, Pub. 100-18 (2008), https://www.cms.gov/Regulations-and-Guidance/Guidance/Transmittals/downloads/R6PDB.pdf.
107 Levenson, interview.
108 Centers for Medicare & Medicaid Services, “Part B Costs”; and Juliette Cubanski and Tricia Neuman, Medicare’s Income-Related Premiums: A Data Note, Henry J. Kaiser Family Foundation (2015), http://k�.org/medicare/issue-brief/medicares-income-related-premiums-a-data-note/.
109 Moody’s Investors Service, US Municipal Governments Can Leverage Federal Medicare to Lower OPEB Costs (2014), http://media.navigatored.com/documents/Medicare+Helping+Muni+Governments+Lower+OPEB+Costs2.pdf.
110 Governmental Accounting Standards Board, Financial Reporting for Postemployment Benefit Plans Other Than Pension Plans (2014), http://www.gasb.org/jsp/GASB/Document_C/GASBDocumentPage?cid=1176164131875&acceptedDisclaimer=true.
111 Governmental Accounting Standards Board, “Summary of Statement No. 45.”
112 Arkansas Department of Finance and Administration, Comprehensive Annual Financial Report (2013), 140, http://www.dfa.arkansas.gov/o¯ces/accounting/Documents/cafr2013.pdf; and Massachusetts O¯ce of the Comptroller, Comprehensive Annual Financial Report (2013), http://www.mass.gov/legis/journal/desktop/2013/cafr.pdf.
113 Bureau of Economic Analysis, “Table 1.1.9. Implicit Price Deflators for Gross Domestic Product (Annual),” accessed May 7, 2015, http://www.bea.gov/iTable/iTable.cfm?reqid=9&step=3&isuri=1&903=13#reqid=9&step=3&isuri=1&903=13.
114 Ibid.
115 U.S. Census Bureau, “Annual Estimates of the Resident Population for the United States, Regions, States, and Puerto Rico: April 1, 2010 to July 1, 2013,” State Totals: Vintage 2013, accessed May 7, 2015, http://www.census.gov/popest/data/state/totals/2013/index.html.
116 U.S. Census Bureau, “Annual Survey of State Government Finances.”
117 Centers for Medicare & Medicaid Services, “Financial Management Report for FY 2013,” CMS-64 Quarterly Expense Reports, accessed Jan. 31, 2015, http://medicaid.gov/medicaid-chip-program-information/by-topics/data-and-systems/mbes/downloads/financial-management-report-fy2012-13.zip; and Milliman Inc., Milliman Atlas of Public Employer Health Plans (2014), http://us.milliman.com/Solutions/Services/Milliman-Atlas-of-Public-Employer-Health-Plans.
118 The set of criteria applicable to some or all of the workers retiring today, or hired today and in the future, is listed for each state.
See Appendix D to learn to which retirees these data are applicable, by state. See Appendix A to review the methodology researchers used to determine which groups of retirees were included in the analysis.

macfound.org pewtrusts.org
pewtrusts.org/healthcarespending