State Restructuring Models \u0026 Their Implications on Regional Development
137
TRIBHUVAN UNIVERSITY INSTITUTE OF ENGINEERING PULCHOWK CAMPUS THESIS NO: “State Restructuring Models and Their Implications on Regional Development” By: Amrit Acharya A THESIS SUBMITTED TO THE DEPARTMENT OF ARCHITECTURE & URBAN PLANNING IN PARTIAL FULFILMENT OF THE REQUIREMENTS FOR THE DEGREE OF MASTER OF SCIENCE IN URBAN PLANNING DEPARTMENT OF ARCHITECTURE & URBAN PLANNING LALITPUR, NEPAL NOVEMBER, 2014
Transcript of State Restructuring Models \u0026 Their Implications on Regional Development

TRIBHUVAN UNIVERSITY
INSTITUTE OF ENGINEERING
PULCHOWK CAMPUS
THESIS NO:
“State Restructuring Models and Their Implications on Regional
Development”
By:
Amrit Acharya
A THESIS
SUBMITTED TO THE DEPARTMENT OF ARCHITECTURE & URBAN
PLANNING IN PARTIAL FULFILMENT OF THE REQUIREMENTS FOR
THE DEGREE OF MASTER OF SCIENCE IN URBAN PLANNING
DEPARTMENT OF ARCHITECTURE & URBAN PLANNING
LALITPUR, NEPAL
NOVEMBER, 2014

ii
DECLARATION
I declare that this Thesis has not been previously accepted in substance for any degree
and is not being concurrently submitted in candidature for any degree. I state this
dissertation is the result of my own independent work/ investigation, except where
otherwise stated. I, hereby, give consent for my dissertation, if accepted, to be available
for photocopying and understand that any reference to or quotation from my thesis will
receive an acknowledgement.
Sign_____________________________
(Amrit Acharya)
Date: ……………………………….

iii
ACKNOWLEDGEMENTS
I would like to express my profound gratitude to Dr. Jibgar Joshi for successfully
guiding me through the various stages of this thesis. He not only provided me support
for acquiring deep insight into the subject, but also was prompt in offering constructive
criticism as and when required, and that too is a must subtle way as possible. The credit
for anything good about my research work is attributed to his guidance.
I am indebted to Prof. Dr. S.R Tiwari whose valuable comments guided in many ways
to make further improvements to this report at various stages. I am grateful to Dr. Kirti
Kusum Joshi, for his valuable comments and suggestion.
I wish to express my gratitude to Prof. Dr. Sudha Shrestha, Program Coordinator
M.Sc. Urban Planning for her continual support. I wish to extend my thanks to Mr.
Rabindra Dawadi for his valuable suggestion during conceptualization of this research
work. His suggestions are highly commendable.
I am very obliged to the staffs of parliament secretariat, Singha Durbar who helped me
by providing hard copies of the reports submitted by State Restructuring Committee
and State Restructuring Commission. I am also obliged to my friends who helped me
during data collection and GIS analysis.
The completion of this study is also dependent upon the patience and understanding
shown by my wife Shringar. I wish my heartiest love to her.
iv
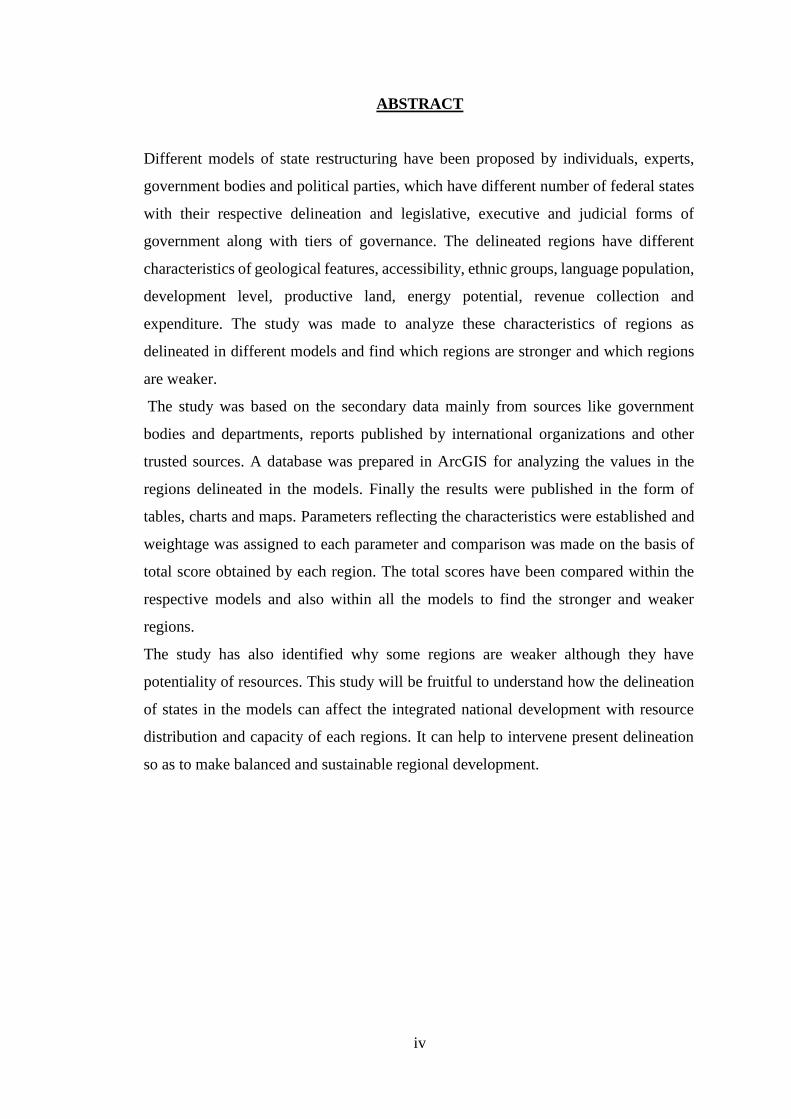
ABSTRACT
Different models of state restructuring have been proposed by individuals, experts,
government bodies and political parties, which have different number of federal states
with their respective delineation and legislative, executive and judicial forms of
government along with tiers of governance. The delineated regions have different
characteristics of geological features, accessibility, ethnic groups, language population,
development level, productive land, energy potential, revenue collection and
expenditure. The study was made to analyze these characteristics of regions as
delineated in different models and find which regions are stronger and which regions
are weaker.
The study was based on the secondary data mainly from sources like government
bodies and departments, reports published by international organizations and other
trusted sources. A database was prepared in ArcGIS for analyzing the values in the
regions delineated in the models. Finally the results were published in the form of
tables, charts and maps. Parameters reflecting the characteristics were established and
weightage was assigned to each parameter and comparison was made on the basis of
total score obtained by each region. The total scores have been compared within the
respective models and also within all the models to find the stronger and weaker
regions.
The study has also identified why some regions are weaker although they have
potentiality of resources. This study will be fruitful to understand how the delineation
of states in the models can affect the integrated national development with resource
distribution and capacity of each regions. It can help to intervene present delineation
so as to make balanced and sustainable regional development.

v
TABLE OF CONTENTS
Chapter Page
Certificate i
Declaration ii
Acknowledgment iii
Abstract iv
Table of Contents v-ix
List of Tables x-xi
List of Figures xii
List of Charts xiii
List of Acronyms xiv
1. CHAPTER I: INTRODUCTION ....................................................................... 1
1.1 Introduction ..................................................................................................... 1
1.2 Problem Statement .......................................................................................... 3
1.3 Objectives: ....................................................................................................... 5
1.4 Research Question: .......................................................................................... 6
1.5 Expected Outcomes ......................................................................................... 6
1.6 Scope & Limitations........................................................................................ 6
2. CHAPTER II: LITERATURE REVIEW ......................................................... 7
2.1 State Restructuring & Regional Development ................................................ 7
2.2 Theoretical Concept of Regionalization .......................................................... 7
2.2.1 Economic (Export) Base Theory ............................................................. 8
2.2.2 Centre Periphery Theory .......................................................................... 8
2.2.3 Industrial Location Theory ...................................................................... 8
2.2.4 Central Place Theory................................................................................ 9
vi
2.2.5 Growth Pole Theory ................................................................................. 9
2.3 Review of Regional Development Efforts in Nepal........................................ 9
2.4 Recent Political Development in Nepal ........................................................ 11
2.4.1 Parliamentary Monarchy (1990-1996) ................................................... 11
2.4.2 Maoist Insurgency (1996) ...................................................................... 11
2.4.3 Royal Massacre (2001) .......................................................................... 11
2.4.4 Suspension of Parliament and Loktantra Andolan (2005-2007)............ 11
2.4.5 Establishment of Federal Republic (2007-2008) ................................... 12
2.5 Federalism ..................................................................................................... 12
2.6 Federal Structure and Interregional Linkages ............................................... 16
2.7 State Restructuring Models ........................................................................... 17
2.8 Concept of Political Parties ........................................................................... 17
2.9 Proposed Federal Models .............................................................................. 20
2.10 Representative Federal Models ..................................................................... 22
2.11 The Three Models ......................................................................................... 22
3. CHAPTER III: METHODOLOGY ................................................................. 27
3.1 Study Area ..................................................................................................... 27
3.2 Data Collection .............................................................................................. 28
3.3 Data Analysis and Synthesis ......................................................................... 29
3.4 Method of Analysis ....................................................................................... 30
4. CHAPTER IV: PROFILE OF ECODEVELOPMENT REGIONS .............. 31
4.1 Area in Sq. Km .............................................................................................. 32
4.2 Population Distribution, 2011 ....................................................................... 32
4.3 Population Density (Sq. Km) and Population Growth .................................. 33
4.4 Strategic Road Length, Density and Influenced Population ......................... 34
5. CHAPTER V: COMPARATIVE ANALYSIS OF MODELS ....................... 36
5.1 Population & Area ......................................................................................... 36
5.1.1 Committee Model (Model A): ............................................................... 36
5.1.2 Commission Model (Model B): ............................................................. 39
5.1.3 Model Agreed Upon by Parties (Model C): ........................................... 42
5.2 Share of Major Ethnic Groups ...................................................................... 44

vii
5.2.1 Ethnic Share in Model A & Model B: ................................................... 47
5.2.2 Ethnic Share in Model C: ....................................................................... 49
5.3 Land Capability ............................................................................................. 50
5.3.1 Land Capability (Arable Land & Slope) in Model A ............................ 52
5.3.2 Land Capability (Arable land & Slope) in Model B .............................. 54
5.3.3 Land Capability (Arable land & Slope) in Model C .............................. 55
5.4 Road Density and Development Rank .......................................................... 56
5.4.1 Road Density and Development Rank in Model A ............................... 57
5.4.2 Road Density and Development Rank in Model B ................................ 59
5.4.3 Road Density and Development Rank in Model C ................................ 61
5.5 Energy Potentiality ........................................................................................ 62
5.5.1 Hydropower Potentiality in Model A .................................................... 63
5.5.2 Hydropower Potentiality in Model B ..................................................... 64
5.5.3 Hydropower Potentiality in Model C ..................................................... 65
5.6 Revenue to Expenditure (R/E) Ratio and HDI .............................................. 66
5.6.1 (R/E) Ratio & HDI in Model A ............................................................. 67
5.6.2 (R/E) Ratio & HDI in Model B.............................................................. 68
5.6.3 (R/E) Ratio & HDI in Model C.............................................................. 70
6. CHAPTER VI: RESULTS ................................................................................ 72
6.1 Results ........................................................................................................... 72
6.2 Weighted Analysis & Ranking of States ....................................................... 79
6.3 Analysis of Result: ........................................................................................ 83
6.3.1 Population Distribution and Density ...................................................... 83
6.3.2 Major Ethnic Share & State Nomenclature ........................................... 83
6.3.3 Land Capability Distribution ................................................................. 84
6.3.4 Road Density and Development Rank ................................................... 84
6.3.5 Energy Potentiality................................................................................. 85
6.3.6 (R/E) Ratio ............................................................................................. 85
6.3.7 HDI ........................................................................................................ 86

viii
6.4 Overall Ranking of States ............................................................................. 87
7. CHAPTER VII: FINDINGS AND DISCUSSION .......................................... 91
7.1 Models and Regional Development .............................................................. 91
7.2 Contribution to Regional Development ........................................................ 91
7.2.1 Committee Model (Model A): ............................................................... 91
7.2.2 Commission Model (Model B): ............................................................. 92
7.2.3 Agreed Model (Model C)....................................................................... 93
7.3 Coalescing of Strong & Weak States ............................................................ 94
7.4 Rights over resources .................................................................................... 94
7.5 Federalism as Boon ....................................................................................... 95
7.6 Power Sharing ............................................................................................... 95
7.7 Financial Capacity ......................................................................................... 95
8. CHAPTER VIII: CONCLUSION AND RECOMMENDATION ................. 96
8.1 Positive Impacts ............................................................................................ 96
8.2 Negative Impacts ........................................................................................... 96
8.3 Further Research Area Topics ....................................................................... 98
REFERENCES…………………………………………………………………… 99
APPENDICES .......................................................................................................... 101
APPENDIX- I: Table Showing Population Share of Ethnic Groups ...................... 102
APPENDIX -II: Area of Arable Land by Eco-development Region ....................... 104
APPENDIX –III: Table Showing Development Rank & Road Density ................... 105
APPENDIX- IV: Map Showing Population Distribution & Density in Model A ..... 106
APPENDIX- V: Map Showing Population Distribution & Density in Model B ..... 107
APPENDIX- VI: Map Showing Population Distribution & Density in Model C ..... 108
APPENDIX- VII: Map Showing Ethnic Share in Model A ...................................... 109
APPENDIX- VIII: Map Showing Ethnic Share in Model B ..................................... 110
APPENDIX- IX: Map Showing Ethnic Share in Model C ....................................... 111
APPENDIX- X: Map Showing Arable Land in Model A ....................................... 112
APPENDIX- XI: Map Showing Arable Land in Model B ....................................... 113
APPENDIX- XII: Map Showing Arable Land in Model C ...................................... 114
APPENDIX -XIII: Map Showing Road Density & Development Rank in Model A 115
APPENDIX-XIV: Map Showing Road Density & Development Rank in Model B 116
ix
APPENDIX-XV: Map Showing Road Density & Development Rank in Model C . 117
APPENDIX-XVI: Map Showing Energy Potential & HDI in Model A ................... 118
APPENDIX-XVII: Map Showing Energy Potential & HDI in Model B ................. 119
APPENDIX-XVIII: Map Showing Energy Potential & HDI in Model C ................. 120
APPENDIX-XIX: Map Showing (R/E) Ratio in Model A ...................................... 121
APPENDIX-XX: Map Showing (R/E) Ratio in Model B ...................................... 122
APPENDIX-XXI: Map Showing (R/E) Ratio in Model C ...................................... 123

x
LIST OF TABLES
Table 1 List of Countries Adopting Federalism .......................................................... 14
Table 2 Major Political Parties of Nepal...................................................................... 17
Table 3 Concept of Major Political Parties to Federal Structure ................................. 18
Table 4 Proposed Federal Models................................................................................ 20
Table 5 Different Federal Models ................................................................................ 26
Table 6 List of Data Collected with Type & Source ................................................... 28
Table 7 Area of Eco-Development Regions ................................................................ 32
Table 8 Population Distribution in Eco Development Regions ................................... 32
Table 9 Population Density 2011 and Growth Rate .................................................... 33
Table 10 Strategic Road Length, Density & Influenced Population ........................... 34
Table 11 Committee Model: Population & Area ......................................................... 36
Table 12 Commission Model: Population & Area ...................................................... 39
Table 13 Model Agreed by Parties: Population & Area .............................................. 42
Table 14 Share of Major Ethnic Groups ...................................................................... 44
Table 15 Ethnic Share in Eco Development Region ................................................... 45
Table 16 Ethnic Share in Model A & Model B .......................................................... 48
Table 17 Ethnic Share in Agreed Model (Model C) .................................................... 49
Table 18 Arable Land of Eco Development Regions .................................................. 51
Table 19 Road Density & Development Rank in Committee Model .......................... 57
Table 20 Road Density & Development Rank in Commission Model ........................ 59
Table 21 Road Density & Development Rank in Agreed Model ................................ 61
Table 22 List of Hydropower Projects ......................................................................... 62
Table 23 Energy Potential in Committee Model ......................................................... 63
Table 24 Energy Potential in Commission Model ....................................................... 64
Table 25 Energy Potential of Agreed Model ............................................................... 65
Table 26 (R/E) & HDI in Committee Model ............................................................... 67
Table 27 (R/E) Ratio & HDI in Commission Model ................................................... 68
Table 28 (R/E) Ratio & HDI in Agreed Model ........................................................... 70
Table 29 Table showing Indicator values in Committee Model (Model A) ................ 73
Table 30 Table Showing Indicator Values in Commission Model (Model B) ............ 75
Table 31 Table Showing Indicator Values in Agreed Model (Model C) .................... 77
Table 32 Table showing Parameter Weightage ........................................................... 79

xi
Table 33 Table showing Rank Score of States in Committee Model .......................... 80
Table 34 Table Showing Rank Score of States in Commission Model ....................... 81
Table 35 Table of Rank Score of States in Agreed Model .......................................... 82
Table 36 Overall Ranking of States-I .......................................................................... 88
Table 37 Overall Ranking of States-II ......................................................................... 89

xii
LIST OF FIGURES
Figure 1 Growth Axes .............................................................................................. 10
Figure 2 SR Model Proposed by State Restructuring Committee ........................... 23
Figure 3 SR Model Model Proposed by State Restructuring Commission ............. 24
Figure 4 SR Model Agreed Upon by Political Parties in May 2012 ....................... 25
Figure 5 Raster Data Model ..................................................................................... 29
Figure 6 Vector Data Model .................................................................................... 29
Figure 7 Map showing Parameter values in Model A ............................................. 74
Figure 8 Map showing Parameter values in Model B.............................................. 76
Figure 9 Map showing Parameter values in Model C............................................... 78

xiii
LIST OF CHARTS
Chart 1 Chart Showing Methodology of Study ....................................................... 27
Chart 2 Population Distribution in Eco development Regions ................................ 33
Chart 3 Population Growth Rate 2001-2011 ........................................................... 34
Chart 4 Strategic Road in Development Regions .................................................... 35
Chart 5 Population Distribution in Model A............................................................ 38
Chart 6 Population Density in Model A .................................................................. 38
Chart 7 Population Distribution in Model B ............................................................ 41
Chart 8 Population Density in Model B ................................................................... 41
Chart 9 Population Distribution in Model C ............................................................ 43
Chart 10 Population Density in Model C ................................................................... 43
Chart 11 Area of Arable land in Eco development Regions ...................................... 52
Chart 12 Area of Arable Land in Model A ................................................................ 52
Chart 13 Percentage Are of Slope in Model A .......................................................... 53
Chart 14 Area of Arable Land in Model B ................................................................ 54
Chart 15 Percentage Area of Slopes in Model B ...................................................... 55
Chart 16 Area of Arable Land in Model C ................................................................ 55
Chart 17 Road Density in Model A ........................................................................... 57
Chart 18 Road Density in Model B............................................................................ 59
Chart 19 Road Density in Model C............................................................................ 61
Chart 20 Hydropower Potential in Model A .............................................................. 63
Chart 21 Hydropower Potential in Model B .............................................................. 65
Chart 22 Hydropower Potential in Model C .............................................................. 66
Chart 23 (R/E) & HDI in Model A ............................................................................ 67
Chart 24 (R/E) Ratio & Development Rank in Model B ........................................... 69
Chart 25 (R/E) Ratio & Development Rank in Model C ........................................... 70

xiv
LIST OF ACRONYMS
B.S Nepali Calendar (Bikram Sambat)
VDC Village Development Committee
CA Constituent Assembly
CBS Central Bureau of Statistics
SRC State Restructuring Committee/Commission
EDR Eastern Development Region
CDR Central Development Region
WDR Western Development Region
MWDR Mid-Western Development Region
FWDR Far Western Development Region
MBKM Mithila Bhojpura Koch Madhesh
MMB Madhesh Mithila Bhojpura
LAT Lumbini Abadh Tharuwan
KK Karnali Khaptad
ICIMOD International Centre for Integrated Mountain Development
SPCBN Support to Participatory Constitution Building in Nepal
NPC National Planning Commission
SRN Strategic Road Network
DoR Department of Roads
HDI Human Development Index
Km Kilometer
Sq.km Square Kilometers
Ha/Hec. Hectares
MW Megawatt
PP Page numbers
Ph.D. Doctor of Philosophy

1
CHAPTER I
1. INTRODUCTION
1.1 Introduction
“Region” is taken as the unit of land on the earth that is often chosen, defined and
planned (Dahal 2007). It is an area usually considered as an entity for the purpose of
analysis, administration, planning and policy. The regional dimension is a very
important aspect of development which takes into consideration the essence of spatial
elements. Dahal believes that the analysis of the spatial dimension of the development
is not an easy task since it requires high level of spatial knowledge. In this context,
Friedman in 1964 has outlined the reasons why the economic growth of the regions is
spatially distributed.
Friedman (1964) stated that “Space economy normally evolves from a number of small
and relatively closed regional economies into a fully integrated national economy in
which the significance of locational differences is sharply reduced.” So, it is quite
relevant that planning for regional development entices the formulation of strategic
regional policies as a part of regional planning for integrated national development
where every regions of the country can contribute to meet the national objectives
making an effective use of natural, human & socio-cultural resources along with capital.
Economic (Export) Base, Sector, Centre Periphery, Industrial Location, Central Place
and Growth Pole are the principal regional planning theories.
Regional Development has been regarded as an issue since the Third Plan (1965-1970)
in Nepal but exercises have seemed to be limited. Since 1970, “Strategy” for regional
development has been occupying a place in the successive periodic plans of
Government of Nepal. The Fourth Plan (1970-75), for the first time, adopted an
elaborate spatial strategy for development that formalized the creation of four
development regions in 1972 (Gurung 1969). Growth Centred Approach was
incorporated as one of the major policy issues thereby concentrating the limited
available resources along the growth axes. Later, it was replaced by the concept of
diffused activities in the development regions. During the last two decades, the major
shift has been on the development of remote areas and backward and poverty groups
(C.B. Shrestha, 2007). The process of reduction of regional disparity is slow due to the

2
planning approach with the primacy of sectoral planning (Gurung, 1999; Shrestha,
2006).
The need of an intermediate level in between the Central and Local Level of
government was felt and hence 14 zones were created long ago during the Panchayat
period. But these zones were limited to maintaining law and order rather than carrying
any development works and eventually dissolved in 1990 (Joshi 2006). The people’s
movement in 2006, with the end of a decade long insurgency and monarchy, opted for
the election of constituent assembly. These incidents provoked a situation for state
restructuring in Nepal.
State restructuring issue was the prime issue in the failure of the first constituent
assembly election in Nepal, 2008 and this called for another CA election in 2013.
Federal System has been politically endorsed as a part of state restructuring in Nepal.
But it is still to be decided about the principles or criteria on the basis of which the
delineation of the federal states is to be made. Political parties, ethnic groups and
experts have raised their own models of state restructuring and these models have
divergence set up in federalism. The forms and tiers of governance, head of the state
and devolution of authority are different in these models. “Efforts are underway for
making changes towards the creation of new Nepal with a view to make a Prosperous
Modern and Just Nepal. While the thrust on the economic front is a welcome step,
failure to use the tools of regional planning and sustainable development make one
sceptical about the changes that are taking place more recently”(Joshi 2009).
Regionalism has started to rise up the political agenda in many European countries,
leading to growing experiments with both policy devolution and political devolution,
for instance in France, Italy, Spain and the UK. Paralleling this rise in policy interest
has been a growing academic interest in the ways in which regionalism has been
inserted into state-restructuring processes. (Haughton & Counsell, 2004). It has also
taken the political agenda with the end of 10 ten years insurgency period followed by
people’s movement during the recent years in Nepal. Resource allocation within diverse
socio economic group and extreme physiographic conditions has been a major issue in
state restructuring in Nepal.
This study aims to find out the impacts of representative state restructuring models of
federalism on regional development.

3
Rationale
Voices have been raised against the centralized system of Nepal. These include
domination of the country from Kathmandu (excessive centralism), domination of the
country by a limited group (caste domination), discrimination on caste/ethnic lines, and
failure to meet the needs of the mass of the people (UNDP 2008). Nepal has two tiers
of governance at present, the centre and districts. The national government is too busy
to deal with the local issues and there are no binding obligations for the centre to give
adequate attention to local affairs (Joshi 2009). A coordinating level of government has
been sought in the regional level that would link the centre and the districts for the
devolution of power and resource mobilization. State Restructuring provides the
framework to make an effective regional level government.
The regional level government would be helpful to strengthen local national linkages.
It would help to reduce regional disparity and discrimination by providing authoritative
power to the local indigenous people. It would also provide markets for local economy
and also establish rights over the resources within their regional territory. It will help
fulfil the gaps between the centre and district and promote integrated national
development.
Only a few countries of the world have adopted federalism and not all of them are
successful. Economic Prosperity, good governance and democratic culture are the fruits
of successful federalism (Joshi 2009). The form of federalism may depend upon the
political culture, resource base and various other intangible factors.
1.2 Problem Statement
In planning for regional growth in Nepal at present, there are various problems related
to physical, socio-cultural, economic, environmental and other aspects.
Physical Aspects:
The natural and built features make up the physical environment of any area. Natural
features are the resources like land, water bodies and vegetation. These resources are
fixed but the demand is ever increasing and overconsumption has resulted in their
extinction. On the other hand, infrastructures like transportation, water supply and
services are scarcely distributed. Weak resource base of the federal regions is another

4
issue in state restructuring. It is still to be recognized, the growth and development
centres that are growing spontaneously. There is also a need to consider national space
before state restructuring.
Socio-Cultural Aspects:
Nepal has diversity in ethnicity, culture, language, costumes and tradition within its
population according with the physiographic division of mountain, hill and Terai. Lack
of social inclusion and participation of disadvantaged groups and minorities in planning
is another important issue. Rising ethnic tensions during the recent years has resulted
in the will for federalism based on ethnicity rather than resource and infrastructure
distribution among certain ethnic groups.
Economic Aspects:
There are limited employment opportunities in Nepal. Unemployment has induced the
youth population to go abroad for earning their livelihood. Meanwhile, per capita
income of the people is low as compared to other developing countries of the world.
Infrastructure financing depends on the funds from International development agencies,
INGOs and bilateral aids. Land ownership within small population and sectoral
budgetary system. Higher administrative costs of governance and tedious process to
channel finance flow from central to local or action level with a huge time lag. Missing
functional linkages between villages that contribute to regional and national economy.
Environmental Aspects:
Forest areas are cautiously decreasing as per the density of tress although the decrease
in total area covered has not been noticed yet. The haphazard establishment of quarries
by the river side for river bed materials has deepened the river bed narrowing its surface
exposure. It has also resulted in the change in river course and flooding. Unscientific
Cutting of slopes for road construction has considerably increased the problems of soil
erosion and slope failure. The rivers in the urban areas are polluted due to the discharge
of untreated effluents.
Political Aspects:
It has been more than two decades of political instability in Nepal. Insurgency, royal
take over, people’s movement, election of the constituent assembly were the major

5
political incidents that occurred during this period. There is lack of clear majority of
any political party in the recent CA election. People are confused with the changing
attitudes of the politicians for their personal .It is unknown what the politicians really
want and what they advocate. There is no such a thing as “National Interest”.
Other Aspects:
Weak institutional framework and mere coordination within the departments of
government are the other problems related to planning in Nepal. Highly centralized
governance system with the absence of local government representatives for more than
a decade has raised the issue of governance and service deliverability ranging from
regional to local level. The craving for power and tendency to centralize, and this
problem may even grow bigger under federal system as tiers of governance increase.
State restructuring will provide a basis for the formation of regions. It will help in the
identification of the resources in the regions and promote their economic importance.
It would consider participatory approach for the inclusion of backward group and
indigenous people in decision making process by providing power in their own hands.
It would help to establish functional linkages between different regions and promote
economic development. Eventually, it would act as a solution to the problems of
regional imbalance, exclusion, national disintegration and weak economic base.
1.3 Objectives:
The main objectives of this research are:
a) To identify different representative models of federalism put forward by
political parties, constitutional bodies and experts as a part of state restructuring.
b) To analyse spatially, these models based on resource distribution, road
infrastructure, industrial location, revenue collection and expenditure where
applicable.
c) To find out the impacts of these models on the different aspects of regional
development.

6
1.4 Research Question:
My research questions are:
1. What resources are available in the regions envisaged in the models and how
are they distributed?
2. How can these models enhance regional development in Nepal?
1.5 Expected Outcomes
This research is expected to provide a comparative output to find the feasibility of
regions of each model & their impacts on regional development with respect to
physical, socio-cultural, economic, environmental and spatial dimensions. It is also
expected to find out the positive and negative impacts of the models in integrated
national development with improved good governance. The results are expected to be
represented in the form of table, charts and maps.
1.6 Scope & Limitations
The limitation of the study will be:
1. The study covers only three representative models of state restructuring.
2. The analysis will be made based on only six quantifiable parameters:
a. Population Distribution & Density
b. Land Capability (Arable Land & Slope)
c. Energy Potentiality
d. Share of Major Ethnic/ Caste Groups
e. Development Rank & HDI
f. Revenue and Expenditure
3. Principles, criteria and bases upon which models have been proposed are not
included in the analysis.
4. These parameters are regarded important but still may not be sufficient.
5. Only “Arable Land” has been considered in Land Capability for analysis.
6. The weightage for parameters are assigned on the importance of parameters
perceived during the study.
7. The study is based on secondary data provided by the departmental sources of
Nepal Government.
7
CHAPTER II
2. LITERATURE REVIEW
2.1 State Restructuring & Regional Development
“State restructuring is something that is directly associated with political re-imagination
of the state as per the spirit of the time and is a continuous process in democracy”
(Bhatta, 2006). It primarily hinges on three organs of the state - the judiciary, legislature
and the executive body. It deals with how best all the three organs of the state can be
made more representative and pro-public so that more and more citizens are collectively
taken into the institutional life of the state and no group/caste/ethnicity/religion is left
behind (Bhatta, 2006). State restructuring mainly involves defining the boundary of the
regions and system of governance with its tiers and devolution of authority.
Wikipedia states “Regional development is the provision of aid and other assistance to
regions which are less economically developed.” It can be achieved through specific
regional development strategies that encompass infrastructural development along with
socio-economic aspects of the regions. Geophysical condition, accessibility, social
infrastructure and feasibility for economic development of the region can guide the
strategies for regional development. These strategies are the necessary conditions for
regional development but still may not be sufficient. The institutional framework
guided by the organs of the state has authority and responsibility as, the other half, to
implement these strategies. When the organs of the state are unable to establish regional
strategies and implement them with sound institutional framework for a long time,
restructuring of the state and its organs is soughed so that every regions can contribute
to integrated national development with the idea of a whole. This can also promote
decentralization, poverty reduction and sustainable regional development.
2.2 Theoretical Concept of Regionalization
Regional development theories seek to explain the delineation criteria of a region
whether it is a formal region characterized by uniformity or homogeneity or a functional
region characterized by interdependence or interrelationship of parts. However, formal
and functional regions may not correlate with administrative need which is necessary
for implementation of any plan. Some regional development theories are:

8
2.2.1 Economic (Export) Base Theory
Developed by R.M Haig in his work on “Regional Plan of New York” in 1928, this
theory assumes that regional economy is the function of basic and non-basic activities.
Basic activities include the production of goods and services for export to other regions
while no basic activities includes goods and service produced for internal consumption.
This indicates that basic activities are the prime movers of regional economy and they
have multiplier effect in it. The multiplier is calculated in terms of employment
generation as:
Multiplier (K) = Employment in Basic + Employment in Non-Basic Activities
Employment in Non-Basic Activities
2.2.2 Centre Periphery Theory
John Friedman in 1966 interpreted the rural urban relation by core and periphery model.
He mentioned that there are three kind of relationship between core and periphery viz.
Independent, High Dependent and Interdependent or symbiotic.
Independent: This relationship occurs in a predominant agrarian economy of rural
regions where market town develops as a center for exchange of surplus agricultural
products and provides basic minimum needs and services to its hinterland. There is a
strong tie between its service area and population. It has no relationship with other
market centers and hierarchy of centers is ruled out.
Highly Dependent: This a relationship where the periphery is exploited by the core.
The centers are highly dependent on their hinterlands with little or no contribution to
hinterland. There is exploitation, one way flow and widening disparity between the core
and periphery in this relationship.
Interdependent: This is symbiotic relation based on mutual beneficial exchanges. The
assumption of the generative relationship is based on the functionally interdependent
system of cities where core and periphery have complementary mutual and harmonious
relationship.
2.2.3 Industrial Location Theory
Alfred Weber in 1909 enunciated the theory of Industrial Location. This theory is based
on the availability of input to industries like land, labour, capital and raw materials for

9
production and market for distribution. There are three main approaches to industrial
location viz. least cost approach, market area analysis and profit maximization
approach. Weber define the least cost approach with the principle that “an entrepreneur
will choose the location where the cost is least”. The cost includes transport and labour
costs.
2.2.4 Central Place Theory
Walter Christaller in 1933 proposed this theory. Centre place is where the service
activities are concentrated. The central places are arranged in space in a hierarchy to
share the market uniformly. Christaller introduced two concepts, Threshold population
and market range to explain the central place. The competition among service provider
for individual service gives the range of service and eventually hexagonal market of a
central place emerges with hierarchy.
2.2.5 Growth Pole Theory
Perraux in 1955 propounded the growth pole theory with the postulates that “Growth
does not appear everywhere and all at once. It appears at points or development poles
with variable intensities and spread along the diverse channels with varying terminal
effects to the whole of nation.” Growth pole is an economic space whereas growth
point or centre is a geographic space. Growth axes are the channels of growth flow. The
concept of this theory are ‘leading industries’ with strong forward and backward
linkage with other sectors or industries, ‘polarization’ with internal, external &
urbanization economies and ‘spread effects’ like trickle down effects.
2.3 Review of Regional Development Efforts in Nepal
In the Third Plan (1965-1970) Nepal was divided into three regions on the basis of
watershed areas of Koshi, Gandaki and Karnali. It was only in the Fourth Plan (1970-
1975) that Regional development strategy was first introduced in Nepal. The strategy
was formalized with the delineation of four development regions in 1972. It was when
the first attempt to incorporate spatial dimension and envisaged a series of north-south
growth axes linking diverse natural regions Himalayas, hills and Terai. Four growth
axes north to south were outlined at four development regions for balanced
development of each region thereby reducing regional disparity. The four growth axes
with their respective growth poles were:
10
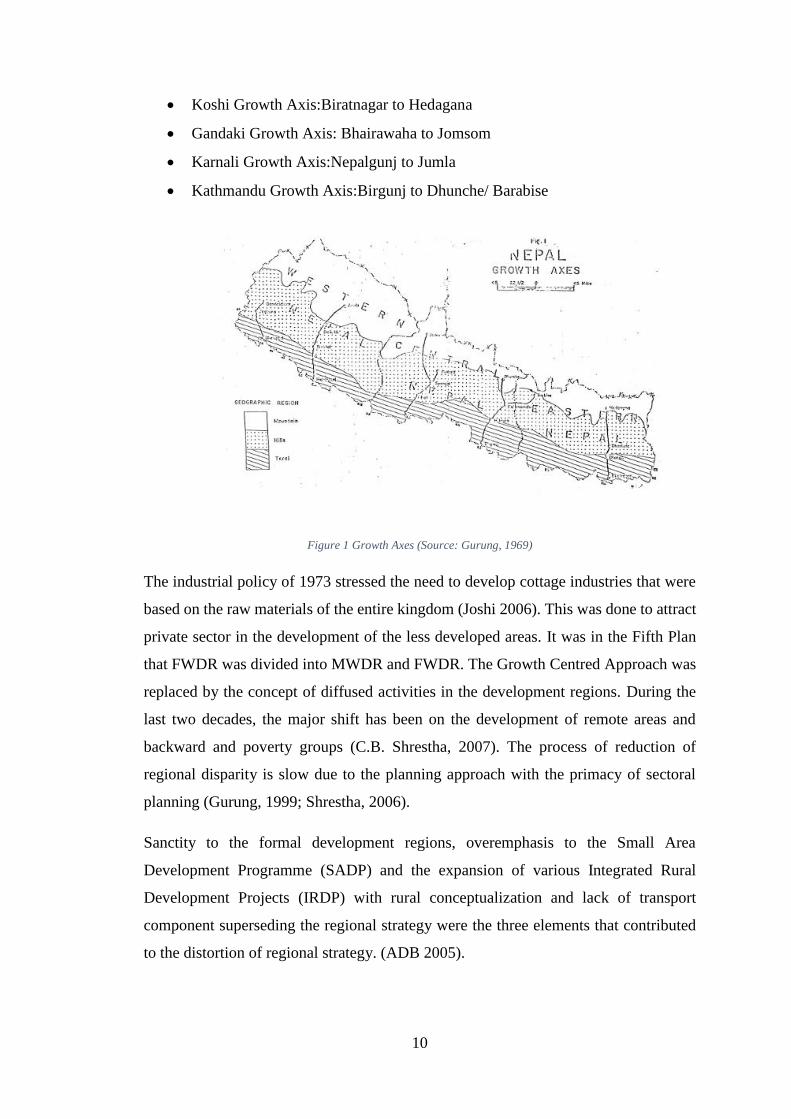
Koshi Growth Axis:Biratnagar to Hedagana
Gandaki Growth Axis: Bhairawaha to Jomsom
Karnali Growth Axis:Nepalgunj to Jumla
Kathmandu Growth Axis:Birgunj to Dhunche/ Barabise
Figure 1 Growth Axes (Source: Gurung, 1969)
The industrial policy of 1973 stressed the need to develop cottage industries that were
based on the raw materials of the entire kingdom (Joshi 2006). This was done to attract
private sector in the development of the less developed areas. It was in the Fifth Plan
that FWDR was divided into MWDR and FWDR. The Growth Centred Approach was
replaced by the concept of diffused activities in the development regions. During the
last two decades, the major shift has been on the development of remote areas and
backward and poverty groups (C.B. Shrestha, 2007). The process of reduction of
regional disparity is slow due to the planning approach with the primacy of sectoral
planning (Gurung, 1999; Shrestha, 2006).
Sanctity to the formal development regions, overemphasis to the Small Area
Development Programme (SADP) and the expansion of various Integrated Rural
Development Projects (IRDP) with rural conceptualization and lack of transport
component superseding the regional strategy were the three elements that contributed
to the distortion of regional strategy. (ADB 2005).

11
2.4 Recent Political Development in Nepal
Nepal and the Nepalese have faced a series of political incidents since 1990 before
when it was a constitutional monarch. The recent political development has been
highlighted as:
2.4.1 Parliamentary Monarchy (1990-1996)
Until 1990, Nepal was a constitutional monarchy running under the executive control
of the king. Faced with a people's movement against the absolute monarchy, King
Birendra, in 1990, agreed to large-scale political reforms by creating a parliamentary
monarchy with the king as the head of state and a prime minister as the head of the
government. In the first free and fair elections in Nepal in 1991, the Nepali Congress
was victorious.
In 1994 the Communist Party of Nepal (Unified Marxist-Leninist) (CPN (UML)) made
Nepal the first communist-led monarchy in Asia. In mid-1994, parliament was
dissolved due to dissension within the Nepali Congress Party. The subsequent general
election, held 15 November 1994, gave no party a majority and led to several years of
unstable coalition governments. As of the May 1999 general elections, the Nepali
Congress Party once again headed a majority government.
2.4.2 Maoist Insurgency (1996)
In February 1996, the Communist Party of Nepal (Maoist) began a violent insurgency
in more than 50 of the country's 75 districts. About 13,000 police, civilians, and
insurgents were killed in the conflict since 1996.
2.4.3 Royal Massacre (2001)
On June 1, 2001, Crown Prince Dipendra was officially reported to have shot and killed
his father, King Birendra and other family members before turning the gun on himself.
After his death two days later, the late King's surviving brother Gyanendra was
proclaimed king.
2.4.4 Suspension of Parliament and Loktantra Andolan (2005-2007)
On 1 February 2005 King Gyanendra suspended the Parliament, appointed a
government led by himself, and enforced martial law. The King argued that civil
politicians were unfit to handle the Maoist insurgency. A broad coalition called the
Seven Party Alliance (SPA) was formed in opposition to the royal takeover,

12
encompassing the seven parliamentary parties who held about 90% of the seats in the
old, dissolved parliament. On 22 November 2005, the Seven Party Alliance (SPA) of
parliamentary parties and the Communist Party of Nepal (Maoist) agreed on a historic
and unprecedented 12-point memorandum of understanding (MOU) for peace and
democracy.
As per the 12-point MOU, the SPA called for a protest movement, and the Communist
Party of Nepal (Maoist) supported it. This led to a countrywide uprising called the
Loktantra Andolan that started in April 2006. This compelled the king to return the
power in the hands of the people with the reinstatement of the House of Representatives.
On 19 May 2006, the parliament assumed total legislative power and gave executive
power to the Government of Nepal leaving no any rights to the king. Nepal was declared
a secular state abrogating the previous status of a Hindu Kingdom.
2.4.5 Abolition of the Monarchy & Establishment of Federal Republic (2007-
2008)
On 23 December 2007, an agreement was made for the monarchy to be abolished and
the country to become a federal republic with the Prime Minister becoming head of
state. The first election of the constituent assembly was held in April 2008. The 601
member constituent assembly declared Nepal as a federal republic in May 2008 which
ended 240 years of royal rule in Nepal.
Although major political achievements were made during this period, the political
parties could not reach a consensus on the number of and delineation of the states, tiers
of governance and the responsibilities and duties of the head of the state. This lead to
the dissolution of first constitutional assembly and second CA election was held in
November 2013. Nepali Congress became the largest party followed by CPN (UML)
and CPN (United Maoist) according to the CA polls. The challenges of the first CA
have now shifted to the second CA and people are still sceptical about drafting the new
constitution before January 2015.
2.5 Federalism
“Federalism is a political concept in which a group of members are bound together by
covenant with a governing representative head. The term "federalism" is also used to
describe a system of government in which sovereignty is constitutionally divided
between a central governing authority and constituent political units (such as states or

13
provinces). Federalism is a system based upon democratic rules and institutions in
which the power to govern is shared between national and provincial/state
governments, creating what is often called a federation” (Wikipedia 2014). The names
used to designate the federal system vary from country to country: sometimes it is just
the “federation of…” variations are the “federal republic”, the “union”, the “united
republic” or the “united states”, the “commonwealth” or “confederation” (UNDP
2006).
Most countries in the world do not have federalism. It may not be affordable to some
of them to practice federalism. The success of federalism results in prosperous
economy, democratic culture and a good system of power sharing across the levels of
government. “It has worked in the countries where the federal economy is robust and
enjoys autonomy. It is a self-evident and spontaneous system of governance in a
country like Switzerland; the economy is robust and there exits complete respect for all
the constituencies” (Joshi 2006).
Some examples of the countries that have adopted federalism are mentioned below and
their contribution to national, regional and local development:
Australia: On 1 January 1901 the Australian nation emerged as a federation. Australia
successfully adapted the American concept of state and federal governments possessing
separate sovereignty within the framework of a constitutional monarchy by establishing
the position of state governor to be appointed by the Sovereign on the advice of the
relevant state premier, the Commonwealth Government playing no role in these
appointments. This gives each state a direct link with the Crown that completely
bypasses Canberra
Original states have equal representation in the senate. Although this is not an essential
element of federation, it reflects the view that states (colonies) should be equal in status.
Brazil: In Brazil, there was the fall of the monarchy in 1889. The 1937 Constitution
granted the federal government the authority to appoint State Governors at will, thus
centralizing power in the hands of President. Brazil also uses the Fonseca system to
regulate interstate trade.
The Brazilian Constitution of 1988 introduced a new component to the ideas of
federalism, including municipalities as federal entities. Brazilian municipalities are

14
now invested with some of the traditional powers usually granted to states in federalism,
and although they are not allowed to have a Constitution, they are structured by an
organic law.
Table 1 List of Countries Adopting Federalism
S.
N
Countries Number of Federal Units Year Adopted
(A.D) 1. Argentina 23 Provinces & 1 Autonomous
City
2. Australia 6 States
3. Austria 10 States 1955
4. Papua New
Guinea
18 Provinces & 1 Autonomous
zone
5. Belgium 3 Zones & 3 Lingual communities 1993
6. Bosnia-
Herzegovina
2 Main units & 10 cantons
7. Brazil 26 States & 1 federal district 1891
8. Canada 10 Provinces & 3 Land zones 1867
9. Comoros 3 States
10. Ethiopia 9 States & 3 Chartered Cities 1995
11. Germany 16 Landers 1945
12. India 28 States & 7 Central states 1947
13. Belau 16 States
14. Malaysia 9 Sultanates, 2 States & 2 Federal
zones
1948
15. Mexico 31 States 1957
16. Micronesia 4 States
17. Nigeria 36 Ethnic States 1963
18. Pakistan 4 Provinces 1947
19. Russia 21 Province & 7 Zones 1993
20. South Africa 9 Provinces 1990
21. Spain 17 Provinces & 2 Centre Governed
States
1977
22. St. Kits & Nevis 14 States
23. Sudan 26 Provinces 1991
24. Switzerland 26 Cantons 1291
25. UAE 7 Emirates 1848
26. USA 50 States 1787/1989
27. Venezuela 23 States 1787
28. Iraq 18 States
Source: Committee Report 2010

15
India: The Government of India (referred to as the Union Government) was established
by the Constitution of India, and is the governing authority of a federal union of 29
states and 7 union territories. The government of India is based on a tiered system, in
which the Constitution of India delineates the subjects on which each tier of government
has executive powers. The Constitution originally provided for a two-tier system of
government, the Union Government (also known as the Central Government) and the
State governments. Later, a third tier was added in the form of Panchayats and
Municipalities. In the current arrangement, The Seventh Schedule of the Indian
Constitution delimits the subjects of each level of governmental jurisdiction, dividing
them into three lists:
Union List includes subjects of national importance such as defence of the country,
foreign affairs, banking, communications and currency. The Union Government alone
can make laws relating to the subjects mentioned in the Union List.
State List contains subjects of State and local importance such as police, trade,
commerce, agriculture and irrigation. The State Governments alone can make laws
relating to the subjects mentioned in the State List.
Concurrent List includes subjects of common interest to both the Union Government
as well as the State Governments, such as education, forest, trade unions, marriage,
adoption and succession. Both the Union as well as the State Governments can make
laws on the subjects mentioned in this list. If their laws conflict with each other, the law
made by the Union Government will prevail.
A distinguishing aspect of Indian federalism is that unlike many other forms of
federalism, it is asymmetric. There is special provision for the state of Jammu and
Kashmir as per its Instrument of Accession. Indian federalism has a system of
President's Rule in which the central government takes control of state's administration
for certain months when no party can form a government in the state or there is violent
disturbance in the state.
Switzerland: The Federal Constitution of 18 April 1999 is the third and current federal
constitution of Switzerland. It establishes the Swiss Confederation as a federal republic
of 26 cantons (states), contains a catalogue of individual and popular rights (including
the right to call for popular referenda on federal laws and constitutional amendments),

16
delineates the responsibilities of the cantons and the Confederation and establishes the
federal authorities of government. The general provisions define the characteristic traits
of the Swiss state on all of its three levels of authority: federal, cantonal and municipal.
They contain an enumeration of the constituent Cantons, affirm Cantonal sovereignty
within the bounds of the Constitution and list the national languages – German, French,
Italian and Romansh. They also commit the State to the principles of obedience to law,
proportionality, good faith and respect for international law, before closing with a
reference to individual responsibility.
USA: Federalism in the United States is the evolving relationship between state
governments and the federal government of the United States. American government
has evolved from a system of dual federalism to one of associative federalism. Because
the states were pre-existing political entities, the U.S. Constitution did not need to
define or explain federalism in any one section but it often mentions the rights and
responsibilities of state governments and state officials in relation to the federal
government. The federal government has certain express powers (also called
enumerated powers) which are powers spelled out in the Constitution, including the
right to levy taxes, declare war, and regulate interstate and foreign commerce. Other
powers (the reserved powers) are reserved to the people or the states.
2.6 Federal Structure and Interregional Linkages
The success of a federal system will depend on the application of regional planning.
The linkage between national and local level of planning is an important aspect that
will deepen decentralization for poverty alleviation and national integration. The
connection between ecological regions based on mutual interest will be necessary for
sustained economic growth.
The resource sufficient local bodies like municipalities and VDCs will function well if
they are made autonomous. “Autonomy at local level should be pursued irrespective of
the system of government” (Joshi 2006). Federal government shall help the different
local entities to resolve conflicts in the sharing of natural resources among different
constituent stakeholders. On the other hand, the central government should part some
of the resources it is holding and should not hold undue power. The principle of
autonomy can be applied in resource regions.
17
Economic linkage with territorial rights will allow the regions to share the resources for
their mutual development. Domestic product should be given priority in use rather than
foreign products. The state will fail in performing its duties if it cannot protect domestic
products. External dependency will increase if there exist a competition between the
states. International trade should be regulated by the centre to protect domestic product.
In International context, the geographical location of Nepal between two giant countries
India and China can be used as an interregional linkage to use the infrastructural
developments made therein. The mountain regions can benefit from the trickle down
effects of China whereas Terai region with the same from India.
2.7 State Restructuring Models
With the declaration of Nepal as a federal state in 2008, various state restructuring
models have been proposed by political parties, economist, ethnic communities,
experts, regional leaders and geographers. These models vary on which basis the
restructuring of state is to be done. The delineation of the state and proposed tiers of
governance with devolution of authority have seemed to be the major challenges in the
process.
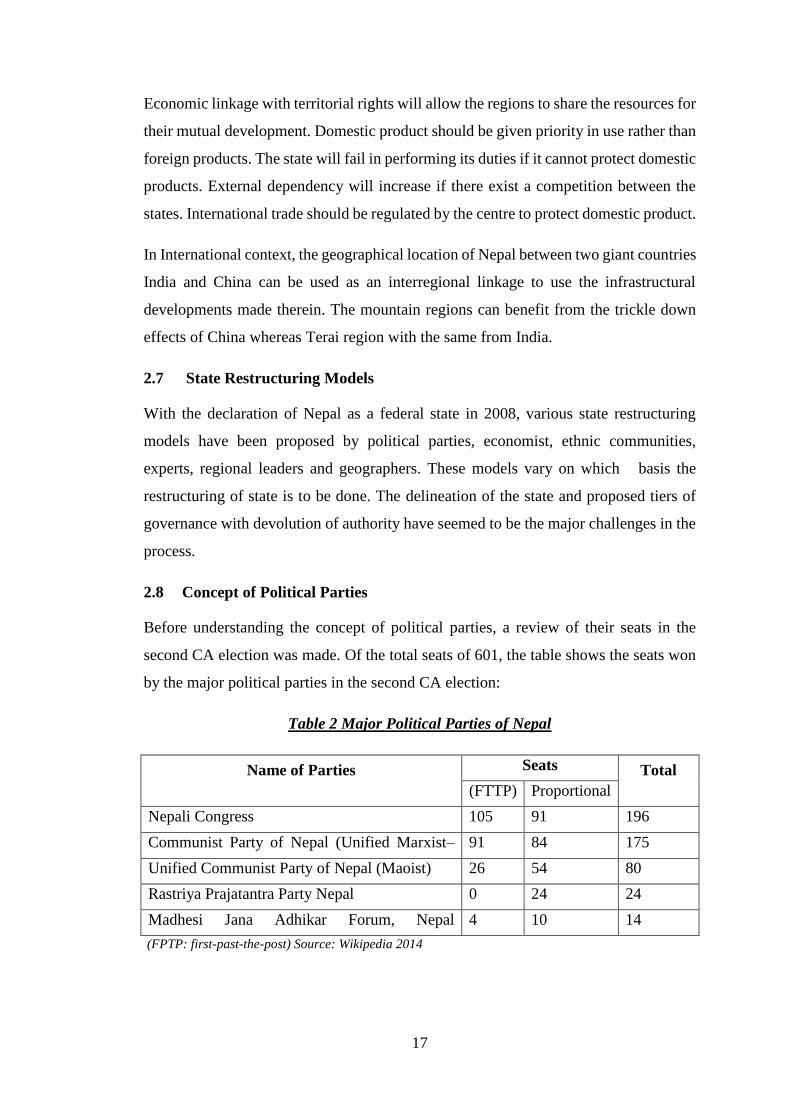
2.8 Concept of Political Parties
Before understanding the concept of political parties, a review of their seats in the
second CA election was made. Of the total seats of 601, the table shows the seats won
by the major political parties in the second CA election:
Table 2 Major Political Parties of Nepal
Name of Parties Seats Total
(FTTP) Proportional
Nepali Congress 105 91 196
Communist Party of Nepal (Unified Marxist–
Leninist)
91 84 175
Unified Communist Party of Nepal (Maoist) 26 54 80
Rastriya Prajatantra Party Nepal 0 24 24
Madhesi Jana Adhikar Forum, Nepal
(Loktantrik)
4 10 14
(FPTP: first-past-the-post) Source: Wikipedia 2014

Table 3 Concept of Major Political Parties to Federal Structure
Name of
Party
Objective Principle/ Criteria Proposed Federal Model Tiers of Government and
Devolution of Authority
Nepali
Congress
Diversity in
Ethnicity,
Language, Culture
& Religion and
region as the basis
of Nepal’s
Nationality.
National sovereignty,
geographical location
and suitability,
population, natural
resource endowment,
economic potential,
interdependence among
regions, ethnic,
language and cultural
agglomeration
Right to Self-Governance and
autonomy to local bodies
Bicameral Parliament at the
centre and unicameral at the
province
Prime minister as Chief
Executive, Election of
President from the members
of central and provincial
parliaments.
Three tiered: Central, Province and
Local
Foreign affairs, monetary policy,
national defence, customs, Large
hydroelectric projects, Airways,
Highways and other National Level
Projects in the jurisdiction of central
government.
Communist
Party of
Nepal
(Unified
Marxist–
Leninist)
Federal structure of
governance
considering ethnic,
linguistic, cultural
and geographical
specificities
Geographical location
and specificities,
population & ethnic
concentration, language,
culture, administrative
accessibility, economic
social interdependence,
capability, potentials,
natural resources and
history
Number, size and coverage of
provinces not made explicit
Foreign affairs, monetary policy,
national defence, customs, Large
hydroelectric projects, Airways,
Highways and other National Level
Projects in the jurisdiction of central
government

19
Name of
Party
Objective Principle/ Criteria Proposed Federal Model Tiers of Government and
Devolution of Authority
Unified
Communist
Party of
Nepal
(Maoist)
Institutionalization
of republic,
democratization,
ethnic and
territorial
autonomy and right
to self-
determination,
reduction in
disparity, group
solidarity,
psychological
unity.
Ethnic (common
language, geography,
economy and
psychological structure)
and territorial identity,
nationalities, ethnic
structure, geographical
accessibility, major
langue and economic
potential.
11 autonomous republic
states: Seti Mahakali and
Bheri-Karnali based on
territorial identity, Magarat,
Tharuwan, Tamuwan, Newa,
Tamsaling, Kirat,
Limbhuwan, Kochila and
Madhes based on ethnic
identity and Mithila,
Bhojpura, and Abadh sub-
states based on identity of
major languages. Bicameral
parliament at centre and
unicameral at state.
3 tiered government
Defense, Foreign affairs, inter-state
trade, monetary policy, central bank,
customs revenue, large hydro-
electricity projects, railways,
airways, national highways and
central university in the center.
Proportional elected representation
in lower house and equal
representation of all states in upper
house, executive president elected
directly. Governors and chief
ministers in the states.
Rastriya
Prajatantra
Party Nepal
Autonomous
federal governance
based on ethnic,
geographical
characteristics and
economic potential
Hindu Kingdom and
Constitutional Monarch as
head of state. Prime minister
as chief executive.
Local Bodies: Districts,
municipalities and VDCs with the
right to self-governance.
Madhesi Jana
Adhikar
Forum, Nepal
(Loktantrik)
Participatory,
Consensual and
inclusive
democracy, right to
self determination
Regional Autonomy Madhes as an autonomous
state and autonomous areas
within state. Bicameral
parliament at the centre.
President as Chief executive
with 5 year term.
Legislative, Executive and Judicial
bodies in each state
(Source: Sharma et al. 2009)
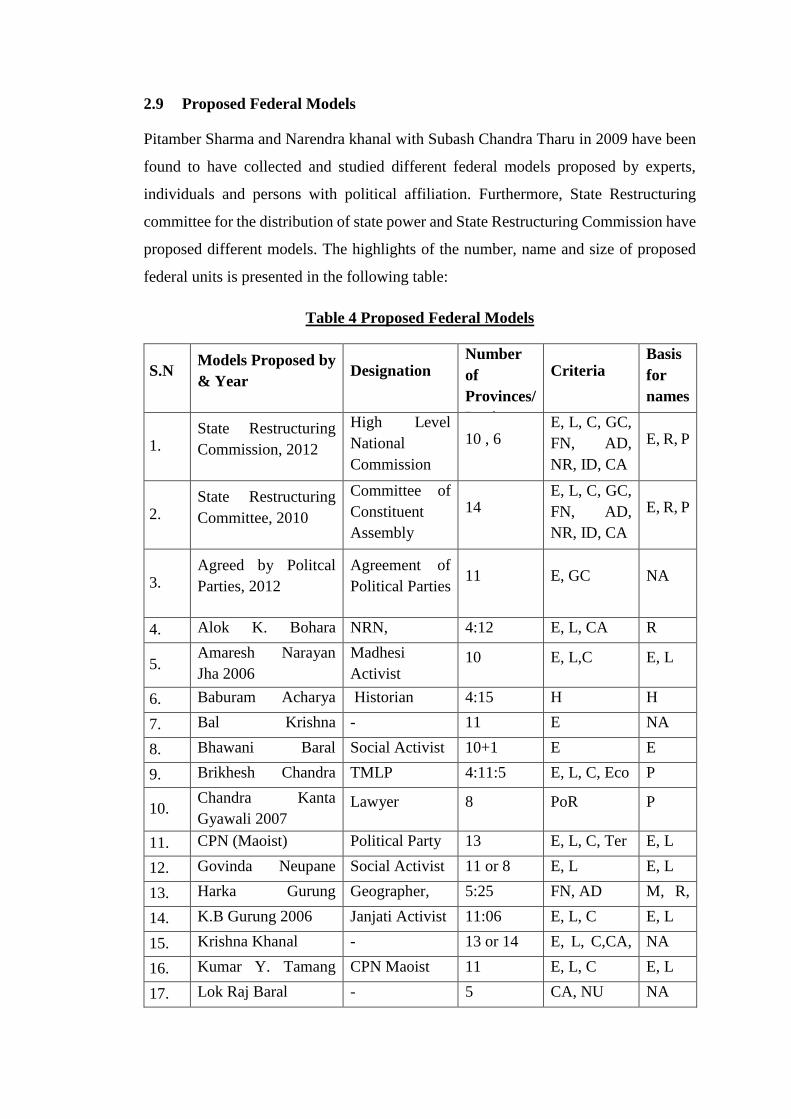
2.9 Proposed Federal Models
Pitamber Sharma and Narendra khanal with Subash Chandra Tharu in 2009 have been
found to have collected and studied different federal models proposed by experts,
individuals and persons with political affiliation. Furthermore, State Restructuring
committee for the distribution of state power and State Restructuring Commission have
proposed different models. The highlights of the number, name and size of proposed
federal units is presented in the following table:
Table 4 Proposed Federal Models
S.N Models Proposed by
& Year Designation
Number
of
Provinces/
Regions
Criteria Basis
for
names
1. State Restructuring
Commission, 2012
High Level
National
Commission
10 , 6 E, L, C, GC,
FN, AD,
NR, ID, CA
E, R, P
2. State Restructuring
Committee, 2010
Committee of
Constituent
Assembly
14 E, L, C, GC,
FN, AD,
NR, ID, CA
E, R, P
3. Agreed by Politcal
Parties, 2012
Agreement of
Political Parties 11 E, GC NA
4. Alok K. Bohara
2007/08
NRN,
Economist
4:12 E, L, CA R
5. Amaresh Narayan
Jha 2006
Madhesi
Activist 10 E, L,C E, L
6. Baburam Acharya
2005
Historian 4:15 H H
7. Bal Krishna
Mabubhang
- 11 E NA
8. Bhawani Baral
2004/06
Social Activist 10+1
=
E E
9. Brikhesh Chandra
Lal
TMLP 4:11:5 E, L, C, Eco P
10. Chandra Kanta
Gyawali 2007 Lawyer 8 PoR P
11. CPN (Maoist)
Political Party 13 E, L, C, Ter E, L
12. Govinda Neupane
2000
Social Activist 11 or 8 E, L E, L
13. Harka Gurung
2000/06
Geographer,
Planner
5:25 FN, AD M, R,
P 14. K.B Gurung 2006 Janjati Activist 11:06 E, L, C E, L
15. Krishna Khanal - 13 or 14 E, L, C,CA,
Acc
NA
16. Kumar Y. Tamang
2006
CPN Maoist 11 E, L, C E, L
17. Lok Raj Baral -
5 CA, NU NA

21
S.N Models Proposed by
& Year Designation
Number
of
Provinces/
Regions
Criteria Basis
for
names
18. Mangal Siddhi
Manandhar et al.
2008
CPN-UML 12 E, L, C E, L
19. Narhari Acharya
2005/06
Nepali
Congress
9 Eco R
20. Nepal Majdoor
Kishan Party Political Party 14 ZN M, R,
P
21. Nepal Sadbhawana
Party (Anandidevi)
Political Party 3 Eco NA
22. Pari Thapa 2006 Janamorcha-P 9 E, L, C E, L
23. Pitamber Sharma
2006/07
Geographer,
Regional
Planner
6:19 E, L, CA M,R,P
24. Prem B. Singh 2006 Political
Activist
14 E, L, C E, P
25. Rajendra Shrestha
2006
CPN-UML 14 E, L, C E, L,P
26. Ram Chandra
Acharya 2007
NRN,
Economist 4+1:13 E, L, C, CA,
Acc R, P
27. Shankar Pokhrel
2006
CPN-UML 15 E, L, C, Acc P
28. Surendra K.C 2006 Historian 8 or 5 E, L, CA E, R
(Source: Committee Report 2010, Commission Report 2012, Sharma et al. 2009)
Note: E=Ethnicity; L= Language; C= Culture; GC= Geographical Continuity; NR=Natural Resource;
ID= Infrastructural Development; H=History; M=Mountain Range & Peaks; R=River/Watershed;
P=Place Name; FN=Financial Resources; AD=Administration; CA=Comparative Advantages &
Complementarities; ACC=Accessibility; NU= National Unity; TER=Territory; ZN=Zones;
Eco=Ecology; NA=No Details Available; NRN=Non Resident Nepalese; TMLP: Tarai Madhes
Loktantrik Party
The number of proposed federal states range from just 3 (Nepal Sadbhawana Party-
Anadidevi) to 15 by Shankar Pokharel as mentioned by above table. Out of 28 models,
4 have proposed fewer than 5 federal states, 11 have proposed 5-10 federal states and
13 have proposed 11-15 federal states. However, the number of districts within the
federal states ranges from 12 to 25. Then names of federal states have been kept using
criteria of ethnic identity, mountain ranges and peaks, rivers, historical places etc.
There are two models with 10 and 6 federal states proposed by Commission where
majority of members have supported the ten state model. There are also the models that
do not propose any change in the existing structure but only seek greater

22
decentralization and devolution of power, proposed by Rastriya Janamorcha-Chitra
Bahadur K.C and Nepal Majdoor Kishan Party.
Although the model proposed by Gurung does not advocate a federal structure, his
proposal to restructure and reorganize existing districts to 25 can be used to delineate
the federal regions. “Consolidation of districts will considerably enlarge their area of
coverage and reduce administrative costs by two thirds.”(Gurung 2005).
Since Nepal has a diversity in culture, language and ethnicity, it would be a tedious task
to delineate exactly the regions and their boundary of the rights to resources. The study
made by Sharma et al. in 2009 showed that the share of the concerned group in federal
unit considered its ancestral homeland is less than 40% in most of the cases.
2.10 Representative Federal Models
The proponents of federal models come from different backgrounds. There are
government committee, commission and individuals with their expertise on politics,
law, geography and social studies. Apart from these there are parties and NRNs as
proponents of the state restructuring models. In this context, it would be wise to
consider the models proposed by bodies or organization that consider the social aspects
and are more likely to be implemented. In Nepal, state restructuring has been considered
a social complex rather than a technical problem that is often solved by experts.
2.11 The Three Models
The selected three models for study are:
A. Fourteen State Model Proposed by State Restructuring Committee in 2010
B. Ten State Model Proposed by State Restructuring Commission in 2012
C. Eleven State Model Agreed Upon by Political Parties in 2012

A. Model Proposed by State Restructuring Committee (Model A)
Figure 2 State Restructuring Model Proposed by State Restructuring Committee (Source: Committee Report 2010)

B. Model Proposed by State Restructuring Commission (Model B)
Figure 3 State Restructuring Model Proposed by State Restructuring Commission (Source: Commission Report 2012)

25
C. Model Agreed Upon by Political Parties (Model C)
Figure 4 State Restructuring Model Agreed Upon by Political Parties in May 2012 (Source: SPCBN)

26
The table below shows a comparative study of the selected models based on objectives, criteria, Federal model and tiers of governance:
Table 5 Different Federal Models
Model Principle/ Criteria Proposed Federal Model Tiers of Government Devolution of
Authority
Model A
Committee
Based on Identity: Ethnic, Communities, Linguistic,
Historical and Geophysical.
Bases of Capability: Geophysical Continuity,
administrative accessibility, availability of natural
resources and feasibility of economic development.
14 Federal States.
Legislative, Executive and Judicial
bodies both at the state and Federation.
Elected Council at Local Level
3 tier structure with Federal, State and Local
level.
Autonomous, Protected & Special zones
within the states.
Monetary system, foreign affairs, army,
security, national boundary agreements
within the centre
Model B
Commission
Based on Identity: Ethnic, Communities,
Linguistic, Historical and Geophysical.
Bases of Capability: Geophysical Continuity,
administrative accessibility, availability of natural
resources and feasibility of economic development.
10 Federal States with one non
Geophysical “Dalit” State.
Legislative, Executive and Judicial
bodies both at the state and Federation.
Elected Council at Local Level
3 tier structure with Federal, State and Local
level.
Autonomous, Protected & Special zones
within the states.
Monetary system, foreign affairs, army,
security, national boundary agreements
within the centre.
Model C
Agreed Upon
Based on Identity: Ethnic, Communities, Linguistic,
Historical and Geophysical.
Bases of Capability: Geophysical Continuity,
administrative accessibility, availability of natural
resources and feasibility of economic development.
11 Federal States.
Names and structuring of bodies not
made explicit.
No details about Tiers and power sharing
between the federal and state government.

CHAPTER III
3. METHODOLOGY
This chapter consists of the description of the study area, source of data, database
preparation and methods of data analysis used in this study. The following chart shows
the graphical representation of methodology.
3.1 Study Area
Restructuring of the state requires a thorough study of all the areas within its bounded
territory. The delineation of the regions in the models is made within the international
boundary of Nepal. So, the territory of Federal Democratic Republic Nepal has been
selected as the study area in this research.
VDC
District
Ecodev
Data Collection
Model Boundary
Image Parameter Data
Digitize & Geo-Reference
Model Boundary
Attributes to Space
GIS
GIS Analysis
Output Data
Analysis of Output
Results
Chart 1 Chart Showing Methodology of Study
28
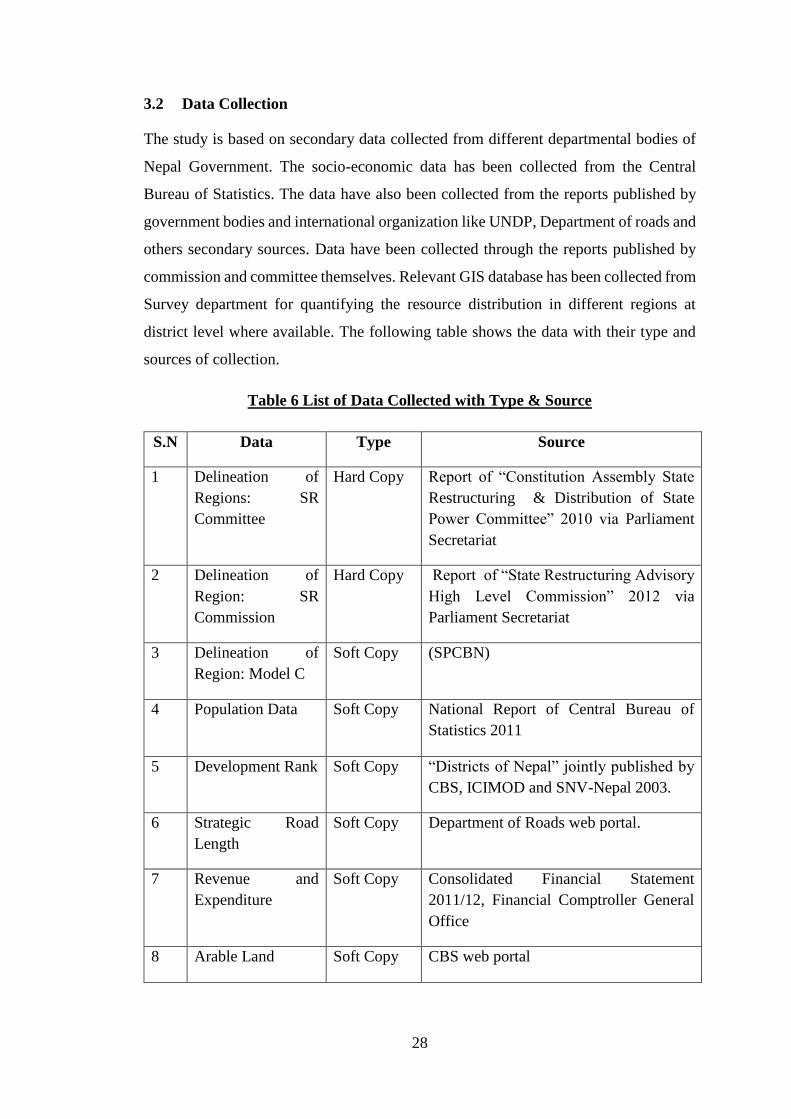
3.2 Data Collection
The study is based on secondary data collected from different departmental bodies of
Nepal Government. The socio-economic data has been collected from the Central
Bureau of Statistics. The data have also been collected from the reports published by
government bodies and international organization like UNDP, Department of roads and
others secondary sources. Data have been collected through the reports published by
commission and committee themselves. Relevant GIS database has been collected from
Survey department for quantifying the resource distribution in different regions at
district level where available. The following table shows the data with their type and
sources of collection.
Table 6 List of Data Collected with Type & Source
S.N Data Type Source
1 Delineation of
Regions: SR
Committee
Hard Copy Report of “Constitution Assembly State
Restructuring & Distribution of State
Power Committee” 2010 via Parliament
Secretariat
2 Delineation of
Region: SR
Commission
Hard Copy Report of “State Restructuring Advisory
High Level Commission” 2012 via
Parliament Secretariat
3 Delineation of
Region: Model C
Soft Copy (SPCBN)
4 Population Data Soft Copy National Report of Central Bureau of
Statistics 2011
5 Development Rank Soft Copy “Districts of Nepal” jointly published by
CBS, ICIMOD and SNV-Nepal 2003.
6 Strategic Road
Length
Soft Copy Department of Roads web portal.
7 Revenue and
Expenditure
Soft Copy Consolidated Financial Statement
2011/12, Financial Comptroller General
Office
8 Arable Land Soft Copy CBS web portal

29
S.N Data Type Source
9 Hydropower
Potential
Soft Copy http://www.ippan.org.np/HPinNepal.html
10 HDI Soft Copy Nepal Human Development Report 2014,
jointly published by UNDP & NPC
11 GIS Database:
National
Boundary, District
Boundary, VDC
Boundary, Slope,
Major Rivers
Soft Copy Survey Department of Nepal
3.3 Data Analysis and Synthesis
The data collected through various sources were synthesised through Microsoft Excel
and entry was made Geographic Information System (GIS). Database has been created
and spatial analysis has been made of the parameters where applicable in the GIS.
Unit of Analysis: Different parameters have been defined putting their values for arable
land, population density, development rank, HDI, energy potentiality, slope and
infrastructural development. These parameters either represented in raster data model
or vector data model based on their type.
Raster Data Model: Each cell in the layer represents one of the parameters. Parameters
like population density and slope can be represented through this data model.
Figure 6 Vector Data Model
Vector Data Model: The data has been represented through point, lines or polygons.
Parameters like hydropower potential has been represented through this data model.
The polygons of boundaries and major rivers are represented through this data model.
Conversion of the data model has been made from one to another as per requirement
and significance soughed in the analysis.
Figure 5 Raster Data Model
30
3.4 Method of Analysis
Different layers of parameters have been built in the GIS using the values obtained from
secondary data collection. Raster layers of population and population density have been
prepared with the entry of VDC level data from CBS. Similarly, district level data
related to development rank, HDI and infrastructural development have been used to
create their respective data layers. Data related to population growth and arable land
have been used of the level of eco-development regions. The weighted data layer was
produced finally for each models to provide a ranking to their respective regions.
The boundary of the models for each region were digitized and geo-referenced using
the image files collected from various sources. Spatial analyst tool and zonal statistical
tools are used to quantify the parameters within a certain region of each models. These
tools calculate the total values of parameter based on the cell values and their count,
which lie within the boundaries. Errors were found to be less than 5% in comparing the
total standard values of parameters.

31
CHAPTER IV
4. PROFILE OF ECODEVELOPMENT REGIONS
Nepal is a landlocked country that is bordered with the Himalayas in the north to China
and India to the East, West and South. Though it occupies only 0.3% and 0.03% of the
total land area of Asia and World respectively, it has extreme topography and climate.
The altitude varies from 70m at south to the highest peak Mt. Everest, 8848m at North.
The east west stretch of the country is 885 Km in average with mean breadth 193 Km
north to south. Geographically, Nepal is divided into three zones viz. The Himalayan
region, The Hilly Region and the Terai Region north to south based on elevation.
Politically, Nepal is divided into 5 Development Regions, 14 zones and 75 districts.
There is one metropolitan city, Kathmandu, 4 sub metropolitan cities, 130
municipalities and 3633 Village Development Committees (VDC).
The Eco development regions of Nepal are:
1) Eastern Mountain
2) Eastern Hill
3) Eastern Terai
4) Central Mountain
5) Central Hill
6) Central Terai
7) Western Mountain
8) Western Hill
9) Western Terai
10) Mid-Western Mountain
11) Mid-Western Hill
12) Mid-Western Terai
13) Far Western Mountain
14) Far Western Hill
15) Far Western Terai
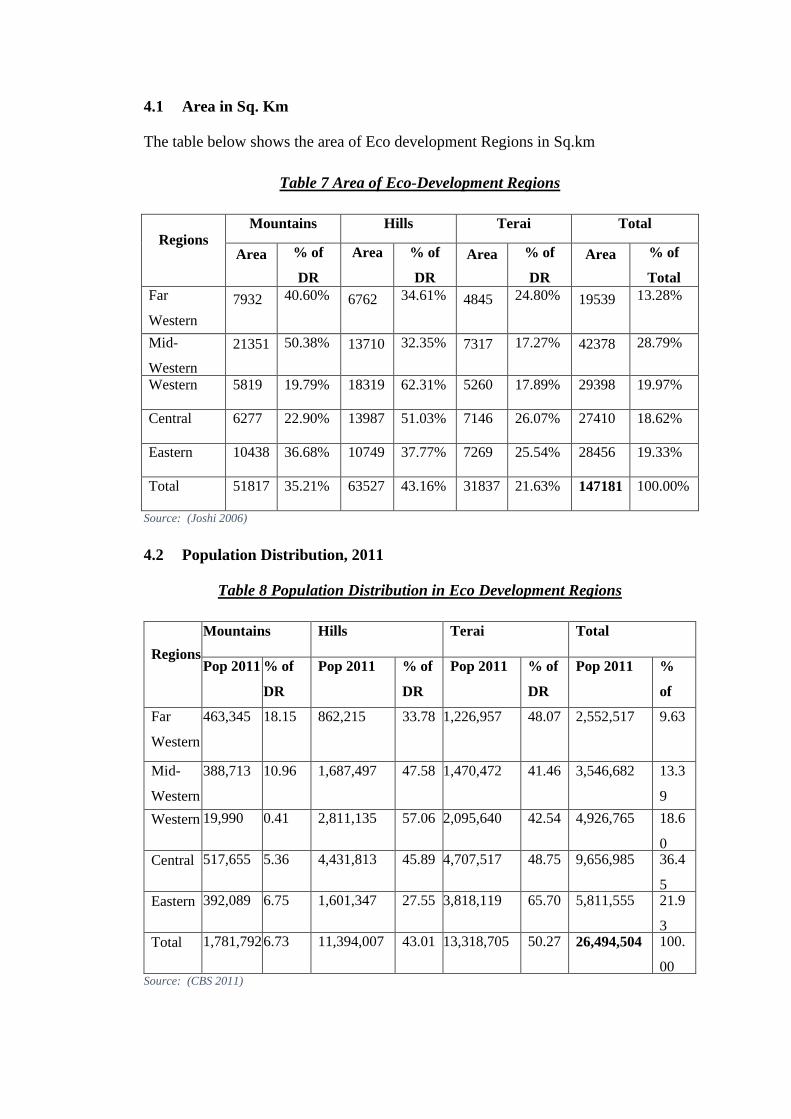
4.1 Area in Sq. Km
The table below shows the area of Eco development Regions in Sq.km
Table 7 Area of Eco-Development Regions
Regions Mountains Hills Terai Total
Area % of
DR
Area
% of
DR
% of
DR
Area % of
DR
Area % of
Total Far
Western
7932 40.60% 6762 34.61% 4845 24.80% 19539 13.28%
Mid-
Western
21351 50.38% 13710 32.35% 7317 17.27% 42378 28.79%
Western 5819 19.79% 18319 62.31% 5260 17.89% 29398 19.97%
Central 6277 22.90% 13987 51.03% 7146 26.07% 27410 18.62%
Eastern 10438 36.68% 10749 37.77% 7269 25.54% 28456 19.33%
Total 51817 35.21% 63527 43.16% 31837 21.63% 147181 100.00%
Source: (Joshi 2006)
4.2 Population Distribution, 2011
Table 8 Population Distribution in Eco Development Regions
Regions
Mountains Hills Terai Total
Pop 2011 % of
DR
Pop 2011 % of
DR
Pop 2011 % of
DR
Pop 2011 %
of
Tot
al
Far
Western
463,345 18.15 862,215 33.78 1,226,957 48.07 2,552,517 9.63
Mid-
Western
388,713 10.96 1,687,497 47.58 1,470,472 41.46 3,546,682 13.3
9
Western 19,990 0.41 2,811,135 57.06 2,095,640 42.54 4,926,765 18.6
0 Central 517,655 5.36 4,431,813 45.89 4,707,517 48.75 9,656,985 36.4
5 Eastern 392,089 6.75 1,601,347 27.55 3,818,119 65.70 5,811,555 21.9
3 Total 1,781,792 6.73 11,394,007 43.01 13,318,705 50.27 26,494,504 100.
00 Source: (CBS 2011)

33
Chart 2 Population Distribution in Eco development Regions
4.3 Population Density (Sq. Km) and Population Growth
Table 9 Population Density 2011 and Growth Rate
Regions Mountains Hills Terai Total
No. of
Distri
cts
Pop
Den
sity
Gro
wth
Rat
e
No. of
Distri
cts
Pop
Dens
ity
Grow
th
Rate
No. of
Distri
cts
Pop
Dens
ity
Grow
th
Rate
No. of
Distri
cts Far
Western
3 58 1.64
%
4 128 0.79
%
2 253 2.33
%
9
Mid-
Western
5 18 2.58
%
7 123 1.46
%
3 201 1.95
%
15
Western 2 3 -
2.00
%
11 153 0.06
%
3 398 1.95
%
16
Central 3 82 -
0.67
%
9 375 2.51
%
7 505 1.97
%
19
Eastern 3 38 -
0.25
%
8 149 -
0.25
%
5 525 1.57
%
16
Total 16 39 20 75
(Data Source: CBS 2011)
2,552,517
3,546,682
4,926,765
9,656,985
5,811,555
0
2,000,000
4,000,000
6,000,000
8,000,000
10,000,000
12,000,000
Far Western Mid-Western Western Central Eastern
Population Distribution in Ecodevelopment Regions 2011
Mountain Hill Terai
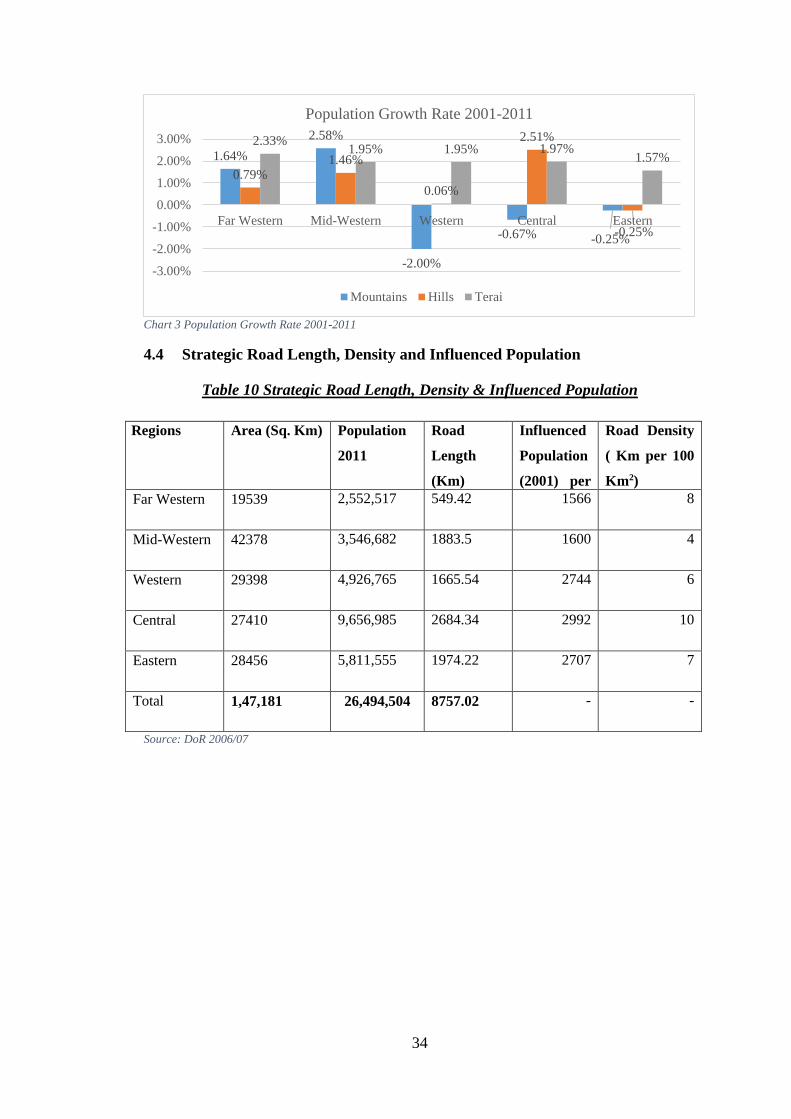
34
Chart 3 Population Growth Rate 2001-2011
4.4 Strategic Road Length, Density and Influenced Population
Table 10 Strategic Road Length, Density & Influenced Population
Regions Area (Sq. Km) Population
2011
Road
Length
(Km)
Influenced
Population
(2001) per
Km
Road Density
( Km per 100
Km2)
Far Western 19539 2,552,517 549.42 1566 8
Mid-Western 42378 3,546,682 1883.5 1600 4
Western 29398 4,926,765 1665.54 2744 6
Central 27410 9,656,985 2684.34 2992 10
Eastern 28456 5,811,555 1974.22 2707 7
Total 1,47,181 26,494,504 8757.02 - -
Source: DoR 2006/07
1.64%
2.58%
-2.00%
-0.67% -0.25%
0.79%1.46%
0.06%
2.51%
-0.25%
2.33%1.95% 1.95% 1.97%
1.57%
-3.00%
-2.00%
-1.00%
0.00%
1.00%
2.00%
3.00%
Far Western Mid-Western Western Central Eastern
Population Growth Rate 2001-2011
Mountains Hills Terai

35
Chart 4 Strategic Road in Development Regions
Mid-Western development region occupies the largest area (28.79%) of the total area
of Nepal with more than half (50.38%) of its area occupied by mountainous terrain. Its
bounds 13.39 % of the total population of 2011. The central region that occupies only
18.60 % of the total area gives shelter to 36.45% of the total population of the state.
This indicates a high population pressure in the central region. The lengths of strategic
road in the central region account to 30.65% of the total strategic road length. About
66% of the population of FWDR live in only about 26% of the area in Terai. There is
negative growth rate of population in the mountains of eastern, central and western
region. However, there is a rapid increase in central hills. FWDR has the least length of
strategic road and influence population per Km but has second highest road density.
The distribution and density of population show the hierarchal rank as CDR, EDR,
WDR, MWDR and FWDR in terms of regional development.
549.42
1883.51665.54
2684.34
1974.22
1566 1600
27442992
2707
8 4 6 10 7
Far Western Mid-Western Western Central Eastern
0
500
1000
1500
2000
2500
3000
3500
Strategic Road in Development Regions 2006
Road Length (Km) Influenced Population (2001) per Km Road Density ( Km per 100 Km2)

36
CHAPTER V
5. COMPARATIVE ANALYSIS OF MODELS
An analysis has been made based on parameters of different models. These parameters
are Population density and growth, share of ethnic groups, Land Capability (Slope &
Arable), Development Rank, Infrastructural Development & HDI, Energy Potentiality,
Expenditure and Income.
5.1 Population & Area
5.1.1 Committee Model (Model A):
This model has fourteen states which are tabulated below. Please refer Appendix IV.
Table 11 Committee Model: Population & Area
S
.
N
Name of the
State Name of Districts
Area
(Sq.km)
Populatio
n
2011
Pop
Den
sity
(Per
Sq.k
m)
1 Jadan State Most Part of Humla, Mugu &
Dolpa
14,620 58,729 4
2 Khaptad State Darchula, Dadeldhura,
Baitadi, Doti, Bajhang,
Achham & a part of Bajura
13,523 1,271,303 94
3 Karnali State
A part of (Bajura, Humla,
Mugu, Dolpa), Kalikot,
Jumla, Dailekh, Jajarkot,
Rukum, Surkhet & Salyan
17,833 1,568,866 88
4 Tamuwan
State
Manang, Mustang & Most
Parts of (Kaski, Lamjung,
Gorkha)
12,051 666,737 55
5 Magarat State
Rolpa, Myagdi, Pyuthan,
Baglung, Arghakhanchi,
Palpa & parts of
(Nawalparasi, Tanahu, Parbat,
Kaski & Rukum)
14,653 2,002,277 137
6 Tamsaling
State
Part of (Dhading, Nuwakot,
Sindhupalchowk,
Kavrepalanchowk, Lalitpur,
Makwanpur) & Rasuwa
9,918 1,419,064 143
7 Sherpa State Part of (Sankhuwasabha,
Solukhumbu, Dolakha &
Sindhupalchowk)
4,867 89,986 18

37
S
.
N
Name of the
State Name of Districts
Area
(Sq.km)
Populatio
n
2011
Pop
Den
sity
(Per
Sq.k
m)
8 Sunkoshi State Part of Dolakha, Ramechhap,
Sindhuli, Okhaldhunga,
Udayapur)
5,144 721,879 140
9 Newa State Kathmandu, Bhaktapur & part
of (Makwanpur, Lalitpur,
Kavre)
929 2,606,158 2805
10 Narayani State Chitwan & part of (Parbat,
Syangja, Kaski, Lamjung,
Tanahu, Gorkha, Dhading,
Nawalparasi, Makwanpur &
Nuwakot)
7,530 1,885,720 250
11 Limbuwan
State
Ilam, Taplejung, Panchthar,
Terathum & part of (Morang,
Dhankuta & Sankhuwasabha)
8,768 900,817 103
12 Kirat State
Khotang, Bhojpur & part of
(Solukhumbhu, Udayapur,
Dhankuta, Sankhuwasabha &
Okhaldhunga)
8,441 876,972 104
13
Mithila-
Bhojpur-Koch
Madhesh State
Parsa, Bara, Rautahat, Sarlahi,
Mahottari, Siraha, Saptari,
Sunsari, Jhapa, Most part of
Morang & part of Udayapur
14,059 7,933,002 564
14
Lumbini
Abadh
Tharuwan
State
Kanchanpur, Kailali, Bardiya,
Banke, Dang, Kapilbastu,
Rupandehi & part of
Nawalparasi
15,392 4,477,661 291
Total 147,730 26,479,173 179
The above table shows the population distribution in the states proposed by state
restructuring committee. It shows that Karnali is the largest (17833 sq.km) of all states
with the density of only 88 person per sq.km whereas Newa is the smallest (929) with
the population density of 2805 person per sq.km. There is a significant differences in
the densities between these two states. Newa, which has the capital city Kathmandu in
it has the highest density and exceeds the Mithila-Bhojpur-Koch-Madhes (MBKM)
state, the second highly denser state, vastly by 2241 person per sq.km. It shows an
intense population pressure in the Newa state than any other state proposed by this
model.

38
From the pie chart below it can also be seen that out of 14 states, the three states,
MBKM, Lumbini-Abadh-Tharuwan and Newa contain more than 50% of the
population of country. Similarly, the seven states Khaptad, Limbuwan, Kirat, Sunkhosi,
Tamuwan, Sherpa and Jadan jointly have less than 20% of the total population. This
shows that population distribution in the regions of this model is highly skewed. This
indicates that there may the scarcity of skilled or unskilled human resources in the
sparsely population regions and require to hire or burrow from other regions that are
densely populated.
The charts below show the distribution and density of population in this model:
Chart 5 Population Distribution in Model A
Chart 6 Population Density in Model A
29.96%
16.91%
9.84%
7.56%
7.12%
5.92%
5.36%
4.80%
3.40%
3.31%2.73%
2.52%
0.34%
0.22%Population Distribution in %
Mithila-Bhojpur-Koch Madhesh
StateLumbini Abadh Tharuwan State
Newa State
Magarat State
Narayani State
Karnali State
Tamsanling State
Khaptad State
Limbuwan State
564291
2805
137 25088 143 94 103 104 140 55 18 4
0
500
1000
1500
2000
2500
3000
Population Density (2011) in person/sq.km
Pop Density

39
5.1.2 Commission Model (Model B):
This model has ten states which are tabulated below. Please refer Appendix V.
Table 12 Commission Model: Population & Area
S
.
N
Name of
the State Name of Districts
Area
(Sq.km
)
Populatio
n
2011
Pop
Density
(Per
Sq.km)
1
Karnali -
Khaptad
State
Humla, Mugu, Dolpa, Jumla,
Bajura, Baitadi, Dadeldhura,
Doti, Jajarkot, Surkhet, Salyan,
Darchula, Achham and part of
Kailali and Rukum
47097 2939883 62
2
Tamuwan
State
Mustang, Manang & most parts
of Kaski, Lamjung and Gorkha
12071 649731 54
3
Tamsaling
State
Rasuwa, Nuwakot, Sindhuli
Sindhupalchowk, Dolakha,
Ramechhap, Makwanpur and
part of (Chitwan, Lalitpur,
Dhading, Solukhumbu &
Udaypur)
17747 2272354 128
4
Magarat
State
Ropa, Pyuthan, Myagdi,
Baglung, Arghakhanchi, Palpa
and part of (Rukum, Syangja,
Tanahau, Chitwan, Gorkha, &
Nawalparasi)
15180 1977763 130
5
Limbuwan
State
Taplejung, Panchthar, Illam,
Terthum and part of
(Sankhuwasabha, Dhankuta &
Morang)
8768 900821 103

40
The above table shows the population distribution, area, and population density of the
model proposed by state restructuring commission. It shows that Madhes-Mithila-
Bhojpura state has the highest population (30.77%) followed by Madhes-Abadh-
Tharuwan (16.66%). The highly populated 3 states have more than 58% of the total
population. Tamuwan has the least share of population (2.45%).
Similarly, Newa state has the highest (2545) population density of all the regions in this
model whereas Tamuwan has the least density (54). The second highest density of
6
Newa State Kathmandu, Bhaktapur and Part
of (Lalitpur, Dhading,
Makwanpur, & Kavre)
1038 2642766 2545
7
Madhes
Mithila
Bhojpura
Bara, Parsa, Rautahat, Sarlahi,
Mahottari, Dhanusha, Siraha,
Saptari, Sunsari, Morang, Jhapa
& part of (Udayapur, Chitwan,
Nawalparasi)
15833 8153860 515
8
Madesh-
Abadh-
Tharuwan
Banke, Bardia, Kailali,
Kanchanpur, Dang, Kapilbastu,
Rupandehi & part of
Nawalparasi
13975 4413723 316
9
Kirat State Khotang, Bhojpur & major part
of Solukhumbu,
Sankhuwasabha and part of
(Okhaldhunga, Dhankuta,
Udayapur)
11077 894263 81
10
Narayani
State
Part of (Chitwan, Nawalparasi,
Dhading, Gorkha, Lamjung,
Syangja, Parbat, Myagdi,
Baglung, Kaski & Nuwakot)
4990 1650295 331
Total 147774 26495460 179

41
Madhes Mithila Bhojpura is only 515 which is less by 2030 than the Newa State. In this
model too, the population distribution is skewed but less than the committee model. It
may difficult for KK, Kirat and Tamuwan states for human resource management in
their respective regions.
Chart 7 Population Distribution in Model B
Chart 8 Population Density in Model B
The population pressure is on the Newa state that contains the capital city. On the other
hand, there are chances of natural resources exploitation due to the overuse by highly
dense population.
30.77%
16.66%
11.10%
9.97%
8.58%
7.46%
6.23%
3.40%
3.38%2.45%
Population Distribution in %Madhes Mithila Bhojpura
Madesh-Abadh-Tharuwan
Karnali - Khaptad State
Newa State
Tamsaling State
Magarat State
Narayani State
Limbuwan State
Kirat State
Tamuwan State
515316
62
2545
128 130331
103 81 54
0
500
1000
1500
2000
2500
3000
Population Density (2011) in person/sq.km
Pop Density
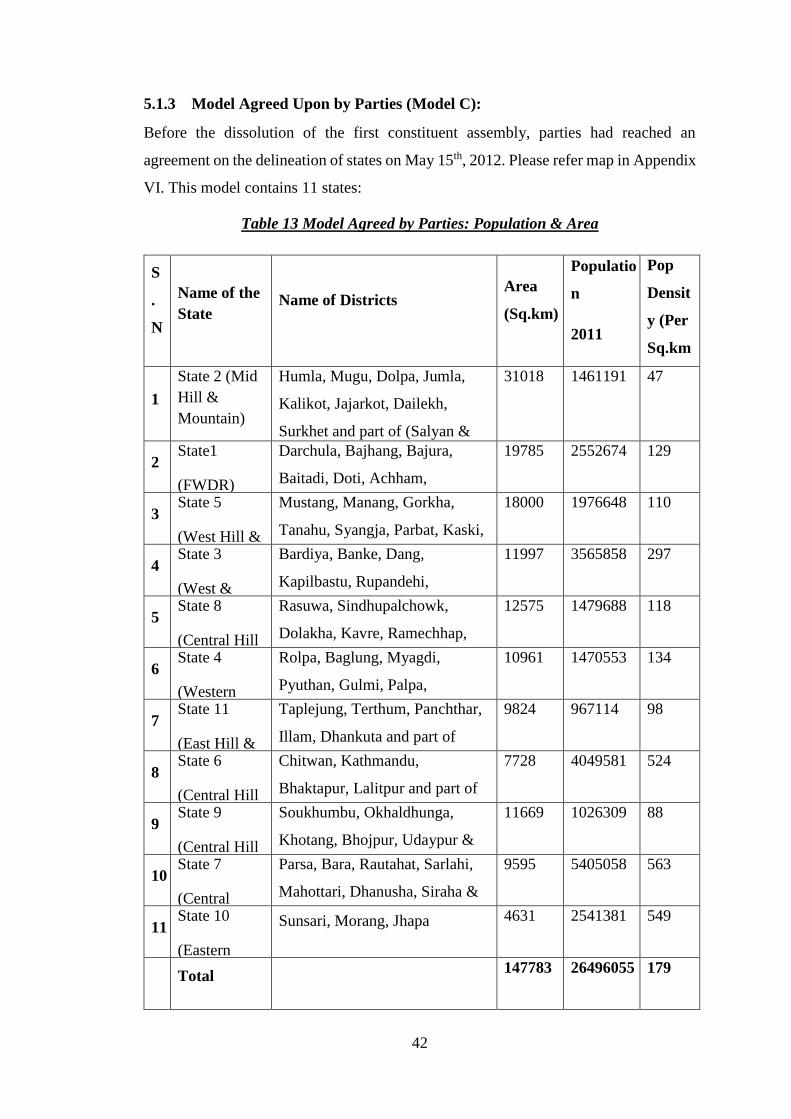
42
5.1.3 Model Agreed Upon by Parties (Model C):
Before the dissolution of the first constituent assembly, parties had reached an
agreement on the delineation of states on May 15th, 2012. Please refer map in Appendix
VI. This model contains 11 states:
Table 13 Model Agreed by Parties: Population & Area
S
.
N
Name of the
State Name of Districts
Area
(Sq.km)
Populatio
n
2011
Pop
Densit
y (Per
Sq.km
)
1
State 2 (Mid
Hill &
Mountain)
Humla, Mugu, Dolpa, Jumla,
Kalikot, Jajarkot, Dailekh,
Surkhet and part of (Salyan &
Rukum)
31018 1461191 47
2 State1
(FWDR)
Darchula, Bajhang, Bajura,
Baitadi, Doti, Achham,
Dadeldhura, Kanchanpur
19785 2552674 129
3 State 5
(West Hill &
Mountain)
Mustang, Manang, Gorkha,
Tanahu, Syangja, Parbat, Kaski,
Lamjung and part of (Baglung &
Myagdi)
18000 1976648 110
4 State 3
(West &
Mid-West
Terai)
Bardiya, Banke, Dang,
Kapilbastu, Rupandehi,
Nawalparasi
11997 3565858 297
5 State 8
(Central Hill
& Mountain)
Rasuwa, Sindhupalchowk,
Dolakha, Kavre, Ramechhap,
Sindhuli and part of (Dhading &
Nuwakot)
12575 1479688 118
6 State 4
(Western
Hill)
Rolpa, Baglung, Myagdi,
Pyuthan, Gulmi, Palpa,
Arghakhanchi and part of
(Salyan & Rukum)
10961 1470553 134
7 State 11
(East Hill &
Mountain)
Taplejung, Terthum, Panchthar,
Illam, Dhankuta and part of
Sankhuwasabha
9824 967114 98
8 State 6
(Central Hill
& Inner
Terai)
Chitwan, Kathmandu,
Bhaktapur, Lalitpur and part of
(Dhading, Nuwakot,
Sindhupalchowk, Kavre &
Makwanpur)
7728 4049581 524
9 State 9
(Central Hill
& Mountain)
Soukhumbu, Okhaldhunga,
Khotang, Bhojpur, Udaypur &
part of Sankhuwasabha
11669 1026309 88
10 State 7
(Central
Terai)
Parsa, Bara, Rautahat, Sarlahi,
Mahottari, Dhanusha, Siraha &
Saptari
9595 5405058 563
11 State 10
(Eastern
Terai)
Sunsari, Morang, Jhapa 4631 2541381 549
Total 147783 26496055 179

43
The above table shows the population distribution, area, and population density of the
model agreed by political parties. State 7 in the central Terai has the highest population
(20.4%) followed by state 6 (15.28%) that has the capital city Kathmandu in it whereas
state 11 in the eastern hill & mountains has the least population (3.65%). The population
distribution in this model is less skewed than the other two models discussed above.
Chart 9 Population Distribution in Model C
Similarly, the chart below shows the population density. It can be seen that states 7, 6
and 10 have density higher than 500 whereas states 2, 9 & 11 have density less than
100. State 7 has the highest density (563) followed by state 10 (549). However, there is
not much difference in the regions of this model as compared to previous models.
Chart 10 Population Density in Model C
This model has a better population distribution in its regions than the previously
discussed two models.
20.40%
15.28%
13.46%9.63%
9.59%
7.46%
5.58%
5.55%
5.51%
3.87% 3.65%Population Distribution in %
State 7 State 6
State 3 State 1
State 10 State 5
State 8 State 4
State 2 State 9
State 11
563524
297
129
549
110 118 134
4788 98
0
100
200
300
400
500
600
State 7 State 6 State 3 State 1 State 10 State 5 State 8 State 4 State 2 State 9 State 11
Population Density (2011) in person/sq.km
Pop Density

44
5.2 Share of Major Ethnic Groups
Nepal has diversity in caste, ethnicity and language along with its geophysical diversity.
Major castes include Chhetri, Brahman, Magar, Tharu, Kami, Newar, Tamang,
Musalman, Yadav and Rai. Brahman & Chhetri are regarded as upper caste in Nepal whereas
castes like Sarki, Damai & Kami as lower castes. The table below shows the percentage
share of each caste in national population according to 2011 census.
Table 14 Share of Major Ethnic Groups
S.N Caste/ Ethnicity Population
2011
Percentage
of Total
Remarks
1 Chhetri 4,398,053 16.60%
2 Brahman-Hill 3,226,903 12.18%
3 Magar 1,887,733 7.12%
4 Tharu 1,737,470 6.56%
5 Tamang 1,539,830 5.81%
6 Newar 1,321,933 4.99%
7 Kami 1,258,554 4.75%
8 Musalman 1,164,255 4.39%
9 Yadav 1,054,458 3.98%
10 Rai 620,004 2.34%
11 Gurung 522,641 1.97%
12 Damai 472,862 1.78%
13 Thakuri 425,623 1.61%
14 Limbu 487,300 1.84%
15 Sarki 374,816 1.41%
16 Teli 369,688 1.40%
17 Chamar/Harijan/Ram 335,893 1.27%
18 Koiri/Kuswaha 306,393 1.16%
19 Musahar 234,490 0.89% Less than 1%
20 Kumai 231,129 0.87% Less than 1%
21 Dashnami/ Sanyashi 227,822 0.86% Less than 1%
22 Dhanuk 219,808 0.83% Less than 1%
23 Dusadh/Paswan/Pasi 208,910 0.79% Less than 1%
24 Mallaha 173,261 0.65% Less than 1%
25 Kewat 153,772 0.58% Less than 1%
26 Kathbaniya 138,637 0.52% Less than 1%
27 Brahman-Terai 134,106 0.51% Less than 1%
28 Kalwar 128,232 0.48% Less than 1%
29 Kanu 125,184 0.47% Less than 1%
30 Kumal 121,196 0.46% Less than 1%
31 Gharti/Bhujel 118,650 0.45% Less than 1%
32 Hajam/Thakur 117,758 0.44% Less than 1%
33 Rajbansi 115,242 0.43% Less than 1%
34 Sherpa 112,946 0.43% Less than 1%

45
S.N Caste/ Ethnicity Population
2011
Percentage
of Total
Remarks
35 Dhobi 109,079 0.41% Less than 1%
36 Tatma/Tatwa 104,865 0.40% Less than 1%
37 Lohar 101,421 0.38% Less than 1%
38 Khatwe 100,921 0.38% Less than 1%
39 Others 2,012,666 7.60%
40 Total 26,494,504 100.00%
Data Source: CBS, 2011
Chhetri is the dominant (12.88%) caste followed by Brahman Hill (12.18%) and Magar
(7.12%). The table shows the hierarchical order of castes having greater than 1 lakh population,
according to their share in national population. Only 18 identified castes have share greater than
1% in total national population whereas twenty other identified caste or ethnic groups have
their share less than 1% in national population.
Most of the states in the models proposed by the SR committee and SR commission have been
named on the basis of dominant ethnic group with the greatest share within that state.
Limbuwan state represents the region with major ethnic group as Limbu, Kirat for Rai, Newa
for Newar, Magarat for Magar, Tamuwan for Gurung, Tharuhat for Tharu, Tamsaling for
Tamang and Madhes for Madhesi community that include castes like Yadav and Brahman
Terai. However, castes like Kami, Musalman, Sarki and Damai have not been used to name the
states although they share a significant portion of population within their respective region and
also in national population. Although the commission model has proposed a non-geographical
state for Dalits (Sarki, Kami, Damai), it seems to be unpractical to administrate such a non-
physical region and deliver service to the people. The table below shows the three major castes
in the Eco development regions with their respective share of population and dominant ethnic
group:
Table 15 Ethnic Share in Eco Development Region
S.
N
Eco
Developme
nt Region
Populatio
n 2011 Major
Castes Population
Percentage
share in
Eco
developme
nt Regions
(%)
Dominan
t Caste/
Ethnicity
1 Eastern
Mountain
392089 Chhetri 60336 15.39 Limbu
Limbu 61510 15.69
Others 55690 14.20
2 Eastern Hill 1601347 Chhetri 294189 18.37 Rai
Rai 332878 20.79
Limbu 184542 11.52

46
3 Eastern
Terai
3818119 Chhetri 330956 8.67 Brahman
Hill Brahman
Hill
394840 10.34
Others 628081 16.45
4 Central
Mountain
517655 Chhetri 115874 22.38 Tamang
Brahman
Hill
53409 10.32
Tamang 159659 30.84
5 Central Hill 4431813 Brahmin
Hill
791845 17.87 Tamang
Tamang 923466 20.84
Newar 854569 19.28
6 Central Terai 4707517 Musalma
n
527645 11.21 Yadav
Yadav 543697 11.55
Others 810865 17.22
7 Western
Mountain
19990 Gurung 6311 31.57 Gurung
Kami 1331 6.66
Others 8683 43.44
8 Western Hill 2811135 Chhetri 416239 14.81 Brahman
Hill Brahman
Hill
622389 22.14
Magar 593321 21.11
9 Western
Terai
2095640 Brahman
Hill
301642 14.39 Brahman
Hill Tharu 252159 12.03
Others 309121 14.75
10 Mid-
Western
Mountain
388713 Chhetri 168278 43.29 Chhetri
Kami 45707 11.76
Thakuri 63238 16.27
11 Mid-
Western Hill
1687497 Chhetri 632137 37.46 Chhetri
Magar 363521 21.54
Kami 271498 16.09
12 Mid-
Western
Terai
1470472 Chhetri 259014 17.61 Tharu
Brahman
Hill
126452 8.60
Tharu 466084 31.70
13 Far Western
Mountain
463345 Chhetri 293868 63.42 Chhetri
Brhaman
Hill
51611 11.14
Kami 34440 7.43
14 Far Western
Hill
862215 Chhetri 472081 54.75 Chhetri
Brahman
Hill
112318 13.03
Others 80449 9.33
15 Far Western
Terai
1226957 Chhetri 294416 24.00 Tharu
Brahman
Hill
168294 13.72
Tharu 437996 35.70
The above table shows that the dominant castes in each eco development regions are
Limbu, Rai, Brahman Hill, Tamang, Chhetri, Tharu, Yadav and Gurung. The share of
major ethnic group is less than 35% in all the eco-development regions except for
Chhetri. It shows that at least remaining 68% of people belong to other caste or
communities and living together with the dominant ethnic group. This shows that

47
Nepalese society is highly heterogeneous in caste and accordingly in their respective
language, culture and costumes. Out of 15 eco-development regions Brahman &
Chhetri have dominance in 7 regions but no state has been named accordingly in any
of the models studied. It can be seen in above table that Chhetri have more than 63%
share in Far Western mountain & more than 54% in Far Western Hill.
The delineation of the state in each model has been made on the basis of Eco
development regions and their respective ethnic groups. In this study, deduction of the
ethnic share in eco development regions has been made to tabulate major ethnic group
of each state in the models studied.
5.2.1 Ethnic Share in Model A & Model B:
The delineation of models proposed by committee (Model A) and commission (Model
B) are similar and contain the same eco development region. The difference is Jadan,
Khaptad and Karnali states of the committee model have been merged to create a greater
Karnali-Khaptad state in the commission model. Sherpa & Sunkoshi states have been
omitted in the commission model to create a greater Kirat and Tamsaling states thereby
reducing the number of states. So, the ethnic share has been compared in case of 14
states of the committee model in the table below. Please refer Appendix VII & VIII.

48
Table 16 Table showing Ethnic Share in Model A & B
S
.
N
State Name
Respective Eco
development
Region
Dominant
Caste
Share
of
Domin
ant
Caste
(%)
Remarks
1 Jadan State Mid & Far
Western Mountain Chhetri 53.35 Average
2 Khaptad State Far Western
Mountain & Hill Chhetri 59.09 Average
3 Karnali State Mid-Western Hill Chhetri 37.46
4 Tamuwan State Western Mountain Gurung 31.57
5 Magarat State Western Hill Brahman
Hill
(Magar
=21.11%)
22.14
6 Tamsaling State Central Hill &
Mountain Tamang 25.84 Average
7 Sherpa State Central Mountain Tamang
(Sherpa=3.2
0%)
30.84
8 Sunkoshi State Central Hill Tamang 20.84
9 Newa State Central Hill Tamang
(Newar
=19.28%)
20.84
10 Narayani State
Central & Western
Hill & Central
Terai (Chitwan
only)
Brahman
Hill 22.14
Highest of
Yadav, Tamang
& Brahman Hill
11 Limbuwan State Eastern Hill &
Mountain Limbu 15.69
12 Kirat State Eastern Hill &
Mountain Rai 20.79
13
Mithila-Bhojpur-
Koch Madhes
State
Eastern & Central
Terai Yadav 11.55
Higher of
Brahmin Hill &
Yadav
14 Lumbini Abadh
Tharuwan State
Western, Mid-
Western & Far
Western Terai
Tharu 33.35 Higher of
Brahmin Hill &
Tharu

49
It can be see that Chhetri have majority in Jadan and Khaptad states with more than
50% share of population and with 37.46% in Karnali state. Similarly, Brahman Hill
have their dominance in Magarat (22.14%) and Narayani states (22.14) whereas Tharu,
Limbu, Tamang & Gurung have their dominance in the states named after themselves.
However, there is no dominance of Magar in Magar state, Newar (19.28) in Newa state
and Sherpa (3.20%) in Sherpa state. There is dominance of Tamang (30.84%) in Sherpa
state and also in Newa state (20.84). Yadav have a slight dominance on Mithila-
Bhojpur-Koch-Madhes state with a percentage of 11.55.
The nomenclature of the states in this models can be quite disputable as most the castes
have a mere dominance over others in their respective regions. There is no clear
scientific reason why Chhetri and Brahman have been deprived of nomenclature of the
states. On the other hand, the distribution of caste and ethnic groups in the regions is so
well mixed that the ethnic nomenclature may bring chaos to harmonically living
Nepalese society at present. Although, every ethnic groups in the regions would have
equal rights, there is misperception in the people of this ethnic nomenclature. Looking
at the above ethnic distribution, the implementation of this nomenclature is still
skeptical.
5.2.2 Ethnic Share in Model C:
The nomenclature in this model was not found during the study. However, the states
have been named as State 1, State 2 and so on for the analysis. The table below shows
the dominant caste in 11 states of the models. Please refer Appendix IX.
Table 17 Ethnic Share in Agreed Model (Model C)
S
.
N
State
Name
Respective Eco
development
Region
Dominant
Caste
Share of
Domina
nt Caste
(%)
Remarks
1 State 2
(Mid-Western Hill
& Mountain) Chhetri 40.37 Average
2
State1 (FW Mountain,
Hill & Terai)
Chhetri 59.09 Higher of Chhetri
& Tharu &
Average

50
The above table shows that Chhetri & Brahman Hill have their dominance in 5 out of
11 states whereas dominance of Tamang can be seen in 3 states and of Rai, Yadav and
Tharu in one state each. This model seems to consider greater ethnic diversity as
compared to other two models. State 10 which has dominance of Brahman Hill, has
been created a different state from MBKM state of the previous models. Similarly, State
6 has been made from the Narayani State of the previous models curtailing the portion
of the western hill and adding Kathmandu valley that has dominance of Newar
community. State 1 has been made of the total area of Far Western Development Region
where Chhetri have dominance.
5.3 Land Capability
Land capability of the states is another important parameter in the this study as it plays
a major role in identifying the land area that can be used for agriculture, horticulture,
cattle rearing, locating of industries and even for development of transport and other
infrastructure. Land Capability in this study cover two characteristics viz. Arable land
& the slope of land. Arable land is the land where agricultural production can be made.
Similarly, the slope is important to determine the ease with which settlements can
3 State 5
(West Hill &
Mountain) Brahman Hill 22.14
Higher of
Brahman Hill &
Gurung
4 State 3
(West & Mid-West
Terai) Tharu 31.70
Higher of
Brahmin Hill &
Tharu
5 State 8
(Central Hill &
Mountain) Tamang 25.84 Average
6 State 4
(Western Hill) Brahman Hill 22.14
7 State 11
(East Hill &
Mountain) Rai 20.79 Higher of Rai &
Limbu
8
State 6 (Central Hill &
Terai) Chitwan
only
Tamang 20.84 Higher of
Brahman Hill &
Tamang
9 State 9
(Central Hill &
Mountain) Tamang 25.84 Average
10 State 7 (Central Terai) Yadav 11.55
11 State 10 (Eastern Terai) Brahman Hill 10.34

51
reside, infrastructure can be developed and overall economic growth can be attained.
Humans have always chosen a place that has flatter terrain than a steep terrain. The
following table shows the area of arable land in thousand hectares of different eco
development regions.
Table 18 Arable Land of Eco Development Regions
Developmen
t region
Mountai
n
% of
Mountai
n
Hill
% of
Hill Terai
% of
Terai Total
Eastern 63.5 31.72% 214.
4
24.85% 431.4 33.34% 709.3
Central 63.6 31.77% 213.
2
24.71% 413.6 31.96% 690.4
Western 2 1.00% 225.
5
26.13% 193.5 14.95% 421
Mid-Western 37.1 18.53% 145.
1
16.82% 147.5 11.40% 329.7
Far-Western 34 16.98% 64.7 7.50% 108 8.35% 206.7
200.2 100.00% 862.
9
100.00
%
1294 100.00
%
2357.
1 Source: Source:cbs.gov.np/wp-content/uploads/2012/Agriculture/.../Chapter05.pdf
The above table shows that Eastern Region has the highest (33.34%) arable land
followed by Central, Western and Mid-Western Region of the total arable land area of
Terai. Similarly, Western Hills have the most arable land (26.13%) followed by Eastern
and Central region in the hills. In case of Mountains, Central region has the highest
(31.77%) arable land followed by Eastern and Mid-Western Region. Eastern, Central
& Western regions have a greater portion of arable land compared to MWDR & FWDR.

52
Similarly the chart below shows portion of arable land in thousand hectares according
to eco development Regions.
Chart 11 Area of Arable land in Eco development Regions
The data of Eco DR has been used to find the area of arable land in different regions of
the models using “Zonal Statistics” tool of ArcGIS software.
5.3.1 Land Capability (Arable Land & Slope) in Model A
The following chart shows the arable land in 14 states of the committee model. Please
refer Appendix X.
Chart 12 Area of Arable Land in Model A
63.5 63.6
237.1 34
214.4 213.2 225.5
145.1
64.7
431.4413.6
193.5
147.5
108
0
50
100
150
200
250
300
350
400
450
500
EDR CDR WDR MWDR FWDR
Area of Arable Land 2001/02 ('000 Hectare)
Mountain Hill Terai
54240.566730.4
170624140196
290999
159278
33521.595109.2
19806.1
208332129332134099
590289
224129
0
100000
200000
300000
400000
500000
600000
700000
Arable Land 2001/02 (in hectares)
Arable Land

53
It can be seen that MBKM state has the greatest area (25.48%) followed by Magarat
state (12.56%) and Lumbini Abadh Tharuwan (9.67%) of the total arable area of Nepal.
Newa state has the least (0.85%) arable land followed by Sherpa, Jadan & Khaptad
states. Only 5 of the 14 states have arable land above average (165478 hectares). This
indicates that remaining 9 states that are mostly in the mountain or hill regions may
have to depend upon the richer states for food or agricultural products. The chart below
shows the percentage of area with different slope categories of different states in
degrees.
Chart 13 Percentage Are of Slope in Model A
The table shows three states viz. Lumbini, MBKM and Newa have more than 60% of
their area with slope of 0 to 5 degrees. Narayani has almost 60% of its area with the
same slope. This indicates that the terrain is flat in these states so farming and other
development activities like road construction, canal construction etc. can be carried
more easily as compared to other states that have less than 40% area with slope less
than 5 degrees. A considerable portion of area with slope greater than 30 degree is in
Sherpa (2.22%), Tamuwan (1.83%) and Jadan (1.27%) states compared to other
regions.
Better road infrastructure attract location of new industries as the transportation cost for
raw materials and finished products is greatly reduced. Passengers along with materials
used in daily consumption by the people can be transported easily in the flatter terrain.
In this instance, MBKM and Lumbini Abadh states in the Terai region seem to be more
advantageous over the other states that are situated in mountainous and hilly region.
However, Newa state seems to have flatter slope due to the presence of Kathmandu
0.00%20.00%40.00%60.00%80.00%
100.00%120.00%
Percentage Area of Slope in Degrees
0 to 5 5 to 10 10 to 15 15 to 20 20 to 30 30 to above

54
valley and Pokhara valley shares a portion of flatter terrain to the Tamuwan state though
they lie in the central and western hilly regions respectively.
5.3.2 Land Capability (Arable land & Slope) in Model B
The following chart shows the arable land in hectares in the states of commission
model. Please refer Appendix XI.
Chart 14 Area of Arable Land in Model B
Like in case of committee model, it can be seen that Madhes Mithila Bhojpura state has
the greatest share (28.02%) of the total arable land area of Nepal followed by Magarat
(13.11%) and Karnali Khaptad (13.10%). Only 4 of the 10 states have their arable land
more than the average (231744). Newa state has the minimum (0.96%) arable land
within it. Newa state has the highest population density but the lowest arable area makes
it the weakest state in agricultural production of all the states and represents its
dependency to its surrounding states Tamsaling and Narayani.
303694
140635
281327 303710
129332
22138.1
649333
207789155540 123937
0
100000
200000
300000
400000
500000
600000
700000
Arable Land 2001/02 (in hectares)
Arable Land
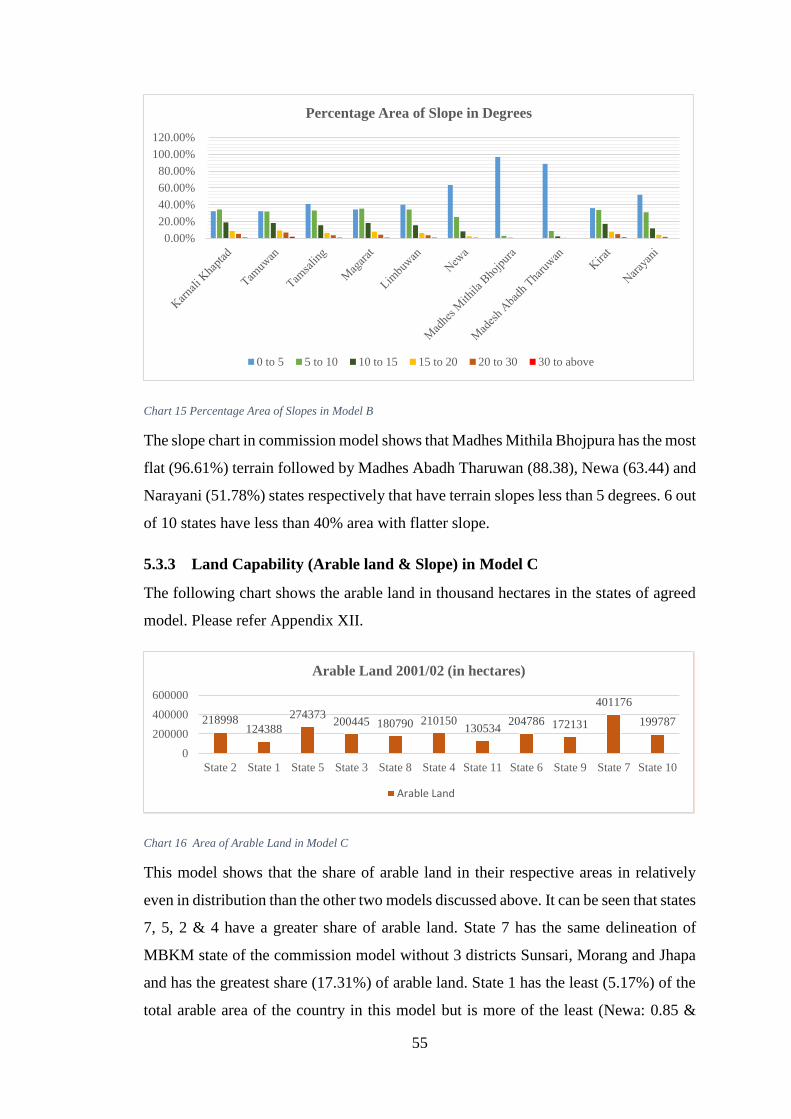
55
Chart 15 Percentage Area of Slopes in Model B
The slope chart in commission model shows that Madhes Mithila Bhojpura has the most
flat (96.61%) terrain followed by Madhes Abadh Tharuwan (88.38), Newa (63.44) and
Narayani (51.78%) states respectively that have terrain slopes less than 5 degrees. 6 out
of 10 states have less than 40% area with flatter slope.
5.3.3 Land Capability (Arable land & Slope) in Model C
The following chart shows the arable land in thousand hectares in the states of agreed
model. Please refer Appendix XII.
Chart 16 Area of Arable Land in Model C
This model shows that the share of arable land in their respective areas in relatively
even in distribution than the other two models discussed above. It can be seen that states
7, 5, 2 & 4 have a greater share of arable land. State 7 has the same delineation of
MBKM state of the commission model without 3 districts Sunsari, Morang and Jhapa
and has the greatest share (17.31%) of arable land. State 1 has the least (5.17%) of the
total arable area of the country in this model but is more of the least (Newa: 0.85 &
0.00%
20.00%
40.00%
60.00%
80.00%
100.00%
120.00%
Percentage Area of Slope in Degrees
0 to 5 5 to 10 10 to 15 15 to 20 20 to 30 30 to above
218998124388
274373200445 180790 210150
130534204786 172131
401176
199787
0
200000
400000
600000
State 2 State 1 State 5 State 3 State 8 State 4 State 11 State 6 State 9 State 7 State 10
Arable Land 2001/02 (in hectares)
Arable Land

56
0.96) of above two models. 7 out of 11 states are almost equal or greater than the
average (210687) which represents that there is less disparity in the distribution of
arable land as compared to the above two models.
In this model, states 7, 10 and 3 of the Terai have a relatively flatter terrain than other
8 states that lie in the mountains or hills. States 5, 2 and 8 have the sloppiest terrain and
cover the hills and mountains of the western, mid-western and central regions
respectively.
In comparing the slopes of all three models, Sherpa state in the committee model has
the greatest portion (20.84%) of sloppy area greater than 15 degrees, followed by
Tamuwan state (17.85%) of the commission model and state 2 (15.41%) of the agreed
model. It also indicates that slope distribution in the agreed model is quite even than
the other two models.
5.4 Road Density and Development Rank
Road network as major part of infrastructure development plays a vital role in any
region. The presence of road network attracts other developmental works like
establishment of Industries and social infrastructure even in the remote areas of the
states. Road reduces the friction of distance between growth centres and service
delivery centres. In this study, road density refers to the total length of strategic road
present in 100 sq.km area of any region. Data (2006) of the district level provided by
DoR was used to determine the road density of the regions in the models.
Development rank in this study, is the hierarchy of districts as tabulated in the report
prepared by the joint study of ICIMOD and CBS in 2003. Three indicator groups viz.
Poverty & Deprivation, Socio-Economic and Infrastructural Development and Women
0.00%
20.00%
40.00%
60.00%
80.00%
100.00%
120.00%
State 2 State 1 State 5 State 3 State 8 State 4 State 11 State 6 State 9 State 7 State 10
Percentage Area of Slope in Degrees
0 to 5 5 to 10 10 to 15 15 to 20 20 to 30 30 to above
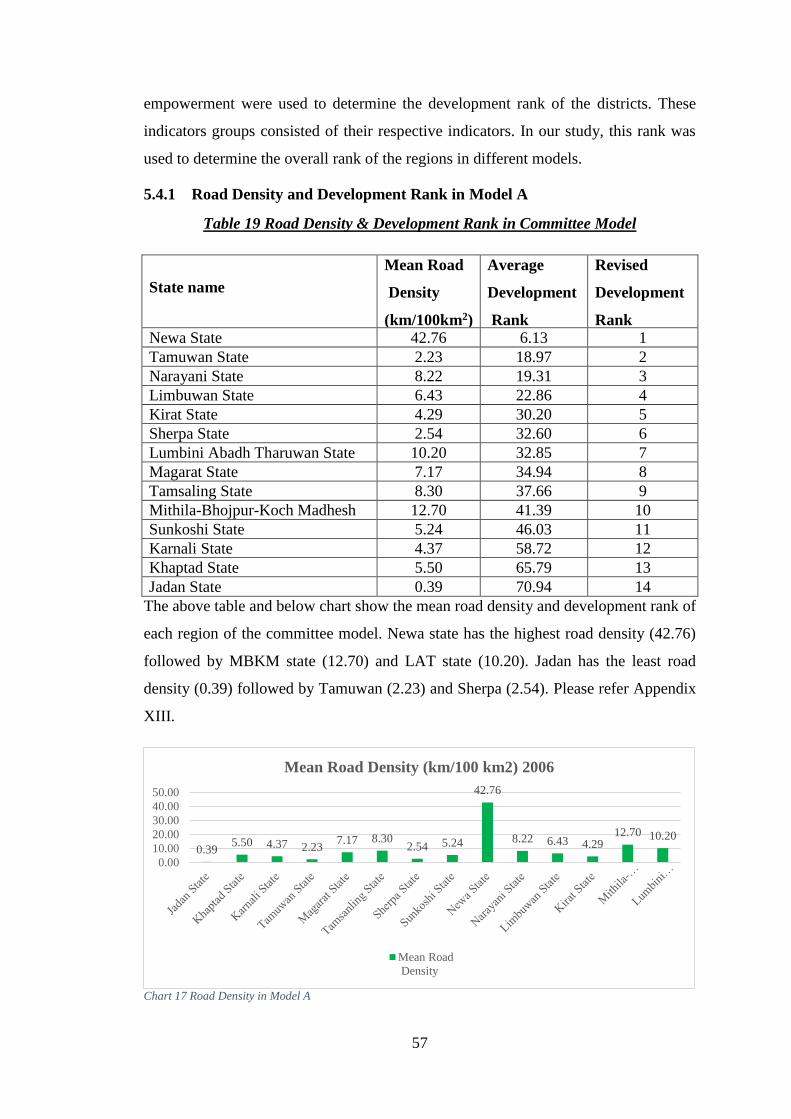
57
empowerment were used to determine the development rank of the districts. These
indicators groups consisted of their respective indicators. In our study, this rank was
used to determine the overall rank of the regions in different models.
5.4.1 Road Density and Development Rank in Model A
Table 19 Road Density & Development Rank in Committee Model
State name
Mean Road
Density
(km/100km2)
Average
Development
Rank
Revised
Development
Rank Newa State 42.76 6.13 1
Tamuwan State 2.23 18.97 2
Narayani State 8.22 19.31 3
Limbuwan State 6.43 22.86 4
Kirat State 4.29 30.20 5
Sherpa State 2.54 32.60 6
Lumbini Abadh Tharuwan State 10.20 32.85 7
Magarat State 7.17 34.94 8
Tamsaling State 8.30 37.66 9
Mithila-Bhojpur-Koch Madhesh
State
12.70 41.39 10
Sunkoshi State 5.24 46.03 11
Karnali State 4.37 58.72 12
Khaptad State 5.50 65.79 13
Jadan State 0.39 70.94 14
The above table and below chart show the mean road density and development rank of
each region of the committee model. Newa state has the highest road density (42.76)
followed by MBKM state (12.70) and LAT state (10.20). Jadan has the least road
density (0.39) followed by Tamuwan (2.23) and Sherpa (2.54). Please refer Appendix
XIII.
Chart 17 Road Density in Model A
0.395.50 4.37 2.23
7.17 8.302.54 5.24
42.76
8.22 6.43 4.2912.70 10.20
0.00
10.00
20.00
30.00
40.00
50.00
Mean Road Density (km/100 km2) 2006
Mean Road
Density

58
Similarly in comparing the development rank, Newa is ranked the first followed by
Tamuwan, Narayani & Limbuwan state. Jadan is the least developed state followed by
Khaptad and Karnali according to the above rank table. Newa state in both the cases
has been the best of all other states. However, MBKM state is in the 10th rank in the
rank table though it has been ranked second in the road density. This indicates that
poverty and deprivation with social development and women empowerment is
considerably low in this state.

59
5.4.2 Road Density and Development Rank in Model B
Table 20 Road Density & Development Rank in Commission Model
State name Mean Road
Density
(km/100km2)
Average
Development
Rank
Revised
Development
Rank
Newa State 39.03 10.46 1
Tamuwan State 2.25 18.96 2
Narayani State 7.75 20.77 3
Limbuwan State 6.43 22.86 4
Kirat State 3.40 28.87 5
Madesh-Abadh-Tharuwan 10.33 32.57 6
Magarat State 7.29 34.38 7
Madhes Mithila Bhojpura 12.23 38.57 8
Tamsaling State 7.08 39.94 9
Karnali - Khaptad State 3.54 64.09 10
Chart 18 Road Density in Model B
Like in the committee model Newa state stands alone with (39.03) km road length per
100 sq.km area in the commission model. Similarly, MMB and MAT states follow
Newa with 12.23 and 10.33 km. Tamuwan state has the least road density of strategic
road with only 2.25 Km per 100sq.km followed by Kirat (3.40) and Karnali-Khaptad
(3.54) state. In comparing development rank Newa, Tamuwan and Narayani states are
3.54 2.257.08 7.29 6.43
39.03
12.23 10.33
3.407.75
0.005.00
10.0015.0020.0025.0030.0035.0040.0045.00
Mean Road Density (km/100 km2) 2006
Mean Road Density

60
in the first, second and third place. Although MMB and MAT states have better
strategic road density against others, their ranks in development table are below rank 5.
The mean rank of Karnali Khaptad state (last in the rank) differs the second last state,
Tamsaling in the rank table by a significant difference of 25. This also indicates that
the districts in the Karnali Khaptad state are far backward in development. Please refer
Appendix XIV.

61
5.4.3 Road Density and Development Rank in Model C
Table 21 Road Density & Development Rank in Agreed Model
State name Mean Road
Density
(km/100km2)
Average
Development
Rank
Revised
Development
Rank
State 10 12.77 8.99 1
State 5 3.69 18.92 2
State 6 14.27 20.77 3
State 11 6.19 22.09 4
State 3 10.68 31.13 5
State 9 3.39 32.46 6
State 4 7.71 38.09 7
State 8 6.01 43.51 8
State 7 12.70 55.97 9
State 1 5.98 59.33 10
State 2 2.48 64.21 11
Chart 19 Road Density in Model C
The above chart shows strategic road density of 2006 in the model agreed in 2012 May.
It shows that State 6 (Kathmandu valley with Chitwan) has the highest density followed
by state 10 (Sunsari, Morang & Jhapa) and state 7 (Central Terai) with values 14.27,
12.77 and 12.70 respectively. State 2 (MW mountains & hills) has the least density of
the strategic road network. State 10, 5 (Pokhara with Manang & Mustang) and 6 are
ranked at top of development table while states 7, 1 and 2 are at the bottom that include
Central Terai, FWDR and MW hills and mountains respectively. Please refer map in
Appendix XV.
12.77
3.69
14.27
6.19
10.68
3.39
7.71
6.01
12.70
5.98
2.48
0.00
2.00
4.00
6.00
8.00
10.00
12.00
14.00
16.00
State 10 State 5 State 6 State 11 State 3 State 9 State 4 State 8 State 7 State 1 State 2
Mean Road Density (km/100 km2) 2006
Mean Road Density

62
The interstate difference between the richest and poorest states in the road densities is
lowest in the agreed model (10.29) followed by commission model (36.78) and
committee model (42.37). This indicates the disparity in the distribution of strategic
roads is less in the agreed models than in the other two models.
5.5 Energy Potentiality
Energy to any country is like water to living beings. With the technological
advancement human life has been made easier with machines. But these machines
require energy to function whether it is at home, office or industry. Vehicles and
construction machines also need energy to operate. No energy means no work and
ultimately no development.
It is often stated that Nepal has a huge potentiality of hydropower generation from its
fast flowing rivers. So, hydropower potential projects of different states in the models
have been determined and compared with one another to determine which has the most
and least hydropower potential. A total of 22,294 MW of potential has identified by
data collection. The list of hydropower projects with their names and capacity used in
the study is tabulated as below:
Table 22 List of Hydropower Projects
S.N Name
Capacity
(MW)
S.N Name Capacity
(MW)
1 Kankai 60 14 Upper Marsyangdi 121
2 Tamor Mewa 100 15 Upper Seti 122
3 Lower Arun 308 16 Madi 86
4 Arun III 402 17 Upper Modi 42
5 Upper Arun 335 18 Andhikhola storage 180
6 Dudh Koshi 300 19 Raughat 27
7 Thulo Dhunga 25 20 Chameliya 30
8 Likhu 4 51 21 West Seti 750
9 Upper Tamakoshi 250 22 Pancheswor 6480
10 Khimti II 27 23 Karnali Chisapani 10800
11 Langtang Storage 218 24 Upper Karnali 300
12 Budhi Gandaki 600 25 Budhi Ganga 20
13 Kali Gandaki 2 660 Total 22294
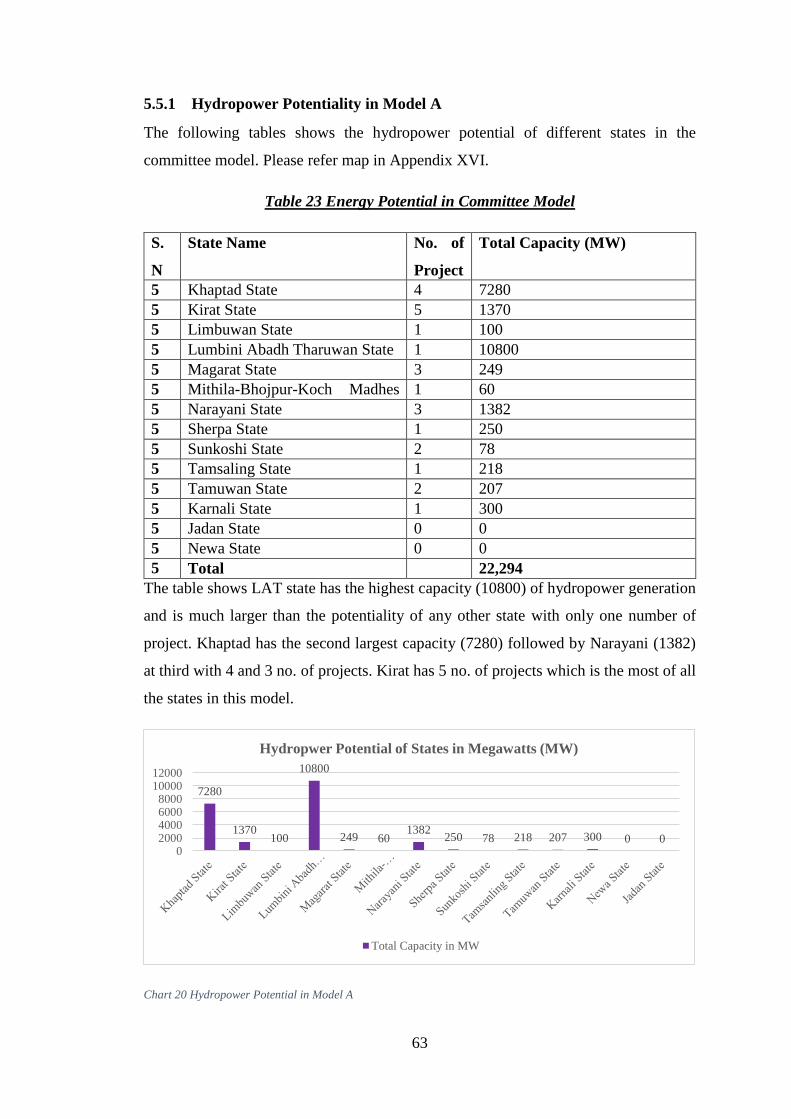
63
5.5.1 Hydropower Potentiality in Model A
The following tables shows the hydropower potential of different states in the
committee model. Please refer map in Appendix XVI.
Table 23 Energy Potential in Committee Model
S.
N
State Name No. of
Project
s
Total Capacity (MW)
5 Khaptad State 4 7280
5 Kirat State 5 1370
5 Limbuwan State 1 100
5 Lumbini Abadh Tharuwan State 1 10800
5 Magarat State 3 249
5 Mithila-Bhojpur-Koch Madhes
State
1 60
5 Narayani State 3 1382
5 Sherpa State 1 250
5 Sunkoshi State 2 78
5 Tamsaling State 1 218
5 Tamuwan State 2 207
5 Karnali State 1 300
5 Jadan State 0 0
5 Newa State 0 0
5 Total 22,294
The table shows LAT state has the highest capacity (10800) of hydropower generation
and is much larger than the potentiality of any other state with only one number of
project. Khaptad has the second largest capacity (7280) followed by Narayani (1382)
at third with 4 and 3 no. of projects. Kirat has 5 no. of projects which is the most of all
the states in this model.
Chart 20 Hydropower Potential in Model A
7280
1370100
10800
249 601382
250 78 218 207 300 0 00
2000400060008000
1000012000
Hydropwer Potential of States in Megawatts (MW)
Total Capacity in MW

64
Although these states were seen to be weaker in comparison of the earlier parameters,
they seem to be stronger in case of hydropower potential. Jadan state is weak in case of
this parameter as well as it has no potential. Similarly, Newa state has no potential of
hydropower generation although it has dominance over earlier discussed parameters.
5.5.2 Hydropower Potentiality in Model B
The following table shows the hydropower potential of different states in the
commission model. Please refer map in Appendix XVII.
Table 24 Energy Potential in Commission Model
S.
N
State Name No. of
Project
s
Total Capacity (MW)
5 Karnali - Khaptad State 5 7580
5 Kirat State 5 1370
5 Limbuwan State 1 100
5 Madhes-Abadh-Tharuwan 1 10800
5 Madhes Mithila Bhojpura 1 60
5 Magarat State 4 909
5 Narayani State 2 722
5 Tamsaling State 4 546
5 Tamuwan State 2 207
5 Newa State 0 0
5 Total 22,294
It can be seen that LAT state with one hydropower project (Karnali Chisapani) has the
greatest potential followed by Karnali Khaptad state and Kirat state. All other states
have at least one project in their territory except Newa state that has no any potential.
The following chart shows the potential in this model.

65
Chart 21 Hydropower Potential in Model B
As in the case of previous model, the same project (10800) has the influence in MAT
state making it the state having highest potential followed by Karnali Khaptad state
Kirat state. Newa state does not enclose any project making it potential less state as in
the commission model.
5.5.3 Hydropower Potentiality in Model C
The following table shows the hydropower potential of different states in the agreed
model. Please refer map in Appendix XVIII.
Table 25 Energy Potential of Agreed Model
S.
N
State Name No. of
Project
s
Total Capacity (MW)
5 State 1 4 7280
5 State 10 1 60
5 State 11 1 100
5 State 2 1 300
5 State 3 1 10800
5 State 4 3 249
5 State 5 4 929
5 State 6 1 660
5 State 8 4 546
5 State 9 5 1370
5 State 7 0 0
5 Total 22,294
It can be seen that state 3 has the greatest 10800 project within it followed by State 1
with 7280 MW potentiality and state 9 which significantly has lower potentiality than
the upper two like the previous models. State 7 (Central Terai) has no hydropower
7580
1370 100
10800
60 909 722 546 207 00
5000
10000
15000
Hydropower Potential of States in Megawatts (MW)
Total Capacity MW

66
potential identified and is in the weakest in comparison of this parameter. Please see
the chart below for illustration.
Chart 22Hydropower Potential in Model C
In comparing three models, the same 10800 MW project has the leading role in
potentiality of the states. Five of the 11 states have their potentiality less than 500 MW
and there is significant difference in the potentiality between first, second and third
highly potential states.
The present peak demand of electricity is about 1100 MW in Nepal but the supply in
the dry season is such that there are more than 14 Hours of load shedding. The demand
is gradually increasing annually. Only a few small projects can fulfill the increasing
demand. In this context, the project development of such large project (10800) may be
a matter of discussion at present.
5.6 Revenue to Expenditure (R/E) Ratio and Human Development Index (HDI)
Revenue and expenditure are the measure of economic activities that take place in the
regions. Revenue to expenditure ratio of the districts has been calculated and analysed
spatially in the GIS to find out the ratio in different states of each models. Consolidated
Financial statements of 2012/13 published by Financial Comptroller General Office has
been used in the analysis. Revenue or Income come from the tax or other sources.
Similarly, Expenditure may be recurrent, capital and financial.
Similarly, HDI measures the positive growth and change in human wellbeing in
individual and collective basis. It is a composite statistic of life expectancy, education
7280
60 100 300
10800
249929 660 546
1370
00
2000
4000
6000
8000
10000
12000
State 1 State 10 State 11 State 2 State 3 State 4 State 5 State 6 State 8 State 9 State 7
Hydropwer Potential of States in Megawatts (MW)
Capacity in Megawatts

67
and income indices. District level (2011) data published by UNDP in 2014 was used to
determine the indices of the states using GIS. The values of regions in each models
have been analysed and comparison has been made.
5.6.1 (R/E) Ratio & HDI in Model A
The following table shows (R/E) ratio and HDI in committee model. Please refer map
in Appendix XIX.
Table 26 (R/E) Ratio & HDI in Committee Model
S.
N
State Name Mean R/E Ratio Mean HDI
1 Jadan State 0.02 0.39
2 Khaptad State 0.03 0.40
3 Karnali State 0.03 0.41
4 Tamuwan State 0.11 0.52
5 Magarat State 0.05 0.46
6 Tamsaling State 0.69 0.48
7 Sherpa State 0.31 0.48
8 Sunkoshi State 0.05 0.46
9 Newa State 1.49 0.59
10 Narayani State 0.64 0.51
11 Limbuwan State 0.16 0.50
12 Kirat State 0.06 0.49
13 Mithila-Bhojpur-Koch Madhesh
State
3.46 0.45
14 Lumbini Abadh Tharuwan State 0.70 0.47
Chart 23 (R/E) & HDI in Model A
0.02 0.03 0.03 0.11 0.05
0.690.31
0.05
1.49
0.640.16 0.06
3.46
0.70
0.000.501.001.502.002.503.003.504.00
Mean I/E Ratio & HDI of States
MEAN R/E Ratio HDI

68
(R/E) Ratio
MBKM state has the highest I/E ratio (3.46) followed by Newa and LAT which have
values 1.49 and 0.70 respectively. Tamsaling and Narayani States have I / E ratio
comparable to these stronger states while the others are still incomparable. Values
greater than 1 represent that the revenue collection is higher than the total expenditure
of the states. Only LAT and Newa states have values greater than 1 which indicates
only these two states generate higher revenues than expenditure they make. However,
8 out of 14 states have revenues less than 20% of the expenses they make. This further
indicates that the expenses of these states are to be borne by the high earning states or
other sources of central government. Jadan, Khaptad and Karnali are weakest states
with respect to I/E ratio as well.
HDI
Similarly, in comparing HDIs of different states Newa, Tamuwan, Narayani &
Limbuwan states are at the top of hierarchical order. Karnali, Khaptad, Jadan and
MBKM are at the bottom of the hierarchical table which indicate that FWDR and
central region have lower values of HDI.
5.6.2 (R/E) Ratio & HDI in Model B
The following table shows (R/E) ratio and HDI in commission model. Please refer map
in Appendix XX.
Table 27(R/E) Ratio & HDI in Commission Model
S.
N
State Name Mean R/E Ratio Mean HDI
1 Karnali - Khaptad State 0.03 0.40
2 Tamuwan State 0.11 0.52
3 Tamsaling State 0.49 0.47
4 Magarat State 0.08 0.47
5 Limbuwan State 0.16 0.50
6 Newa State 1.34 0.58
7 Madhes Mithila Bhojpura 3.22 0.46
8 Madesh-Abadh-Tharuwan 0.73 0.47
9 Kirat State 0.07 0.49
10 Narayani State 0.35 0.51

69
Chart 24 (R/E) Ratio & Development Rank in Model B
(R/E Ratio)
Like in the committee model MMB (3.22) and Newa states (1.34) in this model have
higher (I/E) ratio followed by MAT state and Tamsaling states respectively. Five out of
10 states in this model have their revenue collection less than 20 % of expenditure.
Karnali Khaptad State has the lowest (I/E) ratio followed by Kirat and Magarat states.
HDI
Newa, Tamuwan and Narayani have the highest HDI with values 0.58, 0.52 and 0.51
values respectively. Karnali-Khaptad, MMB and Magarat have the lowest HDI indices
making them weaker in comparison of this parameter. Newa seems to be the strongest
of all other states as it lies top in the HDI ranking and second (R/E) ratio ranking.
However, MMB lies at the second last of HDI ranking although it is at the top of (I/E)
table.
0.03 0.110.49
0.08 0.16
1.34
3.22
0.73
0.070.35
0.00
0.50
1.00
1.50
2.00
2.50
3.00
3.50
Mean I/E Ratio & HDI of States
MEAN R/E Ratio HDI

70
5.6.3 (R/E) Ratio & HDI in Model C
The following table shows (R/E) ratio and HDI in agreed model. Please refer map in
Appendix XXI.
Table 28 (R/E) Ratio & HDI in Agreed Model
S.
N
State Name Mean R/E Ratio Mean HDI
1 State 2 0.02 0.41
2 State 1 0.11 0.41
3 State 5 0.10 0.52
4 State 3 0.76 0.48
5 State 8 0.42 0.46
6 State 4 0.05 0.45
7 State 11 0.05 0.50
8 State 6 1.13 0.52
9 State 9 0.07 0.49
10 State 7 4.35 0.42
11 State 10 1.71 0.51
Chart 25 (R/E) Ratio & Development Rank in Model C
0.02 0.11 0.10
0.76
0.42
0.05 0.05
1.13
0.07
4.35
1.71
0.00
0.50
1.00
1.50
2.00
2.50
3.00
3.50
4.00
4.50
5.00
State 2 State 1 State 5 State 3 State 8 State 4 State 11 State 6 State 9 State 7 State 10
Mean I/E Ratio & HDI of States
MEAN R/E Ratio HDI

71
(R/E) Ratio
The above illustration shows that State 7, 10 and 6 have (R/E) ratio greater than 1
representing Revenue collected is higher in the states than the expenses they make. This
indicates that these states are self-sufficient from financial aspects. 6 out of 11 states
collect less than 20% revenue of the expenses they make. State 2 is the weakest in
revenue collection and collects only two percent revenue of the expenses it makes. In
such circumstances, states require financial support from external sources to function.
In this model, there are three states having I/E ratio greater than 1 compared with only
two states in the previous models.
HDI
States 5, 6 10 have the best HDI indices in this model which include top cities Pokhara,
Kathmandu and Biratnagar respectively. States 1& 2 have the least HDI indices in this
model.

72
CHAPTER VI
6. RESULTS
6.1 Results
The analysis shows that different states in the models have different values, distribution
and density of the parameters established. The quantified values of Population
distribution with density, share of major ethnic groups, infrastructural development
with development, arable land, energy potentiality, income and expenditure of the states
and HDI indicate the strength and weakness of each regions and their likeliness of
stability and sustainability. The results have been tabulated differently as below for
further analysis:
A. Tables showing Indicator Values in Three Different Models
B. Tables showing Scores of Indicator and ranking of States in each models.
C. Overall Ranking of States based of all Models based on Total Score

73
Table 29 Table showing Indicator values in Committee Model (Model A)
S.
N State Name
AREA
Sq.km
Pop
2011
Pop
Density
person/
Sq.km
Major
Ethnic
Group
Share
of
Major
Ethnic
Group
Arable
Land
(Hectares)
Hydrop
ower
Potentia
l (Mw)
R/E
Rati
o
2012
/13
Road
Dens
ity
Km/
100
Sq.k
m
Mea
n
Devel
opme
nt
Rank
Revi
sed
Dev
Ran
k
Mea
n
HDI
2011
1 Jadan State 14620.80 58729 4.02 Chhetri 53.35% 54241.00 0.00 0.02 0.39 70.94 14 0.39
2 Khaptad State 13523.40 1271303 94.01 Chhetri 59.09% 66730.00 7280.00 0.03 5.50 65.79 13 0.40
3 Karnali State 17832.34 1568866 87.98 Chhetri 37.46% 170624.00 300.00 0.03 4.37 58.72 12 0.41
4 Tamuwan State 12051.03 666737 55.33 Gurung 31.57% 140196.00 207.00 0.11 2.23 18.97 2 0.52
5 Magarat State 14653.36 2002277 136.64 Brahman
Hill
22.14% 290999.00 249.00 0.05 7.17 34.94 8 0.47
6 Tamsaling State 9918.09 1419064 143.08 Tamang 25.84% 159278.00 218.00 0.69 8.30 37.66 9 0.48
7 Sherpa State 4866.96 89986 18.49 Tamang 30.84% 33522.00 250.00 0.31 2.54 32.60 6 0.48
8 Sunkoshi State 5144.30 721879 140.33 Tamang 20.84% 95109.00 78.00 0.05 5.24 46.03 11 0.46
9 Newa State 929.06 2606158 2805.17 Tamang 20.84% 19806.00 0.00 1.49 42.76 6.13 1 0.59
10 Narayani State 7530.64 1885720 250.41 Brahman
Hill
22.14% 208332.00 1382.00 0.64 8.22 19.31 3 0.51
11 Limbuwan State 8767.73 900817 102.74 Limbu 15.69% 129332.00 100.00 0.16 6.43 22.86 4 0.51
12 Kirat State 8441.40 876972 103.89 Rai 20.79% 134099.00 1370.00 0.06 4.29 30.20 5 0.49
13 Mithila-Bhojpur-
Koch Madhesh
State
14059.35 7933002 564.25 Yadav 11.55% 590289.00 60.00 3.46 12.70 41.39 10 0.45
14 Lumbini Abadh
Tharuwan State
15392.44 4477661 290.90 Tharu 33.35% 224129.00 10800.0
0
0.70 10.20 32.85 7 0.47

74
Figure 7 Map showing Parameter values in Model A

75
Table 30 Table Showing Indicator Values in Commission Model (Model B)
S.
N State Name
Area
Sq.km
Pop
2011
Pop
Density
person/
Sq.km
Major
Ethnic
Group
Share
of
Major
Ethnic
Group
Arable
Land
(Hectares)
Hydropo
wer
Potential
(Mw)
R/E
Ratio
2012/
13
Road
Density
Km/100
Sq.km
Revise
d Dev
Rank
Mean
Dev
Rank
Mea
n
HDI
2011
1 Karnali -
Khaptad State 47096.67 2939883 62.00 Chhetri 49.96% 303694.00 7580.00 0.03 3.54 10.00 64.09 0.40
2 Tamuwan
State 12070.40 649731 54.00 Gurung 31.57% 140635.00 207.00 0.11 2.25 2.00 18.96 0.52
3 Tamsaling
State 17747.16 2272354 128.00 Tamang 25.84% 281327.00 546.00 0.49 7.08 9.00 39.94 0.47
4 Magarat State 15179.95 1977763 130.00 Brahman
Hill 22.14% 303710.00 909.00 0.08 7.29 7.00 34.38 0.47
5 Limbuwan
State 8767.73 900821 103.00 Limbu 15.69% 129332.00 100.00 0.16 6.43 4.00 22.86 0.51
6 Newa State 1038.88 2642766 2545.00 Tamang 20.84% 22138.00 0.00 1.34 39.03 1.00 10.46 0.58
7 Madhes
Mithila
Bhojpura
15838.60 8153860 515.00 Yadav 11.55% 649333.00 60.00 3.22 12.23 8.00 38.57 0.46
8 Madhesh-
Abadh-
Tharuwan
13975.03 4413723 316.00 Tharu 33.35% 207789.00 10800.00 0.73 10.33 6.00 32.57 0.47
9 Kirat State 11079.13 894263 81.00 Rai 20.79% 155540.00 1370.00 0.07 3.40 5.00 28.87 0.49
10 Narayani State 4989.52 1650295 331.00 Brahman
Hill 22.14% 123937.00 722.00 0.35 7.75 3.00 20.77 0.51
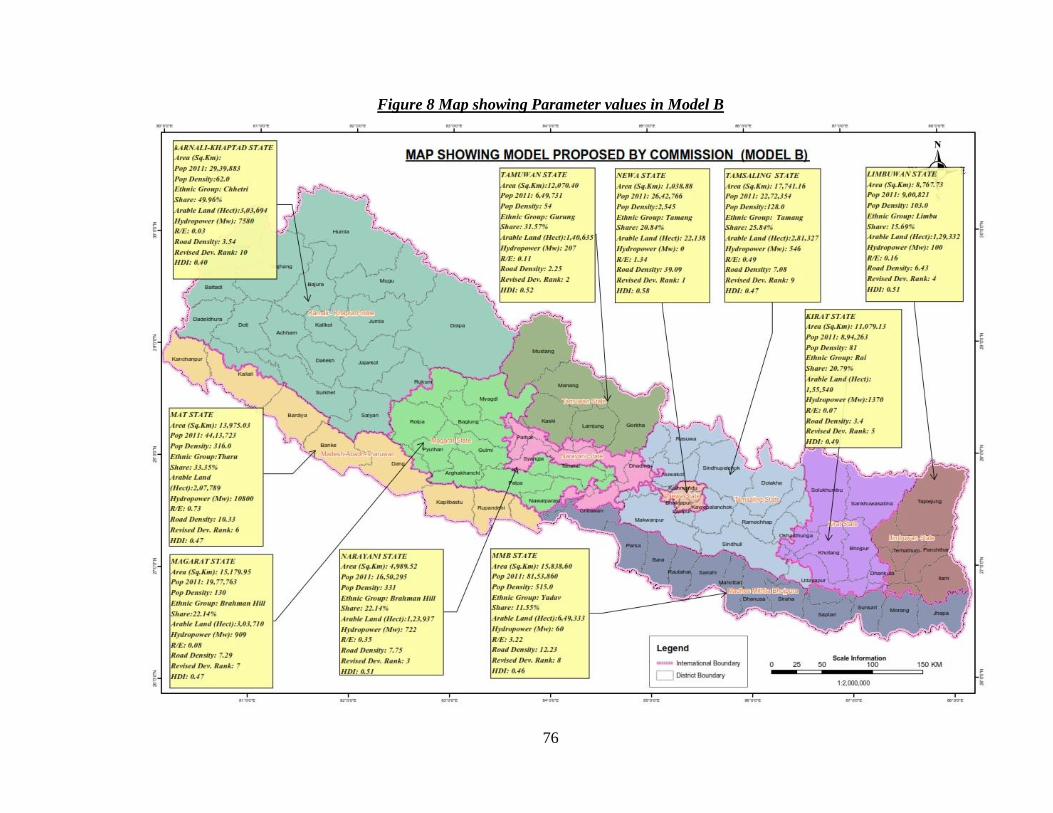
76
Figure 8 Map showing Parameter values in Model B

77
Table 31 Table Showing Indicator Values in Agreed Model (Model C)
S.
N
State
Name
Area
Sq.km
Pop
2011
Pop
Densit
y
person
/Sq.k
m
Major
Ethnic
Group
Share
of
Major
Ethnic
Group
Arable
Land
(Hectares
)
Hydro
power
Potenti
al
(Mw)
R/E
Rati
o
2012
/13
Road
Densi
ty
Km/1
00
Sq.k
m
Mean
Devel
opme
nt
Rank
Re
vis
ed
De
v
Ra
nk
Mea
n
HDI
2011
1 State
2 31017.70 1461191 47.00 Chhetri 40.37% 218998.00 300.00 0.02 2.48 64.21 11 0.41
2 State
1 19785.36 2552674 129.00 Chhetri 59.09% 124388.00 7280.00 0.11 5.98 59.33 10 0.41
3 State
5 17999.74 1976648 110.00 Brahman
Hill 22.14% 274373.00 929.00 0.10 3.69 18.92 2 0.52
4 State
3 11996.77 3565858 297.00 Tharu 31.70% 200445.00 10800.0
0 0.76 10.68 31.13 5 0.48
5 State
8 12574.82 1479688 118.00 Tamang 25.84% 180790.00 546.00 0.42 6.01 43.51 8 0.46
6 State
4 10960.49 1470553 134.00 Brahman
Hill 22.14% 210150.00 249.00 0.05 7.71 38.09 7 0.45
7 State
11 9824.52 967114 98.00 Rai 20.79% 130534.00 100.00 0.05 6.19 22.09 4 0.50
8 State
6 7728.18 4049581 524.00 Tamang 20.84% 204786.00 660.00 1.13 14.27 20.77 3 0.52
9 State
9 11669.24 1026309 88.00 Tamang 25.84% 172131.00 1370.00 0.07 3.39 32.46 6 0.49
10 State
7 9595.27 5405058 563.00 Yadav 11.55% 401176.00 0.00 4.35 12.70 55.97 9 0.42
11 State
10 4631.41 2541381 549.00 Brahman
Hill 10.34% 199787.00 60.00 1.71 12.77 8.99 1 0.51
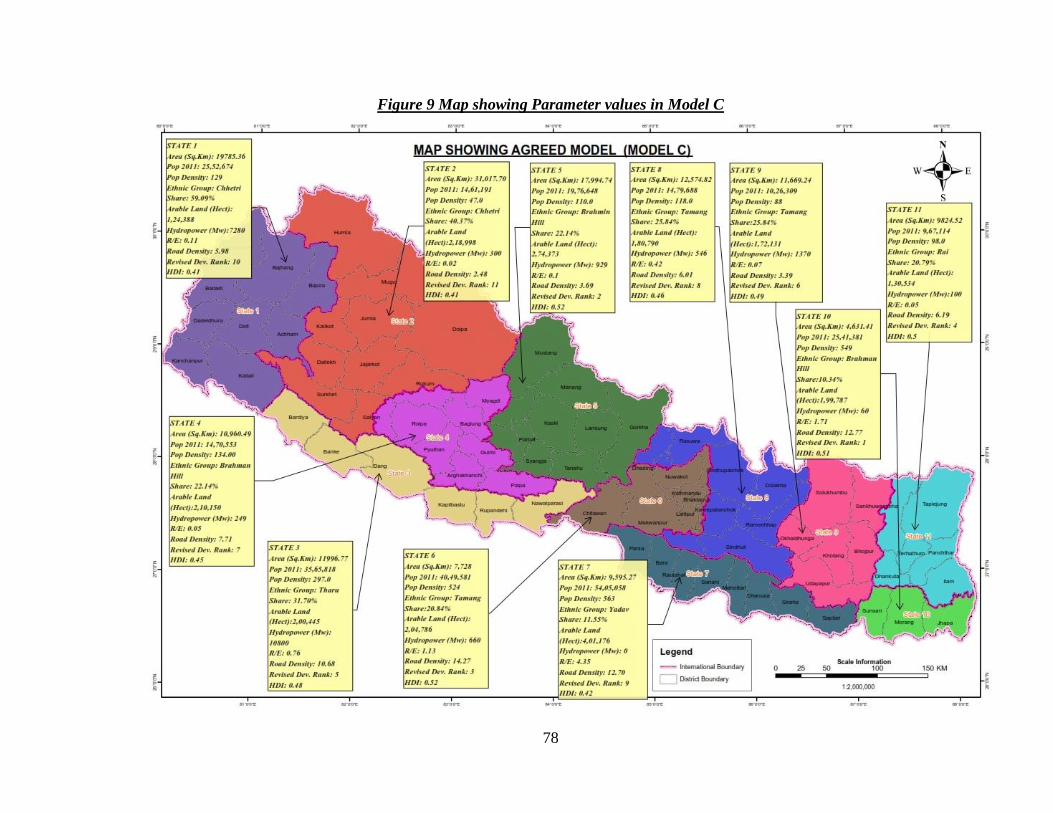
78
Figure 9 Map showing Parameter values in Model C

79
6.2 Weighted Analysis & Ranking of States
Parameters have been assigned a weightage value such that maximum value is given more
points and other values based on the ratio of maximum value in each parameters. The total
value of 100 points has been divided to these parameters. The points obtained by each
region or state is simply calculated by adding the values of each parameter in different
models. The following table shows the weightage assigned to each parameter in this
research:
Table 32 Table showing Parameter Weightage
SN Parameter Scoring Unit Score
1 Population No. 20
2 Share of Major Ethnic Group Percentage 10
3 Arable Land
Hectares 10
4 Hydropower Potential Megawatt 10
5 Road Density Km/100 Sq.km 10
6 Revenue/Expenditure Ratio Ratio 20
7 Human Development Index No. 10
8 Development Rank No. 10
Total 100
The state with highest population receives 20 points whereas the state having least
population receives 0 points. The intermediate values between maximum and minimum
receive points based on their ratio to maximum value. Similarly, points for other parameters
are calculated based on their weightage assigned in the above table. Greater weightage has
been given to population and R/E ratio than the other parameters as population
concentration indicates the possibility of growth of the region and R/E ratio the ability to
collect financial resources.

80
Table 33 Table showing Rank Score of States in Model A (Committee Model)
S.N State Name
Pop
2011
(20)
Share
of
Major
Ethnic
Group
(10)
Arable
Land
(Hectare
s) (10)
Hydro
power
Potent
ial
(Mw)
(10)
R/E
Ratio
2012/13
(20)
Road
Density
Km/100
Sq.km
(10)
Mean
Develop
ment
Rank
(10)
Mean
HDI
2011 (10)
Total
Score
(100) Rank
1 Mithila-Bhojpur-Koch
Madhesh State 20.00 1.95 10.00 0.06 20.00 2.97 4.17 7.64 66.79 1
2 Lumbini Abadh
Tharuwan State 11.29 5.64 3.80 10.00 4.05 2.39 5.37 7.98 50.51 2
3 Newa State 6.57 3.53 0.34 0.00 8.61 10.00 9.14 10.00 48.18 3
4 Narayani State 4.75 3.75 3.53 1.28 3.70 1.92 7.28 8.69 34.90 4
5 Khaptad State 3.21 10.00 1.13 6.74 0.17 1.29 0.73 6.76 30.02 5
6 Tamsaling State 3.58 4.37 2.70 0.20 3.99 1.94 4.69 8.07 29.54 6
7 Magarat State 5.05 3.75 4.93 0.23 0.29 1.68 5.07 7.88 28.88 7
8 Tamuwan State 1.68 5.34 2.38 0.19 0.64 0.52 7.33 8.86 26.94 8
9 Limbuwan State 2.27 2.66 2.19 0.09 0.92 1.50 6.78 8.56 24.98 9
10 Kirat State 2.21 3.52 2.27 1.27 0.35 1.00 5.74 8.27 24.63 10
11 Karnali State 3.96 6.34 2.89 0.28 0.17 1.02 1.72 7.02 23.40 11
12 Sherpa State 0.23 5.22 0.57 0.23 1.79 0.59 5.40 8.19 22.22 12
13 Sunkoshi State 1.82 3.53 1.61 0.07 0.29 1.23 3.51 7.78 19.84 13
14 Jadan State 0.15 9.03 0.92 0.00 0.12 0.09 0.00 6.63 16.93 14

81
Table 34 Table Showing Rank Score of States in Commission Model
S.
N State Name
Pop
2011
(20)
Share
of
Major
Ethnic
Group
(10)
Arable
Land
(Hectare
s) (10)
Hydrop
ower
Potenti
al (Mw)
(10)
R/E
Ratio
2012/13
(20)
Road
Density
Km/100
Sq.km
(10)
Mean
Develop
ment
Rank
(10)
Mean
HDI
2011
(10)
Total
Score
(100) Rank
1 Madhes Mithila Bhojpura 20.00 2.31 10.00 0.06 20.00 3.13 3.98 7.99 67.47 1
2 Madhesh-Abadh-
Tharuwan
10.83 6.68 3.20 10.00 4.53 2.65 4.92 8.18 50.98 2
3 Newa State 6.48 4.17 0.34 0.00 8.32 10.00 8.37 10.00 47.69 3
4 Karnali - Khaptad State 7.21 10.00 4.68 7.02 0.19 0.91 0.00 7.01 37.01 4
5 Tamsaling State 5.57 5.17 4.33 0.51 3.04 1.81 3.77 8.09 32.30 5
6 Narayani State 4.05 4.43 1.91 0.67 2.17 1.99 6.76 8.84 30.81 6
7 Magarat State 4.85 4.43 4.68 0.84 0.50 1.87 4.64 8.18 29.98 7
8 Tamuwan State 1.59 6.32 2.17 0.19 0.68 0.58 7.04 9.08 27.65 8
9 Kirat State 2.19 4.16 2.40 1.27 0.43 0.87 5.50 8.51 25.33 9
10 Limbuwan State 2.21 3.14 1.99 0.09 0.99 1.65 6.43 8.77 25.28 10

82
Table 35 Table of Rank Score of States in Agreed Model (Model C)
S.N State Name
Pop
2011
(20)
Share
of
Major
Ethnic
Group
(10)
Arable
Land
(Hectares)
(10)
Hydropower
Potential
(Mw)
(10)
R/E
Ratio
2012/13
(20)
Road
Density
Km/100
Sq.km
(10)
Mean
Development
Rank
(10)
Mean
HDI
2011
(10)
Total
Score
(100) Rank
1 State 7 20.00 1.95 10.00 0.00 20.00 8.90 1.28 8.08 70.21 1
2 State 3 13.19 5.36 5.00 10.00 3.49 7.48 5.15 9.23 58.92 2
3 State 6 14.98 3.53 5.10 0.61 5.20 10.00 6.77 10.00 56.19 3
4 State 10 9.40 1.75 4.98 0.06 7.86 8.95 8.60 9.81 51.41 4
5 State 1 9.45 10.00 3.10 6.74 0.51 4.19 0.76 7.88 42.63 5
6 State 5 7.31 3.75 6.84 0.86 0.46 2.59 7.05 10.00 38.86 6
7 State 8 5.48 4.37 4.51 0.51 1.93 4.21 3.22 8.85 33.07 7
8 State 4 5.44 3.75 5.24 0.23 0.23 5.40 4.07 8.65 33.01 8
9 State 11 3.58 3.52 3.25 0.09 0.23 4.34 6.56 9.62 31.19 9
10 State 9 3.80 4.37 4.29 1.27 0.32 2.38 4.94 9.42 30.79 10
11 State 2 5.41 6.83 5.46 0.28 0.09 1.74 0.00 7.88 27.69 11

83
6.3 Analysis of Result:
6.3.1 Population Distribution and Density
The distribution of national population in the states are highly imbalanced as we see
from the results of the analysis. Population distribution of the states in the committee
model vary from less than 1% to 30% among the 14 states and 2.45% to 30.77% in the
commission model of 10 states. However, this imbalance is little less in the agreed
model of 11 states with 3.65% to 20.40%. MBKM in Model A, MMB in model B and
State 7 represent almost same geographical area (Central Terai) and are at the top of
their respective rank tables. Al these three states have highest score of population
parameters in their respective models.
Similarly, population density vary from 4 to 2805 in the committee model, 54 to 2545
in the commission model and 47 to 563 in the agreed model. Discrepancies in the
density show the different population pressure in the states. The denser states attract
more people from sparser states making the difference more which results in regional
imbalance and disparity. On the other hand, sparser region depend on denser regions
for human resource and there are chances of natural resource exploitation in the denser
states.
6.3.2 Major Ethnic Share & State Nomenclature
The analysis shows states have been named after ethnic groups like Chhetri, Brahman-
Hill, Magar, Tharu, Tamang, Newar, Yadav, Rai, Sherpa, Gurung and Limbu.
Although, Kami & Muslaman, have a greater share in national population compared to
Rai, Limbu, Gurung and Sherpa, no physical states have been assigned after them
though they belong to indigenous group. Chhetri and Brahman Hill have dominance in
5 states in all the models although the states have not been named after them. However,
agreed model has not been named after ethnic or caste groups.
In comparing the scores of this parameter, states in the Mid & Far Western Mountains
& Hill are ranked top. Chhetri have dominance in these regions but no state has been
named after them.
Although identity has been one of the aspects to be considered in state restructuring
process it has risen tensions between different ethnic groups who had been living
together peacefully since long. This tension has forced people to migrate from Terai to

84
Hill or Hill to Terai disturbing regional harmony and balance thereby affecting overall
regional development due to frequent strikes as the result of such tension.
6.3.3 Land Capability Distribution
States have imbalance in the distribution of arable land too in all the models. Newa has
the highest population density with the lowest area of arable land making it dependant
on other states for food and agricultural products. Far Western Mountains and Hills
named as Jadan, Khaptad and Karnali in different models cover a significant area of
land but have lesser arable area. Similarly, MBKM & LAT have scored more on in
arable land distribution followed by Magarat and Narayani state in model A whereas
MMB and Karnali Khaptad states in model B and State 7 & State 5 in model C.
States in the Terai have greater arable land that have potential of greater agricultural
production. Higher agricultural production contribute to better income of the people
engaged in the basic sector as they can make export to other states as well. States having
no portion of Terai land have lower arable land and thus lower agricultural productivity.
More or less balance in the distribution of arable land has been found in the agreed
model.
Similarly, states having more sloppy area with little flat terrain have to spend more on
infrastructural development due to difficulty in overcoming such terrain for
development works like road or canal construction. States that solely have the Terai
terrain are exempt of this difficulty making them stronger of other regions that have
considerable portion of sloppy terrain.
6.3.4 Road Density and Development Rank
Road density is the measure of infrastructural development in any region. Kathmandu
valley in the Newa state in committee and commission model has the highest strategic
road density which is much lesser in other states of all the models. This indicates
infrastructural development is much focused on Kathmandu valley. FWDR has the
lowest road density compared to eastern, central and western regions. Road Density
values differ from 0.39 to 42.76 km per 100 sq.km in the committee model, 2.25 to
39.03 in the commission model and 2.48 to 14.27 in the agreed model. The difference
is lowest in the agreed model and considerably comparable with one another states.

85
Thus there is imbalance in distribution of strategic road network in the committee and
commission model.
Similarly, Development ranks of the western states in each models is more than the
eastern and central states in each models. However, states in the Terai are ranked lower
in this case although they have better road density. Lower development rank indicates
poverty and deprivation, less infrastructural and social development and less
empowerment of women in the states. It means there is disparity in health facilities
provision, maternal care, life expectancy and other social infrastructure in the Western
Hilly and mountainous states and the states of Terai.
6.3.5 Energy Potentiality
Hydropower potentiality of the states represent the capacity to generate electricity using
the water resources they have. States in the Far western Hills and Mountains have the
greatest capacity to generate hydropower compared to other regions. Hydropower
production can be used to earn capital by selling excess energy to other regions.
Although, Khaptad and Karnali states seemed weaker in other parameters, they have a
greater potential of hydropower generation. This makes a stronger resource base for
these states. Industries are attracted if there is continuous supply of electricity.
Consequently, overall regional development can be achieved with the development of
other infrastructures. Newa and Jadan states have no potential for hydropower
generation and depend upon other states for electricity to run their industries.
There is a deficit of energy at present in Nepal but can be overcome with the
development of hydropower projects. Project as large as 10800 Megawatt can be used
to export energy to our big neighbours like China and India. This would contribute to
not only the beholding state but also for the whole nation. However, financing of such
project may not possible by the state government and should planned by national
government through international sources.
6.3.6 (R/E) Ratio
Revenue or income is the most important requirement to run any state or government.
Higher revenue means there is enough to spend for carrying out development works.
Income to expenditure ratio is greater than 1 in only 2 states in the committee model
and commission model and in 3 states of the agreed model. This indicates other states

86
incur more expenses than the revenues they collect and depend upon central
government for their administration and development. This also implies greater number
of states with no capacity of revenue collection may not be fruitful to the country as the
costs of running them will be higher.
On the other hand, the states that have more revenue collection have either economic
linkage with India or China or there are major growth centres of the country.
Kathmandu and Kaski have two big growth centres viz. Kathmandu, the capital city
and Pokhara while Morang, Rupandehi, Banke and Kailali districts have economical
linkage with India while Sindhupalchowk has with China. The states that enclose these
districts are at the top of table and stronger than other states in all the models. This
implies more linkages (road & economical) with the growth centres of India and China
with each state are required to strengthen the respective state economy and contribute
to overall regional development with the trickle down benefits of these two giant
nations.
6.3.7 HDI
Similarly, HDI of the states that have growth centres in them have higher value of
indices than those which have rural areas in them. States in the FWDR and Terai have
relatively lower HDI as compared to the states of eastern, central and western hills and
mountains. This also implies life expectancy, education level and income of the people
in the region is relatively lower than other states. Differences in HDI is more in model
A rather than model B and model C. However, the scores of states in this parameter are
quite even as compared to other parameters.

87
6.4 Overall Ranking of States
The scores obtained by all 35 states of different models have been tabulated in an
overall ranking table that shows stronger and weaker states based on the comparison of
total scores. This table shows which state of which model is stronger and what points it
has got under different parameters. The state at overall rank 1 is the strongest and at
overall rank 35 is the weakest. The letters in the parenthesis represent their respective
models viz. “A” for SR Committee Model, “B” for SR Commission model and “C” for
agreed model.
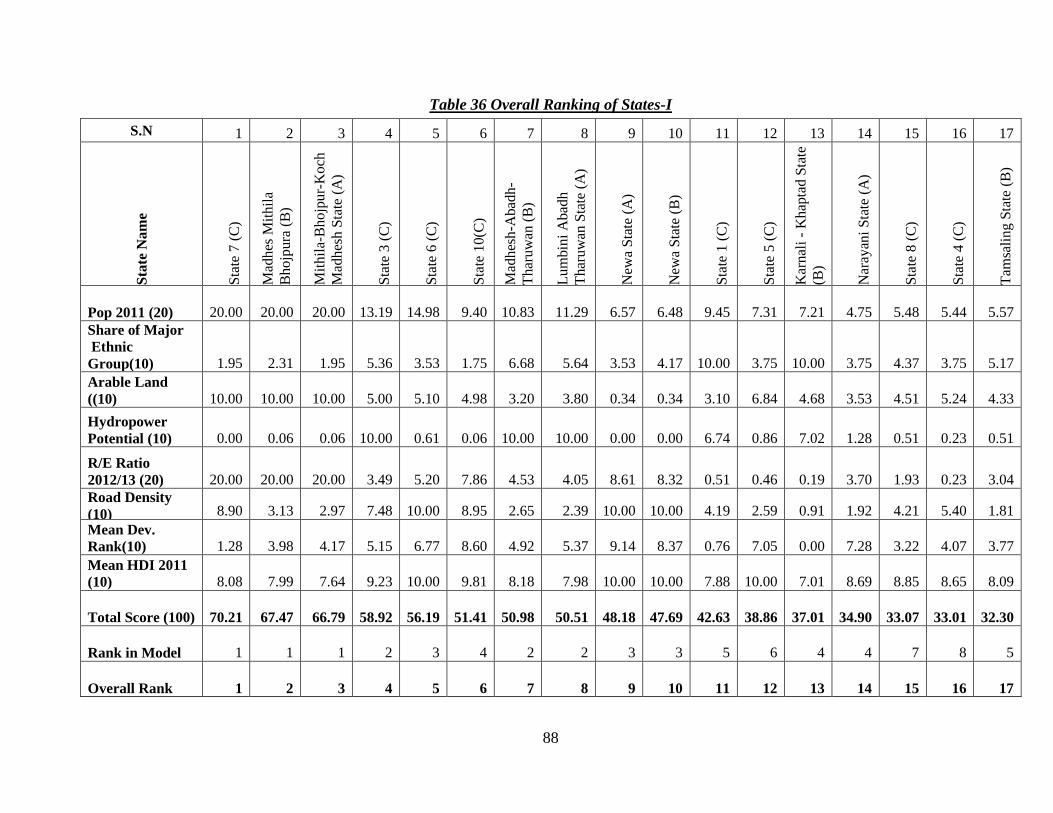
88
Table 36 Overall Ranking of States-I
S.N 1 2 3 4 5 6 7 8 9 10 11 12 13 14 15 16 17 S
tate
Nam
e
Sta
te 7
(C
)
Mad
hes
Mit
hil
a
Bhojp
ura
(B
)
Mit
hil
a-B
hojp
ur-
Koch
Mad
hes
h S
tate
(A
)
Sta
te 3
(C
)
Sta
te 6
(C
)
Sta
te 1
0(C
)
Mad
hes
h-A
bad
h-
Thar
uw
an (
B)
Lum
bin
i A
bad
h
Thar
uw
an S
tate
(A
)
New
a S
tate
(A
)
New
a S
tate
(B
)
Sta
te 1
(C
)
Sta
te 5
(C
)
Kar
nal
i -
Khap
tad S
tate
(B)
Nar
ayan
i S
tate
(A
)
Sta
te 8
(C
)
Sta
te 4
(C
)
Tam
sali
ng S
tate
(B
)
Pop 2011 (20) 20.00 20.00 20.00 13.19 14.98 9.40 10.83 11.29 6.57 6.48 9.45 7.31 7.21 4.75 5.48 5.44 5.57
Share of Major
Ethnic
Group(10) 1.95 2.31 1.95 5.36 3.53 1.75 6.68 5.64 3.53 4.17 10.00 3.75 10.00 3.75 4.37 3.75 5.17
Arable Land
((10) 10.00 10.00 10.00 5.00 5.10 4.98 3.20 3.80 0.34 0.34 3.10 6.84 4.68 3.53 4.51 5.24 4.33
Hydropower
Potential (10) 0.00 0.06 0.06 10.00 0.61 0.06 10.00 10.00 0.00 0.00 6.74 0.86 7.02 1.28 0.51 0.23 0.51
R/E Ratio
2012/13 (20) 20.00 20.00 20.00 3.49 5.20 7.86 4.53 4.05 8.61 8.32 0.51 0.46 0.19 3.70 1.93 0.23 3.04
Road Density
(10) 8.90 3.13 2.97 7.48 10.00 8.95 2.65 2.39 10.00 10.00 4.19 2.59 0.91 1.92 4.21 5.40 1.81
Mean Dev.
Rank(10) 1.28 3.98 4.17 5.15 6.77 8.60 4.92 5.37 9.14 8.37 0.76 7.05 0.00 7.28 3.22 4.07 3.77
Mean HDI 2011
(10) 8.08 7.99 7.64 9.23 10.00 9.81 8.18 7.98 10.00 10.00 7.88 10.00 7.01 8.69 8.85 8.65 8.09
Total Score (100) 70.21 67.47 66.79 58.92 56.19 51.41 50.98 50.51 48.18 47.69 42.63 38.86 37.01 34.90 33.07 33.01 32.30
Rank in Model 1 1 1 2 3 4 2 2 3 3 5 6 4 4 7 8 5
Overall Rank 1 2 3 4 5 6 7 8 9 10 11 12 13 14 15 16 17
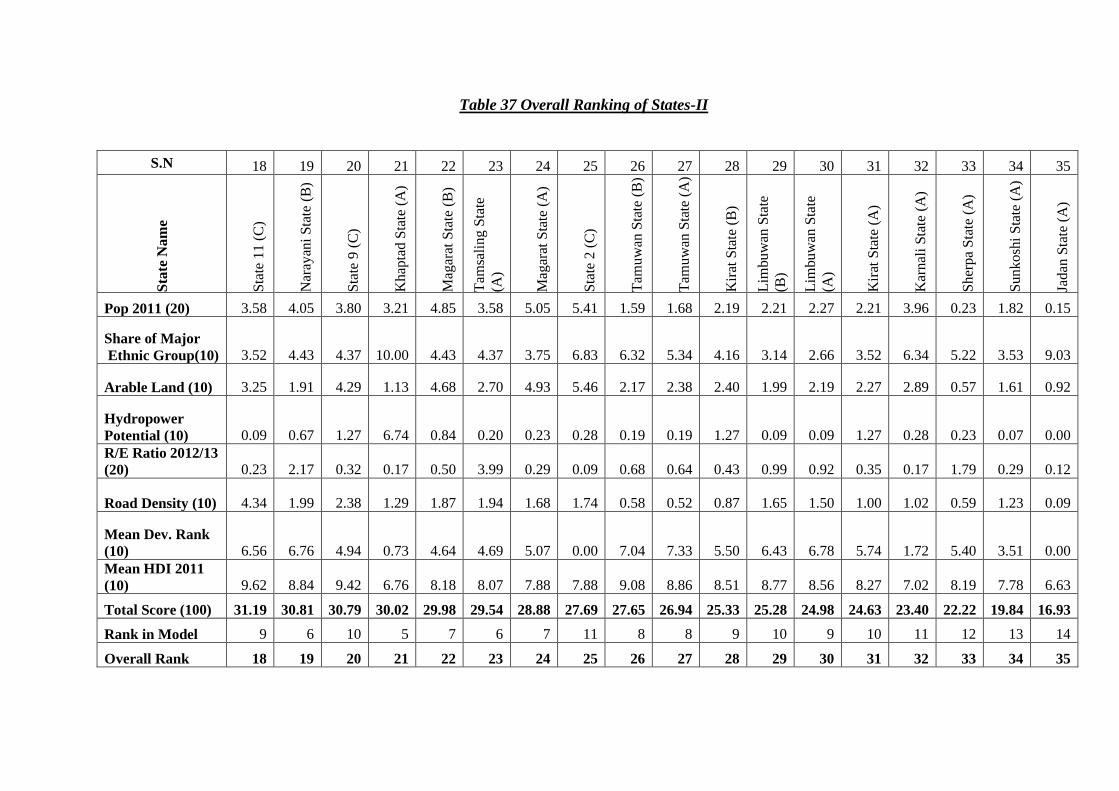
Table 37 Overall Ranking of States-II
S.N 18 19 20 21 22 23 24 25 26 27 28 29 30 31 32 33 34 35 S
tate
Nam
e
Sta
te 1
1 (
C)
Nar
ayan
i S
tate
(B
)
Sta
te 9
(C
)
Khap
tad S
tate
(A
)
Mag
arat
Sta
te (
B)
Tam
sali
ng S
tate
(A)
Mag
arat
Sta
te (
A)
Sta
te 2
(C
)
Tam
uw
an S
tate
(B
)
Tam
uw
an S
tate
(A
)
Kir
at S
tate
(B
)
Lim
buw
an S
tate
(B)
Lim
buw
an S
tate
(A)
Kir
at S
tate
(A
)
Kar
nal
i S
tate
(A
)
Sher
pa
Sta
te (
A)
Sunkosh
i S
tate
(A
)
Jadan
Sta
te (
A)
Pop 2011 (20) 3.58 4.05 3.80 3.21 4.85 3.58 5.05 5.41 1.59 1.68 2.19 2.21 2.27 2.21 3.96 0.23 1.82 0.15
Share of Major
Ethnic Group(10) 3.52 4.43 4.37 10.00 4.43 4.37 3.75 6.83 6.32 5.34 4.16 3.14 2.66 3.52 6.34 5.22 3.53 9.03
Arable Land (10) 3.25 1.91 4.29 1.13 4.68 2.70 4.93 5.46 2.17 2.38 2.40 1.99 2.19 2.27 2.89 0.57 1.61 0.92
Hydropower
Potential (10) 0.09 0.67 1.27 6.74 0.84 0.20 0.23 0.28 0.19 0.19 1.27 0.09 0.09 1.27 0.28 0.23 0.07 0.00
R/E Ratio 2012/13
(20) 0.23 2.17 0.32 0.17 0.50 3.99 0.29 0.09 0.68 0.64 0.43 0.99 0.92 0.35 0.17 1.79 0.29 0.12
Road Density (10) 4.34 1.99 2.38 1.29 1.87 1.94 1.68 1.74 0.58 0.52 0.87 1.65 1.50 1.00 1.02 0.59 1.23 0.09
Mean Dev. Rank
(10) 6.56 6.76 4.94 0.73 4.64 4.69 5.07 0.00 7.04 7.33 5.50 6.43 6.78 5.74 1.72 5.40 3.51 0.00
Mean HDI 2011
(10) 9.62 8.84 9.42 6.76 8.18 8.07 7.88 7.88 9.08 8.86 8.51 8.77 8.56 8.27 7.02 8.19 7.78 6.63
Total Score (100) 31.19 30.81 30.79 30.02 29.98 29.54 28.88 27.69 27.65 26.94 25.33 25.28 24.98 24.63 23.40 22.22 19.84 16.93
Rank in Model 9 6 10 5 7 6 7 11 8 8 9 10 9 10 11 12 13 14
Overall Rank 18 19 20 21 22 23 24 25 26 27 28 29 30 31 32 33 34 35

The above table shows the ranking of all 35 states against one another of three different
models. The ranking is done on the basis the total scores obtained by the states. The
states at the top of the table are the strongest and at the bottom, the weakest. State 7 in
model C, MMB in model B and MBKM in model A are at the rank 1, 2 & 3 respectively
and the strongest states but represent similar regions of central Terai. Similarly, in the
4th, 5th & 6th position are the states from model C (Agreed model) viz. State 3 (Western
& Mid-Western Terai), State 6 (Kathmandu valley & Inner Central Terai) and State 10
(Jhapa, Morang, and Sunsari). MAT & LAT states occupy the 7th & 8th rank but this
region is already represented by state 3 in the 4th rank. Newa states are in 9th and 10th
rank in model A & B and have already been represented by state 6 in the 5th rank.
Similarly, State 1 and State 5 are at 11th & 12th of rank that enclose FWDR and Pokhara
Valley with neighbouring districts respectively. Narayani, State 8 and State 4 are the
following regions in the hierarchical order and these are in the central & western Hills.
These states have economic linkage with Kathmandu growth centre and Pokhara
growth centre making themselves stronger.
However, States at the bottom of the rank table are weaker and may not be capable of
self-sustaining. Most of states of model A & B that have ethnic names are at the bottom
of the rank table which indicate that the regions bounded by them are comparatively
weaker and may not sustain. State 2 is the weakest state in model C (Agreed Model).
Jadan is the weakest state followed by Sunkoshi, Sherpa, Karnali, Kirat, Limbuwan,
Tamuwan and Magarat. This implies that the regions made by such delineation should
be avoided as far as practicable. Delineation of such states may increase regional
disparity making them weaker instead of fostering regional growth. If competitive
environment exists, the stronger regions will grow stronger and weaker, weaker. The
pre-existing regional disparity will further increase resulting in instability.
The table also shows that 8 out of 11 states in model C (Agreed Models) above the
average rank. This implies there are stronger regions in model C than the regions
delineated in model A and model B. The speciality of this model is that it considers the
integration of ecological regions mountain, hill and terai than the previous two models.
If the best model has to be chosen, Model C is recommended on the basis of this study.
91
CHAPTER VII
7. FINDINGS AND DISCUSSION
7.1 Models and Regional Development
One aspect of development refers to the provision of aid and assistance to the regions
that are less economically developed. Geophysical condition, accessibility, social
infrastructure and feasibility for economic development of the region can guide the
strategies for regional development. In this study, models have enclosed different
regions that have diverse geophysical condition and varying levels of infrastructure and
social development. The objective of regional development has been to contribute to
integrated national development thereby increasing intraregional equity but decreasing
interregional disparity. Increase in Gross Domestic Product (GDP) and National
income is only possible by creating sustainable regions that can facilitate local
development as well. So, it is necessary for the regions proposed by these models to be
sustainable through functional linkage with other regions as well and foster local as
well as national growth by strongly tying the central and local level.
7.2 Contribution to Regional Development
The models in this study contain regions that have different qualities regarded as
strength or weakness. Every region, how strong or weak it is, is equally important as
other regions as all of them share the common boundary of a nation with similar interest.
The implication of all the models to regional development are briefly discussed below.
7.2.1 Committee Model (Model A):
The fourteen state model has tried to delineate most of the regions based on ethnicity
as identity with 3 tier structure viz. Federal, State and local level. There are also
autonomous, protected & special zones within the states. There are only two states in
the Terai while the remaining 12 are in the hills or mountains. These two states contain
almost half of the national population and almost all of the portion of the East-West
Highway that has played a role as a growth axis where development centres have
flourished as cities along it. These growth centres are further connected to gateway
towns that have economical linkage with Indian towns from where goods and
machineries are imported to Nepal. These two states collect significant portion of
revenue by enforcing customs and tax which the source of income for national

92
government. On the other hand, these two states have a major portion of arable land
where food production is high and regarded as the greenbelt of Nepal.
As the theory of industrial location suggests the industries are located where the labour
is cheaper and transportation costs are minimum, these states are more advantageous
over the others that do not enough stretch of road infrastructure. These states have
greater number of industries. The increased basic activities within them have induced
multiplier effect in regional economy thereby contributing to regional development.
As we go up to the states of hilly and mountainous terrain, we find limited accessibility
with sparse road density and population. The roads constructed as growth axes from
North to South have somehow reduced the friction of sloppy terrain and distance. These
roads connect the growth points of the hills to the development centre of Terai and serve
an economic function. Some states in this model have no direct linkage to gateway
cities of India or China and have to depend on other connecting states. There is no
possibility of collecting revenues from customs. However, states that contain the basin
or watershed of Koshi, Gandaki and Karnali have better energy potentiality, the usage
of which would generate income for them by selling the excess energy and contribute
to regional development.
Some states in the Himalayan region have scenic beauty and attract a lot of tourist every
year. The tourist visits have yielded income to the local People and tax to the
government. If some portion of it is retained within the state, it would contribute to its
development directly. On the other hand, there is a single gateway town towards China
limiting the economical linkage only to Tamsaling state. States like Jadan neither have
road infrastructure, nor linkage or scenic beauty, nor energy potentiality or arable land.
The contribution of such states to regional development will be minimum unless
effective regional strategies have been undertaken.
7.2.2 Commission Model (Model B):
This 10 state model has been delineated with minor modification to 14 state committee
model. Jadan, Karnali & Khaptad of 14 state model have been merged to create a greater
Karnali-Khaptad state while the states like Sunkoshi and Sherpa have been omitted.
Both the states of Terai have been joined unlike the previous model where they were
separated. Newa state, which has capital city in it has a huge agglomeration of
population and economic activities. It has better revenue collection, road density and

93
HDI. The trickle down benefits of Newa may be useful to surrounding states like
Tamsaling. So Newa has contributed to overall regional development of central hills
and mountains. Similarly, Karnali Khaptad state seems stronger and has larger potential
for hydropower generation the usage of which can be source of income for whole the
hills and mountains of mid and far western region contributing to regional development.
States in the mountains and hills that have no linkage with China, tourist destinations,
energy potential are relatively weaker and have less contribution to national income.
Kirat & Limbuwan have less contribution as compared to other states in this model.
7.2.3 Agreed Model (Model C)
This 11 state model shows less interstate differences in the parameters studied as
compared to previous two models. The far western region is a single state that consists
of all ecological regions and has functional linkage with India in the west and south
whereas with China in the north. It has a portion of arable land and huge potentiality of
hydropower generation. This state can make a significant contribution to regional
development of the far western development region. However, state 2 of the mid-
western development region has the largest area but lower parameter values which
indicate that the region has been backward in development. It includes the districts of
Karnali zone that are regarded to be the remotest areas of Nepal. The contribution of
this state is minimum to the regional development of the mid-western region. Similarly,
State 9 followed by state 11 in the Eastern hills and mountains are weaker and
contribute less to regional and national development. However, all other states of this
model are above the middle rank 18 of the overall rank table indicating these regions
are more stronger with better capability of self-sustaining. More capable regions can
contribute more to overall national development thereby fostering their own regional
development. The population, resources and other infrastructure are quite evenly
distributed in this model than the other two models. This indicates lesser disputes within
the states over the resources and the rights to use them that might arise in future.
Although the models delineate stronger or weaker regions, only sound regional
development strategies can guide overall regional development in the context of overall
prosperity of Nepal. It may not be that states that seem stronger at present only
contribute to regional development. The development potential may be unleashed
through strategic placing of infrastructure or service delivery in these weaker states so
that they can induce regional growth and contribute to national development.

94
The main objective of state restructuring in the perspective of regional development has
been to reduce regional disparity among regions & ethnic groups by providing the rights
over the resources within their bounded territory. A coordinating level of government
between the central and local government has been sought that would strongly guide
resource flow from center to local level.
All of the models proposed federal models directly or indirectly advocate delineation
for major ethnic groups who have been residing there since long. It has been stated that
the principle and criteria for delineating these models are based on the basis of identity
and capability. The question arises “Does just delineating the boundaries under the
federal system ensure regional development?” The present discussion has spent much
time in the number and delineation of states only without giving significant attention
to the overall federal system.
7.3 Coalescing of Strong & Weak States
Nepal has diversity in ecological and ethnic distribution despite its small area. In this
context, there is no certainty that any form of federalism that has been successful in
other countries will work for Nepal. There is a fear that weaker states will be weaker
and stronger states more stronger if delineation is made without considering their self-
sufficiency or sustainability. This implies stronger and weaker regions should be
coalesced so that disparity would reduce amongst the regions.
On the other hand, there are views like just coalescing the stronger and weaker regions
does not foster regional growth because the resources have to be shared. The capacity
of stronger states to compete in international market will reduce as more investments
are to be made to weaker states where return is not quickly possible. So, it would be
wise to coalesce stronger & weaker regions separately so that strategic intervention can
be made separately for stronger and weaker regions. These strategic intervention would
be based on research that would unleash the potentiality of the regions that seem to be
weaker in the studied parameters. These potentiality can be just medicinal herbs, tourist
destination or high valued cash crops as a resource base for the regions.
7.4 Rights over resources
Apart of delineation, the rights of people over the resources bounded by their
designated territory are more important. Providing more rights to the dominant ethnic

95
group may bring chaos to other ethnic group that have more than half the dominance
in all states of all models. Water resources are important and more sensitive. The water
resources like river (natural boundary) are mostly used to delineate regions and make
boundaries. There may be disputes between the states who has more rights over these
boundary resource. Hydropower potentiality may be claimed by one another in case of
Nepal.
7.5 Federalism as Boon
It is also not necessary that the state or regional government will definitely tie up the
link between central and local government. Instead, if inefficient it will obstruct the
channel of resource flow from central level to action level with the increase in tier of
governance. The craving for power and tendency to centralize with undue influence of
political parties will make the federal system more ineffective than the present so called
decentralization system. There is unwillingness of the government officials to leave the
center as facilities are concentrated at the capital. There are also risks associated with
the implementation of federal rules. So, federal system should not be taken as a boon
or magic stick that will change the development scenario at once.
7.6 Power Sharing
The sharing of power between the federal, state and local government is another
important factor that need to be considered during the state restructuring process. Only
providing the map showing delineation does not actually strengthen the economic
status of the people and cater growth. Operation rights should be vested to the state
government so that action level can accomplish their works without obstruction.
Planning and monitoring can be the function of central government. Defense, Foreign
affairs, monetary policies, central banks, customs revenue, large hydro-electricity
projects, national highway and railways should be in the jurisdiction of federal
government.
7.7 Financial Capacity
There is an increase in administrative cost to run the government and delivering service
to the people with the increase in government tier. The more number of states incur
more cost to the central government ultimately. So, less number of states is more
favorable from this point of view.

96
CHAPTER VIII
8. CONCLUSION AND RECOMMENDATION
The overall rank table depicts the stronger and weaker regions by comparing the total
score obtained by the regions in each models. State 7 in model C, MMB in model B
and MBKM in model A are the strongest of all regions and represent the same
geographical area, central Terai. This region is followed by western & mid-western
Terai and represented as State 3. Similarly, State 6 with Kathmandu valley & inner
central Terai and state 10 with eastern Terai follow the above two regions in the rank
table. The states with region of central and western hills follow the above regions in the
hierarchy of strength. Similarly, Limbuwan & Kirat (Eastern Hills & Mountains),
Karnali (Mid-Western Mountains & Hills), Sherpa and Sunkoshi are weaker and are at
the bottom of rank table. All these weaker states are proposed by SRC (model A).The
region of Mid-western Mountain named as Jadan in model A is the weakest of all
regions.
8.1 Positive Impacts
The federal models discussed in this study are likely to have both the positive and
negative impacts to regional development. Positive impacts include the formation an
intermediate governing body that would try to guide local development providing
authoritative rights to the local people. Power would be easily devolved to the grass
root level and local people would be brought to the center of governance. It would
further deepen decentralization and promote infrastructural and social development so
that living standard of the people would be raised. It would provide autonomy to the
local level government like municipalities and VDC so that they can make spontaneous
benefits of the resource base they have. This would contribute to poverty alleviation
which is one of the strategies of regional development. The success of these models
will lead to prosperous economy and sustainable development.
8.2 Negative Impacts
Negative impacts include the added administrative cost to the federal government.
Inefficient allocation of power and responsibilities to the state government would only
increase redundancy in service delivery and resource flow. Initially a lot of financial

97
resources have to be spent in building infrastructure for service delivery by the nation.
With the increased tier, there is possibility of the loss of resources from center to local
level. If states compete with one another, the stronger states might be stronger while
the weaker more weaker unless the central government protects the weaker states. The
ambiguities may occur in resource sharing between the states and there may be rise in
interstate tension. This would endanger national unity between the autonomous states.
However, a system itself cannot be good or bad but depends upon how it is used. Good
power sharing and democratic culture in the local level will certainly promote overall
growth irrespective of any governing system. The consequences of the failure of federal
system may be more devastating than the exiting so called decentralization system.
The expectation of people from state restructuring is to build “A prosperous Nepal” by
using their rights over the resources that are beneficial to them. The life standard of
backward groups and communities is desired to be raised by their increased access to
the system of government and participation in governance along with poverty
alleviation. It would be more important to seek the class discrimination within the
ethnic groups rather than a single ethnic group as a whole so that people under the
poverty with limited access to the state would be empowered irrespective of any caste.
The following recommendations has been made on the basis of this study:
The local government should be powerful and authoritative rights should be vested
to it without comprising the sustainable use of regional resources.
There should be the constitutional recognition of the local government so that its
autonomy and development role will be enhanced and its status with power will be
protected.
The potentiality of forests, medicinal herbs and underground mineral resources
should be explored to find the ultimate resource base of the regions through extensive
research.
The federal or central government should release undue power and undue rights over
the resources it holds.
Economic and transportation linkage are to be built to ensure integration among the
different eco-development regions.
Focus in the development of strategic roads linking Terai, Hills and Mountains have
to be done in the Mid-Western Hills and Mountains.

98
Integration of eco-development regions between hills and terai with the idea of a
whole with sustainable use of resources will only lead to sustainable regional
development.
Programs and policies to improve life Expectancy, literacy rate and women
empowerment have to be introduced especially in the central terai and mid-western
hills and mountains.
Stronger and weaker regions should not compete with one another instead they
should complement one another.
Strategic regional plans for strengthening the regions are to be made to address the
weakness rather than sharing it.
The political economic analysis of the models would bring different other issues as
well.
8.3 Further Research Area Topics
The interregional relationship between the states is much important in fostering the
development in local, regional and national level with their collaborative efforts. It is
difficult for the states of the same nation to sustain without functional linkages and
synergy with their neighboring states as they make a common greater region as a whole.
So an extensive research in local, regional and national level has to be done to find out
to which extent these collaborative efforts foster development in different levels and
how can inter-state collaboration be enhanced for national integrity and development.
Besides, research at the local and regional level has to be done to unleash their resource
potential so that they can contribute to integrated national development.

99
REFERENCES
1. Dahal, Kedar 2007, ‘‘Emergence of Regional Development Agenda in Nepal
An Essay in Honour of Dr. Harka Gurung.’’ The Himalayan Review 38
(2007) pp.101-117
2. Shrestha, C.B 2007, ‘‘Harka Gurung’s Contribution in Regional
Development of Nepal.” The Himalayan Review 38 (2007) pp.53-58
3. Haughton G. and Counsell D. “Regions and sustainable development:
regional planning matters.” The Geographical Journal, Vol. 170, No. 2, June
2004, pp. 135–145
4. Gurung, Harka. “Nepal Development Strategy for Development”. Working
Paper Series No.3, June 2005. Asian Development Bank
5. Gurung Harka. “Regional Development Planning for Nepal”. National
Planning Commission, 1969
6. Joshi, Jibgar, “Regional Strategies for Sustainable Development in Nepal.”
Postscript: “Shaping Federal Structure in Nepal”, 2009 (Reprint)
7. Sharma P, Khanal with Tharu. “Towards a Federal Nepal An Assessment of
Proposed Models” 2009
8. Joshi, Jibgar. “Deepening Decentralization for Poverty Alleviation in
Nepal.” CAMAD Journal, Volume 10, NO. 2, Issue 20, October 2007 (Ashwin
2064), pp. 15– 23.
9. Malla, Umesh B. “Transition and Change in Nepal: State Restructuring
Agenda from Development Planning Perspective” Seminar Paper, pp. 58-
68, 13th National Convention, Nepal Engineer’s Association, April 2013
10. Choe, K. & Pradhan, P. “Unleashing Economic Growth Region Based
Development Strategy for Nepal.” 2010 Philippines, Asian Development
Bank
11. Ghai, Y. & Cottrell. “Federalism and State Restructuring in Nepal” Report
of the conference organised by Constitutional Advisory Support Unit, UNDP.
March 2007
12. Singh P.K, “Role of Emerging Highway Towns as a Growth Point” A case
of Golbazaar & Choharwa in Siraha District, MSc Urban Planning Thesis,
January 2007

100
13. Report of “State Restructuring & Distribution of State Power Committee”,
2010 (Nepal)
14. Report of “ Constituent Assembly State Restructuring Commission”, 2012
15. http://en.wikipedia.org/wiki/List_of_countries_by_GDP_(PPP)_per_capita
16. http://www.cbs.gov.np/?page_id=1101
17. http://www.myrepublica.com/portal/index.php?action=news_details&news_id
=74336
18. En. Wikipedia.org/wiki/politics of Nepal
19. En. Wikipedia.org/wiki/Federalism #Brazil
20. www.annapurnapost.com/en/new/political/11698
21. http://www.trcollege.net/study-material/24-economics/50-weber-s-theory-of-
industrial-location
22. http://www.csiss.org/classics/content/67
23. http://www.ccd.org.np/index.php?action=resources

APPENDICES

APPENDIX-I
Table Showing Population Share of Ethnic Groups

103

APPENDIX -II
Area of Arable Land by Eco development Region 2001/2002 (In thousand hectares)
Development region Mountain % of Mountain Hill % of Hill Terai % of Terai Total
Eastern 63.5 31.72% 214.4 24.85% 431.4 33.34% 709.3
Central 63.6 31.77% 213.2 24.71% 413.6 31.96% 690.4
Western 2 1.00% 225.5 26.13% 193.5 14.95% 421
Mid-Western 37.1 18.53% 145.1 16.82% 147.5 11.40% 329.7
Far-Western 34 16.98% 64.7 7.50% 108 8.35% 206.7
200.2 100.00% 862.9 100.00% 1294 100.00% 2357.1
Percentage Area of Arable Land by Eco-development Region 2001/2002
Development region Mountain Hill Terai Total
Eastern 63.5 214.4 431.4 709.3
% of Dev. Region 8.95% 30.23% 60.82% 100.00%
Central 63.6 213.2 413.6 690.4
% of Dev. Region 9.21% 30.88% 59.91% 100.00%
Western 2 225.5 193.5 421
% of Dev. Region 0.48% 53.56% 45.96% 100.00%
Mid-Western 37.1 145.1 147.5 329.7
% of Dev. Region 11.25% 44.01% 44.74% 100.00%
Far-Western 34 64.7 108 206.7
% of Dev. Region 16.45% 31.30% 52.25% 100.00%
Total 200.2 862.9 1294 2357.1
Source:cbs.gov.np/wp-content/uploads/2012/Agriculture/.../Chapter05.pdf

105
APPENDIX -III
Table Showing Development Rank & Road Density of Districts
S.N District Road
Density
(Km/100K
m2)
Devel
opme
nt
Rank
S.N District Road
Density
(Km/100K
m2)
Develop
ment
Rank
1 Taplejung 1.00 33.00 38 Tanahu 3.00 22.00
2 Panchthar 12.00 23.00 39 Syangja 9.00 16.00
3 Ilam 13.00 12.00 40 Kaski 12.00 9.00
4 Jhapa 12.00 3.00 41 Manang 6.00 6.00
5 Morang 12.00 11.00 42 Mustang 1.00 10.00
6 Sunsari 15.00 14.00 43 Myagdi 1.00 19.00
7 Dhankuta 15.00 7.00 44 Parbat 1.00 25.00
8 Terhathum 5.00 17.00 45 Baglung 8.00 20.00
9 Sankhuwasabh
a
2.00 18.00 46 Gulmi 6.00 24.00
10 Bhojpur 3.00 31.00 47 Palpa 10.00 27.00
11 Solukhumbu 0.00 29.00 48 Nawalparasi 9.00 8.00
12 Okhaldhunga 4.00 39.00 49 Rupandehi 9.00 37.00
13 Khotang 4.00 38.00 50 Kapilbastu 11.00 13.00
14 Udayapur 9.00 43.00 51 Arghakhanchi 13.00 54.00
15 Saptari 18.00 47.00 52 Pyuthan 9.00 42.00
16 Siraha 12.00 58.00 53 Rolpa 13.00 50.00
17 Dhanusa 16.00 46.00 54 Rukum 8.00 64.00
18 Mahottari 18.00 65.00 55 Salyan 2.00 60.00
19 Sarlahi 14.00 61.00 56 Dang 11.00 45.00
20 Sindhuli 4.00 49.00 57 Banke 12.00 21.00
21 Ramechhap 5.00 51.00 58 Bardiya 10.00 30.00
22 Dolakha 6.00 41.00 59 Surkhet 9.00 34.00
23 Sindhupalchok 6.00 48.00 60 Dailekh 9.00 28.00
24 Kavrepalancho
k
11.00 15.00 61 Jajarkot 11.00 63.00
25 Lalitpur 29.00 5.00 62 Dolpa 2.00 59.00
26 Bhaktapur 82.00 4.00 63 Jumla 0.00 67.00
27 Kathmandu 54.00 1.00 64 Kalikot 1.00 69.00
28 Nuwakot 12.00 36.00 65 Mugu 4.00 70.00
29 Rasuwa 3.00 53.00 66 Humla 0.00 75.00
30 Dhading 8.00 44.00 67 Bajura 1.00 74.00
31 Makwanpur 11.00 26.00 68 Bajhang 1.00 71.00
32 Rautahat 8.00 68.00 69 Achham 2.00 73.00
33 Bara 14.00 55.00 70 Doti 8.00 72.00
34 Parsa 3.00 52.00 71 Kailali 7.00 66.00
35 Chitawan 9.00 2.00 72 Kanchanpur 8.00 40.00
36 Gorkha 2.00 32.00 73 Dadeldhura 10.00 35.00
37 Lamjung 1.00 33.00 74 Baitadi 9.00 56.00
75 Darchula 12.00 62.00
Source: Development Rank UNDP Report 2003, Road Density, DoR 2006

106
APPENDIX- IV

107
APPENDIX- V
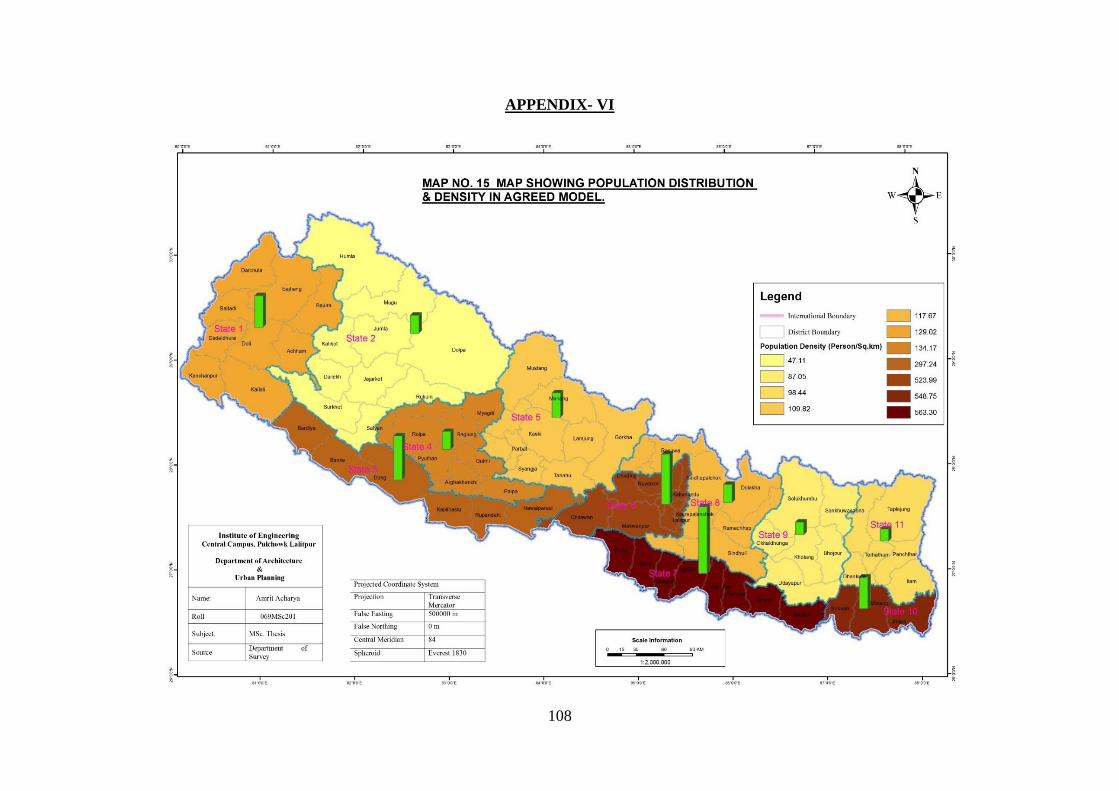
108
APPENDIX- VI

109
APPENDIX- VII

110
APPENDIX- VIII

111
APPENDIX- IX

112
APPENDIX- X

113
APPENDIX-XI

114
APPENDIX-XII

115
APPENDIX- XIII

116
APPENDIX-XIV

117
APPENDIX-XV

118
APPENDIX-XVI

119
APPENDIX-XVII

120
APPENDIX-XVIII

121
APPENDIX-XIX
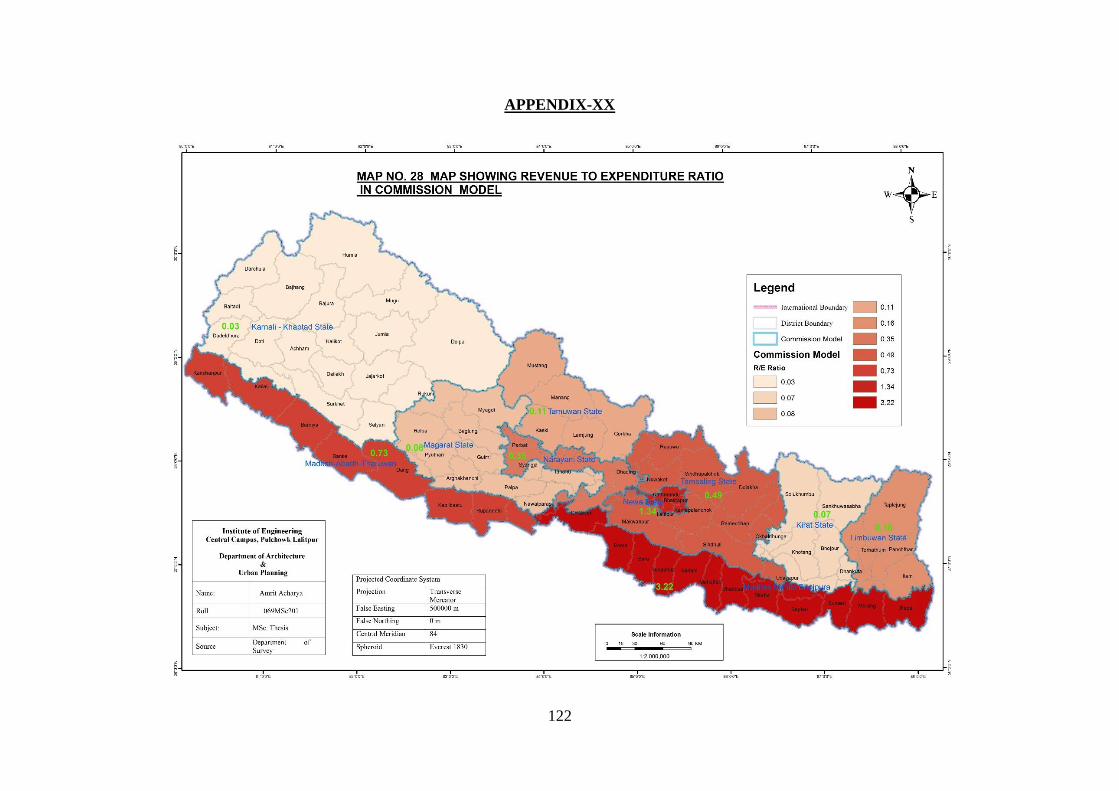
122
APPENDIX-XX

123
APPENDIX-XXI