State of Connecticut - CT.gov
488
S h awn T. Wooden Treasurer State of Connecticut Office of the Treasurer D arrell V. Hill Deputy Treasurer M E M O R A N D U M TO: Members of Investment Advisory Council FROM: Shawn T. Wooden, State Treasurer and Council Secretary DATE: September 3, 2021 SUBJECT: Investment Advisory Council Meeting – September 8, 2021 Enclosed is the agenda package for the Investment Advisory Council meeting on Wednesday, September 8, 2021 starting at 9:00 A.M. The following subjects will be covered at the meeting: Item 1: Approval of the Minutes of the August 11, 2021 IAC Meeting & August 11, 2021 IAC Audit Subcommittee Meeting Item 2: Opening Comments by the Treasurer Item 3: Update on the Market and the CRPTF Performance Ted Wright, Chief Investment Officer, will provide an update on the capital market environment and will report on the following: • The CRPTF performance as of June 30, 2021 and July 31, 2021 Item 4: Presentation by and Consideration of the Finalists for the Domestic Equity Fund - Small Capitalization Search Paul Osinloye, Principal Investment Officer, will provide opening remarks and introduce the following firms as the finalists for the Domestic Equity Fund - Small Capitalization search. • Ariel Investments, LLC • Channing Capital Management, LLC • Lord Abbett & Co. • Riverbridge Partners, LLC • Wellington Management Company, LLP Item 5: HarbourVest CRPTF Co-Investment Partnership Mark Evans, Principal Investment Officer, will provide opening remarks and introduce HarbourVest, a Private Investment Fund opportunity. 65 Capitol Ave, Hartford, CT 06106-1773, Telephone: (860) 702-3000 An Equal Opportunity Employer
-
Upload
khangminh22 -
Category
Documents
-
view
1 -
download
0
Transcript of State of Connecticut - CT.gov

Shawn T. Wooden
Treasurer S ta te o f C o nne c t i cut
O ff i c e of t he T r e a sur e r
Darrell V. Hill
Deputy Treasurer
M E M O R A N D U M
TO: Members of Investment Advisory Council
FROM: Shawn T. Wooden, State Treasurer and Council Secretary
DATE: September 3, 2021
SUBJECT: Investment Advisory Council Meeting – September 8, 2021
Enclosed is the agenda package for the Investment Advisory Council meeting on Wednesday, September 8, 2021 starting at 9:00 A.M.
The following subjects will be covered at the meeting:
Item 1: Approval of the Minutes of the August 11, 2021 IAC Meeting & August 11, 2021
IAC Audit Subcommittee Meeting
Item 2: Opening Comments by the Treasurer
Item 3: Update on the Market and the CRPTF Performance
Ted Wright, Chief Investment Officer, will provide an update on the capital market
environment and will report on the following:
• The CRPTF performance as of June 30, 2021 and July 31, 2021
Item 4: Presentation by and Consideration of the Finalists for the Domestic Equity Fund -
Small Capitalization Search
Paul Osinloye, Principal Investment Officer, will provide opening remarks and introduce the following firms as the finalists for the Domestic Equity Fund - Small Capitalization search.
• Ariel Investments, LLC
• Channing Capital Management, LLC
• Lord Abbett & Co.
• Riverbridge Partners, LLC
• Wellington Management Company, LLP
Item 5: HarbourVest CRPTF Co-Investment Partnership
Mark Evans, Principal Investment Officer, will provide opening remarks and introduce
HarbourVest, a Private Investment Fund opportunity.
65 Capitol Ave, Hartford, CT 06106-1773, Telephone: (860) 702-3000
An Equal Opportunity Employer

Item 6: Morgan Stanley Investment Management Real Assets Co-Investment Strategic
Partnership
Raynald Leveque, Deputy Chief Investment Officer, will provide opening remarks and introduce Morgan Stanley Investment Management, a Real Assets Fund opportunity.
Item 7: Other Business
• Discussion of the preliminary agenda for the October 13, 2021 IAC meeting
Item 8: Comments by the Chair
We look forward to reviewing these agenda items with you at the September 8th meeting.
Please confirm your attendance with [email protected] as soon as possible.
STW/kf
Enclosures

INVESTMENT ADVISORY COUNCIL Wednesday, August 11, 2021
SUCH MINUTES ARE IN DRAFT FORM AND SUBJECT TO THE FINAL REVIEW
AND APPROVAL OF THE INVESTMENT ADVISORY COUNCIL
MEETING NO. 495
Members present: D. Ellen Shuman, Chair
Treasurer Wooden, Secretary Thomas Fiore, representing Secretary Melissa McCaw
*10:41am departure Joshua Hall Michael Knight
Michael LeClairWilliam MurrayPatrick Sampson
Members absent: Steven Muench
Others present: Steven Meier, Interim Chief Investment Officer Kevin Cullinan, Chief Risk Officer
Patricia DeMaras, Legal Counsel Mark Evans, Principal Investment Officer Lyndsey Farris, Principal Investment Officer Karen Grenon, Legal Counsel
Darrell Hill, Deputy Treasurer Harvey Kelly, Pension Fund Analyst Peter Gajowiak, Senior Investment Officer Felicia Genca, Pension Fund Analyst
Raynald Leveque, Deputy Chief Investment Officer Paul Osinloye, Principal Investment Officer Veronica Sanders, Executive Secretary Christine Shaw, Assistant Treasurer for Corporate Governance &
Sustainable Investment Michael Terry, Principal Investment Officer Olivia Wall, Investment Officer
Guests: Greg Balewicz, Lord Abbett Mary Mustard, Meketa Investment Group Liz Smith, AllianceBernstein Peter Woolley, Meketa Investment Group
Public Line
With a quorum present, Chair D. Ellen Shuman called the Investment Advisory Council (“IAC”)
meeting to order at 9:01 a.m.
Approval of Minutes of the July 14, 2021 IAC Meeting
Chair Shuman called for a motion to accept the minutes of the July 14, 2021 IAC Meeting. William Murray moved to approve the minutes. The motion was seconded by Michael
AGENDA ITEM #1

INVESTMENT ADVISORY COUNCIL 2 Wednesday, August 11, 2021
LeClair. There was one abstention from Patrick Sampson. There being no further discussion,
the Chair called for a vote and the motion passed.
Comments by the Treasurer
Treasurer Wooden welcomed IAC members and began by thanking Interim Chief Investment
Officer (“CIO”) Steven Meier for his hard work and diligence through one of the most challenging economic climates the State has ever faced. He stated that this was Mr. Meier’s last IAC and announced Edward “Ted” Wright of Los Angeles County Employees Retirement Association (“LACERA”) was selected as the next CIO and would start on Monday, August 23rd.
Treasurer Wooden gave a brief overview of the agenda and thanked the members for joining the meeting.
Update on the Market and the Connecticut Retirement Plans and Trust Funds Performance
Mr. Meier, Interim CIO, provided an update on the Connecticut Retirement Plans and Trust Fund’s
performance and commented on the capital market environment and the economic outlook. Cash Flow Analysis
Raynald Leveque, Deputy CIO and Peter Gajowiak, Senior Investment Officer, presented the Cash Flow Report projections for Fiscal Year 2021 and provide an update on actual cash flows for Fiscal Year 2020.
Peer Performance Review Analysis
Mary Mustard and Peter Wooley of Meketa Investment Group presented a public pension plan peer performance review analysis.
Executive Session
Chair Shuman asked for a motion to move into Executive Session. A motion was made by
Thomas Fiore, seconded by Mr. Murray that the Investment Advisory Council enter into
Executive Session to consider personnel matters and discuss a potential contractual matter
at 10:42 a.m. The motion passed unanimously. Darrell Hill, Deputy Treasurer; Steven Meier, Interim CIO; and Mark Evans, Principal Investment Officer; were invited to attend the Executive Session.
Chair Shuman reconvened the regular session at 11:10 a.m . Chair Shuman noted that no
substantive votes or actions were taken during the Executive Session.
Consent to the Waive the 45-day Comment Period for the Potential Contractual Matter
Chair Shuman asked for a motion to waive the 45-day comment period for the potential contractual
matter. A motion was made by Mr. Sampson, seconded by Mr. Murray to waive the 45-day
comment period for the potential contractual matter. The motion passed.
Vote to approve the Revised Relocation Policy
Chair Shuman called for a motion to approve the revised relocation policy. A motion was made
by Mr. Murray, seconded by Mr. Sampson, to approve the revised relocation policy. There

INVESTMENT ADVISORY COUNCIL 3 Wednesday, August 11, 2021
being no further discussion, Chair Shuman called for a vote and the motion passed. Other Business
Chair Shuman invited the council members to submit agenda items for the next meeting being held on September 8, 2021.
Comments by the Chair
There being no further business, Chair Shuman called for a motion to adjourn the meeting. Treasurer Wooden moved to adjourn the meeting and the motion was seconded by Mr.
Fiore. There being no discussion, the meeting was adjourned at 11:13 a.m.

INVESTMENT ADVISORY COUNCIL – Audit Subcommittee Meeting Wednesday, August 11, 2021
SUCH MINUTES ARE IN DRAFT FORM AND SUBJECT TO THE FINAL REVIEW
AND APPROVAL OF THE INVESTMENT ADVISORY COUNCIL
MEETING NO. 496
Members present: Michael Knight, Audit Subcommittee Chair D. Ellen Shuman Thomas Fiore, representing Secretary Melissa McCaw
Members absent: Michael LeClair Steven Muench Others present: Katrina Farquhar, Executive Assistant
Darrell Hill, Deputy Treasurer Peter Gajowiak, Senior Investment Officer Guests: Lisa Daly, State Auditor
David Tarallo, State Auditor Public Line
With a quorum present, Chair Michael Knight called the Investment Advisory Council (“IAC”)
Audit Subcommittee meeting to order at 11:301 a.m. Opening Comments by the Chair
Chair Knight welcomed the IAC audit subcommittee members to the meeting.
Executive Session
Chair Knight asked for a motion to move into Executive Session. A motion was made by Thomas
Fiore, seconded by D. Ellen Shuman that the Investment Advisory Council Audit
Subcommittee enter into Executive Session to discuss the audit process at 11:31 a.m. The
motion passed unanimously. Lisa Daly, State Auditor; David Tarallo, State Auditor; Darrell
Hill, Deputy Treasurer; and Peter Gajowiak, Senior Investment Officer were invited to attend the Executive Session.
Chair Knight reconvened the regular session at 12:29 p.m. Chair Knight noted that no
substantive votes or actions were taken during the Executive Session.
Meeting Adjourned
There being no further business, Chair Knight called for a motion to adjourn the meeting. Mr.
Fiore moved to adjourn the meeting and the motion was seconded by Ms. Shuman. There
being no discussion, the meeting was adjourned at 12:29 p.m.

Funds Percent Policy Lower Upper Market Three Fiscal Calendar One Three Five Seven TenBenchmark Holdings Weights Range Range Value (mil.) Month Months YTD YTD Year Year Year Year Year
C5TG9Teacher’s Retirement Fund $21,942.3 1.29 5.94 24.28 8.12 24.28 10.24 10.40 7.79 8.03C5TGX Policy Benchmark 1.19 4.55 24.36 7.64 24.36 10.61 10.54 7.90 8.28C5TGX Dynamic Benchmark 1.13 4.83 23.99 7.73 23.99 10.61 10.56 7.85 N/A
C5TF9 Domestic Equity 22.4% 20.0 15.0 25.0 $4,913.9 2.22 8.14 43.70 15.12 43.70 18.46 17.87 13.88 14.57IX1F00 Russell 3000 2.47 8.24 44.16 15.11 44.16 18.73 17.89 13.95 14.70
C5TF9 Developed Markets ISF 13.2% 11.0 6.0 16.0 $2,903.7 -1.13 5.40 35.03 9.69 35.03 8.86 11.39 6.99 7.75C5TGX MSCI EAFE IMI Net -1.21 5.04 33.57 8.86 33.57 9.34 11.61 7.24 7.85
C5TF9 Emerging Markets ISF 12.6% 9.0 4.0 14.0 $2,766.3 0.31 5.08 46.08 7.36 46.08 14.58 14.13 7.63 5.18C5TGX MSCI Emerging Markets IMI 0.42 5.73 43.21 8.75 43.21 11.38 12.86 6.34 4.31
Global Equities (4) 48.2% 40.0 25.0 55.0 $10,583.8 0.82 6.61 41.70 11.60 41.70 14.65 15.07 10.41 N/AMSCI All Country World Net Index 1.32 7.39 39.26 12.30 39.26 14.57 14.61 9.75 N/A
C5TF9 Core Fixed Income 12.4% 13.0 8.0 18.0 $2,729.9 0.84 2.09 0.52 -1.27 0.52 5.24 3.32 3.13 3.35IX1F00 Barclays U.S. Aggregate Bond Index 0.70 1.83 -0.33 -1.60 -0.33 5.34 3.03 3.28 3.39
C5TF9 Emerging Market Debt 5.2% 5.0 0.0 10.0 $1,140.7 -0.10 4.36 10.11 -1.41 10.11 4.79 4.28 2.74 3.26IX1G0 50% JPM EMBI Global Div / 50% JPM GBI EM Global Div -0.24 3.81 7.07 -2.02 7.07 5.46 4.11 2.59 3.91
C5TF9 High Yield 6.2% 3.0 0.0 8.0 $1,351.6 1.44 2.80 17.22 4.27 17.22 7.12 7.26 4.89 6.12C5TGX Bloomberg Barclays U.S. High Yield 2% Issuer Cap Index 1.34 2.74 15.34 3.61 15.34 6.97 7.13 5.04 6.32
C5TF9 Liquidity Fund 2.0% 2.0 0.0 3.0 $444.2 0.00 0.01 0.13 0.03 0.13 1.40 1.35 0.90 0.74
C5TGX50% U.S. 3-Month T-Bill / 50% Bloomberg Barclays US Government Treasury 1 to 3 Year Index
-0.08 -0.02 0.06 -0.04 0.06 1.62 1.42 1.08 0.82
C5TF9 Real Assets(1) 11.8% 19.0 10.0 25.0 $2,598.3 N/A 4.47 6.48 4.46 6.48 4.97 6.18 7.87 8.32
C5TGX Blended Custom Benchmark 1Q in Arrears^ (2) N/A 2.59 4.23 2.77 4.23 5.20 5.99 7.75 8.92
C5TF9 Private Investment(1) 8.8% 10.0 5.0 15.0 $1,926.5 N/A 17.12 46.05 23.60 46.05 20.59 17.58 15.79 14.14C5TGX Russell 3000 + 250 basis points 1Q in Arrears^ N/A 7.08 65.03 23.17 65.03 19.69 18.25 14.52 15.13
C5TF9 Private Credit(1) 0.9% 5.0 0.0 10.0 $189.9 N/A 5.03 16.93 7.74 16.93 N/A N/A N/A N/AC5TGX S&P / LSTA Leveraged Loan Index + 150 basis points N/A 2.00 22.21 6.23 22.21 N/A N/A N/A N/A
1Q in Arrears^C5TF9 Alternative Investment Fund 4.5% 3.0 0.0 10.0 $977.4 0.02 1.90 9.57 2.95 9.57 3.02 4.43 2.91 3.16C5TGX Absolute Return Strategy blended benchmark (3) -0.01 0.60 2.63 1.06 2.63 4.42 3.01 2.17 1.54
(1) Actual performance, reported one quarter in arrears.(2) A blended benchmark comprised of the weightings of Real Estate, Infrastructure / Natural Resources and U.S. TIPS as of April 2020.(3) A blended benchmark comprised of the weightings of each of the investments utilized within the fund of funds vehicle multiplied by their respective benchmarks as of April 2020.(4) Unofficial Benchmark, for comparison purposes only
TEACHER'S RETIREMENT FUNDNet of All Fees and ExpensesPeriods Ending June 30, 2021
Compound, annualized returns

Funds Percent Policy Lower Upper Market Three Fiscal Calendar One Three Five Seven TenBenchmark Holdings Weights Range Range Value (mil.) Month Months YTD YTD Year Year Year Year Year
C5TG9State Employees’ Retirement Fund $16,156.0 1.29 5.95 24.36 8.13 24.36 10.28 10.47 7.84 8.08C5TGX Policy Benchmark 1.19 4.55 24.36 7.64 24.36 10.60 10.54 7.91 8.29C5TGX Dynamic Benchmark 1.13 4.84 24.08 7.73 24.08 10.66 10.66 7.95 N/A
C5TF9 Domestic Equity 22.3% 20.0 15.0 25.0 $3,603.7 2.22 8.14 43.70 15.12 43.70 18.47 17.87 13.88 14.57IX1F00 Russell 3000 2.47 8.24 44.16 15.11 44.16 18.73 17.89 13.95 14.70
C5TF9 Developed Markets ISF 13.2% 11.0 6.0 16.0 $2,128.9 -1.13 5.40 35.03 9.69 35.03 8.86 11.39 6.99 7.75C5TGX MSCI EAFE IMI Net -1.21 5.04 33.57 8.86 33.57 9.34 11.61 7.24 7.85
C5TF9 Emerging Markets ISF 12.6% 9.0 4.0 14.0 $2,029.3 0.31 5.08 46.08 7.36 46.08 14.58 14.13 7.63 5.18C5TGX MSCI Emerging Markets IMI 0.42 5.73 43.21 8.75 43.21 11.38 12.86 6.34 4.31
Global Equities (4) 48.0% 40.0 25.0 55.0 $7,761.9 0.82 6.61 41.70 11.60 41.70 14.65 15.07 10.41 N/AMSCI All Country World Net Index 1.32 7.39 39.26 12.30 39.26 14.57 14.61 9.75 N/A
C5TF9 Core Fixed Income 12.4% 13.0 8.0 18.0 $2,009.8 0.84 2.09 0.52 -1.27 0.52 5.24 3.32 3.13 3.35IX1F00 Barclays U.S. Aggregate Bond Index 0.70 1.83 -0.33 -1.60 -0.33 5.34 3.03 3.28 3.39
C5TF9 Emerging Market Debt 5.2% 5.0 0.0 10.0 $837.0 -0.10 4.36 10.11 -1.41 10.11 4.79 4.28 2.74 3.26IX1G0 50% JPM EMBI Global Div / 50% JPM GBI EM Global Div -0.24 3.81 7.07 -2.02 7.07 5.46 4.11 2.59 3.91
C5TF9 High Yield 6.2% 3.0 0.0 8.0 $993.8 1.44 2.80 17.22 4.27 17.22 7.12 7.26 4.89 6.12C5TGX Bloomberg Barclays U.S. High Yield 2% Issuer Cap Index 1.34 2.74 15.34 3.61 15.34 6.97 7.13 5.04 6.32
C5TF9 Liquidity Fund 2.3% 2.0 0.0 3.0 $376.7 0.00 0.01 0.13 0.03 0.13 1.40 1.35 0.91 0.74
C5TGX50% U.S. 3-Month T-Bill / 50% Bloomberg Barclays US Government Treasury 1 to 3 Year Index
-0.08 -0.02 0.06 -0.04 0.06 1.62 1.42 1.08 0.82
C5TF9 Real Assets(1) 11.8% 19.0 10.0 25.0 $1,901.6 N/A 4.47 6.48 4.46 6.48 4.97 6.18 7.87 8.32
C5TGX Blended Custom Benchmark 1Q in Arrears^ (2) N/A 2.59 4.23 2.77 4.23 5.20 5.99 7.75 8.92
C5TF9 Private Investment(1) 8.8% 10.0 5.0 15.0 $1,418.5 N/A 17.12 46.05 23.60 46.05 20.59 17.58 15.79 14.15C5TGX Russell 3000 + 250 basis points 1Q in Arrears^ N/A 7.08 65.03 23.17 65.03 19.69 18.25 14.52 15.13
C5TF9 Private Credit(1) 0.9% 5.0 0.0 10.0 $138.1 N/A 5.03 16.93 7.74 16.93 N/A N/A N/A N/AC5TGX S&P / LSTA Leveraged Loan Index + 150 basis points N/A 2.00 22.21 6.23 22.21 N/A N/A N/A N/A
1Q in Arrears^C5TF9 Alternative Investment Fund 4.4% 3.0 0.0 8.0 $718.7 0.02 1.90 9.57 2.95 9.57 3.02 4.43 2.91 3.16C5TGX Absolute Return Strategy blended benchmark (3) -0.01 0.60 2.63 1.06 2.63 4.42 3.01 2.17 1.54
(1) Actual performance, reported one quarter in arrears.(2) A blended benchmark comprised of the weightings of Real Estate, Infrastructure / Natural Resources and U.S. TIPS as of April 2020.(3) A blended benchmark comprised of the weightings of each of the investments utilized within the fund of funds vehicle multiplied by their respective benchmarks as of April 2020.(4) Unofficial Benchmark, for comparison purposes only
STATE EMPLOYEES' RETIREMENT FUNDNet of All Fees and ExpensesPeriods Ending June 30, 2021
Compound, annualized returns

Funds Percent Policy Lower Upper Market Three Fiscal Calendar One Three Five Seven TenBenchmark Holdings Weights Range Range Value (mil.) Month Months YTD YTD Year Year Year Year Year
C5TG9Municipal Employees’ Retirement Fund $3,290.1 1.29 5.97 24.39 8.16 24.39 10.47 10.10 7.68 7.70C5TGX Policy Benchmark 1.19 4.55 24.36 7.64 24.36 10.67 10.11 7.59 7.97C5TGX Dynamic Benchmark 1.14 4.86 24.11 7.75 24.11 10.84 10.21 7.69 N/A
C5TF9 Domestic Equity 22.3% 20.0 15.0 25.0 $732.8 2.22 8.14 43.70 15.12 43.70 18.47 17.87 13.88 14.57IX1F00 Russell 3000 2.47 8.24 44.16 15.11 44.16 18.73 17.89 13.95 14.70
C5TF9 Developed Markets ISF 13.2% 11.0 6.0 16.0 $432.9 -1.13 5.40 35.03 9.69 35.03 8.86 11.40 6.99 7.75C5TGX MSCI EAFE IMI Net -1.21 5.04 33.57 8.86 33.57 9.34 11.61 7.24 7.85
C5TF9 Emerging Markets ISF 12.5% 9.0 4.0 14.0 $411.0 0.31 5.08 46.08 7.36 46.08 14.58 14.13 7.63 5.18C5TGX MSCI Emerging Markets IMI 0.42 5.73 43.21 8.75 43.21 11.38 12.86 6.34 4.31
Global Equities (4) 47.9% 40.0 25.0 55.0 $1,576.7 0.82 6.61 41.70 11.60 41.70 14.65 15.07 10.41 N/AMSCI All Country World Net Index 1.32 7.39 39.26 12.30 39.26 14.57 14.61 9.75 N/A
C5TF9 Core Fixed Income 12.4% 13.0 8.0 18.0 $409.3 0.84 2.09 0.52 -1.27 0.52 5.24 3.32 3.13 3.35IX1F00 Barclays U.S. Aggregate Bond Index 0.70 1.83 -0.33 -1.60 -0.33 5.34 3.03 3.28 3.39
C5TF9 Emerging Market Debt 5.1% 5.0 0.0 10.0 $168.9 -0.10 4.36 10.11 -1.41 10.11 4.79 4.28 2.74 3.26IX1G0 50% JPM EMBI Global Div / 50% JPM GBI EM Global Div -0.24 3.81 7.07 -2.02 7.07 5.46 4.11 2.59 3.91
C5TF9 High Yield 6.1% 3.0 0.0 8.0 $200.8 1.44 2.80 17.22 4.27 17.22 7.12 7.26 4.89 6.12C5TGX Bloomberg Barclays U.S. High Yield 2% Issuer Cap Index 1.34 2.74 15.34 3.61 15.34 6.97 7.13 5.04 6.32
C5TF9 Liquidity Fund 2.6% 2.0 0.0 3.0 $86.3 0.00 0.01 0.13 0.03 0.13 1.40 1.35 0.90 0.74
C5TGX50% U.S. 3-Month T-Bill / 50% Bloomberg Barclays US Government Treasury 1 to 3 Year Index
-0.08 -0.02 0.06 -0.04 0.06 1.62 1.42 1.08 0.82
C5TF9 Real Assets(1) 11.8% 19.0 15.0 25.0 $387.5 N/A 4.47 6.48 4.46 6.48 4.97 6.18 7.87 8.32
C5TGX Blended Custom Benchmark 1Q in Arrears^ (2) N/A 2.59 4.23 2.77 4.23 5.20 5.99 7.75 8.92
C5TF9 Private Investment(1) 8.8% 10.0 5.0 15.0 $288.0 N/A 17.12 46.05 23.60 46.05 20.59 17.58 15.79 14.15C5TGX Russell 3000 + 250 basis points 1Q in Arrears^ N/A 7.08 65.03 23.17 65.03 19.69 18.25 14.52 15.13
C5TF9 Private Credit(1) 0.9% 5.0 0.0 10.0 $28.6 N/A 5.03 16.93 7.74 16.93 N/A N/A N/A N/AC5TGX S&P / LSTA Leveraged Loan Index + 150 basis points N/A 2.00 22.21 6.23 22.21 N/A N/A N/A N/A
1Q in Arrears^C5TF9 Alternative Investment Fund 4.4% 3.0 0.0 10.0 $143.9 0.02 1.90 9.57 2.95 9.57 3.02 4.43 2.91 3.16C5TGX Absolute Return Strategy blended benchmark (3) -0.01 0.60 2.63 1.06 2.63 4.42 3.01 2.17 1.54
(1) Actual performance, reported one quarter in arrears.(2) A blended benchmark comprised of the weightings of Real Estate, Infrastructure / Natural Resources and U.S. TIPS as of April 2020.(3) A blended benchmark comprised of the weightings of each of the investments utilized within the fund of funds vehicle multiplied by their respective benchmarks as of April 2020.(4) Unofficial Benchmark, for comparison purposes only
MUNICIPAL EMPLOYEES RETIREMENT FUNDNet of All Fees and ExpensesPeriods Ending June 30, 2021
Compound, annualized returns

Funds Percent Policy Lower Upper Market Three Fiscal Calendar One Three Five Seven TenBenchmark Holdings Weights Range Range Value (mil.) Month Months YTD YTD Year Year Year Year Year
C5TG9OPEB $2,026.4 1.30 6.00 24.61 8.21 24.61 10.71 9.94 7.79 N/AC5TGX Policy Benchmark 1.19 4.55 24.36 7.64 24.36 10.77 9.82 7.74 N/AC5TGX Dynamic Benchmark 1.14 4.87 24.34 7.81 24.34 11.24 10.06 7.92 N/A
C5TF9 Domestic Equity 22.1% 20.0 15.0 25.0 $447.5 2.22 8.14 43.70 15.12 43.70 18.47 17.88 13.88 N/AIX1F00 Russell 3000 2.47 8.24 44.16 15.11 44.16 18.73 17.89 13.95 N/A
C5TF9 Developed Markets ISF 13.1% 11.0 6.0 15.0 $264.7 -1.13 5.40 35.03 9.69 35.03 8.87 11.40 6.98 N/AC5TGX MSCI EAFE IMI Net -1.21 5.04 33.57 8.86 33.57 9.34 11.61 7.24 N/A
C5TF9 Emerging Markets ISF 12.5% 9.0 4.0 14.0 $253.0 0.31 5.08 46.08 7.36 46.08 14.58 14.13 7.63 N/AC5TGX MSCI Emerging Markets IMI 0.42 5.73 43.21 8.75 43.21 11.38 12.86 6.34 N/A
Global Equities (4) 47.6% 40.0 25.0 54.0 $965.2 0.82 6.61 41.70 11.60 41.70 14.65 15.07 10.41 N/AMSCI All Country World Net Index 1.32 7.39 39.26 12.30 39.26 14.57 14.61 9.75 N/A
C5TF9 Core Fixed Income 12.3% 13.0 8.0 18.0 $249.5 0.84 2.09 0.52 -1.27 0.52 5.24 3.32 3.13 N/AIX1F00 Barclays U.S. Aggregate Bond Index 0.70 1.83 -0.33 -1.60 -0.33 5.34 3.03 3.28 N/A
C5TF9 Emerging Market Debt 5.2% 5.0 0.0 10.0 $105.8 -0.10 4.36 10.11 -1.41 10.11 4.79 4.29 2.74 N/AIX1G0 50% JPM EMBI Global Div / 50% JPM GBI EM Global Div -0.24 3.81 7.07 -2.02 7.07 5.46 4.11 2.59 N/A
C5TF9 High Yield 6.2% 3.0 0.0 8.0 $125.5 1.44 2.80 17.22 4.27 17.22 7.12 7.26 4.89 N/AC5TGX Bloomberg Barclays U.S. High Yield 2% Issuer Cap Index 1.34 2.74 15.34 3.61 15.34 6.97 7.13 5.04 N/A
C5TF9 Liquidity Fund 2.9% 2.0 0.0 3.0 $58.5 0.01 0.02 0.13 0.03 0.13 1.41 1.41 0.94 N/A
C5TGX50% U.S. 3-Month T-Bill / 50% Bloomberg Barclays US Government Treasury 1 to 3 Year Index
-0.08 -0.02 0.06 -0.04 0.06 1.62 1.42 1.08 N/A
C5TF9 Real Assets(1) 11.6% 19.0 15.0 25.0 $235.5 N/A 4.47 6.48 4.46 6.48 4.97 6.19 7.88 N/A
C5TGX Blended Custom Benchmark 1Q in Arrears^ (2) N/A 2.59 4.23 2.77 4.23 5.20 5.99 7.75 N/A
C5TF9 Private Investment(1) 8.8% 10.0 5.0 15.0 $177.8 N/A 17.12 46.05 23.60 46.05 20.60 17.59 15.79 N/AC5TGX Russell 3000 + 250 basis points 1Q in Arrears^ N/A 7.08 65.03 23.17 65.03 19.69 18.25 14.52 N/A
C5TF9 Private Credit(1) 1.0% 5.0 0.0 10.0 $20.1 N/A 5.03 16.93 7.74 16.93 N/A N/A N/A N/AC5TGX S&P / LSTA Leveraged Loan Index + 150 basis points N/A 2.00 22.21 6.23 22.21 N/A N/A N/A N/A
1Q in Arrears^C5TF9 Alternative Investment Fund 4.4% 3.0 0.0 10.0 $88.5 0.02 1.90 9.57 2.95 9.57 3.02 4.43 2.91 N/AC5TGX Absolute Return Strategy blended benchmark (3) -0.01 0.60 2.63 1.06 2.63 4.42 3.01 2.17 N/A
(1) Actual performance, reported one quarter in arrears.(2) A blended benchmark comprised of the weightings of Real Estate, Infrastructure / Natural Resources and U.S. TIPS as of April 2020.(3) A blended benchmark comprised of the weightings of each of the investments utilized within the fund of funds vehicle multiplied by their respective benchmarks as of April 2020.(4) Unofficial Benchmark, for comparison purposes only
OPEB FUNDNet of All Fees and ExpensesPeriods Ending June 30, 2021
Compound, annualized returns

Funds Percent Policy Lower Upper Market Three Fiscal Calendar One Three Five Seven TenBenchmark Holdings Weights Range Range Value (mil.) Month Months YTD YTD Year Year Year Year Year
C5TG9Probate Judges Employees’ Retirement Fund $139.3 1.25 5.88 24.30 8.06 24.30 10.36 10.04 7.64 7.72C5TGX Policy Benchmark 1.19 4.55 24.36 7.64 24.36 10.67 10.18 7.64 8.05C5TGX Dynamic Benchmark 1.09 4.78 24.02 7.67 24.02 10.87 10.30 7.75 N/A
C5TF9 Domestic Equity 21.4% 20.0 15.0 25.0 $29.8 2.22 8.14 43.70 15.12 43.70 18.47 17.87 13.88 14.57IX1F00 Russell 3000 2.47 8.24 44.16 15.11 44.16 18.73 17.89 13.95 14.70
C5TF9 Developed Markets ISF 12.7% 11.0 6.0 16.0 $17.7 -1.13 5.40 35.03 9.69 35.03 8.86 11.40 6.99 7.75C5TGX MSCI EAFE IMI -1.21 5.04 33.57 8.86 33.57 9.34 11.61 7.24 7.85
C5TF9 Emerging Markets ISF 12.1% 9.0 4.0 14.0 $16.8 0.31 5.08 46.08 7.36 46.08 14.58 14.12 7.63 5.18C5TGX MSCI Emerging Markets IMI 0.42 5.73 43.21 8.75 43.21 11.38 12.86 6.34 4.31
Global Equities (4) 46.2% 40.0 25.0 55.0 $64.3 0.82 6.61 41.70 11.60 41.70 14.65 15.07 10.41 N/AMSCI All Country World Net Index 1.32 7.39 39.26 12.30 39.26 14.57 14.61 9.75 N/A
C5TF9 Core Fixed Income 11.9% 13.0 8.0 18.0 $16.6 0.84 2.09 0.52 -1.27 0.52 5.24 3.32 3.13 3.35IX1F00 Barclays U.S. Aggregate Bond Index 0.70 1.83 -0.33 -1.60 -0.33 5.34 3.03 3.28 3.39
C5TF9 Emerging Market Debt 5.0% 5.0 0.0 10.0 $6.9 -0.10 4.36 10.11 -1.41 10.11 4.78 4.28 2.74 3.26IX1G0 50% JPM EMBI Global Div / 50% JPM GBI EM Global Div -0.24 3.81 7.07 -2.02 7.07 5.46 4.11 2.59 3.91
C5TF9 High Yield 5.9% 3.0 0.0 8.0 $8.3 1.44 2.80 17.22 4.27 17.22 7.12 7.26 4.89 6.12C5TGX Bloomberg Barclays U.S. High Yield 2% Issuer Cap Index 1.34 2.74 15.34 3.61 15.34 6.97 7.13 5.04 6.32
C5TF9 Liquidity Fund 5.9% 2.0 0.0 3.0 $8.3 0.00 0.01 0.13 0.03 0.13 1.40 1.35 0.90 0.74
C5TGX50% U.S. 3-Month T-Bill / 50% Bloomberg Barclays US Government Treasury 1 to 3 Year Index
-0.08 -0.02 0.06 -0.04 0.06 1.62 1.42 1.08 0.82
C5TF9 Real Assets(1) 11.4% 19.0 15.0 25.0 $15.8 N/A 4.47 6.48 4.46 6.48 4.97 6.18 7.87 8.32
C5TGX Blended Custom Benchmark 1Q in Arrears^ (2) N/A 2.59 4.23 2.77 4.23 5.20 5.99 7.75 8.92
C5TF9 Private Investment(1) 8.5% 10.0 5.0 15.0 $11.9 N/A 17.12 46.05 23.60 46.05 20.59 17.58 15.79 14.15C5TGX Russell 3000 + 250 basis points 1Q in Arrears^ N/A 7.08 65.03 23.17 65.03 19.69 18.25 14.52 15.13
C5TF9 Private Credit(1) 0.8% 5.0 0.0 10.0 $1.1 N/A 5.03 16.93 7.74 16.93 N/A N/A N/A N/AC5TGX S&P / LSTA Leveraged Loan Index + 150 basis points N/A 2.00 22.21 6.23 22.21 N/A N/A N/A N/A
1Q in Arrears^C5TF9 Alternative Investment Fund 4.3% 3.0 0.0 10.0 $6.0 0.02 1.90 9.57 2.95 9.57 3.02 4.43 2.91 3.16C5TGX Absolute Return Strategy blended benchmark (3) -0.01 0.60 2.63 1.06 2.63 4.42 3.01 2.17 1.54
(1) Actual performance, reported one quarter in arrears.(2) A blended benchmark comprised of the weightings of Real Estate, Infrastructure / Natural Resources and U.S. TIPS as of April 2020.(3) A blended benchmark comprised of the weightings of each of the investments utilized within the fund of funds vehicle multiplied by their respective benchmarks as of April 2020.(4) Unofficial Benchmark, for comparison purposes only
PROBATE JUDGES EMPLOYEES' RETIREMENT FUNDNet of All Fees and ExpensesPeriods Ending June 30, 2021
Compound, annualized returns

Funds Percent Policy Lower Upper Market Three Fiscal Calendar One Three Five Seven TenBenchmark Holdings Weights Range Range Value (mil.) Month Months YTD YTD Year Year Year Year Year
C5TG9State Judges Retirement Fund $294.8 1.30 5.97 24.37 8.15 24.37 10.45 10.11 7.68 7.79C5TGX Policy Benchmark 1.19 4.55 24.36 7.64 24.36 10.67 10.11 7.59 7.97C5TGX Dynamic Benchmark 1.14 4.86 24.08 7.75 24.08 10.96 10.30 7.75 N/A
C5TF9 Domestic Equity 22.2% 20.0 15.0 25.0 $65.5 2.22 8.14 43.70 15.12 43.70 18.47 17.87 13.88 14.57IX1F00 Russell 3000 2.47 8.24 44.16 15.11 44.16 18.73 17.89 13.95 14.70
C5TF9 Developed Markets ISF 13.1% 11.0 6.0 16.0 $38.7 -1.13 5.40 35.03 9.69 35.03 8.86 11.40 6.99 7.75C5TGX MSCI EAFE IMI Net -1.21 5.04 33.57 8.86 33.57 9.34 11.61 7.24 7.85
C5TF9 Emerging Markets ISF 12.5% 9.0 4.0 14.0 $36.8 0.31 5.08 46.08 7.36 46.08 14.58 14.13 7.63 5.18C5TGX MSCI Emerging Markets IMI 0.42 5.73 43.21 8.75 43.21 11.38 12.86 6.34 4.31
Global Equities (4) 47.8% 40.0 25.0 55.0 $141.0 0.82 6.61 41.70 11.60 41.70 14.65 15.07 10.41 N/AMSCI All Country World Net Index 1.32 7.39 39.26 12.30 39.26 14.57 14.61 9.75 N/A
C5TF9 Core Fixed Income 12.4% 13.0 8.0 18.0 $36.4 0.84 2.09 0.52 -1.27 0.52 5.24 3.32 3.12 3.35IX1F00 Barclays U.S. Aggregate Bond Index 0.70 1.83 -0.33 -1.60 -0.33 5.34 3.03 3.28 3.39
C5TF9 Emerging Market Debt 5.2% 5.0 0.0 10.0 $15.2 -0.10 4.36 10.11 -1.41 10.11 4.79 4.28 2.74 3.26IX1G0 50% JPM EMBI Global Div / 50% JPM GBI EM Global Div -0.24 3.81 7.07 -2.02 7.07 5.46 4.11 2.59 3.91
C5TF9 High Yield 6.1% 3.0 0.0 8.0 $18.0 1.44 2.80 17.22 4.27 17.22 7.12 7.26 4.89 6.11C5TGX Bloomberg Barclays U.S. High Yield 2% Issuer Cap Index 1.34 2.74 15.34 3.61 15.34 6.97 7.13 5.04 6.32
C5TF9 Liquidity Fund 2.7% 2.0 0.0 3.0 $8.0 0.00 0.01 0.13 0.03 0.13 1.40 1.35 0.90 0.73
C5TGX50% U.S. 3-Month T-Bill / 50% Bloomberg Barclays US Government Treasury 1 to 3 Year Index
-0.08 -0.02 0.06 -0.04 0.06 1.62 1.42 1.08 0.82
C5TF9 Real Assets(1) 11.7% 19.0 15.0 25.0 $34.5 N/A 4.47 6.48 4.46 6.48 4.97 6.18 7.87 8.32
C5TGX Blended Custom Benchmark 1Q in Arrears^ (2) N/A 2.59 4.23 2.77 4.23 5.20 5.99 7.75 8.92
C5TF9 Private Investment(1) 8.8% 10.0 5.0 15.0 $26.0 N/A 17.12 46.05 23.60 46.05 20.59 17.58 15.79 14.15C5TGX Russell 3000 + 250 basis points 1Q in Arrears^ N/A 7.08 65.03 23.17 65.03 19.69 18.25 14.52 15.13
C5TF9 Private Credit(1) 0.9% 5.0 0.0 10.0 $2.6 N/A 5.03 16.93 7.74 16.93 N/A N/A N/A N/AC5TGX S&P / LSTA Leveraged Loan Index + 150 basis points N/A 2.00 22.21 6.23 22.21 N/A N/A N/A N/A
1Q in Arrears^C5TF9 Alternative Investment Fund 4.4% 3.0 0.0 10.0 $13.0 0.02 1.90 9.57 2.95 9.57 3.02 4.43 2.91 3.16C5TGX Absolute Return Strategy blended benchmark (3) -0.01 0.60 2.63 1.06 2.63 4.42 3.01 2.17 1.54
(1) Actual performance, reported one quarter in arrears.(2) A blended benchmark comprised of the weightings of Real Estate, Infrastructure / Natural Resources and U.S. TIPS as of April 2020.(3) A blended benchmark comprised of the weightings of each of the investments utilized within the fund of funds vehicle multiplied by their respective benchmarks as of April 2020.(4) Unofficial Benchmark, for comparison purposes only
STATE JUDGES RETIREMENT FUNDNet of All Fees and ExpensesPeriods Ending June 30, 2021
Compound, annualized returns

Funds Percent Policy Lower Upper Market Three Fiscal Calendar One Three Five Seven TenBenchmark Holdings Weights Range Range Value (mil.) Month Months YTD YTD Year Year Year Year Year
C5TG9State’s Attorneys’ Retirement Fund $2.7 1.29 5.94 24.29 8.12 24.29 10.06 10.15 7.35 7.49C5TGX Policy Benchmark 1.19 4.55 24.36 7.64 24.36 11.03 10.59 7.80 N/AC5TGX Dynamic Benchmark 1.13 4.83 24.01 7.73 24.01 10.99 10.57 7.78 N/A
C5TF9 Domestic Equity 22.1% 20.0 15.0 25.0 $0.6 2.22 8.14 43.70 15.12 43.70 18.47 17.88 13.89 14.57IX1F00 Russell 3000 2.47 8.24 44.16 15.11 44.16 18.73 17.89 13.95 14.70
C5TF9 Developed Markets ISF 13.1% 11.0 6.0 16.0 $0.4 -1.13 5.40 35.03 9.69 35.03 8.86 11.40 6.99 N/AC5TGX MSCI EAFE IMI Net -1.21 5.04 33.57 8.86 33.57 9.34 11.61 7.24 N/A
C5TF9 Emerging Markets ISF 12.5% 9.0 4.0 14.0 $0.3 0.31 5.08 46.08 7.36 46.08 14.58 14.12 7.63 N/AC5TGX MSCI Emerging Markets IMI 0.42 5.73 43.21 8.75 43.21 11.38 12.86 6.34 N/A
Global Equities (4) 47.8% 40.0 25.0 55.0 $1.3 0.82 6.61 41.70 11.60 41.70 14.65 15.07 10.41 N/AMSCI All Country World Net Index 1.32 7.39 39.26 12.30 39.26 14.57 14.61 9.75 N/A
C5TF9 Core Fixed Income 12.3% 13.0 8.0 18.0 $0.3 0.84 2.09 0.52 -1.27 0.52 5.24 3.32 3.12 3.39IX1F00 Barclays U.S. Aggregate Bond Index 0.70 1.83 -0.33 -1.60 -0.33 5.34 3.03 3.28 3.39
C5TF9 Emerging Market Debt 5.1% 5.0 0.0 10.0 $0.1 -0.10 4.36 10.11 -1.41 10.11 4.78 4.28 2.74 3.26IX1G0 50% JPM EMBI Global Div / 50% JPM GBI EM Global Div -0.24 3.81 7.07 -2.02 7.07 5.46 4.11 2.59 3.91
C5TF9 High Yield 6.1% 3.0 0.0 8.0 $0.2 1.44 2.80 17.22 4.27 17.22 7.12 7.26 4.89 6.10C5TGX Bloomberg Barclays U.S. High Yield 2% Issuer Cap Index 1.34 2.74 15.34 3.61 15.34 6.97 7.13 5.04 6.32
C5TF9 Liquidity Fund 3.0% 2.0 0.0 3.0 $0.1 0.00 0.01 0.13 0.03 0.13 1.40 1.36 0.91 0.74
C5TGX50% U.S. 3-Month T-Bill / 50% Bloomberg Barclays US Government Treasury 1 to 3 Year Index
-0.08 -0.02 0.06 -0.04 0.06 1.62 1.42 1.08 0.82
C5TF9 Real Assets(1) 11.7% 19.0 15.0 25.0 $0.3 N/A 4.47 6.48 4.46 6.48 N/A N/A N/A N/A
C5TGX Blended Custom Benchmark 1Q in Arrears^ (2) N/A 2.59 4.23 2.77 4.23 N/A N/A N/A N/A
C5TF9 Private Investment(1) 8.7% 10.0 5.0 15.0 $0.2 N/A 17.12 46.05 23.60 46.05 N/A N/A N/A N/AC5TGX Russell 3000 + 250 basis points 1Q in Arrears^ N/A 7.08 65.03 23.17 65.03 N/A N/A N/A N/A
C5TF9 Private Credit(1) 0.9% 5.0 0.0 10.0 $0.0 N/A 5.03 16.93 7.74 16.93 N/A N/A N/A N/AC5TGX S&P / LSTA Leveraged Loan Index + 150 basis points N/A 2.00 22.21 6.23 22.21 N/A N/A N/A N/A
1Q in Arrears^C5TF9 Alternative Investment Fund 4.4% 3.0 0.0 10.0 $0.1 0.02 1.90 9.57 2.95 9.57 N/A N/A N/A N/AC5TGX Absolute Return Strategy blended benchmark (3) -0.01 0.60 2.63 1.06 2.63 N/A N/A N/A N/A
(1) Actual performance, reported one quarter in arrears.(2) A blended benchmark comprised of the weightings of Real Estate, Infrastructure / Natural Resources and U.S. TIPS as of April 2020.(3) A blended benchmark comprised of the weightings of each of the investments utilized within the fund of funds vehicle multiplied by their respective benchmarks as of April 2020.(4) Unofficial Benchmark, for comparison purposes only
STATE'S ATTORNEYS' RETIREMENT FUNDNet of All Fees and ExpensesPeriods Ending June 30, 2021
Compound, annualized returns

Funds Percent Policy Lower Upper Market Three Fiscal Calendar One Three Five Seven TenBenchmark Holdings Weights Range Range Value (mil.) Month Months YTD YTD Year Year Year Year Year
C5TG9Agricultural College Fund 100.0% $0.7 0.84 2.09 0.55 -1.27 0.55 5.29 3.35 3.16 3.35C5TGX Policy Benchmark 0.70 1.83 -0.33 -1.60 -0.33 5.34 3.03 3.28 3.35C5TGX Dynamic Benchmark 0.70 1.83 -0.33 -1.60 -0.33 5.34 3.03 3.28 N/A
C5TF9 Core Fixed Income 102.6% 100.0 100.0 100.0 $0.7 0.84 2.09 0.52 -1.27 0.52 5.24 3.32 3.13 3.35IX1F00 Barclays U.S. Aggregate Bond Index 0.70 1.83 -0.33 -1.60 -0.33 5.34 3.03 3.28 3.39
C5TF9 Liquidity Fund (1) -2.6% ($0.0) 0.00 0.00 0.06 0.00 0.06 1.29 1.07 0.68 0.59
C5TGX50% U.S. 3-Month T-Bill / 50% Bloomberg Barclays US Government Treasury 1 to 3 Year Index
-0.08 -0.02 0.06 -0.04 0.06 1.62 1.42 1.08 0.82
(1) Operational cash balance and expense accruals
AGRICULTURAL COLLEGE FUNDNet of All Fees and ExpensesPeriods Ending June 30, 2021
Compound, annualized returns

Funds Percent Policy Lower Upper Market Three Fiscal Calendar One Three Five Seven TenBenchmark Holdings Weights Range Range Value (mil.) Month Months YTD YTD Year Year Year Year Year
C5TG9Andrew C. Clark Fund $1.4 0.79 3.56 12.12 2.86 12.12 8.34 7.02 5.54 6.00C5TGX Policy Benchmark 0.72 3.24 10.73 2.38 10.73 8.24 6.69 5.57 5.98C5TGX Dynamic Benchmark 0.74 3.39 11.31 2.60 11.31 8.40 6.80 5.65 N/A
C5TF9 Domestic Equity 16.5% 15.0 10.0 20.0 $0.2 2.22 8.14 43.70 15.12 43.70 18.48 17.88 13.89 14.56IX1F00 Russell 3000 2.47 8.24 44.16 15.11 44.16 18.73 17.89 13.95 14.70
C5TF9 Developed Markets ISF 12.3% 11.0 6.0 16.0 $0.2 -1.13 5.40 35.03 9.69 35.03 8.87 11.40 6.99 N/AC5TGX MSCI EAFE IMI Net -1.21 5.04 33.57 8.86 33.57 9.34 11.61 7.24 N/A
C5TF9 Emerging Markets ISF 4.4% 4.0 0.0 5.0 $0.1 0.31 5.08 46.08 7.36 46.08 14.58 14.12 7.63 N/AC5TGX MSCI Emerging Markets IMI 0.42 5.73 43.21 8.75 43.21 11.38 12.86 6.34 N/A
Global Equities (1) 33.2% 30.0 16.0 41.0 $0.5 0.82 6.61 41.70 11.60 41.70 14.65 15.07 10.41 N/AMSCI All Country World Net Index 1.32 7.39 39.26 12.30 39.26 14.57 14.61 9.75 N/A
C5TF9 Core Fixed Income 66.2% 67.0 57.0 77.0 $0.9 0.84 2.09 0.52 -1.27 0.52 5.24 3.32 3.13 3.35IX1F00 Barclays U.S. Aggregate Bond Index 0.70 1.83 -0.33 -1.60 -0.33 5.34 3.03 3.28 3.39
C5TF9 Liquidity Fund 0.6% 3.0 0.0 4.0 $0.0 0.00 0.01 0.82 0.03 0.82 3.69 3.18 2.13 1.66
C5TGX50% U.S. 3-Month T-Bill / 50% Bloomberg Barclays US Government Treasury 1 to 3 Year Index
-0.08 -0.02 0.06 -0.04 0.06 1.62 1.42 1.08 0.82
(1) Unofficial Benchmark, for comparison purposes only
ANDREW C. CLARK FUNDNet of All Fees and ExpensesPeriods Ending June 30, 2021
Compound, annualized returns

Funds Percent Policy Lower Upper Market Three Fiscal Calendar One Three Five Seven TenBenchmark Holdings Weights Range Range Value (mil.) Month Months YTD YTD Year Year Year Year Year
C5TG9Soldiers’ Sailors’ & Marines Fund $91.0 0.79 3.54 12.15 2.86 12.15 8.34 7.02 5.54 6.03C5TGX Policy Benchmark 0.72 3.24 10.73 2.38 10.73 8.24 6.69 5.57 6.01C5TGX Dynamic Benchmark 0.73 3.37 11.35 2.60 11.35 8.41 6.82 5.66 N/A
C5TF9 Domestic Equity 15.9% 15.0 10.0 20.0 $14.4 2.22 8.14 43.70 15.12 43.70 18.48 17.88 13.89 14.58IX1F00 Russell 3000 2.47 8.24 44.16 15.11 44.16 18.73 17.89 13.95 14.70
C5TF9 Developed Markets ISF 12.1% 11.0 6.0 16.0 $11.0 -1.13 5.40 35.03 9.69 35.03 8.87 11.40 6.99 N/AC5TGX MSCI EAFE IMI Net -1.21 5.04 33.57 8.86 33.57 9.34 11.61 7.24 N/A
C5TF9 Emerging Markets ISF 4.4% 4.0 0.0 5.0 $4.0 0.31 5.08 46.08 7.36 46.08 14.58 14.13 7.63 N/AC5TGX MSCI Emerging Markets IMI 0.42 5.73 43.21 8.75 43.21 11.38 12.86 6.34 N/A
Global Equities (1) 32.3% 30.0 16.0 41.0 $29.4 0.82 6.61 41.70 11.60 41.70 14.65 15.07 10.41 N/AMSCI All Country World Net Index 1.32 7.39 39.26 12.30 39.26 14.57 14.61 9.75 N/A
C5TF9 Core Fixed Income 64.7% 67.0 57.0 77.0 $58.9 0.84 2.09 0.52 -1.27 0.52 5.24 3.32 3.13 3.35IX1F00 Barclays U.S. Aggregate Bond Index 0.70 1.83 -0.33 -1.60 -0.33 5.34 3.03 3.28 3.39
C5TF9 Liquidity Fund 3.0% 3.0 0.0 4.0 $2.7 0.00 0.01 0.13 0.03 0.13 1.40 1.35 0.90 0.76
C5TGX50% U.S. 3-Month T-Bill / 50% Bloomberg Barclays US Government Treasury 1 to 3 Year Index
-0.08 -0.02 0.06 -0.04 0.06 1.62 1.42 1.08 0.82
(1) Unofficial Benchmark, for comparison purposes only
SOLDIERS' SAILORS' & MARINES' FUNDNet of All Fees and ExpensesPeriods Ending June 30, 2021
Compound, annualized returns

Funds Percent Policy Lower Upper Market Three Fiscal Calendar One Three Five Seven TenBenchmark Holdings Weights Range Range Value (mil.) Month Months YTD YTD Year Year Year Year Year
C5TG9School Fund $13.7 0.80 3.57 12.22 2.83 12.22 8.35 7.04 5.56 5.98C5TGX Policy Benchmark 0.72 3.24 10.73 2.38 10.73 8.24 6.69 5.57 5.98C5TGX Dynamic Benchmark 0.75 3.39 11.42 2.56 11.42 8.41 6.82 5.67 N/A
C5TF9 Domestic Equity 15.9% 15.0 10.0 20.0 $2.2 2.22 8.14 43.70 15.12 43.70 18.48 17.88 13.89 14.57IX1F00 Russell 3000 2.47 8.24 44.16 15.11 44.16 18.73 17.89 13.95 14.70
C5TF9 Developed Markets ISF 11.9% 11.0 6.0 16.0 $1.6 -1.13 5.40 35.03 9.69 35.03 8.87 11.40 6.99 N/AC5TGX MSCI EAFE IMI Net -1.21 5.04 33.57 8.86 33.57 9.34 11.61 7.24 N/A
C5TF9 Emerging Markets ISF 4.2% 4.0 0.0 5.0 $0.6 0.31 5.08 46.08 7.36 46.08 14.58 14.13 7.63 N/AC5TGX MSCI Emerging Markets IMI 0.42 5.73 43.21 8.75 43.21 11.38 12.86 6.34 N/A
Global Equities (1) 32.1% 30.0 16.0 41.0 $4.4 0.82 6.61 41.70 11.60 41.70 14.65 15.07 10.41 N/AMSCI All Country World Net Index 1.32 7.39 39.26 12.30 39.26 14.57 14.61 9.75 N/A
C5TF9 Core Fixed Income 66.5% 67.0 57.0 77.0 $9.1 0.84 2.09 0.52 -1.27 0.52 5.24 3.32 3.12 3.35IX1F00 Barclays U.S. Aggregate Bond Index 0.70 1.83 -0.33 -1.60 -0.33 5.34 3.03 3.28 3.39
C5TF9 Liquidity Fund 1.4% 3.0 0.0 4.0 $0.2 0.01 0.03 0.20 0.05 0.20 2.36 2.26 1.48 1.11
C5TGX50% U.S. 3-Month T-Bill / 50% Bloomberg Barclays US Government Treasury 1 to 3 Year Index
-0.08 -0.02 0.06 -0.04 0.06 1.62 1.42 1.08 0.82
(1) Unofficial Benchmark, for comparison purposes only
SCHOOL FUNDNet of All Fees and ExpensesPeriods Ending June 30, 2021
Compound, annualized returns

Funds Percent Policy Lower Upper Market Three Fiscal Calendar One Three Five Seven TenBenchmark Holdings Weights Range Range Value (mil.) Month Months YTD YTD Year Year Year Year Year
C5TG9IDA Eaton Cotton Fund $3.0 0.79 3.53 12.11 2.81 12.11 8.32 7.01 5.53 5.99C5TGX Policy Benchmark 0.72 3.24 10.73 2.38 10.73 8.24 6.69 5.57 5.98C5TGX Dynamic Benchmark 0.74 3.36 11.30 2.55 11.30 8.38 6.79 5.64 N/A
C5TF9 Domestic Equity 16.3% 15.0 10.0 20.0 $0.5 2.22 8.14 43.70 15.12 43.70 18.48 17.88 13.89 14.57IX1F00 Russell 3000 2.47 8.24 44.16 15.11 44.16 18.73 17.89 13.95 14.70
C5TF9 Developed Markets ISF 12.2% 11.0 6.0 16.0 $0.4 -1.13 5.40 35.03 9.69 35.03 8.87 11.40 6.99 N/AC5TGX MSCI EAFE IMI Net -1.21 5.04 33.57 8.86 33.57 9.34 11.61 7.24 N/A
C5TF9 Emerging Markets ISF 4.3% 4.0 0.0 5.0 $0.1 0.31 5.08 46.08 7.36 46.08 14.58 14.13 7.63 N/AC5TGX MSCI Emerging Markets IMI 0.42 5.73 43.21 8.75 43.21 11.38 12.86 6.34 N/A
Global Equities (1) 32.8% 30.0 16.0 41.0 $1.0 0.82 6.61 41.70 11.60 41.70 14.65 15.07 10.41 N/AMSCI All Country World Net Index 1.32 7.39 39.26 12.30 39.26 14.57 14.61 9.75 N/A
C5TF9 Core Fixed Income 66.2% 67.0 57.0 77.0 $2.0 0.84 2.09 0.52 -1.27 0.52 5.24 3.32 3.13 3.35IX1F00 Barclays U.S. Aggregate Bond Index 0.70 1.83 -0.33 -1.60 -0.33 5.34 3.03 3.28 3.39
C5TF9 Liquidity Fund 1.0% 3.0 0.0 4.0 $0.0 0.00 0.01 0.70 0.03 0.70 4.08 3.36 2.25 1.73
C5TGX50% U.S. 3-Month T-Bill / 50% Bloomberg Barclays US Government Treasury 1 to 3 Year Index
-0.08 -0.02 0.06 -0.04 0.06 1.62 1.42 1.08 0.82
(1) Unofficial Benchmark, for comparison purposes only
IDA EATON COTTON FUNDNet of All Fees and ExpensesPeriods Ending June 30, 2021
Compound, annualized returns

Funds Percent Policy Lower Upper Market Three Fiscal Calendar One Three Five Seven TenBenchmark Holdings Weights Range Range Value (mil.) Month Months YTD YTD Year Year Year Year Year
C5TG9Hopemead Fund $4.9 0.79 3.53 12.10 2.81 12.10 8.28 6.98 5.50 5.89C5TGX Policy Benchmark 0.72 3.24 10.73 2.38 10.73 8.24 6.69 5.57 5.98C5TGX Dynamic Benchmark 0.74 3.36 11.31 2.55 11.31 8.36 6.77 5.62 N/A
C5TF9 Domestic Equity 15.9% 15.0 10.0 20.0 $0.8 2.22 8.14 43.70 15.12 43.70 18.48 17.88 13.89 14.56IX1F00 Russell 3000 2.47 8.24 44.16 15.11 44.16 18.73 17.89 13.95 14.70
C5TF9 Developed Markets ISF 11.8% 11.0 6.0 16.0 $0.6 -1.13 5.40 35.03 9.69 35.03 8.87 11.40 6.99 N/AC5TGX MSCI EAFE IMI Net -1.21 5.04 33.57 8.86 33.57 9.34 11.61 7.24 N/A
C5TF9 Emerging Markets ISF 4.3% 4.0 0.0 5.0 $0.2 0.31 5.08 46.08 7.36 46.08 14.58 14.13 7.63 N/AC5TGX MSCI Emerging Markets IMI 0.42 5.73 43.21 8.75 43.21 11.38 12.86 6.34 N/A
Global Equities (1) 32.1% 30.0 16.0 41.0 $1.6 0.82 6.61 41.70 11.60 41.70 14.65 15.07 10.41 N/AMSCI All Country World Net Index 1.32 7.39 39.26 12.30 39.26 14.57 14.61 9.75 N/A
C5TF9 Core Fixed Income 64.7% 67.0 57.0 77.0 $3.2 0.84 2.09 0.52 -1.27 0.52 5.24 3.32 3.13 3.35IX1F00 Barclays U.S. Aggregate Bond Index 0.70 1.83 -0.33 -1.60 -0.33 5.34 3.03 3.28 3.39
C5TF9 Liquidity Fund 3.3% 3.0 0.0 4.0 $0.2 0.00 0.01 0.13 0.03 0.13 1.40 1.35 0.91 0.75
C5TGX50% U.S. 3-Month T-Bill / 50% Bloomberg Barclays US Government Treasury 1 to 3 Year Index
-0.08 -0.02 0.06 -0.04 0.06 1.62 1.42 1.08 0.82
(1) Unofficial Benchmark, for comparison purposes only
HOPEMEAD FUNDNet of All Fees and ExpensesPeriods Ending June 30, 2021
Compound, annualized returns

Funds Percent Policy Lower Upper Market Three Fiscal Calendar One Three Five Seven TenBenchmark Holdings Weights Range Range Value (mil.) Month Months YTD YTD Year Year Year Year Year
C5TG9Arts Endowment Fund $24.4 0.83 5.30 27.43 7.58 27.43 11.07 9.04 6.96 7.00C5TGX Policy Benchmark 0.75 4.87 26.33 7.15 26.33 10.67 8.57 6.90 7.08C5TGX Dynamic Benchmark 0.77 4.97 26.27 7.32 26.27 11.01 N/A N/A N/A
C5TF9Domestic Equity 28.4% 28.0 23.0 33.0 $6.9 2.22 8.14 43.70 15.12 43.70 18.47 17.88 13.89 N/AIX1F00 Russell 3000 2.47 8.24 44.16 15.11 44.16 18.73 17.89 13.95 N/A
C5TF9Developed Markets ISF 17.4% 17.0 12.0 22.0 $4.3 -1.13 5.40 35.03 9.69 35.03 8.86 11.41 7.00 N/AC5TGX MSCI EAFE IMI Net -1.21 5.04 33.57 8.86 33.57 9.34 11.61 7.24 N/A
C5TF9 Emerging Markets ISF 12.2% 12.0 7.0 17.0 $3.0 0.31 5.08 46.08 7.36 46.08 14.58 14.14 7.64 N/AC5TGX MSCI Emerging Markets IMI 0.42 5.73 43.21 8.75 43.21 11.38 12.86 6.34 N/A
Global Equities (2) 58.0% 57.0 42.0 72.0 $14.2 0.82 6.61 41.70 11.60 41.70 14.65 15.07 10.41 N/AMSCI All Country World Net Index 1.32 7.39 39.26 12.30 39.26 14.57 14.61 9.75 N/A
C5TF9Core Fixed Income 14.7% 16.0 11.0 21.0 $3.6 0.84 2.09 0.52 -1.27 0.52 5.24 3.32 3.12 3.35IX1F00 Barclays U.S. Aggregate Bond Index 0.70 1.83 -0.33 -1.60 -0.33 5.34 3.03 3.28 3.39
C5TF9 Emerging Market Debt 7.3% 8.0 3.0 13.0 $1.8 -0.10 4.36 10.11 -1.41 10.11 N/A N/A N/A N/AIX1G0 50% JPM EMBI Global Div / 50% JPM GBI EM Global Div -0.24 3.81 7.07 -2.02 7.07 N/A N/A N/A N/A
C5TF9 High Yield 8.6% 9.0 4.0 14.0 $2.1 1.44 2.80 17.22 4.27 17.22 N/A N/A N/A N/AC5TGX Bloomberg Barclays U.S. High Yield 2% Issuer Cap Index 1.34 2.74 15.34 3.61 15.34 N/A N/A N/A N/A
C5TF9 Private Credit(1) 8.9% 9.0 4.0 14.0 $2.2 N/A 5.03 16.93 7.74 16.93 N/A N/A N/A N/AC5TGX S&P / LSTA Leveraged Loan Index + 150 basis points N/A 2.00 22.21 6.23 22.21 N/A N/A N/A N/A
1Q in Arrears^C5TF9 Liquidity Fund 2.5% 1.0 0.0 3.0 $0.6 0.00 0.01 0.13 0.03 0.13 1.40 1.32 0.88 0.73
C5TGX50% U.S. 3-Month T-Bill / 50% Bloomberg Barclays US Government Treasury 1 to 3 Year Index
-0.08 -0.02 0.06 -0.04 0.06 1.62 1.42 1.08 0.82
(1) Actual performance, reported one quarter in arrears, (2) Unofficial Benchmark, for comparison purposes only
ARTS ENDOWMENT FUNDNet of All Fees and ExpensesPeriods Ending June 30, 2021
Compound, annualized returns

Funds Percent Policy Lower Upper Market Three Fiscal Calendar One Three Five Seven TenBenchmark Holdings Weights Range Range Value (mil.) Month Months YTD YTD Year Year Year Year Year
C5TG9Policemen and Firemen Survivors’ Benefit Fund $47.1 1.29 5.96 24.28 8.13 24.28 10.30 10.19 7.76 8.27C5TGX Policy Benchmark 1.19 4.55 24.36 7.64 24.36 10.64 10.27 7.70 N/AC5TGX Dynamic Benchmark 1.13 4.85 23.96 7.73 23.96 10.81 10.39 7.80 N/A
C5TF9 Domestic Equity 22.2% 20.0 15.0 25.0 $10.5 2.22 8.14 43.70 15.12 43.70 18.47 17.87 13.88 14.75IX1F00 Russell 3000 2.47 8.24 44.16 15.11 44.16 18.73 17.89 13.95 14.70
C5TF9 Developed Markets ISF 13.2% 11.0 6.0 16.0 $6.2 -1.13 5.40 35.03 9.69 35.03 8.86 11.40 6.99 N/AC5TGX MSCI EAFE IMI Net -1.21 5.04 33.57 8.86 33.57 9.34 11.61 7.24 N/A
C5TF9 Emerging Markets ISF 12.5% 9.0 4.0 14.0 $5.9 0.31 5.08 46.08 7.36 46.08 14.58 14.13 7.63 N/AC5TGX MSCI Emerging Markets IMI 0.42 5.73 43.21 8.75 43.21 11.38 12.86 6.34 N/A
Global Equities (4) 47.9% 40.0 25.0 55.0 $22.6 0.82 6.61 41.70 11.60 41.70 14.65 15.07 10.41 N/AMSCI All Country World Net Index 1.32 7.39 39.26 12.30 39.26 14.57 14.61 9.75 N/A
C5TF9 Core Fixed Income 12.4% 13.0 8.0 18.0 $5.8 0.84 2.09 0.52 -1.27 0.52 5.24 3.32 3.13 3.41IX1F00 Barclays U.S. Aggregate Bond Index 0.70 1.83 -0.33 -1.60 -0.33 5.34 3.03 3.28 3.39
C5TF9 Emerging Market Debt 5.2% 5.0 0.0 10.0 $2.4 -0.10 4.36 10.11 -1.41 10.11 4.78 4.28 2.74 3.26IX1G0 50% JPM EMBI Global Div / 50% JPM GBI EM Global Div -0.24 3.81 7.07 -2.02 7.07 5.46 4.11 2.59 3.91
C5TF9 High Yield 6.1% 3.0 0.0 8.0 $2.9 1.44 2.80 17.22 4.27 17.22 7.12 7.26 4.89 6.09C5TGX Bloomberg Barclays U.S. High Yield 2% Issuer Cap Index 1.34 2.74 15.34 3.61 15.34 6.97 7.13 5.04 6.32
C5TF9 Liquidity Fund 2.6% 2.0 0.0 3.0 $1.2 0.00 0.01 0.13 0.03 0.13 1.40 1.35 0.91 0.74
C5TGX50% U.S. 3-Month T-Bill / 50% Bloomberg Barclays US Government Treasury 1 to 3 Year Index
-0.08 -0.02 0.06 -0.04 0.06 1.62 1.42 1.08 0.82
C5TF9 Real Assets(1) 11.7% 19.0 15.0 25.0 $5.5 N/A 4.47 6.48 4.46 6.48 4.97 6.18 7.87 8.28
C5TGX Blended Custom Benchmark 1Q in Arrears^ (2) N/A 2.59 4.23 2.77 4.23 5.20 5.99 7.75 8.92
C5TF9 Private Investment(1) 8.8% 10.0 5.0 15.0 $4.1 N/A 17.12 46.05 23.60 46.05 20.59 17.58 15.79 N/AC5TGX Russell 3000 + 250 basis points 1Q in Arrears^ N/A 7.08 65.03 23.17 65.03 19.69 18.25 14.52 N/A
C5TF9 Private Credit(1) 0.9% 5.0 0.0 10.0 $0.4 N/A 5.03 16.93 7.74 16.93 N/A N/A N/A N/AC5TGX S&P / LSTA Leveraged Loan Index + 150 basis points N/A 2.00 22.21 6.23 22.21 N/A N/A N/A N/A
1Q in Arrears^C5TF9 Alternative Investment Fund 4.4% 3.0 0.0 10.0 $2.1 0.02 1.90 9.57 2.95 9.57 3.02 4.43 2.91 N/AC5TGX Absolute Return Strategy blended benchmark (3) -0.01 0.60 2.63 1.06 2.63 4.42 3.01 2.17 N/A
(1) Actual performance, reported one quarter in arrears.(2) A blended benchmark comprised of the weightings of Real Estate, Infrastructure / Natural Resources and U.S. TIPS as of April 2020.(3) A blended benchmark comprised of the weightings of each of the investments utilized within the fund of funds vehicle multiplied by their respective benchmarks as of April 2020.(4) Unofficial Benchmark, for comparison purposes only
POLICEMEN AND FIREMEN SURVIVORS' BENEFIT FUNDNet of All Fees and ExpensesPeriods Ending June 30, 2021
Compound, annualized returns

Funds Percent Policy Lower Upper Market Three Fiscal Calendar One Three Five Seven TenBenchmark Holdings Weights Range Range Value (mil.) Month Months YTD YTD Year Year Year Year Year
C5TG9Teacher’s Retirement Fund $22,200.5 0.26 3.36 0.26 8.41 20.22 9.73 9.87 7.94 8.12C5TGX Policy Benchmark 0.79 3.27 0.79 8.50 20.00 10.35 10.09 8.13 8.44C5TGX Dynamic Benchmark 0.50 2.97 0.50 8.26 19.63 10.20 10.03 8.05 N/A
C5TF9 Domestic Equity 22.4% 20.0 15.0 25.0 $4,978.0 1.62 4.45 1.62 16.98 37.75 17.85 17.28 14.44 15.03IX1F00 Russell 3000 1.69 4.67 1.69 17.06 38.73 18.10 17.36 14.55 15.16
C5TF9 Developed Markets ISF 13.2% 11.0 6.0 16.0 $2,926.4 0.82 3.15 0.82 10.59 31.94 8.37 10.47 7.38 8.03C5TGX MSCI EAFE IMI Net 0.90 2.74 0.90 9.84 31.52 8.81 10.70 7.55 8.20
C5TF9 Emerging Markets ISF 11.9% 9.0 4.0 14.0 $2,640.1 -4.50 -1.28 -4.50 2.53 26.26 12.07 12.05 6.71 4.66C5TGX MSCI Emerging Markets IMI -6.09 -3.48 -6.09 2.13 23.42 8.33 10.38 5.12 3.67
Global Equities (4) 47.5% 40.0 25.0 55.0 $10,544.4 -0.20 2.60 -0.20 11.37 33.08 13.59 13.99 10.57 N/AMSCI All Country World Net Index 0.69 3.60 0.69 13.08 33.18 13.70 13.81 10.05 N/A
C5TF9 Core Fixed Income 12.4% 13.0 8.0 18.0 $2,754.8 1.03 2.21 1.03 -0.25 -0.03 5.56 3.36 3.28 3.30IX1F00 Barclays U.S. Aggregate Bond Index 1.12 2.16 1.12 -0.50 -0.70 5.73 3.13 3.48 3.35
C5TF9 Emerging Market Debt 5.1% 5.0 0.0 10.0 $1,136.4 -0.20 1.66 -0.20 -1.61 5.42 3.83 3.91 2.76 3.05IX1G0 50% JPM EMBI Global Div / 50% JPM GBI EM Global Div -0.01 1.53 -0.01 -2.02 3.58 4.69 3.86 2.63 3.71
C5TF9 High Yield 6.1% 3.0 0.0 8.0 $1,352.4 0.21 1.98 0.21 4.49 12.12 6.76 6.82 5.10 6.06C5TGX Bloomberg Barclays U.S. High Yield 2% Issuer Cap Index 0.38 2.02 0.38 4.00 10.62 6.74 6.68 5.30 6.22
C5TF9 Liquidity Fund 3.1% 2.0 0.0 3.0 $695.4 0.00 0.01 0.00 0.04 0.11 1.34 1.33 0.92 0.71
C5TGX50% U.S. 3-Month T-Bill / 50% Bloomberg Barclays US Government Treasury 1 to 3 Year Index
0.09 0.05 0.09 0.05 0.10 1.59 1.43 1.09 0.82
C5TF9 Real Assets(1) 11.8% 19.0 10.0 25.0 $2,628.0 N/A 3.83 1.41 5.93 7.08 5.36 6.49 8.10 8.48
C5TGX Blended Custom Benchmark 1Q in Arrears^ (2) N/A 3.03 1.00 3.81 4.30 5.55 6.20 7.91 9.03
C5TF9 Private Investment(1) 8.9% 10.0 5.0 15.0 $1,976.1 N/A 11.93 0.21 23.87 44.70 20.41 17.63 15.83 14.17C5TGX Russell 3000 + 250 basis points 1Q in Arrears^ N/A 12.87 5.18 29.55 53.42 21.72 18.59 15.57 15.95
C5TF9 Private Credit(1) 1.0% 5.0 0.0 10.0 $220.1 N/A 5.97 3.62 11.65 16.31 N/A N/A N/A N/AC5TGX S&P / LSTA Leveraged Loan Index + 150 basis points N/A 1.38 0.68 6.96 17.60 N/A N/A N/A N/A
1Q in Arrears^C5TF9 Alternative Investment Fund 4.0% 3.0 0.0 10.0 $893.0 0.07 1.63 0.07 3.02 8.34 2.99 4.23 2.76 3.21C5TGX Absolute Return Strategy blended benchmark (3) 0.04 0.31 0.04 1.10 2.27 4.30 3.01 2.18 1.54
(1) Actual performance, reported one quarter in arrears.(2) A blended benchmark comprised of the weightings of Real Estate, Infrastructure / Natural Resources and U.S. TIPS as of April 2020.(3) A blended benchmark comprised of the weightings of each of the investments utilized within the fund of funds vehicle multiplied by their respective benchmarks as of April 2020.(4) Unofficial Benchmark, for comparison purposes only
TEACHER'S RETIREMENT FUNDNet of All Fees and ExpensesPeriods Ending July 31, 2021
Compound, annualized returns

Funds Percent Policy Lower Upper Market Three Fiscal Calendar One Three Five Seven TenBenchmark Holdings Weights Range Range Value (mil.) Month Months YTD YTD Year Year Year Year Year
C5TG9State Employees’ Retirement Fund $16,152.3 0.27 3.36 0.27 8.42 20.26 9.78 9.94 7.99 8.17C5TGX Policy Benchmark 0.79 3.27 0.79 8.50 20.00 10.36 10.08 8.14 8.45C5TGX Dynamic Benchmark 0.51 2.98 0.51 8.27 19.67 10.27 10.13 8.16 N/A
C5TF9 Domestic Equity 22.7% 20.0 15.0 25.0 $3,667.3 1.62 4.45 1.62 16.98 37.75 17.85 17.28 14.44 15.03IX1F00 Russell 3000 1.69 4.67 1.69 17.06 38.73 18.10 17.36 14.55 15.16
C5TF9 Developed Markets ISF 13.3% 11.0 6.0 16.0 $2,145.5 0.82 3.15 0.82 10.59 31.94 8.37 10.47 7.38 8.03C5TGX MSCI EAFE IMI Net 0.90 2.74 0.90 9.84 31.52 8.81 10.70 7.55 8.20
C5TF9 Emerging Markets ISF 12.0% 9.0 4.0 14.0 $1,936.7 -4.50 -1.28 -4.50 2.53 26.26 12.07 12.05 6.71 4.66C5TGX MSCI Emerging Markets IMI -6.09 -3.48 -6.09 2.13 23.42 8.33 10.38 5.12 3.67
Global Equities (4) 48.0% 40.0 25.0 55.0 $7,749.5 -0.20 2.60 -0.20 11.37 33.08 13.59 13.99 10.57 N/AMSCI All Country World Net Index 0.69 3.60 0.69 13.08 33.18 13.70 13.81 10.05 N/A
C5TF9 Core Fixed Income 12.6% 13.0 8.0 18.0 $2,028.1 1.03 2.21 1.03 -0.25 -0.03 5.56 3.35 3.28 3.30IX1F00 Barclays U.S. Aggregate Bond Index 1.12 2.16 1.12 -0.50 -0.70 5.73 3.13 3.48 3.35
C5TF9 Emerging Market Debt 5.2% 5.0 0.0 10.0 $833.9 -0.20 1.66 -0.20 -1.61 5.42 3.83 3.91 2.76 3.05IX1G0 50% JPM EMBI Global Div / 50% JPM GBI EM Global Div -0.01 1.53 -0.01 -2.02 3.58 4.69 3.86 2.63 3.71
C5TF9 High Yield 6.2% 3.0 0.0 8.0 $994.4 0.21 1.98 0.21 4.49 12.12 6.76 6.82 5.10 6.06C5TGX Bloomberg Barclays U.S. High Yield 2% Issuer Cap Index 0.38 2.02 0.38 4.00 10.62 6.74 6.68 5.30 6.22
C5TF9 Liquidity Fund 2.1% 2.0 0.0 3.0 $335.6 0.00 0.01 0.00 0.03 0.10 1.34 1.33 0.92 0.72
C5TGX50% U.S. 3-Month T-Bill / 50% Bloomberg Barclays US Government Treasury 1 to 3 Year Index
0.09 0.05 0.09 0.05 0.10 1.59 1.43 1.09 0.82
C5TF9 Real Assets(1) 12.0% 19.0 10.0 25.0 $1,937.8 N/A 3.83 1.41 5.93 7.08 5.36 6.49 8.10 8.48
C5TGX Blended Custom Benchmark 1Q in Arrears^ (2) N/A 3.03 1.00 3.81 4.30 5.55 6.20 7.91 9.03
C5TF9 Private Investment(1) 9.0% 10.0 5.0 15.0 $1,455.5 N/A 11.93 0.21 23.87 44.70 20.41 17.63 15.83 14.17C5TGX Russell 3000 + 250 basis points 1Q in Arrears^ N/A 12.87 5.18 29.55 53.42 21.72 18.59 15.57 15.95
C5TF9 Private Credit(1) 1.0% 5.0 0.0 10.0 $162.3 N/A 5.97 3.62 11.65 16.31 N/A N/A N/A N/AC5TGX S&P / LSTA Leveraged Loan Index + 150 basis points N/A 1.38 0.68 6.96 17.60 N/A N/A N/A N/A
1Q in Arrears^C5TF9 Alternative Investment Fund 4.1% 3.0 0.0 8.0 $655.4 0.07 1.63 0.07 3.02 8.34 2.99 4.23 2.76 3.21C5TGX Absolute Return Strategy blended benchmark (3) 0.04 0.31 0.04 1.10 2.27 4.30 3.01 2.18 1.54
(1) Actual performance, reported one quarter in arrears.(2) A blended benchmark comprised of the weightings of Real Estate, Infrastructure / Natural Resources and U.S. TIPS as of April 2020.(3) A blended benchmark comprised of the weightings of each of the investments utilized within the fund of funds vehicle multiplied by their respective benchmarks as of April 2020.(4) Unofficial Benchmark, for comparison purposes only
STATE EMPLOYEES' RETIREMENT FUNDNet of All Fees and ExpensesPeriods Ending July 31, 2021
Compound, annualized returns

Funds Percent Policy Lower Upper Market Three Fiscal Calendar One Three Five Seven TenBenchmark Holdings Weights Range Range Value (mil.) Month Months YTD YTD Year Year Year Year Year
C5TG9Municipal Employees’ Retirement Fund $3,294.9 0.27 3.37 0.27 8.45 20.31 10.02 9.64 7.80 7.74C5TGX Policy Benchmark 0.79 3.27 0.79 8.50 20.00 10.46 9.71 7.82 8.07C5TGX Dynamic Benchmark 0.51 2.98 0.51 8.29 19.72 10.50 9.76 7.89 N/A
C5TF9 Domestic Equity 22.6% 20.0 15.0 25.0 $744.2 1.62 4.45 1.62 16.98 37.75 17.85 17.28 14.44 15.02IX1F00 Russell 3000 1.69 4.67 1.69 17.06 38.73 18.10 17.36 14.55 15.16
C5TF9 Developed Markets ISF 13.2% 11.0 6.0 16.0 $436.3 0.82 3.15 0.82 10.59 31.94 8.37 10.47 7.38 8.03C5TGX MSCI EAFE IMI Net 0.90 2.74 0.90 9.84 31.52 8.81 10.70 7.55 8.20
C5TF9 Emerging Markets ISF 11.9% 9.0 4.0 14.0 $392.3 -4.50 -1.28 -4.50 2.53 26.26 12.07 12.05 6.71 4.66C5TGX MSCI Emerging Markets IMI -6.09 -3.48 -6.09 2.13 23.42 8.33 10.38 5.12 3.67
Global Equities (4) 47.7% 40.0 25.0 55.0 $1,572.8 -0.20 2.60 -0.20 11.37 33.08 13.59 13.99 10.57 N/AMSCI All Country World Net Index 0.69 3.60 0.69 13.08 33.18 13.70 13.81 10.05 N/A
C5TF9 Core Fixed Income 12.5% 13.0 8.0 18.0 $413.0 1.03 2.21 1.03 -0.25 -0.03 5.56 3.35 3.28 3.30IX1F00 Barclays U.S. Aggregate Bond Index 1.12 2.16 1.12 -0.50 -0.70 5.73 3.13 3.48 3.35
C5TF9 Emerging Market Debt 5.1% 5.0 0.0 10.0 $168.3 -0.20 1.66 -0.20 -1.61 5.42 3.83 3.91 2.76 3.05IX1G0 50% JPM EMBI Global Div / 50% JPM GBI EM Global Div -0.01 1.53 -0.01 -2.02 3.58 4.69 3.86 2.63 3.71
C5TF9 High Yield 6.1% 3.0 0.0 8.0 $200.9 0.21 1.98 0.21 4.49 12.12 6.76 6.82 5.09 6.06C5TGX Bloomberg Barclays U.S. High Yield 2% Issuer Cap Index 0.38 2.02 0.38 4.00 10.62 6.74 6.68 5.30 6.22
C5TF9 Liquidity Fund 2.7% 2.0 0.0 3.0 $87.9 0.00 0.01 0.00 0.03 0.11 1.34 1.34 0.92 0.72
C5TGX50% U.S. 3-Month T-Bill / 50% Bloomberg Barclays US Government Treasury 1 to 3 Year Index
0.09 0.05 0.09 0.05 0.10 1.59 1.43 1.09 0.82
C5TF9 Real Assets(1) 11.9% 19.0 15.0 25.0 $393.7 N/A 3.83 1.41 5.93 7.08 5.36 6.49 8.10 8.48
C5TGX Blended Custom Benchmark 1Q in Arrears^ (2) N/A 3.03 1.00 3.81 4.30 5.55 6.20 7.91 9.03
C5TF9 Private Investment(1) 8.9% 10.0 5.0 15.0 $294.5 N/A 11.93 0.21 23.87 44.70 20.41 17.63 15.83 14.17C5TGX Russell 3000 + 250 basis points 1Q in Arrears^ N/A 12.87 5.18 29.55 53.42 21.72 18.59 15.57 15.95
C5TF9 Private Credit(1) 1.0% 5.0 0.0 10.0 $31.7 N/A 5.97 3.62 11.65 16.31 N/A N/A N/A N/AC5TGX S&P / LSTA Leveraged Loan Index + 150 basis points N/A 1.38 0.68 6.96 17.60 N/A N/A N/A N/A
1Q in Arrears^C5TF9 Alternative Investment Fund 4.0% 3.0 0.0 10.0 $132.2 0.07 1.63 0.07 3.02 8.34 2.99 4.23 2.76 3.21C5TGX Absolute Return Strategy blended benchmark (3) 0.04 0.31 0.04 1.10 2.27 4.30 3.01 2.18 1.54
(1) Actual performance, reported one quarter in arrears.(2) A blended benchmark comprised of the weightings of Real Estate, Infrastructure / Natural Resources and U.S. TIPS as of April 2020.(3) A blended benchmark comprised of the weightings of each of the investments utilized within the fund of funds vehicle multiplied by their respective benchmarks as of April 2020.(4) Unofficial Benchmark, for comparison purposes only
MUNICIPAL EMPLOYEES RETIREMENT FUNDNet of All Fees and ExpensesPeriods Ending July 31, 2021
Compound, annualized returns

Funds Percent Policy Lower Upper Market Three Fiscal Calendar One Three Five Seven TenBenchmark Holdings Weights Range Range Value (mil.) Month Months YTD YTD Year Year Year Year Year
C5TG9OPEB $2,048.4 0.27 3.39 0.27 8.50 20.48 10.34 9.52 7.91 N/AC5TGX Policy Benchmark 0.79 3.27 0.79 8.50 20.00 10.62 9.48 7.98 N/AC5TGX Dynamic Benchmark 0.51 3.00 0.51 8.36 19.91 10.98 9.67 8.12 N/A
C5TF9 Domestic Equity 22.7% 20.0 15.0 25.0 $464.1 1.62 4.45 1.62 16.98 37.75 17.86 17.29 14.44 N/AIX1F00 Russell 3000 1.69 4.67 1.69 17.06 38.73 18.10 17.36 14.55 N/A
C5TF9 Developed Markets ISF 13.2% 11.0 6.0 15.0 $269.8 0.82 3.15 0.82 10.59 31.94 8.38 10.48 7.37 N/AC5TGX MSCI EAFE IMI Net 0.90 2.74 0.90 9.84 31.52 8.81 10.70 7.55 N/A
C5TF9 Emerging Markets ISF 11.9% 9.0 4.0 14.0 $244.3 -4.50 -1.28 -4.50 2.53 26.26 12.07 12.06 6.71 N/AC5TGX MSCI Emerging Markets IMI -6.09 -3.48 -6.09 2.13 23.42 8.33 10.38 5.12 N/A
Global Equities (4) 47.8% 40.0 25.0 54.0 $978.2 -0.20 2.60 -0.20 11.37 33.08 13.59 13.99 10.57 N/AMSCI All Country World Net Index 0.69 3.60 0.69 13.08 33.18 13.70 13.81 10.05 N/A
C5TF9 Core Fixed Income 12.5% 13.0 8.0 18.0 $255.8 1.03 2.21 1.03 -0.25 -0.03 5.56 3.35 3.28 N/AIX1F00 Barclays U.S. Aggregate Bond Index 1.12 2.16 1.12 -0.50 -0.70 5.73 3.13 3.48 N/A
C5TF9 Emerging Market Debt 5.3% 5.0 0.0 10.0 $109.4 -0.20 1.66 -0.20 -1.61 5.42 3.84 3.92 2.76 N/AIX1G0 50% JPM EMBI Global Div / 50% JPM GBI EM Global Div -0.01 1.53 -0.01 -2.02 3.58 4.69 3.86 2.63 N/A
C5TF9 High Yield 6.3% 3.0 0.0 8.0 $129.6 0.21 1.98 0.21 4.49 12.12 6.76 6.82 5.09 N/AC5TGX Bloomberg Barclays U.S. High Yield 2% Issuer Cap Index 0.38 2.02 0.38 4.00 10.62 6.74 6.68 5.30 N/A
C5TF9 Liquidity Fund 2.2% 2.0 0.0 3.0 $44.8 0.01 0.02 0.01 0.04 0.11 1.35 1.38 0.96 N/A
C5TGX50% U.S. 3-Month T-Bill / 50% Bloomberg Barclays US Government Treasury 1 to 3 Year Index
0.09 0.05 0.09 0.05 0.10 1.59 1.43 1.09 N/A
C5TF9 Real Assets(1) 11.9% 19.0 15.0 25.0 $243.1 N/A 3.83 1.41 5.93 7.08 5.36 6.49 8.10 N/A
C5TGX Blended Custom Benchmark 1Q in Arrears^ (2) N/A 3.03 1.00 3.81 4.30 5.55 6.20 7.91 N/A
C5TF9 Private Investment(1) 9.0% 10.0 5.0 15.0 $183.6 N/A 11.93 0.21 23.87 44.70 20.41 17.63 15.83 N/AC5TGX Russell 3000 + 250 basis points 1Q in Arrears^ N/A 12.87 5.18 29.55 53.42 21.72 18.59 15.57 N/A
C5TF9 Private Credit(1) 1.1% 5.0 0.0 10.0 $22.6 N/A 5.97 3.62 11.65 16.31 N/A N/A N/A N/AC5TGX S&P / LSTA Leveraged Loan Index + 150 basis points N/A 1.38 0.68 6.96 17.60 N/A N/A N/A N/A
1Q in Arrears^C5TF9 Alternative Investment Fund 4.0% 3.0 0.0 10.0 $81.3 0.07 1.63 0.07 3.02 8.34 2.99 4.23 2.76 N/AC5TGX Absolute Return Strategy blended benchmark (3) 0.04 0.31 0.04 1.10 2.27 4.30 3.01 2.18 N/A
(1) Actual performance, reported one quarter in arrears.(2) A blended benchmark comprised of the weightings of Real Estate, Infrastructure / Natural Resources and U.S. TIPS as of April 2020.(3) A blended benchmark comprised of the weightings of each of the investments utilized within the fund of funds vehicle multiplied by their respective benchmarks as of April 2020.(4) Unofficial Benchmark, for comparison purposes only
OPEB FUNDNet of All Fees and ExpensesPeriods Ending July 31, 2021
Compound, annualized returns

Funds Percent Policy Lower Upper Market Three Fiscal Calendar One Three Five Seven TenBenchmark Holdings Weights Range Range Value (mil.) Month Months YTD YTD Year Year Year Year Year
C5TG9Probate Judges Employees’ Retirement Fund $140.0 0.27 3.31 0.27 8.35 20.24 9.89 9.58 7.78 7.76C5TGX Policy Benchmark 0.79 3.27 0.79 8.50 20.00 10.45 9.77 7.88 8.16C5TGX Dynamic Benchmark 0.51 2.93 0.51 8.22 19.66 10.52 9.83 7.95 N/A
C5TF9 Domestic Equity 22.6% 20.0 15.0 25.0 $31.6 1.62 4.45 1.62 16.98 37.75 17.85 17.28 14.44 15.02IX1F00 Russell 3000 1.69 4.67 1.69 17.06 38.73 18.10 17.36 14.55 15.16
C5TF9 Developed Markets ISF 13.2% 11.0 6.0 16.0 $18.5 0.82 3.15 0.82 10.59 31.94 8.37 10.47 7.38 8.03C5TGX MSCI EAFE IMI 0.90 2.74 0.90 9.84 31.52 8.81 10.70 7.55 8.20
C5TF9 Emerging Markets ISF 11.9% 9.0 4.0 14.0 $16.6 -4.50 -1.28 -4.50 2.53 26.26 12.07 12.05 6.71 4.66C5TGX MSCI Emerging Markets IMI -6.09 -3.48 -6.09 2.13 23.42 8.33 10.38 5.12 3.67
Global Equities (4) 47.7% 40.0 25.0 55.0 $66.8 -0.20 2.60 -0.20 11.37 33.08 13.59 13.99 10.57 N/AMSCI All Country World Net Index 0.69 3.60 0.69 13.08 33.18 13.70 13.81 10.05 N/A
C5TF9 Core Fixed Income 12.5% 13.0 8.0 18.0 $17.5 1.03 2.21 1.03 -0.25 -0.03 5.56 3.35 3.28 3.30IX1F00 Barclays U.S. Aggregate Bond Index 1.12 2.16 1.12 -0.50 -0.70 5.73 3.13 3.48 3.35
C5TF9 Emerging Market Debt 5.1% 5.0 0.0 10.0 $7.2 -0.20 1.66 -0.20 -1.61 5.42 3.83 3.91 2.76 3.06IX1G0 50% JPM EMBI Global Div / 50% JPM GBI EM Global Div -0.01 1.53 -0.01 -2.02 3.58 4.69 3.86 2.63 3.71
C5TF9 High Yield 6.1% 3.0 0.0 8.0 $8.5 0.21 1.98 0.21 4.49 12.12 6.76 6.82 5.09 6.06C5TGX Bloomberg Barclays U.S. High Yield 2% Issuer Cap Index 0.38 2.02 0.38 4.00 10.62 6.74 6.68 5.30 6.22
C5TF9 Liquidity Fund 3.0% 2.0 0.0 3.0 $4.2 0.00 0.01 0.00 0.03 0.11 1.34 1.33 0.91 0.72
C5TGX50% U.S. 3-Month T-Bill / 50% Bloomberg Barclays US Government Treasury 1 to 3 Year Index
0.09 0.05 0.09 0.05 0.10 1.59 1.43 1.09 0.82
C5TF9 Real Assets(1) 11.8% 19.0 15.0 25.0 $16.6 N/A 3.83 1.41 5.93 7.08 5.36 6.49 8.10 8.48
C5TGX Blended Custom Benchmark 1Q in Arrears^ (2) N/A 3.03 1.00 3.81 4.30 5.55 6.20 7.91 9.03
C5TF9 Private Investment(1) 9.0% 10.0 5.0 15.0 $12.5 N/A 11.93 0.21 23.87 44.70 20.41 17.63 15.83 14.17C5TGX Russell 3000 + 250 basis points 1Q in Arrears^ N/A 12.87 5.18 29.55 53.42 21.72 18.59 15.57 15.95
C5TF9 Private Credit(1) 0.9% 5.0 0.0 10.0 $1.3 N/A 5.97 3.62 11.65 16.31 N/A N/A N/A N/AC5TGX S&P / LSTA Leveraged Loan Index + 150 basis points N/A 1.38 0.68 6.96 17.60 N/A N/A N/A N/A
1Q in Arrears^C5TF9 Alternative Investment Fund 3.9% 3.0 0.0 10.0 $5.5 0.07 1.63 0.07 3.02 8.34 2.99 4.23 2.76 3.21C5TGX Absolute Return Strategy blended benchmark (3) 0.04 0.31 0.04 1.10 2.27 4.30 3.01 2.18 1.54
(1) Actual performance, reported one quarter in arrears.(2) A blended benchmark comprised of the weightings of Real Estate, Infrastructure / Natural Resources and U.S. TIPS as of April 2020.(3) A blended benchmark comprised of the weightings of each of the investments utilized within the fund of funds vehicle multiplied by their respective benchmarks as of April 2020.(4) Unofficial Benchmark, for comparison purposes only
PROBATE JUDGES EMPLOYEES' RETIREMENT FUNDNet of All Fees and ExpensesPeriods Ending July 31, 2021
Compound, annualized returns

Funds Percent Policy Lower Upper Market Three Fiscal Calendar One Three Five Seven TenBenchmark Holdings Weights Range Range Value (mil.) Month Months YTD YTD Year Year Year Year Year
C5TG9State Judges Retirement Fund $298.6 0.27 3.37 0.27 8.44 20.28 10.00 9.65 7.81 7.81C5TGX Policy Benchmark 0.79 3.27 0.79 8.50 20.00 10.46 9.71 7.82 8.07C5TGX Dynamic Benchmark 0.51 2.99 0.51 8.29 19.70 10.63 9.84 7.95 N/A
C5TF9 Domestic Equity 22.3% 20.0 15.0 25.0 $66.5 1.62 4.45 1.62 16.98 37.75 17.85 17.28 14.44 15.03IX1F00 Russell 3000 1.69 4.67 1.69 17.06 38.73 18.10 17.36 14.55 15.16
C5TF9 Developed Markets ISF 13.1% 11.0 6.0 16.0 $39.0 0.82 3.15 0.82 10.59 31.94 8.38 10.47 7.38 8.04C5TGX MSCI EAFE IMI Net 0.90 2.74 0.90 9.84 31.52 8.81 10.70 7.55 8.20
C5TF9 Emerging Markets ISF 11.8% 9.0 4.0 14.0 $35.1 -4.50 -1.28 -4.50 2.53 26.26 12.07 12.05 6.71 4.66C5TGX MSCI Emerging Markets IMI -6.09 -3.48 -6.09 2.13 23.42 8.33 10.38 5.12 3.67
Global Equities (4) 47.1% 40.0 25.0 55.0 $140.6 -0.20 2.60 -0.20 11.37 33.08 13.59 13.99 10.57 N/AMSCI All Country World Net Index 0.69 3.60 0.69 13.08 33.18 13.70 13.81 10.05 N/A
C5TF9 Core Fixed Income 12.3% 13.0 8.0 18.0 $36.8 1.03 2.21 1.03 -0.25 -0.03 5.56 3.35 3.28 3.30IX1F00 Barclays U.S. Aggregate Bond Index 1.12 2.16 1.12 -0.50 -0.70 5.73 3.13 3.48 3.35
C5TF9 Emerging Market Debt 5.1% 5.0 0.0 10.0 $15.2 -0.20 1.66 -0.20 -1.61 5.42 3.83 3.91 2.76 3.06IX1G0 50% JPM EMBI Global Div / 50% JPM GBI EM Global Div -0.01 1.53 -0.01 -2.02 3.58 4.69 3.86 2.63 3.71
C5TF9 High Yield 6.0% 3.0 0.0 8.0 $18.0 0.21 1.98 0.21 4.49 12.12 6.76 6.82 5.09 6.06C5TGX Bloomberg Barclays U.S. High Yield 2% Issuer Cap Index 0.38 2.02 0.38 4.00 10.62 6.74 6.68 5.30 6.22
C5TF9 Liquidity Fund 3.8% 2.0 0.0 3.0 $11.4 0.00 0.01 0.00 0.03 0.11 1.34 1.33 0.92 0.70
C5TGX50% U.S. 3-Month T-Bill / 50% Bloomberg Barclays US Government Treasury 1 to 3 Year Index
0.09 0.05 0.09 0.05 0.10 1.59 1.43 1.09 0.82
C5TF9 Real Assets(1) 11.8% 19.0 15.0 25.0 $35.2 N/A 3.83 1.41 5.93 7.08 5.36 6.49 8.10 8.48
C5TGX Blended Custom Benchmark 1Q in Arrears^ (2) N/A 3.03 1.00 3.81 4.30 5.55 6.20 7.91 9.03
C5TF9 Private Investment(1) 8.9% 10.0 5.0 15.0 $26.6 N/A 11.93 0.21 23.87 44.70 20.41 17.63 15.83 14.17C5TGX Russell 3000 + 250 basis points 1Q in Arrears^ N/A 12.87 5.18 29.55 53.42 21.72 18.59 15.57 15.95
C5TF9 Private Credit(1) 1.0% 5.0 0.0 10.0 $2.9 N/A 5.97 3.62 11.65 16.31 N/A N/A N/A N/AC5TGX S&P / LSTA Leveraged Loan Index + 150 basis points N/A 1.38 0.68 6.96 17.60 N/A N/A N/A N/A
1Q in Arrears^C5TF9 Alternative Investment Fund 4.0% 3.0 0.0 10.0 $12.0 0.07 1.63 0.07 3.02 8.34 2.99 4.23 2.76 3.21C5TGX Absolute Return Strategy blended benchmark (3) 0.04 0.31 0.04 1.10 2.27 4.30 3.01 2.18 1.54
(1) Actual performance, reported one quarter in arrears.(2) A blended benchmark comprised of the weightings of Real Estate, Infrastructure / Natural Resources and U.S. TIPS as of April 2020.(3) A blended benchmark comprised of the weightings of each of the investments utilized within the fund of funds vehicle multiplied by their respective benchmarks as of April 2020.(4) Unofficial Benchmark, for comparison purposes only
STATE JUDGES RETIREMENT FUNDNet of All Fees and ExpensesPeriods Ending July 31, 2021
Compound, annualized returns

Funds Percent Policy Lower Upper Market Three Fiscal Calendar One Three Five Seven TenBenchmark Holdings Weights Range Range Value (mil.) Month Months YTD YTD Year Year Year Year Year
C5TG9State’s Attorneys’ Retirement Fund $2.7 0.26 3.35 0.26 8.40 20.22 9.47 9.52 7.53 7.46C5TGX Policy Benchmark 0.79 3.27 0.79 8.50 20.00 10.64 10.09 8.06 N/AC5TGX Dynamic Benchmark 0.50 2.97 0.50 8.27 19.64 10.48 10.01 8.00 N/A
C5TF9 Domestic Equity 22.5% 20.0 15.0 25.0 $0.6 1.62 4.45 1.62 16.98 37.75 17.86 17.28 14.45 15.03IX1F00 Russell 3000 1.69 4.67 1.69 17.06 38.73 18.10 17.36 14.55 15.16
C5TF9 Developed Markets ISF 13.2% 11.0 6.0 16.0 $0.4 0.82 3.15 0.82 10.59 31.94 8.38 10.48 7.38 N/AC5TGX MSCI EAFE IMI Net 0.90 2.74 0.90 9.84 31.52 8.81 10.70 7.55 N/A
C5TF9 Emerging Markets ISF 11.9% 9.0 4.0 14.0 $0.3 -4.50 -1.28 -4.50 2.53 26.26 12.06 12.05 6.71 N/AC5TGX MSCI Emerging Markets IMI -6.09 -3.48 -6.09 2.13 23.42 8.33 10.38 5.12 N/A
Global Equities (4) 47.6% 40.0 25.0 55.0 $1.3 -0.20 2.60 -0.20 11.37 33.08 13.59 13.99 10.57 N/AMSCI All Country World Net Index 0.69 3.60 0.69 13.08 33.18 13.70 13.81 10.05 N/A
C5TF9 Core Fixed Income 12.4% 13.0 8.0 18.0 $0.3 1.03 2.21 1.03 -0.25 -0.03 5.56 3.35 3.28 3.34IX1F00 Barclays U.S. Aggregate Bond Index 1.12 2.16 1.12 -0.50 -0.70 5.73 3.13 3.48 3.35
C5TF9 Emerging Market Debt 5.1% 5.0 0.0 10.0 $0.1 -0.20 1.66 -0.20 -1.61 5.42 3.83 3.91 2.76 3.05IX1G0 50% JPM EMBI Global Div / 50% JPM GBI EM Global Div -0.01 1.53 -0.01 -2.02 3.58 4.69 3.86 2.63 3.71
C5TF9 High Yield 6.1% 3.0 0.0 8.0 $0.2 0.21 1.98 0.21 4.49 12.12 6.76 6.82 5.09 6.04C5TGX Bloomberg Barclays U.S. High Yield 2% Issuer Cap Index 0.38 2.02 0.38 4.00 10.62 6.74 6.68 5.30 6.22
C5TF9 Liquidity Fund 3.1% 2.0 0.0 3.0 $0.1 0.00 0.01 0.00 0.03 0.11 1.34 1.34 0.92 0.72
C5TGX50% U.S. 3-Month T-Bill / 50% Bloomberg Barclays US Government Treasury 1 to 3 Year Index
0.09 0.05 0.09 0.05 0.10 1.59 1.43 1.09 0.82
C5TF9 Real Assets(1) 11.9% 19.0 15.0 25.0 $0.3 N/A 3.83 1.41 5.93 7.08 N/A N/A N/A N/A
C5TGX Blended Custom Benchmark 1Q in Arrears^ (2) N/A 3.03 1.00 3.81 4.30 N/A N/A N/A N/A
C5TF9 Private Investment(1) 8.9% 10.0 5.0 15.0 $0.2 N/A 11.93 0.21 23.87 44.70 N/A N/A N/A N/AC5TGX Russell 3000 + 250 basis points 1Q in Arrears^ N/A 12.87 5.18 29.55 53.42 N/A N/A N/A N/A
C5TF9 Private Credit(1) 0.9% 5.0 0.0 10.0 $0.0 N/A 5.97 3.62 11.65 16.31 N/A N/A N/A N/AC5TGX S&P / LSTA Leveraged Loan Index + 150 basis points N/A 1.38 0.68 6.96 17.60 N/A N/A N/A N/A
1Q in Arrears^C5TF9 Alternative Investment Fund 4.0% 3.0 0.0 10.0 $0.1 0.07 1.63 0.07 3.02 8.34 N/A N/A N/A N/AC5TGX Absolute Return Strategy blended benchmark (3) 0.04 0.31 0.04 1.10 2.27 N/A N/A N/A N/A
(1) Actual performance, reported one quarter in arrears.(2) A blended benchmark comprised of the weightings of Real Estate, Infrastructure / Natural Resources and U.S. TIPS as of April 2020.(3) A blended benchmark comprised of the weightings of each of the investments utilized within the fund of funds vehicle multiplied by their respective benchmarks as of April 2020.(4) Unofficial Benchmark, for comparison purposes only
STATE'S ATTORNEYS' RETIREMENT FUNDNet of All Fees and ExpensesPeriods Ending July 31, 2021
Compound, annualized returns

Funds Percent Policy Lower Upper Market Three Fiscal Calendar One Three Five Seven TenBenchmark Holdings Weights Range Range Value (mil.) Month Months YTD YTD Year Year Year Year Year
C5TG9Agricultural College Fund 100.0% $0.7 1.06 2.23 1.06 -0.22 -0.02 5.61 3.39 3.32 3.41C5TGX Policy Benchmark 1.12 2.16 1.12 -0.50 -0.70 5.73 3.13 3.48 3.41C5TGX Dynamic Benchmark 1.12 2.16 1.12 -0.50 -0.70 5.73 3.13 3.48 N/A
C5TF9 Core Fixed Income 102.5% 100.0 100.0 100.0 $0.7 1.03 2.21 1.03 -0.25 -0.03 5.56 3.35 3.28 3.30IX1F00 Barclays U.S. Aggregate Bond Index 1.12 2.16 1.12 -0.50 -0.70 5.73 3.13 3.48 3.35
C5TF9 Liquidity Fund (1) -2.5% ($0.0) 0.00 0.00 0.00 0.00 0.06 1.29 1.07 0.68 0.56
C5TGX50% U.S. 3-Month T-Bill / 50% Bloomberg Barclays US Government Treasury 1 to 3 Year Index
0.09 0.05 0.09 0.05 0.10 1.59 1.43 1.09 0.82
(1) Operational cash balance and expense accruals
AGRICULTURAL COLLEGE FUNDNet of All Fees and ExpensesPeriods Ending July 31, 2021
Compound, annualized returns

Funds Percent Policy Lower Upper Market Three Fiscal Calendar One Three Five Seven TenBenchmark Holdings Weights Range Range Value (mil.) Month Months YTD YTD Year Year Year Year Year
C5TG9Andrew C. Clark Fund $1.4 0.87 2.53 0.87 3.75 9.95 8.30 6.78 5.74 6.03C5TGX Policy Benchmark 0.86 2.32 0.86 3.26 8.98 8.24 6.50 5.78 6.02C5TGX Dynamic Benchmark 0.87 2.39 0.87 3.50 9.45 8.37 6.61 5.86 N/A
C5TF9 Domestic Equity 16.2% 15.0 10.0 20.0 $0.2 1.62 4.45 1.62 16.98 37.75 17.86 17.29 14.45 15.01IX1F00 Russell 3000 1.69 4.67 1.69 17.06 38.73 18.10 17.36 14.55 15.16
C5TF9 Developed Markets ISF 11.5% 11.0 6.0 16.0 $0.2 0.82 3.15 0.82 10.59 31.94 8.38 10.48 7.38 N/AC5TGX MSCI EAFE IMI Net 0.90 2.74 0.90 9.84 31.52 8.81 10.70 7.55 N/A
C5TF9 Emerging Markets ISF 4.2% 4.0 0.0 5.0 $0.1 -4.50 -1.28 -4.50 2.53 26.26 12.07 12.05 6.71 N/AC5TGX MSCI Emerging Markets IMI -6.09 -3.48 -6.09 2.13 23.42 8.33 10.38 5.12 N/A
Global Equities (1) 31.9% 30.0 16.0 41.0 $0.5 -0.20 2.60 -0.20 11.37 33.08 13.59 13.99 10.57 N/AMSCI All Country World Net Index 0.69 3.60 0.69 13.08 33.18 13.70 13.81 10.05 N/A
C5TF9 Core Fixed Income 68.7% 67.0 57.0 77.0 $1.0 1.03 2.21 1.03 -0.25 -0.03 5.56 3.35 3.28 3.30IX1F00 Barclays U.S. Aggregate Bond Index 1.12 2.16 1.12 -0.50 -0.70 5.73 3.13 3.48 3.35
C5TF9 Liquidity Fund -0.6% 3.0 0.0 4.0 ($0.0) -0.01 0.00 -0.01 0.02 0.38 3.35 3.11 2.21 1.64
C5TGX50% U.S. 3-Month T-Bill / 50% Bloomberg Barclays US Government Treasury 1 to 3 Year Index
0.09 0.05 0.09 0.05 0.10 1.59 1.43 1.09 0.82
(1) Unofficial Benchmark, for comparison purposes only
ANDREW C. CLARK FUNDNet of All Fees and ExpensesPeriods Ending July 31, 2021
Compound, annualized returns

Funds Percent Policy Lower Upper Market Three Fiscal Calendar One Three Five Seven TenBenchmark Holdings Weights Range Range Value (mil.) Month Months YTD YTD Year Year Year Year Year
C5TG9Soldiers’ Sailors’ & Marines Fund $91.2 0.85 2.50 0.85 3.73 10.01 8.30 6.79 5.73 5.99C5TGX Policy Benchmark 0.86 2.32 0.86 3.26 8.98 8.24 6.50 5.78 5.97C5TGX Dynamic Benchmark 0.86 2.37 0.86 3.48 9.52 8.38 6.63 5.87 N/A
C5TF9 Domestic Equity 15.9% 15.0 10.0 20.0 $14.5 1.62 4.45 1.62 16.98 37.75 17.86 17.29 14.45 15.03IX1F00 Russell 3000 1.69 4.67 1.69 17.06 38.73 18.10 17.36 14.55 15.16
C5TF9 Developed Markets ISF 11.5% 11.0 6.0 16.0 $10.4 0.82 3.15 0.82 10.59 31.94 8.38 10.48 7.38 N/AC5TGX MSCI EAFE IMI Net 0.90 2.74 0.90 9.84 31.52 8.81 10.70 7.55 N/A
C5TF9 Emerging Markets ISF 4.2% 4.0 0.0 5.0 $3.8 -4.50 -1.28 -4.50 2.53 26.26 12.07 12.05 6.71 N/AC5TGX MSCI Emerging Markets IMI -6.09 -3.48 -6.09 2.13 23.42 8.33 10.38 5.12 N/A
Global Equities (1) 31.5% 30.0 16.0 41.0 $28.8 -0.20 2.60 -0.20 11.37 33.08 13.59 13.99 10.57 N/AMSCI All Country World Net Index 0.69 3.60 0.69 13.08 33.18 13.70 13.81 10.05 N/A
C5TF9 Core Fixed Income 67.3% 67.0 57.0 77.0 $61.4 1.03 2.21 1.03 -0.25 -0.03 5.56 3.35 3.28 3.30IX1F00 Barclays U.S. Aggregate Bond Index 1.12 2.16 1.12 -0.50 -0.70 5.73 3.13 3.48 3.35
C5TF9 Liquidity Fund 1.1% 3.0 0.0 4.0 $1.0 0.00 0.01 0.00 0.03 0.11 1.34 1.34 0.92 0.73
C5TGX50% U.S. 3-Month T-Bill / 50% Bloomberg Barclays US Government Treasury 1 to 3 Year Index
0.09 0.05 0.09 0.05 0.10 1.59 1.43 1.09 0.82
(1) Unofficial Benchmark, for comparison purposes only
SOLDIERS' SAILORS' & MARINES' FUNDNet of All Fees and ExpensesPeriods Ending July 31, 2021
Compound, annualized returns

Funds Percent Policy Lower Upper Market Three Fiscal Calendar One Three Five Seven TenBenchmark Holdings Weights Range Range Value (mil.) Month Months YTD YTD Year Year Year Year Year
C5TG9School Fund $13.9 0.86 2.53 0.86 3.71 10.06 8.32 6.81 5.75 6.01C5TGX Policy Benchmark 0.86 2.32 0.86 3.26 8.98 8.24 6.50 5.78 6.02C5TGX Dynamic Benchmark 0.87 2.40 0.87 3.45 9.57 8.39 6.63 5.88 N/A
C5TF9 Domestic Equity 16.1% 15.0 10.0 20.0 $2.2 1.62 4.45 1.62 16.98 37.75 17.86 17.29 14.45 15.03IX1F00 Russell 3000 1.69 4.67 1.69 17.06 38.73 18.10 17.36 14.55 15.16
C5TF9 Developed Markets ISF 11.3% 11.0 6.0 16.0 $1.6 0.82 3.15 0.82 10.59 31.94 8.38 10.48 7.38 N/AC5TGX MSCI EAFE IMI Net 0.90 2.74 0.90 9.84 31.52 8.81 10.70 7.55 N/A
C5TF9 Emerging Markets ISF 4.0% 4.0 0.0 5.0 $0.6 -4.50 -1.28 -4.50 2.53 26.26 12.07 12.05 6.71 N/AC5TGX MSCI Emerging Markets IMI -6.09 -3.48 -6.09 2.13 23.42 8.33 10.38 5.12 N/A
Global Equities (1) 31.4% 30.0 16.0 41.0 $4.3 -0.20 2.60 -0.20 11.37 33.08 13.59 13.99 10.57 N/AMSCI All Country World Net Index 0.69 3.60 0.69 13.08 33.18 13.70 13.81 10.05 N/A
C5TF9 Core Fixed Income 67.8% 67.0 57.0 77.0 $9.4 1.03 2.21 1.03 -0.25 -0.03 5.56 3.35 3.28 3.30IX1F00 Barclays U.S. Aggregate Bond Index 1.12 2.16 1.12 -0.50 -0.70 5.73 3.13 3.48 3.35
C5TF9 Liquidity Fund 0.8% 3.0 0.0 4.0 $0.1 0.01 0.03 0.01 0.06 0.17 2.25 2.23 1.50 1.09
C5TGX50% U.S. 3-Month T-Bill / 50% Bloomberg Barclays US Government Treasury 1 to 3 Year Index
0.09 0.05 0.09 0.05 0.10 1.59 1.43 1.09 0.82
(1) Unofficial Benchmark, for comparison purposes only
SCHOOL FUNDNet of All Fees and ExpensesPeriods Ending July 31, 2021
Compound, annualized returns

Funds Percent Policy Lower Upper Market Three Fiscal Calendar One Three Five Seven TenBenchmark Holdings Weights Range Range Value (mil.) Month Months YTD YTD Year Year Year Year Year
C5TG9IDA Eaton Cotton Fund $3.0 0.87 2.52 0.87 3.71 9.93 8.29 6.78 5.73 6.02C5TGX Policy Benchmark 0.86 2.32 0.86 3.26 8.98 8.24 6.50 5.78 6.02C5TGX Dynamic Benchmark 0.88 2.38 0.88 3.45 9.44 8.37 6.60 5.86 N/A
C5TF9 Domestic Equity 16.2% 15.0 10.0 20.0 $0.5 1.62 4.45 1.62 16.98 37.75 17.86 17.29 14.45 15.02IX1F00 Russell 3000 1.69 4.67 1.69 17.06 38.73 18.10 17.36 14.55 15.16
C5TF9 Developed Markets ISF 11.3% 11.0 6.0 16.0 $0.3 0.82 3.15 0.82 10.59 31.94 8.38 10.48 7.38 N/AC5TGX MSCI EAFE IMI Net 0.90 2.74 0.90 9.84 31.52 8.81 10.70 7.55 N/A
C5TF9 Emerging Markets ISF 4.1% 4.0 0.0 5.0 $0.1 -4.50 -1.28 -4.50 2.53 26.26 12.07 12.05 6.71 N/AC5TGX MSCI Emerging Markets IMI -6.09 -3.48 -6.09 2.13 23.42 8.33 10.38 5.12 N/A
Global Equities (1) 31.6% 30.0 16.0 41.0 $1.0 -0.20 2.60 -0.20 11.37 33.08 13.59 13.99 10.57 N/AMSCI All Country World Net Index 0.69 3.60 0.69 13.08 33.18 13.70 13.81 10.05 N/A
C5TF9 Core Fixed Income 68.7% 67.0 57.0 77.0 $2.1 1.03 2.21 1.03 -0.25 -0.03 5.56 3.35 3.28 3.30IX1F00 Barclays U.S. Aggregate Bond Index 1.12 2.16 1.12 -0.50 -0.70 5.73 3.13 3.48 3.35
C5TF9 Liquidity Fund -0.4% 3.0 0.0 4.0 ($0.0) -0.01 0.00 -0.01 0.02 0.32 3.83 3.30 2.32 1.71
C5TGX50% U.S. 3-Month T-Bill / 50% Bloomberg Barclays US Government Treasury 1 to 3 Year Index
0.09 0.05 0.09 0.05 0.10 1.59 1.43 1.09 0.82
(1) Unofficial Benchmark, for comparison purposes only
IDA EATON COTTON FUNDNet of All Fees and ExpensesPeriods Ending July 31, 2021
Compound, annualized returns

Funds Percent Policy Lower Upper Market Three Fiscal Calendar One Three Five Seven TenBenchmark Holdings Weights Range Range Value (mil.) Month Months YTD YTD Year Year Year Year Year
C5TG9Hopemead Fund $5.0 0.85 2.50 0.85 3.68 9.96 8.25 6.75 5.69 5.93C5TGX Policy Benchmark 0.86 2.32 0.86 3.26 8.98 8.24 6.50 5.78 6.02C5TGX Dynamic Benchmark 0.86 2.36 0.86 3.43 9.48 8.33 6.58 5.83 N/A
C5TF9 Domestic Equity 15.9% 15.0 10.0 20.0 $0.8 1.62 4.45 1.62 16.98 37.75 17.86 17.29 14.45 15.01IX1F00 Russell 3000 1.69 4.67 1.69 17.06 38.73 18.10 17.36 14.55 15.16
C5TF9 Developed Markets ISF 11.1% 11.0 6.0 16.0 $0.6 0.82 3.15 0.82 10.59 31.94 8.38 10.48 7.38 N/AC5TGX MSCI EAFE IMI Net 0.90 2.74 0.90 9.84 31.52 8.81 10.70 7.55 N/A
C5TF9 Emerging Markets ISF 4.1% 4.0 0.0 5.0 $0.2 -4.50 -1.28 -4.50 2.53 26.26 12.07 12.05 6.71 N/AC5TGX MSCI Emerging Markets IMI -6.09 -3.48 -6.09 2.13 23.42 8.33 10.38 5.12 N/A
Global Equities (1) 31.1% 30.0 16.0 41.0 $1.5 -0.20 2.60 -0.20 11.37 33.08 13.59 13.99 10.57 N/AMSCI All Country World Net Index 0.69 3.60 0.69 13.08 33.18 13.70 13.81 10.05 N/A
C5TF9 Core Fixed Income 67.1% 67.0 57.0 77.0 $3.3 1.03 2.21 1.03 -0.25 -0.03 5.56 3.35 3.28 3.30IX1F00 Barclays U.S. Aggregate Bond Index 1.12 2.16 1.12 -0.50 -0.70 5.73 3.13 3.48 3.35
C5TF9 Liquidity Fund 1.8% 3.0 0.0 4.0 $0.1 0.00 0.01 0.00 0.03 0.11 1.34 1.34 0.92 0.73
C5TGX50% U.S. 3-Month T-Bill / 50% Bloomberg Barclays US Government Treasury 1 to 3 Year Index
0.09 0.05 0.09 0.05 0.10 1.59 1.43 1.09 0.82
(1) Unofficial Benchmark, for comparison purposes only
HOPEMEAD FUNDNet of All Fees and ExpensesPeriods Ending July 31, 2021
Compound, annualized returns

Funds Percent Policy Lower Upper Market Three Fiscal Calendar One Three Five Seven TenBenchmark Holdings Weights Range Range Value (mil.) Month Months YTD YTD Year Year Year Year Year
C5TG9Arts Endowment Fund $24.6 0.57 2.90 0.57 8.19 22.15 10.51 8.75 7.12 6.90C5TGX Policy Benchmark 0.17 2.15 0.17 7.33 21.18 10.03 8.23 7.00 6.93C5TGX Dynamic Benchmark 0.19 2.19 0.19 7.52 21.19 10.30 N/A N/A N/A
C5TF9Domestic Equity 30.4% 28.0 23.0 33.0 $7.5 1.62 4.45 1.62 16.98 37.75 17.86 17.29 14.45 N/AIX1F00 Russell 3000 1.69 4.67 1.69 17.06 38.73 18.10 17.36 14.55 N/A
C5TF9Developed Markets ISF 17.4% 17.0 12.0 22.0 $4.3 0.82 3.15 0.82 10.59 31.94 8.38 10.49 7.39 N/AC5TGX MSCI EAFE IMI Net 0.90 2.74 0.90 9.84 31.52 8.81 10.70 7.55 N/A
C5TF9 Emerging Markets ISF 11.6% 12.0 7.0 17.0 $2.8 -4.50 -1.28 -4.50 2.53 26.26 12.06 12.06 6.72 N/AC5TGX MSCI Emerging Markets IMI -6.09 -3.48 -6.09 2.13 23.42 8.33 10.38 5.12 N/A
Global Equities (2) 59.4% 57.0 42.0 72.0 $14.6 -0.20 2.60 -0.20 11.37 33.08 13.59 13.99 10.57 N/AMSCI All Country World Net Index 0.69 3.60 0.69 13.08 33.18 13.70 13.81 10.05 N/A
C5TF9Core Fixed Income 14.8% 16.0 11.0 21.0 $3.6 1.03 2.21 1.03 -0.25 -0.03 5.56 3.35 3.28 3.30IX1F00 Barclays U.S. Aggregate Bond Index 1.12 2.16 1.12 -0.50 -0.70 5.73 3.13 3.48 3.35
C5TF9 Emerging Market Debt 7.2% 8.0 3.0 13.0 $1.8 -0.20 1.66 -0.20 -1.61 5.42 N/A N/A N/A N/AIX1G0 50% JPM EMBI Global Div / 50% JPM GBI EM Global Div -0.01 1.53 -0.01 -2.02 3.58 N/A N/A N/A N/A
C5TF9 High Yield 8.6% 9.0 4.0 14.0 $2.1 0.21 1.98 0.21 4.49 12.12 N/A N/A N/A N/AC5TGX Bloomberg Barclays U.S. High Yield 2% Issuer Cap Index 0.38 2.02 0.38 4.00 10.62 N/A N/A N/A N/A
C5TF9 Private Credit(1) 8.9% 9.0 4.0 14.0 $2.2 N/A 5.97 3.62 11.65 16.31 N/A N/A N/A N/AC5TGX S&P / LSTA Leveraged Loan Index + 150 basis points N/A 1.38 0.68 6.96 17.60 N/A N/A N/A N/A
1Q in Arrears^C5TF9 Liquidity Fund 1.1% 1.0 0.0 3.0 $0.3 0.00 0.01 0.00 0.03 0.10 1.34 1.30 0.89 0.70
C5TGX50% U.S. 3-Month T-Bill / 50% Bloomberg Barclays US Government Treasury 1 to 3 Year Index
0.09 0.05 0.09 0.05 0.10 1.59 1.43 1.09 0.82
(1) Actual performance, reported one quarter in arrears, (2) Unofficial Benchmark, for comparison purposes only
ARTS ENDOWMENT FUNDNet of All Fees and ExpensesPeriods Ending July 31, 2021
Compound, annualized returns

Funds Percent Policy Lower Upper Market Three Fiscal Calendar One Three Five Seven TenBenchmark Holdings Weights Range Range Value (mil.) Month Months YTD YTD Year Year Year Year Year
C5TG9Policemen and Firemen Survivors’ Benefit Fund $47.2 0.27 3.37 0.27 8.42 20.22 9.84 9.72 7.88 8.31C5TGX Policy Benchmark 0.79 3.27 0.79 8.50 20.00 10.42 9.86 7.93 N/AC5TGX Dynamic Benchmark 0.51 2.99 0.51 8.28 19.63 10.47 9.92 8.00 N/A
C5TF9 Domestic Equity 22.5% 20.0 15.0 25.0 $10.6 1.62 4.45 1.62 16.98 37.75 17.85 17.28 14.44 15.21IX1F00 Russell 3000 1.69 4.67 1.69 17.06 38.73 18.10 17.36 14.55 15.16
C5TF9 Developed Markets ISF 13.3% 11.0 6.0 16.0 $6.3 0.82 3.15 0.82 10.59 31.94 8.37 10.47 7.38 N/AC5TGX MSCI EAFE IMI Net 0.90 2.74 0.90 9.84 31.52 8.81 10.70 7.55 N/A
C5TF9 Emerging Markets ISF 11.9% 9.0 4.0 14.0 $5.6 -4.50 -1.28 -4.50 2.53 26.26 12.07 12.05 6.71 N/AC5TGX MSCI Emerging Markets IMI -6.09 -3.48 -6.09 2.13 23.42 8.33 10.38 5.12 N/A
Global Equities (4) 47.7% 40.0 25.0 55.0 $22.5 -0.20 2.60 -0.20 11.37 33.08 13.59 13.99 10.57 N/AMSCI All Country World Net Index 0.69 3.60 0.69 13.08 33.18 13.70 13.81 10.05 N/A
C5TF9 Core Fixed Income 12.5% 13.0 8.0 18.0 $5.9 1.03 2.21 1.03 -0.25 -0.03 5.56 3.35 3.28 3.36IX1F00 Barclays U.S. Aggregate Bond Index 1.12 2.16 1.12 -0.50 -0.70 5.73 3.13 3.48 3.35
C5TF9 Emerging Market Debt 5.1% 5.0 0.0 10.0 $2.4 -0.20 1.66 -0.20 -1.61 5.42 3.83 3.91 2.76 3.05IX1G0 50% JPM EMBI Global Div / 50% JPM GBI EM Global Div -0.01 1.53 -0.01 -2.02 3.58 4.69 3.86 2.63 3.71
C5TF9 High Yield 6.1% 3.0 0.0 8.0 $2.9 0.21 1.98 0.21 4.49 12.12 6.76 6.82 5.09 6.04C5TGX Bloomberg Barclays U.S. High Yield 2% Issuer Cap Index 0.38 2.02 0.38 4.00 10.62 6.74 6.68 5.30 6.22
C5TF9 Liquidity Fund 2.7% 2.0 0.0 3.0 $1.3 0.00 0.01 0.00 0.03 0.11 1.34 1.34 0.92 0.72
C5TGX50% U.S. 3-Month T-Bill / 50% Bloomberg Barclays US Government Treasury 1 to 3 Year Index
0.09 0.05 0.09 0.05 0.10 1.59 1.43 1.09 0.82
C5TF9 Real Assets(1) 11.9% 19.0 15.0 25.0 $5.6 N/A 3.83 1.41 5.93 7.08 5.36 6.49 8.10 8.44
C5TGX Blended Custom Benchmark 1Q in Arrears^ (2) N/A 3.03 1.00 3.81 4.30 5.55 6.20 7.91 9.03
C5TF9 Private Investment(1) 9.0% 10.0 5.0 15.0 $4.3 N/A 11.93 0.21 23.87 44.70 20.41 17.63 15.83 N/AC5TGX Russell 3000 + 250 basis points 1Q in Arrears^ N/A 12.87 5.18 29.55 53.42 21.72 18.59 15.57 N/A
C5TF9 Private Credit(1) 1.0% 5.0 0.0 10.0 $0.5 N/A 5.97 3.62 11.65 16.31 N/A N/A N/A N/AC5TGX S&P / LSTA Leveraged Loan Index + 150 basis points N/A 1.38 0.68 6.96 17.60 N/A N/A N/A N/A
1Q in Arrears^C5TF9 Alternative Investment Fund 4.0% 3.0 0.0 10.0 $1.9 0.07 1.63 0.07 3.02 8.34 2.99 4.23 2.76 N/AC5TGX Absolute Return Strategy blended benchmark (3) 0.04 0.31 0.04 1.10 2.27 4.30 3.01 2.18 N/A
(1) Actual performance, reported one quarter in arrears.(2) A blended benchmark comprised of the weightings of Real Estate, Infrastructure / Natural Resources and U.S. TIPS as of April 2020.(3) A blended benchmark comprised of the weightings of each of the investments utilized within the fund of funds vehicle multiplied by their respective benchmarks as of April 2020.(4) Unofficial Benchmark, for comparison purposes only
POLICEMEN AND FIREMEN SURVIVORS' BENEFIT FUNDNet of All Fees and ExpensesPeriods Ending July 31, 2021
Compound, annualized returns

Shawn T. Wooden
Treasurer
S ta te o f C o nne c t i cut O ff i c e of t he T r e a sur e r
Darrell V. Hill
Deputy Treasurer
September 3, 2021
Members of the Investment Advisory Council (“IAC”)
Re: Consideration of Finalists for the Domestic Equity Fund (“DEF”) Small Capitalization
Manager Search
Dear Fellow IAC Member:
At the September 8, 2021 meeting of the IAC, I will present five firms for the DEF small capitalization investment manager assignment for the Connecticut Retirement Plans and Trust Funds (the “CRPTF”): Ariel Investments, Channing Capital Management, Lord Abbett, Riverbridge Partners and Wellington Management Company. This is the culmination of a competitive search process, conducted through a Request for Proposal process as outlined and
reviewed by the IAC at the December 9, 2020 meeting.
At the upcoming meeting, I will review the proposed restructure of the DEF portfolio which focuses on creating a more balanced alignment with the inclusion of small capitalization strategies,
providing the opportunity to achieve stronger risk-adjusted returns going forward. Then we will hear brief presentations from each firm that will provide details on their investment philosophy and strategies in the small capitalization segment of the market.
Attached for your review is a recommendation from Chief Investment Officer, Ted Wright, along with an overview of each firm. I look forward to discussing this with you at the September meeting of the IAC and receiving your feedback on these finalists.
Sincerely,
Shawn T. Wooden State Treasurer
65 Capitol Ave, Hartford, CT 06106-1773, Telephone: (860) 702-3000
An Equal Opportunity Employer
AGENDA ITEM #4

OFFICE OF THE STATE TREASURER
MEMORANDUM DECISION
TO: Shawn T. Wooden, Treasurer
FROM: Ted Wright, Chief Investment Officer
CC: Darrel Hill, Deputy Treasurer
Raynald Leveque, Deputy Chief Investment Officer
Paul Osinloye, Principal Investment Officer
Lyndsey Farris, Principal Investment Officer
Peter Gajowiak, Investment Officer
DATE: August 30, 2021
SUBJECT: Domestic Equity Fund - Small Capitalization Recommendations
Summary
The purpose of this memorandum is to provide the results and recommendation for the Domestic
Equity Fund (“DEF”) Small Capitalization Request for Proposal (“RFP”). The Scope of Services and Project Timeline were presented to the Investment Advisory Committee on December 9, 2020 and the RFP was issued on January 8, 2021 with a submission deadline of February 19, 2021. The RFP was undertaken to reposition the structure of the DEF portfolio by adding a Small
Capitalization segment. The RFP was well received by the institutional marketplace with 80 firms submitting proposals with 112 strategy offerings which were evaluated by Pension Fund Management (“PFM”)
investment professionals with the assistance of the Connecticut Retirement Plans and Trust Funds (the “CRPTF”) general consultant Meketa Investment Group (“Meketa”). PFM and Meketa interviewed nineteen semi-finalist firms from April to June, selecting five firms to be considered for the Small Capitalization (“small-cap”) portion of the DEF. The following memorandum will
provide a proposed framework of the DEF and a recommendation for restructuring of the portfolio, via small capitalization investments, with the objective of improving the diversification and long-term performance of the portfolio.
Recommendation
I recommend the approval of five small-capitalization managers with both growth and value
strategies to be placed on a manager panel or bench. The current DEF is positioned as a core US portfolio. The addition of these new small cap managers will continue to maintain DEF’s core profile given the size of the proposed manager allocations. The US economy has resumed the trend of the longest US economic expansion in history, fully shifting into the mid to late-cycle phase of
the business cycle. The mid to late-cycle phase is an environment that historically tends to benefit growth strategies over value strategies. We will retain the flexibility to allocate to several high -quality managers who favor both value and growth strategies, while maintaining the overall core DEF position. The DEF restructure will result in an initial small cap allocation that includes three of the five recommended small cap managers, in addition to two pre-approved managers for this
market segment.

2
The proposed small capitalization allocation being added to the passive index portion of DEF incorporates an active risk/return profile to a passive-dominant fund and provides additional
diversification benefits, broad small capitalization manager leadership across the economic cycle, and increased alpha potential for the modified DEF. In addition, this proposed allocation presents an opportunity for direct investments with high-quality diverse investment managers.
DEF Overview
The DEF invests primarily in common stocks of U.S. corporations to meet CRPTF asset allocation
guidelines for domestic equities and to achieve a strong, long-term real rate of return above the US inflation rate. Specific to this RFP, including small capitalization DEF investments is designed to generate new sources of risk-adjusted active returns in the portfolio and to provide diversification for CRPTF performance. A full complement of DEF managers is optimum to execute the
investment strategy. The DEF, focused on the U.S. domestic equity market, is benchmarked to the Russell 3000 Index which encompasses the entire capitalization spectrum of the U.S. public market. The DEF’s large
capitalization (“large-cap”) allocation is held in passive indexing strategies, recognizing that this segment of the market is relatively efficient and provides difficulties for active large capitalization managers to consistently outperform their benchmarks. The large capitalization allocation is managed as follows:
• T. Rowe Price - enhanced S&P 500 Index strategy
• Rhumbline Advisers - Russell 1000 Index replication strategy
• Xponance - S&P 500 Index replication strategy The proceeds from previous allocations to two manager-of-manager mandates were invested in two transition funds managed by State Street Global Advisers (“SSGA”) and Northern Trust Asset
Management (“Northern Trust”). SSGA manages a passive small-cap Russell 2000 Index replication strategy and Northern Trust manages a passive combined small/mid-cap Russell 2000 Index/ Russell 2500 Index replication strategy.
The current DEF fund structure (Table 1) is sub-optimal, with an oversized large capitalization bias and no active small capitalization exposure. The inclusion of a revised small capitalization allocation (direct manager investments and Ci3 investments) seeks to address this bias and improve the overall structure of the DEF.
Table 1
Current DEF Manager Allocations as of July 31, 2021
Manager Strategy Amount ($M) Percent
T. Rowe Price Passive S&P 500 $4,279 43%
Rhumbline Passive Russell 1000 $3,826 38%
Xponance Passive S&P 500 $749 7%
State Street Global Advisors Transition Passive Russell 2000 $622 6%
Northern Trust Investment Transition Passive Russell 2000/2500 $511 5%
Total $9,995 100%

3
Request for Proposal Process
Proposals were submitted by 80 firms across 112 strategies (see Tables 2). The RFP respondents were assessed from both a qualitative and quantitative perspective through a review of their organization, investment team, investment philosophy, investment process, investment performance, ESG implementation, diversity & inclusion initiatives, management fee proposal,
and portfolio fit.
Table 2
DEF Small-Cap RFP Respondents
(Summarized by Strategy)
Following the initial screening, PFM and Meketa interviewed nineteen semi-finalists over a period from April 12, 2021 through June 4, 2021. Consequently, five firms were selected for recommendation to manage DEF’s small-cap allocation (see Table 3).
Table 3
DEF Small-Cap RFP Finalists
Restructure of the DEF
The objective of restructuring the DEF is to achieve stronger long-term returns by utilizing a combination of active management and passive indexing to capitalize on market efficiencies and
inefficiencies in the U.S., bearing in mind the capitalization segments of the Russell 3000 Index benchmark. PFM envisions a two-step process to complete the DEF restructuring: (1) addition of small
capitalization managers (2) subsequent addition of mid capitalization (“mid-cap”) managers. Specific to this RFP, the first step of the process, PFM proposes allocations to active small capitalization managers to complement existing passive large capitalization managers.
Table 6 provided the following page presents the historical DEF performance which reflects a consistent, slight under-performance (on a net-of-fees basis) relative to the index which can be attributed primarily to a dominant large-cap passive allocation.
Firm Name Product Name Investment Style Investment Approach
Lord,Abbett & Co. LLC Small Cap Growth Small Growth Fundamental
Riverbridge Partners, LLC Small Cap Growth Small Growth Fundamental
Ariel Investments, LLC Ariel Small Cap Value Small Value Fundamental
Channing Capital Management, LLC Channing Small-Cap Value Small Value Fundamental
Wellington Management Company LLP Emerging Companies Micro Cap Core Fundamental

4
Table 6 DEF Historical Net Performance
As of June 30, 2021
YTD Fiscal
YTD 1 Year 3 Year 5 Year 7 Year 10 Year
Domestic Equity Fund 15.12% 43.69% 43.69% 18.45% 17.83% 13.84% 14.58%
Russell 3000 Index 15.11% 44.16% 44.16% 18.73% 17.89% 13.95% 14.70%
Excess Return 0.01% -0.47% -0.47% -0.28% -0.06% -0.11% -0.12%
To improve DEF’s long-term performance, we recommend restructuring the portfolio to improve diversification through the addition of a small capitalization allocation. Table 7 details the current market capitalization segments of the Russell 3000 Index and the corresponding segments of the post-CHF period DEF and the proposed portfolio.
Table 7
DEF and Benchmark Market Capitalization Segment Weights
*Via small-cap and smid-cap transition index funds
** PFM is anticipating a subsequent mid-cap RFP to re-allocate a portion of the large-cap segment
***Via direct manager investments and Ci3 program
In 2020, CRPTF’s emerging manager program, the Connecticut Horizon Program (“CHF”), was replaced by a new program, the Connecticut Inclusive Investment Initiative (“Ci3”). This initiative resulted in an updated array of emerging managers participating in the CRPTF funds. In the DEF,
the previous emerging managers, Capital Prospects and Bivium were terminated, to be replaced by the new Ci3 slate of managers. Leading Edge Investment Advisors (“Leading Edge”), proposed for its US small-cap strategy, and Bivium Capital Partners (“Bivium”), proposed for its US micro-cap strategy, both reside on the Ci3 Manager-of-Managers (“MOM”) program manager panel,
having been selected and approved in a prior RFP process. Portfolio Construction
For diversification purposes, the direct investment small capitalization allocation was segmented into the value and growth style categories. In addition, an allocation was created for micro capitalization. Given the wide range of strategy responses in the RFP, there was a focus
on incorporating, where appropriate, the diversification benefits within each style category.
• Small Capitalization Growth – would utilize the diversification benefits between aggressive growth and defensive growth strategies via a single manager in each sub-strategy.
o Lord Abbett & Co. LLC (“Lord Abbett”) - Aggressive o Riverbridge Partners, LLC (“Riverbridge”) - Defensive
• Small Capitalization Value – would utilize the diversification benefits between deep value and traditional value strategies via a single manager in each sub-strategy.
o Ariel Investments, LLC (“Ariel”) – Deep Value o Channing Capital Management, LLC (“Channing”) - Value

5
• Micro Capitalization Core - given the smaller allocation, it was prudent to use a single manager with a core strategy.
o Wellington Management Company, LLP (“Wellington”) – Core Table 8 details the allocations of a proposed small-cap managers composite incorporating the recommended managers. As previously noted, the portfolio is tilted to growth based on our
estimation of current economic conditions.
Table 8
Proposed Small-Cap Manager Composite Allocations
Table 9 illustrates the excess return correlations of each manager.
Table 9
Proposed Small-Cap Managers
Excess Return Correlations vs Russell 2000 Index
April 1, 2016 – June 30, 2021
Each proposed manager’s excess returns have low or, in some instances, negative correlation to each other. This correlation profile illustrates that diversification benefits are available for the
portfolio’s construction. It also indicates that this combination of managers is not over-diversified. Over-diversification would be illustrated by much higher positive correlations between the managers, indicating that their excess returns tend to move together as a group in a tighter manner than those of the proposed managers.
The proposed multi-manager composite generated excess returns in most periods. As detailed in Table 10, for trailing periods, the multi-manager composite generated excess returns over longer timeframes. In addition, on a calendar-year basis, excess returns were generated in each
year.

6
Table 10
Proposed Small-Cap Multi-Manager Composite Historical Performance
As of June 30, 2021
The proposed manager lineup generated a favorable risk-adjusted performance profile. As illustrated in Table 11, the multi-manager composite provided the following attractive characteristics:
• outperformance over the common period of the managers
• the majority of periods (94%) were above index
• lower risk than the index (standard deviation and downside deviation)
• low tracking error, beta < 1 for an active allocation
• favorable up/down capture profile - 108% upside, 78% downside
• favorable risk-adjusted performance metrics - alpha, Sharpe Ratio, Information Ratio
Table 11
Proposed Small-Cap Multi-Manager Composite
Common Period Returns and Risk Statistics (gross of fees)
April 1, 2016 – June 30, 2021
Table 12 illustrates the consistent nature of the composite portfolio ’s excess return:
• Over the trailing period, the composite portfolio outperformed the Russell 2000 index
in 94% of rolling one-year periods.
Composite Russell 2000 Relative Returns
(%) (%) (%)
Trailing Period Returns (%):
YTD 12.0 17.5 -5.5
1 Year 60.9 62.0 -1.1
3 Year 24.2 13.5 10.7
5 Year 25.6 16.5 9.1
Since inception (4/2016) 25.2 16.4 8.8
Calendar Year Returns (%):
2020 52.2 20.0 32.2
2019 29.8 25.5 4.3
2018 0.7 -11.0 11.7
2017 23.5 14.6 8.9

7
• The average small cap core strategy1 outperformed the index in 50% of rolling one-year periods over that time.
1 Peer group: eVestment US Small Cap Core Equity universe
Table 12
Proposed Small-Cap Multi-Manager Composite
One-Year Rolling Excess Return* vs Russell 2000 Index
(Common Period April 2016 - June 2021)
*Gross of fees
The recommended managers have a history of generating excess returns, as evidenced in Table
13. Evaluation of the composite during rolling multi-year periods (Table 14) indicated:
• Rolling one-year time periods between 2016 and 2021 - the composite outperformed during 94 of the 100 time periods, generating average annualized excess returns of 11.1%.
• Rolling three-year time periods between 2016 and 2021 - the composite outperformed
during all 28 of the 28 time periods, generating average annualized excess returns of 11.1%.
Table 13 Proposed Managers
Rolling Three-Year Excess Returns vs. Russell 2000 Index
Rolling Three-Year Periods as of June 2021
Total
Periods Periods
Outperformed (%) Average
Ann.
Excess Return
Max Min Range
Ariel 418 235 56% 2.8% 28.8% -11.4% 40.2%
Channing 145 89 61% 0.3% 4.5% -5.0% 9.5%
Lord Abbett 379 235 62% 3.1% 25.8% -9.3% 35.1%
Riverbridge 361 256 71% 3.9% 24.3% -10.8% 35.1%
Wellington 379 260 69% 2.5% 16.4% -6.3% 22.7%
Bivium 67 45 67% 1.2% 7.6% -2.3% 9.9%
Leading Edge 28 28 100% 7.5% 10.7% 4.8% 5.9%

8
Table 14
Proposed Small-Cap Multi-Manager Composite
Rolling Period Excess Returns vs. Russell 2000
Index April 2016 to June 2021
Total Periods
Periods Outperformed
(%) Average Ann. Excess Return
Max Min Range
1-Year 52 49 94.2% 11.09% 32.0% -1.3% 33.3%
3-Year 28 28 100% 11.05% 15.4% 7.1% 8.3%
Portfolio construction, utilizing the Aapryl analytical software, positioned the entire small cap manager allocation (recommended small cap managers and Ci3 MOMs - Leading Edge and Bivium) along the 4 phases of a typical economic cycle (Figure 1). This manager mapping was based on the strategy and performance profile of each manager and indicates the period in the
economic cycle where each manager would be expected to maximize the impact of its strategy.
In Figure 1, the profile for the proposed small-cap managers and Ci3 MOMs illustrates that this diverse collection of managers is positioned to provide benefits across the breadth of the
economic cycle.
Figure 1
Proposed Small Cap Managers*
Cyclical Manager Positioning
Ariel
Channing
Leading Edge
Lord, Abbett
Riverbridge
Bivium & Wellington

9
Figure 2 illustrates the manager positioning of the DEF after the inclusion of the proposed small-cap managers and Ci3 MOMs. Note the potential for a wider swath of active managers to be performance enhancers across the economic cycle, compared to the relatively narrow footprint
of the large-cap passive allocation (T. Rowe Price, Rhumbline and Xponance) in the Mid-Cycle phase. This modified version of DEF presents a scenario where, in each phase of the economic cycle, it is expected that at least one active manager is positioned to maximize the impact of its performance.
Figure 2
Domestic Equity Fund (including small cap managers) Cyclical Manager Positioning
Ariel
Channing
Leading Edge
Lord, Abbett
Riverbridge
T. Rowe Price Rhumbline Xponance
Wellington Bivium

10
Proposed Portfolio Structure
The current DEF is positioned as a core US portfolio. The addition of these new small cap managers will continue to maintain DEF’s core profile given the size of the proposed manager allocations. The US economy has resumed the trend of the longest US economic expansion in history, fully shifting into the mid to late-cycle phase of the business cycle. The mid to late-
cycle phase is an environment that historically tends to benefit growth strategies over value strategies. We will retain the flexibility to allocate to several high-quality managers who favor both value and growth strategies, while maintaining the overall core DEF position. The DEF restructure will result in an initial small cap allocation that includes th ree of the five
recommended small cap managers, in addition to two pre-approved managers for this market segment. Table 15 summarizes the proposed initial DEF portfolio structure including the proposed small-
cap managers.
Table 15
Proposed DEF Manager Structure
Strategy/Manager DEF Manager Status Amount ($M) Percent
Large Cap Core (Passive)
T. Rowe Price Existing 4,279 43%
Rhumbline Existing 3,826 38%
Xponance Existing 749 7%
Small Cap Growth
Leading Edge (Ci3) Existing 200 2%
Lord, Abbett New 180 2%
Riverbridge New 180 2%
Small Cap Value
Ariel New 0 0%
Channing New 0 0%
Micro Cap Core
Bivium (Ci3) Existing 50 1%
Wellington New 50 1%
Small Cap Transition Fund State Street Global Advisers 481 5%
TOTAL 9,995 100% * Based on July 31, 2021. Small-cap allocation might not total 10% due to rounding.
Manager Summaries
Manager summaries are provided on the following pages which review each firm’s
organization, investment team, investment philosophy, investment process, investment performance, ESG implementation, diversity & inclusion initiatives, and management fee proposal. Additionally, Table 17 provides summary information on the recommended firms and their portfolio characteristics.

11
Table 17
Manager Overviews
Lord Abbett Riverbridge Russell 2000 Firm Location Jersey City, NJ Minneapolis, MN Firm Inception 1929 1987
Ownership Structure 100% Employees 49% Employees 51% Northill Capital
(passive investor)
Strategy Name Small Cap Growth Small Cap Growth
Strategy Style Growth Growth Strategy Inception 1987 1988
AUM-Firm $234.5B $13.4B AUM-Strategy $5.9B $3.5B
Trailing P/E Ratio 33.2x 42.5x 18.7x Price/Book Value Ratio 6.7x 5.9x 2.5x
Wtd. Average Market Cap $5.7B $5.5B $3.7B Median Market Cap $4.5B $4.7B $1.1B
Typical Holdings 90-110 50 2,056 Expected Annual Turnover 100-200% 15-20% NA
Top 3 Sector Weightings Healthcare 30% Tech 35% Healthcare 19% Tech 25% Healthcare 24% Industrials 16%
Consumer Disc.19% Consumer Disc. 17% Financials 16% Market Cap Weightings
>$5billion 49.1% 50.2% 22.2% $2-5 billion 42.4% 34.5% 46.9%
<$2 billion 7.1% 10.8% 30.1% % Portfolio in Top 10 Holdings 18.3% 32.7% 4.2%
Ariel Channing Wellington Russell 2000
Firm Location Chicago, IL Chicago, IL Boston, MA
Firm Inception 1983 2003 1928 Ownership Structure 93% Employees.
7% outside shareholders.
100% Employees 100% Employees
Strategy Name Small Cap Value Small Cap Value Emerging Companies
Strategy Style Value Value Core Strategy Inception 1983 2006 1984
AUM-Firm $16.2B $3.0B $13T AUM-Strategy $1.7B $2.1B $1.1B
Trailing P/E Ratio 22.6x 19.4x 15.1x 18.7x Price/Book Value Ratio 2.4x 2.3x 2.0x 2.5x
Wtd. Average Market Cap $5.9B $4.0B $1.7B $3.7B Median Market Cap $4.5B $3.3B $1.0B $1.1B
Typical Holdings 40 35-45 75-150 2,056 Expected Annual Turnover 25% 50% 30-50% NA
Top 3 Sector Weightings Industrials 33% Financials 24% Industrials 28% Healthcare 19% Consumer Disc. 17% Industrials 20% Financials 24% Industrials 16%
Financials 14% Consumer Disc. 18% Technology 17% Financials 16% Market Cap Weightings
>$5 billion 51.2% 28.9% 0.0% 22.2% $2-5 billion 25.8% 51.2% 13.8% 46.9%
<$2 billion 21.5% 17% 86.2% 30.1% % Portfolio in Top 10 Holdings 43% 29.2% 29.3% 4.2%

12
LORD ABBETT
Organization
Founded in 1929, Lord Abbett became an independent partnership in 1948 and transitioned to a limited liability company in July of 2002. The firm is 100% owned by approximately 50 partners,
all of whom are in senior management, and retired employees or members of their family. Non-employees are limited partners. Lord Abbett’s total AUM was $224 billion as of 12/31/20. The firm manages a wide range of fixed
income and equity products. Approximately 83% of total assets were in taxable and tax-free fixed income strategies. The remaining 13% was in equity assets spread among 18 domestic value, domestic growth, and global⁄international equity strategies.
At the end of 2020, the innovation growth equity team managed four growth strategies with $15 billion in AUM. These products included micro, small, all-cap and concentrated all-cap. $5.2 billion was in the small-cap growth portfolio.
Lord Abbett’s employee base is 67% male and 33% female. The firm is 73% white, 4% black, 4% Hispanic, 19% Asian, and 2% multi-category. Investment Team
The 8-person Innovation Growth Equity team consists of three PMs, two PM/analysts and three analysts. Two portfolio managers who oversee the firm’s convertible securities strategy are also
part of this team. Tom O'Halloran and Matt DeCicco, both of whom are partners and portfolio managers, lead the team. Mr. O’Halloran joined Lord Abbett in 2001. He took over the Small Cap Growth portfolio
in 2003. Matt DeCicco, who joined Lord Abbett in 2002 as a junior analyst, became a PM in 2017 and a partner in 2020. He was named Director of Equities in 2019 when the firm disbanded its central
research group and moved to three product focused investment teams. The separate Innovation Growth Equity team has always existed. That model was replicated with the creation of three other equity teams. Mr. DeCicco oversees all the analysts on the Innovation team, as well as the PMs of the three teams.
Mr. DeCicco and one other PM, Ben Ebel, also do analytical work. Mr. DeCicco has followed a number of sectors, most recently health care. In managing the portfolio, Mr. O'Halloran defers to Mr. DeCicco when it comes to health care stocks. For technology investments, the roles are
reversed. Mr. Ebel covers the technology and telecomm sectors. The third PM is a Certified Market Technician (CMT). He provides a technical viewpoint on all stocks.
The two PM/analysts and three analysts on the team specialize by sector. As part of the reorganization two years ago, two new analysts were added to the Innovation Growth team. These two analysts cover biotech, consumer staples, and health care.

13
Investment Philosophy
The Lord Abbett Innovation team are aggressive growth investors. They believe that the market persistently underestimates the growth and return potential of highly transformative companies. Based on their experience, however, they recognize that superior growth companies do not always make great investments, and that successful growth investing requires the ability to make this
critical distinction. They focus on identifying innovative companies whose growth prospects are underestimated by the market. The portfolio managers invest in four categories of growth. These include secular, cyclical, stable,
and defensive growth. In addition to fundamental analysis, technical analysis is integral to their approach. The PMs want to see proof that there is "quantifiable operating momentum" combined with stock price
momentum. Exceeding expectations in terms of growth drivers, and positive sales and earnings estimate revisions, are important factors that make stocks attractive.
The PMs are not second derivative investors and will not necessarily sell a stock if the growth rate decelerates. A growth deceleration that is greater than expectations can sometimes be positive. Bottom-up fundamental research accounts for an estimated 80% of the investment process. 20%
is a top down assessment of macro factors, industry conditions, and technical market behavior. Investment Process
From a fundamental perspective, the team looks for companies with "exceptional business models", "competent and credible management", "sustainable competitive advantages," and "favorable industry conditions".
The group screens the universe of stocks with market capitalizations in the range of the Russell 2000 Index for high, sustainable revenue growth, conservative capital structures, and compelling gross margins. They also look for operating and price momentum.
The analysts perform due diligence on attractive candidates. Due diligence entails determining the quality of the company’s business model, sizing the company’s market opportunity and identifying the economic forces that will shape its future direction, assessing the company’s competitive
position and evaluating management. In addition to high revenue growth and strong margins, they look for growth drivers exceeding expectations, and positive sales and earnings estimate revisions. The team builds financial models for all investment candidates.
The underlying stocks of these high growth companies must also have favorable absolute and relative price momentum. The PMs will evaluate shifts in momentum, moving averages, relative strength, and price⁄volume metrics. All stocks receive a technical rating. Every buy and sell decision is "informed" by technical analysis.
The risk-reward profile of each stock influences the conviction level of the PM team, which in turn determines position sizes. The largest positions in the portfolio are generally around 2 %. The portfolio consists of ~90 to 110 stocks.
The investment team monitors short-term company developments. The PMs are quick to sell if fundamentals deviate from expectations or price momentum deteriorates. Stocks may also be sold

14
to ensure adequate portfolio diversification. Annual portfolio turnover has historically been between 100% and 200%.
Performance
Table 1
Trailing Period Returns (%, gross of fees)
As of March 31, 2021
1 Year 3 Year 5 Year 7 Year 10 Year
Lord Abbett 113.4 32.6 29.1 17.2 17.3
Russell 2000 Growth 90.2 17.2 18.6 12.8 13.0
Russell 2000 Index 94.8 14.8 16.4 11.0 11.7
Table 2
Calendar Year Returns (%, gross of fees)
As of March 31, 2021
2020 2019 2018 2017 2016 2015 2014 2013 2012 2011
Lord Abbett 74.3 33.1 6.0 31.1 -1.7 -8.0 4.3 58.8 11.6 -0.6
Russell 2000 Growth 34.6 28.5 -9.3 22.2 11.3 -1.4 5.6 43.3 14.6 -2.9
Russell 2000 Index 20.0 25.5 -11.0 14.6 21.3 -4.4 4.9 38.8 16.3 -4.2
Management Fee
Table 3
Fee Schedule Mandate Size ($M)
Estimated Effective Fee
Peer Group Percentile Ranking
0.65% on the first $50M, 0.60% on the next $50M, 0.58% thereafter
180 0.61% 6
Review of Notices of Legal Proceedings (provided by Legal)
In its disclosure to the Office of the Treasurer, Lord, Abbett & Co. (“Lord Abbett”), states (i) it
has no material legal or non-routine regulatory matters, (ii) no material claims under its fidelity, fiduciary or E&O insurance policies, and (iii) no ongoing internal investigations to report. Comments to Contract Terms:
With respect to the State’s contract, Lord Abbett would seek to modify the insurance coverage to that currently maintained by the company. Lord Abbett would propose to qualify its indemnification obligations in the standard contract to be limited to liabilities resulting directly from the company’s negligent actions and clarify that it would not be liable for damages caused
by negligent acts of third parties.

15
Compliance Summary1 (provided by Compliance)
I. Review of Required Legal and Policy Attachments
LORD, ABBETT & CO. LLC (“Lord Abbett”) a New Jersey-based firm, completed all required legal and policy attachments. It disclosed no third-party fees, campaign
contributions, known conflicts or gifts. Its disclosure of legal/regulatory proceedings is being reviewed by the Legal Unit.
II. Workforce Diversity
As of December 2020, Lord Abbett employed 742, 5 less than the 747 employed in December 2018. The firm identified 8 women and 4 minorities as Executive/Senior Level Officials and Managers, i.e., serving at the senior-most level. Over the past 3 years, 37
women and 20 minorities were promoted within the ranks of professionals or managers. Commitment and Plans to Further Enhance Diversity
Lord Abbett is committed to diversity and inclusion (D&I) in the workplace. In 2019 the
firm launched a comprehensive D&I strategy focused on initiatives including, attracting, developing and retaining a more diverse talent pipeline. The firm has a 5-year D&I goal of exceeding the asset management industry’s average for representation of Asian, Black, Disabled, Hispanic, Latino, LGBTQ+, Military, and Women employees. Since April 2018
the firm has experienced a significant increase in the representation of diversity in senior positions, notably at the Partnership and Managing Director levels. However, an additional goal is to obtain 30% diversity within the Partnership and Managing Director levels. D&I progress to date includes expansion of external recruiting partnerships to ensure a more
diverse set of candidates and working with managers to become more inclusive in candidate assessments. Workforce Statistics
For Executive/Senior Level Officials and Managers:
• Women held 15% (8 of 52) of these positions in December 2020, up from
13% (7 of 54) in December 2019 but down from 17% (1 of 6) in December 2018.
• Minorities held 7.69% (4 of 52) (1.92% Asian, 3.85% Hispanic and 1.92% Black) of these positions in December 2020, up from 7.41% (4 of 54)
(1.85% Asian, 3.7% Hispanic and 1.85% Black) held in December 2019, and 0% (0 of 6) in December 2018.
At the Management Level overall:
• Women held 29% of these positions in both December 2020 (42 of 145) and
December 2019 (40 of 138), down from 30% (31 of 102) in December 2018. • Minorities held 15.17% (22 of 145) (8.97% Asian, 0.69% Hispanic, 2.76%
Black and 2.76% Two or More Races) of these positions in December 2020, slightly down from 15.22% (21 of 138) (8.7% Asian, 3.62% Hispanic,
1.45% Black and 1.45% Two or More Races) in December 2019, and down from 16.67% (17 of 102) (13.73% Asian, 0.98% Hispanic and 1.96% Black) in December 2018.
At the Professional Level:
1 The Treasury Unit responsible for reviewing Lord Abbett’s ESG submission will prepare a separate report.

16
• Women held 30% (166 of 559) of these positions in December 2020, down from 34% (209 of 619) in December 2019 but up from 28% (168 of 606) in December 2018.
• Minorities held 29.7% (166 of 559) (22.18% Asian, 4.29% Hispanic, 2.86% Black and 0.36% Two or More Races) of these positions in December 2020, down from 36.19% (224 of 619) (22,46% Asian, 10.34% Hispanic, 3.07% Black and 0.32% Two or More Races) in December 2019, and 31.52% (191
of 606) (23.6% Asian, 4.13% Hispanic, 3.47% Black, 0.17% Two or More Races, and 0.17% American Indian or Alaskan Native) in December 2018.
Company-Wide:
• Women held 33% (242 of 742) of these positions in December 2020, down
from 36% (293 of 806) in December 2019 but up from 31% (229 of 747) in December 2018.
• Minorities held 27.36% (203 of 742) (18.6% Asian, 8.77 Hispanic, 8.77% Black and 1.21% Two or More Races) of these positions in December 2020,
down from 33.13% (267 of 806) (19.6% Asian, 8.81% Hispanic, 3.72% Black and 0.99% Two or More Races) in December 2019, and 29.59% (221 of 747) (21.15% Asian, 4.15% Hispanic, 4.02% Black, 0.13% Two or More Races, and 0.13% American Indian or Alaskan Native) in December 2018.
III. Corporate Citizenship
Charitable Giving:
Lord Abbett is committed to advancing the communities in which “we live and work” through engagement, volunteerism, and financial support. Its focus is on four areas: education, environment, health and wellness, and people. In response to the Covid-19 pandemic the firm donated $250,000 to the Red Cross specifically aimed at relief efforts.
In addition, the firm donated $250,000 to Mayor Fulop’s Jersey City Local Relief Fund which is working with local community partners to support small businesses and nonprofits in Jersey City. The firm encourages employees to participate in various activities sponsored by the organization. In 2019, 86 Lord Abbett volunteers worked on building homes in New
Jersey in partnership with Habitat for Humanity. The firm also allows employees flexibility in work schedules to accommodate participation in initiatives which may not be sponsored by the firm. It has a gift matching program which has been in place for more than 20 years. In 2019 the firm hosted an investment day for a group of students and teachers from North
Haven High School in Connecticut.
Internships/Scholarships: Lord Abbett partners with organizations such as Year Up. The firm also sponsors the Women in Finance Network which provides women with networking and mentoring opportunities. The firm does not track demographics of participants in these initiatives at
this time, but these initiatives are part of the firm's D&I strategy and typically benefit women, minorities or both. The firm recently created the Lord Abbett Diversity Scholarship at the University of California Irvine School of Law. This gift will provide a 3-year scholarship totaling $20,000 to a qualified first-year student.
Procurement: Lord Abbett does not currently have a formal written procurement policy however, its focus on diversity has led to diverse business relationships. For example in 2019 the firm
traded over $1.1 billion dollars in fixed income securities with minority-owned brokers.

17
Environmental, Social, Governance Analysis (“ESG”)
Lord Abbett described a detailed integration of ESG into its investment processes. The firm is a signatory of the UN PRI, and recently joined the Climate Action 100+ and Ceres Investor Network. Their Global Corporate Citizenship Committee in tandem with their Investment Stewardship Council, are responsible for their ESG policies, research, and practices. In addition to offering
internal and external training opportunities on ESG issues, the firm utilizes Sustainalytics for ESG research, risk scores, and analysis in conjunction with data from MSCI and Bloomberg. The firm does not have a policy on investments with civilian firearms manufacturers or retailers.

18
RIVERBRIDGE
Organization
Mark Thompson and John Wilkie founded Riverbridge in 1987. Prior to starting the firm, Messrs. Thompson and Wilkie had co-managed the New Dimensions fund at IDS. Mr. Wilkie retired from
Riverbridge in 1992 and left the investment business. Mr. Thompson is currently Riverbridge’s Chief Manager and CIO. Riverbridge had $12.6 billion in AUM as of 12⁄31⁄20. The firm manages eight growth strategies
using the same investment approach. Most of the assets are in the all-cap growth ($4.8 billion), small-cap growth ($3.7 billion), and smid-cap growth ($3.5 billion) products. The firm is 49% owned by 24 employees. London-based Northill Capital, a passive investor, holds
51% of the equity. Northill is a source of perpetual capital for boutique asset managers. They support the long-term stability and independence of the managers in which they invest. Northill initially purchased 59% of Riverbridge in 2012. Their ownership has been reduced over time, as stock has been recycled to Riverbridge employees. Northill is not involved in the day -to-day
management of Riverbridge. Investment Team
The Riverbridge investment team consists of seven individuals. Mark Thompson and Rick Moulton are the "lead portfolio managers" on the small cap growth strategy. The lead portfolio managers are responsible for the portfolio construction process, monitoring the strategy's
adherence to the firm's investment and risk disciplines, and ensuring the research pipeline remains robust and diverse. They do not recommend stocks or put names in the portfolio. The rest of the investment team consists of five portfolio managers. All the PMs have between
eight and eleven years of investment experience and have been at the firm for at least eight years. The team has not had any turnover since 2012. Riverbridge does not believe in the specialist model. The PMs are all generalists. They are also
analysts and do all the investment research. This group of five PMs are responsible for adding and removing stocks from the portfolio. Members of the Riverbridge investment team have a substantial portion of their wealth invested
in Riverbridge strategies, Riverbridge portfolio stocks and in the equity of Riverbridge partners.
Investment Philosophy
Riverbridge is a high-quality growth manager. They define high quality as companies that have the ability to sustain high returns on invested capital (ROIC). If a company is able to sustain a high ROIC, they believe it is indicative of a strong market position. Companies must be able to re -invest
at high rates in order to maintain a high ROIC. In addition to a high ROIC, the team looks for strong management, high unit growth, dominant market position and conservative accounting practices. Excluded from consideration are
companies that do not have the ability to finance their own growth. The team will only invest in companies that are profitable at the unit level.

19
The investment team focuses on the long-term earnings power of a company. They believe investors often underestimate the magnitude of a company's earnings power and the sustainability of its growth.
Riverbridge has a long-term investment horizon. They capture the market inefficiency of investor emotion, behavior, and time. Short-term market movements cause investors to make emotional and behavioral mistakes. Turnover in the small-cap growth portfolio has averaged 17% during the
last five years. Most of the turnover comes from selling stocks because their market cap moves out of the small-cap range. The average holding period of eight years reflects the team's belief in the power of compounding.
The firm does not require that each company in which it invests has a minimum growth rate. Portfolio holdings range from companies with 30% to 40% revenue growth to high single-digit or low double-digit top-line growers with margin expansion potential that can be levered to double digit earnings growth.
Investment Process
Ideas are sourced in multiple ways. Many come from Riverbridge's "peer review process" which entails researching companies by talking to customers, suppliers, competitors, and employees. The investment team performs on-site company visits and attends industry and user conferences where they can meet multiple layers of company management. In addition to developing a thorough
understanding of the company, the peer review process is intended to avoid "becoming victims to a story told by senior management". Riverbridge assigns two members of the investment team to every holding, the “champion” and
the “devil’s advocate”. The member of the team who leads the fundamental research, and ultimately decides whether to add the company to the portfolio, is the champion for that holding. He or she will discuss the company with the other members of the team throughout the research process, soliciting their input and addressing their concerns. The champion distributes "milestone"
meeting notes throughout the research process to the entire team. The PM will also build a financial model on the company, including sensitivity analysis. Researching a new idea takes at least six months.
After socializing the idea and addressing any concerns that arise, the champion may initiate up to a 1.5% position in the company. A formal presentation is not made to the group, but everyone on the investment team is aware of the merits of the idea.
Only the five PMs who perform research can put an idea in the portfolio. CIO Mark Thompson has the authority to veto an idea, but he rarely exercises that power. After the idea goes into the portfolio, another member of the team is assigned as the devil’s
advocate. Very often, the champion will ask the person they worked with on the idea to take on this role. The devil’s advocate then conducts his or her own research. The role of the devil’s advocate is to develop an independent perspective, challenge the champion’s assumptions, and add to the team’s overall understanding of the company.
In order for a position to increase above the initial 1.5% weighting, the devil’s advocate must concur that the stock merits an increased weighting. The weighting can be increased to 3% if that person likes the idea.

20
Conviction level and valuation determine position sizes. Riverbridge does not set price targets. The largest positions in the portfolio can be 3% to 4%+. The Small Cap Growth portfolio usually holds about 50 stocks.
Positions are most often sold to fund a new, better opportunity. Stocks are also sold when a company's fundamentals deteriorate or the catalysts for their earnings power fail to materialize. Positions are trimmed when they reach 5% of the portfolio. When a company's market cap reaches
$10 billion, it becomes a source of funds.
Performance
Table 1
Trailing Period Returns (%, gross of fees)
As of March 31, 2021
1 Year 3 Year 5 Year 7 Year 10 Year
Riverbridge 88.7 25.9 25.9 17.1 17.0
Russell 2000 Growth 90.2 17.2 18.6 12.8 13.0
Russell 2000 Index 94.8 14.8 16.4 11.0 11.7
Table 2
Calendar Year Returns (%, gross of fees)
As of March 31, 2021
2020 2019 2018 2017 2016 2015 2014 2013 2012 2011
Riverbridge 55.1 28.3 8.2 24.1 14.2 -2.6 -0.3 43.5 17.9 4.1
Russell 2000 Growth 34.6 28.5 -9.3 22.2 11.3 -1.4 5.6 43.3 14.6 -2.9
Russell 2000 Index 20.0 25.5 -11.0 14.6 21.3 -4.4 4.9 38.8 16.3 -4.2
Management Fee
Table 3
Fee Schedule Mandate Size ($M)
Estimated Effective Fee
Peer Group Percentile Ranking
Flat fee: 80bps 180 0.80% 60
Review of Notices of Legal Proceedings (provided by Legal)
In its disclosure to the Office of the Treasurer, Riverbridge Partners (“Riverbridge”), states (i) it has no material legal or non-routine regulatory matters, (ii) no material claims under its fidelity,
fiduciary or E&O insurance policies, and (iii) no ongoing internal investigations to report. Comments to Contract Terms:
Riverbridge does not have any comments to the State’s standard contract and accepts the contract
without amendment.

21
Compliance Summary2 (provided by Compliance)
I. Review of Required Legal and Policy Attachments
RIVERBRIDGE PARTNERS LLC (“Riverbridge”) a Minnesota-based firm, completed all required legal and policy attachments. It disclosed no third-party fees, campaign
contributions, known conflicts, gifts or legal/regulatory proceedings.
II. Workforce Diversity
As of December 2020, Riverbridge employed 39, 2 more than the 37 employed in December 2018. Riverbridge identified 1 woman and 0 minorities as Executive/Senior Level Officials and Managers, i.e., serving at the senior-most level of the firm. For the 3-
year period 2018-2020, 3 women and 1 minority were promoted within the ranks of professionals or managers. Commitment and Plans to Further Enhance Diversity
Riverbridge is committed to cultivating and preserving a culture of diversity and inclusion (D&I). The firm acknowledges at inequalities, injustices, and prejudices exist based on group identity. The firm also acknowledges that it is corporately and individually responsible for breaking down the barriers and biases. The firm's D&I initiatives fall into
three categories: personal and professional development of employees, recruiting and hiring practices, and community engagement. The firm continually seeks to make progress to challenge the status quo and create new initiatives that support efforts towards a more diverse and inclusive workplace.
Workforce Statistics
For Executive/Senior Level Officials and Managers:
• Women held 13% (1 of 8) of these positions in December 2020, down from 14% (1 of 7) in December 2019 but up from 0% (0 of 4) in December 2018.
• Minorities held 0% of these positions in all 3 years reported as follows:
December 2020 (0 of 8), December 2019 (0 of 7), and December 2018 (0 of 4).
At the Management Level overall:
• Women held 9% (1 of 11) of these positions in December 2020, down from
10% (1 of 10) in both December 2019 and December 2018. • Minorities held 9% (1 of 11) (9% Asian) of these positions in December
2020 down from 10% (10% Asian) (1 of 10) held in both December 2019 and December 2018.
At the Professional Level:
• Women held 42% (8 of 19) of these positions in December 2020, down from 50% (8 of 16) in December 2019 but the same 42% (8 of 19) held in December 2018.
• Minorities held 10.53% (2 of 19) (10.53% Asian) of these positions in December 2020, down from 12.5% (2 of 16) (12.5% Asian) in December 2019, but up from 0% (0 of 19) (% Asian) held in December 2018.
Company-Wide:
2 The Treasury Unit responsible for reviewing Riverbridge’s ESG submission will prepare a separate report.

22
• Women held 33% (13 of 39) of these positions in December 2020, down from 38% (14 of 37) in December 2019 but up from 32% (12 of 37) in December 2018.
• Minorities held 10.26% (4 of 39) (10.26% Asian) of these positions in December2020, down slightly from 10.81% (4 of 37) (10.81% Asian) in December 2019, but up from 5.41% (2 of 37) (5.41% Asian) in December 2018.
III. Corporate Citizenship
Charitable Giving:
Riverbridge believes investing in “our community” brings strong returns. It is committed to developing its employees both personally and professionally and to being good stewards of its resources. In 2019 the firm supported 124 different organizations nominated by employees and clients. The majority of the organizations were supported with donations
but for several, event sponsorship and in-kind support was provided. Riverbridge employees can donate to charitable organizations, and can also nominate a qualified organization to receive a $250 contribution. Employees’ contributions are matched dollar-for-dollar up to $1,000 for qualified organizations. In addition, the firm allows each
employee up to 16 hours of paid time off to volunteer during business hours each calendar year. Internships/Scholarships:
Riverbridge is in the process of creating an internship program to help with the education and training of the next generation of workers in the investment management field. It does not currently provide any scholarships.
Procurement: Riverbridge does not currently have a written procurement policy or program to foster business relationships with diverse businesses.
Environmental, Social, Governance Analysis (“ESG”)
Riverbridge described an overall integration of ESG into its investment processes. The firm is a
signatory of the UN PRI. Unlike most other firms that have committees or individuals in charge of their ESG policies and research, Riverbridge subscribes to the notion that ESG factors are at the heart of their investment philosophy and thus are the responsibility of each member of their Investment Team. The firm provides training opportunities to staff and engages in industry
discussions on ESG topics. They rely on industry peers, leaders, and clients for research. Riverbridge emphasized their longstanding history of ESG integration and noted ESG investing is not a recent add-on approach but rather at the core of their practices.
The firm does not have a policy on investments with civilian firearms manufacturers or retailers.

23
ARIEL INVESTMENTS
Organization
Ariel Investments is a Chicago-based investment management firm. The firm was founded in 1983 by John Rogers Jr. Ariel continues to be majority (93%) employee- and minority-owned. The
balance is held by outside shareholders who helped finance the firm’s in itial start-up. The two largest shareholders are Co-CEO and founder, John Rogers, Jr, and Co-CEO and president, Mellody Hobson (74% combined interest).
Ariel offers both domestic and global equity strategies and has expanded its offerings over time. The firm has several flavors of small-cap value, notably one that is more deep value oriented than the other.
The firm has a total of $16.2 billion in assets under management with the small-cap value strategy under consideration comprising $1.7 billion of that total. Investment Team
CIO John Rogers and Kenneth Kuhrt manage the Small Cap Value strategy. Mr. Rogers has managed the strategy since its inception in 1983, the same year he started Ariel. Mr. Rogers started
in the investment industry in 1980 as a stock-broker at William Blair. Mr. Kuhrt joined Ariel in 2004. He started in the investment industry in 2000 as an investment banking analyst at William Blair.
In addition to Messrs. Rogers and Kuhrt, the broader domestic equity investment team comprises four other portfolio managers who oversee various strategies and who also have stock coverage. These PMs average 33 years of investment experience. Additionally, seven analysts who average 11 years of investment experience also support the broader domestic equity efforts. The analyst
team specializes by sector⁄industry. Three of the seven analysts focus solely on ESG research. The investment team has been relatively stable with only one analyst departure in the last five years.
Investment Philosophy
The team seeks out companies with differentiated products⁄services that dominate niches and that
are financially strong with experienced management teams. They want to invest in such companies when they trade at a significant discount of 40% or greater to the team’s intrinsic value estimate. The strategy follows a benchmark-agnostic, absolute value approach with a long-term 3-5 year horizon.
The approach is decidedly contrarian. The PMs focus on buying out-of-favor, misunderstood and ignored stocks. The team will be patient, often waiting years for a stock that has already been thoroughly vetted to fall on hard times and trade at the required valuation threshold. The strategy’s
focus on out-of-favor stocks means that the strategy is somewhat deeper value, and the team is not afraid to invest in companies many other quality-oriented value managers eschew (e.g. Norwegian Cruise Lines amidst the COVID pandemic).
Investment Process
Ariel uses a bottom-up, fundamental approach to security selection. The team sources ideas from
online sources, periodicals, interviews, meetings, etc. About 50% of the ideas come from the portfolio managers, 40% from the analysts, and 10% from other sources.

24
The due diligence focuses on financial strength and relative valuation, the competitive backdrop of the industry, management team experience, and quality of products⁄services. The team considers valuation in relation to earnings. They aim to invest in companies trading at least at a 40% discount
to intrinsic value estimates. Due diligence includes speaking with management and third-party contacts including board members, shareholders, competitors, suppliers, and industry experts. The team triangulates
valuation three ways: a discounted cash flow analysis, a change-of-control-based estimate, and a full trading value. Each is weighted differently. Best-case and worst-case valuation scenarios are considered along with the base case. A devil’s advocate is assigned to each stock to pick apart the thesis and vet the idea. ESG factors are also considered as part of the process.
All senior members vote on an idea, but the Co-PMs make final investment decisions on the strategy.
The portfolio generally contains approximately 40 stocks. Annual turnover averages around 25%. Performance
Table 1
Trailing Period Returns (%, gross of fees)
As of March 31, 2021
1 Year 3 Year 5 Year 7 Year 10 Year
Ariel 104.2 14.5 15.8 10.8 10.8
Russell 2000 Value 97.1 11.6 13.6 8.9 10.1
Russell 2000 Index 94.8 14.8 16.4 11.0 11.7
Table 2
Calendar Year Returns (%, gross of fees)
As of March 31, 2021
2020 2019 2018 2017 2016 2015 2014 2013 2012 2011
Ariel 19.7 27.5 -13.4 15.1 20.7 -10.2 7.3 37.6 21.6 -10.6 Russell 2000 Value 4.6 22.4 -12.9 7.8 31.7 -7.5 4.2 34.5 18.1 -5.5
Russell 2000 Index 20.0 25.5 -11.0 14.6 21.3 -4.4 4.9 38.8 16.3 -4.2
Management Fee
Table 3
Fee Schedule Mandate Size
($M)
Estimated
Effective Fee
Peer Group
Percentile Ranking 1.00% on the first $10M,
0.75% on the next $10M, 0.50% on the next $30M, 0.40% thereafter
TBD TBD TBD

25
Review of Notices of Legal Proceedings (provided by Legal)
Pursuant to its response on Attachment G, Ariel Investments LLC (along with its affiliates, “Ariel”) disclosed the following legal and regulatory matters occurring in the last 5 years: (a) in April 2018, the SEC asked Ariel to voluntarily provide information related to its global and international strategies, which matter was closed without action in June 2019; and (b) Ariel sued
a firm in Naples, Florida operating under the name of Ariel Capital Advisors. Ariel received a favorable verdict in connection with this lawsuit and the defendant was ordered to change its name by April 19, 2017. Additionally, Ariel notes that it filed a D&O/E&O policy claim related to the costs of responding the 2018 SEC inquiry. Ariel confirms that there are no ongoing internal
investigations to report. Ariel disclosed the following changes to its organization or corporate structure in the past two years: Mellody Hobson was promoted to Co-CEO in July 2019 and became a controlling
shareholder of Ariel. In February 2021, Ariel Alternatives LLC was created as an affiliate to Ariel. Ariel affirmed that it has adequate internal investigation procedures.
Comments to Contract Terms:
In connection with the Treasurer’s standard form of investment management agreement, Ariel has proposed various changes, none of which at this stage appear to be insurmountable for contracting purposes but will require negotiation.
Compliance Summary3 (provided by Compliance)
I. Review of Required Legal and Policy Attachments
ARIEL INVESTMENTS, LL (“Ariel”) a Chicago Illinois-based, minority (Black)-owned firm4, completed all required legal and policy attachments. Ariel disclosed no third-party fees, campaign contributions, known conflicts or gifts. Its disclosure of legal/regulatory proceedings is being reviewed by the Legal Unit.
II. Workforce Diversity
As of December 2020, Ariel employed 103, 2 more than the 101 employed in December
2018. Ariel identified 13 women and 10 minorities as Executive/Senior Level Officials and Managers, i.e., serving at the senior-most level of the firm. For the 3-year period 2018-2020, 5 women and/or minorities were promoted within the ranks of professionals or managers.
Commitment and Plans to Further Enhance Diversity
Ariel was founded in 1983 by an African American male. The firm's mission is to manage
money with the highest expertise and integrity, while creating an environment that includes a broad range of backgrounds, experiences and viewpoints. The minority ownership of the firm is 87%, and 64% of the firm's leadership team are minorities and or women. Women comprise over half of the firm. The co-CEO and President is an African American woman
and prominent global business leader. An additional 13 women hold executive or senior-level positions. In 2002 Ariel co-founded the Black Corporate Directors Conference to ensure the Civil Rights agenda is not forgotten in public company board rooms. In 2018,
3 The Treasury Unit responsible for reviewing Ariel’s ESG submission will prepare a separate report. 4 Not Connecticut certified

26
the firm implemented a firm-wide diversity and inclusion mandate underscoring its commitment to diversity of: employees, purchasing relationships and philanthropic contributions. Ariel's founder supported Illinois legislation to advance diversity on public
company boards. As a result, in 2019 a bill was passed requiring an annual report card from Illinois companies on their diversity efforts. This data will be published by the University of Illinois and will be used to implement “real change”. Ariel has been formally recognized as a minority-owned Business Enterprise certified by the National Minority Business
Council, Inc., Chicago Minority Supplier Development Council, Inc., and the California Utility Supplier Clearinghouse.
Workforce Statistics
For Executive/Senior Level Officials and Managers:
• Women held 48% (13 of 27) of these positions in December 2020, up from 42% (13 of 31) in December 2019 and 43% (12 of 28) in December 2018.
• Minorities held 37.04% (10 of 27) (7.41% Asian and 29.63% Black) of these positions in December 2020, up from 29.03% (9 of 31) (9.68% Asian
and 19.35% Black) in December 2019, and 32.14% (9 of 28) (10.71% Asian and 21.43% Black) in 2018.
At the Management Level overall:
• Women held 57% (26 of 46) of these positions in December 2020, up from
48% held in both December 2019 (24 of 50) and December 2018 (22 of 46). • Minorities held 41.3% (19 of 46) (13.04% Asian and 28.26% Black) of
these positions in December 2020, up from 40% (20 of 50) (12% Asian, 2% Hispanic, and 26% Black) held in December 2019, and the same 41.3% (19
of 46) (13.04% Asian and 28.26% Black) held in 2018. At the Professional Level:
• Women held 50% (20 of 40) of these positions in December 2020, up from 45% (18 of 40) in December 2019 and 47% (17 of 36) in December 2018.
• Minorities held 52.5% (21 of 40) (12.5% Asian, 10% Hispanic, 27.5% Black and 2.5% Two or More Races) of these positions in December 2020, up from 45% (18 of 40) (17.5% Asian, 7.5% Hispanic and 20% Black) in December 2019, but slightly down from 52.78% (19 of 36) (22.22% Asian,
13.89% Hispanic and 16.67% Black) held in 2018. Company-Wide:
• Women held 75% (77 of 103) of these positions in December 2020, up from 71% (71 of 106) in December 2019 and 68% (69 of 101) in December 2018.
• Minorities held 48.54% (50 of 103) (13.59% Asian, 3.88% Hispanic, 30.1% Black and 0.97% Two or More Races) of these positions in December 2020, up from 44.34% (47 of 106) (12.26% Asian, 5.66% Hispanic and 26.42% Black) in December 2019, and 48.51% (49 of 101) (13.86% Asian, 6.93%
Hispanic and 27.72% Black) in 2018.
III. Corporate Citizenship
Charitable Giving: Ariel believes it is its duty to support the neighborhoods in which it does business and where its employees live. The firm has promoted a firm-wide policy of community involvement and civic responsibility. It is committed to among other
areas, education, advancing civil rights, promoting cultural expression and community

27
well-being. Volunteerism by employees is a distinctive attribute of the firm. Financial and in-kind donations are essential for communities and the firm contributes to local and national organizations to the tune of over $1,000,000 annually.
Internships/Scholarships: The Ariel Education Initiative creates educational opportunities for economically disadvantaged youths. In addition to academic offerings, the initiative provides resources
for low-income, inner-city youth which are often otherwise unavailable. In 1991 the Initiative adopted the entire sixth grade class of Shakespeare Elementary School in Chicago and pledged to make college affordable and accessible to each student who graduated from high school. The firm's vice chairman developed the Big Shoulders Stock Market program,
which includes 65 participating inner city Chicago Catholic schools, to educate and involve 8th grade students in managing an actual portfolio. In 1996 the firm launched the Black Investor Survey to compare and contrast the saving and investing behaviors of middle-income black and white Americans. In 2017, the John W. Rogers Junior Internship
Program in Finance was created at the University of Chicago. The goal is to provide students from underrepresented backgrounds with knowledge, understanding and experience in the investment field. Also, in January of 2019, Ariel released FUTURES, a free educational resource available for download. The FUTURES free program guides
students from a basic to an advanced understanding of personal finance, economics, entrepreneurship and investing concepts. Procurement:
Ariel's founder, chairman and CIO meets with department heads to review spend by category, employee diversity data by department, as well as discuss best practices for improvement. Annual spend is reviewed with a view to improve major spend categories, including, gender, ethnicity, veteran and disabled status.
In 2019, 15% of business was conducted with women and minority-owned businesses.
Environmental, Social, Governance Analysis (“ESG”)
Ariel described a thorough integration of ESG into its investment processes. The firm is a signatory of the Carbon Disclosure Project and a member of the SASB Alliance, the Ceres Investor
Network, and the Thirty Percent Coalition. Their ESG committee -- comprised of their Senior Vice President/Director of ESG Investing, an ESG research analyst and a ESG research associate -- oversees ESG policies and research. Ariel conducts quarterly training sessions on ESG issues and relies on third-party research and/or ratings (MSCI, ISS, Bloomberg, etc.) for analysis.
The firm does not have an explicit policy on investments with civilian firearms manufacturers or retailers, but their traditional value strategies avoid corporations whose primary source of revenue is derived from the manufacture of firearms.

28
CHANNING CAPITAL
Organization
Founded in 2003, Channing Capital Management (CCM) is a value manager based in Chicago, IL. Up until recently, two of the firm’s co-founders, CIO Wendell Mackey and Head of Business
Development Rodney Herenton, each owned 50% of the firm. However, on April 1, 2021, all members of the investment team became owners. In total, Channing issued 5% of the shares to the investment team (ex-Mr. Mackey) with a balance of 10% reserved once they achieve items stated in their development goals.
The firm is a value manager and offers four domestic equity strategies and five global equity strategies that are managed by a separate team based in Florida. The domestic equity offerings include small-cap value, small⁄mid-cap value, large-cap value and all-cap value. The large-cap and
all-cap strategies are managed by a separate individual and are managed primarily for a few legacy accounts. Wendell Mackey and his team of four focus on the small-cap value and small⁄mid-cap value.
The firm has a total of $3.0 billion in assets under management with small-cap value comprising $2.1 billion of that total. Investment Team
The small cap value investment team is led by Portfolio Manager Wendell Mackey. He has been the sole decision maker on this strategy since the product’s inception in 2006. Before small cap
was launched, Mr. Mackey worked on the mid cap value strategy from 2003 to 2006. Mid cap was wound down in 2019. Mr. Mackey is also an analyst. He is a generalist, but he gravitates towards financials and
technology. Mr. Mackey started in the investment industry in 1993 and joined Channing in 2003. Prior to joining Channing, he was a managing director at Valenzuela Capital Partners, a Portfolio Manager at Barrett Capital Advisors, and a portfolio manager at NCM Capital Management Group. Mr. Mackey is a CFA charter-holder, and has a BBA from Howard University and MM from the
Kellogg Graduate School of Management at Northwestern University. Mr. Mackey is supported by four analyst⁄PMs. These individuals focus on specific sectors. They started in the investment industry between 1991 and 2006 and are seasoned. In addition to these
two dedicated analysts, Deryck Lampe, CFA, the Portfolio Manager for the large-cap and all-cap strategies, covers energy for all the strategies including small-cap. Mr. Lampe started in the investment industry in 1994. The team has been stable over time.
Investment Philosophy
Channing’s philosophy is best defined as traditional value with a catalyst. They take a contrarian
approach to finding ideas, but this strategy is not deep value. They will purchase stocks of good companies when investors have potentially overreacted and driven the valuation below Channing’s estimate of fair value. They will also research stocks that are not heavily followed and have limited, if any, analyst coverage.
Channing believes that good companies are those with a strong competitive position, solid free cash flow, a healthy balance sheet, and a good management team.
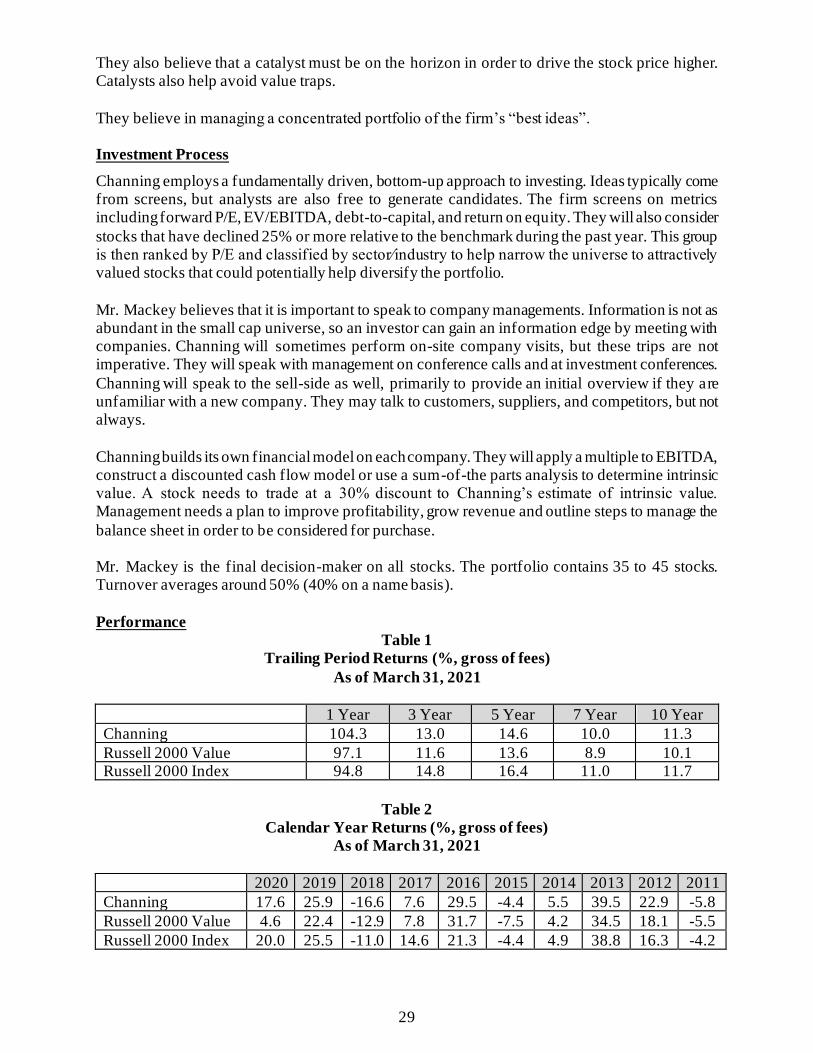
29
They also believe that a catalyst must be on the horizon in order to drive the stock price higher. Catalysts also help avoid value traps.
They believe in managing a concentrated portfolio of the firm’s “best ideas”. Investment Process
Channing employs a fundamentally driven, bottom-up approach to investing. Ideas typically come from screens, but analysts are also free to generate candidates. The firm screens on metrics including forward P/E, EV/EBITDA, debt-to-capital, and return on equity. They will also consider
stocks that have declined 25% or more relative to the benchmark during the past year. This group is then ranked by P/E and classified by sector⁄industry to help narrow the universe to attractively valued stocks that could potentially help diversify the portfolio.
Mr. Mackey believes that it is important to speak to company managements. Information is not as abundant in the small cap universe, so an investor can gain an information edge by meeting with companies. Channing will sometimes perform on-site company visits, but these trips are not imperative. They will speak with management on conference calls and at investment conferences.
Channing will speak to the sell-side as well, primarily to provide an initial overview if they are unfamiliar with a new company. They may talk to customers, suppliers, and competitors, but not always.
Channing builds its own financial model on each company. They will apply a multiple to EBITDA, construct a discounted cash flow model or use a sum-of-the parts analysis to determine intrinsic value. A stock needs to trade at a 30% discount to Channing’s estimate of intrinsic value. Management needs a plan to improve profitability, grow revenue and outline steps to manage the
balance sheet in order to be considered for purchase. Mr. Mackey is the final decision-maker on all stocks. The portfolio contains 35 to 45 stocks. Turnover averages around 50% (40% on a name basis).
Performance
Table 1
Trailing Period Returns (%, gross of fees)
As of March 31, 2021
1 Year 3 Year 5 Year 7 Year 10 Year
Channing 104.3 13.0 14.6 10.0 11.3
Russell 2000 Value 97.1 11.6 13.6 8.9 10.1 Russell 2000 Index 94.8 14.8 16.4 11.0 11.7
Table 2
Calendar Year Returns (%, gross of fees)
As of March 31, 2021
2020 2019 2018 2017 2016 2015 2014 2013 2012 2011
Channing 17.6 25.9 -16.6 7.6 29.5 -4.4 5.5 39.5 22.9 -5.8
Russell 2000 Value 4.6 22.4 -12.9 7.8 31.7 -7.5 4.2 34.5 18.1 -5.5
Russell 2000 Index 20.0 25.5 -11.0 14.6 21.3 -4.4 4.9 38.8 16.3 -4.2

30
Management Fee
Table 3
Fee Schedule Mandate Size ($M)
Estimated Effective Fee
Peer Group Percentile Ranking
0.50% on the first $250M, 0.45% thereafter
TBD TBD TBD
Review of Notices of Legal Proceedings (provided by Legal)
Pursuant to its response on Attachment G, Channing Capital Management LLC (along with its affiliates, “the “Firm”) stated that, in the past five years, (i) there have been no material lawsuits involving the Firm, (ii) the Firm (A) agreed to pay a civil penalty fine of $50 ,000 in 2019 in connection with a determination by the SEC that the Firm violated its own trading policy and (B)
was ordered to cease and desist from committing or causing any further violations, and (iii) there have been no claims on the Firm’s insurance policies. The Firm further confirmed there are no ongoing internal investigations to report, nor are there any recent or pending material changes to its organization or corporate structure.
The Firm affirmed that it has adequate internal investigation procedures pursuant to its Code of Ethics and Employee Handbook.
Comments to Contract Terms:
The Firm accepts the State’s form of investment management agreement in its entirety.
Compliance Summary5 (provided by Compliance)
I. Review of Required Legal and Policy Attachments
CHANNING CAPITAL MANAGEMENT, LLC (“CCM”) a Chicago Illinois-based, minority (Black)-owned firm6, completed all required legal and policy attachments. CCM
disclosed no third-party fees, campaign contributions, known conflicts or gifts. Its disclosure of legal/regulatory proceedings is being reviewed by the Legal Unit.
II. Workforce Diversity
As of December 2020, CCM employed 17, 1 less than the 18 employed in December 2018. CCM identified 0 women and 2 minorities as Executive/Senior Level Officials and Managers, i.e., serving at the senior-most level of the firm. For the 3-year period 2018-
2020, no women or minorities were promoted within the ranks of professionals or managers. Commitment and Plans to Further Enhance Diversity
Diversity is at the core of CCM’s guiding principles. As a minority-owned firm it remains dedicated to providing opportunities to women and minorities and to support diversity and inclusion at all levels. The firm also makes a good faith effort to use third -party vendors who are businesses owned and/ or managed by women and minorities.
5 The Treasury Unit responsible for reviewing CCM’s ESG submission will prepare a separate report. 6 Not Connecticut certified

31
Workforce Statistics
For Executive/Senior Level Officials and Managers:
• Women held 0% of these positions in all 3 years reported as follows: (0 of 2) in December 2020 and December 2019, and (0 of 3) in December 2018.
• Minorities held 100% of these position in all 3 years reported as follows: (2
of 2) (100% Black) in both December 2020 and December 2019, and (3 of 3) (100% Black) in 2018.
At the Management Level overall:
• Women held 0% of these positions in all 3 years reported as follows: (0 of
2) in December 2020 and December 2019, and (0 of 3) in December 2018. • Minorities held 100% of these position in all 3 years reported as follows: (2
of 2) (100% Black) in both December 2020 and December 2019, and (3 of 3) (100% Black) in 2018.
At the Professional Level:
• Women held 31% (4 of 13) of these positions in December 2020, 26% (4 of 14) in December 2019 and 31% (4 of 13) in December 2018.
• Minorities held 45.15% (6 of 13) (7.69% Hispanic and 38.46% Black) of
these positions in December 2020, up from 42.86% (6 of 14) (7.14% Hispanic and 35.71% Black) in December 2019, and 45.15% (6 of 13) (7.69% Hispanic and 38.46% Black) in December 2018.
Company-Wide:
• Women held 35% (6 of 17) of these positions in December 2020 and 33% (6 of 18) in both December 2019 and December 2018.
• Minorities held 58.82% (10 of 17) (11.76% Hispanic and 47.06% Black) of these positions in December 2020, up from 55.56% (10 of 18) (11.11%
Hispanic and 44.44% Black) held in both December 2019 and December 2018.
III. Corporate Citizenship
Charitable Giving: CCM is actively involved with and has sponsored a number of organizations that support diversity and inclusion. Both co-founders of the firm are graduates of historically black
colleges and universities and are actively involved in giving back to their communities. The firm is an active sponsor of the National Association of Securities Professionals and the Asian Association of American Investment Managers. The firm's co-founder and CIO serves on the board of Howard University and recently sponsored a $250,000 donation to
support the creation of a Bloomberg Finance Lab contracting with Bloomberg to finance licenses for 12 terminals at the University. The firm also supports various charitable and nonprofit organizations including, the National Urban League, United Negro College Fund, and Lydia Smith Sickle Cell Foundation.
Internships/Scholarships: The firm is actively engaged with a number HBCUs to recruit interns on an annual basis every summer. 100% of internships have benefited minorities.
Procurement: CCM makes a good faith effort to use third-party vendors that are diverse. Currently the firm is working with 9 service providers “that have representation from brokerage firms
that targets female and or underrepresented minorities”.

32
Environmental, Social, Governance Analysis (“ESG”)
Channing described a general integration of ESG into its investment processes, with a dedicated committee -- including their co-founders -- in charge of ESG policies and research. The firm began the signatory process for the UN PRI and plans to receive approval by end of Q1 this year. The
Channing investment team is focused on education across ESG topics and emphasizes participation in webinars, white paper reviews, and training session to keep abreast of industry trends.
The firm does not have a policy on investments with civilian firearms manufacturers or retailers.

33
WELLINGTON MANAGEMENT
Organization
Wellington Management Company, LLP was founded in 1928 and is a Boston-based, independent, employee-owned firm focused on institutional clients. As of year-end 2020, the firm served as an
investment adviser to over 2,300 clients located in more than 60 countries. Wellington had fourteen offices around the world including in London, Sydney, Singapore, Hong Kong and Tokyo. The firm has been an independent, private partnership since 1979. As of March 31, 2021,
Wellington is owned by 182 partners, all of whom are active in the firm. The firm employs over 2,600 people, including approximately 800 investment professionals. As of March 31, 2021, Wellington managed over $1 trillion in total assets across multiple asset
classes. Equity represents 45% of the firm’s assets. The Emerging Companies strategy had $1.1 billion in AUM. Investment Team
David DuBard was named lead PM on the Emerging Companies strategy in March 2012 when the prior PM was taken off the product for performance reasons.
Mr. DuBard joined Wellington in 1992 as an analyst on the micro-cap team supporting the Emerging Companies strategy and lead PM Binckley Shorts. Prior to joining Wellington, Mr. DuBard was in the research department at Morgan Keegan and Company. He earned his MBA
from the University of Pennsylvania and is a CFA charterholder. Mr. DuBard is supported by three sector-focused analysts who, unlike Wellington’s global industry analysts, are dedicated to Mr. DuBard and the micro-cap strategies. However, Mr. DuBard
and his analysts can leverage Wellington’s approximately 50 global industry analysts as needed. Mr. DuBard covers health care, transportation, banks and specialty finance. Kevin Barry covers industrials, business services, aerospace and defense, and energy. Peter Carpi covers consumer and technology. Don Porter was hired in August 2019 to replace analyst Jason Goins, who left at the
end of 2018 to join the firm’s global impact team. Mr. Porter covers industrials, business services, and materials. By managing the only two micro-cap products offered by Wellington, Mr. DuBard and his team
have the best of both worlds. They have all the benefits of working for a very large, well -established and well-resourced firm, but do not have to deal with any of the mindshare and liquidity headaches that are usually inherent in a firm of Wellington’s size. While the team can leverage Wellington’s analysts, the micro-cap team has very little overlap with the other Wellington small
cap portfolios.
Investment Philosophy
The philosophy is similar to a private equity approach to public markets. Mr. Dubard is essentially a conservative growth investor with a focus on high quality businesses. He generally thinks about companies in terms of valuation on an absolute basis, but he is cognizant of relative value.
Mr. Dubard believes that the efficiency of the market increases considerably as you move up the market cap spectrum. He has a long-term investment horizon and believes that micro-cap companies often carry an illiquidity discount that offers patient investors attractive valuations and

34
a larger universe of potential investments. His ideal scenario is to own companies before they become more visible and reach the “bar of institutional relevance.” He acknowledged that one risk of microcap investing is that the companies are never discovered by other investors.
Investment Process
Ideas are sourced primarily from the 400 to 600 company meetings the team conducts annually. Idea generation is augmented with quantitative screens that incorporate factors based on valuation, profitability, growth and cash flow or quality metrics. The investment team defines their investable universe as the Russell Microcap Index. When they eliminate companies without earnings and⁄or
capital-intensive companies, the result is an investable universe of 500 to 600 companies. The process is iterative. Mr. Dubard and the analysts have ongoing discussions about new ideas. Ideas are generated via company meetings, conferences and field trips, quantitative screens, third-
party sources, and Wellington’s resources. The team seeks to invest in well-capitalized, distinctive niche leaders with a proven management team and a price⁄value disconnect. The analysts conduct very thorough due diligence on all potential investment ideas and will always
meet with or speak to management before purchasing a stock. There is continual discussion between the analysts and PM. When an idea is at an advanced stage, the sponsoring analyst and Mr. Dubard discuss whether to add it the portfolio. The primary valuation metric is EV/EBITDA, but the team will also look at P/E, P/B, free cash flow yield, etc. The analysts drive idea generation
in their areas of coverage, but Mr. Dubard is the ultimate decision maker. The portfolio will hold 75-150 stocks. However, the number of stocks is typically in the 75-100 range.
Performance
Table 1
Trailing Period Returns (%, gross of fees)
As of March 31, 2021
1 Year 3 Year 5 Year 7 Year 10 Year
Wellington 102.8 17.8 18.4 12.9 12.7
Russell Microcap 120.3 16.6 18.1 11.0 12.2 Russell 2000 Index 94.8 14.8 16.4 11.0 11.7
Table 2
Calendar Year Returns (%, gross of fees)
As of March 31, 2021
2020 2019 2018 2017 2016 2015 2014 2013 2012 2011
Wellington 23.7 28.2 -14.0 19.2 23.7 -3.7 7.2 41.9 13.1 -8.4
Russell Microcap 21.0 22.4 -13.1 13.2 20.4 -5.2 3.6 45.6 19.7 -9.3
Russell 2000 Index 20.0 25.5 -11.0 14.6 21.3 -4.4 4.9 38.8 16.3 -4.2

35
Management Fee
Table 3
Fee Schedule Mandate Size ($M)
Estimated Effective
Fee
Peer Group
Percentile Ranking
0.85% on the first $50M, 0.80% on the next $25M, 0.75% thereafter.
50 0.85% 7
Review of Notices of Legal Proceedings (provided by legal)
Pursuant to its response on Attachment G, Wellington Management Company LLP (along with its
affiliates, “the “Firm”) disclosed that from time to time it is involved in litigation in the ordinary course of business, none of which is material with respect to the Firm’s investment management business or its ability to provide advisory services. Additionally, the Firm states that, to the best of its knowledge, none of its investment professionals have been or are currently subject to litigation
that related to his or her investment activities on behalf of the Firm. The Firm notes, however, that it periodically receives inquiries, requests for information and subpoenas from various regulators and governmental entities with regard to its trading activities, securities of companies followed by the Firm, clients of the Firm and industry practices. To the best of its knowledge, the Firm is not
the subject of any such investigation or administrative proceeding that is material to its investment management business or its ability to provide investment advisory services. The Firm states that it has not filed any material insurance claim that would approach coverage limits or constitute a financial burden on its normal operations. During internal counsel’s discussions with the Firm,
representatives confirmed that there are no ongoing material internal investigations to report. The Firm disclosed a number of recent or pending organizational changes including business line changes, the creation of an Enterprise Risk Management Group, and several senior personnel
changes, including a change in CEO and President, effective July 1, 2021 and January 2, 2021, respectively, and a change in the Firm’s Chief Information Officer, effective December 31, 2020. The Firm affirmed that it has adequate internal investigation procedures in place, including as set
forth in the Firm’s Code of Ethics. Comments to Contract Terms:
In connection with the Treasurer’s standard form of investment management agreement, the Firm
requests entering into a contract with terms either the same or substantially similar to the State’s current contract with Wellington. Compliance Summary7 (provided by Compliance)
I. Review of Required Legal and Policy Attachments
WELLINGTON MANAGEMENT COMPANY LLP (“Wellington”) a Boston Massachusetts-based company, completed all required legal and policy attachments. Wellington disclosed no third-party fees, campaign contributions, known conflicts or gifts. Its disclosure of legal/regulatory proceedings is being reviewed by the Legal Unit.
7 The Treasury Unit responsible for reviewing Wellington’s ESG submission will prepare a separate report.

36
II. Workforce Diversity
As of December 20198, Wellington employed 2012, 114 more than the 1898 employed in December 2017. The firm identified 51 women and 13 minorities as Executive/Senior Level Officials and Managers, i.e., serving at the highest level of the firm. Over the 3-year period 2017-2020, Wellington promoted 520 minorities and 731 women within the ranks
of professionals or managers.
Commitment and Plans to Further Enhance Diversity
Diversity and Inclusion are "core to who we are". Wellington believes that a diverse
workforce and inclusive culture are vital to being successful in the asset management business. The firm has created a five-year global diversity and inclusion strategy. Its approach to fostering a diverse and inclusive culture is driven by firm leaders, implemented by managers, supported by employees, and guided by the diversity and inclusion team with
a Director of Global Diversity and Inclusion. The firm has set specific goals and conducts an annual review of quantitative diversity metrics. It has undertaken numerous initiatives including: the Diversity Internship, Early in Career Programs, Historically Black Colleges and Universities, and use of specialized search firms to identify underrepresented talent for
lateral positions. Workforce Statistics
For Executive/Senior Level Officials and Managers:
• Women held 38% (51 of 134) of these positions in 2019, up slightly from 37% (51 of 137) held in 2018, and up from 32% (43 of 134) held in 2017.
• Minorities held 9.7% of these positions (5.97% Asian, 2.99% Hispanic and 0.75% Black) or (13 of 134) in 2019, up slightly from 8.76% (5.84% Asian, 2.19% Hispanic and 0.73% Black) or (12 of 137) held in 2018, and 8.21% (4.48% Asian, 2.24% Hispanic, 0.75 % Black and 0.75% Two or More
Races) or (11 of 134) held in 2017. At the Management Level overall:
• Women held 36% (126 of 351) of these positions in 2019, down from 38% (140 of 372) in 2018, and 37% (120 of 321) in 2017.
• Minorities held 17.09% of these positions (13.39% Asian, 1.42% Hispanic, 1.42% Black, 0.28% American Indian or Alaskan Native and 0.57% Two or More Races) or (60 of 351) in 2019, up from 15.86% (12.9% Asian, 1.88% Hispanic, 0.81% Black and 0.27% American Indian or Alaskan) or
(59 of 372) held in 2018, and 13.08% (10.28% Asian, 1.56% Hispanic, 0.93% Black, and 0.31% Two or More Races) or (42 of 321) held in 2017.
At the Professional Level:
• Women held 36% (541 of 1522) of these positions in 2019, up from 34%
(495 of 1465) in 2018, and 32% (463 of 1427) in 2017. • Minorities held 33.44% of these positions (24.05% Asian, 4.01% Hispanic,
3.61% Black, 0.2% American Indian or Alaskan Native and 1.58% Two or More Races) or (509 of 1522) in 2019, up from 32.29% of these positions
(23.28% Asian, 3.82% Hispanic, 3.75% Black, 0.14% American Indian or Alaskan Native and 1.3% Two or More Races) or (473 of 1465) held in 2018, and 29.57% of these positions (21.86% Asian, 3.01% Hispanic,
8 Wellington reported that 2020 data was not available as of the date of this Report.

37
3.22% Black, 0.21% American Indian or Alaskan Native and 1.26% Two or More Races) or (422 of 1427) held in 2017.
Company-Wide:
• Women held 66% (1335 of 2012) of these positions in 2019, up from 63% (1255 of 1977) in 2018, and 62% (1181 of 1898) in 2017.
• Minorities held 29.77% of these positions (20.87% Asian, 3.78% Hispanic, 3.58% Black, 0.2% American Indian or Alaskan Native and 1.34% Two or
More Races) or (599 of 2012) in 2019, up from 28.43% (19.98% Asian, 3.54% Hispanic, 3.64% Black, 0.2% American Indian or Alaskan Native and 1.06% Two or More Races) or (562 of 1977) held in 2018, and 26.4% of these positions (18.6% Asian, 3.06% Hispanic, 3.32% Black, 0.32%
American Indian or Alaskan Native and 1.37% Two or More Races) or (501 of 1898) held in 2017.
III. Corporate Citizenship
Charitable Giving: At Wellington "we seek to actively support the communities in which we live and work." Wellington Management Foundation and the Wellington Management UK Foundation
support programs and organizations that improve educational opportunities for youth from traditionally underserved and economically challenged communities in the regions where Wellington has offices. The majority of students benefiting from these programs identify as minorities and/or low income and many of these community-based programs are led by
people from within the community or who have similar lived experiences. The Wellington Management Foundation was founded in 1992 as the Wellington Management Company Charitable Fund. It relies on Wellington employees who volunteer their time and talent through service on the Foundation's Advisory Board. In 2020, the US Foundation awarded
more than US $9.5 million in funding to 113 educational organizations in eastern Massachusetts, greater Philadelphia, Chicago, the San Francisco Bay Area, Toronto, Tokyo, Hong Kong, Singapore and Sydney, and to Wellington’s UK Foundation. Wellington has a matching gift program which matches employee donations to registered
non-profit organizations. In response to the covid-19 pandemic beginning in March 2020 the US-based Foundation offered emergency grants of US $25,000 to more than 100 global grantees. Over the course of the year the US Foundation went on to provide an additional $700,000 in funding to organizations working to support remote learning in schools and
programs throughout eastern Massachusetts. Internships/Scholarships: The diversity undergraduate internship program is open to all undergraduate students but
focuses on targeting underrepresented groups in the investment management industry including, but not limited to, women and people of color. The firm also offers a graduate internship program. In addition, the firm supports numerous organizations such as, 100 Women in Finance, Girls Who Invest, and InRoads, to name a few.
Procurement: To the best of its knowledge for the 12 months ending December 31, 2020 Wellington partnered with more than 98 US-based diverse suppliers, with spend of approximately $14.2 million. The suppliers include small businesses, businesses owned by
minorities, women, veterans, individuals with disabilities, and members of the LGBTQ community.

38
Environmental, Social, Governance Analysis (“ESG”)
Wellington described a comprehensive integration of ESG into its investment processes. They have been a signatory of the UN PRI since 2012 and are members of several sustainability-oriented organizations including the International Corporate Governance Network (ICGN), Global Real Estate Sustainability Benchmark (GRESB), Climate Action 100+, Carbon Disclosure Project, and
Ceres Investor Network. The firm relies on their Director of Sustainable Investment, who sits on the UN PRI board, to lead and shape their ESG policies and research. Wellington engages with and provides a multitude of ESG training opportunities, with an emphasis on collaboration. The firm has a clear focus on carbon footprint analysis and board diversity metrics and uses third-party
providers such as MSCI and Sustainalytics for data and benchmarking. The firm does not have a policy on investments with civilian firearms manufacturers or retailers, given their practice of avoiding negative screens across their investment platform.

39
APPENDIX
Table 1
Proposed Managers
Rolling Three-Year Excess Returns vs. Manager-Preferred Benchmark
Rolling Three-Year Periods as of June 2021
Benchmark Total
Periods
Periods
Outperformed
(%) Average
Ann.
Excess
Return
Max Min Range
Lord Abbett Russell 2000 Growth 376 281 75% 4.0% 19.4% -9.8% 29.2%
Riverbridge Russell 2000 Growth 358 264 74% 4.9% 23.7% -7.0% 30.7%
Ariel Russell 2000 Value 421 256 61% 2.0% 14.3% -12.7% 27.0%
Channing Russell 2000 Value 142 113 80% 1.9% 7.4% -3.2% 10.6%
Wellington Russell Microcap 376 175 82% 2.1% 8.4% -4.4% 12.7%
Bivium Russell Microcap 67 61 91% 2.1% 6.2% -0.8% 7.0%
Leading Edge Russell 2000 28 28 100% 7.5% 10.7% 4.8% 5.9%
Impact of a shorter timeframe on analysis of the proposed composite
In the proposed composite (Table 8), Bivium and Leading Edge have shorter track records than the other proposed managers in that composite. This resulted in a common period of April 2016 to June 2021. Given the relative long-term outperformance of the remaining managers, Lord Abbett, Riverbridge and Wellington, to the Russell 2000 benchmark (Table 13), it would stand
to reason that a composite consisting of those three managers, analyzed over a longer-timeframe, would lead to a positive investment narrative. In taking our analysis one step further, we compared a fully diversified composite of the five
recommended managers to the proposed composite listed in Table 8. The managers each have longer track records than the Ci3 managers. The diversified recommended composite utilized equal-weighted growth and value allocations and a micro-cap allocation (Table A8) and was analyzed using a longer common period of July 2006 to June 2021.
Table A8
Diversified Recommended Small-Cap Manager Composite Allocations
Comparisons were made of the relationships in manager correlations, composite performance and risk-adjusted return metrics. Correlations, as outlined in Table A9, for the diversified recommended managers maintain the
same relationships as those in Table 9 for the proposed composite, low or negative correlations.

40
Table A9
Diversified Recommended Small-Cap Managers
Excess Return Correlations vs Russell 2000 Index July 1, 2006 – June 30, 2021
As Table 10 showed for the proposed composite, the diversified recommended composite also generated excess returns in most periods, as detailed in Table A10.
Table A10
Diversified Recommended Small-Cap Multi-Manager Composite Historical Performance
As of June 30, 2021
The risk-adjusted return profile for the diversified recommended composite (Table A11) is
similar to the profile of the proposed composite (Table 11). Table A11 provided the following attractive characteristics:
• outperformance over the common period of the managers
• the majority of periods (57%) were above index
• lower risk than the index (standard deviation and downside deviation)
• reasonable tracking error, beta < 1 for an active allocation
Composite Russell 2000 Relative Returns
(%) (%) (%)
Trailing Period Returns (%):
YTD 12.5 17.5 -5.0
1 Year 60.6 62.0 -1.4
3 Year 20.0 13.5 6.5
5 Year 21.8 16.5 5.3
7 Year 14.5 11.4 3.1
10 Year 15.0 12.3 2.7
Calendar Year Returns (%):
2020 40.2 20.0 20.2
2019 28.7 25.5 3.2
2018 -4.8 -11.0 6.2
2017 19.5 14.6 4.9
2016 16.4 21.3 -4.9
2015 -6.1 -4.4 -1.7
2014 4.4 4.9 -0.5
2013 44.6 38.8 5.8
2012 18.1 16.3 1.8
2011 -3.7 -4.2 0.5
2010 32.8 26.9 5.9
2009 43.5 27.2 16.3
2008 -40.0 -33.8 -6.2
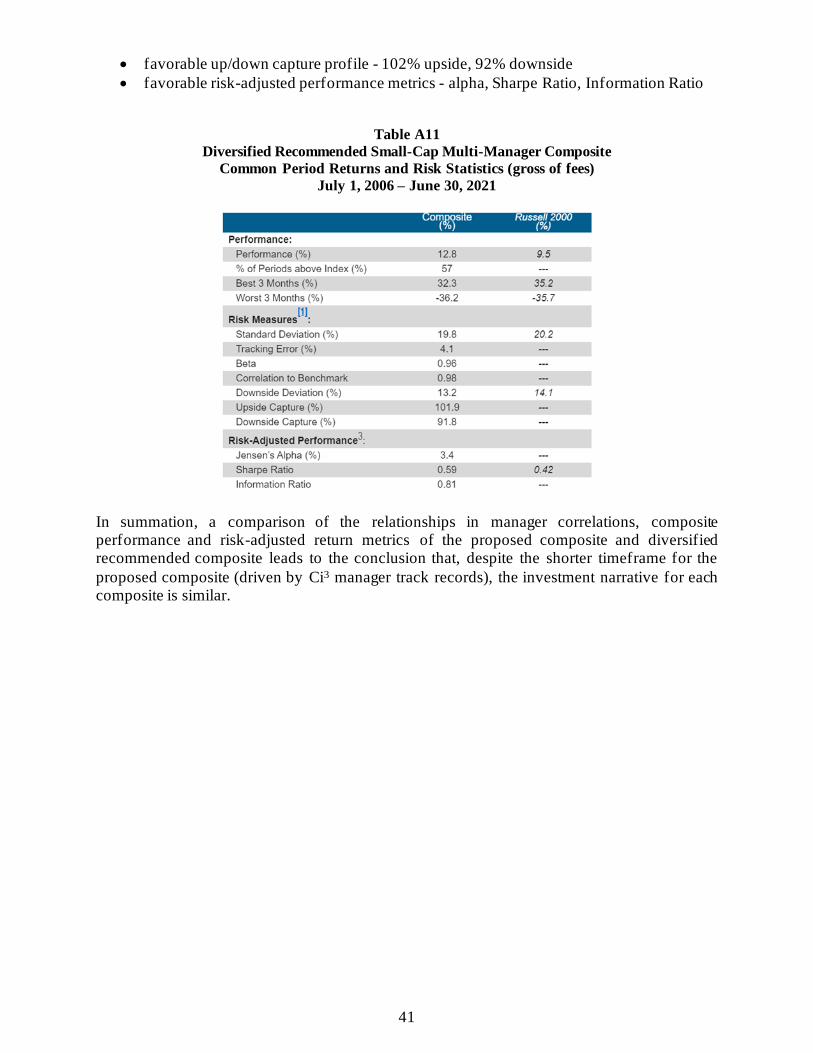
41
• favorable up/down capture profile - 102% upside, 92% downside
• favorable risk-adjusted performance metrics - alpha, Sharpe Ratio, Information Ratio
Table A11
Diversified Recommended Small-Cap Multi-Manager Composite
Common Period Returns and Risk Statistics (gross of fees)
July 1, 2006 – June 30, 2021
In summation, a comparison of the relationships in manager correlations, composite performance and risk-adjusted return metrics of the proposed composite and diversified recommended composite leads to the conclusion that, despite the shorter timeframe for the
proposed composite (driven by Ci3 manager track records), the investment narrative for each composite is similar.

BOSTON CHICAGO LONDON MIAMI NEW YORK PORTLAND SAN DIEGO MEKETA.COM
US Equity Small Cap Finalist Manager Overviews
State of Connecticut Retirement Plans and Trust Funds
September 2021

State of Connecticut Retirement Plans and Trust Funds
Agenda
Agenda
1. Background
2. Microcap Core Manager Overview
3. Small Cap Value Manager Overviews
4. Small Cap Growth Manager Overviews
Page 2 of 56

Background
Page 3 of 56

State of Connecticut Retirement Plans and Trust Funds
Background
Background
On January 8, 2021, the State of Connecticut Retirement Plans and Trust Funds (“CRPTF”) issued a US Small
Capitalization Equity Fund RFP.
As of June 30, 2021, at $10.4 billion, the Domestic Equity Fund represented 23.7% of the overall CRPTF
portfolio.
The CRPTF requested that all respondents submit the RFP by February 19, 2021.
In total, 80 firms responded with 112 strategy offerings, as shown in the table below;
Strategy Micro Small SMID Total
Core 3 18 7 28
Value 4 29 10 43
Growth 4 29 8 41
Total 11 76 25 112
Of the firms that responded, 36 (or 45%) are majority-employee owned. Only 4 (or 5%) are majority-women
and/or minority-employee owned.
50% of the firms provided detail regarding diversity among their workforce.
Of the firms that provided the detail, on average, 14% of executive/senior level positions were held
by women, and 10% were held by minorities.
Page 4 of 56

State of Connecticut Retirement Plans and Trust Funds
Background
Background (continued)
Meketa worked with PFM to narrow down the respondents to 19 semi-finalist managers, and subsequently
met with each of these firms.
Of the 19 semi-finalists, 8 (or 42%) are majority-employee owned, and 2 firms (or 11%) are
majority-women and/or minority employee owned.
Of the semi-finalists who provided the diversity detail, on average 25% and 10% of executive/senior
level positions were held by women and minorities, respectively, at the firms.
Subsequent to the meetings, Meketa and PFM further narrowed the respondents to five finalist managers.
These managers are detailed on the following pages.
Page 5 of 56

State of Connecticut Retirement Plans and Trust Funds
Background
Asset Class Structure Considerations
The combination of the size of the mandate and inherent difficulties for active managers to add value, on
average, combine to present a unique set of challenges.
Given the size of the mandate in scope, allocating to too few managers can prove self-limiting as it narrows
the opportunity towards managers with greater levels of AUM and lesser capacity constraints
(i.e., managers that by design offer lower alpha propositions).
A portfolio design of this nature runs the risk of consisting of “closet index” mandates, which can
drive management fees up without the compensation of higher excess return potential.
A better way to utilize managers includes using a mix of managers with more concentrated portfolios,
higher tracking error, more specific return profiles, and broader portfolio mandates.
In an effort to overcome these challenges as we build this asset class, are to:
Achieve stronger returns from active management by utilizing only managers that are truly
“active.”
Achieve stronger returns per dollar of management fees paid.
Control interim volatility by using a group of complementary strategies.
A variety of portfolio structure options can be considered to satisfy the mandate. While each option is
viable, each carries its own set of pros and cons.
The following pages outline the proposed structure for the small cap US equity allocation within the
Domestic Equity Fund.
Page 6 of 56

State of Connecticut Retirement Plans and Trust Funds
Background
Proposed Asset Class Structure
The proposed structure will include two growth managers, two value managers, and one microcap manager
in addition to the two manager of manager strategies within the Ci3 program.
However, the portfolio will be initially funded with a subset of the managers as outlined in the table
below.
The performance and risk data on the follow pages reflect the allocations in this table.
% of Total
(%)
$ Allocation
($ mm)
Wellington 7.6 50
Riverbridge 27.3 180
Lord Abbett 27.3 180
Bivium 7.6 50
Leading Edge 30.3 200
Total 100.0 660
Page 7 of 56
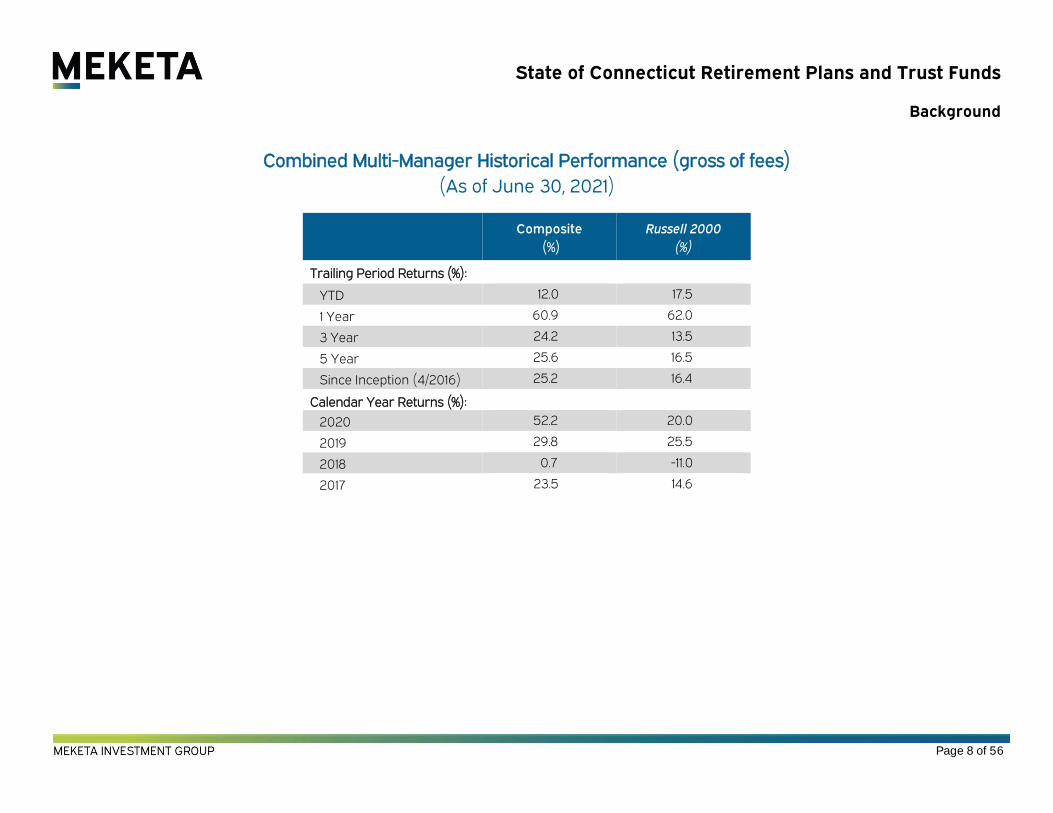
State of Connecticut Retirement Plans and Trust Funds
Background
Combined Multi-Manager Historical Performance (gross of fees)
(As of June 30, 2021)
Composite
(%)
Russell 2000
(%)
Trailing Period Returns (%):
YTD 12.0 17.5
1 Year 60.9 62.0
3 Year 24.2 13.5
5 Year 25.6 16.5
Since Inception (4/2016) 25.2 16.4
Calendar Year Returns (%):
2020 52.2 20.0
2019 29.8 25.5
2018 0.7 -11.0
2017 23.5 14.6
Page 8 of 56

State of Connecticut Retirement Plans and Trust Funds
Background
One-Year Rolling Excess Returns (gross of fees)
(Common Period April 2016-June 2021)
Over the common period, the composite portfolio outperformed the Russell 2000 Core index in 94% of
rolling one-year periods. The average small cap core strategy1 has outperformed the index in 50% of rolling
three-year periods over that time.
1 The peer group is the eVestment US Small Cap Core Equity universe.
-5%
0%
5%
10%
15%
20%
25%
30%
35%
Page 9 of 56

State of Connecticut Retirement Plans and Trust Funds
Background
Common Period Returns and Risk Statistics (gross of fees)
(April 1, 2016 – June 30, 2021)
Composite
(%) Russell 2000
(%)
Performance:
Performance (%) 25.2 16.5
% of One-Year Periods above Index (%) 94 ---
Best 3 Months (%) 36.2 35.2
Worst 3 Months (%) -22.2 -30.6
Risk Measures1:
Standard Deviation (%) 19.6 20.5
Tracking Error (%) 6.6 ---
Beta 0.91 ---
Correlation to Benchmark 0.95 ---
Semi Deviation (%) 20.1 23.7
Upside Capture (%) 107.8 ---
Downside Capture (%) 78.0 ---
Risk-Adjusted Performance2:
Jensen’s Alpha (%) 9.0 ---
Sharpe Ratio 1.23 0.75
Information Ratio 1.33 ---
The composite outperformed the index with less volatility and lower beta, enhancing risk-adjusted returns.
1 The benchmark used for all calculations is the Russell 2000 index.
Page 10 of 56

State of Connecticut Retirement Plans and Trust Funds
Background
Excess Returns Correlation vs Russell 2000 Index
April 30, 2016 – June 30, 2021
Ariel Channing Lord Abbett Riverbridge Wellington Bivium Leading Edge
Ariel 1.00
Channing 0.55 1.00
Lord Abbett -0.35 -0.32 1.00
Riverbridge -0.24 -0.20 0.72 1.00
Wellington 0.09 0.30 -0.14 0.03 1.00
Bivium -0.07 -0.02 -0.16 -0.21 0.17 1.00
Leading Edge -0.04 0.17 0.72 0.65 0.08 0.04 1.00
Page 11 of 56

Microcap Core Manager Overview
Page 12 of 56

State of Connecticut Retirement Plans and Trust Funds
Microcap Core Manager Overview
Investment Manager Overview
Wellington
Firm Location Boston, Massachusetts
Firm Inception 1928
Percent Employee Ownership 100%
Percent Minority Females in Management 9.0%
Strategy Name Emerging Companies
Strategy Inception 1984
Assets Under Management (Strategy) $1.0 billion
Asset Under Management (Firm) $1.4 trillion
Page 13 of 56

State of Connecticut Retirement Plans and Trust Funds
Microcap Core Manager Overview
Wellington Management
Organization
Wellington Management Company, LLP was founded in 1928 and is a Boston based, independent,
employee-owned firm focused on institutional clients. As of year-end 2020, the firm served as an
investment adviser to over 2,300 clients located in more than 60 countries. Wellington had fourteen offices
around the world including in London, Sydney, Singapore, Hong Kong and Tokyo.
The firm has been an independent, private partnership since 1979. As of March 31, 2021, Wellington is owned
by 182 partners, all of whom are active in the firm. The firm employs over 2,600 people, including
approximately 800 investment professionals.
As of June 30, 2021, Wellington managed over $1.4 trillion in total assets across multiple asset classes.
Equity represents 45% of the firm’s assets. The Emerging Companies strategy had $1.0 billion in AUM.
Wellington’s global employee base is 43% male and 57% female. The firm’s US employees are 68% white,
5% black, 4% Hispanic ,21% Asian, and 2% American Indian or Alaska Native, Native Hawaiian or Other Pacific
Islander, or multi-category.
Page 14 of 56

State of Connecticut Retirement Plans and Trust Funds
Microcap Core Manager Overview
Wellington Management
Investment Team
David DuBard was named lead PM on the Emerging Companies strategy in March 2012 when the prior PM
was taken off the product for performance reasons.
Mr. DuBard joined Wellington in 1992 as an analyst on the microcap team supporting the Emerging
Companies strategy and lead PM Binckley Shorts. Prior to joining Wellington, Mr. DuBard was in the
research department at Morgan Keegan and Company. He earned his MBA from the University of
Pennsylvania and is a CFA charterholder.
Mr. DuBard is supported by three sector focused analysts who, unlike Wellington’s global industry analysts,
are dedicated to Mr. DuBard and the microcap strategies. However, Mr. DuBard and his analysts can
leverage Wellington’s approximately 50 global industry analysts as needed.
Mr. DuBard covers health care, transportation, banks and specialty finance. Kevin Barry covers industrials,
business services, aerospace and defense, and energy. Peter Carpi covers consumer and technology.
Don Porter was hired in August of 2019 to replace analyst Jason Goins, who left at the end of 2018 to join
the firm’s global impact team. Mr. Porter covers industrials, business services, and materials.
By managing the only two microcap products offered by Wellington, Mr. DuBard and his team have the best
of both worlds. They have all of the benefits of working for a very large, well-established and well-resourced
firm, but do not have to deal with any of the mindshare and liquidity headaches that are usually inherent in
a firm of Wellington’s size. While the team can leverage Wellington’s analysts, the microcap team has very
little overlap with the other Wellington small cap portfolios.
Page 15 of 56

State of Connecticut Retirement Plans and Trust Funds
Microcap Core Manager Overview
Wellington Management
Investment Philosophy
The philosophy is similar to a private equity approach to public markets. Mr. DuBard is essentially a
conservative growth investor with a focus on high quality businesses. He generally thinks about companies
in terms of valuation on an absolute basis, but is cognizant of relative value.
Mr. DuBard believes that the efficiency of the market increases considerably as you move up the market
cap spectrum. He has a long-term investment horizon and believes that microcap companies often carry
an illiquidity discount that offers patient investors attractive valuations and a larger universe of potential
investments. His ideal scenario is to own companies before they become more visible and reach the “bar
of institutional relevance.” He acknowledged that one risk of microcap investing is that the companies are
never discovered by other investors.
Page 16 of 56

State of Connecticut Retirement Plans and Trust Funds
Microcap Core Manager Overview
Wellington Management
Investment Process
Ideas are sourced primarily from the 400 to 600 company meetings the team conducts annually. Idea
generation is augmented with quantitative screens that incorporate factors based on valuation, profitability,
growth and cash flow or quality metrics. The investment team defines their investable universe as the
Russell Microcap Index. When they eliminate companies without earnings and/or capital-intensive
companies, the result is an investable universe of 500 to 600 companies.
The process is iterative. Mr. DuBard and the analysts have ongoing discussions about new ideas. Ideas are
generated via company meetings, conferences and field trips, quantitative screens, third-party sources,
and Wellington’s resources. The team seeks to invest in well-capitalized, distinctive niche leaders with a
proven management team and a price/value disconnect.
The analysts conduct very thorough due diligence on all potential investment ideas and will always meet
with or speak to management before purchasing a stock. There is continual discussion between the
analysts and PM. When an idea is at an advanced stage, the sponsoring analyst and Mr. DuBard discuss
whether to add it the portfolio. The primary valuation metric is EV/EBITDA, but the team will also look at
P/E, P/B, free cash flow yield, etc. The analysts drive idea generation in their areas of coverage, but
Mr. DuBard is the ultimate decision maker.
The portfolio will hold 75-150 stocks. However, the number of stocks is typically in the 75-100 range.
Page 17 of 56
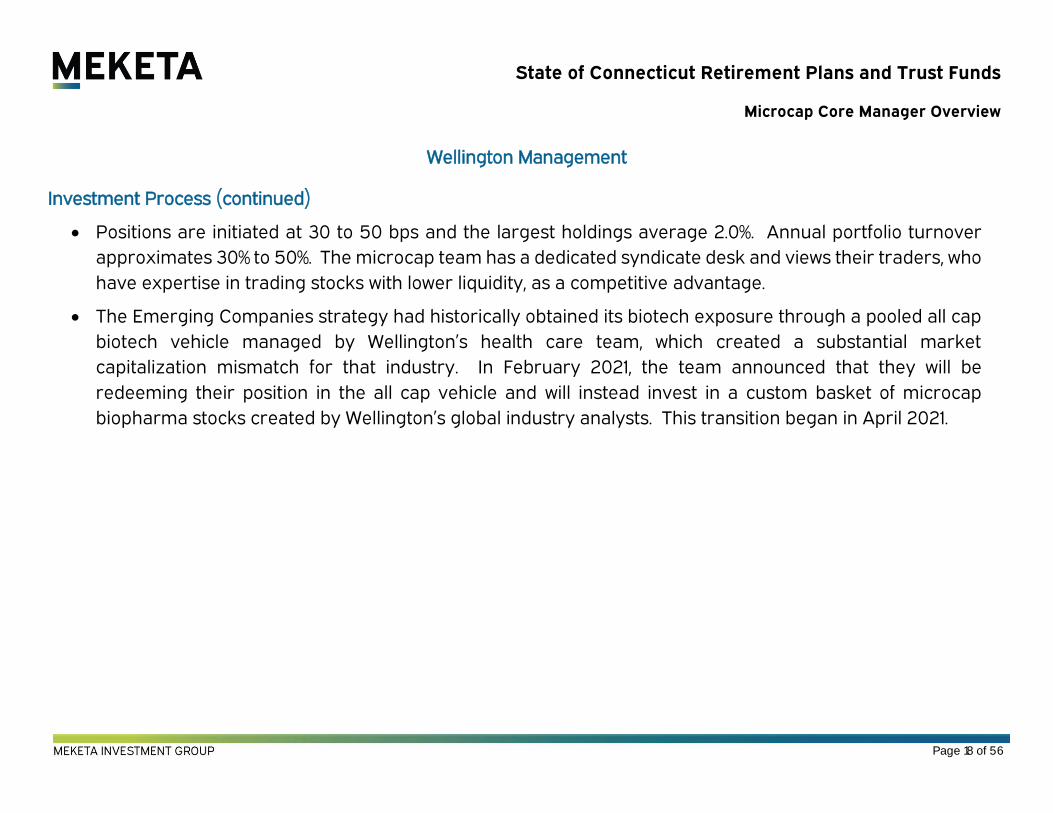
State of Connecticut Retirement Plans and Trust Funds
Microcap Core Manager Overview
Wellington Management
Investment Process (continued)
Positions are initiated at 30 to 50 bps and the largest holdings average 2.0%. Annual portfolio turnover
approximates 30% to 50%. The microcap team has a dedicated syndicate desk and views their traders, who
have expertise in trading stocks with lower liquidity, as a competitive advantage.
The Emerging Companies strategy had historically obtained its biotech exposure through a pooled all cap
biotech vehicle managed by Wellington’s health care team, which created a substantial market
capitalization mismatch for that industry. In February 2021, the team announced that they will be
redeeming their position in the all cap vehicle and will instead invest in a custom basket of microcap
biopharma stocks created by Wellington’s global industry analysts. This transition began in April 2021.
Page 18 of 56

State of Connecticut Retirement Plans and Trust Funds
Microcap Core Manager Overview
Historical Performance (gross of fees)
(As of June 31, 2021)
Wellington (%) Russell Microcap (%)
Trailing Period Returns (%):
YTD 16.7 29.0
1 Year 56.6 75.8
3 Year 15.6 14.5
5 Year 18.3 18.1
7 Year 13.1 11.8
10 Year 13.2 13.1
Calendar Year Returns (%):
2020 23.7 21.0
2019 28.2 22.4
2018 -14.0 -13.1
2017 19.2 13.2
2016 23.7 20.4
2015 -3.7 -5.2
2014 7.2 3.6
2013 41.9 45.6
2012 13.1 19.7
2011 -8.4 -9.3
2010 32.6 28.9
2009 45.3 27.5
2008 -43.9 -39.8
Page 19 of 56

State of Connecticut Retirement Plans and Trust Funds
Microcap Core Manager Overview
Three-Year Rolling Excess Return (gross of fees)
(Trailing 10-Year Period as of June 30, 2021)
Over the trailing 10-year period, Wellington Emerging Companies has outperformed the Russell Microcap
Core index in 73% of rolling 3-year periods. The average microcap core strategy1 has outperformed the
index in 69% of rolling three-year periods over that span.
1 The peer group is the eVestment US Microcap Core Equity universe.
Page 20 of 56

State of Connecticut Retirement Plans and Trust Funds
Microcap Core Manager Overview
Portfolio Characteristics1
(As of March 31, 2021)
Wellington Russell Microcap
Price-Earnings Ratio 15.1 14.5
Price-Book Value Ratio 2.0 2..3
Dividend Yield 0.9% 0.7%
Return-On-Equity 5.8% -7.7%
Historical Earnings Growth 7.8% 14.2%
Projected Earnings Growth 12.9% 16.4%
Weighted Average Market $1.7B $1.4B
Median Market Cap $1.0B $319M
Market Cap > $2bn 13.8% 16.2%
Market Cap $500m - $2bn 72.0% 54.5%
Market Cap < $500m 11.6% 29.3%
Cash 2.6% ---
Number of Holdings 79 1,325
Annual Expected Holdings Range 75 - 150 ---
Active Share 94.8% ---
Top Sector Weightings Industrials
Financials
Technology
28%
24%
17%
Health Care
Financials
Cons. Disc.
26%
20%
16%
% of Portfolio in Top 10 Holdings: 29.3% 9.2%
1 Source: FactSet.
Page 21 of 56

State of Connecticut Retirement Plans and Trust Funds
Microcap Core Manager Overview
Trailing Returns and Risk Statistics (gross of fees)
(March 1, 2012 – June 30, 2021)
Wellington Russell Microcap
Performance:
Performance (%) 14.4 14.4
% of Periods above Index (%) 0.57 ---
Best 3 Months (%) 30.4 48.2
Worst 3 Months (%) -29.3 -32.0
Risk Measures1:
Standard Deviation (%) 18.6 19.8
Tracking Error (%) 7.1 ---
Beta 0.88 ---
Correlation to Benchmark 0.93 ---
Downside Deviation (%) 12.0 12.6
Upside Capture (%) 91.4 ---
Downside Capture (%) 90.8 ---
Risk-Adjusted Performance3:
Jensen’s Alpha (%) 1.6 ---
Sharpe Ratio 0.74 0.69
Information Ratio 0.00 ---
Wellington has performed in line with the Russell Microcap index since Mr. Dubard took over as lead PM in
March of 2012. The strategy has outperformed the index in 57% of monthly periods over that span.
The strategy has undertaken less risk than the Russell Microcap index as measured by both beta and standard
deviation, over that span.
1 The benchmark used for all calculations is the Russell Microcap Core index.
Page 22 of 56

State of Connecticut Retirement Plans and Trust Funds
Microcap Core Manager Overview
Fees and Terms1
Wellington
Investment Vehicle Type SMA
Fee 0.84%
Peer Group Percentile Rank2 8
Wellington’s fee of 0.84% on a $70 million mandate is attractive and ranks in the 8th percentile of the
Microcap Core peer group.
1 Fees are based on a $70 million mandate. 2 The peer group is the eVestment US Microcap Core Equity universe.
Page 23 of 56

Small Cap Value Manager Overviews
Page 24 of 56

State of Connecticut Retirement Plans and Trust Funds
Small Cap Value Manager Overviews
Investment Manager Overview
Channing Ariel
Firm Location Chicago, Illinois Chicago, Illinois
Firm Inception 2003 1983
Percent Employee Ownership 100% 93%
Percent Minority Females in Management 0% 28%
Strategy Name Small-Cap Value Small Cap Value
Strategy Inception 2006 1983
Assets Under Management (Strategy) $2.2 billion $1.8 billion
Asset Under Management (Firm) $3.0 billion $16.8 billion
Page 25 of 56

State of Connecticut Retirement Plans and Trust Funds
Small Cap Value Manager Overviews
Channing Capital Management
Organization
Founded in 2003, Channing Capital Management (CCM) is a Chicago, IL based value manager. Up until
recently, two of the firm’s co-founders, CIO Wendell Mackey and Head of Business Development Rodney
Herenton, each owned 50% of the firm. However, on April 1, 2021, all members of the investment team
became owners. In total, Channing issued 5% of the shares to the investment team (ex-Mr. Mackey) with a
balance of 10% reserved once they achieve items stated in their development goals.
The firm is a value manager and offers four domestic equity strategies and five global equity strategies
that are managed by a separate team based out of Florida. The domestic equity offerings include Small
Cap Value, Small/Mid Cap Value, Large Cap Value and All-Cap Value. The Large and All Cap strategies are
managed by a separate individual and are managed primarily for a few legacy accounts. Wendell Mackey
and his team of four focus on the Small Cap Value and Small/Mid Cap Value.
The firm has a total of $3.0 billion in assets under management with Small Cap Value comprising $2.2 billion
of that total.
Channing’s employee base is 67% male and 33% female. The firm’s employees are 44% white, 44% black,
and 11% Hispanic.
Page 26 of 56

State of Connecticut Retirement Plans and Trust Funds
Small Cap Value Manager Overviews
Channing Capital Management
Investment Team
The Small Cap Value investment team is led by Portfolio Manager Wendell Mackey. He has been the sole
decision maker on this strategy since the product’s inception in 2006. Before Small Cap was launched,
Mr. Mackey worked on the Mid Cap Value strategy from 2003 to 2006. Mid Cap was wound down in 2019.
Mr. Mackey is also an analyst. He is a generalist, but he gravitates towards financials and technology.
Mr. Mackey started in the investment industry in 1993 and joined Channing in 2003. Prior to joining
Channing, he was a Managing Director at Valenzuela Capital Partners, a portfolio manager at Barrett
Capital Advisors, and a portfolio manager at NCM Capital Management Group. Mr. Mackey is a
CFA charterholder. BBA – Howard University; MM – Kellogg Graduate School of Management at
Northwestern University.
Mr. Mackey is supported by four Analyst/PMs. These individuals focus on specific sectors. They started in
the investment industry between 1991 and 2006 and are seasoned. In addition to these two dedicated
analysts, Deryck Lampe, CFA, the portfolio manager for the large and all-cap strategies, covers energy for
all the strategies including small cap. Mr. Lampe started in the investment industry in 1994. The team has
been stable over time.
Page 27 of 56

State of Connecticut Retirement Plans and Trust Funds
Small Cap Value Manager Overviews
Channing Capital Management
Investment Philosophy
Mr. Mackey’s philosophy is best defined as traditional value with a catalyst. He takes a contrarian approach
to finding ideas, but this strategy is not deep value. He will purchase stocks of good companies when
investors have potentially overreacted and driven the valuation below Channing’s estimate of fair value.
They will also research stocks that are not heavily followed and have limited, if any, analyst coverage.
Mr. Mackey believes that good companies are those with a strong competitive position, solid free cash flow,
a healthy balance sheet, and a good management team.
Channing believes that a catalyst must be on the horizon in order to drive the stock price higher. Catalysts
also help avoid value traps.
Mr. Mackey believes in managing a concentrated portfolio of the firm’s “best ideas”.
Page 28 of 56

State of Connecticut Retirement Plans and Trust Funds
Small Cap Value Manager Overviews
Channing Capital Management
Investment Process
Channing employs a fundamentally driven, bottom-up approach to investing. Ideas typically come from
screens, but analysts are also free to generate candidates. The firm screens on metrics including forward
P/E, EV/EBITDA, debt-to-capital, and return on equity. They will also consider stocks that have declined 25%
or more relative to the benchmark during the past year. This group is then ranked by P/E and classified
by sector/industry to help narrow the universe to attractively valued stocks that could potentially help
diversify the portfolio
Mr. Mackey believes that it is important to speak to company managements. Information is not as abundant
in the small cap universe, so an investor can gain an information edge by meeting with companies.
Channing will sometimes perform on-site company visits, but these trips are not imperative. They will speak
with management on conference calls and at investment conferences. Channing will speak to the sell-side
as well, primarily to provide an initial overview if they are unfamiliar with a new company. They may talk to
customers, suppliers, and competitors, but not always.
Channing builds its own financial model on each company. They will apply a multiple to EBITDA, construct
a discounted cash flow model or use a sum-of-the parts analysis to determine intrinsic value. A stock needs
to trade at a 30% discount to Channing’s estimate of intrinsic value. Management needs a plan to improve
profitability and grow revenue, and outline steps to manage the balance sheet in order to be considered
for purchase.
Mr. Mackey is the final decision-maker on all stocks. The portfolio contains 35 to 45 stocks. Turnover
averages around 50% (40% on a name basis).
Page 29 of 56

State of Connecticut Retirement Plans and Trust Funds
Small Cap Value Manager Overviews
Ariel Investments
Organization
Ariel Investments is a Chicago-based investment management firm. The firm was founded in 1983 by
John Rogers Jr. Ariel continues to be majority (93%) employee- and minority-owned. The balance is held
by outside shareholders who helped finance the firm’s initial start-up. The two largest shareholders are
Co-CEO and Founder, John Rogers, Jr, and Co-CEO and President, Mellody Hobson (74% combined
interest).
Ariel offers both domestic and global equity strategies and has expanded its offerings over time. The firm
has several flavors of small cap value, notably one that is more deep value oriented than the other
(though we would argue that both slant deep value).
The firm has a total of $16.8 billion in assets under management with the Small Cap Value strategy under
consideration comprising $1.8 billion of that total.
Ariel’s employee base is 45% male and 55% female. The firm’s employees are 51% white, 30% black,
4% Hispanic, 14% Asian, and 1% multi-category.
Page 30 of 56

State of Connecticut Retirement Plans and Trust Funds
Small Cap Value Manager Overviews
Ariel Investments
Investment Team
CIO John Rodgers and Kenneth Kuhrt manage the Small Cap Value strategy. Mr. Rodgers has managed
the strategy since its inception in 1983, the same year he started Ariel. Mr. Rodgers started in the
investment industry in 1980 as a stock broker at William Blair. Mr. Kuhrt joined Ariel in 2004. He started in
the investment industry in 2000 as an investment banking analyst at William Blair.
In addition to Messrs. Rodgers and Kuhrt, the broader domestic equity investment team comprises four
other Portfolio Managers who oversee various strategies and who also have stock coverage. These PMs
average 33 years of investment experience. Additionally, seven Analysts who average 11 years of
investment experience also support the broader domestic equity efforts. The Analyst team specializes by
sector/industry. Three of the seven Analysts focus solely on ESG research.
The investment team has been relatively stable with only one Analyst departure in the last five years.
Page 31 of 56

State of Connecticut Retirement Plans and Trust Funds
Small Cap Value Manager Overviews
Ariel Investments
Investment Philosophy
The team seeks out companies with differentiated products/services that dominate niches and that are
financially strong with experienced management teams. They want to invest in such companies when they
trade at a significant discount of 40% or greater to the team’s intrinsic value estimate.
The strategy follows a benchmark-agnostic, absolute value approach with a long-term 3-5 year horizon.
The approach is decidedly contrarian. The PMs focus on buying out-of-favor, misunderstood and ignored
stocks. The team will be patient, often waiting years for a stock that has already been thoroughly vetted to
fall on hard times and trade at the required valuation threshold. The strategy’s focus on out-of-favor stocks
means that the strategy is somewhat deeper value, and the team is not afraid to invest in companies many
other quality-oriented value managers eschew (e.g. Norwegian Cruise Lines amidst the COVID pandemic).
Page 32 of 56

State of Connecticut Retirement Plans and Trust Funds
Small Cap Value Manager Overviews
Ariel Investments
Investment Process
Ariel uses a bottom-up, fundamental approach to security selection. The team sources ideas from online
sources, periodicals, interviews, meetings, etc. About 50% of the ideas come from the Portfolio Managers,
40% from the Analysts, and 10% from other sources.
The due diligence focuses on financial strength and relative valuation, the competitive backdrop of the
industry, management team experience, and quality of products/services. The team considers valuation in
relation to earnings. They aim to invest in companies trading at least at a 40% discount to intrinsic value
estimates.
Due diligence includes speaking with management and third-party contacts including board members,
shareholders, competitors, suppliers, and industry experts. The team triangulates valuation three ways: a
discounted cash flow analysis, a change-of-control-based estimate, and a full trading value. Each is
weighted differently. Best-case and worst-case valuation scenarios are considered along with the base
case. A devil’s advocate is assigned to each stock to pick apart the thesis and vet the idea. ESG factors are
also considered as part of the process.
All senior members vote on an idea, but the Co-PMs make final investment decisions on the strategy.
The portfolio generally contains approximately 40 stocks. Annual turnover averages around 25%.
Page 33 of 56

State of Connecticut Retirement Plans and Trust Funds
Small Cap Value Manager Overviews
Historical Performance (gross of fees)
(As of June 30, 2021)
Channing (%) Ariel (%)
Russell 2000 Value
(%)
Trailing Period Returns (%):
YTD 17.1 18.7 26.7
1 Year 64.8 75.2 73.3
3 Year 11.9 14.3 10.3
5 Year 13.9 17.2 13.6
7 Year 9.9 10.6 9.3
10 Year 12.2 11.7 10.8
Calendar Year Returns (%):
2020 17.6 19.7 4.6
2019 25.9 27.5 22.4
2018 -16.6 -13.4 -12.9
2017 7.6 15.1 7.8
2016 29.5 20.7 31.7
2015 -4.4 -10.2 -7.5
2014 5.5 7.3 4.2
2013 39.5 37.6 34.5
2012 22.9 21.6 18.1
2011 -5.8 -10.6 -5.5
2010 33.0 30.6 24.5
2009 23.2 65.3 20.6
2008 -32.7 -45.1 -28.9
Page 34 of 56

State of Connecticut Retirement Plans and Trust Funds
Small Cap Value Manager Overviews
Three-Year Rolling Excess Return (gross of fees)
(Trailing 10-Year Period as of June 30, 2021)
Over the trailing 10-year period, Channing and Ariel have outperformed the Russell 2000 Value index in
76% and 60% of rolling 3-year periods, respectively. The average small cap vale strategy1 has outperformed
the index in 71% of rolling three-year periods over that span.
1 The peer group is the eVestment US Small Cap Value Equity universe.
Page 35 of 56

State of Connecticut Retirement Plans and Trust Funds
Small Cap Value Manager Overviews
Portfolio Characteristics1
(As of March 31, 2021)
Channing Ariel Russell 2000 Value
Price-Earnings Ratio 19.4 22.6 14.7
Price-Book Value Ratio 2.3 2.4 1.7
Dividend Yield 1.0% 1.2% 1.5%
Return-On-Equity -1.2% 1.4% -1.2%
Historical Earnings Growth 5.1% 4.7% 7.5%
Projected Earnings Growth 14.6% 16.3% 13.9%
Weighted Average Market $4.0B $5.9B $3.1B
Median Market Cap $3.3B $4.5B $922M
Market Cap > $5bn 28.9% 51.2% 13.7%
Market Cap $2b - $5bn 51.2% 25.8% 48.0%
Market Cap < $2b 17.0% 21.5% 38.3%
Cash 2.8% 1.5% ---
Number of Holdings 45 39 1507
Annual Expected Holdings Range 35 - 45 ~40 ---
Active Share 93.8% 98.5% ---
Top Sector Weightings Financials
Industrials
Cons. Disc.
24%
20%
18%
Industrials
Cons. Disc.
Financials
33%
17%
14%
Financials
Industrials
Cons. Disc.
27%
17%
14%
% of Portfolio in Top 10 Holdings: 29.2% 43.0% 5.6%
1 Source: FactSet.
Page 36 of 56

State of Connecticut Retirement Plans and Trust Funds
Small Cap Value Manager Overviews
Common Period Trailing Returns and Risk Statistics (gross of fees)
July 1, 2006 - June 30, 2021
Channing Ariel Russell 2000 Value
Performance:
Performance (%) 10.4 9.9 7.9
% of Periods above Index (%) 0.53 0.56 ---
Best 3 Months (%) 35.8 43.8 35.5
Worst 3 Months (%) -33.7 -39.9 -35.7
Risk Measures1:
Standard Deviation (%) 20.7 23.2 20.7
Tracking Error (%) 6.3 7.2 ---
Beta 0.96 1.07 ---
Correlation to Benchmark 0.95 0.95 ---
Downside Deviation (%) 13.9 15.6 14.6
Upside Capture (%) 102.0 108.3 ---
Downside Capture (%) 94.5 100.5 ---
Risk-Adjusted Performance3:
Jensen’s Alpha (%) 2.7 1.8 ---
Sharpe Ratio 0.45 0.38 0.33
Information Ratio 0.39 0.28 ---
Channing has outperformed the Russell 2000 Value index over the trailing common period while taking less
risk than the index, as measured by beta.
Ariel has outperformed the index over the common period. The strategy has captured over 100% of the market
upside.
1 The benchmark used for all calculations is the Russell 2000 Value index.
Page 37 of 56

State of Connecticut Retirement Plans and Trust Funds
Small Cap Value Manager Overviews
Fees and Terms1
Channing Ariel
Investment Vehicle Type SMA SMA
Fee 0.50% 0.47%
Peer Group Percentile Rank2 3 3
Both Channing and Ariel offer attractive fees than rank in the top decile (least expensive) of the peer
group.
1 Fees are based on a $169 million mandate. 2 The peer group is the eVestment US Small Cap Value Equity universe.
Page 38 of 56

Small Cap Growth Manager Overviews
Page 39 of 56

State of Connecticut Retirement Plans and Trust Funds
Small Cap Growth Manager Overviews
Investment Manager Overview
Riverbridge Lord Abbett
Firm Location Minneapolis, Minnesota Jersey City, New Jersey
Firm Inception 1987 1929
Percent Employee Ownership 49% 100%
Percent Minority Females in Management 0% 8%
Strategy Name Small Cap Growth Small Cap Growth
Strategy Inception 1988 1987
Assets Under Management (Strategy) $3.8 billion $5.8 billion
Asset Under Management (Firm) $14.7 billion $245.6 billion
Page 40 of 56

State of Connecticut Retirement Plans and Trust Funds
Small Cap Growth Manager Overviews
Riverbridge Partners
Organization
Mark Thompson and John Wilkie founded Riverbridge in 1987. Prior to starting the firm, Messrs. Thompson
and Wilkie had co-managed the New Dimensions fund at IDS. Mr. Wilkie retired from Riverbridge in 1992
and left the investment business. Mr. Thompson is currently Riverbridge’s Chief Manager and CIO.
Riverbridge had $14.7 billion in AUM as of 6/30/21. The firm manages eight growth strategies using the
same investment approach. Most of the assets are in the All Cap Growth ($4.8 billion), Small Cap Growth
($3.7 billion), and SMID Cap Growth ($3.5 billion) products.
The firm is 49% owned by 24 employees. London-based Northill Capital, a passive investor, holds 51% of the
equity. Northill is a source of perpetual capital for boutique asset managers. They support the long-term
stability and independence of the managers in which they invest. Northill initially purchased 59% of
Riverbridge in 2012. Their ownership has been reduced over time, as stock has been recycled to
Riverbridge employees. Northill is not involved in the day-to-day management of Riverbridge.
Riverbridge’s employee base is 58% white male, 31% white female, 6% Asian male and 6% Asian female.
Page 41 of 56

State of Connecticut Retirement Plans and Trust Funds
Small Cap Growth Manager Overviews
Riverbridge Partners
Investment Team
The Riverbridge investment team consists of seven individuals.
Mark Thompson and Rick Moulton are the "Lead Portfolio Managers" on the Small Cap Growth strategy.
The lead portfolio managers are responsible for the portfolio construction process, monitoring the
strategy's adherence to the firm's investment and risk disciplines, and ensuring the research pipeline
remains robust and diverse. They do not recommend stocks or put names in the portfolio.
The rest of the investment team consists of five portfolio managers. All the PMs have between eight and
eleven years of investment experience, and have been at the firm for at least eight years. The team has
not had any turnover since 2012.
Riverbridge does not believe in the specialist model. The PMs are all generalists. They are also analysts
and do all the investment research. This group of five PMs are responsible for adding and removing stocks
from the portfolio.
Members of the Riverbridge investment team have a substantial portion of their wealth invested in
Riverbridge strategies, Riverbridge portfolio stocks and in the equity of Riverbridge Partners.
Page 42 of 56

State of Connecticut Retirement Plans and Trust Funds
Small Cap Growth Manager Overviews
Riverbridge Partners
Investment Philosophy
Riverbridge is a high quality growth manager. They define high quality as companies that have the ability
to sustain high returns on invested capital (ROIC). If a company is able to sustain a high ROIC, they believe
it is indicative of a strong market position. Companies must be able to re-invest at high rates in order to
maintain a high ROIC.
In addition to a high ROIC, the team looks for strong management, high unit growth, dominant market
position and conservative accounting practices. Excluded from consideration are companies that do not
have the ability to finance their own growth.
The team will only invest in companies that are profitable at the unit level.
The investment team focuses on the long-term earnings power of a company. They believe investors often
underestimate the magnitude of a company's earnings power and the sustainability of its growth.
Riverbridge has a long-term investment horizon. They capture the market inefficiency of investor emotion,
behavior, and time. Short-term market movements cause investors to make emotional and behavioral
mistakes. Turnover in the Small Cap Growth portfolio has averaged 17% during the last five years. Most of
the turnover comes from selling stocks because their market cap moves out of the small cap range. The
average holding period of eight years reflects the team's belief in the power of compounding.
The firm does not require that each company it invests in have a minimum growth rate. Portfolio holdings
range from companies with 30% to 40% revenue growth to high single/low double digit top-line growers with
margin expansion potential that can be levered to double digit earnings growth.
Page 43 of 56
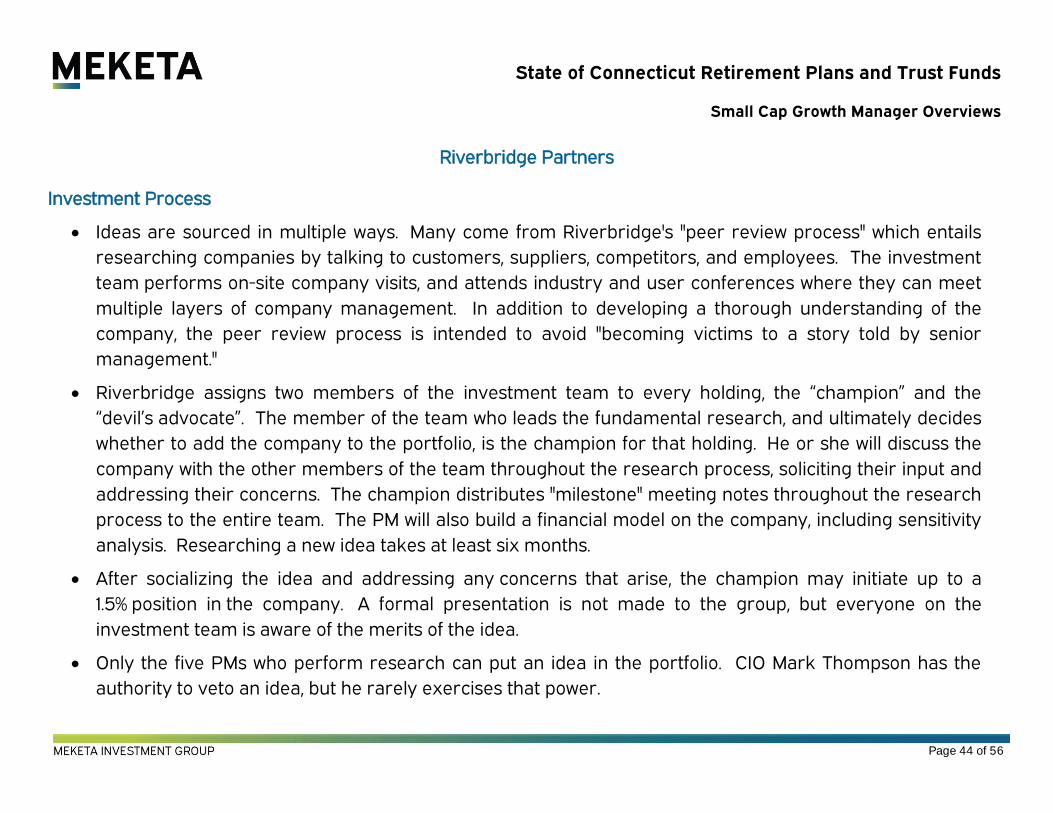
State of Connecticut Retirement Plans and Trust Funds
Small Cap Growth Manager Overviews
Riverbridge Partners
Investment Process
Ideas are sourced in multiple ways. Many come from Riverbridge's "peer review process" which entails
researching companies by talking to customers, suppliers, competitors, and employees. The investment
team performs on-site company visits, and attends industry and user conferences where they can meet
multiple layers of company management. In addition to developing a thorough understanding of the
company, the peer review process is intended to avoid "becoming victims to a story told by senior
management."
Riverbridge assigns two members of the investment team to every holding, the “champion” and the
“devil’s advocate”. The member of the team who leads the fundamental research, and ultimately decides
whether to add the company to the portfolio, is the champion for that holding. He or she will discuss the
company with the other members of the team throughout the research process, soliciting their input and
addressing their concerns. The champion distributes "milestone" meeting notes throughout the research
process to the entire team. The PM will also build a financial model on the company, including sensitivity
analysis. Researching a new idea takes at least six months.
After socializing the idea and addressing any concerns that arise, the champion may initiate up to a
1.5% position in the company. A formal presentation is not made to the group, but everyone on the
investment team is aware of the merits of the idea.
Only the five PMs who perform research can put an idea in the portfolio. CIO Mark Thompson has the
authority to veto an idea, but he rarely exercises that power.
Page 44 of 56

State of Connecticut Retirement Plans and Trust Funds
Small Cap Growth Manager Overviews
Riverbridge Partners
Investment Process (continued)
After the idea goes into the portfolio, another member of the team is assigned as the devil’s advocate. Very
often, the champion will ask the person they worked with on the idea to take on this role. The
devil’s advocate then conducts his or her own research. The role of the devil’s advocate is to develop an
independent perspective, challenge the champion’s assumptions, and add to the team’s overall
understanding of the company.
In order for a position to increase above the initial 1.5% weighting, the devil’s advocate must concur that the
stock merits an increased weighting. The weighting can be increased to 3% if that person likes the idea.
Conviction level and valuation determine position sizes. Riverbridge does not set price targets. The largest
positions in the portfolio can be 3% to 4%+. The Small Cap Growth portfolio usually holds about 50 stocks.
Positions are most often sold to fund a new, better opportunity. Stocks are also sold when a company's
fundamentals deteriorate or the catalysts for their earnings power fail to materialize. Positions are trimmed
when they reach 5% of the portfolio. When a company's market cap reaches $10 billion, it becomes a source
of funds.
Page 45 of 56

State of Connecticut Retirement Plans and Trust Funds
Small Cap Growth Manager Overviews
Lord Abbett
Organization
Founded in 1929, Lord Abbett became an independent partnership in 1948 and transitioned to a limited
liability company in July of 2002. The firm is 100% owned by approximately 50 partners, all of whom are in
senior management, and retired employees or members of their family. Non-employees are limited
partners.
Lord Abbett’s total AUM was $245.6 billion as of 6/30/21. The firm manages a wide range of fixed income
and equity products. Approximately 83% of total assets were in taxable and tax-free fixed income
strategies. The remaining 17% was in equity assets spread among 18 domestic value, domestic growth, and
global/international equity strategies.
At the end of 2020, the Innovation Growth Equity team managed four growth strategies with $15 billion in
AUM. These products included micro, small, all cap and concentrated all cap. $5.2 billion was in the Small
Cap Growth portfolio.
Lord Abbett’s employee base is 67% male and 33% female. The firm is 73% white, 4% black, 4% Hispanic,
19% Asian, and 2% multi-category.
Page 46 of 56

State of Connecticut Retirement Plans and Trust Funds
Small Cap Growth Manager Overviews
Lord Abbett
Investment Team
The 8-person Innovation Growth Equity team consists of three PMs, two PM/analysts and three analysts.
Two portfolio managers who oversee the firm’s convertible securities strategy are also part of this team.
Tom O'Halloran and Matt DeCicco, both of whom are partners and portfolio managers, lead the team.
Mr. O’Halloran joined Lord Abbett in 2001. He took over the Small Cap Growth portfolio in 2003.
Matt DeCicco, who joined Lord Abbett in 2002 as a junior analyst, became a PM in 2017 and a partner in
2020. He was named Director of Equities in 2019 when the firm disbanded its central research group and
moved to three product focused investment teams. The separate Innovation Growth Equity team has
always existed. That model was replicated with the creation of three other equity teams. Mr. DeCicco
oversees all the analysts on the Innovation team, as well as the PMs of the three teams.
Mr. DeCicco and one other PM, Ben Ebel, also do analytical work. Mr. DeCicco has followed a number of
sectors, most recently health care. In managing the portfolio, Mr. O'Halloran defers to Mr. DeCicco when it
comes to health care stocks. For technology investments, the roles are reversed. Mr. Ebel covers the
technology and telecomm sectors.
The third PM is a Certified Market Technician (CMT). He provides a technical viewpoint on all stocks.
The two PM/analysts and three analysts on the team specialize by sector. As part of the reorganization two
years ago, two new analysts were added to the Innovation Growth team. These two analysts cover biotech,
consumer staples, and health care.
Page 47 of 56

State of Connecticut Retirement Plans and Trust Funds
Small Cap Growth Manager Overviews
Lord Abbett
Investment Philosophy
The Lord Abbett Innovation team are aggressive growth investors. They believe that the market
persistently underestimates the growth and return potential of highly transformative companies. Based
on their experience, however, they recognize that superior growth companies do not always make great
investments, and that successful growth investing requires the ability to make this critical distinction. They
focus on identifying innovative companies whose growth prospects are underestimated by the market.
The portfolio managers invest in four categories of growth. These include secular, cyclical, stable, and
defensive growth.
In addition to fundamental analysis, technical analysis is integral to their approach. The PMs want to see
proof that there is "quantifiable operating momentum" combined with stock price momentum.
Exceeding expectations in terms of growth drivers, and positive sales and earnings estimate revisions,
are important factors that make stocks attractive.
The PMs are not second derivative investors and will not necessarily sell a stock if the growth rate
decelerates. A growth deceleration that is greater than expectations can sometimes be positive.
Bottom-up fundamental research accounts for an estimated 80% of the investment process. 20% is a top
down assessment of macro factors, industry conditions, and technical market behavior.
Page 48 of 56

State of Connecticut Retirement Plans and Trust Funds
Small Cap Growth Manager Overviews
Lord Abbett
Investment Process
From a fundamental perspective, the team looks for companies with "exceptional business models",
"competent and credible management", "sustainable competitive advantages," and "favorable industry
conditions".
The group screens the universe of stocks with market capitalizations in the range of the Russell 2000 for
high, sustainable revenue growth, conservative capital structures, and compelling gross margins. They
also look for operating and price momentum.
The analysts perform due diligence on attractive candidates. Due diligence entails determining the quality
of the company’s business model, sizing the company’s market opportunity and identifying the economic
forces that will shape its future direction, assessing the company’s competitive position and evaluating
management In addition to high revenue growth and strong margins, they look for growth drivers
exceeding expectations, and positive sales and earnings estimate revisions. The team builds financial
models for all investment candidates.
The underlying stocks of these high growth companies must also have favorable absolute and relative price
momentum. The PMs will evaluate shifts in momentum, moving averages, relative strength, and
price/volume metrics. All stocks receive a technical rating. Every buy and sell decision is "informed" by
technical analysis.
Page 49 of 56

State of Connecticut Retirement Plans and Trust Funds
Small Cap Growth Manager Overviews
Lord Abbett
Investment Process (continued)
The risk-reward profile of each stock influences the conviction level of the PM team, which in turn
determines position sizes. The largest positions in the portfolio are generally around 2%. The portfolio
consists of ~90 to 110 stocks.
The investment team monitors short-term company developments. The PMs are quick to sell if
fundamentals deviate from expectations or price momentum deteriorates. Stocks may also be sold to
ensure adequate portfolio diversification. Annual portfolio turnover has historically been between 100% and
200%.
Page 50 of 56

State of Connecticut Retirement Plans and Trust Funds
Small Cap Growth Manager Overviews
Historical Performance (gross of fees)
(As of June 30, 2021)
Riverbridge (%) Lord Abbett (%)
Russell 2000 Growth
(%)
Trailing Period Returns (%):
YTD 7.8 5.1 9.0
1 Year 47.7 56.1 51.4
3 Year 25.4 27.8 15.9
5 Year 25.9 29.3 18.8
7 Year 18.6 17.7 13.1
10 Year 17.8 17.5 13.5
Calendar Year Returns (%):
2020 55.1 74.3 34.6
2019 28.3 33.1 28.5
2018 8.2 6.0 -9.3
2017 24.1 31.1 22.2
2016 14.2 -1.7 11.3
2015 -2.6 -8.0 -1.4
2014 -0.3 4.3 5.6
2013 43.5 58.8 43.3
2012 17.9 11.6 14.6
2011 4.1 -0.6 -2.9
2010 29.4 38.2 29.1
2009 36.2 48.7 34.5
2008 -34.0 -46.7 -38.5
Page 51 of 56

State of Connecticut Retirement Plans and Trust Funds
Small Cap Growth Manager Overviews
Three-Year Rolling Excess Return (gross of fees)
(Trailing 10-Year Period as of June 30, 2021)
Over the trailing 10-year period, Riverbridge and Lord Abbett have outperformed the Russell 2000 Growth
index in 73% and 75% of rolling 3-year periods, respectively. The average small cap growth strategy1 has
outperformed the index in 71% of rolling three-year periods over that span.
1 The peer group is the eVestment US Small Cap Growth Equity universe.
Page 52 of 56

State of Connecticut Retirement Plans and Trust Funds
Small Cap Growth Manager Overviews
Portfolio Characteristics1
(As of March 31, 2021)
Riverbridge Lord Abbett Russell 2000 Growth
Price-Earnings Ratio 42.5 33.2 29.1
Price-Book Value Ratio 5.9 6.7 25.2
Dividend Yield 0.3% 0.1% 0.4%
Return-On-Equity 4.5% -4.3% -3.8%
Historical Earnings Growth 27.3% 30.6% 21.3%
Projected Earnings Growth 20.5% 27.8% 21.6%
Weighted Average Market $5.5B $5.7B $4.3B
Median Market Cap $4.7B $4.5B $1.3B
Market Cap > $5bn 50.2% 49.1% 31.1%
Market Cap $2b - $5bn 34.5% 42.4% 45.7%
Market Cap < $2b 10.8% 7.1% 13.3%
Cash 4.5% 1.5% ---
Number of Holdings 50 102 1,147
Annual Expected Holdings Range ~50 90 - 110 ---
Active Share 93.7% 98.6% ---
Top Sector Weightings Technology
Health Care
Cons. Disc.
35%
24%
17%
Health Care
Technology
Cons. Disc.
30%
25%
19%
Health Care
Technology
Industrials.
33%
20%
15%
% of Portfolio in Top 10 Holdings: 32.7% 18.3% 6.6%
1 Source: FactSet.
Page 53 of 56

State of Connecticut Retirement Plans and Trust Funds
Small Cap Growth Manager Overviews
Trailing 10-Year Returns and Risk Statistics (gross of fees)
As of June 30, 2021
Riverbridge Lord Abbett
Russell 2000
Growth
Performance:
Performance (%) 17.8 17.5 13.5
% of Periods above Index (%) 0.53 0.57 ---
Best 3 Months (%) 36.4 40.9 34.8
Worst 3 Months (%) -17.0 -23.8 -25.8
Risk Measures1:
Standard Deviation (%) 17.3 20.4 19.3
Tracking Error (%) 6.9 7.8 ---
Beta 0.84 0.98 ---
Correlation to Benchmark 0.94 0.92 ---
Downside Deviation (%) 10.1 12.5 12.4
Upside Capture (%) 96.0 107.8 ---
Downside Capture (%) 80.5 94.1 ---
Risk-Adjusted Performance3:
Jensen’s Alpha (%) 5.7 4.1 ---
Sharpe Ratio 0.99 0.83 0.67
Information Ratio 0.62 0.51 ---
Both managers have outperformed over the trailing 10-year period by 400bps or more on an annualized basis.
Riverbridge has taken on less risk than the index as measured by standard deviation and beta. Lord Abbett’s
standard deviation has been greater than the index, but its beta has been lower.
1 The benchmark used for all calculations is the Russell 2000 Growth index.
Page 54 of 56

State of Connecticut Retirement Plans and Trust Funds
Small Cap Growth Manager Overviews
Fees and Terms1
Riverbridge Lord Abbett
Investment Vehicle Type SMA SMA
Fee 0.80% 0.61%
Peer Group Percentile Rank2 64 5
Lord Abbett’s proposed fee of 0.61% is very low and ranks in the 5th percentile of the peer group.
Riverbridge’s proposed fee is above average.
1 Fees are based on a $169 million mandate. 2 The peer group is the eVestment US Small Cap Growth Equity universe.
Page 55 of 56

State of Connecticut Retirement Plans and Trust Funds
Small Cap Growth Manager Overviews
Appendix
Information Ratio: This statistic is a measure of the consistency of a portfolio’s performance relative to a benchmark. It is calculated by subtracting the
benchmark return from the portfolio return (excess return), and dividing the resulting excess return by the standard deviation (volatility) of this excess return.
A positive information ratio indicates outperformance versus the benchmark, and the higher the information ratio, the more consistent the outperformance.
Sharpe Ratio: A commonly used measure of risk-adjusted return. It is calculated by subtracting the risk free return (usually three-month Treasury bill) from
the portfolio return and dividing the resulting excess return by the portfolio’s total risk level (standard deviation). The result is a measure of return per unit of
total risk taken. The higher the Sharpe ratio, the better the fund’s historical risk adjusted performance.
Standard Deviation: A measure of the total risk of an asset or a portfolio. Standard deviation measures the dispersion of a set of numbers around a central
point (e.g., the average return). If the standard deviation is small, the distribution is concentrated within a narrow range of values. For a normal distribution,
about two thirds of the observations will fall within one standard deviation of the mean, and 95% of the observations will fall within two standard deviations of
the mean.
Tracking Error: This statistic measures the standard deviation of excess returns relative to a benchmark. Tracking error is calculated by multiplying the
standard deviation of the monthly excess returns of a portfolio relative to a benchmark by the square root of twelve in order to annualize. The higher the
tracking error, the greater the volatility of excess returns relative to a benchmark.
Sources: www.businessdictionary.com
http://www.naplia.com/employeedishonesty/Employee_Dishonesty_FAQ.shtml
Investment Terminology, International Foundation of Employee Benefit Plans, 1999.
Modern Investment Management, Litterman, Bob, 2003.
Page 56 of 56

Slow and steadywins the race.

September 8, 2021
STATE OF CONNECTICUT
ONE: OVERVIEW
1 Stable perspective2 Firm facts3 Patient investment philosophy 4 One philosophy, three approaches5 Living our values
TWO: OUR TEAM
6 Executive leadership7 Investment team 8 Marketing, client services and business administration
THREE: VALUE9 Investment philosophy10 Why Ariel’s value approach? 11 Process16 ESG investing17 Statistics and performance
FOUR: APPENDIX
24 Biographies30 GIPS composite report32 Disclosures
Table of contents
CONTENTS FOR ONE-ON-ONE PRESENTATION

ONE: OVERVIEW
A stable perspective in a changing world
Our patient investment philosophy
• We use the market’s short-term focus to uncover mispriced companies whose true value will be realized over time.
Our focus
• We began as a small- and mid-cap value manager, and evolved strategically to offer three approaches — all of which seek out attractive intrinsic value through relatively concentrated portfolios.
Our culture of learning
• Intensive fundamental research is essential to our proprietary investment processes. We also value the importance of learning in a broader context and are committed to promoting education and nancial literacy.
Since our founding in 1983, much has changed in the investment world, but a clear mission has consistently defi ned who we are and what we do.

ONE: OVERVIEW
2
ONE: OVERVIEW
2Slow and steady wins the race.
Firm factsAs of 06/30/21
1983 by John W. Rogers, Jr.
Headquarters: Chicago Of ces: New York City, San Francisco, Sydney
$16.8 billion
Value, focused value, global
9 separate account strategies, 5 mutual funds
112 (includes Ariel and its af liated entities)
95% owned by employees and board members
Founded:
Location:
Assets:
Approaches:
Products:
Employees:
Ownership:

ONE: OVERVIEW
3
ONE: OVERVIEW
3Slow and steady wins the race.
Our patient investment philosophy sets us apart
PATIENCEWe take the long-term view.
Low turnover
Wait for the perfect pitch that provides a margin of safety Give prices
time to reflect intrinsic value
View short-term volatility opportunistically
EXPERTISEWe specialize in bottom-up, fundamental research.
Long-term experience in our asset classes
Choose to go deep instead of broad
Exceptionally strong company and industry knowledge
INDEPENDENCEWe invest to our convictions, not to benchmarks.
Concentrated portfolios
High active shares versus benchmarks
Contrarian point of view
TEAMWORKWe work collaboratively with a shared commitment to excellence.
Driven by dialogue, not by dictates
Achieve better outcomes by leveraging individual expertise
Reflected in employee ownership of our funds and our firm

ONE: OVERVIEW
4Slow and steady wins the race.
ONE: OVERVIEW
4
SEPARATE ACCOUNTS MUTUAL FUNDS
Value Ariel Small Cap Value
Ariel Small Cap Value Concentrated
Ariel Small/Mid Cap Value
Ariel Mid Cap Value Ariel Fund Ariel
Appreciation Fund
ManagersJohn W. Rogers, Jr.Kenneth Kuhrt
John W. Rogers, Jr. Kenneth Kuhrt
John W. Rogers, Jr.John P. Miller
John W. Rogers, Jr. Timothy Fidler
John W. Rogers, Jr.* with John P. Miller & Kenneth Kuhrt
John W. Rogers, Jr. Timothy Fidler
Assets (M) $1,850 $614 $786 $837 $3,192 $1,414
Benchmark Russell 2000 Value Russell 2000 Value Russell 2500 Value Russell Midcap Value Russell 2500 Value Russell Midcap Value
# of stocks 38 20 37 39 37 39Inception 09/30/83 04/30/20 12/31/00 03/31/90 11/06/86 12/01/89
SEPARATE ACCOUNTS MUTUAL FUNDS PRIVATE FUND
Global Ariel International (DM) Ariel International (DM/EM) Ariel Global Ariel Global
ConcentratedAriel International Fund
Ariel Global Fund
Ariel International (DM/EM)
Managers Rupal J. Bhansali Rupal J. Bhansali Rupal J. Bhansali Rupal J. BhansaliMicky Jagirdar Rupal J. Bhansali Rupal J. Bhansali Rupal J. Bhansali
Assets (M) $1,959 $1,441 $2,685 $227 $874 $151 $543
Benchmark MSCI EAFE MSCI ACWI ex-US MSCI ACWI MSCI ACWI MSCI EAFE MSCI ACWI MSCI ACWI ex-US
# of stocks 58 61 61 25 57 60 61Inception 12/31/11 12/31/11 12/31/11 12/31/19 12/30/11 12/30/11 04/03/17
One philosophy, three approachesAs of 06/30/21
SEPARATE ACCOUNT MUTUAL FUND
Focused Value
Ariel Focused Value Ariel Focus Fund
Managers Charles K. Bobrinskoy Charles K. Bobrinskoy
Assets (M) $163 $66
Benchmark Russell 1000 Value Russell 1000 Value
# of stocks 28 28Inception 03/31/05 06/30/05
*Lead portfolio manager

Living our values – at Ariel and beyond
87% 67% 71%
Our diversity makes us better
•
•
• In 2002, Ariel co-founded the Black Corporate Directors Conference to ensure the civil rights agenda is not forgotten in publiccompany boardrooms.
In 2017, Ariel created the John W. Rogers, Jr. Internship Program in Finance to connect interns from underrepresentedbackgrounds with foundation and endowment investment offices across the country. Since the program’s initial launch at the Universityof Chicago, it has expanded to over 20 foundation and endowment offices.
In 2018, we implemented our own firm-wide Diversity and Inclusion Mandate underscoring our commitment to diversity in ouremployee ranks, purchasing relationships and philanthropic contributions.
A financially literate society is good for us all• In 1996, we founded the Ariel Community Academy (ACA), a K-8 public school located on the south side of Chicago, with an
innovative financial literacy curriculum.
• In 1998, we launched the first-of-its-kind, Black Investor Survey, to compare and contrast the saving and investing behaviors ofmiddle income black and white Americans.
• In 1999, Ariel Vice Chairman, Charles Bobrinskoy developed the Big Shoulders Stock Market Program, to teach the basics of
stock picking to eighth grade students at 64 participating inner-city Chicago Catholic schools.
• In 2019, we released FUTURES: Financially Literate Kids for a Financially Literate Society, a free resource that teaches personalfinance, economics, entrepreneurship and investment concepts to elementary school students. The FUTURES program is available fordownload at www.arieleducationinitiative.org.
Minority White female White male
*Includes Ariel and its affiliated entities as of June 30, 2021
MinorityOwnership
DiverseEmployees*
Minorityand/orwomenleaders*
ONE: OVERVIEW
5Slow and steady wins the race.

TWO: OUR TEAM
6Slow and steady wins the race.
Mellody HobsonCo-CEO & president
John W. Rogers, Jr.Chairman, Co-CEO & CIO
• Oversees Ariel’s domestic and global investment research
• Has portfolio management responsibilities for fl agship value products
• Oversees the business of Ariel outside of investing and research
• Provides fi rmwide strategic direction
Executive leadership

TWO: OUR TEAM
7Slow and steady wins the race.
Domestic research and trading
See appendix for biographies.
PORTFOLIO MANAGEMENT RESEARCH TRADING
John W. Rogers, Jr. (1983)Chairman, Co-CEO & CIO industry generalistIndustry: 41 years
Charles K. Bobrinskoy (2004)Vice chairman, head of investment groupindustry generalistIndustry: 37 years
Timothy Fidler, CFA (1999)EVP, director of researchfi nancial servicesIndustry: 29 years
Kenneth E. Kuhrt, CPA (2004)EVP; consumer services and industrialsIndustry: 23 years
John P. Miller, CFA (1989)SVP; asset management and media Industry: 34 years
Sabrina Carollo, CFA (2001)SVP, director of research operationshealth care and offi ce suppliesIndustry: 28 years
John Oxtoby (2014)SVP, director of ESG investingIndustry: 6 years
James Kenny, CFA (2010)VP; services and industrialsIndustry: 18 years
Danan Kirby, CFA (2021)VP, client portfolio managerIndustry: 13 years
Jamil Soriano (2012)VP; consumer products & services and fi nancial servicesIndustry: 15 years
Aaron Bianco, CFA (2015)Research analyst infrastructure and technologyIndustry: 15 years
Conner Chapman (2019)ESG research associateIndustry: 2 years
Cheryl Cargie (1994)SVP, head traderIndustry: 34 years
Jill Gracia (2015)VP, senior traderIndustry: 21 years
Value Focused Value
established 1983

TWO: OUR TEAM
8Slow and steady wins the race.
TWO: OUR TEAM
8
Client-centered business model
INSTITUTIONAL CLIENT& INVESTOR RELATIONS
Bonnie E. Orlowski (2016)SVP, head of consultant relations & fi nancial intermediaries
Melissa Smith (2015) SVP, consultant relations
Mellody Hobson (1991)Co-CEO & president
Malik T. Murray (2004)SVP, head of business development
Valerie King (2018)SVP, institutional marketing
Ian M. Webber (2015)SVP, institutional marketing, head of Asia Pacifi c & MENA
Taylor Goodridge (2017) VP, institutional marketing
Jennifer DiGrazia (2019)SVP, head of institutional client & investor relations
Camille El-Amin (2007)VP, institutional client & investor relations
Patrice L. Scelzo (1999)VP, institutional client& investor relations
Mareilé B. Cusack (2007)General counsel
Wendy D. Fox (2004)Chief compliance offi cer
Carlos E. Calderon (2021)Chief fi nancial offi cer
FINANCELEGAL & COMPLIANCE IT & OPERATIONS HUMAN RESOURCES
Marlo J. Gaal (2020)Chief talent offi cer
COMMUNICATIONS
Arielle Patrick (2020)Chief communications offi cer
Mary Cecola (2019)Chief technology offi cer
Kenneth T. Slovin (2016)SVP, director of global operations
James R. Rooney, CPA (2015)SVP, fund administration
CONSULTANT RELATIONS INSTITUTIONAL MARKETING

FIVE: GLOBAL
9Slow and steady wins the race.
THREE: VALUE
9
PATIENCE
We take the long-term view.
INDEPENDENCE
We invest to our convictions, not to benchmarks.
EXPERTISE
We specialize in bottom-up, fundamental analysis.
TEAMWORK
We work collaboratively with a shared commitment to excellence.
Our value investment philosophy

THREE: VALUE
10Slow and steady wins the race.
Why Ariel’s value approach?
Ariel’s fl agship value approach is built on the basic principle of targeting undervalued companies that show a strong potential for growth. We take advantage of the market’s short-term thinking to drive long-term results for our clients.
Our track record is one of the longest in the business
• As a pioneer in small- and small/mid-cap value investing, we have a 38-year uninterrupted track record attributable to one portfolio manager.
Clearly defi ned parameters enhance our screening outcomes
• We look for differentiated companies with robust, solid, enduring brands/franchises, strong cash ows, low debt, high-quality products or services, signi cant barriers to entry (moats) and low reinvestment requirements. We also consider environmental, social and governance (ESG) factors.
Concentrated yet diversifi ed portfolios focus on our highest-conviction ideas
• We choose to go deep instead of broad, often taking a contrarian point of view.
In-depth sector and industry expertise informs each investment decision
• Our portfolio managers and research analysts evaluate companies within a well-established “circle of competence” — industries where we are truly experts.
Risk management is a top priority
• We de ne risk as a permanent loss of capital, controlled at the portfolio and stock level via allocation parameters, our focus is on private market value (PMV) and our in-depth understanding of the companies we choose.
• We also mitigate risk by investing with a margin of safety (40% discount to PMV), employing proprietary debt, ESG and moat ratings, as well as using a devil’s advocate to challenge our own investment theses.
THREE: VALUE

THREE: VALUE
11Slow and steady wins the race.
THREE: VALUE
1Idea generation
Risk management
Search for out-of-favor,
misunderstood and
ignored stocks whose
low prices reduce the
risk of owning them
Benefit
In-depth industry
knowledge
helps uncover
investment ideas
others may have
overlooked
Process
Generate
ideas from
deep industry
knowledge,
extensive reading
and computer
screening
3Team validation
Risk management
A devil’s advocate
is assigned
to challenge
investment theses;
proprietary ESG
risk ratings are
designated
Benefit
Ideas vetted from
multiple perspectives
yield more informed
final decisions by
portfolio manager(s)
Process
Rigorous debate
and discussion
2Bottom-up research
Risk management
Seek to invest in
companies whose
shares are trading
at a 40% discount
to PMV and/or 13x
or less next year’s
earnings
Benefit
Enables us to find
quality companies
in industries where
our expertise adds
value
Process
Extensive valuation
work, ESG risk
analysis and
independent
verification
4Portfolio construction
Risk management
Strict buy-and-
sell criteria
Benefit
Unique portfolio with
benchmark-agnostic
industry weightings
drives high active
share and thereby
helps generate alpha
Process
Build
concentrated
portfolios
weighted by
conviction
Our value process

THREE: VALUE
12Slow and steady wins the race.
We read extensively, monitor computer-generated screens and meet with industry experts while also staying abreast of former holdings that can become candidates for repurchase.
Looking through a long-term lens helps identify ideas others might not consider
OUR VALUE PROCESS:
The lead portfolio manager(s) generate(s) 50% of the new ideas, the research team comprised of industry specialists generates 40% and 10% can come from anywhere.
• Research team members track a comprehensive industry watch list across all market caps.
We look for differentiated companies with enduring brands/franchises, strong cash fl ows, low debt, high-quality products or services, signifi cant barriers to entry (moats), and low reinvestment requirements. We also consider environmental, social and governance factors.
1 2 3 4Idea generation

THREE: VALUE
13Slow and steady wins the race.
Bottom-up research determines underlying value and identifies key issues
1 2 3 4
OUR VALUE PROCESS:
Bottom-up research
Proprietary valuation work uncovers discrepancies between a company’s underlying value and its stock price.
• We target quality companies that trade at a 40% discount to our internally generated private market value (PMV), and/or sell for 13x or less forward cash earnings estimates.
• Our valuation process includes discounted cash ow analysis, as well as an extensive review of comparables and recent transactions. We also build full nancial models and perform scenario analysis.
Our extensive independent, third-party contacts are crucial to our analysis.
• Investment ideas are vetted with third-party contacts that include board members, shareholders, C-suite executives, private equity investors, industry experts, respected peers, as well as competitors, suppliers, customers and Wall Street analysts.
• Our strategic questioning of company management teams enables us to determine critical issues affecting companies.
• Our specialized interview training enables us to carefully read portfolio company managers’ verbal and non-verbal responses.
Rigorous ESG research strengthens our fundamental fi nancial analysis.
• We assess nancially material ESG risks and opportunities.• Our analysis is informed by quantitative and qualitative insights from more than 80 data points
derived from public, third-party, and proprietary sources.

THREE: VALUE
14Slow and steady wins the race.
Team review and debate test the validity of our convictions
OUR VALUE PROCESS:
1 2 3 4Team validation
The industry specialist generates a research report that is initially reviewed by the director of research to ensure quality control and vetted by the entire research team.
• For new ideas a two-page report is initially written, followed by a full report if the idea appears to be compelling.
The senior research team then debates the full report, rigorously questioning the industry specialist, who conducts further research as necessary.
• A devil’s advocate is assigned to challenge an investment thesis.
Ultimately, all senior research team members vote on the idea, with the fi nal decision made by the lead or co-portfolio manager(s).
The entire validation process is completed in less than three weeks.
The dedicated ESG team prepares an analysis which considers qualitative and quantitative data, relevant events and ongoing management team engagement.

THREE: VALUE
15Slow and steady wins the race.
Concentrated portfolios drive
better outcomes
OUR VALUE PROCESS:
1 2 3 4Portfolio construction
Purchases made up to 5% at market with appreciation to 6%, at which time we pare back (10% at market with appreciat on to 12% in our small cap concentrated portfolio).
No more than 10% may be invested in companies that do the exact same thing
(20% for our small cap concentrated portfolio).
We carefully monitor portfolio holdings over the long term, selling when:
• A stock trades at full value (0% discount to PMV and/or 20x next year’s earnings);• Competitive landscape shifts, company fundamentals deteriorate, and/or we lose faith in management.
Our low-turnover portfolios typically hold 40 stocks (20 in our small cap concentrated portfolio), with approximately six to eight new names purchased each year.
We consider four proprietary risk metrics for every holding:• Our proprietary debt ratings supplant those of Moody’s and Standard & Poor’s and augment our balance sheet work;
• Our proprietary ESG risk ratings assess the negative nancial impact to a company’s enterprise value arising from ESG
risk related factors;
• Our internally generated “moat” rating requires us to quantify a company’s competitive advantage;
• We formally track sell-side ratings to better understand conventional views.

THREE: VALUE
16Slow and steady wins the race.
ESG investing – traditional value As part of our commitment to drive long-term results for our clients, we employ a rigorous approach when considering
ESG risk factors across Ariel’s fl agship traditional value strategies.
Research and Analysis
• ESG team prepares report for every portfolio company, which considers qualitative/quantitative data, relevant events and ongoing engagement
• Analysis supported by proprietary platform, with insights from 80+ data points derived from public, third-party and proprietary sources
• Assign a proprietary ESG Risk Rating to each portfolio company and integrate into the discount rates used in nancial valuations
• Produce dashboard to monitor ESG issues, and inform overall risk management, future research analysis, continued learning and engagement
• Ariel’s traditional value and focused value strategies do not invest in companies whose primary source of revenue is derived from the production or sale of tobacco products, the manufacture of rearms or the operation of for pro t prisons
Engagement
• In 2020, we tracked 130+ engagements with portfolio companies across nancially material ESG issues
• In 2020, we engaged over 40 portfolio companies to sign the CEO Action Pledge on Diversity and Inclusion
• Our history of engagement on board diversity has resulted in more than 50 Ariel portfolio companies adding diverse directors to their boards
Reporting
• In partnership with lead analyst, ESG team systematically tracks and monitors environmental, social and governance outcomes
• Annual ESG report details our extensive engagement activities
Collaboration
• Our industry memberships provide opportunities to learn and share best practices with the broader ESG community:
- Ariel is a signatory of the UN-supported Principles for Responsible Investment (PRI), CEO Action for Diversity and Inclusion, and the CDP
- We are members of the Sustainable Accounting Standards Board Alliance (SASB), Thirty Percent Coalition, Midwest Investors Diversity Initiative (MIDI), Ceres Investor Network and a board member of RFK Human Rights
- Ariel supports the Task Force on Climate-Related Financial Disclosures (TCFD)

17
ARIEL SMALL CAP VALUE
Portfolio characteristicsAs of 06/30/21
THREE: VALUE
17Slow and steady wins the race.

ARIEL SMALL CAP VALUE
Sector weightings (%)As of 06/30/21
Sector Portfolio Russell 2000 Value Index Russell 2000 Index S&P 500 Index
18
THREE: VALUE
18Slow and steady wins the race.

ARIEL SMALL CAP VALUE
Performance resultsAs of 07/31/21
MonthEnded07/31/21
Year-to-Date12/31/20 –07/31/21
Last 1 Year07/31/20 –07/31/21
Last 3 Years07/31/18 –07/31/21
+Gross of Fees + 13.29%+ 67.88%18.43%– 0.20%
3.58– 22.16+ 63.70+ 8.30+Russell 2000 Value Index
3.61– 13.29+ 51.97+ 11.49+Russell 2000 Index
2.38+ 17.99+ 36.45+ 18.16+S&P 500 Index
34935.47
4395.26Standard & Poor's 500 Index
Dow Jones Industrial Average
Returns greater than one year are annualized.Investing in small and mid cap stocks is more risky and more volatile than investing in large cap stocks. The intrinsic value of the stocks in which the portfolio invests maynever be recognized by the broader market. The portfolio is often concentrated in fewer sectors than its benchmarks, and its performance may suffer if these sectorsunderperform the overall stock market. Investing in equity stocks is risky and subject to the volatility of the markets. Past performance does not guarantee future results.Results shown may be preliminary.Results are shown gross of advisory fees, assume reinvestment of dividends and other earnings, and are net of transaction costs. Client return will be reducedby the advisory fees and any other expenses it may incur in the management of its investment advisory account. Fee information is available upon request andmay also be found in Ariel Investments, LLC’s Form ADV, Part 2. Advisory fees are deducted quarterly. The effect of advisory fees upon performance isillustrated by the following example: A 1.00% annual fee (.25% quarterly) deducted from an account with a 5-year annualized growth rate of 9.5% will producea net result of 8.42%. Actual performance will vary from this example. Results are reported in U.S. dollars. Index returns reflect reinvested dividends and otherearnings. The Composite differs from its benchmark with fewer holdings concentrated in fewer sectors.The figures above for the Dow Jones Industrial Average and the Standard & Poor's 500 Index represent their respective closing values as of the effective dateof this report.
19
THREE: VALUE
19Slow and steady wins the race.

THREE: VALUE
20Slow and steady wins the race.
ARIEL SMALL CAP VALUE
Performance resultsAs of 07/31/21
Last 5 Years07/31/16 –07/31/21
Last 10 Years07/31/11 –07/31/21
Since Inception09/30/83 –07/31/21
+Gross of Fees + 13.16%+ 12.39%15.96%
11.61+ 10.82+ 10.81+Russell 2000 Value Index
14.28+ 12.34+ 9.75+Russell 2000 Index
17.35+ 15.35+ 11.66+S&P 500 Index
34935.47
4395.26Standard & Poor's 500 Index
Dow Jones Industrial Average
Returns greater than one year are annualized.Investing in small and mid cap stocks is more risky and more volatile than investing in large cap stocks. The intrinsic value of the stocks in which the portfolio invests maynever be recognized by the broader market. The portfolio is often concentrated in fewer sectors than its benchmarks, and its performance may suffer if these sectorsunderperform the overall stock market. Investing in equity stocks is risky and subject to the volatility of the markets. Past performance does not guarantee future results.Results shown may be preliminary.Results are shown gross of advisory fees, assume reinvestment of dividends and other earnings, and are net of transaction costs. Client return will be reducedby the advisory fees and any other expenses it may incur in the management of its investment advisory account. Fee information is available upon request andmay also be found in Ariel Investments, LLC’s Form ADV, Part 2. Advisory fees are deducted quarterly. The effect of advisory fees upon performance isillustrated by the following example: A 1.00% annual fee (.25% quarterly) deducted from an account with a 5-year annualized growth rate of 9.5% will producea net result of 8.42%. Actual performance will vary from this example. Results are reported in U.S. dollars. Index returns reflect reinvested dividends and otherearnings. The Composite differs from its benchmark with fewer holdings concentrated in fewer sectors.The figures above for the Dow Jones Industrial Average and the Standard & Poor's 500 Index represent their respective closing values as of the effective dateof this report.

THREE: VALUE
21Slow and steady wins the race.
ARIEL SMALL CAP VALUE
Sector attribution analysisFor the time period from 06/30/21 - 07/31/21
Russell ICB IndustryPortfolio
WeightBench
WeightPortfolio
ReturnBench
ReturnAllocation
EffectSelection+Interaction
TotalEffect
BENCHMARK: Russell 2000 Value Index
Consumer Discretionary 33.31 13.42 -1.84 -8.67 -1.02 2.32 1.31
Industrials 33.98 14.83 0.37 -1.64 0.39 0.69 1.07
Financials 13.76 24.95 4.85 -2.66 -0.11 1.03 0.93
Health Care 3.65 10.88 -0.30 -6.71 0.23 0.24 0.47
Energy 3.46 6.40 -13.64 -10.95 0.24 -0.11 0.12
Cash 1.95 0.00 0.00 0.00 0.09 0.00 0.09
Technology 2.69 4.26 -2.51 -3.29 -0.01 0.02 0.01
Consumer Staples 0.00 2.62 0.00 -3.43 -0.01 0.00 -0.01
Telecommunications 0.00 1.52 0.00 -2.40 -0.02 0.00 -0.02
Real Estate 2.99 11.85 13.87 1.64 -0.47 0.37 -0.10
Utilities 3.09 4.85 -1.40 1.92 -0.09 -0.10 -0.20
Basic Materials 1.12 4.42 -12.63 -0.34 -0.12 -0.14 -0.26
Total 100.00 100.00 -0.17 -3.59 -0.88 4.30 3.42
Source: FactSet
Total portfolio return shown does not represent the performance of the Ariel Small Cap Value Tax Exempt Composite for the period. The portfolio holdings composing the sectors shown are of the representative account of the Ariel Small Cap Value strategy and is not reflective of the portfolio holdings of the composite, of clients as a whole, or of the strategy. The representative account was selected because it has no client-imposed restrictions and it has minimal planned contributions and withdrawals. The portfolio holdings would differ from those of another client account if different client-imposed restrictions were applied, and also may vary from other differences such as cash flow. The portfolio return for each sector reflects the returns of the stocks in the sector before the deduction of transaction costs or advisory fees. A portion of the benchmark’s holdings that are not assigned to a sector may be excluded from the analysis.

THREE: VALUE
22Slow and steady wins the race.
ARIEL SMALL CAP VALUE
Sector attribution analysisFor the time period from 12/31/20 - 07/31/21
Russell ICB IndustryPortfolio
WeightBench
WeightPortfolio
ReturnBench
ReturnAllocation
EffectSelection+Interaction
TotalEffect
BENCHMARK: Russell 2000 Value Index
Health Care 5.33 6.82 33.53 13.26 0.37 0.71 1.07
Financials 13.29 26.00 23.35 18.71 0.39 0.44 0.83
Real Estate 2.78 9.21 50.01 22.17 0.01 0.63 0.63
Basic Materials 1.51 5.50 43.87 27.00 -0.15 0.58 0.42
Consumer Staples 0.00 3.13 0.00 11.32 0.33 0.00 0.33
Technology 2.55 5.31 25.97 16.25 0.21 0.10 0.31
Telecommunications 0.00 1.33 0.00 15.74 0.09 0.00 0.09
Utilities 3.11 4.25 1.76 5.26 0.18 -0.10 0.08
Cash 1.82 0.00 0.02 0.00 -0.43 0.00 -0.43
Energy 3.95 5.30 23.99 45.88 0.20 -0.77 -0.57
Industrials 33.13 15.93 18.70 20.51 -0.03 -0.58 -0.61
Consumer Discretionary 32.53 17.23 9.62 34.83 1.67 -7.51 -5.84
Total 100.00 100.00 18.46 22.15 2.82 -6.51 -3.68
Source: FactSet
Total portfolio return shown does not represent the performance of the Ariel Small Cap Value Tax Exempt Composite for the period. The portfolio holdings composing the sectors shown are of the representative account of the Ariel Small Cap Value strategy and is not reflective of the portfolio holdings of the composite, of clients as a whole, or of the strategy. The representative account was selected because it has no client-imposed restrictions and it has minimal planned contributions and withdrawals. The portfolio holdings would differ from those of another client account if different client-imposed restrictions were applied, and also may vary from other differences such as cash flow. The portfolio return for each sector reflects the returns of the stocks in the sector before the deduction of transaction costs or advisory fees. A portion of the benchmark’s holdings that are not assigned to a sector may be excluded from the analysis.

Representative portfolioAs of 06/30/21
ARIEL SMALL CAP VALUE
Basic Materials
U.S. Silica Holdings, Inc.
Consumer Discretionary
Adtalem Global Education, Inc.
Interpublic Group of Cos., Inc.
Knowles Corp.
Madison Square Garden Entertainment Corp.
Madison Square Garden Sports Corp.
Mattel, Inc.
Matthews International Corp.
Meredith Corp.
Mohawk Industries, Inc.
MSG Networks, Inc.
Nielsen Holdings plc
Norwegian Cruise Line Holdings, Ltd.
OneSpaWorld Holdings, Ltd.
TEGNA, Inc.
Vail Resorts, Inc.
Energy
Core Laboratories N.V.
Energy (cont.)
MIND Technology, Inc.
Financials
BOK Financial Corp.
First American Financial Corp.
Horace Mann Educators Corp.
Janus Henderson Group plc
Lazard, Ltd.
Health Care
Charles River Laboratories International, Inc.
Envista Holdings Corp.
Industrials
ADT, Inc.
Brady Corp.
Brink's Co.
Kennametal, Inc.
Korn Ferry International
Littelfuse, Inc.
nVent Electric plc
Industrials (cont.)
Simpson Manufacturing Co., Inc.
Snap-on, Inc.
Team, Inc.
The Middleby Corp.
Real Estate
JLL
Technology
Methode Electronics, Inc.
Utilities
Stericycle, Inc.
23
THREE: VALUE
23Slow and steady wins the race.

24Slow and steady wins the race.
FIVE: APPENDIX
24
Executive leadershipJohn W. Rogers, Jr.Chairman, Co-CEO & CIO | Founded Ariel in 1983
LEAD PORTFOLIO MANAGER | Ariel Fund
CO - PORTFOLIO MANAGER | Ariel Small Cap Value, Ariel Small Cap Value Concentrated, Ariel Small/Mid Cap Value, Ariel Mid Cap Value and Ariel Appreciation Fund
John’s passion for investing began at age 12 when his father began buying him stocks as Christmas and birthday gifts. His interest in equities grew at Princeton University, where he majored in economics, and over the two-plus years he worked as a stockbroker for William Blair & Company, LLC. In 1983, John founded Ariel to focus on patient, value investing within small- and medium-sized companies. While our research capabilities have expanded across the globe, patience is still the disciplined approach that drives the rm today. Early in his career, John’s investment acumen brought him to the forefront of media attention and culminated in him being selected as Co-Mutual Fund Manager of the Year by Sylvia Porter’s Personal Finance magazine as well as an All-Star Mutual Fund Manager by USA TODAY. Furthermore, John has been highlighted alongside legendary investors Warren Buffett, Sir John Templeton and Ben Graham in the distinguished book: The World’s 99 Greatest Investors by Magnus Angenfelt. His professional accomplishments extend to the boardroom where he is a member of the board of directors of McDonald’s, NIKE and The New York Times Company. John also serves as vice chair of the board of trustees of the University of Chicago. Additionally, he is a member of the American Academy of Arts and Sciences, and a director of the Robert F. Kennedy Center for Justice and Human Rights. In 2008, John was awarded Princeton University’s highest honor, the Woodrow Wilson Award, presented each year to the alumnus or alumna whose career embodies a commitment to national service. Following the election of President Barack Obama, John served as co-chair for the Presidential Inaugural Committee 2009, and more recently, he joined the Barack Obama Foundation’s Board of Directors. John received an AB in economics from Princeton University, where he was also captain of the varsity basketball team.
Mellody HobsonCo-CEO & president | Joined Ariel in 1991
As Co-CEO, Mellody is responsible for management, strategic planning and growth for all areas of Ariel Investments outside of research and portfolio management. Additionally, she serves as Chairman of the Board of Trustees of the Ariel Investment Trust—the company’s publicly traded mutual funds. Prior to being named Co-CEO, Mellody spent nearly two decades as the rm’s President. Outside of Ariel, Mellody is a nationally recognized voice on nancial literacy. Her leadership has also been invaluable to corporate boardrooms across the nation. She currently serves as Chair of the Board of Starbucks Corporation. She is also a director of JPMorgan Chase. She previously served as Chairman of the Board of DreamWorks Animation until the company’s sale and was also a long-standing board member of the Estée Lauder Companies. Mellody’s community outreach includes her role as Chairman of After School Matters, a Chicago non-pro t that provides area teens with high-quality after school and summer programs. Additionally, she is vice chair of World Business Chicago; co-chair of the Lucas Museum of Narrative Art; and a board member of the George Lucas Education Foundation and Bloomberg Philanthropies. She also serves on the board of trustees of the Center for Strategic & International Studies, and of the Los Angeles County Museum of Art (LACMA). Mellody is a member of the American Academy of Arts and Sciences, The Rockefeller Foundation Board of Trustees, and serves on the executive committee of the Investment Company Institute. Mellody earned her AB from Princeton University’s Woodrow Wilson School of International Relations and Public Policy. In 2019, she was awarded the University’s highest honor, the Woodrow Wilson Award, presented annually to a Princeton graduate whose career embodies a commitment to national service. She has also received honorary doctorate degrees from Howard University, Johns Hopkins University, St. Mary’s College, and the University of Southern California. In 2015, Time Magazine named her one of the “100 Most In uential People” in the world.

25Slow and steady wins the race.
FIVE: APPENDIX
25
Domestic portfolio managementCharles K. BobrinskoyVice chairman, head of investment group | Joined Ariel in 2004
PORTFOLIO MANAGER | Ariel Focused Value and Ariel Focus Fund
Charlie manages our focused value strategy—an all-cap, concentrated portfolio of U.S. stocks. He also spearheads Ariel’s thought leadership efforts and takes an active role in representing Ariel’s investment strategies with prospective investors, clients and major media. Prior to joining Ariel in 2004, Charlie spent 21 years as an investment banker at Salomon Brothers and its successor company Citigroup, where he rose to managing director and head of North American investment banking branch of ces. Charlie actively serves the Chicago community, sitting on the corporate board of State Farm Mutual Automobile Insurance Company and ACI Worldwide as well as the boards of the Museum of Science and Industry, the Abraham Lincoln Presidential Library Foundation Board, the Big Shoulders Fund and the Chicago Club. He also teaches monthly investing classes at two Chicago inner-city schools. Charlie graduated with an AB in economics from Duke University and earned an MBA from the University of Chicago.
Kenneth E. Kuhrt, CPAExecutive vice president | Joined Ariel in 2004
CO - PORTFOLIO MANAGER | Ariel Small Cap Value and Ariel Small
Cap Value Concentrated
PORTFOLIO MANAGER | Ariel Fund
Ken serves as co-portfolio manager of our small cap value and small cap value concentrated strategies. Additionally, his portfolio management responsibilities extend to our agship Ariel Fund. In his research capacity, Ken covers consumer services and industrials. Prior to joining Ariel as a research analyst in 2004, he spent more than two years with William Blair & Company, LLC, most recently as a senior investment banking analyst. Ken also worked as a senior auditor at KPMG, LLP. He earned a BS in accounting from the University of Illinois at Urbana-Champaign and an MBA from the University of Chicago, and he is also a Certi ed Public Accountant.
Timothy Fidler, CFA® Executive vice president, director of research | Joined Ariel in 1999
CO - PORTFOLIO MANAGER | Ariel Mid Cap Value and Ariel
Appreciation Fund
Tim is responsible for overseeing all of our domestic equity team’s research output, including chairing our investment committee meetings. He also serves as co-portfolio manager for our mid cap value strategy. As a research analyst, he currently specializes in nancial services companies. Prior to joining Ariel in 1999, Tim was a research analyst and portfolio manager at Morgan Stanley asset management in U.S. value equity. In 2007, he graduated from the Fellowship Program of Leadership Greater Chicago, an initiative to educate and connect emerging leaders in Chicago. In 2008, Institutional Investor magazine recognized him as one of 20 rising stars in the industry. Tim graduated Phi Beta Kappa from Northwestern University with a BA with honors in Economics and earned his MBA with high honors from the University of Chicago.
John P. Miller, CFA® Senior vice president | Joined Ariel in 1989
CO - PORTFOLIO MANAGER | Ariel Small/Mid Cap Value
PORTFOLIO MANAGER | Ariel Fund
John serves as co-portfolio manager for our small/mid cap value strategy as well as portfolio manager for Ariel Fund, our complementary mutual fund. He has been an integral part of Ariel’s investment team for nearly 30 years and has conducted stock analysis for that entire period. John’s current research focus is on the asset management and media segments of the market. Prior to joining Ariel in 1989, John worked for Cantor Fitzgerald & Co. in its institutional equity division. He earned a BB in management from Western Illinois University and an MBA from the University of Chicago. Additionally, John is a member of the CFA Institute and the CFA Society of Chicago.

26Slow and steady wins the race.
FIVE: APPENDIX
26
Domestic research Sabrina Carollo, CFA | Senior vice president, director of research operationsSabrina oversees the department’s broker relationships. As a research analyst she specializes in health care and of ce supply companies. Prior to joining Ariel in 2001, she spent seven years at William Blair & Company, LLC, mainly as a research associate. Sabrina is a member of the CFA Institute and the CFA Society of Chicago. She is also a member of Rush University Medical Center’s Associates Board. Sabrina graduated from Ball State University with a BA in accounting and earned her MBA in healthcare management from Loyola University.
John Oxtoby |Senior vice president, director of ESG investingJohn leads Ariel’s efforts to integrate environmental, social, and governance research into our investment process. Under his direction and in concert with our core domestic ESG research analyst, he proactively works with portfolio companies to adopt and strengthen their social and environmental impacts, and improve governance practices to create shareholder value. Prior to joining Ariel, John worked in the White House with Senior Advisor Valerie Jarrett and Chairman of the Council of Economic Advisers Austan Goolsbee, on public-private partnerships, including the CEO-led President’s Jobs Council. John is an FSA Credential holder, which is administered by the Sustainability Accounting Standards Board (SASB). He graduated with a BA in economics from Harvard College and earned an MBA from Harvard Business School.
James Kenny, CFA |Vice president, researchJim focuses on services and industrials as a research analyst. He joined Ariel in 2008 as a summer intern and returned as a full-time research analyst in 2010. Previously, he served as a managing consultant for Navigant Consulting for three years. He is a member of the CFA Institute and the CFA Society of Chicago. Jim graduated summa cum laude with a BBA in nance from the University of Notre Dame and earned his MBA with honors distinction from the Wharton School at the University of Pennsylvania.
Danan Kirby, CFA |Vice president, client portfolio managerDanan is a Client Portfolio Manager for the domestic equity research team. In this role, he serves as a liaison for the investment team and key investment decision-makers, communicating the process and results of the rm’s domestic investment strategies. Prior to joining Ariel, Danan was a Client Portfolio Manager for Thornburg Investment Management, covering both equities and xed income. Prior to that role, he was a portfolio manager for Strategic Growth Bancorp managing multi-asset strategies for institutional clients. Earlier in his career, he served as a federal banking regulator at the Federal Deposit Insurance Corporation during the nancial crisis. Danan is also a combat veteran of the U.S. Army. He graduated summa cum laude from the University of New Mexico’s Anderson School of Management with a BBA, concentrating in nance. He is a CFA charterholder.
Jamil Soriano | Vice president, researchJamil focuses on consumer products & services and nancial services as a research analyst. He joined Ariel full-time in July 2012 after participating in our summer internship program in 2011. Prior to Ariel, he worked in the investment banking and debt capital markets divisions at Credit Suisse Securities, and later as an investment analyst for Brown Bear Capital Management LLC. Before entering the nancial services industry, he was a player for several teams in the National Football League, including a season with the 2003-04 Super Bowl winning New England Patriots. Jamil earned his AB in biological sciences from Harvard and his MBA with honors from the University of Chicago.
Aaron Bianco, CFA | Research analystAaron focuses on the infrastructure and technology sectors as a research analyst. He joined Ariel in 2014 as a summer intern and returned as a full-time research analyst in 2015. Prior to joining the rm, he served as an investment banking analyst at Barclays and corporate attorney at Jones Day. Aaron graduated with a BA in politics from Princeton University. Additionally, he earned his MBA in analytic nance and accounting from the University of Chicago, and holds a JD from the University of California, Berkeley, School of Law. Aaron is also a member of American Mensa, Ltd.
Conner Chapman | ESG research associateConner works on all aspects of the Domestic Research Team’s ESG process including engagement/meeting tracking, correspondence including diverse board recommendations, data management, ESG research, project management, and other strategic projects. Prior to joining Ariel in 2019, he was an intern with The University of Virginia Law Foundation, the CFA Society Chicago and The University of Chicago Of ce of Investments. Conner earned a BA in Economics from The University of Chicago.

27Slow and steady wins the race.
FIVE: APPENDIX
Domestic tradingCheryl Cargie | Senior vice president, head trader
With over 30 years of trading experience, Cheryl is Ariel’s head domestic trader. Prior to joining the rm in 1994, she was vice president and head trader at Fiduciary Management Associates. In this capacity, she was the rm’s principal trader of both equities and xed income securities. Prior to her tenure at Fiduciary Management, Cheryl was an equity trader at Aon Corporation. She is an active member of NASDAQ’s Institutional Traders Advisory Council and a member of the National Organization of Investment Professionals. In 2013, Cheryl was honored with The Lifetime Achievement Award from the Securities Traders’ Association of Chicago (STAC), where she also served as a past president. Traders Magazine also recognized her industry experience and commitment to excellence in 2015 with The Lifetime Achievement Award. Outside of Ariel, Cheryl is involved in her community, where she is a Commissioner of the River Forest Park District Board. Cheryl graduated from Illinois State University with a BS in nance.
Jill Gracia | Vice president, senior trader
With more than 15 years of experience, Jill trades Ariel’s institutional, mutual fund and wrap accounts. Jill began her career in the trading department at Ariel and then moved on to Allstate and Oak Ridge Investments, where she was vice president and senior trader, specializing in illiquid small-cap stocks along with mid- and large-cap equities. A member of the Security Traders Association of Chicago, Jill earned her BBA in nance from the University of Iowa.

28Slow and steady wins the race.
FIVE: APPENDIX
28
Marketing and client servicesAriel Prior
Jennifer DiGrazia Senior vice president, head of institutional client & investor relations
Client service & investor relations 2019 DreamWorks Animation, DIRECTV University of Connecticut, BS
Valerie King Senior vice president, institutional marketing
Institutional/advisor markets 2018 Holland Capital Management, T. Rowe Price
Clark Atlanta University, MBAIllinois Institute of Technology, BA
Malik T. Murray Senior vice president, head of business development
Institutional/advisor markets 2004 Bank One Brokerage DePaul University, MBA, BA
Bonnie E. Orlowski Senior vice president, head of consultant relations & nancial intermediaries
Consultant relations, nancial intermediaries
2016 AllianceBernstein L.P. Bucknell University, BA
Melissa Smith Senior vice president, consultant relations
Consultant relations 2015 Deutsche Bank, Calamos Investments
Illinois State University, BA
Ian M. Webber Senior vice president, institutional marketing, head of Asia Paci c & MENA
Institutional market/Asia Paci c & MENA
2015 Artio Global Investors, AXA Rosenberg Investment Management
University of Newcastle, BEc; Securities Institute of Australia, Graduate Diploma in Applied Finance and Investment
Camille El-Amin Vice president, institutional client & investor relations
Client service 2007 JPMorgan Private Bank Spelman College, BA
Taylor Goodridge Vice president, institutional marketing Institutional/advisor markets 2017 GE Capital Smith College, BA
Patrice L. Scelzo Vice president, institutional client & investor relations
Client service 1999 Northwest Airlines University of St.Thomas, BA
Arielle Patrick Chief communications of cer Communications 2020 Edelman, Weber Shandwick Princeton University, AB
NAME TITLE FOCUS EXPERIENCE EDUCATION

Business administrationAriel Prior
Carlos E. Calderon Chief nancial of cer 2021 Eaton Vance; State Street Global Advisors; BNY Mellon
University of Massachusetts, BA
Mary Cecola Chief technology of cer 2019 Antares Capital; FHLB Des Moines; Deutsche Bank
Northern Illinois University, MS, BS
Mareilé B. Cusack General counsel 2007 Chicago Stock Exchange; Securities and Exchange Commission
University of Virginia School of Law, JD; University of Pennsylvania, BA
Wendy D. Fox Chief compliance of cer 2004 Securities and Exchange Commission Washington University in St. Louis, JD; University of Michigan, BA
Marlo J. Gaal Chief talent of cer 2020 Groupon Inc., Hyatt Hotels Corporation; Of ceMax, Inc.
Northern Illinois University, BS
James R. Rooney, CPA® Senior vice president, fund administration
2015 Fidelity; Wellington Management Company
Northeastern University, MS; Williams College, BA
Kenneth T. Slovin Senior vice president, director of global operations
2016 BMO Global Asset Management, Batterymarch FinancialManagement, Inc.
University of Massachusetts, BS
NAME TITLE EXPERIENCE EDUCATION
29Slow and steady wins the race.
FIVE: APPENDIX
29

ARIEL SMALL CAP VALUE TAX-EXEMPT COMPOSITE
GIPS Composite Report For the period from 01/01/11 – 12/31/20
Year end Gross Annual
Return Net Annual
Return Russell 2000 Value Index
3-Year Annualized Standard Deviation
Composite Dispersion
Number of Portfolios
Composite Assets
($ millions)
Total Firm Assets
($ millions) Composite Benchmark
2011 -10.61% -11.49% -5.50% 31.25% 26.05% 0.27 18 600.3 4,383.7
2012 21.62% 20.41% 18.05% 23.48% 19.89% 0.45 20 692.2 4,860.5
2013 37.57% 36.21% 34.52% 18.99% 15.82% 0.65 26 965.6 8,992.0
2014 7.29% 6.23% 4.22% 13.45% 12.79% 0.17 26 907.3 10,041.9
2015 -10.19% -11.08% -7.47% 15.29% 13.46% 0.26 26 798.3 10,133.2
2016 20.72% 19.53% 31.74% 16.61% 15.50% 0.27 20 690.3 10,967.5
2017 15.12% 13.98% 7.84% 15.43% 13.97% 0.27 24 538.5 13,132.2
2018 -13.44% -14.29% -12.86% 15.89% 15.76% 0.20 26 468.2 11,565.9
2019 27.52% 26.26% 22.39% 16.92% 15.68% 0.21 20 534.8 13,217.1
2020 19.74% 18.55% 4.63% 27.93% 26.12% 0.58 18 628.6 14,582.7
1. Ariel Investments claims compliance with the Global Investment Performance Standards (GIPS®) and has prepared and presented this report in compliance with the GIPS standards. Ariel Investments has been independently verified for the period from April 1, 1990 through December 31, 2020. A firm that claims compliance with the GIPS standards must establish policies and procedures for complying with all the applicable requirements of the GIPS standards. Verification provides assurance on whether the firm’s policies and procedures related to composite and pooled fund maintenance, as well as the calculation, presentation, and distribution of performance, have been designed in compliance with the GIPS standards and have been implemented on a firm-wide basis. The Ariel Small Cap Value Tax-Exempt Composite has had a performance examination for the periods October 1, 1983 through December 31, 2020. The verification and performance examination reports are available upon request. GIPS® is a registered trademark of CFA Institute. CFA Institute does not endorse or promote this organization, nor does it warrant the accuracy or quality of the content contained herein. Past performance is no guarantee of future results. 2. Ariel Investments, LLC (“Ariel”), a Delaware limited liability company, is a federally registered investment adviser regulated by the U.S. Securities and Exchange Commission. Ariel is headquartered in Chicago, Illinois, and has offices in New York, New York, and Sydney, NSW, Australia. Ariel offers investment strategies that seek long-term capital appreciation by investing primarily in equity securities. Ariel utilizes a bottom-up, fundamental analysis to select quality company stocks. Taking a long-term view and applying independent thinking to investment decisions, Ariel spans the market cap spectrum from micro to large and covers the globe with international and global offerings.
30Slow and steady wins the race.
FIVE: APPENDIX

ARIEL SMALL CAP VALUE TAX-EXEMPT COMPOSITE
GIPS Composite Report, continued 3. The Ariel Small Cap Value Tax-Exempt Composite includes all discretionary, fee-paying, commission-paying, non-wrap small cap tax-exempt portfolios that are invested in the small cap value strategy. This strategy seeks long-term capital appreciation by investing in small cap undervalued companies that show strong potential for growth. The portfolio invests primarily in equity securities of U.S. companies that, at the time of initial purchase for the strategy, have market capitalizations within the range of the companies in the Russell 2000® Index. As of December 31, 2020, the market capitalizations of the companies in the Russell 2000 Index ranged from $43 million to $13.40 billion. Over time, the market capitalizations for the strategy’s portfolio companies will change. This means that the strategy could continue to invest in (hold and purchase) a company if its capitalization were to move outside the range. To maintain the strategy’s small cap characteristic, Ariel has adopted procedures to eliminate companies, over time, that Ariel views as substantially outside the strategy’s small cap range. Effective January 1, 2020, the Ariel Small Cap Value Tax-Exempt Composite was redefined to no longer exclude pooled funds in accordance with GIPS 2020. A list of composite and limited distribution pooled fund descriptions, a list of broad distribution pooled funds, and policies for valuing investments, calculating performance, and preparing GIPS Reports are available upon request. The composite was created in January 1993. The composite’s inception date is 09/30/1983. 4. The 3-year annualized ex-post standard deviation measures the variability of the composite’s gross returns and the benchmark over the preceding 36-month period. 5. Performance results are net of transaction costs and reflect the reinvestment of dividends and other earnings. Net returns reflect the deduction of the maximum advisory fee in effect for the respective period, which is currently 1.00% per annum. Actual fees may vary depending on, among other things, the applicable fee schedule and portfolio size. Results are reported in U.S. dollars. 6. The standard fee schedule currently in effect is as follows: 1.00% on the first $10 million; 0.75% on the next $10 million; and 0.50% above $20 million. 7. The dispersion of annual returns is measured by the standard deviation of asset-weighted gross portfolio returns represented within the composite for the full year. For those periods with one or fewer portfolios included for the entire year, dispersion is not presented. 8. The Russell 2000® Value Index measures the performance of the small-cap value segment of the U.S. equity universe. It includes those Russell 2000 companies with lower price-to-book ratios and lower forecasted growth values. The Ariel Small Cap Value Tax-Exempt Composite differs from its benchmark with fewer holdings concentrated in fewer sectors. The Russell 2000 Value Index returns reflect the reinvestment of income and other earnings, are provided to represent the investment environment during the time period shown, and are not covered by the report of independent verifiers.
31Slow and steady wins the race.
FIVE: APPENDIX

Disclosures Indexes are unmanaged. An investor cannot invest directly in an index. MSCI ACWI (All Country World Index) Index is an unmanaged, market-weighted index of global developed and emerging markets. MSCI EAFE Index is an unmanaged, market-weighted index of companies in developed markets, excluding the U.S. and Canada. MSCI ACWI (All Country World Index) ex-US Index is an unmanaged, market-weighted index of global developed and emerging markets, excluding the United States. MSCI Indices: The MSCI Indices’ net returns reflect the reinvestment of income and other earnings, including the dividends net of the maximum withholding tax applicable to non-resident institutional investors that do not benefit from double taxation treaties. MSCI uses the maximum tax rate applicable to institutional investors, as determined by the companies’ country of incorporation. Source: MSCI. MSCI makes no express or implied warranties or representations and shall have no liability whatsoever with respect to any MSCI data contained herein. The MSCI data may not be further redistributed or used to create indices or financial products. This report is not approved or produced by MSCI. The Russell 1000® Index measures the performance of the large-cap segment of the U.S. equity universe. The Russell 1000® Value Index measures the performance of the large-cap value segment of the U.S. equity universe. It includes those Russell 1000 companies with lower price-to-book ratios and lower expected growth values. The Russell 2000® Index measures the performance of the small-cap segment of the U.S. equity universe. The Russell 2000 Index is a subset of the Russell 3000® Index. It includes approximately 2,000 of the smallest securities based on a combination of their market cap and current index membership. The Russell 2000® Value Index measures the performance of the small-cap value segment of the U.S. equity universe. It includes those Russell 2000 companies with lower price-to-book ratios and lower forecasted growth values. The Russell 2500™ Index measures the performance of the small to mid-cap segment of the U.S. equity universe, commonly referred to as “smid” cap. The Russell 2500 Index is a subset of the Russell 3000® Index. It includes approximately 2,500 of the smallest securities based on a combination of their market cap and current index membership. The Russell 2500™ Value Index measures the performance of the small to mid-cap value segment of the U.S. equity universe. It includes those Russell 2500 companies with lower price-to-book ratios and lower forecasted growth values. The Russell Midcap® Index measures the performance of the mid-cap segment of the U.S. equity universe. The Russell Midcap Index is a subset of the Russell 1000® Index. It includes approximately 800 of the smallest securities based on a combination of their market cap and current index membership. The Russell Midcap® Value Index measures the performance of the mid-cap value segment of the U.S. equity universe. It includes those Russell Midcap Index companies with lower price-to-book ratios and lower forecasted growth values. Russell Indices: Frank Russell Company (“Russell”) is the source and owner of the trademarks, service marks and copyrights related to the Russell Indexes. Russell® is a trademark of Frank Russell Company. Neither Russell nor its licensors accept any liability for any errors or omissions in the Russell Indexes or underlying data and no party may rely on any Russell Indexes and/or underlying data contained in this communication. No further distribution of Russell data is permitted without Russell’s express written consent. Russell does not promote, sponsor or endorse the content of this communication. The S&P 500® Index is the most widely accepted barometer of the market. The sectors shown for the Global strategies are the Global Industry Classification Standard (“GICS”) sector classifications. GICS was developed by and is the exclusive property and a service mark of MSCI Inc. (“MSCI”) and Standard & Poor’s, a division of The McGraw-Hill Companies, Inc. (“S&P”) and is licensed for use by Ariel Investments, LLC. Neither MSCI, S&P nor any third party involved in making or compiling the GICS or any GICS classifications makes any express or implied warranties or representations with respect to such standard or classification (or the results to be obtained by the use thereof), and all such parties hereby expressly disclaim all warranties of originality, accuracy, completeness, merchantability and fitness for a particular purpose with respect to any of such standard or classification. Without limiting any of the foregoing, in no event shall MSCI, S&P, any of their affiliates or any third party involved in making or compiling the GICS or any GICS classifications have any liability for any direct, indirect, special, punitive, consequential or any other damages (including lost profits) even if notified of the possibility of such damages.
32Slow and steady wins the race.
FIVE: APPENDIX

CCM Compliance Approved: 9/3/2021
Small-Cap Value Strategy Presentation to:
September 8, 2021

I. Overview ………………................... 3
II. Investment Approach………….…… 8
III. Portfolio Overview……………...….. 17
IV. Competitive Edge………………...… 23
V. Biographies ………………………… 25
Table of Contents

» Founded in 2003 and headquartered in Chicago, IL
» Boutique firm specializing in domestic equity investing
» 100% Employee-owned
» Fundamental, concentrated, bottom-up, “intrinsic value”
investment philosophy
3
Channing Capital Profile

4
Senior Leadership
Rodney B. Herenton
Founder, Co-Chief Executive Officer,
Chief Business Development and
Strategy Officer
Wendell E. Mackey, CFA
Founder, Co-Chief Executive Officer,
Chief Investment Officer

Channing Assets Under Management (AUM)
5
AUM by Client Type:
(in millions)
StrategyAUM
(in millions)
# of
Accounts
% of
Market Value
Small-Cap Value $2,212 35 70.7%
SMID-Cap Value $556 15 17.8%
Large-Cap Value $158 4 5.1%
All-Cap Value $204 1 6.5%
Total $3,130 55 100%
The firm’s total AUM was $3.1 billion as of July 31, 2021:
Small-Cap Value$2,212
SMID-Cap Value$556
Large-Cap Value$158 All-Cap Value
$204
Corporate$285
Endowment/Foundation$79
Non-Profit/ Religious
$27
Public$2,574
Sub-Advised$151
Taxable Mutual Fund
$2
Union$12
StrategyAUM
(in millions)
# of
Accounts
% of
Market Value
Corporate $285 8 9.1%
Endowment/Foundation $79 10 2.5%
Non-Profit/Religious $27 2 0.9%
Public $2,574 32 82.2%
Sub-Advised $151 1 4.8%
Taxable Mutual Fund $2 1 0.1%
Union $12 1 0.4%
Total $3,130 55 100%
AUM by Strategy:
(in millions)

Channing Organizational Structure
6

Portfolio Management & ResearchAs of 7/31/2021
7
Investment Team Biography Sector Coverage
Wendell Mackey, CFAFounder, Co-CEOChief Investment Officer
• Senior Managing Director of Valenzuela Capital Partners, LLC• Portfolio Manager with Barnett Capital Advisors• Portfolio Manager with NCM Capital Management Group (Calvert Social Investment Managed
Growth Fund & Calvert CRI Balanced Fund)• BBA from Howard University; MM from J.L Kellogg School of Management, Northwestern
University
Lead Portfolio Manager:
Small and SMID-Cap Value
Strategies
Timothy Kroll, CFAPortfolio ManagerSenior Equity Analyst
• Director of InView Investment Management, LLC• Vice President at ABN AMRO Asset Management Holdings, Inc.• BS in Finance from Southern Illinois University; MM from the J.L Kellogg School of Management,
Northwestern University
Communication Services,
Consumer Discretionary,
Consumer Staples
Matt Betourney, CFAPortfolio ManagerSenior Equity Analyst
• Senior Research Analyst at Susquehanna Investment Group• Senior Research Analyst at Wintrust Capital Management• BBA in Finance from the University of Iowa; MBA from the Booth School of Business, University
of Chicago
Industrials, Materials
Kevin Reynolds, CFAAssociate Portfolio ManagerFinancial Services Specialist
• Senior Vice President at Wunderlich Securities, Inc.• Equity Analyst at Morgan Keegan & Co., Janney Montgomery Scott, and Stanford Group• BBA in Finance from Memphis State University (now University of Memphis); MBA from the
Fogelman College of Business and Economics, University of Memphis
Financial Services, Real
Estate, Utilities
Anthony Hipple, CFAPortfolio ManagerSenior Equity Analyst
• Portfolio Manager and Senior Equity Analyst at Lord Abbett & Company• Senior Research Analyst at Piper Jaffray Investment,. and Thrivent Investment Management, Inc.• BA in Business from the University of Northern Iowa; MBA from the Tippie College of Business at
the University of Iowa
Health Care, Information
Technology
Derik Coffey, CFAClient Portfolio Manager
• Portfolio Specialist at Herndon Capital Management• Analyst at UBS Financial Services in the Manager Research Group• BA from Tuskegee University; Master of Science from Georgetown University
Energy

Investment Approach
8

Philosophy
» Channing’s investment strategy is strongly influenced by notable value investing practitioners
such as Warren Buffett
» Like Buffett, we look to find value opportunities in “good” businesses, but also look at the
broad spectrum of sectors and industries
» Our portfolios are concentrated usually with investments in 40 – 50 companies in which we
feel there is long-term unrecognized value – Best Ideas
» Portfolio companies are high-quality investments that have:
• strong market positions
• solid balance sheets / produce free cash flow
• capable management teams with records of past performance
» We utilize a sell discipline that includes a risk management overlay to help avoid value traps,
and protect investor capital
» Our strategy tends to perform best during the mid and late market cycles when high-quality
investing usually shines as economic growth normalizes and matures
9

Quality CompaniesPositioned for Earnings and Cash Flow Growth
10

Investment StrategyIdentify Misunderstood Companies
11

Investment StrategyIntrinsic Value Approach
12
Channing’s intrinsic value approach evaluates a prospective company by applying suitable
valuation techniques, including:

CCM Process OverviewFundamental Research-Driven
*Universe includes the Russell 2000 Value Index and a proprietary database of companies Channing knows well.
13

ESG Integration
14
We view environmental, social and governance (“ESG”) integration as a key consideration in our investment process as we evaluate the
overall risk and return profile of our investments. Channing Capital is in the process of formally establishing an ESG framework for reviewing
material risks and opportunities that is complementary to the team’s overall fundamental analysis.
ESG Integration
» By evaluating both the ESG risks and opportunities across a company’s operations, Channing can assess a company’s ability to create
long-term shareholder value.
» Channing will primarily rely upon its investment team to conduct proprietary ESG research in-house, weighing the material factors for a
given company and industry, and engaging with C-suite executives to discuss these key risk factors to make more informed investment
decisions.
» ESG risks and opportunities will be evaluated through the investment process and monitored across portfolios.
Effective Stewardship
» Active engagement with C-suite executives and the use of proxy voting are both important means for effective stewardship.
» Active engagement with the management teams for all owned portfolio companies is a core tenet to Channing’s overall investment
process, as the investment team engages in regular dialogue on all matters related to corporate strategy; financial performance; capital
allocation; risk management; and environmental, social and governance conduct.
Diversity: The Underpinning of our Competitive Excellence
Diversity is at the core of our guiding principles at Channing Capital Management. We remain dedicated as a firm to providing opportunities
to women and minorities and support diversity and inclusion at all levels.
» This is not only evident by Channing’s diverse workforce mix but also by its consistent track record of recruiting a diverse pool of
candidates.
» CCM also makes a good-faith effort to use third-party vendors who are businesses owned and / or managed by female founders or
minorities.

The following circumstances will trigger a stock sell:
Sell DisciplineThoughtful, Careful Decisions
15

» Portfolios overseen by Management Committee
» Diversify to prevent industry, sector or theme concentration
» Employ strict valuation parameters through buy/sell discipline
» Enforce maximum position sizes
Risk ControlsStrict, Diligent Measures
16

Portfolio Overview
17

1, 2, 3, 4
Small-Cap Value Composite6/30/2006 – 7/31/2021
18
16.92%
57.10%
10.48%12.57%
10.81%12.45%
10.30%
16.63%
56.36%
9.85%11.93%
10.17%11.79%
9.68%
22.16%
63.70%
8.30%
11.61%9.67%
10.82%
7.59%
Year-to-Date 1 Year 3 Year 5 Year 7 Year 10 Year Since Inception
Gross of Fees Net of Fees Russell 2000 Value Index
1 Inception date for the Small-Cap Value composite account is 06/30/06. Channing claims compliance with the GIPS standards and has received a firm wide verification covering the
period 7/1/04 – 12/31/20. Refer to page 21 through 22 for GIPS compliant presentation.
2 Annualized.
3 Preliminary through 7/31/2021
4 Past performance is no guaranty of future returns

Representative Small-Cap Value Portfolio as of 7/31/2021
1 REIT multiples are calculated using Price/FFO
2 Channing’s Small-Cap Value beta is relative to the Russell 2000 Value Index.
3 5-year Beta.
Source: Bloomberg
CHARACTERISTICS CHANNINGRUSSELL 2000
VALUE INDEX
Weighted Average Market Capitalization $3.9 B $2.8 B
Number of Holdings 45 1376
Price/Book 2.4 1.9
Forward Price to Earnings¹ 15.7 19.3
Beta 2,3 1.02 1.00
Dividend Yield (%) 1.46 2.69
Normalized ROE (%) 13.4 7.3
Characteristics
19

Source: Bloomberg
Representative Small-Cap Value Portfolio as of 7/31/2021
SECTOR CHANNINGRUSSELL 2000
VALUE INDEX
Communication Services 3.6% 3.9%
Consumer Discretionary 14.4% 8.3%
Consumer Staples 4.4% 2.8%
Energy 4.5% 6.1%
Financials 18.3% 25.5%
Health Care 7.9% 11.0%
Industrials 27.2% 15.4%
Information Technology 11.4% 5.5%
Materials 6.2% 4.9%
Real Estate 2.1% 11.8%
Utilities 0.0% 4.9%
Sector Weightings
20

Small-Cap ValueRussell 2000 Value
Index
Gross of Fees Net of Fees Russell 2000 Number of Dispersion 3-Year Ex-Post 3-Year Ex-PostTotal Composite
AssetsTotal Firm Assets
Total
Return***
Total
Return***Value Index** Portfolios %**
Standard Deviation
(%)**
Standard Deviation
(%)**($ in Millions) ($ in Millions)
2006 (6 months) 16.59% 16.59% 11.81% 1 N/A N/A N/A 12 593
2007 4.20% 3.59% -9.78% 1 N/A N/A N/A 14 652
2008 -32.74% -33.08% -28.92% 5 N/A N/A N/A 34 488
2009 23.22% 22.57% 20.58% 12 0.13% N/A N/A 149 666
2010 33.02% 32.29% 24.50% 13 0.11% N/A N/A 216 832
2011 -5.82% -6.45% -5.50% 13 0.13% 24.27% 26.04% 190 858
2012 22.95% 22.17% 18.05% 16 0.09% 21.21% 19.89% 366 973
2013 39.54% 38.77% 34.52% 26 0.02% 17.20% 15.82% 787 1,568
2014 5.46% 4.82% 4.22% 25 0.07% 13.16% 12.79% 828 1,982
2015 -4.44% -4.95% -7.47% 32 0.25% 14.62% 13.46% 1,143 2,294
2016 29.48% 28.71% 31.74% 34 0.07% 16.71% 15.50% 1,487 2,856
2017 7.61% 6.98% 7.84% 26 0.16% 15.25% 13.97% 1,557 3,047
2018 -16.59% -17.10% -12.86% 20 0.06% 16.87% 15.76% 1,012 2,038
2019 25.88% 25.14% 22.39% 24 0.11% 17.20% 15.68% 1,295 2,215
2020 17.57% 16.88% 4.63% 16 0.06% 27.32% 26.12% 1,098 2,497
Since Inception
(annualized)9.54% 8.93% 6.43% N/A N/A N/A N/A N/A N/A
Channing Capital Management, LLC (“Channing”) claims compliance with the Global Investment Performance Standards (GIPS®) and has prepared and presented this report in compliance with
the GIPS standards. Channing has been independently verified for the periods July 1, 2004 through December 31, 2020. “A firm that claims compliance with the GIPS standards must establish
policies and procedures for complying with all the applicable requirements of the GIPS standards. Verification provides assurance on whether the firm’s policies and procedures related to
composite and pooled fund maintenance, as well as the calculation, presentation, and distribution of performance, have been designed in compliance with the GIPS standards and have been
implemented on a firm-wide basis. The Small-Cap Value Composite has had a performance examination for the periods July 1, 2006 though December 31, 2020. The verification and
performance examination reports are available upon request”.
Notes: *Composite Performance as of 12/31/20
**Benchmark, Dispersion and Standard Deviation Returns Gross of fees
***Fees are accounted for on a cash basis
Channing SCV Composite DisclosureJune 30, 2006 – December 31, 2020*
21

1. Channing Capital Management, LLC (“CCM”) is an institutional investment manager that invests solely in U.S. equities with a focus on value stocks across small-cap, smid, large-cap and all-cap portfolio strategies.
CCM is an independent investment management firm that is not affiliated with any parent organization. “GIPS® is a registered trademark of CFA Institute. CFA Institute does not endorse or promote this
organization, nor does it warrant the accuracy or quality of the content contained herein.”
2. This composite includes all fully discretionary, non-taxable Small-Cap Value portfolios and generally does not include taxable accounts or portfolios unless such accounts have no investment restrictions and no tax-
related limitations or requirements. Accounts included are primarily comprised of all actively managed institutional equity accounts with assets of at least $2 million that are managed to the Russell 2000®Value
(RUJ) Index and an investment mandate of Small-Capitalization Value. Client portfolios are included in the composite in their first full quarter under management after being qualified for composite inclusion. The
inception date and creation date of the composite is June 30, 2006. A complete list and description of composites and pooled funds are available upon request. Policies for valuing investments, calculating
performance, and preparing GIPS reports are available upon request. Pursuant to CCM’s discretion under GIPS guidelines, since the creation of this composite, accounts that experience significant cash flows in
excess of 10% of the account’s market value or repeated outgoing or incoming cash flows may be temporarily removed from the composite. If removed, such accounts are added back to the composite when they
are considered fully invested and are also subject to our new account inclusion criteria.
3. Composite results are time-weighted rates of return and are presented gross and net of investment advisory fees. Gross returns for the Small-Cap Value Composite are net of commission fees and transaction
costs. Net-of-fees returns, where presented, are calculated net of actual advisory/management fees charged to each client account that is in the composite. Dividends are recorded on an accrual basis. Monthly
composite returns are calculated using the aggregated method. Quarterly composite returns are calculated by linking the monthly composite returns geometrically through compounding. Composite dispersion is
presented as the asset weighted standard deviation of accounts in the composite for the entire year, and, and dispersion is not presented for periods where there are 5 or fewer accounts in the composite for the
entire year. Year 2013 annual dispersion has been updated and restated as 0.02% (from 0.04%) due to the removal or exclusion of a previously included account that had a material client restriction. Year 2012
annual dispersion has been restated as 0.09% due to an inadvertent typographical error. The performance results have been calculated without consideration of the effects of any income taxes thereon. Returns
are calculated net of withholding taxes on dividends, interest or capital gains. Composite results reflect the reinvestment of dividends, capital gains, and other earnings when appropriate.
4. In one-on-one presentations, CCM may present performance returns gross of fees. Fees will reduce the returns of a client portfolio. Fees for the Small-Cap Value strategy are assigned using a tier system: $0 to
$25 million at 100 bps; the next $25 million at 90 bps; over $50 million to $100 million at 85 bps; and above $100 million at 80 bps per annum. The fee schedule contained in CCM’s Form ADV-Part 2 is available
upon request. Actual investment advisory fees incurred by clients may vary based on portfolio size, length of mandate, mandate terms including investment guidelines and restrictions, other similar negotiable
items, and performance returns.
5. Minimum Account Size: The minimum account size for inclusion in the composite is $2,000,000. CCM may, at its discretion, accept accounts below this minimum. It should be noted that some of the Small-Cap
Value Composite client accounts are sub-advised relationships on behalf of other institutions. However, CCM does not engage any other firms as its sub-adviser for the management of client portfolios.
6. The Russell 2000 Value Index represents the Small-Cap Value segment of the U.S. equity universe as a subset to Russell’s 2000 Value Index. The Russell 2000 Value Index measures the performance of those
Russell 2000 Value companies with lower price-to-book ratios and lower forecasted growth values.
7. The performance shown in CCM’s Small-Cap Value Composite represents historical performance. Historical performance is not indicative or a guarantee of future results. investing in mid and small-cap stocks is
more risky and more volatile than investing in large-cap stocks..
8. U.S. dollars are used in the calculation of the presented returns and valuations.
9. 3-Year Ex-Post Standard Deviation (Gross) is included starting in 2011 as required. It measures the variability of the Composite and the Benchmark returns over the preceding 36-month (or 3-Year) period and has
been annualized.
10. Benchmark returns are not covered by the report of independent verifier.
Channing SCV Composite DisclosureJune 30, 2006 – December 31, 2020
22

Competitive Edge
23

» We are a firm that focuses exclusively on “Intrinsic Value”
investing; this specialization has benefitted our clients throughout
the history of our firm
» Accomplished investment professionals with over 100 years of
combined investment experience
» We opportunistically capture alpha through disciplined stock
selection and nimble trading inherent in boutiques
» The concentrated nature of our portfolios allows us to know more
about the companies we invest in than our competitors
Why Channing?Competitive Edge
24

Biographies
25

Wendell E. Mackey, CFA
Founder, Co-Chief Executive Officer & Chief Investment Officer
Wendell E. Mackey, CFA, is a Founder, Co-Chief Executive Officer & Chief Investment Officer for Channing Capital
Management, LLC, where he launched the small-cap value product in 2006 and the SMID value product in 2011.
Mr. Mackey has over 25 years of investment experience.
Formerly, he was Senior Managing Director of Valenzuela Capital Partners, LLC, a small and mid-cap equities
boutique, where he shared responsibility for managing the firm’s assets, research staff and overall firm. He
previously was a portfolio manager with Barnett Capital Advisors, responsible for mid/large cap institutional assets,
and he held a senior role at NCM Capital Management Group, where he served as portfolio manager responsible for
Calvert Social Investment Managed Growth Fund and Calvert CRI Balanced Fund. He also held analyst positions
with PNC Bank in the Corporate Finance, and Investment Management and Research divisions of the Bank.
Mr. Mackey received a BBA from Howard University, and a MM from the J.L. Kellogg Graduate School of
Management, Northwestern University. Mr. Mackey currently serves on the Board of Visitors for the Howard
University School of Business. He previously served as a Board Member and Chair of the Audit Committee of the
CFA Society of Chicago. He has earned the Chartered Financial Analyst designation.
Biography
26

Rodney B. Herenton
Founder, Co-Chief Executive Officer and
Chief Business Development & Strategy Officer
Rodney B. Herenton is a Founder, Co-Chief Executive Officer and Chief Business Development & Strategy Officer
for Channing Capital Management, LLC. Mr. Herenton has over 18 years of investment management experience.
Formerly, he was First Vice-President of the Private Fund Group at Morgan Keegan & Company, Inc. He was also
an Associate in the Investment Banking Department at Bear Stearns, where he was responsible for deal execution
of mergers and acquisitions, equity and high-yield bond transactions, and he was an Associate in the Corporate
Finance Department at Lehman Brothers.
Mr. Herenton received a BA in finance from Morehouse College, and a MBA from Harvard Business School.
Biography
27

Deryck Lampe, CFA
Portfolio Manager
Deryck Lampe is a Portfolio Manager for the Large-Cap and All-Cap Products at Channing Capital Management,
LLC. Mr. Lampe has over 25 years of investment and portfolio management experience. Prior to joining Channing
Capital, Mr. Lampe served as the Senior Portfolio Manager/Director of Research for all internal, actively managed,
fundamental equity products for the Ohio Public Employees Retirement System (OPERS).
Previously, Mr. Lampe was the Senior Portfolio Manager for the equity long/short portion of the U. S. Event Driven
Hedge Fund at Cheyne Capital Management, LLP and was Executive Director/Head of Fundamental Equities at
FHS Investments, LLC where he had primary responsibility for the fundamental equity components of the firm’s
arbitrage trading. Before that, Mr. Lampe served as a portfolio manager and senior analyst for Stein, Roe, and
Farnham, and Conseco Capital Management, where he entered the investment field in 1994.
Mr. Lampe received a BS in Mathematics from Purdue University, and a Master of Science in Statistics/ Operations
Research as well as an MBA in Corporate Finance from the University of Cincinnati. Also, Mr. Lampe earned the
Chartered Financial Analyst designation in 1997.
Biography
28

Timothy Kroll, CFA
Portfolio Manager – Senior Equity Analyst
Timothy (“Tim”) J. Kroll, CFA is a Portfolio Manager-Senior Equity Analyst of the Small and SMID Value Products
at Channing Capital Management, LLC. Mr. Kroll has over 25 years of investment experience. Prior to joining the
firm, Mr. Kroll was a Director of InView Investment Management, LLC. Previously Tim was a Vice President at ABN
AMRO Asset Management Holdings Inc. where he researched equities for a 5-Star Morningstar-rated and Money
Top 100 mutual fund with over $1 billion in assets at that time. He also held equity research positions at Lincoln
Capital Management and at Mesirow Financial as a sell-side small value research analyst.
Mr. Kroll received a BS in finance from Southern Illinois University and a MM from the J.L. Kellogg Graduate
School of Management, Northwestern University. He has earned the Chartered Financial Analyst designation.
Biography
29

Matthew Betourney, CFA
Portfolio Manager – Senior Equity Analyst
Matthew (“Matt”) Betourney, CFA, is a Portfolio Manager and Senior Equity Analyst of the Small and SMID Value
Products at Channing and has over 13 years of investment experience. Prior to joining the firm, Matt was a Senior
Research Analyst at Susquehanna Investment Group based in Chicago. He researched event-driven situations
focused in the industrial and materials sectors. Previously Matt was a Senior Research Analyst at Wintrust Capital
Management where he researched small-cap equities in the industrial, material and consumer sectors. He also
held an equity research position at Magnetar Financial LLC.
Mr. Betourney received his BBA in Finance with an emphasis in Accounting from the University of Iowa and
his MBA at the University of Chicago Booth School of Business. He has earned the Chartered Financial
Analyst designation.
Biography
30

Anthony (“Tony”) W. Hipple, CFA
Portfolio Manager – Senior Equity Analyst
Anthony (“Tony”) W. Hipple, CFA, has more than 22 years of investment experience and is a Portfolio Manager,
Senior Equity Analyst for the Channing Small and SMID-Value Products. Prior to joining Channing Capital
Management, LLC, Mr. Hipple served as a Portfolio Manager and Senior Equity Analyst covering Technology, and
Consumer Discretionary for growth strategies at Lord Abbett & Company and was a portfolio manager for Micro-
Cap Growth. Before that, Mr. Hipple served as a Senior Research Analyst at Piper Jaffray Asset Management
and Thrivent Investment Management, Inc. covering Technology, Financials, and Consumer Discretionary
sectors.
Mr. Hipple received a BA in Business from the University of Northern Iowa, and a MBA from Tippie College of
Business at the University of Iowa. He has earned the Chartered Financial Analyst designation.
Biography
31
Kevin B. Reynolds, CFA
Associate Portfolio Manager – Financial Services Specialist
Kevin B. Reynolds, CFA, is an Associate Portfolio Manager – Financial Services Specialist of the Small and SMID
Value Product at Channing Capital Management, LLC. Mr. Reynolds has 20 years of investment experience.
Prior to joining the firm, Mr. Reynolds was a Senior Vice President at Wunderlich Securities, Inc., where he
researched small and mid-cap Regional and Community Banks. He also held equity research positions at Morgan
Keegan & Co., Janney Montgomery Scott and Stanford Group.
Mr. Reynolds received a BBA in finance from Memphis State University (now the University of Memphis) and an
MBA from the Fogelman College of Business and Economics, University of Memphis. He has earned the
Chartered Financial Analyst designation.
Biography
32

Derik Coffey, CFA
Client Portfolio Manager
Derik D. Coffey, CFA, is Client Portfolio Manager at Channing Capital Management. Mr. Coffey has over 13 years
of investment experience. Prior to joining the firm, he was a Portfolio Specialist at Herndon Capital Management
focused on value strategies. Prior to Herndon, Mr. Coffey was an analyst at UBS Financial Services in the
Manager Research Group responsible for due diligence on managers primarily in the small and mid-cap space.
Before that, he was an Assistant Vice President for M&A at New York Life Insurance, and an analyst in the Global
M&A Group at Lehman Brothers.
Mr. Coffey earned a BA from Tuskegee University, and a Master of Science from Georgetown University. He has
also earned the Chartered Financial Analyst designation.
Biography
33

Scott Silver, CAIA, CMT
Head Trader
Scott Silver, CAIA, CMT, brings more than 15 years of investment management experience and serves as Head
Trader for Channing Capital Management. Previously, Mr. Silver was a Senior Equity Trader at Columbia Wanger
Asset Management where he was responsible for execution of US, European, and Asian equities. Prior to
Columbia Wanger, Mr. Silver was at Advisory Research and Segall Bryant & Hamill. In both roles he was an
Equity Trader for institutional and separately managed accounts.
Mr. Silver received a BS in Finance from Northern Illinois University. He has earned the Chartered Alternative
Analyst (CAIA) and Chartered Market Technician (CMT) designations.
34
Biography
Alta M. Gorman
Equity Trader & Director, Investment Operations
Alta M. Gorman has more than 23 years of experience in financial services. Prior to joining the firm, Ms. Gorman
was Team Leader of Portfolio Accounting with Nuveen Investments where she was responsible for client reporting,
trade settlement and reconciliation. Prior to Nuveen Investments, Ms. Gorman worked in commercial lending at
Fifth Third Bank, as a funding specialist, helping to mitigate credit and administrative risk to the bank. She began
her career in financial services with Brinson Partners.
Ms. Gorman received a Bachelor of Professional Studies in Business from Roosevelt University.
35
Biography

Richard Turnley
Director, Institutional Sales and Marketing
Richard Turnley, III is the Director of Institutional Sales and Marketing of Channing Capital Management, LLC.
Mr. Turnley has over 25 years of investment management experience. Mr. Turnley was formerly President of
Atlanta Wealth Advisors. Prior to Atlanta Wealth Advisors, Mr. Turnley was an investment management
consultant for Bank of America and Smith Barney, where he was responsible for developing and managing client
relationships with endowments, foundations, trusts and high net worth individuals. Prior to his work as an
investment management consultant, Mr. Turnley was a corporate banking associate with Wachovia Bank.
Mr. Turnley currently serves on the Board of Directors for the National Association of Securities Professionals.
Mr. Turnley received a BS in Business Administration and a MBA from Florida A&M University.
Biography
36

Anna M. Sprecher
Manager, Client Service
Anne “Anna” Sprecher is Manager of Client Service with Channing Capital Management, LLC. Ms. Sprecher has
over 15 years of experience in the financial services industry. Ms. Sprecher was formerly Client Relationship
Specialist at Robert W. Baird & Co., where she worked with the Private Asset Management Team focused on
families with net worths of $10 million and higher. As a Client Relationship Specialist, Ms. Sprecher’s primary
responsibilities were client service, trading, reporting, and marketing support services on behalf of the wealth
management team. Prior to Baird, Ms. Sprecher also worked in a client service capacity at Wunderlich Securities,
and William Blair & Company. Ms. Sprecher began her career at a boutique, sell-side, institutional trading firm,
Capital Management Group, LLC.
Ms. Sprecher received a BA from DePaul University and has obtained the Series 7, 24, 55, 63, and 66 licenses.
37
Biography

Curtis Flippen, CFA
Compliance Consultant - Interim Chief Compliance Officer
Curtis is a Senior Director on Foreside’s Investment Adviser Compliance Services team and provides advice and
guidance in all aspects of fiduciary and regulatory issues to investment advisers managing private and public
funds (i.e., ETFs and mutual funds) and institutional clients including forming investment advisers, advising on
issues concerning the need to register with the SEC, SEC registration investment management contracts,
reviewing a private fund's term sheet, private placement memorandum, partnership agreement and operating
agreement, private fund operations, SEC filings, disclosure requirements and documents, SEC audits,
establishing compliance programs, drafting, implementation, and ongoing monitoring of firm’s compliance policies,
procedures and code of ethics, annual review of the firm’s compliance program, and compliance training (annual
and targeted). Mr. Flippen has more than 20 years of experience in investment and securities legal and regulatory
matters. Prior to joining Foreside, he held various compliance and legal roles.
Curtis earned a JD from Rutgers Law School (NJ) and BS, Hampton University.”
Biography
38

For more information, contact:
Richard Turnley, IIIChanning Capital Management, LLC
Director of Institutional Sales & Marketing
(312) 223-0211 | channingcapital.com

This presentation has been prepared exclusively for use in a one-on-one meeting with the State of Connecticut Retirement Plans and Trust Funds. It is not intended for, and should not be used with, any other third party or the public.
Lord Abbett Innovation Growth Investing
For the Quarter Ended June 30, 2021
Brooke Fapohunda
Partner, Chief Sustainability Officer
Matthew R. DeCicco, CFA
Partner, Director of Equities & Portfolio Manager
Greg Balewicz
Institutional Director, U.S. Institutional
1

Our Firm
A singular focus since 1929
▪ Perspectives shaped and decisions sharpened by our
independence
▪ Resources dedicated to the markets e serve
▪ Strategies intelligently designed to meet client needs
▪ Active management characterized by a deliberate
process, teamwork and collaboration
▪ Rigorous research that challenges consensus and
identifies opportunities
▪ Comprehensive risk management that enhances
investment decisions
INVESTMENT-LED INVESTOR-FOCUSED
JERSEY CITY LONDON DUBLIN2

*Includes approximately $1.2 billion for which Lord Abbett provides investment models to managed account sponsors.
Independentprivately held firm
About Us
As of June 30, 2021
MISSIONSecuring a
sustainable future
for our clients,
our people, and our world
We Invest for
Our Clients:
Supporting values,
making an impact,
and seeking to
provide financial
security.
We Empower
Our People:
Building meaningful
careers, enhancing
well-being, and
creating an equitable
environment for all.
We Engage
Our World:
Advancing our
local communities,
taking a stand on
global issues, and
driving change to
benefit our planet.
Assets under management:
approximately
$246billion*
investment professionals
with an average of
18 years of industry experience
164
What Guides Us
3

Our Investment Teams
As of 06/30/2021.
164 Investment Professionals with an Average of 18 Years Industry Experience
Portfolio
Management
Municipal
Research
Portfolio
Management
Equity
Research
Investment
Stewardship
Council
Portfolio
Management
Portfolio
Management
Fixed Income
Quantitative
Research
Marc Pavese, Ph.D.
Partner & Director
Global
Trading
Andrew M. Khatri
Partner & Director
Steven F. Rocco, CFA
Partner & Co-HeadRobert A. Lee
Partner & Co-Head
Tax-Free Income
Dan S.
Solender, CFA
Partner &
Director
Equity
Darnell C.
Azeez, CFA
Managing Director &
Portfolio Manager
Dividends & Value
Matthew R. DeCicco, CFA
Partner & Director of Equities
Sue
Kim
Director
Global
Jeffrey
Rabinowitz, CFA
Portfolio Manager
Durable Growth
Innovation
Equity
F. Thomas
O’Halloran,
J.D., CFA
Partner &
Portfolio Manager
ESG
Investing
Emanuela Scura
Partner & Head
of ESG Investment
Douglas B. SiegManaging Partner
Global Credit
Research
Gregory S. Parker,
CFA
Partner & Director
4

Our Assets and Investment Strategies
5
$246 BILLION IN ASSETS UNDER MANAGEMENTIncluding over $752 million from current and
former partners, employees, and their families
U.S. Equity
▪ Large Value
▪ Focused Large Value
▪ Mid Value
▪ Smid Value
▪ Small Value
▪ Focused Small Value
▪ Multi Value
▪ Small Core
▪ Large Growth
▪ Focused Growth
▪ Mid Growth
▪ Small Growth
▪ Micro Growth
▪ Convertible
▪ Equity Income
▪ Dividend Growth
Global and International Equity
▪ International Equity
▪ International Value
▪ International Small Core
▪ Global Equity
▪ Health Care
▪ Short
▪ Short Duration High Yield
▪ Intermediate
▪ Long
▪ High Yield
▪ State Specific (CA, NY, NJ)
Tax-Free Fixed Income
Taxable Fixed Income
▪ Ultra Short Bond
▪ Short Credit
▪ Intermediate Government/Credit
▪ Government
▪ Core
▪ Core Plus
▪ Climate Focused
▪ Inflation Focused
▪ Corporate Credit
▪ Bank Loan
▪ Multi-Sector
▪ Global Multi-Sector
▪ EM Corporate Debt
▪ EM Bond
▪ Long Duration
▪ Short Duration High Yield
▪ High Yield
▪ Global High Yield
▪ Credit Opportunities
Note: Assets under management data is as of 06/30/2021 unless noted and includes approximately $1.2 billion for which Lord Abbett provides investment models to managed account sponsors.

Past performance is not a reliable indicator or guarantee of future results. The gross performance shown does not reflect the deduction of investment advisory fees, but does reflect the deduction of any applicable transaction costs. Please refer to the End Notes to Performance in the Appendix for additional performance information, including the effect of fees on performance. For the 3-, 5-, and 10 year periods: Large Cap Growth Universe consisting of 306, 286, and 256 managers, Small Cap Growth Universe consisting of 183, 175, and 156 managers, and Micro Cap Growth Universe consisting of 15, 14, and 13 managers. Source: eVestment. Assets under management and performance information as of 06/30/2020. Most recent data available.
Lord Abbett’s Innovation Growth Equity Franchise
3 Years % Rank 5 Years % Rank 10 Years % Rank
Growth Equity Institutional Composite (Gross of
Fees)30.52% 5 28.14% 7 19.74% 5
Focused Growth Equity Institutional Composite
(Gross of Fees)33.24% 2 - - - -
Small Cap Growth Equity Institutional Composite
(Gross of Fees)27.80% 14 29.30% 13 17.47% 21
Micro Cap Growth Equity Institutional Composite
(Gross of Fees)34.06% 21 36.15% 15 22.99% 17
$16.4 BILLION IN ASSETS UNDER MANAGEMENTHave been managing growth equity
portfolios since 1973
6

Innovation Growth Equity Team and
Investment Philosophy
7

Deep, Experienced Investment Platform and Resources
As of 07/01/2021. Years of industry experience is updated as of 01/01/2021.
Equity Resources Risk Management Equity Trading Investment Strategist
40 Additional Investment Professionals21 Years Average
Alec I. Crawford
Partner & Chief Investment
Risk Officer33 Years
4 Risk Management Professionals14 Years Average
Andrew M. Khatri
Partner & Director of Global Trading19 Years
6 Equity Traders29 Years Average
Brian Foerster, CFA
Investment Strategist26 Years
So Young Lee
Consumer Staples, Health Care21 Years
Samantha Shevins
Health Care21 Years
F. Thomas O’Halloran, J.D., CFAPartner & Portfolio Manager
34 Years
Matthew R. DeCicco, CFAPartner, Director of Equities & Portfolio Manager
22 Years
Vernon Bice, CMTPortfolio Manager
20 Years
Michael J. Glaccum, CFA
Consumer, Technology13 Years
Portfolio Management – Small Cap Growth
Research
Benjamin EbelPortfolio Manager
Technology, Telecomm29 Years
Steven Wortman
Consumer, Industrials, Financials
Portfolio Manager – Micro Cap23 Years
Jeremy Lehmann, CFA
Portfolio Manager
9 Years
Alan R. Kurtz
Portfolio Manager 21 Years
Convertibles
8

A Differentiated Approach to Growth and Innovation
As investors focused on identifying powerful themes and innovative companies, we believe a highly active approach is critical
to success
1. Focus on identifying
companies that will take
market share
aggressively
2. Identify companies with
significant investment in
R&D and future growth
potential
3. Apply an active
approach to capture
upside and limit downside
9

Characteristics of Innovators and Superior Businesses
Sustainable Competitive Advantages
▪ Rapidly attaining and maintaining dominance
▪ Strong market share growth
▪ Agile business that can adapt to change
Favorable Industry Conditions
▪ Healthy industry conditions supportive
of growth
▪ Improving economic, regulatory, or
environmental conditions
▪ Open-ended growth potential
Exceptional Business Models
▪ Strong profit margins and improving profitability
▪ Scalable, ideally with a singular focus
▪ Sustainable businesses may be more valuable
Competent and Credible Management
▪ Possessing requisite expertise and skill
▪ Track record of meeting/beating expectations
▪ Visionary and passionate about the business
10

Operating Momentum
We seek companies realizing fundamental (operating) momentum, defining them as growth leaders in their industries
Growth Drivers Exceeding Expectations
▪ Significant increase in total addressable market
(TAM)
▪ Highest-growth business line responsible for an
increasing percentage of total revenues
Positive Sales and Earnings Estimate Revisions
▪ Recent history of beating top-line revenue
expectations
▪ A pattern of upside revisions following earnings
data or fundamental news
High Revenue Growth
▪ Revenue growth persisting at a higher-than-
forecasted rate
▪ Accelerating revenue, where possible
Margin Strength
▪ High gross margins
▪ Positive trend towards profitability,
while still reinvesting in growth
Operating Momentum is characterized by companies exhibiting:
11

Price Momentum
Our differentiated momentum analysis is based on quantitative analytics, and seeks to amplify returns and manage risk
We view momentum as multi-dimensional, and when evaluating investments consider both
Absolute and Relative momentum at the market, sector, and stock level
▪ Absolute price momentum: how a given stock is behaving compared to its own history
▪ Relative price momentum: how a given stock is behaving compared to all other stocks
Our momentum/technical analysis is underpinned by the fundamental context provided
by our research and incorporates
▪ Tools to identify “early warning” signs for price momentum shifts
▪ Moving average analytics, relative strength, and price/volume metrics
▪ An assessment of a stock’s reaction to fundamental news and changes in market expectations
12

Sell Discipline
Securities are continuously monitored and evaluated for sale when:
Operating Momentum Changes
▪ Business model worsens
▪ Management’s execution
falters
▪ Industry conditions turn hostile
▪ Competitive advantage
deteriorates
▪ Growth decelerates too much
Price Momentum Changes
▪ Relative and/or absolute
momentum becomes
unattractive
▪ Technical breakdown through
key moving averages
▪ Sentiment changes due to
market conditions
Diversification
▪ Trim positions in names and/or
sectors to maintain optimal
active exposures and prudent
diversification
13

Small Cap Growth Strategy
14

Portfolio Characteristics
The characteristics above, with the exception of Number of Holdings, are based upon a weighted average of the securities held in the representative portfolio. Source: The Bank of New York Mellon Corp. Past performance is not a reliable indicator or guarantee of future results. Current forecasts may not be achieved. Indexes are unmanaged, do not reflect the deduction of fees or expenses, and are not available for investment.
(AS OF 06/30/2021)
Small Cap Growth
Representative Portfolio Russell 2000® Growth Index
Number of Holdings 100 1,175
Sales/Share Growth FY1 12.0% 2.3%
Long Term Growth (IBES Median) 21.2% 17.6%
Debt/Capital 34.0% 43.7%
Price/Earnings FY1 27.1x 22.7x
Median Market Capitalization ($M) $5,289 $1,523
Weighted Average Market Capitalization ($M) $6,305 $3,817
3 Year Tracking Error 11.2% N/A
3 Year Information Ratio 1.0 N/A
15

Sector Allocation
Source: Wilshire AtlasSM (“Wilshire”). Please see Appendix for information “About Wilshire,” including information about Not Classified securities. Sectors are based upon GICS classifications; sectors may include many industries. Sector allocations exclude cash and therefore total allocations may not equal 100%. Indexes are unmanaged, do not reflect the deduction of fees or expenses, and are not available for investment.
(AS OF 06/30/2021)
5.7
3.4
1.1
0.6
0.2
-0.1
-0.3
-0.5
-1.8
-2.0
-2.8
-5.7
-8% -6% -4% -2% 0% 2% 4% 6% 8%
Consumer Discretionary
Information Technology
Communication Services
Financials
Industrials
Not Classified
Utilities
Materials
Consumer Staples
Energy
Real Estate
Health Care
Underweight Overweight
Small Cap Growth
Representative Portfolio
Russell 2000® Growth Index
20.9% 15.2%
24.7% 21.3%
4.1% 3.0%
5.5% 4.9%
13.6% 13.4%
0.0% 0.1%
0.0% 0.3%
2.5% 3.0%
1.8% 3.6%
0.0% 2.0%
0.0% 2.8%
24.7% 30.4%
16

Average Annual Rates of Return
3.105.10
56.07
27.8029.30
17.4815.61
3.92
8.98
51.36
15.9418.76
13.5210.89
0.0
10.0
20.0
30.0
40.0
50.0
60.0
70.0
80.0
90.0
100.0
2Q 2021 YTD 1 Year 3 Years 5 Years 10 Years 15 Years
% R
etu
rn
Small Cap Growth Institutional Composite (Gross of Fees) Russell 2000 Growth Index*
(AS OF 06/30/2021)
Past performance is not a reliable indicator or guarantee of future results. The gross performance shown does not reflect the deduction of investment advisory fees, but does reflect the deduction of transaction costs. Please refer to the End Notes to Performance in the Appendix for additional performance information, including the effect of fees on performance. Returns for periods of less than one year are not annualized.*Source: Russell. Indexes are unmanaged, do not reflect the deduction of fees or expenses, and are not available for investment. 17

Source: Wilshire AtlasSM (“Wilshire”). Performance data shown above is historical. Past performance is not a reliable indicator or guarantee of future results. Current performance may be higher or lower than the performance data shown. Please see Appendix for information “About Wilshire” and the calculation of performance attribution information, including information about Not Classified securities. *GICS Sectors. Sectors may include many industries. Indexes are unmanaged, do not reflect the deduction of fees or expenses, and are not available for direct investment. Prior to August 2016, GICS included Real Estate holdings within the Financials sector. In September 2018 GICS changed the name of the Telecom sector to Communication Services. In addition to the name change, certain companies that were previously included in the Information Technology and Consumer Discretionary sectors are now included in the Communication Services sector.
Attribution Analysis: Five Year
(AS OF 06/30/2021)
Small Cap Growth
Representative Portfolio Russell 2000® Growth
Index Variance
Sectors* Average Weight %
Base Return %
Average Weight %
Base Return %
Stock Selection %
Group Weight % Total %
Information Technology 29.3 43.0 21.4 25.9 4.3 0.4 4.7
Health Care 26.0 40.0 27.4 21.8 3.9 -0.2 3.8
Consumer Discretionary 16.8 27.3 13.9 18.8 0.9 0.1 1.0
Real Estate 0.5 26.0 3.8 9.5 0.5 0.2 0.7
Consumer Staples 1.7 15.6 3.0 13.6 0.3 -0.1 0.2
Financials 6.3 20.1 5.9 14.2 0.0 0.1 0.1
Utilities 0.1 -2.1 1.0 10.2 0.0 0.1 0.1
Energy 1.1 2.2 1.0 -10.0 0.2 -0.1 0.1
Not Classified 0.0 40.0 0.0 -2.4 0.0 0.0 0.0
Industrials 13.1 17.5 16.9 17.6 0.1 -0.1 -0.1
Materials 1.3 3.7 3.8 10.8 -0.4 0.2 -0.1
Communication Services 1.1 -5.5 1.9 12.3 -0.3 0.1 -0.1
Cash 2.6 1.2 0.0 0.0 0.0 -0.6 -0.6
Total 100.0 28.6 100.0 18.8 9.6 0.3 9.9
18

Holdings are based on the strategy’s representative portfolio. “Stock Selection %” reflects the effect of the individual stock’s performance relative to its benchmark, the Russell 2000 Growth Index. Past performance is not a reliable indicator or guarantee of future results. The holdings identified above do not represent all of the securities purchased, sold, or recommended for advisory clients. The calculation methodology for determining the holdings that contributed most positively and negatively to the representative portfolio’s performance relative to the benchmark for the period as well as a list of the relative contribution of each holding in the portfolio to the portfolio’s performance are available upon request. Sector information for each holding is based upon GICS classifications.
Performance Highlights: Five Year
(AS OF 06/30/2021)
Largest Contributors Ticker % Stock Selection
Generac Holdings, Inc. Industrials
GNRC 8.37
Five9, Inc. Information Technology
FIVN 6.90
Chegg, Inc. Consumer Discretionary
CHGG 6.87
Immunomedics, Inc. Health Care
IMMU 5.85
Roku Inc Communications
ROKU 5.78
Largest Detractors Ticker % Stock
Selection
Overstock.com Inc Consumer Discretionary
OSTK -3.43
Stamps.com Inc Information Technology
STMP -3.18
Stitch Fix Inc Consumer Discretionary
SFIX -3.16
The Realreal Inc Consumer Discretionary
REAL -3.02
Sunrun, Inc. Industrials
RUN -2.94
19

Investing in Innovation
20

Companies well positioned
to adapt and protect their
cash flows and market share
DurabilityInnovation Vulnerability
Companies pioneering and
leveraging new technologies
to grow market share
Companies poorly positioned
to withstand the threat
of innovation
21
Equity Market Dynamics: Beyond Growth and Value
Classifying equities into three types

Transformation of Capital Intensity from Physical to Intellectual
Sources: Left chart: Bloomberg. Data as of 03/31/2020. Right charts: BofA Research, The RIC Report, September 8, 2020, “The Secret Life of Value”
1%
2%
3%
4%
5%
6%
7%
8%
1980 1985 1990 1995 2000 2005 2010 2015 2020
Equipment to GDP Intellectual Property to GDP7.9%
5.5%
1.9%
4.8% 17%
32%
68%
80%84%
83%
68%
32%
20%16%
0%
20%
40%
60%
80%
100%
1975 1985 1995 2005 2018
Types of
Intangible
Assets
Intellectual Property
Business Rights
Brand Value
Patents, Trade Secrets
Public Rights
Proprietary Data
Non-revenue rights
Relationships
Intangible % of S&P 500 Assets
Tangible % of S&P 500 Assets
PHYSICAL EQUIPMENT VS. INTELLECTUAL PROPERTY
40 YEAR TRANSFORMATION ASSET INTENSITY HAS SHIFTED DRAMATICALLY TOWARDS INTANGIBLES
22

R&D Intensity: A Key Factor in Market Returns Over the Past 10 Years
Source: FactSet. Data as of 12/31/2020, most recent available. Innovative companies are derived from the top-decile investor in R&D by intensity – defined as R&D investment per total revenues – and the subsequent next three years of investment returns (using the Russell 1000 Index). Past performance is not a reliable indicator or guarantee of future results. For illustrative purposes only and does not represent any specific portfolio managed by Lord Abbett or any particular investment. Indexes are unmanaged, do not reflect the deduction of fees and expenses, and are not available for direct investment.
Innovators outperformed by on average in the last 10 years29%
0%
20%
40%
60%
80%
100%
120%
2020201920182017201620152014201320122011
Top 10% R&D Investors Rest of the Index
23

Growth Investing in the Age of Innovation
The Technological Revolution
▪ Cloud Technology
▪ Artificial Intelligence
The Genomics Revolution
▪ Biotechnology
▪ Devices and Diagnostics
Empowerment of the
Consumer & Brands
▪ e-Commerce & Life Brands
▪ Virtual Empowerment
EXAMPLES
▪ Cloud infrastructure
▪ Internet software
▪ Autonomous driving
▪ Digital advertising
▪ Intelligent robotics
EXAMPLES
▪ Gene therapy and editing
▪ Immunotherapy
▪ Diabetes monitoring
▪ Cancer diagnostics
▪ Targeted oncology therapies
EXAMPLES
▪ e-Commerce dominant leaders
▪ Lifestyle-enhancing retailers
▪ Social networking
▪ Streaming content, delivery
▪ Remote learning, tutoring
For illustrative purposes only. 24

Appendix
25

Lord Abbett Small Cap Growth
Small Cap Growth Equity Institutional Composite 3 Years 5 Years 10 Years
Excess Return (Gross of Fees) 11.86% 10.54% 3.95%
Sharpe Ratio 0.97 1.27 0.83
Tracking Error 10.64 9.14 7.81
Batting Average 0.64 0.65 0.57
Up Capture 124% 122% 108%
Down Capture 93% 89% 94%
Past performance is not a reliable indicator or guarantee of future results. The gross performance shown does not reflect the deduction of investment advisory fees, but does reflect the deduction of any applicable transaction costs. Please refer to the End Notes to Performance in the Appendix for additional performance information, including the effect of fees on performance. Statistics are relative to the Russell 2000 Growth Index, where applicable. Number of managers in the eVestment universe for U.S. Small Cap Growth Equity for the 3-, 5-, and 10-year time periods is 171, 163, and 147, respectively.
Small Cap Growth Equity Institutional Composite 3 Years 5 Years 10 Years
Annualized Return (Gross of Fees) 27.80% 29.30% 17.48%
eVestment Category Rank 15 14 22
Information Ratio 1.11 1.15 0.51
eVestment Category Rank 27 22 32
(AS OF 06/30/2021)
26

Ten Largest Representative Portfolio Holdings
The securities identified and described do not represent all of the securities purchased, sold or recommended for client accounts. It should not be assumed that investments in the securities identified were or will be profitable or that recommendations made in the future will be profitable or equal the performance of the securities discussed herein. A complete list of all recommendations made by Lord Abbett over the past year can be furnished upon request. *GICS Sectors.
(AS OF 06/30/2021)
Company Name Sector* % of Portfolio
Crocs Inc Consumer Discretionary 2.1
Axon Enterprise, Inc. Industrials 2.0
LGI Homes Inc Consumer Discretionary 2.0
RH Consumer Discretionary 1.9
Shift4 Payments Inc Information Technology 1.9
Bumble Inc Communication Services 1.8
Axonics Inc Health Care 1.8
Endava PLC Information Technology 1.8
Natera Inc Health Care 1.7
Sonos Inc Consumer Discretionary 1.7
Total 18.7%
27

Attribution Analysis: One Year
Source: Wilshire AtlasSM (“Wilshire”). Performance data shown above is historical. Past performance is not a reliable indicator or guarantee of future results. Current performance may be higher or lower than the performance data shown. Please see Appendix for information “About Wilshire” and the calculation of performance attribution information, including information about Not Classified securities. *GICS Sectors. Sectors may include many industries. Indexes are unmanaged, do not reflect the deduction of fees or expenses, and are not available for direct investment.
(AS OF 06/30/2021)
Small Cap Growth
Representative Portfolio Russell 2000® Growth
Index Variance
Sectors* Average Weight %
Base Return %
Average Weight %
Base Return %
Stock Selection %
Group Weight % Total %
Health Care 30.7 53.7 33.5 38.6 4.9 0.3 5.2
Financials 3.5 112.3 4.1 40.8 1.9 0.4 2.3
Information Technology 26.2 59.5 20.6 53.2 1.6 0.2 1.8
Communication Services 1.8 84.2 2.3 36.7 0.9 0.3 1.2
Utilities 0.0 0.0 1.6 18.5 0.0 0.6 0.6
Real Estate 1.3 25.1 3.6 41.6 0.3 0.2 0.5
Consumer Staples 2.1 75.8 3.1 54.1 0.5 -0.4 0.1
Energy 0.0 0.0 0.2 126.2 0.0 -0.1 -0.1
Materials 0.9 0.9 2.6 53.2 -0.3 -0.2 -0.5
Industrials 11.8 61.1 14.1 67.3 -0.8 -0.5 -1.3
Consumer Discretionary 19.5 58.6 14.2 81.4 -4.3 1.4 -2.9
Cash 2.4 0.1 0.0 0.0 0.0 -1.3 -1.3
Total 100.0 57.0 100.0 51.4 4.7 0.9 5.6
28

Holdings are based on the strategy’s representative portfolio. “Stock Selection %” reflects the effect of the individual stock’s performance relative to its benchmark, the Russell 2000 Growth Index. Past performance is not a reliable indicator or guarantee of future results. The holdings identified above do not represent all of the securities purchased, sold, or recommended for advisory clients. The calculation methodology for determining the holdings that contributed most positively and negatively to the representative portfolio’s performance relative to the benchmark for the period as well as a list of the relative contribution of each holding in the portfolio to the portfolio’s performance are available upon request. Sector information for each holding is based upon GICS classifications.
Performance Highlights: One Year
(AS OF 06/30/2021)
Largest Contributors Ticker % Stock
Selection
Immunomedics, Inc. Health Care
IMMU 2.40
Enphase Energy, Inc. Information Technology
ENPH 1.82
Appian Corp Information Technology
APPN 1.59
Myokardia Inc Health Care
MYOK 1.47
Crocs Inc Consumer Discretionary
CROX 1.47
Largest Detractors Ticker % Stock
Selection
Sunrun, Inc. Industrials
RUN -1.31
Overstock.com Inc Consumer Discretionary
OSTK -1.27
Wingstop Inc Consumer Discretionary
WING -1.17
Momentive Global Inc Information Technology
60878Y10 -1.14
Stamps.com Inc Consumer Discretionary
STMP -1.10
29

Source: Wilshire AtlasSM (“Wilshire”). Performance data shown above is historical. Past performance is not a reliable indicator or guarantee of future results. Current performance may be higher or lower than the performance data shown. Please see Appendix for information “About Wilshire” and the calculation of performance attribution information, including information about Not Classified securities. *GICS Sectors. Sectors may include many industries. Indexes are unmanaged, do not reflect the deduction of fees or expenses, and are not available for direct investment.
Attribution Analysis: Three Year
(AS OF 06/30/2021)
Small Cap Growth
Representative Portfolio Russell 2000® Growth
Index Variance
Sectors* Average Weight %
Base Return %
Average Weight %
Base Return %
Stock Selection %
Group Weight % Total %
Information Technology 28.2 44.4 19.1 23.9 4.9 0.6 5.5
Health Care 29.1 29.4 30.1 16.6 3.6 0.0 3.6
Real Estate 0.7 36.9 3.7 10.8 0.7 0.1 0.8
Consumer Staples 2.5 37.0 3.1 14.7 0.6 -0.2 0.4
Financials 4.3 19.6 5.7 8.7 0.1 0.3 0.4
Energy 0.5 -5.4 0.9 -15.6 0.2 0.2 0.4
Materials 0.3 0.3 3.1 4.2 -0.1 0.3 0.2
Utilities 0.0 0.0 1.2 12.2 0.0 0.2 0.2
Consumer Discretionary 18.3 21.1 13.6 19.2 -0.1 0.2 0.1
Not Classified 0.0 25.0 0.0 0.0 0.0 0.0 0.0
Industrials 11.5 18.4 16.9 17.0 0.1 -0.1 0.0
Communication Services 1.7 -7.6 2.5 7.4 -0.4 0.2 -0.2
Cash 2.9 1.3 0.0 0.0 0.0 -0.7 -0.7
Total 100.0 26.8 100.0 15.9 9.6 1.2 10.8
30

Holdings are based on the strategy’s representative portfolio. “Stock Selection %” reflects the effect of the individual stock’s performance relative to its benchmark, the Russell 2000 Growth Index. Past performance is not a reliable indicator or guarantee of future results. The holdings identified above do not represent all of the securities purchased, sold, or recommended for advisory clients. The calculation methodology for determining the holdings that contributed most positively and negatively to the representative portfolio’s performance relative to the benchmark for the period as well as a list of the relative contribution of each holding in the portfolio to the portfolio’s performance are available upon request. Sector information for each holding is based upon GICS classifications.
Performance Highlights: Three Year
(AS OF 06/30/2021)
Largest Contributors Ticker % Stock
Selection
Generac Holdings, Inc. Industrials
GNRC 4.79
Inphi Corp Information Technology
IPHI 3.25
Five9, Inc. Information Technology
FIVN 3.22
Immunomedics, Inc. Health Care
IMMU 3.16
Redfin Corp Real Estate
RDFN 3.03
Largest Detractors Ticker % Stock
Selection
Stamps.com Inc Information Technology
STMP -2.62
Stitch Fix Inc Consumer Discretionary
SFIX -1.83
The Realreal Inc Consumer Discretionary
REAL -1.75
Sunrun, Inc. Industrials
RUN -1.70
Overstock.com Inc Consumer Discretionary
OSTK -1.65
31

Source: Wilshire AtlasSM (“Wilshire”). Performance data shown above is historical. Past performance is not a reliable indicator or guarantee of future results. Current performance may be higher or lower than the performance data shown. Please see Appendix for information “About Wilshire” and the calculation of performance attribution information, including information about Not Classified securities. *GICS Sectors. Sectors may include many industries. Indexes are unmanaged, do not reflect the deduction of fees or expenses, and are not available for direct investment. Prior to August 2016, GICS included Real Estate holdings within the Financials sector. In September 2018 GICS changed the name of the Telecom sector to Communication Services. In addition to the name change, certain companies that were previously included in the Information Technology and Consumer Discretionary sectors are now included in the Communication Services sector.
Attribution Analysis: Ten Year
(AS OF 06/30/2021)
Small Cap Growth
Representative Portfolio Russell 2000® Growth
Index Variance
Sectors* Average Weight %
Base Return %
Average Weight %
Base Return %
Stock Selection %
Group Weight % Total %
Health Care 23.6 27.2 24.9 17.2 2.1 -0.1 2.0
Information Technology 30.0 20.8 22.7 17.6 0.7 0.2 0.9
Financials 7.3 19.0 6.8 12.5 0.3 0.0 0.3
Real Estate 0.2 12.3 1.9 4.7 0.2 0.1 0.3
Energy 2.7 -5.8 2.8 -12.4 0.1 0.1 0.2
Materials 1.3 -16.3 4.2 5.9 -0.2 0.3 0.1
Utilities 0.1 1.9 0.6 7.6 0.0 0.0 0.1
Not Classified 0.0 75.3 0.0 -4.7 0.1 0.0 0.1
Consumer Staples 2.6 14.4 3.6 14.1 0.1 0.0 0.0
Consumer Discretionary 15.8 12.8 15.0 12.7 -0.1 0.1 0.0
Communication Services 0.6 -2.0 1.4 13.0 -0.1 0.0 -0.1
Industrials 13.1 10.8 16.1 13.0 -0.1 -0.1 -0.1
Cash 2.7 0.7 0.0 0.0 0.0 -0.4 -0.4
Total 100.0 16.9 100.0 13.5 3.1 0.3 3.4
32

Holdings are based on the strategy’s representative portfolio. “Stock Selection %” reflects the effect of the individual stock’s performance relative to its benchmark, the Russell 2000 Growth Index. Past performance is not a reliable indicator or guarantee of future results. The holdings identified above do not represent all of the securities purchased, sold, or recommended for advisory clients. The calculation methodology for determining the holdings that contributed most positively and negatively to the representative portfolio’s performance relative to the benchmark for the period as well as a list of the relative contribution of each holding in the portfolio to the portfolio’s performance are available upon request. Sector information for each holding is based upon GICS classifications.
Performance Highlights: Ten Year
(AS OF 06/30/2021)
Largest Contributors Ticker % Stock Selection
Generac Holdings, Inc. Industrials
GNRC 10.26
Five9, Inc. Information Technology
FIVN 9.39
Chegg, Inc. Consumer Discretionary
CHGG 8.90
Immunomedics, Inc. Health Care
IMMU 7.92
Roku Inc Communications
ROKU 7.83
Largest Detractors Ticker % Stock
Selection
Stamps.com Inc Information Technology
STMP -5.11
Overstock.com Inc Consumer Discretionary
OSTK -4.65
Stitch Fix Inc Consumer Discretionary
SFIX -4.28
The Realreal Inc Consumer Discretionary
REAL -4.08
Sunrun, Inc. Industrials
RUN -3.98
33

Strengthening Our Commitment
We are making our firm more inclusive
INCREASING REPRESENTATION OF WOMEN AT SENIOR LEVELS
We have increased the representation of women at senior levels across the
organization through hiring and promoting within the firm. Currently, the roles
of Chief Financial Officer, Chief Impact Officer, Chief Risk Officer, and Chief
Sustainability Officer are all held by women. They, along with other senior
women leaders, hold approximately 40% of the seats on our five leadership
and governance committees – including the Executive Committee, Global
Corporate Citizenship Committee, Investment Committee, Leader
Development Committee, and Partnership Committee. These critical
committees provide strategic direction, enhance our agility, optimize our
impact, and position us for the future.
GALVANIZING UNDERREPRESENTED TALENT COMMUNITIES
We have deepened sense of belonging, inspired allyship, and raised
awareness of the experience of underrepresented talent by building
underrepresented talent networks. These networks sponsor meaningful
educational and philanthropic initiatives throughout the year, with a special
focus on the relevant community during Black History Month, Women’s
History Month, Asian Pacific Heritage Month, LGBTQ+ Pride Month,
Hispanic Heritage Month, and Disability Employment Awareness Month.
USING OUR VOICE TO DRIVE EQUALITY
In July 2019, Lord Abbett joined more than 200 businesses through the
Human Rights Campaign in signing an amicus brief filed with the U.S.
Supreme Court in support of workplace equality for LGBTQ+ workers and in
June of 2020, signed onto the HRC’s Business Coalition for Equality Act. In
October 2020, Lord Abbett wrote a letter to the U.S. Securities and Exchange
Commission in full support of the NASDAQ’s recent stand for enhancing
diversity among listed companies.
ELEVATING OUR FOCUS ON SOCIAL JUSTICE & RACIAL EQUITY
To provide a forum for addressing the issues of social justice that intensified
in 2020, we established an insightful and inspiring series of leadership
conversations on equity with a range of distinguished speakers. Guest
speakers have included Wes Moore, former CEO of the Robin Hood
Foundation, Julie Hill, member of the Board of Directors of the Lord Abbett
Family of Funds, L. Song Richardson, Dean and Chancellor’s Professor of
the UC Irvine School of Law, Adena Friedman, President and CEO of
Nasdaq; and Dr. Michael L. Lomax, President and CEO of UNCF.
EXPANDING OUR INCLUSION CURRICULUM
We sponsor a “Breaking Bias” training series firmwide to educate our people
on bias in the workplace and ways to mitigate its potential impact across our
core talent processes and in our culture. This important effort includes
specialized sessions for people leaders and dedicated training on LGBTQ+
allyship via PFLAG’s Straight for Equality in the Workplace training. These
ongoing initiatives comprise an expanded inclusion curriculum that includes
respectful workplace training.
PARTNERING TO CLOSE THE RACIAL WEALTH IN AMERICA
In April 2021, Lord Abbett announced a new partnership with the Robin Hood
Foundation and nine other leading organizations from across business,
nonprofit, philanthropy, and academia to launch NinetyToZero, an initiative
formed to address the 90% racial wealth gap between White and Black
Americans. NinetyToZero seeks to bring deliberate, collective action to
ensure that all Americans have opportunities to thrive. As a founding partner
of NinetyToZero, we have committed to move on a set of economic levers
designed to grow our Black talent pipeline and direct capital and activity to
Black-owned and Black-led businesses.
34

Enriching the Diversity of Our Talent Pipeline
We are ensuring that each generation is more diverse than the last
Achieving Diversity
in Senior Leadership
Strengthening Diversity
at All Levels
Increasing
Generational Diversity
▪ Women and/or people of color
represent 60% of the independent
members of the Board of Directors/
Trustees of the Lord Abbett Funds
▪ Women hold 40% of the seats on
our five governance committees
▪ Our five-year plan includes a goal
to achieve 30% diversity among
Partners and Managing Directors,
and 28% of Partners and
Managing Directors are diverse
today
▪ Women represent 33% of the firm
and 43% of all new hires since
April 2018
▪ Diverse talent represents 48% of
the firm and 55% of all new hires
since April 2018
▪ Millennials and Gen Z represent
50% of the firm
▪ Gen X represents 43% of the firm
▪ Baby Boomers represent 7% of the
firm
35

Biographies
Brooke A. Fapohunda
Partner, Chief Sustainability Officer
Brooke Fapohunda is Lord Abbett’s Chief Sustainability Officer. She leads the firm’s efforts to drive sustainable and
equitable growth for stakeholders worldwide. In this role, she collaborates with investment professionals on ESG
investing, advances sustainability across all other aspects of the firm’s business, and leads the firm’s Community
Relations and Inclusion & Diversity teams. She also is a member of the Executive Committee and Global Corporate
Citizenship Committee and co-chairs the Leader Development Committee and Investment Stewardship Council.
Ms. Fapohunda joined Lord Abbett in 2006 and was named Partner in 2017. Prior to her current role, she served as
Head of Human Capital Management and was responsible for aligning leadership, culture, and talent initiatives with
the firm’s strategy. Prior to that, she served as Deputy General Counsel for the firm’s U.S. retail business. Her
previous experience includes serving as Vice President and Counsel in the asset management division of Credit
Suisse and Associate at law firms Willkie Farr & Gallagher LLP and K&L Gates LLP. She has worked in the financial
services industry since 2002.
Ms. Fapohunda earned an AB from Princeton University and a JD from Columbia University.
36

Biographies
Matthew R. DeCicco, CFA
Partner & Director of Equities
Matthew DeCicco is responsible for directing Lord Abbett’s equity investment activities, including portfolio
management and equity research. He also is a portfolio manager on the Innovation Growth Equity team and is
responsible for contributing to the management of the firm’s micro cap growth, small cap growth, and large cap
growth equity strategies. In addition, Mr. DeCicco serves on the Investment Committee, which is responsible for
leading Lord Abbett’s investment organization. He also is a member of the Investment Stewardship Council.
Mr. DeCicco joined Lord Abbett in 1999 and was named Partner in 2020. Prior to his current role, he served as
Associate Analyst and was promoted to Research Analyst for the small cap growth team. He has worked in the
financial services industry since 1999.
He earned a BS in business administration and economics from the University of Richmond’s Robins School of
Business and an MS in biotechnology from Johns Hopkins University. He also is a holder of the Chartered Financial
Analyst® (CFA) designation.
37

Biographies
Gregory Balewicz
Institutional Director
Gregory Balewicz is responsible for working with institutional investors across a range of segments, including
corporate, public, insurance, health care, endowments and foundations. In this role, he provides the professional
investor with market perspectives, new investment ideas, in-depth portfolio reviews, and access to the full breadth of
Lord Abbett’s resources.
Mr. Balewicz joined Lord Abbett in 2017. His prior experience includes serving in various roles at State Street; most
recently he was a Vice President in the Institutional Client Group. Earlier in his career, he worked in the Defined
Contribution Group at Putnam Investments. He began his career in the financial services industry in 1996.
He earned a BA from Framingham State University.
38

Team Member Biographies
Name Role Years of Industry Experience Years with Lord Abbett Prior Professional Experience Education
F. Thomas O’Halloran, J.D.,
CFA*
Portfolio Manager 34 20 Dillon, Read, & Co.;
Trial Attorney
AB, Bowdoin College; JD,
Boston College; MBA, Columbia
University
Matthew R. DeCicco, CFA* Portfolio Manager & Director of
Equities
22 22 N/A BS, University of Richmond;
MS, Johns Hopkins University
Vernon Bice, CMT Portfolio Manager 20 10 UBS;
BNY Institutional Asset
Management;
Bank of America
BS, The Ohio State University
Benjamin Ebel Portfolio Manager 29 16 Dreyfus;
Invesco;
Armen Partners, LP
BA, Brandeis University;
MS, University of North Carolina
Steven Wortman Portfolio Manager 23 15** Greenhouse Funds;
Babson Capital Management;
Wynnefield Capital
BS, University of Florida
So Young Lee Research Analyst 21 8 SunTrust Robinson Humphrey;
AllianceBernstein; Credit Suisse
First Boston; Ernst & Young
LLP
MBA, University of Chicago;
BA, Wellesley
As of 04/12/2021. *Partner of Lord Abbett. **Years at Lord Abbett includes 2005– 2014 and 2016-present. Years of industry experience is updated as of 01/01/2021. 39

Team Member Biographies
Name Role Years of Industry Experience Years with Lord Abbett Prior Professional Experience Education
Samantha Shevins Research Analyst 21 4 Visium Asset Management;
Trellus Capital Management;
Lehman Brothers
BS, University of Pennsylvania
Michael J. Glaccum, CFA Research Analyst 13 6*** Fiera Capital Inc. BS, Georgetown University
Alan R. Kurtz Portfolio Manager 21 21 N/A BA, Hartwick College; MBA,
New York University
Jeremy Lehmann, CFA Portfolio Manager 9 9 N/A BA, Columbia University
Alec I. Crawford* Chief Investment Risk Officer 33 9 Ziff Brothers Investments; RBS
Greenwich Capital; Deutsche
Bank Securities
AB, Harvard College
Andrew M. Khatri* Director of Global Trading 19 10 MarketAxess;
Citigroup Global Markets Inc.;
Wellington Management
Company, LLP
BS, Boston College
Brian Foerster, CFA Investment Strategist 26 9 Invesco;
ING Investment Management
BA, Boston College
As of 04/12/2021. *Partner of Lord Abbett. ***Years at Lord Abbett includes 2008– 2011 and 2018-present. Years of industry experience is updated as of 01/01/2021. 40

The Global Investment Performance Standards (GIPS®) compliant performance results shown represent the investment performance record for the Lord, Abbett & Co. LLC (Lord Abbett) Small Cap Growth Equity
Institutional Composite. This composite is comprised of all fully discretionary portfolios managed on behalf of institutional investors investing primarily in small-capitalization equity securities that Lord Abbett deems to have
long-term growth potential. Effective January 2018, accounts funded on or before the 15th of the month will be included in the Composite effective the first day of the first following month. Accounts funded after the 15th of the
month will be included effective on the first day of the second following month. Prior to January 2018, other than registered investment companies sponsored by Lord Abbett, accounts opened/funded on or before the 15 th
day of the month were included in the Composite effective the first day of the second following month and accounts opened/funded after 15th of the month were included effective on the first day of the third following month.
Registered investment companies sponsored by Lord Abbett are included in the Composite in the first full month of management. Closed accounts are removed from the Composite after the last full month in which they
were managed in accordance with the applicable objectives, guidelines and restrictions. Performance results are expressed in U.S. dollars and reflect reinvestment of any dividends and distributions. The Composite was
created in 1999 and incepted in 1987. A list of all composite and pooled fund investment strategies offered by the firm, with a description of each strategy, is available upon request. The type of portfolios in which each
strategy is available (segregated account, limited distribution pooled fund, or broad distribution pooled fund) is indicated in the description of each strategy. Policies for valuing investments, calculating performance, and
preparing GIPS Reports are available upon request.
For GIPS® purposes, the firm is defined as Lord, Abbett & Co. LLC (“Lord Abbett”). Total Firm Assets are the aggregate fair value of a ll discretionary and non-discretionary assets for which the Firm has investment
management responsibility. Accordingly, Total Firm Assets include, but are not limited to, mutual funds (all classes of shares), privately placed investment funds, non-U.S. domiciled investment funds, separate/institutional
portfolios, individual portfolios and separately managed accounts (“Wrap Fee/SMA Portfolios”) managed by Lord Abbett. Total F irm Assets also include any collateralized, structured investment vehicle, such as a
collateralized debt obligation or collateralized loan obligation, for which Lord Abbett has been appointed as the collateral manager. For the period prior to January 1, 2000, the definition of the Firm does not include any
hedge fund or SMA program accounts where Lord, Abbett & Co. LLC did not have the records so long as it is impossible for Lord, Abbett & Co. LLC to have the records (within the meaning of relevant GIPS® standards
interpretations). Total Firm Assets also exclude separately managed program accounts that involve model delivery.
The number of portfolios and total assets in the Composite, and the percentage of total “firm” assets represented by the Composite at the end of each calendar year for which performance information is provided are as
follows:
End Notes to Performance
Calendar Year Ended 2020 2019 2018 2017 2016 2015 2014 2013 2012 2011
# of Portfolios 11 13 13 14 17 19 19 19 17 17
Total Assets ($M) $5,115 $2,498 $2,139 $2,574 $2,929 $4,022 $4,785 $4,567 $2,872 $2,645
Percentage of Firm Assets 2.30% 1.22% 1.33% 1.65% 2.18% 3.24% 3.52% 3.36% 2.20% 2.50%
Total Firm Assets ($M) $222,535 $204,031 $161,055 $156,110 $134,565 $124,007 $135,945 $135,786 $127,753 $107,449
Dispersion 0.33 0.27 0.53 0.26 0.19 0.13 0.21 0.29 0.10 0.15
Lord Abbett Small Cap Grow th Equity Institutional Composite
Gross (Annual)74.30% 33.06% 6.04% 31.13% -1.72% -8.00% 4.33% 58.82% 11.60% -0.62%
Lord Abbett Small Cap Grow th Equity Institutional Composite
Gross (3 year Annualized Return)34.98% 22.76% 10.97% 5.84% -1.93% 15.10% 22.74% 20.76% 15.30% 26.90%
Lord Abbett Small Cap Grow th Equity Institutional Composite
Gross (3 year Annualized Ex-Post Standard Deviation)26.64% 20.19% 18.79% 15.78% 18.06% 16.94% 15.19% 17.01% 19.83% 22.82%
Lord Abbett Small Cap Grow th Equity Institutional Composite Net
(Annual)72.75% 31.91% 5.12% 29.95% -2.60% -8.83% 3.32% 57.17% 10.45% -1.64%
Lord Abbett Small Cap Grow th Equity Institutional Composite Net
(3 year Annualized Return)33.80% 21.69% 9.99% 4.89% -2.83% 13.98% 21.49% 19.52% 14.14% 25.65%
Russell 2000® Grow th Index (Annual) 34.63% 28.48% -9.31% 22.17% 11.32% -1.38% 5.60% 43.30% 14.59% -2.91%
Russell 2000® Grow th Index (3 year Annualized Return) 16.20% 12.49% 7.24% 10.28% 5.05% 14.28% 20.14% 16.82% 12.82% 19.00%
Russell 2000® Grow th Index (3 year Annualized Ex-Post
Standard Deviation)25.46% 16.60% 16.69% 14.80% 16.91% 15.16% 14.02% 17.52% 21.01% 24.65%
41

Dispersion is represented by the asset-weighted standard deviation, a measure that explains deviations of gross portfolio rates of return from the asset-weighted composite return. Only portfolios that have been managed
within the Composite style for a full year are included in the asset-weighted standard deviation calculation. The measure may not be meaningful (N/A) for composites consisting of five or fewer portfolios or for periods of less
than a full year.
The performance of the Composite is shown net and gross of advisory fees, and reflects the deduction of transaction costs. The deduction of advisory fees and expenses (and the compounding effect thereof over time) will
reduce the performance results and, correspondingly, the return to an investor. For all periods through December 31, 2010, net performance of the Composite as presented in the table on the previous page reflects the
deduction of a “model” advisory fee, calculated as the highest advisory fee, borne by any account (without giving effect to any performance fee that may be applicable) in the Composite (an annual rate of 1.00% of assets)
and other expenses. For all periods beginning January 1, 2011, the table on the previous page includes net performance for the Composite and reflects the deduction of the actual advisory fee borne by each account in the
Composite and other trading expenses and performance incentive fees. Portfolio incentive fees are applied on a cash basis in the period in which they are paid. The effect of fees and expenses on performance will vary with
the relative size of the fee and account performance. For example, if $10 million were invested and experienced a 10% compounded annual return for 10 years, its ending dollar value, without giving effect to the
deduction of the advisory fee, would be $25,937,425. If an advisory fee of 1.00% of average net assets per year for the 10-year period were deducted, the annual total return would be 8.91% and the ending
dollar value would be $23,673,637. The management fee schedule is as follows: 1.00% on the first $10 million, 0.75% on the next $40 million, 0.625% on the next $50 million and 0.50% on all assets over $100
million. Certain securities held in portfolios contained in this composite may have valuations determined using both subjective observable and subjective unobservable inputs. The Firm’s valuation hierarchy does not
materially differ from the hierarchy in the GIPS Valuation Principles.
Lord Abbett claims compliance with the Global investment Performance Standards (GIPS®) and has prepared and presented this report in compliance with the GIPS standards. Lord Abbett has been independently verified
for the periods 1993-2020. A firm that claims compliance with the GIPS standards must establish policies and procedures for complying with all the applicable requirements of the GIPS standards. Verification provides
assurance on whether the firm's policies and procedures related to composite and pooled fund maintenance, as well as the calculation, presentation, and distribution of performance, have been designed in compliance with
the GIPS standards and have been implemented on a firm-wide basis. The Small Cap Growth Equity Institutional composite has had a performance examination for the periods 1993-2020. The verification and performance
examination reports are available upon request.
The Russell 2000® Index measures the performance of the small-cap segment of the U.S. equity universe. The index consists of the 2,000 smallest companies in the Russell 3000® Index, which represents approximately
10% of the total market capitalization of the Russell 3000® Index. The Russell 2000® Growth Index measures the performance of those Russell 2000® companies with higher price-to-book ratios and higher forecasted growth
values. The benchmarks have not been examined by Deloitte & Touche LLP.
Past performance is not a reliable indicator or a guarantee of future results. Differences in account size, timing of transactions, and market conditions prevailing at the time of investment may lead to different results
among accounts. Differences in the methodology used to calculate performance also might lead to different performance results than those shown. Composite performance is compared to that of an unmanaged index,
which does not incur management fees, transaction costs, or other expenses associated with a managed account.
End Notes to Performance
42

The Global Investment Performance Standards (GIPS®) compliant performance results shown represent the investment performance record for the Lord, Abbett & Co. LLC (Lord Abbett) Micro Cap Growth Equity
Institutional Composite. This composite is comprised of all fully discretionary portfolios managed on behalf of institutional investors investing primarily in micro-cap equity securities that Lord Abbett deems to have long-
term growth potential. Effective January 2018, accounts funded on or before the 15th of the month will be included in the Composite effective the first day of the first following month. Accounts funded after the 15th of the
month will be included effective on the first day of the second following month. Prior to January 2018, other than registered investment companies sponsored by Lord Abbett, accounts opened/funded on or before the 15 th
day of the month were included in the Composite effective the first day of the second following month and accounts opened/funded after 15th of the month were included effective on the first day of the third following month.
Registered investment companies sponsored by Lord Abbett are included in the Composite in the first full month of management. Closed accounts are removed from the Composite after the last full month in which they
were managed in accordance with the applicable objectives, guidelines and restrictions. Performance results are expressed in U.S. dollars and reflect reinvestment of any dividends and distributions. The Composite was
created and incepted in 1999. A list of all composite and pooled fund investment strategies offered by the firm, with a description of each strategy, is available upon request. The type of portfolios in which each strategy is
available (segregated account, limited distribution pooled fund, or broad distribution pooled fund) is indicated in the description of each strategy. Policies for valuing investments, calculating performance, and preparing GIPS
Reports are available upon request.
For GIPS® purposes, the firm is defined as Lord, Abbett & Co. LLC (“Lord Abbett”). Total Firm Assets are the aggregate fair value of a ll discretionary and non-discretionary assets for which the Firm has investment
management responsibility. Accordingly, Total Firm Assets include, but are not limited to, mutual funds (all classes of shares), privately placed investment funds, non-U.S. domiciled investment funds, separate/institutional
portfolios, individual portfolios and separately managed accounts (“Wrap Fee/SMA Portfolios”) managed by Lord Abbett. Total F irm Assets also include any collateralized, structured investment vehicle, such as a
collateralized debt obligation or collateralized loan obligation, for which Lord Abbett has been appointed as the collateral manager. For the period prior to January 1, 2000, the definition of the Firm does not include any
hedge fund or SMA program accounts where Lord, Abbett & Co. LLC did not have the records so long as it is impossible for Lord, Abbett & Co. LLC to have the records (within the meaning of relevant GIPS® standards
interpretations). Total Firm Assets also exclude separately managed program accounts that involve model delivery.
The number of portfolios and total assets in the Composite, and the percentage of total “firm” assets represented by the Composite at the end of each calendar year for which performance information is provided are as
follows:
End Notes to Performance
Calendar Year Ended 2020 2019 2018 2017 2016 2015 2014 2013 2012 2011
# of Portfolios 8 9 7 7 7 7 5 5 5 5
Total Assets ($M) $727 $759 $642 $638 $531 $526 $542 $569 $372 $372
Percentage of Firm Assets 0.33% 0.37% 0.40% 0.41% 0.39% 0.42% 0.40% 0.42% 0.30% 0.30%
Total Firm Assets ($M) $222,535 $204,031 $161,055 $156,110 $134,565 $124,007 $135,945 $135,786 $127,753 $107,449
Dispersion 0.98 N/A 0.32 0.14 NA NA N/A N/A N/A N/A
Lord Abbett Micro Cap Grow th Equity Institutional Composite
Gross (Annual)83.10% 36.90% 4.41% 40.48% 4.01% -4.90% 12.59% 81.16% 4.35% -3.99%
Lord Abbett Micro Cap Grow th Equity Institutional Composite
Gross (3 year Annualized Return)37.81% 26.16% 15.12% 11.59% 3.65% 24.73% 28.63% 21.97% 11.07% 26.81%
Lord Abbett Micro Cap Grow th Equity Institutional Composite
Gross (3 year Annualized Ex-Post Standard Deviation)31.51% 21.65% 22.07% 19.01% 21.82% 20.01% 19.44% 19.82% 21.18% 23.77%
Lord Abbett Micro Cap Grow th Equity Institutional Composite
Net (Annual)81.44% 35.56% 3.31% 38.87% 2.74% -6.03% 11.22% 79.07% 3.09% -5.20%
Lord Abbett Micro Cap Grow th Equity Institutional Composite
Net (3 year Annualized Return)36.46% 24.82% 13.80% 10.27% 2.40% 23.25% 27.09% 20.50% 9.62% 25.05%
Russell Microcap® Grow th Index (Annual) 40.13% 23.33% -14.18% 16.65% 6.86% -3.85% 4.30% 52.84% 15.17% -8.42%
Russell Microcap® Grow th Index (3 year Annualized
Return)14.04% 7.28% 2.27% 6.22% 2.33% 15.30% 22.45% 17.25% 10.95% 18.18%
Russell Microcap® Grow th Index (3 year Annualized Ex-
Post Standard Deviation)28.35% 18.01% 18.73% 17.22% 19.68% 17.80% 16.71% 18.75% 21.89% 25.59%
43

End Notes to PerformanceDispersion is represented by the asset-weighted standard deviation, a measure that explains deviations of gross portfolio rates of return from the asset-weighted composite return. Only portfolios that have been managed
within the Composite style for a full year are included in the asset-weighted standard deviation calculation. The measure may not be meaningful (N/A) for composites consisting of five or fewer portfolios or for periods of less
than a full year.
The performance of the Composite is shown net and gross of advisory fees, and reflects the deduction of transaction costs. The deduction of advisory fees and expenses (and the compounding effect thereof over time) will
reduce the performance results and, correspondingly, the return to an investor. For all periods through December 31, 2010, net performance of the Composite as presented in the table on the previous page reflects the
deduction of a “model” advisory fee, calculated as the highest advisory fee, borne by any account (without giving effect to any performance fee that may be applicable) in the Composite (an annual rate of 1.50% of assets)
and other expenses. For all periods beginning January 1, 2011, the table on the previous page includes net performance for the Composite and reflects the deduction of the actual advisory fee borne by each account in the
Composite and other trading expenses and performance incentive fees. Portfolio incentive fees are applied on a cash basis in the period in which they are paid. The effect of fees and expenses on performance will vary with
the relative size of the fee and account performance. For example, if $10 million were invested and experienced a 10% compounded annual return for 10 years, its ending dollar value, without giving effect to the
deduction of the advisory fee, would be $25,937,425. If an advisory fee of 1.25% of average net assets per year for the 10-year period were deducted, the annual total return would be 8.64% and the ending
dollar value would be $23,136,233. The Institutional Portfolio management fee schedule is as follows: 1.25% on the first $25 million, and 1.00% on all assets over $25 million. Certain securities held in portfolios
contained in this composite may have valuations determined using both subjective observable and subjective unobservable inputs. The Firm’s valuation hierarchy does not materially differ from the hierarchy in the GIPS
Valuation Principles.
Lord Abbett claims compliance with the Global investment Performance Standards (GIPS®) and has prepared and presented this report in compliance with the GIPS standards. Lord Abbett has been independently verified
for the periods 1993-2020. A firm that claims compliance with the GIPS standards must establish policies and procedures for complying with all the applicable requirements of the GIPS standards. Verification provides
assurance on whether the firm's policies and procedures related to composite and pooled fund maintenance, as well as the calculation, presentation, and distribution of performance, have been designed in compliance with
the GIPS standards and have been implemented on a firm-wide basis. The Micro Cap Growth Equity Institutional composite has had a performance examination for the periods 1999-2020. The verification and performance
examination reports are available upon request.
The Russell Microcap® Index measures performance of the micro cap segment of the U.S. equity universe, representing less than 3% of the U.S. equity market. The Russell Microcap® Index includes the smallest 1,000
securities in the Russell 2000® Index plus the next smaller 1,000 securities. The Russell Microcap® Growth Index measures the performance of those Russell Microcap® companies with higher price-to-book ratios and higher
forecasted growth values. The benchmarks have not been examined by Deloitte & Touche LLP.
Past performance is not a reliable indicator or a guarantee of future results. Differences in account size, timing of transactions, and market conditions prevailing at the time of investment may lead to different results
among accounts. Differences in the methodology used to calculate performance also might lead to different performance results than those shown. Composite performance is compared to that of an unmanaged index,
which does not incur management fees, transaction costs, or other expenses associated with a managed account.
44

The Global Investment Performance Standards (GIPS®) compliant performance results shown represent the investment performance record for the Lord, Abbett & Co. LLC (Lord Abbett) Growth Equity Institutional
Composite. Prior to September 30, 2013, the composite was named Multi Cap Growth Equity Institutional Composite. This composite is comprised of all fully discretionary portfolios managed on behalf of institutional
investors investing primarily in a combination of large-, mid- and small-capitalization equity securities that Lord Abbett deems to have long-term growth potential. Effective January 2018, accounts funded on or before the 15th
of the month will be included in the Composite effective the first day of the first following month. Accounts funded after the 15th of the month will be included effective on the first day of the second following month. Prior to
January 2018, other than registered investment companies sponsored by Lord Abbett, accounts opened/funded on or before the 15 th day of the month were included in the Composite effective the first day of the second
following month and accounts opened/funded after 15th of the month were included effective on the first day of the third following month. Registered investment companies sponsored by Lord Abbett are included in the
Composite in the first full month of management. Closed accounts are removed from the Composite after the last full month in which they were managed in accordance with the applicable objectives, guidelines and
restrictions. Performance results are expressed in U.S. dollars and reflect reinvestment of any dividends and distributions. The Composite was created and incepted in 2011. A list of all composite and pooled fund
investment strategies offered by the firm, with a description of each strategy, is available upon request. The type of portfolios in which each strategy is available (segregated account, limited distribution pooled fund, or broad
distribution pooled fund) is indicated in the description of each strategy. Policies for valuing investments, calculating performance, and preparing GIPS Reports are available upon request.
For GIPS® purposes, the firm is defined as Lord, Abbett & Co. LLC (“Lord Abbett”). Total Firm Assets are the aggregate fair value of all discretionary and non-discretionary assets for which the Firm has investment
management responsibility. Accordingly, Total Firm Assets include, but are not limited to, mutual funds (all classes of shares), privately placed investment funds, non-U.S. domiciled investment funds, separate/institutional
portfolios, individual portfolios and separately managed accounts (“Wrap Fee/SMA Portfolios”) managed by Lord Abbett. Total Firm Assets also include any collateralized, structured investment vehicle, such as a
collateralized debt obligation or collateralized loan obligation, for which Lord Abbett has been appointed as the collateral manager. For the period prior to January 1, 2000, the definition of the Firm does not include any
hedge fund or SMA program accounts where Lord, Abbett & Co. LLC did not have the records so long as it is impossible for Lord, Abbett & Co. LLC to have the records (within the meaning of relevant GIPS® standards
interpretations). Total Firm Assets also exclude separately managed program accounts that involve model delivery.
The number of portfolios and total assets in the Composite, and the percentage of total “firm” assets represented by the Composite at the end of each calendar year for which performance information is provided are as
follows:
*N/A for periods with less than 3 years of data based on the composite inception date.
End Notes to Performance
Calendar Year Ended 2020 2019 2018 2017 2016 2015 2014 2013 2012 7/11 - 12/11
# of Portfolios 2 2 2 2 2 1 1 1 1 1
Total Assets ($M) $8,721 $4,010 $3,210 $3,207 $2,104 $2,284 $1,406 $582 $24 $13
Percentage of Firm Assets 3.92% 1.97% 1.99% 2.05% 1.56% 1.84% 1.03% 0.43% 0.02% 0.01%
Total Firm Assets ($M) $222,535 $204,031 $161,055 $156,110 $134,565 $124,007 $135,945 $135,786 $127,753 $107,449
Dispersion N/A N/A N/A N/A N/A N/A N/A N/A N/A N/A
Lord Abbett Grow th Equity Institutional Composite Gross (Annual) 78.63% 35.98% -0.01% 32.42% 1.44% 7.60% 11.06% 48.00% 10.92% -7.94%
Lord Abbett Grow th Equity Institutional Composite Gross (3 year Annualized
Return*)34.42% 21.65% 10.33% 13.06% 6.63% 20.95% 22.16% N/A N/A N/A
Lord Abbett Grow th Equity Institutional Composite Gross (3 year Annualized
Ex-Post Standard Deviation*)22.59% 16.49% 14.75% 11.62% 12.24% 12.07% 11.17% N/A N/A N/A
Lord Abbett Grow th Equity Institutional Composite Net (Annual) 77.65% 35.23% -0.58% 31.63% 0.83% 6.96% 10.41% 47.15% 10.26% -8.22%
Lord Abbett Grow th Equity Institutional Composite Net (3 year Annualized
Return*)33.67% 20.96% 9.68% 12.39% 5.99% 20.22% 21.45% N/A N/A N/A
Russell 1000® Grow th Index (Annual) 38.49% 36.39% -1.51% 30.21% 7.08% 5.67% 13.05% 33.48% 15.26% -3.92%
Russell 1000® Grow th Index (3 year Annualized Return*) 22.99% 20.49% 11.15% 13.79% 8.55% 16.83% 20.26% N/A N/A N/A
Russell 1000® Grow th Index (3 year Annualized Ex-Post Standard Deviation*) 19.92% 13.26% 12.30% 10.69% 11.31% 10.85% 9.73% N/A N/A N/A
45

Dispersion is represented by the asset-weighted standard deviation, a measure that explains deviations of gross portfolio rates of return from the asset-weighted composite return. Only portfolios that have been managed
within the Composite style for a full year are included in the asset-weighted standard deviation calculation. The measure may not be meaningful (N/A) for composites consisting of five or fewer portfolios or for periods of less
than a full year.
The performance of the Composite is shown net and gross of advisory fees, and reflects the deduction of transaction costs. The deduction of advisory fees and expenses (and the compounding effect thereof over time) will
reduce the performance results and, correspondingly, the return to an investor. Net performance of the Composite as presented in the table on the previous page reflects the deduction of a “model” advisory fee, calculated
as the highest advisory fee, borne by any account (without giving effect to any performance fee that may be applicable) in the Composite (an annual rate of 0.55% of assets) and other expenses (including trade execution
expenses). For example, if $10 million were invested and experienced a 10% compounded annual return for 10 years, its ending dollar value, without giving effect to the deduction of the advisory fee, would be
$25,937,425. If an advisory fee of 0.55% of average net assets per year for the 10-year period were deducted, the annual total return would be 9.40% and the ending dollar value would be $24,669,347. The
management fee schedule is as follows: 0.55% on the first $25 million, 0.45% on the next $75 million, 0.38% on the next $150 million, 0.35% on the next $250 million, and negotiable on all assets over $500
million. Prior to 2018 a 0.60% fee was applied. Net-of-fee performance reflects the deduction of the highest applicable institutional advisory fee that would be charged to a new institutional client account based on the
current fee schedule for this strategy. The composite includes one or more registered investment companies sponsored by Lord Abbett (“Lord Abbett Funds”) that are subject to fees and expenses that would be inapplicable
to an institutional client account. Therefore, the actual performance of Lord Abbett Fund accounts included in the composite may be lower than the net-of-fee composite performance presented. Fees and expenses
applicable to the Lord Abbett Funds are disclosed in each Fund’s Prospectus, which is available upon request. Past performance does not guarantee future results. Certain securities held in portfolios contained in this
composite may have valuations determined using both subjective observable and subjective unobservable inputs. The Firm’s valuation hierarchy does not materially differ from the hierarchy in the GIPS Valuation Principles.
Lord Abbett claims compliance with the Global investment Performance Standards (GIPS®) and has prepared and presented this report in compliance with the GIPS standards. Lord Abbett has been independently verified
for the periods 1993-2020. A firm that claims compliance with the GIPS standards must establish policies and procedures for complying with all the applicable requirements of the GIPS standards. Verification provides
assurance on whether the firm's policies and procedures related to composite and pooled fund maintenance, as well as the calculation, presentation, and distribution of performance, have been designed in compliance with
the GIPS standards and have been implemented on a firm-wide basis. The Growth Equity Institutional composite has had a performance examination for the periods 07/01/11-2020. The verification and performance
examination reports are available upon request.
The Russell 1000® Index measures the performance of the 1,000 largest companies in the Russell 3000® Index, which represents approximately 90% of the total market capitalization of the Russell 3000® Index. The
Russell 1000® Growth Index measures the performance of those Russell 1000 companies with higher price-to-book ratios and higher forecasted growth values. Prior to April 2014, the primary benchmark for the composite
was the Russell 3000® Growth Index. Lord Abbett believes the Russell 1000® Growth Index is more representative of the investment strategy given its minimum 50% allocation to large cap stocks. The benchmark has not
been examined by Deloitte & Touche LLP.
Past performance is not a reliable indicator or a guarantee of future results. Differences in account size, timing of transactions, and market conditions prevailing at the time of investment may lead to different results among
accounts. Differences in the methodology used to calculate performance also might lead to different performance results than those shown. Composite performance is compared to that of an unmanaged index, which does
not incur management fees, transaction costs, or other expenses associated with a managed account.
End Notes to Performance
46

The Global Investment Performance Standards (GIPS®) compliant performance results shown represent the investment performance record for the Lord, Abbett & Co. LLC (Lord Abbett) Focused Growth Institutional
Composite. This composite is comprised of all fully discretionary portfolios managed on behalf of institutional investors investing primarily in a combination of large-, mid- and small-capitalization equity securities of
companies that Lord Abbett deems to have exceptional growth potential. Portfolios included in this composite will under normal conditions generally invest in 40 or fewer equity securities. Accounts funded on or before the
15th of the month will be included in the Composite effective the first day of the first following month. Accounts funded after the 15th of the month will be included effective on the first day of the second following month.
Registered investment companies sponsored by Lord Abbett are included in the Composite in the first full month of management. Closed accounts are removed from the Composite after the last full month in which they
were managed in accordance with the applicable objectives, guidelines and restrictions. Performance results are expressed in U.S. dollars and reflect reinvestment of any dividends and distributions. The Composite was
created and incepted in 2018. A list of all composite and pooled fund investment strategies offered by the firm, with a description of each strategy, is available upon request. The type of portfolios in which each strategy is
available (segregated account, limited distribution pooled fund, or broad distribution pooled fund) is indicated in the description of each strategy. Policies for valuing investments, calculating performance, and preparing GIPS
Reports are available upon request.
For GIPS® purposes, the firm is defined as Lord, Abbett & Co. LLC (“Lord Abbett”). Total Firm Assets are the aggregate fair value of all discretionary and non-discretionary assets for which the Firm has investment
management responsibility. Accordingly, Total Firm Assets include, but are not limited to, mutual funds (all classes of shares), privately placed investment funds, non-U.S. domiciled investment funds, separate/institutional
portfolios, individual portfolios and separately managed accounts (“Wrap Fee/SMA Portfolios”) managed by Lord Abbett. Total F irm Assets also include any collateralized, structured investment vehicle, such as a
collateralized debt obligation or collateralized loan obligation, for which Lord Abbett has been appointed as the collateral manager. For the period prior to January 1, 2000, the definition of the Firm does not include any
hedge fund or SMA program accounts where Lord, Abbett & Co. LLC did not have the records so long as it is impossible for Lord, Abbett & Co. LLC to have the records (within the meaning of relevant GIPS® standards
interpretations). Total Firm Assets also exclude separately managed program accounts that involve model delivery.
The number of portfolios and total assets in the Composite, and the percentage of total “firm” assets represented by the Composite at the end of each calendar year for which performance information is provided are as
follows:
*N/A for periods with less than 3 years of data based on the composite inception date.
End Notes to Performance
Calendar Year Ended 2020 201907/2018-
12/2018
# of Portfolios 1 1 1
Total Assets ($M) $39 $11 $2
Percentage of Firm Assets 0.02% 0.01% 0.00%
Total Firm Assets ($M) $222,535 $204,031 $161,055
Dispersion N/A N/A N/A
Lord Abbett Focused Grow th Institutional Composite Gross (Annual) 88.06% 28.36% -9.49%
Lord Abbett Focused Grow th Institutional Composite Gross (3 year
Annualized Return*)N/A N/A N/A
Lord Abbett Focused Grow th Institutional Composite Gross (3 year
Annualized Ex-Post Standard Deviation*)N/A N/A N/A
Lord Abbett Focused Grow th Institutional Composite Net (Annual) 86.10% 27.18% -9.76%
Lord Abbett Focused Grow th Institutional Composite Net (3 year
Annualized Return*)N/A N/A N/A
Russell 1000® Grow th Index (Annual) 38.49% 36.39% -8.17%
Russell 1000® Grow th Index (3 year Annualized Return*) N/A N/A N/A
Russell 1000® Grow th Index (3 year Annualized Ex-Post Standard
Deviation*)N/A N/A N/A
47

Dispersion is represented by the asset-weighted standard deviation, a measure that explains deviations of gross portfolio rates of return from the asset-weighted composite return. Only portfolios that have been managed
within the Composite style for a full year are included in the asset-weighted standard deviation calculation. The measure may not be meaningful (N/A) for composites consisting of five or fewer portfolios or for periods of less
than a full year.
The performance of the Composite is shown net and gross of advisory fees, and reflects the deduction of transaction costs. The deduction of advisory fees and expenses (and the compounding effect thereof over time) will
reduce the performance results and, correspondingly, the return to an investor. The table on the previous page includes net performance for the Composite and reflects the of the deduction of the actual advisory fee borne
by each account in the Composite and other trading expenses and performance incentive fees. Portfolio incentive fees are applied on a cash basis in the period in which they are paid. The effect of fees and expenses on
performance will vary with the relative size of the fee and account performance. For example, if $10 million were invested and experienced a 10% compounded annual return for 10 years, its ending dollar value,
without giving effect to the deduction of the advisory fee, would be $25,937,425. If an advisory fee of 0.55% of average net assets per year for the 10-year period were deducted, the annual total return would
be 9.40% and the ending dollar value would be $24,669,347. The management fee schedule is as follows: 0.55% on the first $25 million, 0.45% on the next $75 million, 0.38% on the next $150 million, 0.35% on
the next $250 million, and negotiable on all assets over $500 million. Certain securities held in portfolios contained in this composite may have valuations determined using both subjective observable and subjective
unobservable inputs. The Firm’s valuation hierarchy does not materially differ from the hierarchy in the GIPS Valuation Principles.
Lord Abbett claims compliance with the Global investment Performance Standards (GIPS®) and has prepared and presented this report in compliance with the GIPS standards. Lord Abbett has been independently verified
for the periods 1993-2020. A firm that claims compliance with the GIPS standards must establish policies and procedures for complying with all the applicable requirements of the GIPS standards. Verification provides
assurance on whether the firm's policies and procedures related to composite and pooled fund maintenance, as well as the calculation, presentation, and distribution of performance, have been designed in compliance with
the GIPS standards and have been implemented on a firm-wide basis. The verification reports are available upon request.
The Russell 1000® Index measures the performance of the 1,000 largest companies in the Russell 3000® Index, which represents approximately 90% of the total market capitalization of the Russell 3000® Index. The
Russell 1000® Growth Index measures the performance of those Russell 1000 companies with higher price-to-book ratios and higher forecasted growth values. The benchmark has not been examined by Deloitte & Touche
LLP.
Past performance is not a reliable indicator or a guarantee of future results. Differences in account size, timing of transactions, and market conditions prevailing at the time of investment may lead to different results
among accounts. Differences in the methodology used to calculate performance also might lead to different performance results than those shown. Composite performance is compared to that of an unmanaged index,
which does not incur management fees, transaction costs, or other expenses associated with a managed account.
End Notes to Performance
48

About Wilshire
Portfolio
Weight
Portfolio
Base Return
Benchmark
Weight
Benchmark
Base Return
Stock
Selection
Group
Weight Total
Weight (Portfolio): This is the average weight of each group in the portfolio. Alternatively, the weight at the end of the reporting period, or on average across the reporting period, may be selected.
Base Return (Portfolio): This is the weighted average holding period return for the securities in each group. This weighted average is calculated for each link period using beginning weights and then the resulting values are
linked together to calculate the displayed value.
Weight (Benchmark): This is the average weight of each group in the benchmark. Alternatively, the weight at the end of the reporting period, or on average across the reporting period, may be selected.
Base Return (Benchmark): This is the weighted average holding period return for the benchmark securities in each group. This weighted average is calculated for each link period using beginning weights, then the resulting
values are linked together to calculate the displayed value.
Stock Selection Variance: This is the success of selection decisions within each group vs. the benchmark. It is calculated for each link period using the following equation: Stock Selection Variance = WP,G * (RP,G - RB,G),
where WP,G = Weight of the group in the portfolio, RP,G = Return of the group in the portfolio, RB,G = Return of the group in the benchmark.
Group Weighting Variance: This is the result of weighting decisions in each group vs. the benchmark. It is calculated for each link period using the following equation: Group Weighting Variance = (WP,G – WB,G) * (RB,G –
RB,T), where WP,G = Weight of the group in the portfolio, WB,G = Weight of the group in the benchmark, RB,G = Return of the group in the benchmark, RB,T = Overall return of the benchmark.
Total Variance: This is the sum of group weighting and stock selection variances. This represents the amount of total variance that is explained by the selection and allocation decisions for each group.
Hedging Cost: This is the contribution due to the difference in the risk-free rates between currencies and is a function of the time left to maturity. It can be positive or negative, depending on the interest rate differentials
between the long and short currencies. The hedge cost for each contract is calculated individually by multiplying its exposure by its hedge cost; then these contributions are summed to give the total contribution shown on the
report.
Hedging Effect: This is the contribution due to hedging. It is calculated by multiplying the exposure associated with each currency forward by the portion of the forward’s return due to currency fluctuations; then, each of the
forward’s contributions are summed together to give the total that appears in the Contribution Summary table. The return that is used in the calculation excludes the hedge cost.
Portfolio Return: This is the sum of each of the contributions displayed in the Contribution Summary table.
Wilshire generated returns are calculated gross of fees based on end of day prices and do not capture intraday cash flow, price changes or trading activity, and therefore are subject to some variance from Lord Abbett returns.
In addition, Wilshire and Lord Abbett may use different pricing sources and methodologies.
Not Classified securities represent those securities which have not been assigned an official GICS Direct classification. GICS Direct, a joint product of Standard & Poor’s and MSCI, provides industry classifications for more
than 40,000 companies and over 45,000 securities. Not Classified securities may include, but are not limited to: Exchange-Traded Funds (ETFs), pink sheet-listed issues, pre-IPO placements, private placements, secondary
issues, open-end funds, closed-end funds, and non-operating establishments.
Under certain circumstances, Lord Abbett may elect to have Wilshire map an ETF holding to the relevant characteristics represented by that ETF’s underlying index in order to reflect the exposure and performance contributed
by the ETF to the overall portfolio. When this option is selected, Wilshire will remove the ETF from the Not Classified category and instead allocate the ETF’s exposures across the relevant attributes based on the composition
of the ETF’s underlying index.
The Wilshire Atlas Variance Analysis tool provides a methodology for explaining the difference in performance between a portfolio and its benchmark, based on the decomposition of returns. The user specifies the portfolio,
index, link frequency, sector and weighting. The weighting can be shown as beginning, average or end weights and is used for display purposes only.
49

Important Information
The information contained herein is provided by Lord, Abbett & Co. LLC (“Lord Abbett”). Distribution of this information to any person other than the person to whom it was originally delivered and to such person’s advisers is
unauthorized, and any reproduction of these materials, in whole or in part, or the divulgence of any of the contents hereof, without the prior consent of Lord Abbett, is prohibited. The information contained herein is current as
of the date of issuance (or such earlier date as referenced herein) and is subject to change without notice. Lord Abbett has no obligation to update any or all of such information. All amounts, market value information, and
estimates included herein have been obtained from outside sources where indicated or represent the good faith judgment of Lord Abbett. Where such information has been obtained from outside sources, Lord Abbett cannot
guarantee the accuracy or completeness of such information. These materials are not intended to be an offer or solicitation with respect to the purchase or sale of any security or other financial instrument or any
investment management services. These materials do not constitute investment advice and should not be used as the basis for any investment decision.
These materials do not take into account individual client circumstances, objectives, or needs. No determination has been made regarding the suitability of any securities, financial instruments, or strategies for particular
clients or prospects.
The information contained herein is provided on the basis and subject to the explanations, caveats, and warnings set out in this notice and elsewhere herein. Any discussion of risk management is intended to describe Lord
Abbett’s efforts to monitor and manage risk but does not imply low risk.
These materials do not purport to provide any legal, tax, or accounting advice.
Any performance targets contained herein are subject to revision, and there can be no assurance that any product or strategy described herein will meet any such performance targets. An investor could lose
some or all of its investment in such product or strategy. Past performance is not a guarantee or reliable indicator of future results. Investments are not guaranteed by Lord Abbett, its affiliates, or any
governmental agency.
The financial indices referenced herein as benchmarks are provided for information purposes only. Portfolio holdings and characteristics will differ from those of the benchmark(s), and such differences may be material.
Factors affecting portfolio performance that do not affect benchmark performance may include portfolio rebalancing, the timing of cash flows, credit quality, diversification, and differences in volatility. In addition, financial
indices do not reflect the impact of fees, applicable taxes, or trading costs, which reduce returns. Unless otherwise noted, financial indices assume reinvestment of dividends. You cannot make a direct investment in an
index.
References to specific securities and issuers are for illustrative purposes only and are not intended and should not be interpreted as recommendations to purchase or sell such securities. The securities referenced may or
may not be held in portfolios managed by Lord Abbett and, if such securities are held, no representation is being made that such securities will continue to be held.
The information provided is not directed at any investor or category of investors and is provided solely as general information about Lord Abbett’s products and services and to otherwise provide general investment
education. None of the information provided should be regarded as a suggestion to engage in or refrain from any investment-related course of action as neither Lord Abbett nor its affiliates are undertaking to provide
impartial investment advice, act as an impartial adviser, or give advice in a fiduciary capacity. If you are an individual retirement investor, contact your financial advisor or other fiduciary about whether any given investment
idea, strategy, product or service may be appropriate for your circumstances.
50


PRESENTED BY:
Annie PaulRelationship Manager
Rick Moulton, CFALead Portfolio Manager
September 2021

Principal fiduciary of each of the Connecticut Retirement Plans and Trust Funds
(“CRPTF”)
Serving six state pension funds that cover 296k state and municipal
employees, teachers, retirees and survivorships as well as nine state trust
funds that support academic programs, grants, and initiatives throughout the
state
Prudent Investment Management & Long-Term Orientation
Primary among the Treasurer’s considerations for the investment of the
pension plans and trusts is the prudent investment of the assets of the CRPTF
for the long-term economic benefit of plan participants and beneficiaries
Proper safeguarding of the CRPTF assets is necessary to ensure the
retirement security of the beneficiaries and to support the spending policies
of the trust funds
STATE OF CONNECTICUT, OFFICE OF THE TREASURER
The Connecticut State Treasurer’s Office’s mission is to perform in the highest professional and ethical manner to safeguard the state’s public resources. Our office policy, investment, and borrowing decisions encourage greater
financial literacy, education, job and economic growth, and equal opportunity for all who call Connecticut home, a place to do business, and invest.
3STATE OF CONNECTICUT, OFFICE OF THE TREASURER
Connecticut Retirement Plans and Trust Funds
1. State Employees’ Retirement Fund
2. Teachers’ Retirement Fund3. Connecticut Municipal
Employees’ Retirement Fund4. Probate Judges and Employees
Retirement Fund5. State Judge’s Retirement Fund6. State’s Attorneys’ Retirement
Fund
TrustsPlans
1. Soldiers’, Sailors’ and Marines’ Fund
2. Arts Endowment Fund3. Agricultural College Fund4. Ida Eaton Cotton Fund5. Andrew C. Clark Fund6. School Fund7. Hopemead State Park Fund8. Police and Firemen Survivors’
Benefit Fund9. Other Post-Employment
Benefits Trust Fund

RIVERBRIDGE
RIVERBRIDGE 4
At Riverbridge, our work each day is to serve the long-term good of our
clients. We seek to help our clients experience superior investment
outcomes—equipping them to pursue their goals
We believe in the power of long-term investment to build a stronger future
for our communities. Our approach is to identify and invest in the leaders
and businesses that are creating true value over time
Responsible investing is core to our fundamental approach because we
believe that enduring performance and responsible impact go hand in
hand
We are focused on developing our employees, both personally and
professionally, and we are committed to being good stewards of our
resources and of our communities
We Seek to Further Human Flourishing by Investing with Endurance
$1.5B+ Firm-wide Assets Under Management for Public
Entities
REPRESENTATIVE CLIENTS

State of Connecticut, Office of the Treasurer and Riverbridge are in strategic alignment.
OUR SHARED ALIGNMENT
OUR SHARED ALIGNMENT
5
COMPELLING RISK-ADJUSTED RETURNS
STRONG DOWNSIDE PROTECTION WITH LOW RISK
CONSISTENT AND PREDICTABLE
LONG-TERM ORIENTATION

ABOUT OUR FIRM

Our mission is to invest with endurance in ways that build true value over time.
At Riverbridge, we believe what is true endures—
in investments, people, and companies. Since
1987, we’ve served clients with an investment
strategy that bridges human insight with data
analysis to identify the building blocks of
endurance. We invest in companies with the
fundamentals and leadership to grow their
intrinsic value over long periods of time. We’re
on a mission to create enduring value for our
clients.
WHO WE ARE
7
AT A GLANCE HEADQUARTERED IN MINNEAPOLIS, MN
30+ YEAR TRACK RECORD
TIME-TESTED INVESTMENT APPROACH
17 YR AVERAGE INVESTMENT TEAM FIRM TENURE
MAJORITY OF FIRM EMPLOYEES ARE SHAREHOLDERS
INVESTMENT CENTRIC CULTURE
ABOUT OUR FIRM

SOUND CULTURE & MANAGEMENT
STRONG UNIT GROWTH
STRATEGIC MARKET POSITION
INTERNALLY FINANCED GROWTH
CONSERVATIVE ACCOUNTING
8
INVESTMENT PHILOSOPHY
We believe earnings power determinesthe value of a franchise.
We focus on companies that are building their earnings power and intrinsic value over long periods of time. We invest in high-quality growth companies that demonstrate the ability to sustain strong secular earnings growth, regardless of overall economic conditions.
OUR INVESTMENT STRATEGY
We look to identify and invest only in companies that meet all aspects of our investment criteria.
We build portfolios by identifying and buying well-managed companies that are diversified in their sources of earnings and have a sustainable competitive differentiation, which will earn them a high return on invested capital and superior growth in business value. We analyze each company’s unit growth, market position, accounting practices, and ability to finance growth. We spend significant face-to-face time meeting with management and employees, and because we are committed to forming a holistic perspective on the effectiveness of management, we also spend time with industry peers, customers, suppliers, and others who may offer an experienced perspective on the company and its management.
HUMAN INSIGHT + DATA ANALYSISOur investment strategy bridges human insight with data analysis to identify enduring businesses that demonstrate the ability to produce a sustainable high return on invested capital. We seek to invest in companies that possess all five building blocks of our philosophy:
ABOUT OUR FIRM

2
3
1DOES THE COMPANY STAND OUT IN THE MARKET?
DOES THE COMPANYDEMONSTRATE THAT ALL 5 BUILDING BLOCKS ARE PRESENT ANDWILL ENDURE?
IS THE COMPANY’S STOCK VALUED AT OR BELOW ITS INTRINSIC VALUE?
HAS THE DEVIL’S ADVOCATE CHALLENGED THE CHAMPION FOR UNFOUNDED POSITIVE BIAS?
DO FUNDAMENTAL BUILDING BLOCKS REMAIN SOUND?
DISCOVERY
DUE DILIGENCE
CONTINUAL REVIEW(held stock)
9
INVESTMENT PROCESS
The Riverbridge Investment Team collectively manages all our strategies and each company in the strategies has a Champion and a Devil’s Advocate. The member of the Investment Team who ultimately adds a particular stock to the strategy is considered the Champion for that holding, while another member of the team is assigned to play the role of Devil's Advocate for that stock after it has been added to the strategy, conducting his or her own research. This process prevents the Champion from developing an unfounded positive bias that could cloud judgment.
Prior to making an investment, the Riverbridge Investment Team meets with the company’s management team, conducts a peer review, reviews the company’s strategic planning policies, analyzes their past performance, and conducts research of the investment candidate’s financials to determine that it meets our investment criteria. Once a company has been added to our strategies we continually evaluate the business for its ability to sustain a high return on invested capital and superior growth in business value.
ABOUT OUR FIRM
SELL DISCIPLINESOur intention is to remain fully invested at all times. We prune our portfolios to remain invested in the highest-quality companies. The Riverbridge Investment Team could decide to sell for one of three reasons:
Portfolio diversification To fund new/better opportunities Deterioration in the fundamentals

Performance related information, including but not limited to market capitalization information, portfolio risk measures, sector weightings, and representative holdings provided in this document, is presented as supplemental information to the compliant presentation found in the Disclosure section.
SUSTAINABLE RETURNS
Riverbridge Small Cap GrowthSince Strategy Inception 06/30/1988
14.41% 18.92
Russell 2000® Growth 9.13% 21.65
+ / – Benchmark 5.28% -2.73
ABOUT OUR FIRM 10
ENDURING TRACK RECORD RIVERBRIDGE ANNUALIZED RETURNS* (GROSS OF FEES)
HISTORICALLY LOWER RISK RIVERBRIDGE ANNUALIZED STANDARD DEVIATIONS*
The Riverbridge Small Cap Growth portfolio demonstrates an enduring track record of robust returns with historically lower risk compared to the benchmark.
AS OF 06/30/2021

RISK REWARD COMPARISON(06/30/1988 - 06/30/2021)
11SMALL CAP GROWTH STRATEGY
SMALL CAP GROWTH
RISK REWARD COMPARISON (06/30/1988 - 6/30/2021)Periods greater than one year are annualized. Gross of fees.
Performance information is presented as supplemental information to the compliant presentation found in the Disclosure section.
Riverbridge Small Cap Growth Russell 2000® Growth
The Riverbridge Small Cap strategy offers historically strong performance with lower risk.

12
SECTOR WEIGHTINGS
2Q 2021 YTD 1 Year 3 Year 5 Year 10 Year Inception
Riverbridge Small Cap Growth 6.79% 7.79% 47.70% 25.37% 25.86% 17.77% 14.41%
Russell 2000® Growth 3.92% 8.98% 51.36% 15.94% 18.76% 13.52% 9.13%Periods greater than one year are annualized; Performance is gross of fees; Inception Date: 06/30/1988.The Riverbridge Small Cap Growth strategy
was established in 1988. It is a diversified growth stock portfolio invested in 45-60 companies of small market capitalization sizes. Due to our long-term investment approach, turnover is low – averaging less than 20% annually. The portfolio is managed by the Riverbridge Investment Team utilizing our time-tested investment philosophy and disciplines.
SMALL CAP GROWTH STRATEGY
SMALL CAP GROWTH STRATEGY
PERFORMANCE HISTORY (AS OF 06/30/2021)
Security Percent of Portfolio
Globant S.A. 3.58%
Workiva, Inc. Class A 3.42%
Pegasystems, Inc. 3.33%
Paylocity Holding Corp. 3.31%
BlackLine, Inc. 3.23%
Security Percent of Portfolio
Five Below, Inc. 3.09%
Ritchie Bros. Auctioneers, Inc. 3.04%
SPS Commerce, Inc. 3.02%
Alarm.com Holdings, Inc. 2.95%
Kornit Digital Ltd. 2.92%
TOP TEN HOLDINGS
PORTFOLIO FACTS (AS OF 06/30/2021)Characteristic Portfolio
Inception Year 1988
Number of Holdings 54
Benchmark Russell 2000® Growth
Wgt. Avg. Market Cap $5.5 billion
Median Market Cap $4.6 billion
Dividend Yield 0.2%
5-Year Turnover 18.7%
0.0%
5.0%
10.0%
15.0%
20.0%
25.0%
30.0%
35.0%
40.0%
Con. Discretionary Con. Staples Financials Health Care Industrials Inf. Tech

APPENDIX

Riverbridge Small Cap Growth Russell 2000® Growth Riverbridge Small Cap Growth Russell 2000® Growth
Riverbridge Small Cap Growth Russell 2000® Growth
14
Gross of fees.
RANGE OF ANNUAL RETURNS
CUMULATIVE PERFORMANCE COMPARISON
SMALL CAP GROWTH STRATEGY
All Ratios Calculated vs. Russell 2000® Growth, Gross of fees.
Small Cap Growth Portfolio vs. Russell 2000® Growth (06/30/1988 - 06/30/2021)
MARKET CAPTURE (06/30/1988 - 06/30/2021)
RISK REWARD COMPARISON (06/30/1988 - 06/30/2021)
Riverbridge Small Cap Growth Russell 2000® Growth

15SMALL CAP GROWTH STRATEGY
SMALL CAP GROWTH
ANNUAL RETURNS (06/30/1988 - 06/30/2021)Periods greater than one year are annualized. Gross of fees.
Small Cap GrowthRussell 2000® Growth
1988 (since inception: 06/30/1988) -7.21% -3.60%
1989 38.41% 20.17%
1990 6.68% -17.41%
1991 67.61% 51.19%
1992 11.10% 7.77%
1993 5.90% 13.37%
1994 11.72% -2.43%
1995 32.78% 31.04%
1996 -2.56% 11.26%
1997 8.04% 12.95%
1998 20.92% 1.23%
1999 17.68% 43.09%
2000 6.52% -22.43%
2001 18.18% -9.23%
2002 -20.53% -30.26%
2003 47.24% 48.54%
2004 5.08% 14.31%
2005 13.55% 4.15%
Small Cap GrowthRussell 2000® Growth
2006 6.31% 13.35%
2007 15.76% 7.05%
2008 -34.03% -38.54%
2009 36.19% 34.47%
2010 29.41% 29.09%
2011 4.14% -2.91%
2012 17.93% 14.59%
2013 43.47% 43.30%
2014 -0.34% 5.60%
2015 -2.56% -1.38%
2016 14.23% 11.32%
2017 24.09% 22.17%
2018 8.14% -9.31%
2019 28.32% 28.48%
2020 55.10% 34.63%
2021 (through 06/30) 7.79% 8.98%

DISCLOSURES

17
PERFORMANCE DISCLOSURES
Returns presented within this document are presented for gross-of-fee performance figures, which do not reflect the deduction of investment advisory fees. A client’s
returns will be reduced by the advisory fees and other expenses incurred in the management of its account. For example, the deduction of a 1% advisory fee over a 10 year
period would reduce a 10% gross return to an 8.9% net return. A description of Riverbridge’s advisory fees are disclosed on Part 2 of its Form ADV, a copy of which is
available upon request.
Past performance does not guarantee future results.
Performance results do not reflect the impact of taxes.
It should not be assumed that account holdings will correspond directly to any such comparative benchmark index.
Comparative indices may be more or less volatile than Riverbridge portfolios.
Riverbridge performance results reflect the reinvestment of dividends and other account earnings, and are net of applicable account transaction charges.
Information in this document is not intended to be used as investment advice.
Mention of companies/stocks herein is for illustrative purposes only and should not be interpreted as investment advice.
The holdings included in this document are for illustrative purposes only and should not be considered a recommendation to purchase or sell any particular security.
There is no guarantee that the same or similar holdings will be purchased or held in accounts in the future.
DISCLOSURES

18
SMALL CAP GROWTH COMPOSITE
Firm Information: Riverbridge Partners, LLC is a Minnesota based investment advisor registered with the Securities and Exchange Commission under the Investment Advisors Act of 1940. The firm provides investment management services to institutional and individual investors. The company offers growth-oriented investment services by investing in growth equity securities, which it believes will provide high returns over the long term. The firm’s standard fee schedule is an annual 1%.
Composite Characteristics: The Small Cap Growth Composite was created in July 1988 and its inception date was 06/30/1988. It is a growth stock portfolio invested in small to medium sized growth companies. Effective 8/1/2019, this strategy generally invests in companies with market capitalizations of less than $7 billion. Prior to that the general guideline was less than $5 billion. The general market cap guideline was redefined in 2019 due to market appreciation. A complete list and description of all firm composites, including broad and limited distribution pooled funds, is available upon request. The composite benchmark is the Russell 2000® Growth Index. The Russell 2000® Growth Index includes the segment of securities within the Russell 2000® Index with higher price-to-book ratios and higher forecasted growth values. The Russell 2000® Index is an unmanaged index measuring the performance of the small-cap U.S. equity universe. The benchmark returns are gross of all fees and taxes. The composite minimum value is $100,000.
Material risks of the strategy include stock market, business and economic development, liquidity, and foreign security risk. Leverage, derivatives, short positions and illiquid investments are not used in the strategy. As with any investment, an investor may lose money, and the strategy can underperform its benchmark. Investment in strategies is not insured by the FDIC or any other government agency.
Calculation Methodology: Individual portfolios are revalued daily starting 1/1/2009. Prior to that, individual portfolios were revalued monthly and intra-month when large cash flows (defined at 10%) occurred. Gross-of-fee returns are calculated net of transaction costs and gross of management fees. Until 12/31/2007, net performance was calculated by applying the maximum annual management fee of 1% to gross performance on a monthly basis. Starting 1/1/2008, net-of-fee returns are calculated net of actual investment management fees. Both gross-of-fee and net-of-fee returns are calculated gross of all withholding taxes on foreign dividends. Accruals are included in calculations. The dispersion measure is the equal-weighted standard deviation of accounts in the composite for the entire year. Dispersion and Ex-Post standard deviation is calculated using gross-of-fees returns. Policies for valuing investments, calculating performance, and preparing GIPS Reports are available upon request.
Other Disclosures: Riverbridge claims compliance with the Global Investment Performance Standards (GIPS®) and has prepared and presented this report in compliance with the GIPS standards. Riverbridge has been independently verified for the period 12/31/1989 – 12/31/2020. A firm that claims compliance with the GIPS standards must establish policies and procedures for complying with all the applicable requirements of the GIPS standards. Verification provides assurance on whether the firm’s policies and procedures related to composite and pooled fund maintenance, as well as the calculation, presentation, and distribution of performance, have been designed in compliance with the GIPS standards and have been implemented on a firm-wide basis. The Small Cap Growth Composite has had a performance examination for the periods 07/01/1988 – 12/31/2020. The verification and performance examination reports are available upon request.
The benchmark returns are not covered by the report of the independent verifiers. Past performance does not guarantee future results. This performance report should not be construed as a recommendation to purchase or sell any particular securities held in composite accounts. Market conditions can vary widely over time and can result in a loss of portfolio value.
GIPS® is a registered trademark of CFA Institute. CFA Institute does not endorse or promote this organization, nor does it warrant the accuracy or quality of the content contained herein.
DISCLOSURES
Year Gross-of-Fee Return (%)
Net-of-Fee Return (%)
Russell 2000® Growth Return (%)
Portfolios Dispersion (%)Composite 3-Year
Ex-Post Std. Dev.
Russell 2000® Growth 3-Year
Ex-Post Std. Dev.
Composite Assets ($ Millions)
TTL Firm Assets($ Millions)
Advisory Only ($Millions)
Ttl Firm Assets & Advisory Only
($Millions)
2020 55.10 53.89 34.63 97 0.84 22.70 25.10 2,402.9 8,478.1 4,896.5 13,374.6
2019 28.32 27.32 28.48 97 0.27 15.31 16.37 1,396.4 5,378.3 2,633.2 8,011.5
2018 8.14 7.32 -9.31 104 0.47 15.47 16.46 1,372.9 4,737.1 1,842.0 6,579.1
2017 24.09 23.18 22.17 107 0.60 12.99 14.59 1,408.0 5,047.9 1,791.1 6,839.0
2016 14.23 13.37 11.32 111 0.75 15.29 16.67 1,566.9 4,686.7 1,546.6 6,233.3
2015 -2.56 -3.22 -1.38 133 0.43 14.19 14.95 1,633.3 5,030.8 1,202.4 6,233.2
2014 -0.34 -1.03 5.60 155 0.50 13.28 13.82 1,938.4 5,523.2 1,215.6 6,738.8
2013 43.47 42.57 43.30 163 0.87 13.76 17.27 2,257.3 5,718.3 1,085.7 6,804.0
2012 17.93 17.26 14.59 143 0.59 16.75 20.72 1,288.4 3,225.7 650.8 3,876.5
2011 4.14 3.37 -2.91 157 1.03 21.10 24.31 1,323.7 2,558.0 576.6 3,134.6

Wellington Management Company LLP
P0000039107S0000017278
Emerging Companies
For institutional use only. Not intended for reproduction or use with the public. Any views expressed herein are those
of the author(s), are based on available information, and are subject to change without notice. Individual portfolio
management teams may hold different views and may make different investment decisions for different
clients. The material and/or its contents are current as of the most recent quarter end, unless otherwise
noted. Certain data provided is that of a third party. While data is believed to be reliable, no assurance is being provided
as to its accuracy or completeness.
State of Connecticut Retirement & Trust Funds

Tmpl 1.6
2 Copyright © 2021 All Rights Reserved
AUT/
S0000020772
P0000046325
Agenda
Section One Wellington Management Company LLP overview
Section Two Emerging Companies
Section Three Appendix

1

Tmpl 1.6
4 Copyright © 2021 All Rights Reserved
S0000021977
P0000026005
PPT/
Wellington Management todayA trusted advisor and strategic partner to clients worldwide
As of 30 June 2021
OWNERSHIP MODEL
Long-term perspective of a private partnership structure
Attract and retaininvestment talent
Independent: No public shareholders, no outside capital
Interests aligned with clients
BUSINESS MODEL
Singular focus oninvestment management
Diversification by asset class, geography, and client type
Research for clientbenefit only
Commitment to bringing the right resources to each client
INVESTMENT MODEL
Comprehensive capabilities
Rigorous proprietary research
Career analysts
Global resources
Empowered portfolio teams
CULTURE
Open, collaborative
Performance driven
Professional/collegial
High standards, ethics,and integrity
Global diversity and inclusion
Contributors to firm
sustainability
CURRENT LEADERSHIP INITIATIVES
Globalization
Sustainable investing and ESG research
Investment science and research-data analytics
Investment risk management
BY THE NUMBERS
Business
USD 1,388 billion of client assetsunder management
3,271 clients
65 countries in which clients are based
People and portfolios
883 investment professionals
17 years of experience, on average
175 partners all active at the firm
Heritage: key dates
1928 Wellington Fund – the firstUS balanced fund
1979 Establishment of ourprivate partnership
1994 Our first long – shortstrategy
2014 Our first dedicated privateequity strategy
2015 Global Impact: Our first diversified impact investing strategy in public equities

Tmpl 1.6
5 Copyright © 2021 All Rights Reserved
S0000021978
P0000021381
MIX/
Investors draw on our marketplace of ideas to build portfolios
¹Environmental, social, and corporate governance
We believe the best investment thinking is forged by the free exchange of ideas among a broadly diverse group of professionals
Macroanalysis
QuantitativeAnalysis
CreditResearch
Global Industry Research
Sustainability/ESG¹/ Climate Research
Equities
Commodities
Currency
TechnicalAnalysis
Derivatives
Multi-Asset
Fixed Income
GLOBAL COLLABORATION
Daily Morning Meetings
Regional strategy meetings
Weekly industry reviews
Research Exchange (Investor Launch Pad)
Company management meetings
Investor road trips
Future Themes research
Lessons Learned sessions

Tmpl 1.6
6 Copyright © 2021 All Rights Reserved
S0000021981
P0000064045
PPT/
Depth, experience, and continuity create interpretation advantage
As of 30 June 2021
Investors draw on rigorous, proprietary research
We conduct research through fundamental; environmental,social, and corporate governance (ESG); quantitative; macro; and technical lenses
Avg years of professional experienceAvg years with Wellington Management
Total numberof investmentprofessionals: 883
Product Research
Credit Analysis 39Derivatives 2
ESG Research 12Global Industry Analysis 53
Macroanalysis 12Research Associates 65
Private Equity Analysis 8
Equities Portfolio Management 57Research Analysis 62
Quantitative Analysis 18Product Management 47
Fixed Income
Portfolio Management 63
Strategy 6
Quantitative Analysis 14
Product Management 48
Multi-Strategy
Portfolio Management 24Research Analysis 29
Product Management 29Solutions Portfolio Analysis 4
Alternatives Commodities 2Currency 1
Private Equity 4Alternatives Research Analysis 8
Additionalresources
Fund Management 35Product Development 4
Product Management – Private Investments 6Operations 80
Sustainable Research Management 1Competitive Intelligence 4
Data Science Analysis 11
Trading 62
Management 73
0 5 10 15 20 25 30 35

2

Tmpl 1.6
8 Copyright © 2021 All Rights Reserved
S0000012761/S0000003194
P0000013750
PPT/
Emerging CompaniesInvestment philosophy
We believe
A quality orientation can lead to better downside mitigation, particularly in micro cap markets, which are laden with companies that are early stage, capital hungry, and speculative
Micro cap companies often carry an illiquidity discount that offers patient buyers attractive valuations and a larger universe of potential investments
Micro cap companies are often neglected by institutional investors, giving specialist managers an information advantage

Tmpl 1.6
9 Copyright © 2021 All Rights Reserved
S0000012761/S0000012750
P0000029352
PPT/
Emerging CompaniesInvestment objective and approach
Objective
Seeks to provide superior long-term returns in excess of the Russell Microcap Index by investing in neglected small and micro capitalization companies
Competitive edge
Deep and experienced team• Four-member team with coverage by area of expertise• Over 80+ years of aggregate experience investing in micro cap companies
Proprietary fundamental research• Long-term familiarity with companies, management teams, and fundamentals• Over 750 company meetings per year
Trading• Expertise in trading stocks with lower liquidity• Dedicated syndicate desk
Emphasis on the long-term investment merits of companies

Tmpl 1.6
10 Copyright © 2021 All Rights Reserved
S0000012761/S0000003170
P0000029731
MIX/
Emerging CompaniesInvestment team
David B. DuBard, CFASenior Managing Director
Equity Portfolio ManagerUniversity of Pennsylvania (Wharton)1992, MBA30 years of professional experience 28 years with Wellington Management
Kevin M. Barry, CFAManaging Director
Equity Research AnalystDartmouth College (Tuck)1994, MBA36 years of professional experience 26 years with Wellington Management
Peter W. Carpi, CFAManaging Director
Equity Research AnalystStanford University2005, MBA19 years of professional experience 18 years with Wellington Management
Donald S. Porter, CFAVice President
Equity Research AnalystBucknell University2002, BA18 years of professional experience 1 year with Wellington Management

Tmpl 1.6
11 Copyright © 2021 All Rights Reserved
S0000012761/S0000003193
P0000013749
PPT/
Emerging Companies Team resources
As of 30 June 2021
David DuBardPortfolio Manager
Kevin BarryIndustrials, business
services, aerospace and defense, energy
Peter CarpiConsumer,technology
David DuBardHealth care, transportation, banks and specialty finance
MacroStrategists12 members
Global Industry Analysts
53 members
Other Equity Teams
Global Equity Traders
20 members
Donald PorterIndustrials, business services, materials

Tmpl 1.6
12 Copyright © 2021 All Rights Reserved
S0000012761/S0000012751
P0000029353
PPT/
Emerging CompaniesInvestment process
The characteristics presented are sought during the portfolio management process. Actual experience may not reflect all of these characteristics, or may be
outside of stated ranges.
Idea generationWhat we seek to buy
Portfolio construction
North America USD 250 mil – 1.5 bilmarket cap
Company meetings
Conference and field trips
Wellington management resources
Quantitative screens
Third-party sources
Niche leaders
Well capitalized
Proven management
Price/value disconnects
Conviction-weighted
Fully invested
Risk controlsWhat we seek to avoid
Companies with unsustainable debt
Perpetual money losers
Pre-revenue businesses
Highly speculative turnaround stories
1,500+ Companies
Typically 75 – 150 stocks
Portfolio

Tmpl 1.6
13 Copyright © 2021 All Rights Reserved
S0000012761/S0000012752
P0000029354
PPT/
US market cap spectrum profileDecile profile
¹May not total 100% due to rounding | Source: Dow Jones Total Market Index | Micro cap and Nano cap ranges are defined based on the investment team’s
view. | As of 30 June 2021
DecileAverage (USD mil)
Number of companies
Max cap (USD mil)
% of total by cap¹
Large 1 92,503 372 2,148,406 81.4
Mid 2 10,929 382 18,934 9.9
Small 3 4,537 378 6,321 4.1
4 2,491 375 3,210 2.2
Micro 5 1,340 380 1,857 1.2
6 710 380 936 0.6
7 382 378 516 0.3
Nano 8 192 377 267 0.2
9 93 380 135 0.1
10 31 379 57 0.0

Tmpl 1.6
14 Copyright © 2021 All Rights Reserved
S0000012761/S0000003198
P0000013754
PPT/
Relative strength of the Russell Micro Cap Index
Source: FactSet | Gray lines represent typical price performance range | For illustrative purposes only.
PAST RESULTS ARE NOT NECESSARILY INDICATIVE OF FUTURE RESULTS AND AN INVESTMENT CAN LOSE VALUE. | Chart data: 31 August 2005 – 30 June 2021
60
70
80
90
100
110
120
8/05 8/06 8/07 8/08 8/09 8/10 8/11 8/12 8/13 8/14 8/15 8/16 8/17 8/18 8/19 8/20
Russell Micro Cap Index price relative to S&P 500
Price performance

Tmpl 1.6
15 Copyright © 2021 All Rights Reserved
S0000012761/S0000012754
P0000029356
PPT/
Emerging Companies The big theme: Quality
As of 31 March 2021 | Views expressed herein are those of the investment team, are based on available information, and are subject to change without notice.
Individual portfolio management teams may hold different views and may make different investment decisions for different clients. For illustrative purposes
only.
Characteristics we seek Example
High profitability Non-destructive excavation services company
Management consulting firm
Business optimization and industry solutions
Proven management Financial technology company
Innovative thermal management technologies developer
Diagnostic medical imaging agents and products
Defendable niche Technical products and services supplier
Aviation landing gear systems and components manufacturer
Global defense technology company
Free cash flow yield Agricultural equipment manufacturer
Transportation finance and logistics company
Technology-enabled transportation and supply chain management services
Digital transformation Hospitality software and solutions company
Electronic payment services company
Digital media and promotions tech company
Social impact Supplies rare metal-based materials used in technology
Provides acute care telemedicine services
Commercial flooring company

Tmpl 1.6
16 Copyright © 2021 All Rights Reserved
S0000012761/S0000012755
P0000029357
PPT/
Emerging CompaniesPortfolio construction and risk oversight
The characteristics presented are sought during the portfolio management process. Actual experience may not reflect all of these characteristics, or may be
outside of stated ranges.
Portfolio construction Risk oversight
Position sizeSize at purchase: typically 0.75 – 2.00%
Maximum exposure at market: typically < 3%
Top ten positions: typically < 20%
Non-US companiesMaximum exposure at market: typically < 20%
Number of holdings75 – 150
Market capCap at purchase: typically USD 250 million –USD 1.5 billion
CashLess than 10%
IPOsAllowed
Portfolio managementUnderstand the risks to the investment thesis in individual stocks
Balance risk and reward expectations when setting position sizes
ESG review
Ensure adequate diversification across sectors and stocks
Understand liquidity expectations for each investment
Product managementIndependent portfolio analysis
Style consistency/factor risks/stress testing
Capacity/business risks
Investments and risk managementResearch and insights on risk and market trends
Risk Advisory Council
Develop new analytics/tools
Line management and senior management review groups Philosophy/process/performance/characteristics
Resource assessment
ComplianceActive pre- and post-trade compliance monitoring

Tmpl 1.6
17 Copyright © 2021 All Rights Reserved
AUT/
S0000012761/S0000002306
P0000011739
Emerging CompaniesRepresentative account top ten holdings
Sums may not total due to rounding. | The specific securities identified are not representative of all of the securities purchased, sold, or recommended for
clients. It should not be assumed that an investment in the securities identified has been or will be profitable. Actual holdings will vary for each client and there is no
guarantee that a particular client’s account will hold any or all of the securities listed. | The data shown is of a representative account, is for informational purposes
only, is subject to change, and is not indicative of future portfolio characteristics or returns. This information complements the GIPS® Composite
Report included at the end of the materials. Please refer to the Important Disclosures page for additional information.
As of 31 July 2021
Company Industry Group % of equities
Lantheus Health care equip & svcs 2.6
Regional Management Divers financials 2.4
Neo Performance Mate Materials 2.4
Surmodics Health care equip & svcs 2.2
Intl Money Exp Software & svcs 2.0
Apria Health care equip & svcs 1.9
Enova International Divers financials 1.9
Faro Technologies Tech hardware & equip 1.9
StoneX Group Divers financials 1.9
ePlus Tech hardware & equip 1.9
Total 20.9
Number of equity names: 123

Tmpl 1.6
18 Copyright © 2021 All Rights Reserved
AUT/
S0000012761/S0000000230
P0000006110
Emerging CompaniesRepresentative account sector weights
Benchmark: Russell Microcap. | The data shown is of a representative account, is for informational purposes only, is subject to change, and is not indicative of
future portfolio characteristics or returns. This information complements the GIPS® Composite Report included at the end of the materials. Please
refer to the Important Disclosures page for additional information.
0
10
20
30
40
Industrials Info
technology
Financials Materials Utilities Comm
svcs
Cons
staples
Energy Real
estate
Health
care
Cons
discretionary
% of equity as of 31 July 2021
Overweight Underweight
Portfolio Benchmark

Tmpl 1.6
19 Copyright © 2021 All Rights Reserved
AUT/
S0000012761/S0000012830
P0000029501
Emerging Companies Representative account characteristics
Benchmark: Russell Microcap | Historical returns based risk characteristics are calculated versus the benchmark(s) used for performance comparison
purposes, which may be different than the benchmark(s) displayed on this page. Please see the investment returns page for additional information. |
Sums may not total due to rounding. | If access products are held by the portfolio they may not be included in the calculation of characteristic data.
Access products are instruments used to gain access to equity markets not otherwise available and may include (but are not limited to) instruments such as
warrants, total return swaps, p-notes, or zero strike options. | The data shown is of a representative account, is for informational purposes only, is subject
to change, and is not indicative of future portfolio characteristics or returns. Portfolio characteristics are based on the underlying holdings of the representative
account and are subject to change. This data may be sourced internally or externally depending on the specific approach, availability of internal data,
underlying holdings characteristics, and other factors. Projected or forward looking characteristics are based on a number of assumptions and the use of alternative
assumptions could yield significantly different results. Additional information on this data is available upon request. | Historical performance based risk
characteristics are based upon composite data rather than representative account. | This information complements the GIPS® Composite Report included at
the end of the materials. Please refer to the Important Disclosures page for additional information.
As of 31 July 2021
Portfolio Benchmark
Size
Asset-weighted market cap (USD, mil) 969.8 740.0
Median market cap (USD, mil) 843.6 270.0
Over USD 1 bil (%) 44 23
USD 500 mil – 1 bil (%) 41 41
USD 250 – 500 mil (%) 13 21
Under USD 250 mil (%) 1 14
Financial metrics
Projected P/E (x) 23.8 89.0
Price/sales (x) 1.5 1.2
Price/book (x) 2.3 2.2
Yield (%) 0.7 1.1
Risk (holdings based)
Asset turnover (1-yr, %) 100
Risk (returns based)
Historical beta (3-yr, USD) 0.85
Historical R² (3-yr, USD) 0.87
Historical tracking risk (3-yr, USD, %) 10.02

Tmpl 1.6
20 Copyright © 2021 All Rights Reserved
AUT/
S0000012761/S0000009370
P0000024065
Emerging CompaniesInvestment returns
Custom benchmark: The custom benchmark consists of Russell 2000 from index inception through 30 September 2015; Russell Microcap from 01 October
2015 to present. | Sums may not total due to rounding. | Performance returns for periods one year
or less are not annualized. | PAST RESULTS ARE NOT NECESSARILY INDICATIVE OF FUTURE RESULTS AND AN INVESTMENT CAN LOSE VALUE. Gross performance results are net of commissions and other direct expenses, but before (gross of) advisory fees, custody charges, withholding
taxes, and other indirect expenses, and include reinvestment of dividends and other earnings. If all expenses were reflected, the performance shown
would be lower. Actual fees will vary depending on, among other things, the applicable fee schedule and account size. Composite returns have the potential to
be adjusted until reviewed and finalized 30 days following each calendar quarter end period. For use in one-on-one presentations only. This information
complements the GIPS® Composite Report included at the end of the materials. Please refer to the Important Disclosures page for additional information.
As of 31 July 2021 (%, USD)
1 yr 3 yrs 5 yrs 10 yrs
Emerging Companies Composite (gross) 50.1 14.1 16.5 13.3
Custom benchmark 64.3 12.4 15.6 12.5
Active return (gross vs benchmark) -14.2 1.8 0.9 0.8
YTD 2020 2019 2018 2017 2016
Emerging Companies Composite (gross) 15.0 23.7 28.2 -14.0 19.2 23.7
Custom benchmark 21.9 21.0 22.4 -13.1 13.2 20.4
Active return (gross vs benchmark) -6.9 2.7 5.8 -0.9 6.0 3.4
2015 2014 2013 2012 2011
Emerging Companies Composite (gross) -3.7 7.2 41.9 13.1 -8.4
Custom benchmark -4.3 4.9 38.8 16.3 -4.2
Active return (gross vs benchmark) 0.5 2.3 3.1 -3.3 -4.3

3

Copyright © 2019 All Rights Reserved
Our diversity and inclusion strategyTitle Line 2
2001012510/501973_3/G3197/G3197
Strengthen our ability to adapt and innovate
Engage differences to achieve higher performance
•Studentpipelines•DiversityInternships•TargetedSearchFirms•Diversitydashboards
Sustain an environment based on shared values and excellence
Involve new perspectives to eliminate groupthink
•Seniorleadershipdriven•InclusiveLeaderandManagerPrograms
•D&Ieducationforall employees
Leverage external expertise to generate solutions
Understand global markets and businesses
•DiversityPartnerships•EmergingBrokerage Forums•SupplierDiversity Program•EducationandPhilanthropy
COMMUNITY
GlobalDiversity Committee
Upstanders
Director,GlobalDiversityandInclusion
13DiversityBusinessNetworkswithregionalchaptersandoneEMEABusinessNetworkCouncil
12ExternalDiversity Associations
Partneredwithmorethan100US-baseddiversesuppliers
Grantswith193organizationsin11geographiessince1992
Updated in June 2019
A
TALENT
CULTURE
A1 22

Copyright © 2020 All Rights Reserved2002161082/530041_10/G3460/G3460
A
Sustainable investing at Wellington ManagementTitle Line 2Long history of research, client solutions, and industry partnerships
Wellington Management and Domini Impact Investments are independent and unaffiliated entities, each of which offers independent investment approaches and products. Currently, Wellington Management serves as sub-adviser to the Domini Impact International Equity Fund and the Domini Impact Bond Fund.
1995 2006 2007 20112010 2012Since 1970s
Wellington Management Future Themes
Firmwide research initiatives to identify complex set of challenges for the world, focusing on structural themes over the next 5+ years
Theme examples• Breakthroughs in biotechnology• The search for clean energy• Strains on water and food supply• Labor-augmenting technologies• Personalized medicine
2018 202020172016 20192015
Launch a Shari’ah – compliant global equity strategy, collaborating with Harvard University scholars and the Islamic Development Bank
Sub-advise equityfund for Domini
Launch Climate Strategy
Establish ESG Research Team
Sign UK Stewardship Code
Sign UN Principles for Responsible Investment (PRI)
Launch Global Impact
Launch Emerging Market Development
Sub-advise bond fund for Domini
Incubate Broader Perspectives
Wendy Cromwell elected to join the PRI Board
The California Public Employees’ Retirement System (CalPERS) joins climate science initiative
Establish climate science initiative with Woodwell Climate Research Center
Ontario Teachers’ Pension Plan (OTPP) joins climate science initiative
Marjorie Winfrey joins EU Taxonomy Practitioners Group
Commit to Net Zero by 2050
Launch low-carbon emerging markets systematic approach
Launch Global Impact Bond
Harvard Business School professors begin case study on Global Impact
Sign Hong Kong Principles of Responsible Ownership
Approved as a member of the Global Impact Investing Network (GIIN)
Launch Global Stewards
Incubate US Sustainable Companies
Chris Goolgasian joins CFTC Climate Risk Subcommittee
2014
Sign Japan Stewardship Code
Sign Statement of Support for Task Force on Climate-related Financial Disclosures (TCFD)
Incubate US Stewards
Incubate GRE Low Carbon
Launch Responsible Values Multi-Sector Credit
Launch Climate Adaptation
Incubate Advance-ment of Women
Incubate Euro-pean Stewards
A1 23

Tmpl 1.624 Copyright © 2021 All Rights Reserved
S0000020882/S0000022030P0000046697
What is ESG and why is it important?Our philosophy
These examples are not intended to be representative of all ESG factors considered.
PPT/
We believeMaterial ESG issues are strategic business issues that can impact performance, so understanding them enables more informed investment decisions
Through informed and active ownership, we can support actions that benefitour clients
Environmental Social Governance
Water efficiency
Production costs
Labor conflicts Net margins CEO
compensation Share price
Carbon emissions
Water usage
Waste management
Climate change adaptation
Labor union relations
Health and safety
Supply chain risks
Cybersecurity
Ownership structure and control
Board composition
CEO compensation
Shareholder rights

Tmpl 1.625 Copyright © 2021 All Rights Reserved
Research and strategy ESG sector research Climate research
Wendy Cromwell, CFADirector, Sustainable InvestmentSenior Managing DirectorVice Chair
Carolina San Martin, CFADirector, ESG Research Managing Director
Energy
Jennifer Rynne, CFAESG AnalystManaging Director
Utilities, Property, Transport
Hillary FlynnDirector, ESG,Private InvestmentsManaging Director
Chris Goolgasian, CFA, CPA, CAIADirector, Climate ResearchSenior Managing Director
Andria WeilSI Policy ManagerManaging Director
Jeff BarbieriESG AnalystVice President
Financials,Information technology
Michael Shavel, CFAESG AnalystVice President
Materials, Industrials
Celi Khanyile-LynchSustainability Analyst,Private Investments
Julie Delongchamp, CFAClimate Transition RiskAnalystAssistant Vice President
Marjorie WinfreySI Research AnalystVice President
Lindsay Blitstein, CFAESG AnalystAssistant Vice President
Healthcare
Blake BroadnaxResearch Associate
Megan GalliganBusiness Associate
Volkan OzdurmusClimate TransitionRisk AnalystVice President
Beth PiskorowskiCOO, SustainableInvestmentManaging Director
Sean Caplice, CFAESG AnalystVice President
Consumer
Gioia DomenidoQuant AnalystManaging Director
Lauren WhiteBusiness Associate
Jenny XieResearch Associate
Samantha LaxBusiness Manager,Sustainable Investment
Martin SankaleResearch Associate
Andrew MontaltiBusiness Analyst,Sustainable Investment
Jeromy WendrickSenior Software Engineer
Meredith JolyChair, SI Global NetworkManaging Director
Woodwell Climate Research Centerprimary research team of scientistsand fellows
Broader sustainable investment research community
Equity (52) and credit (32) analysts across sectors and geographies
Investment teams for the 10+ strategies on the sustainable investment platform
Resources to be hired
ESG Sovereign Debt Analyst
ESG Analysts (Industry-focused) Boston/London/Asia
ESG Property/Structured Finance Analyst
IMM Practice Leader
S0000020882/S0000020895P0000046699
Sustainable Investment Research TeamLeading our investors, companies, and clients on sustainability research
MIX/

Tmpl 1.6
26 Copyright © 2021 All Rights Reserved
AUT/
S0000012761/S0000003641
P0000014871
Emerging Companies Investment risks
PRINCIPAL RISKSCommon Stock Risk – Common stock are subject to many factors, including economic conditions, government regulations, market sentiment, local and international political events, and environmental and technological issues as well as the profitability and viability of the individual company. Equity security prices may decline as a result of adverse changes in these factors, and there is no assurance that a portfolio manager will be able to predict these changes. Some equity markets are more volatile than others and may present higher risks of loss. Common stock represents an equity or ownership interest in an issuer.
Smaller Capitalization Stock Risk – The share prices of small and mid-cap companies may exhibit greater volatility than the share prices of larger capitalization companies. In addition, shares of small and mid-cap companies are often less liquid than larger capitalization companies.
ADDITIONAL RISKSCommingled Fund Risk – Investments in funds or other pooled vehicles generally will indirectly incur a portion of that fund’s operating expenses and/or fees and will inherit a proportion of the fund's investment risks. Funds may have different liquidity profiles based on their dealing terms, and the types of instruments in the fund. In the event a fund holds illiquid instruments, it is possible that a full redemption from the fund could result in taking custody of illiquid instruments that could not be sold in the market.
Liquidity Risk – Investments with low liquidity may experience market value volatility because they are thinly traded (such as small cap and private equity or private placement bonds). Since there is no guarantee that these securities could be sold at fair value, sales may occur at a discount. In the event of a full liquidation, these securities may need to be held after liquidation date.

Tmpl 1.6
27 Copyright © 2021 All Rights Reserved
S0000012761/S0000000329
P0000022759
Important disclosures
AUT/
Additional performance informationPAST RESULTS ARE NOT NECESSARILY INDICATIVE OF FUTURE RESULTS. There can be no assurance nor should it be assumed that future investment performance of any strategy will conform to
any performance examples set forth in this material or that the portfolio’s underlying investments will be able to avoid losses. The investment results and any portfolio compositions set forth in this
material are provided for illustrative purposes only and may not be indicative of the future investment results or future portfolio composition. The composition, size of, and risks associated with an
investment in the strategy may differ substantially from the examples set forth in this material. An investment can lose value.
Impact of feesIllustration of impact of fees: If USD100,000 was invested and experienced a 10% annual return compounded monthly for ten years, its ending value, without giving effect to the deduction of advisory
fees, would be USD270,704 with an annualized compounded return of 10.47%. If an advisory fee of 0.95% of average net assets per year were deducted monthly for the ten-year period, the annualized
compounded return would be 9.43% and the ending USD value would be USD246,355. Information regarding the firm's advisory fees is available upon request.
Selection of representative accountThe current representative account became effective on 1 January 1985 because it was the least restrictive account at the time of selection. For data shown prior to the current representative account
effective date, data of the representative account(s) deemed appropriate for the time period was used. Further information regarding former representative accounts can be provided upon request. Each
client account is individually managed; individual holdings will vary for each account and there is no guarantee that a particular account will have the same characteristics as described. Actual results may
vary for each client due to specific client guidelines, holdings, and other factors. In limited circumstances, the designated representative account may have changed over time, for reasons including, but
not limited to, account termination, imposition of significant investment restrictions, or material asset size fluctuations.
Access productsIf access products are held by the portfolio they may not be included in the calculation of characteristic data. Access products are instruments used to gain access to equity markets not otherwise
available and may include (but are not limited to) instruments such as warrants, total return swaps, p-notes, or zero strike options.
Global Industry Classification Standard (GICS) changes S&P Dow Jones Indices and MSCI have broadened and renamed the Telecommunication Services Sector as Communication Services to include companies that facilitate communication and offer related
content and information through various media. These changes to Global Industry Classification Standard (GICS) are effective as of 1 October 2018 in the data shown. The new sector name applies
retroactively and therefore Communication Services will replace Telecommunications Services for all periods. Wellington Management data reflects changes in line with the official GICS update; however,
MSCI and S&P have elected to update their official index structures with different timing. Therefore, index data shown may differ from data obtained directly from the index vendors.
Additional disclosures
Securities indices are unmanaged and are not subject to fees and expenses typically associated with managed accounts or investment funds. Investments cannot be made directly into an index.
Benchmark definition
Russell Microcap:The Index measures the performance of the microcap segment of the U.S. equity market.

Wellington Management Composite: Emerging Companies Schedule of Performance Returns from 01 January 2011 to 31 December 2020
Page 1 of 2 GCR_EMGSMALLTOT ©2021 Wellington Management Company LLP. All rights reserved. Generated on: 19 February 2021
Period Gross
Return (%) Net
Return (%) Benchmark Return (%)
Number of Portfolios
Internal Dispersion (%)
Composite Mkt.Value (USD Mil)
Total Firm Assets (USD Mil)
2011 -8.45 -9.32 -4.18 7 0.6 1,123 651,496
2012 13.06 12.00 16.35 < 6 N/M 976 757,903
2013 41.94 40.63 38.82 < 6 N/M 1,381 834,441
2014 7.17 6.16 4.90 < 6 N/M 1,434 914,109
2015 -3.75 -4.66 -4.28 < 6 N/M 1,375 926,949
2016 23.73 22.58 20.37 < 6 N/M 1,575 979,210
2017 19.18 18.07 13.17 < 6 N/M 1,691 1,080,307
2018 -14.01 -14.84 -13.08 < 6 N/M 972 1,003,389
2019 28.25 27.06 22.43 < 6 N/M 1,069 1,154,735
2020 23.69 22.54 20.96 < 6 N/M 1,045 1,291,419
Benchmark: Emerging Companies Custom Performance Splice
N/M: For years where there are less than six portfolios throughout the performance period, Internal Dispersion is not meaningful.
Composite Description: Portfolios included in the Emerging Companies Composite seek to outperform the Russell Microcap Index by investing primarily in stocks of neglected small and micro capitalization companies with a focus on high quality orientation. Companies in which we invest
typically have one or more of the following attributes: unique niche leadership, a strong balance sheet, proven management team, and/or price/value disconnects.
Composite Inception Date: The composite inception date is 31 December 1984.
Composite Creation Date: The composite creation date is May 1996.
Composite Membership: All fully discretionary, fee paying portfolios are eligible for inclusion in the composite.
Fee Schedule: The institutional separate account fee schedule for this product is:
Market Value Annual Fee On the first US$50 million 0.95% Over US$50 million 0.85
Benchmark Description: The Emerging Companies Custom Performance Splice consists of the Russell 2000 from inception through 30 September 2015 and the Russell Microcap from 01 October 2015 to present.
Benchmark Definition: Russell Microcap measures the performance of the microcap segment of the U.S. equity market.
Firm: For purposes of GIPS® compliance, the Firm is defined as all portfolios managed by Wellington Management Company LLP, an independently owned, SEC-registered investment adviser, as well as its affiliates (collectively, Wellington Management). Wellington Management provides
investment advisory services to institutions around the world.
GIPS®: Wellington Management claims compliance with the Global Investment Performance Standards (GIPS®) and has prepared and presented this report in compliance with the GIPS® standards. Wellington Management has been independently verified for the periods 1 January 1993 to 31
December 2019. The verification reports are available upon request.
A firm that claims compliance with the GIPS standards must establish policies and procedures for complying with all the applicable requirements of the GIPS standards. Verification provides assurance on whether the firm’s policies and procedures related to composite and pooled fund
maintenance, as well as the calculation, presentation, and distribution of performance, have been designed in compliance with the GIPS standards and have been implemented on a firm‐wide basis. Verification does not provide assurance on the accuracy of any specific performance report.
GIPS® is a registered trademark of CFA Institute. CFA Institute does not endorse or promote this organization, nor does it warrant the accuracy or quality of the content contained herein.
Performance Calculation: Gross performance results are net of trading expenses. Returns are gross of withholding taxes on dividends, interest and capital gains and include reinvestment of any earnings. Returns, market values, and assets are reported in USD except when otherwise noted.
Returns, market values and assets reported in currencies other than USD are calculated by converting the USD monthly return and assets using the appropriate exchange rate (official 4:00 p.m. London closing spot rates). Policies for valuing portfolios, calculating performance, and preparing
GIPS composite reports are available upon request.
Net of fees performance reflects the deduction of the highest tier investment management fee ("model fee") that would be charged based on the fee schedule appropriate to you for this mandate, without the benefit of breakpoints and is calculated by subtracting 1/12th of the model fee from
monthly gross composite returns. In certain instances Wellington Management may charge certain clients a fee in excess of the standard model fee, such as to legacy clients or clients receiving additional investment services. Performance net of model fees is intended to provide the most
appropriate example of the impact management fees would have for you.
Pool investors will experience costs in excess of investment management fees, such as operating expenses and custodial fees. These indirect costs are not reflected in the model fee, or net of fees performance.
Internal Dispersion: The dispersion measure presented is the asset-weighted standard deviation. The asset-weighted standard deviation measures the dispersion of individual portfolio gross returns relative to the asset-weighted composite return. Only portfolios that have been included in the
composite for the full period are included in the standard deviation calculation. Limitations imposed by client guidelines or by law on a portfolio's ability to invest in certain securities or instruments, such as IPO securities, and/or implementation of the firm's Trade Allocation Policies and Procedures,
may cause the portfolio's performance to differ from that of the composite.

Wellington Management Composite: Emerging Companies Schedule of Performance Returns from 01 January 2011 to 31 December 2020
Page 2 of 2 GCR_EMGSMALLTOT ©2021 Wellington Management Company LLP. All rights reserved. Generated on: 19 February 2021
External Dispersion: The dispersion measure presented is the three-year annualized ex-post standard deviation. It measures the variability of the composite gross returns and the benchmark(s) over the preceding 36-month period. For periods prior to 1 January 2011, the Firm was not required
to present the three-year annualized ex-post standard deviation.
3-Year Standard Deviation (%)
Year 2011 2012 2013 2014 2015 2016 2017 2018 2019 2020
Composite 24.37 19.80 16.64 14.10 15.33 16.64 14.76 16.05 16.40 25.26
Benchmark 24.99 20.20 16.45 13.12 13.99 16.42 15.11 17.02 16.42 26.66
Composite Listing: Wellington Management's list of composite descriptions is available upon request.
Pooled Fund Listing: Wellington Management’s list of pooled fund descriptions is available upon request.
Other Matters: This material contains summary information regarding the investment approach described herein and is not a complete description of the investment objectives, policies, guidelines, or portfolio management and research that supports this investment approach. Any decision to
engage Wellington Management should be based upon a review of the terms of the investment management agreement and the specific investment objectives, policies, and guidelines that apply under the terms of such agreement.
Past Performance: Past results are not necessarily indicative of future results and an investment can lose value.

Tmpl 1.6
30 Copyright © 2021 All Rights Reserved
S0000006515
P0000001665
Important Notice
Wellington Management Company LLP (WMC) is an independently owned investment adviser registered with the US Securities and Exchange Commission (SEC). WMC is also registered with the US Commodity Futures Trading Commission (CFTC) as a commodity trading advisor (CTA) and serves as a CTA to certain clients including commodity pools operated by registered commodity pool operators. WMC provides commodity trading advice to all other clients in reliance on exemptions from CTA registration. WMC, along with its affiliates (collectively, Wellington Management), provides
investment management and investment advisory services to institutions around the world. Located in Boston, Massachusetts, Wellington Management also has offices in Chicago, Illinois; Radnor, Pennsylvania; San Francisco, California; Frankfurt; Hong Kong; London; Luxembourg; Milan; Shanghai; Singapore; Sydney; Tokyo; Toronto; and Zurich. This material is prepared for, and authorized for internal use by, designated institutional and professional investors and their consultants or for such other use as may be authorized by Wellington Management. This material and/or its contents are
current at the time of writing and may not be reproduced or distributed in whole or in part, for any purpose, without the express written consent of Wellington Management. This material is not intended to constitute investment advice or an offer to sell, or the solicitation of an offer to purchase shares or other securities. Investors should always obtain and read an up-to-date investment services description or prospectus before deciding whether to appoint an investment manager or to invest in a fund. Any views expressed herein are those of the author(s), are based on available information, and are subject
to change without notice. Individual portfolio management teams may hold different views and may make different investment decisions for different clients.
In Canada, this material is provided by Wellington Management Canada ULC, British Columbia unlimited liability company registered in the provinces of Alberta, British Columbia, Manitoba, New Brunswick,
Newfoundland and Labrador, Nova Scotia, Ontario, Prince Edward Island, Quebec, and Saskatchewan in the categories of Portfolio Manager and Exempt Market Dealer. In Europe (excluding the United Kingdom and Switzerland), this material is provided by Wellington Management Europe GmbH (WME) which is authorized and regulated by the German Federal Financial Supervisory Authority (Bundesanstalt für Finanzdienstleistungsaufsicht - BaFin). This material may only be used in countries where WME is duly authorized to operate and is only directed at eligible counterparties or
professional clients as defined under the German Securities Trading Act. This material does not constitute investment advice, a solicitation to invest in financial instruments or information recommending or suggesting an investment strategy within the meaning of Section 85 of the German Securities Trading Act (Wertpapierhandelsgesetz). In the United Kingdom, this material is provided by Wellington Management International Limited (WMIL), a firm authorized and regulated by the Financial Conduct Authority (FCA) in the UK (Reference number: 208573). This material is directed only at eligible
counterparties or professional clients as defined under the rules of the FCA. In Switzerland, this material is provided by Wellington Management Switzerland GmbH, a firm registered at the commercial register of the canton of Zurich with number CH-020.4.050.857-7. This material is directed only at Qualified Investors as defined in the Swiss Collective Investment Schemes Act and its implementing ordinance. In Hong Kong, this material is provided to you by Wellington Management Hong Kong Limited (WM Hong Kong), a corporation licensed by the Securities and Futures Commission to conduct
Type 1 (dealing in securities), Type 2 (dealing in futures contracts), Type 4 (advising on securities), and Type 9 (asset management) regulated activities, on the basis that you are a Professional Investor as defined in the Securities and Futures Ordinance. By accepting this material you acknowledge and agree that this material is provided for your use only and that you will not distribute or otherwise make this material available to any person. Wellington Investment Management (Shanghai) Limited is a wholly-owned entity and subsidiary of WM Hong Kong. In Singapore, this material is provided for your use
only by Wellington Management Singapore Pte Ltd (WM Singapore) (Registration Number 201415544E). WM Singapore is regulated by the Monetary Authority of Singapore under a Capital Markets Services Licence to conduct fund management activities and is an exempt financial adviser. By accepting this material you represent that you are a non-retail investor and that you will not copy, distribute or otherwise make this material available to any person. In Australia, Wellington Management Australia Pty Ltd (WM Australia) (ABN19 167 091 090) has authorized the issue of this material for use
solely by wholesale clients (as defined in the Corporations Act 2001). By accepting this material, you acknowledge and agree that this material is provided for your use only and that you will not distribute or otherwise make this material available to any person. Wellington Management Company LLP is exempt from the requirement to hold an Australian financial services licence (AFSL) under the Corporations Act 2001 in respect of financial services provided to wholesale clients in Australia, subject to certain conditions. Financial services provided by Wellington Management Company LLP are
regulated by the SEC under the laws and regulatory requirements of the United States, which are different from the laws applying in Australia. In Japan, Wellington Management Japan Pte Ltd (WM Japan) (Registration Number 199504987R) has been registered as a Financial Instruments Firm with registered number: Director General of Kanto Local Finance Bureau (Kin-Sho) Number 428. WM Japan is a member of the Japan Investment Advisers Association (JIAA), the Investment Trusts Association, Japan (ITA) and the Type II Financial Instruments Firms Association (T2FIFA). WMIL, WM
Hong Kong, WM Japan, and WM Singapore are also registered as investment advisers with the SEC; however, they will comply with the substantive provisions of the US Investment Advisers Act only with respect to their US clients.
©2021 Wellington Management. All rights reserved. | As of January 2021
PPT/

Shawn T. Wooden
Treasurer
S ta te o f C o nne c t i cut O ff i c e of t he T r e a sur e r
Darrell V. Hill
Deputy Treasurer
65 Capitol Ave, Hartford, CT 06106-1773, Telephone: (860) 702-3000
An Equal Opportunity Employer
September 3, 2021
Members of the Investment Advisory Council
Re: HarbourVest CRPTF Co-Investment Partnership
Dear Fellow IAC Member:
At the September 8, 2021 meeting of the Investment Advisory Council, I will present for your
consideration investment opportunities for both the Private Investment Fund (“PIF”) and the Private Credit Fund (“PCF”) of the Connecticut Retirement Plans and Trust Funds: HarbourVest CRPTF Co-Investment Partnership (the “Partnership”). The Partnership will allow the CRPTF to co-invest in private equity and private credit transactions and will be managed by HarbourVest Partners
(“HarbourVest”), a leading private markets investment management firm with more than $80 billion of assets under management.
The Partnership will be comprised of HarbourVest CT Co-Investment Fund LP (“CT Co-Investment
Fund”) and HarbourVest CT Private Debt Fund LP (“CT Private Debt Fund”). I am considering annual commitments of $150 million to each of the CT Co-Investment Fund and the CT Private Debt Fund over an initial three-year commitment period. The CT Co-Investment Fund will allow the CRPTF to participate in co-investment opportunities generated from private equity managers in the PIF portfolio
as well as those accessed through HarbourVest’s deep network of leading general partners. Through the CT Private Debt Fund, the CRPTF will be able to capitalize on co-investment opportunities generated from its PCF managers as well as co-investments alongside HarbourVest’s private credit platform. HarbourVest has established a leading position in the co-investment market, with a deep and
experienced team that has led more than $13 billion of co-investments since 2004 while developing expertise in managing customized co-investment programs for several large public plans.
Attached for your review is the recommendation from Ted Wright, Chief Investment Officer, and the
due diligence report prepared by Hamilton Lane. I look forward to our discussion of these materials at next week’s meeting.
Sincerely,
Shawn T. Wooden
State Treasurer
AGENDA ITEM #5

OFFICE OF THE STATE TREASURER
MEMORANDUM DECISION
TO: Shawn T. Wooden, Treasurer
FROM: Ted Wright, Chief Investment Officer
CC: Darrell V. Hill, Deputy Treasurer
Raynald D. Leveque, Deputy Chief Investment Officer
Kevin Cullinan, Chief Risk Officer
Mark E. Evans, Principal Investment Officer
DATE: September 1, 2021
SUBJECT: HarbourVest CRPTF Co-Investment Partnership – Final Due
Diligence
Summary
The purpose of this memorandum is to recommend that the Connecticut Retirement Plans and Trust Funds (“CRPTF”) consider commitments to (1) HarbourVest CT Co-Investment Fund LP (“CT Co-Investment Fund”) that will focus on private equity co-investments and (2) HarbourVest
CT Private Debt Fund LP (“CT Private Debt Fund”) that will focus on private credit co-investments. The recommended HarbourVest CRPTF Co-Investment Partnership is structured to include annual commitments $150 million per year for three years to each of the CT Co-Investment Fund and the CT Private Debt Fund.
The funds will be structured as customized, separately managed accounts (“SMA”) that will be managed by affiliates of HarbourVest Partners L.P. (“HarbourVest” or the “Firm”) and provide the CRPTF the opportunity to harvest private equity and private credit co-investment opportunities
generated from managers in the CRPTF’s portfolios as well as those managers accessed through the HarbourVest platform. Headquartered in Boston, MA, HarbourVest is a leading private markets investment management
firm that has more than $80 billion of assets under management. Strategic Allocations within the Private Investment Fund and Private Credit Fund
Private Investment Fund The CT Co-Investment Fund would fall under the Corporate Finance allocation of the Private Investment Fund (“PIF”). The Investment Policy Statement (“IPS”) establishes target allocation
ranges of 70% to 100% to Corporate Finance investments within the PIF portfolio as measured by a percentage of total exposure, defined as market value plus unfunded commitments. The PIF’s total exposure to Corporate Finance strategies was approximately 84% as of June 30, 2021.
The CT Co-Investment Fund will focus specifically on co-investment opportunities in growth equity and buyout strategies, which currently represent an estimated 2% and 56% of the PIF’s total exposure, respectively. The PIF’s strategic pacing plan establishes long-term targeted exposures of 10% to 20% to growth equity and 55% to 75% to buyouts.

Page 2 of 21
Private Credit Fund The CT Private Debt Fund will focus on senior and mezzanine credit strategies identified in the IPS. As of June 30, 2021, the PCF’s estimated total exposure to senior and mezzanine credit strategies was 39% and 6%, respectively, while the PCF’s strategic pacing plan currently targets long-term exposures of 40% to 50% in senior debt and 10% to 20% to junior debt.
The recommended CT Co-Investment Fund and CT Private Debt Fund commitments will allow the CRPTF to develop customized co-investment programs with HarbourVest to achieve the following objectives.
• Enhanced returns through investment selection and more favorable fee and carry structures.
• Supporting the goals of the PIF and PCF strategic plans to have co-investments represent 10% to 20% of each portfolio’s exposure over the long-term.
• Increased ability to control capital pacing as well as manager and sector diversification.
• Strengthened relationships with the CPRTF’s private equity and credit managers while gaining insights into existing and prospective managers.
• Additional staff development through information sharing and knowledge transfer opportunities.
Pension Funds Management (“PFM”) investment professionals believe the CRPTF’s private
equity and credit portfolios will benefit from partnering with HarbourVest, a leading private capital co-investment manager. HarbourVest has invested more than $13.5 billion of direct co-investment capital since 2004 and has extensive experience partnering with larger institutional investors to develop customized co-investment programs.
The CRPTF has existing commitments to HarbourVest’s most recent flagship private equity secondary investment fund, Dover Street X, as well as a companion vehicle that invests alongside Dover X in certain secondary transactions. PFM investment professionals note that while both
funds are performing very well to date, the vehicles’ early net internal rates of return (“IRR”) are expected to moderate as the funds continue to draw capital.
Firm and Management Team
HarbourVest is a global private equity investment management firm that spun out of John Hancock Insurance in 1997. The Firm’s founders began investing together at Hancock Venture Partners in the late 1970s and expanded the Firm’s investment strategies to include buyout funds, secondary and direct investments over time. HarbourVest, headquartered in Boston, MA, now has offices in
Beijing, Bogota, Dublin, Frankfurt, Hong Kong, London, Seoul, Singapore, Tel Aviv, Tokyo, and Toronto. The Firm is managed by an Executive Management Committee consisting of John Toomey and
Peter Wilson, Managing Directors who joined the Firm in 1997 and 1996, respectively. The Firm has more than 700 employees globally, including more than 150 investment professionals that
(US$ in millions, as of March 31, 2021)
Vintage Connecticut Unfunded Net
Fund Year Status Commitment Commitment NAV IRR TVM DPI
Dover Street X L.P. 2019 Investing $100 $78 $29 76% 1.4x 0.2x
Secondary Overflow Fund IV L.P. 2019 Investing $100 $91 $13 102% 1.6x 0.2x
Total HarbourVest $200 $168 $42 85% 1.5x 0.2x
Source: Connecticut returns from Burgiss Private i .

Page 3 of 21
have committed over $100 billion of primary, secondary and co-investment capital since inception. HarbourVest is an employee-owned firm with the equity ownership broadly dispersed among a group of current and former Managing Directors while another group of Managing Directors and Principals participate in a profit-sharing plan.
HarbourVest supports its global approach through investment teams in all locations participating in sourcing and evaluating investment opportunities across venture capital, buyout, credit, and infrastructure. While the Firm’s investment professionals may focus on primary, secondary, or direct investments, all professionals are incentivized to support the sourcing and diligence efforts
across the platform based on HarbourVest’s shared economics structure. Beginning in 2019, HarbourVest moved from having one global investment committee responsible for all investments to strategy specific investment committees. All investments approved by the
strategy specific investment committees go to the Firm’s Portfolio Construction Committee that is responsible for allocating the approved opportunity fairly and equitably in accordance with the Firm’s Allocation Policy, which contemplates contractual obligations and fiduciary duties. There is an exception to the general Allocation Policy for customized SMAs such as the recommended
CT Co-Investment Fund and CT Private Debt Fund. Specifically, Connecticut would receive the full allocation of any co-investment opportunity that a general partner identifies for Connecticut, subject to portfolio construction and concentration management practices.
HarbourVest’s primary, secondary, direct co-investment and private credit investment professionals are supported by shared resources including research and risk management, investor relations, operations, and fund administration. For example, HarbourVest Quantitative Research and Investment Risk team utilizes a set of proprietary quantitative models and tools to support the
optimal portfolio diversification objectives intended to maximize each portfolio’s risk adjusted returns. The Quantitative Research and Investment Risk team regularly monitors a variety of portfolio risk metrics, which are reviewed frequently with the primary, secondary, and direct co-investment teams to help support portfolio construction decisions.
More detailed information on the direct co-investment and private credit investment teams and committees is provided in the CT Co-investment Fund and CT Private Debt Fund sections of this memorandum.

Page 4 of 21
Co-Investment Overview
Co-investments are direct investments in a portfolio company or asset alongside the general partner or investment manager of a commingled fund leading the portfolio company investment as
depicted below.
While co-investments can provide benefits to both general and limited partners, the coordination and execution of co-investment opportunities can be time and resource intensive for all parties.
Co-investment can be broadly categorized into two types: syndicated and co -underwritten/co-sponsored. With a syndicated transaction, a fund general partner will close an investment first and then proceed to sell down, or syndicate, a portion of the investment to fund limited partners or other co-investors. In a co-underwritten or co-sponsored transaction, the lead general partner will
seek out co-investment partners early in the process often with the requirement that the co -investment partner(s) be willing to make an equity commitment to the proposed transaction simultaneous with the general partner. Syndicated co-investments may allow the general partner to optimize a fund’s investment hold size but generally present limited risk to the general partner
or fund if all, or some portion, of the targeted co-investment is not syndicated. However, the general partner’s potential risk with a co-underwriter/co-sponsor partner are heightened. Specifically, the general partner’s ability to execute an acquisition agreement may be dependent on the co-investment partner’s decision to sign an equity commitment letter and execute the
transaction alongside the lead sponsor.
General partners often utilize co-investment capital to manage portfolio construction and concentration risks while also providing the fund with increased flexibility to pursue larger transactions when needed. For most transactions, a fund manager would prefer to raise co-
investment capital from the fund’s limited partners or a third-party manager of co-investment capital rather than partnering with another lead equity or credit sponsor that may be a direct competitor. In addition to benefitting the general partner’s investment practice, access to co-investment opportunities can allow the fund manager the opportunity to build stronger
relationships with existing and prospective limited partners.
Private equity and private credit managers have generally offered co-investment opportunities to a fund’s limited partners on a no fee, no carry basis. A limited partner may benefit from a well-run co-investment program through enhanced return potential, more active management of capital
deployment and portfolio exposures, staff development opportunities, and the formation of stronger general partner relationships and insights into a manager’s capabilities.

Page 5 of 21
Hamilton Lane identifies several critical factors and challenges for implementation of a successful co-investment program, all of which are contemplated in the recommended HarbourVest CRPTF Co-Investment Partnership.
• Focus on performance as a primary objective.
• Leverage scale as best as possible, including:
▪ Generating deal flow from GP relationships;
▪ Accessing deep and broad deal flow, particularly from top-tier GPs, to create well-constructed, diversified portfolios that augment primary fund commitments; and,
▪ Achieving economies of scale to effectively manage individual investment costs.
• The ability to evaluate and select attractive investments, including having access to various diligence information channels.
• Having appropriate staff resources to manage investment, legal, reporting, and monitoring requirements.
HarbourVest Key Differentiators
The scale and breadth of HarbourVest’s platform as well as the experience and expertise of its dedicated co-investment and private credit teams has allowed the Firm to develop several key differentiators critical to the success of a co-investment strategy. HarbourVest’s direct co-investment and lending platforms benefit from the Firm’s extensive relationships with more than
700 general partners globally developed through the Firm’s substantial primary and secondary fund investing practices. Since inception, HarbourVest has made more than $48 billion of primary fund commitments and nearly $30 billion of secondary commitments in addition to more than $23 billion of direct equity and credit investments. The more than $100 billion of total commitments
has been made globally with the largest allocations to the Americas (62% of total commitments) followed by EMEA (28%), and Asia (10%).
These Firm’s long-standing relationship with leading general partners, often across multiple HarbourVest strategies, provides the direct co-investment and private credit teams with
differentiated and advantaged deal flow. HarbourVest holds advisory boards seats for more than 77% of the funds in which it makes primary fund commitments and is frequently one of the largest investors in a fund. As a result of HarbourVest’s meaningful and close working relationships with its general partners, the Firm’s investment professionals are often able to uncover potential co-
investment and credit investment opportunities through direct discussions with a general partner. This advantaged access not only creates significant deal flow but often best positions HarbourVest to create proprietary co-investment opportunities as well as advantaged allocations relative to other potential capital partners. HarbourVest’s ability to provide a transaction sponsor with both credit
and equity investment capital is another competitive differentiator for the Firm. The HarbourVest direct co-investment team also maintains a dedicated outbound sourcing effort to expand the Firm’s co-investment opportunity set.
HarbourVest’s ability to generate strong deal flow from leading general partners allows the direct co-investment and private credit teams to be highly selective and maintain disciplined
underwriting and portfolio construction practices. During 2020, the direct co -investment team sourced 730 transactions and closed on commitments to just over 10% of those opportunities. The Firm’s direct private credit team sourced more than 980 transactions in 2020 and closed on fewer than 5% of the total deals sourced.

Page 6 of 21
The HarbourVest direct co-investment and private credit investment professionals utilize the Firm’s information advantage to screen and perform due diligence on potential investment opportunities. The Firm’s close, collaborative working relationships with general partners allows its investment professionals to gain direct, real-time access to the transaction sponsor, due diligence materials, and management teams. This information is augmented by the Firm’s
proprietary database that includes detailed manager track record and portfolio company information for every fund in which the Firm has invested. With information on more than 900 sponsors, the database allows the Firm’s investment teams to gain deep insights into a general partner’s track record by sector and individual partner, which helps to identify the manager’s
particular strengths and core competencies. In addition, HarbourVest’s repository of detailed historical portfolio company information provides its investment teams with the ability to track performance by sector and sub-sector as well as valuation and return trends.
Page 7 of 21
HarbourVest CT Co-Investment Fund LP
Management Team
The HarbourVest direct co-investment platform is one of the largest and most established in the private equity industry. HarbourVest’s direct co-investment and credit team is currently comprised of 56 investment professionals dedicated to direct investments. The private equity direct co-investment team is led by six Managing Directors with an average HarbourVest tenure of 18 years.
The Firm’s direct co-investment professionals are located in Boston, Dublin, Hong Kong, London, and Toronto but also leverage resources across HarbourVest’s other global offices.
HarbourVest began making direct company investments in 1983 and has participated in more than 750 direct co-investments since that time. Initially, HarbourVest made direct investments out of
multi-strategy private equity and credit vehicles but raised its first commingled fund dedicated to co-investments in 2004. Since that time, the direct co-investment team has invested more than $13.5 billion in over 375 co-investments, including through multiple market cycles. The team has gained valuable insights and pattern recognition skills that resulted in constant refinements and
improvements to best practices across due diligence, investment selection and structuring, portfolio construction, and monitoring.
The HarbourVest co-investment team has developed a particular expertise in solutions-oriented co-investments, which allows the Firm to generate proprietary deal flow and serves as a
competitive advantage relative to managers focused on syndicated co-investment opportunities. HarbourVest utilizes the team’s ability to independently assess a co-investment to engage early with the sponsor and create a potential co-investment opportunity for the Firm, often through a customized solution not readily available from other co-investment managers. In addition to co-
underwriting investments, HarbourVest also provides several other forms of solutions-oriented co-investments, including providing growth or recapitalization capital for individual portfolio companies and transaction warehousing. While the HarbourVest direct co-investment team seeks to build the strongest pipeline across all transaction types, solutions-oriented investments have
represented more than 65% of all transactions and capital deployed over the most recent HarbourVest commingled co-investment funds.
In addition to managing a series of commingled co-investment funds, the HarbourVest direct co-investment team began managing co-investment separately managed accounts for institutional
investors in 2011. Since that time, the direct co-investment team has invested more than $9.5 billion in over 345 co-investments completed on behalf of SMA clients. HarbourVest manages co-investment SMAs on behalf of several large public pension plans, including the State of Michigan Retirement System, the Virginia Retirement System, and the New York State Teachers’
Retirement System. Through this significant experience with several large institutions, HarbourVest has developed expertise in providing customized solutions to achieve each client’s desired co-investment objectives.
HarbourVest’s Direct Strategy Committee (“Direct IC”) approves all direct co-investments and is
comprised of six senior Managing Directors of the Firm. Five of the Direct IC members vote on each transaction. Ian Lane, Peter Lipson, Alex Rogers, and Greg Stento vote on all transactions presented to the Direct IC. The fifth voting member is Kelvin Yap if the direct co-investment opportunity involves an Asian investment, or Corentin du Roy Kelvin for opportunities outside of
Asia. Lane, Lipson, Rogers, Yap, and du Roy are all senior members of the direct investment team, while Stento is the Firm’s Head of Investments. Two-thirds of the voting Direct IC members must support an investment for it to be approved and no member of the Direct IC has a veto right.

Page 8 of 21
Investment Strategy and Market Opportunity
The CT Co-Investment Fund’s strategy will be focused on making private equity co-investments alongside buyout and growth equity managers. The primary objectives of the CT Co-Investment
Fund include generating improved net returns, providing access to a higher volume and mo re diverse set of co-investment opportunities, and allowing the CRPTF a complementary means to efficiently scale its deployment of private equity capital.
The fund will be managed by HarbourVest’s direct co-investment team, which will be responsible for sourcing, selecting, structuring, and monitoring investments in the fund subject to the CRPTF’s customized investment guidelines. The CT Co-Investment Fund will create the capacity for the CRPTF to benefit from co-investment opportunities generated from existing private equity
managers in the PIF portfolio. HarbourVest will work with PFM staff to develop a communication and sourcing effort to ensure that Connecticut receives an opportunity to review all appropriate co-investments generated by managers in the PIF portfolio.
HarbourVest will complement the CRPTF’s deal flow with co-investment opportunities sourced through HarbourVest’s deep roster of manager relationships. While HarbourVest invests globally with managers across a range of firm and fund sizes, the Firm’s direct co-investment activities are weighted toward lower and middle market transactions, particularly those with significant sector
expertise. The table below summarizes the composition of HarbourVest’s co-investment activity by enterprise value, sector, and geography across its most recent commingled co-investment funds.
The CT Co-Investment Fund will target co-investment commitments of $150 million per year over an initial three-year commitment period. The CRPTF and HarbourVest would work to extend the
investment period should the initial capital commitment not be deployed as expected. In addition, the fund will be structured as an evergreen vehicle, which would allow the CRPTF to continue to allocate capital for private equity co-investments beyond the fund’s initial three-year commitment period.
HarbourVest will seek to build a portfolio of buyout and growth equity co-investments diversified across managers, sectors, size, and geographies. The Firm anticipates that the CT Co-Investment Fund will make approximately 15 co-investments per year, weighted 70%-90% to buyouts and
10%-30% to growth equity. Based on HarbourVest’s experience and expertise in managing customized co-investment programs for several large institutional, HarbourVest expects the fund’s co-investments to be sourced equally from PIF managers and HarbourVest managers.
Co-investment opportunities sourced from managers in the PIF portfolio will undergo the same thorough screening and diligence process that the direct co-investment team utilizes for its commingled funds and other SMAs. The direct co-investment team has developed a standard due diligence process that begins with an initial screening and involves an iterative process through
which senior members of the investment team and the Direct IC can provide feedback and identify
<$1.5B 51% Technology 25% North America 60%
$1.5B to $3B 31% Industrials 21% Europe 25%
>$3B 18% Healthcare 18% Asia 13%
Financials 18% Emerging Markets 2%
Consumer 18%Source: HarbourVest; % based on invested capital as of March 31, 2021.
Enterprise Value Sector Geography
HarbourVest Co-Investment Fund III through V

Page 9 of 21
focus areas for further diligence. A full due diligence review includes a thorough assessment of the lead sponsor, a comprehensive industry review, company analysis, and an evaluation of both the sponsor’s and target company’s ESG practices. HarbourVest complements its internal due diligence work with the retained services of a leading global strategy consulting firm, which provides HarbourVest with a dedicated team to conduct targeted commercial due diligence on a
no notice basis. HarbourVest proactively manages its co-investment portfolios through frequent interactions with both company management and the lead transaction sponsor. While a minority investor,
HarbourVest seeks to add value to its portfolio companies and sponsor partners through assistance with manager recruitment, customer introductions, strategy formulation, operational improvements, capital raising, and exit alternatives. sale negotiations. Deal teams are responsible for reviewing quarterly financial statements, assisting with valuations, and providing internal
updates on each investment's progress. Direct co-investment team members perform regular bottom-up and top-down portfolio analyses to help monitor portfolio pacing, diversification, and performance. Twice a year the co-investment team produces an analysis of each portfolio company, which allows the team to track portfolio progress during the prior six months. The
semiannual reviews provide insights on projected performance and outcomes as well as the identification of any broader patterns or trends across portfolios. HarbourVest’s active portfolio company monitoring practices provides the Firm the opportunity
to identify underperforming investments early and engage with the lead sponsor to address the company’s challenges. When HarbourVest holds a board or board observer seat, its investment professionals may contribute to discussions involving work-out plans, changes to a company’s management team or capital structure, etc.

Page 10 of 21
HarbourVest CT Private Debt Fund LP
Management Team
HarbourVest established its dedicated private credit team in 2018 and recruited two senior credit investment professionals to complement the experience of the existing team members that had been investing in credit at HarbourVest prior to 2018. The HarbourVest private credit team is
currently comprised of three Managing Directors, each with more than 20 years of investment experience. Additionally, one Principal and four Vice Presidents are dedicated to the private credit platform while junior investment associates are a shared resource of the private credit and direct co-investment teams. The senior investment professionals on HarbourVest’s credit team have an
average of over 15 years of experience originating, underwriting, structuring, and restructuring senior debt investments across multiple market cycles. The private credit investment professionals are all located in the Firm’s Boston headquarters.
The HarbourVest team began making private credit investments in 2003 and had committed $1.2
billion to 75 private credit direct investments as of March 31, 2021. Through 2015, the Firm’s private credit activity was focused primarily on junior credit or mezzanine investments. HarbourVest expanded its private credit direct investment strategy into senior credit in 2015 when it added experienced senior credit investment professionals to the direct investment team. Between
2015 and March 2021, HarbourVest had invested more than $670 million in over 50 direct senior credit investments.
Prior to raising its first dedicated credit fund, HarbourVest Credit Opportunities Fund I (“COF I”), HarbourVest made private credit investments out of other HarbourVest managed vehicles. COF I
was invested between 2015 and 2020 and was followed by HarbourVest Credit Opportunities Fund II (“COF II”), which began investing in 2019. The Credit Opportunities funds are focused on junior credit investments that are most often accompanied with equity co-investments. The Firm launched its first commingled fund dedicated to direct senior credit investments, HarbourVest Direct
Lending Fund, in 2019. Additionally, HarbourVest now manages $400 million of private credit focused SMAs.
Similar to the HarbourVest direct co-investment team, the private credit platform benefits from the network effect of the Firm’s more 150 investment professionals that are engaging frequently
with private equity and private credit firms. The HarbourVest credit team utilizes a systematic process to source opportunities from the Firm’s vast relationships with private markets managers as well as through professional networks developed over decades of direct debt investing. In addition, the Firm’s direct co-investment pipeline is monitored closely for private credit
investment opportunities that may be available as part of the same equity co-investment transaction under review by the direct co-investment team.
HarbourVest’s Credit Strategy Investment Committee (“Credit IC”) is responsible for approving all credit investments and is comprised of five Managing Directors of the Firm: Peter Lipson,
Jamie Athanasoulas, John Morris, Karen Simeone, Greg Stento . Lipson, Athanasoulas, and Simeone are the Managing Directors with primary responsibility for the private credit platform, while Morris and Stento are senior members of the HarbourVest organization with tenures of more than 20 years at the Firm. Two-thirds of the voting Credit IC members must support an investment
for it to be approved and no Credit IC member has a veto right.

Page 11 of 21
Investment Strategy and Market Opportunity
The CT Private Debt Fund’s strategy will be focused on making senior and junior credit investments in companies that are generally owned by private equity sponsors. Consistent with
HarbourVest’s flagship private credit strategies, the CT Private Debt Fund is expected to be primarily invested in middle market companies based in the United States with opportunistic exposure to other geographies.
The CT Private Debt Fund portfolio will be primarily focused on senior credit opportunities, which are expected to comprise 70% of the fund’s exposure. HarbourVest will seek to build a diversified portfolio of senior credit investments across first lien, unitranche and second lien securities to provide current income, capital preservation, and strong downside protection. The balance of the
fund’s exposure is expected to be consist of higher yielding junior credit investments, which may include second lien, holdco notes, and PIK preferred instruments. The CT Private Debt Fund investment guidelines will limit the fund’s total equity exposure but provide the opportunity for capital appreciation when available.
The objectives of the CT Private Debt Fund are to deliver returns consistent with the PCF’s risk profile and return benchmark while also providing the CRPTF with the opportunity to build out the PCF’s market value through a fee efficient strategy. HarbourVest will target net unlevered
returns of 7% to 8% for senior credit investments and in the low teens for junior capital investments made on behalf of the CT Private Debt Fund. The CT Private Debt Fund will enable the CRPTF to capture co-investment opportunities
generated from private credit managers in the PCF portfolio. Based on the current composition of the PCF portfolio, HarbourVest expects approximately 30% of the CT Private Debt Fund’s investments will be sourced from Connecticut’s private credit managers and the balance from HarbourVest’s direct credit origination efforts. HarbourVest will work with PFM staff to develop
a communication and sourcing effort to ensure that Connecticut receives an opportunity to review all appropriate co-investments generated by managers in the PCF portfolio. The fund will be managed by HarbourVest’s private credit investment team, which will be
responsible for sourcing, selecting, structuring, and monitoring investments in the fund subject to the CRPTF’s investment guidelines. HarbourVest will seek to build a portfolio of senior and junior credit investments diversified by vintage year, size, and sector. The CT Private Debt Fund will co-invest with HarbourVest’s direct lending strategies, which are primarily focused on U.S. based
middle market companies with $10 million to $100 million of EBITDA at the time of investment. The CT Private Debt Fund will target commitments of $150 million per year over an initial three-year commitment period. HarbourVest anticipates that the fund will make 16 to 18 co-investments
per year. The CRPTF and HarbourVest would work to extend the investment period should the initial capital commitment not be deployed as expected. In addition, the fund will be structured as an evergreen vehicle, which would allow the CRPTF to continue to allocate capital for private credit co-investments beyond the fund’s initial three-year commitment period.
HarbourVest’s private credit team will utilize the Firm’s rigorous due diligence and underwriting practices for CT Private Debt Fund opportunities. The Firm’s standardized due diligence process involves a comprehensive analysis of the target company and its management team, credit and
structural risks, and the transaction sponsor. The private credit team’s due diligence includes both qualitative and quantitative assessments, including development of robust financial models that

Page 12 of 21
incorporates company and comparable company data as well as free cash flow and downside analyses. The deal team is also able to leverage HarbourVest’s insights into the lead sponsor as well as the Firm’s proprietary database to assesses the strengths and weaknesses of the lead sponsor and its track record with comparable companies. The private credit team also has access to the retained global strategy consulting firm utilized by the direct co-investment team.
The private credit team’s active portfolio monitoring practices are similar to those utilized by the direct co-investment team. With a focus on directly originated middle-market credit transactions, which tend to have fewer credit providers than larger, broadly syndicated loans, HarbourVest is
well-positioned to actively monitor its investment portfolio. This dynamic combined with the Firm’s close working relationships with transaction sponsors, allows HarbourVest’s private credit team to more proactively address challenges and opportunities that may develop with its portfolio companies.
Investment opportunities that under consideration by a deal team are reviewed by the private credit investment team through weekly Credit IC meetings, which allows the deal team to provide frequent updates to the Credit IC and broader investment team as the diligence process continues.
If a credit investment opportunity is brought to the Credit IC for a final decision, it has been typically reviewed at least three times by the entire investment team and Credit IC. Track Record
The HarbourVest team has invested more than $20 billion in over 800 direct co-investments since 1982, including during its affiliation with Hancock Venture Partners before 1998. PFM investment
professionals have focused the track record assessment herein on HarbourVest’s direct co-investment track record since 2004, which is when HarbourVest raised its first commingled fund dedicated to direct co-investments.
Between 2004 and March 2021, HarbourVest had invested $13.5 billion in 399 companies across all HarbourVest managed vehicles targeting direct co-investments. These co-investments generated a gross IRR and total value multiple (“TVM”) of 19%% and 1.8x, respectively, as of March 31, 2021. As shown in the table below, HarbourVest had realized co-investments in 158
companies, which generated a 2.1x gross multiple on $3.9 billion of invested capital.
(US$ in millions, as of March 31, 2021)
Invested Realized Unrealized Total
Strategy # Companies1 Capital Value Value Value TVM IRR RPI2
Buyout 239 $10,338 $7,389 $10,379 $17,768 1.7x 17% 0.7x
Growth Equity 108 $2,332 $2,019 $3,818 $5,837 2.5x 22% 0.9x
Credit/Other 52 $863 $558 $752 $1,309 1.5x 23% 0.6x
All Investments 399 $13,533 $9,966 $14,948 $24,914 1.8x 19% 0.7x
Buyout 101 $3,045 $6,104 $32 $6,136 2.0x 16% 2.0x
Growth Equity 40 $664 $1,528 $0 $1,528 2.3x 19% 2.3x
Credit/Other 17 $144 $400 $0 $400 2.8x 27% 2.8x
Realized Investments 158 $3,854 $8,032 $32 $8,065 2.1x 17% 2.1xSource: HarbourVest.1. Company counts be impacted by more than one investment in the same company.2. RPI i s rea l ized to paid in capita l .
HarbourVest - Direct Co-Investments 2004 to Present
Investment Performance Summary
Gross
All Investments
Realized Investments

Page 13 of 21
The track record for HarbourVest’s five commingled funds focused on direct co-investments is summarized in the following table.
The performance of HarbourVest’s direct co-investment commingled funds has generally improved as the Firm has continued to scale its co-investment platform, refine the investment strategy, and broadened its opportunity set. Other than the 2007 Direct Fund, the HarbourVest
commingled co-investment funds were all ranked as first or second quartile funds on an IRR and TVM basis as of March 31, 2021. PFM staff notes that the 2007 Direct Fund’s net IRR fell less than 20 basis points outside of the second quartile of the Hamilton Lane Buyout Benchmark for the 2007 vintage year. HarbourVest’s more mature commingled co-investment funds also ranked
as first or second quartile funds based on distribution ratios. All of HarbourVest’s commingled co-investment funds had outperformed the Russell 3000 on a public market equivalent basis as of March 31, 2021.
As previously noted, HarbourVest began managing customized co-investment SMAs in 2011. HarbourVest invested more than $9.5 billion in more than 340 co-investments on behalf of its SMA clients, which generated a gross IRR and TVM of 25.4% and 1.7x, respectively, as of December 31, 2020. The realized co-investments made on behalf of HarbourVest’s SMA clients
generated a gross IRR and TVM of 32.8% and 2.5x as of the same date. Private Credit From 2003 through March 31, 2021, HarbourVest had invested $1.2 billion in 75 companies in
direct credit across all HarbourVest managed vehicles. As shown in the table below, the Firm’s direct credit investments generated a gross IRR and TVM of 20% and 1.4x, respectively, as of March 31, 2021. HarbourVest had realized 23 credit investments as of March 31, 2021, which generated a gross IRR of 22% and TVM of 1.9x on $0.3 billion of invested capital.
(US$ in millions, as of March 31, 2021)
Vintage Fund Invested Realized Unrealized Total
Fund Year Size # Deals Capital Value Value Value TVM IRR DPI TVM IRR DPI
2004 Direct Fund 2004 $350 25 $368 $699 $36 $735 2.0x / 1.9x 13% / 11% 1.9x / 1.8x 1st 2nd 1st
2007 Direct Fund 2007 $734 35 $750 1,330 27 $1,357 1.8x / 1.7x 12% / 10% 1.8x / 1.7x 2nd 3rd 2nd
2013 Direct Fund 2013 $1,010 30 $1,026 1,569 684 $2,253 1.8x / 1.6x 23% / 19% 1.5x / 1.4x 1st 2nd 1st
Co-Invest Fund IV 2016 $1,768 40 $1,742 778 2,652 $3,430 1.8x / 1.6x 26% / 24% 0.4x / 0.3x 1st 1st 2nd
Co-Invest Fund V 2018 $3,030 43 $2,398 229 3,818 $4,047 1.7x / 1.6x 53% / 71% 0.1x / 0.0x 1st 1st 4th
Total All Funds $6,892 173 $6,284 $4,605 $7,216 $11,822 1.9x / 1.8x 19% / 17% 0.7 x / 0.6x
Source: HarbourVest, Hamilton Lane Buyout Benchmark. Quartile Rank based on net returns.
HarbourVest - Commingled Co-Investment Funds
Investment Performance Summary
Gross / Net Quartile Rank
(US$ in millions, as of March 31, 2021)
Vintage Fund Invested Realized Unrealized Total
Fund Year Size # Deals Capital Value Value Value TVM IRR DPI TVM IRR DPI
Model Portfolio 1 2003 n/a 4 $27 $84 $0 $84 3.1x 30% 3.1x n/a n/a n/a
Model Portfolio 2 2008 n/a 9 $163 $259 $0 $259 1.6x 15% 1.6x n/a n/a n/a
Model Portfolio 3 2011 n/a 5 $44 $98 $5 $103 2.3x 32% 2.2x n/a n/a n/a
COF I 2015 $379 18 $385 $294 $298 $593 1.5x / 1.5x 19% / 19% 1.5x / 1.5x 1st 1st 1st
COF II 2019 $833 16 $365 $11 $391 $402 1.1x / 1.1x 19% / 16% 0.0x / 0.0x n/m n/m n/m
Direct Lending I 2020 $580 23 $207 $19 $199 $218 1.1x / 1.1x 11% / 12% 0.1x / 0.0x n/m n/m n/m
Total $1,792 75 $1,191 $765 $893 $1,658 1.4x 20% 0.6x
Source: HarbourVest, Hamilton Lane Credit Benchmark. Quartile Rank based on net returns.
*Model Portfolios and Total performance reported gross of fees.
HarbourVest - Direct Private Credit Investment Performance Summary
Gross / Net Quartile Rank

Page 14 of 21
The model portfolios shown in the performance summary table represent the private credit direct investments made by HarbourVest before 2015 that are consistent with HarbourVest’s core private credit direct investment strategy. The model portfolios were from various HarbourVest managed vehicles and not dedicated credit funds; therefore, only the gross return profile of these investments
is available. HarbourVest’s first dedicated commingled credit fund, Credit Opportunities Fund I, performed well through March 31, 2021 resulting in the fund being ranked in the first quartile across all
relevant Hamilton Lane Credit Benchmarks. The return profile of COF I is reflective of the HarbourVest’s junior credit strategy, which generally includes co-investing equity alongside the Firm’s junior debt instruments. COF I’s invested capital was comprised of 59% debt securities and 41% equity interests.
Credit Opportunities Fund II began investing in 2019 and Direct Lending Fund I’s first investment was made in 2020. While both funds are performing to expectations and in line with HarbourVest’s targeted returns for these strategies, it is too early to draw meaningful conclusions on the funds’
long-term performance.

Page 15 of 21
Key Strengths
1. Size and Experience of Direct Investment Team. The HarbourVest direct investment platform is managed by one of the largest teams of professionals dedicated to co-investments
and direct investments. Since inception, the Firm has committed more than $23 billion direct private equity and credit investments, including co-investing more than $13.5 billion in over 370 companies since raising its first direct co-investment focused fund in 2004. The HarbourVest direct investment team is currently comprised of 56 professionals located in five
offices globally, which provides the platform with differentiated capabilities to source and execute locally. The HarbourVest direct investment team is led by a tenured group of Managing Directors, with an average of 20 years of experience. The team and Firm’s experience investing through various economic and capital market environments has led to
strategy and execution refinements as well as the development of institutional knowledge and pattern recognition capabilities that are expected to benefit the HarbourVest CRPTF Co-Investment Partnership.
2. Strategic Positioning with Transaction Sponsors. HarbourVest’s ability to provide general partners with solutions-oriented co-investments as well as direct investments of debt and equity capital is a competitive advantage over co-investment and direct managers that do not have the capabilities or flexibility to provide such a broad range of solutions. Moreover, the
HarbourVest direct investment platform benefits from the Firm’s long-term relationships with leading private equity and credit managers globally through HarbourVest’s significant primary fund and secondary investment platforms. HarbourVest’s institutional knowledge of managers, funds, and portfolio companies helps to create sourcing and information advantages for the
HarbourVest direct investment platform.
3. Significant Experience with Customized Co-Investment Programs. HarbourVest has long offered customized solutions to institutional investors seeking to access private markets. The
Firm has gained significant experience managing customized co-investment SMAs since 2011. Specifically, HarbourVest has developed expertise in managing customized co -investment programs for several large public pension plans for states such as Michigan and Virginia and more recently for New York City. The success and effectiveness of HarbourVest’s customized
co-investment programs is demonstrated by the longevity and size of several individual SMAs that have grown to exceed more than $1 billion in assets under management through successive commitments.
4. PIF & PCF Strategic Plan Objectives. The recommended HarbourVest CRPTF Co-Investment Partnership would allow the CRPT to achieve several objectives of the PIF and PCF strategic plans, including deploying capital at scale through fee efficient strategies. The CRPTF’s ability to access HarbourVest’s substantial private equity and credit deal flow would
allow the CRPTF to gain access to managers, strategies, and geographies that are expected to be complementary to the CRPTF’s exposures to managers in the PIF and PCF portfolios. Lastly, PFM investment professionals should gain additional insights into exis ting and prospective managers through information sharing with the HarbourVest direct investment
team. Major Risks and Mitigants
1. Team Capacity and Discipline. The HarbourVest direct investment platform has continued to grow as measured by both assets under management and transaction volume. The direct co-investment team deployed $1.5 billion of co-investment capital in 2020, which represented a

Page 16 of 21
41% increase over 2018 investment levels. The Firm’s private credit team increased its transaction count from seven in 2019 to 20 in 2020. The increase in assets under management and investment activity raises concerns that the Firm’s ability to effectively deploy larger pools may be adversely affected. This risk is mitigated by several factors. HarbourVest has continued to invest in the growth of its investment teams to properly support the expansion of its direct
investment platform. The co-investment market opportunity continues to grow in line with overall private market transaction levels, and the increased scale of HarbourVest’s direct investment platform strengthens its strategic positioning within the private equity and credit sponsor community. As a result, HarbourVest is better positioned to generate strong and
advantaged deal flow, which are critical factors to executing a successful co -investment strategy. PFM investment professionals also gained comfort that HarbourVest has continued to exercise investment discipline as the Firm’s ratio of deals closed to deals sourced has been consistent as transaction volumes has grown.
2. Less Proven Senior Credit Strategy. While HarbourVest has invested in private credit for close to two decades, the Firm began investing in senior credit in 2015. The lack of a long-
term track record and experience set in senior credit may raise concerns with the team’s ability to effectively manage this portion of the CT Private Debt Fund. PFM investment professionals believe HarbourVest has addressed this concern through the recruitment of several experienced senior credit investment professionals to the team since 2015. Notably, Jamie Athanasoulas
and Karen Simeone were recruited to HarbourVest in 2018 with significant senior credit experience at Bain Capital Credit and TCW, respectively. Athanasoulas and Simeone led the private credit team along with Managing Director Peter Lipson, who has been with HarbourVest since 1997, and all have significant credit experience. HarbourVest has also
added several mid-level investment professionals with senior direct lending experience to its team as the Firm’s private credit platform has grown.
Fees and Terms – Please see Appendix I
Legal and Regulatory Disclosure (provided by Legal)
Through its disclosure, HarbourVest Partners, LLC (“HarbourVest”), discloses one legal related matter. In April 2020, HarbourVest filed a proof of claim related to a bankruptcy filing by Highland Capital Management. HarbourVest settled its claims with Highland Capital, pursuant to which HarbourVest agreed to drop its claims against Highland Capital and transfer its interest in the
relevant Highland managed fund to the Highland estate, in exchange for a $45 million general unsecured creditor claim plus a $35 million junior class creditor claim in the bankruptcy process. HarbourVest does not disclose any material claims under its fidelity, fiduciary or E&O insurance
policies, and has no ongoing internal investigations to report. HarbourVest states it has adequate procedures in place to undertake internal investigations of its employees, officers and directors.
Compliance Review
HarbourVest’s Workforce Diversity & Corporate Citizenship review is attached.
Environment, Social & Governance Analysis (“ESG”)
The Assistant Treasurer for Corporate Governance & Sustainable Investment’s Evaluation and
Implementation of Sustainable Principles review is attached.

Page 17 of 21
Appendix I
During Years 1 through 5 0.47%
Thereafter Reduced by 20%
per year
GP's Carried Interest Rate 6.25%
LP's Preferred Return 8.00%
GP's Carried Interest Rate 5.00%
LP's Preferred Return 0.00%
*European, or whole fund, waterfall.
During Years 1 through 5 0.30%
Thereafter Reduced by 20%
per year
GP's Carried Interest Rate 5.00%
LP's Preferred Return 5.00%
*European, or whole fund, waterfall.
Management Fee on Invested Capital
Carried Interest/Waterfall*
HarbourVest CT Co-Investment Fund
Management Fee on Invested Capital
Carried Interest/Waterfall*
Option One
Option Two
HarbourVest CT Private Debt Fund

Page 18 of 21
COMPLIANCE REVIEW FOR HARBOURVEST PARTNERS
SUMMARY OF LEGAL AND POLICY1 ATTACHMENTS SUBMITTED BY
HARBOURVEST PARTNERS L.P. I. Review of Required Legal and Policy Attachments
HARBOURVEST PARTNERS L.P. (“HarbourVest”) completed all necessary attachments. It disclosed no impermissible third party fees, campaign contributions, known conflicts, or gifts. The firm’s disclosure of legal/regulatory proceedings is being reviewed by the Legal Unit.
II. Workforce Diversity (See Also 3-year Workforce Diversity Snapshot Page Attached)
As of June 2021, HarbourVest, a Boston Massachusetts-based firm, employed 722, 159 more than the 563 employed as of August 12, 2019. The firm identified 98 women and/or minorities as Executive/Senior Level Officials and Managers. Over the 3-year period reported (2021 - 2019), the firm promoted 125 women and 75 minorities2 within the ranks of professionals or managers. Women and minorities (the highest percentage being Asians) are well represented at all levels of the firm. Workforce Statistics3 For Executive/Senior Level Officials and Managers:
• Women held 34% of these positions in June 2021 (69 of 204), up from 30% in June 2020 (54 of 180), slightly up from 29% (47 of 162) in August 2019.
• Minorities held 24% (49 of 204) of these positions both in June 2021 (2% Black, 2% Hispanic, 14% Asian, 5% Do Not Wish to Answer, and 0.98% Two or More Races), and in June 2020 (47 of 162) (2% Black, 2% Hispanic, 15% Asian, 4% Do Not Wish to Answer, 1.1% Two or More Races), slightly down from 25% (41 of 162) (2.5% Black, 2% Hispanic, 15% Asian, and 6.2% Do Not Wish to Answer) in August 2019.
At the Management Level overall:
• Women held 38% (103 of 271) of these positions in June 2021, up from 35% both
in June 2020 (85 of 242), and in August 2019 (76 of 216).
• Minorities held 26% (70 of 271) of these positions in June 2021 (2% Black, 4%
Hispanic, 15% Asian, 4% Do Not Wish to Answer, 0.74% Two or More Races)
slightly up from 25% (61 of 242) (2.5% Black, 3% Hispanic, 15% Asian, 3% Do Not
Wish to Answer, 1.2% Two or More Races) in June 2020, and 27% (58 of 216) (3%
Black, 3% Hispanic, 15% Asian, 5% Do Not Wish to Answer, and 0.46% Two or
More Races) in August 2019.
1 The Treasury’s Policy Unit will prepare a separate Summary with respect to HarbourVest’s ESG submission. 2 The total number of women promoted includes minority women and white women; and the total number of minorities promoted represent the number of minority women and minority male. 3 HarbourVest included a new category “Do Not Wish to Answer” in the Employer Information Report as some
employees chose not to answer ethnicity questions.

Page 19 of 21
At the Professional Level:
• Women held 46.2% (170 of 368) of these positions both in June 2021, and in June
2020 (135 of 293), up from 44% (110 of 248) in August 2019.
• Minorities held 36% (133 of 368) (4% Black, 6% Hispanic, 19% Asian, 6% Do Not Wish to Answer, 1.4% Two or More Races) of these positions in June 2021, up from 35% (102 of 293) (2% Black, 5% Hispanic, 23% Asian, 4% Do Not Wish to Answer, 1% Two or More Races) in June 2020, and 35% (87 of 248) (0.81% Black, 5% Hispanic, 23% Asian, 5% Do Not Wish to Answer, 1.2% Two or More Races) in August 2019.
Firm-wide:
• Women held 46% (331 of 722) of these positions in June 2021, slightly up from 45% (287 of 642) both in June 2020, and in August 2019 (252 of 563).
• Minorities held 32% (233 of 722) (3% Black, 6% Hispanic, 17% Asian, 4% Do Not Wish to Answer, 1.1% Two or More Races) of these positions in both June 2021, and in June 2020 (206 of 642) (3% Black, 5% Hispanic, 19% Asian, 4% Do Not Wish to Answer, 1.2% Two or More Races), and 33% (188 of 563) (3% Black, 5% Hispanic, 19% Asian, 6% Do Not Wish to Answer, 0.89% Two or More Races) in August 2019.
III. Corporate Citizenship
Charitable Giving: HarbourVest and its more than 600 staff members (from senior management down) support numerous community organizations where they live and work. Causes supported include: youth mentoring, child/adult special education, gender diversity, poverty and homelessness, health causes, women’s leadership, and the arts. The firm holds two Global Volunteer Weeks each year, allowing staff to donate time to local causes during business hours. HarbourVest also has a matching gift program, whereby the firm matches up to $1,000 of donations to the causes that matter the most to its employees. In 2020 employees donated over $130,000 ($91,000 matched by HarbourVest) to over 600 unique causes worldwide. In May 2020, HarbourVest gave each employee $250 in Rewards dollars, in response to the ongoing pandemic, to donate to organizations resulting in over $140,000 in additional donations. Several Connecticut-based organizations, such as the Smithsonian Institution, Connecticut College, Foodshare, Inc., and Ready to Power, qualify for this dollar-for-dollar matching program. Furthermore, in June 2020, HarbourVest announced its employees will be given two paid volunteer days a year to dedicate to causes that address social inequality known as the Employee Services Days Program which launched globally in 2021. Internships/Scholarships: HarbourVest is participating in #blackinterns, an initiative to offer 100 internships to Black students and recent graduates across the United Kingdom to help kick start careers in investment management. Procurement: HarbourVest does not have a formal procurement policy or program regarding women-owned,
minority-owned, and/or emerging businesses. However, the firm has long provided capital
support to smaller funds particularly those that are early in their life cycle or led by diverse
managers. In all, the firm has closed on approximately $1.5 billion in commitments to 69 private

Page 20 of 21
equity funds focused on the US lower middle market, including more than $1 billion into funds
managed by female or minority partners. Within the firm’s emerging and diverse portfolio, 80%
of the funds have at least one female or minority partner, and 46% have more than one female
or minority partner. In addition, HarbourVest is currently in the process of changing its diversity
data gathering technique, including the ILPA Diversity Template.

Page 21 of 21
Evaluation and Implementation of Sustainable Principles (provided by Assistant Treasurer
of Corporate Governance and Sustainable Investing Policy)
Criteria Responses
1 Firm has an ESG policy Yes
1a If yes, firm described its ESG policy Yes
2
If yes, firm provided examples of ESG factors considered in the
decision-making process, explained the financial impact of these
ESG factors
Yes
3Designated staff responsible for sustainability policies and
researchYes
4Firm provides training/resources on sustainability issues,
explained sources of ESG-related dataYes
5 Signatory/member of sustainability-related initiatives or groups Yes
6Policy for evaluating current or prospective relationships with
manufacturers or retailers of civilian firearmsNo
7Policy that requires safe and responsible use, ownership or
production of gunsNo
8Enhanced screening of manufacturers or retailers of civilian
firearmsYes
9
Enhanced screening of any industry/sector subject to increased
regulatory oversight, potential adverse social and/or
environmental impacts
Yes
10Merchant credit relationships with retailers of civilian firearms
and accessoriesNo
10aIf yes, firm confirms compliance with laws governing firearms
sales N/A
11Overall assessment of responses (e.g., depth of approach to ESG
and integration)
HarbourVest has been a signatory of the UN PRI since 2013, and
employs a climate change strategy that aligns with standards
promulgated by the Taskforce on Climate-related Financial
Disclosures (TCFD). The firm has an ESG council that oversees
ESG policies and its Executive Management Committee is charged
with implementing said policies. The firm provides periodic ESG
training sessions to staff and relies on tools from the Sustainability
Accounting Standards Board (SASB) and RepRisk to support the
evaluation of materiality.
The firm does not have a policy regarding relationships with
manufacturers or retailers of civilian firearms.
Overall, HarbourVest’s disclosure suggests thorough integration of
ESG factors in its investment process.
SCORE:
Excellent - 1
Detailed description of ESG philosophy and integration; ongoing
ESG assessment; established framework; member of
sustainability-oriented organizations; enhanced screening of
firearms and/or higher-risk sectors
Very Good - 2
Detailed description of ESG philosophy and integration; ongoing
ESG assessment; established framework; member of
sustainability-oriented+B3 organizations
Satisfactory - 3
General description of ESG philosophy and integration; some
evidence of framework for ongoing ESG assessment; member of
sustainability-oriented organizations
Needs Improvement - 4
Generic and/or vague description of ESG philosophy and
integration; no ongoing ESG assessment; no dedicated ESG staff
or resources
Poor - 5
Incomplete or non-responsive
2

HarbourVest/State of Connecticut Private Credit Mandate
Meeting Memorandum
This report is intended solely for the clients and employees of Hamilton Lane. It contains confidential and proprietary Hamilton Lane information. This presentation is not an offer to sell, or a solicitation of any offer
to buy, any security or to enter into any agreement with Hamilton Lane or any of its affiliates.
1
Meeting Details Meeting Date: 7/30/21
GP Attendees: Peter Lipson, Craig MacDonald, Karen Simeone, Jackie Peradotto, Lee Incandela and Fran Peters
HL Attendees: Katie Moore, Sean Barber and Jesten Jacob Meeting Conclusions
HarbourVest is well positioned to execute on the mandate due to its sizable investment team led by a deep bench of tenured and experienced deal leads. The General Partner continues to expand its dedicated Private Credit co-investment team and its footprint across geographies, ensuring broad coverage of investment opportunities and enhancing deal execution.
The General Partner targets a diversified portfolio of senior and junior credit investments across companies, industries and geographies. HarbourVest expects the majority of deal flow to be sourced from its platform and allocated to the State of Connecticut private credit mandate. While the General Partner’s historical track record has a heavy equity component, it is expected that the CRPTF’s private credit co-investment mandate will be focused on senior and junior credit securities with limited material equity exposure.
HarbourVest has generated attractive gross performance and the General Partner has stepped up its deployment pace from 2015 upon the establishment of dedicated credit vehicles.
Fund Information General Partner: HarbourVest Partners, LLC (“General Partner”), (“HarbourVest”) Fund: State of Connecticut Private Credit Separate Account (“Fund”) Target Size: $450 million Investment Period: 3 years Fund Term: 8 years GP Commitment: 1.0%
The Fund is a separately managed account for State of Connecticut’s private credit program.
The management fees and carried interested negotiated are competitive in the market.

HarbourVest/State of Connecticut Private Credit Mandate
Meeting Memorandum
This report is intended solely for the clients and employees of Hamilton Lane. It contains confidential and proprietary Hamilton Lane information. This presentation is not an offer to sell, or a solicitation of any offer
to buy, any security or to enter into any agreement with Hamilton Lane or any of its affiliates.
2
Strategy Asset Class: Private debt Strategy: Direct lending Substrategy: Senior/1st lien and junior debt # of Investments: 16 to 18 per year Enterprise Values: Not provided Inv. Size Range: Approximately $9 million Geography: Primarily North America with Western Europe Industries: Diversified Target Returns: High single-digit gross IRR
HarbourVest targets a broad, globally diversified portfolio of senior and junior credit investments.
o The General Partner expects to deploy 70% of capital in senior securities and 30% in junior securities.
o HarbourVest primarily targets middle-market companies generating less than $150 million of EBITDA.
o The General Partner intends to incorporate 1st lien, unitranche, 2nd lien and hybrid securities and will seek to limit exposure to equity securities to 15%.
The General Partner expects 70% of deal flow to be sourced by HarbourVest and 30% through managers in the Private Credit Fund of the Connecticut Retirement Plans and Trust Funds (“CRPTF”).
HarbourVest plans to leverage its Portfolio Construction Committee, allocation policies and internal software to determine the allocation of investments across funds and separately managed accounts; allocation is expected to be done in a formulaic, consistent and fair approach.
o Co-investment opportunities specifically directed to State of Connecticut will be 100% allocated to State of Connecticut, subject to portfolio construction parameters.
Post-investment, the General Partner continues to maintain a dialogue with the sponsors and monitors the investments through a quarterly monitoring process.

HarbourVest/State of Connecticut Private Credit Mandate
Meeting Memorandum
This report is intended solely for the clients and employees of Hamilton Lane. It contains confidential and proprietary Hamilton Lane information. This presentation is not an offer to sell, or a solicitation of any offer
to buy, any security or to enter into any agreement with Hamilton Lane or any of its affiliates.
3
Organization Firm Inception: 1978 Locations: Boston (headquarters), Beijing, Bogota, Dublin, Frankfurt, Hong Kong,
London, Seoul, Singapore, Tel Aviv, Tokyo and Toronto Formal ESG Policy: Yes PRI Signatory: Yes Investment Team: 61 investment professionals; 9 Managing Directors, 10 Principals, 14 Vice
Presidents, 7 Senior Associates and 21 Associates Additional Resources: The broader HarbourVest platform Direct Private Credit Team
As of 3/31/21, the General Partner had $76.2 billion of assets under management across the various HarbourVest strategies.
HarbourVest has built on-the-ground relationships to facilitate deal flow and enhance deal execution.
o The General Partner has gradually expanded its presence globally, having recently opened a Singapore office in May 2021 and a Frankfurt office in July 2021.
The General Partner expects to add four credit investment professionals by December 2021.
The investment committee for private credit is comprised of Messrs. Lipson, Simeone, Athanasoulas, Stento and Morris; decisions are made on a consensus approach.
o Greg Stento and John Morris are Managing Directors in the Primary Partnerships team.
o Once the direct investment committee approves an investment, the opportunity will subsequently go to the Portfolio Construction Committee to determine ultimate position sizing and portfolio fit.
The Portfolio Construction Committee is comprised of two Managing Directors and the CCO Bill Royer as a non-voting, adjunct member and advisor.
The General Partner is committed to responsible investing with a dedicated ESG Council and Diversity and Inclusion Council.
Name Title Business Focus LocationTot. Exp.
(yrs.)Tenure(yrs.)
Educational Background
Peter Lipson Managing Director Direct Co-Investments/Private Credit
Boston 25 24 ● Salomon Brothers, Analyst ●
●
●
Harvard Business School (MBA)University of Virginia (MS)University of California, San Diego (BA)
Alex Rogers Managing Director Direct Co-Investments Boston 23 23 ● McKinsey & Company ●
●
Harvard Business School (MBA)Duke University (BA)
Ian Lane Managing Director Direct Co-Investments Boston 21 18 ● JP Morgan, Analyst ●
●
Harvard Business School (MBA)University of Florida (BS) (MS)
Corentin du Roy Managing Director Direct Co-Investments London 21 18 ● AXA Investment Managers, Analyst ● Paris IX Dauphine University (BS)
Craig MacDonald Managing Director Direct Co-Investments Dublin 19 16 ●
●
Morgan Stanley, AnalystCitigroup, Analyst
● University of North Carolina, Chapel Hill (BA)
Kelvin Yap Managing Director Direct Co-Investments/Fund Investment
Hong Kong/Singapore
19 15 ●
●
Deloitte, ManagerPwC, Senior Associate
● Monash University (BC)
Karen Simeone Managing Director Private Credit Boston 21 3 ●
●
●
●
TCW, Managing DirectorStairway Capital, PrincipalHVB Group, AssociateJP Morgan, Analyst
●
●
London School of EconomicsGeorgetown University (BS)
James Athanasoulas
Managing Director Private Credit Boston 16 3 ●
●
Bain Capital Credit, Managing DirectorBain & Company
●
●
Dartmouth College (MBA)Georgetown University (BA)
Seth Palmer Managing Director Direct Co-Investments Boston 16 3 ●
●
●
BlackRock, DirectorWeston Presidio, AssociateBanc of Amerca Securities
●
●
Harvard Business School (MBA)University of Michigan (BA)
Experience of Investment Professionals
Prior Experience

HarbourVest/State of Connecticut Private Credit Mandate
Meeting Memorandum
This report is intended solely for the clients and employees of Hamilton Lane. It contains confidential and proprietary Hamilton Lane information. This presentation is not an offer to sell, or a solicitation of any offer
to buy, any security or to enter into any agreement with Hamilton Lane or any of its affiliates.
4
Track Record
Net Returns
Gross Returns
HarbourVest has generated strong gross returns across prior investments.
o Model Portfolio represents all private credit direct investments before 2015, grouped by initial investment dates.
o Credit Opportunities Fund I has generated attractive returns due to its sizable exposure to equity securities.
Credit Opportunities Fund II and Direct Lending Fund I remain early in their fund life with average holding periods of 0.7 years and 0.5 years, respectively.
o As of 6/30/21, Credit Opportunities Fund II was 35% called and 58% committed.
o As of 6/30/21, Direct Lending Fund I was 25% drawn (based on a $580.3 million fund size) and 64% committed.
HarbourVest Partners HL Benchmark PME Benchmark
Prior Investment Performance1 CreditS&P Global
Leveraged Loan Index + 150bps
As of 3/31/21 As of 3/31/21 As of 3/31/21
($mm)
Credit Opportunities Fund I 2015 $379 $313.8 $202.6 $270.7 0.6x 1.5x 19.2% 0.9x 1.3x 9.0% 5.6%
Credit Opportunities Fund II 2019 833 229.9 0.0 250.2 0.0x 1.1x 16.3% 0.3x 1.3x 29.7% 1.5%
Direct Lending Fund I2 2020 580 63.3 0.0 70.7 0.0x 1.1x 12.2% 0.1x 1.1x 36.6% 4.5%
Total $607.0 $202.6 $591.6 0.3x 1.3x 20.3% 5.7%1 Capital Draw n, Capital Distributed and NAV are calculated from the cash f low s of fee paying limited partners and excludes any cash f low s from the General Partner's commitment 2 Fund size for Direct Lending Fund I is $580 million as of 6/30/21; f inal close expected in August 2021
PMEIRRFund DPI TVPI
NetIRR
Vintage Fund Size Capital Drawn
Capital Distributed
NAV DPI TVPINetIRR
Top-Quartile
HarbourVest Partners
Prior Investment Performance1
As of 3/31/21
($mm)
Fund Total Real.
Model Portfolio 1 2003 4 4 n/a $26.9 $83.8 $0.0 3.1x 29.6%
Model Portfolio 2 2008 9 9 n/a 162.6 258.6 0.0 1.6x 15.1%
Model Portfolio 3 2011 5 4 n/a 44.3 97.5 5.0 2.3x 32.0%
Credit Opportunities Fund I 2015 18 5 379 385.0 294.4 298.1 1.5x 19.2%
Credit Opportunities Fund II 2019 16 0 833 365.0 11.2 391.1 1.1x 19.0%
Direct Lending Fund I2 2020 23 1 580 207.0 19.3 199.0 1.1x 10.7%
Total 75 23 $1,190.9 $764.8 $893.1 1.4x 20.2%1 Model Portfolios refer to all private credit direct investments made by a HarbourVest fund or account since 1/1/03, grouped into model portfolios based on initial date of investment2 Fund size for Direct Lending Fund I is $580 million as of 6/30/21; f inal close expected in August 2021
Vintage# of Inv.
Fund SizeAmount Invested
Amount Realized
UnrealizedValue
GrossMult.
Gross IRR
HarbourVest Partners HarbourVest Partners
Realized Investment Performance Unrealized Investment Performance
As of 3/31/21 As of 3/31/21
($mm) ($mm)
Fund Fund
Model Portfolio 1 $26.9 $83.8 $0.0 3.1x 29.6% Model Portfolio 1 $0.0 $0.0 $0.0 n/a n/a
Model Portfolio 2 162.6 258.6 0.0 1.6x 15.1% Model Portfolio 2 0.0 0.0 0.0 n/a n/a
Model Portfolio 3 39.0 94.6 2.9 2.5x 33.6% Model Portfolio 3 5.3 2.9 2.1 0.9x -1.3%
Credit Opportunities Fund I 94.2 192.8 2.9 2.1x 33.6% Credit Opportunities Fund I 290.8 101.7 295.2 1.4x 12.6%
Credit Opportunities Fund II 0.0 0.0 0.0 n/a n/a Credit Opportunities Fund II 365.0 11.2 391.1 1.1x 19.0%
Direct Lending Fund I 9.6 10.5 0.0 1.1x 9.6% Direct Lending Fund I 197.4 8.8 199.0 1.1x 10.5%
Total $332.3 $640.2 $5.8 1.9x 22.0% Total $858.5 $124.6 $887.3 1.2x 13.1%
Gross Mult.
Gross IRR
Gross Mult.
Gross IRR
Amount Invested
AmountRealized
UnrealizedValue
UnrealizedValue
AmountRealized
Amount Invested

HarbourVest/State of Connecticut Private Credit Mandate
Meeting Memorandum
This report is intended solely for the clients and employees of Hamilton Lane. It contains confidential and proprietary Hamilton Lane information. This presentation is not an offer to sell, or a solicitation of any offer
to buy, any security or to enter into any agreement with Hamilton Lane or any of its affiliates.
5
The General Partner has generated a 24% loss ratio on a realized basis; taking into account unrealized deals, the aggregate loss ratio was 12% as of 3/31/21.
o Realized losses were from Model Portfolio 2 and there have been no realized losses since 2010.
Direct Lending Fund I has one realized deal to date; the investment is a senior credit deal in the software sector in the United States.
HarbourVest has increased its investment pacing since 2015 which reflect the establishment of its dedicated credit funds.
The General Partner has deployed an average of over $200 million per year from 2018 to 2020.
In 2020, HarbourVest deployed a significant amount of capital primarily from newly-raised vehicles Credit Opportunities Fund II and Direct Lending Fund I.

HarbourVest/State of Connecticut Private Credit Mandate
Meeting Memorandum
This report is intended solely for the clients and employees of Hamilton Lane. It contains confidential and proprietary Hamilton Lane information. This presentation is not an offer to sell, or a solicitation of any offer
to buy, any security or to enter into any agreement with Hamilton Lane or any of its affiliates.
6
Recommendation
Approved

HarbourVest/State of Connecticut Private Credit Mandate
Meeting Memorandum
This report is intended solely for the clients and employees of Hamilton Lane. It contains confidential and proprietary Hamilton Lane information. This presentation is not an offer to sell, or a solicitation of any offer
to buy, any security or to enter into any agreement with Hamilton Lane or any of its affiliates.
7
Appendix Management Fee: 0.3% of invested capital stepping down by 20% annually after year 5 Carried Interest: 5% Preferred Return: 5%

HarbourVest/State of Connecticut Private Credit Mandate
Meeting Memorandum
This report is intended solely for the clients and employees of Hamilton Lane. It contains confidential and proprietary Hamilton Lane information. This presentation is not an offer to sell, or a solicitation of any offer
to buy, any security or to enter into any agreement with Hamilton Lane or any of its affiliates.
8
Important Disclosures All information contained within this report has been gathered from sources believed to be reliable, including but not limited to the general partner(s), other industry participants and the Hamilton Lane Investment Database, but its accuracy cannot be guaranteed. The information contained in this report may include forward-looking statements regarding the fund presented or its portfolio companies. Forward-looking statements include a number of risks, uncertainties and other factors beyond the control of the fund or the portfolio companies, which may result in material differences in actual results, performance or other expectations. The opinions, estimates and analyses reflect our current judgment, which may change in the future. The past performance information contained in this report is not necessarily indicative of future results and there is no assurance that the fund will achieve comparable results or that it will be able to implement its investment strategy or achieve its investment objectives. The actual realized value of currently unrealized investments will depend on a variety of factors, including future operating results, the value of the assets and market conditions at the time of disposition, any related transaction costs and the timing and manner of sale, all of which may differ from the assumptions and circumstances on which the current unrealized valuations are based. Any tables, graphs or charts relating to past performance included in this report are intended only to illustrate the performance of the fund or the portfolio companies referred to for the historical periods shown. Such tables, graphs and charts are not intended to predict future performance and should not be used as the basis for an investment decision. By accepting receipt of this investment report and in consideration of access to the information contained herein (together with the investment report, the “Confidential Information”), the recipient agrees to maintain the strict confidentiality of any and all Confidential Information in accordance with the terms of this paragraph. The recipient acknowledges that (i) the Confidential Information constitutes proprietary trade secrets, and (ii) disclosure of any Confidential Information may cause significant harm to Hamilton Lane Advisors, L.L.C. (“Hamilton Lane”), its affiliates or any of their respective businesses. Unless otherwise required by law, the recipient shall not disclose any Confidential Information to any third party. If required by law to disclose any Confidential Information, the recipient shall provide Hamilton Lane with prompt written notice of such requirement prior to any such disclosure so that Hamilton Lane may seek a protective order or other appropriate remedy. Prior to making any disclosure of any Confidential Information required by law, the recipient shall use its reasonable best efforts to claim any potential exemption to such requirement and otherwise shall limit disclosure only to such information that is necessary to comply with such requirement. The calculations contained in this document are made by Hamilton Lane based on information provided by the general partner (e.g. cash flows and valuations), and have not been prepared, reviewed or approved by the general partner. Stacked bar charts or pie charts presented in the Strategy section in this report may not equate to 100% per the data labels on the charts due to rounding; however, all stacked bar charts and pie charts equate to 100% using exact proportions.

HarbourVest/State of Connecticut Private Credit Mandate
Meeting Memorandum
This report is intended solely for the clients and employees of Hamilton Lane. It contains confidential and proprietary Hamilton Lane information. This presentation is not an offer to sell, or a solicitation of any offer
to buy, any security or to enter into any agreement with Hamilton Lane or any of its affiliates.
9
Definitions Benchmark Analysis: An analysis which compares the net IRR of the prior funds to the top-quartile net IRR
benchmarks for similar funds (based on strategy and vintage) as reported by the Hamilton Lane database. The benchmark data shown is the most recent data available at this time
DPI: Distributed-to-Paid In = (Amount of Distributions Received)/(Total Amount of Capital Paid-In)
ESG: Environmental, Social and Governance Gross IRR: Internal Rate of Return (“IRR”) of investments at the ‘fund level’, excludes fees paid by LPs to
the General Partner such as management fees and carried interest. For investments held less than one year, Hamilton Lane nominalizes the IRR to match the hold period of the investment, in order to represent a more meaningful number
Investment Pacing: An analysis of the total capital invested during the given years. Includes all prior investments, realized or unrealized
J-Curve Benchmark: Peer (median by age) is calculated by taking the median IRR of similar funds (based on strategy and vintage) in Hamilton Lane’s database at each quarter, which are simulated as investing at the same point of time. The length of time to break the J-curve is calculated from inception to the first time each fund generated a positive net IRR
Loss Ratio Analysis: An analysis of the capital invested in realized transactions generating different multiples of invested capital
Net IRR: Annualized Internal Rate of Return (“IRR”) of investments at the ‘LP level’, inclusive of fees such as management fees and carried interest paid to the General Partner
Net Returns to Limited Partners:
The performance of the General Partner’s prior investment vehicles at the net LP level, inclusive of all fees, carried interest and expenses. Performance data is as reported by the General Partner, using actual capital contributions, distributions and net asset value for either all limited partners, or a sample set of limited partners, in the respective funds
Outlier Analysis: An analysis of the gross returns of investments in prior funds, comparing overall performance against the performance when certain ‘outlier’ transactions are excluded. Outliers are defined as transactions which generate exceptionally positive or negative results
PME Analysis: Calculated by taking the fund monthly cash flows and investing them in the relevant Total Return Index (where all dividends are re-invested). Contributions were scaled by a factor such that the ending portfolio balance would be equal to the private equity net asset value (equal ending exposures for both portfolios). This prevents shorting of the public market equivalent portfolio in order to match the performance of an outperforming private equity portfolio. Distributions were not scaled by this factor. The IRRs were then calculated based off of these adjusted cash flows. The selected PME represents the most relevant public market benchmark
Realized Attribution Analysis: Analysis of the capital invested in, and performance of, the prior realized transactions according to the criteria indicated
Realized Investments: Hamilton Lane classifies investments as ‘realized’ if it has i) an unrealized value of less than 20% of the total value; ii) a carrying value that has been written to zero or has been previously written-off; or iii) been fully exited and the GP has no remaining interest in the company
RVPI: Remaining Value-to-Paid In = (Current Net Asset Value)/(Total Amount of Capital Paid-In)
TVPI: Total Value-to-Paid In = (Amount of Distributions Received + Current Net Asset Value)/(Total Amount of Capital Paid-In)
Time-zero IRR: Represents the gross IRR calculated as if every investment was initiated on the same date
Write-Down Ratio: The ratio of capital invested in realized investments that have been sold for a value that is less than 1.0x their original cost basis, divided by the total capital invested in all realized investments
Write-Off Ratio: The ratio of capital invested in realized investments that have been sold for a value that is less than 0.5x their original cost basis, divided by the total capital invested in all realized investments

HarbourVest/State of Connecticut Private Credit Mandate
Meeting Memorandum
This report is intended solely for the clients and employees of Hamilton Lane. It contains confidential and proprietary Hamilton Lane information. This presentation is not an offer to sell, or a solicitation of any offer
to buy, any security or to enter into any agreement with Hamilton Lane or any of its affiliates.
10
Contact Information Philadelphia (Headquarters) Seven Tower Bridge 110 Washington Street Suite 1300 Conshohocken, PA 19428 USA +1 610 934 2222
London 8-10 Great George Street London SW1P 3AE United Kingdom +44 (0) 207 340 0100
San Francisco 201 California Street, Suite 550 San Francisco, CA 94111 USA +1 415 365 1056
Tel Aviv 6 Hahoshlim Street Building C 7th Floor Hertzelia Pituach, 4672201 P.O. Box 12279 Israel +00 972-73-2716610
Denver 4600 South Syracuse Street Denver, CO 80327 +1 866 361 1720
Miami 999 Brickell Avenue Suite 720 Miami, Florida 33131 USA +1 954 745 2780
Scranton 32 Scranton Office Park Suite 101 Moosic, PA 18507 USA +570 247 3739
Tokyo 13F, Marunouchi Bldg 2-4-1, Marunouchi Chiyoda-ku Tokyo 100-6313, Japan +81 (0) 3 5860 3940
Frankfurt Schillerstr. 12 60313 Frankfurt am Main Germany +49 89 954 537901
New York 610 Fifth Avenue, Suite 401 New York, NY 10020 USA +1 212 752 7667
Seoul 12F, Gangnam Finance Center 152 Teheran-ro, Gangnam-gu Seoul 06236 Republic of Korea +82 2 6191 3200
Toronto 150 King St. West Suite 200 Toronto, Ontario Canada M5H 1J9 +1 647 715 9457
Hong Kong Room 1001-3, 10th Floor St. George’s Building 2 Ice House Street Central Hong Kong, China +852 3987 7191
Portland 15350 SW Sequoia Pkwy Suite 260 Portland, OR 97224 USA +1 503 624 9910
Singapore 12 Marina View Asia Square Tower 2, Suite 26-04 Singapore, 018961 +65 6856 0920
Las Vegas 3753 Howard Hughes Parkway Suite 200 Las Vegas, NV 89169 USA +1 702 784 7690
San Diego 7817 Ivanhoe Avenue Suite 310 La Jolla, CA 92037 USA +1 858 410 9967
Sydney Level 33, Aurora Place 88 Philip Street Sydney, NSW 2000 Australia +61 2 9293 7950

HarbourVest/State of Connecticut Co-Investment Mandate
Meeting Memorandum
This report is intended solely for the clients and employees of Hamilton Lane. It contains confidential and proprietary Hamilton Lane information. This presentation is not an offer to sell, or a solicitation of any offer
to buy, any security or to enter into any agreement with Hamilton Lane or any of its affiliates.
1
Meeting Details Meeting Date: 7/30/21
GP Attendees: Peter Lipson, Craig MacDonald, Karen Simeone, Jackie Peradotto, Lee Incandela and Fran Peters
HL Attendees: Katie Moore, Sean Barber and Jesten Jacob Meeting Conclusions
HarbourVest is well-positioned to execute on the mandate due to its significant private equity investment capabilities and deal flow from its established co-investment operations. The General Partner maintains the relevant experience of managing customized co-investment programs for large institutions, including public pension plans. The senior investment team is sizable and tenured, ensuring a thorough diligence process and consistent strategy execution. HarbourVest has expanded its global footprint through the opening of Singapore and Frankfurt offices, which help to facilitate deal flow.
The General Partner intends to deploy a flexible approach to construct a diversified co-investment portfolio across lead managers, strategies, industries and geographies. HarbourVest estimates that 50% of the co-investment transactions will be generated via deal flow directed to Connecticut Retirement Plans and Trust Funds (“CRPTF”) from managers within its Private Investment Fund portfolio; the remaining 50% of deal flow is expected to be sourced through the HarbourVest platform and allocated to the co-investment mandate through the General Partner's detailed allocation process.
HarbourVest has generated attractive gross and net returns across recent co-investment funds, driven by select value drivers in each vintage.
Fund Information General Partner: HarbourVest Partners, LLC (“General Partner”), (“HarbourVest”) Fund: State of Connecticut Private Equity Co-Investment Separate Account
(“Fund”) Target Size: $450 million Investment Period: 3 years Fund Term: 10 years GP Commitment: 1.0%
The Fund is a separately managed account for State of Connecticut’s Private Equity co-investment program.
The management fees and carried interested negotiated are competitive in the market.

HarbourVest/State of Connecticut Co-Investment Mandate
Meeting Memorandum
This report is intended solely for the clients and employees of Hamilton Lane. It contains confidential and proprietary Hamilton Lane information. This presentation is not an offer to sell, or a solicitation of any offer
to buy, any security or to enter into any agreement with Hamilton Lane or any of its affiliates.
2
Strategy Asset Class: Private equity Strategy: Co-investment Substrategy: Buyout; growth equity # of Investments: Approximately 15 per year Enterprise Values: Varied Inv. Size Range: $5 million to $15 million Geography: North America, Europe and Asia Industries: Diversified
HarbourVest expects to construct a co-investment portfolio diversified by lead managers, strategies, industries and geographies.
o The General Partner has developed deep relationships with distinguished sponsors, enabling extensive coverage of potential investment opportunities.
o HarbourVest remains industry agnostic and will limit exposure to a single industry to 20% to 30%.
o The General Partner seeks to invest over 50% of capital in North America and the remaining in Europe and Asia.
While HarbourVest has full discretion over the mandate, the General Partner intends to work with the CRPTF in a transparent manner and in terms of deal sourcing.
o The General Partner expects 50% of deal flow to be sourced by HarbourVest and 50% by the managers in the CRPTF’s Private Investment Fund portfolio.
The General Partner plans to leverage its Portfolio Construction Committee and internal software to determine the allocation of investments across funds and separately managed accounts; allocation is expected to be done in a formulaic, consistent and fair approach.
o Co-investment opportunities specifically directed to State of Connecticut will be 100% allocated to State of Connecticut, subject to portfolio construction parameters.
Post-investment, HarbourVest remains active in company monitoring and management, despite being selective in taking board seats in portfolio companies.

HarbourVest/State of Connecticut Co-Investment Mandate
Meeting Memorandum
This report is intended solely for the clients and employees of Hamilton Lane. It contains confidential and proprietary Hamilton Lane information. This presentation is not an offer to sell, or a solicitation of any offer
to buy, any security or to enter into any agreement with Hamilton Lane or any of its affiliates.
3
Organization Firm Inception: 1978 Locations: Boston (headquarters), Beijing, Bogota, Dublin, Frankfurt, Hong Kong,
London, Seoul, Singapore, Tel Aviv, Tokyo and Toronto Formal ESG Policy: Yes PRI Signatory: Yes Investment Team: 61 investment professionals; 9 Managing Directors, 10 Principals, 14 Vice
Presidents, 7 Senior Associates and 21 Associates Additional Resources: The broader HarbourVest platform Direct Co-Investments Team
As of 3/31/21, the General Partner had $76.2 billion of assets under management across the various HarbourVest strategies.
HarbourVest has built on-the-ground relationships to facilitate deal flow and enhance deal execution.
o The General Partner has gradually expanded its presence globally, having recently opened a Singapore office in May 2021 and a Frankfurt office in July 2021.
The direct investment committee is comprised of Messrs. Lipson, Rogers, Lane, du Roy, Stento and Yap; decisions are made on a consensus approach.
o Greg Stento is a Managing Director in the Primary Partnerships team.
o Once the direct investment committee approves an investment, the opportunity will subsequently go to the Portfolio Construction Committee to determine ultimate position sizing and portfolio fit.
The Portfolio Construction Committee is comprised of two Managing Directors and the CCO Bill Royer as a non-voting, adjunct member and advisor.
The General Partner is committed to responsible investing with a dedicated ESG Council and Diversity and Inclusion Council.
Name Title Business Focus LocationTot. Exp.
(yrs.)Tenure(yrs.)
Educational Background
Peter Lipson Managing Director Direct Co-Investments/Private Credit
Boston 25 24 ● Salomon Brothers, Analyst ●
●
●
Harvard Business School (MBA)University of Virginia (MS)University of California, San Diego (BA)
Alex Rogers Managing Director Direct Co-Investments Boston 23 23 ● McKinsey & Company ●
●
Harvard Business School (MBA)Duke University (BA)
Ian Lane Managing Director Direct Co-Investments Boston 21 18 ● JP Morgan, Analyst ●
●
Harvard Business School (MBA)University of Florida (BS) (MS)
Corentin du Roy Managing Director Direct Co-Investments London 21 18 ● AXA Investment Managers, Analyst ● Paris IX Dauphine University (BS)
Craig MacDonald Managing Director Direct Co-Investments Dublin 19 16 ●
●
Morgan Stanley, AnalystCitigroup, Analyst
● University of North Carolina, Chapel Hill (BA)
Kelvin Yap Managing Director Direct Co-Investments/Fund Investment
Hong Kong/Singapore
19 15 ●
●
Deloitte, ManagerPwC, Senior Associate
● Monash University (BC)
Seth Palmer Managing Director Direct Co-Investments Boston 16 3 ●
●
●
BlackRock, DirectorWeston Presidio, AssociateBanc of Amerca Securities
●
●
Harvard Business School (MBA)University of Michigan (BA)
Experience of Investment Professionals
Prior Experience

HarbourVest/State of Connecticut Co-Investment Mandate
Meeting Memorandum
This report is intended solely for the clients and employees of Hamilton Lane. It contains confidential and proprietary Hamilton Lane information. This presentation is not an offer to sell, or a solicitation of any offer
to buy, any security or to enter into any agreement with Hamilton Lane or any of its affiliates.
4
Track Record
Net Returns
Gross Returns
Recent vintages (Co-Investment Funds IV and V) have performed well with top-quartile performance on a net IRR basis, while more mature vintages (2004, 2007 and 2013 Direct Funds) have lagged top-quartile peers.
Early outperformance in Co-Investment Funds IV and V has been driven by two transactions.
o As of 6/30/21, Co-Investment Fund IV was 84% called and 101% committed.
o As of 6/30/21, Co-Investment Fund V was 72% called and 98% committed.
HarbourVest began managing co-investment separately managed accounts in 2011 and has deployed $9.5 billion in co-investment SMA capital across 347 investments.
o In aggregate, as of 12/31/20, the SMAs have generated a gross realized IRR of 32.8% and a gross realized multiple of 2.5x.
HarbourVest Partners HL Benchmark PME Benchmark
Prior Investment Performance1 Buyout Russell 3000 TR
As of 3/31/21 As of 3/31/21 As of 3/31/21
($mm)
2004 Direct Fund 2004 $350 $346.5 $615.2 $33.0 1.8x 1.9x 10.8% 1.8x 1.8x 16.8% 5.1%
2007 Direct Fund 2007 734 710.3 1,174.9 32.0 1.7x 1.7x 10.2% 1.9x 2.0x 15.7% 11.0%
2013 Direct Fund 2013 1,010 967.7 1,353.4 620.4 1.4x 2.0x 19.2% 1.1x 2.0x 22.1% 13.3%
Co-Investment Fund IV 2016 1,768 1,467.3 483.9 2,404.9 0.3x 2.0x 23.7% 0.5x 1.7x 21.8% 16.1%
Co-Investment Fund V 2018 3,030 2,159.9 0.0 3,507.6 0.0x 1.6x 70.5% 0.2x 1.5x 31.8% 32.1%
Total $5,651.8 $3,627.5 $6,597.9 0.6x 1.8x 16.5% 12.2%1 Capital Draw n, Capital Distributed and NAV are calculated from the cash f low s of fee paying limited partners and excludes any cash f low s from the General Partner's commitment
PMEIRRFund DPI TVPI
NetIRR
Vintage Fund Size Capital Drawn
Capital Distributed
NAV DPI TVPINetIRR
Top-Quartile
HarbourVest Partners
Prior Investment Performance
As of 3/31/21
($mm)
Fund Total Real.
2004 Direct Fund 2004 25 24 $350 $368.1 $699.2 $36.0 2.0x 13.1%
2007 Direct Fund 2007 35 32 734 749.5 1,330.4 26.5 1.8x 12.4%
2013 Direct Fund 2013 30 17 1,010 1,026.3 1,569.1 684.2 2.2x 22.6%
Co-Investment Fund IV 2016 40 5 1,768 1,742.1 777.9 2,651.7 2.0x 25.6%
Co-Investment Fund V 2018 43 1 3,030 2,398.2 228.6 3,817.9 1.7x 53.3%
Total 173 79 $6,284.1 $4,605.1 $7,216.2 1.9x 18.6%
Vintage# of Inv.
Fund SizeAmount Invested
Amount Realized
UnrealizedValue
GrossMult.
Gross IRR
HarbourVest Partners HarbourVest Partners
Realized Investment Performance Unrealized Investment Performance
As of 3/31/21 As of 3/31/21
($mm) ($mm)
Fund Fund
2004 Direct Fund $343.2 $699.0 $0.1 2.0x 14.2% 2004 Direct Fund $25.0 $0.1 $35.9 1.4x 2.7%
2007 Direct Fund 700.8 1,320.4 2.3 1.9x 13.4% 2007 Direct Fund 48.7 10.0 24.2 0.7x -3.9%
2013 Direct Fund 559.8 1,302.4 17.5 2.4x 28.9% 2013 Direct Fund 466.5 266.7 666.7 2.0x 15.6%
Co-Investment Fund IV 242.9 467.2 1.8 1.9x 30.1% Co-Investment Fund IV 1,499.2 310.7 2,649.9 2.0x 24.9%
Co-Investment Fund V 9.9 9.8 0.0 1.0x -0.6% Co-Investment Fund V 2,388.3 218.7 3,817.9 1.7x 53.4%
Total $1,856.5 $3,798.9 $21.7 2.1x 16.3% Total $4,427.7 $806.2 $7,194.5 1.8x 23.2%
Gross Mult.
Gross IRR
Gross Mult.
Gross IRR
Amount Invested
AmountRealized
UnrealizedValue
UnrealizedValue
Amount Invested
AmountRealized

HarbourVest/State of Connecticut Co-Investment Mandate
Meeting Memorandum
This report is intended solely for the clients and employees of Hamilton Lane. It contains confidential and proprietary Hamilton Lane information. This presentation is not an offer to sell, or a solicitation of any offer
to buy, any security or to enter into any agreement with Hamilton Lane or any of its affiliates.
5
The General Partner has generated a dispersion of returns profile in line with buyout peers.
Only one deal in Co-Investment Fund V has been realized; the investment is a North American growth equity deal in the communication services sector.
HarbourVest has gradually increased its deployment pace across vintages, reflecting the increase in transaction sizes and fund sizes.
The General Partner has deployed an average of $1.1 billion per year from 2018 to 2020.

HarbourVest/State of Connecticut Co-Investment Mandate
Meeting Memorandum
This report is intended solely for the clients and employees of Hamilton Lane. It contains confidential and proprietary Hamilton Lane information. This presentation is not an offer to sell, or a solicitation of any offer
to buy, any security or to enter into any agreement with Hamilton Lane or any of its affiliates.
6
Recommendation
Approved

HarbourVest/State of Connecticut Co-Investment Mandate
Meeting Memorandum
This report is intended solely for the clients and employees of Hamilton Lane. It contains confidential and proprietary Hamilton Lane information. This presentation is not an offer to sell, or a solicitation of any offer
to buy, any security or to enter into any agreement with Hamilton Lane or any of its affiliates.
7
Appendix Option A Management Fee: 0.47% of invested capital stepping down by 20% annually after year 5 Carried Interest: 6.25% Preferred Return: 8% Option B Management Fee: 0.47% of invested capital stepping down by 20% annually after year 5 Carried Interest: 5.00% Preferred Return: No preferred return
Hamilton Lane completed a scenario analysis using an internal model to determine estimated carry savings assuming:
o CRPTF’s selection of Option A or Option B.
o The Hamilton Lane model assumes a 20% gross return, with a 15-year life.
o The model assumed $150 million invested into co-investments annually for three years; total allocation of $450 million.
Conclusions:
o While Option B starts to pay carried interest earlier, the total estimated amount paid in carried interest is less than Option A.
o For CT to pay more in carried interest by selection Option B, it would mean that HarbourVest would have to generate a return not in line with those assumed when investing in private equity co-investments.
o Over a 15-year assumed life, carried interest paid when selecting Option A is estimated to be over $7.0 million higher than carried interest paid in Option B.
Disclosure: Hamilton Lane is not projecting performance for the HarbourVest co-investment program. HarbourVest’s deployment of the SMA and ultimately the performance that HarbourVest generates as General Partner will affect the outcome in terms of total dollars paid in carried interest versus the estimates provided above.

HarbourVest/State of Connecticut Co-Investment Mandate
Meeting Memorandum
This report is intended solely for the clients and employees of Hamilton Lane. It contains confidential and proprietary Hamilton Lane information. This presentation is not an offer to sell, or a solicitation of any offer
to buy, any security or to enter into any agreement with Hamilton Lane or any of its affiliates.
8
Important Disclosures All information contained within this report has been gathered from sources believed to be reliable, including but not limited to the general partner(s), other industry participants and the Hamilton Lane Investment Database, but its accuracy cannot be guaranteed. The information contained in this report may include forward-looking statements regarding the fund presented or its portfolio companies. Forward-looking statements include a number of risks, uncertainties and other factors beyond the control of the fund or the portfolio companies, which may result in material differences in actual results, performance or other expectations. The opinions, estimates and analyses reflect our current judgment, which may change in the future. The past performance information contained in this report is not necessarily indicative of future results and there is no assurance that the fund will achieve comparable results or that it will be able to implement its investment strategy or achieve its investment objectives. The actual realized value of currently unrealized investments will depend on a variety of factors, including future operating results, the value of the assets and market conditions at the time of disposition, any related transaction costs and the timing and manner of sale, all of which may differ from the assumptions and circumstances on which the current unrealized valuations are based. Any tables, graphs or charts relating to past performance included in this report are intended only to illustrate the performance of the fund or the portfolio companies referred to for the historical periods shown. Such tables, graphs and charts are not intended to predict future performance and should not be used as the basis for an investment decision. By accepting receipt of this investment report and in consideration of access to the information contained herein (together with the investment report, the “Confidential Information”), the recipient agrees to maintain the strict confidentiality of any and all Confidential Information in accordance with the terms of this paragraph. The recipient acknowledges that (i) the Confidential Information constitutes proprietary trade secrets, and (ii) disclosure of any Confidential Information may cause significant harm to Hamilton Lane Advisors, L.L.C. (“Hamilton Lane”), its affiliates or any of their respective businesses. Unless otherwise required by law, the recipient shall not disclose any Confidential Information to any third party. If required by law to disclose any Confidential Information, the recipient shall provide Hamilton Lane with prompt written notice of such requirement prior to any such disclosure so that Hamilton Lane may seek a protective order or other appropriate remedy. Prior to making any disclosure of any Confidential Information required by law, the recipient shall use its reasonable best efforts to claim any potential exemption to such requirement and otherwise shall limit disclosure only to such information that is necessary to comply with such requirement. The calculations contained in this document are made by Hamilton Lane based on information provided by the general partner (e.g. cash flows and valuations), and have not been prepared, reviewed or approved by the general partner. Stacked bar charts or pie charts presented in the Strategy section in this report may not equate to 100% per the data labels on the charts due to rounding; however, all stacked bar charts and pie charts equate to 100% using exact proportions.

HarbourVest/State of Connecticut Co-Investment Mandate
Meeting Memorandum
This report is intended solely for the clients and employees of Hamilton Lane. It contains confidential and proprietary Hamilton Lane information. This presentation is not an offer to sell, or a solicitation of any offer
to buy, any security or to enter into any agreement with Hamilton Lane or any of its affiliates.
9
Definitions Benchmark Analysis: An analysis which compares the net IRR of the prior funds to the top-quartile net IRR
benchmarks for similar funds (based on strategy and vintage) as reported by the Hamilton Lane database. The benchmark data shown is the most recent data available at this time
DPI: Distributed-to-Paid In = (Amount of Distributions Received)/(Total Amount of Capital Paid-In)
ESG: Environmental, Social and Governance Gross IRR: Internal Rate of Return (“IRR”) of investments at the ‘fund level’, excludes fees paid by LPs to
the General Partner such as management fees and carried interest. For investments held less than one year, Hamilton Lane nominalizes the IRR to match the hold period of the investment, in order to represent a more meaningful number
Investment Pacing: An analysis of the total capital invested during the given years. Includes all prior investments, realized or unrealized
J-Curve Benchmark: Peer (median by age) is calculated by taking the median IRR of similar funds (based on strategy and vintage) in Hamilton Lane’s database at each quarter, which are simulated as investing at the same point of time. The length of time to break the J-curve is calculated from inception to the first time each fund generated a positive net IRR
Loss Ratio Analysis: An analysis of the capital invested in realized transactions generating different multiples of invested capital
Net IRR: Annualized Internal Rate of Return (“IRR”) of investments at the ‘LP level’, inclusive of fees such as management fees and carried interest paid to the General Partner
Net Returns to Limited Partners:
The performance of the General Partner’s prior investment vehicles at the net LP level, inclusive of all fees, carried interest and expenses. Performance data is as reported by the General Partner, using actual capital contributions, distributions and net asset value for either all limited partners, or a sample set of limited partners, in the respective funds
Outlier Analysis: An analysis of the gross returns of investments in prior funds, comparing overall performance against the performance when certain ‘outlier’ transactions are excluded. Outliers are defined as transactions which generate exceptionally positive or negative results
PME Analysis: Calculated by taking the fund monthly cash flows and investing them in the relevant Total Return Index (where all dividends are re-invested). Contributions were scaled by a factor such that the ending portfolio balance would be equal to the private equity net asset value (equal ending exposures for both portfolios). This prevents shorting of the public market equivalent portfolio in order to match the performance of an outperforming private equity portfolio. Distributions were not scaled by this factor. The IRRs were then calculated based off of these adjusted cash flows. The selected PME represents the most relevant public market benchmark
Realized Attribution Analysis: Analysis of the capital invested in, and performance of, the prior realized transactions according to the criteria indicated
Realized Investments: Hamilton Lane classifies investments as ‘realized’ if it has i) an unrealized value of less than 20% of the total value; ii) a carrying value that has been written to zero or has been previously written-off; or iii) been fully exited and the GP has no remaining interest in the company
RVPI: Remaining Value-to-Paid In = (Current Net Asset Value)/(Total Amount of Capital Paid-In)
TVPI: Total Value-to-Paid In = (Amount of Distributions Received + Current Net Asset Value)/(Total Amount of Capital Paid-In)
Time-zero IRR: Represents the gross IRR calculated as if every investment was initiated on the same date
Write-Down Ratio: The ratio of capital invested in realized investments that have been sold for a value that is less than 1.0x their original cost basis, divided by the total capital invested in all realized investments
Write-Off Ratio: The ratio of capital invested in realized investments that have been sold for a value that is less than 0.5x their original cost basis, divided by the total capital invested in all realized investments
HarbourVest/State of Connecticut Co-Investment Mandate
Meeting Memorandum
This report is intended solely for the clients and employees of Hamilton Lane. It contains confidential and proprietary Hamilton Lane information. This presentation is not an offer to sell, or a solicitation of any offer
to buy, any security or to enter into any agreement with Hamilton Lane or any of its affiliates.
10
Contact Information Philadelphia (Headquarters) Seven Tower Bridge 110 Washington Street Suite 1300 Conshohocken, PA 19428 USA +1 610 934 2222
London 8-10 Great George Street London SW1P 3AE United Kingdom +44 (0) 207 340 0100
San Francisco 201 California Street, Suite 550 San Francisco, CA 94111 USA +1 415 365 1056
Tel Aviv 6 Hahoshlim Street Building C 7th Floor Hertzelia Pituach, 4672201 P.O. Box 12279 Israel +00 972-73-2716610
Denver 4600 South Syracuse Street Denver, CO 80327 +1 866 361 1720
Miami 999 Brickell Avenue Suite 720 Miami, Florida 33131 USA +1 954 745 2780
Scranton 32 Scranton Office Park Suite 101 Moosic, PA 18507 USA +570 247 3739
Tokyo 13F, Marunouchi Bldg 2-4-1, Marunouchi Chiyoda-ku Tokyo 100-6313, Japan +81 (0) 3 5860 3940
Frankfurt Schillerstr. 12 60313 Frankfurt am Main Germany +49 89 954 537901
New York 610 Fifth Avenue, Suite 401 New York, NY 10020 USA +1 212 752 7667
Seoul 12F, Gangnam Finance Center 152 Teheran-ro, Gangnam-gu Seoul 06236 Republic of Korea +82 2 6191 3200
Toronto 150 King St. West Suite 200 Toronto, Ontario Canada M5H 1J9 +1 647 715 9457
Hong Kong Room 1001-3, 10th Floor St. George’s Building 2 Ice House Street Central Hong Kong, China +852 3987 7191
Portland 15350 SW Sequoia Pkwy Suite 260 Portland, OR 97224 USA +1 503 624 9910
Singapore 12 Marina View Asia Square Tower 2, Suite 26-04 Singapore, 018961 +65 6856 0920
Las Vegas 3753 Howard Hughes Parkway Suite 200 Las Vegas, NV 89169 USA +1 702 784 7690
San Diego 7817 Ivanhoe Avenue Suite 310 La Jolla, CA 92037 USA +1 858 410 9967
Sydney Level 33, Aurora Place 88 Philip Street Sydney, NSW 2000 Australia +61 2 9293 7950

Connecticut Retirement Plans & Trust Funds
September I 2021

CONFIDENTIAL 2
HarbourVest representatives
IAN LANE, Managing Director, HarbourVest Partners, LLC (Boston)Ian Lane joined HarbourVest in 2003 and focuses on direct co-investments in venture, buyout, and mezzanine transactions and serves as the Chair of the Firm’s Direct Investment Committee. He led several of the Firm’s investments, including Acclaris, Advanced Health, Datatel, Digital Insight, eTapestry, Lightower, M-Qube, National Cardiovascular Partners, Nexidia, Planview, Secure-24, Wayfair (NYSE: W), and Zayo (NYSE: ZAYO). Additionally, Ian serves on the Board of Overseers at Beth Israel Deaconess Medical Center, a teaching and research affiliate of Harvard Medical School. Ian’s previous experience includes two years with J.P. Morgan where he was an investment banking analyst in the mergers and acquisitions group. While earning his undergraduate degree, Ian founded and managed a chain of martial arts schools in Florida. Ian received a dual BS/MS (with honors) in Accounting from the University of Florida in 2001 and an MBA from Harvard Business School, where he graduated with distinction in 2008
JACKIE PERADOTTO, Principal, HarbourVest Partners, LLC (Boston)Jackie Peradotto joined HarbourVest in 2009. She left the Firm to attend business school and rejoined HarbourVest’s directinvestment team in 2014 after completing her MBA. Jackie focuses on sourcing, reviewing, executing, and monitoring directco-investments, primarily in the healthcare industry. She serves as a board member at Comprehensive Pharmacy Services(CPS) and Dentistry for Children (D4C), and formerly served as a board member of Five Star Food Service. Jackie hasplayed a key role on several deals including Advance Health, Aldevron, Cambrex, CareCentrix, MedOptions, MultiPlan,Press Ganey, and Vetsource. Jackie’s previous experience includes three years with Morgan Stanley, where she was aninvestment banking analyst in the Global Power & Utility Group in New York and the Corporate Finance Group in SanFrancisco. Her prior experience also includes a position at McKesson Corporation. She received an AB in Molecular Biologyfrom Princeton University in 2006 and an MBA in Health Care Management (with honors) from the Wharton School at theUniversity of Pennsylvania in 2014.
FRAN PETERS, CFA, CAIA, Principal, Investor Relations, HarbourVest Partners, LLC (Boston)Fran Peters joined HarbourVest’s investor relations team in 2015. He focuses on coordinating, monitoring, and enhancingrelationships with new and existing investors and consultants. Fran joined the Firm from Meketa Investment Group, where heserved as the lead consultant on defined benefit, health and welfare, endowment and insurance funds, with public, Taft-Hartley, and not-for-profit plan sponsors. He was also a member of the firm’s Investment Policy Committee, as well as thefirm’s ESG and Marketing Committees. Prior to Meketa, he was a client account manager at ING Financial Advisers, wherehe worked with Massachusetts public employees. Fran received a BS in Business Administration from the University of NewHampshire in 1999 and an MBA in Finance from the University of Massachusetts, Boston in 2005. He holds the CharteredFinancial Analyst (CFA) and the Chartered Alternative Investment Analyst (CAIA) designations and is a member of the CFAInstitute, the Boston Security Analysts Society, and the CAIA Association.

CONFIDENTIAL 3
Table of contents
Intended for use with institutional and qualified investors only. This document contains confidential and proprietary informa tion and should not be disseminated without express written consent from HarbourVest.
These materials do not constitute an offer to sell or the solicitation of an offer to buy interests in any fund or any other investment product sponsored by HarbourVest Partners L.P. or its affiliates (“HarbourVest”), hereafter
referred to as the “Fund”. Any offering of interests in the Fund will be made by means of delivery of a confidential Private Placement Memorandum or similar materials that contain a description of the material terms of such
investment and subscriptions will be accepted solely pursuant to definitive documentation. These materials do not purport to contain all the information relevant to evaluating an investment in the Fund. No sale will be made
in any jurisdiction in which the offer, solicitation, or sale is not authorized or to any person to whom it is unlawful to ma ke the offer, solicitation, or sale. Offers and sales of interests in the Fund will not be registered under the
laws of any jurisdiction and will be made solely to “ qualified purchasers” as defined in the U.S. Investment Company Act of 1 940, as amended. These materials are highly confidential and may not be reproduced or
redistributed in any format without the express written approval of HarbourVest. An investment in the Fund involves a high degree of risk and therefore should be undertaken only by prospective investors capable of
evaluating the risks of the Fund and bearing the risks such an investment represents. There can be no assurance that the Fund will be able to achieve its investment objectives or that the investors will receive a return on
their capital. For further legal and regulatory disclosures see ‘Additional Important Information’ at the end of these materi als.
I. HarbourVest Firm Overview
II. Co-Invest Platform
III. Custom Solutions
IV. Additional Information: Co-Investments
Appendix

CONFIDENTIAL
HARBOURVEST
SOLUTIONS
Experienced
Collaborative
Flexible
Analytical
35+ years of experience building comprehensive private markets solutions
Constructing and adapting portfolios in partnership with our clients
Diversified global platform allows for program adjustments as client objectives evolve
Leveraging data to improve investment results and enhance the client experience
Executive summary
4
CRPTF IS
SEEKING A
PARTNER WHO
CAN…
TODAY’S
MEETING
OBJECTIVES
WHAT WE WANT
YOU TO LEAVE
WITH
> Build a collaborative direct co-investment partnership that will allow the CRPTF to achieve
its goals
> Execute direct equity and credit co-investments generated by CRPTF and HarbourVest
GP relationships
> Deliver transparent and robust execution, providing a compelling experience to GPs
> Enable CRPTF to set key portfolio construction parameters and ensure the program is
consistent with the broader private equity and private credit portfolios and strategy
> Generate accretive returns to support the mission and beneficiaries of CRPTF
> Provide an overview and update of our platform, partnership philosophy, global
capabilities, and experience
> Discuss how we will integrate with CRPTF to support and achieve your objectives
> HarbourVest has a proven track record of successfully executing custom mandates
> We are dedicated to the success of this partnership, being an extension of your team,
and supporting your mission
> Together CRPTF and HarbourVest will create scale of capital, breadth and depth of
resources, and an unparalleled co-investment experience to deliver superior returns
As of August 26, 2021. This information has been prepared for discussion purposes only specifically for Connecticut Retirement Plans and Trust Funds (August 2021) and is based on our understanding of the client’s objectives.

CONFIDENTIAL
HARBOURVEST FIRM OVERVIEW

CONFIDENTIAL 6
HarbourVest at-a-glance
As of June 30, 2021
*Reflects committed capital from LPs for all active funds/accounts, excludes any funds / accounts that are in extension, liquidation, or fully liquidated.
25 yearsaverage industry
experience of managing directors
Strong track record
35+ years
950+ Managers
tracked
700+ colleagues
150+investment
professionals
900+advisory
board seats
$80.9
billiontotal AUMacross allstrategies*
Private
markets specialists in equity, credit,
and real assets
Expertisein primary,
secondary, direct co-investments, credit, and real
assets

CONFIDENTIAL 7
Global Scale – Our market coverage is broad and deep
As of June 30, 2021. Based on primary, secondary, and direct commitments made by HarbourVest since inception. Indica tes HarbourVest team location. *Singapore office opened May 2021. Frankfurt office opened
July 2021.
Seoul Beijing Toronto
Boston
Bogotá
Tel Aviv
Hong Kong
Tokyo
LondonDublin
Americas Asia PacificEMEA
Expertise Across Capital Structure (Equity and Debt) and Investment Types
PRIMARY INVESTMENTS SECONDARY & REAL ASSETS DIRECT – EQUITY & CREDIT
$48.4 billion committed $29.9 billion committed $23.5 billion committed
117Investment
Professionals
32Investment
Professionals
22Investment
Professionals
$62.9Billion
Committed
$29.0Billion
Committed
$9.9Billion
Committed
Singapore*
Frankfurt*

CONFIDENTIAL 8
ESG focus is embedded across the organization
The public version of HarbourVest’s 2020 PRI Transparency Report can be accessed at https://www.harbourvest.com/why-harbourvest/corporate-responsibility. To access the firm’s annual Private Transparency Report
and Assessment Report, please log on to HarbourVest’s secure investor log -in site at https://investor.harbourvest.com using your email address and password. Once logged in, go to the “News and Update” tab and select
“ Market Updates.”
We achieved certification in
2020 in accordance with
The CarbonNeutral Protocol,
the leading global framework
for carbon neutrality
CarbonNeutral® Company
z
HarbourVest PRI RatingsCore Program pillars
Integrate ESG factors into investment processes
Reflect values in policies and products
Provide transparency to stakeholders
Govern efforts through senior leadership
Foster GP adoption and support
ESG Category 2020 Score*
Strategy & Governance A+
Indirect Investments (Primary & Secondary) A+
Direct Investments A
▪ 12 members; multidisciplinary
▪ Provides firmwide support on ESG
strategy and policy implementation
Aligned Interests
Transparency
Performance
ESG Council

CONFIDENTIAL 9
*As of March 31, 2021. This figure represents $1.4B in emerging and diverse targeted SMA capital raised since joining Harbour Vest, and $1.9B in capital committed to similar vehicles managed by the team at BAML before
joining HarbourVest in February 2016. Commitment amounts reflect the aggregate commitments to primary, secondary, and direct co-investments since inception, and are presented net of leverage.
**As of December 31, 2020. Gender diversity is accounted for globally. Ethnic diversity data includes US employees only.
Committed to diversity and inclusion in all we do
Proud to support and participate in initiatives
that are changing the face of our industry
Industry Collaboration
▪ Established in 2019
▪ Group of senior leaders focused
on developing our D&I strategy
▪ Drives decisions, measures progress, implements related
policies and practices
Focus on diverse and emerging managers
Dedicated investment team with wide network
and established sourcing process
% of female and/or ethnically diverse staff**
57%
150+Opportunities reviewed annually
in this market segment
Capital managed or previously advised
on focused in this market segment*
Global
Team
Executive
Management
Senior
Leadership
Investment
Professionals
Adopting an intentional approach to diversity
Diversity & Inclusion Council
Targeted Investment Solutions
$3.3Billion
Diverse Workforce
39%
38%40%

CONFIDENTIAL
CO-INVEST PLATFORM

CONFIDENTIAL 11
Leader in building co-investment portfolios
As of March 31, 2021, unless otherw ise noted.
* Past performance is not a reliable indicator of future results. Gross model IRR is presented on a gross basis and reflects the performance of all co-inv estments made by the HarbourVest team in
the last 10 y ears across all HarbourVest-managed funds and accounts. The gross model IRR since inception (1983) is 17.5%. No inv estor receiv ed the gross model IRR. Actual performance
may differ substantially from the gross model IRR presented. Proceeds generated reflect gross realized proceeds from all partially and realized co-inv estments in this same univ erse. See
‘Additional Important Information’ at the end of the presentation, including important disclosures related to Gross Performance Returns, Model Performance, and Fees and Ex penses, and does
not reflect the management fees, carried interest, and other ex penses borne by inv estors, w hich would reduce returns. There can be no assurance that the actual inv estment activ ity of the Fund
w ill be consistent w ith these assumptions.
** As of December 31, 2020. Small/mid-market deals statistic represents percentage of deals rev iew ed in depth that has an enterprise v alue of $1.5 billion or less at the time of our rev iew .
§ Reflects all activ e general partner relationships across the HarbourVest platform as of June 30, 2021
†† As of June 30, 2021.
Strong, demonstrated model track record*
Focus on creating solutions for GPs Large, experienced global team
HARBOURVEST STRENGTHS
56 20average years of
MD experience
19.1%gross model
10-year IRR
investment
professionalsglobally††
730deals sourced
in LTM
68%small/mid-market
deals reviewed in LTM
$12.2 billion proceeds
generated since inception
Active deal-sourcing platform**
700+active GP
relationships§
1983 first co-investment
made

CONFIDENTIAL 12
Proven deal sourcing platform
* Last twelve months (“ LTM” ) data represents all equity co -investment deals sourced from January 1, 2020 to December 31, 2020. Past performance is not a reliable indicator of future results.
Industry Network
Access to the GP networks of our
global, diversified LP base
HarbourVest Platform
Relationships with 700+ GPs built
by our primary and secondary
investment teams
730 Deals sourced in LTM*
Proactive Sourcing
Systematic sourcing approach
with dedicated internal resources
Broad global platform, resulting in
meaningful deal flow

CONFIDENTIAL 13
Experienced direct co-investment team
As of June 30, 2021. * These individuals are focused on direct co-investments, as well as primary partnership investments, credi t investments, and/or investor relations.
Noel Lam
Sophia Maizel*
Megan Beecher*
TylerSmith
TikerenQuinn
MichaelGuiness
BrendanButler
IanLane
Kelv in Yap
JoelHwang
CraigMacDonald
CartusChan
Gonçalo Faria Ferreira
LennyLi
Jackie Peradotto
SethPalmer
JunyiZang
BensonWong
RuyinLiao
KarenChung
Stev eWong
Elliott Campbell
ThorneMichaels
Jonathan Sanford
RodrigoLameira
RachelWu
ManushaChereddy
ZacharyEagle
RichardSterndale
HoudaHamdouch
WilliamMorelli
Corentindu Roy
RyanJones
AlexanderMackinger
Dav id Krauser*
Caleb Morrison
PeterLipson*
AlexRogers
Dav idZug*
MattCheng
EU
RO
PE
AS
IA
NO
RT
H A
ME
RIC
A
AndreasKuzma
Laure Fournier
RyanWolfson
SeanCarolan
XirenHuang
JohnSchwartz
JackieHuang
ErikGarrigo
JosephMitrani
ShanPatel
MarieSmith
AbigailCough
JuliaBurke
LeorRadbil
CarolinaAlv es
JacobBjorklund

CONFIDENTIAL
HarbourVest’s private credit strategies are led by seasoned professionals
with broad market expertise
14
Experienced credit team
Team Member Prior Firms
Jamie AthanasoulasManaging Director25 years experience
Peter LipsonManaging Director23 years experience
Karen SimeoneManaging Director21 years experience
Lee IncandelaPrincipal14 years experience
Megan BeecherVice President10 years experience
Sean GillespieVice President8 years experience
Will HastenVice President11 years experience
Greg MazurVice President15 years experience
Private Credit Experience Across Cycles
> Pattern-recognition skills honed by actively
investing throughout multiple cycles
> Deep familiarity with all parts of managing debt
investments from sourcing and underwriting to restructuring and exit
Extensive Industry Networks
> Strong relationships with sponsors, lenders, and intermediaries that has the potential to drive
differentiated deal flow, enhancing HarbourVest’sprivate markets platform
Complementary Investment Capabilities
> Combined expertise across the entire capital structure
– Senior debt
– Junior debt
– Equity direct investments and co-investment
– Turnaround / restructuring
As of June 30, 2021

CONFIDENTIAL 21
Global direct co-investment performance by stage
Prepared for the exclusive use of State of Connecticut Retirement Plans and Trust Funds (August 2021). Not for distribution to third parties
For illustrative purposes only. As of March 31, 2021. Reflects all investments in HarbourVest’s Global Direct Co -Investment Track Record from January 1, 2004 (the year in which HarbourVest first launched its global direct-
co-investment commingled fund) through March 31, 2021 by stage of investment. This information is presented on a gross basis unl ess otherwise noted. Gross returns do not reflect the management fees, carried interest,
and other expenses borne by investors in the HarbourVest-managed funds/accounts, which will reduce returns. See ‘Additional Important Information’ at the end of the presentation, including important disclosures related to
Gross Performance Returns, Vintage Year, Model Portfolios, and Fees and Expenses. Past performance is not a reliable indicator of future results.
USD in Millions Buyout Growth Equity Credit / Other
All Investments
Number of Companies 239 108 52
Total Cost $10,337.5 $2,332.0 $863.2
Realized Value $7,388.7 $2,019.2 $557.6
Total Value $17,767.6 $5,837.1 $1,309.2
Realized Value / Total Cost 0.7x 0.9x 0.6x
Total Value / Total Cost 1.7x 2.5x 1.5x
Gross Portfolio IRR 17.3% 22.4% 22.8%
Realized Investments
Number of Companies 101 40 17
Total Cost $3,045.4 $663.9 $144.2
Realized Value $6,104.1 $1,527.8 $400.4
Total Value $6,136.4 $1,527.8 $400.4
Realized Value / Total Cost 2.0x 2.3x 2.8x
Total Value / Total Cost 2.0x 2.3x 2.8x
Gross Portfolio IRR 16.3% 19.1% 26.6%
As of March 31, 2021

CONFIDENTIAL
CUSTOM SOLUTIONS

CONFIDENTIAL 17
As of June 30, 2021 unless otherw ise noted.
* Inv estment activ ity reflects all direct equity co-inv estment activ ity related to a HarbourVest fund and/or account from January 1, 2020 to December 31, 2020. Ex cludes credit and real assets direct
co-inv estments. Past performance is not a reliable indicator of future results.
A trusted partner for customized co-investment solutions
Flexible selection ofservice offerings
Utilize HarbourVest co-investment professionals as extension of your team
HARBOURVEST STRENGTHS
56 6offices globally with
co-investment team presence
> Program design
> Knowledge transfer / information sharing> Sourcing
> Various levels of discretion> Execution
> Monitoring & reporting
investment
professionalsglobally
Leverage theHarbourVest platform
$4.4 billionco-investment capital
committed in 2020*
800+co-investments
completed since inception
Proprietary deal flow
> Proactive sourcing from GP network
> Internal diligence resources
> Portfolio company assistance

CONFIDENTIAL 18
Flexibility in service options based on client needs
For illustrative purposes only.
z
Client-Led HarbourVest-LedDesired
Collaboration
Level
Flexibility to toggle involvement depending on client’s needs
SERVICE OFFERINGS
Sourcing &
GP Access
Information Sharing &
Knowledge Transfer
Discretion &
Decision-Making
Post-Investment
Monitoring
Coordinated sourcing
from client’s
relationships and, if
desired, HarbourVest’s
managers
Ability for client to
review diligence
materials and
participate in review
process
HarbourVest discretion,
client discretion, or
blend of both on deal
decisions
HarbourVest can
perform monitoring
services or the
responsibility can be
turned over to client
post-investment

CONFIDENTIAL
ADDITIONAL INFORMATION: CO-INVESTMENTS

CONFIDENTIAL 20
HarbourVest has outperformed public and private benchmarks
Commitment
Period
Fund Size
(Millions)
%
Called
Net
DPI
Net
TVPI
Net
IRR
S&P 500
(PME**)
MSCI AC
World (PME**)
HCF III 2013-2016 $1,010.1 97% 1.4x 2.0x 19.2% 13.6% 10.6%
HCF IV* 2016-2019 $1,767.7 84% 0.3x 2.0x 23.7% 15.8% 12.6%
HCF V* 2018-2021 $3,030.3 72% 0.0x 1.6x 70.5% 29.3% 27.9%
Performance (Since Inception) vs.
Burgiss Global All Private Equity Benchmark***
* HCF IV and HCF V performance also includes the performance of any AIF-related funds.
** Adjusted index returns to reflect a comparable public market equivalent (“PME” ).
*** As of March 31, 2021. Source: Burgiss, Global All Private Equity benchmarks for the respective fund vintage years (2013, 2016, and 2018 respectively). There are 254 funds in the benchmark for the 2013 vintage, 355
funds in the benchmark for the 2016 vintage, and 502 funds in the 2018 vintage. The quartiles are determined based on the net TVPI return of each fund in the benchmark. The funds comprising the Global All Private Equity
benchmark may have substantially different characteristics than the respective HarbourVest funds, and the comparison is provi ded for illustrative purposes only.
Performance provided as of March 31, 2021. HCF III refers to 2013 Direct Fund, HCF IV refers to Co -Investment Fund IV, and HCF V refers to Co-Investment Fund V. Past performance is not a reliable indicator of future
results. For EEA prospective investors, this performance information is intended for distribution with the annual performance information in ‘Additional Track Record Detail.’ See ‘Additional Important Information’ at the end of
the presentation, including important disclosures related to Net Performance Returns, Public Market Comparison, Private Equity Index Data, and Fees and Expenses.
19%24%
71%
14%16%
29%
11%13%
28%
0%
10%
20%
30%
40%
50%
60%
70%
80%
HCF III HCF IV* HCF V*
Performance (Since Inception) vs.Public Benchmarks
Net IRR S&P 500 (PME**) MSCI AC World (PME**)
IRR
TV
PI
1st Quartile 1st
2nd Quartile 2nd
3rd Quartile 3rd
4th Quartile 4th
HV Net TVPI
0.0x
0.5x
1.0x
1.5x
2.0x
2.5x
3.0x
3.5x
4.0x
4.5x
HCF III HCF IV* HCF V*

CONFIDENTIAL
APPENDIX

CONFIDENTIAL
Strong global team
22
SECONDARY INVESTMENTS
MANAGING DIRECTOR
Dav id Atterbury Edward Holdsworth
Greg Ciesielski Jef f Keay
Tim Flower Mike Pugatch
Brett Gordon Rajesh Senapati
Valérie Handal Dustin Willard
PRINCIPAL
Abuzar Anaswala Blake Holman
John Fiato Matt Souza
Dominic Goh Martin Yung
VICE PRESIDENT
Nick Bellisario Yassin Knocke
Chad Bounds Emily Ren
Ky le Dowd William Thompson
SENIOR ASSOCIATE
Julie Catton Andrea Pompili
Matthew Dezenzo Patrick Qian
Jack Donov an Michael Venditti
Tony Law
ASSOCIATE
Benjamin Gerber Tay lor Percy
Freddie Grimwade Christoph Schwarz
Ry an Kim Kaitly n Shao
Kelly Lau Jordan v an Wezel
Mary Maccabee Christopher West
Parthiv Patel Oliv ia Xu
As of June 30, 2021. Includes employees of HarbourVest Partners, LLC, HarbourVest Partners (U.K.) Limited, HarbourVest Partners (Asia) Limited, HarbourVest Partners (Japan) Limited, HarbourVest Partners, LLC Oficina de Representación, HarbourVest Investment Consulting (Beijing) Company Limited, HarbourVest Partners Korea Ltd, HarbourVest Partners (Israel) Ltd,
HarbourVest Partners (Ireland) Limited, and HarbourVest Partners (Singapore) Pte. Limited.
DIRECT CO-INVESTMENTS & PRIVATE CREDIT
MANAGING DIRECTOR
Jamie Athanasoulas Seth Palmer
Corentin du Roy Alex Rogers
Ian Lane Karen Simeone
Peter Lipson Kelv in Yap
Craig MacDonald
PRINCIPAL
Cartus Chan Ry an Jones
Matthew Cheng Lenny Li
Goncalo Faria Ferreira Jacqueline Peradotto
Joel Hwang Stev e Wong
Lee Incandela Dav id Zug
VICE PRESIDENT
Megan Beecher William Hasten
Brendan Butler Alexander Mackinger
Elliott Campbell Sophia Maizel
Karen Chung Gregory Mazur
Sean Gillespie Thorne Michaels
Michael Guiness Jonathan Sanf ord
Houda Hamdouch Juny i Zang
SENIOR ASSOCIATE
Sean Carolan William Morelli
Manusha Chereddy Tikeren Quinn
Noel Lam Ty ler Smith
Ruy in Liao
ASSOCIATE
Carolina Alv es Joseph Mitrani
Jacob Bjorklund Caleb Morrison
Julia Burke Shan Patel
Abigail Cough Leor Radbil
Zachary Eagle John Schwartz
Laure Fournier Marie Smith
Erik Garrigo Richard Sterndale
Jackie Huang Ry an Wolf son
Xiren Huang Benson Wong
Andreas Kuzma Rachel Wu
Rodrigo Lameira
QUANTITATIVE INVESTMENT SCIENCE
MANAGING DIRECTOR
Sof ia Gertsberg
INVESTOR RELATIONS
MANAGING DIRECTOR
Nate Bishop Simon Lund
Minjun Chung Tadasu Matsuo
Matt HoganBruen Vinay Mendiratta
Simon Jennings Nhora Otalora
Jamie Kase Ilan Rosen
Olav König Sally Shan
Tatsuy a Kubo Laura Thaxter
PRINCIPAL & SENIOR VICE PRESIDENT
Emily Archer Teri Noble
Mohit Bhatia Fran Peters
Jay Brasseur Vai Rajan
John Brescia Abigail Ray ner
Daniel Conti Christopher Row
John Cooney Jonathan Seidman
Ashleigh Dorsett Drew Snow
Shumin Gong Alicia Sweeney
Michael Joseph Audrey The-Dumas
Yasunobu Kawahara Taehy un Yum
Dav id Krauser Sarah Zilzer
Warwick Mancini
OPERATIONS
Monique Austin, Managing Director
Richard Campbell, Managing Director
Paula Drake, Managing Director
Julie Eiermann, Managing Director, CDO
Karin Lagerlund, Managing Director, CFO
Rob MacGoey , Managing Director, CFO
Tricia Mackechnie, Managing Director, CTO
Mark Reale, Managing Director
Bill Roy er, Managing Director, CCO
Mary Traer, Managing Director / CAO
Jennif er Blatt, SVP, Head of Perf . & Rewards
Tony Cobuzzi, SVP, Fund Controller
Cory Cook, SVP, Fund Controller
Matthew Dowgert, SVP, Counsel
Aliza Firestone Goren, SVP, Counsel
Jason Frigiani, SVP, Corporate Controller
Ian Jack, SVP, Head of Compliance, EMEA
Dav id Morris, SVP, Tax Structuring
Michael Pekkarinen, SVP, Business Resilience
Bruce Pixler, SVP, Director of Tax
Dav id Rule, SVP, Global Inf rastructure
Kim Schawbel, SVP, Admin. Operations
Jonathan Sidi, SVP, Counsel
Dav e Stepanis, SVP, Portf olio Analy tics
Amy Unckless, SVP, Org. Ef f ectiveness
Jack Wagner, SVP, Treasurer
Jean Walsh, SVP, Assistant Treasurer
REAL ASSETS
MANAGING DIRECTOR
Michael Dean Kev in Warn-Schindel
PRINCIPAL
Dan Buf f ery Justin Lane
Diego Jimenez Benjamin Wu
VICE PRESIDENT
Holland Dav is Ian Jef f rey
ASSOCIATE
Anthony Crawf ord Colin Mooney
Kate-Ly nn Gordey Andrew Ty e
Dhruv Goy al
PRIMARY PARTNERSHIPS
MANAGING DIRECTOR
Till Burges John Morris
Carolina Espinal Amanda Outerbridge
Mac Gray son Senia Rapisarda
Ry an Gunther Greg Stento
Ly dia Hao Scott Voss
Hemal Mirani
PRINCIPAL
Alex Barker Stephen Tamburelli
Joseph Li Chris Walker
Eric Simas Alex Wolf
VICE PRESIDENT
Amanda Chen Danielle Dobson
Stephanie Daul Lindsey Macleod
SENIOR ASSOCIATE
Michael Ferrante John Powers
Zachary Knowlton Luke v on Maur
Dary l Ng Chloe Webster
ASSOCIATE
Michael Choi Robin McNamara
Trav is Chou Justin Padilla
Thomas Dils Julien Van den Rul
John Fazzini Julie Zhu
Garren Hong
EMERGING AND DIVERSE INVESTMENTS
MANAGING DIRECTOR
Craig Fowler Sanjiv Shah
Edward Powers
ENTERPRISE INVESTMENT OFFICE
SENIOR VICE PRESIDENT
Nick Fleischhacker
VICE PRESIDENT
Jecca Auchterlonie Dean Poulos
Todd DeAngelo
SENIOR ASSOCIATE
James Tsav aris
ASSOCIATE
Anthony Grassa Nicholas Potter
Silas Hill
EXECUTIVE MANAGEMEN T COMMITTEE
MANAGING DIRECTOR
John Toomey Peter Wilson
HVPE
Richard Hickman, Principal, Portf olio Mgmt.
Bill Macaulay , Director of Finance

CONFIDENTIAL 23
Contacts – We are accessible across the globe
harbourvest.com
Americas EMEA APAC
BOGOTÁ
HarbourVest Partners, LLC Oficina de Representación
+57 1 552 1400
DUBLIN
HarbourVest Partners (Ireland) Limited
+353 1 566 4410
BEIJING
HarbourVest Investment
Consulting (Beijing)
Company Limited
+86 10 5706 8600
BOSTON
HarbourVest Partners, LLC+1 617 348 3707
FRANKFURT
HarbourVest Partners (Ireland) Limited, Zweigniederlassung
Deutschland+49 69 589964040
HONG KONG
HarbourVest Partners (Asia) Limited
+852 2525 2214
TORONTO
HarbourVest Partners (Canada) Limited
+1 647 484 3022
LONDON
HarbourVest Partners (U.K.) Limited
+44 20 7399 9820
TEL AVIVHarbourVest Partners (Israel)
Limited+972 3 3720123
SEOUL
HarbourVest Partners Korea Limited
+82 2 6410 8020
SINGAPOREHarbourVest Partners
(Singapore) Pte. Limited+65 6978 9613
TOKYO
HarbourVest Partners (Japan) Limited
+81 3 3284 4320

CONFIDENTIAL
ADDITIONAL IMPORTANT INFORMATION

CONFIDENTIAL 25
Additional important informationAny data presented about investments prior to 1998 is related to transactions that occurred when the HarbourVest team was affiliated with Hancock Venture Partners, Inc.
HarbourVest’s founders began making venture capital investments for John Hancock Financial Services in late 1970s. In 1982 they formed Hancock Venture Partners, Inc, which was fully owned by John Hancock Mutual Life Insurance Company, to independently develop and manage third-party private equity capital. In January 1997, the Hancock Venture Partners management team formed a new independent management company, HarbourVest Partners, LLC. All then-employees of Hancock Venture Partners became owners and/or employees of HarbourVest Partners, LLC. As of January 1, 2021 all employees of HarbourVest Partners, LLC hired prior to 1997 are still affiliated with HarbourVest and serve either as a Managing Director or in a Senior Advisor capacity. HarbourVest Partners, LLC has no affiliation with John Hancock Financial Services.
The source of the performance information is HarbourVest. In considering the performance information contained herein, prospective investors should bear in mind that past performance is not a reliable indicator of future results, and there can be no assurance that an investment sponsored (or an account managed) by HarbourVest will achieve comparable results or be able to implement its investment strategy or meet its performance objectives. The funds that made these investments may have had different terms and investment objectives than those proposed or modeled herein.
The foregoing performance information includes realized and unrealized investments. Unrealized investments are valued by HarbourVest in accordance with the valuation guidelines contained in the applicable partnership agreement. Actual realized returns on unrealized investments will depend on, among other factors, future operating results, the value of the assets and market conditions at the time of disposition, any related transaction costs, and the timing and manner of sale, all of which may differ from the assumptions on which the valuations used in prior performance data contained herein are based. Accordingly, the actual realized returns on these unrealized investments may differ materially from returns indicated herein.
In certain cases, a HarbourVest fund or account, or the partnerships in which it invests, may utilize a credit facility or other third-party financing. This is generally to bridge capital calls from limited partners or to fund a portion of an investment and may also be used to facilitate transactions involving the recapitalization of portfolio investments. This may make the resulting IRR and multiples higher or lower than the IRR or multiples that would have been presented had drawdowns from partners or available cash been initially used to acquire or pay for the investment.
IRRs are calculated from the date of a fund’s first cash flow from a limited partner, which may include capital contributionsin connection with fund formation, as may occur with certain AIF -Related Funds (as defined below), and therefore can be earlier than the date of the first capital call from a limited partnerfor the purpose of investment. The start date for IRR calculations can also be later than the date of initial investment when a credit facility or other third-party financing is used to fund such investment.
Performance is expressed in US dollars, unless otherwise noted. Returns do not include the effect of any withholding taxes. Cash flows are converted to US dollars at historic daily exchange rates, unless otherwise indicated. The return to investors whose local currency is not the US dollar may increase ordecrease as a result of currency fluctuations.
1. Net Performance Returns - DPI (Distributions / Paid-In Capital), TVPI (Total Value / Paid-In Capital), and Net IRR (Internal Rate of Return) through the applicable date are the returns to limited partners after all management fees, commissions, fund operating expenses, and carried interest. These retu rns reflect the combined return for all limited partners in a fund and may not reflect an individual limited partner’s actual return. The Net IRR is calculated using daily cash flows to and from limited partners. In this calculation, the final cash flow to limited partners is the fair market value of all limited partners’ capital accounts at the applicable date as determined by the general partner of the respective HarbourVest fund or account in accordance with the valuation policy. The net multiples (DPI and TVPI) are calculated based on the same cash flows. See note 8 below for additional disclosures related to fees and expenses of a fund.
Notes continued on next page.

CONFIDENTIAL 26
Additional important information2. Gross Performance Returns – This information (Distributed / Funded, Total Value / Funded, TV/TC (Total Value / Total Cost), Gross Portfolio IRR, and Gross IRR), if shown, is
presented on a gross basis and reflects the performance of the investment portfolio, including primary fund investments, secondary investments, and/or direct co-investments. Gross Portfolio IRR represents the annual return calculated using daily cash flows from the Fund(s) to and from the various partnerships or companies, either directly or through a special purpose vehicle in which the Fund(s) invested during the period specified. These returns reflect the fees, expenses, and carried interest of the underlying fund investments (where applicable), certain expenses of any special purpose vehicle that held an interest in the underlying fund, as applicable, but do not reflect the management fees, carried interest, and other expenses borne by investors in the Fund(s), which will reduce returns. See note 8 below for additional disclosures related to fees and expenses of a Fund.
3. Portfolio Company Performance – This information, if shown, is based on the cost and value of underlying company investments within the primary and secondary investment portfolios of the Fund(s). These returns do not reflect the fees, expenses, and carried interest of the partnership investments of the Fund(s), which will reduce returns. Performance may be aggregated when a company is held through multiple primary and secondary investments. These returns do notrepresent the performance of any specific Fund or the return to limited partners of any specific Fund. As a result, portfolio company performance returns are considered model performance. See notes 6 and 8 below for additional disclosures related to model performance and fees and expenses of a Fund, respectively.
4. Public Market Comparison – This information, if shown, represents adjusted model performance of each index as if the respective index had been purchasedand sold at the time of the limited partners’ capital calls and distributions, with the remainder held at the date noted. The indices used assume reinvestment of all dividends. Under this methodology, the capital calls for the purchase of the public market index are the same as the capital calls for the Fund(s).The distributions for the sales of the public market index are scaled to represent the same proportion of the Fund’s NAV at the time of the distribution. For example, if the Funddistributes 5% of NAV, then 5% of the index NAV is distributed. Thus, the index returns presented are not gross actual index returns, but adjusted model returns. See note 6 for additional disclosures related to model performance.
The MSCI AC Asia Pacific® Index captures large and mid cap representation across 5 Developed Markets countries (Australia, Hong Kong, Japan, New Zealand and Singapore) and 9 Emerging Markets countries (China, India, Indonesia, Korea, Malaysia, Pakistan, the Philippines, Taiwan and Thailand) in the Asia Pacific region. With 1,573 constituents, the index covers approximately 85% of the free float-adjusted market capitalization in each country.
The MSCI AC World® Index (ACWI) is designed to measure the performance of publicly-traded large and mid-capitalization equity securities in global developed and emerging markets. The MSCI ACWI Index is maintained by Morgan Stanley Capital International (“MSCI”) and has historically captured approximately 85% coverage of the free float-adjusted market capitalization of its publicly-traded global equity opportunity set.
The MSCI AC World® (ACWI) Ex-US Index is designed to measure the performance of publicly-traded large and mid-capitalization equity securities in global developed and emerging markets excluding the US. The MSCI ACWI Ex-US Index is maintained by MSCI and has historically captured approximately 85% coverage of the free float-adjusted market capitalization of its publicly-traded global equity opportunity set outside the US.
The MSCI EAFE® Index is designed to measure the performance of publicly-traded large and mid-capitalization equity securities across developed markets, including countries in Europe, Australasia, Israel and the Far East, and excluding the US and Canada. The MSCI EAFE Index is maintained by MSCI and has historically captured approximately 85% coverage of the free float-adjusted market capitalization of publicly-traded equities in each included country.
The S&P 500® Index is designed to measure the performance of publicly-traded equity securities of the large capitalization sector of the US market and includes 500 large companies having common stock listed on eligible U.S. exchanges. The S&P 500 Index is maintained by Standard & Poors (“S&P”) and has historically captured approximately 80% coverage of available market capitalization of publicly-traded equities in the US market.
Notes continued on next page.

CONFIDENTIAL 27
Additional important informationThe Russell 2000® Index is designed to measure the performance of publicly -traded equity securities of the small capitalization sector of the US market and includes the 2,000 smallest companies in the Russell 3000® Index. These indexes are maintained by FTSE Russell, a subsidiary of the London StockExchange Group. The Russell 3000 Index consists of the 3,000 largest publicly-listed US companies, and has historically captured approximately 98% coverage of the total capitalization of the entire US stock market.
The adjusted public market indices shown are not intended to, and do not, parallel the risk, investment strategy, or investment characteristics of a Fund. The securities comprising the public market indices have substantially different characteristics than the investments held by a Fund, and accordingly, a direct comparison may not be meaningful. The public market comparison is shown for illustrative purposes only. The adjusted indices are shown to demonstrate the approximate returns an investor may have received had the investor invested in certain publicly-traded equity securities in lieu of a Fund or the investments made by HarbourVest. An investor is not able to directly invest in a benchmark index.
Bloomberg is the source of the index data contained or reflected in this material. MSCI, S&P, and FTSE Russell are the ownersofthe index data contained or reflected in this material and all trademarks and copyrights related thereto. This is HarbourVest’s presentation of the data. Bloomberg, MSCI, S&P, and FTSE Russell are not responsible for the calculations conducted by HarbourVest, the formatting or configuration of this material, or for any inaccuracy in presentation thereof.
5. Vintage Years - HarbourVest vintage classification is based on the year in which capital was first funded to each underlying fund (for primar y fund investments) or the year of HarbourVest’s purchase (for secondary investments).
6. Monte Carlo Simulations - These model (hypothetical) portfolios, if shown, are intended for illustrative purposes only. Performance information for eac h hypothetical portfolio utilized a Monte Carlo Simulation and are based on the actual cash flows of a proprietary data set that includes partnership investments made by Funds, along with partnership data from external sources. The capital calls and distribution data is based on historic partnership investment cash flows, but does not represent the actual experience of any investor or Fund. The results of the simulation are impacted by an uneven representation of funds with different vintage years, sizes, managers, and strategies, and a limited pool of investment cash flow data. The actual pace and timing of cash flows is likely to be different and will be highly dependent on the underlying partnerships’ commitment pace, the types of investments made by the Fund(s), market conditions, and terms of any relevant management agreements. The results presented are based entirely on the output from numerous mathematical simulations. The simulations are unconstrained by the fund size, market opportunity, and minimum commitment amount, and do not take into account the practical aspects of raising and managing a fund. The simulated hypothetical portfolio results should be used solely as a guide and should not be relied upon to manage your investments or make investment decisions.
7. Model Performance - Model performance results are inherently limited and should not be relied upon as indicators of future performance. Individual fund and strategy performance can be better or worse than the model. No investor received the indicated model performance. Certain assumptions have been made for modeling purposes. No representation or warrant is made as to the reasonableness of the assumptions made. Changes in the assumptions may have a material impact on the hypothetical returns presented.
Different model scenarios will provide different results. While the model portfolio may consist of investments made by HarbourVest during the relevant period(s), it does not reflect an actual portfolio managed by HarbourVest during the relevant period(s) and does not represent the impact that material economic and market factors might have had on HarbourVest’s decision making if HarbourVest had been managing a fund that incorporated the investment strategy shown during the specified period(s).
Notes continued on next page.

CONFIDENTIAL 28
Additional important information
In addition, the HarbourVest fund(s) had investment results materially different from the results portrayed in the model portfolio during the relevant period(s). The fund(s)’ actual investments may have substantially different terms than those reflected in the model portfolio. No representation is made that any Fund will or is likely to achieve returns similar to those presented, and there can be no assurance that the fund(s) or HarbourVest will achieve profits or avoid incurring substantial losses. Other periods selected for the model portfolios may have different results, including losses. Current model performance may differ from that shown.
Model may assume each portfolio participates in every investment opportunity on a pro rata basis based on actual aggregate HarbourVest commitments for each vintage year. Actual investment opportunities may be limited due to scarcity and desired portfolio construction; creating a more concentrated portfolio in comparison to the model. The incremental benefit of portfolio diversification may become limited at the higher range of underlying partnerships / investments.
The following is the criteria used when showing model portfolio performance that includes the following investment types:
Primary Investments – Based on the cash flows of all primary investments (or a subset as noted) made by fund(s) during the perio d(s) specified, with the exception of custom accounts that made investments primarily in emerging venture capital managers, emerging managers, diverse managers, or state-focused managers, as these strategies are outside of HarbourVest’s core focus.
Secondary Investments – Based on the cash flows of all secondary investments (or a subset as noted) made by fund(s) during the p eriod(s) specified.
Direct Co-Investments – Based on the cash flows of all direct co-investments (or a subset as noted) made by fund(s) during the period(s) specified. This performance excludes custom accounts that may make investments outside of HarbourVest’s core co-investment strategy (e.g., industry, sourcing, return profile). Direct co-investments are generally defined as: (i) buyout, recapitalization, and special situation investments; (ii) expansion capital, growth equity, or other venture capital investment in companies with greater than $7.5 million in trailing 12-month revenues at the time of investment; or (iii) mezzanine investments. Early stage investmen ts, generally defined as those companies with revenues less than $7.5 million at the time of initial investment, which are outside the focus of the fund, are also not included in the model portfolio returns shown. If early stage investments were included in the model portfolio, returns would be lower.
8. Fees and Expenses - Actual management fees and carried interest will vary and are established in negotiations with the limited partners of a Fund or separate account client. Management fees may range from an average of 0.1% to 1.25% per year of committed, called, or invested capital over the expected life of the Fund, pursuant to the limited partnership agreement or investment management agreement. Fees for Funds in extension years may be reduced, including to nil.Fund investors will typically bear all the costs and expenses relating to the operations of a Fund and its general partners (or similar managing fiduciary). A Fund shall bear its pro rata share of any such expenses incurred in connection with any portfolio investment to the extent the same portfolio investment is being made by other Funds. Organization expenses of a Fund will also typically be borne by Fund investors. When a Fund is generally expected to invest alongside a Fund primarily intended for European-based investors, which takes into account the regulatory requirements of the Alternative Investment Fund Managers Directive (an “AIF Related Fund”), organization expenses may be aggregated and allocated pro-rata between a Fund and its AIF Related Fund based on the relative commitments of the partners of the Fund and the partners of its AIF Related Fund (unless HarbourVest, as general partner, determines in good faith that a different share is appropriate). The specific payment terms and other conditions of the management fees, carried interest, and other expenses of a Fund are set forth in the governing documents of the Fund. Fees and expenses are also described in HarbourVest’s Form ADV, Part 2A brochure.
Notes continued on next page.

CONFIDENTIAL 29
Additional important information
Gross performance returns, if shown, are presented before management fees, carried interest, and other expenses borne by investors in the Fund(s). An actual portfolio would bear such fees and expenses. If such fees and expenses were deducted from performance, returns would be lower. For example, if a fund appreciated by 10% a year for five years, the total annualized return for five years prior to deducting fees and expenses at the end of the five year period would be 10%. If total fund fees and expenses were 1% for each of the five years, the total annualized return of the fund for five years at the end of the five-year period would be 8.90%.
9. Private Equity Index Data - Unless otherwise indicated, all private equity fund benchmark data reflects the fees, carried interest, and other expenses of the funds included in the benchmark. Please note that Fund returns would be reduced by the fees, carried interest, and other expenses borne by investors in the Fund. Such fees, carried interest, and other expenses may be higher or lower than those of the funds included in the benchmark. Burgiss (unless otherwise noted) is the source and owner of any private equity index data contained or reflected in this material and all trademarks and copyrights related thereto. The material may contain confidential information and unauthorized use, disclosure, copying, dissemination, or redistribution is strictly prohibited. This is HarbourVest’s presentation of the data. Burgiss is not responsible for the calculations conducted by HarbourVest, the formatting or configuration of this material, or for any inaccuracy in presentation thereof.
Epidemics, Pandemics and Other Health Risks
Many countries have experienced infectious illnesses in recent decades, including swine flu, avian influenza, SARS and 2019-nCoV (the “Coronavirus”). In December 2019, an initial outbreak of the Coronavirus was reported in Hubei, China. Since then, a large and growing number of cases have been c onfirmed around the world. The Coronavirus outbreak has resulted in numerous deaths and the imposition of both local and more widespread “work from home” and other quar antine measures, border closures and other travel restrictions causing social unrest and commercial disruption on a global scale. The World Health Organization has declared the Coronavirus outbreak a pandemic. The ongoing spread of the Coronavirus has had and will continue to have a material adverse impact on local economies in the affected juri sdictions and also on the global economy as cross-border commercial activity and market sentiment are increasingly impacted by the outbreak and government and other measures s eeking to contain its spread. In addition to these developments having potentially adverse consequences for underlying portfolio investments of the Fund and the value of the Fund’s investments therein, the operations of HarbourVest and the Fund have been, and could continue to be, adversely impacted, including through quarantine measures and travel restrictions imposed on HarbourVest personnel or service providers based around the world, and any related health issues of such personnel or service providers. Any of the foregoing events could materially and adversely affect the Fund’s ability to source, manage and divest its investments and its ability to fulfill its investment ob jectives. Similar consequences could arise with respect to other comparable infectious diseases.
Notes continued on next page.

CONFIDENTIAL 30
Additional important information
The information contained herein is highly confidential and is being provided to you at your request for informational purposes only and is not, and may not be
relied on in any manner as, legal, tax, or investment advice or as an offer to sell or a solicitation of an offer to buy an interest in any fund or any other investment
product sponsored by HarbourVest (the “Fund”). Any offering of interests in the Fund w ill be made by means of delivery of a c onfidential Private Placement
Memorandum or similar materials (the “Memorandum”) that contain a description of the material terms of such investment and subscriptions w ill be accepted solely
pursuant to definitive documentation. These materials do not purport to contain all the information relevant to evaluating an investment in the Fund. The information
contained herein w ill be superseded by, and is qualif ied in its entirety by reference to, the Memorandum, w hich w ill contain information about the investment
objective, terms, and conditions of an investment in the Fund and w ill also contain tax information and risk disclosures that are important to any investment
decision regarding the Fund. No person has been authorized to make any statement concerning the Fund other than as w ill be set forth in the Memorandum and
any such statements, if made, may not be relied upon. No sale w ill be made in any jurisdiction in w hich the offer, solicitation, or sale is not authorized or to any
person to w hom it is unlaw ful to make the offer, solicitation, or sale. Offers and sales of interests in the Fund w ill not be registered under the law s of any jurisdiction
and w ill be made solely to “qualif ied purchasers” as defined in the U.S. Investment Company Act of 1940, as amended. The info rmation contained herein must be
kept strictly confidential and may not be reproduced or redistributed in any format w ithout the express w ritten approval of HarbourVest.
An investment in the Fund w ill involve signif icant risks, including loss of the entire investment. Before deciding to invest in the Fund, prospective investors should
pay particular attention to the risk factors contained in the Memorandum. Prospective investors should make their ow n investigations and evaluations of the
information contained herein. Prior to the closing of a private offering of interests in the Fund, HarbourVest w ill give investors the opportunity to ask questions and
receive additional information concerning the terms and conditions of such offering and other relevant matters. Each prospect ive investor should consult its ow n
attorney, business advisor, and tax advisor as to legal, business, tax, and related matters concerning the information contained herein and such offering.
Certain information contained herein (including f inancial information and information relating to investments) has been obtained from published and non-published
sources. Such information has not been independently verif ied by HarbourVest. Except w here otherw ise indicated herein, the information provided herein is based
on matters as they exist as of the date of preparation and not as of any future date, and w ill not be updated or otherw ise revised to reflect information that
subsequently becomes available, or circumstances existing or changes occurring after the date hereof. Any forecast provided herein is based on HarbourVest’s
opinion of the market as of the date of preparation and is subject to change, dependent on future changes in the market.
In considering any performance data contained herein, you should bear in mind that past performance is not a reliable indicat or of future results.
Certain information contained herein constitutes forward-looking statements, which can be identified by the use of terms such as “may”, “will”,
“should”, “expect”, “anticipate”, “project”, “estimate”, “intend”, “continue”, or “believe” (or the negatives thereof) or other variations thereof. Due to
various risks and uncertainties, including those discussed above, actual events or results or actual performance of the Fund may differ materially from
those reflected or contemplated in such forward-looking statements. As a result, investors should not rely on such forward-looking statements in
making their investment decisions.
None of the information contained herein has been filed w ith the Securities and Exchange Commission, any securities administr ator under any state securities
law s, or any other governmental or self -regulatory authority. No governmental authority has passed on the merits of the offering of interests in the Fund or the
adequacy of the information contained herein. Any representation to the contrary is unlaw ful.

Shawn T. Wooden
Treasurer
S ta te o f C o nne c t i cut O ff i c e of t he T r e a sur e r
Darrell V. Hill
Deputy Treasurer
65 Capitol Ave, Hartford, CT 06106-1773, Telephone: (860) 702-3000
An Equal Opportunity Employer
September 3, 2021
Members of the Investment Advisory Council
Re: Morgan Stanley CRPTF Real Assets Co-Investment Strategic Partnership
Dear Fellow IAC Member:
At the September 8, 2021 meeting of the Investment Advisory Council, I will present for your
consideration an investment opportunity in the Real Asset Fund (“RAF”) of the Connecticut Retirement Plans and Trust Funds (the “CRPTF”): Morgan Stanley Investment Management CRPTF Co-Investment Strategic Partnership (“MSIM-CT”). The MSIM-CT partnership will allow the CRPTF to co-invest in private real assets transactions managed by the Morgan Stanley Investment Management
(“MSIM”) Solutions Team operating within a publicly traded global financial services and asset management firm, with more than $1.4 trillion of assets under management.
I am considering a commitment of up to $125 million per year over a three-year commitment period in
MSIM-CT to participate in co-investments transactions in real estate, infrastructure, natural resources. The MSIM-CT mandate will allow the CRPTF to pursue co-investment opportunities from our own General Partner (“GP”) relationships as well as the extensive network of GPs working with MSIM. Additionally, this strategic partnership will bring MSIM resources to the CRPTF providing direct access
for close collaboration, knowledge transfer with Morgan Stanley experts, training, and professional development. The MSIM Real Assets Solution team has established a robust global co-investment platform, having invested over $2 billion in real assets opportunities, with over $800 million in real assets co-investments since 2009.
Attached for your review is the recommendation from Ted Wright, Chief Investment Officer, and the due diligence report prepared by Meketa. I look forward to our discussion of these materials at next week’s meeting.
Sincerely,
Shawn T. Wooden State Treasurer
AGENDA ITEM #6

OFFICE OF THE STATE TREASURER
MEMORANDUM
DECISION
TO: Shawn T. Wooden, Treasurer
FROM: Ted Wright, Chief Investment Officer
CC: Darrell V. Hill, Deputy Treasurer
Raynald D. Leveque, Deputy Chief Investment Officer
Mark Evans, Principal Investment Officer
Kevin J. Cullinan, Chief Risk Officer
Kan Zuo, Private Markets Investment Officer
DATE: September 2, 2021
SUBJECT: Morgan Stanley Investment Management CRPTF Real Assets Co-
Investment Strategic Partnership
Summary
The purpose of this memorandum is to recommend that the Connecticut Retirement Plans and Trust Funds (the "CRPTF") consider an annual commitment of up to $125 million each year over a three-
year period to the Morgan Stanley Investment Management ("MSIM") CRPTF Real Assets Co-Investment L.P. ("MSIM-CT") in the Real Assets Fund (“RAF”). The target capital commitment will comprise up to a $75 million allocation to the Real Estate investments and up to a $50 million allocation to the Infrastructure and Natural Resources investments.
MSIM-CT is an RAF co-investment strategic partnership. This partnership will provide the CRPTF the opportunity to co-invest in favorable transactions of existing general partners ("GPs") that the CRPTF has made fund commitments to and with GPs in the Morgan Stanley network that the
CRTPF does not have a fund relationship. MSIM-CT would be structured as a separately managed account (“SMA”) vehicle with a three-year commitment period to source and underwrite real assets opportunities in the real estate, infrastructure, and natural resources asset classes.
This strategic partnership with Morgan Stanley, in addition to the execution of a robust co-investment real assets portfolio, offers a broad range of services to the Pension Fund Management ("PFM") investment professionals. Investment services include custom training, investment due diligence, knowledge transfer, access to investment tools and analytics, and professional
development, leveraging the resources of a global asset management organization. Meketa believes the MSIM-CT partnership is an attractive structure for PFM, enabling our organization to engage in investment opportunities relative to the CRTPF's internal constraints.
Meketa identifies a few factors and opportunities for successfully implementing our private markets co-investment program addressed in this memorandum. PFM investment professionals believe that the MSIM-CT strategic partnership will be accretive to
our existing private markets portfolio, achieving attractive risk-adjusted returns over the long term and benefits of a strategic alliance for staff professional development.

Page 2 of 15
Strategic Allocation within the Real Assets Portfolio
The MSIM-CT strategy is to implement a high-quality co-investment program that complements the existing and future commitments to the RAF portfolio, generating superior risk-adjusted returns. This co-investment program will harvest opportunities from the list of high conviction GPs in the RAF, further augmented by adding GP relationships sourced through the Morgan Stanley platform.
The MSIM partnership will source transactions to underwrite value-add and opportunistic investments to build out the target exposure in real estate and accelerate our exposure in renewables, sustainable infrastructure, and natural resources investments. The MSIM-CT mandate will focus on
smaller and mid-market GP co-invest opportunities that can create outsized returns. The MSIM-CT co-investment mandate will be discretionary. All transactions will be approved, acquired, managed, and monitored by the MSIM Real Assets Solutions Team ("MSIM Solutions
Team"). As of June 30, 2021, the real estate allocation total net asset value is $2.81 billion or 6.38% of the CRPTF. The net asset value of the infrastructure & natural resources allocation is $204.5 million or
0.46% of the total plan. Real estate, infrastructure, & natural resources are underweight relative to the policy target allocation of 10% and 4.2%, respectively. The CRPTF will target approximately 10% of the RAF portfolio for co-investments over the long term.
MSIM Solutions Team Overview
Morgan Stanley Investment Management is a global asset manager with $1.4 trillion in assets under management, operating in 22 countries, with 1,184 investment professionals across 52 offices.
The Morgan Stanley real assets co-investment practice was established in 2009 and operated within the Solutions and Multi-Asset Group. The MSIM Solutions Team is a group of 26 investment, administration, and research professionals responsible for implementing the real assets co-investment platform. The MSIM Solution Team is led by the six-member Investment Committee
("IC") comprised of Rui De Figueiredo, Ph.D., Co-Head and Chief Investment Officer, and Managing Directors, Ted Eliopoulos, Ryan Meredith, Catherine Hong, Steve Turner, and Damon Wu.
The IC members have over 116 years of experience in the real assets sector, each with a strong network of GP and industry contacts. The IC will be responsible for sourcing, underwriting, portfolio management, and overseeing the MSIM-CT co-investment opportunities. Four of the six IC members have worked together as portfolio managers at Morgan Stanley for over 13 years. The
two recent additions, Ted Eliopoulos and Steve Turner, bring specific experience in infrastructure and natural resources investments on the public and private sides, respectively. The IC is supported by 13 dedicated global investment research professionals and seven investment
administration and data management professionals. The investment research team is comprised of both quantitative and qualitative analysts who are focused on underwriting and monitoring investment deals. The investment administration team is responsible for various aspects of deal administration, operations, structuring, monitoring, and reporting of portfolio transactions.

Page 3 of 15
Further, the broader MSIM Solutions Team will leverage the specialist investment teams in the Private Markets & Hedge Fund Solutions, Private Real Estate, and Private Infrastructure areas. These specialist teams support the MSIM Solutions Team in sourcing, diligence, transaction
structuring, and execution. Overall, this platform employs over 350 professionals, inclusive of legal, tax, and reporting teams. Risk management will be an integral part of the investment process for the MSIM-CT strategy. Risk
will be adequately addressed on a pre-and post-investment basis, considering key risk factors (e.g., regional dynamics, regulation/policy, asset stage, market competition, market pricing, and asset utilization). The investment and legal professionals of the MSIM Solutions Team include a broad set of risk management interests and alignment clauses when negotiating the terms of a co-
investment deal. Investment Strategy
The objective of the MSIM-CT mandate is to access co-investment opportunities to enhance the RAF portfolio's real returns through exposure to differentiated sources of performance that focus on operational management, capital-constrained market segments, and favorable sectors. The MSIM-
CT mandate is designed to be an actively managed completion portfolio to the RAF primary fund investments. The MSIM Solutions Team will review the composition of the real estate and infrastructure & natural resources assets and build a diversified portfolio of co-investments across property types, managers, and vintage years.
Within real estate, the MSIM-CT will focus mainly on the following co-investment deal targets:
• Value-add and opportunistic strategies
• Developed markets with select emerging market exposures
• Vertically integrated fund managers focused on operational management and business enhancement
• Less efficient small to mid-size real estate fund sectors
Within infrastructure and natural resources, MSIM-CT will target:
• Value-add and opportunistic strategies
• Assets with long useful lives, including energy businesses (e.g., power generation and midstream energy)
• Utilities, transport, and select infrastructure transactions
• Other select natural resources sectors, such as timberland, mining, and minerals
Portfolio Guidelines
PFM investment professionals will work with the MSIM Solutions Team to develop portfolio guidelines and constraints to customize the portfolio construction of the co-investment mandate. These guidelines will assist in building a targeted co-investment portfolio and include flexibility to
adapt to changes in the RAF portfolio as the program matures. These parameters are based on committed capital as a percentage of aggregate commitments over the three-year commitment period. There is a single GP limit of 25% of either real estate or infrastructure & natural resources on GP concentration and a 20% limit of the overall mandate. In addition, examples of the MSIM-
CT portfolio investment criteria are shown on the following page.

Page 4 of 15
MSIM-CT Real Assets Co-Investment Mandate Proposed Investment Guidelines
Investment Type Lower Bound Upper Bound Strategy Lower Bound Upper Bound
Co-investments 95% 100%
Real Estate 50% 70%
Stapled Primaries 0% 5% Infra & Nat. Resources 30% 50%
Commitment Sizing Lower Bound Upper Bound Geography Lower Bound Upper Bound
Investment Size $10M $25M
North America 20% 80%
Europe 10% 60%
Developed Asia Pacific 0% 30%
Emerging Markets 0% 20%
Source: PFM, MSIM Solutions Team
On potential conflict situations: the MSIM Solutions team will be required to seek consent or waiver
for transactions involving Morgan Stanley or any of its affiliates as a seller, agent, or advisors. During our investment due diligence, PFM investment professionals found the MSIM Solutions Team thoughtful in designing applicable and tailored guidelines for our co-investment mandate to be similar to other institutional investor mandates.
Sourcing
Co-investment opportunities for the MSIM-CT mandate will be driven by available supply based on our existing GP fund investments and market opportunities from the Morgan Stanley sourcing network. The MSIM Real Assets Solutions Team has and will continue to leverage the broader investment platform across Private Markets, Private Real Estate, and Private Infrastructure teams.
Historically, the Morgan Stanley Alternative Investment Partners (AIP) Private Markets Team has collaborated on sourcing co-investment transactions with the MSIM Solutions Team. PFM investment professionals believe the Morgan Stanley brand and the collaboration of the AIP team are significant advantages contributing to the success of the track record and their continued ability
to source co-investments across the mandate. Examining the existing MSIM manager relationships indicates that those managers would all be new to the CRPTF, thus increasing exposure to other high-quality general partners for co-
investments. Transaction Process
Once a prospective investment is sourced, the deal undergoes a rigorous transaction cycle to be evaluated and executed. PFM investment professionals found the MSIM transaction process robust, comprehensive, and efficient in executing co-investment opportunities. The discretionary nature of
the mandate allows MSIM-CT to be more agile in deal execution.
Shown below is a description of the specific steps in the transaction cycle:
• Initial Review (Phase I): The opportunity is screened for fit against the specific MSIM-CT investment criteria. The MSIM Solutions Team creates an initial IC approval memo that

Page 5 of 15
summaries the alignment of interest, team, tenure, track record, strategy, alignment of interest between the GP and the CRPTF, risks, and mitigants, along with peer comparisons
• Detailed Underwriting (Phase II): After the approval of Phase I, the opportunity undergoes a rigorous quantitative and qualitative analysis to confirm the initial screen and independent
underwriting. The MSIM Solutions Team evaluates many critical factors, including but not limited to GP sponsor quality, fit and alignment, asset level fundamentals, entry/exit valuations, market dynamics, and historical and projected business performance, and Environmental, Social, and Governance ("ESG") factors
• Transaction Execution: Following Phase II diligence, the legal, economic, operational, and structuring considerations are addressed, along with other risks and mitigants. Negotiation
of the terms with the sponsor is outlined, along with a review of necessary governing documentation and subscription materials
• Investment Committee Decision: The prospective investment is presented to the IC, which makes a decision on the deal. Each co-investment deal requires approval by a supermajority (five out of six members). Following the decision, the MSIM Solutions Team provides feedback to the GP sponsor and parameters for deal execution
GP Monitoring Process
All team members are involved in the monitoring process, which includes active dialogue with GPs and results in a written report. As part of the portfolio monitoring process, manager investments are ranked and rated based on relative performance.
Shown below is the ranking methodology used:
• Meets expectations - valuations are in line with funds of a similar vintage
• Above expectations - valuations are better than normal funds of a similar vintage
• Below expectations - portfolio companies not growing as expected
• Too early to tell – default case until several investments are made and developments (positive or negative) are observed
The need for active intervention or heightened sensitivity to developments is highlighted with a red,
yellow, or green flag:
• Red flag - Requires active intervention
• Yellow flag - Requires close monitoring for developments
• Green flag - Investment proceeding normally
This process prioritizes monitoring activities and can be an early warning for issues developing at the general partner level of the underlying fund. Track Record and Performance
The performance of the MSIM Real Assets co-investment program is summarized in the table on the following page.

Page 6 of 15
MSIM Real Assets Performance Summary as of March 31, 2021
Vintages Capital
Committed
Called
Capital
Distributions NAV +
Distributions
Gross-
Net IRR
TVPI # Deals
Real Assets
co-investments only
2009 – 2021 $821.9M $705.7M $601.4M $1,051.4M 16.3% 1.5x 40
Real Estate co-investments
2009 – 2021 $530.4M $469.3M $586.3M $734.7M 12.8% 1.6x 31
Infra. & Nat. Res.
co-investments
2013 – 2021 $291.5M $236.4M $15.1M $316.7M 23.2% 1.3x 9
Total Real Assets Composite
(prim., secd, co-inv)
2009 - 2021 $2,027.7M $1,585.6M $1,184.2M $2,167.5M 11.6% 1.4x 113
Source: MSIM Solutions Team Gross-Net is defined as net of the underlying GP management fee, gross of Morgan Stanley fee
As of March 31, 2021, MSIM real assets platform has committed over $800 million to over 40 real asset co-investments since its inception in 2009. Overall, inclusive of primary and secondary commitments with co-investments, MSIM has put to work over $2.03 billion in over 110 real assets investments. The real assets co-investments have generated a 16.3% gross of Morgan Stanley fee
net of underlying management fee return and 1.5x net multiple. This track record reflects various sourcing of multiple customized mandates from MSIM clients and deals that have been approved through their process. The MSIM Solutions team has over twenty
clients, including corporations, family offices, endowment and foundations, pension plans, and sovereign wealth funds. Relevant to our mandate, the MSIM Solutions team manages assets for six pension funds, of which five include real assets investments. The MSIM team interacts with more than 400 GPs annually due to its broad and deep sourcing capabilities.
The track record appears to balance real estate and infrastructure and natural resources investments in terms of commitments in dollar amounts relative to the number of deals. The commitments by vintage year are also shown below. In the past five years, the MSIM Solutions Team has deployed
on average close to $100 million of co-investments per year on behalf of their clients. Closer examination of commitments by vintage year support MSIM's ability to deploy capital within the MSIM-CT mandate at our desired target level.
MSIM Real Assets Co-Invest Commitments
by Asset Class & Vintage Year as of March 31, 2021
Source: PFM, MSIM Solutions Team
Page 7 of 15
More importantly, a detailed review reveals that several investments in the track records represented highly sought-after opportunities sponsored by strong GPs. Several allocations were in sectors in which the CRPTF team has firm conviction, such as the logistics real estate sector. A substantial
portion of the allocations was in attractive international markets for which CRPTF's current RAF portfolio lacks exposure. Overall, the GP network of the MSIM Solutions Team, evidenced by their track record, can serve as a solid complement to the current RAF allocations of the CRPTF.
Key Strengths
• Large Well-Resourced Organization: The Morgan Stanley platform is among the most
significant asset management platforms for institutional clients seeking high-quality solutions. Morgan Stanley has a global brand in the private markets, which affords them important deal flow from intermediaries, general partners, and like-minded institutional
investors. Morgan Stanley engages in primary and secondary fund activities in the private markets to leverage niche and specialize opportunities to source deals for their co-investment platform.
The key strength for MSIM-CT will be the integration of primary fund investing and co-investment activities, which mirrors the same perspective in which the RAF investment team would approach portfolio integration. However, MSIM can leverage the full breadth and heft of its broader franchise to execute against the mandate.
The MSIM Solutions Real Assets team is separate from the other private investment teams in the Morgan Stanley organization, which allows for managing potential conflicts. The team has built its real assets capability and works collaboratively with other groups on deal flow.
Morgan Stanley has implemented a sourcing policy to manage allocations from GPs within the platform.
• Strong Experienced Team and Structure: Rui de Figueiredo, Ph.D., Ryan Meredith, CFA,
FFA, Ted Eliopoulos, Catherine Hong, Steven Turner, CFA, and Damon Wu will lead and coordinate the real asset mandate for CRPTF and draw upon a number of resources across MSIM and the broader firm platform. These individuals form the IC that will be responsible for the day-to-day portfolio oversight and management of the MSIM-CT mandate. The
MSIM Solutions Team is led by a strong team of senior professionals with a combined 116 years of experience, strong networks in the industry, and extensive experience working with public pension plans. For example, before joining Morgan Stanley, Ted Eliopoulos served as the Chief Investment Officer at the California Public Employees' Retirement System.
The IC is structured to enhance the collective strengths of the whole team rather than a collection of individual experts. Catherine Hong, Steven Turner, and Ted Eliopoulos serve as the core of the IC, leading the global research team to assist with deal sourcing and
underwriting. Rui de Figueiredo and Ryan Meredith, founders of the group, provide leadership and macro perspective to various mandates. Rounding out the team is Damon Wu, who brings a quantitative perspective when assisting with portfolio construction.
Additionally, the global research team appears to have a very deep bench of talent currently in place. Notable additions include Joshua Myers, with solid industry experience in real estate, and Nick Di Giampasquale, who brings to the team corporate debt experience for

Page 8 of 15
example. Over the next 12 to 18 months, the team expects to add two more investment professionals.
Morgan Stanley has established talent retention mechanisms such as deferred carried interests and profit-sharing for alignment of interests. Overall, the leadership, IC structure, along with the research talent and the Morgan Stanley organization, will insulate the MSIM Solutions Team ability to execute on our mandate.
• ESG Integration: The MSIM Solutions Team integrates ESG concerns with investment goals during each transaction diligence. The team's diligence process evaluates investment
managers, funds, portfolio companies, and assets on several ESG factors and themes during the screening and underwriting process before deal execution.
Examples of factors evaluated during the ESG skill-set review of managers include:
• What is the manager's experience considering ESG factors?
• Who is responsible for ESG considerations? Does the investment team have ESG
training? Is there a dedicated ESG resource?
• What is the framework for evaluating ESG?
• What are the key ESG risks in the relevant sector/geography, and how do they
compare to the global opportunity set?
Ted Eliopoulos, a member of IC for the MSIM Solutions Team, brings deep experience in alternatives, portfolio construction, and an ESG perspective gained as an asset owner. Ted's past
board affiliation includes advisory work with the Sustainability Accounting Standards Board which guides the disclosures of financially material sustainability information by companies to investors.
Risks
• Potential for Uneven Deal Flow: The availability of favorable co-investment opportunities can be unpredictable, based on the deal flow from the CRTPF manager sources and the
Morgan Stanley sourcing network. The MSIM-CT strategy will target approximately a 50 / 50 split of co-investments sourced from the infrastructure & natural resource RAF partners and MSIM network, and a 25 / 75 split sourced from the real estate RAF partners and MSIM network, respectively. Additionally, once a prospective deal is identified, the transaction
must undergo diligence before execution.
Despite this risk, a strategic partner like Morgan Stanley affords the MSIM-CT strategy a greater chance of seeing attractive deal flow with high-quality general partners. CRPTF will
engage with our portfolio GPs to indicate our interest in co-investment opportunities. The portfolio construction guidelines PFM investment staff and the Solutions Team have put in place will assist in mitigating this risk. Furthermore, the annual commitments are considered flexible across the three-year commitment period to allow the MSIM Solutions Team to
account for market conditions when implementing co-investments.

Page 9 of 15
Fees and Terms
The proposed fees for the MSIM-CT Co-investment partnership are detailed below:
Management Fee on Invested Capital: 45 basis points
Preferred Return Net of Fees: 8%
Carried Interest: 7%
Commitment Period: Three years
Structure: Separately Managed Account (SMA)
Target Return: 12% IRR (net of all fees)
Target Annual Commitment: $125 million
Target Annual Commitments to Real Estate $75 million
Target Annual Commitments to Infra. & Nat. Res. $50 million
Total Commitment Size: $375 million
Morgan Stanley Commitment 2% of Total Commitment Size
PFM investment professionals found the MSIM-CT management fees of 45 basis points favorable, considering the overall commitment size, track record of co-investments made over the team's tenure, and strategic partnership benefits. CRPTF retains the right to suspend or terminate future
commitments to MSIM-CT at each year-end. Additionally, PFM investment professionals were able to secure a Morgan Stanley commitment alongside the MSIM-CT mandate to firmly align the interest of the CRPTF and the MSIM Solutions
Team beyond the discretionary economic incentives of carry shared between the team and firm. This commitment by Morgan Stanley is consistent with the expectations from a global leader who values our partnership.
Legal and Regulatory Disclosure (provided by Legal)
The Review of Notice of Legal Proceedings is attached.
Compliance Review (provided by Compliance)
The Workforce Diversity & Corporate Citizenship review is attached. Environmental Social and Governance ("ESG") Analysis
The Assistant Treasurer for Corporate Governance & Sustainable Investment's Evaluation and Implementation of Sustainable Principles review is attached.

Page 10 of 15
Morgan Stanley Investment Management Inc.
Review of Notice of Legal Proceedings
Through its disclosure, Morgan Stanley Investment Management Inc. ("MSIM"), states that its parent company, Morgan Stanley, files legal disclosures on its Form 10-K and Form 10-Q with the SEC. With respect to MSIM, the following matter is disclosed in its ADV:
• In December 2015, MSIM settled charges by the SEC relating to prearranged trades by a former portfolio manager/trader. The settlement covers the period from late 2011 through early 2012. The prearranged trades resulted in the undisclosed favorable treatment of certain
MSIM advisory clients over others. The portfolio manager at MSIM who was involved was terminated in May 2014. MSIM consented to the entry of an administrative cease and desist order finding certain violations of the Securities Act and the Investment Advisers Act. MSIM was censured, and also agreed to pay a civil money penalty in the amount of $8 million to
the SEC.
Morgan Stanley does not disclose any material claims under its fidelity, fiduciary or E&O insurance policies, and confirms that none of the individuals who would be closely responsible for the products
or services sought by the OTT are subject to any ongoing internal investigations. Morgan Stanley states it has adequate procedures in place to undertake internal investigations of its employees, officers and directors.

Page 11 of 15
COMPLIANCE REVIEW FOR MORGAN STANLEY INVESTMENT MANAGEMENT,
INC.
SUMMARY OF LEGAL AND POLICY1 ATTACHMENTS SUBMITTED BY
MORGAN STANLEY INVESTMENT MANAGEMENT, INC.
I. Review of Required Legal and Policy Attachments
MORGAN STANLEY INVESTMENT MANAGEMENT, INC. ("Morgan Stanley") completed all
necessary attachments. It disclosed no impermissible third party fees, campaign contributions, known conflicts, or gifts. The firm's disclosure of legal/regulatory proceedings is being reviewed by the Legal Unit.
II. Workforce Diversity (See Also 3-year Workforce Diversity Snapshot Page Attached) As of June 2021, Morgan Stanley, a New York-based firm, employed 856 people, 36 more than the 820 employed as of December 31, 2019. The firm identified 153 women and/or minorities as Executive/Senior Level Officials and Managers. Over the 3-year period
reported (2021 - 2019), the firm promoted 90 women and 84 minorities within the ranks of professionals or managers. Minorities (the highest percentage being Asians) are well represented at all levels of the firm.
Workforce Statistics For Executive/Senior Level Officials and Managers:
• Women held 28% of these positions in June 2021 (105 of 371), December
2020 (99 of 358), and in December 2019 (92 of 329). • Minorities held 22% (81 of 371) of these positions in June 2021 (2% Black,
3% Hispanic, 16% Asian, 0.27% American Indian or Alaskan Native, and 0.81% Two or More Races), up from 19% (69 of 358) (1.4% Black, 3.1%
Hispanic, 14% Asian, 0.28% American Indian or Alaskan Native, and 0.84% Two or More Races) in December 2020, and slightly down from 20% (65 of 329) (2% Black, 3% Hispanic, 14% Asian, and 0.30% American Indian or Alaskan Native, and 1.22% Two or More Races) in December 2019.
At the Management Level overall:
• Women held 30% (173 of 573) of these positions in June 2021, June 2020
(164 of 549), and in December 2019 (154 of 519).
• Minorities held 27% (155 of 573) of these positions in June 2021 (3% Black, 5% Hispanic, 18% Asian, 0.17% American Indian or Alaskan Native, and 1.57% Two or More Races) slightly up from 26% (141 of 549) (3% Black,
5% Hispanic, 17% Asian, 0.18% American Indian or Alaskan Native, and 1.28% Two or More Races) in December 2020, and slightly up from 25% (132 of 519) (2% Black, 4% Hispanic, 18% Asian, 0.19% American Indian or Alaskan Native, and 1.54% Two or More Races) in December 2019.
At the Professional Level:
1 The Treasury’s Policy Unit will prepare a separate Summary with respect to Morgan Stanley’s ESG submission.

Page 12 of 15
• Women held 44% (100 of 225) of these positions in June 2021, up from 40% (102 of 258) in December 2020, and 37% (91 of 243) in December 2019.
• Minorities held 41% (93 of 225) (3% Black, 8% Hispanic, 25% Asian, and 5% Two or More Races) of these positions in June 2021, up from 38% (99 of 258) (3% Black, 9% Hispanic, 23% Asian, and 4.3% Two or More Races) in December 2020, and up from 35% (84 of 243) (3% Black, 8% Hispanic, 19%
Asian, and 4.1% Two or More Races) in December 2019.
Firm-wide:
• Women held 38% (329 of 856) of these positions in June 2021, slightly up
from 37% (321 of 864) both in December 2020, and in December 2019 (300 of 820).
• Minorities held 33% (279 of 856) (4% Black, 7% Hispanic, 19% Asian, 0.12% American Indian or Alaskan Native, and 3% Two or More Races) of
these positions in June 2021, up from 31%(270 of 864) (4% Black, 7% Hispanic, 18% Asian, 0.12% American Indian or Alaskan Native, and 2.31% Two or More Races) in December 2020, and 30% (247 of 820) (4% Black, 7% Hispanic, 18% Asian, 0.12% American Indian or Alaskan Native, and
2.32% Two or More Races) in December 2019.
III. Corporate Citizenship
Charitable Giving: Morgan Stanley and its more than 800 staff members (from senior management down) support children's physical and cognitive development through sustained access to healthy and nutritious foods, safe places to play and access to quality and mental healthcare. In
2019, 93% of Morgan Stanley employees participated in philanthropic programs, provided over $106 million to nonprofits and more than 52K employees volunteered nearly 509,000 hours. Specifically, in Connecticut, $847,707 was donated to Project Purple, United Way, and Boys and Girls Club of Greenwich; Morgan Stanley employees donated $608,878 to the
Sandy Hook Promise Foundation, Shatterproof and Make a Wish Foundation of Connecticut; and 8,272 of volunteer hours went to the Greenwich Land Trust, Columbus House, and The Community Foundation for Greater New Haven. In the United States and United Kingdom, the 2019 Strategy Challenge delivered over 13,000 hours of pro bono
consulting hours to 14 nonprofits. Some of the Morgan Stanley's partner highlights include: In 2019, built their 23rd playground with KaBOOM! to deliver accessible and safe play spaces to over 10,000 children; distributed nearly 211 million meals to children and families in need through a 10-year partnership with Feeding America; and 2019 marked the fifth year
of the Healthy London Program. Through this program, over 60,000 meals have been delivered and play specialists have led over 5,700 hours of play for local children. Since its launch is Glasglow, 53,000 meals have been delivered with over 22,000 hours of play for children led by play specialists.
Internships/Scholarships: Morgan Stanley sponsors several scholarships and internships for diverse students and works closely with external partners to build and maintain a workforce that is diverse in experience
and background. Morgan Stanley's various programs offer students exposure to a variety of divisions at the firm to gain insights into the financial services sector, learn about the

Page 13 of 15
technology used and networking opportunities with professionals. Some of the programs to recruit diverse candidates include: The Morgan Stanley MBA Fellowship, the Richard B. Fisher Scholarship, the Sales and Trading Enrichment Program, the Investment Management
& Wealth Management Diversity Open House, The Technology Showcase and the Return to Work Program. In addition, the firm works to develop its diverse individuals by offering their employees challenging opportunities, career development programs, networking opportunities,
coaching and access and exposure to senior management through various programs such as the Leadership Conference for Newly Promoted Women Managing Directors, Leadership Engagement and Development Program, and the Morgan Stanley Wealth Management's biennial Women's and Multicultural Leadership Summits, among others.
Procurement: Morgan Stanley has a supplier Diversity Program whereby the firm seeks to partner with minority and multicultural businesses, run by women, veterans, physically challenged
individuals and members of the LGTB community, that meet the firm's competitive standards to better serve their employees, clients and communities.

Page 14 of 15
SUMMARY OF RESPONSES TO ATTACHMENT M (REAL ESTATE): EVALUATION AND
IMPLEMENTATION OF SUSTAINABLE PRINCIPLES
SUBMITTED BY MORGAN STANLEY INVESTMENT MANAGEMENT, INC.
Morgan Stanley Investment Management (MSIM) has been a signatory to the UN Principles of Responsible Investment since 2013 and is a member/signatory of 20 other sustainability -oriented groups.
The firm's disclosure conveyed a clear commitment to ESG considerations in its investment process. The firm assesses energy and water cost/usage as a part of its pre-investment due diligence process. They actively engage general partners (GPs) on these matters as part of its ongoing monitoring
process and conduct evaluations based on sustainability reports and energy usage/costs summaries of the underlying assets submitted by GPs. The firm utilizes a multitude of resources to assist with energy and water research, and engages with
MSCI, Sustainalytics, ISS, S&P Trucost, and Bloomberg f or overall ESG research and training. MSIM benchmarks its investment portfolios across real estate and other real assets against both public and private benchmarking options, most notably, the Global Real Estate Sustainability Benchmark (GRESB).
Overall, MSIM's disclosure suggested comprehensive integration of ESG considerations in its investment processes.

Page 15 of 15

BOSTON CHICAGO LONDON MIAMI NEW YORK PORTLAND SAN DIEGO CONFIDENTIAL
MEKETA INVESTMENT GROUP
Morgan Stanley Investment
Management/CRPTF
Real Assets Co-Investment
Partnership
September 8, 2021
Private Markets Investment Memorandum

MEKETA INVESTMENT GROUP 1
BOSTON OFFICE 80 University Avenue
Westwood, MA 02090
(781) 471-3500
NEW YORK OFFICE 48 Wall Street
11th Floor
New York, NY 10005
(212) 918-4783
SAN DIEGO OFFICE 5796 Armada Drive, Suite 110
Carlsbad, CA 92008
(760) 795-3450
MIAMI OFFICE 5200 Blue Lagoon Drive, Suite 120
Miami, FL 33126
(305) 341-2900
PORTLAND OFFICE 2175 NW Raleigh Street, Suite 300A
Portland, OR 97209
(503) 226-1050
CHICAGO OFFICE 1 East Wacker Drive, Suite 1210
Chicago, IL 60601
(312) 474-0900
LONDON OFFICE 25 Green Street
London, UK W1K 7AX
+44 (0)20 3841-6255
Confidentiality: This communication has been prepared by Meketa Investment Group solely for the use by the intended
recipient in its evaluation of the investment manager (“Manager”) that is the subject of this communication (such
evaluation, the “Purpose”). In taking receipt of this communication, the recipient acknowledges and agrees: (i) this
communication contains, reflects or is based on information of the Manager and/or one or more of its affiliates not
generally available to the public (“Information”); (ii) it shall maintain this communication in strict confidence, use
all reasonable efforts to prevent the unauthorized use, disclosure or dissemination of this communication; (iii) it will
use this communication solely for the Purpose; (iv) that it will not distribute or otherwise divulge this communication
to any person other than its legal business, investment or tax advisors in connection with obtaining the advice of any
such person in connection with the Purpose; and (v) it will promptly remove any Information (as directed by Meketa
Investment Group) from this communication and to certify such removal in writing to Meketa Investment Group. If recipient
is requested or required by law or legal process to disclose this communication, in whole or in part, it agrees that it
shall provide Meketa Investment Group with prompt written notice of such request or requirement and will reasonably
cooperate with the Manager and/or one or more of its affiliates in its and/or their efforts to obtain a protective order
or other appropriate remedy to limit disclosure of the Information.
Confidentiality: This communication has been prepared by Meketa Investment Group solely for the use by the intended
recipient in its evaluation of the investment manager (“Manager”) that is the subject of this communication (such
evaluation, the “Purpose”). In taking receipt of this communication, the recipient acknowledges and agrees: (i) this
communication contains, reflects or is based on information of the Manager and/or one or more of its affiliates not
generally available to the public (“Information”); (ii) it shall maintain this communication in strict confidence, use
all reasonable efforts to prevent the unauthorized use, disclosure or dissemination of this communication; (iii) it will

MEKETA INVESTMENT GROUP 2
MSIM CRPTF REAL ASSETS CO-INVESTMENT PARTNERSHIP
Private Markets Investment Memorandum
Table of Contents
Table of Contents
EXECUTIVE SUMMARY ________________________________________ 3
INVESTMENT STRATEGY _______________________________________ 9
MANAGER BACKGROUND _____________________________________ 18
INVESTMENT RESOURCES AND EXPERIENCE ____________________ 19
INVESTMENT PROCESS _______________________________________ 24
HISTORICAL PERFORMANCE __________________________________ 26
ENVIRONMENTAL, SOCIAL, & CORPORATE GOVERNANCE __________ 32
OPERATIONS _______________________________________________ 35
OTHER ITEMS _______________________________________________ 38
ANALYSIS & CONCLUSIONS ___________________________________ 40
APPENDICES ________________________________________________ 44
Exhibit 1: Partnership Terms _______________________________________________ 45
Exhibit 2: Professional Biographies __________________________________________ 48
Exhibit 3: Manager Meetings________________________________________________ 53
Exhibit 4: Reference Checks________________________________________________ 54
Exhibit 5: Background Checks______________________________________________ 56

MEKETA INVESTMENT GROUP 3
MSIM CRPTF REAL ASSETS CO-INVESTMENT PARTNERSHIP
Private Markets Investment Memorandum
Executive Summary
Executive Summary
DILIGENCE PROCESS
Meketa Investment Group (“Meketa”) initiated its evaluation of Morgan Stanley Investment
Management’s (“MSIM” or the “Manager”) proposed Real Assets Co-Investment Partnership
(“RACP”), a “fund of one” , discretionary separate account (the “Account”) in August 2021 at the
request of Connecticut Retirement Plans and Trust Funds (“CRPTF"). MSIM offers a range of
bespoke strategies to institutional investors from its Customized Solutions Platform and this
Account’s mandate will be to make private markets co-investments on a discretionary basis on
behalf of CRPTF in real estate, infrastructure, natural resources, and related other real assets.
CRPTF Staff conducted a search process and identified and selected the Manager for this real
assets mandate. Meketa did not evaluate any other participants or offerings during the search
process.
As part of a comprehensive due diligence process, Meketa completed a thorough review of all
marketing materials and other supporting documentation related to the offering, including the
Manager’s response to Meketa’s Due Diligence Questionnaire , and the draft Investment
Guidelines (as of August 25, 2021). Meketa also conducted two virtual meetings with the MSIM
team: an introductory session with the senior team on August 5, 2021; and an in-depth due
diligence session on August 18, 2021 with the senior team that covered the organization, strategy
development and execution, historical performance, and operations among other topics . Virtual
meetings were held in lieu of in-person meetings due to the travel policy restrictions and other
considerations related to COVID-19 at the time of Meketa’s diligence. Meketa also conducted a
number of reference calls to further assess the Manager, team, and strategy.
MANAGER BACKGROUND
Account Name Manager Office Location(s) Target Market Target Geography
CRPTF Real Assets
Co-Investment
Partnership
Morgan Stanley
Investment
Management 52 offices in 22 countries
Infrastructure,
Natural
Resources, and
Real Estate
Global
Morgan Stanley Investment Management was established in June 1975, when Morgan Stanley
Asset Management Inc. (later changing its name to Morgan Stanley Investment Management
Inc.) was established in New York, NY. MSIM became a subsidiary of Morgan Stanley Group Inc.

MEKETA INVESTMENT GROUP 4
MSIM CRPTF REAL ASSETS CO-INVESTMENT PARTNERSHIP
Private Markets Investment Memorandum
Executive Summary
in 1980 and registered with the SEC under the Investment Advisers Act of 1940 on
January 29, 1981. MSIM provides global asset management products and services spanning the
risk and return spectrum across geographies, investment styles and asset classes, including
equity, fixed income, alternatives and private markets to a wide range of investors and
institutions. On March 1, 2021, Morgan Stanley completed its acquisition of Eaton Vance. The
combined organization creates an asset management firm with $1.5 trillion in assets under
management and expands its client solutions, consultants and business partners globally. The
acquisition of Eaton Vance does not have any impact on the services, team or product offering
related to the real assets co-investment mandate.
In aggregate, MSIM’s AUM comprises a variety of strategies, including High Conviction Equities
($404 billion), Active Fixed Income & Liquidity ($547 billion), Alternative Investments
($110 billion), Sustainable Investing ($50 billion), and Customized Solutions ($501 billion).
Specifically, the Customized Solutions Platform houses the Portfolio Solutions team, which
designs and manages custom multi-asset portfolios for institutional and high net worth investors,
including providing Outsourced Chief Investment Officer (“OCIO”) services . The team has
developed 25 partnerships since its inception in 2009, representing $16 billion in total assets. In
addition to Portfolio Solutions, Customized Solutions also encompasses Hedge Fund Solutions,
Parametric and a Liquidity & Overlay Business (both from Eaton Vance), two multi-asset
businesses, FundLogic, and other smaller businesses.
OFFERING TERMS
Account Size Management
Fee1
Carry And
Carry
Structure
Preferred
Return
Fee
Income
Inv. Period And
Total Term
Total target up to $175 million
deployed per year.
Infrastructure & Natural Resources
target/year: $50 million to
$75 million.
Real Estate target/year: $75 million
to $100 million.
45 bps on
invested
capital
7% whole
fund
8% net of
fees N/A
3 years minimum
commitment for fee
rate; total term per
underlying
investments.
1 Assumes a minimum of three-year commitment: implied target of $375 million to up to $525 million.

MEKETA INVESTMENT GROUP 5
MSIM CRPTF REAL ASSETS CO-INVESTMENT PARTNERSHIP
Private Markets Investment Memorandum
Executive Summary
STRATEGY
MSIM is proposing to create a co-investment multi-manager portfolio of real asset opportunities
across private real estate, infrastructure, and natural resources segments globally. The platform seeks
to:
Enable CRPTF to develop co-investment activities within real assets in an effort to
generate solid returns and further expand CRPTF’s reputation as a limited partner of
choice;
Identify attractive co-investment opportunities with investment managers that are in CRPTF’s
real assets portfolio;
Utilize MSIM’s deep bench of relationships and market exposure to identify investment
opportunities via MSIM’s network to produce risk adjusted returns and overall portfolio return
enhancement; and
Develop a strategic partnership between CRPTF and MSIM in an effort to leverage resources,
gain more market access, and provide training to CRPTF staff.
CRPTF looks to initially invest $75 million to $100 million within real estate and $50 million to $75 million
within infrastructure and natural resources on an annual basis. The Fund does not have any specific
targets with respect to sub-sector exposures but will maintain a focus on diversification. The
co-investment Account has a target return of 12% net of fees.
TRACK RECORD
REAL ASSET CO-INVESTMENTS: BY ASSET CLASS
AS OF MARCH 31, 2021 ($ IN MILLIONS)
Asset Class Year of
First
Investment
Invested
($)
Realized
Value
($)
Total
Value
($)
Net
Gross
Multiple2
(X)
Net
Gross
IRR2
(%)
Infrastructure & Natural Resources 2013 236.4 15.1 316.7 1.3 23.3
Real Estate 2009 469.3 586.3 734.7 1.6 12.8
Total 705.7 601.4 1,051.4 1.5 16.3
2 Net-Gross IRR and Net-Gross TVPIs are after deducting all underlying managers’ fees, expenses and carried interest paid
or accrued to date and taking into account cash balances drawn in advance of funding underlying investments but before
MSIM fees, expenses and carried interest paid or accrued to date.

MEKETA INVESTMENT GROUP 6
MSIM CRPTF REAL ASSETS CO-INVESTMENT PARTNERSHIP
Private Markets Investment Memorandum
Executive Summary
INVESTMENT ANALYSIS
Strengths
Platform Deal Flow and General Partner Network — MSIM has access to an extensive
network of General Partners (“GPs”) thereby positioning MSIM to gain exposure to
attractive co-investment opportunities in addition to CRPTF’s own GPs .
Team Experience and Resources — The team has a broad range of experience within real
assets, brings significant years of investing experience, is well versed in separately
managed accounts, and is supported by the broader Morgan Stanley platform.
Investment Themes and Research Capabilities — MSIM uses a global investment research
team to assist with deal sourcing and underwriting to build customized client portfolios.
Creative Investment Structure — The mandate provides flexibility to pursue attractive
deals across asset classes, sectors, property types, and geographies.
GP Access — The Account will position CRPTF before leading GPs as an attractive source
of capital with transaction reliability and diligence efficiency, and continue to strengthen
CRPTF’s reputation as a limited partner of choice .
Strategic Partnership — MSIM resources will provide client collaboration, training, and
investment tools for CRPTF staff.
Weaknesses
Conflicts of Interest — There is a potential for allocation conflicts and a lack of
transparency around allocation decisions as MSIM manages multiple co-investment
mandates for institutional investors and high net worth entities.
Deployment Capabilities — CRPTF’s mandate represents a meaningful increase in MSIM’s
annual capital deployment target within real assets co-investment opportunities and
MSIM has yet to demonstrate the ability to execute at these levels and target timeframe.
No Prior Co-investment Experience with CRPTF’s Managers — MSIM does not appear to
have co-invested with any of CRPTF’s existing real assets managers and it may take some
time for MSIM to forge relationships with them.
Aggregate MSIM Co-Investment Activity — MSIM’s reported real assets track record
consists of just 41 investments (35 deals) since its 2009 inception. Infrastructure and
natural resources account for only nine of the investments (seven deals), representing
$292 million of committed capital versus $530 million in real estate activity.
Senior Departure — The impact of the departure of an Executive Director is uncertain as
he played a significant role in the execution of real estate investments.

MEKETA INVESTMENT GROUP 7
MSIM CRPTF REAL ASSETS CO-INVESTMENT PARTNERSHIP
Private Markets Investment Memorandum
Executive Summary
Track Record — The real estate track record does not provide strong evidence of property
type or geographic expertise, or consistent repeat sourcing channels with key GP
relationships.
Double Fees — In some circumstances, CRPTF may pay fees to MSIM as well as to
underlying investment managers for investment opportunities.
Weak Alignment — MSIM is not making a GP contribution to the investment vehicle, which
highlights a lack of GP/LP alignment of interests.
CRPTF Governance Procedures — CRPTF needs to clearly define internal procedures and
processes for addressing any conflicts, issues and guideline changes to maintain the
efficiency of a delegated authority structure with an asset manager.
Opportunities
Broaden GP Exposure — This mandate will provide CRPTF with an opportunity to invest
with leading fund managers and to expand its manager relationships on a global basis.
Hands-on Participation — Under the proposed Strategic Partnership, CRPTF staff can
interact with managers, track market trends and investment opportunities, and follow
co-investment diligence.
Growth Potential — The initial mandate is relatively modest in size compared to CRPTF’s
real assets allocation but has the potential to scale up as CRPTF gains experience and if
co-investment appetite increases.
Threats
Limited Partner Competition — MSIM co-investments will compete with other Limited
Partners (“LPs”), including ones who are existing investors in the underlying funds,
highlighting potential accessibility issues.
Platform Demand — MSIM is not limited in the number of co-investment mandates it can
oversee, potentially further increasing competition for deal flow.
MSIM as a Competitor — MSIM has a number of commingled private funds that invest in
infrastructure and real estate, and GPs may not want colleagues of those fund teams
diligencing their underwriting, asset management, and other proprietary processes.

MEKETA INVESTMENT GROUP 8
MSIM CRPTF REAL ASSETS CO-INVESTMENT PARTNERSHIP
Private Markets Investment Memorandum
Executive Summary
CONCLUSION
Meketa believes that the Real Assets Co-Investment Partnership with MSIM is an attractive
structure that provides CRPTF with its initial foray into co-investments within the Real Assets
Portfolio. Since 2019, CRPTF has stated a desire to participate in co-investment opportunities
within the private markets asset classes. RACP will enable CRPTF to partner with a global asset
manager to participate in attractive opportunities with leading general partners investing in the
target asset classes. RACP allows co-investment opportunities to be identified, analyzed, and
underwritten via an efficient process while minimizing investment risks.
MSIM has assembled a solid investment team that has a strong track record of co-investments.
MSIM works with leading institutional investors and provides OCIO solutions to sophisticated
investors. MSIM takes a global perspective when evaluating investment opportunities, thereby
expanding CRPTF’s deal sourcing universe beyond its current roster. In addition, MSIM will
partner with CRPTF’s existing investment managers to further analyze more co -investment
opportunities that CRPTF is currently unable to address given staff restrictions and time
constraints. MSIM provides a platform whereby CRPTF will not forego attractive investment
opportunities due to these constraints.

MEKETA INVESTMENT GROUP 9
MSIM CRPTF REAL ASSETS CO-INVESTMENT PARTNERSHIP
Private Markets Investment Memorandum
Investment Strategy
Investment Strategy
OVERVIEW
MSIM customizes its Real Assets Solutions strategies by client mandate to pursue any
combination of primary fund investments, co-investments, secondaries, and other types of
vehicles to access underlying funds or individual assets or portfolio companies. The mandates
can cover all of infrastructure, natural resources, and real estate, or selectively focus on only
one or two asset classes, and/or selected sectors and/or property types. MSIM mandates are
also customizable by geography to focus on certain regions or exclude areas or countries .
CRPTF’s Account mandate will target primarily co-investments alongside commingled funds
across all three asset classes with a value-add and opportunistic risk-return profile in
North America, Western Europe, and other regions to a lesser extent. MSIM will source
opportunities from CRPTF’s own existing real assets General Partners (“GPs”), looking to invest
alongside CRPTF’s commingled funds, as well as with current GPs alongside funds CRPTF is not
invested. MSIM will also source co-investment opportunities for the Account from among the
universe of GPs other Portfolio Solutions clients are invested with, as well as MSIM’s broader,
firm-wide network of GP relationships. Primary fund investments may be made where MSIM can
secure co-investment access (i.e., “stapled primaries”). The Account’s Investment Guidelines
contemplate a three-year minimum investment period and target a return of 12% IRR net of fees.
Across all asset classes, MSIM will focus on segments of the market it believes are inefficient,
including middle-market scale, with absolute size relative to the asset class, sector, property
type, etc., and on deals where MSIM believes the GP has sufficient ability to control outcomes
(see additional asset-specific strategy descriptions below). The team emphasized the premium
it places not only on the quality of a GP, but on the specific quality and expertise of the deal team
associated with each particular opportunity. MSIM will also position clients where their aggregate
investment can offer a mutually beneficial solution to a GP ’s capital need that regular LPs,
investment banks, or other financing sources cannot. MSIM will look for attractive opportunities
where it has a competitive advantage by virtue of its relationships, information reach, resources
it can bring to bear from other Morgan Stanley divisions, and reputation as a deal partner trusted
to execute.

MEKETA INVESTMENT GROUP 10
MSIM CRPTF REAL ASSETS CO-INVESTMENT PARTNERSHIP
Private Markets Investment Memorandum
Investment Strategy
CRPTF ACCOUNT PORTFOLIO CONSTRUCTION
The Account’s Investment Guidelines and related documents will establish targets and
constraints for capital deployment by asset class, risk-return profile, geography, and investment
type, as summarized below. See also the Summary of Key Terms in Appendix Exhibit 2 for more
detail on diversification targets and limits.
Guideline Infrastructure & Natural
Resources
Real Estate RACP Account
Annual Target
Commitment $M 50 - 75 75 - 100 125 – 175
Bite Size Target approximately $15 million
$10 million minimum, up to $25 million
Implied # Deals 3 to 5 5 to 7 8 to 12
Deal Source:
CRPTF / MSIM 50% / 50% 25% / 75% 35% / 65% 3
Asset Class
Exposure % of Total 30% to 50% 50% - 70% 100%
Risk Profile
Exposure % of Total Core: 0% - 30%
Value-Add/Opp: 10% - 50%
Core 0% - 30%
Value-Add/Opp: 20% - 70%
Core 0% - 60%4
Value-Add/Opp:
40% - 100%
Geography
Exposure % of Total
North America 20% - 80% Europe 10% - 60%
Developed Asia 0% - 30% Emerging Markets 0% - 20%
Single GP
Concentration5 25% 25% 20%
INFRASTRUCTURE & NATURAL RESOURCES STRATEGY
Within infrastructure and natural resources, MSIM focuses on assets with long useful lives that
are essential to society and the economy, including energy businesses (primarily power
generation and midstream energy), utilities, transportation assets, social infrastructure, and
select infrastructure service companies. MSIM anticipates that co-investments are likely to come
from deals with exposures reflecting the impact of key mega trends such as population growth,
urbanization, technology changes, and rising public debt.
3 Approximation, could range from 32.5% /67.5% to 37.5% / 62.5% across bounds of possibilities. 4 Implied by asset-class level guidelines. 5 Based on committed capital as a percentage of the intended aggregate Annual Commitments over the three-year
Commitment Period.

MEKETA INVESTMENT GROUP 11
MSIM CRPTF REAL ASSETS CO-INVESTMENT PARTNERSHIP
Private Markets Investment Memorandum
Investment Strategy
Prior Infrastructure & Natural Resources Co-Investments
Of MSIM’s 41 co-investment deals provided as the team’s track record, only nine were
infrastructure/natural resources related, representing $292 million of total capital committed,
with the majority deployed between 2018 and 2021. Meketa would classify six as infrastructure
and three as natural resources, as described below and illustrated in the accompanying charts:
North American pallet business;
UK company providing rapid charging units for electric vehicles;.
Portfolio of rolled-over power, utilities, and other natural resources investments;
Four European-based shipping vessels;
Canadian midstream energy services provider;
Company producing oils and lubricants by recycling used inputs; and
Investment in a European agri-food business focusing on the fruit and vegetable industry.
IS & NR Co-Invest Capital Deployed: Sector IS & NR Co-Invest Capital Deployed: Geography
Current and Forward-Looking Infrastructure & Natural Resources Themes
MSIM provided Meketa with its top-down infrastructure and natural resources market views and
screening criteria, which it will combine with its bottom-up sourcing to develop co-investment
opportunities in these sectors, as Meketa has summarized below.
Infrastructure
Post-COVID-crisis opportunities exist in devalued areas such as transport, but deal
volume has been limited (could look for preferred equity positions in these assets).
Digital infrastructure was resilient during COVID and has strong growth trajectories in
most geographies for increasing installed fiber, wireless, and data centers.
4%
28%
20%13%3%
27%
5%
Energy Transition
Energy & Power
Logistics
Midstream
Shipping
Agribusiness
Decarbonization
53%
13%
3%
27%
4% North America
Canada
Europe
Spain
UK

MEKETA INVESTMENT GROUP 12
MSIM CRPTF REAL ASSETS CO-INVESTMENT PARTNERSHIP
Private Markets Investment Memorandum
Investment Strategy
Renewables deal volumes continue to be strong in most geographies, with clean energy
transition goals also driving interest in related assets, such as energy storage,
transmission and distribution, and electric vehicle infrastructure.
Somewhat unique to infrastructure, MSIM looks for deals where the seller is retaining a
piece and/or staying on as operator and the manager brings a competitive advantage to
the go-forward partnership.
Agriculture
Preference exists for product differentiation and opportunities to include vertical
integration for margin capture and natural price hedging.
MSIM is cautious on homogenous commodity outputs and consolidated midstream
operations.
The team will look for seasonal diversification to mitigate supply-demand imbalances.
Timber
MSIM is focused on opportunities with clear value-creation strategies, particularly those
with vertical integration components and entry advantages.
The Team is cautious around investment returns driven by exogenous, market-related
risk factors.
Energy
Their midstream focus is on the level of commodity exposures, contracted revenues, and
counterparty quality.
Traditional exploration and production pricing is suppressed, and out of public market
favor, creating some private opportunities; they are wary of potential further downside.
Energy transition, decarbonization, and fossil fuel impact reduction goals create new
businesses in recycling, services, and some areas overlapping with infrastructure.

MEKETA INVESTMENT GROUP 13
MSIM CRPTF REAL ASSETS CO-INVESTMENT PARTNERSHIP
Private Markets Investment Memorandum
Investment Strategy
REAL ESTATE STRATEGY
Within real estate, MSIM presented an unconstrained investment approach that allows MSIM to
allocate capital based on macro-economic trends, government policy, and geo-political factors.
MSIM will focus on global gateway markets, which demonstrate liquidity, and properties managed
by best-in-class, vertically integrated local market experts. More tactically, MSIM currently
favors industrial and residential investments, along with investments in life science properties
and select service hotels in resort/leisure locations.
Based on MSIM’s review of the client’s portfolio, it proposes investing primarily in value-add and
opportunistic opportunities in the U.S., Europe and Asia Pacific regions. MSIM also noted it
intends to collaborate on co-investments with emerging and diverse GPs.
Prior Real Estate Co-Investments
Of MSIM’s 41 co-investment deals provided as the Team’s track record, 32 were real estate
investments representing $530 million of total capital committed. Notably, five of the
investments are part of a single, sector-specific, programmatic co-investment venture (NYC
Hotels – 2020). Including these five, MSIM has made fourteen real estate commitments since
the beginning of 2016, or less than three per year. Co-investments have been made in the U.S.,
South America, Europe, the Middle East and Asia-Pacific, and across property sectors. The tables
and charts below summarize investment diversification by count and capital across property
type and geography.
Property Type Diversification to Date (Investments)
2009-2015 2016-2021 Total RE Co-Invest Capital Deployed – Type
Residential 5 3 8
Hotel 2 5 7
Office 4 2 6
Industrial 4 1 5
Retail 2 1 3
Student Housing 0 2 2
Self-Storage 1 0 1
Total 18 14 32
11%
24%
23%
25%
3%
7%7%
Hotel
Industrial
Office
Residential
Retail
Self-Storage
Student Housing
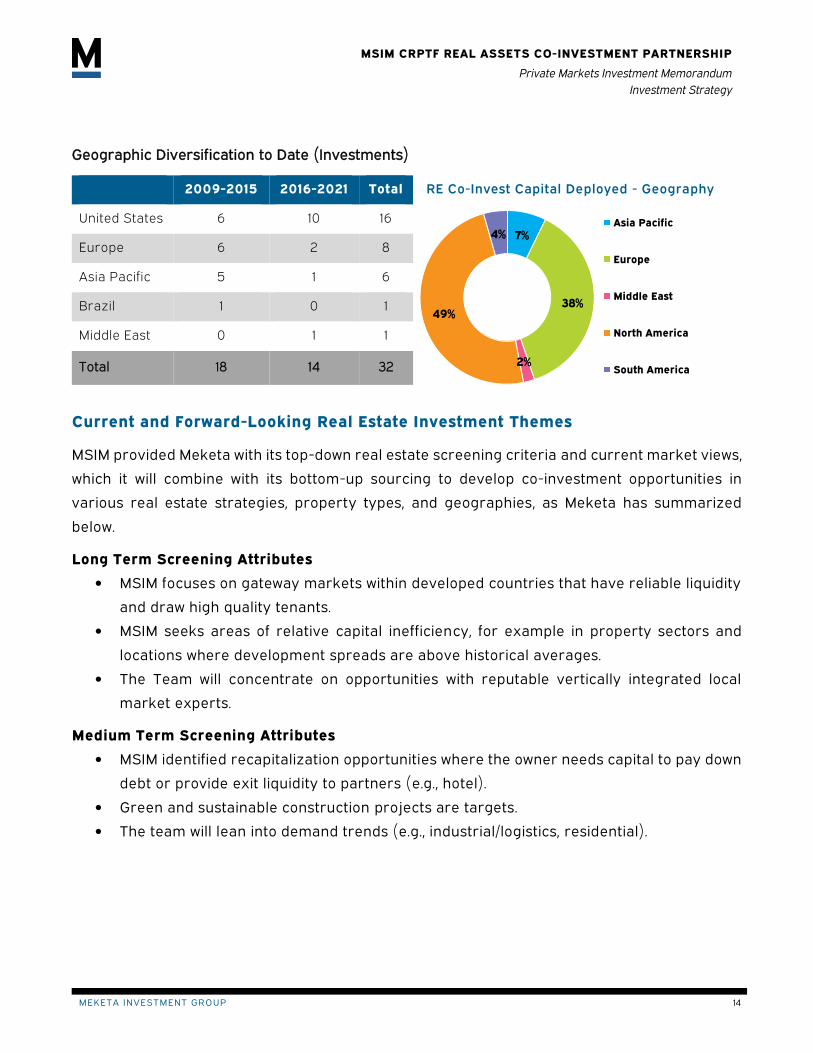
MEKETA INVESTMENT GROUP 14
MSIM CRPTF REAL ASSETS CO-INVESTMENT PARTNERSHIP
Private Markets Investment Memorandum
Investment Strategy
Geographic Diversification to Date (Investments)
Current and Forward-Looking Real Estate Investment Themes
MSIM provided Meketa with its top-down real estate screening criteria and current market views,
which it will combine with its bottom-up sourcing to develop co-investment opportunities in
various real estate strategies, property types, and geographies, as Meketa has summarized
below.
Long Term Screening Attributes
MSIM focuses on gateway markets within developed countries that have reliable liquidity
and draw high quality tenants.
MSIM seeks areas of relative capital inefficiency, for example in property sectors and
locations where development spreads are above historical averages.
The Team will concentrate on opportunities with reputable vertically integrated local
market experts.
Medium Term Screening Attributes
MSIM identified recapitalization opportunities where the owner needs capital to pay down
debt or provide exit liquidity to partners (e.g., hotel).
Green and sustainable construction projects are targets.
The team will lean into demand trends (e.g., industrial/logistics, residential).
2009-2015 2016-2021 Total RE Co-Invest Capital Deployed - Geography
United States 6 10 16
Europe 6 2 8
Asia Pacific 5 1 6
Brazil 1 0 1
Middle East 0 1 1
Total 18 14 32
7%
38%
2%
49%
4%Asia Pacific
Europe
Middle East
North America
South America

MEKETA INVESTMENT GROUP 15
MSIM CRPTF REAL ASSETS CO-INVESTMENT PARTNERSHIP
Private Markets Investment Memorandum
Investment Strategy
U.S. Market View
MSIM sees a strong post-COVID recovery supported by stimulus:
o $2 trillion in excess savings exists to support household consumption; and
o Resilient capital markets and strong investor demand put downward pressure on
yields (particularly for in-favor property types).
MSIM will focus on large markets benefiting from population in-migration (e.g., Sunbelt),
and markets with a strong life science tenant base (e.g., South San Francisco, San Diego,
Boston).
Europe Market View
The economy is expected to accelerate in second half of 2021 supporting a rebound in
fundamentals:
o An older demographic with slower population growth in most countries will likely
limit longer term growth prospects; and
o Inflation is expected to remain low and yield spreads should remain attractive,
contributing to strong investor demand.
MSIM will focus on locations that benefit from e-commerce growth and resilient supply
chains, and cities with strong population and employment growth prospects.
Asia Pacific Market View
The region experienced a faster post-COVID recovery; however, renewed lockdowns have
begun to slow growth:
o Longer term demographics remain favorable in many markets, but less so in China
and Japan; and
o China’s growth remains pivotal to the region, though increased regulation and
heightened tensions with the U.S. are creating volatility .
MSIM will focus on stable and defensive markets (i.e., Japan) and Chinese markets with
urbanization trends and strong economic clusters.

MEKETA INVESTMENT GROUP 16
MSIM CRPTF REAL ASSETS CO-INVESTMENT PARTNERSHIP
Private Markets Investment Memorandum
Investment Strategy
EXISTING INVESTMENTS AND PIPELINE
The Account has not made any investments to date, and it is not expected that CRPTF will have
access to any of the existing co-investments MSIM’s Portfolio Solutions group has made to date
on behalf of other clients. MSIM provided a pipeline of opportunities which appears to be in line
with the strategy and desired diversification needs of the CRPTF mandate.
MSIM REAL ASSETS CO-INVESTMENT ACTIVITY: 2009 – 2021
The charts on the following page show MSIM’s level of co-investment activity in real assets by
capital committed and number of deals, with horizontal lines marking the annual targets for
CRPTF’s Account. The charts illustrate that the Account’s mandate will represent a significant
increase in MSIM’s activity, both by the level of capital and number of deals.

MEKETA INVESTMENT GROUP 17
MSIM CRPTF REAL ASSETS CO-INVESTMENT PARTNERSHIP
Private Markets Investment Memorandum
Investment Strategy
MSIM Real Asset Co-Investment Activity: 2009 - 2021
$-
$20
$40
$60
$80
$100
$120
$140
$160
$180
$200
20
09
20
10
20
11
20
12
20
13
20
14
20
16
20
17
20
18
20
19
20
20
20
21
MSIM Real Assets Co-Investment Commitments $M
MSIM RA
CT Low
CT High
01
23456789
1011
1213
20
09
20
10
20
11
20
12
20
13
20
14
20
16
20
17
20
18
20
19
20
20
20
21
MSIM Real Assets Co-Investment Commitments #
Deals
MSIM RA
CT Low
CT High
$-
$10
$20
$30
$40
$50
$60
$70
$80
$90
$100
20
09
20
10
20
11
20
12
20
13
20
14
20
16
20
17
20
18
20
19
20
20
20
21
MSIM Infrastructure & Natural Resources Co-
Investment Commitments $M
MSIM IS/NR
CT IS/NR Low
CT IS/NR High
01
23456789
1011
1213
20
09
20
10
20
11
20
12
20
13
20
14
20
16
20
17
20
18
20
19
20
20
20
21
MSIM Infrastructure/Natural Resources Co-
Investment #Deals
MSIM IS/NR
CT IS/NR Low
CT IS/NR High
$-
$20
$40
$60
$80
$100
$120
$140
20
09
20
10
20
11
20
12
20
13
20
14
20
16
20
17
20
18
20
19
20
20
20
21
MSIM Real Estate Co-Investment Commitments $M
MSIM RE
CT RE Low
CT RE High
0
1
2
3
4
5
6
7
8
9
10
11
12
13
20
09
20
10
20
11
20
12
20
13
20
14
20
16
20
17
20
18
20
19
20
20
20
21
MSIM Real Estate Co-Investment #Deals
MSIM RE
CT RE Low
CT RE High

MEKETA INVESTMENT GROUP 18
MSIM CRPTF REAL ASSETS CO-INVESTMENT PARTNERSHIP
Private Markets Investment Memorandum
Manager Background
Manager Background Founded in 1935, Morgan Stanley is a publicly traded financial services institution providing a
variety of solutions across investment banking, securities, investment management, and wealth
management. To date, the company’s global footprint spans 41 countries and includes over
71,000 employees. Within the broader Morgan Stanley platform, three distinct business
segments comprise total firm activity, including the Institutional Securities Group, Wealth
Management, and Investment Management, the latter of which will serve as the Manager of the
CRPTF Co- Investment Partnership.
Founded in 1975, Morgan Stanley Investment Management (MSIM) provides global asset
management products and services to a wide range of investors and institutions. The Firm is
based over 52 offices in 22 countries, with 2,849 employees, of which 1,134 are investment
professionals. Additionally, Morgan Stanley recently completed its acquisition of Eaton Vance in
March 2021, integrating the business as part of the overall MSIM platform. As of June 30, 2021,
MSIM has over $1.5 trillion in AUM across its variety of strategies, consisting of High Conviction
Equities ($404 billion), Active Fixed Income & Liquidity ($547 billion), Alternative Investments
($110 billion), Sustainable Investing ($50 billion), and Customized Solutions ($501 billion).
The Customized Solutions Division within MSIM houses the Portfolio Solutions group that
manages custom multi-asset portfolios, outsourced CIO programs, and liquid alternative
investment strategies for institutional and high net worth investors. As of June 30, 2021, the
group had approximately $16 billion in assets across 25 partnerships and has committed over
$2 billion to real assets investments since inception in 2009. In addition to Portfolio Solutions,
the Customized Solutions Platform also comprises: Hedge Fund Solutions ($22 billion);
Parametric, which manages customized direct indexing portfolios ($280 billion); a Liquidity &
Overlay Business ($130 million); two multi-asset businesses ($36 billion); FundLogic, an
alternatives and systematic investment solutions business ($11 billion), and other smaller
businesses.

MEKETA INVESTMENT GROUP 19
MSIM CRPTF REAL ASSETS CO-INVESTMENT PARTNERSHIP
Private Markets Investment Memorandum
Investment Resources and Experience
Investment Resources and Experience The Portfolio Solutions team comprises 26 total professionals across investment research,
investment administration, data management, and the Investment Committee. The Investment
Committee, including senior members Rui de Figueiredo, Ted Eliopoulos, Ryan Meredith,
Catherine Hong, Steven Turner, and Damon Wu, will be responsible for day-to-day portfolio
oversight and management of the CRPTF Real Asset Co-Investment mandate. Mr. Figueiredo,
Mr. Meredith, Ms. Hong, and Mr. Wu have worked together as Portfolio Managers at Morgan
Stanley for 14 years, in addition to their previous time together at Citigroup. Mr. Turner joined
the team over nine years ago, while Mr. Eliopoulos is the most recent addition, joining in 2019.
The leadership team is directly supported by a 13-person investment research team that
executes sourcing, diligence, and monitoring of the real asset co-investment opportunities.
Additional investment administration and data management employees provide operational
expertise to the group, implementing administration, structuring, and reporting for the
Partnership. The Portfolio Solutions team will also leverage the broader Morgan Stanley
platform, including investment research specialists across AIP Private Markets & Hedge Fund
Solutions (110 professionals), MS Private Real Estate (200 professionals), and MS Private
Infrastructure (50 professionals), for depth in investment sourcing, diligence, transaction
structuring, and execution, as well as operations personnel for portfolio services and
administration, reporting and analysis, information technology, compliance, marketing, legal and
tax.
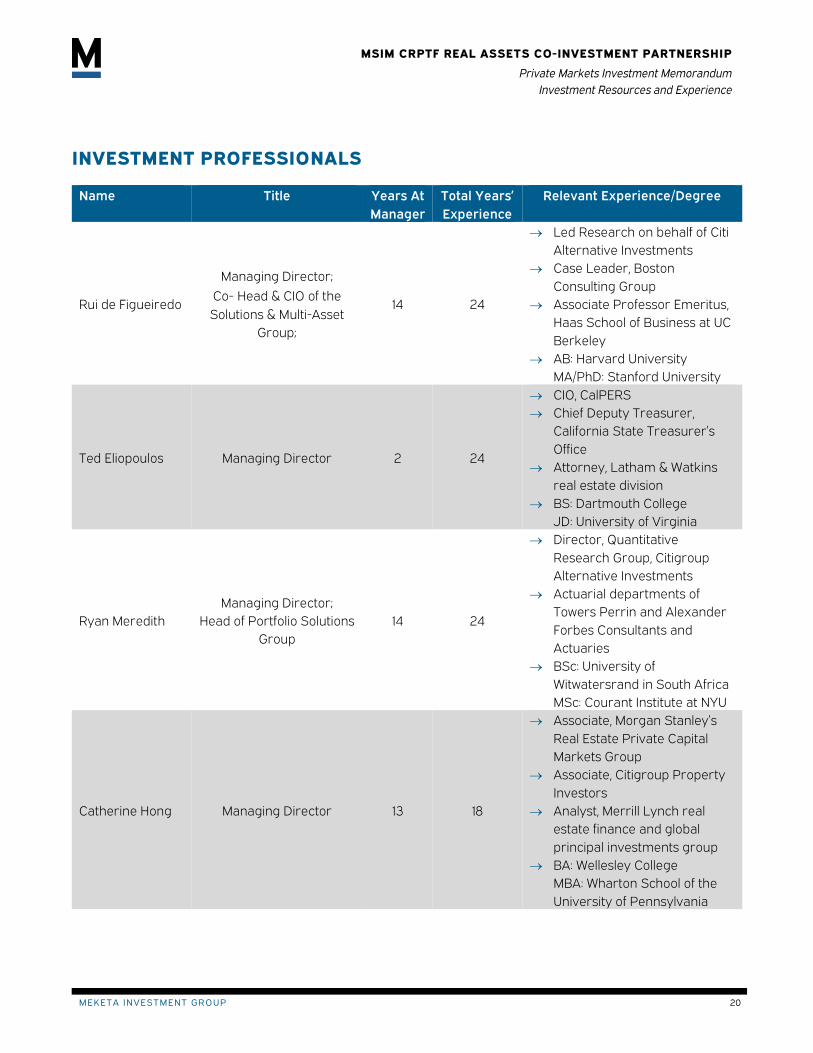
MEKETA INVESTMENT GROUP 20
MSIM CRPTF REAL ASSETS CO-INVESTMENT PARTNERSHIP
Private Markets Investment Memorandum
Investment Resources and Experience
INVESTMENT PROFESSIONALS
Name Title Years At
Manager
Total Years’
Experience
Relevant Experience/Degree
Rui de Figueiredo
Managing Director;
Co- Head & CIO of the
Solutions & Multi-Asset
Group;
14 24
Led Research on behalf of Citi
Alternative Investments
Case Leader, Boston
Consulting Group
Associate Professor Emeritus,
Haas School of Business at UC
Berkeley
AB: Harvard University
MA/PhD: Stanford University
Ted Eliopoulos Managing Director 2 24
CIO, CalPERS
Chief Deputy Treasurer,
California State Treasurer’s
Office
Attorney, Latham & Watkins
real estate division
BS: Dartmouth College
JD: University of Virginia
Ryan Meredith
Managing Director;
Head of Portfolio Solutions
Group
14 24
Director, Quantitative
Research Group, Citigroup
Alternative Investments
Actuarial departments of
Towers Perrin and Alexander
Forbes Consultants and
Actuaries
BSc: University of
Witwatersrand in South Africa
MSc: Courant Institute at NYU
Catherine Hong Managing Director 13 18
Associate, Morgan Stanley’s
Real Estate Private Capital
Markets Group
Associate, Citigroup Property
Investors
Analyst, Merrill Lynch real
estate finance and global
principal investments group
BA: Wellesley College
MBA: Wharton School of the
University of Pennsylvania

MEKETA INVESTMENT GROUP 21
MSIM CRPTF REAL ASSETS CO-INVESTMENT PARTNERSHIP
Private Markets Investment Memorandum
Investment Resources and Experience
Name Title Years At
Manager
Total Years’
Experience
Relevant Experience/Degree
Steve Turner Executive Director 9 13
Analyst, Mercer Investment
Management
BSc: University of
Southampton
MSc: International Capital
Markets Association Centre at
Henley Business School
Damon Wu Executive Director 14 14
Associate, Merrill Lynch
BS: National Taiwan University
MBS/MS: Case Western
Reserve University
MS: Carnegie Mellon
University
Pennapa
Tantiyakul Executive Director 11 13
Hedge Fund Research Analyst,
Lipper
Quantitative Analyst, ING Fund
of Hedge Funds
Business Consultant, IBM
BS: Chulalongkorn University
MS: University of Chicago
Alicia Biggs Vice President 8 11
Business Development,
Hukkster
Associate, Roundtable
Investment Partners &
Carleon Capital Partners
BS: Princeton University
MPA: University of
Pennsylvania
Yige Zou Vice President 8 8
Associate, Morgan Stanley
Investment Management
BS: Renmin University of China
MS: New York University
Blanca Garcia
Requesens Vice President 9 9 BS: Northeastern University
Nick Di
Giampasquale Vice President 6 12
Associate, Mercer in Fiduciary
Management
BS: University of Nottingham
Greg Waterman Vice President 1 15
Vice President and Senior
Equity Analyst, Cortina Asset
Management
Vice President, Goldman
Sachs
BA: Duke University

MEKETA INVESTMENT GROUP 22
MSIM CRPTF REAL ASSETS CO-INVESTMENT PARTNERSHIP
Private Markets Investment Memorandum
Investment Resources and Experience
Name Title Years At
Manager
Total Years’
Experience
Relevant Experience/Degree
Joshua Myers Vice President <1 10
Vice President, Good Hill
Partners
Senior Associate, Neuberger
Berman Alternatives
BS: New York University
FIRM DIVERSITY
Staff Demographics (%) Male Female Minority Non-Minority
Entire Staff 49 51 34 66
All Investment Professionals 63 37 46 54
Senior Investment Professionals 78 22 26 74
OWNERSHIP & COMPENSATION
Morgan Stanley employees receive a discretionary compensation package comprised of a base
salary and discretionary variable incentive compensation. The fixed compensation amounts are
not compared to any peer group, but rather determined by one or more of the following factors
depending on the specific team and circumstances: revenue and profitability of the business
and/or fund/account managed by the portfolio manager; revenue and profitability of the firm;
risk factors; assets managed by the portfolio manager; external market conditions; new business
development; contribution to client objectives; pre-tax investment performance; and individual
contribution and performance.
Discretionary variable incentive compensation typically includes a combination of cash bonus
and deferred incentive awards, a significant percentage of which is subject to vesting conditions
and market and cancellation risk. The Compensation, Management, Development, and
Succession Committee of the Morgan Stanley Board of Directors approves the amount of
variable compensation to be allocated to deferred incentive awards annually. For the CRPTF Real
Assets Co-Investment Partnership, the Portfolio Solutions team will also participate in any
carried interest paid to MSIM, based on Account performance, split between the team and
Morgan Stanley.

MEKETA INVESTMENT GROUP 23
MSIM CRPTF REAL ASSETS CO-INVESTMENT PARTNERSHIP
Private Markets Investment Memorandum
Investment Resources and Experience
DEPARTURES
Since inception, five senior professionals—two Executive Directors, one Managing Director, and
two Vice Presidents—have departed the Portfolio Solutions team. One Managing Director who
departed in 2018, was a member of the Investment Committee; however, MSIM described his role
as more of an oversight position with his expertise primarily focused on operational functions.
Additionally, one Executive Director who was the most recent departure in 2021, reported to
Catherine Hong on the real estate side while at MSIM, and his responsibilities have been taken
over by several existing staff and new hires, including Joshua Myers.
PERSONNEL SUMMARY
MSIM employs almost 3,000 employees globally, including 1,134 investment professionals. Within
the broader platform, 26 professionals are dedicated to the Portfolio Solutions team, which will
manage the CRPTF Real Assets Co-Investment Partnership on a daily basis, alongside other
client mandates across its current roster of 25 total relationships. MSIM believes the current
team is appropriately staffed to successfully execute the guidelines of this specific mandate, but
will continue to look for high quality talent with plans to hire two investment professionals with
real asset experience within the next 18 months.

MEKETA INVESTMENT GROUP 24
MSIM CRPTF REAL ASSETS CO-INVESTMENT PARTNERSHIP
Private Markets Investment Memorandum
Investment Process
Investment Process The investment team is responsible for sourcing, with senior members covering specific areas of focus.
The team conducts sourcing through a variety of channels: its established brand; existing GP
relationships and personal networks; the team’s market survey and outreach; and the broader Morgan
Stanley platform and resources. The team has additional sourcing channels through MSIM’s broader
investment platform including AIP Private Markets & Hedge Fund Solutions (110 professionals,
$31.7 billion in AUM), MS Private Real Estate (200 professionals, $36.4 billion), and MS Private
Infrastructure (50 professionals, $6.4 billion).
The co-investment team is integrated with the primary fund investment team, allowing for efficient
co-investment due diligence processes and on-going monitoring. Following the sourcing of a
prospective investment, the co-investment process has two phases: the preliminary screening phase;
and a more rigorous quantitative and qualitative analysis. The team screens opportunity for fit and
develops an initial view of the prospective opportunity based on client co-investment criteria during the
initial phase. If the criteria are likely to be met, the team presents the opportunity to the Investment
Committee (the “IC”) to discuss interest and concerns. The next phase entails a detailed examination
specific to each sponsor and asset, confirming initial findings in a comprehensive manner and
developing an independent underwriting.
If the deal team reaches consensus on the co-investment opportunity, the team prepares an
investment memorandum, including criteria such as: rationale and investment thesis including desired
investment amount; due diligence analysis; merits, risks and mitigants; and Environmental, Social, and
Governance diligence. The due diligence process covers sponsor-specific and asset-specific aspects,
which include: quality (team, resources, track record, integrity); fit (sponsor’s experience and fit in the
targeted asset and strategy); alignment of interest, and sponsor profile. The asset is analyzed based on
a number of factors, including: the submarket’s supply and demand dynamics and macroeconomic
perspective; transaction structure, including entry valuation, leverage, and terms; ESG risk profile; value
creation plan and return profile. The team also reviews the prospective process, including transparency
during diligence, timing, and capacity.
A recommendation is presented to the IC upon completion of the comprehensive due diligence. The IC
for CRPTF’s Account will be comprised of six senior members of the team as follows: Rui De Figueiredo,
Ted Eliopoulos; Ryan Meredith; Catherine Hong; Steven Turner; and Damon Wu. Five out of six consents
are required from the IC to approve an investment.

MEKETA INVESTMENT GROUP 25
MSIM CRPTF REAL ASSETS CO-INVESTMENT PARTNERSHIP
Private Markets Investment Memorandum
Investment Process
Following the due diligence but prior to the IC approval, the team initiates the execution phase.
Transaction execution addresses legal, economic, and structuring considerations. The transaction
support team initiates a review of governing documents and subscription materials while the deal team
finalizes the underwriting and negotiates terms. The transaction support team also engages in
negotiation of terms after the IC’s final approval. The co-investment will not be executed if the team, the
sponsor, and its counsel cannot reach an agreement on key terms.
The team relies on the primary fund manager or other primary sponsor of the investment to determine
the investment’s exit strategy. Where there is a Board of Directors for the asset or portfolio company,
the Team typically seeks board observer seats for co-investments to closely monitor developments
and remain engaged with the sponsors (MSIM’s collective capital in a co-investment would not typically
be large enough to garner a voting Board seat).

MEKETA INVESTMENT GROUP 26
MSIM CRPTF REAL ASSETS CO-INVESTMENT PARTNERSHIP
Private Markets Investment Memorandum
Historical Performance
Historical Performance MSIM provided track record data for the 41 co-investment deals and for the 27 individual separate
account mandates. The deal-level data includes net-gross TVMI and IRR (see footnotes this page), asset
class, industry, sourcing, and other deal-specific attributions. The account-level performance data,
including TVMI, IRR, were aggregated for each account, and do not identify which deal(s) each account
participated in, only the number. Each set of data are relevant for evaluating MSIM’s co-investment
track record and are presented in turn below.
AGGREGATED DEAL PERFORMANCE BY ASSET CLASS
Real Assets Co-Investments: By Asset Class
As of March 31, 2021
($ in Millions)
Fund Year of
First
Investment
Number
of
Investments
Invested
Capital
($)
Realized
Value
($)
Unrealized
Value
($)
Total
Value
($)
Infrastructure & Natural Resources 2013 9 236.4 15.1 301.6 316.7
Real Estate 2009 32 469.3 586.3 148.4 734.7
Total 41 705.7 601.4 450.0 1,051.4
Fund Net - Gross
IRR6
(%)
Net - Gross
TVM4, 7
(X)
Loss
Ratio8
(%)
Infrastructure & Natural Resources 23.3 1.3 0.0
Real Estate 12.8 1.6 6.8
Total 16.3 1.5 4.5
Since inception in 2009, the Portfolio Solutions team has invested approximately $706 million
across 41 real assets co-investments. The track record is heavily weighted in real estate, which
accounts for $469.3 million, or 67%, of invested capital, while infrastructure and natural
resources together constitute the remaining 33% capital, totaling $236.4 million. Additionally,
real estate represents the Firm’s longest standing asset class within real assets co-investments,
6 Net-Gross IRR and Net-Gross TVPIs are after deducting all underlying managers’ fees, expenses and carried interest paid or accrued to
date and taking into account cash balances drawn in advance of funding underlying investments but before MSIM fees, expenses and
carried interest paid or accrued to date. 7 Total Value Multiple (TVM) equals Realized Value plus Unrealized Value, then divided by Invested Capital. 8 Loss Ratios represent the proportion of invested capital that has resulted in realized and unrealized losses in a portfolio. The Ratio is
calculated by taking the sum of lost capital (invested capital minus an investment’s total value) for all investments that have generated a
negative return, then dividing that amount by total invested capital across the entire portfolio.

MEKETA INVESTMENT GROUP 27
MSIM CRPTF REAL ASSETS CO-INVESTMENT PARTNERSHIP
Private Markets Investment Memorandum
Historical Performance
dating back to the group’s inception. The team made its first infrastructure co -investment in
2013, but the rest of infrastructure deals have been executed in 2018 or later, which is the same
timeline as for natural resources investment activity. Accordingly, real estate investments have
had the most realizations to date across all asset classes, overall generating a 1.7x net-gross
realized multiple. Infrastructure and natural resources investments remain young, but are all
tracking above cost as of March 31, 2021. Performance attribution analysis is provided in the
narrative and charts immediately below, with detailed deal-level performance provided in
Appendix Exhibit 1.
ASSET CLASS ALLOCATION
Across MSIM’s aggregate real assets co-investment
track record, the large majority of investment activity
falls within the real estate asset class. Real estate co-
investments represent 67% of capital invested, totaling
$469.3 million spanning 32 deals. Non-real estate
investments include infrastructure and natural
resources, which comprise six and three deals,
respectively9. Infrastructure investments represent
$156.7 million in invested capital, while natural
resources investments represent the smallest
allocation at $79.8 million.
9 Meketa considers MSIM’s shipping investment as infrastructure and treats it as such throughout the performance analysis;
however, MSIM classifies it as natural resources due to commodity exposure of cargo. The investment includes a fleet of
petroleum product, food grade oil, and chemical tankers.
22%
11%
67%
Infrastructure
Natural
Resources
Real Estate

MEKETA INVESTMENT GROUP 28
MSIM CRPTF REAL ASSETS CO-INVESTMENT PARTNERSHIP
Private Markets Investment Memorandum
Historical Performance
ALLOCATION & PERFORMANCE BY SECTOR –
INFRASTRUCTURE/NATURAL RESOURCES10
Within infrastructure and natural resources, MSIM has made nine investments across a variety of subsectors,
as defined by the Manager. The industrials sector represents the largest allocation, comprising three
investments and $75.8 million of invested capital. Aggregate industrials investments are tracking at a 1.41x,
tied for highest performing sector with natural resources, which includes a single investment of $15.0 million.
Agriculture is currently the lowest performing sector, tracking at a 1.24x, however it is the second largest
sector allocation, totaling $64.8 million invested across two investments. Logistics is the only additional IS/NR
sector with two investments.
ALLOCATION & PERFORMANCE BY PROPERTY TYPE – REAL ESTATE
Across the 32 real estate co-investments, MSIM has invested in seven property types. Residential is the largest
sector allocation by a slight margin, representing $116.7 million invested across eight deals. Industrial and
office both comprise five investments, totaling $114.8 million and $106.9 million of invested capital, respectively.
These three sectors are the highest performing, in addition to being the largest allocations, with industrial
demonstrating significant outperformance at a 2.4x gross-net multiple. Self-storage is the lowest performing
sector, but only represents a single investment, which is located in Brazil.
10 Uses Morgan Stanley’s industry classifications.
28%
32%
22%
12%
6%
Agriculture
Industrials
Logistics
Midstream Energy
Natural Resources
1.24x
1.41x
1.32x1.35x
1.41x
1.0x
1.1x
1.2x
1.3x
1.4x
1.5x
11%
24%
23%
25%
3%7%
7%
Hotel
Industrial
Office
Residential
Retail
Self-Storage
Student Housing
1.3x
2.4x
1.6x1.4x
1.1x
0.6x
0.9x
0.0x
0.5x
1.0x
1.5x
2.0x
2.5x

MEKETA INVESTMENT GROUP 29
MSIM CRPTF REAL ASSETS CO-INVESTMENT PARTNERSHIP
Private Markets Investment Memorandum
Historical Performance
ALLOCATION & PERFORMANCE BY GEOGRAPHY – AGGREGATE
North America represents the largest geographic allocation across all MSIM real assets co-investments,
comprising 17 investments and $343.5 million of invested capital. Europe is the second largest allocation, but
the strongest performing geography, totaling 13 investments and $265.5 million of invested capital. Other
geographies outside of North America and Europe also received capital for real estate co-investments. Asia
Pacific investments include China, Hong Kong, and Japan specifically, while the South America investment is
located in Brazil and is currently the lowest performer in the track record. The Middle East investment is a
regional deal.
PROFESSIONAL ATTRIBUTION - AGGREGATE
Deal attribution for the MSIM real assets co-
investment track record includes current IC members
and Managing Directors Catherine Hong and Steve
Turner. Ms. Hong has sourced and led 14 real estate
deals, representing 32.2% of invested capital, the
largest percentage, or $227.3 million. Mr. Turner has
sourced and led two deals, both infrastructure
investments, totaling $34.2 million in invested capital,
however he is also listed as Co-Lead for six of the
seven deals where he was not the lead deal team
member. The remaining professionals who have led
and sourced deals from the track record are from
Morgan Stanley’s Alternative Investment Partners
(AIP) Private Markets team, demonstrating synergies
across the Custom Solutions Platform.
7%
38%
2%
49%
4%Asia Pacific
Europe
Middle East
North America
South America
1.6x1.7x
1.1x
1.4x
0.6x
0.0x
0.2x
0.4x
0.6x
0.8x
1.0x
1.2x
1.4x
1.6x
1.8x
2.0x
1.4x
1.8x
1.3x 1.3x 1.3x
2.4x
1.2x 1.3x 1.4x
0.0x
0.5x
1.0x
1.5x
2.0x
2.5x

MEKETA INVESTMENT GROUP 30
MSIM CRPTF REAL ASSETS CO-INVESTMENT PARTNERSHIP
Private Markets Investment Memorandum
Historical Performance
SEPARATE ACCOUNT PERFORMANCE
MSIM’s real assets co-investment track record comprises 27 mandates, incepted as early as 2009, to
as recently as 2020, which vary meaningfully in level of activity, bite size, and cumulative account size.
The bubble chart below displays the account inception year, performance to date using multiple of
invested capital, and the size of the bubble reflects the amount of capital each account has committed.
Note that in most cases not all capital was deployed in the accounts’ inception year.
MSIM Real Assets Co-Investment Accounts
Inception Year, Performance Multiple, and Cumulative Committed $ Million
Across the whole set of mandates, clients made 141 commitments to 37 deals, at an average bite size of
$5.8 million and an average deal size of $22.2 million. For any individual client, the minimum average
deal commitment was $0.6 million, and the largest was $25 million. With respect to factors influencing
performance, neither total capital committed nor number of deals is significant, while account inception
year explains some variation in performance, as would be expected from a preponderance of value-
add and opportunistic deals that take some time to execute business plans and deliver to targets with
older accounts having generally better performance. Variance in performance across the accounts is
as would be expected from a collection of mandates that relies on a combination of sourcing deals from
$172
$13
$145 $202
$14
$8 $7 $10
$5
$79
$25
$6
$11
$21
$3
$2 $4 $10
$2
$13
$5
$2
$2
$2
$49
$10 $5
1.0
1.1
1.2
1.3
1.4
1.5
1.6
1.7
1.8
1.9
2.0
2.1
2.2
2.3
2.4
2007 2008 2009 2010 2011 2012 2013 2014 2015 2016 2017 2018 2019 2020 2021
Mu
ltip
le o
f In
ve
ste
d C
ap
ita
l
Account Inception Year

MEKETA INVESTMENT GROUP 31
MSIM CRPTF REAL ASSETS CO-INVESTMENT PARTNERSHIP
Private Markets Investment Memorandum
Historical Performance
each client’s primary investment managers and the additional managers MSIM has relationships with
independent of their clients. The table and chart below provide some performance statistics and
graphic representation for the observed range and variance within.
Statistic TVM IRR TVM & IRR: Number of Accounts in Range
Aggregate ($ Weighted) 1.50 16.3
Average ($ Unweighted) 1.31 14.4
Median 1.26 13.0
Minimum 1.02 1.3
Maximum 2.21 30.5
Std Dev 0.25 8.3
Count > / < Aggregate 3 / 24 9 / 18
Of particular note is the high number of accounts with TVMs and IRRs less than the aggregate for the
collective 27 accounts: on a TVM-basis, only three accounts performed better than the aggregate, with
24 below; and on an IRR-basis, a slightly more reasonable nine performed better than the aggregate,
with 18 below. The bar chart illustrates this, with the first two range buckets showing accounts at one
and two standard deviations below median, and the right three range buckets showing one, two, and
three standard deviations above median. Recognizing 27 accounts is too small a number for statistical
significance, using standard deviation is a convenient approach to sizing the buckets. The account
metrics behind these results are described below.
TVM—Two of the three accounts with TVMs greater than 1.50 (each at 1.7x) collectively represent
45% of invested capital. These accounts each have made 10 investments, beginning in 2009 and
2013 respectively. The third account, at 2.2x, only represents 0.4% and is not a factor in the
asymmetry.
IRR—The nine accounts with IRRs greater than 16.3% collectively represent 38% of invested
capital. These include the 2009 account with $130.8 million invested with a 21.1% IRR (19% of total)
invested, as well as 2018 and 2019 accounts that have invested $62.4 million and $41.2 million
with IRRs of 30.5% and 17.7%, respectively (together 15% of total invested). The other six have
each invested between $2 million and $11 million to date.
As expected in this situation, the dollar-unweighted average and the median are both lower than the
aggregate TVM and IRR, and are perhaps more indicative of overall performance.
13
11
2
01
7
11
54
00
2
4
6
8
10
12
14
1.0x - 1.25x,
0 - 8.0
>1.25x - 1.5x,
>8.0 - 16.0
>1.50 - 1.75x,
>16.0 - 24.0
>1.75x - 2.0x,
>24.0 - 32.0
>2.0x - 2.25x,
>32.0
TVM IRR

MEKETA INVESTMENT GROUP 32
MSIM CRPTF REAL ASSETS CO-INVESTMENT PARTNERSHIP
Private Markets Investment Memorandum
Environmental, Social, & Corporate Governance
Environmental, Social, & Corporate Governance
ESG POLICY AND PROGRAM
Morgan Stanley has a multi-faceted program covering traditional elements of ESG policies, as well as
continually evolving and improving goals around sustainable and responsible investing, and enhanced
levels of broad or targeted impact investing. The Firm’s Environmental and Social Policy Statement was
most recently updated in December 2020 and covers the following areas: sustainable finance and
investing; environmental and social risk management (“ESRM”); climate change; human rights;
operations; and governance, implementation, and reporting. The section on ESRM addresses due
diligence processes and ESG analysis, and includes specific guidance for sectors with meaningful ESG
considerations. Additionally MSIM has been a signatory to the United Nations Principals of Responsible
Investment (“PRI”) since 2013.
While each product-cognizant investment team is responsible for ESG integration and implementation
across its own strategy/ies, as described shortly for the Portfolio Solutions team and its separate
accounts, there are a number of organizational entities that drive continuous improvement,
consistency, and provide support across the Firm, as described immediately below.
Sustainability Team: Develops ESG investment integration standards; produces data, tools, and
research; and partners with investment teams to enhance ESG integration practices.
Sustainability Council: In 2017 convened cross-functional leaders to guide implementation of ESG
and related programs across product development, investment processes, measurement,
education, and reporting.
Global Stewardship Team: Oversees proxy voting across the Firm, supports investment teams
engaging with portfolio companies, leads various initiatives including Firm-level ESG reporting
and the annual PRI assessment.
Global Sustainable Finance Group and Institute for Sustainable Investing: Established in 2009 and
2013, respectively, the Group and Institute drive and support a variety of regular and special
activities across the Firm and are a resource for knowledge sharing and initiative collaboration
with business units.
The Custom Solutions Platform implements the MSIM ESG program in several ways, which are woven
into the sourcing, diligence, manager selection, and monitoring process. Beginning with, and most likely
memorializing a client’s goals in their Investment Guidelines, the Platform can incorporate a range of
ESG-relevant target levels and approaches, including:

MEKETA INVESTMENT GROUP 33
MSIM CRPTF REAL ASSETS CO-INVESTMENT PARTNERSHIP
Private Markets Investment Memorandum
Environmental, Social, & Corporate Governance
Restriction Screening—Avoiding investments based on specific criteria;
ESG Integration—Proactively considering ESG criterial alongside financial analysis to identify and
characterize opportunities and risks;
Thematic Exposure—Focusing on themes and sectors dedicated to solving sustainability-related
challenges; and
Impact Investing—Allocating capital to opportunities designed to deliver specific positive social
and/or climate impacts.
Specifically for CRPTF’s co-investment mandate, MSIM is offering to target renewables and
sustainable infrastructure, consistent with Connecticut’s interest in sustainability, as well as
collaborate on co-investments with emerging and diverse GPs, consistent with the Connecticut
Inclusive Investment Initiative (“CI3”).
With respect to evaluating specific managers and deal opportunities, MSIM described that it uses a
matrixed-approach that combines classifying GPs in one of three ESG “skill set” categories—
Best in Class, Moderate, or Weak, and classifying a specific opportunity in one of three risk categories
(and corresponding grades)—High (A), Medium (B), or Low (C). The risk assignments are made for each
of an applicable sector or business line, if multiple and for each of the E, S, and G elements of ESG. The
skill set review covers the manager’s overall ESG framework, resources, experience and attitude,
investment process, and monitoring and reporting. The deal-level risk analysis considers such areas as
potential for environmental or human impacts, as well as integrity and corruption issues and the
individual and country level.
MSIM synthesizes its granular analysis of manager skill set elements with the business’ E, S, and G
grades to place the manager-deal opportunity in one of nine GP-Opportunity categories in the
corresponding matrix. The combined skill and risk results inform MSIM’s level of engagement with and
interest any particular opportunity and guide the Team’s interaction with the manager, deal team, and
portfolio company during diligence and in the post-investment monitoring process. Better-skilled
managers will be tagged for a standard monitoring program, with engagement and awareness activities
being included with increasing levels of deal-level risks. Weak-skilled managers combined with high
deal risk opportunities may be reconsidered for capital allocation entirely, or only advance with
approval contingent on having a concrete plan in place to improve the GP’s skills and reduce deal risk.

MEKETA INVESTMENT GROUP 34
MSIM CRPTF REAL ASSETS CO-INVESTMENT PARTNERSHIP
Private Markets Investment Memorandum
Environmental, Social, & Corporate Governance
RESPONSIBLE CONTRACTOR POLICY
MSIM does not have an RCP. Instead, the Investment Team evaluates underlying GPs’ human
capital practices using MSIM’s ESG framework, with labor policies as one element of
environmental, social, and governance practices. MSIM represents that it will put in place the
standards and practices necessary to comply with the State of Connecticut RCP as applied to
this mandate, which is a GP-sponsored co-investment structure where asset-level decisions are
delegated to the underlying GPs. MSIM stated that the strength of governance in relation to being
a responsible contractor is expected to be delivered through the MSIM team’s diligence of the
underlying GPs with RCPs and the relevant standards being stipulated through side letter
inclusions with the underlying GPs .

MEKETA INVESTMENT GROUP 35
MSIM CRPTF REAL ASSETS CO-INVESTMENT PARTNERSHIP
Private Markets Investment Memorandum
Operations
Operations
ORGANIZATION
Morgan Stanley Investment Management employs 2,849 professionals globally, including both
investment and operations personnel. As of June 30, 2021, operations resources comprise over
1,000 employees across a variety of back office functions including compliance, human
resources, information technology, legal, marketing, and tax. While these professionals are
shared across the Firm, certain members from each function directly support the Portfolio
Solutions team and their respective multi-alternative investment activities. The Portfolio
Solutions team also has dedicated operations resources, including Chief Operating Officer,
Victoria Eckstein and an additional six investment administration and data management
professionals who are responsible for all operational aspects of the partnership and
communication with the broader MSIM functions.
FINANCE AND ACCOUNTING
The Alternative Investment Services Operations team (“AIS”) within the broader MSIM
Operations group employs over 60 professionals and will assist the Portfolio Solutions team
across three functional areas: portfolio services and business management (31); fund
administration (11); and pricing, processing, and reconciliation (25).
Within these functions, AIS manages cash movements, and provides daily cash projections for
portfolios managed by the Portfolio Solutions team.. This report is used by the team to determine
whether a capital call or distribution is required and what amount is appropriate. The AIS
Operation team then prepares a file containing all components of the cash flow, which is
subsequently reviewed and approved by the investment team prior to notice generation. MSIM
Investor Services prepares the notice, and they or Client Services distributes the notice via an
online portal. Only the Portfolio Services function within AIS has the authority to instruct the
bank to wire funds, and requires signatures from two members before wire instruction. The team
utilizes the internal Investran accounting system throughout this process and for all investment
activity.
Morgan Stanley Investment Management engages Deloitte & Touche LLP (“Deloitte” ) to perform
annual audits of the Firm and individual teams’ funds. Deloitte has been the auditor for the Firm
since 1997 upon the merger of Morgan Stanley and Dean Witter Discover & Co. Prior to 1997,

MEKETA INVESTMENT GROUP 36
MSIM CRPTF REAL ASSETS CO-INVESTMENT PARTNERSHIP
Private Markets Investment Memorandum
Operations
MSIM’s auditor was Ernst & Young. Internally, the Firm also employs an Internal Audit
Department to support senior management and the Board Audit Committee with risk
management, control, and governance procedures.
VALUATION
Morgan Stanley Investment Management performs valuations in compliance with US GAAP
accounting standards. Valuations are prepared by the administrator as well as independently by
AIS. MSIM investments in investment funds and co-investments are carried at fair value.
Investments in investment funds are valued at an amount equal to the port folio’s pro rata
interest in the net assets of such investment fund, typically provided quarterly by the investment
manager. Co-investments are valued utilizing information provided by the respective investment
funds based on established policies, as described in financial statements and offering
memoranda.
When no valuation is available for an investment fund or co-investment, or the valuation provided
is deemed incorrect by the Portfolio Solutions team, the MSIM Valuation team will determine the
fair value through a recommendation to the Valuation Committee, chaired by the head of MSIM
Valuation. Voting members of the Valuation Committee include representatives from MSIM
Valuation, AIS Business Management, AIS Fund Administration, and MSIM Risk Management.
Additional non-voting members include the Portfolio Management team, MSIM Legal, and MSIM
compliance.
LEGAL AND COMPLIANCE
The MSIM Compliance Program is led by Chief Compliance Officer, Raul Yanes and the Morgan
Stanley Funds Board, and supported by a team of one Managing Director and nine Executive
Directors, all of whom head their respective functions. Overall, the compliance team oversees
business line management, independent risk management, and internal audit, executing
advisory initiatives, testing, risk assessment, policies & procedures, and training across the Firm.
MSIM Legal provides legal advice relating to fund formation, fund management, investment
activities, regulatory & compliance requirements, and matters in dispute across the fund and
transaction level. Managing Director Philip Quirk serves as the General Counsel for MSIM and
the International General Counsel covering EMEA, APAC, and Japan. Mr. Quirk leads a team of
32 professionals globally.

MEKETA INVESTMENT GROUP 37
MSIM CRPTF REAL ASSETS CO-INVESTMENT PARTNERSHIP
Private Markets Investment Memorandum
Operations
TECHNOLOGY INFRASTRUCTURE
Morgan Stanley’s technology infrastructure functions are encompassed within its Fusion
Resilience Center which maintains the goal of defending the Firm against operational threats
and incidents, including those related to technology and cyber-attacks. The Center includes the
business continuity management and technology disaster recover teams. Business continuity
plans are prepared for individual business units, detailing recovery strategies and available
options during an event, as well as the team’s roles and responsibilities. Plans are reviewed on a
regular basis by the respective business unit management team and circulated to staff at least
annually. The investment management technology team includes a total of 45 professionals and
is led by Chief Infrastructure Officer, Raj Bendre.

MEKETA INVESTMENT GROUP 38
MSIM CRPTF REAL ASSETS CO-INVESTMENT PARTNERSHIP
Private Markets Investment Memorandum
Other Items
Other Items
LEGAL ISSUES
Over the past ten years, the Portfolio Solutions team has not been involved in any legal issues,
as disclosed by the Manager. More broadly, Morgan Stanley Investment Management and
Morgan Stanley, its parent company, are occasionally named as defendants in various legal
proceedings, as well as involved in investigations by governmental, regulatory, and self -
regulatory agencies, which may result in adverse penalties. All litigations, proceedings, and
investigations are disclosed in Morgan Stanley’s filings with the SEC.
POTENTIAL CONFLICTS
MSIM does not anticipate any material potential conflicts of interest with respect to the
management of the CRPTF real asset portfolio. The Firm employs dedicated Conflict
Management Officers for each business unit to identify and address any potential conflicts of
interest within their area. If a conflict were to arise, an escalation process is in place, moving first
to senior management within the business unit, and ultimately to Firm management if necessary.
MSIM manages customized solutions for a variety of separately managed accounts and fund-of-
one vehicles which also include real asset co-investments. Accordingly, an investment may be
allocated to multiple portfolios at the discretion of the Investment Committee (“IC”) based on the
following considerations: (i) investment guidelines, goals or restrictions of the portfolio ;
(ii) existing allocation to similar strategies and the diversification objectives of the portfolio ;
(iii) tax considerations; (iv) legal or regulatory considerations; and/or (v) other relevant business
considerations. If the available capacity in an investment is less than the target allocations of the
portfolios eligible for the investment, portfolios that are an attributable source will receive
priority allocation for the full amount (for example where the client is a limited partner in the
subject fund, or otherwise has a relationship with the GP). When available capacity for applicable
portfolios is limited, materiality assessments will be made to determine allocations. Additionally,
when capacity allocated to a portfolio is below a defined threshold for a co-investment, the IC
may decide to allocate to a subset of appropriate portfolios or revert to a serial lottery drawing.
All rationale for investment allocations will be detailed in the respective investment memos.

MEKETA INVESTMENT GROUP 39
MSIM CRPTF REAL ASSETS CO-INVESTMENT PARTNERSHIP
Private Markets Investment Memorandum
Other Items
The Partnership may include internal MSIM products, if approved by CRPTF; however, the
Portfolio Solutions team will not receive any incentive for allocation to in-house vehicles through
trailer fees or transfer pricing.
While it is not within Morgan Stanley’s policy to disclose any Principal’s involvement with other
business ventures, all outside business activity or private investments must be approved by
compliance prior to participation. Compliance will review whether such involvement presents an
actual or potential conflict of interest and will interfere with a professional’s ability to carry out
designated responsibilities at the Firm.
DISTRIBUTION/MARKETING
Morgan Stanley Investment Management has not engaged a placement agent with respect to
the CRPTF Real Assets Co-Investment Partnership and has not historically used a placement
agent for similar investor mandates. There is no compensatory relationship between MSIM and
Meketa Investment Group.
LIMITED PARTNERS
RACP will have a fund of one structure and CRPTF will be the only investor. MSIM has worked
with numerous limited partners representing sovereign wealth funds, pension plans,
corporations, endowments and foundations as well as high net worth individuals to execute
co-investment strategies.

MEKETA INVESTMENT GROUP 40
MSIM CRPTF REAL ASSETS CO-INVESTMENT PARTNERSHIP
Private Markets Investment Memorandum
Analysis & Conclusions
Analysis & Conclusions
DUE DILIGENCE BASIS
Meketa has carefully evaluated the proposed Account’s Manager—MSIM, its investment professionals’
experience and qualifications and related resources, strategy, co-investment pipeline, investment
process, historical track record, and other aspects of this opportunity as described in prior sections of
this investment memorandum.
Overall, we find MSIM’s Real Assets Co-Investment Partnership, with a mandate developed in
collaboration with CRPTF Staff, an attractive opportunity that supports CRPTF’s goal of establishing
co-investment expertise and deploying capital to expand the investment opportunities within the real
estate and real assets portfolios. Our finding is based on our evaluation of this offering’s primary
advantages, balanced with any concerns or considerations, along with Meketa’s and the Manager’s view
of the Account’s mandate relative to market opportunities and potential strategy execution challenges.
These elements of our findings are documented below, along with our summary conclusion.
SWOT ANALYSIS Strengths
Platform Deal Flow and GP Network - MSIM has access to an extensive network of GPs thereby
positioning MSIM to gain exposure to attractive co-investment opportunities in addition to
CRPTF’s own GPs.
Team Experience and Resources - The team has a broad range of experience within real assets,
brings significant years of investing experience and is well versed in separately managed
accounts, and is supported by the broader Morgan Stanley platform.
Investment Themes and Research Capabilities - MSIM utilizes a global investment research team
to assist with deal sourcing and underwriting to build customized portfolios for clients.
Creative Investment Structure - The mandate provides flexibility to pursue attractive deals
across asset classes, sectors, property types, and geographies.
GP Access – The Account will position CRPTF before leading GPs as an attractive source of
capital with transaction reliability and diligence efficiency, and continue to strengthen CRPTF’s
reputation as a limited partner of choice.
Strategic Partnership - MSIM resources will provide client collaboration, training, and investment
tools for CRPTF staff.

MEKETA INVESTMENT GROUP 41
MSIM CRPTF REAL ASSETS CO-INVESTMENT PARTNERSHIP
Private Markets Investment Memorandum
Analysis & Conclusions
Weaknesses
Conflicts of Interest - There is a potential for allocation conflicts and a lack of transparency
around allocation decisions as MSIM manages multiple co-investment mandates for institutional
investors and high net worth entities.
Mitigating Factor(s): The MSIM Investment Committee oversees the allocation process
and reviews client allocations and determines the appropriate allocations for each client
portfolio based on customized investment guidelines. As a result, every investment
opportunity may not be appropriate for every client portfolio.
Deployment Capabilities – CRPTF’s mandate represents a meaningful increase in MSIM’s annual
capital deployment target within real assets co-investment opportunities and MSIM has yet to
demonstrate the ability to execute at these levels and target timeframe.
Mitigating Factor(s): MSIM represents a global platform within a global asset manager.
MSIM is supported by a significant research team which can identify and diligence a large
number of investment opportunities for clients.
CRPTF’s existing investment managers will also generate investment opportunities for
MSIM to evaluate.
No Prior Co-investment Experience with CRPTF’s Managers - MSIM does not appear to have
co-invested with any of CRPTF’s existing real assets managers and it may take some time for
MSIM to forge relationships with them.
Mitigating Factor(s): MSIM is well staffed to begin developing a relationship with CRPTF’s
existing investment managers.
Aggregate Co-investment Activity - MSIM’s reported real assets track record consists of just 41
investments (35 deals) since its 2009 inception. Infrastructure and natural resources account
for only nine of the investments (seven deals), representing $292 million of committed capital
versus $530 million in real estate activity.
Mitigating Factor(s): While the MSIM co-investment track record is limited in the number
of transactions, those transactions have generated an attractive return of 16.3% net IRR.
MSIM has a deep bench of investment personnel to assign to deal sourcing. In addition,
MSIM will develop relationships with CRPTF’s existing roster of real assets managers
which may increase deal sourcing opportunities.

MEKETA INVESTMENT GROUP 42
MSIM CRPTF REAL ASSETS CO-INVESTMENT PARTNERSHIP
Private Markets Investment Memorandum
Analysis & Conclusions
Senior Departure - The impact of the departure of an Executive Director is uncertain as he
played a significant role in the execution of real estate activities.
Mitigating Factor(s): Since the Executive Director’s departure the team has continued to
execute on real estate transactions.
Based on reference calls with two fund managers / co-investment partners listed in the
track record, the Executive Director’s successor on the deal, Catherine Hong, is
knowledgeable, thorough, and great to work with.
Track Record - The real estate track record does not provide strong evidence of property type
or geographic expertise, or consistent repeat sourcing channels with key GP relationships.
Mitigating Factor(s): The lack of focused track record is reflective of a high-level
thematic investment approach and multiple mandates. MSIM has access to Morgan
Stanley’s broader real estate team which can provide access to investment
opportunities, and insights and underwriting guidance based on managing the firm’s
global real estate portfolio.
Double Fees - In some circumstances CRPTF may pay fees to MSIM as well as to underlying
investment managers for investment opportunities.
Mitigating Factor(s): MSIM has sourced some co-investment opportunities that were
associated with a no fee and no carry structure. However, the fee arrangement on each
underlying opportunity will vary based on the GP of the underlying fund.
CRPTF staff has negotiated an attractive fee structure with MSIM for the RACP mandate.
Weak Alignment - MSIM is not making a GP contribution to the investment vehicle, which
highlights a lack of GP/LP alignment of interests.
Mitigating Factor(s): MSIM is not managing assets as it relates to this mandate and as a
result, it is not contributing the normal general partner contribution as is common for a
fund manager.
CRPTF staff has negotiated an attractive fee structure with MSIM for the RACP mandate.
CRPTF Governance Procedures – In addition to the investment guidelines, CRPTF needs to
clearly define internal procedures and processes for addressing any conflicts, issues and
guideline changes so as to maintain the efficiency of a delegated authority structure with an
asset manager.
Mitigating Factor(s): As this is a new opportunity for CRPTF, staff can create internal
processes and procedures before the Limited Partner Agreement is finalized.

MEKETA INVESTMENT GROUP 43
MSIM CRPTF REAL ASSETS CO-INVESTMENT PARTNERSHIP
Private Markets Investment Memorandum
Analysis & Conclusions
Opportunities
Broaden GP Exposure - This mandate will provide CRPTF with an opportunity to invest
with leading fund managers and to expand its manager relationships on a global basis.
Hands-on Participation - Under the proposed Strategic Partnership, CRPTF staff can
interact with managers, track market trends and investment opportunities, and follow
co-investment diligence.
Growth Potential - The initial mandate is relatively modest in size compared to CRPTF’s
real assets allocation but has the potential to scale up as CRPTF gains experience and if
co-investment appetite increases.
Threats
Limited Partner Competition - MSIM co-investments will compete with other LPs, including ones
who are existing investors in the underlying funds, highlighting potential accessibility issues.
Platform Demand - MSIM is not limited in the number of co-investment mandates it can
oversee, potentially further increasing competition for deal flow.
MSIM as a Competitor - MSIM has a number of commingled private funds that invest in
infrastructure and real estate, and GPs may not want colleagues of those fund teams
diligencing their underwriting, asset management, and other proprietary processes.
CONCLUSION
Meketa believes that the Real Assets Co-Investment Partnership with MSIM is an attractive structure
that provides CRPTF with its initial foray into co-investments within the Real Assets Portfolio. Since 2019,
CRPTF has stated a desire to participate in co-investment opportunities within the private markets
asset classes. RACP will enable CRPTF to partner with a global asset manager to participate in attractive
opportunities with leading general partners investing in the target asset classes. RACP allows co-
investment opportunities to be identified, analyzed and underwritten via an efficient process while
minimizing investment risks.
MSIM has assembled a solid investment team that has a strong track record of co-investments. MSIM
works with leading institutional investors and provides OCIO solutions to sophisticated investors. MSIM
takes a global perspective when evaluating investment opportunities, thereby providing CRPTF with
more investment opportunities. In addition, MSIM will partner with CRPTF’s existing investment
managers to further analyze more co-investment opportunities that CRPTF is currently unable to
address given staff restrictions and time constraints. MSIM provides a platform whereby CRPTF will not
forego attractive investment opportunities due to these constraints.

MEKETA INVESTMENT GROUP 44
MSIM CRPTF REAL ASSETS CO-INVESTMENT PARTNERSHIP
Private Markets Investment Memorandum
Appendices
Appendices

MEKETA INVESTMENT GROUP 45
MSIM CRPTF REAL ASSETS CO-INVESTMENT PARTNERSHIP
Private Markets Investment Memorandum
Appendices
Exhibit 1: Partnership Terms
MANAGEMENT/GOVERNANCE
Type of Partnership TBD
Legal Counsel TBD
Auditor TBD
Placement Agent Not Applicable
TERMS AND CONDITIONS SUMMARY Below is a summary of the key terms and conditions that appear in the draft Investment Guidelines
(“IG”) for the co-investment Account (a fund of one Partnership) CRPTF is negotiating with Morgan
Stanley Investment Management in the version dated August 25, 2021. A draft Limited Partnership
Agreement was not available for Meketa’s review at the time this Investment Memorandum was
prepared. Note that the Investment Guidelines described below are subject to change based on ongoing
or future negotiations between the CRPTF and MSIM.
PROVISION TERMS COMMENT
Return Target 12% IRR net of all fees for each three-year
commitment period
The target is consistent with the stated
strategy and investment vehicles. It
appears the return target may be
tranched for purposes of calculating
MSIM’s carry, but was not explicit in the
IG. Additionally, many co-investors
target higher returns from investing
outside commingled funds.
Account Size & Hard Cap
Implied $375 million to $525 million in first
three years; hard cap not set [Not stated in
the IG]
The size is appropriate for CRPTF’s
scale; however it represents a
meaningful increase in MSIM’s capital
deployed into co-investments over
prior years.
GP Commitment None The market is mixed.
Investment Period
3 years minimum for
quoted Management Fee [Referenced but
not directly defined in the IG]
CRPTF maintains the right to suspend
or terminate future commitments at
each year-end.
Total Term
The total term of the underlying co-
investments will depend on the underlying
deal terms.
MSIM will have discretion over selecting
co-investments with reasonable terms.

MEKETA INVESTMENT GROUP 46
MSIM CRPTF REAL ASSETS CO-INVESTMENT PARTNERSHIP
Private Markets Investment Memorandum
Appendices
PROVISION TERMS COMMENT
Commitment Size
Minimum of $10 million &
Maximum of $25 million
Target $15 million + $5 million [Prior
Materials, not stated in the IG]
The sizes are reasonable for CRPTF’s
programs; however the quantum, on an
individual and implied cumulative basis
represents a meaningful increase over
MSIM’s pace to date.
Diversification Limits
Investment Type
Co-investments: 90% - 100%
Stapled Primaries: 0% - 10%
Blind Pool Co-Investments (consent needed
from CRPTF): 0% - 5%
Primaries: 0%
Secondaries: 0%
The targets are reasonable. Primaries
and secondaries are not a focus of this
mandate.
Risk-Return Profile
% Range of Total Account
% IS RE The targets are reasonable; however
very little core investments in these
asset classes are done outside of open-
end funds, which would not be expected
to offer co-investment, except to large
individual investors.
Core 0-30 0-30
Non-Core 10-50 20-70
Total 30-50 50-70
Geography
At the Account Level
North America: 20% - 80%
Europe: 10% - 60%
Developed Asia: 0% - 20%
Emerging Markets: 0% - 20%
The targets are reasonable given the
opportunity set, noting that
infrastructure may offer more ex-U.S.
deals than either other asset class.
General Partner Concentration
25% max by Asset Class
20% max at Account Level
Based on committed capital as a
percentage of the intended aggregate
Annual Commitments over the three-year
Commitment Period.
The targets are reasonable.
Management Fee 45 bps on invested [Prior Materials, not
stated in the IG] Neutral
Preferred Return 8% [Prior Materials, not stated in the IG] Neutral
Carried Interest 7% [Prior Materials, not stated in the IG] Neutral
Carry Structure Whole-fund [Prior Materials, not stated in
the IG] Favorable
Catch-Up Provision Not specified
Fee Income N/A Consistent with account type.
Key Person Provision Not specified
No-Fault Termination
CRPTF maintains the right to suspend or
terminate future commitments at each
year-end.
Not specified/unclear how CRPTF can
remove MSIM as the Account
manager.

MEKETA INVESTMENT GROUP 47
MSIM CRPTF REAL ASSETS CO-INVESTMENT PARTNERSHIP
Private Markets Investment Memorandum
Appendices
ESTIMATED IMPACT OF FEES
Meketa did not have sufficient data to estimate the impact of fees on CRPTF’s expected Account
performance relative to the 12% net of all fees target (MSIM’s and underlying GPs’). MSIM provided the
statement below around the matter of underlying fees, with respect to level of management fees and/or
carry that co-investments managers where CRPTF is and is not an existing LP:
The average fee across all investments is 0.8% management fee on invested capital, with 11% carried
interest over an 8% preferred return with a 40% catch up rate. 35% of the 37 investments have a
management fee below 0.5% (seven deals have no management fee). While a higher proportion of the
real estate investments are structured with management fees and carried interest, 40% of the real estate
investments have no catch up mechanism on the carried interest calculation, which can potentially have
a material impact on the transfer of economics.

MEKETA INVESTMENT GROUP 48
MSIM CRPTF REAL ASSETS CO-INVESTMENT PARTNERSHIP
Private Markets Investment Memorandum
Appendices
Exhibit 2: Professional Biographies
Rui De Figueiredo, Ph.D., Managing Director Rui is Co-Head and Chief Investment Officer of the Solutions & Multi-Asset Group at Morgan Stanley Investment
Management. Additionally, he is a member of the Global Investment Committee and of the Investment
Management Operating Committee, and Chairman of Investment Management’s Sustainability Council. He has 24
years of industry experience. Prior to his current role, he provided investment leadership to the Portfolio Solutions
Group and Hedge Fund Solutions team within Investment Management. Prior to joining the firm in 2007 he led
Research on behalf of Citi Alternative Investments. In this capacity, he developed and implemented leading-edge
research on portfolio strategy with alternative investments for proprietary and client portfolios. Earlier, he was a
case leader at the Boston Consulting Group and an associate at the Alliance Consulting Group, both business
strategy consulting firms. Rui has published in finance, economics, law and political science journals. Additionally,
he is Associate Professor Emeritus of the Graduate School and was previously an Associate Professor (with tenure)
at the Haas School of Business at the University of California Berkeley. His research there focuses on game theoretic
and econometric analysis of institutions. Rui holds an AB degree from Harvard University, and a PhD and two
master’s degrees from Stanford University.
Ryan Meredith, FFA, CFA, Managing Director Ryan is the head of the Portfolio Solutions Group at Morgan Stanley Investment Management. He is based in New
York and has 23 years of industry experience. Prior to joining the firm in 2007, Ryan was a director in the quantitative
research group at Citigroup Alternative Investments, focused on the development of leading-edge modeling and
research on portfolio strategy, and a research vice president at Citigroup Asset Management. Previously, he worked
in the actuarial departments of both Towers Perrin in London and Alexander Forbes Consultants and Actuaries in
South Africa, conducting asset liability modeling and investment research. Ryan received a B.Sc. in mathematical
statistics from the University of Witwatersrand in South Africa and a M.Sc. in mathematics of finance from the
Courant Institute at New York University. He is a fellowship member of the Faculty of Actuaries in the United Kingdom
and holds the Chartered Financial Analyst designation.
Ted Eliopoulos, Managing Director Ted is the Vice Chairman & Head of Strategic Partnerships at MSIM. He is also a member of the Investment
Management Operating Committee and Senior Sponsor of MSIM’s Diversity Council. Before joining Morgan Stanley
in 2019, Ted served as the Chief Investment Officer at California Public Employees' Retirement System (CalPERS).
From 2007 to 2014, he held various leadership roles at CalPERS including interim Chief Investment Officer and
Senior Investment Officer of Real Estate and Real Assets. From 2002 to 2006, he served as the Chief Deputy
Treasurer and Deputy Treasurer at the California State Treasurer's Office. Ted has also held positions in both the
private and public sectors, including real estate development and in environmental management with the U.S.

MEKETA INVESTMENT GROUP 49
MSIM CRPTF REAL ASSETS CO-INVESTMENT PARTNERSHIP
Private Markets Investment Memorandum
Appendices
Department of Energy. He began his career at Latham & Watkins as an attorney in the real estate division. Ted's
past board affiliations include the U.S. Real Estate Roundtable and the Pension Real Estate Association and the
Sustainability Accounting Standards Board’s Investor Advisory Group and is on the Alliance for Southern California
Innovation's Advisory Council. He received a Bachelor's degree, magna cum laude, with honors, in comparative
literature from Dartmouth College and holds a Juris Doctor degree from the University of Virginia.
Catherine Hong, Managing Director Catherine is a managing director for the Portfolio Solutions Group at MSIM, co-responsible for fundamental
investment research in public and private markets. In addition to having oversight of fundamental research for the
team, Catherine is a member of the real estate investment committee. She has 19 years of industry experience.
Before joining the Investment Management division, Catherine worked as an associate in Morgan Stanley's Real
Estate Private Capital Markets Group, focusing on private real estate fund formation throughout Europe. Prior to
joining the firm, Catherine was an associate with Citigroup Property Investors in New York, where she evaluated
global real estate fund investments for the firm's real estate multi-manager platform and the Citigroup Pension Plan.
She began her career as an analyst in the Real Estate Finance and Global Principal Investment groups at Merrill
Lynch in New York. Catherine received a B.A. cum laude in economics and art history from Wellesley College and
an M.B.A. from the Wharton School of the University of Pennsylvania.
Steven Turner, CFA, Executive Director Steven is a senior research analyst for the Portfolio Solutions Group at MSIM, co-responsible for fundamental
investment research in public and private markets. In addition to having oversight of fundamental research for the
team, Steven focuses on asset allocation in private markets and has helped develop and refine the proprietary cash
flow models utilized by the team. He has 13 years of industry experience. Prior to joining the firm in 2013, Steven was
an Analyst for Mercer Investment Management where he was involved in the construction of alternative investment
portfolios for large UK pension funds. Steven received a B.Sc in economics from the University of Southampton and
an M.Sc in Investment Management from the International Capital Markets Association (ICMA) Centre at Henley
Business School. He holds the Chartered Financial Analyst designation.
Damon Wu, Executive Director Damon is a portfolio manager for the Portfolio Solutions Group at MSIM. He is responsible for quantitative investment
research in public and private markets. In addition to having oversight of quantitative research for the team, Damon
focuses on asset allocation, portfolio optimization and rebalancing and has helped develop and refine the
proprietary quant models utilized by the team. He has 14 years of industry experience. Prior to joining the firm in
2008, Damon was an associate at Merrill Lynch, responsible for portfolio construction and quantitative research in
the hedge fund development and management team. Damon received a B.S. in engineering from National Taiwan

MEKETA INVESTMENT GROUP 50
MSIM CRPTF REAL ASSETS CO-INVESTMENT PARTNERSHIP
Private Markets Investment Memorandum
Appendices
University and an M.B.A. and M.S. joint degree from Case Western Reserve University. He also holds an M.S. in
computational finance from Carne.
Pennapa Tantiyakul, CAIA, Executive Director
Pennapa is a quantitative research analyst for the Portfolio Solutions Group at MSIM. She has 13 years of industry
experience. Prior to joining the firm in 2010, Pennapa was a hedge fund research analyst at Lipper, a Thomson
Reuters company, responsible for fund selection and rating as well as publishing comprehensive hedge fund
research reports. Previously, she was at ING Fund of Hedge Funds where she served as a quantitative analyst. Before
that, she was a business consultant with IBM, serving clients within the financial sectors. Pennapa received her B.S.
in Statistics, summa cum laude and class valedictorian, from Chulalongkorn University. She also received an M.S. in
Financial Mathematics from the University of Chicago. She holds the Chartered Alternative Investment Analyst
(CAIA) designation.
Alicia Biggs, Vice President
Alicia is a portfolio specialist and research analyst for the Portfolio Solutions Group at MSIM. She has 11 years of
industry experience. Prior to joining MSIM in 2014, Alicia was an associate for the Morgan Stanley Merchant Banking
& Real Estate Investing Capital Markets team where she focused on investor coverage and new product
development. Before joining the firm, Alicia worked as an investment associate at Roundtable Investment Partners,
where she was involved in the construction of alternative investment portfolios for institutions and high net worth
individuals. Alicia received a B.A. from Princeton University and a MPA from the University of Pennsylvania.
Yige Zou, CFA, Vice President
Yige is a quantitative research analyst for the Portfolio Solutions Group at MSIM. She has eight years of industry
experience. Prior to joining the firm in 2014, Yige received her Bachelor of Science in Economics from Renmin
University of China. She also received a Master of Science in Financial Mathematics from New York University. She
holds the Chartered Financial Analyst designation.
Blanca Garcia Requesens, Vice President
Blanca is a portfolio specialist and research analyst for the Portfolio Solutions Group at MSIM. She has nine years of
industry experience. Prior to joining the firm in 2012, Blanca received her dual B.S., summa cum laude, in
International Business from Northeastern University and Universidad Pontificia de Comillas (ICADE) in Spain.

MEKETA INVESTMENT GROUP 51
MSIM CRPTF REAL ASSETS CO-INVESTMENT PARTNERSHIP
Private Markets Investment Memorandum
Appendices
Nick Di Giampasquale, CAIA, CFA, Vice President
Nick is a research analyst for the Portfolio Solutions Group at MSIM. He has 12 years of industry experience. Prior to
joining the firm in 2015, Nick was an analyst for Mercer Investment Management where he was involved in the
construction of alternatives portfolios for large institutional investors. Nick received a first class MEng in Mechanical
Engineering from the University of Nottingham. He holds the Chartered Financial Analyst and Chartered Alternatives
Investment Analyst designations.
Greg Waterman, CFA, Vice President
Greg is a research analyst for the Portfolio Solutions Group at MSIM. He has 15 years of industry experience. Prior
to joining the firm in 2020, he was a senior equity analyst at Cortina Asset Management, a boutique long-only
investment management firm focused on small-cap equities. His responsibilities at Cortina included both sector
coverage and a role guiding portfolio strategy. Greg began his career at Goldman Sachs in the Global Investment
Research division, where his role grew to include lead coverage of the specialty pharmaceuticals sector. Greg
received a B.A. in Economics, cum laude, from Duke University. He holds the Chartered Financial Analyst designation.
Joshua Myers, Vice President
Joshua is a research analyst for the Portfolio Solutions Group at MSIM. He has 10 years of industry experience. Prior
to joining the firm in 2021, he managed a portfolio of commercial mortgage backed-securities and was a high yield
bond and bank debt analyst at Good Hill Partners, a credit-focused hedge fund firm. Joshua began his career at
Neuberger Berman, where he was involved in the construction and management of hedge fund portfolios for large
institutional investors. Joshua received a B.S. in Finance, magna cum laude, from New York University Leonard N.
Stern School of Business.
Kaili Li, Senior Associate
Kaili is a quantitative research analyst for the Portfolio Solutions Group at MSIM. She has four years of industry
experience. Prior to joining the firm in 2018, Kaili received a Masters of Science in Financial Mathematics from New
York University and a Bachelor of Science in Applied Mathematics from Fudan University. She has passed all three
levels of the CFA program.
Ravel Shen, CFA, Senior Associate
Ravel is a quantitative research analyst for the Portfolio Solutions Group at MSIM. He has four years of industry
experience. Prior to joining the firm in 2018, Ravel received his Bachelor of Science in Computing Mathematics from
City University of Hong Kong. He also received a Master of Science in Financial Mathematics from New York University.
He holds the Chartered Financial Analyst designation.

MEKETA INVESTMENT GROUP 52
MSIM CRPTF REAL ASSETS CO-INVESTMENT PARTNERSHIP
Private Markets Investment Memorandum
Appendices
Carlo Arlunno, Senior Associate
Carlo is a research analyst for the Portfolio Solutions Group at MSIM. He has five years of industry experience. Prior
to joining the firm in 2021, Carlo was an Investment Manager for a UK Life Insurance company where he was investing
across the credit spectrum. Before that he worked at Cambridge Associates where he was involved in the construction
of advisory and discretionary portfolios across all asset classes. He started his career at Russell Investments
researching Hedge Fund managers. Carlo received a first class MSc in Management from ESCP Europe. He holds the
Chartered Alternatives Investment Analyst designation.
Emir Osmani, Associate
Emir is a research analyst for the Portfolio Solutions Group at MSIM. He has five years of industry experience. Emir
joined Morgan Stanley in 2016 after graduating and has spent time in the Investment Oversight and Product
Management teams, having worked in the New York, Dublin, and London offices. Emir graduated cum laude from
Georgetown University, where he studied Finance and Operations & Information Management. He has passed all
three levels of the CFA program and both levels of the CAIA exam.
Patrick Kenney, Associate
Patrick is a portfolio specialist and research analyst for the Portfolio Solutions Group at MSIM. He joined the firm in
2016 and has five years of industry experience. Prior to joining the team, Patrick was an analyst for the Internal Audit
team based in New York. He received his Bachelor of Science in Finance and Operations Management from the
University of Delaware and has passed all three levels of the CFA program.
Hayley Soriano, Analyst
Hayley is a portfolio specialist and research analyst for the Portfolio Solutions Group at MSIM. She has one year of
industry experience. Prior to joining the firm in 2020, Hayley received her B.A. in Government from Dartmouth
College.

MEKETA INVESTMENT GROUP 53
MSIM CRPTF REAL ASSETS CO-INVESTMENT PARTNERSHIP
Private Markets Investment Memorandum
Appendices
Exhibit 3: Manager Meetings Meeting Location: Zoom Meeting
Date: August 5th, 2021
Manager Attendees: Rui de Figueiredo, Catherine Hong, Steve Turner, Ted Eliopolous, Patrick
Lombardo, John Mecca
Meketa Attendees: Judy Chambers, Lisa Bacon, Colin Hill, Esther Lho, Sarah Christo
Purpose of Meeting: Initial call with MSIM team to introduce the Partnership and the Portfolio Solutions
platform.
Meeting Location: Zoom Meeting
Date: August 18th, 2021
Manager Attendees: Rui de Figueiredo, Steve Turner, Catherine Hong, Ted Eliopoulos, Alicia Biggs,
Vikram Raju, Victoria Eckstein, Noel Langlois, Francie Tai, Patrick Lombardo, John
Mecca
Client Attendees: Kan Zuo
Meketa Attendees: Judy Chambers, Lisa Bacon, Colin Hill, Esther Lho, Sarah Christo
Purpose of Meeting: Onsite due diligence with the Portfolio Solutions team to cover the following items:
Firm & Team Overview
Market Environment
Investment Philosophy & Process
Co-Investment Track Record
Operations
Proposed Terms

MEKETA INVESTMENT GROUP 54
MSIM CRPTF REAL ASSETS CO-INVESTMENT PARTNERSHIP
Private Markets Investment Memorandum
Appendices
Exhibit 4: Reference Checks Meketa Investment Group conducts a large amount of due diligence before we evaluate references for
the partnership’s General Partners. Prior to this stage, we have already met numerous times with the
key professionals at the partnership, and have evaluated fully the partnership’s investment strategy.
The function of the reference check is twofold. First, reference checks provide insight into the personal
integrity and character of the General Partners. A lack of integrity that is hidden during a series of
formal meetings can sometimes be uncovered by discussions with references. Second, reference
checks provide deeper insight into the partners’ investment experience and reputation.
SCOPE OF REFERENCE CHECKS
As part of Meketa Investment Group’s due diligence of MSIM CRPTF Real Assets Co-Investment
Partnership, we requested that Morgan Stanley Investment Management provide us with personal
references for each of the firm’s managing partners.
We discussed with each of the references the nature of their relationship with Morgan Stanley
Investment Management, and the reference’s perception of the company’s integrity, work ethic,
character, and professional acumen. We asked further for the reference to discuss the specific
individuals within Morgan Stanley Investment Management, to gain a better assessment of the firm’s
depth.
OUTCOME OF REFERENCE CALLS
Meketa Investment Group has contacted various references provided by Morgan Stanley Investment
Management, as well as other references. References consisted of limited partners that are currently
utilizing the Customized Solutions Platform operated by MSIM, other investors that have participated
in certain co-investment transactions, and two real estate fund managers with which MSIM has an
existing co-investment.
In general references were very pleased with the members of the Customized Solutions Platform team.
One reference stated that his endowment’s portfolio has almost doubled over the eleven years that
MSIM has overseen the portfolio and his endowment does not receive contributions from its sponsor.
The growth has been purely based on investment performance. References utilize MSIM as an OCIO
platform whereby MSIM has delegated authority over investment portfolios. It was noted that Rui

MEKETA INVESTMENT GROUP 55
MSIM CRPTF REAL ASSETS CO-INVESTMENT PARTNERSHIP
Private Markets Investment Memorandum
Appendices
Figueiredo, CIO, is very active in the client management and investment decision making process.
Multiple references stated that Mr. Figueiredo participates in all client calls. One endowment reference
stated that he has weekly calls with Mr. Figueiredo and that the MSIM team is extremely interactive with
his staff. MSIM offers a plethora of resources to clients at all times so references feel as if their
investment questions are always addressed because MSIM uses all resources to address questions and
concerns. Some references stated that while Catherine Hong and Steve Turner made investment
decisions, they interact with a different point person who oversees all aspects of their account (non co-
investment activities and other asset classes).
References stated that MSIM provides a pipeline of investment opportunities on a no-name basis very
frequently. As the limited partners have provided MSIM with delegated authority, they do not review
the investment details of co-investment opportunities. However, MSIM does discuss how specific co-
investment opportunities are a fit for their portfolio and MSIM reviews the risk/return criteria related to
co-investment opportunities. References stated that they do not feel there are any allocation issues
pertaining to deal sourcing as they have received access to many unique opportunities within real
assets. These opportunities have been global and fall in line with the guidelines that they established
with MSIM. Certain references have very specific investment guidelines pertaining to restricted assets
and industries. However, they stated that MSIM is very cognizant of these guidelines and identifies
appropriate investment opportunities accordingly. References stated that MSIM has been very
transparent with regard to investment pipelines and deal allocations.
When asked about the performance of co-investments, one reference stated that most of the co-
investments were purchased at a discount so the investments have experienced very little j-curve
impact and have actually produced a positive return very quickly. Another reference stated that the
real assets co-investments have been a good way to expand its exposure in this space.
The real estate fund managers / co-investment partners that were interviewed noted that MSIM’s
diligence process was very thorough, including property tours. MSIM worked with the managers to
modify the cash flow models to include assumptions based on other investments owned by the Morgan
Stanley platform. The one note of caution given by one of the references was turnover within the MSIM
team. Though all MSIM team members were described as “really talented,” the particular investment
is being overseen by a fourth person (Catherine Hong) since the deal was consummated in 2014.
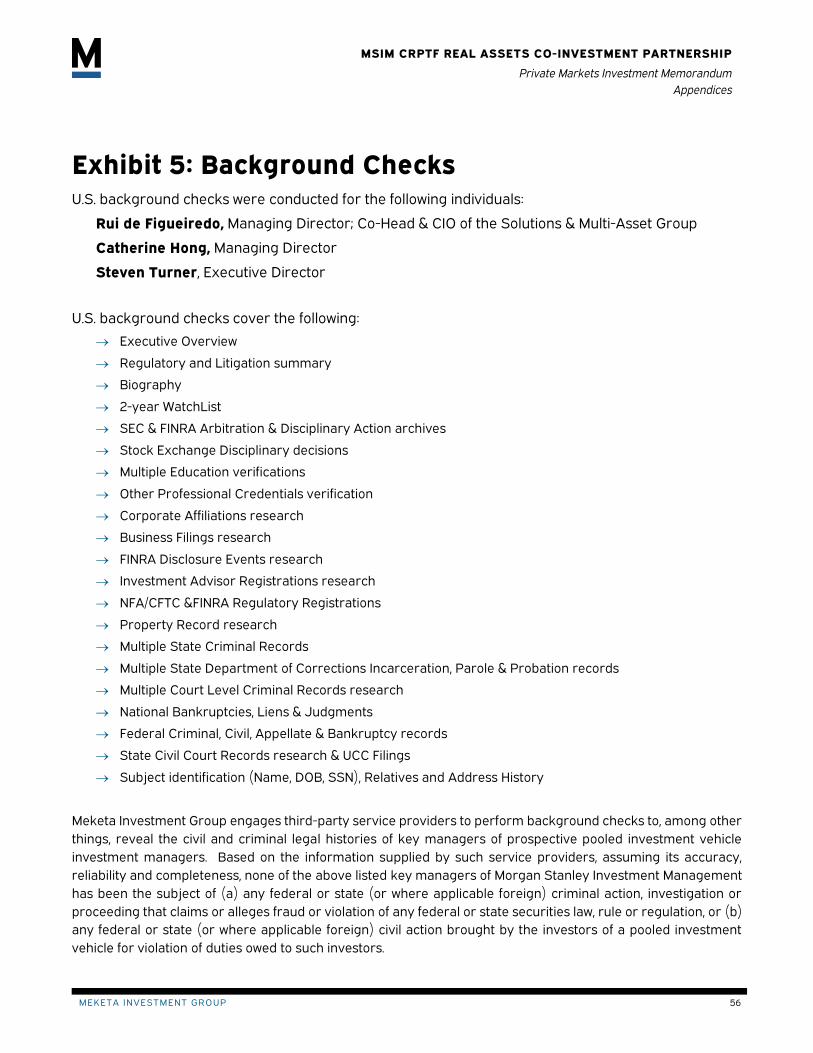
MEKETA INVESTMENT GROUP 56
MSIM CRPTF REAL ASSETS CO-INVESTMENT PARTNERSHIP
Private Markets Investment Memorandum
Appendices
Exhibit 5: Background Checks U.S. background checks were conducted for the following individuals:
Rui de Figueiredo, Managing Director; Co-Head & CIO of the Solutions & Multi-Asset Group
Catherine Hong, Managing Director
Steven Turner, Executive Director
U.S. background checks cover the following:
Executive Overview
Regulatory and Litigation summary
Biography
2-year WatchList
SEC & FINRA Arbitration & Disciplinary Action archives
Stock Exchange Disciplinary decisions
Multiple Education verifications
Other Professional Credentials verification
Corporate Affiliations research
Business Filings research
FINRA Disclosure Events research
Investment Advisor Registrations research
NFA/CFTC &FINRA Regulatory Registrations
Property Record research
Multiple State Criminal Records
Multiple State Department of Corrections Incarceration, Parole & Probation records
Multiple Court Level Criminal Records research
National Bankruptcies, Liens & Judgments
Federal Criminal, Civil, Appellate & Bankruptcy records
State Civil Court Records research & UCC Filings
Subject identification (Name, DOB, SSN), Relatives and Address History
Meketa Investment Group engages third-party service providers to perform background checks to, among other
things, reveal the civil and criminal legal histories of key managers of prospective pooled investment vehicle
investment managers. Based on the information supplied by such service providers, assuming its accuracy,
reliability and completeness, none of the above listed key managers of Morgan Stanley Investment Management
has been the subject of (a) any federal or state (or where applicable foreign) criminal action, investigation or
proceeding that claims or alleges fraud or violation of any federal or state securities law, rule or regulation, or (b)
any federal or state (or where applicable foreign) civil action brought by the investors of a pooled investment
vehicle for violation of duties owed to such investors.

CRPTF: Real Assets Co-Investment PartnershipSeptember 2021

SOLUTIONS TEAM 2FOR THE EXCLUSIVE USE OF CRPTF | 2021
Disclaimers
Certain assumptions have been made regarding the historical performance information included in this Presentation, and such performance information is presented by way of example only. No representation is made that the performance presented will be achieved as a result of implementing an investment strategy substantially identical or similar to that described in this Presentation or that every assumption made in achieving, calculating, or presenting the historical performance information in this Presentation has been considered or stated in preparing this Presentation. Any changes to assumptions that may have been made in preparing this Presentation could have a material impact on the investment returns that are presented herein by way of example. Historical performance information is not indicative of future results, and the historical performance information in this Presentation should not be viewed as an indicator of any future performance that may be achieved as a result of implementing an investment strategy substantially identical or similar to that described in this Presentation.
Information regarding expected market returns and market outlooks is based on the research, analysis, and opinions of the Investment Adviser as of the date of this Presentation. These conclusions are speculative in nature, are subject to change, may not come to pass, and are not intended to predict the future of any specific Morgan Stanley investment.
Alternative investments are speculative, involve a high degree of risk, are highly illiquid, typically have higher fees than other investments, and may engage in the use of leverage, short sales, and derivatives, which may increase the risk of investment loss. These investments are designed for investors who understand and are willing to accept these risks. Performance may be volatile, and an investor could lose all or a substantial portion of its investment. No representation or warranty, express or implied, is made or can be given with respect to the accuracy or completeness of the information in this Presentation or to the effect that any Agreement will conform to the terms described in this Presentation. No person has been authorized to make any representations which are inconsistent with the statements contained in this Presentation. As noted above, engagement of the Investment Adviser would be governed by the terms of the Agreement. In making any investment decision, the recipient should not rely on this Presentation.
Morgan Stanley does not render advice on tax and tax accounting matters to clients. This material was not intended or written to be used, and it cannot be used, with any taxpayer for the purpose of avoiding penalties which may be imposed on the taxpayer under U.S. federal tax laws. Federal and state tax laws are complex and constantly changing. You should always consult your legal or tax advisor for information concerning your individual situation.
The investment strategies described herein have not been registered with, or approved or disapproved by, the U.S. Securities and Exchange Commission, the U.S. Commodity Futures Trading Commission, any U.S. national securities exchange, or any other U.S. federal or state governmental agency or regulatory authority. No agency, exchange, or authority has passed upon the accuracy or adequacy of this Presentation or the merits of investing with the Investment Adviser. Any representation to the contrary is a criminal offense.
Additional information is available upon request.
The recipient should not construe the contents of this Presentation as legal, tax, or financial advice and should consult its own professional advisors as to the legal, tax, financial, or other matters relevant to the suitability of an investment in the Fund for the recipient.

SOLUTIONS TEAM 3FOR THE EXCLUSIVE USE OF CRPTF | 2021
Table of Contents
Co-Investment Overview Section 1
Partnership Overview Section 2
Real Asset Solutions Team Section 3
Mandate Overview Section 4
Real Asset Investment Strategy & Process Appendix A
Risk Factors Appendix B

Co-Investment Overview
SECTION 1

SOLUTIONS TEAM 5FOR THE EXCLUSIVE USE OF CRPTF | 2021
Private Market Co-Investment Overview
Co-InvestmentA passive investment made directly into a pre-identified operating company / asset alongside a private market sponsor (also known as ageneral partner or “GP”) that serves as an active lead investor.A co-investment opportunity can arise when a sponsor seeks to acquire an interest in a company / asset for which the required investment capital is greater than what the sponsor’s fundis able to commit.
LPLP
Co-Investment
Co-Investment StructureFor illustrative purposes only
Co-Investment Deployment For illustrative purposes onlyFund IRR (%)
GP
LP LP LP
Inv. Inv.Inv.Inv. Time
0
Portfolio (Primary Commitments)Portfolio (Co-Investment Commitments)
The information set forth above is provided for purposes of illustration only and as an example and as an example and does not reflect an actual investment. Actual performance of any investmentwill depend on future general economic, financial and market circumstances, most, if not all, of which are not presently known. For illustrative purposes only.

SOLUTIONS TEAM 6FOR THE EXCLUSIVE USE OF CRPTF | 2021
Private Market Co-Investment Benefits
Access to high quality investments
Efficiently enhanced long-term net returns
Low fee burden
Ability to target specific vintage year and differentiated assets
Enhanced selection and investment scrutiny
The information set forth above is provided for purposes of illustration only and as an example and as an example and does not reflect an actual investment. Actual performance of any investmentwill depend on future general economic, financial and market circumstances, most, if not all, of which are not presently known. For illustrative purposes only.
Accelerated capital deployment

Partnership Overview
SECTION 2

SOLUTIONS TEAM 8FOR THE EXCLUSIVE USE OF CRPTF | 2021
Our Understanding of CRPTF Objectives
Implement efficient and cost-effective deployment of real asset investments across real estate, infrastructure and natural resources
Develop a real asset co-investment partnership to supplement CRPTF fund investments, increasing potential to achieve attractive risk-adjusted returns and overall portfolio return enhancement
Create a resource extension allowing for CRPTF to quickly and efficiently assess and execute co-investments from existing GP relationships as well as leveraging GP network of a 3rd party partner
The statements above represent our opinions and views as of the date hereof and not as of any future date and will not be supplemented. The proposal set forth above is for discussion purposes only and isnot final. The terms of any investment shall be governed by definitive agreements. Any decision to invest should be made solely in reliance upon such agreements. Targets may not be realized and cannot beguaranteed. There is no guarantee a portfolio would meet its objectives.

SOLUTIONS TEAM 9FOR THE EXCLUSIVE USE OF CRPTF | 2021
MSIM’s Partnership Approach to Co-investing
Co-investment Resource Extension: Partnership to underwrite real asset co-investment opportunities from current CRPTF portfolio/GPs
Third Party Co-investment Opportunities: Access to unique and proprietary co-investment opportunities that are complementary to CRPTF’s broader real asset portfolio
ESG Opportunities: Tailor portfolio based on the specific goals and sensitivities
The above represents the views and opinions of MSIM as of the date hereof and not as of any future date.
Operational Benefits: Reduced operational and administrative requirements through a single investment vehicle and tailored reporting
Knowledge Transfer: Comprehensive program designed to address full spectrum of needs (content, research, investment insights, client training, etc.)

SOLUTIONS TEAM 10FOR THE EXCLUSIVE USE OF CRPTF | 2021
Benefits of a Strategic Partnership ApproachTailored partnership beyond the investment portfolio
KNOWLEDGETRANSFER
RESEARCH & INVESTMENTINSIGHTS
CLIENT EVENTS &TRAINING
INVESTMENT• Diagnostic analysis• Asset allocation study• Due diligence • Illiquid portfolio management tools • Benchmark studyORGANIZATIONAL • D&I collaboration (eg. programmatic,
community and metrics)• Organizational and governance study • Trading, compliance and risk
management best practices
• Access to broader Morgan Stanley research and network, including MS Senior Leadership
• Proprietary research and analytical tools
• Tailored research projects (examples):– Active / Passive– Strategic Asset allocation– Liability Framework
• Access to thematic investment insights such as ESG, diversity and inclusion and climate impact
MSIM CONFERENCES:• MSIM Institute • MSIM Ideas • Global Insights Day
AD-HOC EVENTS: • Private Market Perspectives• Post Crisis Investing• Allocating to the Green Economy
TAILORED TRAINING CUSTOMIZED IN FOCUS AND LENGTH (1 – 8 WEEKS): • Asset Allocation• Sub-asset class focus• Implementation • Risk Management
The above represents the views and opinions of MSIM as of the date hereof and not as of any future date.

Real Asset Solutions Team
SECTION 3
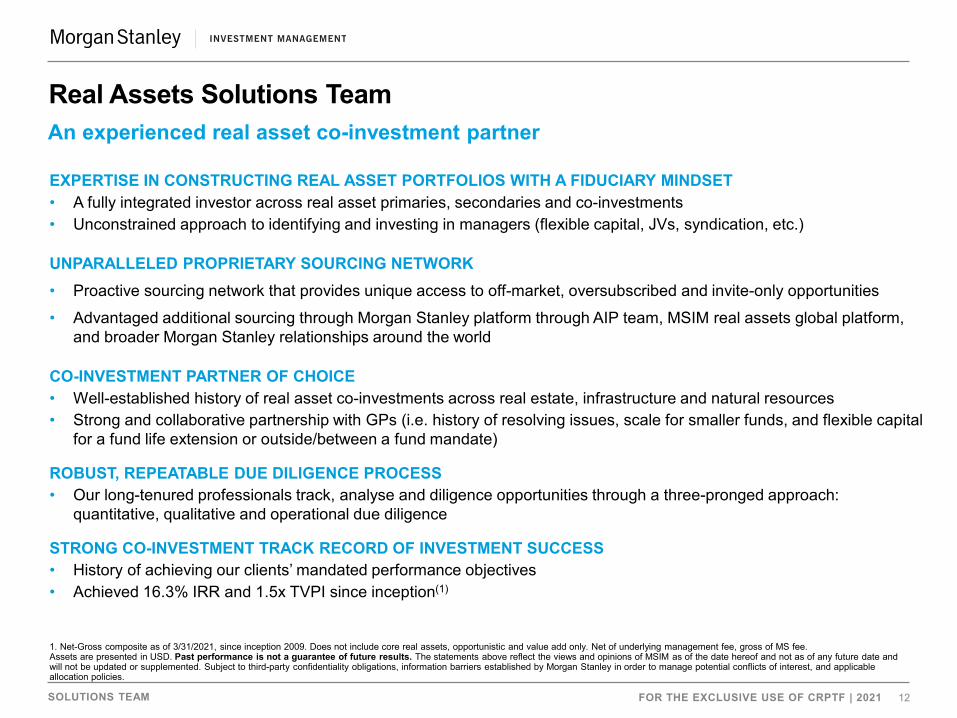
SOLUTIONS TEAM 12FOR THE EXCLUSIVE USE OF CRPTF | 2021
Real Assets Solutions Team
1. Net-Gross composite as of 3/31/2021, since inception 2009. Does not include core real assets, opportunistic and value add only. Net of underlying management fee, gross of MS fee. Assets are presented in USD. Past performance is not a guarantee of future results. The statements above reflect the views and opinions of MSIM as of the date hereof and not as of any future date and will not be updated or supplemented. Subject to third-party confidentiality obligations, information barriers established by Morgan Stanley in order to manage potential conflicts of interest, and applicable allocation policies.
EXPERTISE IN CONSTRUCTING REAL ASSET PORTFOLIOS WITH A FIDUCIARY MINDSET • A fully integrated investor across real asset primaries, secondaries and co-investments • Unconstrained approach to identifying and investing in managers (flexible capital, JVs, syndication, etc.)
UNPARALLELED PROPRIETARY SOURCING NETWORK • Proactive sourcing network that provides unique access to off-market, oversubscribed and invite-only opportunities • Advantaged additional sourcing through Morgan Stanley platform through AIP team, MSIM real assets global platform,
and broader Morgan Stanley relationships around the world
CO-INVESTMENT PARTNER OF CHOICE• Well-established history of real asset co-investments across real estate, infrastructure and natural resources • Strong and collaborative partnership with GPs (i.e. history of resolving issues, scale for smaller funds, and flexible capital
for a fund life extension or outside/between a fund mandate)
ROBUST, REPEATABLE DUE DILIGENCE PROCESS• Our long-tenured professionals track, analyse and diligence opportunities through a three-pronged approach:
quantitative, qualitative and operational due diligence
STRONG CO-INVESTMENT TRACK RECORD OF INVESTMENT SUCCESS • History of achieving our clients’ mandated performance objectives• Achieved 16.3% IRR and 1.5x TVPI since inception(1)
An experienced real asset co-investment partner

SOLUTIONS TEAM 13FOR THE EXCLUSIVE USE OF CRPTF | 2021
RELATIONSHIP MANAGEMENT
INVESTMENT COMMITTEE
CRPTF Senior Relationship and Portfolio Management Team
Rui De Figueiredo, PhDManaging DirectorCo-Head & CIO of Solutions & Multi-Asset Group
Head of Portfolio Construction & Analysis
Ryan Meredith, CFA, FFAManaging DirectorHead of Portfolio Solutions GroupVice Chairman & Head of
Strategic Partnerships
Ted EliopoulosManaging Director
Damon WuExecutive Director
John MeccaExecutive Director
Co-Head of Investment Research
Catherine HongManaging Director
Steven TurnerExecutive Director
› Former CIO & Head of Real Assets at CalPERS
› Member of IM Operating Committee, Co-Chair of the Sustainable Investing Council and Senior Sponsor of MSIM’s Diversity Council
› AB from Harvard University, Ph.D. & two master’s degrees from Stanford University. Emeritus at Hass Business School at UC Berkeley
› Member of Global Investment Committee & IM Operating Committee
› M.Sc. in Computational Finance from Carnegie Mellon University
› M.B.A. and M.S. joint degree from Case Western Reserve University
› B.Sc. in Engineering from National Taiwan University
› M.Sc. in Mathematics of Finance, Courant Institute at New York University and B.Sc. in Mathematical Statistics, University of Witwatersrand in South Africa
› Fellowship member of the Institute and Faculty of Actuaries
› Former Director on BlackRock’s strategic client coverage team and previously a Managing Director at The Rock Creek Group
› 19 years of industry experience and 9 years with Morgan Stanley
Co-Head of Investment Research
› B.A. cum laude in Economics from Wellesley College and M.B.A from the Wharton School of the University of Pennsylvania
› Member of Real Estate Investment Committee and Sustainable Investing Council
› B.Sc in Economics from the University of Southampton
› M.Sc in Investment Management from the International Capital Markets Association Centre at Henley Business School
Strategic Client Relationships
Seema HingoraniManaging Director
› Former CIO at New York City Retirement Systems, CIO & Founder of SevenStep Capital
› Founder & Chair of Girls Who Invest, Senior Sponsor of MSIM’s Diversity Council, member of Morgan Stanley’s Diversity and Inclusion Senior Leadership Advisory Council
North America Institutional Sales
Vice Chairman & Head ofStrategic Partnerships
Ted EliopoulosManaging Director
› Former CIO & Head of Real Assets at CalPERS
› Member of IM Operating Committee, Co-Chair of the Sustainable Investing Council and Senior Sponsor of MSIM’s Diversity Council
Dedicated resources responsible for delivering a best-in-class real asset co-investment partnership

SOLUTIONS TEAM 14FOR THE EXCLUSIVE USE OF CRPTF | 2021
Investment Committee
• The Investment Committee is responsible for day-to-day portfolio oversight and management of CRPTF real asset co-investment solution
Investment Research• Global investment research
team responsible for sourcing, underwriting and monitoring of real asset co-investment opportunities
Investment Administration & Data Management• Team responsible for
administration, structuring, reporting and operational aspects of partnership
Specialist Investment Research• Access to broader MS platform
for support in investment sourcing, diligence, transaction structuring and execution depth
Our Team
Investment Committee
Rui de Figueiredo24 yrs experience
Ryan Meredith24 yrs experience
OPERATIONS | PORTFOLIO SERVICES AND ADMINISTRATION | REPORTING AND ANALYSIS | INFORMATION TECHNOLOGY | COMPLIANCE | MARKETING | LEGAL | TAX |
Catherine Hong18 yrs experience
Steve Turner 13 yrs experience
As of July 31, 2021. The statements above reflect the views and opinions of MSIM as of the date hereof and not as of any future date.
Damon Wu14 yrs experience
Investment Research
Yige Zou, CFA Vice President (New York)
Pennapa Tantiyakul, CAIAExecutive Director (New York)
Nick Di Giampasquale, CAIA, CFA
Vice President (London)
Alicia BiggsVice President (New York)
Blanca Garcia RequesensVice President (New York)
Kaili LiSenior Associate (New York)
Ravel Shen, CFASenior Associate (New York)
Patrick KenneyAssociate (New York)
Emir OsmaniAssociate (London)
Greg WatermanVice President (New York)
Hayley SorianoAnalyst (New York)
Victoria EcksteinCOO (New York)
Investment Administration
Fiona DeansAssociate (London)
Veronica Lai(New York)
Kristen DebonoVice President (New York)
Michael SchreierSenior Associate (New York)
Francie TaiExecutive Director (New York)
Ishaan ViegasSenior Associate (New York)
Data Management
350+ Specialist Investment Research Professionals
Joshua MyersVice President (New York)
Carlo ArlunnoSenior Associate (London)
Ted Eliopoulos24 yrs experience

SOLUTIONS TEAM 15FOR THE EXCLUSIVE USE OF CRPTF | 2021
AIP Private Equity & Hedge Fund Team MSIM Operations, Legal & Compliance AIP Private Markets:
• History of working together on custom mandates for 10+ years
• 50+ dedicated professionals
• Committed $20+ billion to more than 950 private markets investments since inception in 2000
• Maintains relationships with over 300 GPs and, since inception, has tracked over 3,500
AIP Hedge Fund Solutions:
• History of working together on custom mandate for 10+ years
• 60+ dedicated professionals
• $22bn in AUM and AUA
• Pioneer and active co-investment investor with successful track record
Access to best-in-class resources:
• Operations: 295 professionals
• Finance: 79 professionals
• Legal and Compliance: 94 professionals
• Risk Management: 35 professionals
• Technology: 163 professionals
• Human Resources: 10 professionals
Shared Resources to Benefit the CRPTF Mandate
The statements above reflect the views and opinions of MSIM as of the date hereof and not as of any future date and will not be updated or supplemented. For illustrative purposes only. As of March 31,2021
MSIM Direct Private Real Asset Platforms • MS Private Real Estate: Core to opportunistic deployment
with 200 professionals and $36.4 bn AUM
• MS Private Infrastructure: Value add to opportunistic deployment with 50 professionals and $6.4bn AUM
• Access to thought leadership and industry expertise

SOLUTIONS TEAM 16FOR THE EXCLUSIVE USE OF CRPTF | 2021
Real Asset Net-Gross IRR1,2
IRRReal Asset Net-Gross TVPI1,2
TVPI
A Successful Tradition of Real Asset Co-Investing1
16.3%
11.4%
0%
2%
4%
6%
8%
10%
12%
14%
16%
18%
20%
MS Real AssetsCo-InvestComposite
Cambridge RealAsset Composite
1.5x
1.3x
1.3x
1.3x
1.4x
1.4x
1.5x
1.5x
1.6x
MS Real AssetsCo-InvestComposite
CambridgeReal AssetComposite
COMMITTED & NUMBER OF INVESTMENTS TO REAL ASSETS SINCE INCEPTION (1)
$2+Bn / 110+
COMMITTED & NUMBER OF INVESTMENTS TO REAL ASSETS CO-INVESTMENTS SINCE INCEPTION (1)
$800+MM/40
REAL ASSET NET-GROSS IRR / TVPI (1)
16.3% / 1.5x
1. As of 3/31/2021, since inception: 2009. Does not include core real assets, opportunistic and value add only. Net of underlying management fee, gross of MS fee. 2. Cambridge composite comprised of opportunistic and value add real estate, infrastructure and timber from vintages 2009-2021 as of December 31, 2020, NCREIF US from 3/31/2009-3/31/2021. Assets
are presented in USD. Past performance is not a guarantee of future results. The statements above reflect the views and opinions of MSIM as of the date hereof and not as of any future date and will not be updated or supplemented. Subject to third-party confidentiality obligations, information barriers established by Morgan Stanley in order to manage potential conflicts of interest, and applicable allocation policies.
Top quartile co-investment track record
REALIZED REAL ASSET NET-GROSS IRR / TVPI (1)
22.6% / 2.0x

Mandate Overview
SECTION 4

SOLUTIONS TEAM 18FOR THE EXCLUSIVE USE OF CRPTF | 2021
Mandate Overview
The statements above reflect the views and opinions of MSIM & CRPTF as of the date hereof and not as of any future date.
Investment Strategy:• Invest in co-investments across private real estate, infrastructure and natural resources sourced through CRPTF GPs and
MSIM GPs
• Focus globally across value add and opportunistic co-investments
• Account for diversification by strategy, geography and vintage year
• Collaborate on co-investments with emerging and diverse GPs
• Consider CRPTF ESG preferences and objectives
Investment Objective: • To target a 12% internal rate of return, net of all fees, for the investment associated with each three-year commitment period
Structure:• A Separately Managed Account that is evergreen in nature with three-year commitment periods
• Commitment amount to be dynamic based on CRPTF’s direction. We understand CRPTF’s current desired commitments for the next 12 months are as follows:
• Real Estate: $75MM annual commitments
• Infrastructure / natural resources: $50MM annual commitments
Alignment of Interest:• Morgan Stanley & senior investment professionals aligned through GP commitment and carried interest
Mandate is customizable in nature and reflective of a 3 -year commitment period

SOLUTIONS TEAM 19FOR THE EXCLUSIVE USE OF CRPTF | 2021
Range
Co-Investments 95% - 100%
Stapled Primaries 0% - 5%
Real Estate 50% - 70%
Infrastructure and Natural Resources 30% - 50%
North America 20% - 80%
Europe 10% - 60%
Developed Asia Pacific 0% - 30%
Emerging Markets 0% - 20%
Target Investment Size $10 - $25MM
Materiality Constraint $10MM
Asset Class 25%
Portfolio Level 20%
CRPTF Co-Investment Guidelines
The statements above reflect the opinions and views of MSIM and CRPTF as of the date hereof and not as of any future date and will not be updated or supplemented.
Commitments by Investment Type
Commitments by Strategy
Commitments by Geography
Commitment Sizing
GP Concentration Limit
Guidelines are customizable in nature and reflective of a 3-year commitment period

SOLUTIONS TEAM 20FOR THE EXCLUSIVE USE OF CRPTF | 2021
Step 1A
CRPTF GP sourced co-investment
CRPTF connects MSIM to GP
MSIM initial review of co-investment & GP
MSIM proceeds with due diligence
MSIM provides initial stage memo / summary
Step 1B
MSIM-sourced co-investment
MSIM initial review of co-investment & GP
MSIM proceeds with due diligence
MSIM provides initial stage memo / summary
Step 2
MSIM conducts in-depth review and due diligence
of co-investment
MSIM underwrites opportunity set,
conducts site visit, reviews findings with
GP, examines comparables in local
market
Step 3
MSIM develops investment report
MSIM reviews full due diligence with
Investment Committee
Outcome
Approve/deny for Investment
Further Validation:Respond to questions
and document and repeat review with IC
Acquire asset and begin ongoing monitoring
Discretionary Mandate Investment Due Diligence Process with CRPTF
For illustrative purposes only. The statements above reflect the opinions and views of MSIM and CRPTF as of the date hereof and not as of any future date and will not be updated or supplemented.

SOLUTIONS TEAM 21FOR THE EXCLUSIVE USE OF CRPTF | 2021
MSIM CRPTF Co-Investment Partnership Proposed Fees
Management Fee (On Invested
Capital)Carried Interest1
Annual Targeted Co-Investment Commitments2
Estimated Co-Investment Sources (CRPTF / Program
Manager)
Real Asset Co-Investment Program
45bps 7% over an 8% preferred return net of fees $125M to $175M
Infrastructure / Natural Resources $50 to $75M 50% / 50%
Real Estate $75 to $100M 25% / 75%
Note the above does not constitute the full detailed set of terms, which will be included int he final agreement1. Return calculated for each three-year investment period (in blocks aggregated across three vintage years).2. Assuming a minimum of three-year commitments.All underlying manager fees are borne by the client. For discussion purposes only. All terms are subject to a final definitive agreement. We seek to use our size and reputation as a leading investor to ensure efficient implementation of underlying positions and typically push for best pricing with each underlying manager. Any discount that we may achieve is directly passed through to the client.

Real Asset Investment Strategy & Process
APPENDIX A

SOLUTIONS TEAM 23FOR THE EXCLUSIVE USE OF CRPTF | 2021
Our Real Asset Co-Investment Philosophy
SPONSOR RELATIONSHIPS
RELATIVEVALUE
ORIENTATION
FOCUS ON CAPITAL
PRESERVATION
FUNDAMENTAL VALUE CREATION
Source and partner with strong, well-positioned GPs
Co-investment partner of choice via integrated
primary platform and rapid execution
Emphasize less efficient markets (1)
Focused on constrained markets and opportunistic investments to enhance entry pricing and return
generation
Seek sponsors who are institutional, well-resourced,
aligned, and experienced
Construct exposure to highly differentiated return drivers (for example regulatory risk in infrastructure) to reduce correlation with other asset
classes
Preference for opportunities that are focused on
operational management where asset level
engagement is expected to drive business enhancements
A focus on differentiated exposure and alpha generation
Source: MSIM. This information reflects the views of the portfolio manager as of the date hereof and not of any future date and are subject to change without notice in response to changing circumstances and market conditions. This information should not be construed as investment advice and should not be deemed a recommendation to buy or sell any strategy.

SOLUTIONS TEAM 24FOR THE EXCLUSIVE USE OF CRPTF | 2021
Private Real Asset Opportunity Set
Source: MSIM. This information reflects the views of the portfolio manager as of the date hereof and not of any future date and are subject to change without notice in response to changing circumstances and market conditions. This information should not be construed as investment advice and should not be deemed a recommendation to buy or sell any strategy.

SOLUTIONS TEAM 25FOR THE EXCLUSIVE USE OF CRPTF | 2021
WELL-ESTABLISHED PLATFORM
Experienced team with over $2+ billion committed to 110+investments since inception(1)
PERSONAL NETWORKS
IC members collectively have over 116 years of experience withstrong networks of industry professionals and general partners
GP RELATIONSHIPS
Tracked over 2,000 GPs since inception with over 150+ active GPrelationships(2). GP’s sourced proactively through existing GPrelationships, market research searches, MS client relationships andproprietary funds across MS platform.
GLOBAL REAL ASSETS FRANCHISE
Real Assets Solutions Team leverages functional experts from MSIM’s broader investment platform in areas such as:• AIP Private Markets & Hedge Fund Solutions | 110 professionals | $31.7bn AUM
• MS Private Real Estate | 200 professionals | $36.4 bn AUM
• MS Private Infrastructure | 50 professionals | $6.4bn AUM
MORGAN STANLEYNETWORKS
Extensive networks of Morgan Stanley with over 70,000 employeesin 40+ countries (3)
Past performance is not indicative of future results. The statements above reflect the views and opinions of MSIM as of the date hereof and not as of any future date and will not be supplemented.1. As of March 31, 2021, including unfunded commitments.2. Real Assets Solutions Team estimate as of March 31, 2021.3. As of March 31, 2021. Subject to third party confidentiality obligations and internal policies and procedures established by Morgan Stanley, including information barriers and allocation policies, to manage
potential and actual conflicts of interest and/or in respect of regulatory requirements.
Sourcing Elements Platform with Broad Reach
400+ GP Interactions
Annually
150+Active GP
Relationships
<4%Close Rate
Co-Investment Sourcing Strong sourcing allows for robust deal flow, high selectivity, and consistent investment pace

SOLUTIONS TEAM 26FOR THE EXCLUSIVE USE OF CRPTF | 2021
We Believe We are a Partner of Choice
Source: MSIM. The statements above reflect the views and opinions of MSIM as of the date hereof and not as of any future date and will not be supplemented.
Access to “best-of-breed” and hard to access opportunities
A “Partner of Choice”:
• Co-investment, secondary and primary capital
• Working with partners to resolve issues
• Fund life extensions
• Bridge to first close
• Expand smaller funds’ acquisition abilities
• Opportunities outside the underlying fund’s mandate
Proprietary Flow
High Selectivity
Consistent Co-Investment Pipeline

SOLUTIONS TEAM 27FOR THE EXCLUSIVE USE OF CRPTF | 2021
Co-Investment Diligence Process
The statements above reflect the views and opinions of MSIM as of the date hereof and not as of any future date and will not be supplemented.
Methodical, granular process to ensure effective and disciplined execution
Our Investment Process Provides a Consistent Framework for Opportunity Evaluation
Opportunity Sourcing(ongoing)
Initial Review Detailed Underwriting, Site Visit and Execution
• Proactive sourcing of new opportunities and relationships
• Constant mining of existing Real Assets Solutions Team relationships
• Leading reputation as a significant LP and for direct co-Investment appetite and execution
• Leverage Morgan Stanley platform
• Placement agents
Investment Monitoring(ongoing)
Deal Specific Steps
• Assess investment partner profile for co-investment
• Review initial materials and discuss opportunity with investment partner
• Screen opportunity for initial fit with key investment criteria
• Determine if we can perform detailed due diligence on underlying real assets
• Determine timeline, process, and pricing
• Consider portfolio fit• Initial IC Approval
• Confirm fit with investment criteria
• Examine all GP diligence and related third-party analysis
• Independent benchmarking of GP underwriting
• Develop underwriting plan • Conduct in-depth review of
opportunity, focusing on key drivers of value and risk in the asset
• Site visit, broker meetings, comparison tours
• Map out capital structure, financing requirements and debt maturities
• Review legal structure and reporting basis for NAV
• Establish third party valuations using global network
• Stress test assumptions for differing outcomes
• Derive discount to FMV• Management assessment and
background checks• Reference calling• Tax, compliance, ESG, and
operations assessment• Obtain IC approval• Provide feedback to GP on
interest level, threshold valuation, and key sensitivities
• Negotiation of final structure and terms
• Advisory board rights• Routine interactions with
management team and investment partners
• Portfolio-level investment monitoring
• Formal semi-annual investment monitoring
• Independent fair value process and audit
• GP performance review to inform future investment sourcing and assessment

SOLUTIONS TEAM 28FOR THE EXCLUSIVE USE OF CRPTF | 2021
Bottom Up
Top Down
Asset Focus
Seeking to Generate
Attractive Risk Adjusted Returns
Portfolio Construction& Monitoring
• Deep value investing and a focus on fundamental returns
• Alignment and fiduciary culture
For illustrative purposes only. The statements above reflect the views and opinions of MSIM as of the date hereof and not as of any future date and will not be updated or supplemented.
• Granular portfolio monitoring; asset, fund & portfolio levels
• Integrated platform: flexibility to use primaries, secondaries & co-investments to contrast portfolios
• Focus on markets with exit liquidity
• Growth markets/supply & demand imbalances
Macro Economic Factors
Selecting Top Quartile Managers
• Asset by asset underwriting to develop a concrete understanding of value drivers, risks and mitigants
• A focus on unlevered post tax returns
Residential, NY
Class A Office, London
Real Asset Risk Management

SOLUTIONS TEAM 29FOR THE EXCLUSIVE USE OF CRPTF | 2021
Institutionalized Monitoring Process Sample Monitoring Note (1)
Consistent and Rigorous MonitoringOur process prioritizes monitoring activities and can be an early warning for issues at the GP level of investments
Images provided for illustrative purposes only. The statements above are the opinions and views of MSIM as of the date hereof and not as of any future date, and will not be supplemented.1. Due to confidentiality reasons complete monitoring pages can only be shown onsite.
• Real Asset Team members are involved• Strive to meet each GP at least twice each year • Written review for each investment at least annually
Process encompasses three layers of oversight
• Annual onsite monitoring meeting• Discussion of monitoring updates during team calls• Participation on advisory boards
Investments are ranked and rated:
• Meets expectations• Above expectations • Below expectations• Too early to tell
Need for active intervention or heightened sensitivity highlighted
• Red Flag• Yellow Flag• Green Flag
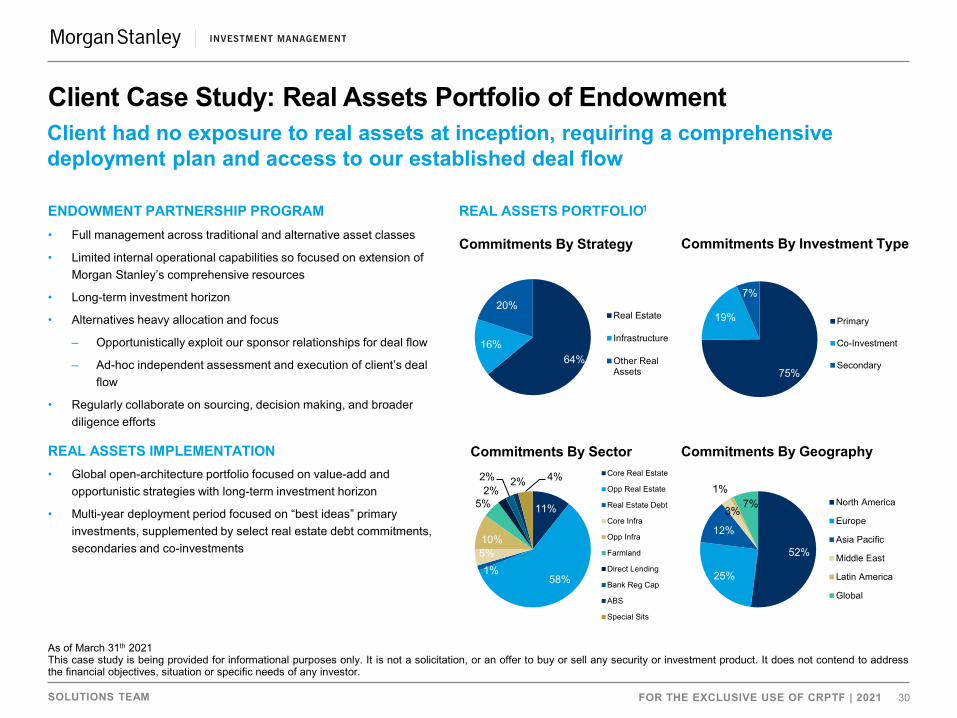
SOLUTIONS TEAM 30FOR THE EXCLUSIVE USE OF CRPTF | 2021
Client Case Study: Real Assets Portfolio of EndowmentClient had no exposure to real assets at inception, requiring a comprehensive deployment plan and access to our established deal flow
ENDOWMENT PARTNERSHIP PROGRAM • Full management across traditional and alternative asset classes
• Limited internal operational capabilities so focused on extension of Morgan Stanley’s comprehensive resources
• Long-term investment horizon
• Alternatives heavy allocation and focus
– Opportunistically exploit our sponsor relationships for deal flow
– Ad-hoc independent assessment and execution of client’s deal flow
• Regularly collaborate on sourcing, decision making, and broader diligence efforts
REAL ASSETS IMPLEMENTATION
REAL ASSETS PORTFOLIO1
As of March 31th 2021This case study is being provided for informational purposes only. It is not a solicitation, or an offer to buy or sell any security or investment product. It does not contend to addressthe financial objectives, situation or specific needs of any investor.
• Global open-architecture portfolio focused on value-add and opportunistic strategies with long-term investment horizon
• Multi-year deployment period focused on “best ideas” primary investments, supplemented by select real estate debt commitments, secondaries and co-investments
Commitments By Geography
52%
25%
12%
3%
1%7% North America
Europe
Asia Pacific
Middle East
Latin America
Global
Commitments By Sector
11%
58%1%
5%10%
5%2%
2% 2% 4% Core Real Estate
Opp Real Estate
Real Estate Debt
Core Infra
Opp Infra
Farmland
Direct Lending
Bank Reg Cap
ABS
Special Sits
Commitments By Investment Type
75%
19%
7%
Primary
Co-Investment
Secondary64%16%
20%Real Estate
Infrastructure
Other RealAssets
Commitments By Strategy

SOLUTIONS TEAM 31FOR THE EXCLUSIVE USE OF CRPTF | 2021
Co-Investment Case Study: Real Estate Residential
INVESTMENT THESIS
• Co-investment interest in a partially built out master planned community totaling 11,000 acres and entitled for over 6,000 residential units
• Located in in Orlando, FL, Project Sunshine is one of Central Florida’s largest Green Certified development
• Seller had completed all of the infrastructure and entitlement work, but was forced to liquidate the asset, as it was the last remaining asset in seller’s fund
• Manager acquired the fully entitled site for large discount (70%) compared to seller’s basis for an unentitled site
POTENTIAL BENEFITS• Attractive acquisition basis at distressed pricing• No entitlement risk, no major offsite infrastructure requirements and low land
carry costs• Strong management team with extensive expertise • Orlando is one of Manager’s strongest and largest investment markets
RISKS CONSIDERED• Potential downturn in the U.S. residential market• Key person
IMPLEMENTATION
• Underwritten base case 22% IRR over nine-year hold period using no leverage
• During underwriting, the Manager began negotiations to sell parts of the site within one year of closing
• Within six months of closing the co-investment, the Manager successfully sold two parts of the master planned community to strategic and bulk buyers, returning 50% of invested equity
Source: Solutions & Multi-Asset. This information reflects the views of the portfolio manager as of the date hereof and not of any future date and are subject to change without notice in response to changing circumstances and market conditions. This information should not be construed as investment advice and should not be deemed a recommendation to buy or sell any strategy.
Master Plan – Aerial View
Existing Homes on Site

SOLUTIONS TEAM 32FOR THE EXCLUSIVE USE OF CRPTF | 2021
INVESTMENT THESIS
• Joint venture focused on acquiring vacant and other value-add industrial assets around Dublin
• No new supply post-GFC with attractive macro and rental growth prospects given the strong recovery of the Irish economy
• Opportunity to partner with a best-in-class, but capital-constrained, value-add industrial manager seeking to expand to Europe
POTENTIAL BENEFITS• Opportunity to acquire prime industrial assets at ~50% below
replacement cost, in good locations with long-term leases in-place that we expected to benefit from rental growth over the hold period
• Benefit from the economic growth prospects of Ireland over the life of the investment
• Upside potential in creating a larger portfolio of multiple assets in Dublin to sell as a portfolio at premium pricing to larger institutional investors looking to access the market and asset class
RISKS CONSIDERED
• Leasing risk given limited comparable rental transactions in the market at the time of acquisition
• Exit risk
IMPLEMENTATION
• Over a two-year period, manager acquired 21 warehouse assets, with going-in occupancy of 83% and 7.0% yield on cost
• Manager successfully leased up the portfolio to 100% occupancy and 10.3% yield on cost given stronger than underwritten rental growth
• Portfolio sold in December 2020, generating a gross-net 33% IRR and 3.3x TVPI
The statements above reflect our views and opinions as of the date hereof and not as of any future date and will not be updated or supplemented. This information should not be construed as investment advice and should not be deemed a recommendation to buy or sell any strategy.
Co-Investment Case Study: Real Estate Irish Industrial Asset
Asset ExteriorDublin, Ireland
Property Interior

SOLUTIONS TEAM 33FOR THE EXCLUSIVE USE OF CRPTF | 2021
Source: PWC
Co-Investment Case Study: U.K. Electric Vehicle Charging Infrastructure
Source: Solutions & Multi-Asset. This information reflects the views of the portfolio manager as of the date hereof and not of any future date and are subject to change without notice in response to changing circumstances and market conditions. This information should not be construed as investment advice and should not be deemed a recommendation to buy or sell any strategy.
INVESTMENT THESIS
• Opportunity to co-invest in the UK’s leading rapid charging operator in the UK that benefits from a first-mover advantage and a differentiated offering that should enable the Company to take advantage of market and regulatory tailwinds driven by the “Green Recovery.”
• Stapled primary fund investment in a £400m target fund anchored by the UK Government to invest in the public charging infrastructure of electric vehicles in the UK
POTENTIAL BENEFITS• Attractive EV infrastructure market that is growing rapidly• Differentiated offering and strong consumer brand• Site selection and partnership wins• Strong and measurable environmental impact• Attractive entry valuation and compelling exit opportunities• Experienced management team that sponsor knows wellRISKS CONSIDERED• Weak demand for electric vehicles in UK• Highly competitive market• Technology risks• Management alignmentIMPLEMENTATION
• Co-Investment combined with staple primary fund commitment• Primary commitment involves gaining unique exposure to the high-return
mobility infrastructure market with attractive demand-supply dynamics by backing an experienced and innovative team that has the support of the UK government
Forecasted Number of Public EV chargers
EV Adoption Curve in the UK 2016-2030

Risk Factors
APPENDIX B

SOLUTIONS TEAM 35FOR THE EXCLUSIVE USE OF CRPTF | 2021
This is a summary of various risks associated with investing in portfolios of alternative investments. This summary is not, and is not intended to be, a complete enumeration or explanation of the risks involved. The recipient should consult with its own advisors before deciding whether to invest in these strategies. In addition, to the extent that the investment program of such a portfolio changes and develops over time, additional risk factors not described here may apply. Only a recipient who understands the nature of the investment, does not require more than limited liquidity in the investment, and has sufficient resources to sustain the loss of its entire investment should consider making the kind of investments described in this Presentation.
The following are among the risks applicable generally to a portfolio of hedge fund investments:
Reliance on Third-Party Management. The goal of investing in a portfolio of hedge funds managed by the Investment Adviser is to seek capital appreciation. Hedge funds selected for the portfolio are managed by third-party managers unaffiliated with the Investment Adviser over which the Investment Adviser does not exercise control.
No Assurance of Returns. The investment program of a portfolio of hedge funds is speculative and entails substantial risks. No assurance can be given that its investment objective would be achieved. Its performance depends upon the performance of the hedge funds included in the portfolio and upon the ability of the Investment Adviser effectively to select hedge funds and allocate and reallocate the portfolio’s assets among them. Each hedge fund’s use of leverage, short sales, and derivative transactions, in certain circumstances, can result in significant losses, volatility, or both.
Performance-Based Compensation. In addition to asset-based fees based on the hedge fund’s net assets under management, a hedge fund’s investment manager will typically charge each of the hedge fund’s investors a performance or incentive fee or allocation based on net profits of the hedge fund which it manages. Similarly, in addition to asset based fees based on the portfolio’s net assets, the Investment Adviser or one of its affiliates will also receive performance-based compensation (the “Performance Incentive”). The receipt of a performance or incentive fee or allocation by a hedge fund’s investment manager or of the Performance Incentive by the Investment Adviser or one of its affiliates may create an incentive for the hedge fund’s investment manager or the Investment Adviser, respectively, to make investments which are riskier or more speculative than those which might have been made in the absence of such an incentive.
Lack of Transparency. Hedge funds are not registered as investment companies with the U.S. Securities and Exchange Commission (the “SEC”) under the Investment Company Act of 1940 (the “ICA”), and investors in hedge funds will not have the benefit of the protections afforded by the ICA to investors in registered investment companies. Although the Investment Adviser will periodically receive information from each hedge fund in which the portfolio is invested regarding such hedge fund’s investment performance and investment strategy, the Investment Adviser may have little or no means of independently verifying this information. Hedge funds are not contractually or otherwise obligated to inform their investors of details surrounding proprietary investment strategies. In addition, the Investment Adviser has no control over the investment management, brokerage practices, custodial arrangements, or operations of hedge funds and must rely on the experience and competence of each hedge fund’s investment manager in these areas.
Multiple Levels of Fees and Expenses. By investing in a portfolio of hedge funds managed by the Investment Adviser, an investor bears its proportionate share of the asset-based fees and the Performance Incentive payable to the Investment Adviser and any of its affiliates, as the case may be, as well as other expenses of the portfolio. An investor, however, also indirectly bears its proportionate share of the asset-based fees, performance or incentive fees or allocations, and other expenses borne by investors in the hedge funds included in the portfolio. An investor which meets the eligibility conditions imposed by the respective hedge funds included in the portfolio, including minimum initial investment requirements which may be substantially higher than those imposed by any fund, could avoid the extra layer of fees and expenses by investing directly in those hedge funds.
Independence of Hedge Funds’ Investment Managers. A hedge fund’s investment manager will receive any performance or incentive fees or allocations to which it is entitled, without regard to both the performance of the other hedge funds in the portfolio and the performance of the overall portfolio. An investment manager to a hedge fund with positive performance may receive compensation, even if the overall portfolio’s aggregate returns are negative.
Potential for Increased Transactions Costs. Investment managers of the hedge funds included in the portfolio make investment decisions independently of each other. Consequently, at any particular time, one hedge fund in the portfolio may be purchasing interests in an issuer which at the same time are being sold by another hedge fund in the portfolio. Investment by hedge funds in this manner could cause the overall portfolio to incur certain transaction costs indirectly without accomplishing any net investment result.
Limited Liquidity of Hedge Funds. Additional investments in, or withdrawals from, the hedge funds in the portfolio may be made only at certain times, as specified in the governing documents of the respective hedge funds. As a result, before investments in hedge funds are effected or in furtherance of the portfolio’s objectives generally, some assets held in the portfolio may temporarily be from time to time cash, cash equivalents, or high-quality fixed-income securities and money market instruments (whether or not managed by affiliates of the Investment Adviser)
Summary of Risk Factors

SOLUTIONS TEAM 36FOR THE EXCLUSIVE USE OF CRPTF | 2021
Limited Voting Rights of Investors. A hedge fund typically restricts the ability of its investors to vote on matters relating to the hedge fund. As a result, investors in the hedge fund will have no say in matters which could adversely affect their investment, via the portfolio, in the hedge fund. Additionally, for regulatory purposes related to the Investment Adviser’s management of certain funds registered with the SEC under the ICA, the Investment Adviser may enter into contractual relationships under which other Funds irrevocably waive their respective voting rights (if any) to vote interests in underlying hedge funds.
Distributions in Kind. Hedge funds may distribute securities in kind to investors. Securities distributed in kind may be illiquid or difficult to value. In the event that a hedge fund were to make such a distribution in kind to a Fund, the Investment Adviser would seek to dispose of the securities so distributed in a manner which is in the best interests of such Fund.
Reliance on Third-Party Managers with Respect to Asset Valuation. Certain securities in which a hedge fund invests may not have a readily ascertainable market price and will be valued by the hedge fund’s investment manager. Such a valuation generally will be conclusive, even though the hedge fund’s investment manager may face a conflict of interest in valuing the securities, inasmuch as the value of such securities will affect the compensation payable to the hedge fund’s investment manager. In most cases, the Investment Adviser will have no ability to assess the accuracy of any such valuation. In addition, the net asset values or other valuation information received by the Investment Adviser from hedge funds will typically be estimates only, subject to revision until completion of the annual audits of the respective hedge funds. Revisions to the gain and loss calculations will be an ongoing process, and no net capital appreciation or depreciation figure can be considered final until completion of the annual audits of the respective hedge funds.
Leverage. Investments can be highly volatile and may engage in leverage and other speculative investment practices, which can increase investment loss.
Regulation as a Bank Holding Company. Morgan Stanley elected in September 2008 to be regulated as a Bank Holding Company (a “BHC”) under the U.S. Bank Holding Company Act of 1956, as amended (the “BHCA”), and the Federal Reserve has granted Morgan Stanley’s application for “financial holding company” (“FHC”) status under the BHCA. FHC status is available to BHCs which meet certain criteria. FHCs may engage in a broader range of activities than BHCs which are not FHCs.
The activities of BHCs and their affiliates are subject to certain restrictions imposed by the BHCA and related regulations. Because Morgan Stanley may be deemed to “control” a Fund within the meaning of the BHCA, these restrictions could apply to such Fund as well. These restrictions may materially adversely affect the Fund, among other ways, by imposing a maximum holding period on some or all of the Fund’s investments; limiting the amount of an entity’s beneficial ownership interests which the Fund may hold; restricting the ability of Morgan Stanley, the Adviser, the AIP affiliate which serves as general partner or manager of the relevant Fund (in either case, the “General Partner”), or their affiliates to invest in the Fund or to participate in the management and operations of the entities in which the Fund or an Investment Fund invests; or affecting either the ability of the Adviser to pursue certain strategies within the Fund’s investment program or the ability of the Fund, Morgan Stanley, the General Partner, the Adviser, or any of their respective affiliates to invest in certain Investment Funds. Certain BHCA regulations may also require aggregation of the positions owned, held, or controlled in client and proprietary accounts by Morgan Stanley and its affiliates (including without limitation the General Partner and the Adviser) with positions held by the Fund (and, in certain instances, one or more Investment Funds). Moreover, Morgan Stanley may cease in the future to qualify as an FHC, which in either case may subject the Fund to additional restrictions or cause the General Partner to dissolve the Fund. Additionally, there can be no assurance either that the bank regulatory requirements applicable to Morgan Stanley and the Fund will not change or that any such change will not have a material adverse effect on the Fund.
Morgan Stanley may in the future, in its sole discretion, restructure the Fund, the General Partner, or the Adviser in order to reduce or eliminate the impact or applicability of these bank regulatory restrictions on the Fund or other funds and accounts managed by the Adviser or any of its affiliates. Morgan Stanley may seek to accomplish this result by causing another entity to replace the Fund’s current General Partner, transferring ownership of the General Partner or the Adviser, reducing the amount of Morgan Stanley’s investment in the Fund (if any), effecting any combination of the foregoing, or implementing such other means as it determines in its sole discretion. Any such transferee may be unaffiliated with Morgan Stanley. In connection with any such change, the General Partner may in its sole discretion assign its right to receive any performance fee or allocation or cause another entity to be admitted to the Fund for the purpose of receiving such performance fee or allocation. In connection with any such change, the General Partner may in its sole discretion, assign its right to receive any performance fee or allocation or cause another entity to be admitted to the fund for the purpose of receiving such performance fee or allocation.
Recent Legislative Events. On July 21, 2010, President Obama signed into law the Dodd-Frank Wall Street Reform and Consumer Protection Act (the “Dodd-Frank Act”). Section 619 of the Dodd-Frank Act is known as the “Volcker Rule.” Once the Volcker Rule takes effect, which will be no later than July 21, 2012, it will limit the extent to which a “banking entity,” including Morgan Stanley and any of its affiliates, may sponsor or invest in a hedge fund or a private equity fund. It will also limit the aggregate equity, partnership, or other ownership interests of Morgan Stanley in hedge funds and private equity funds to a maximum of 3% of Morgan Stanley’s Tier 1 Capital. In addition, Morgan Stanley will be able to own no more than 3% of the total equity, partnership, or other ownership interests of any hedge fund or private equity fund organized and offered by Morgan Stanley. Banking entities such as
Summary of Risk Factors (cont’d)

SOLUTIONS TEAM 37FOR THE EXCLUSIVE USE OF CRPTF | 2021
Morgan Stanley will also not be permitted, directly or indirectly, to guarantee, to assume, or otherwise to insure the obligations or performance of such funds or of any funds in which such funds invest. Upon effectiveness, the Volcker Rule will also prohibit Morgan Stanley from engaging in certain “covered transactions” with any Fund, such as extensions of credit. The Volcker Rule may require Morgan Stanley and its affiliates, including the General Partner, the Adviser, or both, to restructure or terminate their respective affiliations with the Fund. During a statutory transition period for Morgan Stanley to become compliant with the requirements of the Volcker Rule, a Fund and any offshore fund formed for the purpose of investing in such Fund may need to change its name so as to avoid sharing a name with Morgan Stanley. Also, the General Partner and any other affiliate of Morgan Stanley invested in the Fund may need to reduce its investment in the Fund so as to meet the limitation that no more than 3% of Morgan Stanley’s Tier 1 Capital be invested in hedge funds and private equity funds. Any of the Fund, the General Partner, or the Adviser may also be required to take other actions. Morgan Stanley currently believes that any investments by it or any of its affiliates should comply with the 3% limitation on Morgan Stanley’s total ownership interest in the Fund. Because the Dodd-Frank Act and the Volcker Rule are such recent legislative changes and because the Dodd-Frank Act and the Volcker Rule direct a variety of other bodies and regulatory agencies of the U.S. Government to consider certain additional implementing regulations, the full scope of the impact of both the Dodd-Frank Act and the Volcker Rule is not yet known, and other direct or indirect consequences of the Dodd-Frank Act and the Volcker Rule may affect Morgan Stanley, the General Partner, the Adviser, or any of their respective affiliates and may result in a material adverse effect on the Fund.
The following risks are applicable to emerging markets investments:
Emerging Markets. The Fund or the hedge funds selected for the Fund’s portfolio may invest in assets in emerging markets. Investing in emerging markets involves risks and special considerations not typically associated with investing in other more established economies or securities markets. Such risks may include: (i) increased risk of confiscatory taxation or nationalization or expropriation of assets; (ii) greater social, economic, and political uncertainty, including war; (iii) higher dependence on exports and the corresponding importance of international trade; (iv) greater volatility, less liquidity, and smaller capitalization of securities markets; (v) greater volatility in currency exchange rates; (vi) greater risk of inflation; (vii) greater controls on foreign investment and limitations on repatriation of invested capital and on the ability to exchange local currencies for U.S. dollars; (viii) increased likelihood of governmental involvement in, and control over, the economies; (ix) governmental decisions to cease support of economic reform programs or to impose centrally planned economies; (x) differences in auditing and financial reporting standards which may result in the unavailability of material information about issuers; (xi) less extensive regulation of the securities markets; (xii) longer settlement periods for securities transactions and less reliable clearance and custody arrangements; and (xiii) less developed corporate laws regarding protection of investors and fiduciary duties of officers and directors.
Non-U.S. Investments. The fund or hedge funds selected for the Fund’s portfolio expects to make investments (directly or indirectly) in a number of different countries. Such investments may be made in countries or economies which may prove unstable. Depending on the country in which the investment is made, there may exist the risk of adverse political developments, including nationalization, confiscation without fair compensation, or war. Laws and regulations of other countries may impose restrictions which would not exist in the U.S. Investments in non-U.S. corporations may require significant government approvals under corporate, securities, exchange control, foreign investment, and other similar laws and may require financing and structuring alternatives which differ significantly from those customarily used in the U.S. No assurance can be given that a given political or economic climate, or that particular legal or regulatory risks, might not adversely affect an investment by the Fund.
Small-Capitalization Stocks. The Fund or the hedge funds selected for the Fund’s portfolio may invest in other funds which make investments in small- to medium-sized companies of a less seasoned nature. Investments in small-capitalization issuers often involve significantly greater risks than the securities of larger, better-known companies because they may lack the management experience, financial resources, product diversification, and competitive strengths of larger companies. The equity securities of these smaller issues are usually traded in the over-the-counter markets or on regional securities exchanges, and the frequency and volume of trading in these securities is often substantially less than that of larger companies, which may result in wider price fluctuations in small-capitalization stocks than in stocks of larger issuers. When selling large positions in small-capitalization stocks, the Fund or the hedge funds selected for the Fund’s portfolio may have to sell holdings at discounts from quoted prices or may have to make a series of small sales over a period of time.
Currencies. The Fund or one or more of the hedge funds selected for the Fund’s portfolio may invest a portion of its assets in non-U.S. currencies, or in instruments denominated in non-U.S. currencies, the prices of which are determined with reference to currencies other than the U.S. dollar. The Fund or such hedge funds may or may not seek to hedge all or any portion of its foreign currency exposure. To the extent unhedged, the value of the Fund or such hedge fund’s assets will fluctuate with U.S. dollar exchange rates, as well as the price changes of its investments in the various local markets and currencies. In addition, some governments from time to time impose restrictions intended to prevent capital flight, which may for example involve punitive taxation (including high withholding taxes) on certain securities transfers or the imposition of exchange controls making it difficult or impossible to exchange or repatriate the local currency. These and other restrictions may make it impracticable for the Fund or the hedge funds selected for the Fund’s portfolio to distribute the full amount of the Limited Partners’ capital accounts in U.S. dollars, and, therefore, a portion of the distribution may be made in non-U.S. securities or currency.
Summary of Risk Factors (cont’d)