
Stanislav Ivanov HOTEL REVENUE MANAGEMENT FROM THEORY TO PRACTICE
205
Stanislav Ivanov HOTEL REVENUE MANAGEMENT FROM THEORY TO PRACTICE
-
Upload
independent -
Category
Documents
-
view
0 -
download
0
Transcript of Stanislav Ivanov HOTEL REVENUE MANAGEMENT FROM THEORY TO PRACTICE
Stanislav Ivanov
HOTEL REVENUE MANAGEMENT
FROM THEORY TO PRACTICE

Stanislav Ivanov (2014). Hotel Revenue Management: From Theory to Practice. Varna: Zangador. Page 1 of 204
student
2014
Stanislav Ivanov
HOTEL REVENUE MANAGEMENT
FROM THEORY TO PRACTICE
Stanislav Ivanov (2014). Hotel Revenue Management: From Theory to Practice. Varna: Zangador. Page 2 of 204
First published 2014
by Zangador Ltd.
Varna, Bulgaria; tel: +359 52 330 964; email: [email protected]
ISBN: 978-954-92786-3-7
Reference:
Ivanov, Stanislav (2014). Hotel Revenue Management: From Theory to Practice. Varna: Zangador
This work is licensed under the Creative Commons Attribution-
NonCommercial-NoDerivatives 4.0 International License. To view a copy
of this license, visit http://creativecommons.org/licenses/by-nc-nd/4.0/.

Stanislav Ivanov (2014). Hotel Revenue Management: From Theory to Practice. Varna: Zangador. Page 3 of 204
To Maya and Hristo
Stanislav Ivanov (2014). Hotel Revenue Management: From Theory to Practice. Varna: Zangador. Page 4 of 204
PREFACE
This research monograph aims at developing an integrative framework of hotel
revenue management. It elaborates the fundamental theoretical concepts in the field
of hotel revenue management like the revenue management system, process, metrics,
analysis, forecasting, segmentation and profiling, and ethical issues. Special attention
is paid on the pricing and non-pricing revenue management tools used by hoteliers to
maximise their revenues and gross operating profit. The monograph investigates the
revenue management practices of accommodation establishments in Bulgaria and
provides recommendations for their improvement. The book is suitable for
undergraduate and graduate students in tourism, hospitality, hotel management,
services studies programmes, and researchers interested in revenue/yield
management. The book may also be used by hotel general managers, marketing
managers, revenue managers and other practitioners looking for ways to improve
their knowledge in the field.
Stanislav Ivanov (2014). Hotel Revenue Management: From Theory to Practice. Varna: Zangador. Page 5 of 204
ACKNOWLEDGEMENTS
The author would like to thank the following people who made this monograph
happen:
Prof. Steven F. Illum, Missouri State University (USA), and Prof. Metin Kozak,
Dokuz Eylul University (Turkey), for their constructive reviews of the
manuscript.
Vladyslav Ralko from the MBA programme at International University College
(Bulgaria) who helped with the primary data collection.
All hoteliers, manager and owners of accommodation establishments in
Bulgaria who devoted their precious time in the empirical research.
The participants in the Hotel Revenue Management courses of the author who
have shared their views and practical experience in the field.
Finally, I would like to thank my family who had to accept my long hours in
front of the computer.
Stanislav Ivanov (2014). Hotel Revenue Management: From Theory to Practice. Varna: Zangador. Page 6 of 204
HOTEL REVENUE MANAGEMENT:
FROM THEORY TO PRACTICE
TABLE OF CONTENTS:
PAGE
Chapter 1. Introduction to hotel revenue management 7
Chapter 2. Economic fundamentals of hotel revenue management 13
Chapter 3. Hotel revenue management system 22
Chapter 4. Hotel revenue management process 34
Chapter 5. Hotel revenue management metrics 43
Chapter 6. Market segmentation, profiling and targeting 56
Chapter 7. Information provision for the revenue management process 66
Chapter 8. Revenue management analysis 70
Chapter 9. Revenue management forecasting 79
Chapter 10. Value creation 87
Chapter 11. Pricing hotel revenue management tools 98
Chapter 12. Non-pricing hotel revenue management tools 114
Chapter 13. Combined hotel revenue management tools 135
Chapter 14. Managing revenues in various hotel revenue management
centres
149
Chapter 15. Hotel revenue management, ethics and relationship marketing 158
Chapter 16. Revenue management practices of accommodation
establishments in Bulgaria
163
Concluding thoughts 187
References 188
Stanislav Ivanov (2014). Hotel Revenue Management: From Theory to Practice. Varna: Zangador. Page 7 of 204
Chapter 1
INTRODUCTION TO HOTEL REVENUE MANAGEMENT
Revenue management, also known as yield management, is an essential instrument
for matching supply and demand by dividing customers into different segments
based on their purchase intentions and allocating capacity to the different segments
in a way that maximizes a particular firm’s revenues (El Haddad, Roper & Jones,
2008). Kimes (1989) and Kimes & Wirtz (2003) define revenue management as the
application of information systems and pricing strategies to allocate the right capacity
to the right customer at the right price at the right time. This puts revenue
management practice into the realm of marketing management where it plays a key
role in demand creation (Cross, Higbie & Cross, 2009) and managing consumer
behaviour (Anderson & Xie, 2010). Revenue management theory has also benefited
strongly not only from marketing management research, but more profoundly from
operations (e.g. Talluri & van Ryzin, 2005) and pricing research (Shy, 2008).
Initially developed by the airline industry after the deregulation process in the 1970s,
revenue management has expanded to its current state as a common business practice
in a wide range of industries. It is profitably applied by airlines, hotels, restaurants,
golf courses, shopping malls, telephone operators, conference centres and other
companies. This has triggered significant theoretical research in revenue management
fundamentals and its application in various industries (Chiang, Chen & Xu, 2007;
Cross, 1997; Ng, 2009a; Phillips, 2005; Talluri & van Ryzin, 2005), including tourism
and hospitality (Avinal, 2006; Hayes & Miller, 2011; Ingold, McMahon-Beattie &
Yeoman, 2001; Ivanov & Zhechev, 2012; Kimes, 2003; Lee-Ross & Johns, 1997;
Legoherel, Poutier & Fyall, 2013a; Mauri, 2012; Tranter, Stuart-Hill & Parker, 2008;
Yeoman & McMahon-Beattie, 2004, 2011). Moreover, the importance of revenue
management as a research field has been recognised by the launch of two academic
journals dedicated to the theory and practice of revenue management: Journal of
Revenue and Pricing Management (published since 2002 by Palgrave MacMillan) and

Stanislav Ivanov (2014). Hotel Revenue Management: From Theory to Practice. Varna: Zangador. Page 8 of 204
the International Journal of Revenue Management (published since 2007 by Inderscience
Publishers).
While there are general revenue management principles easily applied across
different industries, each industry has also specific characteristics that determine the
practical aspects of revenue management application in companies that work in it.
What is a successful strategy for the airlines, for example, is not always a working
solution for the hotel or restaurant. That’s why this book concentrates on revenue
management as applied by the hotel industry. Its goal is to identify and critically
evaluate the revenue management principles, practices and techniques applied by
hotels and other accommodation establishments. It develops the theoretical
framework of hotel revenue management as a concept, analyses the various pricing
and non-pricing revenue management tools in the hoteliers’ arsenal and delves into
contemporary issues related to the concept – ethics, human resources, relationship
marketing. Finally, the book investigates the revenue management practices of
accommodation establishments in Bulgaria, evaluates their effectiveness and
provides recommendations for their improvement. For the sake of simplicity and to
avoid repetition throughout the book the terms ‘hotel’, ‘property’ and
‘accommodation establishment’ are used interchangeably, although the author
acknowledges the differences in their meaning.
Building on Kimes (1989) and Kimes & Wirtz (2003) we could define hotel revenue
management as the constellation of tools and actions dedicated toward the achievement of an
optimal level of the hotel’s net revenues and gross operating profit by offering the right
product to the right customers via the right distribution channel at the right time at the right
price with the right communication. This long definition incorporates several key points:
Optimal level of hotel’s net revenues and the gross operating profit
The net revenues of the hotel include the sales revenues after taxes and commissions.
The gross operating profit equals the net revenues minus the costs for serving the
customers – the costs of goods sold, marketing, administrative, human resource
expenses (Dopson & Hayes (2009). The keyword is ‘optimal’ level. Maximising the
net revenues does not necessarily mean that the gross operating profit would be at its
potential maximum level. For example, it may turn out that attracting additional
customers to the hotel would be too costly to serve so that the gross operating profit
Stanislav Ivanov (2014). Hotel Revenue Management: From Theory to Practice. Varna: Zangador. Page 9 of 204
would be actually decreased. Furthermore, when companies work at full capacity the
attention service employees could pay to every single customers is decreased which is
a basis for operational mistakes, lack of personalised services, queues and other
consequences that would have negative impact on customers’ satisfaction and might
even be used as grounds for complaints, the settlement of which would diminish the
gross operating profit of the hotel. On the other hand, the increase in the gross
operating profit might be a result of cost-cutting strategy, which, although sometimes
is necessary and inevitable, often leads to service quality deterioration, dissatisfaction
and future loss of customers and revenues. Therefore the goal of revenue
management should not be maximising the revenues of the hotel at all costs, but
achieving the highest revenues and gross operating profit simultaneously. The various
revenue management metrics used in analysis and goal-setting are discussed in
Chapter 5.
Right customer
Not all customers are equally profitable for the hotel. Some of them are too costly to
serve, i.e. they may have too high requirements which the hotel could not easily and
profitably meet, while others are willing to pay too low prices which could hardly
cover the hotel’s expenses. The ‘right’ customer is a debatable concept from a
marketing point of view but could be associated with the target market segment
which has been identified by the hotel’s marketing manager and whose requirements
are taken into consideration when preparing the product of the hotel. The concept of
the ‘right’ customer calls for the hotel to use various marketing techniques in order to
attract the customers which it could properly and profitable serve and deny
accommodation for the rest. Hotels, for example, put minimum stay requirements
during specific busy periods (e.g. during fairs, exhibitions, world championships) so
that they dissuade transit one-night stays in favour of more profitable longer stay
customers. Market segmentation, profiling and targeting are discussed in Chapter 6,
while ethical issues arising from the application of various revenue management
techniques are discussed in Chapter 15.
Right product
The right product is determined by both the customers and the hoteliers. It is the
product that a) delivers value to the ‘right’ customers by satisfying their needs, wants,
requirements, b) reflects the customer’s willingness to pay, and c) is profitable for the
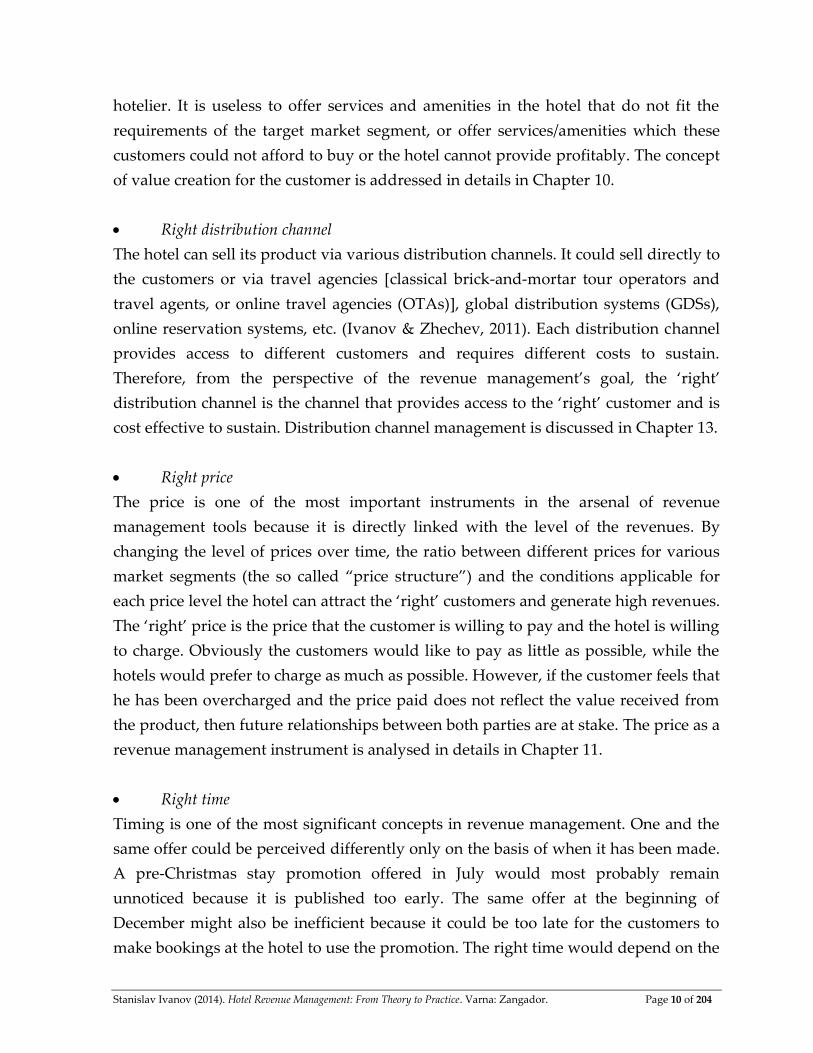
Stanislav Ivanov (2014). Hotel Revenue Management: From Theory to Practice. Varna: Zangador. Page 10 of 204
hotelier. It is useless to offer services and amenities in the hotel that do not fit the
requirements of the target market segment, or offer services/amenities which these
customers could not afford to buy or the hotel cannot provide profitably. The concept
of value creation for the customer is addressed in details in Chapter 10.
Right distribution channel
The hotel can sell its product via various distribution channels. It could sell directly to
the customers or via travel agencies [classical brick-and-mortar tour operators and
travel agents, or online travel agencies (OTAs)], global distribution systems (GDSs),
online reservation systems, etc. (Ivanov & Zhechev, 2011). Each distribution channel
provides access to different customers and requires different costs to sustain.
Therefore, from the perspective of the revenue management’s goal, the ‘right’
distribution channel is the channel that provides access to the ‘right’ customer and is
cost effective to sustain. Distribution channel management is discussed in Chapter 13.
Right price
The price is one of the most important instruments in the arsenal of revenue
management tools because it is directly linked with the level of the revenues. By
changing the level of prices over time, the ratio between different prices for various
market segments (the so called “price structure”) and the conditions applicable for
each price level the hotel can attract the ‘right’ customers and generate high revenues.
The ‘right’ price is the price that the customer is willing to pay and the hotel is willing
to charge. Obviously the customers would like to pay as little as possible, while the
hotels would prefer to charge as much as possible. However, if the customer feels that
he has been overcharged and the price paid does not reflect the value received from
the product, then future relationships between both parties are at stake. The price as a
revenue management instrument is analysed in details in Chapter 11.
Right time
Timing is one of the most significant concepts in revenue management. One and the
same offer could be perceived differently only on the basis of when it has been made.
A pre-Christmas stay promotion offered in July would most probably remain
unnoticed because it is published too early. The same offer at the beginning of
December might also be inefficient because it could be too late for the customers to
make bookings at the hotel to use the promotion. The right time would depend on the
Stanislav Ivanov (2014). Hotel Revenue Management: From Theory to Practice. Varna: Zangador. Page 11 of 204
booking patterns of the different market segments. If the target segment usually
makes most of the bookings within two weeks before the check-in date, then the
optimum date for the release of the promotion might be 2-3 weeks before check-in in
order for the promotion to be noticed by the potential customers.
Right communication
In the context of revenue management, marketing communications of the hotel
influence how its product and prices are perceived. The way information is provided
on the hotel’s website or how prices are presented (framed) can influence customers’
perceptions about the value they (could) receive from consuming the hotel’s product,
and the fairness of the price conditions. This, on other hand, impacts the perceived
‘price/value’ ratio and customers’ satisfaction from the purchase and their future
purchase intentions. The role of marketing communications in value creation is
elaborated in Chapter 10.
The Revenue management constellation
Revenue management includes a variety of processes, actions, and techniques
sometimes difficult to summarise. Figure 1.1 provides a concept map of the revenue
management constellation of terms that are discussed in detail in this book. The core
of the concept maps is the relationship between the various revenue management
concepts with the hotel’s revenues, price, quantity and the hotel customer.
Considering the fact that revenue management has a multifaceted and multi-layered
nature, the concept map (Figure 1.1) should be considered as a non-comprehensive
elaboration of the links among the revenue management concept.

Stanislav Ivanov (2014). Hotel Revenue Management: From Theory to Practice. Varna: Zangador. Page 12 of 204
Figure 1.1. Revenue management constellation concept map
Customer
Segmentation, profiling, targeting
Marketing information system
Competitors
Revenues Price Quantity
Value creation
Ethics
Room availability guarantee
Length-of-stay control
Overcontracting and
overbooking
Capacity management
Inventory
management
Channel management
Optimal room-rate allocation
Hotel
= x
Non-pricing
techniques
Pricing
techniques
Rate fences
Price discrimination
Lowest price guarantee
Dynamic pricing
Price presentation
Combined
techniques
RM system
RM metrics
RM process
RM team
RM software
RM centres
Analysis
and
forecasting 100% Satisfaction guarantee
Stanislav Ivanov (2014). Hotel Revenue Management: From Theory to Practice. Varna: Zangador. Page 13 of 204
Chapter 2
ECONOMIC FUNDAMENTALS OF HOTEL REVENUE MANAGEMENT
Hotel revenue management is based on several economic fundamentals and
assumptions (Ivanov & Zhechev, 2011; Kimes, 1989; Schwartz, 1998; Wirtz et al., 2003)
that determine the applicability of revenue management as a practice in the hotel
industry:
Product perishability
The hotel’s product is essentially a service which cannot be stored for later
consumption. Temporary excessive capacity of the hotel cannot be forwarded to
periods with high demand. Production and consumption of the hotel services take
place simultaneously with the active participation of the consumer. Each room that
has not been used for a particular time base (overnight) cannot be sold later for a
future use and the potential revenue from it is lost forever as no customer would be
willing to pay for accommodation for a period already passed. Therefore, the rational
hotelier tries to manage the demand through various tools to shift some of the
demand for rooms from busy to slower periods, e.g. by offering alternative dates for
accommodation to customers who have been denied accommodation for a particular
period when the hotel is fully booked. Product perishability means that customers
would look for tangible clues about the quality of the product – hotel descriptions,
pictures, guest reviews, which increases the role of marketing communication in the
presentation of hotel’s product value.
Limited capacity
Capacity can be defined as the number of customers that the hotel can service within
a particular period of time. When the time base for the calculation of the capacity is
one night, then the room capacity of the hotel equals the number of beds in the hotel.
Some hotels also provide rooms for smaller time periods than the usual 24 hours (e.g.
day let rooms or rooms let on per hour basis) which means that they could serve
Stanislav Ivanov (2014). Hotel Revenue Management: From Theory to Practice. Varna: Zangador. Page 14 of 204
more customers within 24 hours than the number of beds in the hotel which is a
rational way to increase the room capacity of the hotel.
Besides room capacity, we can identify capacities for the various other revenue
generating services/centres – restaurant, function rooms, spa centre, swimming pool
capacity. These capacities are determined in a similar manner as the room capacity –
the number of customers that could be served within a specific time period, e.g.
number of customers that could take massage in one day. Similar to room capacity,
the capacities of the restaurant, the spa centre, the swimming pool, etc., would
depend on the number seats or deck chairs. However, besides the pure physical
limitations, the capacity of these revenue centres of the hotel would also be
influenced by other factors. The capacity of the restaurant, for example, would be
influenced by the average time spent by the customers for a particular meal, the
working hours of the restaurant, the type of service (self-service/waiter), the number
of employees, etc. (see Chapter 14). The capacity of the massage service would
depend on the working hours, the duration of one massage and the number of
masseurs on shift. The capacity of the function rooms would be determined by the
number of rooms and their layout style (banquet, cocktail, board room, U-style,
classroom or theatre).
In the short run the physical room capacity of the hotel is fixed and cannot be
changed – the number of rooms remains constant because adding additional rooms
by building new wings, for instance, requires time. However, the hotel can decrease
its room capacity in the short run by closing wings or floors. The latter is usually
applied during periods of low demand in order to reduce operating maintenance
costs. The capacity of the other revenue generating service centres in the hotel is
relatively easily changed in the short run (e.g. more chairs and different layout of the
function rooms), especially if this does not involve heavy investment in fixed assets
(i.e. reconstructing the building). In the long run the capacity of every company,
including the hotel, is variable.
High fixed and low variable costs
Fixed costs (FC) are those that do not change according to the number of guests in the
hotel – depreciation, debt service, salaries for administrative personnel and part of
the front line employees, part of the expenses for heating/water/electricity, and

Stanislav Ivanov (2014). Hotel Revenue Management: From Theory to Practice. Varna: Zangador. Page 15 of 204
marketing expenses, among others. Usually they account for 60-80% of all costs in the
hotel. Variable costs are those that change according to the number of guests in the
hotel – part of the salaries for the front line employees, food product costs,
heating/water/electricity for the rooms. From an economic point of view the hotel can
afford to serve guests until the marginal revenue from a guest (MR) is at least equal to
the marginal costs (MC) for serving him (Varian, 2006), i.e. when:
(2.1) MR≥MC
The marginal room revenue is equal to the price (P) received by the hotel for the
room. Attracting one more additional customer increases the variable costs of the
hotel by the variable costs per one overnight (VC1). Therefore, substituting P and VC1
in (2.1) we get:
(2.2) P≥VC1
Equation (2.2) shows that, for the hotel, it is worth serving a particular customer if the
room revenues received from him cover at least the variable costs for serving him.
When (2.2) is fulfilled then the hotel covers the entire variable costs for serving the
customers and some of the fixed costs, which are made regardless of whether the
guest is in the hotel or not. When VC1 are low then the hotel can actively use price to
attract new customers and sell vacant rooms. The hotel should not lower the price
below VC1 because it would lose money. However, this latter statement should not be
perceived as an ultimate rule. The marginal revenues in (2.1) do not include only
revenues from the rooms – guests make expenses for other services as well like F&B,
spa, concierge, internet, parking, sport facilities, casino, etc., which generate
additional revenues for the hotel. In some hotels these additional revenues might
even be more important than the room revenues (e.g. casino hotels). Therefore, when
calculating the marginal revenues hoteliers should consider all revenues generated by
the customer, not only the room revenues, which is the basis of the total hotel revenue
management concept (Buckhiester, 2012; Noone, McGuire & Rohls, 2011). Therefore,
sometimes it is possible and economically rational for the price of a guest room to go
below the variable costs because the additional revenues from the customer will
compensate for that low price.
Stanislav Ivanov (2014). Hotel Revenue Management: From Theory to Practice. Varna: Zangador. Page 16 of 204
Unequal demand throughout the day/week/month/year
Having a stable demand eliminates the need for revenue management. If, for
example, every day the hotel receives between 90 and 110 booked rooms, the general
manager can be sure of the occupancy rate which decreases the pressure to attract
more customers. However, tourism demand is often volatile, uncertain and subject to
seasonal variations depending on the product of the hotel and its location. Business
hotels, for example, have higher occupancy during weekdays and lower over the
weekend, while for leisure properties the situation is usually reversed. Seaside hotels
are more attractive during the summer season, while fewer numbers of guests arrive
during the shoulder periods. Variations in tourism demand force hoteliers to look for
different instruments to manage demand – attract more customers during slow
periods, attract higher paying customers and divert demand from busy to less busy
periods.
Possibility to forecast demand
This is one of the main assumptions of hotel revenue management, because all
decisions of the revenue manager are based on the forecasts about tourism demand. If
demand is chaotic and impossible to forecast within acceptable forecasting error,
revenue management becomes obsolete and the optimal hotel pricing strategy would
be to maintain constant prices.
Possibilities to segment market demand
Applying revenue management techniques, price discrimination in particular,
requires that market demand is not homogeneous, so that the hotel may apply a
differentiated marketing strategy and prepare different marketing mixes for the
different target segments (Kotler et al., 2009). When demand cannot be segmented
properly then market segmentation becomes redundant and the best marketing
strategy for the hotelier would be to trade with all customers using a uniform
marketing mix – same product, price, distribution channels, and communication mix.
However, tourism demand is quite diverse which gives ground to hoteliers to
actively use revenue management techniques.
Different price elasticities of market segments
Tourism demand does not have a uniform elasticity. It varies by segment and market
conditions and this provides a basis for hotels to charge different market segments
Stanislav Ivanov (2014). Hotel Revenue Management: From Theory to Practice. Varna: Zangador. Page 17 of 204
different prices. Price elasticity of demand (ed) is the reaction of demand to changes in
prices. It is measured by the ratio between the percentage change in quantity
demanded and the percentage change in a product’s price (Das, 2007):
(2.3)
,
where dq=q1-q0 is the change in quantity demanded by customers (e.g. number of
overnights) in period 1 compared to period 0, and dp=p1-p0 is the change of price over
the same period.
Usually demand demonstrates negative price elasticity (Peng et al., 2014), meaning
that the increase in room price leads to a decrease in the number of overnights
booked in the hotel. When ed<-1 demand is elastic and quantity demanded changes
more than the percentage change of price, i.e. a 10% increase in prices would cause a
more than 10% drop of overnights sold. When ed=-1 we observe unit elasticity and
quantity demanded changes in exactly the same proportion as price, i.e. a 10%
increase in prices would cause 10% drop of overnights sold. Finally, when ed∊(-1; 0)
demand is inelastic and quantity demanded changes less than the price, i.e. a 10%
increase in prices would cause less than 10% drop of overnights sold.
For the sake of a comprehensive discussion the author notes that there are two more
situations concerning the value of the coefficient of elasticity. When ed→-∞ demand is
perfectly elastic and minute changes in price cause it to drop to zero. When ed=0
demand is perfectly inelastic so that it is irresponsive to changes in price (Tribe, 2005:
76). However, in field of tourism these two extremes have mostly theoretical rather
than practical value because customers may always switch to another hotel if the
price increases (thus eroding the perfect inelastic demand) or are loyal to brands (thus
eliminating some elasticity from the perfectly elastic demand).
Price elasticity of demand should be properly estimated by the hotel manager
because it is strongly connected with revenues of the hotel. The revenues of the hotel
from overnights TR are:
(2.4) ,
Stanislav Ivanov (2014). Hotel Revenue Management: From Theory to Practice. Varna: Zangador. Page 18 of 204
which after differentiating is:
(2.5)
From (2.3) we can derive that
(2.6)
Substituting (2.6) in (2.5) and performing the mathematical operations we get:
(2.7)
.
Therefore, the change in hotel’s revenues as a consequence of price changes would
depend on the demand price elasticity ed. If demand is elastic (ed<-1) the hotel could
increase its revenues by decreasing prices because the lost revenues from the lower
prices would be overcompensated by the larger number of overnights sold. If
demand is inelastic (ed∊(-1; 0)) then the optimal strategy is opposite – increase of the
price, which would be partially offset by lost revenues from decreased number of
overnights in the hotel, but the final balance would be a positive impact on revenues.
If demand has unit elasticity (ed=-1) the hotel does not have stimuli to change prices as
the gained revenues due to higher price would be entirely offset by lost revenues due
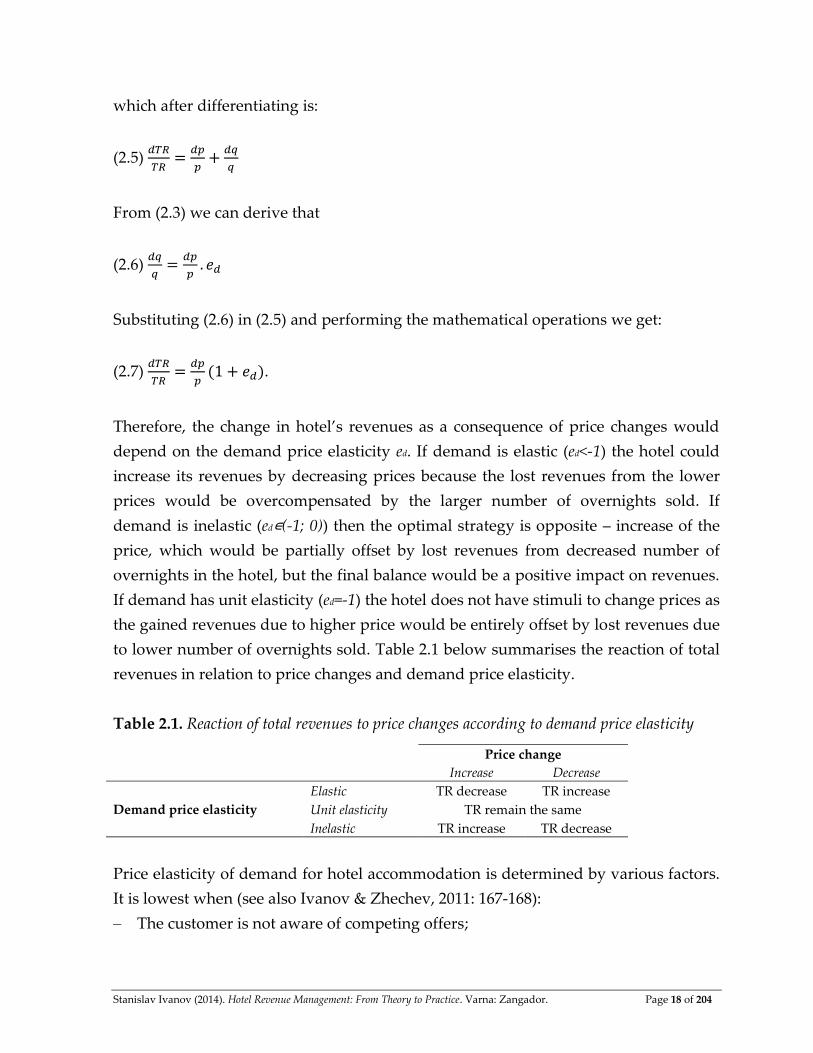
to lower number of overnights sold. Table 2.1 below summarises the reaction of total
revenues in relation to price changes and demand price elasticity.
Table 2.1. Reaction of total revenues to price changes according to demand price elasticity
Price change
Increase Decrease
Demand price elasticity
Elastic TR decrease TR increase
Unit elasticity TR remain the same
Inelastic TR increase TR decrease
Price elasticity of demand for hotel accommodation is determined by various factors.
It is lowest when (see also Ivanov & Zhechev, 2011: 167-168):
– The customer is not aware of competing offers;
Stanislav Ivanov (2014). Hotel Revenue Management: From Theory to Practice. Varna: Zangador. Page 19 of 204
– The hotel product is unique and there are no substitutes for the product (e.g.
underwater hotel);
– Consuming the product increases the prestige and social status of the customer
(e.g. accommodation in a luxury hotel);
– Costs are shared among customers or expenses are covered entirely or partially by
someone else (e.g. business travellers whose expenses are covered by their
companies);
– Accommodation costs have a low share in the total budget of the tourist for the
trip;
– The tourist is highly involved in booking a particular hotel (e.g. the hotel from the
honeymoon holiday);
– The customer has already purchased other products connected with the hotel
booking (e.g. flights for specific dates);
– The customer books a low number of overnights (i.e. customers booking long
stays would be more price sensitive compared to customers who book only one
overnight in the hotel);
– Accommodation costs constitute a small share of the customer’s income (i.e.
customers with higher incomes are usually less price sensitive).
The rise of online hotel bookings has introduced previously unobserved hyper-
transparency on the accommodation market. Tourists can now check online
availability for thousands of destinations with a myriad of hotels and suppliers and
compare prices, which increases the price elasticity of demand.
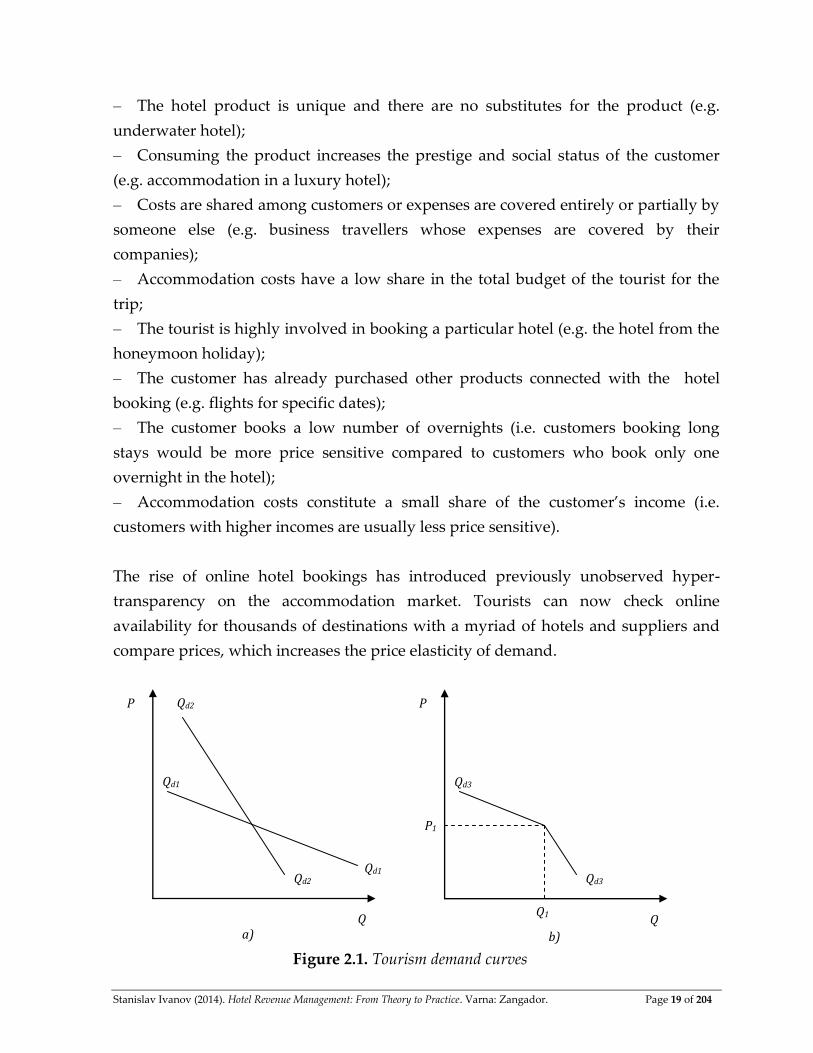
a) b)
Figure 2.1. Tourism demand curves
Q
P
Qd1 Qd2
Qd1
Qd2
Q
P
Qd3
Qd3
P1
Q1
Stanislav Ivanov (2014). Hotel Revenue Management: From Theory to Practice. Varna: Zangador. Page 20 of 204
Usually demand is depicted as a curve showing the relationship between quantity
demanded and price. Figure 2.1 presents three demand curves for a particular hotel.
Qd1 on Figure 2.1.a is the visualisation of the elastic demand while Qd2 depicts the
inelastic tourism demand. Both demand curves assume that demand would stay
elastic or inelastic at all price levels and disregard the reaction of competition. In
practice, however, customers react differently to price increases and decreases (Figure
2.1.b). When the hotel increases its prices during normal business periods P1 (i.e.
outside periods with local special events) without change in the value of the offered
services, most probably its competitors would not follow suit. If their prices remain
constant or increase less than the prices of the hotel in question, the price/value ratio
changes in favour of the competitors and the hotel loses part of its price
competitiveness. Tourists would find it easy to switch their bookings to competing
hotels meaning that demand would be elastic, i.e. the number of overnights in the
hotel will decrease more than the increase of the price and the total revenues of the
hotel will actually drop. If, on the contrary, the hotel decides to decrease its prices, it
is highly probable that its competitors would do the same. Therefore, its price
advantage would be only temporary until competitors match the lower price,
meaning that the demand would be inelastic and the increase of the quantity
demanded would not be able to offset the decrease in prices. That’s why, in reality,
the demand curve for a specific hotel would be kinked (Figure 2.1.b) meaning that
demand is elastic to price increases and inelastic for price decreases (see also Carroll, 2011:
179). The latter leads to the conclusion that price wars among hotels in a destination are
meaningless as they do not increase hotels’ revenues but exhaust their financial resources.
Different willingness-to-pay of market segments
The willingness-to-pay is the highest price an individual is willing to accept to pay for
some good or service (Breidert, 2006: 27). If the price of the product is above the
customer’s willingness-to-pay he would not buy it; if the price is lower, the difference
between the willingness-to-pay and the price creates a consumer surplus for the
buyer but lost potential revenue for the company. When different market segments
are ready to pay different prices for the same product, accommodation
establishments can apply price discrimination, charge them different rates according
to their willingness-to-pay and erect price fences so that customers with higher
willingness-to-pay do not purchase at lower rates.
Stanislav Ivanov (2014). Hotel Revenue Management: From Theory to Practice. Varna: Zangador. Page 21 of 204
Possibility for advanced booking
One of the major characteristic of hotel services is that they may be booked in
advance – weeks, even months before the check-in date. Advance bookings allow
tourists to be guaranteed that they would receive the accommodation service
sometime in the future while they provide a long time window during which
hoteliers can sell their rooms. From a revenue management perspective the possibility
to book hotel rooms in advance provides hoteliers with the opportunity to use time as
a segmentation criterion – e.g. differentiating customers on the basis how many days
before check-in they make their booking in the hotel. Furthermore, the hotelier can
keep track of how bookings for a particular check-in date are accrued and react
according to changes in demand.
Stanislav Ivanov (2014). Hotel Revenue Management: From Theory to Practice. Varna: Zangador. Page 22 of 204
Chapter 3
HOTEL REVENUE MANAGEMENT SYSTEM
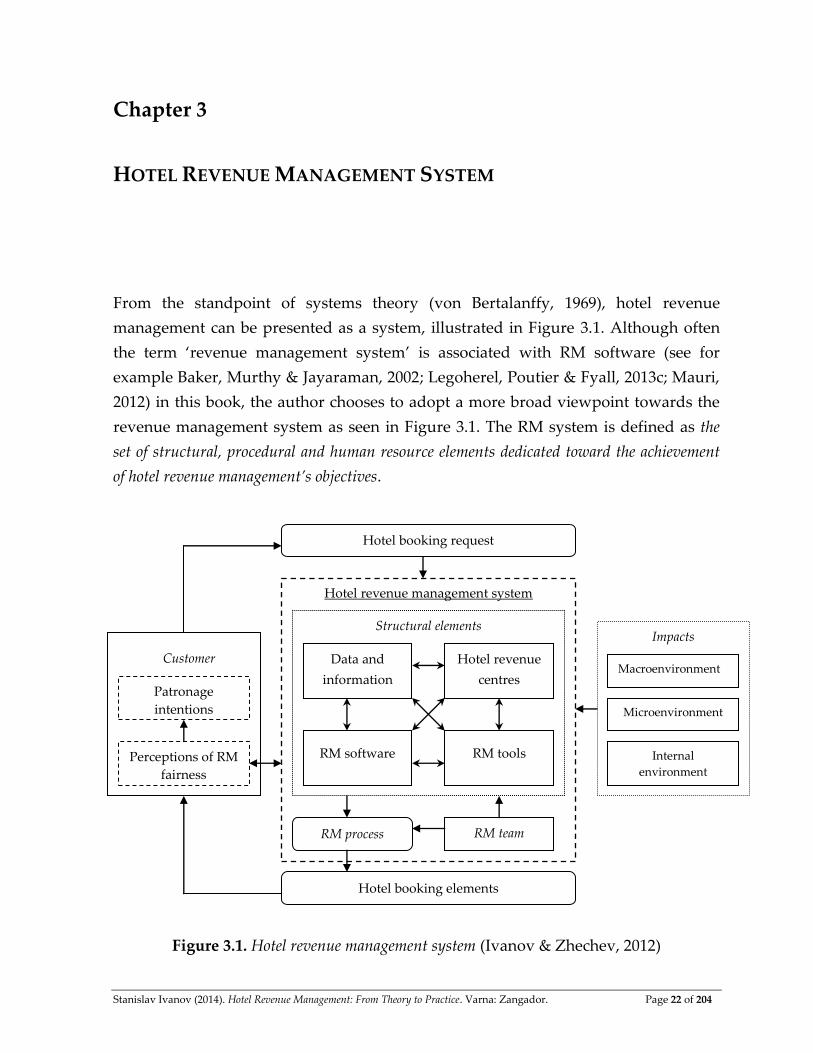
From the standpoint of systems theory (von Bertalanffy, 1969), hotel revenue
management can be presented as a system, illustrated in Figure 3.1. Although often
the term ‘revenue management system’ is associated with RM software (see for
example Baker, Murthy & Jayaraman, 2002; Legoherel, Poutier & Fyall, 2013c; Mauri,
2012) in this book, the author chooses to adopt a more broad viewpoint towards the
revenue management system as seen in Figure 3.1. The RM system is defined as the
set of structural, procedural and human resource elements dedicated toward the achievement
of hotel revenue management’s objectives.
Figure 3.1. Hotel revenue management system (Ivanov & Zhechev, 2012)
Hotel booking request
RM process
Hotel booking elements
Data and
information
Hotel revenue
centres
RM software RM tools
Structural elements
Hotel revenue management system
Macroenvironment
Microenvironment
Impacts
Internal
environment
Patronage
intentions
Customer
RM team
Perceptions of RM
fairness
Stanislav Ivanov (2014). Hotel Revenue Management: From Theory to Practice. Varna: Zangador. Page 23 of 204
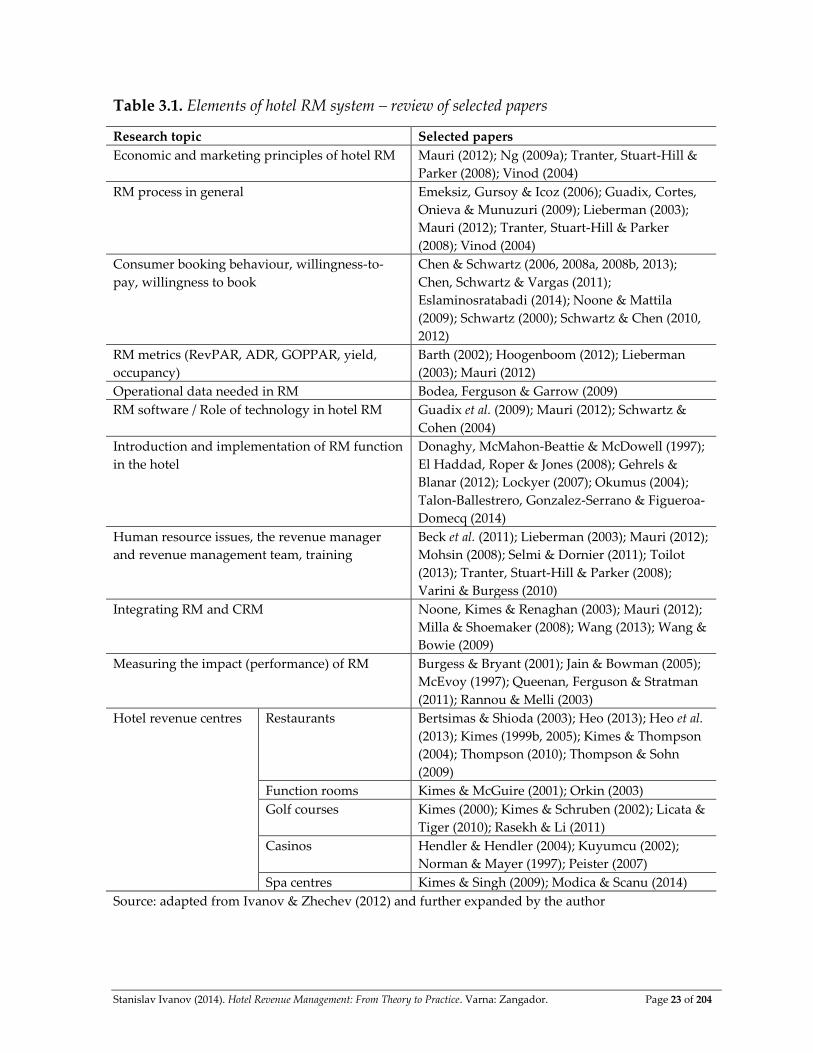
Table 3.1. Elements of hotel RM system – review of selected papers
Research topic Selected papers
Economic and marketing principles of hotel RM Mauri (2012); Ng (2009a); Tranter, Stuart-Hill &
Parker (2008); Vinod (2004)
RM process in general Emeksiz, Gursoy & Icoz (2006); Guadix, Cortes,
Onieva & Munuzuri (2009); Lieberman (2003);
Mauri (2012); Tranter, Stuart-Hill & Parker
(2008); Vinod (2004)
Consumer booking behaviour, willingness-to-
pay, willingness to book
Chen & Schwartz (2006, 2008a, 2008b, 2013);
Chen, Schwartz & Vargas (2011);
Eslaminosratabadi (2014); Noone & Mattila
(2009); Schwartz (2000); Schwartz & Chen (2010,
2012)
RM metrics (RevPAR, ADR, GOPPAR, yield,
occupancy)
Barth (2002); Hoogenboom (2012); Lieberman
(2003); Mauri (2012)
Operational data needed in RM Bodea, Ferguson & Garrow (2009)
RM software / Role of technology in hotel RM Guadix et al. (2009); Mauri (2012); Schwartz &
Cohen (2004)
Introduction and implementation of RM function
in the hotel
Donaghy, McMahon-Beattie & McDowell (1997);
El Haddad, Roper & Jones (2008); Gehrels &
Blanar (2012); Lockyer (2007); Okumus (2004);
Talon-Ballestrero, Gonzalez-Serrano & Figueroa-
Domecq (2014)
Human resource issues, the revenue manager
and revenue management team, training
Beck et al. (2011); Lieberman (2003); Mauri (2012);
Mohsin (2008); Selmi & Dornier (2011); Toilot
(2013); Tranter, Stuart-Hill & Parker (2008);
Varini & Burgess (2010)
Integrating RM and CRM Noone, Kimes & Renaghan (2003); Mauri (2012);
Milla & Shoemaker (2008); Wang (2013); Wang &
Bowie (2009)
Measuring the impact (performance) of RM Burgess & Bryant (2001); Jain & Bowman (2005);
McEvoy (1997); Queenan, Ferguson & Stratman
(2011); Rannou & Melli (2003)
Hotel revenue centres Restaurants Bertsimas & Shioda (2003); Heo (2013); Heo et al.
(2013); Kimes (1999b, 2005); Kimes & Thompson
(2004); Thompson (2010); Thompson & Sohn
(2009)
Function rooms Kimes & McGuire (2001); Orkin (2003)
Golf courses Kimes (2000); Kimes & Schruben (2002); Licata &
Tiger (2010); Rasekh & Li (2011)
Casinos Hendler & Hendler (2004); Kuyumcu (2002);
Norman & Mayer (1997); Peister (2007)
Spa centres Kimes & Singh (2009); Modica & Scanu (2014)
Source: adapted from Ivanov & Zhechev (2012) and further expanded by the author
Stanislav Ivanov (2014). Hotel Revenue Management: From Theory to Practice. Varna: Zangador. Page 24 of 204
When the customer sends an email query to the hotel, calls by telephone, checks
availability on the hotel’s/chain’s website or in an online hotel reservation system, the
booking request he made is registered by the hotel’s revenue management system.
The RM system consists of four structural elements (data and information, hotel
revenue centres, RM software and RM tools), the RM process and the RM team. The
operational results from the RM process are the specific elements of the particular
booking request – e.g. status (confirmed/rejected), number of rooms, types and
category of rooms, duration of stay, price, cancellation and amendment terms and
conditions, etc. Final booking details could be different from those of the initial
request – for example, the hotel might confirm a different room type, or propose
alternate dates. The booking details and the operation of the whole RM system
influence customer’s perceptions of the fairness of hotel’s RM system and his
intentions for future bookings with the same hotel/hotel chain. If the customer feels
he has been treated unfairly he would not consider booking at the same hotel in the
future. The RM system experiences constant influences of the external (macro- and
micro-) and internal environmental factors in which the hotel operates (e.g.
company’s goals, its financial situation, legislation, competition, changes in demand,
destination’s image, or force majeure events among others) and a revenue manager’s
decisions must take all these into consideration. The way the RM system is organised
and especially the applied software, accumulated data, and the taken decisions
influence the competitiveness of the accommodation establishments. Therefore the
RM system must be considered as intellectual property and treated as a trade secret
(Kimes & Wagner, 2001). Table 3.1 summarises the main directions of hotel RM
system elements research. Due to their importance, separate tables are dedicated to
present research on RM tools, forecasting and approaches used for solving RM
mathematical problems.
This chapter focuses on the structural elements of the RM system, the RM team and
potential impacts on the RM system. Due to their significance, the RM process and
ethical issues (perceived fairness) are discussed in separate chapters.
3.1. Structural elements of the revenue management system
The hotel RM system includes four structural elements, namely: revenue centres, data
and information, RM tools, and RM software.
Stanislav Ivanov (2014). Hotel Revenue Management: From Theory to Practice. Varna: Zangador. Page 25 of 204
Hotel revenue centres
Hotel revenue centres determine the potential sources of revenues for the hotel
(rooms division, F&B, function rooms, spa & fitness facilities, golf courses, casino and
gambling facilities, and other additional services) and the capacity of the hotel to
actively use pricing as a revenue generation tool. From a practical point of view, the
broader the sources of revenues the better. Having a wider scope of revenue sources
increases the opportunities of the hotel to sell more services to customers and to
actually generate higher revenues – not only from guest rooms, but from additional
services as well. Hotel revenue management research up to now has focused
overwhelmingly on the Rooms Division and its related problems – most notably price
discrimination and overbookings. However, it is important that the hotel’s revenue
management system includes all revenue centres, not only the guest rooms, because
they can significantly contribute to the hotel’s total revenues and financial results. As
mentioned in Chapter 2, for some types of properties, like casino hotels, guest rooms
might even be a secondary revenue source.
The fact that besides the rooms the hotel can have additional revenue centres
complicates the revenue management process. Instead of maximising room revenues
only, revenue managers must now focus on the revenues of the hotel as a whole, i.e.
to apply a total hotel revenue management approach. This justifies the arising interest
in the application of revenue management principles and tools in related hospitality
industries and hotel revenue centres (Table 3.1) – restaurants (Bertsimas & Shioda,
2003; Heo, 2013; Kimes, 2005; Kimes & Thompson, 2004), function rooms (Kimes &
McGuire, 2001; Orkin, 2003), casinos (Hendler & Hendler, 2004; Kuyumcu, 2002;
Norman & Mayer, 1997), spa centres (Kimes & Singh, 2009), golf courses (Licata &
Tiger, 2010; Rasekh & Li, 2011). In most cases, the additional revenue centres will
generate income only if the guests are already accommodated in the hotel, although
some guests might use only the additional hotel services without room
accommodation (e.g. use of spa centre, F&B, conference facilities). In this regard, the
goal of maximising guest room revenues might not be consistent with the total
revenue maximisation objective. Revenue managers might decrease room rates in
order to attract additional guests to the hotel that will subsequently increase the
demand for the other revenue centres, although Murphy, Semrad & Yost (2013)
found in their research that discounting room rates during the low season did not
significantly influence in-house restaurant sales. In practice, many hotel chains have
Stanislav Ivanov (2014). Hotel Revenue Management: From Theory to Practice. Varna: Zangador. Page 26 of 204
long recognised the importance of additional services as revenue source and have
adopted proper revenue management strategies to generate revenues from them. RM
software used by them also includes modules for the additional revenue centres.
However, from a research point of view, up to now, the additional revenue centres
have been studied as separate business units, and not as integrated with revenue
management of the Rooms Division department. In this regard, it is necessary that
the hotel revenue management research incorporates them into the revenue
maximisation problem of the hotel in search of total hotel revenue management.
Data and information
The application of RM requires a lot of data regarding different revenue metrics –
average daily rate (ADR), revenue per available room (RevPAR), gross operating
profit per available room (GOPPAR), occupancy, yield, profit per available room, etc.
(Barth, 2002; Lieberman, 2003; Hoogenboom, 2012; Mauri, 2012). Additionally, the
revenue management system requires information about a hotel’s future bookings on
a daily basis (what types and how many rooms), sale of additional services in the
other revenue centres, competitors’ rates and strategies, information regarding
changes in legislation, special events to take place at the destination, and any other
data/information that relates to the demand, supply, revenues and financial results of
the hotel. Albeit their importance, RM metrics and data requirements seem somewhat
neglected in the hotel RM research field. Academic literature on hotel RM accepts the
metrics per se while only a few authors analyse the metrics’ DNA in details (most
notably Hoogenboom, 2012). RM metrics are discussed in detail in Chapter 5.
RM tools
Revenue management involves the utilisation of different RM tools, which are
defined as instruments by which hotels can influence the revenues they get from their
customers. RM tools can be broadly divided into pricing, non-pricing and combined
tools (Table 3.2).
Pricing tools (Chapter 11) include price discrimination, the erection of rate fences,
dynamic and behavioural pricing, lowest price guarantee and other techniques that
directly influence a hotel’s prices (their level, structure, presentation and price rules).
Non-pricing tools (Chapter 12) do not influence pricing directly and relate to
inventory control – capacity management, overbookings, length-of-stay control, room
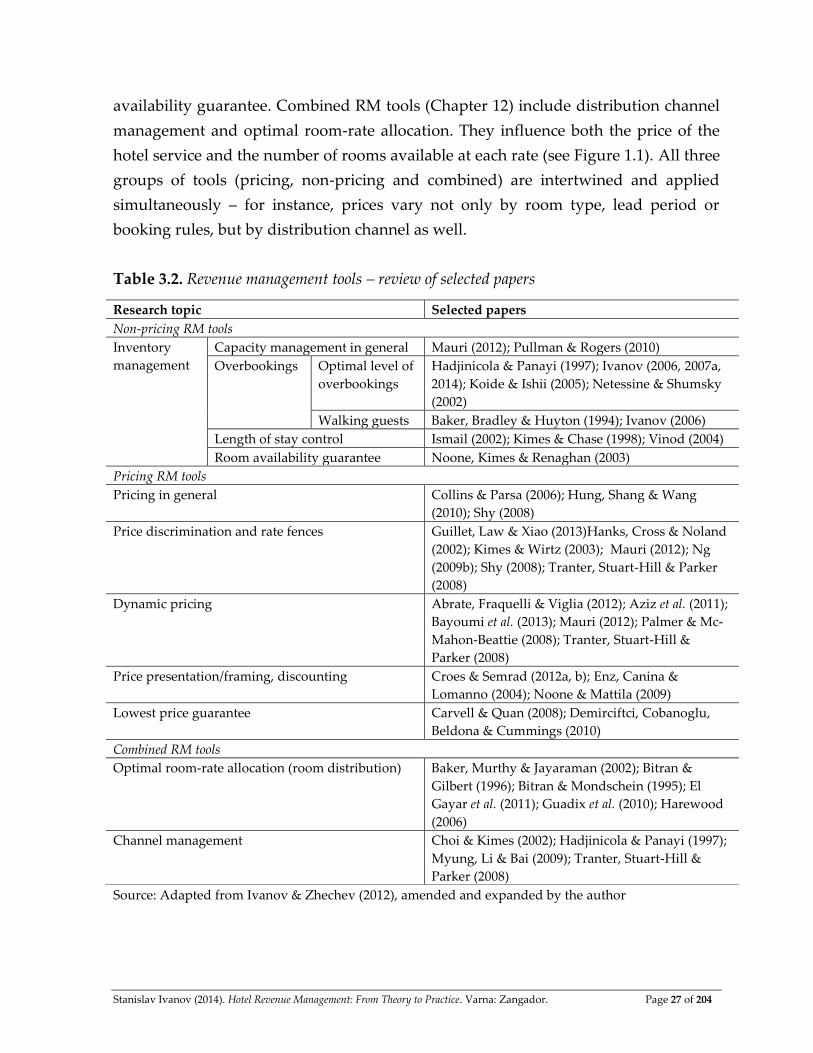
Stanislav Ivanov (2014). Hotel Revenue Management: From Theory to Practice. Varna: Zangador. Page 27 of 204
availability guarantee. Combined RM tools (Chapter 12) include distribution channel
management and optimal room-rate allocation. They influence both the price of the
hotel service and the number of rooms available at each rate (see Figure 1.1). All three
groups of tools (pricing, non-pricing and combined) are intertwined and applied
simultaneously – for instance, prices vary not only by room type, lead period or
booking rules, but by distribution channel as well.
Table 3.2. Revenue management tools – review of selected papers
Source: Adapted from Ivanov & Zhechev (2012), amended and expanded by the author
Research topic Selected papers
Non-pricing RM tools
Inventory
management
Capacity management in general Mauri (2012); Pullman & Rogers (2010)
Overbookings Optimal level of
overbookings
Hadjinicola & Panayi (1997); Ivanov (2006, 2007a,
2014); Koide & Ishii (2005); Netessine & Shumsky
(2002)
Walking guests Baker, Bradley & Huyton (1994); Ivanov (2006)
Length of stay control Ismail (2002); Kimes & Chase (1998); Vinod (2004)
Room availability guarantee Noone, Kimes & Renaghan (2003)
Pricing RM tools
Pricing in general Collins & Parsa (2006); Hung, Shang & Wang
(2010); Shy (2008)
Price discrimination and rate fences Guillet, Law & Xiao (2013)Hanks, Cross & Noland
(2002); Kimes & Wirtz (2003); Mauri (2012); Ng
(2009b); Shy (2008); Tranter, Stuart-Hill & Parker
(2008)
Dynamic pricing Abrate, Fraquelli & Viglia (2012); Aziz et al. (2011);
Bayoumi et al. (2013); Mauri (2012); Palmer & Mc-
Mahon-Beattie (2008); Tranter, Stuart-Hill &
Parker (2008)
Price presentation/framing, discounting Croes & Semrad (2012a, b); Enz, Canina &
Lomanno (2004); Noone & Mattila (2009)
Lowest price guarantee Carvell & Quan (2008); Demirciftci, Cobanoglu,
Beldona & Cummings (2010)
Combined RM tools
Optimal room-rate allocation (room distribution) Baker, Murthy & Jayaraman (2002); Bitran &
Gilbert (1996); Bitran & Mondschein (1995); El
Gayar et al. (2011); Guadix et al. (2010); Harewood
(2006)
Channel management Choi & Kimes (2002); Hadjinicola & Panayi (1997);
Myung, Li & Bai (2009); Tranter, Stuart-Hill &
Parker (2008)
Stanislav Ivanov (2014). Hotel Revenue Management: From Theory to Practice. Varna: Zangador. Page 28 of 204
RM software
The processing of large databases is impossible without appropriate RM software
(Guadix et al., 2009; Mauri, 2012; Pucciani & Murphy, 2011) and hotels that employ it
gain a strategic advantage over those that rely on intuitive decisions only (cf.
Emeksiz, Gursoy & Icoz, 2006) and have improved financial performance (Koushik,
Higbi & Eister, 2012; Pekgun et al., 2013). Some of the software packages include:
EzRMS™ — http://www.easyrms.com/core.php
Opera — http://www.micros.com/Solutions/HotelsAndResorts/
PROS — http://www.pros.com/solutions/pricing-effectiveness/pricing-
solutions//
JDA Pricing and Revenue Management —
http://www.jda.com/solutions/pricing-revenue-management/
RM software usually includes several modules. The database module contains and
analyses enormous amounts of primary data on bookings:
– number of bookings
– length of stay
– lead period
– number of guest rooms in one booking
– prices by distribution channels and market segments
– historical information on no-shows, walk-ins and denials
– historical booking patterns (booking curves)
– historical cancellation patterns, etc.
The demand modelling module is used to generate the mathematical model of demand
for a particular property, while the forecasting module is used to forecast demand and
the values of the RM metrics. The controls and recommendations module gives
suggestions on price amendments, inventory control and channel management.
Despite the high level of sophistication of RM software the ultimate RM decision,
however, lies in the hands of the revenue manager and his/her team.
It should be noted that the RM software influences the decision making process of
revenue managers. Firstly, the software analyses huge databases and provides
forecasts based on the optimisation models embedded in it. If the mathematical
models are flawed, then the forecasts will be flawed and the revenue manager’s
Stanislav Ivanov (2014). Hotel Revenue Management: From Theory to Practice. Varna: Zangador. Page 29 of 204
decisions will be irrelevant to the situation. On the other hand, as Schwartz & Cohen
(2004) demonstrate, the interface of the software and how information is presented in
the software impacts the judgment of revenue managers and their inclination to
adjust the computer’s forecasts. Therefore, RM software forecasts should be used as
guidelines, not as ultimate decisions.
3.2. Revenue management team
Human resource issues are essential in RM system planning and implementation
(Beck et al., 2011; Lieberman, 2003; Mohsin, 2008; Noone & Hultberg, 2011; Selmi &
Dornier, 2011; Tranter, Stuart-Hill & Parker, 2008; Zarraga-Oberty & Bonache, 2007)
and authors agree that revenue managers and RM teams are vital for the success of
any RM system (Tranter, Stuart-Hill & Parker, 2008). In many hotel companies the
application of RM techniques is the responsibility of a single person who may or may
not specialise solely in revenue management. This is especially valid for independent
hotels which do not have the financial resources (nor is it necessary) to form a
separate revenue management team. In these hotels RM activities are performed by
the general manager, the marketing manager and/or the front office manager,
depending on the size of the property and the existence of the specific job position.
Very small properties and family hotels employ too few people to afford a separate
revenue manager or even a marketing manager. In these hotels the revenue
management is usually one of the responsibilities of the general manager or the front
office manager. Mid-sized hotels might have a separate marketing manager who
deals with revenue management as well. Only large and upscale properties generate
enough revenues to justify and financially sustain a separate revenue manager
position. However, large hotel chains have long recognised the importance of
revenue management to their bottom line and have appointed a separate revenue
manager (Mainzer, 2004: 287) or even regional revenue management teams (Tranter,
Stuart-Hill & Parker, 2008) to head and guide company’s efforts in optimal
management of its revenues. Nevertheless, regardless of whether a separate revenue
manager is appointed, the basic revenue management and sales techniques must be
understood and applied by every staff member involved in the sales of hotel’s
services (front office, reservations department, F&B outlets, spa/fitness and other
additional services) in order to boost sales and revenues of the hotel. This is especially
valid for upselling (sale of higher priced products) and cross-selling (sale of
additional products offered by other departments in the hotel). For example, the front
Stanislav Ivanov (2014). Hotel Revenue Management: From Theory to Practice. Varna: Zangador. Page 30 of 204
office might inform guests at check-in about offers in the restaurant. Therefore
employees must have knowledge about all services offered by the hotel at any
moment and be regularly trained in sales techniques. In this context, Lieberman
(2003) emphasises the specific knowledge and training revenue management
specialists need to be effective and efficient – marketing, finance, forecasting.
The introduction and the implementation of the RM system in a hotel and the RM
software as its more visible part in particular (Donaghy, McMahon-Beattie &
McDowell, 1997; El Haddad, Roper & Jones, 2008; Lockyer, 2007; Okumus, 2004) is a
challenging and significant change that might cause some resistance among
employees which should be addressed properly. Resistance might arise due to
misunderstanding regarding the role of revenue management in the strategic, tactical
and operational management of the property, insufficient clarifications about the goal
and objectives of RM, overlapping responsibilities between different
departments/personnel, fear of the unknown, or numerous other reasons. In any case,
when the hotel management team tries to introduce the revenue management
philosophy in the hotel, it must be done with care, considering all internal
stakeholders affected by it.
3.3. Impacts on the RM system
Macroenvironment
The macroenvironment of the hotel includes those factors from the external
environment which it cannot influence, but should consider and try to adapt to.
Usually the macroenvironment is analysed in the six PESTEL dimensions (political,
economic, social, technological, environmental and legislative) each of which impacts,
although at varying degree, the revenue management system of the hotel.
Legal and technological factors have the strongest influence on a hotel’s RM system.
Legislative factors determine whether the application of the RM tools is even allowed
by law and how these tools maybe applied. Article 27 (3) from the Bulgarian
Consumer Protection Act, for example, explicitly says that the “designation of
different prices for the same service in particular premises is prohibited. If, however,
different prices are given for the same service, the customer pays the lower price”.
This means that price discrimination might be considered illegal by Bulgarian
authorities. That’s why after the introduction of the Consumer Protection Act in 2006,
Stanislav Ivanov (2014). Hotel Revenue Management: From Theory to Practice. Varna: Zangador. Page 31 of 204
publishing different prices for domestic and foreign guests in accommodation
establishments became illegal which led to increased prices for domestic tourists.
Therefore accommodation establishments in Bulgaria should carefully determine the
conditions and price levels in their contracts with distributors and the prices they
publish on their websites and at the reception of the hotel in order to avoid
subsequent legal sanctions. Similar regulations exist in other countries.
The development of information and communication technologies (ICT) has allowed
hoteliers to use a multitude of distribution channels. From one side this has provided
the hotel with enormous revenue management opportunities such as reaching
customers from various countries and segments effectively and cost efficiently,
applying dynamic pricing, gathering information on customers on an individual level
and applying microsegmentation. On the other hand, ICTs have introduced
unprecedented transparency about the prices and pricing strategies adopted by
hotels. Through the OTAs (Booking.com, Venere.com, Expedia.com, Orbitz.com)
customers can now easily check the prices for hundreds of hotels at a particular
destination, while through meta search engines (like Kayak.com, Hotelscombined.com,
Trivago.com) they may even compare prices of the same hotel via the different OTAs
and select the lowest price. This has led to greater price elasticity of the customers
(they have more information about the market offers) and to a certain degree of
commodification of the hotel product (customers shop for the best bargain and have
lower loyalty to brands). Furthermore, the prices are visible not only to customers but
to competitors, and can therefore be easily matched within minutes/hours, thus
eliminating any temporary price advantage one hotel might have had over its
competitors at a destination.
The economic (economy size, purchasing power parity, economic growth, economy’s
stage in the business cycle, balance of payments, inflation, exchange rates,
unemployment, etc.), social (population size, natural growth of population, ethnic
structure, travel and paid leave preferences, etc.), political (political stability), and
environmental factors often directly influence the RM system of a hotel by their
impact on tourism demand. For instance, in periods of high economic growth both
business and leisure travel demand increase, therefore, decreasing the need for price
promotions in hotels. When the local currency appreciates too much, the local hotel
industry loses its price competitiveness over other destinations and inbound tourism
Stanislav Ivanov (2014). Hotel Revenue Management: From Theory to Practice. Varna: Zangador. Page 32 of 204
demand drops, thus forcing hotels to apply various RM tools to stimulate demand.
Preferences of people when to take paid leave and go on a holiday may influence
traditional seasonality patterns in the revenues of the hotel. Political unrest in the
country would dissuade many travellers from taking the trip leading to significant
pressure on hotels’ revenues, prices and number of overnights.
Microenvironment
The microenvironment includes those actors from hotel’s external environment
whose behaviour the company can possibly influence through the elements of its
marketing mix. In a narrower context the microenvironment includes its customers,
the competitors, and distributors. In a wider context the microenvironment also may
include the media, various social/interest groups, financial and marketing partners of
the hotel, and the general public. Obviously each of these actors may have a profound
direct impact on a hotel’s RM system. The preferences, purchasing power,
characteristics of the customers determine the mix of the pricing, non-pricing and
combined RM tools that the hotel applies. The behaviour of competitors determines
the decisions made by the hotel, the distributors help the hotel sell its product and
generate revenues, while the media publications may cause some revenue
management practices to be more or less acceptable (e.g. media coverage of
overbookings). Therefore, the hotel should always keep track of the developments in
its microenvironment in order to be prepared to implement timely and proactive RM
decisions.
Internal environment
The internal environment includes the factors within the company that could shape
its RM system, its scope and/or the way it functions. In particular, here we could
include the marketing and financial objectives of the hotel, the decision-making and
organisational system of the property, its financial situation. If the objective of the
hotel’s management team is the maximisation of the RevPAR, the RM decisions to be
taken will be somewhat different compared to a situation when the objective is to
maximise the GOPPAR. Furthermore, if the hotel does not have an RM manager and
the RM function is the responsibility of the general manager of the hotel, RM might
not reach its full potential because the general manager may not have the time,
knowledge and/or skills to apply all RM techniques, because (s)he might simply be
overwhelmed with routine operational decisions such as housekeeping, repairs, staff

Stanislav Ivanov (2014). Hotel Revenue Management: From Theory to Practice. Varna: Zangador. Page 33 of 204
turnover, or relations with the hotel owner. Finally, if the hotel is struggling
financially, the strategy to protect the rooms for the highest paying customers might
step back in favour of a strategy aimed at attracting most (or any!) customers.
Stanislav Ivanov (2014). Hotel Revenue Management: From Theory to Practice. Varna: Zangador. Page 34 of 204
Chapter 4
HOTEL REVENUE MANAGEMENT PROCESS
The revenue management process is the set and sequences of actions undertaken by
revenue managers on strategic, tactical and operational level in relation to managing
the revenues of the hotel. Tranter, Stuart-Hill & Parker (2008) identify eight steps in
the RM process – customer knowledge, market segmentation and selection, internal
assessment, competitive analysis, demand forecasting, channel analysis and selection,
dynamic value-based pricing, and channel and inventory management. It is evident
that these authors’ steps of the RM process are derived from the general marketing
management practice, which is understandable, considering the fact that revenue
management developed into the realm of marketing management. Emeksiz, Gursoy
& Icoz (2006) propose a more comprehensive hotel revenue management model that
includes five stages, namely: preparation, supply and demand analysis,
implementation of revenue management strategies, evaluation of revenue
management activities and monitoring and amendment of the revenue management
strategy. The main advantage of the Emeksiz et al. (2006) model is the inclusion of
qualitative evaluation and constant monitoring of the chosen revenue management
strategy. Vinod (2004: 181) takes a more pragmatic approach to identifying the steps
in revenue management application and distinguishes the following steps in the RM
process: market segmentation, inventory pooling, demand and supply forecasting,
overbooking controls, revenue mix controls, performance measurement and
management reporting. Mauri (2012) provides a literature review of the different
viewpoints on the content of the revenue management process.
It is obvious that the authors identify more or less similar activities/steps/stages in the
RM process. The RM process is reported to include segmentation, analysis,
forecasting demand and supply, application of various RM tools, and monitoring and
evaluation of activities. This book adopts the Ivanov & Zhechev (2012) 7-stage
revenue management process elaborated in Figure 2. Segmentation is not considered

Stanislav Ivanov (2014). Hotel Revenue Management: From Theory to Practice. Varna: Zangador. Page 35 of 204
as a stage in the revenue management process but as part of the larger marketing
process of the hotel (Ivanov & Zhechev, 2011:15).
Figure 4.1. Hotel revenue management process (adapted from Ivanov & Zhechev, 2012)
RM goals
At the start of the RM process the revenue manager, the general manager and/or the
owner of the hotel set the goals of the revenue management of the hotel with a
specific strategic (several years), tactical (weeks/months) and operational (days) time
horizon (Ivanov and Zhechev, 2011: 304). These goals relate to the values of different
RM metrics (RevPAR, ADR, occupancy, GOPPAR) to be discussed in detail in
Chapter 5. It is important that goals are SMART:
Goals
Monitoring
Implementation
Forecasting
Analysis
Information
Stage Content
RM metrics –RevPAR, ADR, occupancy, GOPPAR
Goals by revenue centres
Strategic, tactical and operational goals
Operational data and information provided by hotel’s
marketing information system
Analysis of demand and supply in the destination
Analysis of operational data and information
Forecasting demand and supply in the destination
Forecasting RM metrics on a daily basis
Forecasting methods
Pricing, non-pricing and combined RM tools
Optimisation process
Approaches for solving RM mathematical problems
Performance evaluation of taken decisions and the RM
system as a whole
Decision
Sales techniques
Human resource training
Stanislav Ivanov (2014). Hotel Revenue Management: From Theory to Practice. Varna: Zangador. Page 36 of 204
Specific – the goal relates to a particular metric. ‘Being profitable’ is not
considered a specific goal as it is too generic. ‘Achieving RevPAR …’ is a very specific
and suitable RM goal.
Measurable – the goal has a numerical expression, i.e. ‘Achieving
RevPAR of 85 euros …’. The measurability of the goal serves as a prerequisite for
effective monitoring of the RM process as the target value of the metric is used as a
criterion whether the goal has been achieved or not.
Achievable – the goal is set within reasonable limits. It is unjustified to
set a goal for RevPAR for a three-star at the level of a four-/five-star hotel.
Realistic – the goal is supported by marketing activities and financial
budget. A goal of 10%-increase of RevPAR without necessary marketing actions and
financial resources would be overly optimistic.
Time-bound – the goal includes a deadline, i.e. ‘Achieving RevPAR of 85
euros in 2015’.
Separate sets of strategic, tactical and operational goals may be formulated for the
different revenue centres in the hotel (the F&B outlets, function rooms, spa & fitness
facilities, golf courses, casino and gambling facilities, and additional services) on the
basis of revenue centre’s specific RM metrics. Setting the RM goals is important, for
several reasons:
RM goals visualise the targets towards which the hotel is moving;
SMART RM goals provide a basis for evaluating the work of the
revenue manager/RM team;
RM goals help the RM team form a consensus about its objectives.
Data and information gathering
The second stage of the RM process includes the gathering of necessary operational
data and information provided by the hotel’s marketing information system. It will
be analysed in details in Chapter 7.
Analysis
During the third stage of the RM process, operational data is analysed to provide the
revenue manager with clues about the trends in the hotel’s RM metrics for the
forthcoming days/weeks. This stage also involves analysis of demand (on the level of
an individual hotel, chain properties at a destination and on destination level), and
Stanislav Ivanov (2014). Hotel Revenue Management: From Theory to Practice. Varna: Zangador. Page 37 of 204
the lodging supply at the destination (opening/closing/reflagging properties).
Analysis will be further elaborated in Chapter 8.
Forecasting
The revenue manager makes decisions on the basis of forecasts about the demand,
supply and development of various RM metrics. Therefore good RM forecasts are a
prerequisite for good RM decisions. Forecasting will be the subject of Chapter 9.
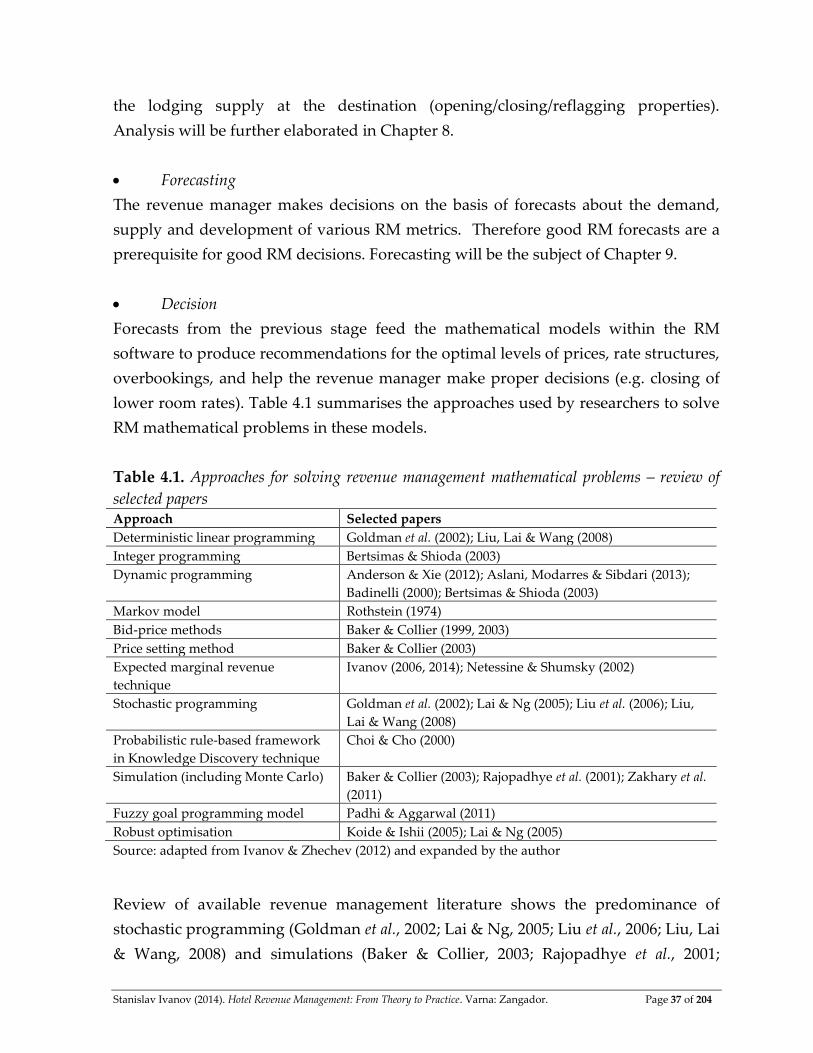
Decision
Forecasts from the previous stage feed the mathematical models within the RM
software to produce recommendations for the optimal levels of prices, rate structures,
overbookings, and help the revenue manager make proper decisions (e.g. closing of
lower room rates). Table 4.1 summarises the approaches used by researchers to solve
RM mathematical problems in these models.
Table 4.1. Approaches for solving revenue management mathematical problems – review of
selected papers Approach Selected papers
Deterministic linear programming Goldman et al. (2002); Liu, Lai & Wang (2008)
Integer programming Bertsimas & Shioda (2003)
Dynamic programming Anderson & Xie (2012); Aslani, Modarres & Sibdari (2013);
Badinelli (2000); Bertsimas & Shioda (2003)
Markov model Rothstein (1974)
Bid-price methods Baker & Collier (1999, 2003)
Price setting method Baker & Collier (2003)
Expected marginal revenue
technique
Ivanov (2006, 2014); Netessine & Shumsky (2002)
Stochastic programming Goldman et al. (2002); Lai & Ng (2005); Liu et al. (2006); Liu,
Lai & Wang (2008)
Probabilistic rule-based framework
in Knowledge Discovery technique
Choi & Cho (2000)
Simulation (including Monte Carlo) Baker & Collier (2003); Rajopadhye et al. (2001); Zakhary et al.
(2011)
Fuzzy goal programming model Padhi & Aggarwal (2011)
Robust optimisation Koide & Ishii (2005); Lai & Ng (2005)
Source: adapted from Ivanov & Zhechev (2012) and expanded by the author
Review of available revenue management literature shows the predominance of
stochastic programming (Goldman et al., 2002; Lai & Ng, 2005; Liu et al., 2006; Liu, Lai
& Wang, 2008) and simulations (Baker & Collier, 2003; Rajopadhye et al., 2001;
Stanislav Ivanov (2014). Hotel Revenue Management: From Theory to Practice. Varna: Zangador. Page 38 of 204
Zakhary et al., 2011) as approaches to solving RM mathematical problems. Other
methods like deterministic linear programming (Goldman et al., 2002; Liu, Lai &
Wang, 2008), integer programming (Bertsimas & Shioda, 2003), dynamic
programming (Badinelli, 2000; Bertsimas & Shioda, 2003), fuzzy goal programming
(Padhi & Aggarwal, 2011), and robust optimisation (Koide & Ishii, 2005; Lai & Ng,
2005) have received less, but growing attention. Finally, techniques such as bid-price
and price setting methods (Baker & Collier, 2003), and expected marginal revenue
technique (Ivanov, 2006, 2014; Netessine & Shumsky, 2002) have not been applied
widely in the field of hotel revenue management. To some extent the reasons may be
attributable to the stochastic nature of hotel bookings (in terms of lead period,
number of overnights, number of rooms, type of rooms, fare class, etc.) which
requires stochastic programming and simulations. On the other hand, the expected
marginal revenue technique provides greater simplicity of calculations and is more
practically applicable on a daily basis without the need for costly and complex
software. However, the aspiration of researchers and practitioners to model hotel
operations and market demand as realistically as possible leads to the construction of
more multifarious RM problems requiring innovative and more sophisticated
approaches to solve them.
As mentioned earlier, RM software provides recommendations to the RM manager
about the application of the different RM tools. However, the RM manager (or the
person whose responsibilities include managing the revenues of the hotel regardless
of their title) should make the decision. In particular, the decision could relate to:
– Opening/closing dates for sale to all or specific market segments;
– Opening/closing particular price levels for bookings to all or specific
market segments;
– Changes in overbooking limits for specific dates;
– Confirming/denying specific booking requests;
– Amending price levels by distribution channel;
– Amending booking terms by distribution channel (requirements for
credit card guarantee, prepayment, cancellations and amendments, etc.);
– Setting/amending requirements for minimum length of stay (minimum
number of overnights), etc.

Stanislav Ivanov (2014). Hotel Revenue Management: From Theory to Practice. Varna: Zangador. Page 39 of 204
In practice, decisions of the RM software may also be automated. When the RM
software is integrated in real time with the computer reservation system and the
website of the hotel (chain), it is possible for its website to visualise different rates to
different customers during different search times but for one and the same check-
in/stay-through date, depending on the number of already accrued bookings for that
particular date at the time of the search and how often accommodation for that date
has been searched for via the website of the hotel (chain). This saves time for the
revenue manager and provides opportunities for real time revenue management and
dynamic pricing without direct operational involvement of the manager. However,
the lack of human contact would mean that it is possible the website to visualise a
higher price than necessary and dissuade the customer from booking. If the customer
has an account on the website of the hotel (chain) and has signed in, he would be
identified and the appropriate prices would be visualised. However, in most cases the
user does not sign in when searching for information only. But when revenue
managers and software developers look for other clues hinting the ‘right prices’ to be
visualised (e.g. previously visited websites, information for which is obtainable via
the ‘cookies’, or the operating system used to access the website of the hotel (chain))
this may cause ethical concerns among customers, i.e. the practice of Orbitz to
visualise to Apple users hotels with average higher prices compared to PC users has
caused the company very bad publicity (Mattila & Choi, 2013). Therefore, automated
decision making should be limited to the most basic decisions like opening/closing
specific price levels when the number of accrued bookings has reached/fallen below
specific predetermined limit in order to avoid ethical complications.
Implementation
Once the RM decision has been made it must be implemented. All staff members
involved in sales should be informed about the decision if they have not participated
in the decision-making process. Operational decisions involving the next few
days/weeks could be announced by email and/or during the morning meetings
between hotel staff, general, marketing, front office and revenue managers. The
importance of tactical and strategic decisions may be further elaborated during
quarterly/annual staff meetings.
Implementation of the decisions requires that the staff be trained to apply numerous
sales techniques (such as upselling or cross-selling) in order to close a sale at a higher
Stanislav Ivanov (2014). Hotel Revenue Management: From Theory to Practice. Varna: Zangador. Page 40 of 204
rate or reject a booking for a shorter stay with the expectation to sell a guest room for
a longer one and thus achieve RM goals. This further requires specific selling abilities
(Weilbaker & Crocker, 2001) and constant training of sales personnel (Beck et al.,
2011). The term ‘upselling’ involves a sales technique by which the seller offers to a
customer a more expensive product or additional services to already purchased
goods/services. For instance, the administrator could offer the prospective customer a
superior room at a higher price that allows free cancellation instead of the lower non-
refundable rate for a standard room. If the customer cannot afford the price, the
administrator could then gradually lower the price (against stricter cancellation
conditions and lower room category) until a proposition is accepted by the customer
up to a predetermined limit (see also Hanks, Cross & Noland, 2002). Such Dutch
auction, starting with a high price and its sequential decrease by the seller until
accepted by the buyer (Menezes & Monteiro, 2005), would elicit a higher average
room price than immediately offering the lowest price. Upselling occurs also when at
check-in the administrator offers the customer an upgrade to the next higher category
room for additional payment. ‘Cross-selling’ is a sales technique in which an
employee in one department of the hotel informs the customer about and offers
services/products provided by other departments in the hotel, e.g. when the
administrator informs the guest at check-in about offers in the restaurant or the
services in the spa centre. If the customer books online via the hotel (chain) website,
the upselling could be performed automatically as explained in the previous
paragraph. The website could also provide the customer the option to book
additional services (cross-selling) either at the time of booking or after the booking for
the rooms has been confirmed.
Monitoring
Finally, the revenue management process includes the monitoring and evaluation of
all stages in the process and searching for opportunities to improve it at every stage.
Specifically, monitoring and evaluation might reveal that:
Goals are too ambitious (not ‘achievable’), too low (if the salaries of the
revenue management team depend on their performance in reaching specific RM
metrics targets they are interested in setting lower goals in order to receive higher
bonuses), or not accepted by the people who have to achieve them;
The hotel’s marketing information system is not providing the proper
information, it produces too much information (yielding shallow analysis due to data

Stanislav Ivanov (2014). Hotel Revenue Management: From Theory to Practice. Varna: Zangador. Page 41 of 204
overload) or too little information (thus no in-depth analysis), or information is not
provided in a timely manner;
Analysis is altogether missing and therefore is too shallow, its results
are ignored, or the revenue management team are obsessed with the analysis or
overconfident with their conclusions;
Forecasting is based on unrealistic assumptions and demand models,
does not cover all relevant variables or is overly complicated (i.e. no significant
forecasting accuracy gain from using a more sophisticated forecasting technique
instead of a simpler one);
Decision is not related to the results of the analysis or the forecasting, or
not understood/accepted by the employees who have to implement it;
Employees involved in the sales of various services in the hotel are not
implementing the decisions, or ‘it’s-not-my-job’ culture is cultivated in the hotel (i.e.
sales are perceived as responsibility solely of the sales team).
Monitoring and evaluating the RM process is required not only when the revenue
management team fails to achieve their objectives, but also when it reaches and,
especially, outperforms them. It may turn out, that due to unusually strong demand
the hotel (chain) surpassed its RM goals so that this achievement should not be
entirely attributed to the revenue management. It may also turn out that the
objectives have been deliberately set at low levels, so that the RM team could easily
achieve them and receive greater bonuses. Anyway, regardless of the results of the
monitoring process, all identified issues should be addressed properly and in a timely
manner.
Revenue management should be applied only if it contributes positively to the hotel’s
bottom line. This requires measuring the performance of hotel’s RM system and
process (Burgess & Bryant, 2001; Jain & Bowman, 2005; McEvoy, 1997; Rannou &
Melli, 2003) on individual property or chain level (Sanchez & Satir, 2005). Authors
agree that revenue management, like any investment, is worth when the increased
revenues from its application offset the additional costs related to it. Cross et al. (2009:
73) suggest that the “revenue generation index”, calculated as the ratio of hotel’s
RevPAR divided by the RevPAR of the competitive set, is a more accurate assessment
of revenue productivity for a particular property, especially when considering the
economic environment in which the hotel is operating. Same authors also discuss the
Stanislav Ivanov (2014). Hotel Revenue Management: From Theory to Practice. Varna: Zangador. Page 42 of 204
“revenue opportunity index” calculated as the ratio between actual and optimal
(maximum) revenue that could have been achieved by the hotel. However, regardless
of the performance measures used, they have to be applied systematically in order to
provide comparability of hotel’s results in a given time period. In practice, this may
take the form of RM reports prepared on a suitable time basis (daily, weekly,
monthly, quarterly, or annually).
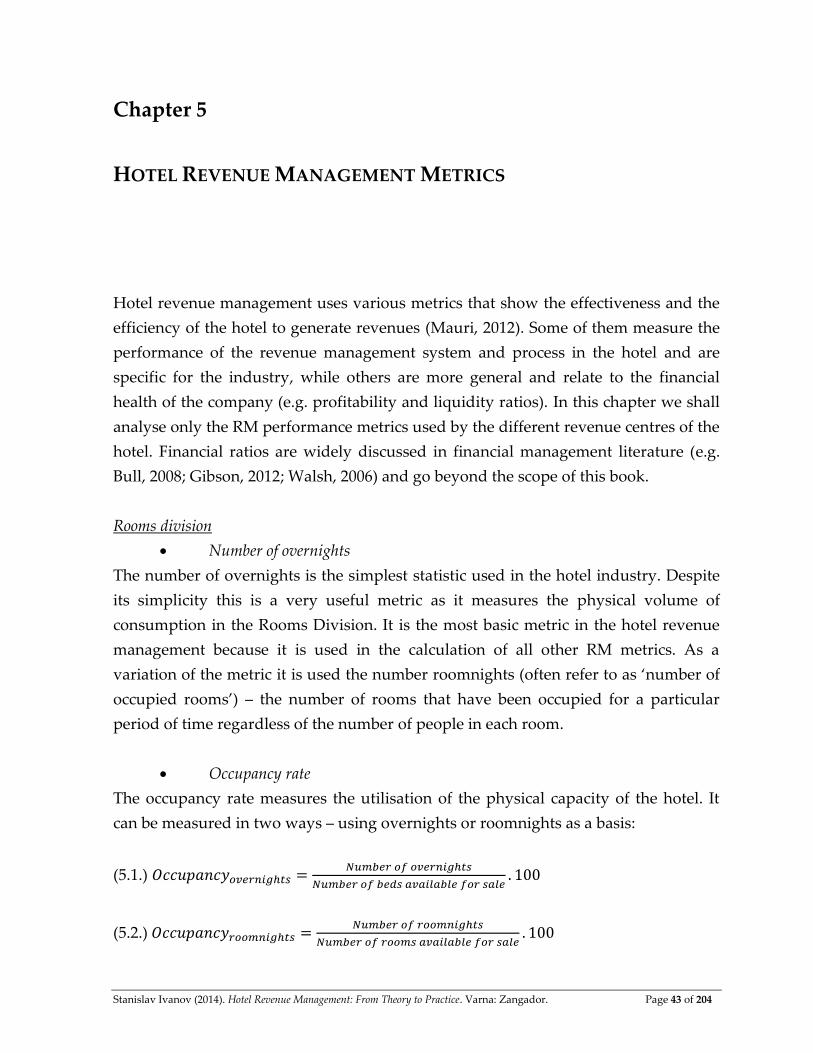
Stanislav Ivanov (2014). Hotel Revenue Management: From Theory to Practice. Varna: Zangador. Page 43 of 204
Chapter 5
HOTEL REVENUE MANAGEMENT METRICS
Hotel revenue management uses various metrics that show the effectiveness and the
efficiency of the hotel to generate revenues (Mauri, 2012). Some of them measure the
performance of the revenue management system and process in the hotel and are
specific for the industry, while others are more general and relate to the financial
health of the company (e.g. profitability and liquidity ratios). In this chapter we shall
analyse only the RM performance metrics used by the different revenue centres of the
hotel. Financial ratios are widely discussed in financial management literature (e.g.
Bull, 2008; Gibson, 2012; Walsh, 2006) and go beyond the scope of this book.
Rooms division
Number of overnights
The number of overnights is the simplest statistic used in the hotel industry. Despite
its simplicity this is a very useful metric as it measures the physical volume of
consumption in the Rooms Division. It is the most basic metric in the hotel revenue
management because it is used in the calculation of all other RM metrics. As a
variation of the metric it is used the number roomnights (often refer to as ‘number of
occupied rooms’) – the number of rooms that have been occupied for a particular
period of time regardless of the number of people in each room.
Occupancy rate
The occupancy rate measures the utilisation of the physical capacity of the hotel. It
can be measured in two ways – using overnights or roomnights as a basis:
(5.1.)
(5.2.)
Stanislav Ivanov (2014). Hotel Revenue Management: From Theory to Practice. Varna: Zangador. Page 44 of 204
Due to various reasons (e.g. repair works, temporary technical problems or
accommodation of employees), some of the guest rooms of the hotel are blocked and
not designated for sale to guests. The rest will be considered available for sale.
Considering the facts that hotels have rooms with different number of beds, the
number of different room types in a particular hotel is not equal, the demand for the
different room types is not equal, extra beds could be added to some rooms for
particular nights and fewer guests could be accommodated in the room than its
maximum capacity, the occupancy rates calculated on the basis of roomnights and
overnights might be different. The occupancy rate shows the ability of the hotel to
generate revenues in an extensive way, i.e. by increasing the number of
guests/nights/sold rooms. It varies depending on:
– Day of the week – higher during weekdays for business hotels
and lower during weekends. For leisure properties the situation is reversed – higher
occupancy during weekends and lower on weekdays.
– Period of the year – alludes to the seasonality of tourism activi-
ties. Seaside hotels have higher occupancy during summer season, while mountain
properties could have double peaks – higher in winter and lower in summer.
– Market segments – business travellers prefer to stay in single
rooms. Usually hotels do not offer many proper single rooms and accommodate
single guests in double rooms for single use. This action does not influence the
occupancy rate measured by roomnights, but decreases the occupancy rate measured
by overnights as fewer guests have been accommodated in the double rooms than
rooms’ capacity.
– Special events – events like exhibitions, conferences, congresses,
festivals, or sport games attract a lot of visitors to the destination and increase the
demand for accommodation and the occupancy rates of hotels.
– Factors like destination accessibility, competitors’ actions, the
marketing strategy and activities of the hotel, product quality and other factors that
impact the demand for the product of the particular hotel.
Average daily rate (ADR)
The ADR relates to the average price charged by the hotel for one overnight (equation
5.3.) or roomnight (equation 5.4.). This statistic reflects the ability of the hotel to
generate revenues intensively from occupied rooms, i.e. by achieving higher prices
rather than more overnights/roomnights. It can be calculated for every room type
Stanislav Ivanov (2014). Hotel Revenue Management: From Theory to Practice. Varna: Zangador. Page 45 of 204
separately (e.g. standard, superior, deluxe, executive rooms, studios, suites, etc.) or
for the hotel as a whole.
(5.3.)
(5.4.)
The ADR depends on:
– Day of the week – business hotels have higher rates during weekdays
and lower during weekend days. Similar to occupancy rate, the opposite situation is
observed in leisure properties – higher prices during weekend days and lower for
weekdays.
– Period of the year – higher prices during main tourist season and lower
prices during shoulder and low season periods.
– Market segments – if the hotel charges different prices by market
segment.
– Special events – during special events demand for accommodation
increases which eliminates the need for promotions to stimulate it. Therefore the
ADR rises (see Herrmann & Herrmann (2014) for an example of the impact of 2012
Oktoberfest on prices of hotels in Munich).
– Contract conditions, price levels and booking terms by distribution
channels used by the hotel – if the hotel achieves higher rates in its contracts with
intermediaries, the ADR will increase.
– The types of rooms booked by customers – more expensive rooms drive
up the ADR of the hotel.
– Other factors that impact the demand for the product of the particular
hotel discussed in the previous paragraph.
ADR is an intuitive metric, straightforward, and easy to calculate and understand by
hotel managers, employees and investors. That’s why it is widely used in the
industry. However, a major criticism is that it considers only room revenues. As
Mauri (2012) pinpoints, for a budget hotel, guest room revenues may well account for
nearly all of its revenues but for a luxury business/leisure/golf/casino hotel room,
revenues may be around or even less than half of its total revenues, which justifies
the use of the next metric – the total revenue per occupied room.
Stanislav Ivanov (2014). Hotel Revenue Management: From Theory to Practice. Varna: Zangador. Page 46 of 204
Length-of-stay
Length-of-stay shows the average number of overnights spent by guests in the hotel:
(5.5.)
Transit motels and airport hotels usually show very low length-of-stay statistics
(slightly above 1 night), business city hotels – around 2-3 nights, while leisure hotels –
5-7 or more overnights. Length-of-stay is related to the costs and revenues from the
guests. Longer guest stays require less frequent change of laundry, which decreases
slightly the variable costs, while increase the opportunities for the hotel staff to sell
additional services to those guests. Longer stays also decrease the number of check-
ins and check-outs, thus lowering the workload for the Front Office and
Housekeeping departments. That’s why hotels usually offer discounts to guests with
longer stays either in the form of a lower room rates or by free additional nights (e.g.
“Stay 7, pay 6 overnights”).
Total revenue per occupied room (Total RevPOR)
This metric is calculated similarly to the ADR but instead of the room revenues only
the nominator includes the total revenues of the hotel.
(5.6.)
The main advantage of this metric is that it considers the revenues from ancillary
services. Besides the factors that impact the ADR, the total RevPOR depends on the
variety of additional services offered by the hotel and the employees’ selling and
cross-selling skills.
Revenue per available room (RevPAR)
ADR and occupancy rates alone cannot be measures of the effectiveness and
efficiency of the revenue management system of the hotel because having a high ADR
or high occupancy does not necessarily mean high revenues – a high ADR can
actually be achieved at a very low occupancy, while a low ADR – at a very high
occupancy. That’s why it is best if both metrics (occupancy and ADR) be used
together involving the metric named ‘revenue per available room’ (RevPAR). It
measures room revenues generated by the hotel per one room available for sale
Stanislav Ivanov (2014). Hotel Revenue Management: From Theory to Practice. Varna: Zangador. Page 47 of 204
(equation 5.7.) and is considered as one of the most important metrics in the hotel
industry.
(5.7.)
RevPAR can also be calculated as the product of ADR and the occupancy rate:
(5.8.)
Equation (5.8.) shows that the RevPAR is influenced by both the occupancy rate and
ADR, and depends on the factors that influence each of them. Therefore the hotel can
achieve a higher RevPAR by increasing the occupancy (extensive growth), the ADR
(intensive growth), or by adjusting both. It should be noted that ADR and occupancy
have an inverse relationship. When the hotel increases its room rates its ADR rises
but occupancy drops; when prices decrease the ADR falls but the occupancy rate
increases. Therefore, it is possible that the hotel has the same RevPAR at various
levels of occupancy and ADR. Similar to ADR the RevPAR disregards revenues from
additional services but nevertheless, again, it is the most widely used performance
metric in hotel revenue management.
Total revenue per available room (Total RevPAR)
Total RevPAR overcomes the disadvantage of the RevPAR by taking into
consideration the revenues from additional services as well. It is the product of the
total RevPOR and the occupancy rate.
(5.9.)
(5.10.)
Obviously the total RevPAR is the best metric for analysing the effectiveness of the
revenue management to generate revenues as it integrates all above metrics. It has,
nevertheless, one disadvantage – it disregards the costs for generating the revenues.
Measuring and analysing costs is important. It may turn out that the hotel is
achieving very high total RevPAR but at the expense of high costs that decrease or
Stanislav Ivanov (2014). Hotel Revenue Management: From Theory to Practice. Varna: Zangador. Page 48 of 204
even entirely eliminate the profit of the hotel. This disadvantage is overcome by the
next metric – the gross operating profit per available room.
Gross operating profit per available room (GOPPAR)
The GOPPAR is the most useful metric available to revenue managers because it
considers the revenues and costs simultaneously. It is calculated by (Dopson &
Hayes, 2009: 299):
(5.11)
The gross operating profit (GOP) of the Rooms Division is the difference between the
total room revenues (TR) and the total room costs (TC):
(5.12)
Total room costs include variable (VC) and fixed costs (FC):
(5.13)
Revenues are the product of the ADR and the number of roomnights sold (i.e. the
number of occupied rooms). Variable costs are the product of the variable costs per
one roomnight (VC1) and the number of occupied rooms:
(5.14)
(5.15)
Considering that
(5.16)
,
we come to:
(5.17)
Stanislav Ivanov (2014). Hotel Revenue Management: From Theory to Practice. Varna: Zangador. Page 49 of 204
By substituting (5.17) in (5.11) we arrive at:
(5.18)
Taking into account (5.2) and (5.8) we can conclude that (Hoogenboom, 2012: 3):
(5.19)
(5.20)
where FCPAR are the fixed costs per available room.
Equations (5.19) and (5.20) reveal that hoteliers may increase GOPPAR by raising the
ADR, the occupancy rate, RevPAR and the gross profit margin and/or by decreasing
the fixed room costs. The GOPPAR can be calculated for each source of revenues, not
only from guest rooms but also F&B, retail sales, and other services in the hotel. Then
the total GOPPAR of the hotel would be equal to the sum of the GOPPARs for each
revenue source/centre. Considering the fact that GOPPAR deals with profit, not
revenues, it is considered to be the most important revenue metric for the future
(Kimes, 2011; Mauri 2012).
Yield
The yield is the ratio showing what percentage of the maximum potential revenues
for a particular period (usually one night) the hotel has actually generated:
(5.21)
(5.22)
(5.23)
(5.24)
It is obvious that the yield is proportionate to the RevPAR and in an inverse
relationship to rack rate. This means that every time the hotel changes its rack rate,
yield changes as well, even in the case of constant other variables. Therefore in order
to generate comparable results in time, the rack rate should not be changed
Stanislav Ivanov (2014). Hotel Revenue Management: From Theory to Practice. Varna: Zangador. Page 50 of 204
frequently and this is also advisable from a market positioning perspective. Often in
practice, the rack rate is just a nominal rate at which only too few bookings are made.
Restaurant
For hotel food and beverage outlets the revenue manager may use a different set of
metrics, specific to the restaurant business.
Average check
(5.25)
This is a measure of the average customer bill. It is the restaurant equivalent of the
ADR. The average check depends on:
– Period of the day (lunch or dinner).
– Market segment – business travellers tend to spend more money
at the restaurant because they receive per diem allowances from their company to
cover subsistence costs unlike leisure travellers who are spending their own income
during travel.
– Restaurant visit occasion – people tend to spend more money
during restaurant visits on special occasions, e.g. wedding anniversary, business
lunch/dinner, etc.
– Prices of individual menu entrees.
– Duration of stay in the restaurant – when customers stay longer
in the restaurant it is more likely that they will consume more food and drinks but
this decreases the table turnover and fewer customers will be served by the restaurant
during a given period of time.
Revenue per available seat-hour (RevPASH)
Kimes (1999b) and Thompson & Sohn (2009) emphasise the use of the RevPASH
metric for assessing the efficiency of revenue management in restaurants.
(5.26)
The RevPASH measures the revenues generated by the restaurant per available seat
per one hour. It is the equivalent of the RevPAR metric in the Rooms Division.
Stanislav Ivanov (2014). Hotel Revenue Management: From Theory to Practice. Varna: Zangador. Page 51 of 204
Similar to RevPAR, it can be increased extensively by serving more guests and
intensively by achieving a higher average check per guest. On the other hand, the
number of customers served will depend on the average meal duration – the shorter
the duration of the meal, the more customers may be served at a table during a given
period of time.
Function rooms
For measuring revenue management performance of function rooms
(conference/meeting rooms, ball room), the revenue manager can use the following
time- and capacity-based metrics.
Revenue per rented square metre-hour (RevPSMH)
(5.27)
If the hotel has only one function room which can only be rented as a whole, the
rented capacity would be equal to the maximum capacity of the function rooms so the
denominator of (5.27) would include the rented hours only. If the hotel has two or
more function rooms it would be better if the rented capacity is measured in square
metres rather than number of seats because the seating capacity of the function rooms
depends on their layout. RevPSMH is conceptually equivalent to ADR. It illustrates
the average rental price of the function rooms per square metre per hour.
Occupancy
Occupancy of function rooms is measured by:
(5.28)
It is increased when more square metres are rented (extensive growth) and for more
hours (intensive growth). Occupancy will depend on the types of meetings function
rooms could host, the flexibility of their space (i.e. the possibility to divide one room
into two or merge two neighbouring rooms), or the variety of rooms that facilitate
different meetings simultaneously without hindering one another.
Revenue per available square metre-hour (RevPASMH)
Stanislav Ivanov (2014). Hotel Revenue Management: From Theory to Practice. Varna: Zangador. Page 52 of 204
(5.29)
(5.30)
RevPASMH illustrates what revenues function rooms generate per one square metre
and per hour available for rent. It is the equivalent of the RevPAR. RevPASMH
increases when RevPSMH and occupancy rate increase.
Spa centre
Revenue performance of a spa centre is measured by the following set of time- and
capacity-based metrics:
Average revenue per guest
(5.31)
Occupancy
Occupancy measures the actual number of treatments as a percentage of the
maximum capacity of the spa centre, i.e.:
(5.32)
It depends on the maximum number of guests that can be served within one hour
and the number of working hours of the spa centre.
Revenue per available treatment hour (RevPATH) (Kimes & Singh,
2009)
(5.33)
(5.34)
RevPATH is the spa equivalent of the RevPAR, therefore these share similar
characteristics.
Casino
Some revenue management metrics in a casino include:
Stanislav Ivanov (2014). Hotel Revenue Management: From Theory to Practice. Varna: Zangador. Page 53 of 204
Average bet per customer
(5.35)
It is calculated separately for the different table games (dice, roulette, blackjack,
baccarat, etc.).
Hands per hour
(5.36)
This is calculated for each table separately and illustrates the speed (pace) of the
game. The casino is interested in higher game pace (more hands per hour) in order to
generate higher revenues.
House advantage – shows the theoretical statistical probability of win
for the casino. From a revenue management perspective it impacts the number and
mix of table and slot games to be offered by the casino. Higher house advantage
generates higher revenues as percent of the bet but may dissuade customers from
betting.
Average daily theoretical revenue (ADT) (Hendler & Hendler, 2004: 75)
(5.37)
ADT is the amount of money a player spends in the casino per day.
Revenue per square foot/metre
(5.38)
This space-related metric shows how effectively the casino utilises its limited space to
generate revenues.
Stanislav Ivanov (2014). Hotel Revenue Management: From Theory to Practice. Varna: Zangador. Page 54 of 204
Profit per square foot/metre
(5.39)
This metric is analogical to the revenue per square foot/metre and measures the
effectiveness of the casino to generate profit from its limited space.
Casino win on a player level (Peister, 2007: 72)
(5.40)
This metric illustrates the amount of money a casino retains from player’s bets.
Win per available seating hour (WPASH) (Peister, 2007: 72) is a casino’s
equivalent of RevPAR:
(5.41)
WPASH is influenced positively by the amount of the average bet per player, the
number of hands one plays per hour, the time spent playing and the house
advantage. Therefore, casino managers are interested in increasing the values of these
metrics.
Golf course
Tee time interval
Golf courses allow golfers to start their rounds at specific moments and the interval
between two consecutive moments is the tee time interval. Longer tee time intervals
mean that fewer groups will be able to use the golf course. If the tee time interval is 10
minutes there will be six rounds starting per hour, while if intervals are every 12
minutes – only 5 rounds will be played every hour.
Number of available rounds
(5.42)
Stanislav Ivanov (2014). Hotel Revenue Management: From Theory to Practice. Varna: Zangador. Page 55 of 204
This metric shows the maximum number of rounds available to golfers on a
particular day.
Course utilisation
(5.43)
Course utilisation may be perceived as the occupancy rate of the golf course.
Round duration
This is the amount of time it takes for a player to go through all the holes on the
course. Shorter rounds mean fewer players will be on the course at any given
moment and shorter tee time intervals may be set.
Revenue per utilised round (RevPUR)
(5.44)
RevPUR is conceptually identical to Total RevPOR in the Rooms Division.
Revenue per available tee time (RevPATT) (Kimes, 2000)
(5.45)
This metric is the Total RevPAR equivalent in the golf industry.
RM is a constantly evolving field. It is recommended that the revenue manager of the
hotel is not be restricted to the above metrics but delve deeper and, why not, develop
his/her own metrics that will contribute both to the theory and practice of hotel
revenue management.
Stanislav Ivanov (2014). Hotel Revenue Management: From Theory to Practice. Varna: Zangador. Page 56 of 204
Chapter 6
MARKET SEGMENTATION, PROFILING AND TARGETING
Segmentation refers to the process of dividing the consumers into distinct groups
with similar set of needs and wants requiring the development of different marketing
mixes by the hotel. Consumers within each segment are homogeneous on one or
more segmentation criteria but may be very heterogeneous on other criteria. From a
revenue management perspective segmentation is used to identify the ‘right’
customer(s) for the hotel. As segmentation and types of tourists have been widely
discussed in tourism and hospitality marketing literature (e.g. Bowie & Buttle, 2011;
Hudson, 2008; Ivanov & Zhechev, 2011; Kotler, Bowen & Makens, 2006; Morritt, 2007;
Kozak & Martin, 2012; Wearne & Morrison, 2011), this chapter concentrates only on
those segmentation issues relevant to hotel revenue management and will omit the
general discussion of the segmentation process.
The necessity for segmentation stems from the fact that the hotel which offers a
product for the ‘average’ customer satisfies no one – for some customers the product
would be too expensive, for others – of too low category, for third – with too limited
additional services, while another may not be interested in extensive services at all.
Customers differ in their needs, wants, desires and preferences toward the product
characteristics, travel motives, booking period, travel period, purchase occasions,
purchase volume, attitude toward the brand of the hotel chain, hotel selection criteria,
willingness to pay, buying power, etc. On the other hand, many customers share
common preferences and for them the hotel could offer the same product, sell it via the
same distribution channels, communicate the same product value and charge the
same price. These customers, for whom the hotel uses the same marketing mix, form
a market segment.
Hotel managers can use a variety of segmentation criteria. Appendices 6.1 and 6.2
present sample lists of segmentation criteria and market segments that may be
Stanislav Ivanov (2014). Hotel Revenue Management: From Theory to Practice. Varna: Zangador. Page 57 of 204
considered by hoteliers for segmenting the tourists and organisational customers,
respectively. Segmentation criteria in the two appendices are hierarchically ordered
into two levels – synthetic and analytic criteria (Rakadzhiiska, Marinov & Dyankov,
2013). Synthetic criteria are general broad approaches for segmentation consisting of
one or more analytic criteria used to identify the particular segments. The diversity of
segmentation criteria is wide and there is no need to use all of them – hoteliers should
use only those criteria that are relevant to their type of accommodation
establishments and influence the buyer behaviour and the decision making process of
the tourists and the organisations. Several segmentation criteria may be used
simultaneously. However, the more segmentation criteria used, the greater the
number and the smaller the size of the market segments.
Segmenting the market is not an easy task – the identified market segments should
fulfil the following requirements (see also Bowie & Buttle, 2011; Kotler, Bowen &
Makens, 2006; Morritt, 2008):
Discrete – the segment has a unique set of needs, wants, requirements
and expectations that require the development of a special marketing mix.
Mutually exclusive – the segments formulated by a particular
segmentation criterion should not be overlapping, i.e. one customer belongs to one
segment identified by that criterion, not to two or more.
Measurable – the segment must be approximately measured in terms of
size (number of potential tourists / organisations within the segment), sales volume,
growth, market shares.
Profitable – the segment is large enough and financially attractive to
justify entry and the development of a special combination of marketing mix
elements.
Accessible – the segment is reachable via the distribution network of the
hotel.
Stability – the segment is relatively stable and is expected to exist into
the near future.
Actionable – the hotel could influence the behaviour of the identified
market segment with the marketing mix.
Segmentation based on synthetic criteria like geography, demography, technical and
organisational characteristics of the trip and travel motives usually produces market

Stanislav Ivanov (2014). Hotel Revenue Management: From Theory to Practice. Varna: Zangador. Page 58 of 204
segments that fulfil all the above criteria. It is relatively easy to apply, intuitive and
statistical data on some of the segments are readily available or cheap to obtain.
That’s why they are the most widely used both in practice and in travel industry
market reports. On the other hand, psychographic and behavioural segmentation
produce segments that might be more relevant for the hotel, but their main
disadvantage is the difficult measurability. Nevertheless, regardless of the
segmentation criteria used, formulated market segments should be carefully
evaluated in terms of their size, sales volume, profitability, competition within the
segment and revenue management characteristics in order to assess their
attractiveness. Table 6.1 below summarises the revenue management profiles of some
selected market segments, while Table 6.2 illustrates the same for special events
organised in a hotel.
Once market segments have been identified and their profiles developed, the revenue
manager should select the target market segment based on their attractiveness and
the strengths (and weaknesses) of the hotel. The attractiveness of the market segment
is based on segment size, profitability, expectations of the customers, competition by
other hotels (chains) within the segment. The hotel may target only one segment – e.g.
roadside motels target the transient car travellers, while some hotels in Amsterdam
are marketed as gay hotels. The hotel may also target several segments
simultaneously. However, the compatibility of selected market segments should be
taken into account. Some customer groups should not be accommodated in the hotel
at the same time– e.g. teenager groups with senior travellers, sport teams with guests
for balneology and rehabilitation, school children with LGBT guests. Of course, the
hotel may accommodate all these groups but this should likely take place at different
times. However, if they have to be accommodated at the same time, potentially
conflicting segments should be located in different wings/floors of the hotel and, if
possible, have different time schedules for use of the restaurant and other facilities of
the hotel to avoid complaints. In any case, the marketing mix of the hotel should be
developed in line with the characteristics, preferences and expectations of the selected
target market segments. From a revenue management perspective the customer mix
of the hotel is important because it influences directly its revenues and profitability.
As discussed in Chapter 1 the hotel should focus on the ‘right’ market segments it can
serve profitably and whose expectations it can meet properly.
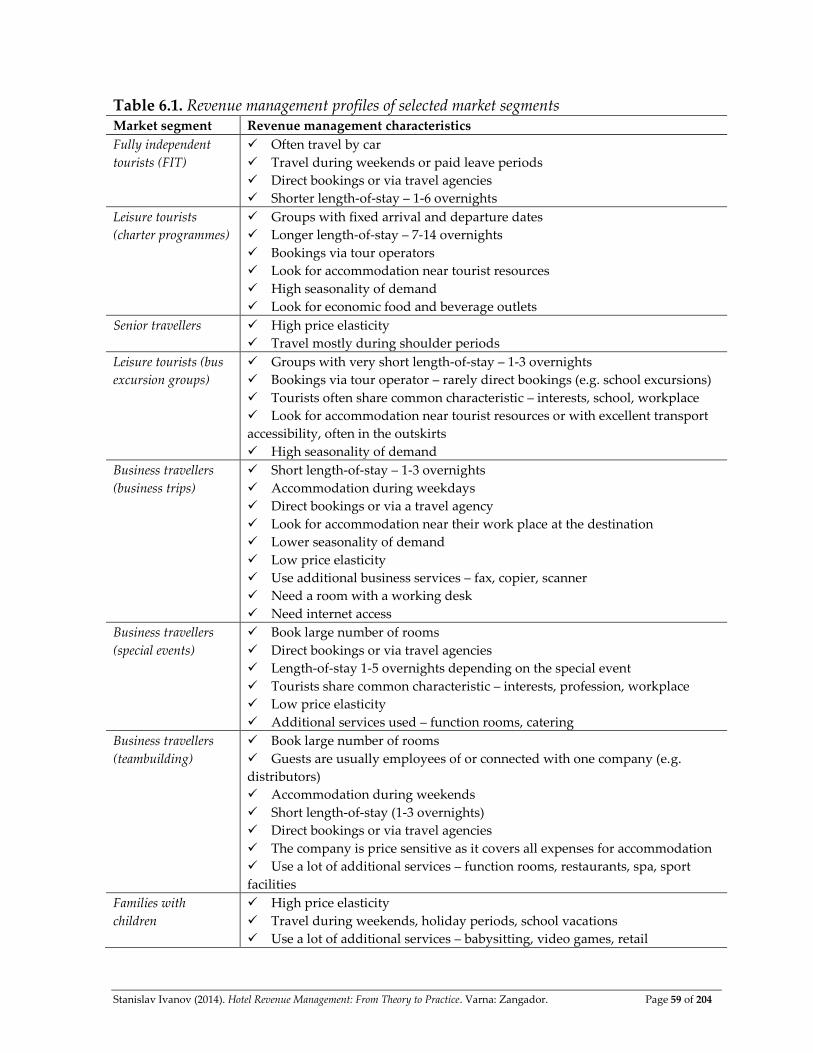
Stanislav Ivanov (2014). Hotel Revenue Management: From Theory to Practice. Varna: Zangador. Page 59 of 204
Table 6.1. Revenue management profiles of selected market segments Market segment Revenue management characteristics
Fully independent
tourists (FIT)
Often travel by car
Travel during weekends or paid leave periods
Direct bookings or via travel agencies
Shorter length-of-stay – 1-6 overnights
Leisure tourists
(charter programmes)
Groups with fixed arrival and departure dates
Longer length-of-stay – 7-14 overnights
Bookings via tour operators
Look for accommodation near tourist resources
High seasonality of demand
Look for economic food and beverage outlets
Senior travellers High price elasticity
Travel mostly during shoulder periods
Leisure tourists (bus
excursion groups)
Groups with very short length-of-stay – 1-3 overnights
Bookings via tour operator – rarely direct bookings (e.g. school excursions)
Tourists often share common characteristic – interests, school, workplace
Look for accommodation near tourist resources or with excellent transport
accessibility, often in the outskirts
High seasonality of demand
Business travellers
(business trips)
Short length-of-stay – 1-3 overnights
Accommodation during weekdays
Direct bookings or via a travel agency
Look for accommodation near their work place at the destination
Lower seasonality of demand
Low price elasticity
Use additional business services – fax, copier, scanner
Need a room with a working desk
Need internet access
Business travellers
(special events)
Book large number of rooms
Direct bookings or via travel agencies
Length-of-stay 1-5 overnights depending on the special event
Tourists share common characteristic – interests, profession, workplace
Low price elasticity
Additional services used – function rooms, catering
Business travellers
(teambuilding)
Book large number of rooms
Guests are usually employees of or connected with one company (e.g.
distributors)
Accommodation during weekends
Short length-of-stay (1-3 overnights)
Direct bookings or via travel agencies
The company is price sensitive as it covers all expenses for accommodation
Use a lot of additional services – function rooms, restaurants, spa, sport
facilities
Families with
children
High price elasticity
Travel during weekends, holiday periods, school vacations
Use a lot of additional services – babysitting, video games, retail
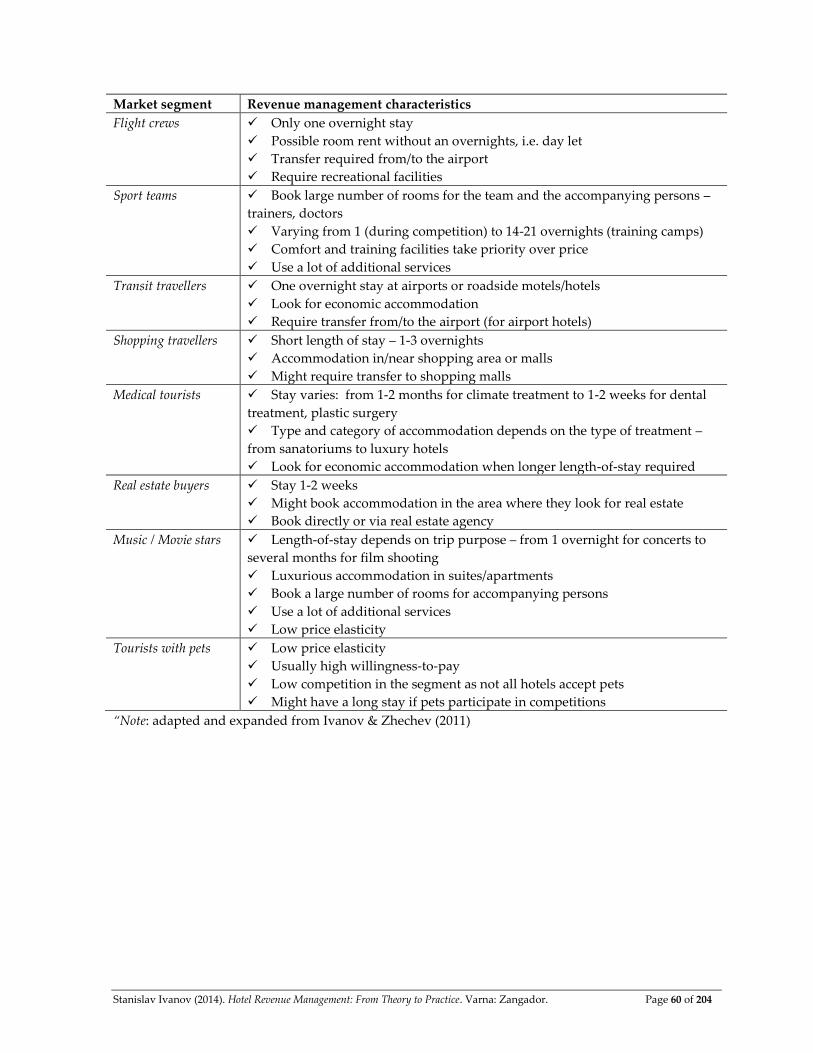
Stanislav Ivanov (2014). Hotel Revenue Management: From Theory to Practice. Varna: Zangador. Page 60 of 204
Market segment Revenue management characteristics
Flight crews Only one overnight stay
Possible room rent without an overnights, i.e. day let
Transfer required from/to the airport
Require recreational facilities
Sport teams Book large number of rooms for the team and the accompanying persons –
trainers, doctors
Varying from 1 (during competition) to 14-21 overnights (training camps)
Comfort and training facilities take priority over price
Use a lot of additional services
Transit travellers One overnight stay at airports or roadside motels/hotels
Look for economic accommodation
Require transfer from/to the airport (for airport hotels)
Shopping travellers Short length of stay – 1-3 overnights
Accommodation in/near shopping area or malls
Might require transfer to shopping malls
Medical tourists Stay varies: from 1-2 months for climate treatment to 1-2 weeks for dental
treatment, plastic surgery
Type and category of accommodation depends on the type of treatment –
from sanatoriums to luxury hotels
Look for economic accommodation when longer length-of-stay required
Real estate buyers Stay 1-2 weeks
Might book accommodation in the area where they look for real estate
Book directly or via real estate agency
Music / Movie stars Length-of-stay depends on trip purpose – from 1 overnight for concerts to
several months for film shooting
Luxurious accommodation in suites/apartments
Book a large number of rooms for accompanying persons
Use a lot of additional services
Low price elasticity
Tourists with pets Low price elasticity
Usually high willingness-to-pay
Low competition in the segment as not all hotels accept pets
Might have a long stay if pets participate in competitions
“Note: adapted and expanded from Ivanov & Zhechev (2011)
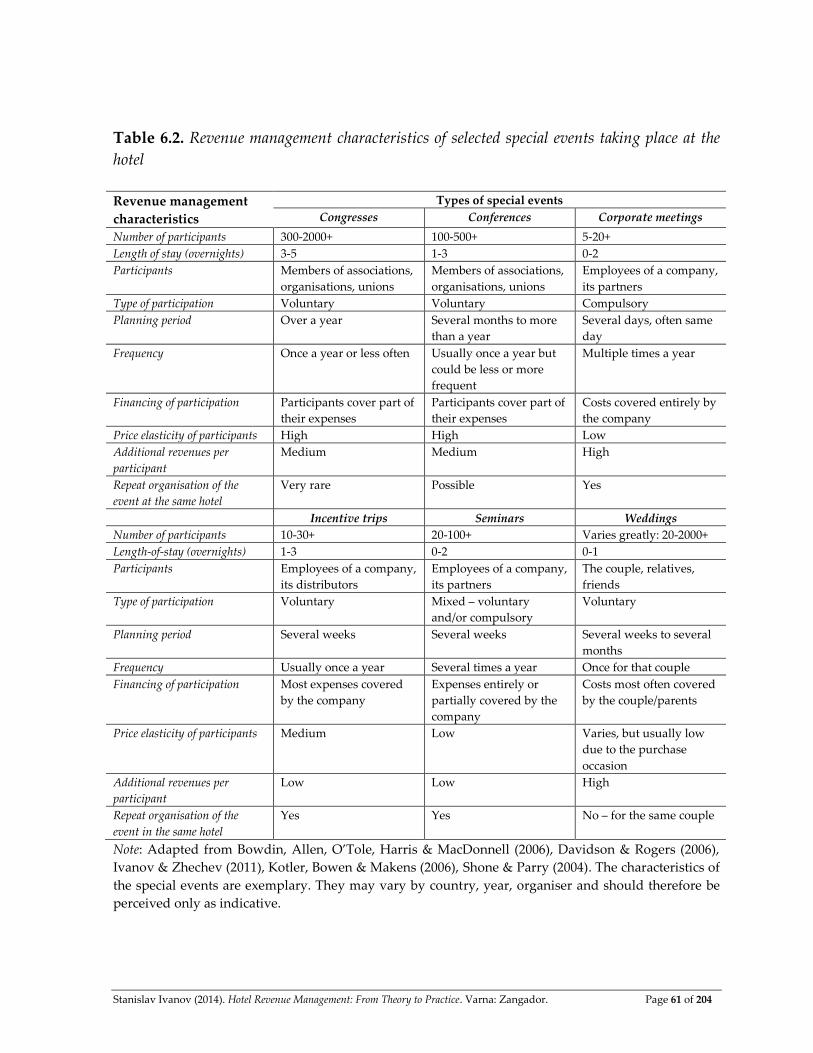
Stanislav Ivanov (2014). Hotel Revenue Management: From Theory to Practice. Varna: Zangador. Page 61 of 204
Table 6.2. Revenue management characteristics of selected special events taking place at the
hotel
Revenue management
characteristics
Types of special events
Congresses Conferences Corporate meetings
Number of participants 300-2000+ 100-500+ 5-20+
Length of stay (overnights) 3-5 1-3 0-2
Participants Members of associations,
organisations, unions
Members of associations,
organisations, unions
Employees of a company,
its partners
Type of participation Voluntary Voluntary Compulsory
Planning period Over a year Several months to more
than a year
Several days, often same
day
Frequency Once a year or less often Usually once a year but
could be less or more
frequent
Multiple times a year
Financing of participation Participants cover part of
their expenses
Participants cover part of
their expenses
Costs covered entirely by
the company
Price elasticity of participants High High Low
Additional revenues per
participant
Medium Medium High
Repeat organisation of the
event at the same hotel
Very rare Possible Yes
Incentive trips Seminars Weddings
Number of participants 10-30+ 20-100+ Varies greatly: 20-2000+
Length-of-stay (overnights) 1-3 0-2 0-1
Participants Employees of a company,
its distributors
Employees of a company,
its partners
The couple, relatives,
friends
Type of participation Voluntary Mixed – voluntary
and/or compulsory
Voluntary
Planning period Several weeks Several weeks Several weeks to several
months
Frequency Usually once a year Several times a year Once for that couple
Financing of participation Most expenses covered
by the company
Expenses entirely or
partially covered by the
company
Costs most often covered
by the couple/parents
Price elasticity of participants Medium Low Varies, but usually low
due to the purchase
occasion
Additional revenues per
participant
Low Low High
Repeat organisation of the
event in the same hotel
Yes Yes No – for the same couple
Note: Adapted from Bowdin, Allen, O’Tole, Harris & MacDonnell (2006), Davidson & Rogers (2006),
Ivanov & Zhechev (2011), Kotler, Bowen & Makens (2006), Shone & Parry (2004). The characteristics of
the special events are exemplary. They may vary by country, year, organiser and should therefore be
perceived only as indicative.
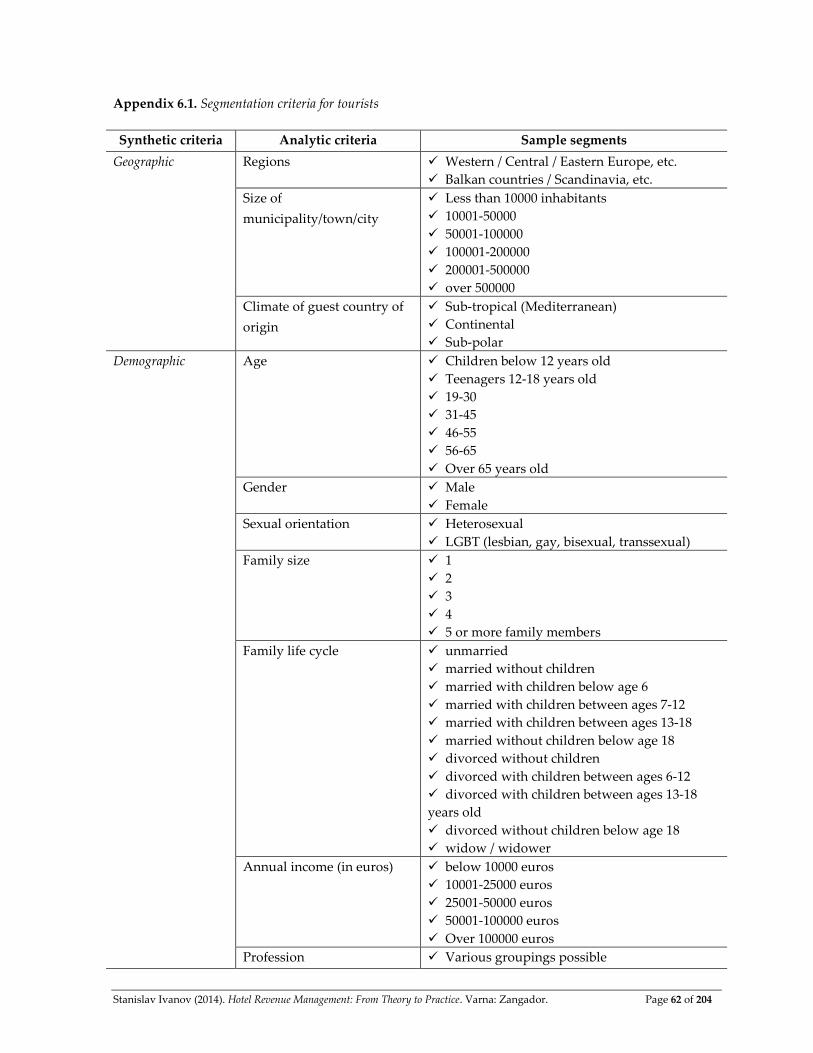
Stanislav Ivanov (2014). Hotel Revenue Management: From Theory to Practice. Varna: Zangador. Page 62 of 204
Appendix 6.1. Segmentation criteria for tourists
Synthetic criteria Analytic criteria Sample segments
Geographic Regions Western / Central / Eastern Europe, etc.
Balkan countries / Scandinavia, etc.
Size of
municipality/town/city
Less than 10000 inhabitants
10001-50000
50001-100000
100001-200000
200001-500000
over 500000
Climate of guest country of
origin
Sub-tropical (Mediterranean)
Continental
Sub-polar
Demographic Age Children below 12 years old
Teenagers 12-18 years old
19-30
31-45
46-55
56-65
Over 65 years old
Gender Male
Female
Sexual orientation Heterosexual
LGBT (lesbian, gay, bisexual, transsexual)
Family size 1
2
3
4
5 or more family members
Family life cycle unmarried
married without children
married with children below age 6
married with children between ages 7-12
married with children between ages 13-18
married without children below age 18
divorced without children
divorced with children between ages 6-12
divorced with children between ages 13-18
years old
divorced without children below age 18
widow / widower
Annual income (in euros) below 10000 euros
10001-25000 euros
25001-50000 euros
50001-100000 euros
Over 100000 euros
Profession Various groupings possible

Stanislav Ivanov (2014). Hotel Revenue Management: From Theory to Practice. Varna: Zangador. Page 63 of 204
Synthetic criteria Analytic criteria Sample segments
Education Without education
Primary
Secondary
Higher
Religion Christian Orthodox
Christian Catholics
Christian Protestant
Muslims
Hebrews
Hinduists, etc.
Nationality By country
Social class Higher class
Upper middle class
Middle class
Lower middle class
Skilled working class
Working class
Subsistence
Psychographic Personality Sporting personalities
Individualists
Gregarious
Ambitious
Authoritarian
Fashion followers
Trendsetters, etc.
Lifestyle VALS framework:
Innovators
Thinkers
Believers
Achievers
Strivers
Experiences
Makers
Survivors
Consumption lifestyle Psychocentric
Allocentric
Behavioural Purchase occasion Wedding
Birthday
Annual holiday, etc.
Benefits sought Save money
High quality
Relaxation
Save time, etc.
Purchase readiness Missing
Low
Medium
High
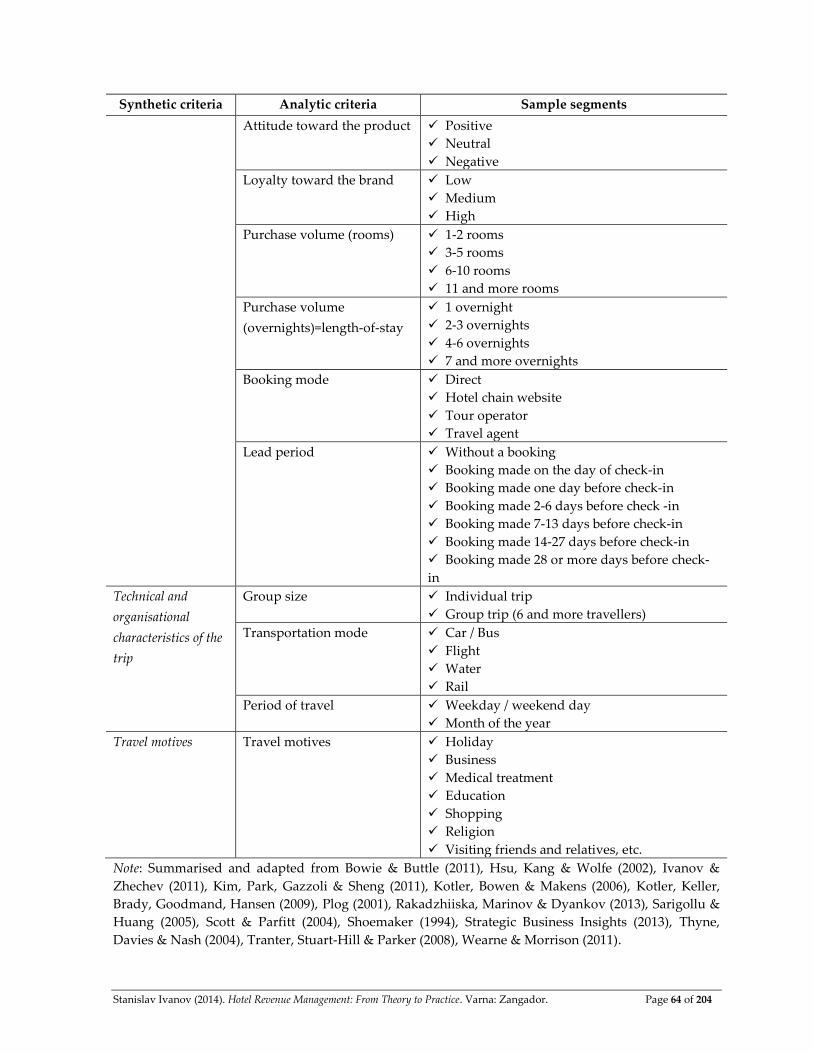
Stanislav Ivanov (2014). Hotel Revenue Management: From Theory to Practice. Varna: Zangador. Page 64 of 204
Synthetic criteria Analytic criteria Sample segments
Attitude toward the product Positive
Neutral
Negative
Loyalty toward the brand Low
Medium
High
Purchase volume (rooms) 1-2 rooms
3-5 rooms
6-10 rooms
11 and more rooms
Purchase volume
(overnights)=length-of-stay
1 overnight
2-3 overnights
4-6 overnights
7 and more overnights
Booking mode Direct
Hotel chain website
Tour operator
Travel agent
Lead period Without a booking
Booking made on the day of check-in
Booking made one day before check-in
Booking made 2-6 days before check -in
Booking made 7-13 days before check-in
Booking made 14-27 days before check-in
Booking made 28 or more days before check-
in
Technical and
organisational
characteristics of the
trip
Group size Individual trip
Group trip (6 and more travellers)
Transportation mode Car / Bus
Flight
Water
Rail
Period of travel Weekday / weekend day
Month of the year
Travel motives Travel motives Holiday
Business
Medical treatment
Education
Shopping
Religion
Visiting friends and relatives, etc.
Note: Summarised and adapted from Bowie & Buttle (2011), Hsu, Kang & Wolfe (2002), Ivanov &
Zhechev (2011), Kim, Park, Gazzoli & Sheng (2011), Kotler, Bowen & Makens (2006), Kotler, Keller,
Brady, Goodmand, Hansen (2009), Plog (2001), Rakadzhiiska, Marinov & Dyankov (2013), Sarigollu &
Huang (2005), Scott & Parfitt (2004), Shoemaker (1994), Strategic Business Insights (2013), Thyne,
Davies & Nash (2004), Tranter, Stuart-Hill & Parker (2008), Wearne & Morrison (2011).
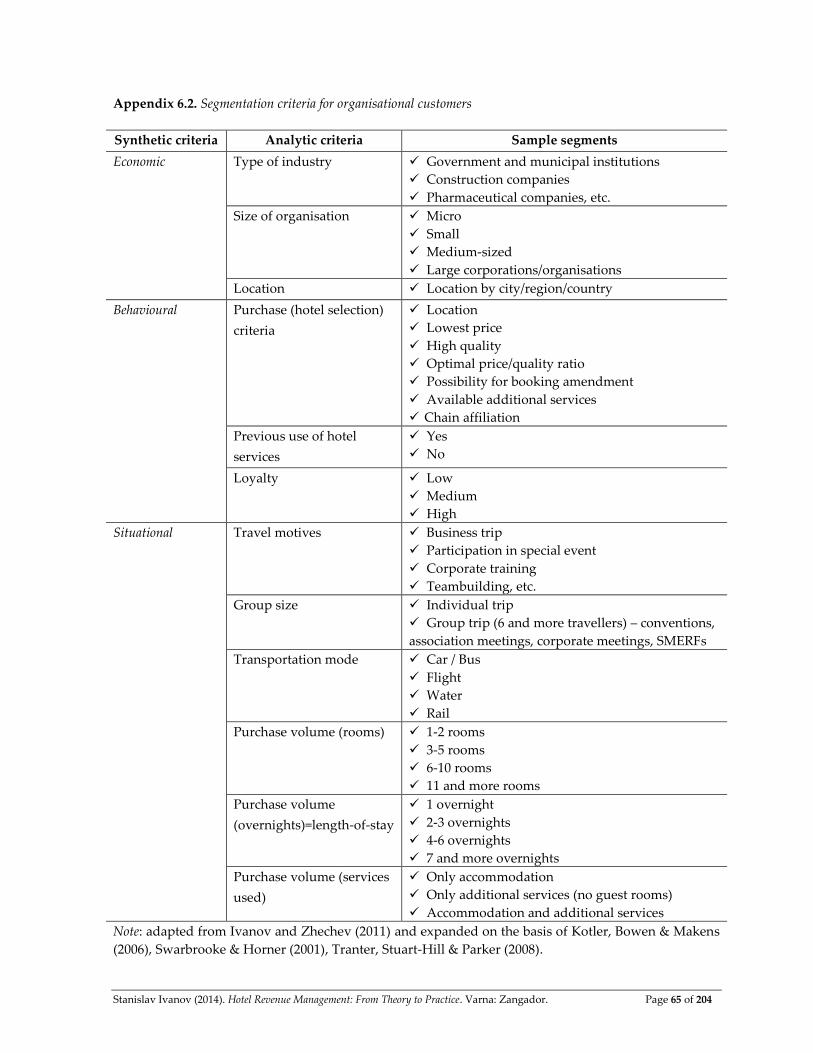
Stanislav Ivanov (2014). Hotel Revenue Management: From Theory to Practice. Varna: Zangador. Page 65 of 204
Appendix 6.2. Segmentation criteria for organisational customers
Synthetic criteria Analytic criteria Sample segments
Economic Type of industry Government and municipal institutions
Construction companies
Pharmaceutical companies, etc.
Size of organisation Micro
Small
Medium-sized
Large corporations/organisations
Location Location by city/region/country
Behavioural Purchase (hotel selection)
criteria
Location
Lowest price
High quality
Optimal price/quality ratio
Possibility for booking amendment
Available additional services
Chain affiliation
Previous use of hotel
services
Yes
No
Loyalty Low
Medium
High
Situational Travel motives Business trip
Participation in special event
Corporate training
Teambuilding, etc.
Group size Individual trip
Group trip (6 and more travellers) – conventions,
association meetings, corporate meetings, SMERFs
Transportation mode Car / Bus
Flight
Water
Rail
Purchase volume (rooms) 1-2 rooms
3-5 rooms
6-10 rooms
11 and more rooms
Purchase volume
(overnights)=length-of-stay
1 overnight
2-3 overnights
4-6 overnights
7 and more overnights
Purchase volume (services
used)
Only accommodation
Only additional services (no guest rooms)
Accommodation and additional services
Note: adapted from Ivanov and Zhechev (2011) and expanded on the basis of Kotler, Bowen & Makens
(2006), Swarbrooke & Horner (2001), Tranter, Stuart-Hill & Parker (2008).
Stanislav Ivanov (2014). Hotel Revenue Management: From Theory to Practice. Varna: Zangador. Page 66 of 204
Chapter 7
INFORMATION PROVISION FOR THE REVENUE MANAGEMENT
PROCESS
A good revenue management decision is an informed decision. As discussed in
Chapters 3 and 4 the revenue manager needs very detailed data on various statistics
in order to make a justified decision which are provided by the hotel’s marketing
information system. Kotler et al. (2009: 173) define the marketing information system
as the set of “people, equipment and procedures to gather, sort, analyse, evaluate and
distribute needed, timely and accurate information to marketing decision makers”.
Similar to market segmentation, the marketing information system has been widely
discussed in the literature (Ivanov & Zhechev 2011; Kotler et al. 2009; Kotler, Bowen &
Makens, 2006); that’s why this book reflects only those issues related to the hotel
revenue management.
The revenue manager will base his decisions on data about hotel’s internal
(operations), micro- (customers, competitors, distributors) and macroenvironment
(PESTEL factors). Table 7.1 below summaries the revenue management related
statistics and the sources for their provision by data dimension. The statistics and
sources included in Table 7.1 are not comprehensive and should be considered only
as indicative. In practice the revenue manager could use more statistics from a greater
variety of sources. The revenue management metrics discussed in Chapter 5 are not
included in Table 7.1 because they are composite metrics calculated with the help of
the operational data provided by the marketing information system. Revenue
management data should fulfill the following requirements:
Accuracy – the data reflect truly the real situation.
Timeliness – the data are provided when necessary.
Sufficiency – the provided data should be detailed enough for the
revenue manager to make an informed decision – not too few as no in-depth analysis
is possible and not too much because it may lead to information overload.
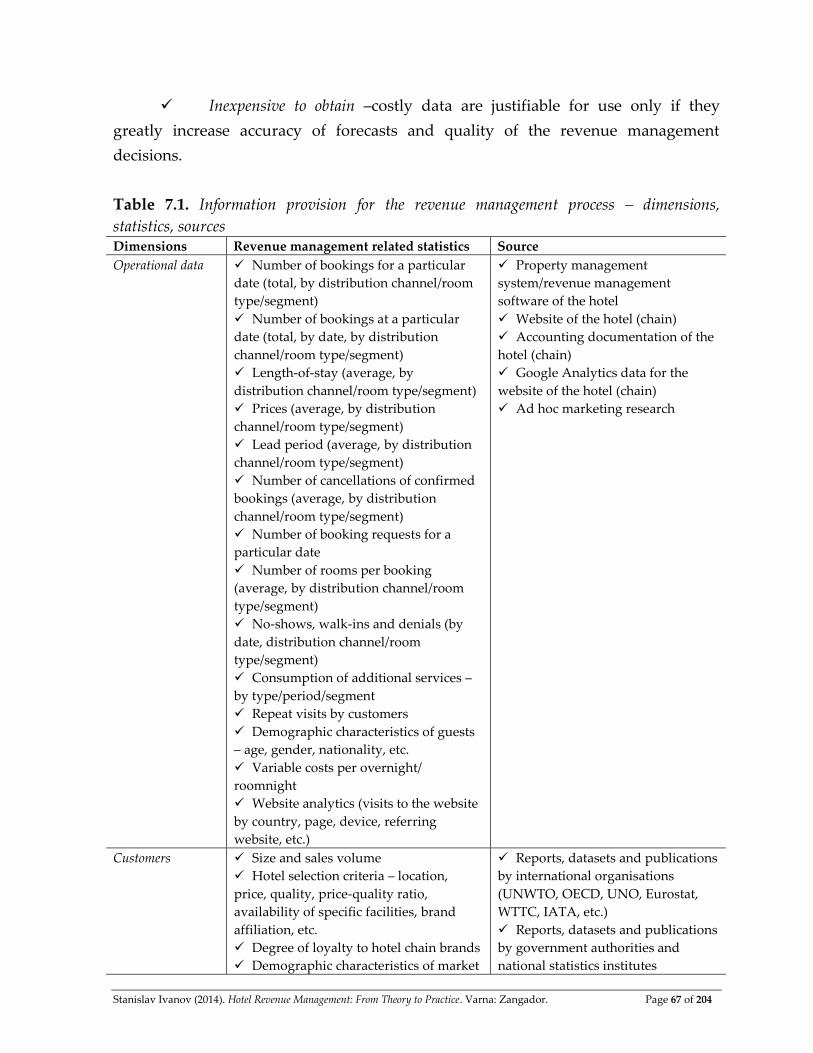
Stanislav Ivanov (2014). Hotel Revenue Management: From Theory to Practice. Varna: Zangador. Page 67 of 204
Inexpensive to obtain –costly data are justifiable for use only if they
greatly increase accuracy of forecasts and quality of the revenue management
decisions.
Table 7.1. Information provision for the revenue management process – dimensions,
statistics, sources Dimensions Revenue management related statistics Source
Operational data Number of bookings for a particular
date (total, by distribution channel/room
type/segment)
Number of bookings at a particular
date (total, by date, by distribution
channel/room type/segment)
Length-of-stay (average, by
distribution channel/room type/segment)
Prices (average, by distribution
channel/room type/segment)
Lead period (average, by distribution
channel/room type/segment)
Number of cancellations of confirmed
bookings (average, by distribution
channel/room type/segment)
Number of booking requests for a
particular date
Number of rooms per booking
(average, by distribution channel/room
type/segment)
No-shows, walk-ins and denials (by
date, distribution channel/room
type/segment)
Consumption of additional services –
by type/period/segment
Repeat visits by customers
Demographic characteristics of guests
– age, gender, nationality, etc.
Variable costs per overnight/
roomnight
Website analytics (visits to the website
by country, page, device, referring
website, etc.)
Property management
system/revenue management
software of the hotel
Website of the hotel (chain)
Accounting documentation of the
hotel (chain)
Google Analytics data for the
website of the hotel (chain)
Ad hoc marketing research
Customers Size and sales volume
Hotel selection criteria – location,
price, quality, price-quality ratio,
availability of specific facilities, brand
affiliation, etc.
Degree of loyalty to hotel chain brands
Demographic characteristics of market
Reports, datasets and publications
by international organisations
(UNWTO, OECD, UNO, Eurostat,
WTTC, IATA, etc.)
Reports, datasets and publications
by government authorities and
national statistics institutes

Stanislav Ivanov (2014). Hotel Revenue Management: From Theory to Practice. Varna: Zangador. Page 68 of 204
Dimensions Revenue management related statistics Source
segments
Booking characteristics – lead period,
length-of-stay, group size, travel period
Price elasticity and willingness-to-pay
by segment
Preferred distribution channels
Reports, datasets and publications
by national, regional and local
tourism organisations (destination
marketing organisations, convention
and visitors bureaus, tourism boards,
tourism councils, associations, etc.)
Hospitality industry reports
(Keynote, Mintel, Euromonitor,
Datamonitor)
Websites of competitors,
distributors and customers
Social media pages/profiles of
competitors, distributors and
customers (Facebook, Twitter, Google+,
LinkedIn, Foursquare, YouTube,
TripAdvisor, etc.)
Annual financial statements of
competitors and distributors
Meta search engines (Kayak.com,
Hotelscombined.com, Trivago.com, etc.)
Visits to the office of the
distributor or the customers, to the
competing hotels
Advertisements of competitors
and distributors
Travel fairs (e.g. ITB-Berlin,
World Travel Market-London, etc.)
Blogs, forums, technology reports
Consulting companies’ bulletins
Academic publications
Trade press publications
Legislation databases
Ad hoc marketing research
Competitors Size and sales volume
Category, location, offered services
Prices and booking terms
Market positioning
Distribution channels used
Current promotions
Distributors Business model – merchant or agency
Levels of commissions/mark-ups
Number and geographic coverage of
hotels on their websites
Size and sales volume
Number of offices
Geographic distribution of customers
Market positioning
Current promotions
Macroenvironment
(PESTEL factors)
Trends, developments and statistical data
on different factors:
Political
Economic
Socio-cultural and demographic
Technological
Environmental
Legal
Data may be obtained from different sources. The internal accounting system of the
hotel (chain) and its property and revenue management software are the primary
sources of operational data. Mostly operational data are either readily available or
easy to obtain/calculate. They are also visualised by the RM software through the use
of appropriate graphs (e.g. the booking curves to be discussed in the next Chapter 8)
which facilitate the decision-making process. It is important that all bookings and
purchases of guests are registered in the internal database of the hotel in a timely
manner so that the revenue manager and the managers of different revenue centres in
the hotel have real-time information about the financial and operational statistics for
their respective departments which will allow them to make relevant managerial

Stanislav Ivanov (2014). Hotel Revenue Management: From Theory to Practice. Varna: Zangador. Page 69 of 204
decisions. This requires the hotel to have an elaborate property and revenue
management system that integrates all departments and assures real-time
connectivity with its website and all POS terminals in the hotel. The use of QR codes
and RFID tags/chips could facilitate the automatic entry and reading of data
into/from the information system.
Information sources on customers, distributors, competitors and the
macroenvironment are very diverse in terms of type and characteristics. They vary
from free (e.g. most of the statistical data by the national statistics institutes) to paid
(e.g. Mintel industry reports), from highly academic (articles in academic journals) to
very pragmatic (articles in the trade press), from very general (publications by
international organisations) to very specific (websites of competitors), from sources of
quantitative data (statistical websites) to qualitative evaluations (blogs). Websites of
competitors and distributors and their social media profiles are an invaluable source
of information regarding their prices, market positioning strategies, current
promotions, etc. Travel fairs are an excellent opportunity for the hotel (chain) to stay
current with the latest developments in the industry.
Some additional points need to be considered in terms of data collection. First, the
external sources of information should be assessed for their credibility. Official data by
national statistics institutes and international organisations, industry reports (by
Mintel, Keynote, Euromonitor, Datamonitor) and academic publications are usually
considered to be of highest credibility due to their systematic scientific research
approach to data collection, analysis and interpretation. Blogs and forums, in this
regard, have the lowest credibility but are a good source of information for current
trends in the industry. Second, if information is not obtainable via internal or external
sources or if it is not detailed enough or entirely relevant, the revenue manager may
undertake or commission a marketing research (Zikmund & Babin, 2013) and social
media could be actively used in the data collection process (Illum, Ivanov, Liang,
2010). Finally, the revenue manager is advised to apply triangulation if this is
financially feasible, i.e. to try obtaining one and the same piece of information from
different sources to be sure of its reliability and credibility. In any case, the quality of
the revenue management decisions will depend on the quality of the data and
information generated by the hotel marketing information system.
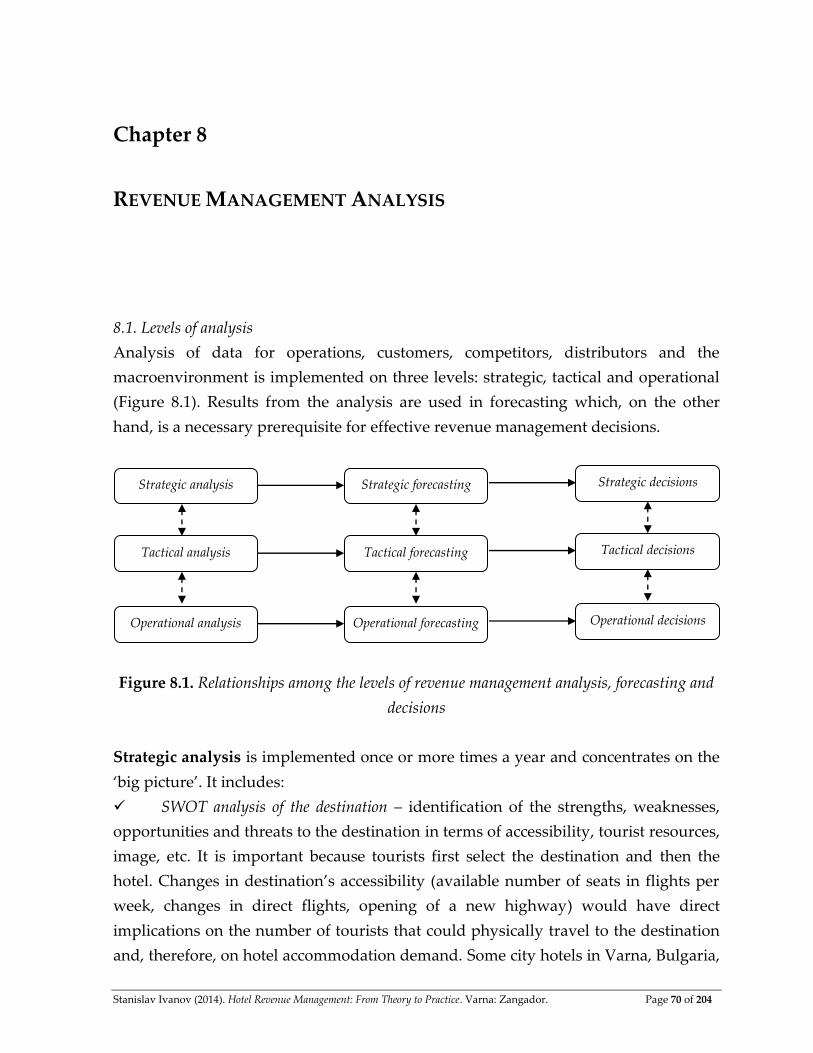
Stanislav Ivanov (2014). Hotel Revenue Management: From Theory to Practice. Varna: Zangador. Page 70 of 204
Chapter 8
REVENUE MANAGEMENT ANALYSIS
8.1. Levels of analysis
Analysis of data for operations, customers, competitors, distributors and the
macroenvironment is implemented on three levels: strategic, tactical and operational
(Figure 8.1). Results from the analysis are used in forecasting which, on the other
hand, is a necessary prerequisite for effective revenue management decisions.
Figure 8.1. Relationships among the levels of revenue management analysis, forecasting and
decisions
Strategic analysis is implemented once or more times a year and concentrates on the
‘big picture’. It includes:
SWOT analysis of the destination – identification of the strengths, weaknesses,
opportunities and threats to the destination in terms of accessibility, tourist resources,
image, etc. It is important because tourists first select the destination and then the
hotel. Changes in destination’s accessibility (available number of seats in flights per
week, changes in direct flights, opening of a new highway) would have direct
implications on the number of tourists that could physically travel to the destination
and, therefore, on hotel accommodation demand. Some city hotels in Varna, Bulgaria,
Strategic analysis
Operational analysis
Tactical analysis
Operational forecasting
Tactical forecasting
Strategic forecasting
Operational decisions
Tactical decisions
Strategic decisions
Stanislav Ivanov (2014). Hotel Revenue Management: From Theory to Practice. Varna: Zangador. Page 71 of 204
for example, experienced more than a 15% annual increase in their occupancy rates in
2005 and 2006 compared to 2003 and 2004 after the opening of direct flights from
Budapest to Varna in June 2004 by Malev Airlines and from Vienna in 2005 by
Austrian Airlines (personal communication by the author with hotel managers in
Varna, Bulgaria). Before these direct links were established, Varna was accessible
only by direct charter flights in the summer and regular scheduled flights via the
country’s capital, Sofia. Increased accessibility of the destination attracted more
tourists during the non-summer months. Furthermore, the development of more
man-made tourist attractions (e.g. amusement parks) or archaeological discoveries
may also influence positively the demand to the destination.
Tourism demand to the destination should be analysed in terms of volume
(number of arrivals/roomnights/overnights), spending (total revenues from tourism,
average spending per tourist), structure (by gender, nationality, transportation mode,
consumption lifestyle and other segmentation criteria from Table 6.1.) and
seasonality. Analysis of demand would reveal the trends in arrivals, average
spending per tourist, seasonal patterns in tourist arrivals, and other tendencies that
shape demand for the product of the hotel. Changes in the prevailing segments
coming to the destination might be finding the hotel unprepared. Bulgarian seaside
resorts, for example, until the 1990s targeted mostly Western European charter
markets – tourists arrived at the destination by flight, transfers from/to the airport
were provided by bus which did not stay at the hotel. This eliminated the necessity
for hotels to have large parking areas. After Bulgaria’s entry into the European Union
in January 2007, many seaside hotels and resorts in the country heavily targeted the
Romanian market and the number of arrivals from Romania increased threefold in
just five years – from 612630 visitors in 2004 to 1769194 in 2008 (NSI, 2013a).
However, Romanian tourists arrived in the country by car, not by plane or bus, which
increased dramatically the demand for parking lots – something the seaside resorts in
Bulgaria found difficult to provide. Parking has now been transformed into a selling
proposition and competitive advantage for hotels for this market segment.
Room supply at the destination must be analysed on several levels – dynamics of
total room supply (construction of new properties, closing or change of the capacity
of existing ones) and structure by type and category of accommodation
establishments. Room supply, its type and category structure determines the
competition at the destination. Usually the increase in room supply is negatively
evaluated by existing hotels because it increases the competitive rivalry for guests.

Stanislav Ivanov (2014). Hotel Revenue Management: From Theory to Practice. Varna: Zangador. Page 72 of 204
However, successful marketing of a specific type of hotel product might require a
critical mass of tourist development and room supply. A single casino hotel cannot
create a casino destination – there should be several such (competing) hotels in order
the destination to be able to attract a significant enough number of tourists whose
primary motive is gambling. Otherwise a casino will just be an additional
entertainment service provided to hotel guests whose primary travel motive is other
than gambling. Development of Las Vegas, Nevada with its 150,481 room inventory
in 2012, 39727022 visitors, 9.4 billion USD gambling revenues, and occupancy rates
consistently higher than 80% (LVCVA, 2013) is a good example of this direction. Type
and category structure of accommodation establishments shape the image of the
destination and the market segments it will attract – prevailing campsites and 2-3-star
hotels will create an image of a cheap destination, thus depressing the prices at the 5-
star properties in the destination.
SWOT analysis of the hotel focuses on its strengths, weaknesses, opportunities
and threats. Strengths and weaknesses stem from its internal environment (location,
product, pricing, distribution, positioning, image, cost structure, financial
management, human resources) while the opportunities and threats stem from its
external environment (macro- and microenvironment). The revenue manager must be
familiar with the strengths of the hotel in order to capitalise on them as well as its
weaknesses so their negative consequences are mitigated or even transformed into a
competitive advantage. A hotel in a seaside resort located far from the beach could
target market segments that value tranquillity and relaxation while a hotel on the
promenade would charge premium prices for its sea-view rooms.
Strategic analysis of the revenue management metrics of the hotel – its goal is to
evaluate the long-term dynamics of RevPAR, ADR, occupancy, GOPPAR and the
other RM metrics, and to identify the factors that influence them. Multivariate
regression analysis could reveal the relationship between the dynamics of the RM
metrics and a number of explanatory variables – room supply at the destination,
arrivals, hotel’s prices, competitors’ prices, special events organised in the destination
and/or the hotel, etc. Results of this analysis will be then used to fuel the forecasts of
the RM metrics.
The time scale of the tactical analysis is up to one year. It looks at short-term changes
in room supply and tourism demand, competitors’ pricing, commissions and booking
terms (release periods, cancellation deadlines, payment terms), seasonality of
Stanislav Ivanov (2014). Hotel Revenue Management: From Theory to Practice. Varna: Zangador. Page 73 of 204
demand, booking patterns (lead period, travel period), short-term dynamics of the
RM metrics, etc. The goal is to identify short-term trends, market opportunities,
evaluation of the efficiency of different distribution channels. For seasonal hotels
tactical analysis might reveal, for instance, that bookings for the main tourist season
for the current year are accruing faster and earlier than in the previous year which
gives ground for higher prices and less use of promotional rates. The analysis might
also show that a particular tour operator utilised only 40% of its allotment during the
year, which could serve as a reason to decrease it for the subsequent season/year. A
special case of the tactical analysis would be the annual review of the revenue
management process in the hotel (chain) – review of the RM decisions made during
the year and their impact on the dynamics of the RM metrics.
Operational analysis has the shortest time horizon – days or weeks. At this level of
analysis, room supply is constant so the analysis focuses mostly on competitors’
prices, demand, daily/weekly changes in RM metrics. It is performed daily and
weekly by the revenue manager/night auditor and discussed with the general
manager, the front office and managers of the other revenue generating centres of the
hotel. This analysis is the basis for opening/closing of dates for sale, opening/closing
of price levels, changes in the OTAs’ allotments (e.g. on Booking.com) and
overbooking levels, or last-minute promotions.
Strategic, tactical and operational analyses are interconnected. Figure 8.2 illustrates
sample hypothetical curves of the RevPAR dynamic on the three levels. Strategic
analysis reveals the trend in annual RevPAR, tactical analysis – the monthly RevPAR
seasonal dynamic while operational analysis – the daily RevPAR. Each level could be
perceived as a closer ‘zoom’ in the upper level of the analysis (the circle with the
dashed lines in b) and c)), or as an aggregation of the preceding lower level.
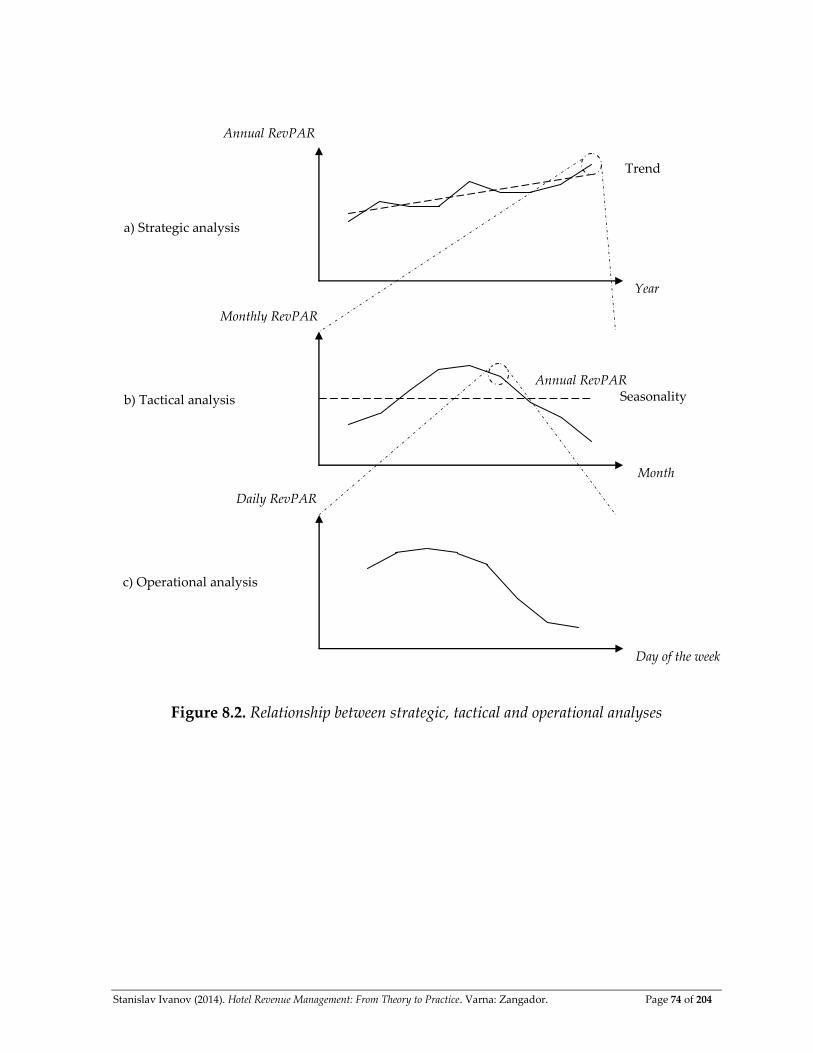
Stanislav Ivanov (2014). Hotel Revenue Management: From Theory to Practice. Varna: Zangador. Page 74 of 204
Figure 8.2. Relationship between strategic, tactical and operational analyses
Annual RevPAR
Year
Trend
Monthly RevPAR
Month
Seasonality
Daily RevPAR
Day of the week
Annual RevPAR
a) Strategic analysis
b) Tactical analysis
c) Operational analysis
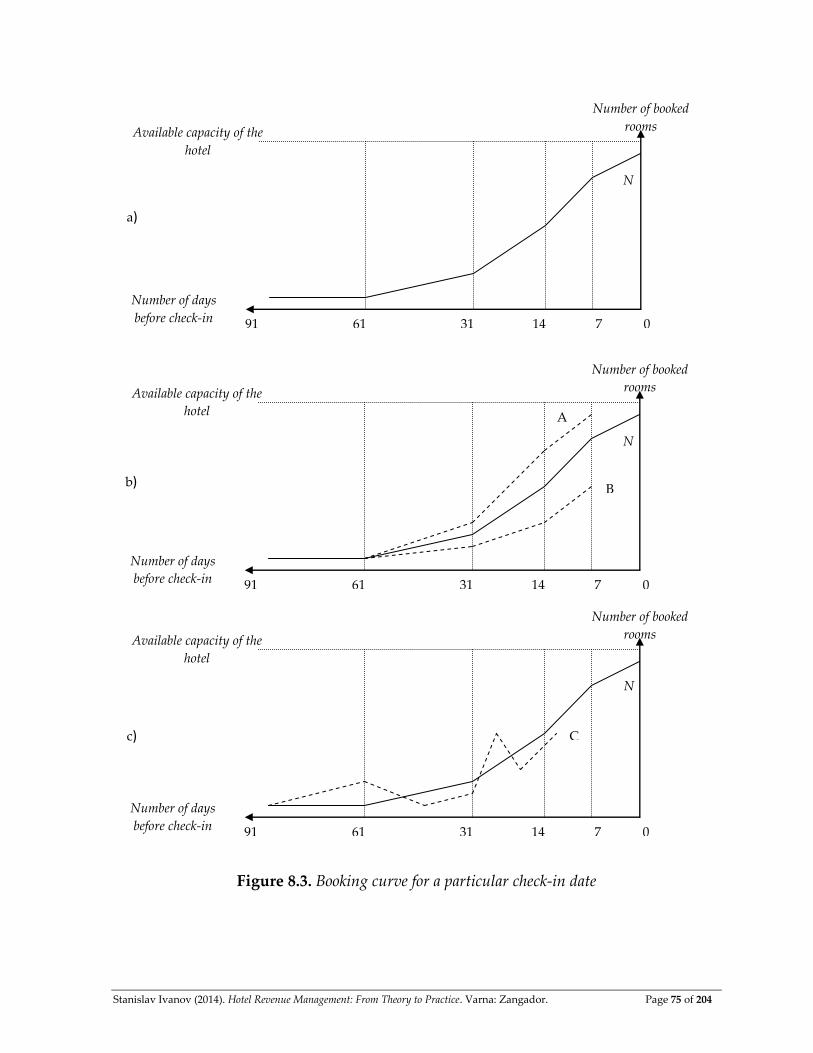
Stanislav Ivanov (2014). Hotel Revenue Management: From Theory to Practice. Varna: Zangador. Page 75 of 204
Figure 8.3. Booking curve for a particular check-in date
Number of days
before check-in
Number of booked
rooms
91 14 31 61 7 0
Available capacity of the
hotel
Number of days
before check-in
Number of booked
rooms
91 14 31 61 7 0
Available capacity of the
hotel
В
А
Number of days
before check-in
Number of booked
rooms
91 14 31 61 7 0
Available capacity of the
hotel
С
a)
b)
c)
N
N
N
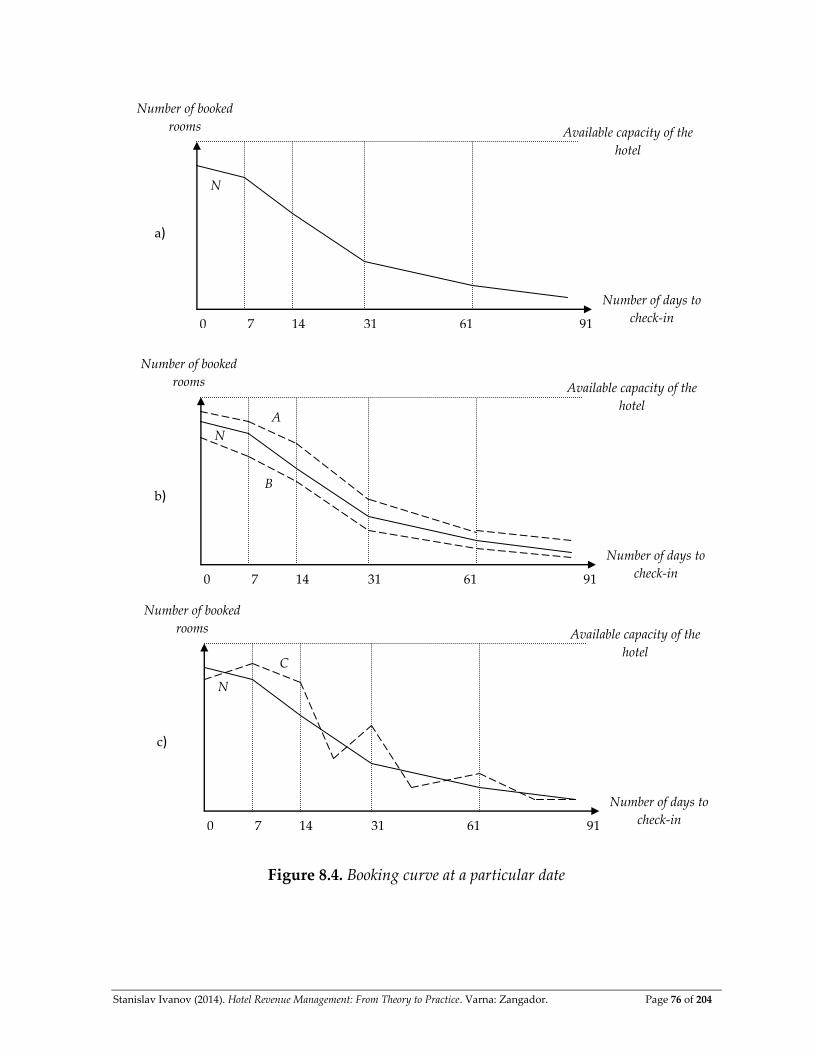
Stanislav Ivanov (2014). Hotel Revenue Management: From Theory to Practice. Varna: Zangador. Page 76 of 204
Figure 8.4. Booking curve at a particular date
Number of days to
check-in
Number of booked
rooms
91 14 31 61 7 0
Available capacity of the
hotel
Number of days to
check-in
Number of booked
rooms
91 14 31 61 7 0
Available capacity of the
hotel
Number of days to
check-in
Number of booked
rooms
91 14 31 61 7 0
Available capacity of the
hotel
N
N
N
A
B
C
a)
c)
b)
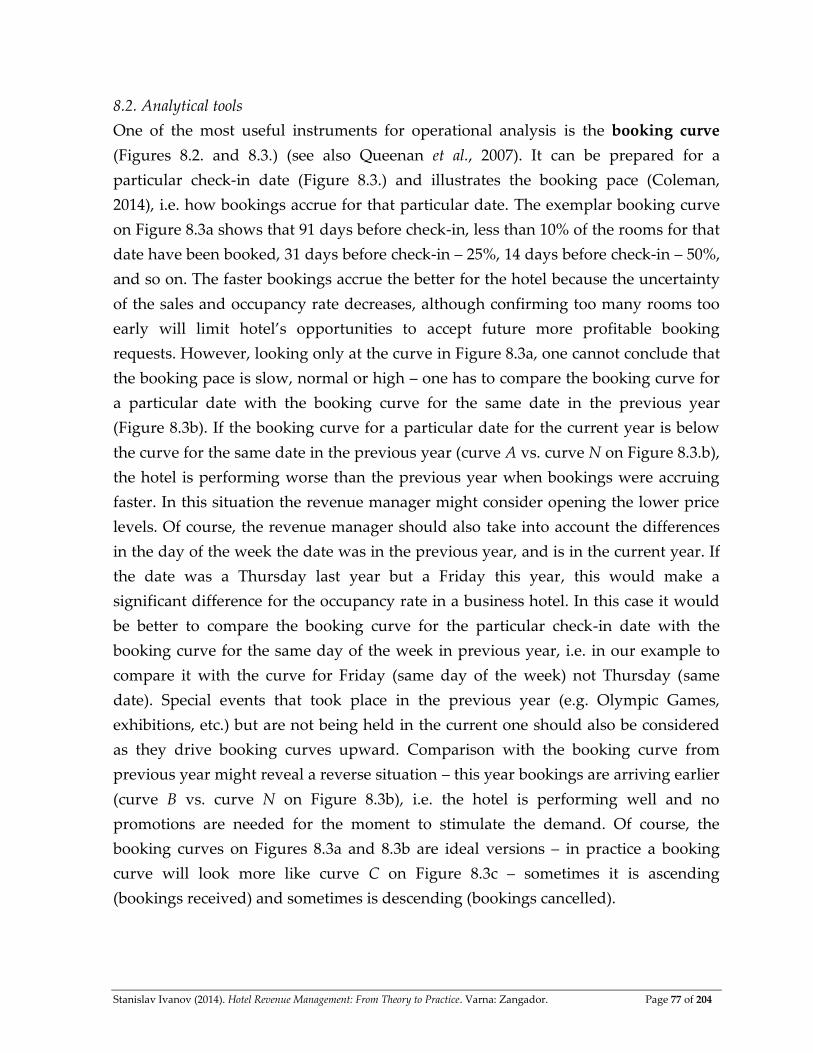
Stanislav Ivanov (2014). Hotel Revenue Management: From Theory to Practice. Varna: Zangador. Page 77 of 204
8.2. Analytical tools
One of the most useful instruments for operational analysis is the booking curve
(Figures 8.2. and 8.3.) (see also Queenan et al., 2007). It can be prepared for a
particular check-in date (Figure 8.3.) and illustrates the booking pace (Coleman,
2014), i.e. how bookings accrue for that particular date. The exemplar booking curve
on Figure 8.3a shows that 91 days before check-in, less than 10% of the rooms for that
date have been booked, 31 days before check-in – 25%, 14 days before check-in – 50%,
and so on. The faster bookings accrue the better for the hotel because the uncertainty
of the sales and occupancy rate decreases, although confirming too many rooms too
early will limit hotel’s opportunities to accept future more profitable booking
requests. However, looking only at the curve in Figure 8.3a, one cannot conclude that
the booking pace is slow, normal or high – one has to compare the booking curve for
a particular date with the booking curve for the same date in the previous year
(Figure 8.3b). If the booking curve for a particular date for the current year is below
the curve for the same date in the previous year (curve A vs. curve N on Figure 8.3.b),
the hotel is performing worse than the previous year when bookings were accruing
faster. In this situation the revenue manager might consider opening the lower price
levels. Of course, the revenue manager should also take into account the differences
in the day of the week the date was in the previous year, and is in the current year. If
the date was a Thursday last year but a Friday this year, this would make a
significant difference for the occupancy rate in a business hotel. In this case it would
be better to compare the booking curve for the particular check-in date with the
booking curve for the same day of the week in previous year, i.e. in our example to
compare it with the curve for Friday (same day of the week) not Thursday (same
date). Special events that took place in the previous year (e.g. Olympic Games,
exhibitions, etc.) but are not being held in the current one should also be considered
as they drive booking curves upward. Comparison with the booking curve from
previous year might reveal a reverse situation – this year bookings are arriving earlier
(curve B vs. curve N on Figure 8.3b), i.e. the hotel is performing well and no
promotions are needed for the moment to stimulate the demand. Of course, the
booking curves on Figures 8.3a and 8.3b are ideal versions – in practice a booking
curve will look more like curve C on Figure 8.3c – sometimes it is ascending
(bookings received) and sometimes is descending (bookings cancelled).
Stanislav Ivanov (2014). Hotel Revenue Management: From Theory to Practice. Varna: Zangador. Page 78 of 204
Figure 8.4 depicts a different perspective of the booking curves – booking curve at a
particular date. It illustrates how many booked rooms the hotel has received up to a
particular moment for various dates in the future. Similar to the previous type, the
booking curve at a particular date for the current year must be compared with the
same curve for the previous year (Figure 8.4.b). If the current curve is above the curve
from the previous year (curve B vs. curve N) the hotel has received up to this date
more bookings for future dates than last year, i.e. it is performing better. To the
contrary, if the current curve N is below the previous year’s curve A the revenue
manager should pay attention to the reasons and undertake necessary actions. In
practice, this booking curve would look more like curve C (Figure 8.4c) – more rooms
booked for some dates, less for others.
The two booking curves are conceptually different. The booking curve for a particular
check-in date (Figure 8.3) shows the dynamics of booked rooms for that check-in
date, while the booking curve at a particular date (Figure 8.4) shows the future
bookings the hotel has received so far to this date. Nevertheless, both types of curves
could be used to analyse customers’ booking behaviour – how many days in advance
before check-in they make a booking at the hotel, i.e. the booking lead time. This
provides information about the timing of promotions. Looking at curve N on Figure
8.3 we could definitely say that offering a promotional rate more than 91 days (3
months) before the check-in date would not be reasonable as it is too early – it might
not be noticed and would not have significant impact on bookings. It would be better
if the hotel times the promotion 14-45 days before the check-in date – not too early so
it would be noticed by potential customers and not too late in order to allow them to
use the promotion. Of course, the hotel might use a more rigorous pricing schedule
and offer special prices for early bookings made a certain minimum number of days
before check-in (so called ‘early bird’ rates), but they would be considered as part of
hotel’s regular pricing strategy rather than as promotions.
Stanislav Ivanov (2014). Hotel Revenue Management: From Theory to Practice. Varna: Zangador. Page 79 of 204
Chapter 9
REVENUE MANAGEMENT FORECASTING
9.1. Overview of revenue management forecasting
Forecasting is a key stage in the revenue management process as forecasts feed and
determine the decision-making process (Figure 8.1). Therefore, a high proportion of
the related research literature is dedicated to forecasting from a theoretical and
methodological perspective (Burger et al., 2001; Frechtling, 2001; Tranter, Stuart-Hill
& Parker, 2008; Weatherford, Kimes & Scott, 2001; Weatherford & Kimes, 2003,
among others), summarised in Table 9.1. Review of available literature on hotel
revenue management reveals that most studies have dealt with two main topics:
forecasting demand (e.g. Frechtling, 2001; Lim & Chan, 2011; Song, Witt & Li, 2009)
and forecasting RM metrics and operational data (El Gayar et al., 2011; Haensel &
Koole, 2011; Morales & Wang, 2010; Zakhary et al., 2011). This is justified since
volume, structure and characteristics of demand and forecasts for occupancy rate,
number of arrivals, cancellations, no shows, RevPAR, ADR and other operational
statistics are of utmost importance to a hotel’s revenue management system.
However, revenue management decisions in a particular hotel are influenced by its
competitors’ decisions and actions and the developments in the external macro- and
micro environment (see the impacts on the RM system on Figure 3.1). Therefore it is
surprising that a limited number of papers, most notably Yüksel (2007), discuss issues
related to forecasting competitive actions and the external environment which
remains a neglected field of study.
9.2. Levels of forecasting
Forecasting is based on the results of the revenue management analysis. That’s why
we distinguish the same levels of forecasting as in the analysis – strategic, tactical and
operational forecasting as depicted in Figure 8.1. On the other hand, forecasts help
revenue managers make decisions on the same respective levels.
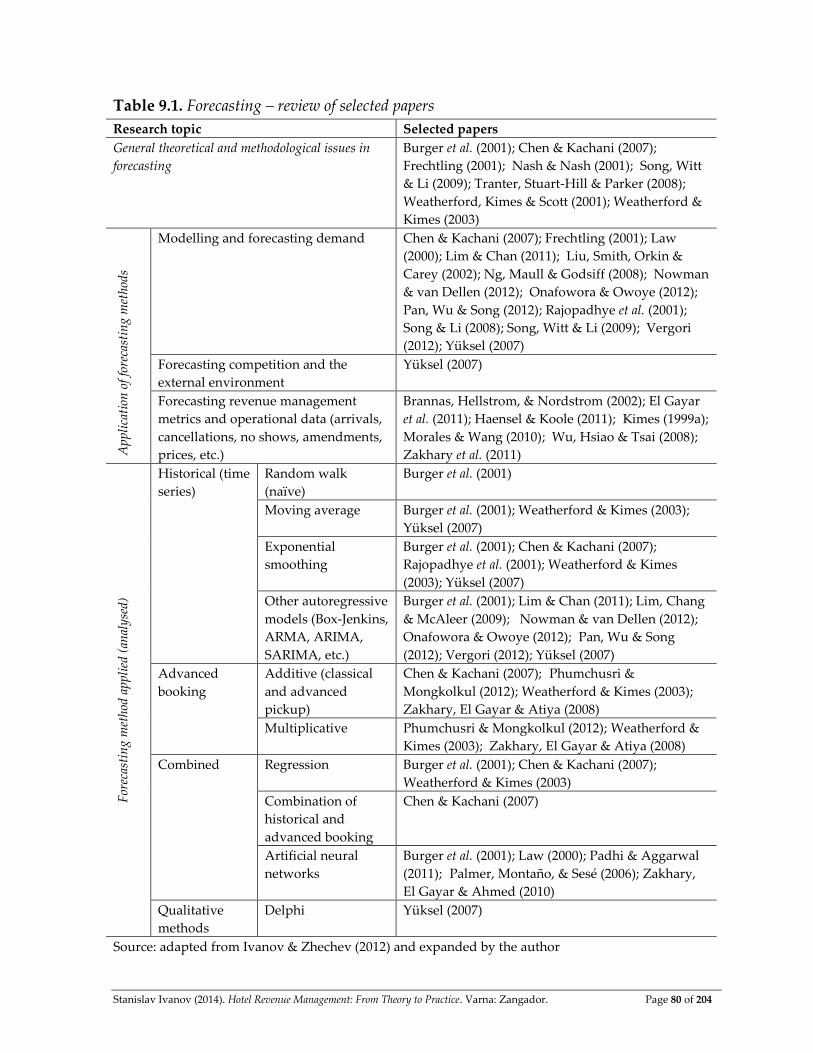
Stanislav Ivanov (2014). Hotel Revenue Management: From Theory to Practice. Varna: Zangador. Page 80 of 204
Table 9.1. Forecasting – review of selected papers
Source: adapted from Ivanov & Zhechev (2012) and expanded by the author
Research topic Selected papers
General theoretical and methodological issues in
forecasting
Burger et al. (2001); Chen & Kachani (2007);
Frechtling (2001); Nash & Nash (2001); Song, Witt
& Li (2009); Tranter, Stuart-Hill & Parker (2008);
Weatherford, Kimes & Scott (2001); Weatherford &
Kimes (2003)
App
lica
tion
of
fore
cast
ing
met
hods
Modelling and forecasting demand Chen & Kachani (2007); Frechtling (2001); Law
(2000); Lim & Chan (2011); Liu, Smith, Orkin &
Carey (2002); Ng, Maull & Godsiff (2008); Nowman
& van Dellen (2012); Onafowora & Owoye (2012);
Pan, Wu & Song (2012); Rajopadhye et al. (2001);
Song & Li (2008); Song, Witt & Li (2009); Vergori
(2012); Yüksel (2007)
Forecasting competition and the
external environment
Yüksel (2007)
Forecasting revenue management
metrics and operational data (arrivals,
cancellations, no shows, amendments,
prices, etc.)
Brannas, Hellstrom, & Nordstrom (2002); El Gayar
et al. (2011); Haensel & Koole (2011); Kimes (1999a);
Morales & Wang (2010); Wu, Hsiao & Tsai (2008);
Zakhary et al. (2011)
For
ecas
tin
g m
etho
d ap
plie
d (a
nal
ysed
)
Historical (time
series)
Random walk
(naïve)
Burger et al. (2001)
Moving average Burger et al. (2001); Weatherford & Kimes (2003);
Yüksel (2007)
Exponential
smoothing
Burger et al. (2001); Chen & Kachani (2007);
Rajopadhye et al. (2001); Weatherford & Kimes
(2003); Yüksel (2007)
Other autoregressive
models (Box-Jenkins,
ARMA, ARIMA,
SARIMA, etc.)
Burger et al. (2001); Lim & Chan (2011); Lim, Chang
& McAleer (2009); Nowman & van Dellen (2012);
Onafowora & Owoye (2012); Pan, Wu & Song
(2012); Vergori (2012); Yüksel (2007)
Advanced
booking
Additive (classical
and advanced
pickup)
Chen & Kachani (2007); Phumchusri &
Mongkolkul (2012); Weatherford & Kimes (2003); Zakhary, El Gayar & Atiya (2008)
Multiplicative Phumchusri & Mongkolkul (2012); Weatherford &
Kimes (2003); Zakhary, El Gayar & Atiya (2008)
Combined Regression Burger et al. (2001); Chen & Kachani (2007);
Weatherford & Kimes (2003)
Combination of
historical and
advanced booking
Chen & Kachani (2007)
Artificial neural
networks
Burger et al. (2001); Law (2000); Padhi & Aggarwal
(2011); Palmer, Montaño, & Sesé (2006); Zakhary,
El Gayar & Ahmed (2010)
Qualitative
methods
Delphi Yüksel (2007)
Stanislav Ivanov (2014). Hotel Revenue Management: From Theory to Practice. Varna: Zangador. Page 81 of 204
Strategic forecasting in the revenue management process includes forecasting the
long-term dynamic of the following:
Demand to the destination – number of arrivals and overnights, tourists’
expenses (total and for accommodation), preferences, etc.
Room supply at the destination – number of rooms, changes in room/bed
capacity of the destination, changes in the structure of room/bed capacity by category
and type of accommodation establishment.
Destination’s attractiveness and accessibility – changes in transport connections to
the destination, opening/closing of major tourists resources driving tourism demand
to the destination (theme park, convention centre, enterprise, pilgrimage centre, etc.),
destination image.
Strategic forecasts of the revenue management metrics of the hotel – RevPAR, ADR,
occupancy, GOPPAR and other RM metrics used by the revenue manager.
The goal of strategic forecasting is to predict long-term competitiveness of the
destination as a whole to attract and serve tourists rather than dealing with forecasts
at property level. The reason is clear – if in the long run the destination as a whole is
not competitive, it will be entering its decline stage and facing a decreasing number
of arrivals and tourist expenditures, the revenue manager cannot hope that his hotel
will be attracting more guests who will generate higher revenues at higher prices.
Tactical forecasting deals with forecasting the volume of demand to the particular
hotel, demand structure by segments (see Tables 6.1 and 6.2) and distribution
channel, occupancy, price levels, length-of-stay, competitors’ prices and actions,
distributor’s behaviour, etc. The aim is to identify future periods with potential high
and low demand in order to take necessary actions – avoid confirming low
contribution group bookings for periods with high demand and stimulate demand
during slow periods.
Operational forecasting has the shortest time horizon – several days up to a month
ahead. Its final result is a forecast about the revenue management metrics (mostly
ADR and occupancy) of the hotel by date, room type, market segment and
distribution channel. Operational forecasts will reveal the need to use last minute
promotions in order to attract guests.
Stanislav Ivanov (2014). Hotel Revenue Management: From Theory to Practice. Varna: Zangador. Page 82 of 204
9.2. Forecasting methods
Forecasting involves the application of different quantitative and qualitative methods
to provide the revenue manager with prognoses about the future development of RM
metrics, demand and supply. Weatherford & Kimes (2003) divide quantitative
methods into historical, advanced booking and combined methods. Mostly used (or
analysed) by researchers historical methods include: moving average (Burger et al.,
2001; Weatherford & Kimes, 2003; Yüksel, 2007), exponential smoothing (Burger et al.,
2001; Chen & Kachani, 2007; Rajopadhye et al., 2001; Weatherford & Kimes, 2003;
Yüksel, 2007), and other autoregressive models (Burger et al., 2001; Lim & Chan, 2011;
Lim, Chang & McAleer, 2009; Yüksel, 2007). Historical methods are based on time
series analysis:
Simple moving average
The simple moving average forecast ft for moment (period) t is an unweighted
average of the actual values xi of the variable for the preceding n moments (periods).
(9.1) ∑
It can be calculated with daily, weekly, monthly, quarterly or annual data, and with
different number n of past values of the variable. The larger the n, the lower the
variation in the values of the moving average. In the simple moving average every
past value xi used in the calculation is considered to have equal importance on the
value of the forecasted value ft and, therefore, weight, regardless of its temporal
distance from the moment (period) of the forecast.
Exponential smoothing
In the exponential smoothing the past values of the variable xi have different weights
– they decrease with the temporal distance of the past values from the forecast value
ft. The forecast ft depends on the actual value xt-1 and the forecast ft-1 of the variable in
the preceding period:
(9.2) ,
where α (0< α <1) is the smoothing factor and illustrates the portion of the previous
period’s forecast error included in the forecast for the new period ft. The
Stanislav Ivanov (2014). Hotel Revenue Management: From Theory to Practice. Varna: Zangador. Page 83 of 204
lower α, the more weight it gives to all values prior to the last one, summarised in the
component of equation (9.2) (Frechtling, 2001: 88).
Other autoregressive models
Besides the simple moving average and exponential smoothing, forecasting theory
and practice uses other more sophisticated econometric techniques such as
autoregressive moving average (ARMA), autoregressive integrated moving average
(ARIMA), seasonal ARIMA (SARIMA), autoregressive conditional heteroskedastic
model (ARCH), generalised ARCH model (GARCH), etc., discussed in details in
Montgomery, Jennings & Kulachi (2008), which are also based on time series analysis.
The main advantages of historical methods are the relatively easy application and
minimal data requirements – they need only historical data on the analysed variable.
On the other hand, they rely on the fact that knowing how a certain variable has
changed over time (e.g. what was the occupancy of the hotel during the last twelve
months) can provide information on how this variable will change in the future, i.e.
as if the variable has memory, similar to technical analysis in financial markets
forecasting. This is the main disadvantage of time series forecasting – they disregard
other variables – demand, competitors’ actions or special events at the destinations
that stimulate demand. Albeit their shortcomings, time series methods remain widely
used.
Advanced booking models forecast the number of booked rooms on a particular
arrival day on the basis of the number of booked rooms on a previous day (called
‘reading day’) and the ‘pickup’ of rooms (increase in the number of booked rooms)
between the reading day and the arrival day (Phumchusri & Mongkolkul, 2012;
Weatherford & Kimes, 2003; Zakhary, El Gayar & Atiya, 2008). Weatherford & Kimes
(2003: 403) divide advanced booking models into additive and multiplicative models.
Additive models
Additive models assume that the number of reservations on hand on a particular day
before arrival is independent of the total number of rooms sold. In these models, the
number of booked rooms on the reading day is added to the average historical pickup
between the reading and the arrival (check-in) day. If is the number of booked
rooms for i-th check-in date j days before arrival, then represents the
Stanislav Ivanov (2014). Hotel Revenue Management: From Theory to Practice. Varna: Zangador. Page 84 of 204
additionally booked rooms for i-th check-in date j days before arrival. The forecast
for the i-th check-in date t days before arrival would be (Phumchusri & Mongkolkul,
2012):
(9.3) ∑ ̅ ,
where ̅ is the average pickup of rooms between j and j-1 days prior to arrival.
Multiplicative models
Multiplicative model forecasts are based on the number of bookings on the reading
day multiplied by the average historical pickup ratio. If is the ratio of the
increased number of booked rooms for i-th arrival date j days before arrival:
(9.4)
,
then the forecast for the i-th check-in date t days before arrival would be
(Phumchusri & Mongkolkul, 2012):
(9.5) (∏ ) ,
where ̅ is the average pickup ratio between j and j-1 days prior to arrival.
It is evident that both additive and multiplicative models include a historical
component and in this regard share the same disadvantages as the time series models
discussed above.
As combined methods Weatherford & Kimes (2003) identify regression models
(Burger et al., 2001; Chen & Kachani, 2007; Weatherford & Kimes, 2003) and weighted
average between historical and advanced booking forecasts (Chen & Kachani, 2007).
Regression models present the dependent variable (number of booked rooms in the
hotel, occupancy, ADR, RevPAR, GOPPAR, etc.) as a function of different
independent variables xi:
(9.6)
Stanislav Ivanov (2014). Hotel Revenue Management: From Theory to Practice. Varna: Zangador. Page 85 of 204
Their greatest advantage is that they allow the inclusion of numerous variables in the
forecasting models (e.g. day of the week, special events, tourism demand and number
of flights to the destination, marketing expenses of the hotel, timing of promotions,
price levels, inflation, etc.) and, therefore, might provide superior forecasts compared
to the preceding ones. Regression models may be successfully applied for tactical and
especially strategic forecasting because they require mostly aggregated data
potentially available on a monthly, quarterly and annual, but not on daily or weekly
basis.
The weighted average forecast ft between historical ( ) and advanced booking
forecasts ( ) is:
(9.7)
,
where is the weight put on the historical forecast (0< <1).
In addition to the above combined method we can add the artificial neural networks
(Zhang, 2004) which warrant growing attention in tourism, hospitality and revenue
management forecasting (e.g. Burger et al., 2001; Law, 2000; Padhi & Aggarwal, 2011;
Palmer, Montaño, & Sesé, 2006; Zakhary, El Gayar & Ahmed, 2010). In essence the
artificial neural network is a computer programme with a non-linear mathematical
algorithm that emulates the behaviour of the human brain. Past data on different
variables is used to ‘train’ the model and develop the relationships among them. The
trained model is then fed with the new values of the same variables used for
forecasting. The artificial neural networks are superior to the other forecasting
methods due to their learning capabilities. They may be used for any level of
forecasting but could be especially useful for operational forecasting due to the large
datasets with operational data generated in hotels.
Qualitative methods like Delphi (Yüksel, 2007) are based on experts’ opinions rather
than quantitative data. In the field of revenue management, they have only marginal
applicability because they rely on the subjective perceptions of experts rather than
objective statistical data.
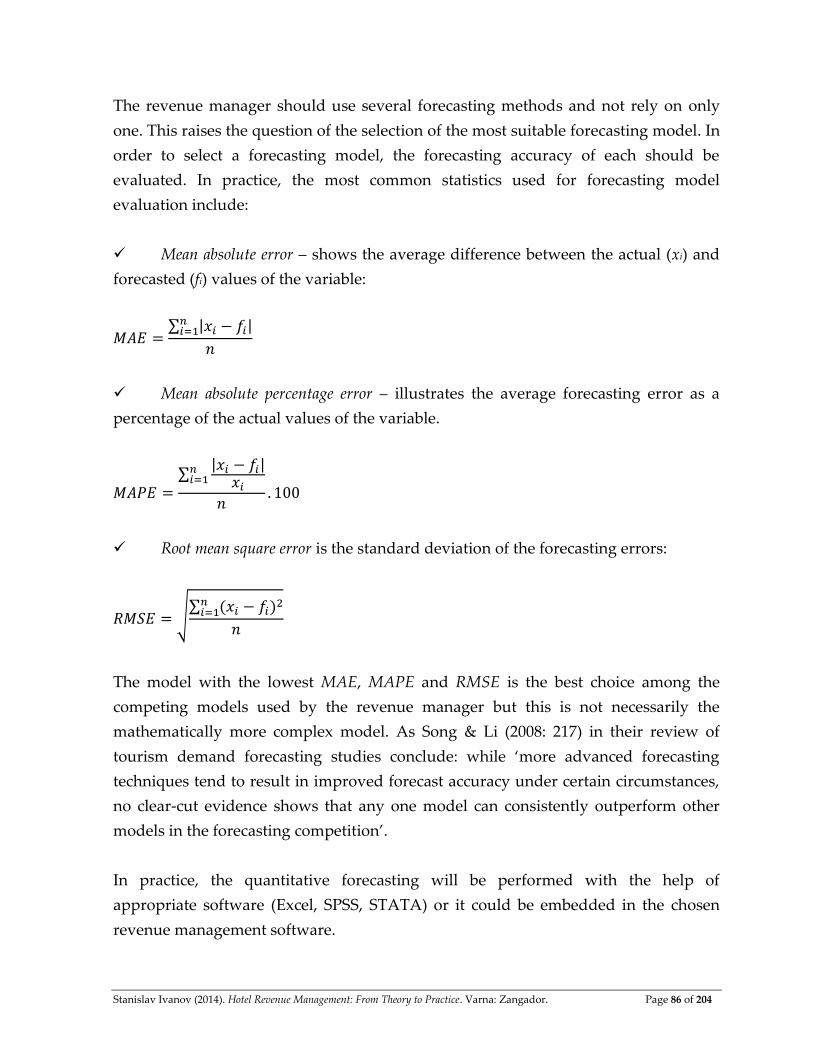
Stanislav Ivanov (2014). Hotel Revenue Management: From Theory to Practice. Varna: Zangador. Page 86 of 204
The revenue manager should use several forecasting methods and not rely on only
one. This raises the question of the selection of the most suitable forecasting model. In
order to select a forecasting model, the forecasting accuracy of each should be
evaluated. In practice, the most common statistics used for forecasting model
evaluation include:
Mean absolute error – shows the average difference between the actual (xi) and
forecasted (fi) values of the variable:
∑ | |
Mean absolute percentage error – illustrates the average forecasting error as a
percentage of the actual values of the variable.
∑
| |
Root mean square error is the standard deviation of the forecasting errors:
√∑
The model with the lowest MAE, MAPE and RMSE is the best choice among the
competing models used by the revenue manager but this is not necessarily the
mathematically more complex model. As Song & Li (2008: 217) in their review of
tourism demand forecasting studies conclude: while ‘more advanced forecasting
techniques tend to result in improved forecast accuracy under certain circumstances,
no clear-cut evidence shows that any one model can consistently outperform other
models in the forecasting competition’.
In practice, the quantitative forecasting will be performed with the help of
appropriate software (Excel, SPSS, STATA) or it could be embedded in the chosen
revenue management software.
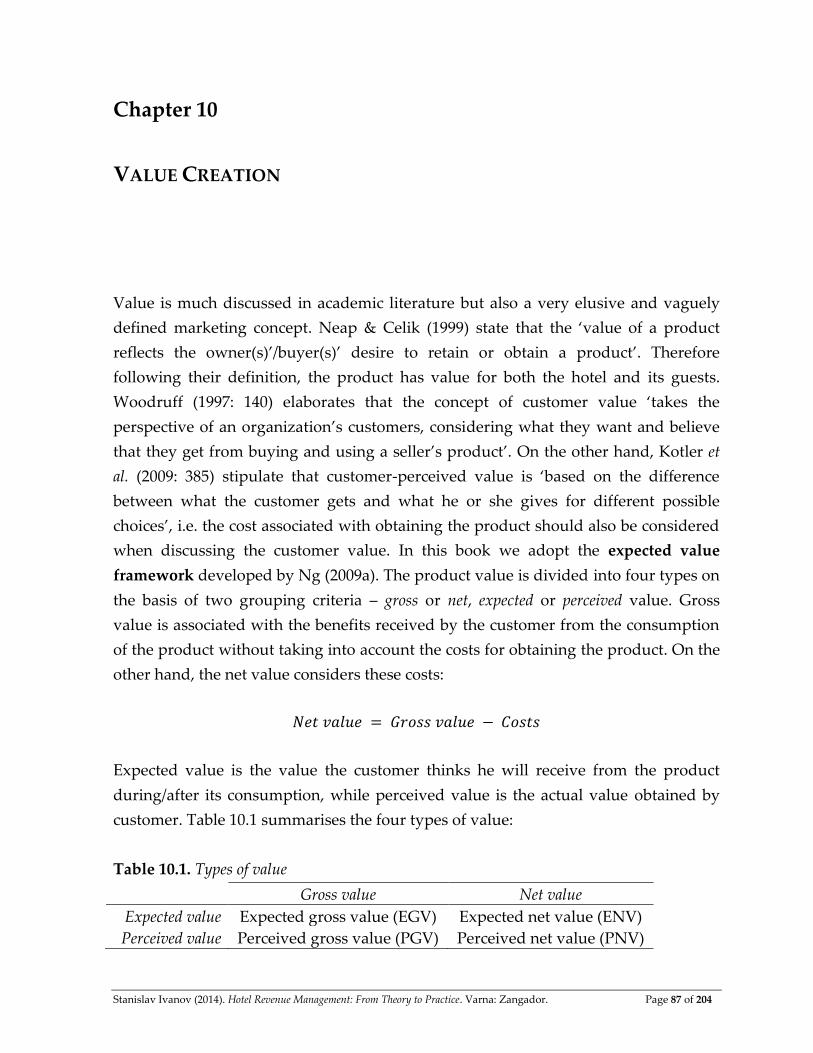
Stanislav Ivanov (2014). Hotel Revenue Management: From Theory to Practice. Varna: Zangador. Page 87 of 204
Chapter 10
VALUE CREATION
Value is much discussed in academic literature but also a very elusive and vaguely
defined marketing concept. Neap & Celik (1999) state that the ‘value of a product
reflects the owner(s)’/buyer(s)’ desire to retain or obtain a product’. Therefore
following their definition, the product has value for both the hotel and its guests.
Woodruff (1997: 140) elaborates that the concept of customer value ‘takes the
perspective of an organization’s customers, considering what they want and believe
that they get from buying and using a seller’s product’. On the other hand, Kotler et
al. (2009: 385) stipulate that customer-perceived value is ‘based on the difference
between what the customer gets and what he or she gives for different possible
choices’, i.e. the cost associated with obtaining the product should also be considered
when discussing the customer value. In this book we adopt the expected value
framework developed by Ng (2009a). The product value is divided into four types on
the basis of two grouping criteria – gross or net, expected or perceived value. Gross
value is associated with the benefits received by the customer from the consumption
of the product without taking into account the costs for obtaining the product. On the
other hand, the net value considers these costs:
Expected value is the value the customer thinks he will receive from the product
during/after its consumption, while perceived value is the actual value obtained by
customer. Table 10.1 summarises the four types of value:
Table 10.1. Types of value
Gross value Net value
Expected value Expected gross value (EGV) Expected net value (ENV)
Perceived value Perceived gross value (PGV) Perceived net value (PNV)
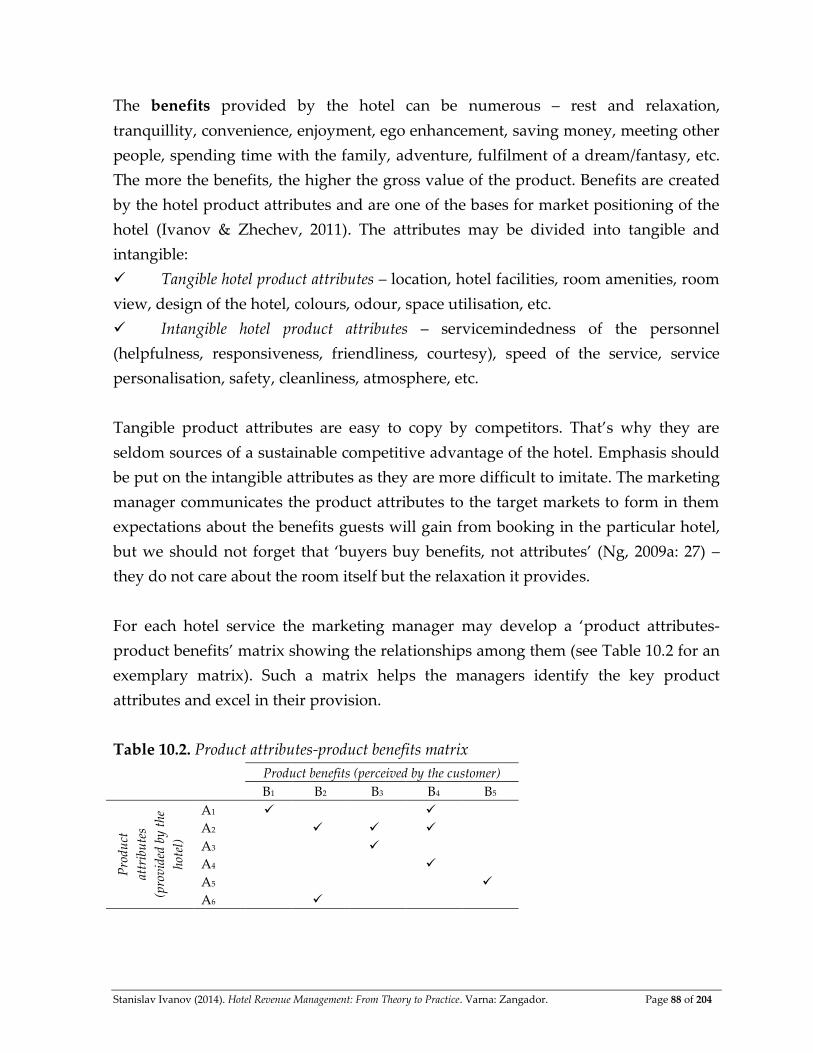
Stanislav Ivanov (2014). Hotel Revenue Management: From Theory to Practice. Varna: Zangador. Page 88 of 204
The benefits provided by the hotel can be numerous – rest and relaxation,
tranquillity, convenience, enjoyment, ego enhancement, saving money, meeting other
people, spending time with the family, adventure, fulfilment of a dream/fantasy, etc.
The more the benefits, the higher the gross value of the product. Benefits are created
by the hotel product attributes and are one of the bases for market positioning of the
hotel (Ivanov & Zhechev, 2011). The attributes may be divided into tangible and
intangible:
Tangible hotel product attributes – location, hotel facilities, room amenities, room
view, design of the hotel, colours, odour, space utilisation, etc.
Intangible hotel product attributes – servicemindedness of the personnel
(helpfulness, responsiveness, friendliness, courtesy), speed of the service, service
personalisation, safety, cleanliness, atmosphere, etc.
Tangible product attributes are easy to copy by competitors. That’s why they are
seldom sources of a sustainable competitive advantage of the hotel. Emphasis should
be put on the intangible attributes as they are more difficult to imitate. The marketing
manager communicates the product attributes to the target markets to form in them
expectations about the benefits guests will gain from booking in the particular hotel,
but we should not forget that ‘buyers buy benefits, not attributes’ (Ng, 2009a: 27) –
they do not care about the room itself but the relaxation it provides.
For each hotel service the marketing manager may develop a ‘product attributes-
product benefits’ matrix showing the relationships among them (see Table 10.2 for an
exemplary matrix). Such a matrix helps the managers identify the key product
attributes and excel in their provision.
Table 10.2. Product attributes-product benefits matrix
Product benefits (perceived by the customer)
B1 B2 B3 B4 B5
Pro
duct
attr
ibu
tes
(pro
vide
d by
the
hote
l)
A1
A2
A3
A4
A5
A6
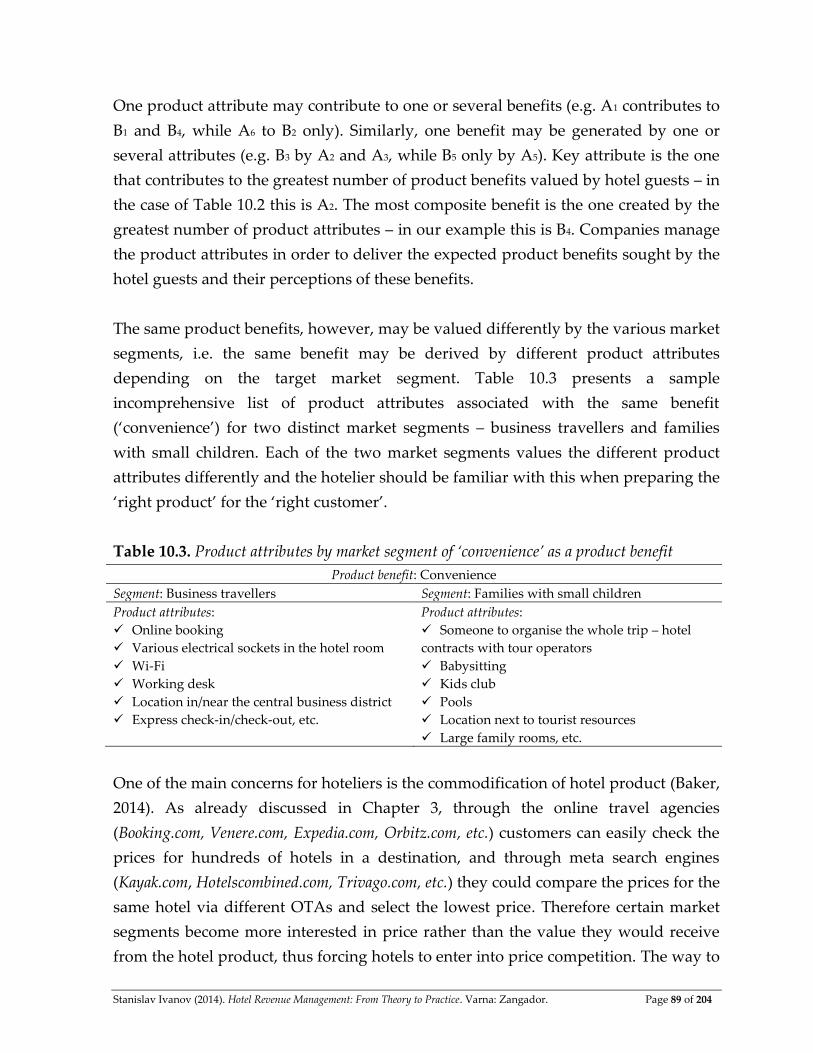
Stanislav Ivanov (2014). Hotel Revenue Management: From Theory to Practice. Varna: Zangador. Page 89 of 204
One product attribute may contribute to one or several benefits (e.g. A1 contributes to
B1 and B4, while A6 to B2 only). Similarly, one benefit may be generated by one or
several attributes (e.g. B3 by A2 and A3, while B5 only by A5). Key attribute is the one
that contributes to the greatest number of product benefits valued by hotel guests – in
the case of Table 10.2 this is A2. The most composite benefit is the one created by the
greatest number of product attributes – in our example this is B4. Companies manage
the product attributes in order to deliver the expected product benefits sought by the
hotel guests and their perceptions of these benefits.
The same product benefits, however, may be valued differently by the various market
segments, i.e. the same benefit may be derived by different product attributes
depending on the target market segment. Table 10.3 presents a sample
incomprehensive list of product attributes associated with the same benefit
(‘convenience’) for two distinct market segments – business travellers and families
with small children. Each of the two market segments values the different product
attributes differently and the hotelier should be familiar with this when preparing the
‘right product’ for the ‘right customer’.
Table 10.3. Product attributes by market segment of ‘convenience’ as a product benefit
Product benefit: Convenience
Segment: Business travellers Segment: Families with small children
Product attributes:
Online booking
Various electrical sockets in the hotel room
Wi-Fi
Working desk
Location in/near the central business district
Express check-in/check-out, etc.
Product attributes:
Someone to organise the whole trip – hotel
contracts with tour operators
Babysitting
Kids club
Pools
Location next to tourist resources
Large family rooms, etc.
One of the main concerns for hoteliers is the commodification of hotel product (Baker,
2014). As already discussed in Chapter 3, through the online travel agencies
(Booking.com, Venere.com, Expedia.com, Orbitz.com, etc.) customers can easily check the
prices for hundreds of hotels in a destination, and through meta search engines
(Kayak.com, Hotelscombined.com, Trivago.com, etc.) they could compare the prices for the
same hotel via different OTAs and select the lowest price. Therefore certain market
segments become more interested in price rather than the value they would receive
from the hotel product, thus forcing hotels to enter into price competition. The way to
Stanislav Ivanov (2014). Hotel Revenue Management: From Theory to Practice. Varna: Zangador. Page 90 of 204
counteract the process of commodification of the hotel product is through its
differentiation from competing products and redefining the benefits it offers. A useful
instrument a hotel may use for implementing differentiation is the adoption of the
experience economy philosophy.
Developed at the end of the 1990s by Pine & Gilmore (1998, 1999) the concept of
experience economy gained popularity in the tourism and hospitality industry as well
(Andersson, 2007; Gilmore & Pine, 2002; Oh, Fiore & Jeoung, 2007). Experiences are
perceived as products that are different from goods and services. Pine & Gilmore
(2011: 17) emphasise that ‘experience offerings occur whenever a company
intentionally used services as the stage and goods as props to engage an individual.
Whereas commodities are fungible, goods tangible, and services intangible,
experiences are memorable’ (Italics in original). In order to be competitive, the firm
should offer positive, sensational, memorable, and long-lasting experiences, which
stimulate the customers to talk about them and to repeat their purchases. Experiences
are the basis of the entertainment business – theme parks, rock concerts, movies,
virtual reality of the video/online games, kids’ birthday parties (at McDonald’s or
specialised kids clubs), etc. Experiences do not result in the ownership of something –
the customer ‘buys’ memories, which justify charging a higher price for
‘participating’ in the experience. Company employees create personalised services
and influence the emotions of the guests. A key moment is the participation of the
customer in the experience delivery process, i.e. he is transformed into a ‘prosumer’
(producer + consumer) – the customer is simultaneously a consumer of the experience
and an actively engaged participant in its staging. The design of the service
experience (Patricio et al., 2011) requires that all elements of the company product and
service delivery process be coordinated – the stages of the service delivery process,
the level of customer participation in the service process, his interactions with other
customers and employees, the atmosphere and physical environment of the hotel, the
employee uniforms, the restaurant menu, the usage of all five senses to communicate
the experience message (the value) to the customer.
In the hotel industry, the adoption of the experience economy philosophy leads to the
development of experiential hotel product concepts. Table 10.4 provides multiple
examples of different degrees of application of the experience economy philosophy
adopted by hotels in various destinations worldwide. Experience effect is achieved by
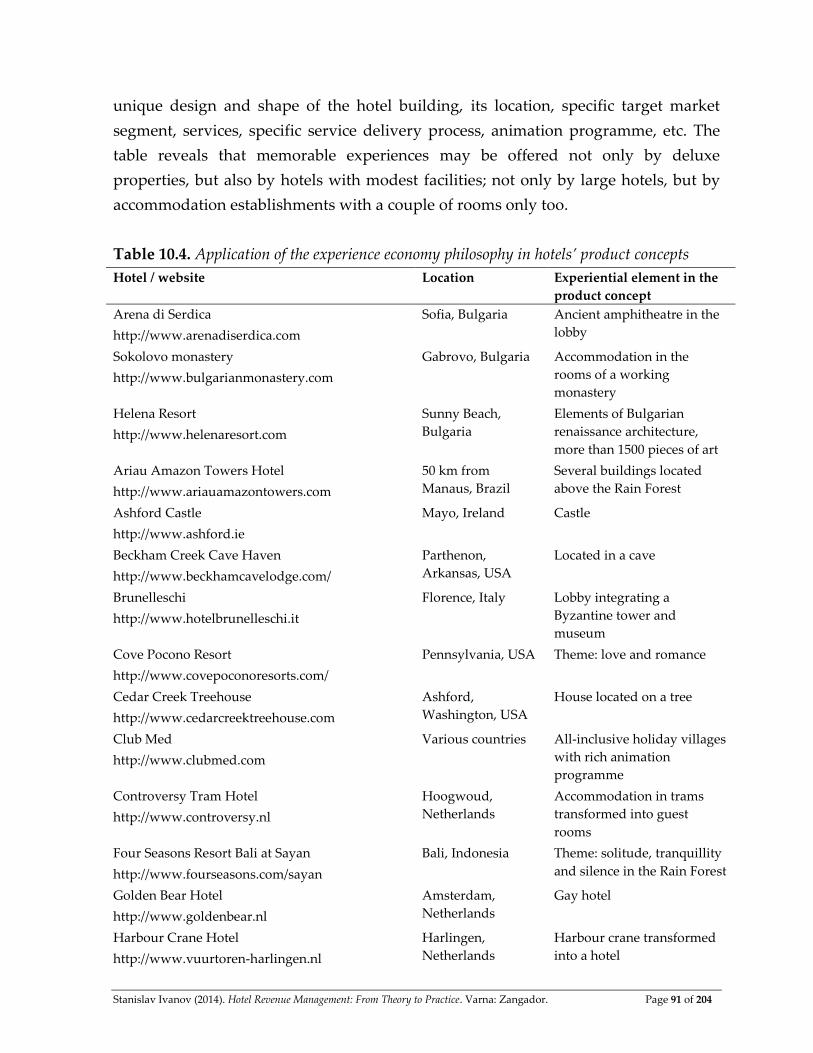
Stanislav Ivanov (2014). Hotel Revenue Management: From Theory to Practice. Varna: Zangador. Page 91 of 204
unique design and shape of the hotel building, its location, specific target market
segment, services, specific service delivery process, animation programme, etc. The
table reveals that memorable experiences may be offered not only by deluxe
properties, but also by hotels with modest facilities; not only by large hotels, but by
accommodation establishments with a couple of rooms only too.
Table 10.4. Application of the experience economy philosophy in hotels’ product concepts
Hotel / website Location Experiential element in the
product concept
Arena di Serdica
http://www.arenadiserdica.com
Sofia, Bulgaria Ancient amphitheatre in the
lobby
Sokolovo monastery
http://www.bulgarianmonastery.com
Gabrovo, Bulgaria Accommodation in the
rooms of a working
monastery
Helena Resort
http://www.helenaresort.com
Sunny Beach,
Bulgaria
Elements of Bulgarian
renaissance architecture,
more than 1500 pieces of art
Ariau Amazon Towers Hotel
http://www.ariauamazontowers.com
50 km from
Manaus, Brazil
Several buildings located
above the Rain Forest
Ashford Castle
http://www.ashford.ie
Mayo, Ireland Castle
Beckham Creek Cave Haven
http://www.beckhamcavelodge.com/
Parthenon,
Arkansas, USA
Located in a cave
Brunelleschi
http://www.hotelbrunelleschi.it
Florence, Italy Lobby integrating a
Byzantine tower and
museum
Cove Pocono Resort
http://www.covepoconoresorts.com/
Pennsylvania, USA Theme: love and romance
Cedar Creek Treehouse
http://www.cedarcreektreehouse.com
Ashford,
Washington, USA
House located on a tree
Club Med
http://www.clubmed.com
Various countries All-inclusive holiday villages
with rich animation
programme
Controversy Tram Hotel
http://www.controversy.nl
Hoogwoud,
Netherlands
Accommodation in trams
transformed into guest
rooms
Four Seasons Resort Bali at Sayan
http://www.fourseasons.com/sayan
Bali, Indonesia Theme: solitude, tranquillity
and silence in the Rain Forest
Golden Bear Hotel
http://www.goldenbear.nl
Amsterdam,
Netherlands
Gay hotel
Harbour Crane Hotel
http://www.vuurtoren-harlingen.nl
Harlingen,
Netherlands
Harbour crane transformed
into a hotel
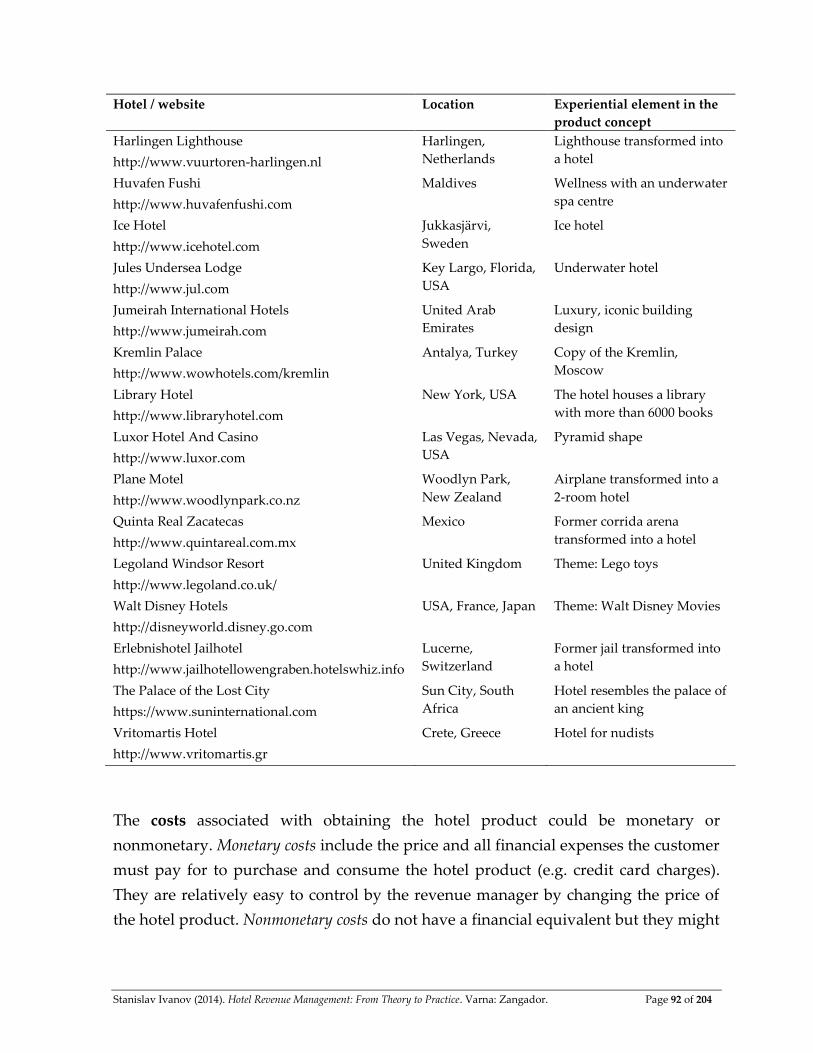
Stanislav Ivanov (2014). Hotel Revenue Management: From Theory to Practice. Varna: Zangador. Page 92 of 204
Hotel / website Location Experiential element in the
product concept
Harlingen Lighthouse
http://www.vuurtoren-harlingen.nl
Harlingen,
Netherlands
Lighthouse transformed into
a hotel
Huvafen Fushi
http://www.huvafenfushi.com
Maldives Wellness with an underwater
spa centre
Ice Hotel
http://www.icehotel.com
Jukkasjärvi,
Sweden
Ice hotel
Jules Undersea Lodge
http://www.jul.com
Key Largo, Florida,
USA
Underwater hotel
Jumeirah International Hotels
http://www.jumeirah.com
United Arab
Emirates
Luxury, iconic building
design
Kremlin Palace
http://www.wowhotels.com/kremlin
Antalya, Turkey Copy of the Kremlin,
Moscow
Library Hotel
http://www.libraryhotel.com
New York, USA The hotel houses a library
with more than 6000 books
Luxor Hotel And Casino
http://www.luxor.com
Las Vegas, Nevada,
USA
Pyramid shape
Plane Motel
http://www.woodlynpark.co.nz
Woodlyn Park,
New Zealand
Airplane transformed into a
2-room hotel
Quinta Real Zacatecas
http://www.quintareal.com.mx
Mexico Former corrida arena
transformed into a hotel
Legoland Windsor Resort
http://www.legoland.co.uk/
United Kingdom Theme: Lego toys
Walt Disney Hotels
http://disneyworld.disney.go.com
USA, France, Japan Theme: Walt Disney Movies
Erlebnishotel Jailhotel
http://www.jailhotellowengraben.hotelswhiz.info
Lucerne,
Switzerland
Former jail transformed into
a hotel
The Palace of the Lost City
https://www.suninternational.com
Sun City, South
Africa
Hotel resembles the palace of
an ancient king
Vritomartis Hotel
http://www.vritomartis.gr
Crete, Greece Hotel for nudists
The costs associated with obtaining the hotel product could be monetary or
nonmonetary. Monetary costs include the price and all financial expenses the customer
must pay for to purchase and consume the hotel product (e.g. credit card charges).
They are relatively easy to control by the revenue manager by changing the price of
the hotel product. Nonmonetary costs do not have a financial equivalent but they might

Stanislav Ivanov (2014). Hotel Revenue Management: From Theory to Practice. Varna: Zangador. Page 93 of 204
determine whether or not the customer will make the effort to purchase and consume
the product. In particular, nonmonetary costs include (Ng, 2009a):
Time necessary for the customer to search for information, prices and room
availability at suitable hotels in the destination he is going to visit, to evaluate the
alternatives, to make a booking, to wait to receive confirmation, etc. The longer the
time needed to be spent on the above activities, the higher the nonmonetary costs for
the consumer.
Social costs relate to the loss/gain of personal image by the customer and the
answer to the question ‘What would others think if they see me in this hotel’? If
staying in a particular hotel would be perceived by customer’s peers/colleagues/
relatives/reference group members as inappropriate (e.g. a CEO of a large corporation
staying in a 2-star property during a business trip), then the customer’s perceptions
about the social costs will be high.
Psychological costs stem from the unknown and uncertainty – e.g. a highly
sophisticated hotel product that causes psychological inconvenience because the
customer does not know how to behave in the hotel or how to use its technology.
Opportunity costs are associated with the costs to acquire a competing product.
Booking in a particular hotel means that the customer rejected an alternative. If the
other option was very attractive the customer faces high opportunity costs and vice
versa – the less attractive the alternative, the lower the opportunity costs.
Relationships between expected and perceived benefits and costs influence the choice
of a hotel by customers and their satisfaction from the stay. Figure 10.1 elaborates the
value framework of hotel selection. The customer assesses the benefits he would
receive from hotels A, B, C, etc. Following the definitions at the beginning of the
chapter, these expected benefits form the expected gross values of the hotels: EGVA,
EGVB, EGVC. Each hotel product is associated with some expected costs (monetary
and nonmonetary): ECA, ECB, ECC. The difference between EGV and EC gives the
expected net values of each competing hotel: ENVA, ENVB, ENVC. The customer then
compares the ENVs of the hotels in his consideration set and selects the one in which
to book a room, considering his budget constraints. In order to be selected by the
customer the ENV of the hotel must be higher than the ENV provided by competing
hotels at the destination. Table 10.5 below summarises the situations when the ENV
of a particular hotel is higher or lower than the ENV of its competitors.
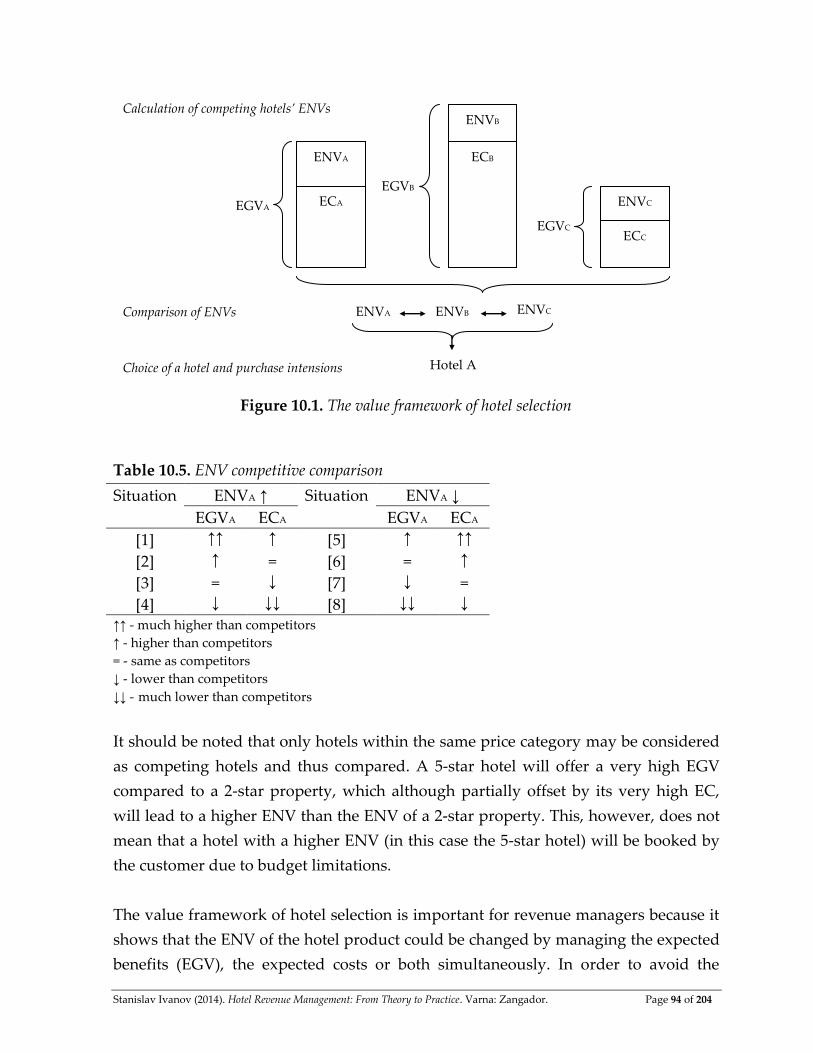
Stanislav Ivanov (2014). Hotel Revenue Management: From Theory to Practice. Varna: Zangador. Page 94 of 204
Table 10.5. ENV competitive comparison
Situation ENVA ↑ Situation ENVA ↓
EGVA ECA EGVA ECA
[1] ↑↑ ↑ [5] ↑ ↑↑
[2] ↑ = [6] = ↑
[3] = ↓ [7] ↓ =
[4] ↓ ↓↓ [8] ↓↓ ↓
↑↑ - much higher than competitors
↑ - higher than competitors
= - same as competitors
↓ - lower than competitors
↓↓ - much lower than competitors
It should be noted that only hotels within the same price category may be considered
as competing hotels and thus compared. A 5-star hotel will offer a very high EGV
compared to a 2-star property, which although partially offset by its very high EC,
will lead to a higher ENV than the ENV of a 2-star property. This, however, does not
mean that a hotel with a higher ENV (in this case the 5-star hotel) will be booked by
the customer due to budget limitations.
The value framework of hotel selection is important for revenue managers because it
shows that the ENV of the hotel product could be changed by managing the expected
benefits (EGV), the expected costs or both simultaneously. In order to avoid the
ENVA
ECA
ENVB
ECB
EGVA
EGVB ENVC
ECC EGVC
ENVA
ENVB
ENVC
Calculation of competing hotels’ ENVs
Comparison of ENVs
Choice of a hotel and purchase intensions Hotel A
Figure 10.1. The value framework of hotel selection
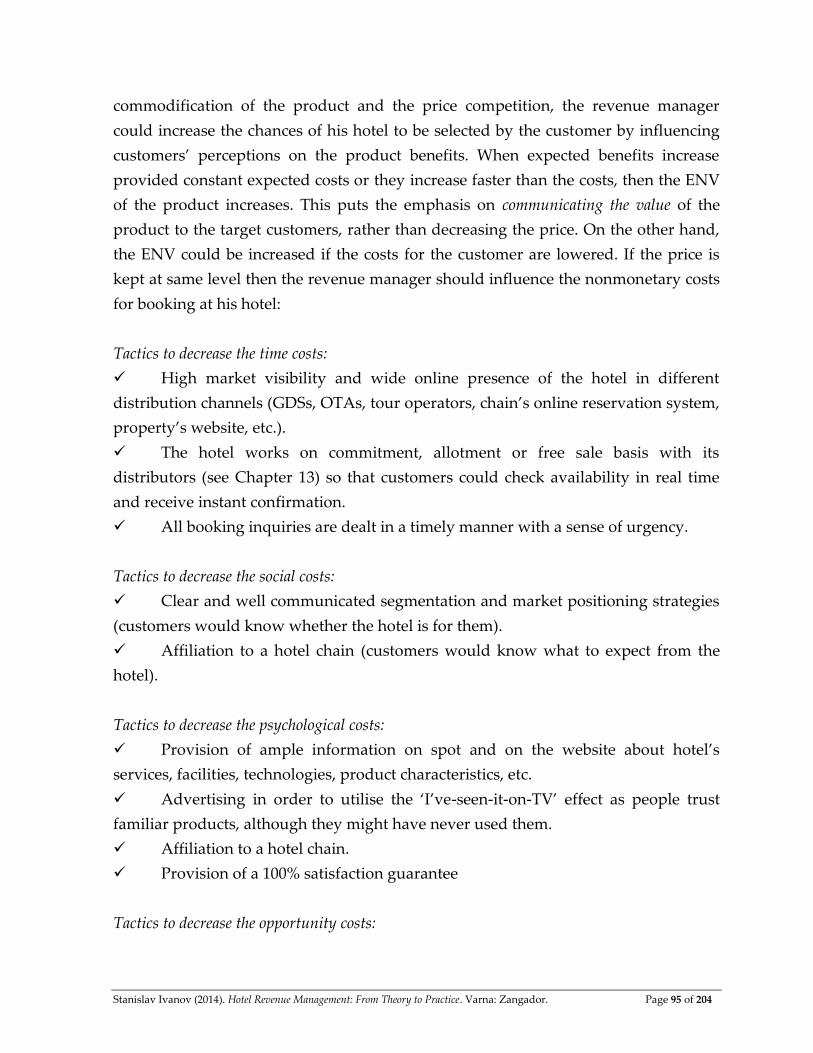
Stanislav Ivanov (2014). Hotel Revenue Management: From Theory to Practice. Varna: Zangador. Page 95 of 204
commodification of the product and the price competition, the revenue manager
could increase the chances of his hotel to be selected by the customer by influencing
customers’ perceptions on the product benefits. When expected benefits increase
provided constant expected costs or they increase faster than the costs, then the ENV
of the product increases. This puts the emphasis on communicating the value of the
product to the target customers, rather than decreasing the price. On the other hand,
the ENV could be increased if the costs for the customer are lowered. If the price is
kept at same level then the revenue manager should influence the nonmonetary costs
for booking at his hotel:
Tactics to decrease the time costs:
High market visibility and wide online presence of the hotel in different
distribution channels (GDSs, OTAs, tour operators, chain’s online reservation system,
property’s website, etc.).
The hotel works on commitment, allotment or free sale basis with its
distributors (see Chapter 13) so that customers could check availability in real time
and receive instant confirmation.
All booking inquiries are dealt in a timely manner with a sense of urgency.
Tactics to decrease the social costs:
Clear and well communicated segmentation and market positioning strategies
(customers would know whether the hotel is for them).
Affiliation to a hotel chain (customers would know what to expect from the
hotel).
Tactics to decrease the psychological costs:
Provision of ample information on spot and on the website about hotel’s
services, facilities, technologies, product characteristics, etc.
Advertising in order to utilise the ‘I’ve-seen-it-on-TV’ effect as people trust
familiar products, although they might have never used them.
Affiliation to a hotel chain.
Provision of a 100% satisfaction guarantee
Tactics to decrease the opportunity costs:
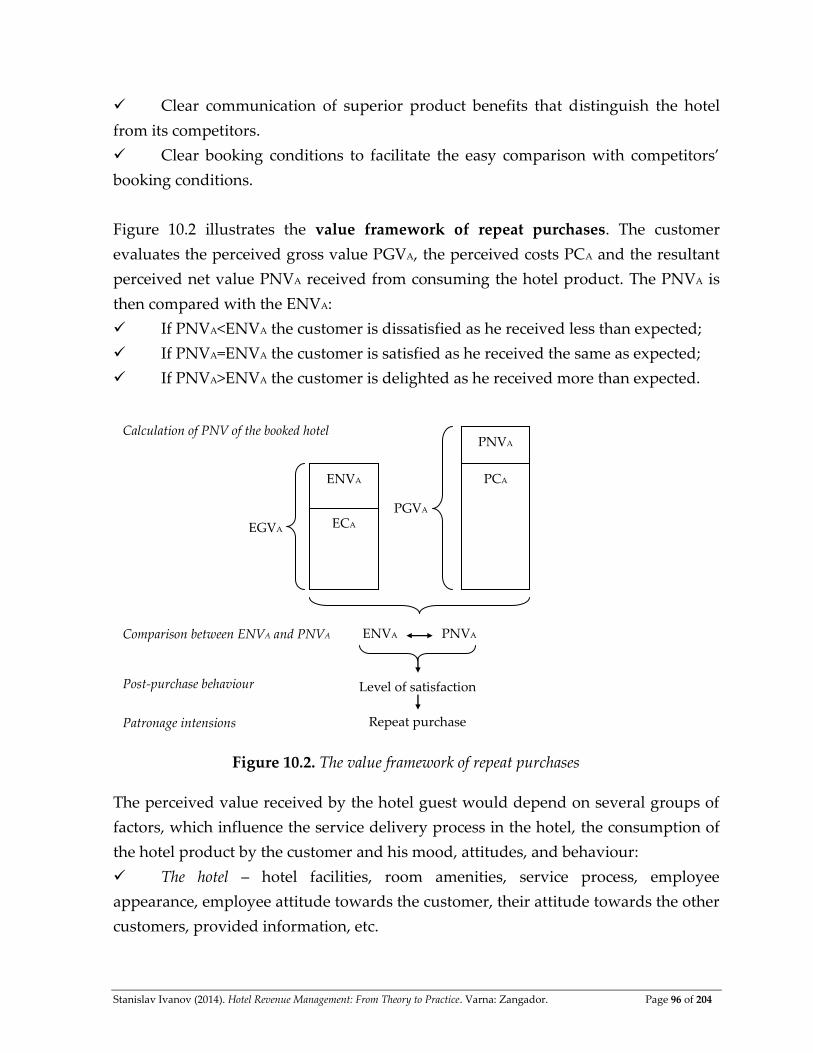
Stanislav Ivanov (2014). Hotel Revenue Management: From Theory to Practice. Varna: Zangador. Page 96 of 204
Clear communication of superior product benefits that distinguish the hotel
from its competitors.
Clear booking conditions to facilitate the easy comparison with competitors’
booking conditions.
Figure 10.2 illustrates the value framework of repeat purchases. The customer
evaluates the perceived gross value PGVA, the perceived costs PCA and the resultant
perceived net value PNVA received from consuming the hotel product. The PNVA is
then compared with the ENVA:
If PNVA<ENVA the customer is dissatisfied as he received less than expected;
If PNVA=ENVA the customer is satisfied as he received the same as expected;
If PNVA>ENVA the customer is delighted as he received more than expected.
The perceived value received by the hotel guest would depend on several groups of
factors, which influence the service delivery process in the hotel, the consumption of
the hotel product by the customer and his mood, attitudes, and behaviour:
The hotel – hotel facilities, room amenities, service process, employee
appearance, employee attitude towards the customer, their attitude towards the other
customers, provided information, etc.
ENVA
ECA
PNVA
PCA
EGVA
PGVA
ENVA
PNVA
Calculation of PNV of the booked hotel
Comparison between ENVA and PNVA
Post-purchase behaviour Level of satisfaction
Figure 10.2. The value framework of repeat purchases
Repeat purchase
Patronage intensions

Stanislav Ivanov (2014). Hotel Revenue Management: From Theory to Practice. Varna: Zangador. Page 97 of 204
The customer him/herself – his/her mood, behaviour, attitudes, appearance,
health, etc. as he is a prosumer in the process.
Accompanying persons, other guests in the hotel, other tourists in the destination –
their mood, behaviour, attitudes, appearance, health, etc.
External circumstances – weather, events in the destination, behaviour and
attitudes of local population towards the tourists.
Obviously, only part of the factors are completely (or nearly entirely) controllable by
the hotel, while most are either partially controllable (the customer, his accom-
panying persons, other guests and tourist) or completely uncontrollable (external
circumstances). Therefore, the PNV to be received by the hotel guest is uncertain
which, increases the perceived risk for him. In order to mitigate this perceived risk
some hotel chains, like Hampton, provide a 100% service satisfaction guarantee to
their customers (Hampton, 2014) which will be discussed in details in Chapter 12.
From a revenue management perspective satisfied and delighted customers are more
likely to repeat their purchase and stay again in the hotel. However, research shows
that in case of a service failure by the company, a good service recovery (swift
solution of customer problems with proper compensation) might transform the
dissatisfied, angry and annoyed customers into satisfied and loyal ones (Skaalsvik,
2012). However, it should be emphasised that in order to come to the same hotel,
tourists have to select the destination as a whole again. Therefore, the repeat purchase of
the tourist would depend not only on the net value provided by the hotel, but on the total net
value of the destination product as a whole, which mostly goes beyond the control of the
revenue manager of the hotel (chain). This raises the necessity hoteliers, tour
operators and travel agents, transportation companies, tourist attractions, destination
management companies and all other destination stakeholders to work together in
order to provide a memorable destination experience for the tourists and stimulate
their loyalty, which would be beneficial for all economic agents in the destination,
including the hotels.
Stanislav Ivanov (2014). Hotel Revenue Management: From Theory to Practice. Varna: Zangador. Page 98 of 204
Chapter 11
PRICING HOTEL REVENUE MANAGEMENT TOOLS
Price is a very important element of a hotel’s marketing mix – it is the only one
directly connected with hotel’s revenues (see Figure 1.1). Many scholars have
identified the importance of pricing and price strategy as a basis for creating
sustainable competitive advantage (Cross, Higbie & Cross, 2009; Desiraju & Shugan,
1999; Nagle & Hogan, 2006; Ng, 2009a, b; Shy, 2008). In the hotel industry the most
widely used pricing revenue management tools include price discrimination,
dynamic pricing, lowest price guarantee, price presentation and, price parity and they
have been extensively researched in academic literature (Choi & Kimes, 2002; Hanks,
Cross & Noland, 2002; Koenig & Meissner, 2010; Lieberman, 2011; Mauri, 2012;
Noone & Mattila, 2009; Schwartz, 2006, 2008; Steed & Gu, 2005; Tranter, Stuart-Hill &
Parker, 2008; Tse & Poon, 2012) for both individual and group booking requests
(Choi, 2006; Cross, Higbie & Cross, 2009; Schwartz & Cohen, 2003). In practice, price
is one of the (strongest) instruments for market positioning of a hotel (Ivanov &
Zhechev, 2011) as it is included in all market positioning models – the Bowman
strategy clock (Bowman, 1991), the value positioning (Kotler et al., 2002), and the
positioning maps (Lovelock & Wright, 1999). Due to the information function of price
(Chen, Ruseski & Schwartz, 2009), customers form expectations about the service
quality according to service price (among other factors) and the higher price is an
implicit promise for higher quality (Wilson, Zeithaml, Bitner & Gremler, 2012).
Therefore, pricing also influences the expected value of the hotel product (see
Chapter 10).
11.1. Constellation of prices in the hotel industry
The hotel industry is famous for using a myriad of prices. Table 11.1 below
summarises some of the criteria for differentiating the price. Room prices may vary
according to the type of room, room standard, food board, room view, period of
accommodation, time of booking, booking terms (cancellation, amendment and
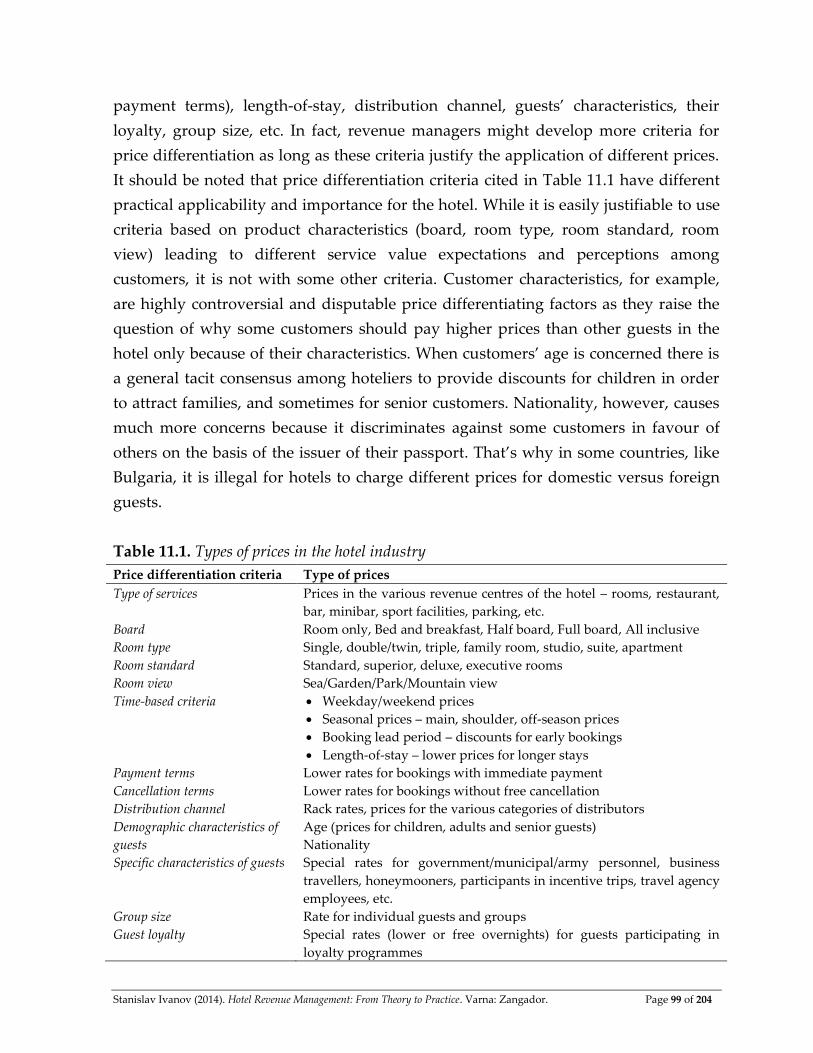
Stanislav Ivanov (2014). Hotel Revenue Management: From Theory to Practice. Varna: Zangador. Page 99 of 204
payment terms), length-of-stay, distribution channel, guests’ characteristics, their
loyalty, group size, etc. In fact, revenue managers might develop more criteria for
price differentiation as long as these criteria justify the application of different prices.
It should be noted that price differentiation criteria cited in Table 11.1 have different
practical applicability and importance for the hotel. While it is easily justifiable to use
criteria based on product characteristics (board, room type, room standard, room
view) leading to different service value expectations and perceptions among
customers, it is not with some other criteria. Customer characteristics, for example,
are highly controversial and disputable price differentiating factors as they raise the
question of why some customers should pay higher prices than other guests in the
hotel only because of their characteristics. When customers’ age is concerned there is
a general tacit consensus among hoteliers to provide discounts for children in order
to attract families, and sometimes for senior customers. Nationality, however, causes
much more concerns because it discriminates against some customers in favour of
others on the basis of the issuer of their passport. That’s why in some countries, like
Bulgaria, it is illegal for hotels to charge different prices for domestic versus foreign
guests.
Table 11.1. Types of prices in the hotel industry
Price differentiation criteria Type of prices
Type of services Prices in the various revenue centres of the hotel – rooms, restaurant,
bar, minibar, sport facilities, parking, etc.
Board Room only, Bed and breakfast, Half board, Full board, All inclusive
Room type Single, double/twin, triple, family room, studio, suite, apartment
Room standard Standard, superior, deluxe, executive rooms
Room view Sea/Garden/Park/Mountain view
Time-based criteria Weekday/weekend prices
Seasonal prices – main, shoulder, off-season prices
Booking lead period – discounts for early bookings
Length-of-stay – lower prices for longer stays
Payment terms Lower rates for bookings with immediate payment
Cancellation terms Lower rates for bookings without free cancellation
Distribution channel Rack rates, prices for the various categories of distributors
Demographic characteristics of
guests
Age (prices for children, adults and senior guests)
Nationality
Specific characteristics of guests Special rates for government/municipal/army personnel, business
travellers, honeymooners, participants in incentive trips, travel agency
employees, etc.
Group size Rate for individual guests and groups
Guest loyalty Special rates (lower or free overnights) for guests participating in
loyalty programmes

Stanislav Ivanov (2014). Hotel Revenue Management: From Theory to Practice. Varna: Zangador. Page 100 of 204
11.2. Factors, influencing pricing decisions in the hotel
Revenue management decisions in relation to pricing experience the impact of
various factors from the macro, micro- and the internal environment of the hotel.
Table 11.2 below elaborates on some of these factors that the revenue manager might
consider and their potential impact on the price and/or the pricing process. The
factors may have different impact magnitude and importance for every
accommodation establishment depending on the situation.
Table 11.2. Factors, influencing pricing decisions in the hotel
Factor Impact on pricing
Category Higher prices for higher category properties
Quality / value Higher prices for hotels delivering higher value to their
customers
Image Positive image leads to higher prices than competing hotels
Product lifecycle stage Lower prices during introduction and decline stages, higher
during maturity
Additional services included in the price More included services lead to price escalation
Location Hotels closer to tourist resources boast higher prices
Competition Serves as a benchmark
Sales volume Lower prices (discounts) for guests (distributors) booking
more rooms
Demand Higher prices during periods of high demand (e.g. special
events)
Demand elasticity Lower prices for price sensitive customers, higher prices for
less price sensitive customers
Affiliation to a hotel chain Payment of franchise/management fees increases costs and,
thus, prices
Bargaining power of distributors High distributor bargaining power leads to lower prices
Company’s marketing strategy and goals Focused differentiation strategy is related to high prices,
while market penetration to low prices
Organisational structure Determines who has the responsibility for pricing within the
company
Taxation Positive relationship with prices
Government regulations Setting price ceilings (maximum prices) or price floors
(minimum prices)
Costs From an accounting perspective costs are a pricing factor.
From a marketing perspective customers are interested in
their costs (price, time, social costs, etc.) and the value they
receive, not the costs of the company.
Note: developed by the author on the basis of Enz, Canina & Liu (2008); Hung, Shang & Wang (2010);
Ivanov & Zhechev (2011); Kotler, Bowen & Makens (2006); Portolan (2013); Ropero (2013)
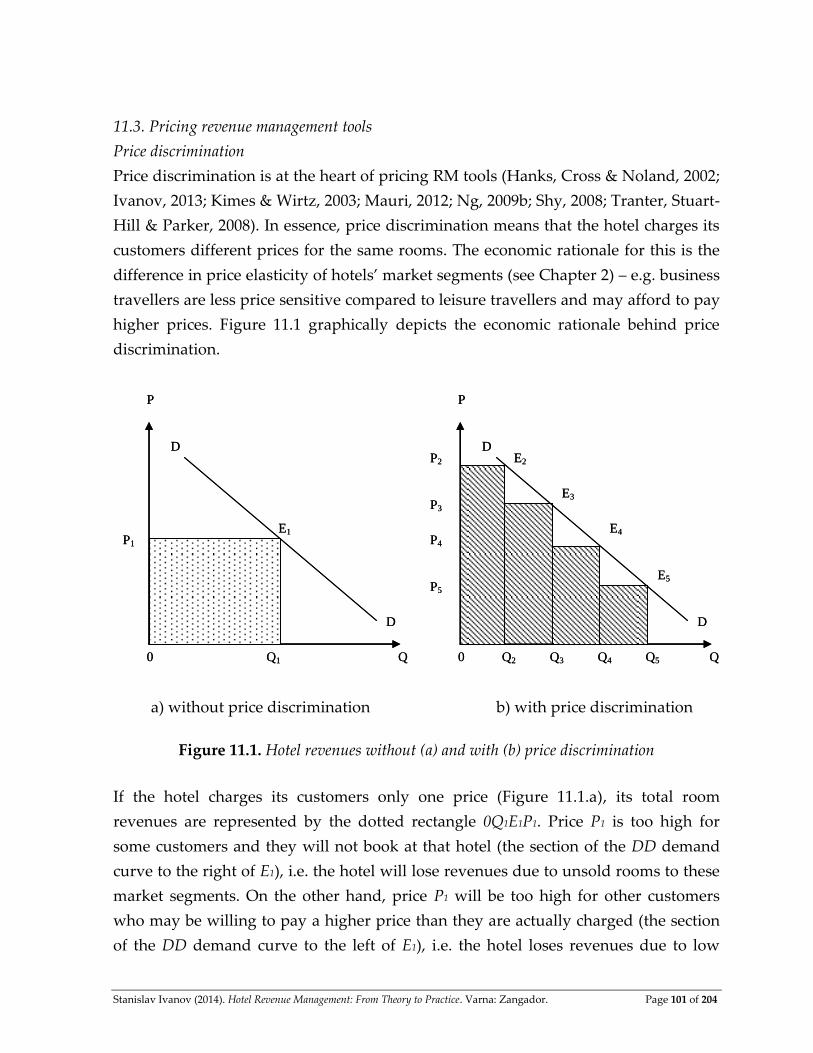
Stanislav Ivanov (2014). Hotel Revenue Management: From Theory to Practice. Varna: Zangador. Page 101 of 204
11.3. Pricing revenue management tools
Price discrimination
Price discrimination is at the heart of pricing RM tools (Hanks, Cross & Noland, 2002;
Ivanov, 2013; Kimes & Wirtz, 2003; Mauri, 2012; Ng, 2009b; Shy, 2008; Tranter, Stuart-
Hill & Parker, 2008). In essence, price discrimination means that the hotel charges its
customers different prices for the same rooms. The economic rationale for this is the
difference in price elasticity of hotels’ market segments (see Chapter 2) – e.g. business
travellers are less price sensitive compared to leisure travellers and may afford to pay
higher prices. Figure 11.1 graphically depicts the economic rationale behind price
discrimination.
a) without price discrimination b) with price discrimination
Figure 11.1. Hotel revenues without (а) and with (b) price discrimination
If the hotel charges its customers only one price (Figure 11.1.a), its total room
revenues are represented by the dotted rectangle 0Q1E1P1. Price P1 is too high for
some customers and they will not book at that hotel (the section of the DD demand
curve to the right of E1), i.e. the hotel will lose revenues due to unsold rooms to these
market segments. On the other hand, price P1 will be too high for other customers
who may be willing to pay a higher price than they are actually charged (the section
of the DD demand curve to the left of E1), i.e. the hotel loses revenues due to low
0 Q1
P1 E1
D
D
P
Q 0 Q5
P2 E2
D
D
P
Q
E3
E4
E5
P3
P4
P5
Q4 Q3 Q2 0 Q1
P1 E1
D
D
P
Q 0 Q5
P2 E2
D
D
P
Q
E3
E4
E5
P3
P4
P5
Q4 Q3 Q2
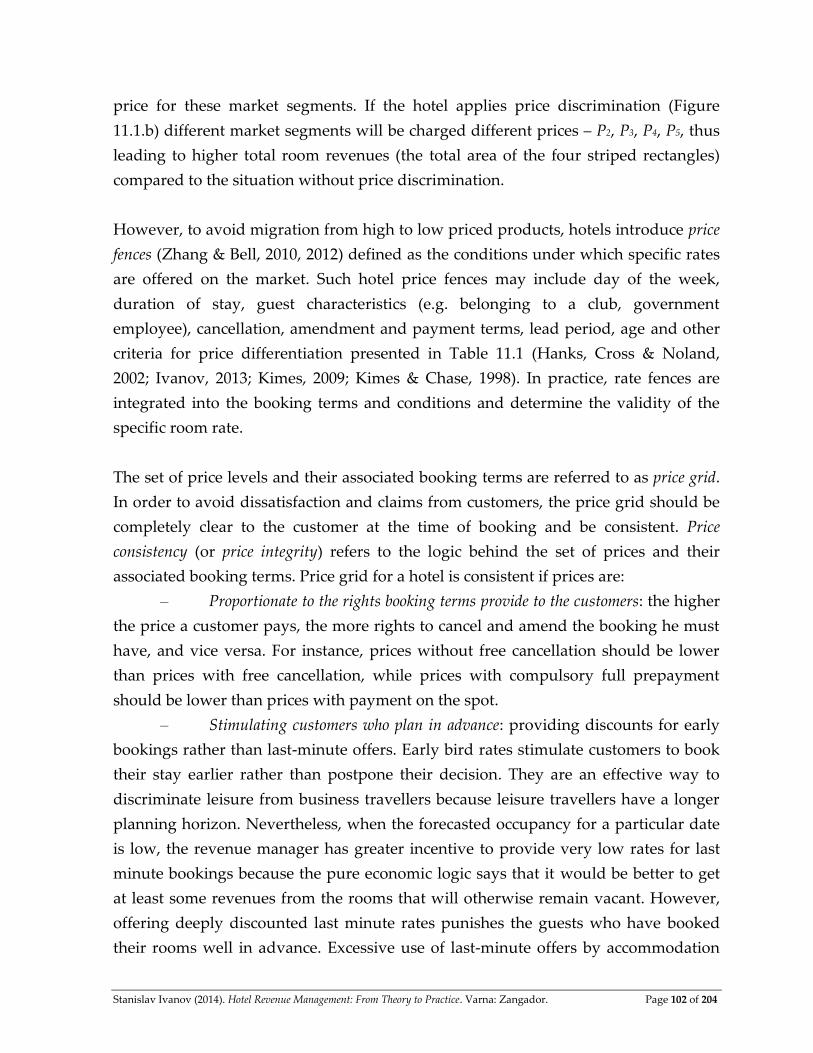
Stanislav Ivanov (2014). Hotel Revenue Management: From Theory to Practice. Varna: Zangador. Page 102 of 204
price for these market segments. If the hotel applies price discrimination (Figure
11.1.b) different market segments will be charged different prices – P2, P3, P4, P5, thus
leading to higher total room revenues (the total area of the four striped rectangles)
compared to the situation without price discrimination.
However, to avoid migration from high to low priced products, hotels introduce price
fences (Zhang & Bell, 2010, 2012) defined as the conditions under which specific rates
are offered on the market. Such hotel price fences may include day of the week,
duration of stay, guest characteristics (e.g. belonging to a club, government
employee), cancellation, amendment and payment terms, lead period, age and other
criteria for price differentiation presented in Table 11.1 (Hanks, Cross & Noland,
2002; Ivanov, 2013; Kimes, 2009; Kimes & Chase, 1998). In practice, rate fences are
integrated into the booking terms and conditions and determine the validity of the
specific room rate.
The set of price levels and their associated booking terms are referred to as price grid.
In order to avoid dissatisfaction and claims from customers, the price grid should be
completely clear to the customer at the time of booking and be consistent. Price
consistency (or price integrity) refers to the logic behind the set of prices and their
associated booking terms. Price grid for a hotel is consistent if prices are:
– Proportionate to the rights booking terms provide to the customers: the higher
the price a customer pays, the more rights to cancel and amend the booking he must
have, and vice versa. For instance, prices without free cancellation should be lower
than prices with free cancellation, while prices with compulsory full prepayment
should be lower than prices with payment on the spot.
– Stimulating customers who plan in advance: providing discounts for early
bookings rather than last-minute offers. Early bird rates stimulate customers to book
their stay earlier rather than postpone their decision. They are an effective way to
discriminate leisure from business travellers because leisure travellers have a longer
planning horizon. Nevertheless, when the forecasted occupancy for a particular date
is low, the revenue manager has greater incentive to provide very low rates for last
minute bookings because the pure economic logic says that it would be better to get
at least some revenues from the rooms that will otherwise remain vacant. However,
offering deeply discounted last minute rates punishes the guests who have booked
their rooms well in advance. Excessive use of last-minute offers by accommodation
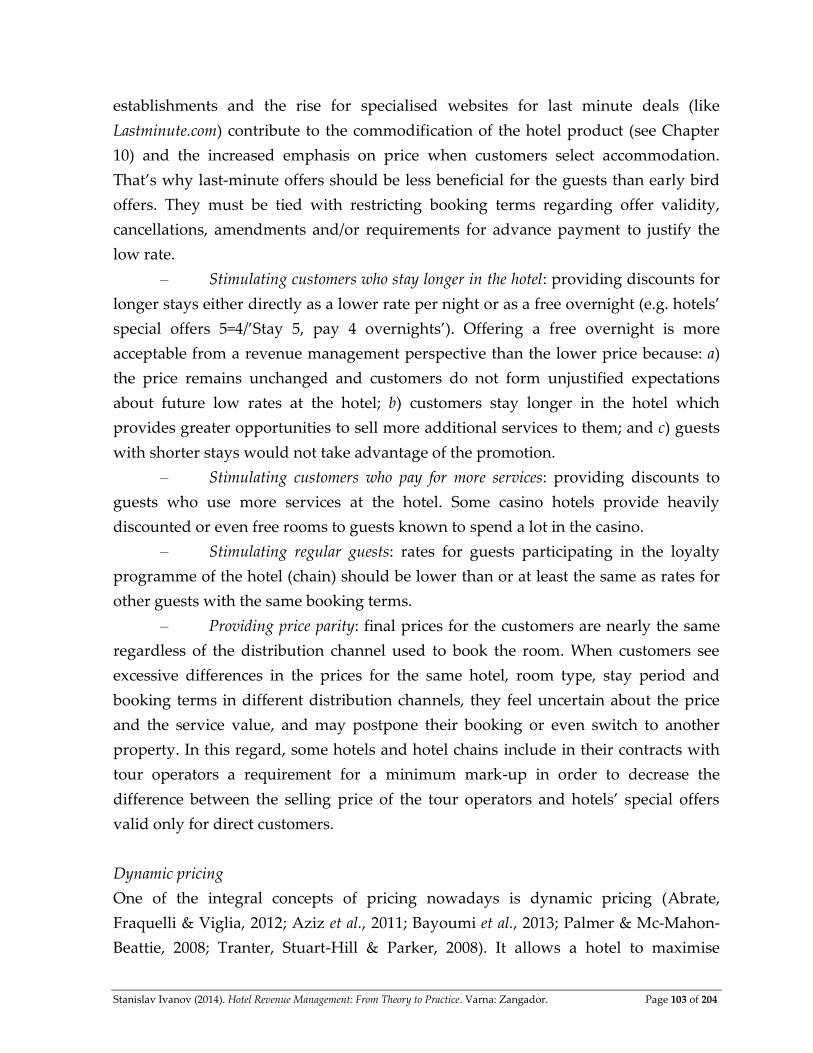
Stanislav Ivanov (2014). Hotel Revenue Management: From Theory to Practice. Varna: Zangador. Page 103 of 204
establishments and the rise for specialised websites for last minute deals (like
Lastminute.com) contribute to the commodification of the hotel product (see Chapter
10) and the increased emphasis on price when customers select accommodation.
That’s why last-minute offers should be less beneficial for the guests than early bird
offers. They must be tied with restricting booking terms regarding offer validity,
cancellations, amendments and/or requirements for advance payment to justify the
low rate.
– Stimulating customers who stay longer in the hotel: providing discounts for
longer stays either directly as a lower rate per night or as a free overnight (e.g. hotels’
special offers 5=4/’Stay 5, pay 4 overnights’). Offering a free overnight is more
acceptable from a revenue management perspective than the lower price because: a)
the price remains unchanged and customers do not form unjustified expectations
about future low rates at the hotel; b) customers stay longer in the hotel which
provides greater opportunities to sell more additional services to them; and c) guests
with shorter stays would not take advantage of the promotion.
– Stimulating customers who pay for more services: providing discounts to
guests who use more services at the hotel. Some casino hotels provide heavily
discounted or even free rooms to guests known to spend a lot in the casino.
– Stimulating regular guests: rates for guests participating in the loyalty
programme of the hotel (chain) should be lower than or at least the same as rates for
other guests with the same booking terms.
– Providing price parity: final prices for the customers are nearly the same
regardless of the distribution channel used to book the room. When customers see
excessive differences in the prices for the same hotel, room type, stay period and
booking terms in different distribution channels, they feel uncertain about the price
and the service value, and may postpone their booking or even switch to another
property. In this regard, some hotels and hotel chains include in their contracts with
tour operators a requirement for a minimum mark-up in order to decrease the
difference between the selling price of the tour operators and hotels’ special offers
valid only for direct customers.
Dynamic pricing
One of the integral concepts of pricing nowadays is dynamic pricing (Abrate,
Fraquelli & Viglia, 2012; Aziz et al., 2011; Bayoumi et al., 2013; Palmer & Mc-Mahon-
Beattie, 2008; Tranter, Stuart-Hill & Parker, 2008). It allows a hotel to maximise
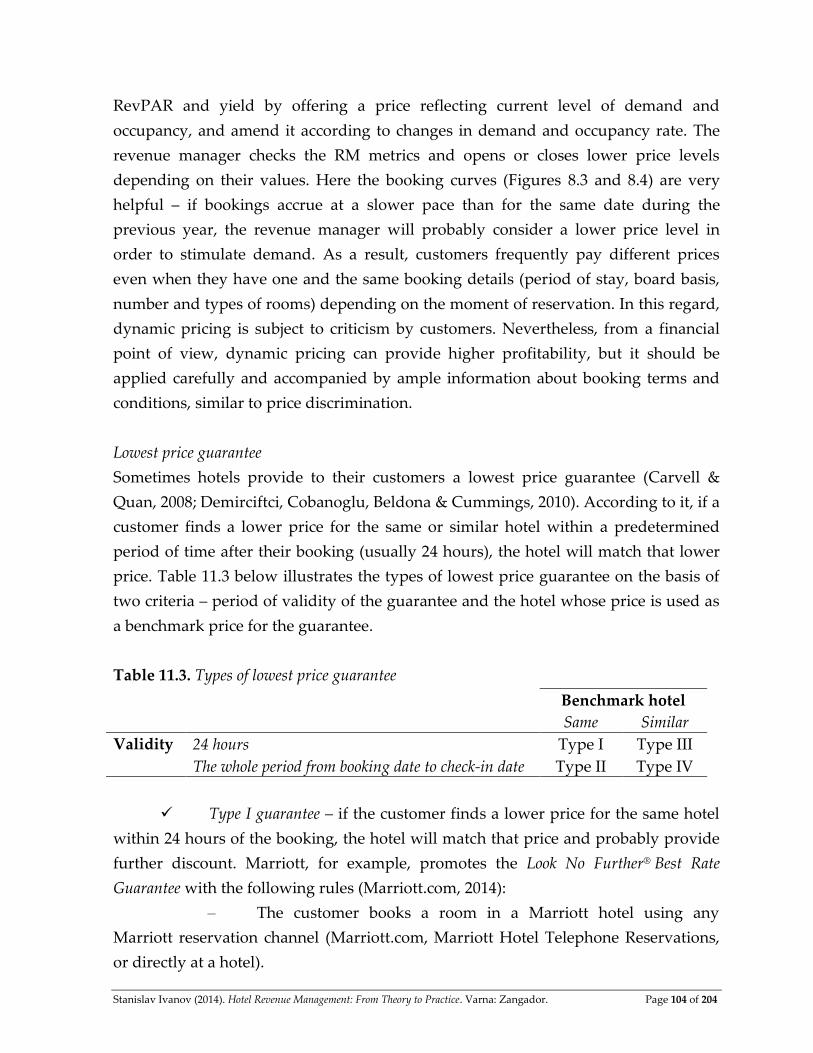
Stanislav Ivanov (2014). Hotel Revenue Management: From Theory to Practice. Varna: Zangador. Page 104 of 204
RevPAR and yield by offering a price reflecting current level of demand and
occupancy, and amend it according to changes in demand and occupancy rate. The
revenue manager checks the RM metrics and opens or closes lower price levels
depending on their values. Here the booking curves (Figures 8.3 and 8.4) are very
helpful – if bookings accrue at a slower pace than for the same date during the
previous year, the revenue manager will probably consider a lower price level in
order to stimulate demand. As a result, customers frequently pay different prices
even when they have one and the same booking details (period of stay, board basis,
number and types of rooms) depending on the moment of reservation. In this regard,
dynamic pricing is subject to criticism by customers. Nevertheless, from a financial
point of view, dynamic pricing can provide higher profitability, but it should be
applied carefully and accompanied by ample information about booking terms and
conditions, similar to price discrimination.
Lowest price guarantee
Sometimes hotels provide to their customers a lowest price guarantee (Carvell &
Quan, 2008; Demirciftci, Cobanoglu, Beldona & Cummings, 2010). According to it, if a
customer finds a lower price for the same or similar hotel within a predetermined
period of time after their booking (usually 24 hours), the hotel will match that lower
price. Table 11.3 below illustrates the types of lowest price guarantee on the basis of
two criteria – period of validity of the guarantee and the hotel whose price is used as
a benchmark price for the guarantee.
Table 11.3. Types of lowest price guarantee
Benchmark hotel
Same Similar
Validity 24 hours Type I Type III
The whole period from booking date to check-in date Type II Type IV
Type I guarantee – if the customer finds a lower price for the same hotel
within 24 hours of the booking, the hotel will match that price and probably provide
further discount. Marriott, for example, promotes the Look No Further® Best Rate
Guarantee with the following rules (Marriott.com, 2014):
– The customer books a room in a Marriott hotel using any
Marriott reservation channel (Marriott.com, Marriott Hotel Telephone Reservations,
or directly at a hotel).
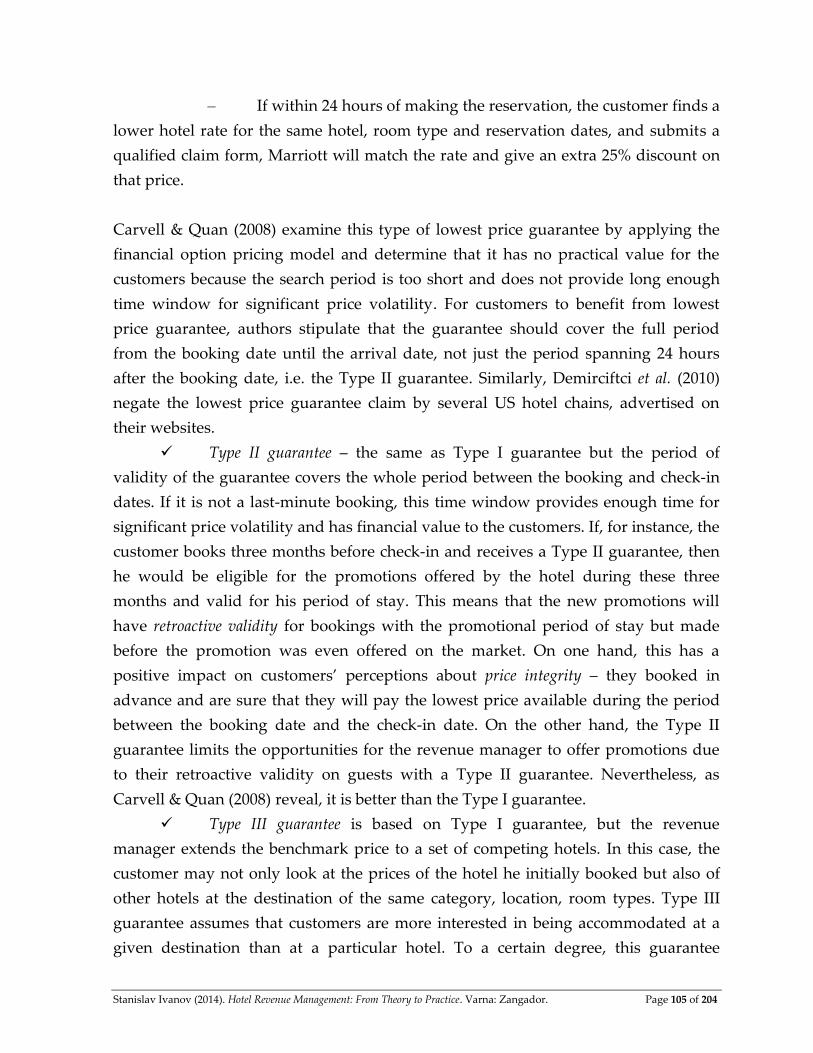
Stanislav Ivanov (2014). Hotel Revenue Management: From Theory to Practice. Varna: Zangador. Page 105 of 204
– If within 24 hours of making the reservation, the customer finds a
lower hotel rate for the same hotel, room type and reservation dates, and submits a
qualified claim form, Marriott will match the rate and give an extra 25% discount on
that price.
Carvell & Quan (2008) examine this type of lowest price guarantee by applying the
financial option pricing model and determine that it has no practical value for the
customers because the search period is too short and does not provide long enough
time window for significant price volatility. For customers to benefit from lowest
price guarantee, authors stipulate that the guarantee should cover the full period
from the booking date until the arrival date, not just the period spanning 24 hours
after the booking date, i.e. the Type II guarantee. Similarly, Demirciftci et al. (2010)
negate the lowest price guarantee claim by several US hotel chains, advertised on
their websites.
Type II guarantee – the same as Type I guarantee but the period of
validity of the guarantee covers the whole period between the booking and check-in
dates. If it is not a last-minute booking, this time window provides enough time for
significant price volatility and has financial value to the customers. If, for instance, the
customer books three months before check-in and receives a Type II guarantee, then
he would be eligible for the promotions offered by the hotel during these three
months and valid for his period of stay. This means that the new promotions will
have retroactive validity for bookings with the promotional period of stay but made
before the promotion was even offered on the market. On one hand, this has a
positive impact on customers’ perceptions about price integrity – they booked in
advance and are sure that they will pay the lowest price available during the period
between the booking date and the check-in date. On the other hand, the Type II
guarantee limits the opportunities for the revenue manager to offer promotions due
to their retroactive validity on guests with a Type II guarantee. Nevertheless, as
Carvell & Quan (2008) reveal, it is better than the Type I guarantee.
Type III guarantee is based on Type I guarantee, but the revenue
manager extends the benchmark price to a set of competing hotels. In this case, the
customer may not only look at the prices of the hotel he initially booked but also of
other hotels at the destination of the same category, location, room types. Type III
guarantee assumes that customers are more interested in being accommodated at a
given destination than at a particular hotel. To a certain degree, this guarantee
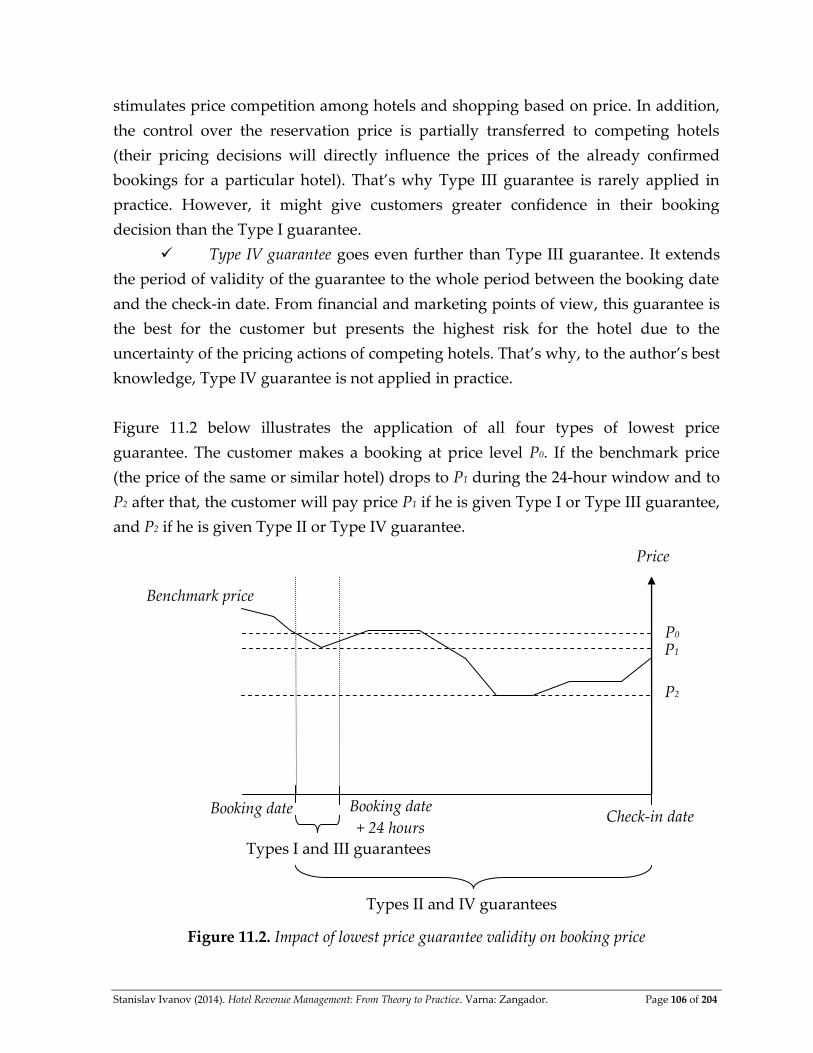
Stanislav Ivanov (2014). Hotel Revenue Management: From Theory to Practice. Varna: Zangador. Page 106 of 204
stimulates price competition among hotels and shopping based on price. In addition,
the control over the reservation price is partially transferred to competing hotels
(their pricing decisions will directly influence the prices of the already confirmed
bookings for a particular hotel). That’s why Type III guarantee is rarely applied in
practice. However, it might give customers greater confidence in their booking
decision than the Type I guarantee.
Type IV guarantee goes even further than Type III guarantee. It extends
the period of validity of the guarantee to the whole period between the booking date
and the check-in date. From financial and marketing points of view, this guarantee is
the best for the customer but presents the highest risk for the hotel due to the
uncertainty of the pricing actions of competing hotels. That’s why, to the author’s best
knowledge, Type IV guarantee is not applied in practice.
Figure 11.2 below illustrates the application of all four types of lowest price
guarantee. The customer makes a booking at price level P0. If the benchmark price
(the price of the same or similar hotel) drops to P1 during the 24-hour window and to
P2 after that, the customer will pay price P1 if he is given Type I or Type III guarantee,
and P2 if he is given Type II or Type IV guarantee.
Figure 11.2. Impact of lowest price guarantee validity on booking price
Check-in date Booking date
+ 24 hours Booking date
Types I and III guarantees
Types II and IV guarantees
Price
P1
P2
Benchmark price
P0
Stanislav Ivanov (2014). Hotel Revenue Management: From Theory to Practice. Varna: Zangador. Page 107 of 204
Price presentation (price framing)
Price framing refers to the way a price is presented to the customers. A lower price
may be presented either directly as a low price or as a discount from a higher price.
These concepts are different because they form a different expectation about the value
of the product. In the value framework of hotel selection (Figure 10.1), the higher
price serves as a reference price signalling greater gross value of the product (EGV),
while the discount signals the financial benefits the customer will gain from booking
now at the hotel (lower expected costs). When the price is not framed in the form of a
discount, customers have to use the prices of competing hotels as a benchmark to
form perceptions about the level of the price. Therefore, from a revenue management
perspective, framing the low price as a discount from a higher price is preferable (see
also Wirtz & Kimes, 2007). However, pricing research indicates that discounting in
general might not have a significant long-term effect on hotel’s financial performance
(Croes & Semrad, 2012a, b) as the decrease in the prices may not be compensated by a
respective increase in occupancy. In this regard Enz, Canina & Lomanno (2004)
propose that hotels even keep their rates at normal levels when competitors are
offering discounts.
11.4. General pricing strategies
A hotel may apply various pricing strategies as summarised in Table 11.4 below. The
specific strategic choice will depend on the type of accommodation establishment, its
product and offered services, revenue management goals, competition and other
pricing factors elaborated in Table 11.2.
Table 11.4. Summary of general pricing strategies
General pricing strategy Explanation
Demand (value) based pricing A hotel sets higher prices for market segments with higher willingness
to pay, lower price elasticity and higher perceptions of product’s value.
This is consistent with the RM goal of revenue maximisation but might
cause dissatisfaction among customers entitled to pay higher prices.
Cost based pricing Price is set on the basis of costs – fixed and variable. It is easy to apply
and comprehend but not related to the market factors and demand.
Market penetration pricing Setting a low price for a limited period of time for newly opened
accommodation establishments in order to attract demand. Applied
also by existing properties when they aim at expanding their market
share in a specific market segment.
Market skimming pricing Opposite of market penetration pricing – setting a high price in order to
capture the high demand for a novel product.
Product bundle pricing Selling two or more services as a package at a single price – e.g. spa
Stanislav Ivanov (2014). Hotel Revenue Management: From Theory to Practice. Varna: Zangador. Page 108 of 204
General pricing strategy Explanation
hotels offering packages with accommodation, food and some spa
procedures. The goal is to stimulate the consumption of additional
services in the hotel. The price of the package should be lower than the
sum of the prices of individual services included in the package.
Optional product pricing The basic price includes accommodation only or accommodation and
breakfast. All other services are paid for separately. Most widely
applied pricing strategy.
Psychological pricing Considers the psychological influence of numbers. For example, prices
ending at 9 (e.g. 99) are considered as promotional, while prices ending
at 0 (100) communicate value (see also (Collins & Parsa, 2006).
Promotional pricing Temporarily lowering of prices in order to be more price competitive
and attract bookings. The key point is that lower prices are valid for a
limited period of time.
Captive product pricing Applied when consumption of two or more products is interconnected
(e.g. printer and cartridge). The company sets a high price on one
product and a lower on the other – e.g. low price for the
accommodation and high prices for additional services (golf, tennis, spa
and wellness services, etc.)
11.5. 3D pricing model
Pricing is a complicated process and many factors need to be taken into account. This
book proposes a 3D-pricing model that may be used by accommodation
establishments when determining their prices, which is graphically depicted on
Figure 11.3. The 3D-pricing model has three dimensions (hence its name):
Length – price seasonality, i.e. prices vary depending on the period of
stay. Price seasonality depends on the type of accommodation establishment, its
product, category, served market segments, its geographic destination. Leisure hotels
located in mass tourist destinations establish many seasons (periods of validity of
their rates) with highest prices during the main tourist season and lowest prices
during off-season periods. On the other hand, more hotel services and higher star
ratings are associated with fewer seasonal variations in hotel prices (Espinet et al.,
2012).
Depth – price levels according to the distribution channels. Hotels
establish different rates for different distribution channels – direct sales, Global
Distribution Systems, online travel agencies, tour operators, travel agents, group
buying websites (see more details in Chapter 13).
Width – the hotel establishes different prices for different booking terms.

Stanislav Ivanov (2014). Hotel Revenue Management: From Theory to Practice. Varna: Zangador. Page 109 of 204
Figure 11.3. 3D-pricing model (author’s elaboration)
The three dimensions form a 3D coordinate system. If the price decreases from Period
1 to Period k, from Price level 1 to Price level n and from Tariff 1 to Tariff m, then the
price will be highest at point (Period 1; Price level 1; Tariff 1) and lowest at point (Period
k; Price level n; Tariff m). The vector connecting these two points we name ‘price erosion
vector’ and it shows the direction of the decrease in room rates of the hotel. The
specific combination of length, depth and width define several types of pricing
strategies in the 3D pricing model graphically illustrated and explained in Table 11.5.
Strategies vary from a basic pricing strategy (one season, one tariff, one price for all
distributors) to a full-scale/mature pricing strategy (many seasons, many tariffs, many
rate levels for distributors). They also have different applicability in the hotel
industry. Most widely used are the basic, L-, LD-, LW- and mature pricing strategies,
while D-, W- and WD- strategies have more limited application due to the importance
of seasonality in pricing the hotel product. The main advantage of the 3D pricing
model is that it provides a conceptual ground for the comparison and analysis of
various pricing strategies applied by the accommodation establishments. It may be
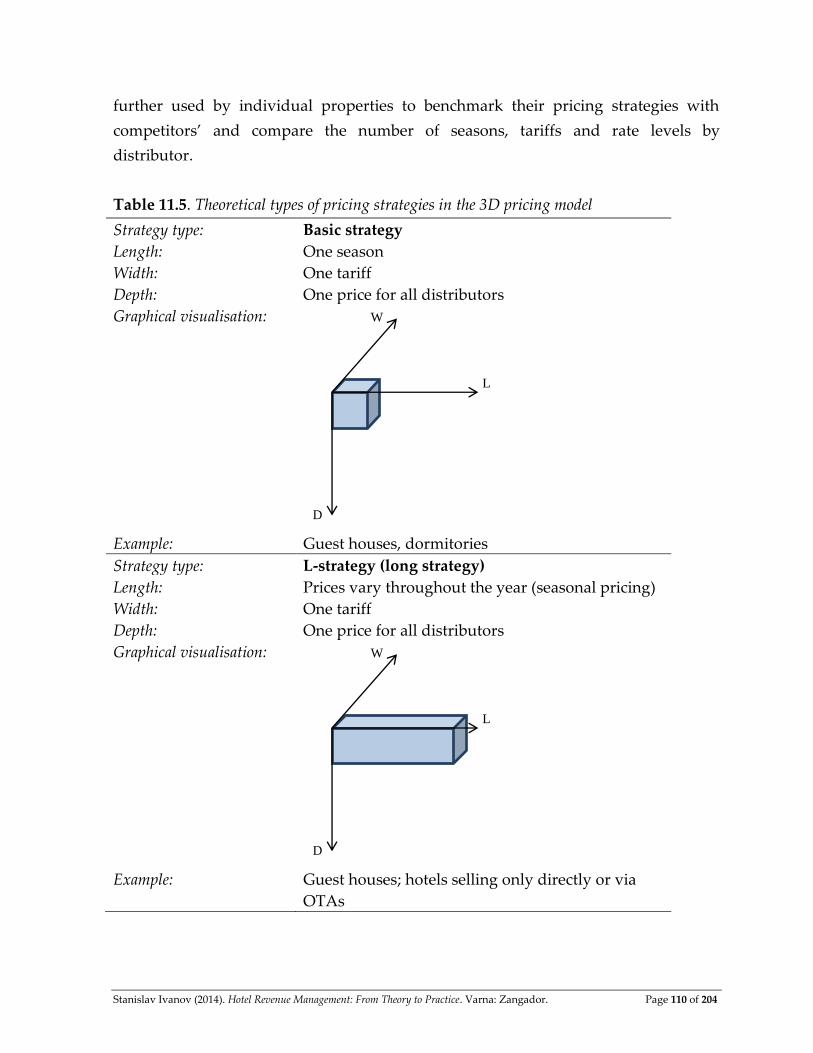
Stanislav Ivanov (2014). Hotel Revenue Management: From Theory to Practice. Varna: Zangador. Page 110 of 204
further used by individual properties to benchmark their pricing strategies with
competitors’ and compare the number of seasons, tariffs and rate levels by
distributor.
Table 11.5. Theoretical types of pricing strategies in the 3D pricing model
Strategy type: Basic strategy
Length: One season
Width: One tariff
Depth: One price for all distributors
Graphical visualisation:
Example: Guest houses, dormitories
Strategy type: L-strategy (long strategy)
Length: Prices vary throughout the year (seasonal pricing)
Width: One tariff
Depth: One price for all distributors
Graphical visualisation:
Example: Guest houses; hotels selling only directly or via
OTAs
L
W
D
L
W
D
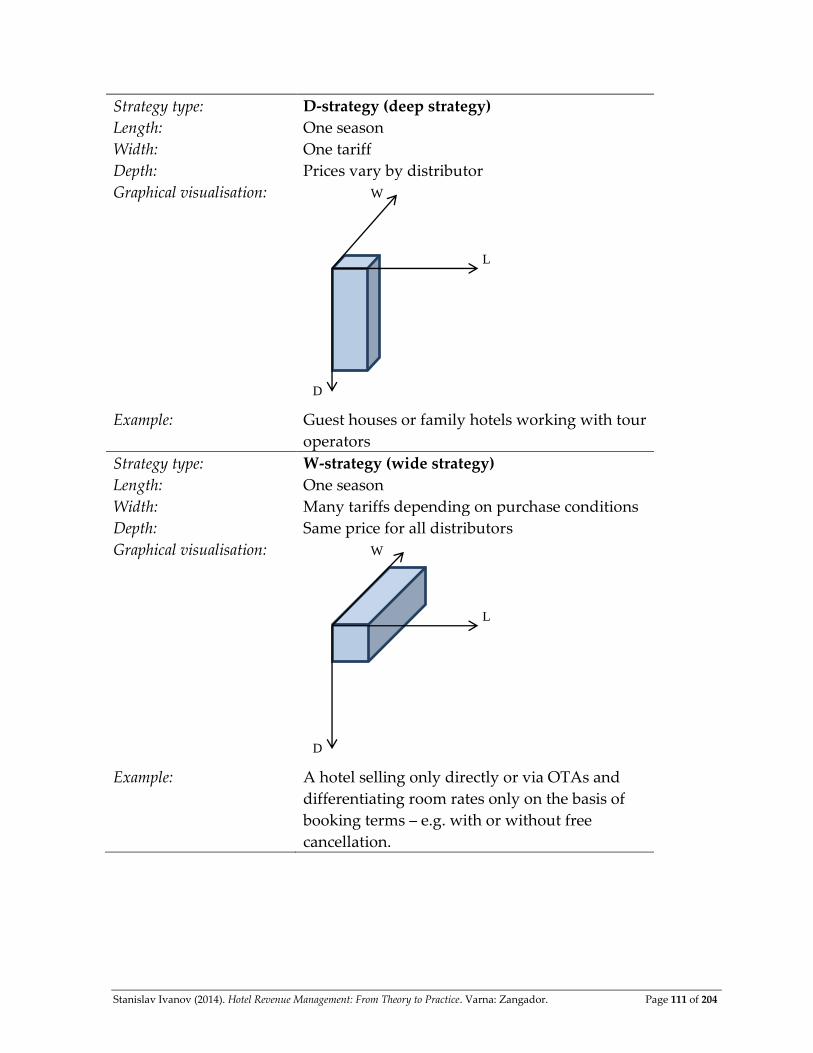
Stanislav Ivanov (2014). Hotel Revenue Management: From Theory to Practice. Varna: Zangador. Page 111 of 204
Strategy type: D-strategy (deep strategy)
Length: One season
Width: One tariff
Depth: Prices vary by distributor
Graphical visualisation:
Example: Guest houses or family hotels working with tour
operators
Strategy type: W-strategy (wide strategy)
Length: One season
Width: Many tariffs depending on purchase conditions
Depth: Same price for all distributors
Graphical visualisation:
Example: A hotel selling only directly or via OTAs and
differentiating room rates only on the basis of
booking terms – e.g. with or without free
cancellation.
L
W
D
L
W
D
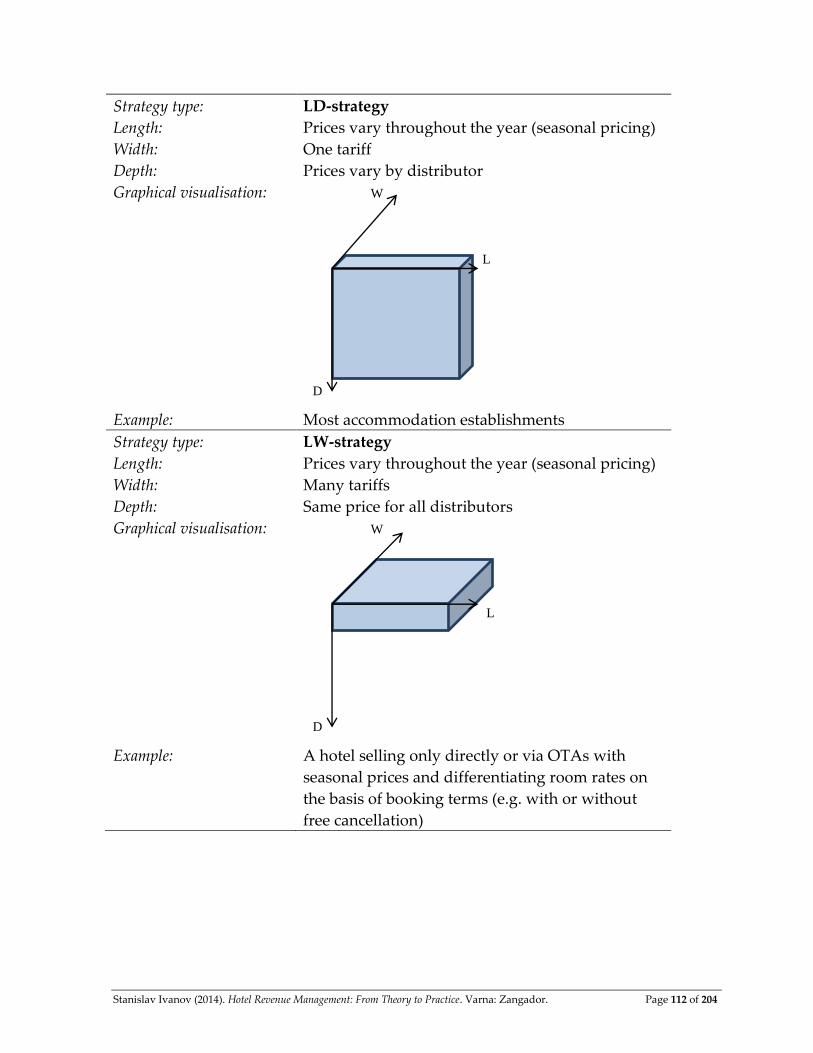
Stanislav Ivanov (2014). Hotel Revenue Management: From Theory to Practice. Varna: Zangador. Page 112 of 204
Strategy type: LD-strategy
Length: Prices vary throughout the year (seasonal pricing)
Width: One tariff
Depth: Prices vary by distributor
Graphical visualisation:
Example: Most accommodation establishments
Strategy type: LW-strategy
Length: Prices vary throughout the year (seasonal pricing)
Width: Many tariffs
Depth: Same price for all distributors
Graphical visualisation:
Example: A hotel selling only directly or via OTAs with
seasonal prices and differentiating room rates on
the basis of booking terms (e.g. with or without
free cancellation)
L
W
D
L
W
D
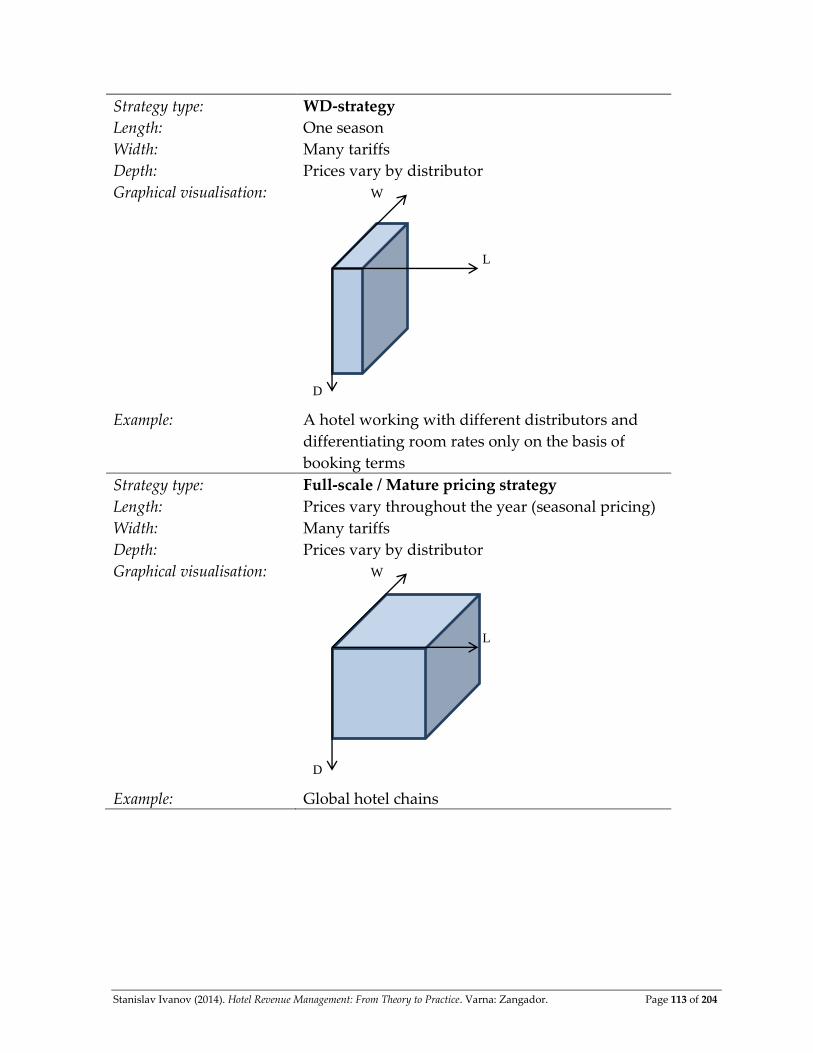
Stanislav Ivanov (2014). Hotel Revenue Management: From Theory to Practice. Varna: Zangador. Page 113 of 204
Strategy type: WD-strategy
Length: One season
Width: Many tariffs
Depth: Prices vary by distributor
Graphical visualisation:
Example: A hotel working with different distributors and
differentiating room rates only on the basis of
booking terms
Strategy type: Full-scale / Mature pricing strategy
Length: Prices vary throughout the year (seasonal pricing)
Width: Many tariffs
Depth: Prices vary by distributor
Graphical visualisation:
Example: Global hotel chains
L
W
D
L
W
D

Stanislav Ivanov (2014). Hotel Revenue Management: From Theory to Practice. Varna: Zangador. Page 114 of 204
Chapter 12
NON-PRICING HOTEL REVENUE MANAGEMENT TOOLS
In this chapter we shall concentrate on the non-pricing RM tools used in the Rooms
Division of a hotel – the application of these tools in other departments of the hotel
will be discussed in Chapter 14. Non-pricing revenue management tools concentrate
on inventory management (i.e. the quantity of supply) and include capacity
management, overcontracting and overbookings, room availability guarantee, length-
of-stay control, and 100% satisfaction guarantee (see Figure 1.1.). Capacity
management and overbookings are the two most influential techniques and, at the
same time, the most controversial issues in revenue management (Karaesmen & van
Ryzin, 2004).
12.1. Capacity management
Capacity management refers to the set of activities dedicated to a hotel’s capacity
control. Pullman & Rogers (2010) distinguish between strategic and short-term
(tactical) capacity management decisions. The first include capacity expansion (e.g.
number of rooms), carrying capacity (the optimal use of physical capacity before
tourist’s experience deteriorates, e.g. optimal occupancy rate), and capacity flexibility
(a hotel’s ability to respond to fluctuations in demand by changing its capacity by
closing or opening wings/floors). Tactical decisions refer to the set of activities related
to managing capacity on a daily basis – work schedules, guest arrival/departure
times, service interaction time, application of queuing and linear programming
models to service processes, customers’ participation in the service process, etc.
From a narrow perspective, a hotel’s capacity refers to the Rooms Division capacity
only, i.e. the total number of overnights a hotel can serve on any given date (so called
‘available room capacity’). Due to various reasons (facility repairs or damage,
accommodation of employees, etc.), some of the rooms may not be available for a
particular date. That’s why the available capacity of a hotel may vary on a daily basis
Stanislav Ivanov (2014). Hotel Revenue Management: From Theory to Practice. Varna: Zangador. Page 115 of 204
by a few rooms. A hotel can efficiently decrease its available room capacity (and save
some fixed costs) by closing wings or floors, or expand it (and increases its revenue
base) by offering day-let rooms, but in any case, room capacity has very limited
flexibility as defined by Pullman & Rogers (2010). From a wider perspective, a hotel’s
capacity also includes the capacity of F&B outlets, golf course, function rooms and
other revenue centres that provide greater options for capacity management. This
will be analysed in the next chapter.
12.2. Overcontracting and overbooking
Overcontracting refers to the signing of contracts with distributors (GDSs, OTAs, tour
operators, travel agents, etc.) for a greater number of rooms than the physical
capacity of the hotel. Overcontracting is necessary because distributors do not utilise
their entire allotments in hotels. Tour operators, for example, contract more rooms in
hotels at a destination than the number of seats they have in (charter) flights in order
to have greater flexibility and choice of accommodation establishments for their
customers. However, such opportunistic behaviour from their side puts hotels in a
vulnerable position where they are not sure whether the contracts with the tour
operators will be fulfilled, or what percentage of the contracted rooms will effectively
be booked and used by them. To protect themselves, hotels fight overcontracting by tour
operators with overcontracting on their side. This is especially valid for seaside properties
at mass tourism destinations where hotels are largely perceived as substitutable and
their product is commoditised.
Overbooking relates to confirming to distributors and direct customers bookings for a
greater number of rooms than the available capacity of the hotel. It is based on the
assumption that some customers that have booked rooms will not appear for check-in
(so called ‘no show’), others will cancel or amend their bookings at the last minute,
while still others will prematurely break their stay in the hotel (due to illness,
personal reasons, traffic, bad weather, force majeure, or other reasons). To protect
itself from losses the hotel confirms more rooms than its available room capacity with
the expectation that the number of overbooked rooms will match the number of no
shows, last minute cancellations and amendments. Overcontracting and overbooking
as RM tools are closely connected as shown on Figure 12.1.

Stanislav Ivanov (2014). Hotel Revenue Management: From Theory to Practice. Varna: Zangador. Page 116 of 204
Section A on Figure 12.1 depicts the available room capacity of the hotel for a
particular date. The sum of all sections A+B+C+D is the total number of contracted
rooms, i.e. the sum of all allotments of distributors in the hotel for a given date. The
difference between the contracted rooms and the available room capacity defines the
overcontracted rooms (B+C+D). The sum of sections A+B+C illustrates the number of
rooms for which the hotel has received booking requests, leaving section D as the
contracted but unrequested rooms. Some booking requests will be confirmed (A+B)
while others will not be granted (section C). The number of rooms (B) confirmed
above the available room capacity defines the number of overbooked rooms.
Figure 12.1. Relationship between overcontracting and overbooking of rooms
Overbookings are a widely analysed tool (Talluri & van Ryzin, 2005; Chiang et al,
2007; Lan, Ball & Karaesmen, 2007), also in the framework of the hotel industry
(Badinelli, 2000; Bitran & Mondschein, 1995; Guadix et al., 2010; Ivanov, 2006, 2007a,
2014; Koide & Ishii, 2005; Netessine & Shumsky, 2002; Pullman & Rogers, 2010; Toh &
de Kay, 2002; Tranter, Stuart-Hill & Parker, 2008). The great interest in management
of overbookings is entirely justified because of the criticism overbooking policies
receive, especially in its legal and ethical considerations, elaborated further in
Chapter 15.
When managed properly, overbookings do not ordinarily cause serious problems. If,
for instance, a hotel has confirmed X rooms on top of its available room capacity and
the customers for the same number of rooms do not arrive for check-in, then the
number of occupied rooms for this particular date will be equal to the available room
Available room capacity
Overbooked rooms
Booked rooms
A+B
Overcontracted rooms
B+C+D
Contracted rooms
A+B+C+D
Contracted but
unrequested rooms
A
B
C
D
Requested rooms
A+B+C
Contracted and requested
but unconfirmed rooms
Stanislav Ivanov (2014). Hotel Revenue Management: From Theory to Practice. Varna: Zangador. Page 117 of 204
capacity of the hotel and the total room revenues from overnights, ceteris paribus,
will be at maximum. However, if no shows, last-minute cancellations and
amendments are fewer than the number of the overbookings (more customers arrive
for check-in than the available room capacity), some of the guests will not be
accommodated and should be walked to other hotels which thus incurs overbooking
costs for the hotel. Overbooking costs have two elements: a) direct financial expenses for
walking the guests to another property (cost of accommodation in the alternative
hotel, transportation of guests to it, compensation for inconveniences caused); and b)
brand image (customer goodwill) losses due to the walking of guests. While the former
are easy to calculate, the latter are more important for the long-term relationships of
the hotel with its customers, yet more difficult to calculate. On the other hand, if the
number of no shows, last-minute cancellations and amendments is greater than the
number of overbookings, part of the available capacity of the hotel remains
unoccupied and it loses revenues. Lost revenue from non-guaranteed reservations
equals the room rate, while lost revenue from guaranteed bookings is lower and
equals the room rate deducted with the cancellation charges. Therefore, hotels must
plan carefully the optimal level of overbookings (Hadjinicola & Panayi, 1997; Ivanov,
2006, 2007, 2014; Koide & Ishii, 2005; Netessine & Shumsky, 2002). Netessine and
Shumsky (2002: 39) indicate that the optimal overbooking level balances the lost
revenue from empty rooms with the overbooking costs. Appendices 12.1, 12.2 and
12.3 elaborate the mathematical models for calculating the optimal overbooking
levels for one-, two- and three-room type hotels using the expected marginal room
revenue technique.
Regardless how well a hotel plans its optimal level of overbookings, differences
between planned and actual number of no shows, last-minute cancellations and
amendments are inevitable. When more guests appear for check-in, the hotel must
walk some of them to a different property. This requires the front office manager to
make several decisions about walking guests (Baker, Bradley & Huyton, 1994; Ivanov,
2006):
Who to be walked?
A suitable approach is to accommodate guests on a ‘first come-first served’ basis and
walking late arrivals to other hotels. This approach, however, does not take into

Stanislav Ivanov (2014). Hotel Revenue Management: From Theory to Practice. Varna: Zangador. Page 118 of 204
account the different importance of hotel’s customers. The front office manager
should also consider:
Length-of-stay – guests with shorter stays (one night) could be walked
instead of those with longer stays. Resort hotels could offer to already accommodated
guests to spend their last night at a luxury airport hotel for free (Wirtz et al., 2003:
224).
Guests’ loyalty – walking a regular customer might incur more negative
impacts than a first-comer. Therefore they should be walked last.
Room rate – usually hotels walk guests who have paid the lowest rates. This
means that hotels prefer to accommodate direct customers at the expense of those
sent by tour operators and travel agents. Such an approach, although financially
sound in the short-run, might cause the termination of the contract between the hotel
and the tour operator/travel agent in the long-run, especially if the hotel regularly
walks guests of tour operators and travel agents (Kotler, Bowen, Makens, 2006).
Where to walk guests?
A hotel must redirect its guests to another establishment of the same or higher
category. If this is impossible (there is no other similar hotel in the city/resort or no
rooms are available), overbooked guests could be walked to a hotel of a lower
category but they must receive a refund equal to the price difference between the two
hotels. To face the overbooking situation prepared, it is recommended that the hotel
has a contract (or at least a verbal agreement) with two or three other hotels in the
area to which guests will be walked. The reverse situation is also possible – if other
hotels are overbooked the hotel in question might receive bookings (and revenues!)
from them provided rooms are available. Therefore, each hotelier must keep good
relationships with managers of competing hotels, because it is they who will help in case of a
serious overbooking.
At the practical level, hotel managers are required to establish service recovery
programmes with standard procedures to be followed by their front office managers
if they find that too many rooms have been overbooked. Baker, Bradley & Huyton
(1994: 131-132) propose a detailed multi-step procedure for the front office manager:
Define the number of booked rooms.
Check the arrivals list, types of bookings (guaranteed or nonguaranteed),
booking remarks and room status to identify possible late or early departures, no
Stanislav Ivanov (2014). Hotel Revenue Management: From Theory to Practice. Varna: Zangador. Page 119 of 204
shows, last-minute cancellations and amendments. This will show how many rooms
are expected to be occupied for the particular date.
Compare the number of booked rooms and the number of rooms expected
to be occupied – the difference between them shows the excessive overbooking and
the potential number of guests that need to be walked.
Search for internal sources to increase available capacity of the hotel to
accommodate guests – different room type in the same hotel (upgrade/downgrade),
rooms used by hotel employees.
Book necessary rooms in an alternate hotel in nearest vicinity.
Decide who to walk.
Arrange transportation to the alternative hotel and compensation for the
inconvenience.
Inform the general manager, revenue manager and everyone concerned in
the hotel.
What compensation to provide?
Obviously, when a guest is denied service and must be walked to another property,
he has to receive monetary or non-monetary compensation, e.g. direct cash refund,
complimentary meal, a free voucher for a spa centre or casino, bottle of
wine/champagne, or other gift. The form of compensation is directly linked with the
satisfaction level. Noone & Lee (2011) explain that cash-based overcompensation
results in significantly higher satisfaction than normal compensation or voucher-
based compensation.
Looking at the booking curve for a particular date (see Figure 8.3), the revenue
manager might decide that the number of accrued bookings for that date is high
enough and no more bookings should be confirmed. In this situation, the revenue
manager has potentially two options:
Option 1: Close the date for sale and inform the distributors about the closed
date.
Option 2: Do not close the date but increase the price significantly (e.g. 2-4
times above the normal rate – called ‘prohibitive price’). The aim is to deter bookings
for that particular date but not close the date for sale, i.e. the hotel will show
availability in GDSs, OTAs, and other hotel reservation systems. If, however, the
demand is very high and there are sales at this high price, then the front office
Stanislav Ivanov (2014). Hotel Revenue Management: From Theory to Practice. Varna: Zangador. Page 120 of 204
manager may walk guests to alternative hotels with the lower prices (or on the basis
of other possible criteria).
Obviously, the second option provides greater flexibility but hoteliers risk creating an
image of a too-expensive property. It is possible that customers are dissuaded from
making future bookings at the hotel (even at normal rates) due to their perceptions of
it being too expensive. However, the opposite situation is also possible – the normal
rates for the hotel being perceived as bargain prices compared to the prohibitive
price. Further research is needed in this field to understand the reaction of potential
customers to such price dynamics as no definite answer may yet be given from a
theoretical perspective. In any case, great care must be taken when prohibitive pricing
is applied.
12.3. Room availability guarantee
Walking guests with confirmed bookings to another hotel creates stress for them and
loss of brand image/customer goodwill for the hotel. To eliminate their perceived risk
from potential overbooking, hotel chains provide a room availability guarantee to
selected guests (e.g. members of a loyalty programme) according to which guests will
be accommodated in the hotel, regardless of its occupancy rate, provided the guests
made the booking a certain minimum number of days before check-in.
Intercontinental Hotel Group, for instance, gives a room availability guarantee to its
Platinum Elite Rewards Club members subject to the following conditions (IHG,
2014):
Requires 72 hours advance notice.
Platinum Elite members are guaranteed one guest room for personal use for
reservations made at least 72 hours prior to the date of arrival, except during special
events that result in extraordinary demand, as determined solely by the hotel.
Guaranteed room availability is not valid for Reward Nights.
These reservations can only be made through the IHG Rewards Club Service
Center.
Room availability guarantee does not result in direct revenues for the hotel but it
decreases the perceived risk for the guest. It is not provided to all guests because
walking guests in case of an overbooking then becomes impossible – the hotel cannot
walk guests with a room availability guarantee.

Stanislav Ivanov (2014). Hotel Revenue Management: From Theory to Practice. Varna: Zangador. Page 121 of 204
12.4. Length-of-stay control
Length-of-stay control is a much neglected area of research (Ismail, 2002; Kimes &
Chase, 1998; Vinod, 2004), yet widely applied in hotel business practice. Through it,
hotels set limits on the minimum and, rarely, maximum number of nights in the
customer bookings. Length-of-stay control allows hotels to protect themselves from
losing revenues when customers book rooms for short stays in periods of huge
demand (e.g. during special events such as exhibitions, fairs, congresses, sport events,
etc.). It also provides the possibility to generate additional revenues from overnights
in days when demand is historically low (e.g. when a business hotel requires
compulsory stay over Saturday nights for all bookings that include a Friday night).
Vinod (2004) highlights that length-of-stay control has one major disadvantage – it is
static and, therefore, not very flexible. In practice, limitation on the length-of-stay
should be explicitly stated in the pricing section of hotel’s website and hotel rate’s
conditions in OTAs’/GDSs’/tour operators’ websites. However, it is also possible that
the length-of-stay is not explicitly stated but implied – this is the case when the hotel
does not appear at all in the list of hotels in the OTAs’/GDSs’/tour operators’ websites
for booking requests for stays shorter than the minimum required number of
overnights during a particular period. The maximum length of stay is very rarely
used by hotels – usually when a hotel would be closed after a particular date due to
the start of renovation works or the end of the season.
Length-of-stay control may be successfully implemented only if it is applied by most
of the hotels at a destination during a given period. If, for example, only a handful of
properties out of many hotels available require that guests spend a minimum number
of nights during a particular period of time, they will not be competitive because
potential customers would very easily find and book rooms in properties that do not
impose such limitations. Cooperation among hotels at a destination proves, again, to
be a prerequisite for successful revenue management.
12.5. 100% Satisfaction guarantee
A service guarantee promises the customer that if the service delivery system does
not meet certain performance standards, he is entitled to an economic and/or
noneconomic payout (Baker & Collier, 2005: 197). Some hotel chains like Hampton
Inn (Hampton Inn, 2014) provide their customers a 100% satisfaction guarantee. If
Stanislav Ivanov (2014). Hotel Revenue Management: From Theory to Practice. Varna: Zangador. Page 122 of 204
guests are not completely satisfied with their stay, they do not pay for it. However, in
order to protect the financial interests of the chain and dissuade opportunistic
behaviour of some customers, this guarantee may be used by a customer only once.
The idea behind this limitation is that, if a customer is really dissatisfied and wants a
refund, he would not make a booking in the same hotel chain again. If, however, he
does this it means that the previous time he wasn’t entirely dissatisfied but wanted to
take advantage of the guarantee. That’s why when he makes a booking in any hotel of
the chain after the guarantee has been used, the customer is explicitly advised in
writing that he cannot be provided a 100% satisfaction guarantee. Considering its
serious financial implications and relatively low loyalty of customers to particular
hotels, this guarantee is not feasible for application by individual properties but by
chains only. The 100% satisfaction guarantee does not directly increase the revenues
of a hotel, but decreases the risk perceived by the customer in his choice of an
accommodation establishment (see Chapter 10).

Stanislav Ivanov (2014). Hotel Revenue Management: From Theory to Practice. Varna: Zangador. Page 123 of 204
Appendix 12.1. The basic model of overbookings1
This appendix presents the derivation of the optimal number of overbooked rooms
by applying the expected marginal room revenue technique (Ivanov, 2006; Netessine
& Shumsky, 2002).
Let the random variable X be the number of rooms of guests, holding confirmed
bookings for a specific date, that do not arrive at the hotel (no shows, last minute
cancellations, last minute amendments of reservations of already accommodated
guests). For simplicity we assume that the hotel sells all its rooms at one rate r (in
Appendices 12.2 and 12.3 this assumption would be removed and the situation of two
and three types of rooms would be analysed, respectively). If the hotel sells all its
rooms without overbookings, but guests for rooms do not arrive, the hotel will
have missed revenues of . Therefore the hotel can increase its revenues if it
confirms rooms above its available capacity. If the guests for rooms do not
arrive the number of the occupied rooms will be equal to its available capacity and
the total revenues TR will be maximum.
If the actual number of last minute cancellations, amendments and no shows is
, the number of rooms of guests holding confirmed bookings is greater than
the available capacity of the hotel and some of them should be walked to
other hotels, for which the hotel incurs overbookings costs c per room/night, or total
. If the last minute cancellations, amendments and no shows are ,
the hotel will have missed revenues of although less than compared with
the situation without overbookings.
In order to calculate the optimal number of overbookings , we must define the
marginal revenues MRob and marginal cost MCob associated with the overbookings.
Let F(X) be the distribution function of X, showing the probability of guests holding
confirmed bookings for X number of rooms that do not arrive at the hotel and their
rooms remain unoccupied. The total costs of the overbookings TCob include the net
costs and missed revenues. There are two possible situations:
1 Some of the text and the formulas in this appendix have been adapted from Ivanov (2006) with the permission of
the publisher

Stanislav Ivanov (2014). Hotel Revenue Management: From Theory to Practice. Varna: Zangador. Page 124 of 204
If ,
If , [ ]
Therefore, the total costs of overbookings TCob are:
(1) [ ]
Marginal costs of the overbookings MCob are found through differentiating (1):
(2)
[ ]
On the other hand, the hotel does not receive any revenues from the unoccupied
rooms, as well as from walking guests to other hotels due to overbookings (this
assumption would be removed later in this appendix). Thus, its marginal revenues
are null:
(3) MRob=0
The hotel can afford to overbook until the marginal revenues from the overbookings
exceed the marginal costs from them:
(4)
In microeconomic analysis total revenues are maximum when MR=MC, but because
we look for an integer solution, the equation may not be kept. Substituting (2) and (3)
in (4) leads to:
(5) [ ]
(6)
(7)
(8)
The optimal number of overbookings is the smallest integer for which inequality
(8) is fulfilled (Ivanov, 2006; Netessine & Shumsky, 2002).

Stanislav Ivanov (2014). Hotel Revenue Management: From Theory to Practice. Varna: Zangador. Page 125 of 204
Inequality (8) may be illustrated with the following empirical example:
Example 12.1: Let a hotel have a capacity of 230 rooms. The revenue manager finds
that the number of last-minute cancellations, amendments and no shows have a
normal distribution with a mean ̅ rooms and a standard deviation σ=7.5 rooms.
The price of one room at the hotel is r=130 EUR and the net costs of walking a guest
are c=165 EUR. Substituting the initial data in (8) we get:
(9)
With the help of Excel through the function “=NORMINV(0,4407;10;7,5)” we find that
to ̅ , σ=7.5 and F(X)=0.4407 corresponds X=8.88104. Therefore, the optimal
number of overbookings is rooms, and the maximum number of confirmed
bookings for a particular date should not exceed 230+9=239 rooms. Of course, in
practice the statistical distribution of X for a particular hotel might not be normal but
some other type and this other type of distribution should be used in the calculation
of .
Additional considerations of the basic model
1. The basic mathematical model assumes that a hotel offers all its rooms at only
one rate, which will not be the case in reality. As discussed in details in Chapter 11,
hotels differentiate room rates on the basis of kind of room (single, double, triple),
type of room (standard, deluxe, studio, suite, apartment), days of the week, market
segments, market intermediaries etc. This complicates the price structure and
calculation of the optimal number of overbookings. Appendix 12.2 overcomes this
weakness of the basic model by elaborating the optimal overbooking limits for a hotel
with two room types, while Appendix 12.3 illustrates the case of a 3-room type hotel.
2. Some hotels have a joint reservation policy with other hotels belonging to the
same owners – they act as one hotel, have the same rates and guests are
accommodated at any of them (they learn the name of the exact hotel at the day of
arrival). The Hotels Center 1, Center 2 and Center 3 in Rome are an excellent example
(http://www.centerhotelrome.com). In this situation, we must calculate a joint
optimal number of overbookings for the participating hotels which might be different

Stanislav Ivanov (2014). Hotel Revenue Management: From Theory to Practice. Varna: Zangador. Page 126 of 204
from the sum of the separate optimal numbers. For simplicity we shall examine the
situation of two hotels, but it is easily generalisable for three and more hotels.
Let X1 be the discrete random variable of last-minute cancellations, amendments and
no shows at the first hotel. Its specific values are X1i with probabilities and
cumulative probabilities ∑ . We denote with X2 the discrete
random variable of last-minute cancellations, amendments and no shows at the
second hotel. Its specific values are X2i with probabilities and cumulative
probabilities ( ) ∑ .
The joint discrete random variable of last-minute cancellations, amendments and no
shows at both hotels is . Its specific values are
[ { } { } { }]. The probabilities are:
(17) ∑ ∑ ( ) ,
The cumulative probabilities of X are:
(18) ∑
The total optimal number of overbookings for both hotels is the smallest integer
for which inequality (8) is fulfilled, given the cumulative probabilities of (17). It can
be greater, equal to or less than the sum of the separate optimal numbers
[(see Ivanov (2006) for illustrative examples].
3. The basic model assumes that the marginal revenue from the unoccupied room
is null (see Equation (3) in this Appendix). While this is valid for non-guaranteed
bookings, in practice, hotels actually do receive some revenue m in the form of a
cancellation charge in case of late cancellations of their guaranteed bookings. The
total revenues from cancellation charges for the unoccupied rooms will be:
(19) [ ]
Differentiating (19) we find the marginal revenues of the unoccupied rooms to be:
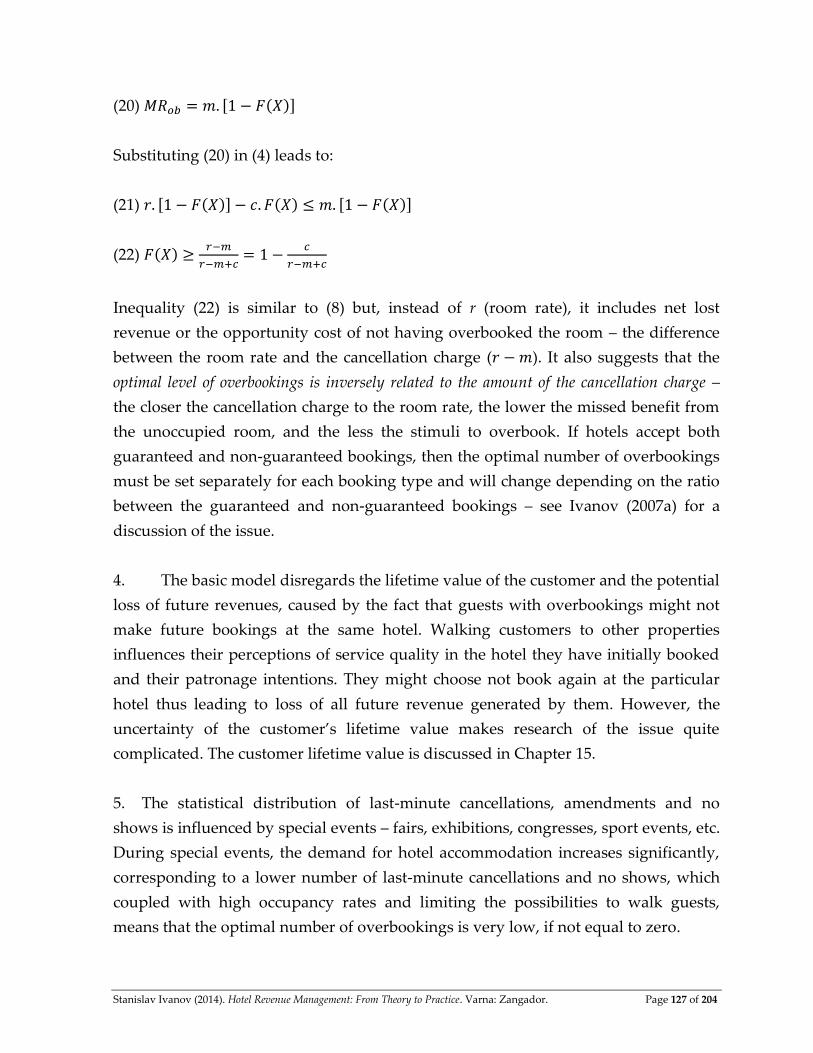
Stanislav Ivanov (2014). Hotel Revenue Management: From Theory to Practice. Varna: Zangador. Page 127 of 204
(20) [ ]
Substituting (20) in (4) leads to:
(21) [ ] [ ]
(22)
Inequality (22) is similar to (8) but, instead of r (room rate), it includes net lost
revenue or the opportunity cost of not having overbooked the room – the difference
between the room rate and the cancellation charge ( ). It also suggests that the
optimal level of overbookings is inversely related to the amount of the cancellation charge –
the closer the cancellation charge to the room rate, the lower the missed benefit from
the unoccupied room, and the less the stimuli to overbook. If hotels accept both
guaranteed and non-guaranteed bookings, then the optimal number of overbookings
must be set separately for each booking type and will change depending on the ratio
between the guaranteed and non-guaranteed bookings – see Ivanov (2007a) for a
discussion of the issue.
4. The basic model disregards the lifetime value of the customer and the potential
loss of future revenues, caused by the fact that guests with overbookings might not
make future bookings at the same hotel. Walking customers to other properties
influences their perceptions of service quality in the hotel they have initially booked
and their patronage intentions. They might choose not book again at the particular
hotel thus leading to loss of all future revenue generated by them. However, the
uncertainty of the customer’s lifetime value makes research of the issue quite
complicated. The customer lifetime value is discussed in Chapter 15.
5. The statistical distribution of last-minute cancellations, amendments and no
shows is influenced by special events – fairs, exhibitions, congresses, sport events, etc.
During special events, the demand for hotel accommodation increases significantly,
corresponding to a lower number of last-minute cancellations and no shows, which
coupled with high occupancy rates and limiting the possibilities to walk guests,
means that the optimal number of overbookings is very low, if not equal to zero.
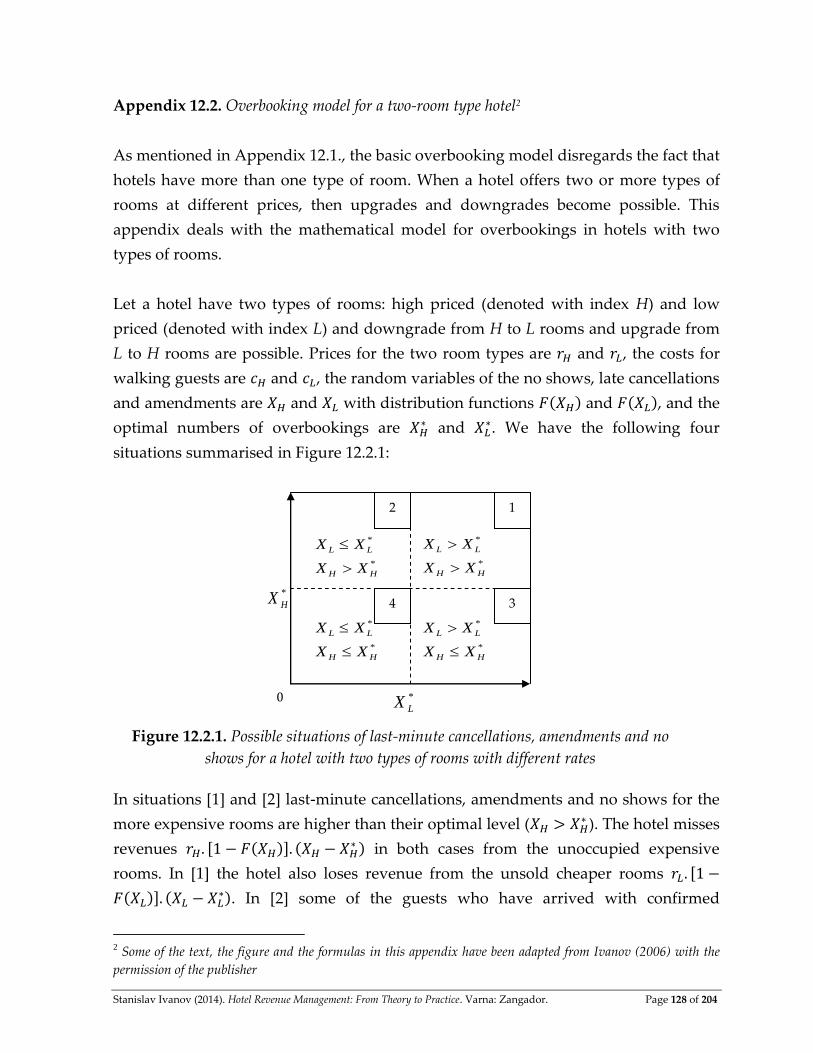
Stanislav Ivanov (2014). Hotel Revenue Management: From Theory to Practice. Varna: Zangador. Page 128 of 204
Appendix 12.2. Overbooking model for a two-room type hotel2
As mentioned in Appendix 12.1., the basic overbooking model disregards the fact that
hotels have more than one type of room. When a hotel offers two or more types of
rooms at different prices, then upgrades and downgrades become possible. This
appendix deals with the mathematical model for overbookings in hotels with two
types of rooms.
Let a hotel have two types of rooms: high priced (denoted with index H) and low
priced (denoted with index L) and downgrade from H to L rooms and upgrade from
L to H rooms are possible. Prices for the two room types are and , the costs for
walking guests are and , the random variables of the no shows, late cancellations
and amendments are and with distribution functions and , and the
optimal numbers of overbookings are and
. We have the following four
situations summarised in Figure 12.2.1:
In situations [1] and [2] last-minute cancellations, amendments and no shows for the
more expensive rooms are higher than their optimal level ( ). The hotel misses
revenues [ ] in both cases from the unoccupied expensive
rooms. In [1] the hotel also loses revenue from the unsold cheaper rooms [
] . In [2] some of the guests who have arrived with confirmed
2 Some of the text, the figure and the formulas in this appendix have been adapted from Ivanov (2006) with the
permission of the publisher
*
LX
*
HX
0
*
*
HH
LL
XX
XX
*
*
HH
LL
XX
XX
*
*
HH
LL
XX
XX
*
*
HH
LL
XX
XX
2 1
4 3
Figure 12.2.1. Possible situations of last-minute cancellations, amendments and no
shows for a hotel with two types of rooms with different rates

Stanislav Ivanov (2014). Hotel Revenue Management: From Theory to Practice. Varna: Zangador. Page 129 of 204
overbookings for the L rooms can be accommodated in the available H rooms causing
a loss of revenues . The rest of the guests in [2] will be
walked to another hotel incurring costs
. The sum of the
four elements of the costs and missed benefits gives the total costs of the
overbookings given :
(1) = [ ]
+ [ ] +
+
In situations [3] and [4] which causes costs of walking guests
in both cases. In [4] this is combined with costs of walking guests
with confirmed overbookings for the L rooms . In [3] some of the
guests will be accommodated in the cheaper rooms, causing a refund
. The rest of the guests will be walked to another hotel incurring
costs
. Thus, the total overbooking costs when
are:
(2) =
+ +
+
The sum of (1) and (2) gives the total costs of the overbookings for both types of
rooms:
(3) = +
= [ ] + [
] +
+
+
+ +
+
Total costs are minimum when marginal costs of the overbookings are
equal to the marginal revenues from them for both room types:
(4) |
Substituting (3) in (4) and performing the mathematical operations leads to:

Stanislav Ivanov (2014). Hotel Revenue Management: From Theory to Practice. Varna: Zangador. Page 130 of 204
(5) |
If and
are solutions of (5) the optimal numbers of overbookings and
are the smallest integers such that:
(6) |
Stanislav Ivanov (2014). Hotel Revenue Management: From Theory to Practice. Varna: Zangador. Page 131 of 204
Appendix 12.3. Overbooking model for a three-room type hotel3
This appendix focuses on optimal overbooking limits for a three-room type hotel with
upgrade and downgrade constraints. Let a hotel have three types of rooms denoted
as H (high-priced rooms), M (mid-priced) and L (low-priced) rooms. Their respective
room rates are rH, rM and rL, such as: rH>rM>rL. When overbooking happens and guests
must be walked to another property, the hotel incurs overbooking costs cH, cM and cL,
which fulfil the condition: cH>cM>cL. The assumption is that overbooking costs are
higher than the respective room rates, i.e. cH>rH, cM>rM and cL>rL because the hotel
incurs additional expenses for those guests (paying for the second hotel,
transportation, free food vouchers, free bottle of wine, souvenirs/gifts, etc.) to
compensate them for the inconveniences caused, and may therefore experience some
brand image losses (see Appendix 12.1).
When the hotel does not overbook or has overbooked less than the optimal level and
some rooms remain unoccupied, the hotel has missed benefits in the form of missed
revenues which are equal to the respective room rates for those rooms – rH, rM or rL
(for simplicity, we disregard the missed revenues from additional services in the
hotel). We denote with XH, XM and XL the random variables of the number of
confirmed H, M and L rooms, respectively, for a specific date that remain unused due
to no-shows, last-minute cancellations and amendments of reservations of already
accommodated guests. Their respective distribution functions are F(XH), F(XM) and
F(XL), showing the probabilities of guests holding confirmed bookings for XH, XM and
XL number of rooms that do not arrive at the hotel and their rooms remain
unoccupied. The optimal level of overbooking for each room type is denoted with ,
and
.
We assume that the demand for each room type is independent from the demand for the other
2 room types, i.e. the market segments for the 3 room types are quite distinct. In
practice, the customers for apartments and suites (high-priced rooms) will be
different from the customers for business rooms (mid-priced rooms) and the guests in
standard (low-priced) rooms. We further consider that an upgrade to a higher room
category and downgrade to a lower category is possible, but with some limitations as
presented by the following rules:
3 For the full mathematical model and the derivation of the functions see Ivanov (2014)
Stanislav Ivanov (2014). Hotel Revenue Management: From Theory to Practice. Varna: Zangador. Page 132 of 204
Rule 1: An upgrade to a higher room category is acceptable but by one step only: we
can upgrade L to M (denoted with L→M) and M→H, but not L→H, in order to avoid
overcompensation of customers.
Rule 2: A downgrade to a lower room category is acceptable but by one step only: we
can downgrade M to L (denoted with L←M) and M←H, but not L←H, in order to
minimise the negative consequences from the downgrade.
Rule 3: A downgrade to a certain category has an advantage over an upgrade to the
same category, i.e. M←H is preferred to L→M, in order to retain higher paying
customers at the hotel and avoid having to walk them to another property.
Rule 4: An upgrade from a certain category has an advantage over a downgrade from
it, i.e. M→H is preferred to L←M.
Rule 5: Accommodating customers who have a booking for a certain room category
has an advantage to upgrades and downgrades to that category, i.e. L→L is preferred
to L←M, M→M is preferred to L→M and M←H, H→H is preferred to M→H.
Downgrading from a particular category to the lower one requires that the guest be
compensated. Obviously, the customer should be refunded the difference between
the price paid for the more expensive room and the rate of the cheaper room in which
he is accommodated. The hotel will incur downgrading costs denoted with dH and dM
for the downgraded H and M rooms respectively, so that dH>dM. The downgrading
costs consist of two elements: a) direct financial expenses for compensating the
downgraded customer (free dinner, drinks, fruits, vouchers for free spa services up to
a limit predetermined by the hotel management), and b) brand image losses. Similar
to the overbooking costs c, the financial expenses as an element of downgrading costs
are easier to calculate than brand image losses. However, the latter may have
detrimental effect on customer satisfaction and loyalty. Considering the facts that in
downgrading the hotel does not pay to another hotel for walking guests but
accommodates them in a lower category room, provides financial compensation on
top of the difference between the two room rates and suffers brand image losses, then
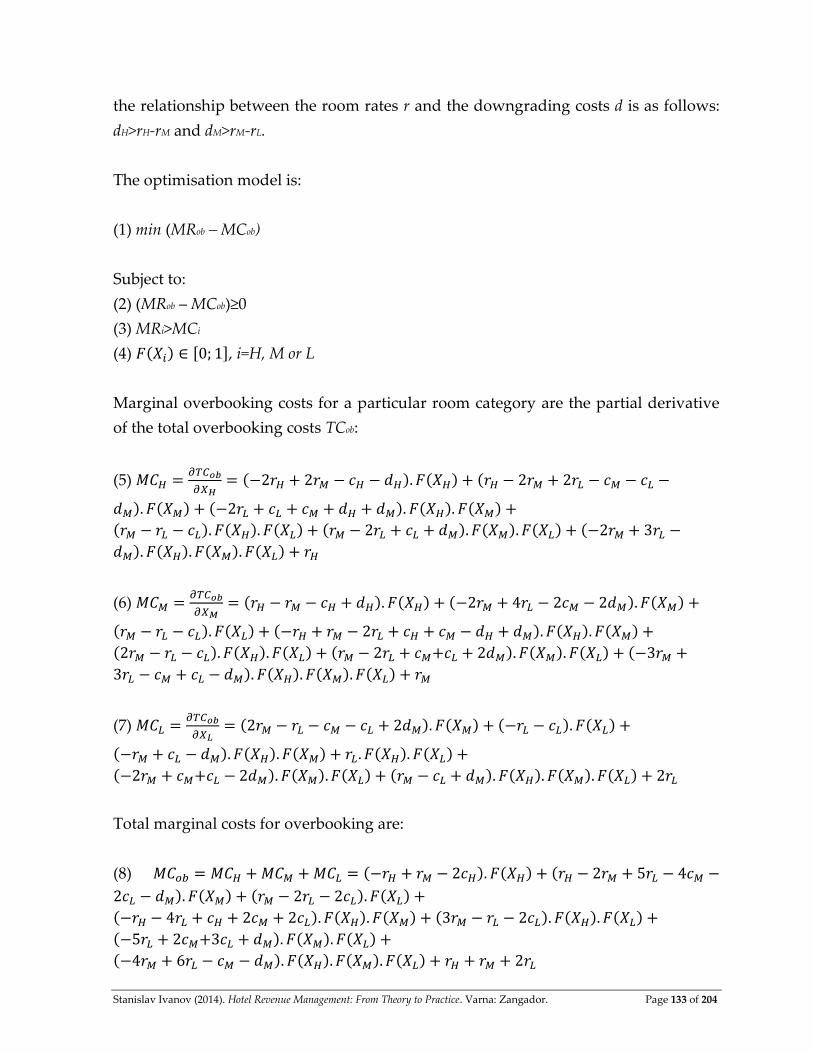
Stanislav Ivanov (2014). Hotel Revenue Management: From Theory to Practice. Varna: Zangador. Page 133 of 204
the relationship between the room rates r and the downgrading costs d is as follows:
dH>rH-rM and dM>rM-rL.
The optimisation model is:
(1) min (MRob – MCob)
Subject to:
(2) (MRob – MCob)≥0
(3) MRi>MCi
(4) [ ], i=H, M or L
Marginal overbooking costs for a particular room category are the partial derivative
of the total overbooking costs TCob:
(5)
(6)
(7)
Total marginal costs for overbooking are:
(8)
Stanislav Ivanov (2014). Hotel Revenue Management: From Theory to Practice. Varna: Zangador. Page 134 of 204
If ,
and are the solution of (1), then the optimal number of
overbooked rooms ,
and are the smallest integers for which (9) is fulfilled:
(9) |
Stanislav Ivanov (2014). Hotel Revenue Management: From Theory to Practice. Varna: Zangador. Page 135 of 204
Chapter 13
COMBINED HOTEL REVENUE MANAGEMENT TOOLS
Combined hotel revenue management tools include channel management and
optimal room-rate allocation (Figure 1.1). We denote them as combined RM tools
because they include activities that influence both the price and the quantity of
offered services simultaneously.
13.1. Channel management
As a combined RM tool, channel management has not received its deserved attention
in academic literature, in contrast to its profound importance in hotel RM practice.
Although the structure of intermediaries used by a hotel and the terms and
conditions in contracts with them significantly influence the ADR, RevPAR and the
whole RM system of the hotel, only few authors discuss the distribution channels
utilised by a hotel from an RM perspective (e.g. Choi & Kimes, 2002; Hadjinicola &
Panayi, 1997; Tranter, Stuart-Hill & Parker, 2008). Cross et al. (2009), for example,
state that after 9/11 hotels looked for wider exposure to guests and were eager to
work with third party websites and online merchants against big discounts.
However, the huge discounts clients were getting from them, rather than the hotel
itself, eroded the relationship between hotels and their guests, and people began to
shop third party sites first. Furthermore, Myung, Li & Bai (2009) investigated the
impact of e-wholesalers on hotel distribution channels and found that hotels were
generally satisfied with the performance and relationships with e-wholesalers despite
the conflicts with them. However, Choi & Kimes (2002) concluded that applying RM
strategies to distribution channels might not help hotels that are already optimising
their revenues by rate and length-of-stay. This might explain the lower interest in
channel management as an RM tool compared to the plethora of operations research
on overbookings.
In practice, channel management as a combined RM tool includes several activities:

Stanislav Ivanov (2014). Hotel Revenue Management: From Theory to Practice. Varna: Zangador. Page 136 of 204
Choice of distribution channels
The primary decision to be made in relation to distribution channel management is
the choice of distribution channels. A hotel has a great variety of distribution
channels from which to choose: direct sales (without the use of intermediaries), GDSs
(Amadeus, Sabre, Travelport with the brands Worldspan and Galileo), OTAs
(Booking.com, Venere.com, Expedia.com, Orbitz.com), and tour operators and travel
agents. The more the distributors a hotel works with and the more websites it is
presented in, the greater the market visibility of the hotel and the greater the chance
that a potential customer will find it and make a booking. Therefore, hotels have
incentive to work with many distributors. However, each group of intermediaries has
specific characteristics which should be considered before signing a contract with
them:
Global Distribution Systems serve as electronic platforms connecting
accommodation establishments and other intermediaries. A hotel inputs in the GDS
the available rooms, prices and booking terms for a particular period, and travel
agencies (tour operators/travel agents) or other companies with access to the GDS
platform make bookings in the hotel via the GDS platform. The booking is
guaranteed either with a corporate credit card or the IATA number of the agency. The
customer pays directly to the hotel on the spot. The GDS receives a fee from the hotel
for the used bookings, while the travel agency – a commission. The greatest
advantage for a hotel to join a GDS is that it does not need to sign separate contracts
with thousands of intermediaries – the hotel signs only one contract with the GDS
and, through it, it reaches thousands of GDS users. A disadvantage is the high
commissions and fees for maintaining the distribution channels, making it suitable
for medium to large, and from middle to high category accommodation
establishments. It is a very popular distribution channel for hotel chains and all major
chains are present in the GDSs.
Travel agencies, depending on their license, can be tour operators or
travel agents. Tour operators work on a merchant model. They receive net rates from
hotels, add their mark-up, and sell to customers (directly or via travel agents), or to
other tour operators. The hotel receives the payment for the accommodation from the
tour operator, not from the customer. Travel agents work on an agency model. They
sell to final customers at prices fixed by hotels and, in exchange, receive a
commission. A travel agency with both licenses may work with some hotels as a tour
Stanislav Ivanov (2014). Hotel Revenue Management: From Theory to Practice. Varna: Zangador. Page 137 of 204
operator and with others as an agent. Travel agencies that work exclusively online via
their own websites for hotel reservations are usually referred to as Online Travel
Agencies. They may operate on both merchant and agency models. Different from
GDSs, OTAs target predominantly direct customers and provide great flexibility to
hotels regarding changes in prices and allotments. Although commissions received
by some OTAs are high (for instance, Booking.com charges 15% regular commission
and 18% if the hotel is to appear on top of the search results list), the fact that
customers pay on the spot directly to the hotel decreases the risk for the hotel – it
does not need to wait for payment from the intermediary. OTAs are therefore very
suitable for every type of accommodation establishments, regardless of size or
category.
Furthermore, GDSs and many OTAs have developed white labels – the booking engine
of the website of the GDS/OTA is integrated into the website of another travel agency.
The user makes a hotel booking on the website of the travel agency and it goes
directly to the reservation system of the GDS/OTA. This strategy increases the market
coverage of the GDS/OTA providing the white label to its partner travel agencies.
This also indirectly benefits the hotel because it even appears on websites of travel
agencies with whom it does not have a contract. The direction of payments by the
customer depends on the types of contracts between the GDS, the OTA, the hotel and
travel agency.
Group buying websites are electronic platforms used for connecting
sellers and buyers on which sellers promote highly discounted rates (often above 50%
discount) that are valid for limited period of time (e.g. less than 7 days). The original
idea of group buying websites was that in order to take advantage of an offer, there
must be a minimum number of customers who buy the same product, and guarantee
a purchase with their credit cards. However, in recent years, many group buying
websites have lifted the requirement for a minimum number of customers and they
were transformed into websites for special offers. In the hotel industry, group buying
websites (e.g. Groupon.com, Grabo.bg) connect accommodation establishments with
direct customers (not with other distributors). Similar to global distribution systems,
a hotel inputs its rates, available rooms and booking terms, but in difference to the
GDSs, offers on group buying websites have limited validity in order to stimulate
customers to act quickly and make the decision to book rather than postpone and
look for offers elsewhere. Group buying websites are useful when a hotel targets
Stanislav Ivanov (2014). Hotel Revenue Management: From Theory to Practice. Varna: Zangador. Page 138 of 204
price-sensitive customers. While they attract customers with heavily discounted rates
and are financially efficient in the short run, they might have detrimental effect on
hotel’s image in the long run because the low-priced special offers may create
unfavourable customer expectations about the future price of the product – it would
be difficult for a hotelier to persuade a customer to pay the full or slightly discounted
price for the accommodation when for his previous stay he paid a heavily discounted
rate via a group buying website. Therefore, special offers via group buying websites
(and special offers in general) should be managed carefully in order to eliminate
unjustified customer expectations about the prices. On the other hand, discussing the
impact of discounts on destination image Sheridan, Lee & Roehl (2013: 607) stipulate
that ‘heavily discounted rate deals in a specific destination do not dampen the image
of the destination, but rather lead potential visitors to perceive the hotel deal as a
great value; consequently, the discount deal positively influences their perceptions
about the destination and visit intentions. This can lead to persuading people to come
to the city that may have never been before.’
Choice of a distribution channel is influenced by several groups of factors:
Characteristics of hotel’s product – specialised hotel products (golf, casino,
spa & wellness, themed hotel) imply the use of specialised intermediaries (usually
tour operators) that have a customer base (the ‘right customers’) and knowledge to
sell such products.
Characteristics of the company and its marketing strategy. Large hotel chains
have developed their own reservation systems and customers may book accom-
modation directly on their websites in hundreds of chain members. The sheer number
of properties available on a chain’s website makes it competitive and attractive to
customers (Ivanov, 2008). Moreover, some of the promotional rates or room
availability guarantees are only valid for direct bookings via the chain’s website. This
makes chains less dependent on intermediaries compared to individual hotels. The
marketing objectives also influence the choice of distribution channels. If the aim of a
hotel is to achieve very high market visibility, it must be present in many online
reservation systems or in several OTAs with large customer bases and/or a white
label network.
Characteristics of distributors – size, market coverage, marketing strategy,
purchasing/booking criteria. If a seaside hotel wants to attract tourists from Russia, it
must make contracts with travel agencies that operate in that market. If a tour
Stanislav Ivanov (2014). Hotel Revenue Management: From Theory to Practice. Varna: Zangador. Page 139 of 204
operator is positioned as low-cost, it will not be the ‘right’ distribution channel for a
boutique hotel offering an exclusive product. Furthermore, if a distributor competes
on price, it will press the hotel to charge a low price, which is often a source of
conflicts between accommodation establishments and intermediaries (see for example
Buhalis, 2000; Myung, Li & Bai, 2009) and leads to perceptions of a commoditised
product (see Chapter 10).
Characteristics of the target market – type and particular distribution
channels target customers prefer to use. If customers prefer to book online then the
hotel should be present in various online reservation systems. If they prefer to travel
with tour operators, then the hotel should sign contracts with them.
Competition – the revenue manager should consider the distribution
channels of competing hotels. They may be used as a benchmark to assess
effectiveness and efficiency of hotel’s own distribution network. Of course,
competitors’ contracts with intermediaries are considered a trade secret, but a simple
check of online hotel reservation systems regarding the offered hotels at the
destination will provide a good idea about the distribution channels used by the
competitors. It must be emphasised that it is not necessary for a hotel to use the same
distribution channels as competitors. On the contrary, the revenue/marketing
manager must concentrate on the distribution channels that help the hotel reach its target
customers, and these are not necessarily the channels used by its competitors. The
latter may provide an idea of what other channels could be used by the hotel (if
competitors use channels not applied by the hotel) or, they may identify potential for
opportunistic behaviour by the distributor (if a tour operator works with many
competing hotels at the destination which it may confront against each other in case
of low demand).
Two special issues must be emphasised in relation to choice of a distribution channel:
It is possible that the increase in the sales of a hotel through one channel
is at the expense of sales through another one. This phenomenon is known as
distribution channel cannibalisation (Ivanov, 2007b). Cannibalisation is inevitable when
a hotel uses many channels to reach its target market. It is not a problem if adding
one additional channel leads to an increase in total bookings/sales in the hotel – part
of the sales are cannibalised (i.e. instead of one channel some customers book at the
hotel through another one), but other part of the sales has been generated by
customers not previously reached through the existing distribution system of that
Stanislav Ivanov (2014). Hotel Revenue Management: From Theory to Practice. Varna: Zangador. Page 140 of 204
hotel. If, however, total sales do not increase, perfect cannibalisation occurs – no new
potential customers have been reached by adding the additional distribution channels
to the network. Identifying and measuring distribution channel cannibalisation is
very difficult and that’s why it has been neglected by both academics and
practitioners.
Many leisure hotels at seaside and mountain mass tourism destinations
rely on charter tour operators to sell their rooms. Some of them even sign exclusive
contracts with single tour operators, leaving themselves entirely at the mercy of those
distributors. During negotiations some hoteliers experience what we call the ‘large
tour operator syndrome’ – they prefer to work with tour operators that bring many
tourists to the destination, although this does not necessarily mean that they will
bring many tourists to that particular hotel. Tour operators use the number of tourists
they bring to the destination as an argument to negotiate for lower prices at hotels.
However, they have brought many tourists to the destination because in the previous
year they were given low prices by the hotels. This led to their high price
competitiveness in tourist generating countries/regions. Therefore, providing low hotel
rates to large tour operators in one year will lead to their increased bargaining power the next
year.
Determination of prices and booking conditions by distribution channel
After a hotel has identified the channels it will work with, it must determine the
prices and the booking conditions for each. Obviously, not all distribution channels
are equal and do not receive the same prices and booking conditions. The prices
distributors are given are usually inversely related to the number of overnights they
book in the hotel, i.e. the intermediary that sends more guests to the hotel receives
lower prices. However, this hotel practice has very flawed logic because prices must
stimulate future bookings, not to serve as a bonus for past sales. Hotel’s pricing decisions
determine the distribution channels from which it would actually receive bookings.
When a hotel provides low prices to particular intermediaries, it usually receives
more bookings from these same distribution channels because they become more
price competitive and attract more customers compared to other intermediaries, i.e.
we observe a situation of self-fulfilling prophesy. Therefore, the revenue manager
should be very careful when deciding which channels to stimulate by determining
lower prices for them. This decision should be coupled with price parity as discussed
in Chapter 11 – the price for the final customers must be nearly the same regardless of
Stanislav Ivanov (2014). Hotel Revenue Management: From Theory to Practice. Varna: Zangador. Page 141 of 204
the distribution channel they use. Otherwise, distribution channel cannibalisation will
be observed (see above).
Booking conditions include:
Release date – the number of days before check-in when the distributors
(usually the tour operators) must release the unsold rooms from their allotments.
Tour operators are interested this release date to be as close to the check-in date as
possible to be able to capture any late bookings. To the contrary, hoteliers prefer an
earlier release date in order to decrease their risk and have enough time to sell unsold
rooms from tour operators’ allotments themselves. The intense competition among
hotels and extreme bargaining power of intermediaries (especially the tour operators
at mass tourist destinations) has led to very short release dates – from 7 days during
the main season in holiday destinations to 6 p.m. on the arrival day/check-in date for
business hotels. By managing the release date, a hotel may or may not stimulate last-
minute bookings through a particular distribution channel.
Cancellation and amendment terms – the number of days before check-in
until when a customer/distributor can cancel/amend a booking free of charge. The
closer the free cancellation deadline to the check-in/stay-over date, the better for the
distributor. The cancellation deadline depends on the type of hotel (later for business
hotels, earlier for holiday properties), period of the year (earlier during high season,
later during off-season), types of customers (earlier for groups, later for individual
guests), distributors, etc. It is possible that a hotel applies a uniform cancellation
policy regardless of the above criteria. The free cancellation deadline is usually after
the release date but it is possible that they may coincide. Figure 13.1 below depicts the
relationships between these booking terms dates.
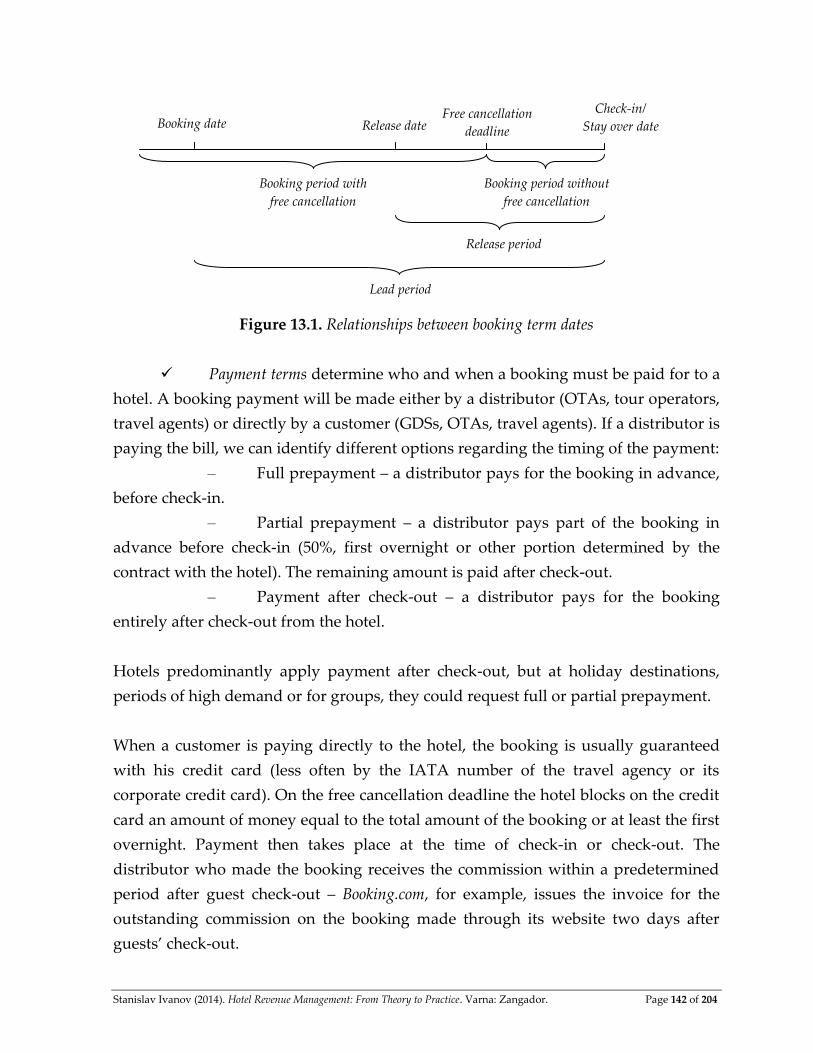
Stanislav Ivanov (2014). Hotel Revenue Management: From Theory to Practice. Varna: Zangador. Page 142 of 204
Figure 13.1. Relationships between booking term dates
Payment terms determine who and when a booking must be paid for to a
hotel. A booking payment will be made either by a distributor (OTAs, tour operators,
travel agents) or directly by a customer (GDSs, OTAs, travel agents). If a distributor is
paying the bill, we can identify different options regarding the timing of the payment:
– Full prepayment – a distributor pays for the booking in advance,
before check-in.
– Partial prepayment – a distributor pays part of the booking in
advance before check-in (50%, first overnight or other portion determined by the
contract with the hotel). The remaining amount is paid after check-out.
– Payment after check-out – a distributor pays for the booking
entirely after check-out from the hotel.
Hotels predominantly apply payment after check-out, but at holiday destinations,
periods of high demand or for groups, they could request full or partial prepayment.
When a customer is paying directly to the hotel, the booking is usually guaranteed
with his credit card (less often by the IATA number of the travel agency or its
corporate credit card). On the free cancellation deadline the hotel blocks on the credit
card an amount of money equal to the total amount of the booking or at least the first
overnight. Payment then takes place at the time of check-in or check-out. The
distributor who made the booking receives the commission within a predetermined
period after guest check-out – Booking.com, for example, issues the invoice for the
outstanding commission on the booking made through its website two days after
guests’ check-out.
Booking date Release date Free cancellation
deadline
Check-in/
Stay over date
Booking period without
free cancellation
Booking period with
free cancellation
Release period
Lead period
Stanislav Ivanov (2014). Hotel Revenue Management: From Theory to Practice. Varna: Zangador. Page 143 of 204
Allotment management by distribution channel
Allotment management includes the allocation of rooms for sale across different
distribution channels. We can identify the following types of contracts between a
hotel and intermediaries (see for more details Ivanov, 2008):
– Commitment – applied with distributors working on a merchant model.
The tour operator prepays for the rooms regardless of whether they are used or not. It
is possible that a tour operator pays one price for used/unused rooms or a higher
price for used rooms and lower rate for the unused. The hotel cannot sell the rooms
blocked for the distributor. The advantage for the hotel is that it receives advance
payment regardless of whether the tour operator sells the rooms or not, which could
be used for renovations. However, the rates in commitment contracts are the lowest.
The advantage for the tour operator is that it is guaranteed the rooms, especially in
periods of high demand, but it has to invest a lot of resources to prepay the rooms
which limits its financial and operational flexibility. Currently, commitment contracts
are rarely used due to the intense competition between accommodation
establishments.
– Allotment – a contract similar to the commitment, but the tour operator
does not prepay for all the rooms, only the rooms used. Unsold rooms allocated to the
tour operator have to be released up to the release date. This contract has greater
flexibility than the commitment contract for both sides and is widely used. It is often
accompanied by an overcontracting strategy by hotels (see Chapter 12). A version of
the allotment contract involves the hotel manually making changes in the rooms
available for sale in the OTAs working on an agency model.
– Free sale – a hotelier gives the intermediary the non-exclusive right to
sell free rooms. It is used for both merchant and agency models. A distributor
confirms the bookings with its customers/agents at the very moment they are
received and must periodically inform the hotel (usually every day) of the confirmed
bookings. The bookings are input into hotel’s computer reservation system and the
revenue/marketing manager informs the distributor of the closed dates immediately
(usually on the same day) which the distributor inputs in its own system. The main
advantage of the free sale for the hotel is that it can work with many distributors and
it can sell the rooms by itself. The advantage for the distributor is that it can show
availability of rooms in its system without the need to prepay for any rooms or deal
with release periods. However, the free sale has one major disadvantage for both the
Stanislav Ivanov (2014). Hotel Revenue Management: From Theory to Practice. Varna: Zangador. Page 144 of 204
hotel and the intermediaries. There is a time gap between the moments the
distributor confirms the rooms to its customers/agents, it informs the hotel, these
bookings are input in the hotel’s computer reservation system, the revenue/marketing
manager makes the decision to close a date for sale, the distributor is informed of the
closed date, and the date is closed in distributor’s reservation system. This whole
process can take several hours, especially when the hotel and distributor are located
in different time zones. This may create a time window when a customer may make a
booking for dates closed for sale and the distributor confirms the booking to that
customer without knowing that the dates are actually closed. Applying free sale
therefore requires careful planning by the revenue manager. It is recommended that
free sale be used only by mid- to large-sized properties (so there are enough rooms in
the hotel) and a limitation be set on the maximum number of rooms to be confirmed
by a distributor with one booking in order to provide incremental growth of bookings
for a particular date.
– Upon request – a distributor has not been given any allotment in a hotel,
or the rooms from its allotment for a particular date have already been sold out. It
sends a booking request to a hotel and the latter confirms or denies it. However, in
the modern world, the customers want real-time information about room availability
in hotels and instant confirmation of their bookings. In this regard, intermediaries
want hotels included in their online reservation systems to show available rooms due
to the maxim that ‘what is available, that is sellable’. That’s why hoteliers usually work
on an upon request basis with smaller intermediaries, e.g. with travel agents.
The type of contract is closely related with the room rate and degree of financial
interdependence between the hotel and the distributor. Figure 13.2 below depicts the
inverse relationship between the price and the degree of financial interdependence,
different for each type of contract. The price is lowest for the commitment contract
and highest for the upon request contract, while the financial interdependence
between the hotel and the distributor is highest for the commitment contract and is
lowest in the upon request one.
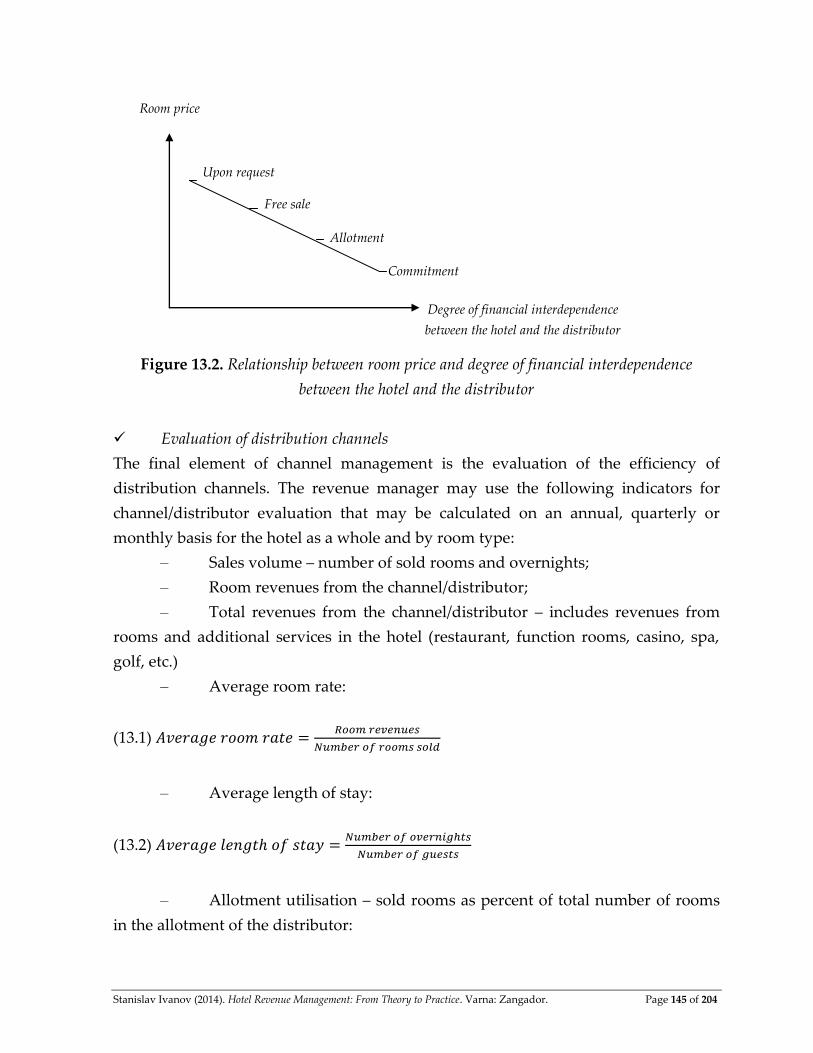
Stanislav Ivanov (2014). Hotel Revenue Management: From Theory to Practice. Varna: Zangador. Page 145 of 204
Figure 13.2. Relationship between room price and degree of financial interdependence
between the hotel and the distributor
Evaluation of distribution channels
The final element of channel management is the evaluation of the efficiency of
distribution channels. The revenue manager may use the following indicators for
channel/distributor evaluation that may be calculated on an annual, quarterly or
monthly basis for the hotel as a whole and by room type:
– Sales volume – number of sold rooms and overnights;
– Room revenues from the channel/distributor;
– Total revenues from the channel/distributor – includes revenues from
rooms and additional services in the hotel (restaurant, function rooms, casino, spa,
golf, etc.)
– Average room rate:
(13.1)
– Average length of stay:
(13.2)
– Allotment utilisation – sold rooms as percent of total number of rooms
in the allotment of the distributor:
Degree of financial interdependence
between the hotel and the distributor
Room price
Upon request
Free sale
Allotment
Commitment
Stanislav Ivanov (2014). Hotel Revenue Management: From Theory to Practice. Varna: Zangador. Page 146 of 204
(13.3)
– Channel maintenance expenses – average commission/discount given to
a channel/distributor;
– Lead period – the average number of days before check-in when guests
make a booking at the hotel with the particular distributor/channel.
Revenue managers may use additional indicators according to the specific
characteristics of the accommodation establishment. As information sources for
channel evaluation they may use:
– The property management system of the hotel that generates various
reports containing the above indicators.
– Distributors’ websites – provide information about the completeness and
accuracy of a hotel’s description, quality of photographs, up to date prices and
promotions, competing hotels. Some distributors provide access to accommodation
establishments to their own profiles so hoteliers could easily and timely input current
information about their properties.
– Visit to the office of the distributor – may generate information regarding
the offered competing products, knowledge of current promotions, location of hotel’s
promotional materials in the office.
The outcome from distribution channel evaluation may include:
– Contract renewal under the same conditions
– Changes in contract prices (increase or decrease)
– Changes in number of rooms in the allotment
– Changes in commissions/discounts
– Change of release periods
– Change of cancellation deadlines
– Termination of the contract with the distributor
13.2. Optimal room-rate allocation (room distribution)
The optimal room-rate allocation (e.g. El Gayar et al., 2011; Guadix et al., 2010) refers
to the determination of the maximum number of rooms to be booked at different
price levels, i.e. the hotel actively limits its available room capacity that may be
booked at a given price. Obviously, the number of allocated rooms is inversely
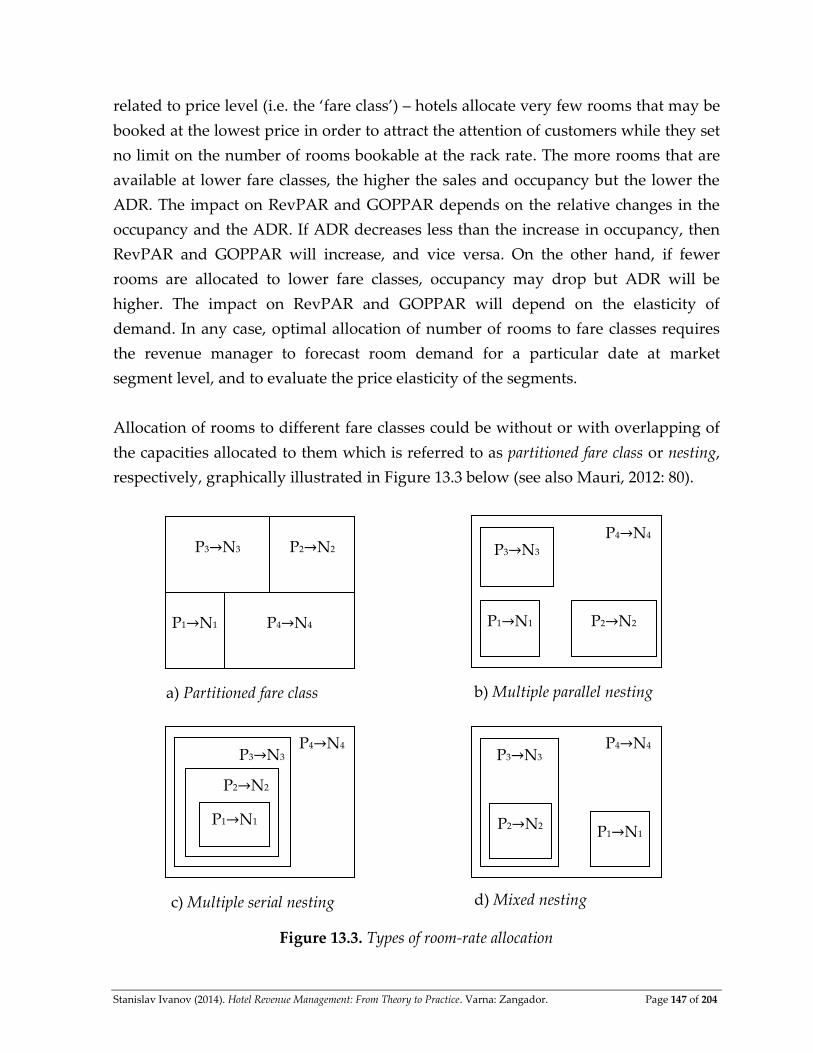
Stanislav Ivanov (2014). Hotel Revenue Management: From Theory to Practice. Varna: Zangador. Page 147 of 204
related to price level (i.e. the ‘fare class’) – hotels allocate very few rooms that may be
booked at the lowest price in order to attract the attention of customers while they set
no limit on the number of rooms bookable at the rack rate. The more rooms that are
available at lower fare classes, the higher the sales and occupancy but the lower the
ADR. The impact on RevPAR and GOPPAR depends on the relative changes in the
occupancy and the ADR. If ADR decreases less than the increase in occupancy, then
RevPAR and GOPPAR will increase, and vice versa. On the other hand, if fewer
rooms are allocated to lower fare classes, occupancy may drop but ADR will be
higher. The impact on RevPAR and GOPPAR will depend on the elasticity of
demand. In any case, optimal allocation of number of rooms to fare classes requires
the revenue manager to forecast room demand for a particular date at market
segment level, and to evaluate the price elasticity of the segments.
Allocation of rooms to different fare classes could be without or with overlapping of
the capacities allocated to them which is referred to as partitioned fare class or nesting,
respectively, graphically illustrated in Figure 13.3 below (see also Mauri, 2012: 80).
Figure 13.3. Types of room-rate allocation
P3→N3 P2→N2
P1→N1 P4→N4
P4→N4 P3→N3
P2→N2 P1→N1
P4→N4 P3→N3
P2→N2
P1→N1
P4→N4 P3→N3
P2→N2 P1→N1
a) Partitioned fare class b) Multiple parallel nesting
c) Multiple serial nesting d) Mixed nesting

Stanislav Ivanov (2014). Hotel Revenue Management: From Theory to Practice. Varna: Zangador. Page 148 of 204
Let’s assume that the revenue manager of a hotel fixed four price levels P1, P2, P3 and
P4 so that P1<P2<P3<P4. The manager allocates to them the maximum number of rooms
that may be booked for each level – N1, N2, N3 and N4. If a particular room capacity Ni
can be sold only at the specific price level Pi we observe partitioned fare classes (Figure
13.3.a). It is simple to apply but contradicts the revenue management’s goal to
maximise the revenues and the gross operating profit of the hotel – a booking request
at a higher price may be declined or confirmed at a lower rate because the number of
rooms allocated to that price level have been depleted.
Nesting occurs when for the same room capacity different price levels are applicable.
It has three versions. In multiple parallel nesting (Figure 13.3.b), room capacities N1, N2
and N3 are bookable either at their respective price levels P1, P2 and P3 or at the
highest price P4. It is impossible to book N1 at rates P2 or P3, N2 at rates P1 and P3 or N3
at rates P1 or P2. Furthermore, room capacity remaining after N1, N2 and N3 have been
sold is only possible to book at rate P4. In multiple serial nesting (Figure 13.3.c), each
room capacity is available at its designated or any higher rate, i.e. N1 can be booked at
rates P1, P2, P3 or P4, N2 at P2, P3 or P4, N3 at P3 or P4, while the difference between N4
and N3 is only bookable at P4. Mixed nesting (Figure 13.3.d) is a combination of the
parallel and the serial nesting. Nesting as a way for room-rate allocation is better than
partitioned fare classes because it allows the room capacity allocated to a particular
lower price level to be sold at higher price.
* * *
Pricing, non-pricing and combined revenue management tools are commonly
discussed together in research literature. This is a result of the notion that hotel RM is
an integrated system that must provide solutions to RM problems for price levels,
price fences, booking conditions and overbookings simultaneously through optimal
room-rate allocation. Furthermore, the optimal level of overbookings is influenced by
room rate (see the model of Netessine & Shumsky (2002) and Ivanov (2006)) which
shows the interconnectedness of pricing and non-pricing tools. Finally, hotels try to
achieve price parity among and within the different distribution channels they use
(Demirciftci et al., 2010; Maier, 2011, 2012) which requires simultaneous application of
pricing and non-pricing RM tools (channel management, price discrimination, dyna-
mic pricing, etc.). In practice, pricing, non-pricing and combined RM tools are used
simultaneously in order to achieve the RM goals of the hotel.
Stanislav Ivanov (2014). Hotel Revenue Management: From Theory to Practice. Varna: Zangador. Page 149 of 204
Chapter 14
MANAGING REVENUES IN VARIOUS HOTEL REVENUE
MANAGEMENT CENTRES
The total hotel revenue management concept discussed in previous chapters is based on
the optimisation of the revenues of the hotel from all departments as a whole, not
only from its Rooms Division. The revenue manager should think beyond room
revenues and consider the total revenues generated by the guest from purchases of
additional services. In this regard, this chapter concentrates on revenue management
practices in the various hotel departments besides the Rooms Division.
14.1. Revenue management in the F&B department
Revenue management practices of F&B outlets have received considerable attention
in the literature in recent years (Hayes & Miller, 2011; Heo, 2013; Heo, Lee, Mattila &
Hu, 2013; Kimes, 1999b; Kimes et al., 1998; Kimes & Robson, 2004; Kimes & Thomson,
2004, 2005; Thomson, 2010; Thomson & Sohn, 2009), but the analysis is predominantly
from the perspective of independent outlets needing to optimise only their own
revenues and have a high level of independence in revenue management decisions.
F&B outlets located in an accommodation establishment have a revenue management
strategy subordinate to the RM strategy of the hotel as a whole, especially if the total
hotel revenue management concept is fully embraced by the hotel management team.
Usually the F&B department has the greatest potential for revenue generation
(besides the Rooms Division) either as provision of regular services (breakfast, lunch,
dinner, etc.), banqueting and events (e.g. weddings, conferences, seminars), or
catering outside the hotel facility. In the context of accommodation establishments,
revenue management in the F&B department is on two levels – 1) the accommodation
establishment (property) level and 2) the F&B outlet level. At the property level,
hoteliers and owners should make several strategic revenue management decisions:
number of F&B outlets, types of F&B outlets (breakfast room, restaurant, bar, lobby
Stanislav Ivanov (2014). Hotel Revenue Management: From Theory to Practice. Varna: Zangador. Page 150 of 204
bar), room board (RO, BB, HB, FB, AI), type of service (á la carte, buffet), additional
F&B services (catering, room service, in-room minibar). The All Inclusive board, for
example, limits opportunities for additional revenues from F&B, even if the hotel
offers an á la carte restaurant. Room service and minibar extend the capacities of the
restaurant and the bar, respectively, providing convenience for the hotel guests and
more options for revenue generation.
At the outlet level, major restaurant revenue management tools include:
Capacity management
The capacity of a restaurant is defined as the number of customers that can be
serviced during its working hours. Therefore, restaurant capacity is determined by
several factors: physical number of seats, table mix (number of tables with different
seating capacity), number of working hours, and average time spent by customers in
the restaurant. Table mix (Kimes & Thomson, 2004, 2005) is important because it
limits the physical capacity of the restaurant. For example, if a couple is dining at a
table for four, the other two seats remain unused as customers usually do not want to
sit at the same table with people they do not know. Therefore, the restaurant must
conduct an empirical marketing research to determine its prevalent customer group
sizes. If results from the research show that half of the guests come in couples, a third
in groups of 3-4 guests and the rest customer groups are of 5 or more, then the
optimal table mix might be as follows: 50% of the seats on tables for two, 30-35% on
the tables for four, and 15-20% on the tables for six. In this way, the structure of
seating capacity in the table mix would reflect the structure of group sizes. The maître
d'hôtel has the operational responsibility of assigning a table with appropriate seating
capacity to each group of customers arriving at the restaurant. Utilisation of seating
capacity at a restaurant is positively related to its revenues but, as Heo (2013)
indicates, working at high capacity might negatively influence the quality of
customers’ experience, and may cause stress among employees and operational
mistakes.
Meal duration management
Meal duration shows how much time customers spend in a restaurant from arrival to
departure. The longer the duration, the lower the table turnover and the number of
customers served. That’s why restaurant managers are keen on decreasing the time
spent on serving customers. Part of the meal duration is controllable by the restaurant
staff (time needed to accommodate guests at a table, take an order, serve meals,

Stanislav Ivanov (2014). Hotel Revenue Management: From Theory to Practice. Varna: Zangador. Page 151 of 204
provide a bill) and proper operations management could make these stages of the
customer service process very efficient. However, other stages of the service process
are not entirely controllable by restaurant staff – how much time guests would need
to consume their food. Limiting customer duration-of-stay in a restaurant might be
possible in case of advance bookings only, which are not the norm in F&B outlets
located in accommodation establishments. Therefore restaurant managers need to
find other ways to control meal duration without leaving customers with an
impression that they are being pressed to finish their meals. Kimes et al. (1998)
identified different measures to decrease the uncertainty of meal duration and
improve operational planning in a restaurant: menu design with meals that do not
cause customers to linger, better labour scheduling in order to reduce the time to
serve guests, pre-bussing of tables, quick check delivery, separate coffee and dessert
bar, visual signs, reduced time between customers.
Menu design and pricing
From a revenue management perspective, menu design influences the revenues of the
F&B outlet in three main ways: meal duration, average check, food expenses of the
outlet. Menu items, requiring a lot of time to prepare or consume may cause
customers to stay longer in the restaurant without contributing more to revenues
because table turnover decreases. Greater choice of menu items requires customers to
spend more time before ordering meals but also provides a good opportunity for the
waiter to invite customers to order drinks while choosing their meal and offer
recommendations about menu items, the daily menu or special offers. The menu
structure and its prices will impact the average check (see Chapter 5) – a greater share
of expensive items on the menu will increase the average check but might also create
the impression that the restaurant is too expensive. Menu items require different costs
to prepare which directly impacts total food costs and the gross operating profit of
the restaurant.
Menu items are priced differently. Some entries (appetizers, salads, sweets) and
beverages have higher mark-ups and contribute significantly to gross operating profit
while others (the main course) have deliberately low mark-ups in order to attract
customers (see also Davis, Lockwood & Stone, 2006: 112-119). From an RM
perspective besides differential mark-ups, a restaurant may add a service, cover or
minimum charge (Davis et al., 2006: 113). A service charge is a fixed percent added to
a bill which is (supposedly) distributed among employees on duty during that
Stanislav Ivanov (2014). Hotel Revenue Management: From Theory to Practice. Varna: Zangador. Page 152 of 204
working day. A cover charge is similar but is a fixed amount for bread, butter or
other menu item. A minimum charge is used to dissuade customers who intend to
spend only small amount for a cheap menu item or a drink. While contributing to
revenues, these types of charges may arouse customer dissatisfaction. If applied,
charges must be explicitly and clearly explained with text on the menu.
14.2. Revenue management in a fitness, spa or wellness centre
Fitness, spa and wellness facilities are often a differentiation factor in the hotel
industry. Research in spa revenue management has been marginal (Kimes & Singh,
2009; Modica & Scanu, 2014) and, similarly to restaurant RM, its research has
concentrated on independent operators. Similar to RM in the F&B department in
hotel, fitness, spa and wellness revenue management should be implemented on two
levels: 1) property (hotel) and 2) facility. At the property level, strategic revenue
management decisions include: whether to offer fitness, spa and wellness facilities at
all; what types of fitness, spa and wellness facilities/services to offer [(fitness centre,
swimming pool(s), spa, Turkish bath, sauna, massage, jacuzzi, aroma therapy, etc.)];
whether hotel guests are to be charged for the use of fitness, spa or wellness facilities,
or they would be included in the room price. These decisions will determine the
revenue management potential of the fitness, spa and wellness facilities and services
in the accommodation establishment.
At the facility level, fitness, spa and wellness revenue management tools include:
Capacity management
Capacity of a fitness, spa or wellness facility depends on physical size/number of each
(or part of the) facility, working hours, number of employees (for massages), service
duration, time interval between customers served. If a massage takes 45 minutes, one
masseur works eight hours a day and needs a 15-minute break between massages,
and an hour for lunch, he would be able to provide the service to maximum of seven
guests per day. If the hotel has two masseurs, the maximum number of available time
slots for massages will be 14. The very limited capacity of spa and wellness facilities
may cause guest dissatisfaction at all-inclusive resort hotels if the facilities are free of
charge but guests cannot use them due to extremely high demand compared to the
capacity. Therefore, the capacity of fitness, spa and wellness facilities must be based
on the forecasted demand for them by hotel guests and external customers not
accommodated in the hotel (e.g. local residents).
Stanislav Ivanov (2014). Hotel Revenue Management: From Theory to Practice. Varna: Zangador. Page 153 of 204
Advance bookings
Advance bookings decrease the uncertainty of arrivals to fitness, spa and/or wellness
facilities and contribute to better operational planning in that department. They may
be coupled with prepayment or deposit to guarantee the reservation.
Service duration management
Some spa and wellness services have fixed (e.g. massages) while others have more
varying service duration (e.g. use of the fitness centre or swimming pool). To provide
greater predictability of service duration, spa and wellness treatments are offered in
blocks with fixed duration (Kimes & Singh, 2009). Analysis of service operations
would help to identify possibilities to decrease the time between customers, and more
efficient ways to provide the service.
Prices
As a swimming pool and a fitness centre have high fixed costs and very low variable
costs, they are usually offered to hotel guests free of charge or at low prices, while
external customers (not accommodated at the hotel) must pay regular rates. Other spa
and wellness facilities are fee-based due to their high variable costs. The hotelier
might use price discrimination and charge different prices for fitness, spa and
wellness services during high and low demand periods of the day or week. Lower
prices should be framed as discounts from regular prices.
14.3. Function rooms revenue management
Function rooms provide a hotel with an opportunity to attract organisers of various
special events (see Table 6.2) and are a major source of revenue for some business and
resort hotels. Revenue management research and hotel practice reveals that RM
concepts are applicable to managing hotel function rooms as well (Kimes & McGuire,
2001; Orkin, 2003). At the property level, the number, size and seating layout in
function rooms will determine what type of special events a hotel may host and how
many of these events may be hosted simultaneously. Special events like congresses,
conventions, balls require very large conference/ball rooms which few hotels can
provide. On the other hand, corporate meetings, conferences and seminars require
small (up to 50 seats) to medium sized (up to 200 seats) venues and may easily be
hosted by hotels. Accommodation establishments without function rooms located
near congress centres benefit from the organisation of special events there by
providing accommodation to participants in these events.

Stanislav Ivanov (2014). Hotel Revenue Management: From Theory to Practice. Varna: Zangador. Page 154 of 204
At the function room level revenue management decisions include:
Capacity management
While the total area of function rooms is limited, their seating capacity is variable
depending on seating layout – banquet, cocktail, boardroom, U-shaped, classroom or
theatre style. As seats are usually portable chairs, a function room may be prepared in
different seating layout styles, depending on the preferences of the customers.
Furthermore, large function rooms may have a foldable (removable) wall in the
middle allowing to be transformed into two smaller rooms when necessary.
Therefore, although function rooms have limited area, their capacity in terms of the
number of people they may accommodate simultaneously in them is flexible.
Duration management
Function rooms are rented for different periods of time. However, shorter renting
periods (e.g. a room rented for one hour only) might prevent a hotel from selling
them to customers who would like to rent function rooms for longer periods. That’s
why function rooms are normally rented for fixed periods – half day or full day. Per-
hour rent may also be possible during periods of low demand.
Price
Pricing strategy for the function rooms is subordinate to the general revenue
management strategy of the hotel. Services related to function rooms might be priced
separately (i.e. rent for the function room, beamer, flipchart, laptop computer) or as
one package price. It should be noted that in most cases the use of the function rooms
is accompanied by catering and guest rooms bookings, which provides additional
revenue opportunities for the hotel. That’s why it is also possible that the function
room is provided by the hotel free of charge in order to attract the organisers of
special events – the lost revenue is offset by the revenues generated by the sale of
rooms and catering the event.
14.4. Casino revenue management
Research of casino revenue management and operations (Hendler & Hendler, 2004;
Kilby, Fox & Lucas, 2005; Kuyumcu, 2002; Norman & Mayer, 1997; Peister, 2007;
Zhuang & Li, 2012) is growing as a result of the importance of gambling as a travel
motive and its role for revenue generation especially in destinations like Las Vegas
and Macao. At the property level, strategic casino revenue management decisions
relate to: types of games offered in a casino, number and location of tables and slot
machines, hours of operation. These decisions influence the revenue potential of the
Stanislav Ivanov (2014). Hotel Revenue Management: From Theory to Practice. Varna: Zangador. Page 155 of 204
casino. Casino hotels offer a wide variety of games with highly varying betting levels
(from slot machines with a minimum bet of 0.01 USD to roulettes with bets of several
hundred USD) in order to attract different market segments.
At the game/table/slot machine level, revenue management levers available to casino
managers include:
Capacity management
For table games, capacity is fixed – it depends on the number of seats available for
players around the table. The capacity of slot machines is equal to their number.
However, slot machines might be located in different areas of the hotel (in the
restaurant, bar, corridors, even in toilets), provided local government regulation
allows it, leading to expansion of a casino’s physical capacity and more encounter
points of the potential players with the slot machines.
Managing average bets
Slot machines and table games at casinos allow players to choose their bet within a
certain range. A minimum bet protects the financial interests of the casino, while the
maximum – of customers. Messages on slot machines show potential wins depending
on bet size to stimulate players to increase their bets.
Managing game pace
Slow game pace means fewer hands per hour played on a table which lowers a
casino’s win. It is the role of the croupier to accelerate the pace of a table game. Music,
sound and lights serve the same role for slot machines.
Time management
The longer players stay in a casino, the larger the amount of money they will gamble.
Casinos do not have clocks or windows so players will lose track of time and play
longer.
Managing house advantage
For some games, like roulette, the house advantage is fixed. For others, like slot
machines, the house advantage is flexible. Casinos have to balance the house advan-
tage they set for their slot machines – too low an advantage will attract players but
will generate low revenues; too high a house advantage will generate higher revenues
from individual players but will dissuade them from playing the slot machines. To
balance both objectives (attracting players and generating high revenues) casinos set
different house advantages on different slot machines, locate slot machines with a
high advantage next to others with low advantage, and regularly change the
Stanislav Ivanov (2014). Hotel Revenue Management: From Theory to Practice. Varna: Zangador. Page 156 of 204
advantage of every slot machine in order to avoid pattern recognition of the results
by players.
Gambling is an important revenue source for casino hotels and it may well be their
major source of revenue. As the gambling revenues depend on the number of players,
casino hotels often tend to have large number of guest rooms (above 1000) sold at
prices much lower than the prices for non-casino hotels of the same category and
similar standard of service. Casino hotel revenue managers attract customers to their
hotels with low prices for accommodation who will then spend more for gambling,
food and beverages, shopping, entertainment, etc.
14.4. Golf course revenue management
Golf course revenue management (Barth, 2002; Kimes, 2000; Kimes & Schruben, 2002;
Licata & Tiger, 2010; Rasekh & Li, 2011) is based on the same principles as RM in the
other hotel departments. Golf revenue management tools include:
Membership fees
One of the main sources of revenues for golf clubs and golf hotels are the annual
membership fees. Club membership gives a player the right to use a golf course for
an unlimited number of rounds during a club’s membership period. Members are
also entitled to discounts for room accommodation, in F&B outlets, spa centre, etc. To
stimulate loyal members, golf resort hotels often provide discounts for early renewals
(i.e. before a specific date). If a golf resort hotel includes chalets/houses sold to
players but managed by the hotel, discounts are provided to homeowners as well. It
is possible that discounts for joint membership in two or more golf resorts of the same
chain/owner to be offered (a joint membership programme is offered by Lighthouse
Golf & Spa Resort and BlackSeaRama Golf & Villas Resort in Bulgaria:
http://www.lighthousegolfresort.com/Golf-in-Bulgaria/Membership).
Green fees
Green fees are paid by non-members for the right to use a golf course at specific tee
times. Green fees may vary on the basis of:
– Number of holes – usually green fees are set for 9 or 18 holes.
– Time of the day – higher green fees during busy periods of the
day and lower fees during periods of low demand.
– Day of the week – lower green fees (discounts) during weekdays.

Stanislav Ivanov (2014). Hotel Revenue Management: From Theory to Practice. Varna: Zangador. Page 157 of 204
– Customer characteristics – discounts for guests accommodated in
the hotel or owning a chalet/house at the golf resort.
Fees for additional services
Golf courses generate revenues for additional services like:
– Golf lessons – prices can vary for a single lesson or a package of
several (e.g. 10) lessons, individual or group lessons, lessons for junior players or
private playing lessons of 9 or 18 holes.
– Rentals of trolley, golf cart, clubs, golf shoes, etc.
Some or all of the above services may be included in the club membership fee or the
green fee.
Capacity management
A golf course’s capacity depends on its hours of operation and tee time intervals. A
golf course open ten hours a day with ten minutes of tee time intervals will have 60
available rounds (600 operational minutes : 10 minutes tee time interval). During high
demand periods of the day, the tee time might be decreased to nine or even eight
minutes to accommodate more players wishing to use the course.
Duration management
The speed with which golfers play influences tee time intervals – a slower play
requires longer intervals which decreases the revenue potential of the golf course.
Therefore, the management team must know the average play duration of different
market segments which would help better plan tee time intervals. Juniors need more
time to play a round or certain number of shots than adults and more experienced
players and, that’s why, the intervals between them must be longer.
Advance bookings
Advance bookings help the golf club/hotel better plan the utilisation of the golf
course. A hotel may require full or partial prepayment or at least credit card
guarantee in exchange for a price discount. Normally club members bookings will
have priority over bookings by non-members.
This chapter has revealed that revenue management practices could (and should) be
adopted by the various departments in the hotel. It is necessarily that a total hotel
revenue management strategy is applied so that the RM decisions taken in each
department are in line with the general RM strategy of the hotel.
Stanislav Ivanov (2014). Hotel Revenue Management: From Theory to Practice. Varna: Zangador. Page 158 of 204
Chapter 15
HOTEL REVENUE MANAGEMENT, ETHICS AND RELATIONSHIP
MARKETING
15.1. The role of revenue management in relationship marketing
With its focus on pricing and inventory management tools, revenue management is
closely connected with customer relationship management (CRM) (Butscher, Vidal &
Dimier, 2009; Iyengar & Suri, 2012; Milla & Shoemaker, 2008; Noone, Kimes &
Renaghan, 2003; Wang & Bowie, 2009; Wang, 2012a, 2012b, 2013) as they both aim at
maximising revenues although through different means. CRM aims at achieving
higher profitability for a company by establishing and sustaining long-lasting and
mutually beneficial relationships with its customers. In this sense, CRM has a long-
term time horizon while RM is more short-term oriented. Therefore, inevitably CRM
and RM may seem as opposing business practices not typically followed by
companies simultaneously. Nevertheless, as Noone, Kimes & Renaghan (2003) and
Wang (2013) show, CRM and RM should be perceived as complimentary business
strategies and RM tools can be effectively used in CRM practices. Accommodation
establishments, for example, should determine their price levels and booking terms in
relation to customer loyalty. As discussed in Chapter 12, the Intercontinental Hotel
Group provides room availability guarantee to its Platinum Elite Rewards Club
members if certain advance booking conditions have been met. Furthermore, hotel
chains provide special rates valid only to their loyalty programme members, thus
rewarding them for their patronage. Finally, enrolling guests in loyalty programmes
positively influences their spending (Voorhees, McCall & Carroll, 2014) and,
therefore, contributes to the improved financial performance of the hotel.
One of the main concepts in CRM is customer life-time value (CLTV). In essence, it
shows the monetary value of the long-term relationship with a particular customer.
In financial terms it can be calculated as the net present value of the gross operating
Stanislav Ivanov (2014). Hotel Revenue Management: From Theory to Practice. Varna: Zangador. Page 159 of 204
profit generated by a customer during the whole period of his relationship with the
company:
(15.1) ∑
,
where: CLTVj – lifetime value of customer j; GOPj – gross operating profit generated
by customer j; ACj – initial customer acquisition costs; n – duration of the relationship
between the customer and the company; r –retention rate of the customers; k –
discount rate (required rate of return from investments of the company).
The lifetime value is dependent on the customer retention rate r – the probability that
a customer will be retained by the company and will not defect to competitors.
Satisfied customers are more likely to repeat their purchases and book again with the
same hotel (chain) than those unsatisfied (see Figure 10.2). The lifetime value is also
positively influenced by the duration of the relationship between the company and
the customer – the longer the relationship, the higher the total gross operating profit
generated by the customer. The latter might also increase on a per annum basis as a
result of:
Increased purchase quantity – e.g. more frequent and/or longer stays in
the hotel(s of the chain);
Increased prices of purchased products – e.g. stays in higher standard
rooms;
Increased purchases of additional services in the hotel;
Decreased operating costs to serve hotel guests due to better knowledge
about their preferences;
Attracted new customers due to positive word-of-mouth generated by
current/past customers – e.g. reviews in Booking.com, Tripadvisor.com, Foursquare,
comments in Facebook and Twitter, personal recommendations to friends, relatives,
colleagues and acquaintances.
Of course, in order to maintain the relationships with its loyal customers the hotel
will provide rooms and/or additional services free of charge or at heavily reduced
rates which will decrease the short-term gross operating profit but increase customer
satisfaction, retention rate and the lifetime value of the customer. Similar to revenue
management, CRM, through the customer lifetime value concept, acknowledges that
Stanislav Ivanov (2014). Hotel Revenue Management: From Theory to Practice. Varna: Zangador. Page 160 of 204
different customers have different profitability and importance for the company (see
Chapter 1). The hotel (chain) should target only market segments with a positive
lifetime value and avoid segments that are too costly to serve.
The above discussion confirms that the concepts of CRM and RM are closely
connected. In any case, RM tools play a supportive role to CRM in the process of
establishing and maintaining long-lasting profitable relationships between the hotel
and its customers.
In recent years the concept of customer relationship management has been further
developed with the introduction of the concept of gamification (Werbach & Hunter,
2012) and engagement economy (Palmer, Lunceford & Patton, 2012). According to
Werbach & Hunter (2012: 22), external gamification involves existing or prospective
customers and is a way to improve relationships between businesses and customers,
producing increased engagement, identification with the product, stronger loyalty
and, ultimately, higher revenues. In the hotel industry, the concept of gamification is
embodied in the collection of points via chain’s loyalty programme and the different
levels of membership in the programme leading to different customer status and
access to different rewards (e.g. free overnights, complimentary services in member
hotels of the chain, or exchange for free miles and flight tickets). Additionally, the
hotel (chain) might actively use social media for RM purposes (Noone, McGuire &
Rohls, 2011), and involve customers through its pages (Facebook, Foursquare, Twitter,
Pinterest, etc.) and various competitions and quizzes it organises there.
Besides with customers, the hotel (chain) must maintain good relationships with its
distributors too as elaborated in Chapter 13. In this context the concept of distribution
channel cannibalisation, resulting from a hotel’s opportunistic behaviour, plays a key
role. The prices the hotel charges its direct customers serve as a ceiling for the prices
that its distributors may charge their customers. If a hotel charges its direct customers
prices that are lower or the same as its distributors’ prices, the latter will avoid
working with that hotel. This will lead to distribution channel cannibalisation
(Chapter 13) and vertical conflicts within the distribution network. Furthermore,
relationships with the distributors will be affected by the overbooking practices of the
accommodation establishment. When hotels are faced with the necessity to walk
guests due to overbooking, they must choose who to walk (Chapter 12). If they walk
Stanislav Ivanov (2014). Hotel Revenue Management: From Theory to Practice. Varna: Zangador. Page 161 of 204
a guest sent by a distributor, this decision and the way it is implemented may
negatively influence the relationship between the hotel and the distributor.
15.2. Ethical issues in hotel revenue management
Despite their perceived positive impacts on a hotels’ bottom line, revenue
management techniques have received a huge amount of criticism in terms of
grievances and lack of sensible benefits (Bitran & Caldentey, 2003; Koide & Ishii,
2005). This is especially valid for price discrimination and overbooking. Customers
feel belied if they discover that they have paid a higher price than other guests for the
same room, or if they have to be moved to another hotel. This influences their
perception about the fairness of revenue management practices in the accommodation
establishment (Beldona & Namasivayam, 2006; Beldona & Kwansa, 2008; Choi &
Mattila, 2003, 2005, 2006; Heo & Lee, 2011; Hwang & Wen, 2009; Kimes, 2002; Kimes
& Wirtz, 2003; Mauri, 2007; Rohlfs & Kimes, 2007; Taylor & Kimes, 2011; Wirtz &
Kimes, 2007), their patronage intentions and, ultimately, their future bookings at the
same hotel (chain) (see Figure 3.1). Guests might form negative perceptions about the
fairness of RM practices as a result of the lack of or incomplete information about
prices, rate fences, price dynamics, cancellation, amendment and payment terms,
insufficient compensation when being walked, and many other reasons. Kimes (2002:
28-30) pinpoints the RM practices that customers consider acceptable or unacceptable:
Acceptable revenue management practices:
Providing customers with all information regarding prices and booking
conditions because hiding information destroys trust.
Deep discounts in booking rates in exchange for stricter cancellation /
amendment conditions.
Different prices for products perceived by customers as different – e.g.
weekend and weekday prices.
Unacceptable revenue management practices:
Insignificant discounts in exchange for stricter cancellation/amendment
conditions.
Changes in booking terms without informing the customer.
Stanislav Ivanov (2014). Hotel Revenue Management: From Theory to Practice. Varna: Zangador. Page 162 of 204
Obviously, when information about prices and booking terms is available and
understood by guests or when different prices are charged for products perceived by
them as different, customers are more inclined to accept revenue management
practices. In the other cases, when discounts are insignificant compared to booking
amendment/cancellation restrictions or the latter are changed after the booking has
been confirmed, customers will be dissatisfied. Furthermore, Choi & Mattila (2005)
specify that only informing customers about a hotel’s rates is not enough to improve
their perceived fairness of revenue management – they have to know the basis for
rates variability (i.e. the rate fences) and the booking conditions. Price consistency
(integrity), discussed in Chapter 11, contributes positively to guest perceptions of
fairness. In any case, the hotel should provide clear, simple, straightforward,
understandable information about its prices and promotions because the use of
jargon and complicated legal language might create mistrust. Furthermore, hotels
should have clear policies and procedures regarding overbookings, walking guests,
and compensation. Staff training is essential because their actions on the operational
level (who to be walked, what discount/compensation to give) will determine the
satisfaction of customers and their feelings and perceptions about the revenue
management system of the hotel as a whole.
Stanislav Ivanov (2014). Hotel Revenue Management: From Theory to Practice. Varna: Zangador. Page 163 of 204
Chapter 16
REVENUE MANAGEMENT PRACTICES OF ACCOMMODATION
ESTABLISHMENTS IN BULGARIA
This chapter analyses revenue management practices applied by accommodation
establishments in Bulgaria. It first provides a brief overview of the development of
Bulgaria’s hotel industry in the period 2010-2013. The second section of the chapter
elaborates the methodology, section three analyses the results while the last section
provides recommendations to accommodation establishment owners, general,
marketing and revenue managers for improving applied RM practices.
16.1. Empirical setting
Bulgarian tourism industry expanded rapidly during the last 15 years and in 2013 it
boasted 302433 beds (a 6.6% increase from 2010) as official data from the National
Statistics Institute indicate (see Table 16.1). The category of beds is balanced, with
roughly one-third of the beds with 1-2, 3 and 4-5 stars, with slight advantage of the
highest categories. Regarding the number of accommodation establishments, the
situation is a bit controversial. In 2012 the NSI changed its methodology for counting
accommodation establishments. In March 2013 the author contacted the NSI for an
explanation regarding those changes but their answer was that the NSI did not intend
to and would not recalculate the data for the years prior to 2012 according to the new
methodology. That’s why the statistics calculated on the basis of number of
accommodation establishments are not truly comparable over time.
The total number of tourists and number of overnights grew steadily during the
analysed period. From a structural perspective, in 2013 4-5 star accommodation
establishments accounted for nearly half of the tourists and the overnights. Average
revenues from one overnight remained nearly constant for all lodging categories. The
average stay was about 3-4 overnights with slightly longer stays at 3- and 4-5 star
compared to 1-2 star properties. The average capacity of accommodation

Stanislav Ivanov (2014). Hotel Revenue Management: From Theory to Practice. Varna: Zangador. Page 164 of 204
establishments varies greatly – from 54 beds for lower categories to 329 beds for
higher categories (in 2013). This was expected, considering the high concentration of
4-5 star hotels on the Black sea coast relying on the economies of scale to stay
profitable on the mass 3S tourist market.
Table 16.1. Key statistics of Bulgarian hotel industry
Source: NSI (2013b) and author’s calculations.
Note: 1 EUR=1.95583 BGN;
* The data for 2012 and 2013 are according to the new methodology and for 2010 and 2011 – according
to the old one.
2010 2011 2012* 2013*
Number of accommodation establishments Total 3540 3776 2758 2953
1-2 stars 2423 2615 1568 1698
3 stars 823 868 867 904
4-5 stars 294 293 323 351
Number of beds in accommodation
establishments
Total 283641 283251 301140 302433
1-2 stars 91200 94032 92700 92261
3 stars 89779 90685 93951 94637
4-5 stars 102662 98534 114489 115535
Average capacity of the accommodation
establishments (in beds)
Total 80,12 75,01 109,19 102,42
1-2 stars 37,64 35,96 59,12 54,34
3 stars 109,09 104,48 108,36 104,69
4-5 stars 349,19 336,29 354,46 329,16
Number of overnights in accommodation
establishments
Total 16261170 18855331 20252038 21617474
1-2 stars 3326381 3753555 4354331 4524469
3 stars 5135842 6307012 6420223 6671313
4-5 stars 7798947 8794764 9477484 10421692
Number of tourists spending at least one
night in accommodation establishments
Total 4411899 5045332 5494014 5847289
1-2 stars 1043171 1165774 1364709 1407858
3 stars 1369715 1597840 1666452 1728036
4-5 stars 1999013 2281718 2462853 2711395
Revenues of the accommodation
establishments from overnights (in BGN)
Total 653736875 733053423 836210287 906305593
1-2 stars 74148025 86190578 115131158 110696302
3 stars 176693474 218093171 226198301 238008396
4-5 stars 402895376 428769674 494880828 557600895
Average revenues of the accommodation
establishments from one overnight (in BGN)
Total 40,20 38,88 41,29 41,92
1-2 stars 22,29 22,96 26,44 24,47
3 stars 34,40 34,58 35,23 35,68
4-5 stars 51,66 48,75 52,22 53,50
Average length of stay (number of
oivernights)
Total 3,69 3,74 3,69 3,70
1-2 stars 3,19 3,22 3,19 3,21
3 stars 3,75 3,95 3,85 3,86
4-5 stars 3,90 3,85 3,85 3,84

Stanislav Ivanov (2014). Hotel Revenue Management: From Theory to Practice. Varna: Zangador. Page 165 of 204
16.2.Methodology
16.2.1. Research method 1: Survey of accommodation establishments in Bulgaria
Data collection
Data collection took place in January-February 2014. Although it was during the
winter months, this was not a hindrance for seaside properties to participate in the
study, because although they do not serve tourists during that period, their
general/marketing/revenue managers work and regularly check their
correspondence. An online questionnaire was developed and sent by email to 1991
(67.42%) out of 2953 accommodation establishments operating in Bulgaria in 2013
(NSI, 2013b) whose emails were successfully identified. Two reminders were sent to
the potential respondents about two and four weeks after the initial invitation to
participate in the study. No more reminders were sent in order to avoid classifying
the email as spam and causing negative reactions by potential respondents.
To stimulate the response rate, the author offered an incentive to survey participants
(as advised in Illum, Ivanov & Liang, 2010). Every respondent who completed the
online questionnaire received a link to a trade press article, co-authored by the
researcher discussing sustainable tourism practices in accommodation establishments
in Bulgaria. Permission was obtained from the publisher of this closed-access article
to use its full text as a reward to survey respondents prior to the distribution of the
questionnaire. As a second incentive, the researcher offered an option to survey
respondents to participate in a lottery for two complimentary copies of a textbook on
hotel marketing co-authored by the researchers. Permission to use this incentive was
granted by the textbook publisher. Winners were announced in February 2014.
Hoteliers were informed about the winners in order to create trust and stimulate their
participation in future research projects. Furthermore, other industry contacts have
been fully utilised to stimulate the response rate. The author contacted the Bulgarian
Hotel and Restaurant Association, tourist chambers in the two districts with largest
number of accommodation establishment in the country (Varna Chamber of Tourism
and Bourgas Regional Tourist Chamber), as well as three tour operators working with
many hotels in Bulgaria with request for them to distribute the questionnaire to their
members/partners. The final sample included 102 accommodation establishments,
yielding a 5.12% response rate. This was not surprising as similar small numbers of
respondents from the Bulgarian tourism industry were reported by Ivanov, Ivanova
& Iankova (2012), Ivanova & Ivanov (2014), Lucas, Marinova & Vodenska (2009).
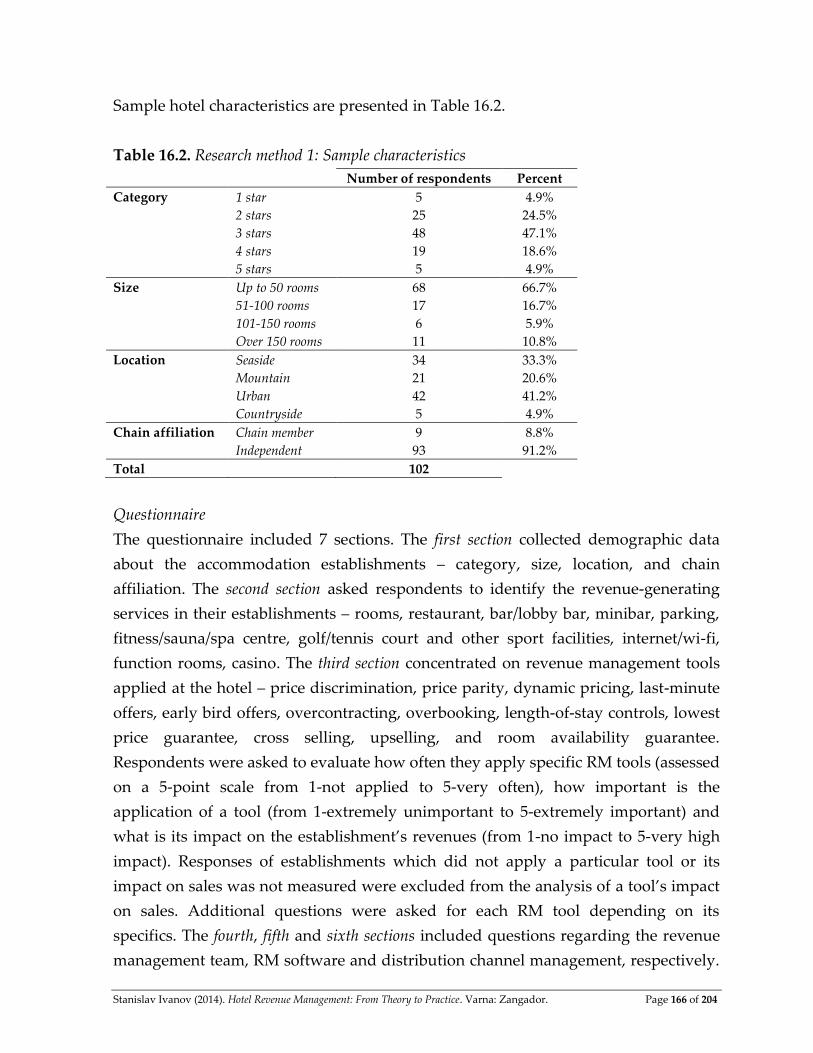
Stanislav Ivanov (2014). Hotel Revenue Management: From Theory to Practice. Varna: Zangador. Page 166 of 204
Sample hotel characteristics are presented in Table 16.2.
Table 16.2. Research method 1: Sample characteristics
Number of respondents Percent
Category 1 star 5 4.9%
2 stars 25 24.5%
3 stars 48 47.1%
4 stars 19 18.6%
5 stars 5 4.9%
Size Up to 50 rooms 68 66.7%
51-100 rooms 17 16.7%
101-150 rooms 6 5.9%
Over 150 rooms 11 10.8%
Location Seaside 34 33.3%
Mountain 21 20.6%
Urban 42 41.2%
Countryside 5 4.9%
Chain affiliation Chain member 9 8.8%
Independent 93 91.2%
Total 102
Questionnaire
The questionnaire included 7 sections. The first section collected demographic data
about the accommodation establishments – category, size, location, and chain
affiliation. The second section asked respondents to identify the revenue-generating
services in their establishments – rooms, restaurant, bar/lobby bar, minibar, parking,
fitness/sauna/spa centre, golf/tennis court and other sport facilities, internet/wi-fi,
function rooms, casino. The third section concentrated on revenue management tools
applied at the hotel – price discrimination, price parity, dynamic pricing, last-minute
offers, early bird offers, overcontracting, overbooking, length-of-stay controls, lowest
price guarantee, cross selling, upselling, and room availability guarantee.
Respondents were asked to evaluate how often they apply specific RM tools (assessed
on a 5-point scale from 1-not applied to 5-very often), how important is the
application of a tool (from 1-extremely unimportant to 5-extremely important) and
what is its impact on the establishment’s revenues (from 1-no impact to 5-very high
impact). Responses of establishments which did not apply a particular tool or its
impact on sales was not measured were excluded from the analysis of a tool’s impact
on sales. Additional questions were asked for each RM tool depending on its
specifics. The fourth, fifth and sixth sections included questions regarding the revenue
management team, RM software and distribution channel management, respectively.

Stanislav Ivanov (2014). Hotel Revenue Management: From Theory to Practice. Varna: Zangador. Page 167 of 204
The last section was devoted to the revenue management process – RM metrics and
forecasting methods. This section also aimed at assessing the level of agreement of
respondents (on a 5-point scale from 1-completely disagree to 5-completely agree)
with various statements related to the RM process. In general, the questionnaire took
about 10-15 minutes to complete.
Data analysis
The study investigated the impact of category, size, location and chain affiliation on
the application of various revenue management practices of accommodation
establishments in Bulgaria. The non-parametric Mann-Whitney U-test and Kruskal-
Wallis χ2 test were adopted to identify the influence of these factors on respondents’
answers to the dichotomous questions (applied/not applied). The Kolmogorov-
Smirnov z-test revealed that the responses to the 5-point scale questions have a
normal distribution. That’s why the parametric test ANOVA was used in their
analysis (Baggio & Klobas, 2011). Tukey's HSD and Scheffe’s post-hoc tests were used
for further analysis of the differences identified by ANOVA.
16.2.2. Research method 2: Pricing data about accommodation establishments in Sofia from an
OTA
The aim of this second study was to investigate the impact of different factors on the
level of accommodation establishment prices (see also Becerra, Santalo & Silva, 2013;
Portolan, 2013). Data were collected regarding rates for 149 accommodation
establishments in Sofia in Booking.com for the check-in dates 19th February and 22nd
February 2014 at ten time points during the period December 2013-February 2014 to
discover the factors that influence prices. Booking.com was chosen as a source of the
prices data because this OTA works on the agency model, i.e. the managers of the
accommodation establishments determine the prices for the final consumers
published on Booking.com. That’s why the prices and their changes in Booking.com
reflect the revenue management decisions of hotel management teams and not of the
OTA. In this regard, this website was considered as a reliable source of primary data
on room prices. In a similar vein, Schütze (2008) used Hrs.com for collecting pricing
data on hotels in Vienna.
For this study, the capital city of Bulgaria was selected because it has more than 100
accommodation establishments in the chosen OTA from very diverse categories and,
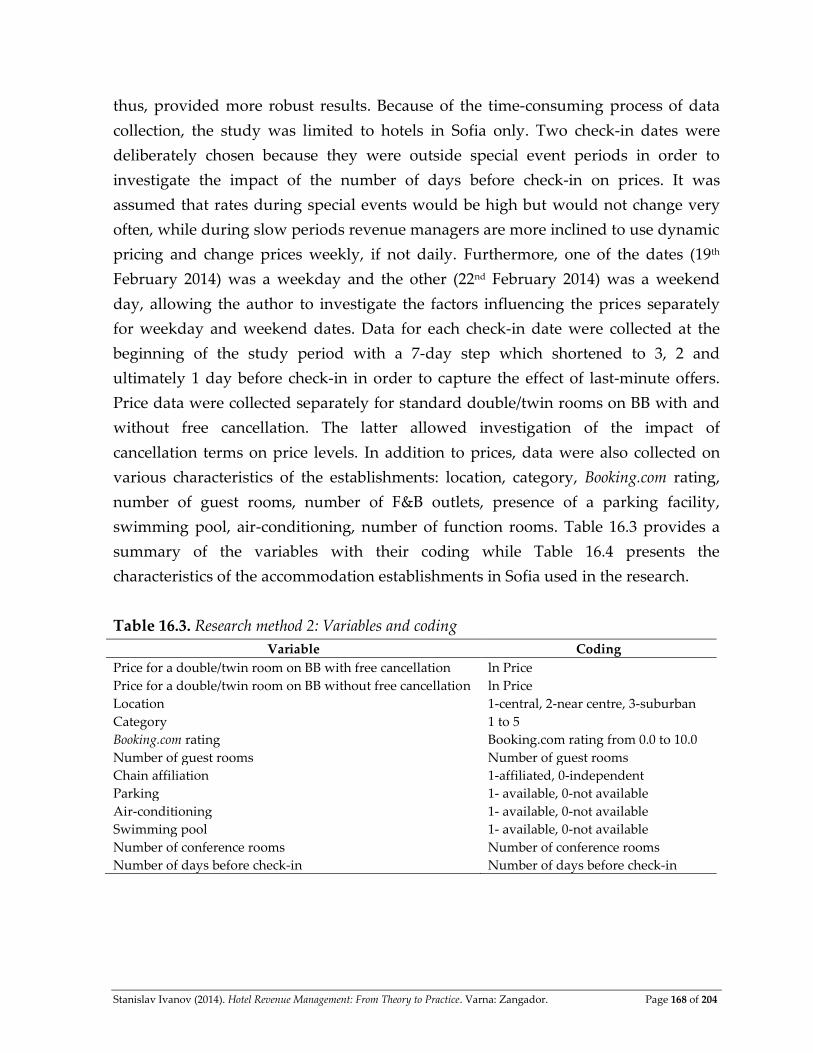
Stanislav Ivanov (2014). Hotel Revenue Management: From Theory to Practice. Varna: Zangador. Page 168 of 204
thus, provided more robust results. Because of the time-consuming process of data
collection, the study was limited to hotels in Sofia only. Two check-in dates were
deliberately chosen because they were outside special event periods in order to
investigate the impact of the number of days before check-in on prices. It was
assumed that rates during special events would be high but would not change very
often, while during slow periods revenue managers are more inclined to use dynamic
pricing and change prices weekly, if not daily. Furthermore, one of the dates (19th
February 2014) was a weekday and the other (22nd February 2014) was a weekend
day, allowing the author to investigate the factors influencing the prices separately
for weekday and weekend dates. Data for each check-in date were collected at the
beginning of the study period with a 7-day step which shortened to 3, 2 and
ultimately 1 day before check-in in order to capture the effect of last-minute offers.
Price data were collected separately for standard double/twin rooms on BB with and
without free cancellation. The latter allowed investigation of the impact of
cancellation terms on price levels. In addition to prices, data were also collected on
various characteristics of the establishments: location, category, Booking.com rating,
number of guest rooms, number of F&B outlets, presence of a parking facility,
swimming pool, air-conditioning, number of function rooms. Table 16.3 provides a
summary of the variables with their coding while Table 16.4 presents the
characteristics of the accommodation establishments in Sofia used in the research.
Table 16.3. Research method 2: Variables and coding
Variable Coding
Price for a double/twin room on BB with free cancellation ln Price
Price for a double/twin room on BB without free cancellation ln Price
Location 1-central, 2-near centre, 3-suburban
Category 1 to 5
Booking.com rating Booking.com rating from 0.0 to 10.0
Number of guest rooms Number of guest rooms
Chain affiliation 1-affiliated, 0-independent
Parking 1- available, 0-not available
Air-conditioning 1- available, 0-not available
Swimming pool 1- available, 0-not available
Number of conference rooms Number of conference rooms
Number of days before check-in Number of days before check-in
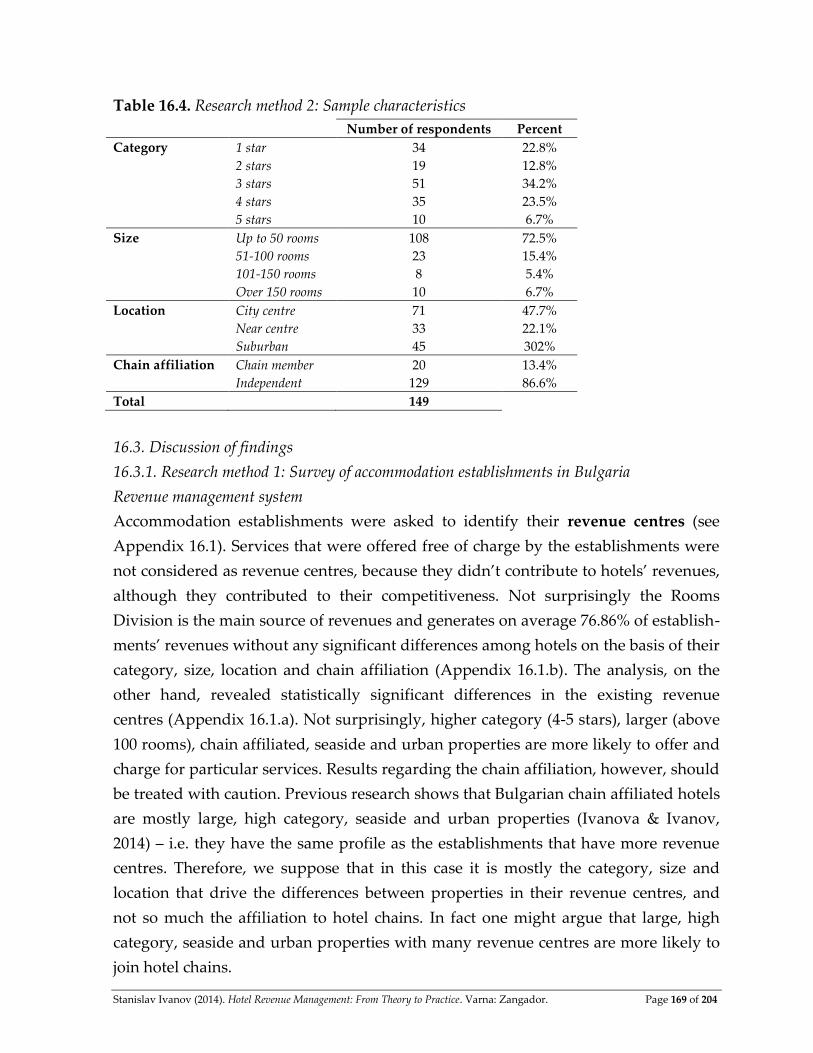
Stanislav Ivanov (2014). Hotel Revenue Management: From Theory to Practice. Varna: Zangador. Page 169 of 204
Table 16.4. Research method 2: Sample characteristics
Number of respondents Percent
Category 1 star 34 22.8%
2 stars 19 12.8%
3 stars 51 34.2%
4 stars 35 23.5%
5 stars 10 6.7%
Size Up to 50 rooms 108 72.5%
51-100 rooms 23 15.4%
101-150 rooms 8 5.4%
Over 150 rooms 10 6.7%
Location City centre 71 47.7%
Near centre 33 22.1%
Suburban 45 302%
Chain affiliation Chain member 20 13.4%
Independent 129 86.6%
Total 149
16.3. Discussion of findings
16.3.1. Research method 1: Survey of accommodation establishments in Bulgaria
Revenue management system
Accommodation establishments were asked to identify their revenue centres (see
Appendix 16.1). Services that were offered free of charge by the establishments were
not considered as revenue centres, because they didn’t contribute to hotels’ revenues,
although they contributed to their competitiveness. Not surprisingly the Rooms
Division is the main source of revenues and generates on average 76.86% of establish-
ments’ revenues without any significant differences among hotels on the basis of their
category, size, location and chain affiliation (Appendix 16.1.b). The analysis, on the
other hand, revealed statistically significant differences in the existing revenue
centres (Appendix 16.1.a). Not surprisingly, higher category (4-5 stars), larger (above
100 rooms), chain affiliated, seaside and urban properties are more likely to offer and
charge for particular services. Results regarding the chain affiliation, however, should
be treated with caution. Previous research shows that Bulgarian chain affiliated hotels
are mostly large, high category, seaside and urban properties (Ivanova & Ivanov,
2014) – i.e. they have the same profile as the establishments that have more revenue
centres. Therefore, we suppose that in this case it is mostly the category, size and
location that drive the differences between properties in their revenue centres, and
not so much the affiliation to hotel chains. In fact one might argue that large, high
category, seaside and urban properties with many revenue centres are more likely to
join hotel chains.
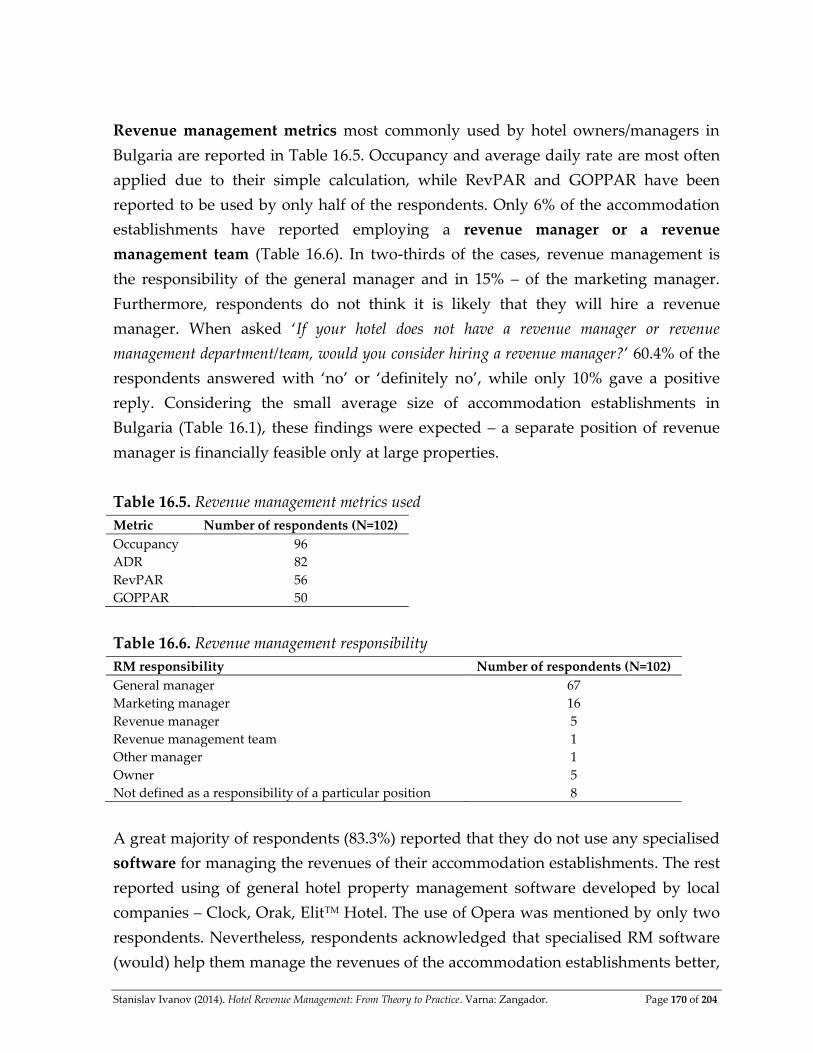
Stanislav Ivanov (2014). Hotel Revenue Management: From Theory to Practice. Varna: Zangador. Page 170 of 204
Revenue management metrics most commonly used by hotel owners/managers in
Bulgaria are reported in Table 16.5. Occupancy and average daily rate are most often
applied due to their simple calculation, while RevPAR and GOPPAR have been
reported to be used by only half of the respondents. Only 6% of the accommodation
establishments have reported employing a revenue manager or a revenue
management team (Table 16.6). In two-thirds of the cases, revenue management is
the responsibility of the general manager and in 15% – of the marketing manager.
Furthermore, respondents do not think it is likely that they will hire a revenue
manager. When asked ‘If your hotel does not have a revenue manager or revenue
management department/team, would you consider hiring a revenue manager?’ 60.4% of the
respondents answered with ‘no’ or ‘definitely no’, while only 10% gave a positive
reply. Considering the small average size of accommodation establishments in
Bulgaria (Table 16.1), these findings were expected – a separate position of revenue
manager is financially feasible only at large properties.
Table 16.5. Revenue management metrics used
Metric Number of respondents (N=102)
Occupancy 96
ADR 82
RevPAR 56
GOPPAR 50
Table 16.6. Revenue management responsibility
RM responsibility Number of respondents (N=102)
General manager 67
Marketing manager 16
Revenue manager 5
Revenue management team 1
Other manager 1
Owner 5
Not defined as a responsibility of a particular position 8
A great majority of respondents (83.3%) reported that they do not use any specialised
software for managing the revenues of their accommodation establishments. The rest
reported using of general hotel property management software developed by local
companies – Clock, Orak, ElitTM Hotel. The use of Opera was mentioned by only two
respondents. Nevertheless, respondents acknowledged that specialised RM software
(would) help them manage the revenues of the accommodation establishments better,

Stanislav Ivanov (2014). Hotel Revenue Management: From Theory to Practice. Varna: Zangador. Page 171 of 204
but they are not willing to spend the money for it (Table 16.7). Chain hotels are
willing to pay more for RM software than independent properties and 5-star hotels
are willing to pay more than 2- (Tukey’s HSD p<0.01) and 3-star establishments
(p<0.05). This is natural, considering the larger revenues of higher category properties
which make the investment in a specialised software financially feasible.
Table 16.7. Revenue management software
ANOVA M-W U test
Mean Standard
deviation
Category Size Location Chain affiliation
Do you think a specialised software
helps (would help) you manage
better the revenues of your
accommodation establishment?1
3.61 1.036 0.874 0.307 0.371 328.5
How much would you pay annually
for specialised RM software?2
308.82 486.42 3.603*** 2.842** 0.937 231.5**
Notes: ***Significant at 1% level; ** Significant at 5% level; *Significant at 10% level 1 measured on a 5-point scale (1-completely disagree; 5-completely agree) 2 in euros
Revenue management tools
Appendix 16.2.a elaborates on the pricing revenue management tools applied by
accommodation establishments in Bulgaria, Appendix 16.2.b – the non-pricing tools,
while Appendix 16.3 analyses the distribution channel management. Results reveal
that price discrimination and price parity are most often used pricing RM tools,
while last-minute offers and early bird rates are used less frequently. All pricing tools
exhibit above average level of importance (i.e. above 3.00). Contrary to general belief,
last-minute offers are perceived as having a lower impact on sales compared to price
discrimination, price parity and even early bird rate. This may partially explain the
low level importance attributed to group buying websites (like Grabo.bg) for of the
accommodation establishments’ revenues (see Appendix 16.3.a). Property category
influences the use of price parity and the perceptions of its importance and impact on
sale. Five-star hotels are more concerned about price parity than 1- (Tukey’s HSD
p<0.05), 2- (p<0.1) and 3-star properties (p<0.1) and the application of early bird rates
is having greater impact on their sales than at the lowest category properties (p<0.1).
Mid-sized properties (51-100 rooms) are more likely to pursue price parity (Tukey’s
HSD p<0.1) and apply early bird rates (p<0.05) than smallest ones (up to 50 rooms).
Seaside hotels are much more likely to apply early bird rates than mountain (Tukey’s
HSD p<0.05), urban (p<0.01), and countryside/rural properties (p<0.05). Chain hotels
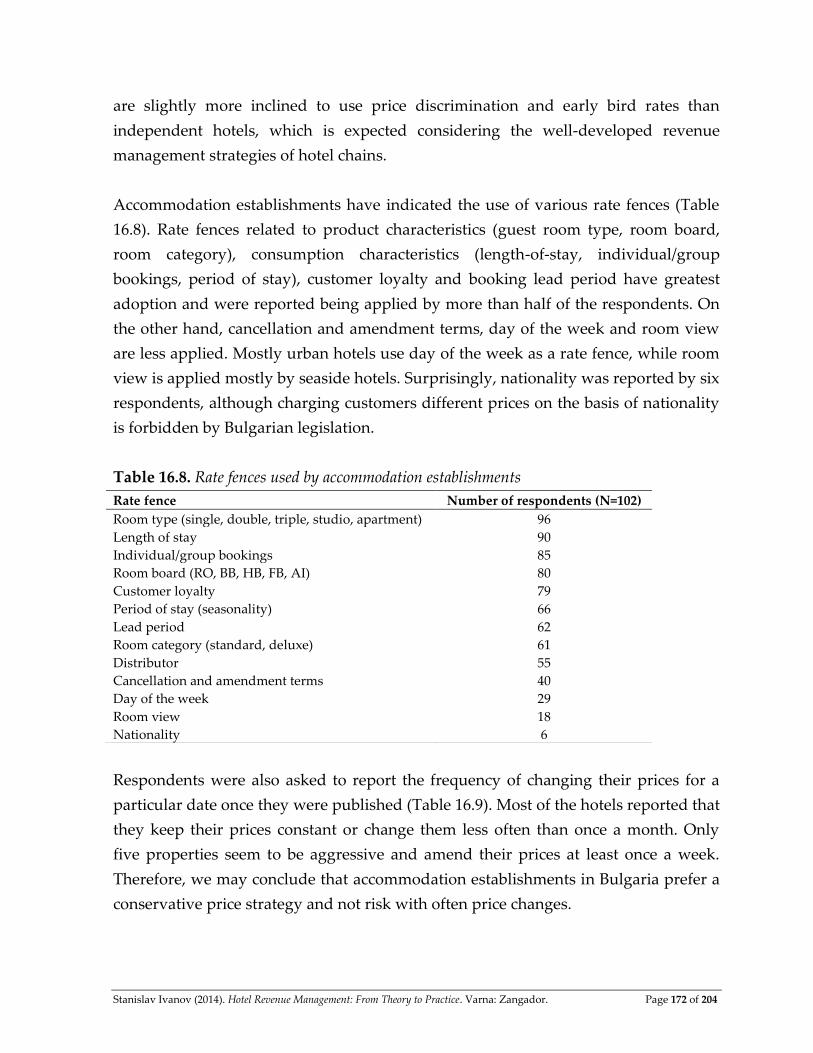
Stanislav Ivanov (2014). Hotel Revenue Management: From Theory to Practice. Varna: Zangador. Page 172 of 204
are slightly more inclined to use price discrimination and early bird rates than
independent hotels, which is expected considering the well-developed revenue
management strategies of hotel chains.
Accommodation establishments have indicated the use of various rate fences (Table
16.8). Rate fences related to product characteristics (guest room type, room board,
room category), consumption characteristics (length-of-stay, individual/group
bookings, period of stay), customer loyalty and booking lead period have greatest
adoption and were reported being applied by more than half of the respondents. On
the other hand, cancellation and amendment terms, day of the week and room view
are less applied. Mostly urban hotels use day of the week as a rate fence, while room
view is applied mostly by seaside hotels. Surprisingly, nationality was reported by six
respondents, although charging customers different prices on the basis of nationality
is forbidden by Bulgarian legislation.
Table 16.8. Rate fences used by accommodation establishments
Respondents were also asked to report the frequency of changing their prices for a
particular date once they were published (Table 16.9). Most of the hotels reported that
they keep their prices constant or change them less often than once a month. Only
five properties seem to be aggressive and amend their prices at least once a week.
Therefore, we may conclude that accommodation establishments in Bulgaria prefer a
conservative price strategy and not risk with often price changes.
Rate fence Number of respondents (N=102)
Room type (single, double, triple, studio, apartment) 96
Length of stay 90
Individual/group bookings 85
Room board (RO, BB, HB, FB, AI) 80
Customer loyalty 79
Period of stay (seasonality) 66
Lead period 62
Room category (standard, deluxe) 61
Distributor 55
Cancellation and amendment terms 40
Day of the week 29
Room view 18
Nationality 6
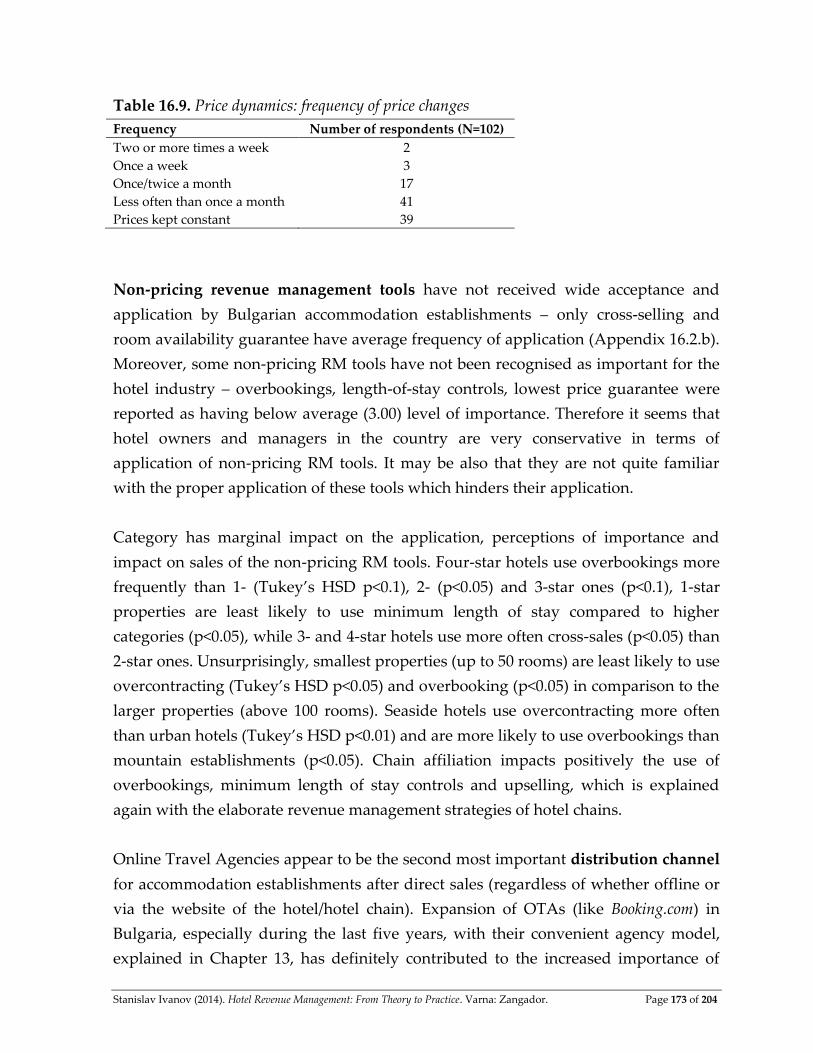
Stanislav Ivanov (2014). Hotel Revenue Management: From Theory to Practice. Varna: Zangador. Page 173 of 204
Table 16.9. Price dynamics: frequency of price changes
Frequency Number of respondents (N=102)
Two or more times a week 2
Once a week 3
Once/twice a month 17
Less often than once a month 41
Prices kept constant 39
Non-pricing revenue management tools have not received wide acceptance and
application by Bulgarian accommodation establishments – only cross-selling and
room availability guarantee have average frequency of application (Appendix 16.2.b).
Moreover, some non-pricing RM tools have not been recognised as important for the
hotel industry – overbookings, length-of-stay controls, lowest price guarantee were
reported as having below average (3.00) level of importance. Therefore it seems that
hotel owners and managers in the country are very conservative in terms of
application of non-pricing RM tools. It may be also that they are not quite familiar
with the proper application of these tools which hinders their application.
Category has marginal impact on the application, perceptions of importance and
impact on sales of the non-pricing RM tools. Four-star hotels use overbookings more
frequently than 1- (Tukey’s HSD p<0.1), 2- (p<0.05) and 3-star ones (p<0.1), 1-star
properties are least likely to use minimum length of stay compared to higher
categories (p<0.05), while 3- and 4-star hotels use more often cross-sales (p<0.05) than
2-star ones. Unsurprisingly, smallest properties (up to 50 rooms) are least likely to use
overcontracting (Tukey’s HSD p<0.05) and overbooking (p<0.05) in comparison to the
larger properties (above 100 rooms). Seaside hotels use overcontracting more often
than urban hotels (Tukey’s HSD p<0.01) and are more likely to use overbookings than
mountain establishments (p<0.05). Chain affiliation impacts positively the use of
overbookings, minimum length of stay controls and upselling, which is explained
again with the elaborate revenue management strategies of hotel chains.
Online Travel Agencies appear to be the second most important distribution channel
for accommodation establishments after direct sales (regardless of whether offline or
via the website of the hotel/hotel chain). Expansion of OTAs (like Booking.com) in
Bulgaria, especially during the last five years, with their convenient agency model,
explained in Chapter 13, has definitely contributed to the increased importance of
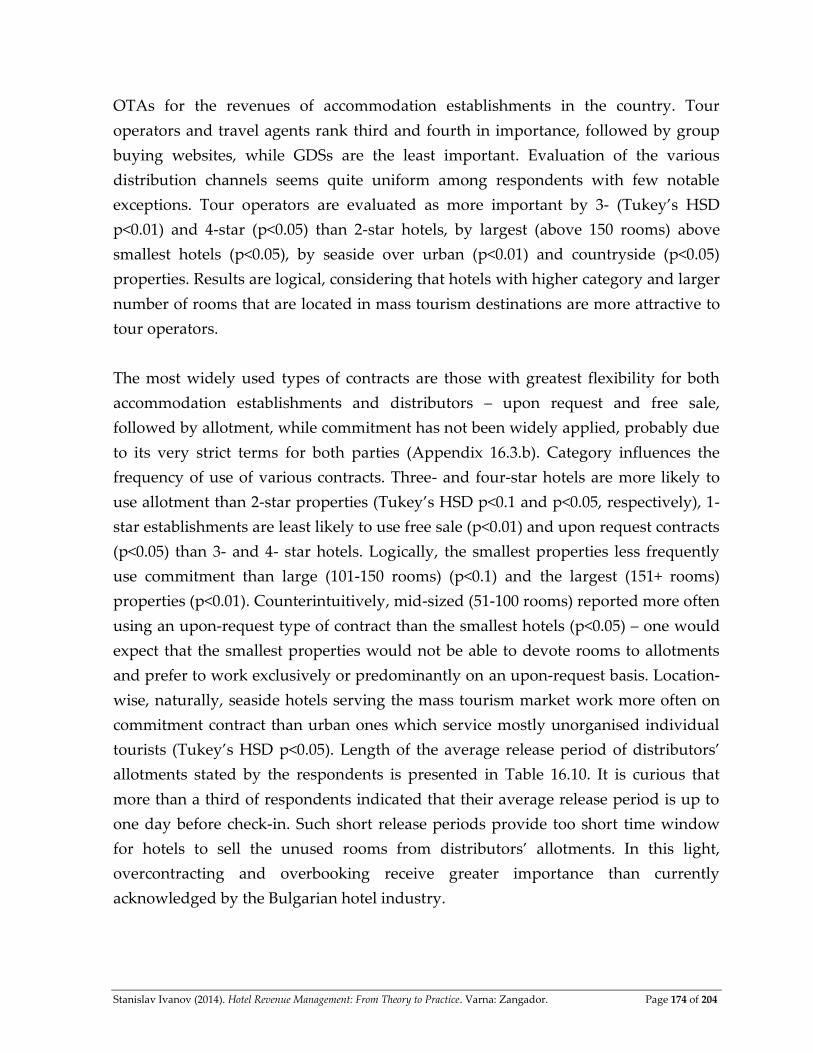
Stanislav Ivanov (2014). Hotel Revenue Management: From Theory to Practice. Varna: Zangador. Page 174 of 204
OTAs for the revenues of accommodation establishments in the country. Tour
operators and travel agents rank third and fourth in importance, followed by group
buying websites, while GDSs are the least important. Evaluation of the various
distribution channels seems quite uniform among respondents with few notable
exceptions. Tour operators are evaluated as more important by 3- (Tukey’s HSD
p<0.01) and 4-star (p<0.05) than 2-star hotels, by largest (above 150 rooms) above
smallest hotels (p<0.05), by seaside over urban (p<0.01) and countryside (p<0.05)
properties. Results are logical, considering that hotels with higher category and larger
number of rooms that are located in mass tourism destinations are more attractive to
tour operators.
The most widely used types of contracts are those with greatest flexibility for both
accommodation establishments and distributors – upon request and free sale,
followed by allotment, while commitment has not been widely applied, probably due
to its very strict terms for both parties (Appendix 16.3.b). Category influences the
frequency of use of various contracts. Three- and four-star hotels are more likely to
use allotment than 2-star properties (Tukey’s HSD p<0.1 and p<0.05, respectively), 1-
star establishments are least likely to use free sale (p<0.01) and upon request contracts
(p<0.05) than 3- and 4- star hotels. Logically, the smallest properties less frequently
use commitment than large (101-150 rooms) (p<0.1) and the largest (151+ rooms)
properties (p<0.01). Counterintuitively, mid-sized (51-100 rooms) reported more often
using an upon-request type of contract than the smallest hotels (p<0.05) – one would
expect that the smallest properties would not be able to devote rooms to allotments
and prefer to work exclusively or predominantly on an upon-request basis. Location-
wise, naturally, seaside hotels serving the mass tourism market work more often on
commitment contract than urban ones which service mostly unorganised individual
tourists (Tukey’s HSD p<0.05). Length of the average release period of distributors’
allotments stated by the respondents is presented in Table 16.10. It is curious that
more than a third of respondents indicated that their average release period is up to
one day before check-in. Such short release periods provide too short time window
for hotels to sell the unused rooms from distributors’ allotments. In this light,
overcontracting and overbooking receive greater importance than currently
acknowledged by the Bulgarian hotel industry.
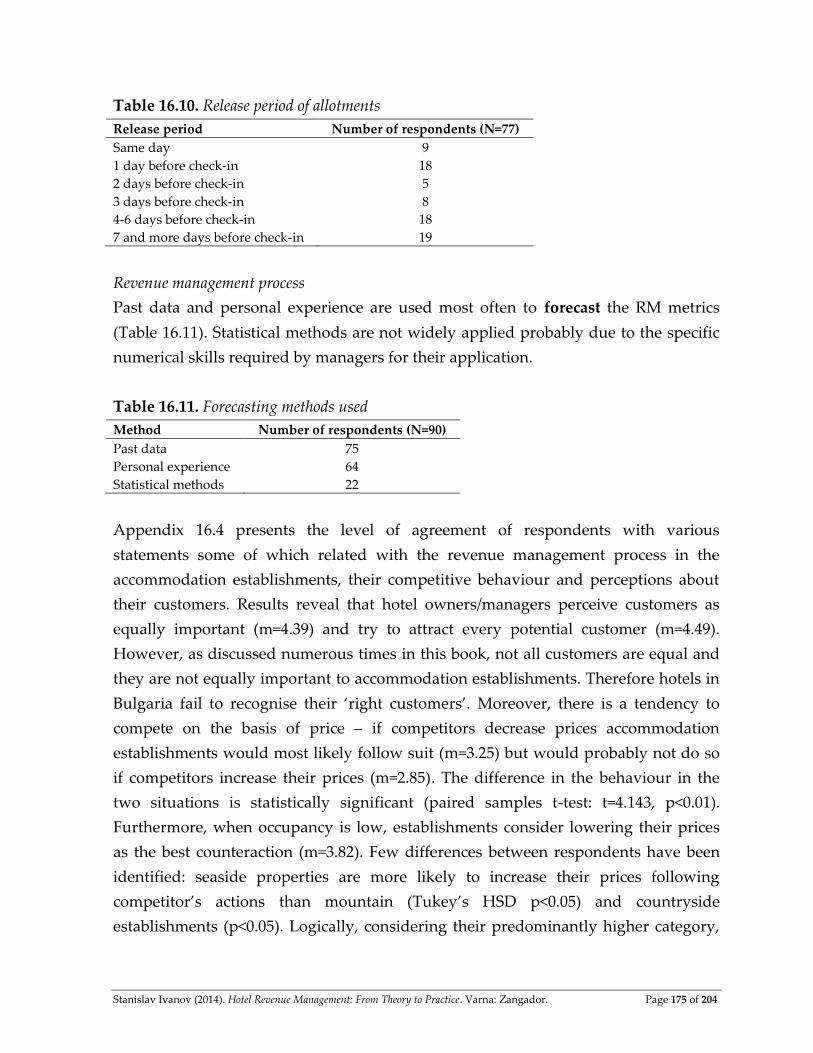
Stanislav Ivanov (2014). Hotel Revenue Management: From Theory to Practice. Varna: Zangador. Page 175 of 204
Table 16.10. Release period of allotments
Release period Number of respondents (N=77)
Same day 9
1 day before check-in 18
2 days before check-in 5
3 days before check-in 8
4-6 days before check-in 18
7 and more days before check-in 19
Revenue management process
Past data and personal experience are used most often to forecast the RM metrics
(Table 16.11). Statistical methods are not widely applied probably due to the specific
numerical skills required by managers for their application.
Table 16.11. Forecasting methods used
Method Number of respondents (N=90)
Past data 75
Personal experience 64
Statistical methods 22
Appendix 16.4 presents the level of agreement of respondents with various
statements some of which related with the revenue management process in the
accommodation establishments, their competitive behaviour and perceptions about
their customers. Results reveal that hotel owners/managers perceive customers as
equally important (m=4.39) and try to attract every potential customer (m=4.49).
However, as discussed numerous times in this book, not all customers are equal and
they are not equally important to accommodation establishments. Therefore hotels in
Bulgaria fail to recognise their ‘right customers’. Moreover, there is a tendency to
compete on the basis of price – if competitors decrease prices accommodation
establishments would most likely follow suit (m=3.25) but would probably not do so
if competitors increase their prices (m=2.85). The difference in the behaviour in the
two situations is statistically significant (paired samples t-test: t=4.143, p<0.01).
Furthermore, when occupancy is low, establishments consider lowering their prices
as the best counteraction (m=3.82). Few differences between respondents have been
identified: seaside properties are more likely to increase their prices following
competitor’s actions than mountain (Tukey’s HSD p<0.05) and countryside
establishments (p<0.05). Logically, considering their predominantly higher category,

Stanislav Ivanov (2014). Hotel Revenue Management: From Theory to Practice. Varna: Zangador. Page 176 of 204
chain hotels tend to disagree with the statement that customers prefer lower prices
than higher service quality.
In summary, this part of the study of revenue management practices of accommo-
dation establishments in Bulgaria leads us to the following general conclusions:
Rooms Division is by far the most important source of revenue;
Accommodation establishments do not have a revenue manager or an
RM team/department and revenue management is usually the responsibility of the
general manager;
Special RM software is not used, although its importance is
acknowledged;
Hotels are very conservative in the application of RM tools;
Properties prefer distribution channels (direct sales, OTAs) and certain
types of contracts with distributors (free sale, upon-request), allowing them greater
flexibility and control over pricing and sales.
16.3.2. Research method 2: Pricing data about accommodation establishments in Sofia from an
OTA
The impact of accommodation establishments’ characteristics and the number of days
before check-in on room prices was estimated using the following multiple regression
model:
(16.1) ∑
where lnPij is the natural logarithm of price of the i-th accommodation establishment
at moment j; const is the constant; Aik is the value of k-th attribute of the i-th accommo-
dation establishment (namely: location, category, Booking.com rating, number of
rooms, chain affiliation, number of F&B outlets, parking, swimming pool, air-
conditioning, conference rooms); Dij – the number of days before check-in at moment
j.
Similar to previous studies (Hung, Shang & Wang, 2010; Portolan, 2013) prices were
included in the regression model in logarithmic form in order to avoid skewness of
results in favour of hotels with high prices. On some survey days, the
accommodation establishments were fully booked for any of the two check-in days

Stanislav Ivanov (2014). Hotel Revenue Management: From Theory to Practice. Varna: Zangador. Page 177 of 204
under investigation, they did not appear in Booking.com, no prices were visualised
and they were not bookable. Furthermore, some hotels were offering non-refundable
rates during some periods and non-refundable in others. The regression analysis
included only those data points for which prices were available. Table 16.12 presents
the regression results.
Table 16.12. Factors influencing price – regression model results
Check-in date
Weekday Weekend
Cancellation terms
Non-refundable
rate
Free cancellation
rate
Non-refundable
rate
Free cancellation
rate
Model 1 Model 2 Model 3 Model 4
Dependent variable: ln Price for a double/twin room on BB
Independent variables standardised coefficients
Constant (intercept) (***) (***) (***) (***)
Location -0.015 -0.108*** -0.089*** -0.139***
Category 0.288*** 0.394*** 0.774*** 0.716***
Booking.com rating 0.024*** 0.016 0.157*** 0.177***
Number of rooms 0.047*** -0.007 0.004 0.044
Chain affiliation -0.009 -0.012 0.067*** 0.082***
Number of F&B outlets 0.065*** 0.076* 0.079*** 0.026
Parking -0.009 0.032 -0.062*** 0.086***
Swimming pool -0.055*** 0.014 -0.058*** -0.034*
Air-conditioning 0.041*** 0.056 0.039** -0.006
Conference rooms -0.069*** 0.051 -0.019 -0.019
Number of days before
check-in
0.706*** 0.098 -0.006 0.016
Model summary characteristics
R 0.979 0.611 0.898 0.879
R2 0.958 0.374 0.806 0.772
Adjusted R2 0.958 0.364 0.803 0.770
Number of valid
observations
722 1031 740 1039
Note: ***Significant at 1% level; ** Significant at 5% level; *Significant at 10% level
Regression analysis was based on four models with the same explanatory
independent variables but different dependent variables:
Model 1: ln Price for a double/twin room on BB on 19th February 2014,
non-refundable rate;
Model 2: ln Price for a double/twin room on BB on 19th February 2014
with free cancellation;

Stanislav Ivanov (2014). Hotel Revenue Management: From Theory to Practice. Varna: Zangador. Page 178 of 204
Model 3: ln Price for a double/twin room on BB on 22nd February 2014,
non-refundable rate;
Model 4: ln Price for a double/twin room on BB on 22nd February 2014
with free cancellation.
Results indicate that distance from city centre depresses the prices in all 4 models (cf.
Lee & Jang, 2012), while category, number of F&B outlets and air-conditioning has
generally positive impact. Surprisingly, the presence of a swimming pool is mostly
negatively related with the price. From a customer relationship management perspec-
tive (Chapter 15) it is important to indicate that the Booking.com rating of the
accommodation establishment has a positive influence on its prices in all four models
and in three of them the respective standardised regression coefficient is statistically
significant at the 1% level. This is a proof that hard work pays off: when hotels
provide superior value (Chapter 10), customers reward them with positive reviews
which increase the competitiveness of the establishments, attract/divert demand to
them and they could afford to charge higher prices. The other explanatory variables
do not have consistent impact on prices. Chain hotels have higher prices during the
weekend date (Models 3 and 4) but slightly lower during the weekday date (Models 1
and 2). The number of days before check-in has highly positive and statistically
significant at the 1% level impact on prices only in Model 1 (weekday, non-
refundable rate), i.e. the larger the number of days before check-in, the higher the
price, and vice versa – prices are lower closer to the check-in date. Therefore,
regarding the non-refundable weekday rates accommodation establishments used
last minute offers. The regression coefficients for the number of days before check-in
in the other three models are not significant. In general the four models have high
explanatory power: Model 1 explains 95.8% of the variations in the dependent
variable, Model 3 – 80.3%, Model 4 – 77%, while Model 2 – 36.4%.
Table 16.13. Differences between refundable and non-refundable rates
Check-in date
Weekday Weekend
Mean Standard deviation Mean Standard deviation
Absolute difference in BGN 19.68 17.84 16.76 19.14
Difference in percent 14.31 11.70 19.14 14.43
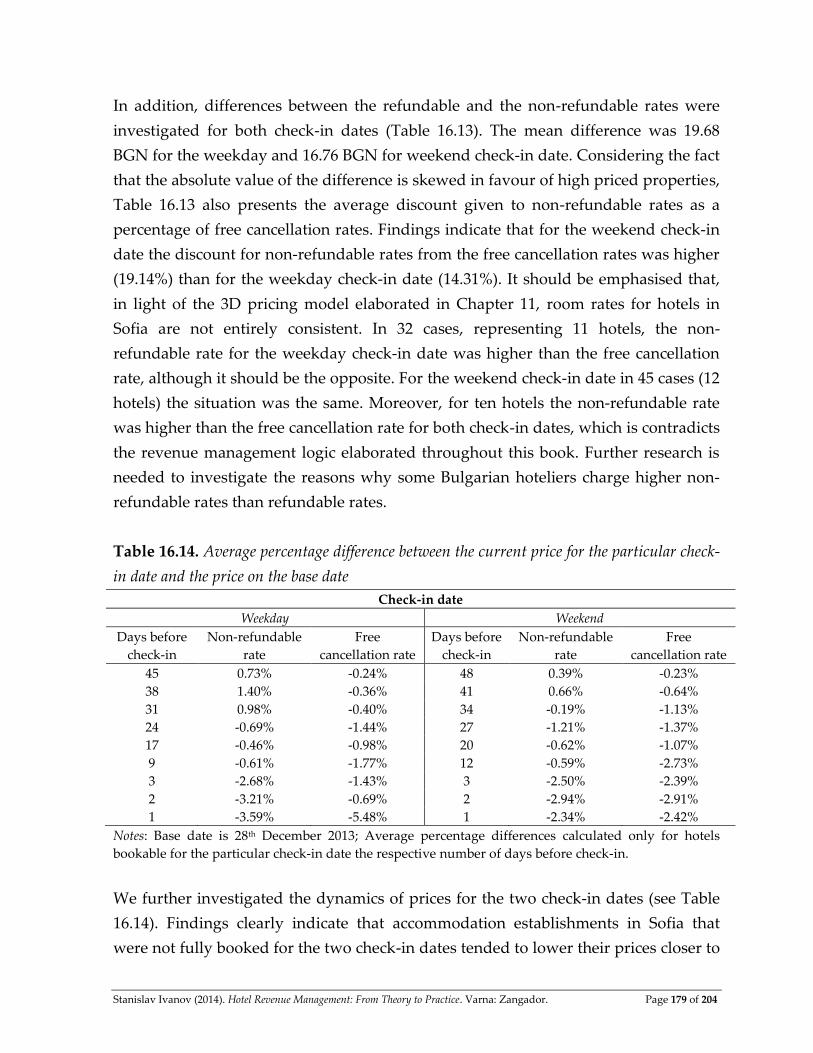
Stanislav Ivanov (2014). Hotel Revenue Management: From Theory to Practice. Varna: Zangador. Page 179 of 204
In addition, differences between the refundable and the non-refundable rates were
investigated for both check-in dates (Table 16.13). The mean difference was 19.68
BGN for the weekday and 16.76 BGN for weekend check-in date. Considering the fact
that the absolute value of the difference is skewed in favour of high priced properties,
Table 16.13 also presents the average discount given to non-refundable rates as a
percentage of free cancellation rates. Findings indicate that for the weekend check-in
date the discount for non-refundable rates from the free cancellation rates was higher
(19.14%) than for the weekday check-in date (14.31%). It should be emphasised that,
in light of the 3D pricing model elaborated in Chapter 11, room rates for hotels in
Sofia are not entirely consistent. In 32 cases, representing 11 hotels, the non-
refundable rate for the weekday check-in date was higher than the free cancellation
rate, although it should be the opposite. For the weekend check-in date in 45 cases (12
hotels) the situation was the same. Moreover, for ten hotels the non-refundable rate
was higher than the free cancellation rate for both check-in dates, which is contradicts
the revenue management logic elaborated throughout this book. Further research is
needed to investigate the reasons why some Bulgarian hoteliers charge higher non-
refundable rates than refundable rates.
Table 16.14. Average percentage difference between the current price for the particular check-
in date and the price on the base date
Check-in date
Weekday Weekend
Days before
check-in
Non-refundable
rate
Free
cancellation rate
Days before
check-in
Non-refundable
rate
Free
cancellation rate
45 0.73% -0.24% 48 0.39% -0.23%
38 1.40% -0.36% 41 0.66% -0.64%
31 0.98% -0.40% 34 -0.19% -1.13%
24 -0.69% -1.44% 27 -1.21% -1.37%
17 -0.46% -0.98% 20 -0.62% -1.07%
9 -0.61% -1.77% 12 -0.59% -2.73%
3 -2.68% -1.43% 3 -2.50% -2.39%
2 -3.21% -0.69% 2 -2.94% -2.91%
1 -3.59% -5.48% 1 -2.34% -2.42%
Notes: Base date is 28th December 2013; Average percentage differences calculated only for hotels
bookable for the particular check-in date the respective number of days before check-in.
We further investigated the dynamics of prices for the two check-in dates (see Table
16.14). Findings clearly indicate that accommodation establishments in Sofia that
were not fully booked for the two check-in dates tended to lower their prices closer to
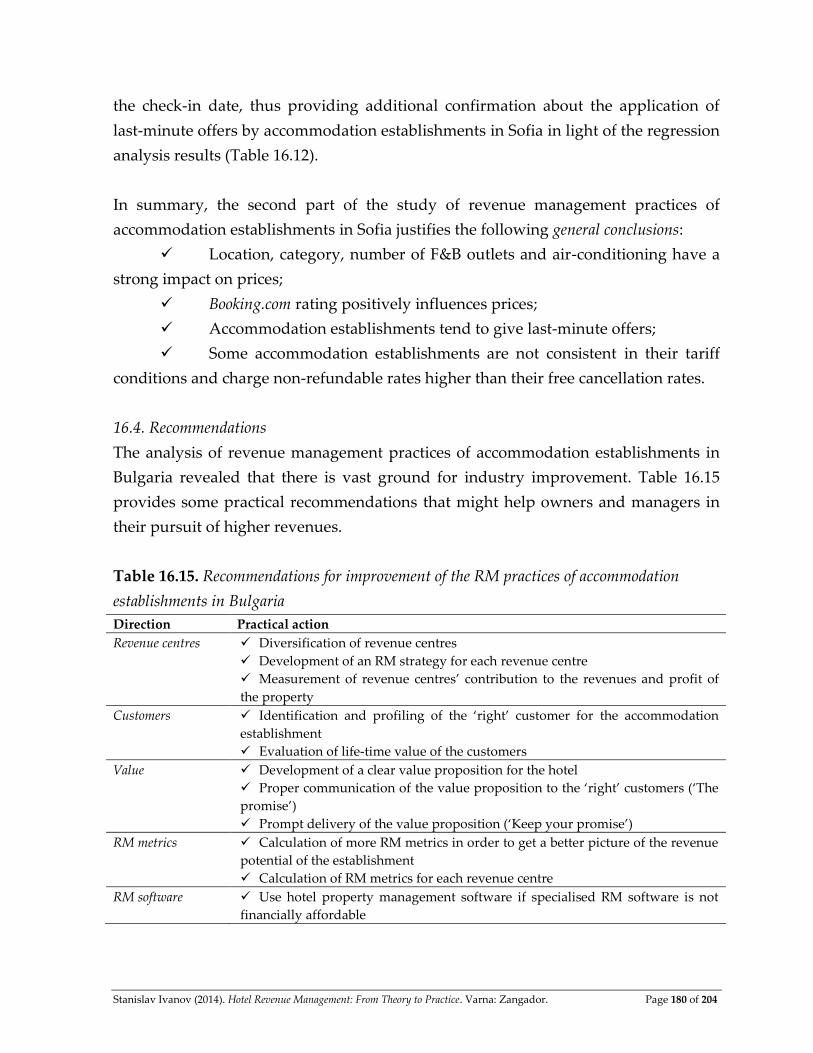
Stanislav Ivanov (2014). Hotel Revenue Management: From Theory to Practice. Varna: Zangador. Page 180 of 204
the check-in date, thus providing additional confirmation about the application of
last-minute offers by accommodation establishments in Sofia in light of the regression
analysis results (Table 16.12).
In summary, the second part of the study of revenue management practices of
accommodation establishments in Sofia justifies the following general conclusions:
Location, category, number of F&B outlets and air-conditioning have a
strong impact on prices;
Booking.com rating positively influences prices;
Accommodation establishments tend to give last-minute offers;
Some accommodation establishments are not consistent in their tariff
conditions and charge non-refundable rates higher than their free cancellation rates.
16.4. Recommendations
The analysis of revenue management practices of accommodation establishments in
Bulgaria revealed that there is vast ground for industry improvement. Table 16.15
provides some practical recommendations that might help owners and managers in
their pursuit of higher revenues.
Table 16.15. Recommendations for improvement of the RM practices of accommodation
establishments in Bulgaria
Direction Practical action
Revenue centres Diversification of revenue centres
Development of an RM strategy for each revenue centre
Measurement of revenue centres’ contribution to the revenues and profit of
the property
Customers Identification and profiling of the ‘right’ customer for the accommodation
establishment
Evaluation of life-time value of the customers
Value Development of a clear value proposition for the hotel
Proper communication of the value proposition to the ‘right’ customers (‘The
promise’)
Prompt delivery of the value proposition (‘Keep your promise’)
RM metrics Calculation of more RM metrics in order to get a better picture of the revenue
potential of the establishment
Calculation of RM metrics for each revenue centre
RM software Use hotel property management software if specialised RM software is not
financially affordable
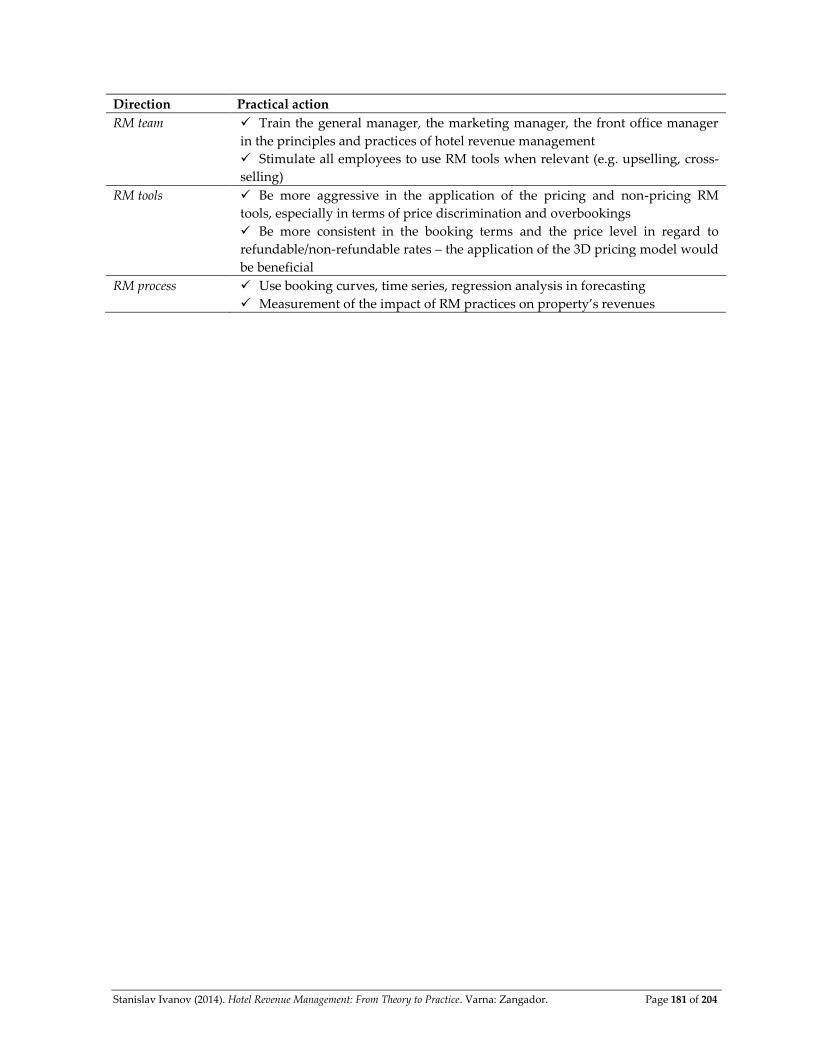
Stanislav Ivanov (2014). Hotel Revenue Management: From Theory to Practice. Varna: Zangador. Page 181 of 204
Direction Practical action
RM team Train the general manager, the marketing manager, the front office manager
in the principles and practices of hotel revenue management
Stimulate all employees to use RM tools when relevant (e.g. upselling, cross-
selling)
RM tools Be more aggressive in the application of the pricing and non-pricing RM
tools, especially in terms of price discrimination and overbookings
Be more consistent in the booking terms and the price level in regard to
refundable/non-refundable rates – the application of the 3D pricing model would
be beneficial
RM process Use booking curves, time series, regression analysis in forecasting
Measurement of the impact of RM practices on property’s revenues
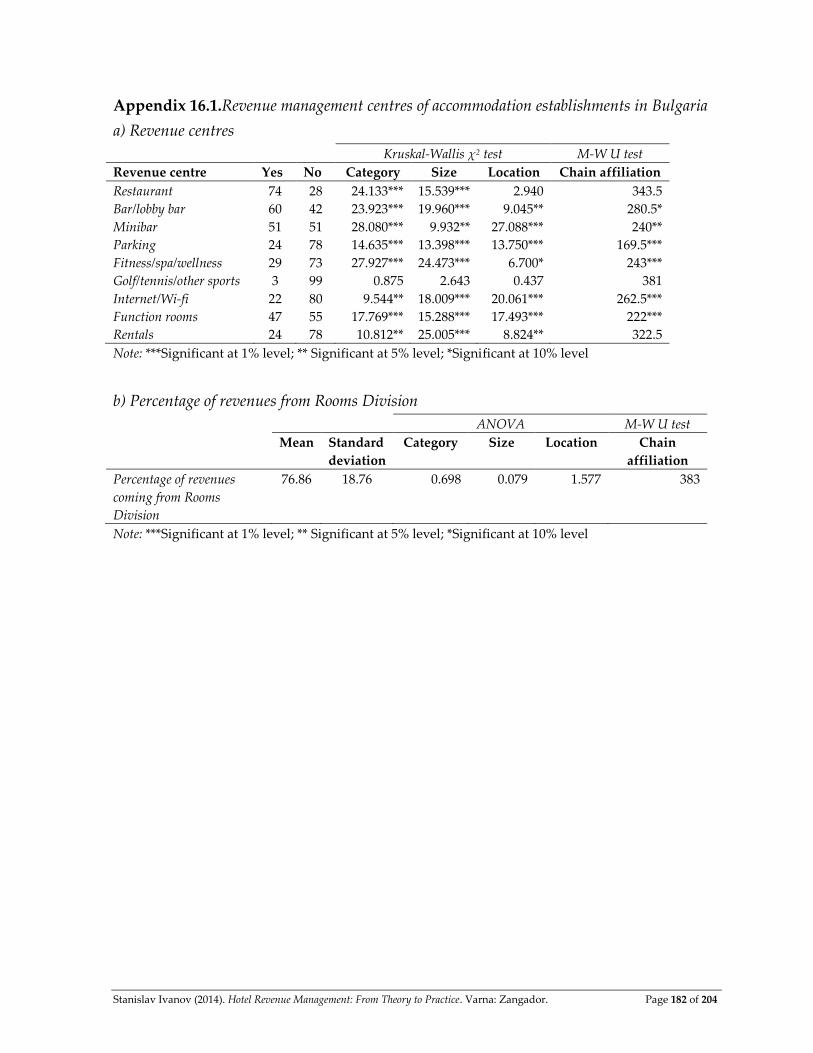
Stanislav Ivanov (2014). Hotel Revenue Management: From Theory to Practice. Varna: Zangador. Page 182 of 204
Appendix 16.1.Revenue management centres of accommodation establishments in Bulgaria
a) Revenue centres
Kruskal-Wallis χ2 test M-W U test
Revenue centre Yes No Category Size Location Chain affiliation
Restaurant 74 28 24.133*** 15.539*** 2.940 343.5
Bar/lobby bar 60 42 23.923*** 19.960*** 9.045** 280.5*
Minibar 51 51 28.080*** 9.932** 27.088*** 240**
Parking 24 78 14.635*** 13.398*** 13.750*** 169.5***
Fitness/spa/wellness 29 73 27.927*** 24.473*** 6.700* 243***
Golf/tennis/other sports 3 99 0.875 2.643 0.437 381
Internet/Wi-fi 22 80 9.544** 18.009*** 20.061*** 262.5***
Function rooms 47 55 17.769*** 15.288*** 17.493*** 222***
Rentals 24 78 10.812** 25.005*** 8.824** 322.5
Note: ***Significant at 1% level; ** Significant at 5% level; *Significant at 10% level
b) Percentage of revenues from Rooms Division
ANOVA M-W U test
Mean Standard
deviation
Category Size Location Chain
affiliation
Percentage of revenues
coming from Rooms
Division
76.86 18.76 0.698 0.079 1.577 383
Note: ***Significant at 1% level; ** Significant at 5% level; *Significant at 10% level
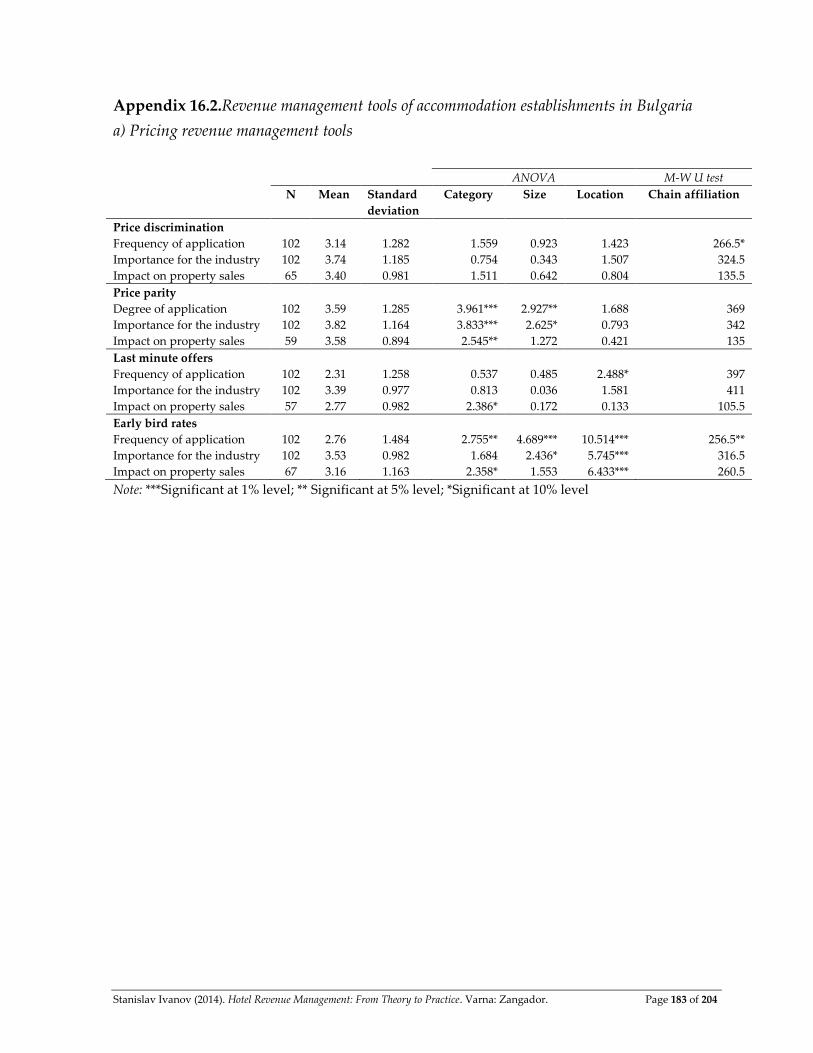
Stanislav Ivanov (2014). Hotel Revenue Management: From Theory to Practice. Varna: Zangador. Page 183 of 204
Appendix 16.2.Revenue management tools of accommodation establishments in Bulgaria
a) Pricing revenue management tools
ANOVA M-W U test
N Mean Standard
deviation
Category Size Location Chain affiliation
Price discrimination
Frequency of application 102 3.14 1.282 1.559 0.923 1.423 266.5*
Importance for the industry 102 3.74 1.185 0.754 0.343 1.507 324.5
Impact on property sales 65 3.40 0.981 1.511 0.642 0.804 135.5
Price parity
Degree of application 102 3.59 1.285 3.961*** 2.927** 1.688 369
Importance for the industry 102 3.82 1.164 3.833*** 2.625* 0.793 342
Impact on property sales 59 3.58 0.894 2.545** 1.272 0.421 135
Last minute offers
Frequency of application 102 2.31 1.258 0.537 0.485 2.488* 397
Importance for the industry 102 3.39 0.977 0.813 0.036 1.581 411
Impact on property sales 57 2.77 0.982 2.386* 0.172 0.133 105.5
Early bird rates
Frequency of application 102 2.76 1.484 2.755** 4.689*** 10.514*** 256.5**
Importance for the industry 102 3.53 0.982 1.684 2.436* 5.745*** 316.5
Impact on property sales 67 3.16 1.163 2.358* 1.553 6.433*** 260.5
Note: ***Significant at 1% level; ** Significant at 5% level; *Significant at 10% level

Stanislav Ivanov (2014). Hotel Revenue Management: From Theory to Practice. Varna: Zangador. Page 184 of 204
Appendix 16.2.Revenue management tools of accommodation establishments in Bulgaria
b) Non-pricing revenue management tools
ANOVA M-W U test
N Mean Standard
deviation
Category Size Location Chain
affiliation
Overcontracting
Frequency of application 102 2.06 1.341 1.929 6.703*** 5.886*** 329
Importance for the industry 102 3.15 1.189 1.125 2.789** 4.167*** 341
Impact on property sales 55 3.02 1.163 1.580 1.634 9.258*** 96.5
Percent of overcontracting 50 36.00 36.715 0.579 0.667 2.484* 87
Overbooking
Frequency of application 102 1.46 0.779 3.318** 14.184*** 2.942** 182***
Importance for the industry 102 2.28 1.205 0.343 3.689** 1.584 245.5**
Impact on property sales 33 2.52 1.121 0.178 1.771 0.231 50.5*
Percent of overbooking 33 5.27 3.769 1.235 2.843* 0.565 73
Length-of-stay controls
Minimum length-of-stay control
Frequency of application 102 1.97 1.181 3.016** 1.880 7.103*** 247**
Importance for the industry 102 2.66 1.286 1.192 2.010 2.315* 265*
Maximum length-of-stay control
Frequency of application 102 1.51 0.972 1.713 3.226** 0.299 409.5
Importance for the industry 102 1.99 1.165 0.698 0.667 0.503 351.5
Length-of-stay controls
Impact on property sales 45 3.02 1.138 0.688 0.307 0.916 91.5
Lowest price guarantee
Frequency of application 102 1.96 1.319 1.810 0.689 0.118 320
Importance for the industry 102 2.86 1.211 0.668 0.614 0.535 304.5
Impact on property sales 39 3.15 1.136 0.981 0.391 1.108 45**
Cross-selling
Frequency of application 102 2.98 1.659 3.048** 2.054 1.162 330
Importance for the industry 102 3.84 1.264 1.377 0.515 0.148 374.5
Impact on property sales 66 3.45 1.192 0.152 0.387 0.927 231
Upselling
Frequency of application 102 2.23 1.210 2.358 0.881 2.160* 204.5***
Importance for the industry 102 3.15 1.172 1.212 0.360 0.641 237**
Impact on property sales 55 2.75 1.109 3.097 1.270 0.555 154.5
Room availability guarantee
Frequency of application 102 2.99 1.686 2.633** 0.981 1.317 323.5
Importance for the industry 102 3.89 1.226 2.063* 0.600 0.346 396
Impact on property sales 59 3.64 1.310 0.333 0.222 1.667 184.5
Note: ***Significant at 1% level; ** Significant at 5% level; *Significant at 10% level
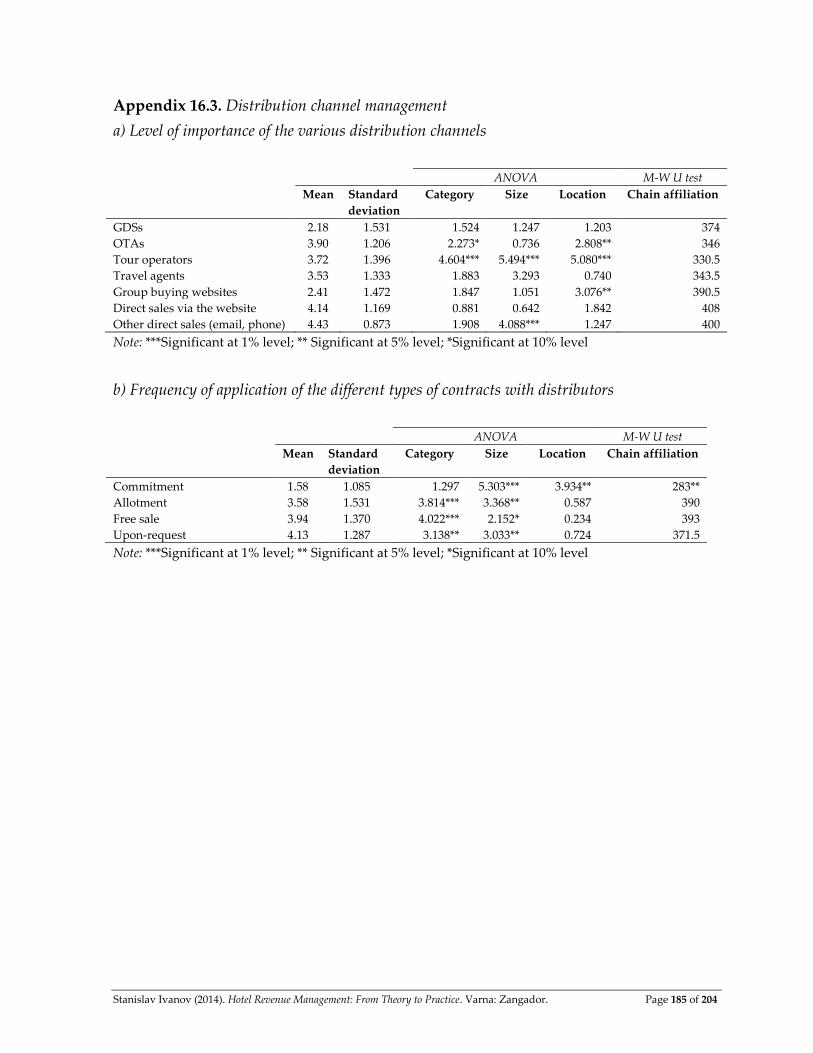
Stanislav Ivanov (2014). Hotel Revenue Management: From Theory to Practice. Varna: Zangador. Page 185 of 204
Appendix 16.3. Distribution channel management
a) Level of importance of the various distribution channels
ANOVA M-W U test
Mean Standard
deviation
Category Size Location Chain affiliation
GDSs 2.18 1.531 1.524 1.247 1.203 374
OTAs 3.90 1.206 2.273* 0.736 2.808** 346
Tour operators 3.72 1.396 4.604*** 5.494*** 5.080*** 330.5
Travel agents 3.53 1.333 1.883 3.293 0.740 343.5
Group buying websites 2.41 1.472 1.847 1.051 3.076** 390.5
Direct sales via the website 4.14 1.169 0.881 0.642 1.842 408
Other direct sales (email, phone) 4.43 0.873 1.908 4.088*** 1.247 400
Note: ***Significant at 1% level; ** Significant at 5% level; *Significant at 10% level
b) Frequency of application of the different types of contracts with distributors
ANOVA M-W U test
Mean Standard
deviation
Category Size Location Chain affiliation
Commitment 1.58 1.085 1.297 5.303*** 3.934** 283**
Allotment 3.58 1.531 3.814*** 3.368** 0.587 390
Free sale 3.94 1.370 4.022*** 2.152* 0.234 393
Upon-request 4.13 1.287 3.138** 3.033** 0.724 371.5
Note: ***Significant at 1% level; ** Significant at 5% level; *Significant at 10% level
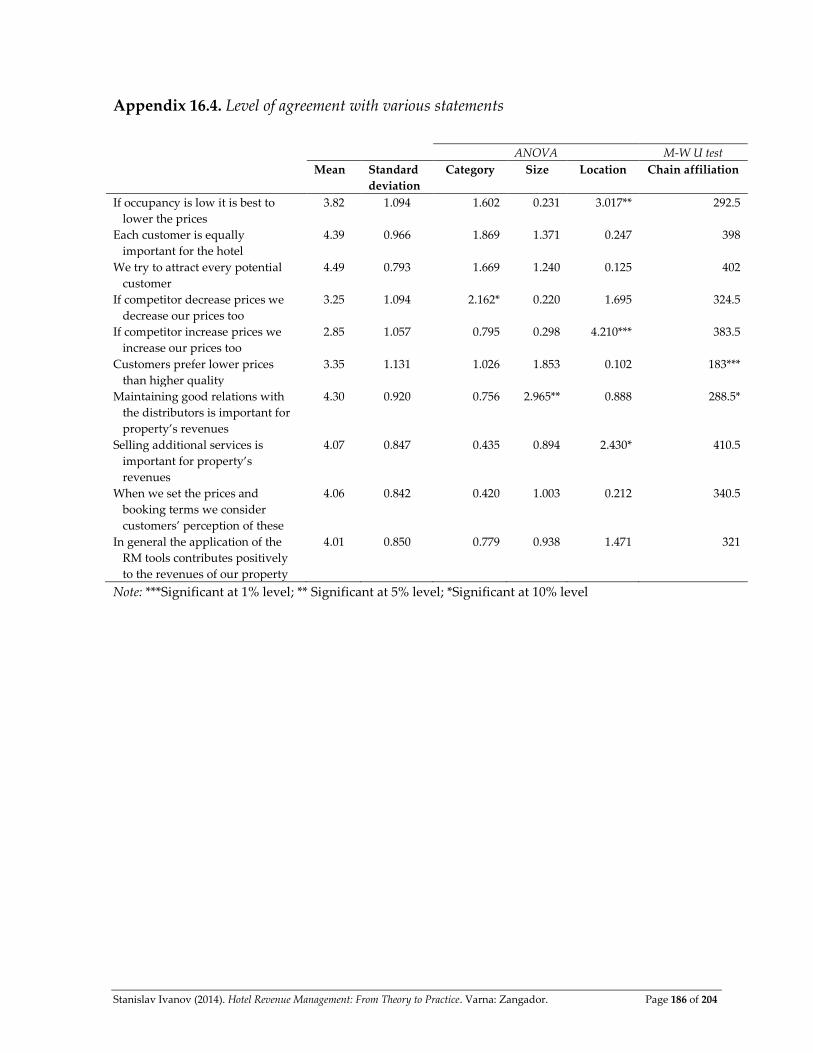
Stanislav Ivanov (2014). Hotel Revenue Management: From Theory to Practice. Varna: Zangador. Page 186 of 204
Appendix 16.4. Level of agreement with various statements
ANOVA M-W U test
Mean Standard
deviation
Category Size Location Chain affiliation
If occupancy is low it is best to
lower the prices
3.82 1.094 1.602 0.231 3.017** 292.5
Each customer is equally
important for the hotel
4.39 0.966 1.869 1.371 0.247 398
We try to attract every potential
customer
4.49 0.793 1.669 1.240 0.125 402
If competitor decrease prices we
decrease our prices too
3.25 1.094 2.162* 0.220 1.695 324.5
If competitor increase prices we
increase our prices too
2.85 1.057 0.795 0.298 4.210*** 383.5
Customers prefer lower prices
than higher quality
3.35 1.131 1.026 1.853 0.102 183***
Maintaining good relations with
the distributors is important for
property’s revenues
4.30 0.920 0.756 2.965** 0.888 288.5*
Selling additional services is
important for property’s
revenues
4.07 0.847 0.435 0.894 2.430* 410.5
When we set the prices and
booking terms we consider
customers’ perception of these
4.06 0.842 0.420 1.003 0.212 340.5
In general the application of the
RM tools contributes positively
to the revenues of our property
4.01 0.850 0.779 0.938 1.471 321
Note: ***Significant at 1% level; ** Significant at 5% level; *Significant at 10% level
Stanislav Ivanov (2014). Hotel Revenue Management: From Theory to Practice. Varna: Zangador. Page 187 of 204
CONCLUDING THOUGHTS
In the last 30 years hotel revenue management has gained the status of mainstream
research area. It is constantly developing, driven largely by the evolving nature of
revenue management practices applied by accommodation establishments. I hope
that the integrative framework of hotel revenue management elaborated in this
monograph will contribute to further advancements in the field and be useful for all
readers – students, researchers, revenue/marketing/front office/general managers of
accommodation establishments. Like every book, this monograph presents the
viewpoint and experience of its author. I would be glad if you share with me by email
to [email protected] or [email protected] or on the Facebook page
https://www.facebook.com/RevenueYield your valuable feedback, comments, experiences,
cases, recommendations, research papers.
The Author
Stanislav Ivanov (2014). Hotel Revenue Management: From Theory to Practice. Varna: Zangador. Page 188 of 204
REFERENCES
Abrate, G., Fraquelli, G. & Viglia, G. (2012). Dynamic pricing strategies: Evidence from European
hotels. International Journal of Hospitality Management, 31(1), 160-168.
Anderson, C. K., & Xie, X. (2010). Improving hospitality industry sales: Twenty-five years of revenue
management. Cornell Hospitality Quarterly, 51(1), 53-67.
Anderson, C. K., & Xie, X. (2012). A choice-based dynamic programming approach for setting opaque
prices. Production and Operations Management, 21(3), 590-605.
Andersson, T. D. (2007). The tourist in the experience economy. Scandinavian Journal of Hospitality and
Tourism 7(1), 46-58.
Aslani, S., Modarres, M & Sibdari, S. (2013). A decomposition approach in network revenue
management: Special case of hotel. Journal of Revenue and Pricing Management, 12(5), 451-463.
Avinal, E. A. (2006). Revenue management in hotels. Journal of Foodservice Business Research, 7(4), 51-57.
Aziz, H. A., Saleh, M., Rasmy, M. H. & Elshishiny, H. (2011). Dynamic room pricing model for hotel
revenue management systems. Egyptian Informatics Journal, 12(3), 177-183.
Badinelli, R. D. (2000). An optimal, dynamic policy for hotel yield management. European Journal of
Operations Research, 121(3), 476-503.
Baggio, R., & Klobas, J. (2011). Quantitative methods in tourism. A handbook. Bristol: Channel View
Publications.
Baker, S., Bradley, P. & Huyton, J. (1994). Principles of hotel front office operations. New York: Cassell.
Baker, T. (2014). London hoteliers worry over commoditization. HotelNewsNow.com, 21st January.
Available online at: http://www.hotelnewsnow.com/article/12986/London-hoteliers-worry-
over-commoditization (Accessed on 23.01.2014)
Baker, T. K. & Collier, D. A. (1999). A comparative revenue analysis of hotel yield management
heuristics. Decision Sciences, 30(1), 239-263
Baker, T. K. & Collier, D. A. (2003). The benefits of optimizing prices to manage demand in hotel
revenue management systems. Production and Operations Management, 12(4), 502-518.
Baker, T. K. & Collier, D. A. (2005). The economic payout model for service guarantees. Decision
Sciences, 36(2), 197-220.
Baker, T., Murthy, N. N. & Jayaraman, V. (2002). Service package switching in hotel revenue
management systems. Decision Sciences, 33(1), 109-132.
Barth, Y. (2002). Yield management: opportunities for private club managers. International Journal of
Contemporary Hospitality Management, 14(3), 136-141.
Bayoumi, A. E.-M., Saleh, M., Atiya, A. & Aziz, H. A. (2013). Dynamic pricing for hotel revenue
management using price multipliers. Journal of Revenue and Pricing Management, 12(3), 271-285.
Stanislav Ivanov (2014). Hotel Revenue Management: From Theory to Practice. Varna: Zangador. Page 189 of 204
Becerra, M., Santalo, J. & Silva, R. (2013). Being better vs. being different: Differentiation, competition,
and pricing strategies in the Spanish hotel industry. Tourism Management, 34. 71-79.
Beck, J., Knutson, B., Cha, J. & Kim, S. (2011). Developing revenue managers for the lodging industry.
Journal of Human Resources in Hospitality & Tourism, 10(2), 182-194.
Beldona, S. & Kwansa, F. (2008). The impact of cultural orientation on perceived fairness over demand-
based pricing. International Journal of Hospitality Management, 27(4), 594-603.
Beldona, S. & Namasivayam, K. (2006). Gender and demand-based pricing: Difference in perceived
(un)fairness and patronage intentions. Journal of Hospitality & Leisure Marketing, 14(4), 89-107.
von Bertalanffy, L. (1969). General system theory: Foundations, development, applications. New York:
George Braziller.
Bertsimas, D. & Shioda, R. (2003). Restaurant revenue management. Operations Research, 51(3), 472-486.
Bitran, G. & Caldentey, R. (2003). An overview of pricing models for revenue management.
Manufacturing & Service Operations Management, 5(3), 203–229.
Bitran, G. & Gilbert, S. M. (1996). Managing hotel reservations with uncertain arrivals. Operations
Research, 44(1), 35-49.
Bitran, G. & Mondschein, S. V. (1995). An application of yield management to the hotel industry
considering multiple day stays. Operations Research, 43(3), 427-443.
Bodea, T., Ferguson, M & Garrow, L. (2009). Choice-based revenue management: data from a major
hotel chain. Manufacturing & Service Operations Management, 11(2), 356-361.
Bowdin, G. A. J., Allen, J., O’Tole, W., Harris, R. & MacDonnell, I. (2006). Event management. 2nd ed.,
Oxford: Butterworth-Heinemann.
Bowie, D. & Buttle, F. (2011). Hospitality marketing. 2nd ed. Oxford: Butterworth-Heinemann.
Bowman, C. (1991). Charting competitive strategy. Cranfield CERES, School of Management Working
and Occasional Paper No. SWP33/91. Available at:
https://dspace.lib.cranfield.ac.uk/bitstream/1826/344/2/SWP3391.pdf (Accessed on 27.07.2008)
Brannas, K., Hellstrom, J. & Nordstrom, A. (2002). A new approach to modeling and forecasting
monthly guest nights in hotels. International Journal of Forecasting, 18(1), 19-30.
Breidert, C. (2006). Estimation of willingness-to-pay: Theory, measurement, application. Wiesbaden: GWV
Fachverlage.
Buckhiester, B. (2012). Optimizing total revenue management. Hotelnewsnow.com, 23rd May. Available
online at: http://www.hotelnewsnow.com/Article/8251/Optimizing-total-revenue-management
(Accessed on 05.01.2014).
Buhalis, D. (2000). Relationships in the distribution channel of tourism: conflicts between hoteliers and
tour operators in the Mediterranean region. International Journal of Hospitality and Tourism
Administration, 1(1), 113-139.
Burger, C.J.S.C, M. Dohnal, M. Kathrada, R. Law (2001). A practitioners guide to time-series methods
for tourism demand forecasting – a case study of Durban, South Africa. Tourism Management,
22(4), pp. 403-409.
Burgess, C. & Bryant, K. (2001). Revenue management - the contribution of the finance function to
profitability. International Journal of Contemporary Hospitality Management 13(3), 144-150.
Butscher, S. A., Vidal, D. & Dimier, C. (2009). Managing hotels in the downturn: Smart revenue growth
through pricing optimisation. Journal of Revenue and Pricing Management, 8(5), 405-409.

Stanislav Ivanov (2014). Hotel Revenue Management: From Theory to Practice. Varna: Zangador. Page 190 of 204
Carroll, B. (2011). Demand management. In Sturman, M. C., Corgel, J. B. & Verma, R. (Eds.) The Cornell
School of Hotel Administration on Hospitality: Cutting edge thinking and practice. Hoboken, NJ: John
Wiley & Sons, pp. 174-191.
Carvell, S. A. & Quan, D. A. (2008). Exotic reservations – Low price guarantee. International Journal of
Hospitality Management 27(2), 162-169.
Chen, C. & Kachani, S. (2007). Forecasting and optimisation for hotel revenue management. Journal of
Revenue and Pricing Management, 6(3), 163-174.
Chen, C.-C. , Ruseski, J. E. & Schwartz, Z. (2009). Room rates as signals of quality, sell-out risk and the
prospects of getting a better deal: analytical model and empirical evidence. Tourism Economics,
15 (2), 367-380.
Chen, C. & Schwartz, Z. (2006). The importance of information asymmetry in customers’ booking
decisions: A cautionary tale from the Internet. Cornell Hotel and Restaurant Administration
Quarterly, 47(3), 272-285.
Chen, C. & Schwartz, Z. (2008a). Room rates patterns and customers’ propensity to book hotel rooms.
Journal of Hospitality and Tourism Research, 32(3), 287-306.
Chen, C. & Schwartz, Z. (2008b). Timing matters: Travelers’ advanced-booking expectations and
decisions. Journal of Travel Research, 47(1), 35-42.
Chen, C.-C. & Schwartz, Z. (2013). On revenue management and last minute booking dynamics.
International Journal of Contemporary Hospitality Management, 25(1), 7-22.
Chen, C., Schwartz, Z. & Vargas, P. (2011). The search for the best deal: How hotel cancellation policies
affect the search and booking decisions of deal seeking customers. International Journal of
Hospitality Management, 30(1), 129-135.
Chiang, W-C., Chen, J. C. H. & Xu, X. (2007). An overview of research on revenue management current
issues and future research. International Journal of Revenue Management, 1(1), 97-127.
Choi, S. (2006). Group revenue management: A model for evaluating group profitability. Cornell Hotel
and Restaurant Administration Quarterly, 47(3), 260-271.
Choi, S. & Kimes, S. E. (2002). Electronic distribution channels’ effect on hotel revenue management.
Cornell Hotel and Restaurant Administration Quarterly, 43(3), 23-31.
Choi, S. & Mattila, A. S. (2003). Hotel revenue management and its impact on customers’ perceptions
of fairness. Journal of Revenue and Pricing Management, 2(4), 303-314.
Choi, S. & Mattila, A. S. (2005). Impact of information on customer fairness perception of hotel revenue
management. Cornell Hotel and Restaurant Administration Quarterly, 46(4), 444-451.
Choi, S. & Mattila, A. S. (2006). The role of disclosure in variable hotel pricing: A cross-cultural
comparison of customers’ fairness perceptions. Cornell Hotel and Restaurant Administration
Quarterly, 47(1), 27-35.
Choi, T.Y. & Cho, V. (2000). Towards a knowledge discovery framework for yield management in the
Hong Kong hotel industry. International Journal of Hospitality Management, 19(1), 17-31.
Coleman, K. (2014). Hotel business intelligence in action: Interpreting booking pace. Hotelmarketing.com,
09th January. Available online at:
http://hotelmarketing.com/index.php/content/article/trends_that_could_shape_hotel_distributi
on_in_2014 (Accessed on 09.01.2014).
Stanislav Ivanov (2014). Hotel Revenue Management: From Theory to Practice. Varna: Zangador. Page 191 of 204
Collins, M. & Parsa, H. G. (2006). Pricing strategies to maximize revenues in the lodging industry.
International Journal of Hospitality Management, 25(1), 91-107.
Croes, R. & Semrad, K. (2012a). Does discounting work in the lodging industry? Journal of Travel
Research, 51(5), 617-631.
Croes, R. & Semrad, K. (2012b). Discounting works in the hotel industry: a structural approach to
understanding why. Tourism Economics, 18(4), 769-779.
Cross, R. (1997). Revenue management: Hard-core tactics for market domination. New York: Broadway.
Cross, R., Higbie, J. & Cross, D. (2009). Revenue management’s renaissance: a rebirth of the art and
science of profitable revenue generation. Cornell Hospitality Quarterly, 50(1), 56-81.
Das, S. P. (2007). Microeconomics for business. Thousand oaks, CA: Sage.
Davidson, R. & Rogers, T. (2006). Marketing destinations and venues for conferences, conventions and
business events. Oxford: Butterworth-Heinemann.
Davis, B., Lockwood, A. & Stone, S. (2006). Food and beverage management. 3rd ed. Oxford: Butterworth-
Heinemann.
Demirciftci, T., Cobanoglu, C., Beldona, S. & Cummings, P. (2010). Room rate parity analysis across
different hotel distribution channels in the U.S. Journal of Hospitality Marketing & Management,
19(4), 295-308
Desiraju, R. & Shugan, S. M. (1999). Strategic service pricing and yield management. Journal of
Marketing, 63(1), 44-56.
Donaghy, K., McMahon-Beattie, U. & McDowell, D. (1997) Implementing yield management: lessons
from the hotel sector. International Journal of Contemporary Hospitality Management, 9(2), 50-54.
Dopson, L. R. & Hayes, D. K. (2009). Managerial accounting for the hospitality industry. Hoboken, NJ: John
Wiley and Sons.
El Gayar, N. F., Saleh, M., Atiya, A., El-Shishiny, H., Zakhary, A. A. Y. F. & Habib, H. A. A. M. (2011).
An integrated framework for advanced hotel revenue management. International Journal of
Contemporary Hospitality Management, 23(1), 84-98.
El Haddad, R., Roper, A. & Jones, P. (2008). The impact of revenue management decisions on customers
attitudes and behaviours: A case study of a leading UK budget hotel chain. EuroCHRIE 2008
Congress, Emirates Hotel School, Dubai, UAE, 11th-14th October. Available online at:
http://pc.parnu.ee/~htooman/EuroChrie/Welcome%20to%20EuroCHRIE%20Dubai%202008/pa
pers/The%20Impact%20of%20Revenue%20Management.pdf (Accessed on 06th April 2011).
Emeksiz, M., Gursoy, D. & Icoz, O. (2006). A yield management model for five-star hotels:
Computerized and non-computerized implementation. International Journal of Hospitality
Management, 25(4), 536-551.
Enz, C., Canina, L. & Lomanno, M. (2004). Why discounting does not work: The dynamics of rising
occupancy and falling revenue among competitors. Cornell Hospitality Report, 4(7).
Enz, C., Canina, L. & Liu, Z. (2008). Competitive dynamics and pricing behavior in US hotels: The role
of co-location. Scandinavian Journal of Hospitality and Tourism, 8 (3), 230-250.
Eslaminosratabadi, H. (2014). An investigation on green attitudes and demographics: Understanding
the intention of international tourists in Malaysia to pay a premium for green hotels. European
Journal of Tourism Research, 7, 92-108.
Stanislav Ivanov (2014). Hotel Revenue Management: From Theory to Practice. Varna: Zangador. Page 192 of 204
Espinet, J.-M., Fluvia, M., Rigall-i-Torrent, R. & Saló (2012). Hotel characteristics and seasonality in
prices: an analysis using Spanish tour operators’ brochures. Tourism Economics, 18(4), 749-767.
Frechtling, D. C. (2001) Forecasting tourism demand: Methods and strategies. Oxford: Butterworth-
Heinemann.
Gehrels, S. & Blanar, O. (2012). How economic crisis affects revenue management: the case of Prague
Hilton hotels. Research in Hospitality Management, 2(1/2), 9-15.
Gibson, C. H. (2012). Financial reporting and analysis: Using financial accounting information. Cengage
Learning. 13th ed.
Gilmore, H. J. & Pine, B. J. II (2002). Differentiating hospitality operations via experiences: Why selling
services is not enough. Cornell Hotel and Restaurant Administration Quarterly, 43(3), 87–96.
Goldman, P., Freling, R., Pak, K. & Piersma, N. (2002). Models and techniques for hotel revenue
management using a rolling horizon. Journal of Revenue & Pricing Management, 1(3), 207-219.
Guadix, J., Cortes, P., Onieva, L. & Munuzuri, J. (2010). Technology revenue management system for
customer groups in hotels. Journal of Business Research, 63(5), 519-527.
Guillet, B. D., Law, R. & Xiao, Q. (2013). Rate fences in hotel revenue management and their
applications to Chinese leisure travellers: A fractional factorial design approach. Cornell
Hospitality Quarterly, http://cqx.sagepub.com/content/early/2013/11/27/1938965513507497
Hadjinicola, G. C. & Panayi, C. (1997). The overbooking problem in hotels with multiple tour-
operators. International Journal of Operations & Production Management, 17(9), 874-885.
Haensel, A. & Koole, G. (2011). Booking horizon forecasting with dynamic updating: A case study of
hotel reservation data. International Journal of Forecasting, 27(3), 942-960.
Hampton (2014). 100% Hampton guarantee. Available online at:
http://hamptoninn3.hilton.com/en/about/satisfaction.html (Accessed on 23.01.2014).
Hanks, R. D., Cross, R. G. & Noland, R. P. (2002). Discounting in the hotel industry. A new approach.
Cornell Hotel and Restaurant Administration Quarterly, 43(4), 94-103.
Harewood, S. I. (2006). Managing a hotel’s perishable inventory using bid prices. International Journal of
Operations & Production Management, 26(10), 1108-1122.
Hayes, D. K. & Miller, A. A. (2011). Revenue management for the hospitality industry. Hoboken, N. J.: John
Wiley & Sons.
Hendler, R. & Hendler, F. (2004). Revenue management in fabulous Las Vegas: Combining customer
relationship management and revenue management to maximise profitability. Journal of
Revenue and Pricing Management, 3(1), 73-79.
Heo, C. Y. (2013). Restaurant revenue management. In Legoherel, P., Poutier, E., & Fyall, A. (eds.).
Revenue management for hospitality and tourism. Woodeaton, Oxford: Goodfellow Publishers ltd.,
pp. 118-129.
Heo, C. Y. & Lee, S. (2011). Influences of consumer characteristics on fairness perceptions of revenue
management pricing in the hotel industry. International Journal of Hospitality Management, 30(2),
243-251.
Heo, C. Y., Lee, S., Mattila, A., & Hu, C. (2013). Restaurant revenue management: Do perceived
capacity scarcity and price differences matter? International Journal of Hospitality Management,
35, 316-326.
Stanislav Ivanov (2014). Hotel Revenue Management: From Theory to Practice. Varna: Zangador. Page 193 of 204
Hampton Inn (2014). 100% Hampton guarantee. Available online at:
http://hamptoninn3.hilton.com/en/about/satisfaction.html (accessed on 23.02.2014).
Herrmann, R. & Herrmann, O. (2014). Hotel room rates under the influence of a large event: The
Oktoberfest in Munich 2012. International Journal of Hospitality Management, 39, 21-28.
Hoogenboom, E. (2012). The powerful tool for performance management, ‘The GOPPAR Model’ - a generous
container of KPIs for hospitality. Motus, Kamperland, The Netherlands. Available online at:
http://www.hospitalitynet.org/file/152004871.pdf (Accessed on 18th April 2012).
Hsu, C. H. C., Kang, S. K. & Wolfe, K. (2002). Psychographic and demographic profiles of niche market
leisure travelers. Journal of Hospitality and Tourism Research, 26(1), 3-22.
Hudson, S. (2008). Tourism and hospitality marketing. A global perspective. Thousand Oaks: Sage.
Hung, W.-T., Shang, J.-K. & Wang, F.-C. (2010). Pricing determinants in the hotel industry: Quantile
regression analysis. International Journal of Hospitality Management, 29(3), 378-384.
Hwang, J. & Wen, L. (2009). The effect of perceived fairness toward hotel overbooking and
compensation practices on customer loyalty. International Journal of Contemporary Hospitality
Management, 21(6), 659-675.
Intercontinental Hotel Group /IHG/ (2014). IHG Rewards Club. Available online at:
http://www.ihg.com/rewardsclub/us/en/enjoy-rewards#scmisc=wallet_enjoy-rewards_6c
(Accessed on 23.02.2014).
Illum, S. F., Ivanov, S. & Liang, Y. (2010). Using virtual communities in tourism research. Tourism
Management, 31(3), 335-340.
Ingold, A., McMahon-Beattie, U. & Yeoman, I. (eds.) (2001). Yield management. Strategies for the service
industries. London: Continuum.
Ismail, A. (2002) Front office operations and management. Albany, NY: Delmar.
Ivanov, S. (2006). Management of overbookings in the hotel industry – basic concepts and practical
challenges. Tourism Today, 6, 19-32.
Ivanov, S. (2007a). Dynamic overbooking limits for guaranteed and nonguaranteed hotel reservations.
Tourism Today, 7, 100-108.
Ivanov, S. (2007b). Conceptualizing cannibalisation: the case of tourist companies. Yearbook of
International University College, 3, 20-36. Available online at: http://ssrn.com/abstract=1293730
Ivanov, S. (2008). Conceptual marketing framework for online hotel reservation system design. Tourism
Today 8, 7-32. Available online at: http://ssrn.com/abstract=1296040
Ivanov, S. (2013). Price discrimination as a hotel revenue management tool – from theory to practice.
Proceedings of the "Knowledge - traditions, innovations, perspectives" scientific conference, Bourgas
Free University, 14-15 June 2013, Bourgas, Bulgaria, Volume III, pp. 380-385. Available online
at: http://ssrn.com/abstract=2049341
Ivanov, S. (2014). Optimal overbooking limits for a 3-room type hotel with upgrade and downgrade
constraints. Tourism Economics (forthcoming). Earlier version available at:
http://ssrn.com/abstract=2190042
Ivanov, S., Ivanova, M. & Iankova, K. (2012). Sustainable tourism practices – mountain vs. non-mountain
accommodation establishments in Bulgaria. Paper presented at the International Conference
“Changing Paradigms in Sustainable Mountain Tourism Research: Problems and

Stanislav Ivanov (2014). Hotel Revenue Management: From Theory to Practice. Varna: Zangador. Page 194 of 204
Perspectives”, Forum Brixen/Bressanone, Italy, 25th–28th October 2012. Available online at:
http://ssrn.com/abstract=2161586
Ivanov, S., & Zhechev, V. (2011). Hotel marketing. Varna: Zangador (in Bulgarian)
Ivanov, S., & Zhechev, V. (2012). Hotel revenue management – a critical literature review. Tourism,
60(2), 175-197.
Ivanova, M. & Ivanov, S. (2014). Hotel chains’ entry mode in Bulgaria. Anatolia 25(1), 131-135.
Iyengar, A. & Suri, K. (2012). Customer profitability analysis – An avant-garde approach to revenue
optimisation in hotels. International Journal of Revenue Management, 6(1-2), 127-143.
Jain, S. & Bowman, H. B. (2005). Measuring the gain attributable to revenue management. Journal of
Revenue and Pricing Management, 4(1), 83-94.
Kilby, J., Fox, J. & Lucas, A. F. (2005). Casino operations management. 2nd ed. Hoboken, NJ: John Wiley &
Sons.
Kim, W. G., Park, Y., Gazzoli, G. & Sheng, E. (2011). Benefit segmentation of international travelers to
Macau, China. Journal of Quality Assurance in Hospitality and Tourism, 12(1), 28-57.
Kimes, S. E. (1989). Yield management: a tool for capacity-constrained service firms. Journal of
Operations Management, 8(4), 348–363.
Kimes, S. E. (1999a). Group forecasting accuracy in hotels. Journal of the Operational Research Society, 50,
1104-1110.
Kimes, S. E. (1999b). Implementing restaurant revenue management. A five step approach. Cornell
Hotel and Restaurant Administration Quarterly, 40(3), 16-21.
Kimes, S. E. (2000). Revenue management on the links: applying yield management to the golf-course
industry. Cornell Hotel and Restaurant Administration Quarterly, 41(1), 120-127.
Kimes, S. E. (2002). Perceived fairness of yield management. Cornell Hotel and Restaurant Administration
Quarterly, 43(1), 21-30.
Kimes, S. E. (2003). Revenue management: A retrospective. Cornell Hotel and Restaurant Administration
Quarterly, 44(5/6), 131-138.
Kimes, S. E. (2005). Restaurant revenue management: could it work? Journal of Revenue & Pricing
Management, 4(1), 95-97.
Kimes, S. E. (2009). Hotel revenue management in an economic downturn: Results of an international
study. Cornell Hospitality Report 9(12).
Kimes, S. E. (2011). The future of hotel revenue management. Journal of Revenue and Pricing
Management, 10(1), 62-72.
Kimes, S. E. & Chase, R. B. (1998). The strategic levers of yield management. Journal of Service Research,
1(2), 156-166.
Kimes, S. E., Chase, R. B., Choi, S., Lee, P. Y. Y Ngonzi, E. N. (1998). Restaurant revenue management:
applying yield management to the restaurant industry. Cornell Hotel and Restaurant
Administration Quarterly, 39(3), 32-39.
Kimes, S. E. & McGuire, K. A. (2001). Function-space revenue management: a case study from
Singapore. Cornell Hotel and Restaurant Administration Quarterly, 42(6), 33-46.
Kimes, S. E. & Robson, S. K. A. (2004). The impact of restaurant table characteristics on meal duration
and spending. Cornell Hotel and Restaurant Administration Quarterly, 45(4), 333-346.

Stanislav Ivanov (2014). Hotel Revenue Management: From Theory to Practice. Varna: Zangador. Page 195 of 204
Kimes, S. E. & Schruben, L. W. (2002). Golf course revenue management. A study of tee time intervals.
Journal of Revenue and Pricing Management, 1(2), 111-120.
Kimes, S. E. & Singh, S. (2009). Spa revenue management. Cornell Hospitality Quarterly, 50(1), 82-95.
Kimes, S. E. & Thompson, G. M. (2004). Restaurant revenue management at Chevys: determining the
best table mix. Decision Sciences, 35(3), 371-392.
Kimes, S. E. & Thompson, G. M. (2005). An evaluation of heuristic methods for determining the best
table mix in full-service restaurants. Journal of Operations Management, 23(6), 599-617.
Kimes, S. E. & Wagner, P. E. (2001). Preserving your revenue-management system as a trade secret.
Cornell Hotel and Restaurant Administration Quarterly, 42(5), 8-15.
Kimes, S. E. & Wirtz, J. (2003). Has revenue management become acceptable? Findings from an
international study on the perceived fairness of rate fences. Journal of Service Research, 6(2), 125-
135.
Koenig, M. & Meissner, J. (2010). List pricing versus dynamic pricing: Impact on the revenue risk.
European Journal of Operational Research, 204(3), 505-512.
Koide, T. & Ishii, H. (2005). The hotel yield management with two types of room prices, overbooking
and cancellations. International Journal of Production Economics, 93-94, 417-428.
Kotler, P., Armstrong, G. Saunders, J. & Wong V. (2002). Principles of marketing. Harlow: Prentice Hall,
3rd ed.
Kotler, P., Bowen, J. & Makens, J. (2006). Marketing for hospitality and tourism. Harlow: Prentice Hall, 4th
ed.
Kotler, P., Keller, K. L., Brady, M., Goodmand, M., Hansen, T. (2009). Marketing management. Harlow,
UK: Pearson.
Koushik, D., Higbie, J. A. & Eister, C. (2012). Retail price optimization at intercontinental hotels group.
Interfaces, 42(1), 45-57.
Kozak, M. & Martin, D. (2012). Tourism life cycle and sustainability analysis: Profit-focused strategies
for mature destinations. Tourism Management, 33(1), 188-194.
Kuyumcu, A. H. (2002). Gaming twist in hotel revenue management. Journal of Revenue and Pricing
Management, 1(2), 161-167.
Lai, K.-K. & Ng, W.-L. (2005). A stochastic approach to hotel revenue optimization. Computers &
Operations Research, 32(5), 1059-1072.
Lan, Y., Ball, M & Karaesmen, I. Z. (2007). Overbooking and Fare-Class Allocation with Limited
Information. Robert H. Smith School of Business- Working Paper No. RHS-06-055. Available at
SSRN: http://ssrn.com/abstract=1086239 (Accessed 10.12.2010).
Las Vegas Convention and Visitors Authority /LVCVA/ (2013). Historical Las Vegas Visitor Statistics
(1970-2012). Available online at:
http://www.lvcva.com/includes/content/images/media/docs/Historical-1970-to-2012.pdf
(Accessed on 05.01.2014).
Law, R. (2000). Back-propagation learning in improving the accuracy of neural network-based tourism
demand forecasting. Tourism Management, 21(4), 331-340.
Lee, S. K., Jang, S. (2012). Premium or discount in hotel room rates? the dual effects of a central
downtown location. Cornell Hospitality Quarterly, 53(2), 165-173.
Stanislav Ivanov (2014). Hotel Revenue Management: From Theory to Practice. Varna: Zangador. Page 196 of 204
Lee-Ross, D. & Johns, N. (1997). Yield management in hospitality SMEs. International Journal of
Contemporary Hospitality Management, 9(2), 66–69.
Legoherel, P., Poutier, E., & Fyall, A. (eds.) (2013a). Revenue management for hospitality and tourism.
Woodeaton, Oxford: Goodfellow Publishers ltd.
Legoherel, P., Poutier, E., & Fyall, A. (2013b). The role of the revenue manager. In Legoherel, P.,
Poutier, E., & Fyall, A. (eds.). Revenue management for hospitality and tourism. Woodeaton,
Oxford: Goodfellow Publishers ltd., pp. 37-52.
Legoherel, P., Poutier, E., & Fyall, A. (2013c). Setting up a revenue management system. In Legoherel,
P., Poutier, E., & Fyall, A. (eds.). Revenue management for hospitality and tourism. Woodeaton,
Oxford: Goodfellow Publishers ltd., pp. 74-86
Licata, J. W. & Tiger, A. W. (2010). Revenue management in the golf industry: Focus on throughput
and consumer benefits. Journal of Hospitality Marketing & Management, 19(5), 480-502.
Lieberman, W. H. (2011). Practical pricing for the hotel industry. In Yeoman, I. & McMahon-Beattie, U.
(eds.) Revenue Management. A Practical Pricing Perspective. Palgrave Macmillan, 180-191.
Lieberman, W. H. (2003). Getting the most from revenue management. Journal of Revenue and Pricing
Management, 2(2), 103-115.
Lim, C. & Chan, F. (2011). An econometric analysis of hotel–motel room nights in New Zealand with
stochastic seasonality. International Journal of Revenue Management, 5(1), 63-83.
Lim, C., Chang, C. & McAleer, M. (2009). Forecasting h(m)otel guest nights in New Zealand.
International Journal of Hospitality Management, 28(2), 228-235.
Liu, P. H., Smith, S., Orkin, E. B. & Carey, G. (2002). Estimating unconstrained hotel demand based on
censored booking data. Journal of Revenue and Pricing Management, 1(2), 121-138.
Liu, S., Lai, K. K., Dong, J. & Wang, S.-Y. (2006). A stochastic approach to hotel revenue management
considering multiple-day stays. International Journal of Information Technology & Decision
Making, 5(3), 545-556.
Liu, S., Lai, K. K., Wang, S.-Y. (2008). Booking models for hotel revenue management considering
multiple-day stays. International Journal of Revenue Management, 2(1), 78-91.
Lockyer, T. (2007). Yield management: the case of the accommodation industry in New Zealand.
International Journal of Revenue Management, 1(4), 315-326.
Lovelock, C. & Wright, L. (1999). Principles of service marketing and management. Harlow: Prentice Hall.
Lucas, R., Marinova, M. & Vodenska, M. (2009). From public to private: Has employment practice
changed in Bulgarian hotels? International Journal of Hospitality Management, 28(3), 310-318
Maier, T. A. (2011). Hospitality industry revenue management performance modelling: Uncovering
issues associated with inconsistencies in price parity across multiple distribution channels in
the US hotel market. International Journal of Revenue Management, 5(4), 290-307.
Maier, T. A. (2012). International hotel revenue management. Web-performance effectiveness
modelling – research comparative. Journal of Hospitality and Tourism Technology, 3(2), 121-137.
Mainzer, B. W. (2004). Fast forward for hospitality revenue management. Journal of Revenue and Pricing
Management, 3(3), 285-289.
Marriott.com (2014). Look No Further Best Rate Guarantee. http://www.marriott.com/hotel-
prices/travel.mi (Accessed on 23.02.2014).
Stanislav Ivanov (2014). Hotel Revenue Management: From Theory to Practice. Varna: Zangador. Page 197 of 204
Mattila, A. S. & Choi, C. (2013). An analysis of consumers’ reactions to travel websites’ discrimination
by computer platform. Cornell Hospitality Quarterly,
http://cqx.sagepub.com/content/early/2013/10/31/1938965513509879
Mauri, A. G. (2007). Yield management and perceptions of fairness in the hotel business. International
Review of Economics, 54(2), 284-293.
Mauri, A. G. (2012). Hotel revenue management: Principles and practices. Milan-Torino: Pearson Italia.
McEvoy, B. J. (1997). Integrating operational and financial perspectives using yield management
techniques: an add-on matrix model. International Journal of Contemporary Hospitality
Management, 9(2), 60–65.
Menezes, F. M. & Monteiro, P. K. (2005). An introduction to auction theory. Oxford: Oxford University
Press.
Milla, S. & Shoemaker, S. (2008). Three decades of revenue management: What’s next? Journal of
Revenue and Pricing Management, 7(1), 110–114.
Modica, P. & Scanu, E. (2014). Day spa revenue management: some examples from Italy. In M. Smith &
L. Puczkó (Eds.) Health, tourism and hospitality: wellness, spas and medical travel. 2nd ed. Oxon:
Routledge, pp. 269-273.
Mohsin, A. (2008). How empowerment influences revenue management and service quality: the case
of a New Zealand hotel. International Journal of Revenue Management, 2(1), 92-106.
Montgomery, D. C., Jennings, C. L. & Kulachi, M. (2008). Introduction to time series analysis and
forecasting. Hoboken, N.J.: John Wiley & Sons.
Morales, D. R. & Wang, J. (2010). Forecasting cancellation rates for services booking revenue
management using data mining. European Journal of Operational Research, 202(2), 554-562.
Morritt, R. (2008). Segmentation strategies for hospitality managers: Target marketing for competitive
advantage. Binghamton: The Haworth Press.
Murphy, K., Semrad, K. & Yost, E. (2013). The impact of discounting room rates on in-house restaurant
sales. International Journal of Hospitality and Tourism Administration, 14(1), 50-65.
Myung, E., Li, L. & Bai, B. (2009). Managing the distribution channel relationship with e-wholesalers:
Hotel operators’ perspective. Journal of Hospitality Marketing & Management, 18(8), 811-828.
Nagle, T. T. & Hogan, J. E. (2006). The strategy and tactics of pricing. A guide to growing more profitably. 4th
ed. Upper Saddler River: Pearson Prentice Hall.
Nash, J. C. & Nash, M. M. (2001). Practical forecasting for managers. London: Arnold.
National Statistics Institute /NSI/ (2013a). Arrivals of visitors from abroad to Bulgaria by months and by
country of origin. Available online at:
http://www.nsi.bg/sites/default/files/files/data/timeseries/TUR_1.4_For_en.xls (Accessed on
05.01.2014).
National Statistics Institute /NSI/ (2013b). Accommodation establishments by statistical zones, statistical
regions and by districts in 2013. Available online at http://www.nsi.bg/en/content/7067/annual-
data (Accessed on 03.03.2014).
Neap, H. S. & Celik, T. (1999). Value of a product: A definition. International Journal of Value-Based
Management, 12, 181-191.
Netessine, S. & Shumsky, R. (2002). Introduction to the theory and practice of yield management.
INFORMS Transactions on Education, 3(1), 34-44.
Stanislav Ivanov (2014). Hotel Revenue Management: From Theory to Practice. Varna: Zangador. Page 198 of 204
Ng, I. C. L. (2009a). The pricing and revenue management of services: A strategic approach. London:
Routledge.
Ng, I. C. L. (2009b). A demand-based model for the advance and spot pricing of services. Journal of
Product & Brand Management, 18(7), 517-528.
Ng, I. C. L., Maull, R & Godsiff, P. (2008). An integrated approach towards revenue management.
Journal of Revenue and Pricing Management, 7(2), 185-195.
Noone, B.M. & Hultberg, T. (2011). Profiting through teamwork: The role of the revenue management
and sales functions in group revenue management. Cornell Hospitality Quarterly, 52(4), 407-420.
Noone, B. M., Kimes, S. E. & Renaghan, L. M. (2003). Integrating customer relationship management
with revenue management: A hotel perspective. Journal of Revenue and Pricing Management,
2(1), 7-21.
Noone, B. M., Lee, C. H. (2011). Hotel overbooking: The effect of overcompensation on customers’
reactions to denied service. Journal of Hospitality and Tourism Research, 35(3), 334-357.
Noone, B. M. & Mattila, A. S. (2009). Hotel revenue management and the Internet: The effect of price
presentation strategies on customers’ willingness to book. International Journal of Hospitality
Management, 28(2), 272-279.
Noone, B. M., McGuire, K. A. & Rohls, K. V. (2011). Social media meets hotel revenue management:
Opportunities, issues and unanswered questions. Journal of Revenue and Pricing Management,
10(4), 293-305.
Norman, E. D. & Mayer, K. J. (1997). Yield management in Las Vegas casino hotels. Cornell Hotel and
Restaurant Administration Quarterly, 38(5), 28-33.
Nowman, K. B. & van Dellen, S. (2012). Forecasting overseas visitors to the UK using continuous time
and autoregressive fractional integrated moving average with discrete data. Tourism Economics,
18(4), 835-844.
Oh, H., Fiore, A. M. & Jeoung, M. (2007). Measuring experience economy concepts: Tourism
applications. Journal of Travel Research 46(2), 119-132.
Okumus, F. (2004). Implementation of yield management practices in service organisations: empirical
findings from a major hotel group. The Service Industries Journal, 24(6), 65-89.
Onafowora, O. A. & Owoye, O. (2012). Modelling international tourism demand for the Caribbean.
Tourism Economics, 18(1), 159-180.
Orkin, E. (2003). The emerging role of function space optimisation in hotel revenue management.
Journal of Revenue and Pricing Management, 2(2), 172-174.
Padhi, S. S. & Aggarwal, V. (2011). Competitive revenue management for fixing quota and price of
hotel commodities under uncertainty. International Journal of Hospitality Management, 30(3), 725-
734.
Palmer, A., Montaño, J. J. & Sesé, A. (2006). Designing an artificial neural network for forecasting
tourism time series. Tourism Management, 27(5), 781-790.
Palmer, D., Lunceford, S. & Patton, A. J. (2012). The engagement economy: How gamification is
reshaping business. Delloitte Review, 11, 52-69
Pan, B., Wu, D. C. & Song, H. (2012). Forecasting hotel room demand using search engine data. Journal
of Hospitality and Tourism Technology, 3(3), 196-210.

Stanislav Ivanov (2014). Hotel Revenue Management: From Theory to Practice. Varna: Zangador. Page 199 of 204
Patricio, L., Fisk, R. P., Falcão e Cunha, J. & Constantine, L. (2011). Multilevel service design: from
customer value constellation to service experience blueprinting. Journal of Service Research,
14(2), 180-200.
Peister, C. (2007). Table-games revenue management: applying survival analysis. Cornell Hotel and
Restaurant Administration Quarterly, 48(1), 70-87.
Pekgun, P., Menich, R. P., Acharya, S., Finch, P. G., Deschamps, F., Mallery, K., Van Sistine, J.,
Christianson, K. & Fuller, J. (2013). Carlson Rezidor hotel group maximizes revenue through
improved demand management and price optimization. Interfaces, 43(1), 21-36.
Peng, B., Song, H., Crouch, G. I. & Witt, S. F. (2014). A meta-analysis of international demand
elasticities. Journal of Travel Research, doi: 10.1177/0047287514528283
Phillips, R. (2005). Pricing and revenue management optimization. Palo Alto, CA: Stanford University
Press.
Phumchusri, N. & Mongkolkul, P. (2012). Hotel room demand forecasting via observed reservation
information. In V. Kachitvichyanukul, H.T. Luong & R. Pitakaso (Eds). Proceedings of the Asia
Pacific Industrial Engineering & Management Systems Conference, Patong Beach, Phuket, Thailand,
pp. 1978-1985. Available online at: http://www.apiems.net/conf2012/T5D5.pdf (Accessed on
11.01.2014).
Pine, B. J. II. & Gilmore, H. J. (1998). Welcome to the experience economy. Harvard Business Review,
76(4), 97-105.
Pine, B. J. II. & Gilmore, H. J. (1999). The experience economy: Work is theatre and every business a stage.
Boston, MA: Harvard Business School Press.
Pine, B. J. II. & Gilmore, H. J. (2011). The experience economy. 2nd ed. Boston, MA: Harvard Business
School Press;
Plog, S. (2001). Why destinations rise and fall in popularity. An update of a Cornell Quarterly Classic.
Cornell Hotel and Restaurant Administration Quarterly, 42(3), 13-24.
Portolan, A. (2013). Impact of the attributes of private tourist accommodation facilities onto prices: A
hedonic price approach. European Journal of Tourism Research, 6(1), 74-82.
Pucciani, K. K. & Murphy, J. C. (2011). An investigation of data management and property
management systems in hotels. Tourism and Hospitality Management, 17(1), 101-114.
Pullman, M. & Rogers, S. (2010). Capacity management for hospitality and tourism: A review of
current approaches. International Journal of Hospitality Management, 29(1), 177-187.
Queenan, C. C., Ferguson, M. E., Higbie, J. & Kapoor, R. (2007). A comparison of unconstrained
methods to improve revenue management systems. Production and Operations Management,
16(6), 729-746.
Queenan, C. C., Ferguson, M. E. & Stratman, J. K. (2011). Revenue management performance drivers:
An exploratory analysis within the hotel industry. Journal of Revenue and Pricing Management,
10(2), 172-188.
Rajopadhye, M., Ghalia, M. B., Wang, P. P., Baker, T. & Eister, C. V. (2001). Forecasting uncertain hotel
room demand. Information Sciences, 132(1-4), 1-11
Rakadzhiiska, S., Marinov, S. & Dyankov, T. (2013). Tourism marketing. Varna: University of
Economics-Varna (in Bulgarian)
Stanislav Ivanov (2014). Hotel Revenue Management: From Theory to Practice. Varna: Zangador. Page 200 of 204
Rannou, B. & Melli, D. (2003). Measuring the impact of revenue management. Journal of Revenue and
Pricing Management, 2(3), 261-270.
Rasekh, L. & Li, Y. (2011). Golf course revenue management. Journal of Revenue and Pricing Management,
10(2), 105-111.
Rohlfs, K. V. & Kimes, S. E. (2007). Customers’ perceptions of best available hotel rates. Cornell Hotel
and Restaurant Administration Quarterly, 48(2), 151-162.
Ropero, M. A. (2013). Effects of competition and quality on hotel pricing policies in an online travel
agency. Tourism Economics, 19(1), 63-76.
Rothstein, M. (1974). Hotel overbooking as a Markovian sequential decision process. Decision Science,
5(3), 389-404.
Sanchez, J. F., & Satir, A. (2005). Hotel yield management using different reservation modes.
International Journal of Contemporary Hospitality Management, 17(2), 136-146.
Sarigollu, E. & Huang, R. (2005). Benefits segmentation of visitors to Latin America. Journal of Travel
Research, 43(3), 277-293.
Schütze, J. (2008). Pricing strategies for perishable products: the case of Vienna and the hotel
reservation system hrs.com. Central European Journal of Operations Research, 16, 43-66.
Schwartz, Z. (1998). The confusing side of yield management: Myths, errors, and misconceptions.
Journal of Hospitality & Tourism Research, 22(4), 413-430.
Schwartz, Z. (2000). Changes in hotel guests’ willingness to pay as the date-of-stay draws closer.
Journal of Hospitality and Tourism Research, 24(2), 180-198.
Schwartz, Z. (2006). Advanced booking and revenue management: Room rates and the consumers’
strategic zones. International Journal of Hospitality Management, 25(3), 447-462.
Schwartz, Z. (2008). Time, price and advanced booking of hotel rooms. International Journal of
Hospitality and Tourism Administration, 9(2), 128-146.
Schwartz, Z. & Chen, C. (2010). The peculiar impact of higher room rates on customers’ propensity to
book. International Journal of Contemporary Hospitality Management, 22(1), 41-55.
Schwartz, Z. & Chen, C.-C. (2012). Hedonic motivations and the effectiveness of risk perceptions-
oriented revenue management policies. Journal of Hospitality and Tourism Research, 36(2), 232-
250.
Schwartz, Z., & Cohen, E. (2003). Hotel revenue management with group discount room rates. Journal
of Hospitality & Tourism Research, 27(1), 24-47.
Schwartz, Z. & Cohen, E. (2004). Hotel revenue management forecasting – evidence of expert-
judgment bias. Cornell Hotel and Restaurant Administration Quarterly, 45(1), 85-98.
Scott, N. & Parfitt, N. (2004). Lifestyle segmentation in tourism and leisure: imposing order or finding
it? Journal of Quality Assurance in Hospitality and Tourism, 5(2/3/4), 121-139
Selmi, N. & Dornier, R. (2011). Yield management in the French hotel business: An assessment of the
importance of the human factor. International Business Research, 4(2), 58-66.
Sheridan, M. F., Lee, S. & Roehl, W. (2013). Effects of hotel discounting practice on visitors’ perceptions
and visitation intentions. Tourism Economics, 19(3), 599-611.
Shoemaker, S. (1994). Segmenting the U.S. travel market according to benefits realized. Journal of Travel
Research, 32(3), 8-21.
Stanislav Ivanov (2014). Hotel Revenue Management: From Theory to Practice. Varna: Zangador. Page 201 of 204
Shone, A. & Parry, B. (2004). Successful event management. A practical handbook. 2nd ed., London:
Thomson Scientific.
Shy, O. (2008). How to price. A guide to pricing techniques and yield management. Cambridge University
Press.
Skaalsvik, H. (2012). Why service recovery fails: A case study on the Norwegian Coastal Voyage
(Hurtigruten). European Journal of Tourism Research, 5(2), 129-152.
Song, H. & Li, G. (2008). Tourism demand modelling and forecasting – a review of recent research.
Tourism Management, 29, 203-220.
Song, H., Witt, S. F. & Li, G. (2009). The advanced econometrics of tourism demand. Oxon: Routledge.
Steed, E. & Gu, Z. (2005). An examination of hotel room pricing methods: Practiced and proposed.
Journal of Revenue and Pricing Management, 3(4), 369-379.
Strategic Business Insights (2013). US Framework and VALS™ Types. Available online at:
http://www.strategicbusinessinsights.com/vals/ustypes.shtml (Accessed on 29th December
2013).
Swarbrooke, J. & Horner, S. (2001). Business travel and tourism. Oxford: Butterworth-Heinemann
Talluri, K. T. & van Ryzin, G. (2005). The theory and practice of revenue management. New York: Springer
Science+Business Media.
Talon-Ballestrero, P., Gonzalez-Serrano, L., & Figueroa-Domecq (2014). A model for evaluating
revenue emanagemenr implementation (MERMI) in the hotel industry. Journal of Revenue and
Pricing Management (forthcoming) doi: 10.1057/rpm.2013.47
Taylor, W. & Kimes, S. E. (2011). The effect of brand class on perceived fairness of revenue
management. Journal of Revenue and Pricing Management, 10(3), 271-284.
Thompson, G. (2010). Restaurant profitability management: The evolution of restaurant revenue
management. Cornell Hospitality Quarterly, 51(3), 308-322.
Thompson, G. & Sohn, H. (2009). Time- and capacity-based measurement of restaurant revenue.
Cornell Hospitality Quarterly, 50(4), 520-539.
Toh, R. S. & de Kay, F. (2002). Hotel room inventory management: An overbooking model. Cornell
Hotel and Restaurant Quarterly, 43(4), 79-90.
Toilot, F. (2013). Staff empowerment and revenue management. In Legoherel, P., Poutier, E., & Fyall,
A. (eds.). Revenue management for hospitality and tourism. Woodeaton, Oxford: Goodfellow
Publishers ltd., pp. 213-222.
Tranter, K. A., Stuart-Hill, T. & Parker, J. (2008). Introduction to revenue management for the hospitality
industry. Harlow: Pearson Prentice Hall.
Tribe, J. (2005). The economics of recreation, leisure and tourism. 3rd ed. Oxford: Elsevier.
Tse, T. S. M. & Poon, Y. T. (2012). Revenue management: resolving a revenue optimization paradox.
International Journal of Contemporary Hospitality Management, 24(4), 507-521.
Varian, H. R. (2006). Intermediate microeconomics: a modern approach. 7th ed. New York: W. W. Norton &
Co.
Varini, K. & Burgess, C. (2010). Maximising profits: Do managers have the skills? International Journal of
Revenue Management, 4(2), 163-178.
Vergori, A. S. (2012). Forecasting tourism demand: the role of seasonality. Tourism Economics, 18(5),
915-930.
Stanislav Ivanov (2014). Hotel Revenue Management: From Theory to Practice. Varna: Zangador. Page 202 of 204
Vinod, B. (2004). Unlocking the value of revenue management in the hotel industry. Journal of Revenue
and Pricing Management, 3(2), 178-190.
Voorhees, C. M., McCall, M. & Carroll, B. (2014). Assessing the benefits of the reward programs: A
recommended approach and case study from the lodging industry. Cornell Hospitality Report,
14(1).
Walsh, C. (2006). Key management ratio. Harlow: Financial Times Prentice Hall.
Wang, X. L. (2013). Revenue management and customer relationship management. In Legoherel, P.,
Poutier, E., & Fyall, A. (eds.) Revenue management for hospitality and tourism. Woodeaton,
Oxford: Goodfellow Publishers ltd., pp. 194-212.
Wang, X. L. (2012a). The impact of revenue management on hotel key account relationship
development. International Journal of Contemporary Hospitality Management, 24(3), 358-380.
Wang, X. L. (2012b). Relationship or revenue: Potential management conflicts between customer
relationship management and hotel revenue management. International Journal of Hospitality
Management, 31(3), 864-874.
Wang, X. L. & Bowie, D. (2009). Revenue management: the impact on business-to-business
relationships. Journal of Services Marketing, 23(1), 31-41.
Wearne, N. & Morrison, A. (2011). Hospitality marketing. Oxon: Routledge.
Weatherford, L. R., Kimes, S. E. & Scott, D. A. (2001). Forecasting for hotel revenue management:
Testing aggregation against disaggregation. Cornell Hotel and Restaurant Administration
Quarterly, 42(4), 53-64.
Weatherford, L. R. & Kimes, S. E. (2003). A comparison of forecasting methods for hotel revenue
management. International Journal of Forecasting, 19(3), 401-415.
Weilbaker, D. C. & Crocker, K. (2001). The importance of selling abilities in corporate hospitality sales
to corporate customers. Journal of Hospitality & Leisure Marketing, 7(4), 17-32.
Werbach, K. & Hunter, D. (2012). For the win: How game thinking can revolutionize your business.
Philadelphia: Wharton Digital Press.
Wilson, A., Zeithaml, V., Bitner, M. J. & Gremler, D. (2012). Service marketing: Integrating customer focus
across the firm. McGraw-Hill. 2nd European ed.
Wirtz, J. & Kimes, S. E. (2007). The moderating effects of familiarity on the perceived fairness of
revenue management pricing. Journal of Service Research, 9(3), 229-240.
Wirtz, J., Kimes, S. E., Theng, J. H. & Patterson, P. (2003). Yield management: Resolving potential
customer conflicts. Journal of Revenue and Pricing Management 2(3), 216-226.
Woodruff, R. B. (1997). Customer value: the next source for competitive advantage. Journal of the
Academy of Marketing Science, 25(2), 139-153.
Wu, W.-Y., Hsiao, S.-W. & Tsai, C.-H. (2008). Forecasting and evaluating the tourist hotel industry
performance in Taiwan based on Grey theory. Tourism and Hospitality Research, 8(2), 137-152.
Yeoman, I. & McMahon-Beattie, U. (eds.) (2011). Revenue Management. A Practical Pricing Perspective.
Palgrave Macmillan.
Yeoman, I. & McMahon-Beattie, U. (eds.) (2004). Revenue Management and Pricing: Case Studies and
Applications. Thomson Business Press.
Yüksel, S. (2007). An integrated forecasting approach to hotel demand. Mathematical and Computer
Modelling, 46(7-8), 1063–1070.
Stanislav Ivanov (2014). Hotel Revenue Management: From Theory to Practice. Varna: Zangador. Page 203 of 204
Zakhary, A., Atiya, A. F., El-Shishiny, H., & El Gayar, N. E. (2011). Forecasting hotel arrivals and
occupancy using Monte Carlo simulation. Journal of Revenue & Pricing Management, 10(4), 344-
366.
Zakhary, A., El Gayar, N. & Ahmed, S. E. H. (2010). Exploiting neural networks to enhance trend
forecasting for hotels reservations. In Schwenker, F. & El Gayar, N. (eds.). Artificial neural
networks in pattern recognition. 4th IAPR TC3 Workshop, ANNPR 2010, Cairo, Egypt, April 11-
13, 2010, Proceedings. Berlin: Springer, 241-251.
Zakhary, A., El Gayar & Atiya, A, F. (2008). A comparative study of the pickup method and its
variations using a simulated hotel reservation data. International Journal on Artificial Intelligence
and Machine Learning, 8, 15-21
Zarraga-Oberty, C. & Bonache, J. (2007). Human factors in the design of revenue management systems
in multinational corporations. International Journal of Revenue Management, 1(2), 141-153.
Zhang, M. & Bell, P. C. (2010). Fencing in the context of revenue management. International Journal of
Revenue Management, 4(1), 42-68.
Zhang, M. & Bell, P. C. (2012). Price fencing in the practice of revenue management: An overview and
taxonomy. Journal of Revenue and Pricing Management, 11(2), 146-159.
Zhang, G. P. (2004). Neural networks in business forecasting. Hershey: Idea Group Publishing.
Zhuang, W. & Li, M. Z. F. (2012). Dynamic pricing with two revenue streams. Operations Research
Letters, 40(1), 46-51.
Zikmund, W. G. & Babin, B. J. (2013). Essentials of marketing research. 5th ed. Mason: Cengage Learning.

Stanislav Ivanov (2014). Hotel Revenue Management: From Theory to Practice. Varna: Zangador. Page 204 of 204
Dr. Stanislav Ivanov is Associate Professor and Vice Rector for Academic
Affairs and Research at International University College, Bulgaria. He is the
Editor-in-Chief of the European Journal of Tourism Research
(http://ejtr.vumk.eu) and serves on the Editorial boards of 20 other journals.
His research interests include hotel marketing, revenue management, tourism
economics, tourism and politics, special interest tourism. Dr. Ivanov’s
publications have appeared in top academic journals like Annals of Tourism
Research, Tourism Management, Tourism Economics, Journal of Heritage Tourism,
Tourism Today, Tourism, Anatolia, Journal of Economic Studies, Journal of
Southern Europe and the Balkans, South-Eastern Europe Journal of Economics.
ISBN: 978-954-92786-3-7