Standing and very slow walking: foot pain-pressure threshold, subjective pain experience and work...
10
Applied Ergonomics 32 (2001) 81 } 90 Standing and very slow walking: foot pain-pressure threshold, subjective pain experience and work activity Karen Messing!,*,A s sa Kilbom" !CINBIOSE, Department of Biological Sciences, Universite & du Que & bec a % Montre & al, C.P. 8888, Succursale Centre-ville, Montre & al, Que & bec H3C 3P8, Canada "Arbetsha ( lsoenteten, National Institute for Working Life, Solna 171 84, Sweden Received 27 August 1998; accepted 19 May 2000 Abstract Prolonged standing is described as uncomfortable by exposed workers, but the discomfort has not been linked to precise descriptions of workplace activity. We observed 10 sales and kitchen workers (`group 1a) who worked standing. We compared the plantar pain-pressure threshold (PPT) of `group 1a (10 standing workers) to that of `group 2a (11 researchers who could choose their posture freely). Group 1 spent an average time of 62% standing still compared to 5% for group 2. Despite the fact that group 1 were primarily con"ned to de"ned areas and stood for 62% of the time, their mean time standing still was only 7 s. They walked 35% of the time, but 57% of walking sequences were only one or two steps. Group 1 PPT declined by 23% over the work day compared to 5% among group 2 ( p(0.05, ANOVA). Foot PPT is a promising quantitative indicator of e!ects of standing work. ( 2001 Elsevier Science Ltd. All rights reserved. Keywords: Short-distance walking; Foot; Pain-pressure threshold; Standing 1. Introduction Prolonged standing is found in such service occupa- tions as sales clerk (Kilbom, 1971), food service worker (Winkel, 1982) and hairdresser (Gacia-Fondan, 1992) as well as many factory jobs (Derrienic et al., 1996). In some countries, supermarket clerks (Ryan, 1989; Ve H zina et al., 1994) and bank tellers (Seifert et al., 1997) also work standing. In the MUSIC I study of a Swedish working population, aged 20}64, 19% of men and 15% of women worked standing during more than one-tenth of the day (Wiktorin et al., 1991). Although epidemiological studies are rare, there has been a long-lasting interest in the health consequences of constrained standing, due to discomfort su!ered by workers. Deane (1901) found that laundresses who worked standing had a four-fold excess of leg ulcerations compared to other women workers. Studies done prim- arily in the laboratory suggest that the immediate dis- comfort in the back and lower limbs associated with prolonged constrained standing arises from four main * Corresponding author. Tel.: 1-514-987-3000; fax: 1-514-987-6183. E-mail address: messing.karen@uqam.ca (K. Messing). sources (Buckle et al., 1986; Whitstance et al., 1995; Sejersted and Westgaard, 1988; Edwards, 1988; Krijnen, 1997; Hansen et al., 1998): (1) interference with the venous return from the lower limbs to the heart, resulting in tissue hypoxia; (2) interference with the venous return from the lower limbs to the heart, resulting in oedema; (3) intervertebral disc stress from excessive lordosis; (4) stretching of ligaments. Extension of laboratory studies to workplace situ- ations has been hampered by two types of di$culties. First, it is hard for observers to di!erentiate constrained standing from walking, since workers often move only one or two steps at a time (Seifert et al., 1997). Measure- ment of very slow walking in complex workplace situ- ations by a pedometer has been found to correlate poorly with observation (Selin and Winkel, 1994), and self-re- ports of the frequency of walking also di!er sharply from observations (Baty et al., 1986; Wiktorin et al., 1993). It is therefore important to characterize standing/walking postures in such a way as to produce reproducible data about workers' exposures. Second, in order to identify determinants of the dis- comfort associated with constrained standing, it is also necessary to "nd an indicator of those e!ects that will allow objective, quantitative determination. Pain-pressure 0003-6870/01/$ - see front matter ( 2001 Elsevier Science Ltd. All rights reserved. PII: S 0 0 0 3 - 6 8 7 0 ( 0 0 ) 0 0 0 3 0 - 2
Transcript of Standing and very slow walking: foot pain-pressure threshold, subjective pain experience and work...
Applied Ergonomics 32 (2001) 81}90
Standing and very slow walking: foot pain-pressure threshold,subjective pain experience and work activity
Karen Messing!,*, As sa Kilbom"
!CINBIOSE, Department of Biological Sciences, Universite& du Que&bec a% Montre&al, C.P. 8888, Succursale Centre-ville, Montre&al, Que&bec H3C 3P8, Canada"Arbetsha( lsoenteten, National Institute for Working Life, Solna 171 84, Sweden
Received 27 August 1998; accepted 19 May 2000
Abstract
Prolonged standing is described as uncomfortable by exposed workers, but the discomfort has not been linked to precisedescriptions of workplace activity. We observed 10 sales and kitchen workers (`group 1a) who worked standing. We compared theplantar pain-pressure threshold (PPT) of `group 1a (10 standing workers) to that of `group 2a (11 researchers who could choose theirposture freely). Group 1 spent an average time of 62% standing still compared to 5% for group 2. Despite the fact that group 1 wereprimarily con"ned to de"ned areas and stood for 62% of the time, their mean time standing still was only 7 s. They walked 35% of thetime, but 57% of walking sequences were only one or two steps. Group 1 PPT declined by 23% over the work day compared to 5%among group 2 (p(0.05, ANOVA). Foot PPT is a promising quantitative indicator of e!ects of standing work. ( 2001 ElsevierScience Ltd. All rights reserved.
Keywords: Short-distance walking; Foot; Pain-pressure threshold; Standing
1. Introduction
Prolonged standing is found in such service occupa-tions as sales clerk (Kilbom, 1971), food service worker(Winkel, 1982) and hairdresser (Gacia-Fondan, 1992) aswell as many factory jobs (Derrienic et al., 1996). In somecountries, supermarket clerks (Ryan, 1989; VeH zina et al.,1994) and bank tellers (Seifert et al., 1997) also workstanding. In the MUSIC I study of a Swedish workingpopulation, aged 20}64, 19% of men and 15% of womenworked standing during more than one-tenth of the day(Wiktorin et al., 1991).
Although epidemiological studies are rare, there hasbeen a long-lasting interest in the health consequences ofconstrained standing, due to discomfort su!ered byworkers. Deane (1901) found that laundresses whoworked standing had a four-fold excess of leg ulcerationscompared to other women workers. Studies done prim-arily in the laboratory suggest that the immediate dis-comfort in the back and lower limbs associated withprolonged constrained standing arises from four main
*Corresponding author. Tel.: 1-514-987-3000; fax: 1-514-987-6183.E-mail address: [email protected] (K. Messing).
sources (Buckle et al., 1986; Whitstance et al., 1995;Sejersted and Westgaard, 1988; Edwards, 1988; Krijnen,1997; Hansen et al., 1998): (1) interference with the venousreturn from the lower limbs to the heart, resulting intissue hypoxia; (2) interference with the venous returnfrom the lower limbs to the heart, resulting in oedema; (3)intervertebral disc stress from excessive lordosis; (4)stretching of ligaments.
Extension of laboratory studies to workplace situ-ations has been hampered by two types of di$culties.First, it is hard for observers to di!erentiate constrainedstanding from walking, since workers often move onlyone or two steps at a time (Seifert et al., 1997). Measure-ment of very slow walking in complex workplace situ-ations by a pedometer has been found to correlate poorlywith observation (Selin and Winkel, 1994), and self-re-ports of the frequency of walking also di!er sharply fromobservations (Baty et al., 1986; Wiktorin et al., 1993). It istherefore important to characterize standing/walkingpostures in such a way as to produce reproducible dataabout workers' exposures.
Second, in order to identify determinants of the dis-comfort associated with constrained standing, it is alsonecessary to "nd an indicator of those e!ects that willallow objective, quantitative determination. Pain-pressure
0003-6870/01/$ - see front matter ( 2001 Elsevier Science Ltd. All rights reserved.PII: S 0 0 0 3 - 6 8 7 0 ( 0 0 ) 0 0 0 3 0 - 2
Table 1Characteristics of sales and kitchen personnel (group 1)
Age (yr) Sex Height (m) Weight(kg range)
Seniority(yr)
Pain in feetduring last3 months
Shoes worn!
Sales1 30 F 1.75 80}89 11 Yes Running2 31 F 1.57 70}79 13 Yes Clogs with rubber soles3 53 F 1.76 70}79 23 Yes Clogs4 30 F 1.63 50}59 8 Yes Running5 28 F 1.74 70}79 11 No Clogs6 38 F 1.57 50}59 18 Yes Clogs7 58 F 1.60 60}69 33 No Running8 41 F 1.61 70}79 14 Yes Clogs with rubber solesKitchen9 41 F 1.73 70}79 1 No Running10 32 M 1.92 110}119 10 Yes RunningAverage 38.2$10.3 1.69$0.11 70}79 14.2$8.8
!On day of study.
Table 2Characteristics of research personnel (group 2)
Group 2 Age (yr) Sex Height (m) Weight (kg) Pain in feet duringlast 3 moths
Shoes worn!
1 37 F 1.69 60}69 No Running2 33 F 1.68 50}59 Yes (new shoes) Sandals3 49 M 1.93 60}69 No Sandals4 35 F 1.71 50}59 No Clogs5 25 F 1.65 60}69 No Sandals6 32 M 1.80 70}79 No Sandals with massage soles7 36 F 1.53 40}49 No Clogs8 35 F 1.67 60}69 No Running9 42 F 1.70 55}60 No Clogs10 50 F 1.68 70}79 No Clogs11 35 M 1.91 80}89 No SandalsAverage 37.2$7.3 1.72$0.12 60}69
! On day of study.
threshold (PPT) determination in the hand has beensuccessfully used to quantify e!ects of hand-tool use inthe workplace and has been proposed as an indicator ofdamaged tissue (BystroK m et al., 1995).
The aim of the present study is therefore twofold: todescribe constrained walking in a working populationand to relate changes in PPT over a workday to observa-tions of working postures. Our hypotheses are (1) thatworkers in a constrained standing posture are not com-pletely still and (2) that foot PPT is lowered by a day'swork in a constrained standing posture.
2. Materials and methods
2.1. Study population
Standing workers were compared to those who sat formost of the day. `Group 1a were paid volunteers from
a Stockholm department store (n"8) or a Stockholmrestaurant (n"2). (see Table 1). `Group 2a were unpaidresearch personnel of similar age from the National Insti-tute for Working Life who did not work standing andwho did not report problems with their feet (Table 2).
2.2. PPT measurements
Pain-pressure threshold (PPT) was recorded in kilo-pascals at seven marked points on the plantar surface ofthe dominant foot (Fig. 1) using a pressure algometer(Somedic, Algometer Type I) with a 1.0 cm2 round-edgealuminum surface at an approximate 25 kPa s~1 applica-tion rate, applied by a single experimenter. Pressure wasincreased until the subjects indicated by pressing a but-ton that they had reached their PPT (Hall, 1995). Sub-jects practised three times before every recording session,at points not used for the eventual recording. The sub-jects could not see the algometer reading during the
82 K. Messing, As . Kilbom / Applied Ergonomics 32 (2001) 81}90
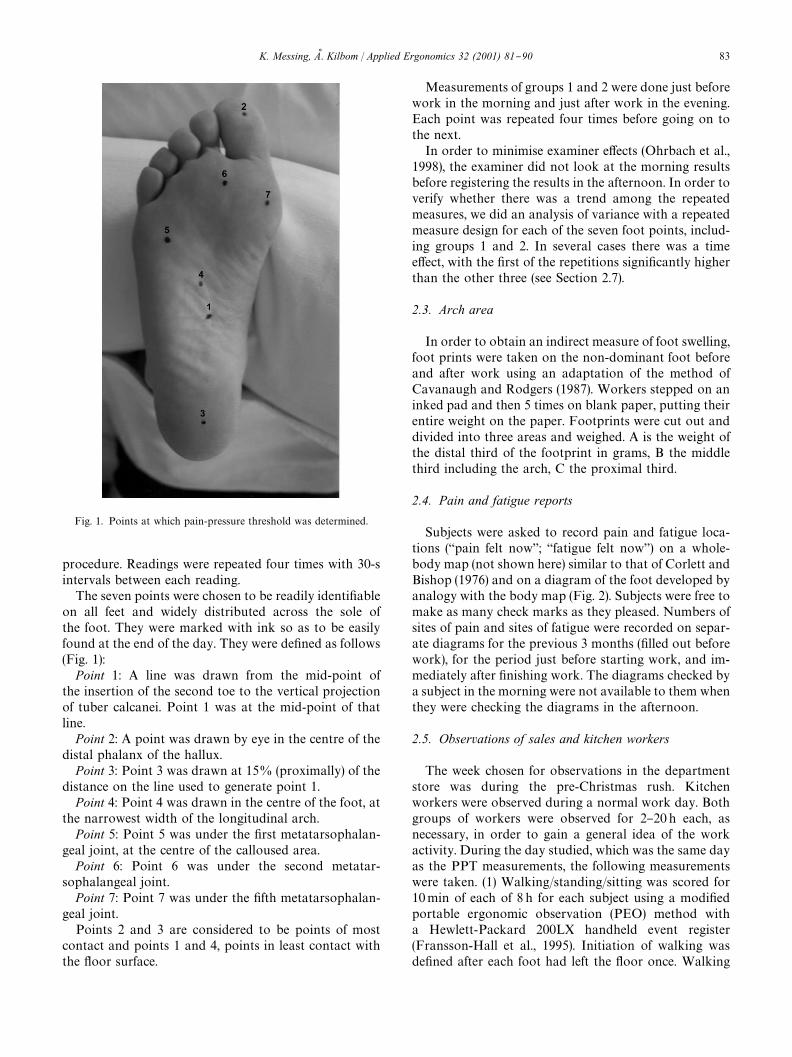
Fig. 1. Points at which pain-pressure threshold was determined.
procedure. Readings were repeated four times with 30-sintervals between each reading.
The seven points were chosen to be readily identi"ableon all feet and widely distributed across the sole ofthe foot. They were marked with ink so as to be easilyfound at the end of the day. They were de"ned as follows(Fig. 1):
Point 1: A line was drawn from the mid-point ofthe insertion of the second toe to the vertical projectionof tuber calcanei. Point 1 was at the mid-point of thatline.
Point 2: A point was drawn by eye in the centre of thedistal phalanx of the hallux.
Point 3: Point 3 was drawn at 15% (proximally) of thedistance on the line used to generate point 1.
Point 4: Point 4 was drawn in the centre of the foot, atthe narrowest width of the longitudinal arch.
Point 5: Point 5 was under the "rst metatarsophalan-geal joint, at the centre of the calloused area.
Point 6: Point 6 was under the second metatar-sophalangeal joint.
Point 7: Point 7 was under the "fth metatarsophalan-geal joint.
Points 2 and 3 are considered to be points of mostcontact and points 1 and 4, points in least contact withthe #oor surface.
Measurements of groups 1 and 2 were done just beforework in the morning and just after work in the evening.Each point was repeated four times before going on tothe next.
In order to minimise examiner e!ects (Ohrbach et al.,1998), the examiner did not look at the morning resultsbefore registering the results in the afternoon. In order toverify whether there was a trend among the repeatedmeasures, we did an analysis of variance with a repeatedmeasure design for each of the seven foot points, includ-ing groups 1 and 2. In several cases there was a timee!ect, with the "rst of the repetitions signi"cantly higherthan the other three (see Section 2.7).
2.3. Arch area
In order to obtain an indirect measure of foot swelling,foot prints were taken on the non-dominant foot beforeand after work using an adaptation of the method ofCavanaugh and Rodgers (1987). Workers stepped on aninked pad and then 5 times on blank paper, putting theirentire weight on the paper. Footprints were cut out anddivided into three areas and weighed. A is the weight ofthe distal third of the footprint in grams, B the middlethird including the arch, C the proximal third.
2.4. Pain and fatigue reports
Subjects were asked to record pain and fatigue loca-tions (`pain felt nowa; `fatigue felt nowa) on a whole-body map (not shown here) similar to that of Corlett andBishop (1976) and on a diagram of the foot developed byanalogy with the body map (Fig. 2). Subjects were free tomake as many check marks as they pleased. Numbers ofsites of pain and sites of fatigue were recorded on separ-ate diagrams for the previous 3 months ("lled out beforework), for the period just before starting work, and im-mediately after "nishing work. The diagrams checked bya subject in the morning were not available to them whenthey were checking the diagrams in the afternoon.
2.5. Observations of sales and kitchen workers
The week chosen for observations in the departmentstore was during the pre-Christmas rush. Kitchenworkers were observed during a normal work day. Bothgroups of workers were observed for 2}20 h each, asnecessary, in order to gain a general idea of the workactivity. During the day studied, which was the same dayas the PPT measurements, the following measurementswere taken. (1) Walking/standing/sitting was scored for10min of each of 8 h for each subject using a modi"edportable ergonomic observation (PEO) method witha Hewlett-Packard 200LX handheld event register(Fransson-Hall et al., 1995). Initiation of walking wasde"ned after each foot had left the #oor once. Walking
K. Messing, As . Kilbom / Applied Ergonomics 32 (2001) 81}90 83
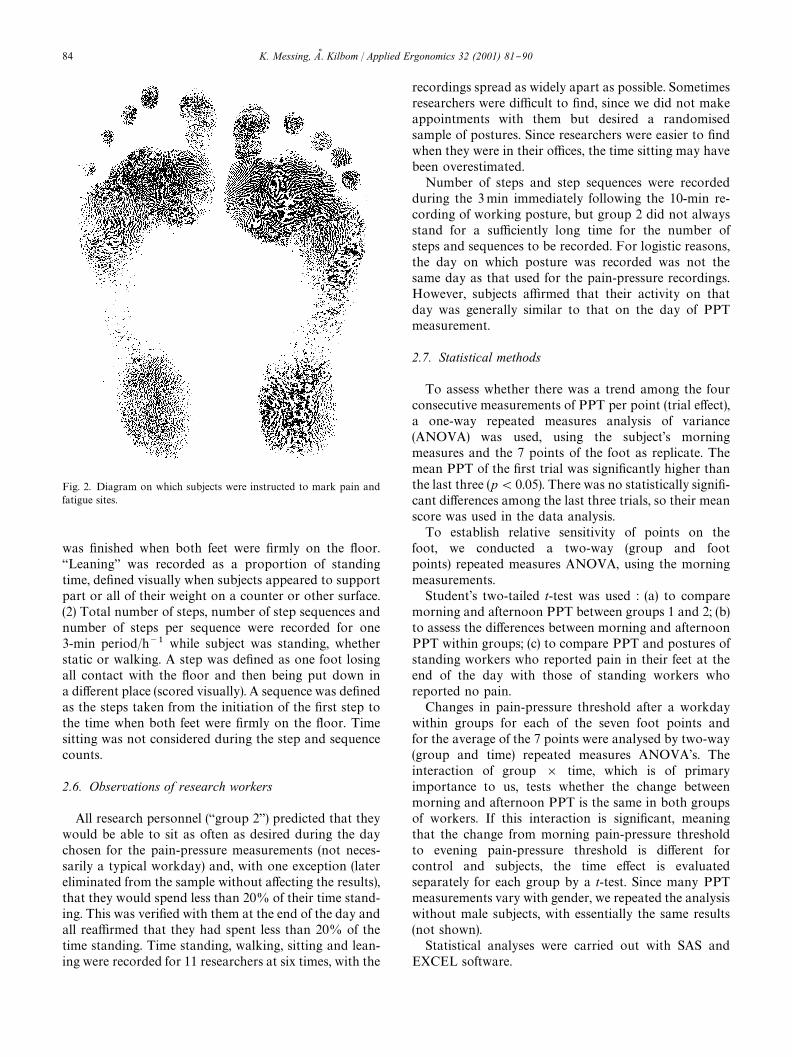
Fig. 2. Diagram on which subjects were instructed to mark pain andfatigue sites.
was "nished when both feet were "rmly on the #oor.`Leaninga was recorded as a proportion of standingtime, de"ned visually when subjects appeared to supportpart or all of their weight on a counter or other surface.(2) Total number of steps, number of step sequences andnumber of steps per sequence were recorded for one3-min period/h~1 while subject was standing, whetherstatic or walking. A step was de"ned as one foot losingall contact with the #oor and then being put down ina di!erent place (scored visually). A sequence was de"nedas the steps taken from the initiation of the "rst step tothe time when both feet were "rmly on the #oor. Timesitting was not considered during the step and sequencecounts.
2.6. Observations of research workers
All research personnel (`group 2a) predicted that theywould be able to sit as often as desired during the daychosen for the pain-pressure measurements (not neces-sarily a typical workday) and, with one exception (latereliminated from the sample without a!ecting the results),that they would spend less than 20% of their time stand-ing. This was veri"ed with them at the end of the day andall rea$rmed that they had spent less than 20% of thetime standing. Time standing, walking, sitting and lean-ing were recorded for 11 researchers at six times, with the
recordings spread as widely apart as possible. Sometimesresearchers were di$cult to "nd, since we did not makeappointments with them but desired a randomisedsample of postures. Since researchers were easier to "ndwhen they were in their o$ces, the time sitting may havebeen overestimated.
Number of steps and step sequences were recordedduring the 3min immediately following the 10-min re-cording of working posture, but group 2 did not alwaysstand for a su$ciently long time for the number ofsteps and sequences to be recorded. For logistic reasons,the day on which posture was recorded was not thesame day as that used for the pain-pressure recordings.However, subjects a$rmed that their activity on thatday was generally similar to that on the day of PPTmeasurement.
2.7. Statistical methods
To assess whether there was a trend among the fourconsecutive measurements of PPT per point (trial e!ect),a one-way repeated measures analysis of variance(ANOVA) was used, using the subject's morningmeasures and the 7 points of the foot as replicate. Themean PPT of the "rst trial was signi"cantly higher thanthe last three (p(0.05). There was no statistically signi"-cant di!erences among the last three trials, so their meanscore was used in the data analysis.
To establish relative sensitivity of points on thefoot, we conducted a two-way (group and footpoints) repeated measures ANOVA, using the morningmeasurements.
Student's two-tailed t-test was used : (a) to comparemorning and afternoon PPT between groups 1 and 2; (b)to assess the di!erences between morning and afternoonPPT within groups; (c) to compare PPT and postures ofstanding workers who reported pain in their feet at theend of the day with those of standing workers whoreported no pain.
Changes in pain-pressure threshold after a workdaywithin groups for each of the seven foot points andfor the average of the 7 points were analysed by two-way(group and time) repeated measures ANOVA's. Theinteraction of group ] time, which is of primaryimportance to us, tests whether the change betweenmorning and afternoon PPT is the same in both groupsof workers. If this interaction is signi"cant, meaningthat the change from morning pain-pressure thresholdto evening pain-pressure threshold is di!erent forcontrol and subjects, the time e!ect is evaluatedseparately for each group by a t-test. Since many PPTmeasurements vary with gender, we repeated the analysiswithout male subjects, with essentially the same results(not shown).
Statistical analyses were carried out with SAS andEXCEL software.
84 K. Messing, As . Kilbom / Applied Ergonomics 32 (2001) 81}90
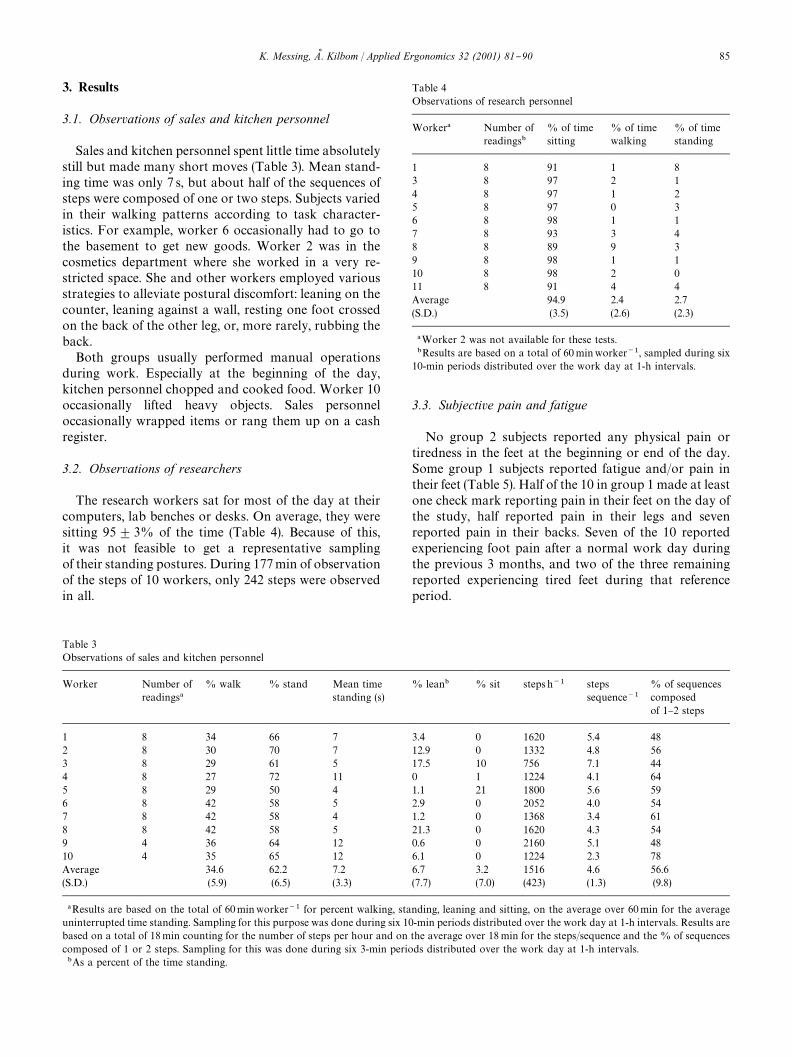
Table 3Observations of sales and kitchen personnel
Worker Number ofreadings!
% walk % stand Mean timestanding (s)
% lean" % sit steps h~1 stepssequence~1
% of sequencescomposedof 1}2 steps
1 8 34 66 7 3.4 0 1620 5.4 482 8 30 70 7 12.9 0 1332 4.8 563 8 29 61 5 17.5 10 756 7.1 444 8 27 72 11 0 1 1224 4.1 645 8 29 50 4 1.1 21 1800 5.6 596 8 42 58 5 2.9 0 2052 4.0 547 8 42 58 4 1.2 0 1368 3.4 618 8 42 58 5 21.3 0 1620 4.3 549 4 36 64 12 0.6 0 2160 5.1 4810 4 35 65 12 6.1 0 1224 2.3 78Average 34.6 62.2 7.2 6.7 3.2 1516 4.6 56.6(S.D.) (5.9) (6.5) (3.3) (7.7) (7.0) (423) (1.3) (9.8)
!Results are based on the total of 60minworker~1 for percent walking, standing, leaning and sitting, on the average over 60min for the averageuninterrupted time standing. Sampling for this purpose was done during six 10-min periods distributed over the work day at 1-h intervals. Results arebased on a total of 18min counting for the number of steps per hour and on the average over 18 min for the steps/sequence and the % of sequencescomposed of 1 or 2 steps. Sampling for this was done during six 3-min periods distributed over the work day at 1-h intervals."As a percent of the time standing.
Table 4Observations of research personnel
Worker! Number ofreadings"
% of timesitting
% of timewalking
% of timestanding
1 8 91 1 83 8 97 2 14 8 97 1 25 8 97 0 36 8 98 1 17 8 93 3 48 8 89 9 39 8 98 1 110 8 98 2 011 8 91 4 4Average 94.9 2.4 2.7(S.D.) (3.5) (2.6) (2.3)
!Worker 2 was not available for these tests."Results are based on a total of 60 minworker~1, sampled during six
10-min periods distributed over the work day at 1-h intervals.
3. Results
3.1. Observations of sales and kitchen personnel
Sales and kitchen personnel spent little time absolutelystill but made many short moves (Table 3). Mean stand-ing time was only 7 s, but about half of the sequences ofsteps were composed of one or two steps. Subjects variedin their walking patterns according to task character-istics. For example, worker 6 occasionally had to go tothe basement to get new goods. Worker 2 was in thecosmetics department where she worked in a very re-stricted space. She and other workers employed variousstrategies to alleviate postural discomfort: leaning on thecounter, leaning against a wall, resting one foot crossedon the back of the other leg, or, more rarely, rubbing theback.
Both groups usually performed manual operationsduring work. Especially at the beginning of the day,kitchen personnel chopped and cooked food. Worker 10occasionally lifted heavy objects. Sales personneloccasionally wrapped items or rang them up on a cashregister.
3.2. Observations of researchers
The research workers sat for most of the day at theircomputers, lab benches or desks. On average, they weresitting 95$3% of the time (Table 4). Because of this,it was not feasible to get a representative samplingof their standing postures. During 177min of observationof the steps of 10 workers, only 242 steps were observedin all.
3.3. Subjective pain and fatigue
No group 2 subjects reported any physical pain ortiredness in the feet at the beginning or end of the day.Some group 1 subjects reported fatigue and/or pain intheir feet (Table 5). Half of the 10 in group 1 made at leastone check mark reporting pain in their feet on the day ofthe study, half reported pain in their legs and sevenreported pain in their backs. Seven of the 10 reportedexperiencing foot pain after a normal work day duringthe previous 3 months, and two of the three remainingreported experiencing tired feet during that referenceperiod.
K. Messing, As . Kilbom / Applied Ergonomics 32 (2001) 81}90 85
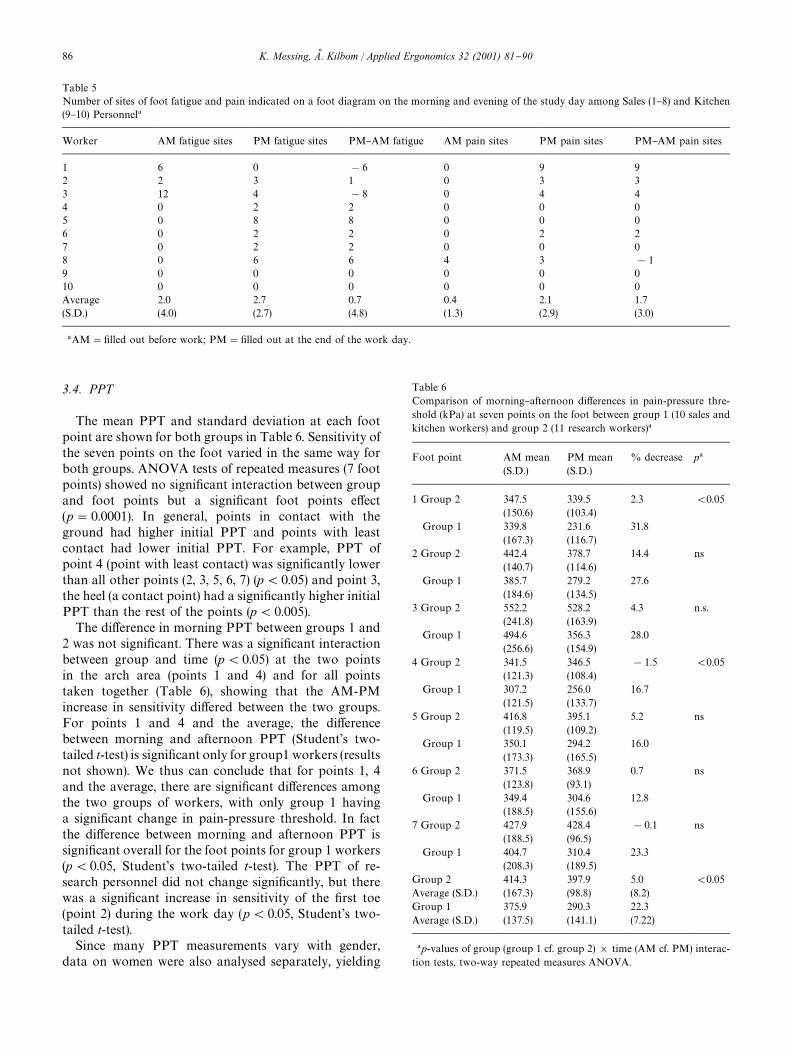
Table 5Number of sites of foot fatigue and pain indicated on a foot diagram on the morning and evening of the study day among Sales (1}8) and Kitchen(9}10) Personnel!
Worker AM fatigue sites PM fatigue sites PM}AM fatigue AM pain sites PM pain sites PM}AM pain sites
1 6 0 !6 0 9 92 2 3 1 0 3 33 12 4 !8 0 4 44 0 2 2 0 0 05 0 8 8 0 0 06 0 2 2 0 2 27 0 2 2 0 0 08 0 6 6 4 3 !19 0 0 0 0 0 010 0 0 0 0 0 0Average 2.0 2.7 0.7 0.4 2.1 1.7(S.D.) (4.0) (2.7) (4.8) (1.3) (2.9) (3.0)
!AM""lled out before work; PM""lled out at the end of the work day.
Table 6Comparison of morning}afternoon di!erences in pain-pressure thre-shold (kPa) at seven points on the foot between group 1 (10 sales andkitchen workers) and group 2 (11 research workers)!
Foot point AM mean(S.D.)
PM mean(S.D.)
% decrease p!
1 Group 2 347.5 339.5 2.3 (0.05(150.6) (103.4)
Group 1 339.8 231.6 31.8(167.3) (116.7)
2 Group 2 442.4 378.7 14.4 ns(140.7) (114.6)
Group 1 385.7 279.2 27.6(184.6) (134.5)
3 Group 2 552.2 528.2 4.3 n.s.(241.8) (163.9)
Group 1 494.6 356.3 28.0(256.6) (154.9)
4 Group 2 341.5 346.5 !1.5 (0.05(121.3) (108.4)
Group 1 307.2 256.0 16.7(121.5) (133.7)
5 Group 2 416.8 395.1 5.2 ns(119.5) (109.2)
Group 1 350.1 294.2 16.0(173.3) (165.5)
6 Group 2 371.5 368.9 0.7 ns(123.8) (93.1)
Group 1 349.4 304.6 12.8(188.5) (155.6)
7 Group 2 427.9 428.4 !0.1 ns(188.5) (96.5)
Group 1 404.7 310.4 23.3(208.3) (189.5)
Group 2 414.3 397.9 5.0 (0.05Average (S.D.) (167.3) (98.8) (8.2)Group 1 375.9 290.3 22.3Average (S.D.) (137.5) (141.1) (7.22)
!p-values of group (group 1 cf. group 2) ] time (AM cf. PM) interac-tion tests, two-way repeated measures ANOVA.
3.4. PPT
The mean PPT and standard deviation at each footpoint are shown for both groups in Table 6. Sensitivity ofthe seven points on the foot varied in the same way forboth groups. ANOVA tests of repeated measures (7 footpoints) showed no signi"cant interaction between groupand foot points but a signi"cant foot points e!ect(p"0.0001). In general, points in contact with theground had higher initial PPT and points with leastcontact had lower initial PPT. For example, PPT ofpoint 4 (point with least contact) was signi"cantly lowerthan all other points (2, 3, 5, 6, 7) (p(0.05) and point 3,the heel (a contact point) had a signi"cantly higher initialPPT than the rest of the points (p(0.005).
The di!erence in morning PPT between groups 1 and2 was not signi"cant. There was a signi"cant interactionbetween group and time (p(0.05) at the two pointsin the arch area (points 1 and 4) and for all pointstaken together (Table 6), showing that the AM-PMincrease in sensitivity di!ered between the two groups.For points 1 and 4 and the average, the di!erencebetween morning and afternoon PPT (Student's two-tailed t-test) is signi"cant only for group1 workers (resultsnot shown). We thus can conclude that for points 1, 4and the average, there are signi"cant di!erences amongthe two groups of workers, with only group 1 havinga signi"cant change in pain-pressure threshold. In factthe di!erence between morning and afternoon PPT issigni"cant overall for the foot points for group 1 workers(p(0.05, Student's two-tailed t-test). The PPT of re-search personnel did not change signi"cantly, but therewas a signi"cant increase in sensitivity of the "rst toe(point 2) during the work day (p(0.05, Student's two-tailed t-test).
Since many PPT measurements vary with gender,data on women were also analysed separately, yielding
86 K. Messing, As . Kilbom / Applied Ergonomics 32 (2001) 81}90
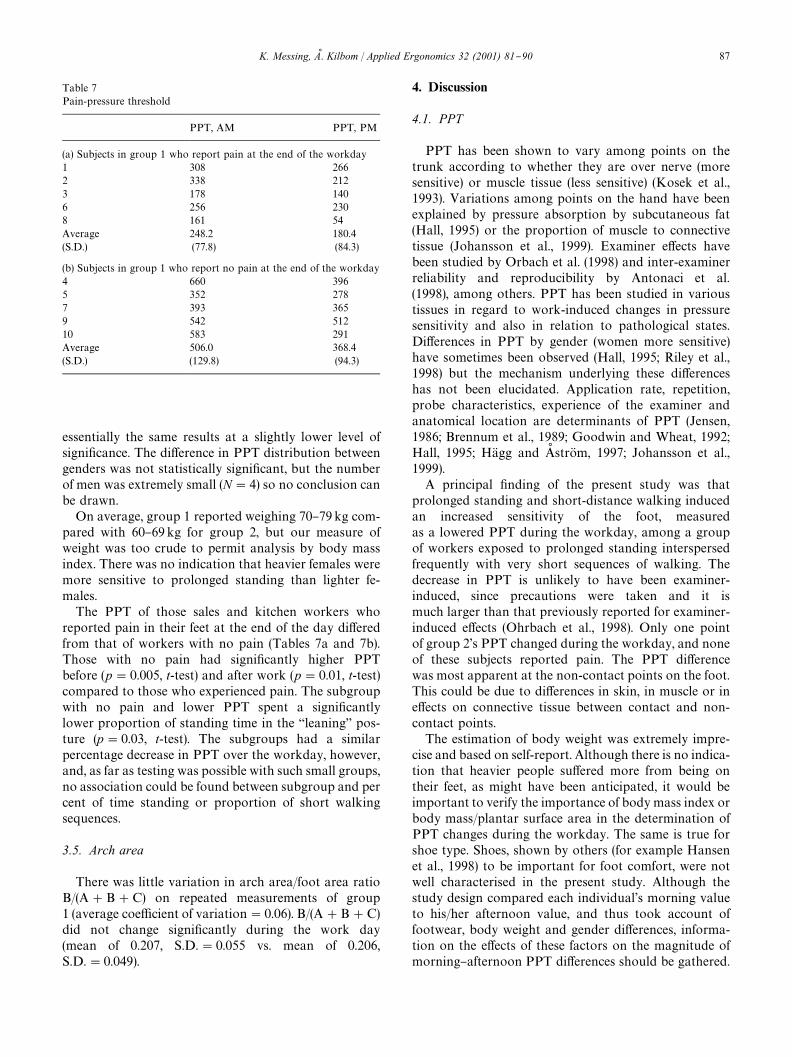
Table 7Pain-pressure threshold
PPT, AM PPT, PM
(a) Subjects in group 1 who report pain at the end of the workday1 308 2662 338 2123 178 1406 256 2308 161 54Average 248.2 180.4(S.D.) (77.8) (84.3)
(b) Subjects in group 1 who report no pain at the end of the workday4 660 3965 352 2787 393 3659 542 51210 583 291Average 506.0 368.4(S.D.) (129.8) (94.3)
essentially the same results at a slightly lower level ofsigni"cance. The di!erence in PPT distribution betweengenders was not statistically signi"cant, but the numberof men was extremely small (N"4) so no conclusion canbe drawn.
On average, group 1 reported weighing 70}79kg com-pared with 60}69kg for group 2, but our measure ofweight was too crude to permit analysis by body massindex. There was no indication that heavier females weremore sensitive to prolonged standing than lighter fe-males.
The PPT of those sales and kitchen workers whoreported pain in their feet at the end of the day di!eredfrom that of workers with no pain (Tables 7a and 7b).Those with no pain had signi"cantly higher PPTbefore (p"0.005, t-test) and after work (p"0.01, t-test)compared to those who experienced pain. The subgroupwith no pain and lower PPT spent a signi"cantlylower proportion of standing time in the `leaninga pos-ture (p"0.03, t-test). The subgroups had a similarpercentage decrease in PPT over the workday, however,and, as far as testing was possible with such small groups,no association could be found between subgroup and percent of time standing or proportion of short walkingsequences.
3.5. Arch area
There was little variation in arch area/foot area ratioB/(A#B#C) on repeated measurements of group1 (average coe$cient of variation"0.06). B/(A#B#C)did not change signi"cantly during the work day(mean of 0.207, S.D."0.055 vs. mean of 0.206,S.D."0.049).
4. Discussion
4.1. PPT
PPT has been shown to vary among points on thetrunk according to whether they are over nerve (moresensitive) or muscle tissue (less sensitive) (Kosek et al.,1993). Variations among points on the hand have beenexplained by pressure absorption by subcutaneous fat(Hall, 1995) or the proportion of muscle to connectivetissue (Johansson et al., 1999). Examiner e!ects havebeen studied by Orbach et al. (1998) and inter-examinerreliability and reproducibility by Antonaci et al.(1998), among others. PPT has been studied in varioustissues in regard to work-induced changes in pressuresensitivity and also in relation to pathological states.Di!erences in PPT by gender (women more sensitive)have sometimes been observed (Hall, 1995; Riley et al.,1998) but the mechanism underlying these di!erenceshas not been elucidated. Application rate, repetition,probe characteristics, experience of the examiner andanatomical location are determinants of PPT (Jensen,1986; Brennum et al., 1989; Goodwin and Wheat, 1992;Hall, 1995; HaK gg and As stroK m, 1997; Johansson et al.,1999).
A principal "nding of the present study was thatprolonged standing and short-distance walking inducedan increased sensitivity of the foot, measuredas a lowered PPT during the workday, among a groupof workers exposed to prolonged standing interspersedfrequently with very short sequences of walking. Thedecrease in PPT is unlikely to have been examiner-induced, since precautions were taken and it ismuch larger than that previously reported for examiner-induced e!ects (Ohrbach et al., 1998). Only one pointof group 2's PPT changed during the workday, and noneof these subjects reported pain. The PPT di!erencewas most apparent at the non-contact points on the foot.This could be due to di!erences in skin, in muscle or ine!ects on connective tissue between contact and non-contact points.
The estimation of body weight was extremely impre-cise and based on self-report. Although there is no indica-tion that heavier people su!ered more from being ontheir feet, as might have been anticipated, it would beimportant to verify the importance of body mass index orbody mass/plantar surface area in the determination ofPPT changes during the workday. The same is true forshoe type. Shoes, shown by others (for example Hansenet al., 1998) to be important for foot comfort, were notwell characterised in the present study. Although thestudy design compared each individual's morning valueto his/her afternoon value, and thus took account offootwear, body weight and gender di!erences, informa-tion on the e!ects of these factors on the magnitude ofmorning}afternoon PPT di!erences should be gathered.
K. Messing, As . Kilbom / Applied Ergonomics 32 (2001) 81}90 87
Male}female di!erences have sometimes been found inhand PPT (Fransson-Hall and Kilbom, 1993; Johanssonet al., 1999), but no information is currently availableon gender di!erences in pain perception on the plantarsurface.
The di!erence in PPT change between researchers andrestaurant and sales workers may be related to the di!er-ence in work activity or in the ability to adjust workingconditions as necessary to assure comfort. Two sub-groups of standing workers were identi"ed. The "rst(Table 7a), who reported pain in their feet at the end ofthe workday, showed a lower pain threshold in themorning and afternoon than the second group (Table 7b),who reported no pain. There was a tendency for the`paina group to be observed more often in the posture`leaninga than the other group. These associations arebased on very small samples and their cause is not clear;the `paina group may have been originally more sensitiveto pain or may have undergone changes due to theirwork or other experience. These associations should becon"rmed.
There are no obvious di!erences between the `painagroup and their colleagues in seniority, age, weight orfootwear. Attempts to correlate PPT level with elementsof work activity (per cent of time standing, walking pat-tern) did not succeed. However the sample was very smalland exposure conditions did not vary greatly amonggroup 1. The fact that the level of the foot PPT wasassociated with perceived pain and with measures (`%leaninga) presumably taken to counteract pain leads usto believe that PPT could provide a quantitative, semi-objective indicator of foot discomfort.
We did not succeed in relating the increase in sensitiv-ity (decrease in PPT) over the workday to swelling. Themethod used has been shown to be reliable within thesame day at 0.96 and between days at 0.94 (Cavanaughand Rodgers, 1987) and performed similarly duringa pre-test for the present study. However, oedema maynot be well measured by changes at the arch. Some other,more sensitive method might pick up changes; a plethys-mograph was used by Hansen and colleagues (1998) tomeasure oedema induced by 2 h of standing. Impedancechanges have also been used to measure leg swelling (Seoet al., 1995).
It has been suggested that chronic pain associated withcontinuous muscle load arises from positive feedbackloops where a primary muscle or group is a!ected andsecretes metabolites which activate other muscles andwhich also increase pain sensitivity in the originally a!ec-ted muscle (Johansson and Sojka, 1991; Elert et al., 1992).Such a mechanism could have rendered Group I moresensitive to pressure during the PPT test, due to previoussensitisation. However, the present research has onlyslight indications of the existence of chronic pain amongthe subjects. No signi"cant morning di!erences in PPTwere found between groups, although group I did report
more pain in their feet over the previous three months.The morning PPT di!erence should be studied witha larger sample size.
Another mechanism that may produce pain is connect-ive tissue stretching or creep. (Nordin and Frankel, 1980).Loading of connective tissue leads to slow deformation,which can lead to some considerable pain (Harms-Rin-gdahl, 1983). This mechanism may be responsible for footpain recorded after periods of standing (Hansen et al.,1998). Evidence suggesting this explanation are the distri-bution of PPT changes over the plantar surface, withconcentration at the inner parts of the longitudinal arch.This leads us to suggest that the pain may emerge fromprolonged loading of the connective tissues, stretchingthe ligaments supporting the longitudinal and transver-sal arches. These e!ects of loading could be accentuatedby distortion from uncomfortable shoes and contact withhard #oors.
Studies of connective tissue and creep have mainlybeen animal experiments. PPT and distribution of pres-sure under the foot (Hennig and Rosenbaum, 1991) couldalso be followed over the workday among subjects whostand.
4.2. Measurement of standing postures
Another "nding was that workers did not stand com-pletely still. Average standing time was 7 s. Results foundfor North American bank tellers using a less rigorousde"nition of standing were an average of 15}20 s betweenwalking episodes (Seifert et al., 1997).
Distinguishing between standing and walking is noteasy for ergonomists or workers. Subjective reportsare not thought to be reliable. According to Baty et al.(1986), workers' ability to estimate time spent accordingto body posture has been shown to be good forstanding/walking but poor when the two are separated(Buckle et al., 1986). Compared to observers, workersgreatly overestimate walking time and underestimatestanding time by a similar factor (Baty et al., 1986).Based on similar results, large population studies rarelyseparate standing and walking in their questionnaires(Wiktorin et al., 1993).
Observations have used several techniques. Ped-ometers are not reliable at low walking speeds (Selin andWinkel, 1994). Step counting has been used to character-ise standing/walking, de"ning walking as `a shift ofweight from one foot to the other with simultaneoushorizontal movement of the foota (Selin and Winkel,1994).
We used a similar de"nition to score total time walk-ing, with the help of an event register. However, thismethod does not, in our view, present accurate measure-ments when a large proportion of steps occur in se-quences of one or two steps. This is the situation with thegroups of kitchen and sales workers. The time taken to
88 K. Messing, As . Kilbom / Applied Ergonomics 32 (2001) 81}90
punch in the appropriate code on the event register is ofthe same order of magnitude as the duration of morethan half of the walking sequences. Because of this, wehave probably underestimated total time standing.
Our estimate of 1516 steps h~1, assuming that it can beextrapolated from a total of 6 h of observation, fallstoward the high end of the groups studied by Selin andWinkel (range of 100 steps h~1 for medical secretaries,who usually sat, to 1800 steps h~1 for furniture movers).However, allowing even a large stride (for a woman) of0.70metres step~1, this is a slow walking speed of about1 kmh~1. This slow, short-distance walking may bea fairly common pattern among those whose jobs requirethem to stand in a limited area.
5. Conclusion
PPT changes on the plantar surface over the work daymay be an indicator of the e!ects of standing postures atwork. The present study found greater PPT changes andmore discomfort among workers who spent more timestanding. However, the exact dimension of standing workresponsible for the increased pain sensitivity is not clear.Among those who work standing, patterns di!er by pro-portion of time walking, speed of walking, proportion ofshort walking sequences, distance covered per walkingsequence, and time between sequences. The e!ects ofthese variables on perceived discomfort and PPT shouldbe explored.
Acknowledgements
We thank Carina KaK ll for excellent technical assist-ance and France Tissot for statistical analysis. We aregrateful for the advice of Bertrand Fournier of theData Analysis Consultation Service (SCAD) of theUniversiteH du QueH bec a MontreH al. We thank GoK ranHaK gg, Jorgen Winkel and Margareta TorgeH n for helpfuldiscussions and Laura Punnett for useful references.Support for the project was provided by the NationalInstitute for Working Life of Sweden and the FondsFCAR. KM is a member of the research team `l'Invisiblequi fait mala supported by the Quebec Council for SocialResearch.
References
Antonaci, F., Sand, T., Lucas, G.A., 1998. Pressure algometry in healthysubjects: Inter-examiner variability. Scand. J. Rehab. Med. 30, 3}8.
Baty, D., Buckle, P.W., Stubbs, D.A., 1986. Posture recording by directobservation, questionnaire assessment and instrumentation: a com-parison based on a recent "eld study. In: Corlett, N., Wilson, J.,Manenica, I. (Eds.), The Ergonomics of Working Postures: Models,Methods and Cases. Taylor & Francis, London, pp. 283}292.
Brennum, J., Kjeldsen, M., Jensen, K., Jensen, T., 1989. Measurementsof human pain-pressure thresholds on "ngers and toes. Pain 38,211}217.
Buckle, P.W., Stubbs, D.A., Baty, D., 1986. Musculo-skeletal disorders(and discomfort) and associated work factors. In: Corlett, N.,Wilson, J., Manenica, I. (Eds.), The Ergonomics of WorkingPostures: Models, Methods and Cases. Taylor & Francis, London,pp. 19}30.
BystroK m, S., Hall, C., Welander, T., Kilbom, As ., 1995. Clinical disordersand pressure-pain threshold of the forearm/hand among automo-bile assembly line workers. J. Hand Surg. 208, 782}790.
Cavanaugh, P., Rodgers, M.M., 1987. The arch index: a useful measurefrom footprints. J. Biomech. 20 (5), 547}551.
Corlett, E.N., Bishop, R.P., 1976. A technique for assessing posturaldiscomfort. Ergonomics 19, 175}182.
Deane, L., 1901. Annual Report of Her Majesty's Women Inspectors1900. Parliamentary Paper, England, pp. 391}395. Cited by Har-rison, B., 1996. Not only the `Dangerous Tradesa. Women's Workand Health in Britain 1880}1914. Taylor and Francis, London.
Derrienic, F., Touranchet, A., Volko!, S., 1996. Age, travail, santeH :ED tudes sur les salarieH s a( geH s de 37 a 52 ans. Les eH ditions INSERM,Paris, p. 388.
Edwards, R.H.T., 1988. Hypotheses of peripheral and central mecha-nisms underlying occupational muscle pain and injury. Eur. J. Appl.Physiol. 57, 275}281.
Elert, J., Brulin, C., Gerdle, B., Johannson, H., 1992. Mechanical perfor-mance, level of continuous contraction and muscle pain symptomsin home care personnel. Scand. J. Rehab. Med. 24, 141}150.
Fransson-Hall, C., Gloria, R., Winkel, J., Kilbom, A., Karlqvist, L.,Wiktorin, C., 1995. A portable ergonomic observation method(PEO) for computerized on-line recording of postures and manualhandling. Appl. Ergon. 26, 93}100.
Fransson-Hall, C., Kilbom, As ., 1993. Sensitivity of the hand to surfacepressure. Appl. Ergon. 24, 181}189.
Gacia-Fondan, M., 1992. Travailler debout: L'exemple du coi!eur.Performances Hum. Tech. 60, 32}42.
Goodwin, A., Wheat, H.N., 1992. Magnitude estimation of contactforce when objects with di!erent shapes are added passively to the"ngerpad. Somatosensory Motor Res. 9, 339}344.
HaK gg, G.M., As stroK m, A., 1997. Load pattern and pressure-pain thre-shold in the upper trapezius muscle and psychosocial factors inmedical secretaries with and without shoulder-neck disorders. Int.Arch. Occup. Environ. Health 69, 423}432.
Hall, C., 1995. Hand function with special regard to work with tools.Arbete och HaK lsa 4. ArbetsmiljoK institutet, Stockholm.
Hansen, L., Winkel, J., J+rgenson, K., 1998. Signi"cance of mat andshoe softness during prolonged work in upright position. Appl.Ergon. 29 (3), 217}224.
Harms-Ringdahl, K., 1983. Discomfort and pain from loaded passivejoint structures. Scand. J. Rehab. Med. 15, 205}211.
Hennig, E.M., Rosenbaum, D., 1991. Pressure distribution patternsunder the feet of children in comparison with adults. Foot Ankle 11(5), 306}311.
Kilbom, As ., 1971. Physical training with submaximal intensities inwomen, III. E!ect on adaptation to professional work. Scand. J.Clin. Lab. Invest. 28 (3), 331}343.
Kosek, E., Ekholm, J., Nordemar, R., 1993. A comparison of pressure-pain thresholds in di!erent tissues and body regions. Scand. J.Rehab. Med. 25, 117}124.
Krijnen, R.M.A., 1997. Epidemiology of venous disorders in thegeneral and occupational populations. Epidemiol. Rev. 19 (2),294}309.
Jensen, K., 1986. Pressure-pain threshold in the human temporalregion. Evaluation of a new pressure algometer. Pain 25,313}323.
Johansson, L., Kjellberg, A., Kilbom, As ., HaK gg, G., 1999. Perception ofsurface pressure applied to the hand. Ergonomics 42, 1274}1282.
K. Messing, As . Kilbom / Applied Ergonomics 32 (2001) 81}90 89
Johansson, H., Sojka, P., 1991. Pathophysiological mechanisms in-volved in genesis and spread of muscular tension in occupationalmuscule pain and in chronic musculoskeletal pain syndromes: a hy-pothesis. Med. Hypotheses 35, 196}203.
Nordin, M., Frankel, V.H., 1980. Biomechanics of collagenous tissues.In: Frankel, V.H., Nordin, M. (Eds.), Basic Biomechanics of theSkeletal System. Lea & Febiger, Philadelphia, pp. 87}110.
Ohrbach, R., Crow, H., Kamer, A., 1998. Examiner expectancy e!ects inthe measurement of pressure pain thresholds. Pain 74, 163}170.
Riley, J.R., Robinson, M.E., Wise, E.A., Myers, C.D., Fillingim, R.B.,1998. Sex di!erences in the perception of noxious experimentalstimuli: a meta-analysis. Pain 74, 181}187.
Ryan, G.A., 1989. The prevalence of musculo-skeletal symptoms insupermarket workers. Ergonomics 32 (4), 359}371.
Seifert, A.M., Messing, K., Dumais, L., 1997. Star wars and strategicdefense initiatives: work activity and health symptoms of unionizedbank tellers during work reorganization. Int. J. Health Services 27(3), 455}477.
Sejersted, O.M., Westgaard, R.H., 1988. Occupational muscle pain andinjury: scienti"c challenge. Eur. J. Appl. Physiol. 57, 271}274.
Selin, K., Winkel, J., Stockholm-MUSIC I Study Group, 1994. Evalu-ation of two instruments for recording sitting and standing posturesand number of foot steps. Appl. Ergon. 25 (1), 41}46.
Seo, A., Kakehashi, M., Udu, S., Tsuru, S., Yoshinaga, F., 1995. Bioelec-trical impedance measuring method for standing load evaluation. J.Occup. Health (Jpn. ) 37, 83}87.
VeH zina, N., Geo!rion, L., Chatigny, C., Messing, K., 1994. A manualmaterials handling job: symptoms and working conditions amongsupermarket cashiers. Chronic Dis. Can. 15 (1), 17}22.
Whitstance, R.S., Adams, L.P., van Geems, B.A., Bridger, R.S., 1995.Postural adaptations to workbench modi"cations in standingworkers. Ergonomics 38 (12), 2485}2503.
Wiktorin, C., Hjelm, E.W., Karlqvist, L., Nyga> rd, C., Winkel, J., 1991.Exponiering i arbete och under fritid enlight enkaK t och intervjui StockholmsundersoK kningen. In: Hagberg, M., Hogstedt, C.(Eds.), StockholmsundersoK kningen. MUSIC Books, Stockholm,pp. 51}54.
Wiktorin, C., Karlqvist, L., Winkel, J., 1993. Validity of self-reportedexposures to work postures and manual materials handling. Scand.J. Work Environ. Health 19 (3), 208}214.
Winkel, J., 1982. An ergonomic evaluation of foot complaints amongwaiters as a basis for job design. Proceedings of the 8th Congress ofthe International Ergonomics Association, Tokyo, Japan, August23}27. Intergroup Corp., Kageyu Noro, pp. 630}631.
90 K. Messing, As . Kilbom / Applied Ergonomics 32 (2001) 81}90