Stalking Victimization, 2016
17
U.S. Department of Justice Office of Justice Programs Bureau of Justice Statistics APRIL 2021 NCJ 253526 Special Report Stalking Victimization, 2016 Jennifer L. Truman, Ph.D., and Rachel E. Morgan, Ph.D., BJS Statisticians I n 2016, an estimated 1.5% of all U.S. residents age 16 or older (3.8 million persons) were victims of stalking (fgure 1, table 1). Stalking is repeated unwanted contacts or behaviors that either cause the victim to experience fear or substantial emotional distress or that would cause a reasonable person to experience fear or substantial emotional distress. Most persons reported experiencing both stalking with technology and traditional stalking (0.7%). A greater percentage reported experiencing stalking with technology only (0.5%) than traditional stalking only (0.3%). Findings are based on the 2016 Supplemental Victimization Survey (SVS) to the National Crime Victimization Survey (NCVS). From July of 2016 to December of 2016, the SVS asked persons age 16 or older about their experiences with stalking during the 12 months preceding the interview. Te report details the demographic characteristics of victims who were stalked during a 12-month period. It also describes the nature of stalking victimization, including the number of ofenders, the victim-ofender relationship, and the frequency and duration of the stalking. FIGURE 1 Prevalence of stalking, by type of stalking, 2016 Percent of all persons age 16 or older 1.6 1.4 1.2 1.0 0.8 0.6 0.4 0.2 0.0 0.5 † 0.3 † 1.5 0.7 Total Traditional stalking Stalking with Both traditional only a technology only b stalking and stalking with technology* Note: Estimates include 95% confdence intervals. See appendix table 1 for estimates and standard errors. *Comparison group. †Diference with comparison group is signifcant at the 95% confdence level. a Includes victims who only experienced the following types of unwanted behaviors: following; sneaking into, waiting at, or showing up at a place; leaving or sending unwanted items; or harassing friends or family about the victim’s whereabouts. b Includes victims who only experienced the following types of unwanted behaviors: making unwanted phone calls, leaving voice mail messages, or sending text messages; spying using technology; tracking the victim’s whereabouts with an electronic tracking device or application; posting or threatening to post unwanted information on the internet; sending emails or messages using the internet; or monitoring activities using social media. Source: Bureau of Justice Statistics, National Crime Victimization Survey, Supplemental Victimization Survey, 2016. HIGHLIGHTS About 1.5% (3.8 million) of persons age 16 or older were victims of stalking in 2016. A greater percentage of persons age 16 or older experienced stalking with technology only (0.5%) than traditional stalking only (0.3%). Females were stalked more than twice as often (2.0%) as males (0.9%). Most victims of stalking (69%) knew their ofender in some capacity. Victims were three times as likely to be stalked by ex-intimate partners (21%) as by current intimate partners (7%). Twenty-four percent of stalking victims said the stalking behaviors lasted 2 years or more. About 1 in 10 victims said it happened too many times to count. Stalking behaviors were still ongoing at the time of the interview for more than a quarter all victims.
-
Upload
khangminh22 -
Category
Documents
-
view
3 -
download
0
Transcript of Stalking Victimization, 2016

U.S. Department of Justice Office of Justice Programs Bureau of Justice Statistics
APRIL 2021 NCJ 253526
Special Report
Stalking Victimization, 2016 Jennifer L. Truman, Ph.D., and Rachel E. Morgan, Ph.D., BJS Statisticians
In 2016, an estimated 1.5% of all U.S. residents age 16 or older (3.8 million persons) were victims of stalking (fgure 1, table 1). Stalking is repeated
unwanted contacts or behaviors that either cause the victim to experience fear or substantial emotional distress or that would cause a reasonable person to experience fear or substantial emotional distress. Most persons reported experiencing both stalking with technology and traditional stalking (0.7%). A greater percentage reported experiencing stalking with technology only (0.5%) than traditional stalking only (0.3%).
Findings are based on the 2016 Supplemental Victimization Survey (SVS) to the National Crime Victimization Survey (NCVS). From July of 2016 to December of 2016, the SVS asked persons age 16 or older about their experiences with stalking during the 12 months preceding the interview. Te report details the demographic characteristics of victims who were stalked during a 12-month period. It also describes the nature of stalking victimization, including the number of ofenders, the victim-ofender relationship, and the frequency and duration of the stalking.
FIGURE 1 Prevalence of stalking, by type of stalking, 2016 Percent of all persons age 16 or older 1.6 1.4 1.2 1.0 0.8 0.6 0.4 0.2 0.0
0.5 †
0.3 †
1.5
0.7
Total Traditional stalking Stalking with Both traditional onlya technology onlyb stalking and stalking
with technology*
Note: Estimates include 95% confdence intervals. See appendix table 1 for estimates and standard errors. *Comparison group. †Diference with comparison group is signifcant at the 95% confdence level. aIncludes victims who only experienced the following types of unwanted behaviors: following; sneaking into, waiting at, or showing up at a place; leaving or sending unwanted items; or harassing friends or family about the victim’s whereabouts. bIncludes victims who only experienced the following types of unwanted behaviors: making unwanted phone calls, leaving voice mail messages, or sending text messages; spying using technology; tracking the victim’s whereabouts with an electronic tracking device or application; posting or threatening to post unwanted information on the internet; sending emails or messages using the internet; or monitoring activities using social media. Source: Bureau of Justice Statistics, National Crime Victimization Survey, Supplemental Victimization Survey, 2016.
HIGHLIGHTS � About 1.5% (3.8 million) of persons age 16 or older
were victims of stalking in 2016.
� A greater percentage of persons age 16 or olderexperienced stalking with technology only (0.5%)than traditional stalking only (0.3%).
� Females were stalked more than twice as often (2.0%)as males (0.9%).
� Most victims of stalking (69%) knew their ofender insome capacity.
� Victims were three times as likely to be stalked byex-intimate partners (21%) as by current intimatepartners (7%).
� Twenty-four percent of stalking victims said thestalking behaviors lasted 2 years or more.
� About 1 in 10 victims said it happened too manytimes to count.
� Stalking behaviors were still ongoing at the time ofthe interview for more than a quarter all victims.

2 STALKING VICTIMIZATION, 2016 | APRIL 2021
An estimated 2.5 million persons age 16 or older experienced traditional stalking, and 3.1 million experienced stalking with technology (table 1).
About 1.8 million persons age 16 or older experienced both traditional stalking and stalking with technology.
TABLE 1 Prevalence of stalking, by type of stalking, 2016
Number of victimsa
Total 3,788,800
Percent of all personsb
1.5%
Standard error Percent of all
Number of victims persons 117,999 0.05%
Any traditional stalkingc 2,472,440 1.0% 95,410 0.04% Traditional stalking only
Any stalking with technologyd 703,250
3,085,550 0.3
1.2% 50,883
106,545 0.02 0.04%
Stalking with technology only 1,316,360 0.5 69,637 0.03 Both traditional stalking and stalking with technology 1,769,190 0.7% 80,729 0.03% Note: Details may not sum to totals because victims could experience more than one type of stalking. Total population age 16 or older was 256,432,020. aNumber of persons age 16 or older who experienced stalking victimization in the past year.bPercentage of persons age 16 or older who experienced stalking victimization in the past year. cIncludes the following types of unwanted behaviors: following; sneaking into, waiting at, or showing up at a place; leaving or sending unwanted items; or harassing friends or family about the victim’s whereabouts. dIncludes the following types of unwanted behaviors: making unwanted phone calls, leaving voice messages, or sending text messages; spying using technology; tracking the victim’s whereabouts with an electronic tracking device or application; posting or threatening to post unwanted information on the internet; sending emails or messages using the internet; or monitoring activities using social media. Source: Bureau of Justice Statistics, National Crime Victimization Survey, Supplemental Victimization Survey, 2016.
Measuring stalking victimization To be classifed as a victim of stalking in the Supplemental Victimization Survey (SVS), the respondent must have experienced a repeated course of conduct (i.e., experiencing the same behavior or contact more than once or experiencing two or more diferent behaviors one time) that either—
� caused them substantial emotional distress or to fear for their safety or the safety of someone they know (actual fear)
� would cause a reasonable person to fear for their safety or the safety of someone they know.
Reasonable fear includes victimizations where the victim reported that they experienced either—
� damage, attempted damage, or destruction of property
� threatened, attempted, or completed attacks on the victim, someone close to them, or a pet.
The SVS measured 12 types of stalking behaviors, incorporating both traditional stalking and stalking with technology.
Traditional stalking includes the following unwanted behaviors:
� following and watching
� sneaking into a place
� waiting at a place
� showing up at a place
� leaving or sending unwanted items
� harassing friends or family about the victim’s whereabouts.
Stalking with technology includes the following unwanted behaviors:
� making unwanted phone calls, leaving voice messages, or sending text messages
� spying using technology
� tracking the victim’s whereabouts with an electronic tracking device or application
� posting or threatening to post unwanted information on the internet
� sending unwanted emails or messages using the internet
� monitoring activities using social media.
See Methodology for the SVS questions used to measure actual fear, substantial emotional distress, reasonable fear, and the types of unwanted behaviors that victims experienced.
Continued on next page

3 STALKING VICTIMIZATION, 2016 | APRIL 2021
Measuring stalking victimization (continued) Of the 3.8 million stalking victims in 2016, more than 2.2 million (59%) experienced fear and 2.4 million (64%) experienced substantial emotional distress (table 2). About 2.0 million victims (52%) had an experience that
would, by defnition, cause a reasonable person to experience fear, including reporting property damage or an attack.
TABLE 2 Number and percent of stalking victims, by component of stalking, 2016
Stalking component Total
Number of victimsa
3,788,800 Percent of victims
100%
Standard error Number of victims Percent of victims
117,999 ~ Actual fearb* 2,228,230 58.8% 90,586 1.54% Substantial emotional distressc 2,418,770 63.8% † 94,371 1.50% Reasonable feard 1,960,020 † 51.7% † 84,968 1.56%
Damage/attempted damage/destruction of property* 713,340 18.8 51,247 1.22
Threatened/attempted/completed attack against victim 486,280 † 12.8 † 42,299 1.04
Threatened/attempted/completed attack against pet/someone close to victim 167,350 † 4.4 † 24,793 0.64
Two or more reasonable fear componentse 593,050 ‡ 15.7 ‡ 46,720 1.13 Note: Details may not sum to totals because victims could experience more than one component of stalking. *Comparison group. †Diference with comparison group is signifcant at the 95% confdence level. ‡Diference with comparison group is signifcant at the 90% confdence level. ~Not applicable. aNumber of persons age 16 or older who experienced stalking victimization in the past year. bIncludes stalking where the victim reported that the unwanted behaviors made them fear for their safety or the safety of someone close to them. cIncludes stalking where the victim reported that the unwanted behaviors caused them substantial emotional distress. dIncludes stalking that involved damage, attempted damage, or destruction of property; or threatened, attempted, or completed attacks against the victim, a pet, or someone close to the victim. eIncludes stalking that involved two or more reasonable fear components (i.e., damage, attempted damage, or destruction of property or threatened, attempted, or completed attacks against the victim, a pet, or someone close to the victim). Source: Bureau of Justice Statistics, National Crime Victimization Survey, Supplemental Victimization Survey, 2016.

4 STALKING VICTIMIZATION, 2016 | APRIL 2021
59% of traditional-stalking victims in 2016 said the ofender followed and watched them
Te most frequently reported traditional stalking behaviors included the ofender following and watching the victim (59%) or showing up at, riding by, or driving by places where the ofender had no business being (52%) (table 3). More than a third of victims
of traditional stalking reported that the ofender harassed their friends or family for information about their whereabouts (40%) or waited for them at home, school, or another place (36%). About 1 in 5 victims of traditional stalking said the ofender lef or sent unwanted items (24%) or snuck into their home, car, or other place (19%).
TABLE 3 Number and percent of victims of traditional stalking, by type of stalking behavior, 2016 Stalking behavior Number of victimsa Percent of victims Percent of all personsb
Total traditional stalking 2,472,440 100% 1.0% Followed victim around/watched victim 1,450,740 58.7 0.6 Showed up at/rode by/drove by places victim was when the ofender had
no business being there 1,283,540 51.9 0.5 Harassed/repeatedly asked victim’s friends/family for information about
their whereabouts 996,710 40.3 0.4 Waited for victim at home/work/school/any other place when victim did
not want them to be there 901,480 36.5 0.4 Left/sent victim unwanted items/cards/letters/presents/fowers 604,000 24.4 0.2 Sneaked into victim’s home/car/any other place and did things to let victim
know they had been there 472,990 19.1 0.2 Note: Details may not sum to totals because a victim could experience more than one behavior of traditional stalking. Total population age 16 or older was 256,432,020. See appendix table 2 for standard errors. aNumber of persons age 16 or older who experienced stalking victimization in the past year.bPercentage of persons age 16 or older who experienced stalking victimization in the past year. Source: Bureau of Justice Statistics, National Crime Victimization Survey, Supplemental Victimization Survey, 2016.

5 STALKING VICTIMIZATION, 2016 | APRIL 2021
67% of victims of stalking with technology said the ofender used the phone to excessively contact them in 2016
Sixty-seven percent of victims of stalking with technology received unwanted phone calls, voice messages, or text messages (67%), while 50% received unwanted emails or messages via the internet (table 4). About 35% of victims said their activities were monitored using social media. Twenty-seven
percent of victims experienced the ofender posting or threatening to post inappropriate, unwanted, or personal information about them on the internet. Nineteen percent of victims of stalking with technology said the ofender spied on them or monitored their activities using technologies such as listening devices, cameras, or computer or cellphone monitoring sofware. Nine percent of victims were tracked with an electronic tracking device or application.
TABLE 4 Number and percent of victims of stalking with technology, by type of stalking behavior, 2016 Stalking behavior Number of victimsa Percent of victims Percent of all personsb
Total stalking with technology 3,085,550 100% 1.2% Made unwanted calls to victim/left voice messages/sent text messages/used
telephone to excessively contact victim 2,070,400 67.1 0.8 Sent victim unwanted emails/messages using the internet or social media apps/
websites like Instagram/Twitter/Facebook 1,542,570 50.0 0.6 Monitored victim’s activities using social media apps/websites like Instagram/
Twitter/Facebook 1,067,800 34.6 0.4 Posted/threatened to post inappropriate/unwanted/personal information about
victim on internetc 818,550 26.5 0.3 Spied on victim/monitored victim’s activities using technologies such as a
listening device, a camera, or computer/cellphone monitoring software 585,770 19.0 0.2 Tracked victim’s whereabouts with electronic device/application such as GPS/
app on victim’s cellphone 283,630 9.2 0.1 Note: Details may not sum to totals because a victim could experience more than one behavior of stalking with technology. Total population age 16 or older was 256,432,020. See appendix table 3 for standard errors. aNumber of persons age 16 or older who experienced stalking victimization in the past year.bPercentage of persons age 16 or older who experienced stalking victimization in the past year. cIncludes posting private photographs, videos, or rumors. Source: Bureau of Justice Statistics, National Crime Victimization Survey, Supplemental Victimization Survey, 2016.
6 STALKING VICTIMIZATION, 2016 | APRIL 2021
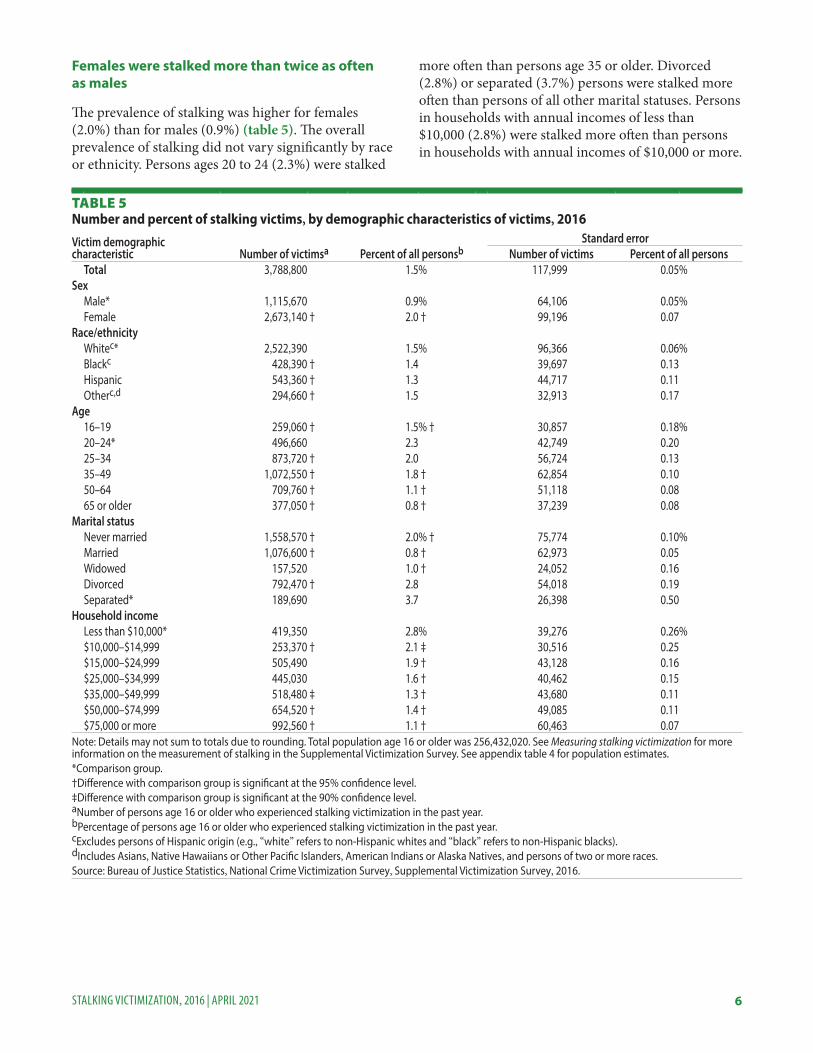
Females were stalked more than twice as often as males
Te prevalence of stalking was higher for females (2.0%) than for males (0.9%) (table 5). Te overall prevalence of stalking did not vary signifcantly by race or ethnicity. Persons ages 20 to 24 (2.3%) were stalked
more ofen than persons age 35 or older. Divorced (2.8%) or separated (3.7%) persons were stalked more ofen than persons of all other marital statuses. Persons in households with annual incomes of less than $10,000 (2.8%) were stalked more ofen than persons in households with annual incomes of $10,000 or more.
TABLE 5 Number and percent of stalking victims, by demographic characteristics of victims, 2016 Victim demographic characteristic Number of victimsa Percent of all personsb
Standard error Number of victims Percent of all persons
Total 3,788,800 1.5% 117,999 0.05% Sex
Male* 1,115,670 0.9% 64,106 0.05% Female 2,673,140 † 2.0 † 99,196 0.07
Race/ethnicity Whitec* 2,522,390 1.5% 96,366 0.06% Blackc 428,390 † 1.4 39,697 0.13 Hispanic 543,360 † 1.3 44,717 0.11 Otherc,d 294,660 † 1.5 32,913 0.17
Age 16–19 259,060 † 1.5% † 30,857 0.18% 20–24* 496,660 2.3 42,749 0.20 25–34 873,720 † 2.0 56,724 0.13 35–49 1,072,550 † 1.8 † 62,854 0.10 50–64 709,760 † 1.1 † 51,118 0.08 65 or older 377,050 † 0.8 † 37,239 0.08
Marital status Never married 1,558,570 † 2.0% † 75,774 0.10% Married 1,076,600 † 0.8 † 62,973 0.05 Widowed 157,520 1.0 † 24,052 0.16 Divorced 792,470 † 2.8 54,018 0.19 Separated* 189,690 3.7 26,398 0.50
Household income Less than $10,000* 419,350 2.8% 39,276 0.26% $10,000–$14,999 253,370 † 2.1 ‡ 30,516 0.25 $15,000–$24,999 505,490 1.9 † 43,128 0.16 $25,000–$34,999 445,030 1.6 † 40,462 0.15 $35,000–$49,999 518,480 ‡ 1.3 † 43,680 0.11 $50,000–$74,999 654,520 † 1.4 † 49,085 0.11 $75,000 or more 992,560 † 1.1 † 60,463 0.07
Note: Details may not sum to totals due to rounding. Total population age 16 or older was 256,432,020. See Measuring stalking victimization for more information on the measurement of stalking in the Supplemental Victimization Survey. See appendix table 4 for population estimates. *Comparison group. †Diference with comparison group is signifcant at the 95% confdence level. ‡Diference with comparison group is signifcant at the 90% confdence level. aNumber of persons age 16 or older who experienced stalking victimization in the past year.bPercentage of persons age 16 or older who experienced stalking victimization in the past year. cExcludes persons of Hispanic origin (e.g., “white” refers to non-Hispanic whites and “black” refers to non-Hispanic blacks). dIncludes Asians, Native Hawaiians or Other Pacifc Islanders, American Indians or Alaska Natives, and persons of two or more races. Source: Bureau of Justice Statistics, National Crime Victimization Survey, Supplemental Victimization Survey, 2016.

7 STALKING VICTIMIZATION, 2016 | APRIL 2021
Most stalking victims knew their ofender
One ofender committed the unwanted contacts and behaviors for more than half of stalking victims (table 6). Most stalking victims said they knew the ofender. In 2016, 69% of victims of stalking knew their ofender in some capacity. Victims were more likely to be stalked by a well-known or casual acquaintance (36%) or a current or ex-intimate partner (27%) than by some other relative (6%).1
1Intimate partners includes current or former spouses or partners, boyfriends or girlfriends, or other romantic or sexual partners.
Victims were three times more likely to be stalked by an ex-intimate partner (21%) than a current intimate partner (7%). A greater portion of victims were stalked by ex-intimate partners than by persons of all other victim-ofender relationships.
In 2016, about 17% of victims were stalked by a stranger. About 13% of victims were unable to identify their relationship to the ofender.
TABLE 6 Percent of stalking victims, by number of ofenders and victim-ofender relationship, 2016
Total stalking Standard error Total 100% ~
Number of ofenders One* 56.9% 1.55% Two or more 33.6 † 1.47 Unknown 9.2 † 0.90
Victim-ofender relationshipa
Known 69.4% 1.44% Intimate partnerb 27.4 1.39
Current partner 6.8 † 0.78 Ex-partner* 20.7 1.26
Other relative 6.0 † 0.74 Well-known/casual acquaintance 36.0 † 1.50
Friend/ex-friend 7.5 † 0.82 Acquaintance/in-law or relative of spouse or ex-spouse/friends of ofender 10.1 † 0.94 Roommates/housemates/boarders/neighbors 6.6 † 0.77 Professional acquaintancesc 7.7 † 0.83 Other 4.1 † 0.62
Strangers 16.9 † 1.17 Unknown relationship 12.9 † 1.04
Number of victims 3,788,800 117,999 Note: Details may not sum to totals due to missing data. See Measuring stalking victimization for more information on the measurement of stalking in the Supplemental Victimization Survey. *Comparison group. †Diference with comparison group is signifcant at the 95% confdence level. ~Not applicable. aIncludes characteristics for single and multiple ofenders. For multiple ofenders, victims were asked if the ofenders worked alone or together as a team. If the ofender worked alone, victims were asked about the ofender who had stalked them most recently. If ofenders acted together, victims were asked if there was one who was most responsible. Victims were asked about the one ofender’s or the multiple ofenders’ characteristics. If the victims did not know the number of ofenders, they were asked to focus on the most recent person who had stalked them. bIncludes current or former spouses or partners, boyfriends or girlfriends, or other romantic or sexual partners. cIncludes schoolmates, supervisors (current or former), co-workers (current or former), teachers or school staf, customers or clients, patients, students, and employees (current or former). Source: Bureau of Justice Statistics, National Crime Victimization Survey, Supplemental Victimization Survey, 2016.

8 STALKING VICTIMIZATION, 2016 | APRIL 2021
Nearly a quarter of stalking victims said the stalking behaviors lasted 2 years or more
Forty-fve percent of stalking victims experienced stalking behaviors that lasted one month to less than one year (table 7). Twenty-four percent of victims said the stalking behaviors lasted 2 years or more. About 1% of victims did not know how long they had been stalked.
For more than half (57%) of stalking victims, the stalking behaviors occurred 2 to 10 times during the victimization. About 1 in 10 victims said the stalking behaviors happened too many times to count. More than 5% of stalking victims did not know or could not remember how many times the behaviors had occurred.
At the time of the interview, stalking behaviors were still going on for more than a quarter of victims (table 8). In cases where the stalking behaviors had stopped, 51% of the victims took measures to stop the behaviors. Tese measures included changing or blocking a phone number, email, or social media account or getting a new phone or computer; talking to the ofender; moving; getting a restraining, protection, or no-contact order; or getting married or starting a new relationship. Changing or blocking a phone number, email, or social media account or getting a new phone or computer (23%) was the most common measure victims took that stopped stalking behaviors. About 20% of victims said the behaviors stopped because someone intervened, such as a friend or relative, police, or others.
TABLE 7 Percent of stalking victims, by duration and frequency of stalking, 2016
Total stalking Standard error Total 100% ~
Duration Less than 1 month 16.6% 1.16% 1 month to less than 1 year 45.3 1.55 1 year to less than 2 years 12.5 1.03 2 years or more 23.9 1.33 Unknown 1.2 0.34
Frequency 2 to 10 timesa 57.4% 1.54% 11 to 50 times 18.7 1.21 More than 50 times 7.9 0.84 Too many times to count 9.4 0.91 Don't know/don't remember
number of times 5.6 0.72
Number of victims 3,788,800 117,999 Note: Details may not sum to totals due to rounding and missing data. See Measuring stalking victimization for more information on the measurement of stalking in the Supplemental Victimization Survey. ~Not applicable. aUnwanted contacts or behaviors had to happen more than once for the respondent to screen into the Supplemental Victimization Survey. Source: Bureau of Justice Statistics, National Crime Victimization Survey, Supplemental Victimization Survey, 2016.

9 STALKING VICTIMIZATION, 2016 | APRIL 2021
TABLE 8 Percent of stalking victims, by whether the stalking was ongoing, 2016
Total stalking Standard error Total 100% ~
Stalking behaviors are still ongoing 28.3% 1.40% Stalking behaviors have stopped 62.0% 1.52
Reason why stalking behaviors have stopped 100% ~ Victim took measures to stop behaviors 50.8 1.98%
Changed/blocked phone number/email/social media account or got a new phone/computer 23.1 1.67
Talked to ofender 12.0 1.29 Moved 8.2 1.09 Got a restraining/protection/no-contact order 5.4 0.89 Got married/started a new relationship 2.2 0.57
Someone intervened 19.6 1.57 Friend/relative 6.9 1.00 Police 6.7 0.99 Othersa 6.0 0.94
Behaviors stopped because ofender— 14.0 1.37 Was arrested/incarcerated 5.2 0.88 Moved 3.9 0.77 Started a new relationship 3.1 0.68 Got help/counseling 1.8 0.52
Otherb 19.9 1.58 Unknown 20.8 1.61
Unknown whether stalking behaviors are still ongoing 8.6% 0.87%
Number of victims 3,788,800 117,999 Note: Details may not sum to totals due to rounding and missing data and because a victim could select more than one reason that the stalking stopped. See Measuring stalking victimization for more information on the measurement of stalking in the Supplemental Victimization Survey. ~Not applicable. aIncludes employer; school ofcial, faculty, or staf; clergy or faith leader; or some other person.bIncludes the ofender died and other reasons why the stalking behaviors stopped. Source: Bureau of Justice Statistics, National Crime Victimization Survey, Supplemental Victimization Survey, 2016.

10 STALKING VICTIMIZATION, 2016 | APRIL 2021
Methodology Data collection
Te Supplemental Victimization Survey (SVS) is a supplement to the National Crime Victimization Survey (NCVS) that the U.S. Census Bureau carries out for the Bureau of Justice Statistics (BJS). Te NCVS collects data on crimes reported or not reported to police against persons age 12 or older from a nationally representative sample of U.S. households. Te sample includes persons living in group quarters (such as dormitories, rooming houses, and religious-group dwellings) and excludes persons living in military barracks and in institutional settings (such as correctional or hospital facilities) and persons who are homeless.
From July 1, 2016 through December 31, 2016, persons age 16 or older in sampled NCVS households received the SVS at the end of the NCVS interview. Proxy responders to the NCVS interview did not receive the SVS. Unlike in 2006 when BJS frst administered the SVS, if the 2016 NCVS interview was conducted in a language other than English, the SVS interview could be conducted in that language, either by the interviewer or a reliable translator. All NCVS and SVS interviews were conducted using computer-assisted personal interviewing, either by telephone or in-person visit. Of the 126,500 original NCVS-eligible respondents age 16 or older, approximately 96,300 completed the SVS questionnaire, resulting in a response rate of 76.1%. Te SVS response rate is similar to the NCVS response rate.
Te combined SVS unit response rate for NCVS households, NCVS persons, and SVS persons was 58.3%. Because of the level of non-response, a bias analysis was conducted. Te results indicated that there was little or no substantive bias due to non-response in the SVS estimates.
Te SVS collected individual-level data on the prevalence of stalking victimization among persons, the characteristics of stalking victims, and the patterns of reporting to the police and other authorities. Respondents were asked whether they were stalked during the 12 months prior to the interview. For example, persons interviewed in July 2016 were asked about stalking victimization that occurred between July 2015 and June 2016. Stalking victimizations are classifed by the year of the survey and not by the year of the victimization.
Persons who reported a stalking victimization were asked more detailed questions about their victimization and their responses to it, such as the victim-ofender relationship, physical and emotional consequences to the victim, self-protective measures taken, and the response of the criminal justice system. For most sections of the survey, the SVS asked stalking victims to think about the person or persons who committed these unwanted contacts or behaviors in the last 12 months when answering questions.
Changes to the measurement of stalking victimization in the SVS
BJS frst collected data from the SVS in 2006. Te supplement was designed in 2005, shortly before federal stalking laws changed under the Violence Against Women and Department of Justice Reauthorization Act of 2005 (VAWA). VAWA expanded the legal defnition of cyberstalking to include all communications via sofware that use the internet or internet-based technologies. Te law also expanded the victim-harm requirement to include substantial emotional harm to the victim in addition to actual or reasonable fear.2
2Violence Against Women and Department of Justice Reauthorization Act of 2005, 109 U.S.C. § 3402 et seq. (2005). https://www.gpo.gov/fdsys/pkg/BILLS-109hr3402enr/pdf/BILLS-109hr3402enr.pdf
In 2013, VAWA was amended to address presence, intimidation, substantial emotional distress, and cyberstalking.3
3Violence Against Women and Department of Justice Reauthorization Act of 2013, 113 U.S.C. § 2261A et seq. (2013). https://www.gpo.gov/fdsys/pkg/BILLS-113s47enr/pdf/BILLS-113s47enr.pdf
First, the law was expanded to apply to any person stalking another person within U.S. waters, territorial jurisdictions, or states. Second, the stalker’s intent previously had to be to kill, injure, harass, or place a person under surveillance, and this was expanded to include intimidation. Tird, the law was expanded to include acts that caused, were intended to cause, or would be reasonably expected to cause substantial emotional distress. Finally, the defnition of cyberstalking was expanded to include any electronic communication, including interstate and foreign electronic communication.
In 2015, BJS redesigned the 2006 SVS instrument to incorporate the 2005 and 2013 updates to VAWA. Te redesigned instrument began with a series of screener questions about each element of VAWA’s stalking defnition. Te screener included expanded questions about unwanted contacts and behaviors

11 STALKING VICTIMIZATION, 2016 | APRIL 2021
associated with traditional stalking and stalking with technology. Separate screener questions were also developed to measure victim responses of fear and substantial emotional distress. If the respondent’s answers identifed them as a stalking victim, the survey instrument included additional questions focused on details of the stalking victimization. In addition to the changes to the instrument, BJS lowered the minimum age of survey respondents from 18 to 16. Due to these changes, estimates from the 2016 SVS cannot be compared to estimates from the 2006 SVS.
Te 2016 SVS can be used to estimate stalking prevalence for persons age 16 or older in the U.S. Te expansions to the stalking screening questions allowed for better measurement of the types of stalking behaviors experienced by respondents, especially stalking with technology. Improvements to the questions about the stalking incident enhanced the ability to describe the characteristics of stalking victimizations.
Defning stalking victimization
Tere is no nationwide defnition of stalking victimization. However, the federal defnition and many state defnitions include similar components. In developing the SVS, BJS used the expertise of a range of federal (including the Department of Justice’s Ofce on Violence Against Women and Ofce for Victims of Crime) and private sources in the felds of criminal justice and victim services.
State stalking laws
Te federal government, the 50 states, and the District of Columbia have criminal laws to address stalking. However, the legal defnition of stalking varies across jurisdictions. State laws vary regarding defnitions of fear and emotional distress. Te 50 states and the District of Columbia specify that there must have been a repeated course of conduct (table 9).
In addition, criminal laws in the 50 states and the District of Columbia include the element of actual fear in their stalking defnition. Most states and the District of Columbia also include the element of reasonable fear, defned as behaviors that would cause a reasonable person to be fearful. Tree-quarters of the states and the District of Columbia include the element of emotional distress, which is consistent with changes in federal laws. About half of these states and the District of Columbia indicate that there may also be an element of reasonable emotional distress.
All state laws require actual fear, reasonable fear, emotional distress, or reasonable emotional distress to be present for the repeated course of conduct to be defned as stalking. Te laws vary regarding the standard and level of fear or emotional distress required, depending on what is included in the law and whether there are diferent classifcations of stalking.

TABLE 9 State criminal laws on stalking, by elements of the crime, 2018
State law addresses— Repeated course of conduct Actual fear Reasonable fear Actual emotional distress Reasonable emotional distress
Alabama Alaska -- -- --Arizona --Arkansas California --Colorado Connecticut Delaware District of Columbia Florida --Georgia --Hawaii -- -- --Idaho Illinois Indiana Iowa -- --Kansas -- --Kentucky Louisiana Maine Maryland -- --Massachusetts -- Michigan Minnesota -- --Mississippi -- --Missouri Montana --Nebraska -- -- --Nevada --New Hampshire -- --New Jersey New Mexico -- --New York --North Carolina North Dakota -- --Ohio --Oklahoma Oregon -- --Pennsylvania --Rhode Island South Carolina South Dakota -- --Tennessee Texas --Utah Vermont Virginia -- --Washington West Virginia Wisconsin Wyoming Note: For the behaviors to be defned as stalking, every state and the District of Columbia require a repeated course of conduct and actual fear, reasonable fear, emotional distress, or reasonable emotional distress to be present. State law includes this element. --State law does not include this element. Source: Data based on Bureau of Justice Statistics review of stalking laws in each state and the District of Columbia as of April 2018.

13 STALKING VICTIMIZATION, 2016 | APRIL 2021
Measuring stalking with the SVS
Because the SVS defnition of stalking is aligned with the federal defnition, to be classifed as a victim of stalking in the SVS, the respondent must have experienced a repeated course of conduct that caused them to experience fear or substantial emotional distress or that would cause a reasonable person to experience fear or substantial emotional distress. Te SVS screener questions collected the following elements of that defnition: (1) unwanted contacts or behaviors; (2) a repeated course of conduct (i.e., experiencing the same behavior or contact more than once or experiencing two or more diferent behaviors one time); (3) actual fear; (4) substantial emotional distress; and (5) reasonable fear.
Questions used to measure stalking behaviors
SQ1. In the past 12 months, have you experienced any unwanted contacts or behaviors? By that I mean has anyone—
a. Followed you around and watched you?
b. [Has anyone] Sneaked into your home, car, or any place else and did unwanted things to let you know they had been there?
c. [Has anyone] Waited for you at your home, work, school, or any place else when you didn’t want them to?
d. [Still thinking about unwanted contacts and behaviors, in the past 12 months, has anyone...] Showed up, rode or drove by places where you were when they had no business being there?
e. [Has anyone] Lef or sent unwanted items, cards, letters, presents, fowers, or any other unwanted items?
f. [Has anyone] Harassed or repeatedly asked your friends or family for information about you or your whereabouts?
Now I want to ask about unwanted contacts or behaviors using various technologies, such as your phone, the Internet, or social media apps. Again, please DO NOT include bill collectors, solicitors, or other sales people. In the past 12 months, has anyone—
g. Made unwanted phone calls to you, lef voice messages, sent text messages, or used the phone excessively to contact you?
h. [Has anyone] Spied on you or monitored your activities using technologies such as a listening device, camera, or computer or cell phone monitoring sofware?
i. [Still thinking about unwanted contacts or behaviors, in the past 12 months, has anyone...] Tracked your whereabouts with an electronic tracking device or application, such as GPS or an application on your cell phone?
j. [Has anyone] Posted or threatened to post inappropriate, unwanted, or personal information about you on the Internet, this includes private photographs, videos, or spreading rumors?
k. [Has anyone] Sent unwanted e-mails or messages using the Internet, for example, using social media apps or websites like Instagram, Twitter, or Facebook?
l. [Has anyone] Monitored your activities using social media apps like Instagram, Twitter, or Facebook?
Question used to measure repetition
SQ2. Has anyone done (this/any of these things) to you more than once in the past 12 months?
If the respondent answered ‘no’ to this question, but had experienced more than one of the stalking behaviors, the interview continued and they were asked about fear and emotional distress.
Questions used to measure actual fear and substantial emotional distress
SQ3a. Did any of these unwanted contacts or behaviors make you fear for your safety or the safety of someone close to you?
SQ3b. Did any of these unwanted contacts or behaviors cause you substantial emotional distress?
Questions used to measure reasonable fear
Now I have some additional questions about the time someone {behavior1}, {behavior2}, and {behaviorx…}. Tinking about the person or persons who committed these unwanted contacts or behaviors in the past 12 months, did any of the following occur—
SQ4. Did this person or these people damage or attempt to damage or destroy property belonging to you or someone else in your household?

14 STALKING VICTIMIZATION, 2016 | APRIL 2021
SQ5. [Tinking about the person or persons who committed these unwanted contacts or behaviors in the past 12 months…] Did this person or these people—
� Physically attack you?
� Attempt to attack you?
� Treaten to attack you?
SQ6. [Tinking about the person or persons who committed these unwanted contacts or behaviors in the past 12 months…] Did this person or these people—
� Physically attack someone close to you or a pet?
� Attempt to attack someone close to you or a pet?
� Treaten to attack someone close to you or a pet?
Standard error computations
When national estimates are derived from a sample, caution must be taken when comparing one estimate to another. Although one estimate may be larger than another, estimates based on a sample have some degree of sampling error. Te sampling error of an estimate depends on several factors, including the amount of variation in the responses and the size of the sample. When the sampling error around an estimate is accounted for, diferences in estimates may not be statistically signifcant.
One measure of the sampling error associated with an estimate is the standard error. Te standard error may vary from one estimate to the next. Generally, an estimate with a small standard error provides a more reliable approximation of the true value than an estimate with a larger standard error. Estimates with relatively large standard errors are associated with less precision and reliability and should be interpreted with caution.
Generalized variance functions (GVF) parameters were used to generate standard errors for each point estimate (e.g., numbers, percentages, and rates) in this report. To generate standard errors around prevalence estimates from the SVS, the U.S. Census Bureau produces GVF parameters for BJS. Te GVFs account for aspects of the NCVS’s complex sample design and represent the curve ftted to a selection of individual standard errors based on the Balanced Repeated Replication technique.
BJS conducted statistical tests to determine whether diferences in estimated numbers, percentages, and rates in this report were statistically signifcant once sampling error was accounted for. Using statistical analysis programs developed specifcally for the NCVS, all comparisons in the text were tested for signifcance. Te primary test procedure used was the Student’s t-statistic, which tests the diference between two sample estimates. Findings described in this report as higher, lower, or diferent passed a test at either the 0.05 level (95% confdence level) or 0.10 level (90% confdence level) of statistical signifcance. Figures and tables in this report should be referenced for testing on specifc fndings. Caution is required when comparing estimates not explicitly discussed in this report.
Estimates and standard errors of the estimates in this report may be used to generate a confdence interval around the estimate as a measure of the margin of error. Te following example illustrates how standard errors may be used to generate confdence intervals:
Based on the SVS, in 2016 an estimated 1.5% of all persons age 16 or older experienced stalking victimization. (See table 1.) Using GVFs, BJS determined that the estimated prevalence rate has a standard error of 0.05. (See appendix table 1.) A confdence interval around the estimate is generated by multiplying the standard error by ±1.96 (the t-score of a normal, two-tailed distribution that excludes 2.5% at either end of the distribution). Terefore, the 95% confdence interval around the 1.5% estimate is 1.5 ± (0.05 × 1.96) or (1.39% to 1.57%). In other words, if BJS used the same sampling method to select diferent samples and computed an interval estimate for each sample, it would expect the true population parameter (percentage of stalking victims) to fall within the interval estimates 95% of the time.
For this report, BJS also calculated a coefcient of variation (CV) for all estimates, representing the ratio of the standard error to the estimate. CVs (not shown in tables) provide another measure of reliability and a means for comparing the precision of estimates across measures with difering levels or metrics.

15 STALKING VICTIMIZATION, 2016 | APRIL 2021
APPENDIX TABLE 1 Estimates and standard errors for fgure 1: Prevalence of stalking, by type of stalking, 2016
Estimate Standard error 95% confdence interval
Lower bound Upper bound Total 1.5% 0.05% 1.39% 1.57%
Traditional stalking onlya 0.3 † 0.02 0.24 0.31 Stalking with technology onlyb 0.5 † 0.03 0.46 0.57 Both traditional stalking and
stalking with technology* 0.7 0.03 0.63 0.75 *Comparison group. †Diference with comparison group is signifcant at the 95% confdence level. aIncludes victims who only experienced the following types of unwanted behaviors: following; sneaking into, waiting at, or showing up at a place; leaving or sending unwanted items; or harassing friends or family about the victim’s whereabouts. bIncludes victims who only experienced the following types of unwanted behaviors: making unwanted phone calls, leaving voice mail messages, or sending text messages; spying using technology; tracking the victim’s whereabouts with an electronic tracking device or application; posting or threatening to post unwanted information on the internet; sending emails or messages using the internet; or monitoring activities using social media. Source: Bureau of Justice Statistics, National Crime Victimization Survey, Supplemental Victimization Survey, 2016.
APPENDIX TABLE 2 Standard errors for table 3: Number and percent of victims of traditional stalking, by type of stalking behavior, 2016 Stalking behavior Number of victims Percent of victims Percent of all persons
Total traditional stalking 95,410 ~ 0.04% Followed victim around/watched victim 73,106 1.90% 0.03 Showed up at/rode by/drove by places victim was when the ofender had
no business being there 68,763 1.93 0.03 Harassed/repeatedly asked victim’s friends/family for information about
their whereabouts 60,589 1.89 0.02 Waited for victim at home/work/school/any other place when victim did
not want them to be there 57,619 1.86 0.02 Left/sent victim unwanted items/cards/letters/presents/fowers 47,150 1.66 0.02 Sneaked into victim’s home/car/any other place and did things to let victim
know they had been there 41,716 1.52 0.02 ~Not applicable. Source: Bureau of Justice Statistics, National Crime Victimization Survey, Supplemental Victimization Survey, 2016.
APPENDIX TABLE 3 Standard errors for table 4: Number and percent of victims of stalking with technology, by type of stalking behavior, 2016 Stalking behavior Number of victims Percent of victims Percent of all persons
Total stalking with technology 106,545 ~ 0.04% Made unwanted calls to victim/left voice messages/sent text messages/
used telephone to excessively contact victim 87,324 1.63% 0.03 Sent victim unwanted emails/messages using the internet or social media
apps/websites like Instagram/Twitter/Facebook 75,384 1.73 0.03 Monitored victim’s activities using social media apps/websites like
Instagram/Twitter/Facebook 62,714 1.64 0.02 Posted/threatened to post inappropriate/unwanted/personal information
about victim on internet 54,901 1.53 0.02 Spied on victim/monitored victim’s activities using technologies such as a
listening device, a camera, or computer/cellphone monitoring software 46,432 1.35 0.02 Tracked victim’s whereabouts with electronic device/application, such as
GPS/app on victim’s cellphone 32,290 1.00 0.01 ~Not applicable. Source: Bureau of Justice Statistics, National Crime Victimization Survey, Supplemental Victimization Survey, 2016.

16 STALKING VICTIMIZATION, 2016 | APRIL 2021
APPENDIX TABLE 4 Population estimates for table 5: Number and percent of stalking victims, by demographic characteristics of victims, 2016 Victim demographic characteristic Population age 16 or older
Total 256,432,020 Sex
Male 124,495,830 Female 131,936,180
Race/ethnicity Whitea 164,940,900 Blacka 31,436,250 Hispanic 40,687,330 Othera,b 19,367,530
Age 16–19 17,162,670 20–24 21,578,750 25–34 44,540,360 35–49 61,266,890 50–64 63,443,210 65 or older 48,440,140
Marital status Never married 79,185,130 Married 127,877,140 Widowed 15,221,900 Divorced 27,818,370 Separated 5,193,230
Household income Less than $10,000 15,194,230 $10,000–$14,999 11,906,530 $15,000–$24,999 25,993,250 $25,000–$34,999 27,141,010 $35,000–$49,999 39,372,150 $50,000–$74,999 45,186,460 $75,000 or more 91,638,410
aExcludes persons of Hispanic origin (e.g., “white” refers to non-Hispanic whites and “black” refers to non-Hispanic blacks). bIncludes Asians, Native Hawaiians or Other Pacifc Islanders, American Indians or Alaska Natives, and persons of two or more races. Source: Bureau of Justice Statistics, National Crime Victimization Survey, Supplemental Victimization Survey, 2016.

Te Bureau of Justice Statistics of the U.S. Department of Justice is the principal federal agency responsible for measuring crime, criminal victimization, criminal ofenders, victims of crime, correlates of crime, and the operation of criminal and civil justice systems at the federal, state, tribal, and local levels. BJS collects, analyzes, and disseminates reliable statistics on crime and justice systems in the United States, supports improvements to state and local criminal justice information systems, and participates with national and international organizations to develop and recommend national standards for justice statistics. Doris J. James is the acting director.
Tis report was written by Jennifer Truman and Rachel Morgan. Erika Harrell, Alexandra Tompson, and Stephanie Mueller verifed the report.
Eric Hendrixson, Edrienne Su, and Jill Tomas edited the report. Carrie Epps-Carey produced the report.
April 2021, NCJ 253526
Ofce of Justice Programs Building Solutions • Supporting Communities • Advancing Justice
www.ojp.gov