Stalin is dead, long live Stalin? Testing socialization, structural, ideological, nationalist, and...
68
Stalin is Dead, Long Live Stalin? Testing Socialization, Structural, Ideological, Nationalist, and Gender Hypotheses The edited and shortened draft is forthcoming in POST-SOVIET AFFAIRS (2014) Alexi Gugushvili (Corresponding author) Bremen International Graduate School for Social Science (BIGSSS), University of Bremen, Email: [email protected] Peter Kabachnik College of Staten Island-The City University of New York (CUNY), Staten Island, New York, Email: [email protected] This work was supported, in part, by a Dean's Research Scholarship and a PSC-CUNY Award, jointly funded by The Professional Staff Congress and The City University of New York.
Transcript of Stalin is dead, long live Stalin? Testing socialization, structural, ideological, nationalist, and...

Stalin is Dead, Long Live Stalin? Testing Socialization, Structural, Ideological,
Nationalist, and Gender Hypotheses
The edited and shortened draft is forthcoming in POST-SOVIET AFFAIRS (2014)
Alexi Gugushvili (Corresponding author)
Bremen International Graduate School for Social Science (BIGSSS), University of Bremen,
Email: [email protected]
Peter Kabachnik
College of Staten Island-The City University of New York (CUNY), Staten Island, New York,
Email: [email protected]
This work was supported, in part, by a Dean's Research Scholarship and a PSC-CUNY Award, jointly
funded by The Professional Staff Congress and The City University of New York.

2
Stalin is Dead, Long Live Stalin? Testing Socialization, Structural,
Ideological, Nationalist, and Gender Hypotheses
Abstract
Recently, there has been a renewed focus on analyzing post-Soviet memory in Georgia,
including the rekindling of debate on contemporary perspectives of Josef Stalin. Most notably,
the publication of The Stalin Puzzle has helped bring attention to the persistence of positive
accounts and admiration, along with ambivalent and contested images, of the former dictator of
the Soviet Union. We utilize the unique survey data commissioned in 2012 by the Carnegie
Endowment for International Peace and administered by the Caucasus Research Resource
Centers (CRRC) to ascertain what factors might shape people's attitudes towards Stalin in
Georgia. Our objectives in this article are twofold. First, we wish to move past descriptive data in
the search for the determinants of attitudes using various bivariate and multivariate statistical
methods (including generalized ordered logistic regressions). Second, we test five broad
hypotheses – socialization, structural, ideological, nationalist, and gender – against the survey
data results.
Keywords: Stalin; post-Soviet memory; Georgia; socialization, nationalism

3
Introduction
Scholars have identified the phenomena of nostalgia for the Soviet Union and the Soviet era as a
particularly salient feature of modern post-communist societies (Boym 2001; Mendelson and
Gerber 2005; Mendelson and Gerber 2006; Munro 2006; Popov 2008; Kalinin 2011; Lee 2011;
Khinkulova 2012; Sullivan 2013; Végso 2013). Symbols of the Soviet era manifest themselves in
a variety of discourses, be it discussing the communist past nostalgically, military parades that
allude to the glory days of the Soviet empire and its former superpower status, or the
reproduction of the cult of the Great Patriotic War.1 The symbols of the Soviet era also
materialize in various places, like monuments (Forest and Johnson 2002), billboards and
advertisements (Danilova 2005; Kara-Murza 2013), or else in literature (Medvedev 2005;
Yasmann 2006; Marsh 2007) and television (Khinkulova 2012). In this article we turn our
attention to another such symbol -- Josef Stalin -- and the narratives and opinions people have
about him. Narratives about the past and opinions about historical figures might reflect the tenor
of political stances in the present.
In the 21st century, Stalin is making his presence felt yet again. Surveys have
demonstrated that Stalin's popularity remained high or has in fact risen in recent years in the
successor states to the Soviet Union (Mendelson and Gerber 2006). For instance, in Russia,
Stalin repeatedly polls as one of the most celebrated figures in Russian history (Slysz 2010), his
image adorns a variety of products, and Volgograd has reverted to its previous toponym -
Stalingrad - six days a year. Meanwhile, new Stalin monuments have appeared in several parts
of Georgia, the Stalin Museum in Gori still idealizes the hometown hero, and it is not unusual to
1 For example see the special issue of The Soviet and Post-Soviet Review (Volume 38, 2011) dedicated to
the World War II cult in post-Soviet space.

4
hear toasts dedicated to the man of steel such as “this is to a boy with a moustache, who took the
axis out of the Earth, put it on his genitals, and turned it around as he wished” (Kikodze 2012, p.
20).
Beyond symbolic manifestations and anecdotal evidence, a recent study has drawn
attention to, and spurred considerable debate about, people's attitudes towards Josef Stalin
throughout contemporary post-Soviet space (De Waal 2013a). The findings surprised many
observers both inside and outside the four countries polled – Armenia, Azerbaijan, Georgia, and
Russia. The survey results revealed high levels of admiration for a person considered to be one
of the most notorious dictators in history. For some commentators, this became proof that the
people surveyed had failed the "Stalin Test" (Mendelson and Gerber 2006), or else that these
results indicated that there is a "Stalin puzzle" that needed solving (De Waal 2013a). Questions
undoubtedly arise: How to approach Stalin's continued persistent presence into the 21st century,
over 60 years after his death? How shall we digest this information? How do we contend with
this phenomenon? In this article we attempt to explain attitudes towards Stalin in his birthplace,
Georgia, where the abovementioned survey respondents demonstrated by far the highest support
towards him. Therefore, in addition to the mainstream explanations of political attitudes –
socialization, social structural, ideological and gender theories – we also look at the ethno-
nationalistic dimension of Stalin’s admiration in Georgia.
We utilize the survey data commissioned by the 2012 Carnegie survey and administered
by the Caucasus Research Resource Centers (CRRC 2012). Although the descriptive results are
already available to the public, in order to better situate the survey responses, one needs to go
beyond the surface results as captured in the charts detailing the percentage of respondents
answering each question (see De Waal 2013: 7-11). While this is certainly a necessary and

5
important starting point, to get a sense of what factors are informing people's attitudes one must
dig deeper into the survey data. To this end we use bivariate and multivariate statistical methods
to analyze the data, search for valid explanations of attitudes about Stalin, and draw conclusions
for existing and future studies. Our objectives in this article are twofold. First, we wish to move
past descriptive data in the search for determinants using advanced statistical methods. Second,
we test the applicability of the general theories of public attitudes as well as nationalist
sentiments that might shape people's attitudes towards Stalin in Georgia. This article is
structured as follows. In the following section, we provide an overview of the main issues
relating to contemporary understandings of Stalin in post-Soviet space and in Georgia. Next, we
detail our major hypotheses drawn from the decades of scholarly literature on why people hold
the particular political attitudes they do. Then we provide an overview of our data and methods,
followed by the bulk of the article, the analysis of the empirical data, along with our predictions
about what will happen with attitudes about Stalin in future. We close with a summary and
discuss the possible implications of our findings.
Understanding Stalin Today
Before elaborating the specific hypotheses of our study, we consider it essential to describe what
Stalin means today for people in the former Soviet Union. Many scholars examine the issue of
cultural memory in post-Soviet space, deeming it a topic necessitating further research (Etkind
2013). These studies focus on how Russia, in the first two decades after the collapse of the
USSR, has not gone through a process of destalinization, failing to both properly reassess its past
and adequately commemorate and acknowledge the victims of the Soviet regime. However,
much of the research that does not only focus on this topic theoretically, draws upon the

6
experience of former dissidents, the intelligentsia, former prisoners, and writers and artists
(Etkind 2013). When everyday perspectives are considered, or current understandings of the
past explored, it is often done anecdotally (Hochschild 1995; K. E. Smith 1996; Satter 2012; for
a non-Russia example, see Rosenberg 1996). By contrast, we systematically analyse survey data
about people's attitudes towards Stalin in order to augment the rich, though often
methodologically less rigorous,2 qualitative data already available in the literature. This serves
two functions. First, to help better verify whether certain discourses and claims being made
about what opinions of Stalin signify are isolated themes or else more broadly representative of
the general public; and secondly, we can identify what factors contribute to heightened levels of
appreciation of Stalin or more critical views about the Soviet dictator.
There has been some exploration of popular attitudes and analysis of survey data on
sensitive topics such as violence and conflicts in the north and south Caucasus (Kolossov and
Toal 2007; O’Loughlin, Toal, and Kolossov 2008; Bakke, O’Loughlin, and Ward 2009;
O’Loughlin, Kolossov, and Toal 2011; Toal and Grono 2011; Toal and O’Loughlin 2013), as
well as research analyzing popular understandings of the Soviet era in Russia (Rose and
Carnaghan 1995; Mendelson and Gerber 2005; Mendelson and Gerber 2006; Mendelson and
Gerber 2008; Sullivan 2013). Other related research has examined a wide range of topics, from
measuring the power of nostalgia for the Soviet Union (Munro 2006; Popov 2008; Lee 2011;
2 We do not mean to imply that this data is not useful or that qualitative data in general is less rigorous
than quantitative data; however, in the way qualitative data is typically employed in this literature it is
often done in an ad hoc, limited, and/or anecdotal fashion, rather than in a systematic way, with clearly
documented methods and rationale for choosing the survey sample, interview subjects, etc.
7
Sullivan 2013) to documenting the attitudes of Russian youth towards the United States
(Mendelson and Gerber 2008).
Within this literature, the analysis of attitudes towards Stalin has been explored.
However, few studies have consulted the broader literature on attitude formation and persistence
and employed rigorous statistical analysis to uncover variables pertaining to people's perceptions
of Stalin (Reisinger et al. 1994; Munro 2006; Mendelson and Gerber 2008; Sullivan 2013).
Furthermore, to date there has been no attempt at multivariate analysis of survey data about
attitudes towards Stalin in Georgia. Lasha Bakradze (2013) provides the only analysis thus far of
the survey results in Georgia. He offers a general summary of the factors influencing attitudes
towards Stalin. Counter-intuitively, he states that “a more precise breakdown of Georgian
attitudes by age and social group does not reveal significant differences across society"
(Bakradze 2013: 52). Age in particular is often offered as a component that correlates with
positive or negative feelings towards Stalin, namely that older people are more likely to be proud
of Stalin. He goes on to say that education plays little role, residents of Tbilisi tend to be more
critical of Stalin, and attitudes towards Russia only provide a small level of indication of support
for Stalin. In this article, we will be able to test these pronouncements and other proffered
explanations drawn from literature on political attitudes and the knowledge of the specific
context in Georgia.
In the next section, we propose five broad hypotheses to test against the survey data
results. The development and selection of the five hypotheses – socialization, structural,
ideological, nationalist, and gender -- was shaped by the Carnegie report’s analyses (De Waal
2013b; Bakradze 2013; Gudkov 2013; Lipman 2013), the broader literature on attitudes about
Stalin in Russia (as discussed above), the prevailing 'conventional wisdom' in Georgia, and our

8
own experiences speaking with people in Georgia about Stalin. The five hypotheses encapsulate
a variety of indices, including ethnicity, religiosity, education level, age, sex, political and
economic ideology, socioeconomic status, and settlement type. These hypotheses will be
considered and either validated or challenged based on the various statistical methods that will be
documented throughout the article.
Hypotheses
In order to explain attitudes towards Stalin in Georgia we refer to major theories on the micro-
foundations of political attitudes – socialization, social structural and ideological perspectives.
We also consider the role of Georgian nationalism in explaining why respondents in this country
are more likely to express approval of Stalin than respondents in neighbouring Armenia,
Azerbaijan, and Russia (De Waal 2013a). In addition, we hypothesize that gender has specific
implications in relation to the Soviet dictator and that the outlined factors also manifest
differently within consecutive birth cohorts.
Socialization theory
We propose that socialization theory is the main framework for understanding attitudes towards
Stalin in Georgia. Each individual born in a society acquires values and beliefs from the
distinctive development of her or his birth cohort through peer-group socialization, the content of
formal education and idiosyncratic historical experiences such as war, revolution or
technological change (Ryder 1965). Political attitudes are shaped at a relatively young age when
individuals are entering adulthood (Jennings and Markus 1984). More specifically, the

9
impressionable years hypothesis implies that during late adolescence and early adulthood
individuals are highly susceptible to attitude change and their susceptibility significantly declines
thereafter (Krosnick and Alwin 1989). According to the aging-stability hypothesis stable
attitudes emerge soon after the early adult experiences and differences between cohorts are quite
durable in the face of social change (Alwin and Krosnick 1991). Probably the main reason why
attitudes adopted during childhood tend to persist over the life course is that individuals in their
adulthood are more likely to believe in the importance and certainly of their convictions, while
their perceived quantity of attitude-relevant knowledge is greater than during their late
adolescence or early adulthood (Visser and Krosnick 1998).
Generational differences in social and structural conditions are one of the main
explanations why most social change progresses slowly. Evidence from democratic societies
suggests that after early adulthood and a period of relative instability of attitudes, throughout the
remainder of one's life levels of stability are quite high (Fendrich and Lovoy 1988). In this line,
many scholars of post-socialist democratic transition have reached a consensus that a cohort
replacement over a long period of time would be necessary to create a civil society free of the
communist indoctrination (e.g. Finkel, Humphries, and Opp 2001; Pop-Eleches and Tucker
2014). Individual studies in post-Soviet space also show that the youngest generation is more
favorable towards popular participation in decision making, while the older generation exhibits
admiration for a ‘strong leader’ (Hahn and Logvinenko 2008). Although the most appealing
political system for Russians, regardless of age, is a Soviet system, nearly half of respondents
born before 1930s preferred an unreformed Soviet political regime, whereas among those born
after 1960s that proportion was only 10% (Colton and Mcfaul 2002). We know that cohorts born
in the first half of 20th century in Soviet Georgia were brought up in an environment whereby
10
people were indoctrinated to communist ideas and exposed to idealized representations of Stalin
(Kitaevich 2014), at least before Khrushchev's “Secret Speech” and de-Stalinization measures
after 1956 (Kemp-Welch 1996). It is expected that the oldest generations will exhibit the
strongest support for Stalin.
The youngest generations are least influenced by socialization which glorified Stalin and
communist achievements in general, as they grew up during the less authoritative 1960s and
1970s and in Mikhail Gorbachev's Perestroika and Glasnost periods. In one of the few studies
which analyzed in a multivariate framework attitudes towards Stalin, Reisinger et al (1994)
inquired into how strong respondents agree with the following statement: 'these days, Stalin is
not given adequate credit for his accomplishments.' Their findings suggest that positive attitudes
towards Stalin indeed are highest for those born before 1925 and the lowest among individuals
born after 1966. However, the same survey in Ukraine and Lithuania suggests that the oldest
cohorts have less positive perceptions of Stalin than those born in 1926-1935. The most likely
explanation for this trend is that Lithuania was independent before the Second World War and
therefore those born earlier than 1926 were not indoctrinated by the Soviet regime during their
formative years. Whereas in Ukraine the oldest survey respondents might remember the famine
of 1932–1933 and put blame for it on the late Soviet ruler (Bilinsky 1999). Since Georgia was
annexed by Soviet Russia in 1921 in our survey we do not have respondents with living memory
of the first Georgian republic (1918-1921). Following from the preceding review of theoretical
and empirical literature, we expect that the older cohorts will be most supportive of Stalin in
Georgia.
11
Hypothesis 1: Positive attitudes towards Stalin are strongest among the oldest birth cohorts and
they rapidly decline among those born in the second half of 20th century.
Social structural theory
Our first hypothesis assumes that individuals’ have different attitudes about Stalin because of
their generational belonging and socialization. The levels of indoctrination markedly differed in
the first half of 20th century from the period when Georgia became an independent country (for
instance this is vividly illustrated by Kitaevich (2014) with her extensive interviews with school
teachers of history in Georgia). However it would be naïve to completely explain attitudes of a
certain individual towards the Soviet system and Stalin based on her or his birth date (Ekman and
Linde 2005). The level of education is a good example to illustrate this point because it might
have implications for both socialization and social structural theories. If we assume that an
individuals education has an effect on attitudes towards Stalin then expanding educational
opportunities might be responsible for variance of attitudes among different generations. Here
we are not talking about the content of curriculum at different historical times which itself would
be a generational effect, but rather about the share of people with primary, secondary and tertiary
educational attainment across time. Education is only one example, other areas of social and
economic change encompass urbanization, labor market structure, material welfare and other
developments related to transition from more traditional agrarian society to the more
industrialized and urbanized Georgian Soviet Socialist Republic (Rose and Carnaghan 1995). In
contrast to the socialization approach which gives primary importance to formative years for
individuals’ attitudes, social structural theory assumes that values and beliefs can change

12
throughout the life course and attitudes are shaped by the current structural conditions in which
individuals find themselves.
Although there is a scarcity of literature how social and structural conditions are
associated with attitudes towards Stalin or other dictators, the perception of democracy seems to
be related with a complex interplay of institutional, cultural and economic factors (Inglehart
1988). Leaving institutional determinants aside, better educated individuals are expected to have
more critical attitudes towards strict norms and authoritative leaders because education equips
people with the skills that are necessary to understand political processes and to communicate
preferences to those who make decisions even in authoritative states. Hahn (1991), analyzing
attitudes in Russia, just before the collapse of the Soviet Union, concludes that educational
attainment had the most important effect on political attitudes among other conventional
explanations. It seems that individuals with limited education are different political actors from
those who have achieved a higher academic attainment. We should expect that more educated
individuals, controlling for their birth date, are less likely to support Stalin because they are more
aware of the mass executions and other atrocities committed by the Soviet regime under Stalin’s
leadership. A highly educated public is less likely to tolerate the old Stalinist system's heavy-
handed terror and controls (Bahry 1993).
Another important social structural explanation of attitudes towards Stalin can be rural-
urban differences. The increased complexity of social structure that accompanies urban residence
could be more difficult to accommodate within the framework of an authoritarian state system.
In urban areas people are better informed about actions implemented by governments. It was
argued that in Russia of the early 1990s a salient urban-rural split in the distribution of political
attitudes existed and that rural residents were generally less supportive of political reforms

13
(Wegren 1994) and were more collectivist and egalitarian than urban Russians (Reisinger,
Miller, and Hesli 1995) Studies which analyze democratic satisfaction in a number of post-
socialist countries also show that in big cities and national capitals people have been more
critical of democracy than in small and midsized town and rural communities (Neundorf 2010;
Pop-Eleches and Tucker 2014). When asked if these days Stalin is not given adequate credit for
his accomplishments, urban residents are less likely to view Stalin favorably (Reisinger et al.
1994). The same can apply to differences of Stalin’s support between rural and urban settlements
in Georgia. It is expected that in rural areas Stalin is more popular than in the capital city and
other urban settlements. It has been shown that in consecutive national elections since
independence Tbilisi residents were more likely to cast votes for oppositional parties and
presidential candidates (George 2014).
In addition to education and urbanization, what might also shape attitudes towards Stalin
in Georgia is respondents’ socioeconomic status. It was argued that not the progress of
modernization but its discontinuities prompted social and political change in Soviet Union
(Ruble 1987). For instance, higher education had expended far more rapidly than the existing
occupational structure could accommodate, which led to substantial underemployment of the
educated labor force. Similar trends were also observed in Georgia’s educational and
occupational expansion (Gugushvili 2013). In this article we make an assumption that Stalin is
perceived as a symbol of the individual's attitude towards various aspects of the Soviet political
and economic system (Cohen 1982). In this regard, many of those who are dissatisfied by their
current position in post-socialist socioeconomic hierarchy might exert positive attitudes to the
Soviet system and its main architect Josef Stalin. Earlier empirical findings are in line with our
thinking. For instance, using data for 16 post-socialist societies, it was shown that an individuals’
14
income is strongly and positively related to support for democratic political order and it tends to
have its strongest effect if economic development is high (Andersen 2012). Studies on Soviet
nostalgia also reveal that the poor are more likely to harbor positive feelings of the Soviet past
(Sullivan 2013). Munro (2006) shows that an individuals’ evaluation of the current economic
system has a weak negative influence on nostalgia, but more importantly the family economic
situation in the past has the strongest effect on attitudes towards former system. Individuals’
socioeconomic conditions could be even more important for attitudes towards Stalin in Georgia
as the country experienced dramatic economic decline in the 1990s and the poverty level has
remained consistently high thereafter (Gugushvili 2011).
Hypothesis 2: Attitudes towards Stalin are stratified based on the individuals’ current
socioeconomic conditions - more educated, urban and wealthier individuals being
against Stalin, while less educated, rural and poor individuals being pro-Stalin.
Ideological preferences
The next theoretical approach assumes that the perception of the Soviet dictator is linked to other
sets of attitudes. Individuals view Stalin as part of a larger belief system (Brooks and Bolzendahl
2004). People as a rule are not knowledgeable about most issues at a given point of time, yet they
are able to express preferences when necessary or if asked to. Rational individuals sort their
preferences by answering two questions: Who am I? and What should I do? Their cultural
identity helps individuals to know what kind of preferences they are expected to have as well as
their desirability in comparison to others’ beliefs (Wildavsky 1987). Furthermore, social
interaction among individuals can be viewed under a cognitive framework that encompasses

15
points of view that are incidental to this framework’s primary objectives but has considerable
salience to the participants of interaction (Snow et al. 1986). We can assume that democratic
values in socialist and post-socialist societies stem from a breakdown in confidence in the
authoritarian regime. This trend was further fueled by the diffusion of Western ideas about the
democratic political system which was perceived as a powerful alternative political model
(Gibson 1996). It is likely that the residual authoritative values and beliefs in post-socialist
societies stem from system-internal experiences whereas the democratic elements stem from
system-external experiences (Roller 1994).
The effect of an individuals’ ideology on attitudes towards Stalin is simple to explain.
After the dissolution of the Soviet Union and reproaching of communism, the ideas of a free
market economy and democratic political system began to take hold. Like other Western
practices, ideas and items such as religion, Levis, and Snickers, democracy became fashionable
in post-socialist societies (Gibson 1996). It was also argued that as democratic attitudes were
antithetical to communist regimes, the learning of these values already in the 1980s came
through alternative channels – what Dalton (1994) calls the counter-culture model. In 1992, in
one of the first nationally representative surveys conducted in independent Georgia, 63% of
respondents agreed that the creation of a market economy largely free from state control was
right for the country’s future. In the same survey more than half of respondents expressed
satisfaction with democracy development (Reif and Cunningham 1993). In 2012, after 20 years
of post-socialist transition most people in Georgia (83%) agree that democracy is preferable to
any other form of political system (CRRC 2012). The gradual spread of ideas about the
fundamental characteristics of the politico-economic system is obvious in Stalin’s home country.
The reason why we expect that these ideological preferences will be reflected in views towards

16
the Soviet dictator is that the fundamental principles of market economy and democracy are
hardly compatible with Stalinism. Individuals who perceive democracy and the market economy
as a preferable politico-economic system should not exhibit strong positive attitudes towards
Stalin and his policies.
Hypothesis 3: Support of ideology that is not compatible with Stalinism – democracy and market
economy – leads to a negative perception of Stalin.
Nationalism theory
As we outlined earlier in this article, one of the major findings of “The Stalin Puzzle” report is
that attitudes towards the late Soviet dictator are significantly and systematically more positive in
Georgia than in Armenia, Azerbaijan, and Russia. Beyond socialization, social structural, and
ideological factors, in this paper we speculate that Stalin’s ethnicity might be one of the major
covariates that shapes his positive perception through the Georgian national identity (Zedania
2011). Many scholars have identified high levels of nationalism in the country, even during the
Soviet period (Jones 1992; Nodia 1995; Chinn and Kaiser 1996; Slider 1997; Kaufman 2001). It
is also argued that virulent ultranationalism dominated for a time in the 1990s (Suny 2006).
There are reasons to believe that many Georgians still identify with and are proud of their ethnic
kin – Ioseb Jugashvili (Bakradze 2013) who is arguably the most well-known Georgian in world
history. Showing pride in Stalin, or displaying a portrait of him in one's home, could be a
nationalist practice that reproduces Georgian national identity. As nationalism scholars relate,
narratives and symbols, such as the image of Stalin and the stories told about him, help to
embody everyday performative nationalism (Bhabha 1990). Stalin's role as a national symbol

17
can reproduce national identity both in explicit and ritualistic (Hobsbawm 1983) and banal ways
(Billig 1995). If Stalin is understood as a particularly Georgian symbol, and thus a key aspect of
Georgia identity and history, then attitudes towards Stalin can be seen as a measure of Georgian
nationalism.
Furthermore, the unique role of Stalin in Georgian nationalism could be affected by the
1956 demonstrations to mark the third anniversary of Stalin's death and consequently by 9 March
massacre unleashed by the Soviet military in Tbilisi. There is evidence of strong nationalist
sentiment present during these protests in Georgia (Suny 1994). Though the degree to which
Stalin was imbricated in the nationalist fervor is difficult to quantify and is debated (Kozlov
1999; Blauvelt 2009), there was clearly a connection. It is argued that along with the demands
for the rehabilitation of Stalin, protestors raised the issues of self-determination and the
independence of Georgia. Some commentators also draw parallels between the 1956 events and
the 1989 independence movement massacre for the formation of Georgian national identity
(Vashakidze 2013). In spite of Khrushchev's destalinization campaign, Stalin remained, perhaps
more than in other Soviet republics, a presence in domestic (photographs and portraits hanging in
homes and workplaces) and public space (monuments) in Georgia throughout the Soviet period
and still to this day. This indicates that Stalin remained a central element of Georgian identity
and the inability to limit his presence in the landscape could be explained by Georgian
nationalism.
Nationalism, especially its ethnic component, is often expressed through religious
nationalism and indeed one prominent feature of national identity in the Georgian case is
religion. Zedania (2012) highlights the role of religious nationalism in the country and notes the
central role of the Orthodox Church for Georgian identity, as for many being Georgian "lies in
18
'being Orthodox'." (125). It is also argued that religious-nationalistic views and value orientations
in Georgian society prevail over civil and liberal ones (Chelidze 2014). Furthermore, there are
some direct links between religious nationalism and the Stalin cult in Georgia as many clergy are
grateful for Stalin’s re-institution of the Church during the Second World War. This narrative
also implies that the death of Stalin in 1953 prompted the new repressions of the Church often
ignoring the fact that Stalin’s regime was an atheist dictatorship which was responsible for the
destruction of numerous churches in Georgia and elsewhere in the Soviet Union. Probably the
most vivid manifestation of the position of the Georgian Church is an interview with its leader,
Ilia II, who polls repeatedly indicate is the most trusted figure in Georgia, stated that ‘Stalin is an
exceptional person, people like him are rarely born’ (Metskhvarishvili 2013).
However, one more dimension to be considered here are alternative forms of nationalism
and meanings of national identity in Georgia which particularly intensified after “the Rose
Revolution” (Vachridze 2012). These features of national identity emphasize civic nationalism as
well as anti-Russian rhetoric heard from the ruling elites. Indeed, the pride in Stalin in Georgia is
arguably linked to ethnic nationalism as opposed to its civic form and as the main political actors
set a goal of the transformation of Georgia’s ethnic nationalism into a civic one the problem of
Stalin for contemporary Georgia also had to disappear (Zedania 2011). On 25 June 2010 the
monument to Stalin in his birthplace that withstood the process of de-Stalinization in 1956 and
Georgian independence since 1989 was removed from the main square of the town of Gori. If
people view Stalin as more Soviet or Russian, rather than Georgian, or else as someone who
harmed Georgian society, then their nationalism would manifest itself differently. If Stalin is
primarily equated with Russia, and Russia is seen as a colonizer both before and during the

19
Soviet period, then those people who perceive Russia to be Georgia's biggest threat will judge
Stalin more harshly than those who do not.
Hypothesis 4: Ethnic and civil national identity respectively positively and negatively shape
attitudes towards the Soviet dictator as Stalin is viewed by Georgians through the lens of
nationalism.
Gender Gap and within cohort effects
One additional vector which might matter for attitudes towards Stalin is gender. There is a
scarcity of studies that show how males differ from females in their attitudes towards
authoritarian leaders, however the available scholarship highlights the existing “gender gap” in a
broad array of attitudes related to the use of force and violence (Shapiro and Mahajan 1986).
Smith (1984), by compiling six different sources of survey data in the United States, shows that
the gender differences usually result from males for survey questions choosing the pro-force
options such as capital punishment, military intervention, loose gun control, while females either
have no opinion or select the anti-force answer choices. There is no conclusive agreement why
females differ in their political ideas but researchers across disciplines have put forward several
possible interpretations. It has been suggested that women biologically have stronger
compassion, moral strength and maternal instincts (Togeby 1994). In social psychology
literature, these gender differences have been attributed to Social Dominance Orientation (SDO)
that is linked to an individuals’ gender. SDO implies general preference for group inequality and
has been shown to be more prevalent among men (Pratto, Stallworth, and Sidanius 1997).

20
We do not find any studies that investigate specifically the role of gender towards Stalin
or other dictators in post-Soviet space, but some empirical evidence also supports the idea that
males are more likely to be in favor of the Soviet system and consequently Stalin and Stalinism.
For instance, in one of the rare studies of gender gap in political attitudes, Carnaghan and Bahry
(1990) show that females in the Soviet Union on average tend to oppose higher spending on
defense, (though no gender-based differences were revealed when it comes to support for Soviet
use of force). Munro (2006) showed that females in Russia were less likely than males to express
desire to see the return of communist system. Males in Russia also have been shown to exhibit
more anti-American views than females in Russia (Mendelson and Gerber 2008). Furthermore,
in the country of our analysis – Georgia, the Caucasus Barometer (CRRC 2012) demonstrates
that males are marginally more likely to declare that in some circumstances authoritarianism is a
better political regime than democracy (11.0% vs. 8.8%). Therefore gender can be a significant
covariate of attitudes towards Stalin.
Hypothesis 5: Controlling for other factors, males in Georgia are expected to express more
positive attitudes towards Stalin than females.
After reviewing what we expect from different birth cohorts, social and structural conditions,
ideological preferences, Georgian nationalism, and gender in relations to attitudes towards Stalin,
we also outline how these characteristics might have different effects according to individuals’
birth dates. There are reasons to believe that the hypothesized factors have different
manifestations across different generations. Perhaps the major achievement of Stalin for which
he is credited by many in post-Soviet societies is the victory in the Second World War. This
21
might also imply that males as direct participants of military activities would be closer to Stalin
than females whose involvement in war was less directly combat related. If so, gender
differences might be more intense among the older generations rather than the recent cohorts
without living memory or first-hand accounts of the Second World War from their parents. We
also expect that differences between social and structural characteristics are more salient among
the youngest generations. Inequality levels in terms of rural-urban differences and income
distribution were much less pronounced for those born before the dissolution of the Soviet Union
(Fuchs and Demko 1979). The gap between urban and rural lifestyles and socioeconomic
conditions of poorer and wealthier individuals was not markedly salient.3 In the recent years
these differences are more intensively manifested (World Bank 2009). In addition, we also
speculate that ideological convictions are more relevant for the elderly individuals because in the
era when Stalin and the socialist system were idealized having positive attitudes toward a free
market economy and democracy also would imply the negative perception of the Soviet regime
and Stalin.
Data and research design
In 2012, the Carnegie Endowment for International Peace commissioned the Caucasus Research
Resource Centers (CRRC 2012) to include several questions designed to elicit people's
perceptions of Stalin in the South Caucasus. This was the first time a nationally representative
survey on this topic had been undertaken in the birthplace of the Soviet dictator. The questions
3 In fact, the poverty rates in rural areas in the large part of 1990s were lower than in urban areas which
can be attributed to the highly developed agriculture by the end of 1980s (World Bank 1999).

22
about Stalin were integrated in the annual Caucasus Barometer survey, conducted every fall
since 2006, which allows for the testing of links between the perceptions of Stalin on the one
hand and individuals’ various demographic, economic, and attitudinal characteristics. The
Caucasus Barometer respondents answer face-to-face survey questions, participation in the
survey is voluntary and anonymous and the results are representative for the adult (18+)
population of Georgia. 2,502 respondents in Georgia completed the survey in 2012.4 Below we
describe four questions on attitudes towards Stalin which serve as the dependent variables in our
study, followed by an overview of independent variables that are used to explain the perceptions
of Stalin in Georgia. The section concludes with the rationale of employed statistical methods in
our analysis.
Dependent variables
We employ four dependent variables from the survey which inquire into how strongly
respondents agree with the following statements: a) ”Stalin was a wise leader who brought power
and prosperity to the Soviet Union.” This question intends to understand respondents’ attitudes
towards Stalin as a political leader and a manager who created one of the strongest superpowers
in world history; b) “For all Stalin’s mistakes and misdeeds, the most important thing is that
under his leadership the Soviet people won the Great Patriotic War.” This statement implies that
the victory in the Second World War can be considered more important than Stalin’s misdeeds;
c) “Stalin was a cruel, inhuman tyrant, responsible for the deaths of millions of innocent people.”
The third question allows insight into whether respondents know and acknowledge Stalin’s
4 More details about the survey can be accessed at the CRRC Web site (http://www.crrccenters.org).

23
responsibility in the Soviet terror; d) “Our people will always have need of a leader like Stalin,
who will come and restore order.“ The last statement relates Stalin’s legacy to the contemporary
and future needs of people to have a dictator which can remedy a dysfunctional political and
economic system. Answer options for each question consist of ‘completely disagree,’ ‘mostly
disagree,’ ‘mostly agree,’ ‘completely agree,’ ‘don’t know,’ and ‘refuse to answer.’
Interestingly 4.4% of the survey respondents declared that they did not know who Stalin
was. Our analysis suggests that the individuals who are unaware of Stalin are overrepresented
among rural residents, ethnic Azerbaijanis, and cohorts born after 1975, but surprisingly the level
of education is not related to awareness of Stalin. Among those who have heard about Stalin
roughly 2% of respondents refused to answer the questions, while respectively 13.9%, 11.9%,
20.6% and 22.9% of respondents chose option ”don’t know” for the described four statements. It
is telling that more than one-tenth of respondents would not provide their opinion if Stalin was a
wise leader and that the victory in the Second World War is more important than his mistakes,
but even more intriguing is that about one in five respondents do not know if Stalin was
responsible for deaths of millions of innocent people and whether people will always have need
of a leader like Stalin. This suggests that either the awareness of Stalin and Stalinism in Georgia
is low or that people are constrained to reveal their real attitudes towards Stalin. The analysis of
respondents who did not know what to answer on the questions suggests that females, non-
Tbilisi residents, less educated, Azerbaijanis, and cohorts born after 1975 were more likely to
choose this answer option among alternatives.
Figure 1 about here

24
In our empirical study we leave aside those individuals who do not know who Stalin is, who
refuse to answer the questions asked or do not know what to think about the statements. The
responses of the remaining individuals in our sample are presented in Figure 1. It is clear that the
majority of respondents in the CRRC survey agree with the first two statements. Only less than
20% of respondents who answered the question disagree that Stalin was a wise leader bringing
power and prosperity to the Soviet Union, while 41.1% completely agree with this statement.
The consensus is even higher that under Stalin's leadership the Soviet people won the Great
Patriotic War which is more important than his shortcomings as about 90% of respondents agree
with the statement (49.5% completely agree and 40.0% mostly agree). More diverse are
respondents’ answers about Stalin’s responsibility for the deaths of millions of innocent people
and the need for a leader like Stalin. The Soviet leader is perceived as a cruel and inhuman
tyrant by about 65.9% of respondents (32.2% completely agree and 33.7% mostly agree), while
10.3% completely disagree with the statement. For the last variable the majority of respondents
disavow the idea that people will always need a leader like Stalin (about 62%), but more than
one-third of respondents (37.4%) believe that it is always be necessary for such a leader to come
and restore order (14.0% completely agree 23.4% mostly agree). We can infer from the
descriptive statistics that many individuals acknowledge Stalin as a wise leader and that the
defeat of Germany in the Second World War is more important than his mistakes, but at the same
time the same people think that Stalin was a cruel, inhuman tyrant, and that people will never
have need of a leader like Stalin. The share of individuals with these simultaneously positive and
negative attitudes towards Stalin is about 26.6% in our sample.

25
Independent variables
To test our hypotheses we employ fourteen independent variables. Following the work of Rose
and Carnaghan (1995) and Munro (2006), we derive 7 distinct birth cohorts, or generations: a)
the Second World War (born before 1935, 5.0% of the sample); b) the Stalinist (1935-1944,
10.0%); c) the post-Stalinist (1945-1954, 13.4%); d) the social contract (1955-1964, 19.1%); e)
the Glasnost (1965-1974, 17.2%); f) the transition (1975-1984, 18.4%); and g) the independence
(1985-1994, 17.0%) generations. The older cohorts are hypothesized to be most supportive of
Stalin in Georgia (refer to the Appendix 1 for more details on operationalized generations). We
employ several variables to test H2. The years of education varies from 0 to 25 with mean value
of 12.7 (SD 3.2). The elaborated hypothesis suggests that the higher the respondents education,
the lower their positive perception of Stalin. Two related variables to individuals’ education are
their comprehension of foreign languages – Russian and English (from no basic knowledge=1 to
advanced knowledge=4 with mean values 2.9 (SD .89), and 1.5 (SD .86), respectively). It is
assumed that the higher proficiency in either language, but especially in English which is much
less prevalent in Georgia (Blauvelt 2013), would be associated with negative attitudes towards
Stalin. For settlement type (Tbilisi – 21.8%, other urban areas – 39.4%, rural areas – 38.8%) we
expect that Tbilisi residents hold the most critical views, while rural residents will have the least
negative perceptions of Stalin.
The social structural hypothesis is further tested with individuals' socioeconomic
conditions which are operationalized in three variables: labour market position, number of
households’ material items, and respondents’ subjective perception of their households’
socioeconomic status. The unemployed, who constitute one-fourth of our sample (23.9%), are
expected to express positive attitudes about Stalin. In order to derive households’ objective

26
socioeconomic conditions we use information on whether the respondents have seven items and
services in their households.5 The retained items after principal factor analysis are summed in the
cumulative index with values ranging from 0 (no listed items in the household) to 7 (all listed
items are available in household) with mean value of 2.7 (SD 1.95). For the perception of
subjective socioeconomic situation we use information from the survey question about
respondents’ households’ placement on subjective income rung – from the lowest possible
economic position in society=1 to the highest possible position=10 with mean value of 4.2 (SD
1.7).
H3 on ideological preferences is tested with two questions related to political and
economic systems. Respondents are asked to choose from the following three statements:
‘democracy is preferable to any other kind of government’ – 82.7%, ‘in some circumstances, a
non-democratic government can be preferable’ – 9.7%, ‘for someone like me, it doesn’t matter
what kind of government we have’ – 7.7%. We expect that those who prefer democracy would
exhibit negative attitudes towards Stalin, while authoritarian preferences would increase support
for the Soviet dictator. Respondents’ economic ideology is measured by their subjective
placement on the following scale – ‘government ownership of business and industry should be
increased’=1 to ‘private ownership of business and industry should be increased’=10. This
variable has mean value of 4.6 (SD 3.0). We expect that supporters of government ownership
5 These items are: (a) color television, (b) digital photo camera, (c) automatic washing machine, (d) DVD
player, (e) refrigerator, (f) air conditioner, (g) car, (h) land line phone, (i) cell phone, (j) activated
internet access from your personal cell phone, (k) personal computer, including laptop, and (l) Internet
access from home computer or laptop.

27
will sympathize with Stalin, while the opposite attitudes should be observed among supporters of
private property and privatization.
H4 on the links between Georgian nationalism and attitudes towards Stalin is tested with
independent variables on respondents’ ethnicity, religiosity and their perception of the biggest
enemy of Georgia. We expect that ethnic Georgians (88.1%) would exhibit stronger support for
Stalin than Armenians (4.6%), Azerbaijanis (4.7%) and other ethnicities living in Georgia
(2.7%); Religiosity is measured based on respondents’ answers to how religious they are from
‘not at all religious’=1 to ‘very religious’=10 with mean value of 6.3 (SD 2.3). It is difficult to
hypothesize how religiosity could affect attitudes towards Stalin because, on the one hand,
religious people might oppose communist ideology and the atheism associated with it, but, at the
same time, due to close links between ethnic nationalism and the Georgian Orthodox Church, we
expect that religiosity has a positive effect on attitudes towards Stalin. Caucasus Barometer also
asks respondents which country is currently the biggest enemy of Georgia. We code dummy
variable 1 if respondents answer Russia (32.9%). Those who say Russia is the biggest enemy are
expected to manifest negative attitudes towards Stalin. Lastly, we test H5 on the importance of
gender with a dummy variable for males. Similarly to other surveys in Georgia, females are
overrepresented in our sample (62.5%), but we hypothesise that males are the ones who will
express more positive attitudes towards Stalin.
Results
Bivariate analysis
28
We start testing our hypotheses with the univariate analysis of variances which identifies if
attitudes towards Stalin vary along with hypothesised explanatory factors. For each dependent
and independent variable, Table 1 shows F-ratios, their statistical significance and η2. The first
row of Table 1 shows that generational belonging is a strong explanation of variance in all
dependent variables. In line with H1, it explains as much as 11% of variance for the people’s
need of a leader like Stalin. However, our main concern here is the strong link of the age variable
with proficiency in English (r=.46) and the number of material items in respondent households
(r=.27) which in turn, as we will see below, are statistically significant explanations of variance
in attitudes towards Stalin. Most variables which test the validity of H2 also appear statistically
significant. Education accounts for 4% of variance when the dependent variable asks for the need
of a leader like Stalin. Proficiency in foreign languages, both in Russian and English, is also a
significant factor in why respondents’ attitudes towards Stalin do vary. Interestingly, knowledge
of English has nearly double the values of F-ratio and η2 which suggests that without controlling
for other variables, proficiency in English is a better explanation of variance in our dependent
variables than proficiency in Russian. Furthermore, settlement type seems to be a good
explanation of variance in attitudes towards Stalin, especially for the perception that people will
always have need of a leader like Stalin (F-ratio=53.5, η2=0.06) and that Stalin brought power
and prosperity to the Soviet Union (F-ratio=41.5, η2=0.03). Nonetheless, settlement type, as
Table 1a in the appendix suggests, is correlated with respondents’ other characteristics such as
education (r=-.316), proficiency in languages (r=-.31 for Russian and r=-.34 for English) and the
number of household items (-.40), which in turn explain variance in our dependent variables.
Table 1 about here
29
Now we discuss H2 in relation to respondents’ socioeconomic conditions – unemployment
status, the number of household items, and their subjective income rung. Although
unemployment has the strongest association with the perception that Stalin was responsible for
the deaths of millions of innocent people, it fails to explain any variance in the first and second
columns in Table 1. One of the reasons why unemployment status is not a good predictor of
attitudes towards Stalin is that the unemployed individuals in our regressions specification are
compared with people of variety labor market attachments, including students, disabled
individuals, and housewives. Next, for all dependent variables, except the one asking what
individuals think about Stalin’s responsibility for the deaths of millions of innocent people, the
objective number of household items is a stronger covariate of dependent variables than
respondents’ subjective perception of socioeconomic status. However, the latter two variables
are strongly correlated (r=.46), while objective socioeconomic status is also linked with
settlement type (r=-40), education (r=38), and proficiency in English (r=33). Our multivariate
analysis in the next section will clarify if objective socioeconomic status maintains statistical
significance when other covariates are accounted for.
Testing H3 we identify that the perception of democracy explains some variance in the
dependent variable on Stalin’s responsibility for the deaths of millions of innocent people as well
as the need of a leader like Stalin. Nonetheless, we have to be cautious of the results as the views
of democracy are moderately associated with ethnicity and subjective socioeconomic rung of
households. Attitudes towards private ownership of business and industry depict consistent and
significant links with all four dependent variables. It is not surprising that the strongest links are
observed for attitudes towards people’s need of a leader like Stalin which is incompatible with
the idea of a free market economy (F-ratio=9.21, η2=0.02). We can be certain that this

30
association is immune from the problem of multicolinearity because all associations with the
remaining covariates are very weak.
H4 related to ethnic nationalism is tested by the variables on respondents’ ethnicity,
religiosity, and their perception of Russia. Ethnic origin appears to be significant for people’s
perceptions on Stalin’s role in the Second World War (F-ratio=13.1, η2=0.01), and people’s need
of a leader who will come and restore order (F-ratio=10.6, η2=0.01). The religiosity of
respondents demonstrates the strongest effect for the second dependent variable on Stalin role in
the Second World War (F-ratio=10.6, η2=0.01), but it also remains significant for the third and
the fourth dependent variables. Another variable gauging nationalism is who the respondents feel
is the biggest enemy of Georgia. Perceiving Russia as the country’s biggest threat is strongly
associated with all our dependent variables. We can be certain that the latter association is not
spurious because the perception of Russia is not associated strongly with other covariates.
Finally, contradicting H5, gender exhibits only a weak association with attitudes towards Stalin
and for the dependent variables in columns 2 and 3 it fails a statistical significance test at the
10% level. In sum, our bivariate analysis tentatively suggests that generational belonging,
education, foreign language proficiency, the type of settlement, objective and subjective
socioeconomic status, attitudes towards private property, and perception of Russia might affect
attitudes towards Stalin.
Multivariate analysis
The goal of the multivariate analysis in Table 2 is to identify the net effect of specific factors by
simultaneously controlling for all independent variables in generalized ordered logit models.
Before proceeding with the description of findings it is important to clarify how to interpret the

31
presented regression output. The first panel indicates coefficients of covariates which
differentiate between the answer ‘completely disagree’ in the corresponding dependent variable
on the one hand, and the categories ‘mostly disagree’, ‘mostly agree’ and ‘completely agree’ on
the other hand. These coefficients show the impact of independent variables in getting a
respondent up from the first step of the four-step ladder in our dependent variable. The second
panel of the table contrasts ‘completely disagree’/’mostly disagree’ on the one hand with ‘mostly
agree’/’completely agree’ on the other, meaning how respondents on the third and fourth step of
the ladder differ from those on the first two steps. The same logic applies to the third and the
final panel of the table when the effect of covariates are estimated for the contrast between
‘completely disagree’, ‘mostly disagree’, and ‘mostly agree’ vs. ‘completely agree.’ The main
purpose of this analysis is to correctly identify the statistical significance and direction of the
derived log-odd coefficients for the hypothesised variables. The positive sign of predictors across
three panels of Table 3 would suggest that independent variables have a positive association with
attitudes towards Stalin, by contrast if coefficients have a negative sign then independent
variables are negatively associated with Stalin’s perceptions.6
Starting with the analysis of H1 on socialization in Table 2, respondents’ generational
belonging, appears to be the strongest explanation of support towards Stalin. When compared to
those born in 1985-94, all earlier born cohorts have more positive attitudes towards Stalin.
Expectedly, the Second World War (born in 1925-34) and immediate post-war Stalinist (born in
1935-44) generations are Stalin’s strongest supporters, while attitudes among respondents born
6 Obvious exception is Model 3 in which respondents’ agreement with survey question reflects negative
attitudes towards Stalin. Therefore we should expect a negative sign if covariates positively associate
with the perception of Stalin.
32
later in time trend downward. The Second World War generation is especially against the
statement that Stalin was a cruel, inhuman tyrant, responsible for the deaths of millions of
innocent people (β=–2.12, p<.01, in panel 2). It is also interesting that individuals born in 1975-
84 (β=–0.68, p<.01) still have more positive ideas about Stalin than the generation of the
independent Georgia. In H2 we assumed that education would be negatively associated with
attitudes towards Stalin, but years of education exhibit only weak, if any, links with our
dependent variables. Furthermore, better educated people counter intuitively tend to agree that
the more important thing than the crimes committed by Stalin is that under his leadership the
Soviet people won the Second World War. Respondents’ self-reported proficiency in Russian
has negative association with attitudes towards Stalin. In all three panels of Table 2, log-odd
coefficients have negative values which clearly suggest that people with the advanced knowledge
of Russian language are more likely to completely disagree or mostly disagree that Stalin was a
wise leader who brought power and prosperity to the Soviet Union.
Table 2 about here
As expected, rural residents are much more likely to express positive attitudes towards Stalin.
Most obviously this can be seen in the second panel of the table which contrasts ‘completely
disagree’/’mostly disagree’ vs. ‘mostly agree’/’completely agree’ answer options. Panel 3 of the
regression output also suggests that Tbilisi residents are more likely than others to completely
agree with the statement that Stalin was a cruel, inhuman tyrant, responsible for the deaths of
millions of innocent people. Contrary to H2 and the results of the bivariate analysis, objective
socioeconomic conditions operationalised with a dummy variable for unemployment and the
33
number of households’ items exhibits virtually no association with attitudes towards Stalin. The
unemployed are more likely to perceive that Stalin brought power and prosperity to the Soviet
Union, but this association only holds at the 10% significance level. The subjective perception of
socioeconomic status of respondents’ families appears to be more important for our dependent
variables which can be seen in all coefficients of the second and third panels in Table 2 that have
negative signs and are statistically significant.
When testing H3, we do not find that perceptions of democracy and authoritarianism are
linked with attitudes towards the Soviet dictator, however those who believe that democracy is
the preferable political system are more likely to choose option answer options ‘mostly disagree’,
‘mostly agree’, ‘completely agree’ than ‘completely disagree’ when asked if Stalin was a wise
leader. On the other hand, in line with our hypothesis, the respondent’s views towards
privatization appear to be the significant predictor of attitudes towards the Soviet dictator. Those
who think that private ownership of business and industry should be increased are much more
likely to disagree that Stalin brought power and prosperity to the Soviet Union and that people
will always have need of a leader like Stalin. On the other hand, those respondents who think
that government ownership of business and industry should be increased are likely to disagree
that Stalin was responsible for the deaths of millions of innocent people.
H4 on nationalism is tested with the ethnicity variable in which Armenian and
Azerbaijani respondents are compared with Georgians in their attitudes towards Stalin.
Unexpectedly, we find that non-Georgian ethnic groups are more likely to express positive
attitudes towards Stalin than do Georgians. It is also interesting that Azerbaijani residents of
Georgia, on the one hand, think that Stalin was a cruel, inhuman tyrant, responsible for the
deaths of millions of innocent people, but, on the other hand, they are more likely to agree that

34
people will always have need of a leader like Stalin, who will come and restore order. Azeri
respondents in Georgia are also more likely to think that Stalin was a wise leader and that the
victory in the Second World War is more important than all his shortcomings. Although religious
people are less likely to choose the answer option completely agree in Model 2, the effect is not
statistically significant for any other panel or dependent variable. In line with our hypothesis, the
perception that Russia is the biggest enemy of Georgia is negatively associated with the
perception that Stalin was a wise leader who brought power and prosperity to the Soviet Union.
The same people also disagree that under Stalin’s leadership the Soviet people won the Second
World War. Ending with the analysis of H5 on gender the first and the second panels of Table 2
suggest that males are more likely to express positive attitudes towards Stain which is indicated
with positive and statistically significant values of coefficients from generalized ordered logit
regressions in Models 1, 3 and 4.
Overall, the results partially or fully confirm our hypotheses and suggest that
representatives of older generations, rural residents, people with poor Russian skills, subjectively
deprived individuals, ethnic Azerbaijanis, those who think Russia is not Georgia’s biggest
enemy, those who support government’s ownership of business and industry, and males exhibit
stronger support for Stalin. To understand the scale of the effect of these variables we utilise the
aggregated index of positive perceptions of Stalin. As we describe in Appendix 1, 0 points in this
variable means that for the four questions about Stalin respondents hold extremely negative
ideas, while those who score 12 points respond completely positively on all four questions. This
form of the dependent variable allows us to see clearly how each independent variable is
associated with attitudes towards the Soviet dictator. Figure 2 provides a clear illustration of the
specific effect of independent variables. As hypothesized, demographic cleavage provides the

35
strongest explanation of the cumulative index of attitudes towards Stalin. Respondents born
before 1934 and between 1935-44 score respectively 8.4 (SD .32) and 8.2 (SD .22) in our
dependent variables, while the youngest cohorts born in 1985-94 score only 5.3 (SD .21) points
in our cumulative Stalin support index. Moving up by one level in the proficiency in Russian
leads to –.23 lower score in the aggregated dependent variable. Those who claim that they know
Russian at an advanced level score 6.4 (SD .14) in the index of Stalin support. Salient differences
are also observed between individuals living in rural and urban settlements. If rural residents
score on average 7.3 (SD .13) points, residents both in Tbilisi and other urban areas score 6.4
(with SD .15 and .11). Subjective perception of respondents’ household socioeconomic status is
also an important predictor of attitudes towards Stalin. Moving up one ladder on this scale is
associated with a .24 points reduction of the dependent variable. Those who classify their
families in the lowest two income ladders score 7.2 (SD .21) points, while those perceiving
themselves in seventh or eighth ladder score only 5.8 (SD .25) points in the Stalin’s aggregated
index.
Figure 2 about here
For H3 those who completely support the idea that private ownership of business and industry
should be increased (scoring 9/10 in this indicator) are much less likely to express positive
perceptions of Stalin (6.3, SD .14) than those who think that government ownership of business
and industry should be increased (7.4, SD .20). Unlike the previous results for H4 on the ethnic
differences in terms of Stalin’s perceptions in Georgia, for the cumulative index of four
dependent variables we do not observe statistically significant differences between Georgians,
Armenians, Azerbaijanis and other ethnicities living in Georgia. However, non-Georgian
36
ethnicities score higher in their support of Stalin, but the low number of observations for them
produces large standard errors which prevents us from making any definitive conclusions.
Believing that Russia is the biggest enemy of Georgia is also associated with our dependent
variable. Those who consider that Georgia’s northern neighbour is the biggest foreign threat to
the country score 6.4 (SD .12) points which is about .5 points lower than the score of those
individuals who do not perceive Russia as Georgia’s biggest enemy. Finally, we once again
confirm the effect of gender as males express .41 points higher support for Stalin than females.
Cleavages within generations
The bivariate and multivariate analysis presented above suggests that birth year and generational
attachment are the strongest explanations of variance in our dependent variables, but in addition
settlement type, subjective income rung, belief in private ownership, the perception of Russia as
the biggest enemy of Georgia, and gender are the key explanatory variables that are linked with
attitudes towards Stalin in Georgia. It is not clear if any cleavages exist within the defined
generations. This is a substantively and statistically important question because it will allow one
to see what the important covariates, if any, make some elderly respondents exhibit negative
attitudes toward Stalin when most of the age peers in their demographic group judge Stalin
positively. More importantly, this analysis allows us to observe why some individuals in the
youngest demographic group are positive about Stalin, when they are expected to be indifferent
or express negative attitudes toward the late Soviet leader. To answer this question we interact
the key explanatory factors with respondents’ birth years starting from the 1920s and ending in
the 1990s. The interpretation of Figure 3 is straightforward: the main lines in the diagrams show
37
the marginal effects of covariates, while dashed lines give 95% confidence intervals. The effect
is statistically significant when confidence intervals do not cross the horizontal zero reference
line.7 Although we are not able to follow the developments in time because attitudes might
change across an individual's life course, the analysis in this section is helpful in understanding
what to expect in the long run in terms of attitudes towards Stalin.
Figure 3a shows marginal effects of settlement in rural areas according to the
respondent’s birth year. Our main analysis suggests that much more positive attitudes towards
Stalin are held in rural areas than in Tbilisi and other urban settlements, but interaction effects
showed that the within-generational gap between rural and urban residents intensifies, especially
for those born in 1960s or later. Among individuals born in 1935-44, urban-rural differences are
virtually non-existent (shown in 95% confidence interval cross zero reference line), but for the
cohorts born after the 1970s rural residents score on average 1 points higher than urban residents
in our cumulative index of attitudes towards Stalin. The reason why the rural-urban divide is
more intense among the recent generations is not entirely clear, but we can speculate that
differences in access to electronic media, levels of social capital, and other areas of
socioeconomic development are much more pronounced between rural and urban youth than is
the case for rural and urban elderly.
Next, we analyse generational differences in terms of subjective socioeconomic status of
respondents’ households. Figure 3b indicates that for individuals born after the 1970s, moving up
on subjective income rung is associated with about .3 points decrease in support of Stalin in our
7 We again do not report interactions of birth year with education, objective socioeconomic status and
religiosity because these variables proved to be insignificant in explaining attitudes towards Stalin
across and within generations.
38
cumulative dependent variable. In general we know that those individuals who classify
themselves in the highest rung of socio-economic status (in the pooled survey analysis) hold
negative perceptions of Stalin, but the differences are especially apparent among the youngest
generations who were born after 1970s. In fact the group which is subjectively richest in
Georgian society exhibits the lowest support of Stalin among all other demographic and
socioeconomic groups (β=3.7, SD .38). Our explanation for this trend is that the youngest
generations who feel socially and economically excluded from society (those who rank
themselves in bottom of 10 ladder hierarchy) might think of Stalin in association of the old
communist regime and the relative prosperity of the Soviet Union. This finding suggests that
socioeconomic status might be one of the few important vectors which explain the differences in
perception of Stalin among the youngest residents in Georgia.
Figure 3 about here
We analyse the interaction effects between the respondents’ birth year and their ideologies and
nationalist variables in terms of attitudes towards private ownership of business and industry and
perceived international threat. Interestingly the interaction effect in Figure 3e suggests that
attitudes about Russia do make a difference for perceptions of Stalin among the elderly. More
specifically, those who were born before the 1970s and believe that Russia in the biggest enemy
of Georgia exhibit .5 to 1 point lower support for the Soviet dictator. For instance, in the
generation 1945-54, those who answer ‘Russia’ when asked which country is the biggest enemy
of Georgia score 6.5 (SD .32) in the support of Stalin index, while for those who feel otherwise
this score reaches 7.9 points (SD .23). The perception of Russia is only important in

39
understanding Stalin attitudes in the generations which exhibited the highest support for the
Soviet dictator. This category of respondents is probably ideologically close to Soviet dissidents
who opposed to the Soviet regime and it most notorious leader. This speculation is also
supported by Figure 3c which shows interaction effect between birth year and attitudes towards
private property. Again, moving one step up in support for private ownership of business and
industry reduces positive perceptions of Stalin by .1 to .2 points for cohorts born before 1970. It
appears that among the elderly ideological differences is the most salient factor which
differentiates the supporters and the opponents of Stalin in Georgia, while it does not make any
difference in attitudes among the youngest generations.
To analyse within generational cleavages in ethnicity we combine all non-Georgians in
our sample as a distinct category.8 Figure 3d suggests that differences between Georgians and
other ethnicities in their attitudes towards Stalin become statistically significant for those born
after 1970s. However it has to be mentioned that a few cases for non-Georgians produce large
standard errors and does not reveal the real effect of ethnic vector in perceptions of Stalin.
However, if anything, Georgians exhibit weaker support for Stalin and this ethnic divide is likely
to be higher for the recent generations than among the elderly. Finally, the importance of gender
for preferences towards Stalin within separate birth cohorts is shown in Figure 3f. The results
suggest that the higher support of Stalin among men is primarily derived from individuals born
before 1970s. Males and females of the two latest generations are not statistically different from
each other. For instance, among those born before 1934, males express 1.77 (p<.01) points
higher support for Stalin than, while for the generation that grew up in an independent Georgia
8 This is done because the low number of observations for non-Georgian ethnicity does not permit making
statistically significant tests across consecutive birth cohorts.

40
this difference is not statistically significant. Stronger attachment of elderly men to Stalin can be
related to his military leadership during the Second World War which becomes a less relevant
factor among the younger generations.
Predicting Attitudes towards Stalin
After presenting across and within generational analysis of socialization, social structural,
ideological, nationalist, and gender hypotheses, we can tentatively speculate how attitudes
towards Stalin will evolve over time. The fourth president of Georgia stated in 2013 that in the
future Stalin would be perceived as a great politician and military leader (Margvelashvili, 2013).
We are unaware what kind of evidence his statement was based on, but our findings allow us to
speculate how public attitudes can evolve along changes in covariates which were identified as
important factors in explaining the perception of Stalin. We assert with the high level of certainty
that positive attitudes towards Stalin should gradually decline in Georgia. First and foremost, this
trend will be determined by the reproduction of demographic cohorts. We know that consecutive
generations in 20th century Georgia substantially differ in their childhood experiences and
attitudes towards Stalin adopted during formative years persist across the life course of these
individuals. Since the major cleavages in Stalin’s perception come from cohort differences, the
replacement of the older cohorts with the younger ones should lead to sizable decline in positive
perceptions of Stalin. The results of our analysis suggest that the most positive attitudes towards
Stalin are held by individuals born before 1950s. Considering the current average life
expectancy, 73.3 years, and its slow growth in Georgia, individuals born in 1920s-1940s (scoring
more than 8 points in our cumulative dependent variable) will be replaced by the younger
cohorts (scoring 7 points in the same index) by the end of 2020s. At the same time, the relative

41
share of the cohorts born in independent Georgia will increase and these are demographic
cohorts which express the lowest sympathies towards Stalin (about 5.5 in the aggregated Stalin
support index) among all other groups with various characteristics.
One of the most important factors of changing attitudes towards Stalin could be economic
development and trends of urbanization in Georgia. We have seen that rural residents express
significantly higher sympathies towards Stalin and therefore the gradual reallocation of
population towards urban areas will affect attitudes towards the Soviet dictator. Although in
between 1985-2010 the level of urbanization virtually stayed unaffected or even declined, the
United Nations, as shown in Table 3, predicts urbanization levels to reach 66.4% by 2050 from
52.7% in 2010 (United Nations 2012). More importantly, our results also suggest that subjective
perception of socioeconomic status is negatively associated with positive attitudes towards
Stalin. The strongest determinant of subjective economic perceptions is objective economic
development (Evans and Kelley 2004). In 1995-2010, the Georgian economy grew by 6% on
average (World Bank 2012), if this trend continues and Georgia becomes more prosperous,9 this
may impact attitudes towards the Soviet era and Stalin. The main channel through which
economic growth is expected to affect perceptions of Stalin is that people will be less likely to
have nostalgia for the relative prosperity and economic security of the Soviet Union and its main
architect – Josef Stalin. Time-series analysis of Caucasus Barometer in 2008-2013 suggests that
the share of those households that define themselves at the lowest 1-4 steps on 10-steps ladder
decreased from 66% to 47%, while the share of the highest 4 steps increased from 4% to 12% in
the last 5 years (CRRC 2013).
9 In fact, 6% annual growth is enough to double the nominal GDP every 12 years.

42
Table 3 about here
Some influence on attitudes towards Stalin will probably stem from the geopolitical situation in
Georgia and its foreign relations with Russia. The overall perception of Stalin can deteriorate if
animosity between these countries remain high, however the effect might stem primarily for
those born before the 1980s because the perception of Russia does not make much difference
among the youngest generations. Gradual movement towards establishing the rule of law, the
respect of private property, the dominance of private ownership which were observed in the last
decade (Gwartney, Lawson, and Hall 2013) could also undermine the admiration of the Soviet
leader who was the architect of policies which are incompatible with a free market economy.
Nonetheless, the analysis of Caucasus Barometer in 2011-2013 suggest that the share of those
who think that private ownership of business and industry should increase declined from 56% to
42%, while the share of those who support government ownership increased from 23% to 30%.
Yet, we still expect that the joint effect of cohort replacement, structural changes, primarily
through economic growth and urbanization, and the prevalence of liberal views on economy and
politics will decrease positive perception of Stalin in Georgian society.
Although we do not find that education has any effect on attitudes towards Stalin,
integrating into the school curriculum more critical information about the Stalinist years might
have an effect on the formation of attitudes among young cohorts in the future. Various public
awareness campaigns are unlikely to have a dramatic effect on attitudes towards Stalin among
those already socialized but they might generate the formation of more negative perception of
Stalin in the new generations. As made evident by the different patterns of Stalin support in

43
Russia, education, popular culture, and political discourse all play a role in impacting public
sentiment. Scholars have demonstrated deep ambivalence towards Stalin among Russian youth
and a proclivity to mimic the Putin regime's political stances on a number of issues (Mendelson
and Gerber 2008). Their research revealed that 56% felt Stalin did more good than bad, 51%
agreed that Stalin was a wise leader, and that 19% would definitely or probably vote for Stalin if
he were running for office today. These higher than expected levels of appreciation for Stalin
among Russian youth indicate that discourses that actively aim to rehabilitate Stalin can create a
new generation of Stalin admirers. That being said, a focus on reassessing the past and
destalinization would produce more critical views on Stalin (Mendelson and Gerber 2006).
Conclusion
Examining Stalin is not (only) an historical exploration, as Stalin is not (only) a part of the past,
but "is still a figure of the present" (de Waal 2013b: 5). Ironically, after more than half a century
after the British press described Krushchev becoming a new Soviet leader as “Stalin is Dead,
Long Live Stalin” (The New London Evening Day 1955) this metaphor is still relevant to refer to
the contemporary public sentiments about Stalin in post-Soviet space in general and in Russia
and Georgia in particular. Stalin remains a dominant figure, symbol, and presence in
contemporary post-Soviet space. Despite suggestions otherwise (Lipman 2013), one can still
readily encounter reminders, representations, and images of Stalin in many parts of the former
Soviet Union, such as in Moscow or Tbilisi. Stalin's persistent popularity and his increasing
presence in public space, which can be encountered in a wide variety of formats – whether on a
wine label, a biography, on a poster, or in a monument – has been dubbed by Eugenie Ikhlov as
44
the phenomenon of Stalinshchina, or Stalin nostalgia (Anders 2005). Furthermore, this issue
"goes to the heart of contemporary questions about politics, the relationship between society and
state, democratization, and education in the former Soviet Union" (de Waal 2013b: 3).
This analysis has served to provide evidence from the survey data that both validates and
challenges typically invoked reasons that seek to explain people's admiration of Stalin, as well as
introducing novel explanations that have heretofore not been entertained. Not only do we
contribute to the emerging academic debate on the role of Stalin in contemporary post-Soviet
socio-political life, but also we connect the broader theories on political attitudes with the
idiosyncratic characteristics of Stalin’s legacy in Georgia. Several hypotheses that had been seen
as conventional wisdom, but previously only had anecdotal evidence to support it, are now
confirmed through sustained statistical methodologies. This includes the idea that older
generations and those who think that they are poorer view Stalin more positively, and that
pejorative associations abound in those who consider Russia to be the biggest threat to Georgia
and among those who value private ownership. This study also rejects other well-trodden
assumptions, like education level and religiosity, and shows that these factors have little to no
effect on how people judge Stalin. We also are able to offer up an intriguing twist in regards to
ethnicity, as non-Georgian minorities in Georgia, if anything, show even higher esteem for Stalin
than Georgians, although more research needs to be conducted to better validate this finding due
to the low numbers of non-Georgian respondents in our sample.
Our analysis reveals that the continuing persistence of Stalin in Georgia is mitigated by a
number of factors. The 8 main variables that influence attitudes on Stalin are depicted in Figure
2. Elderly, poor men from rural areas have the most positive associations of Stalin, while young,
wealthier women from cities judge Stalin negatively. Those with an advanced level of Russian

45
language ability, who perceive Russia as Georgia's biggest threat, and who are open to
privatization also view Stalin more harshly. Overall, age is the most significant factor as an
explanatory variable for attitudes towards Stalin, with older generations having the highest levels
of support and the youngest age cohort having the lowest. The analysis of cleavages within
generations also reveals the differences in covariates of Stalin’s perception among the youngest
and the oldest residents of Georgia. If gender, the perception of Russia as the biggest threat for
Georgia, and attitudes towards private ownership of business and industry are the most important
factors that affect support of Stalin among the elderly, subjective income rung, rural-urban
inequalities, and ethnicity are the major explanations why some youngsters still maintain a
positive image of Stalin. Our findings do indicate a clear downward trend of positive perceptions
of Stalin, and as time progresses demographic shifts and economic development will eliminate
those who were socialized within Stalin's personality cult or have nostalgia for Soviet economic
security, thus reducing a large portion of Stalin admirers from Georgian society.
Although we do not find strong links between attitudes towards democracy,
authoritarianism, and the perception of Stalin, thoughts about Ioseb Besarionis Dze Jugashvili
still can be proxies for the type of regime and political leader Georgian society is willing to
accept. Thus what people think about the Soviet dictator can have political consequences today
and can affect the future development of the region. We must remain cautious about the growing
gap between pride in Stalin between the elderly and the youth. While admiration for Stalin may
be weaker among the youth, so too is the amount of knowledge they have about Stalin. This
latter point, coupled with higher levels of ambiguity towards Stalin, leaves room for the
possibility that the meaning of Stalin can change once again. If destalinization is not engendered
in Georgia in school curriculum and the media, then it is entirely possible for Stalin to become a

46
renewed symbol of national pride, and be (re)invoked as a political tool, which can shape a new
generation and produce young Stalin admirers, just as studies of youth in Russian have shown
(Mendelson and Gerber 2005-2006; Mendelson and Gerber 2006). This will be an important
issue to follow and it remains to be seen how the current “Georgian Dream” coalition and
consecutive, hopefully democratically elected, governments will deploy the image of Stalin for
their own political agenda (Dixon Klump 2013).

47
References
Alwin, Duane F, and Jon A Krosnick. 1991. “Aging, Cohorts, and the Stability of Sociopolitical Orientations Over the Life Span.” American Journal of Sociology 97 (1) (July): 169–195. doi:10.1086/229744.
Andersen, Robert. 2012. “Support for Democracy in Cross-National Perspective: The Detrimental Effect of Economic Inequality.” Research in Social Stratification and Mobility 30 (4): 389–402. doi:http://dx.doi.org/10.1016/j.rssm.2012.04.002.
Bahry, Donna. 1993. “Society Transformed? Rethinking the Social Roots of Perestroika.” Slavic Review 52 (3) (January): 512. doi:10.2307/2499722.
Bakke, Kristin M., John O’Loughlin, and Michael D. Ward. 2009. “Reconciliation in Conflict-Affected Societies: Multilevel Modeling of Individual and Contextual Factors in the North Caucasus of Russia.” Annals of the Association of American Geographers 99 (5) (October 30): 1012–1021. doi:10.1080/00045600903260622.
Bakradze, Lasha. 2013. “Georgia and Stalin: Still Living Eith the Great Son of the Nation.” In The Stalin Puzzle: Deciphering Post-Soviet Public Opinion, edited by Thomas De Waal, 47–54. Washington D.C.: Carnegie Endowment for International Peace.
Bhabha, Homi. 1990. Nation and Narration. New York: Routledge.
Bilinsky, Yaroslav. 1999. “Was the Ukrainian Famine of 1932–1933 Genocide?” Journal of Genocide Research 1 (2) (June): 147–156. doi:10.1080/14623529908413948.
Billig, Michael. 1995. Banal Nationalism. London: SAGE.
Blauvelt, Timothy K. 2009. “Status Shift and Ethnic Mobilisation in the March 1956 Events in Georgia.” Europe-Asia Studies 61 (4) (June): 651–668. doi:10.1080/09668130902826246.
———. 2013. “Endurance of the Soviet Imperial Tongue: The Russian Language in Contemporary Georgia.” Central Asian Survey 32 (2) (June): 189–209. doi:10.1080/02634937.2013.771978.
Boehmke, Frederick J. 2008. “GRINTER: A Stata Utility to Graph Interaction Effects after Regression Models (Version 1.5”. Iowa City: University of Iowa.
Boym, Svetlana. 2001. The Future of Nostalgia. New York: Basic Books.
Brambor, Thomas, William Roberts Clark, and Matt Golder. 2006. “Understanding Interaction Models: Improving Empirical Analyses.” Political Analysis 14 (1): 63–82. doi:10.1093/pan/mpi014.

48
Breslauer, George W. 1978. “On the Adaptability of Soviet Welfare-State Authoritarianism.” In Soviet Society and the Communist Party, edited by Karl W. Ryavec, 3–25. Amherst: University of Massachusetts Press.
Brooks, Clem, and Catherine Bolzendahl. 2004. “The Transformation of US Gender Role Attitudes: Cohort Replacement, Social-Structural Change, and Ideological Learning.” Social Science Research 33 (1) (March): 106–133. doi:10.1016/S0049-089X(03)00041-3.
Carnaghan, Ellen, and Donna Bahry. 1990. “Political Attitudes and the Gender Gap in the USSR.” Comparative Politics 22 (4) (July): 379–399. doi:10.2307/421970.
Chelidze, Ana. 2014. “Ethno-Nationalistic and Religious-Nationalistic Components of Identity in Post-Soviet Georgia.” Occasional Papers on Religion in Eastern Europe 34 (2): 1–20.
Chinn, Jeff, and Robert Kaiser. 1996. Russians as the New Minority: Ethnicity and Nationalism in the Soviet Successor States. Boulder: Westview.
Cohen, Stephen F. 1982. Rethinking the Soviet Experience: Politics and History Since 1917. New York: Basic Books.
Colton, Timothy J, and Michael Mcfaul. 2002. “Are Russians Undemocratic?” Post-Soviet Affairs 18 (2): 91–121. doi:10.1080/1060586X.2002.10641515.
CRRC. 2012. “Caucasus Barometer”. Tbilisi: Caucasus Research Resource Center. http://www.crrccenters.org/caucasusbarometer/.
———. 2013. “Caucasus Barometer Time-Series Dataset Georgia”. Tbilisi: Caucasus Research Resource Center. http://caucasusbarometer.org/en/cb-ge/codebook/.
Dalton, Russell J. 1994. “Communists and Democrats: Democratic Attitudes in the Two Germanies.” British Journal of Political Science 24 (4) (January 27): 469–493. doi:10.1017/S0007123400006967.
Danilova, Maria. 2005. “Dictator Stalin Stirs Nostalgia as Russians Remember War.” Seattle Times, May 9. http://seattletimes.com/html/nationworld/2002268263_stalin09.html.
De Waal, Thomas. 2013a. “The Stalin Puzzle: Deciphering Post-Soviet Public Opinion”. Washington D.C.: Carnegie Endowment for International Peace.
———. 2013b. “Introduction.” In The Stalin Puzzle: Deciphering Post-Soviet Public Opinion, edited by Thomas De Waal, 1–6. Washington D.C.: Carnegie Endowment.
Ekman, Joakim, and Jonas Linde. 2005. “Communist Nostalgia and the Consolidation of Democracy in Central and Eastern Europe.” Journal of Communist Studies and Transition Politics 21 (3) (September): 354–374. doi:10.1080/13523270500183512.

49
Etkind, Alexander. 2013. Warped Mourning: Stories Of The Undead In The Land Of The Unburied. Stanford: Stanford University Press.
Evans, M D R, and Jonathan Kelley. 2004. “Subjective Social Location: Data From 21 Nations.” International Journal of Public Opinion Research 16 (1) (March 1): 3–38. doi:10.1093/ijpor/16.1.3.
Fendrich, James Max, and Kenneth L Lovoy. 1988. “Back to the Future: Adult Political Behavior of Former Student Activists.” American Sociological Review 53 (5) (October): 780. doi:10.2307/2095823.
Finkel, S. E., S. Humphries, and K.-D. Opp. 2001. “Socialist Values and the Development of Democratic Support in the Former East Germany.” International Political Science Review 22 (4) (October 1): 339–361. doi:10.1177/0192512101022004004.
Forest, Benjamin, and Juliet Johnson. 2002. “Unraveling the Threads of History: Soviet–Era Monuments and Post–Soviet National Identity in Moscow.” Annals of the Association of American Geographers 92 (3) (September): 524–547. doi:10.1111/1467-8306.00303.
Fuchs, Roland J, and George J Demko. 1979. “Geographic Inequality under Socialism.” Annals of the Association of American Geographers 69 (2) (June): 304–318. doi:10.1111/j.1467-8306.1979.tb01259.x.
George, Julie a. 2014. “Can Hybrid Regimes Foster Constituencies? Ethnic Minorities in Georgian Elections, 1992–2012.” Electoral Studies (March): 1–18. doi:10.1016/j.electstud.2014.02.007.
Gibson, James L. 1996. “A Mile Wide But an Inch Deep(?): The Structure of Democratic Commitments in the Former USSR.” American Journal of Political Science 40 (2) (May): 396–420. doi:10.2307/2111630.
Gudkov, Lev. 2013. “The Archetype of the Leader: Analyzing a Totalitarian Symbol.” In The Stalin Puzzle: Deciphering Post-Soviet Public Opinion, 29–44. Washington D.C.: Carnegie Endowment.
Gugushvili, Alexi. 2011. “Understanding Poverty in Georgia.” Caucasus Analytical Digest 34 (December 21): 15–18.
———. 2013. “Social Origin, Education and Occupation in Georgia.” Caucasus Social Science Review 1 (1): 1–26.
Gwartney, James, Robert Lawson, and Joshua Hall, ed. 2013. Economic Freedom of the World: 2013 Annual Report. Washington D.C.: Fraser Institute. http://www.freetheworld.com/datasets_efw.html.

50
Hahn, Jeffrey W. 1991. “Continuity and Change in Russian Political Culture.” British Journal of Political Science 21 (4) (January 27): 393–421. doi:10.1017/S0007123400006232.
Hahn, Jeffrey W., and Igor Logvinenko. 2008. “Generational Differences in Russian Attitudes towards Democracy and the Economy.” Europe-Asia Studies 60 (8) (October): 1345–1369. doi:10.1080/09668130802292168.
Hobsbawm, Eric. 1983. “Mass-Producing Tradition: Europe 1870-1914.” In The Invention of Traditon, edited by Eric Hobsbawm and Ternece Ranger, 263–308. Cambridge: Cambridge University Press.
Hochschild, Adam. 1995. The Unquiet Ghost: Russians Remember Stalin. New York: Penguin.
Inglehart, Ronald. 1988. “The Renaissance of Political Culture.” The American Political Science Review 82 (4) (December): 1203–1230. doi:10.2307/1961756.
Jennings, M Kent, and Gregory B Markus. 1984. “Partisan Orientations over the Long Haul: Results from the Three-Wave Political Socialization Panel Study.” The American Political Science Review 78 (4) (December): 1000–1018. doi:10.2307/1955804.
Jones, Stephen. 1992. “Georgia: The Long Battle for Independence.” In Nationalism and the Breakup of Empire: Russia and Its Periphery, 73–96. Westport: Praeger.
Kalinin, Ilya. 2011. “Nostalgic Modernization: The Soviet Past as ‘Historical Horizon.’” Slavonica 17 (2) (November): 156–166. doi:10.1179/136174211X13122749974366.
Kara-Murza, Vladimir. 2013. “Resurrecting Stalin – Again.” World Affairs 6 February. Http://www.worldaffairsjournal.org/blog/vladimir-kara-murza/resurrecting-stalin-%E2%80%94-again.
Kaufman, Stuart. 2001. Modern Hatreds: The Symbolic Politics of Ethnic War. Ithaca: Cornell University Press.
Kemp-Welch, Tony. 1996. “Khrushchev’s ‘secret Speech’ and Polish Politics: The Spring of 1956.” Europe-Asia Studies 48 (2) (March): 181–206. doi:10.1080/09668139608412343.
Khinkulova, Kateryna. 2012. “Hello, Lenin? Nostalgia on Post-Soviet Television in Russia and Ukraine.” Journal of European Television History and Culture 1 (2): 94–104.
Kikodze, Archil. 2012. “Playing Wuth Statues.” In Playing with Statues: Stalin Here and Now, edited by Henrich Boell Foundation, 17–27. Tbilisi, Georgia: Henrich Boell Foundation South Caucasus Regional Office.
Kitaevich, Evgenia Jane. 2014. “History That Splinters: Education Reforms and Memory Politics in the Republic of Georgia.” Southeast European and Black Sea Studies 14 (2) (May 2): 319–338. doi:10.1080/14683857.2014.906089.

51
Kolossov, Vladimir, and Gerard Toal. 2007. “An Empire’s Fraying Edge? The North Caucasus Instability in Contemporary Russian Geopolitical Culture.” Eurasian Geography and Economics 48 (2) (January 1): 202–225. doi:10.2747/1538-7216.48.2.202.
Kozlov, Vladimir .A. 1999. Massovye Besporyadki v SSSR Pri Khrushcheve I Brezhneve—1953–1980 Gody. Novosibirsk: Khronograf.
Krosnick, Jon A., and Duane F. Alwin. 1989. “Aging and Susceptibility to Attitude Change.” Journal of Personality and Social Psychology 57 (3): 416–425. doi:10.1037/0022-3514.57.3.416.
Lee, Moonyoung. 2011. “Nostalgia as a Feature of ‘Glocalization’: Use of the Past in Post-Soviet Russia.” Post-Soviet Affairs 27 (2) (April 1): 158–177. doi:10.2747/1060-586X.27.2.158.
Lipman, Maria. 2013. “Stalin Is Not Dead: A Legacy That Holds Back Russia.” In The Stalin Puzzle: Deciphering Post-Soviet Public Opinion, edited by Thomas In De Waal, 15–26. Washington D.C.: Carnegie Endowment.
Marsh, Rosalind. 2007. Literature, History and Identity in Post-Soviet Russia, 1991 – 2006. Oxford: Peter Lang.
Medvedev, Roy. 2005. “Stalin Lives.” Project Syndicate 29 March. http://www.project-syndicate.org/commentary/stalin-lives.
Mendelson, Sarah E., and Theodore P. Gerber. 2005. “Soviet Nostalgia: An Impediment to Russian Democratization.” The Washington Quarterly 29 (1) (December): 83–96. doi:10.1162/016366005774859661.
———. 2006. “Failing the Stalin Test: Russians and Their Dictator.” Foreign Affairs 85 (1): 2–8. doi:10.2307/20031837.
———. 2008. “Us and Them: Anti-American Views of the Putin Generation.” The Washington Quarterly 31 (2) (April): 131–150. doi:10.1162/wash.2008.31.2.131.
Metskhvarishvili, Maya. 2013. “Ilia II: I Love Russia Very Much, Stalin Was Religious.” Netgazeti 31 July (July 31). http://netgazeti.ge/GE/105/News/22214/.
Munro, Neil. 2006. “Russia’s Persistent Communist Legacy: Nostalgia, Reaction, and Reactionary Expectations.” Post-Soviet Affairs 22 (4) (January 1): 289–313.
Neundorf, Anja. 2010. “Democracy in Transition: A Micro Perspective on System Change in Post-Socialist Societies.” The Journal of Politics 72 (4) (October 1): 1096–1108. doi:10.1017/S0022381610000551.
52
Nodia, G. O. (Georgii Otarovich). 1995. “Georgia’s Identity Crisis.” Journal of Democracy 6 (1): 104–116. doi:10.1353/jod.1995.0014.
O’Loughlin, John, Vladimir Kolossov, and Gerard Toal. 2011. “Inside Abkhazia: Survey of Attitudes in a De Facto State.” Post-Soviet Affairs 27 (1) (January 1): 1–36.
O’Loughlin, John, Gerard Toal, and Vladimir Kolossov. 2008. “The Localized Geopolitics of Displacement and Return in Eastern Prigorodnyy Rayon, North Ossetia.” Eurasian Geography and Economics 49 (6) (November 1): 635–669. doi:10.2747/1539-7216.49.6.635.
Pop-Eleches, Grigore, and Joshua A Tucker. 2014. “Communist Socialization and Post-Communist Economic and Political Attitudes.” Electoral Studies 33 (0): 77–89. doi:http://dx.doi.org/10.1016/j.electstud.2013.06.008.
Popov, N. P. 2008. “Nostalgia for Greatness—Russia in the Post-Soviet Space.” Sociological Research 47 (5) (September 1): 36–51. doi:10.2753/SOR1061-0154470502.
Pratto, Felicia, Lisa M. Stallworth, and Jim Sidanius. 1997. “The Gender Gap: Differences in Political Attitudes and Social Dominance Orientation.” British Journal of Social Psychology 36 (1) (March 6): 49–68. doi:10.1111/j.2044-8309.1997.tb01118.x.
Reif, K, and G Cunningham. 1993. “Dataset: Central and Eastern Eurobarometer 3 (Political Desintegration)”. GESIS - Leibniz Institute for the Social Sciences, Cologne, Germany. http://zacat.gesis.org.
Reisinger, William M, Arthur H Miller, and Vicki L Hesli. 1995. “Political Norms in Rural Russia: Evidence from Public Attitudes.” Europe-Asia Studies 47 (6) (September): 1025–1042. doi:10.1080/09668139508412303.
Reisinger, William M., Arthur H. Miller, Vicki L. Hesli, and Kristen Hill Maher. 1994. “Political Values in Russia, Ukraine and Lithuania: Sources and Implications for Democracy.” British Journal of Political Science 24 (2) (March 3): 183–223. doi:10.1017/S0007123400009789.
Roller, Edeltraud. 1994. “Ideological Basis of the Market Economy: Attitudes toward Distribution Principles and the Role of Government in Western and Eastern Germany.” European Sociological Review 10 (2): 105–117.
Rose, Richard, and Ellen Carnaghan. 1995. “Generational Effects on Attitudes to Communist Regimes: A Comparative Analysis.” Post-Soviet Affairs 11 (1): 28–56.
Rosenberg, Tina. 1996. The Haunted Land: Facing Europe’s Ghosts After Communism. New York: Vintage.
Ruble, Blair A. 1987. “The Social Dimensions of Perestroy.” Soviet Economy 3 (2): 171–183. doi:10.1080/08826994.1987.10641276.

53
Ryder, Norman B. 1965. “The Cohort as a Concept in the Study of Social Change.” American Sociological Review 30 (6) (December): 843–861. doi:10.2307/2090964.
Satter, David. 2012. It Was a Long Time Ago and It Never Happened Anyway: Russia and the Communist Past. New Haven: Yale University Press.
Shapiro, Robert Y., and Harpreet Mahajan. 1986. “Gender Differences in Policy Preferences: A Summary of Trends From the 1960s to the 1980s.” Public Opinion Quarterly 50 (1) (January): 42. doi:10.1086/268958.
Slider, Darrell. 1997. “Democratization in Georgia.” In Conflict, Cleavage, and Change in Central Asia and the Caucasus, edited by Karen Dawisha and Bruce Parrott, 156–198. Cambridge: Cambridge University Press.
Slysz, Gregory. 2010. “Crafting a Suitable Past.” Transitions Online 29 Novembe.
Smith, Kathleen E. 1996. Remembering Stalin’s Victims: Popular Memory and the End of the USSR. Ithaca: Cornell University Press.
Smith, Tom W. 1984. “The Polls: Gender and Attitudes Toward Violence.” Public Opinion Quarterly 48 (1) (January): 384–396. doi:10.1086/268834.
Snow, David A, E Burke Rochford, Steven K Worden, and Robert D Benford. 1986. “Frame Alignment Processes, Micromobilization, and Movement Participation.” American Sociological Review 51 (4) (August): 464–481. doi:10.2307/2095581.
Sullivan, Charles J. 2013. “Missing the Soviet Motherland: Nostalgia for the USSR in Russia Today.” http://www.globalinterests.org/wp-content/uploads/2013/03/Missing-the-Soviet-Motherland-Nostalgia-for-the-USSR-in-Russia-Today.pdf.
Suny, Ronald Grigor. 1994. The Making of the Georgian Nation. Bloomington: Indiana University Press.
———. 2006. “Nationalism, Nation Making, & the Postcolonial State of Asia, Africa, & Eurasia.” In After Independence, edited by Lowell W Barrington, 279–295. Ann Arbor: University of Michigan Press.
The New London Evening Day. 1955. “Long Live Stalin: Malenkov’s Fall Is Received with ‘Forboding’ in Europe.” The New London Evening Day, February 8. http://news.google.com/newspapers?nid=1915&dat=19550208&id=zREiAAAAIBAJ&sjid=EXQFAAAAIBAJ&pg=1772,1220962.
Toal, Gerard, and Magdalena Frichova Grono. 2011. “After Ethnic Violence in the Caucasus: Attitudes of Local Abkhazians and Displaced Georgians in 2010.” Eurasian Geography and Economics 52 (5) (September 1): 655–678. doi:10.2747/1539-7216.52.5.655.

54
Toal, Gerard, and John O’Loughlin. 2013. “Inside South Ossetia: A Survey of Attitudes in a De Facto State.” Post-Soviet Affairs 29 (2): 136–172. doi:10.1080/1060586X.2013.780417.
Togeby, Lise. 1994. “The Gender Gap in Foreign Policy Attitudes.” Journal of Peace Research 31 (4) (November 1): 375–392. doi:10.1177/0022343394031004002.
United Nations. 2012. World Population Prospects: The 2011 Revision. New York: United Nations.
Vachridze, Zaza. 2012. “Two Faces of Nationalism and Efforts to Establish Georgian Identity.” Identity Studies 4: 1–7. http://ojs.iliauni.edu.ge/index.php/identitystudies/article/view/47/35.
Vashakidze, Nika. 2013. “The Role of 9 March 1956 in the Formation of Georgian Ethnopsychic.” Iveria 30 April. http://iveria.biz/18-1956-wlis-9-martis-roli-qartuli-etnofsiqikis-formirebasi.html.
Végso, Roland. 2013. “Stalin’s Boots and the March of History (Post-Communist Memories).” Cultural Critique 83 (Winter): 31–62. http://muse.jhu.edu/journals/cultural_critique/v083/83.vegs.html.
Visser, Penny S., and Jon A. Krosnick. 1998. “Development of Attitude Strength over the Life Cycle: Surge and Decline.” Journal of Personality and Social Psychology 75 (6): 1389–1410. doi:10.1037/0022-3514.75.6.1389.
Wegren, Stephen K. 1994. “Rural Reform and Political Culture in Russia.” Europe-Asia Studies 46 (2) (January): 215–241. doi:10.1080/09668139408412159.
Wildavsky, Aaron. 1987. “Choosing Preferences by Constructing Institutions: A Cultural Theory of Preference Formation.” American Political Science Review 81 (1) (March): 3. doi:10.2307/1960776.
Williams, Richard. 2006. “Generalized Ordered Logit/partial Proportional Odds Models for Ordinal Dependent Variables.” The Stata Journal 6 (1): 58–82. http://www.stata-journal.com/article.html?article=st0097.
World Bank. 1999. “Georgia: Poverty and Income Distribution. (In Two Volumes) Volume I: Main Report”. Washington, D.C. : Poverty Reduction and Economic Managemen Unit, Europe and Central Asia Region.
———. 2009. “Georgia: Poverty Assessment”. Human Development Sector Unit, South Caucasus Country Unit, Europe and Central Asia Region.
———. 2012. “World Development Indicators 2012”. Washington, D.C.: World Bank.
Yasmann, Victor. 2006. “Russia: Nostalgia for USSR Increases.” Radio Free Europe/Radio Liberty 23 Decembe. http://www.rferl.org/content/article/1073655.html .
55
Zedania, Giga. 2011. “Societal Values in Georgia: Twenty Years Later.” In 20 Years after the Collapse of Communism: Expectations, Achievements and Disillusions of 1989, edited by Nicolas Hayoz, Leszek Jesien, and Daniela Koleva, 253–272. Bern: Peter Lang.
———. 2012. “The Rise of Religious Nationalism in Georgia.” Identity Studies 3: 120–128. http://www.identitystudies.ac.ge/index.php/IStudies/article/view/38.

56
Appendix 1
Overview of analyzed generations
In our analysis the earliest generation consists of people born before 1935 who have experienced
the Second World War in their early childhood and adolescence. This generation for the obvious
reasons is the smallest in our sample, 5.0%, but its members are expected to exert the strongest
support for Stalin. The Stalinist generation covers individuals who were born during the Second
World War, 1935-1944, and were socialised in the immediate post-war period when Stalin was
heavily idolized through the mechanism of his prolific personality cult. This generation takes up
10.0% of our sample and we can hypothesize that it will also exhibit strong support towards
Stalin and his policies. The size of the next generation in our dataset is 13.4% and it includes
individuals born between 1945 and 1954. They can be labelled the post-Stalinist generation
because they experienced their early adulthood socialization after Stalin’s death in 1953.
The following generation is comprised of respondents born in 1955-1964 and it is the
largest in our sample – 19.1%. In line with Rose and Carnaghan’s (1995) classification, this
generation can be referred to as the social contract cohort, a group promised more goods and
benefits (see Breslauer 1978), as well as living alongside growing corruption, and some major
antisocialist events such as the Prague Spring. We label individuals born in the 1965-1974 era as
the Glasnost generation, 17.2%, as their conscious socialization took place in the late 70s or early
80s. Our transition generation consists of individuals born between 1975-1984, 18.4% of the
sample. These people acutely experienced post-communist transition in the formative years of
their lives. Lastly, the independence generation covers people born in the 1985-1994 period, who
formed their opinions in newly independent Georgia in the late 1990s and 2000s. The share of

57
this generation is 17.0% and they are expected to exhibit the most negative attitudes towards
Stalin.
Overview of employed statistical methods
The descriptive statistics of our four independent variables suggest high variance of attitudes
towards Stalin among our respondents which allows us to use various statistical techniques to
test the formulated hypotheses. We start the examination of the survey data with bivariate
analysis by testing the strength of associations between four dependent variables and the
described explanatory factors. This is done with the help of univariate analysis of variances
(ANOVA). We examine F-ratios, their statistical significance and η2 (eta squared) values for
separate dependent and independent variables. The larger the F-ratio value, the greater the
likelihood that the differences between the means of answer options are due to something other
than chance alone. On the other hand, η2 is the fraction of the overall variance attributable to
differences among the group means. This approach is a simple but effective method to derive
preliminary confirmation or rejection of any associations between dependent and independent
variables. Nonetheless, even if we identify significant links between dependent and independent
variables this cannot be a conclusive indication that an independent variable has statistically
significant association with the dependent variables. Our correlative analysis also investigates if
independent variables are associated with other explanatory factors. This approach allows us to
narrow down our attention to the specific independent variables in our multivariate analysis of
potential explanations of variance in the dependent variables.
We employ two regression specifications in the multivariate analysis. The ordinal form
the dependent variables (from completely disagree=1 to completely agree=4) permits the
58
estimation of simple ordered logistic regressions, but the parallel regression assumption in these
models is often violated. In this case, the coefficients that describe the relationship between, for
instance, ‘completely disagree vs. mostly disagree, mostly agree, completely agree’ should be
identical to the coefficients that describe the relationship between ‘completely disagree, mostly
disagree vs. mostly agree, completely agree.’ Indeed, the conducted Brant Test of the parallel
regression assumption indicates that in each fitted model, the parallel-lines model assumption
was violated for several independent variables such as gender, type of settlement, education and
ethnicity. Among several alternatives to the ologit model such as multinomial logit and linear
probability models (for the created binary answer option), we employ the maximum-likelihood
generalised ordered logit model, which relaxes the proportional odds assumption and allows the
effects of the independent variables to vary across ordered categories of the dependent variable
(Williams 2006). Moreover, the output of generalised ordered logit regressions is relatively
straightforward to interpret which will be explained in details in the results section. We also
calculate robust standard errors.
Ordered variables on attitudes towards Stalin i= β0 i + γ Generation i + χ Social structural variables i
+ φ 3 Ideology i + θ Nationalism i + λ Gender i + ε i
(1)
In Model 1 β0i and εi represent the intercept and error terms, respectively. The described ordered
dependent variables and generalized ordered logit models are helpful for identifying the strength,
statistical significance and the direction of associations between the dependent and independent
variables, but these approaches are less useful in understanding the scale of impact of
independent variables on attitudes towards Stalin. To address this problem we derive the
cumulative index of perception of the Soviet dictator by the survey respondents. This is done by
59
combining answers on the dependent variables from completely disagree=1 to completely
agree=4 into a single index of attitudes towards Stalin. We reversed answer options for question
3 because higher scores indicated negative attitudes towards Stalin in contrast to the other
dependent variables. Both factor loading of these variables, all above .40 with Eigenvalue of
Factor 1=1.58, and their scale reliability coefficient, 0.72, suggest that the derived index is a
relevant aggregated measure of attitudes towards Stalin. In order to make the results easier to
interpret, we rescale answer options to completely disagree=0 to completely agree=3. Therefore
0 points (4*0) in the cumulative index means that for all four questions the respondent holds
extremely negative ideas about Stalin (2.1% of the sample), while those who score 12 points
(4*3) have extremely positive attitudes towards the Soviet dictator (4.7% of the sample).
Formatting the dependent variable in this fashion allows us to see clearly how each independent
variable is associated with attitudes about Stalin. Since the derived dependent variable varies
from 0 to 12, using ordinary least squares (OLS) models presents itself as the most convenient
option. In order to simplify presentation of results we produce linear prediction of attitudes
towards Stalin conditioned by each category of our independent variables.
Attitudes towards Stalin i= �����1�� + βn Birth year i + βn Birth year * Social structural variables + βn Birth
year * Ideology i + βn Birth year * Nationalism i + βn Birth year * Gender i
(2)
Finally, to understand how social structural, ideological, nationalism and gender variables differ
in their effect on attitudes towards Stalin within consecutive generations, we investigate the
effect of those factors across respondents’ birth cohort. We use the same specifications as in
Model 1 with the index of attitudes towards Stalin as the dependent variable, but this time with
an addition of interaction terms of generations and other hypothesised independent variables that

60
proved to be statistically significant in the earlier bivariate and multivariate analysis.
Furthermore, we substitute the dummy variables for seven generations with a more precise year
of birth variable which allows us to linearly follow change in attitudes along with individual
years, conditioned by other independent variables. We include in Model 2 all constitutive terms
of interaction effects which increases the size of standard errors and makes it less likely that the
coefficient on the interaction term will be significant10 (Brambor, Clark, and Golder 2006). Since
the interpretation of interaction terms in regression models is often misleading, we employ a
simple figure that succinctly illustrates the marginal effect of hypothesised variables and the
corresponding standard errors across a substantively meaningful range of the modifying variable,
respondents’ birth year, ranging from the 1920s to the 1990s. We use state command Grinter to
visualize interaction effects and corresponding standard errors (Boehmke 2008).
10 Nonetheless this does not justify the omission of constitutive terms in interaction models.

61
Appendix 2
Table 1a: Pairwise correlation between independent variables Covariates 1 2 3 4 5 6 7 8 9 10 11 12 13 1 Birth cohorts
– – – – – – – – – – – – – – – – – – – – – – – – – –
2 Years of education .195 (.000)
– – – – – – – – – – – – – – – – – – – – – – – –
3 Proficiency in Russian .010 (.688)
.386 (.000)
– – – – – – – – – – – – – – – – – – – – – –
4 Proficiency in English .457 (.000)
.339 (.000)
.219 (.000)
– – – – – – – – – – – – – – – – – – – –
5 Settlement –.162 (.000)
–.316 (.000)
–.311 (.000)
–.342 (.000)
– – – – – – – – – – – – – – – – – –
6 Unemployment .255 (.000)
–.036 (.139)
–.003 (.915)
–.013 (.615)
–.023 (.352)
– – – – – – – – – – – – – – – –
7 Number of households items .267 (.000)
.378 (.000)
.257 (.000)
.331 (.000)
–.403 (.000)
–.058 (.021)
– – – – – – – – – – – – – –
8 Subjective income rung .190 (.000)
.186 (.000)
.131 (.000)
.208 (.000)
–.065 (.008)
–.085 (.001)
.462 (.000)
– – – – – – – – – – – –
9 Attitudes towards democracy –.046 (.061)
–.099 (.000)
–.104 (.000)
.072 (.004)
.054 (.029)
.025 (.311)
–.075 (.002)
–.108 (.000)
– – – – – – – – – –
10 Attitudes towards privatization .030 (.222)
.041 (.094)
.042 (.085)
.099 (.000)
–.091 (.000)
–.045 (.066)
.112 (.000)
.086 (.001)
–.062 (.011)
– – – – – – – –
11 Ethnicity .044 (.071)
.126 (.000)
.017 (.496)
.049 (.050)
–.072 (.004)
–.023 (.344)
.017 (.493)
.030 (.230)
–.126 (.000)
.013 (.588)
– – – – – –
12 Religiosity –.002 (.865)
.056 (.000)
.145 (.000)
.098 (.000)
.010 (.405)
–.037 (.003)
.051 (.000)
.088 (.000)
.020 (.148)
–.068 (.000)
–.248 (.000)
– – – –
13 Russia is the biggest enemy .043 (.078)
.071 (.004)
.012 (.608)
.039 (.114)
–.084 (.001)
–.048 (.049)
.059 (.018)
.068 (.006)
–.077 (.002)
.033 (.184)
.041 (.095)
–.036 (.004)
– –
14 Gender .044 (.070)
.016 (.515)
.105 (.000)
–.114 (.000)
.105 (.000)
.119 (.000)
.002 (.928)
.041 (.098)
–.032 (.198)
–.003 (.884)
–.019 (.441)
–.098 (.000)
.040 (.107)
Notes: P-values are shown in parentheses. Source: Authors’ calculations based on data from Caucasus Barometer (CRRC 2012).

62
Tables
Table 1: Univariate analysis of variances (ANOVA) tests for attitudes about Stalin
Dependent variables Dependent
variable: 1 Dependent variable: 2
Dependent variable: 3
Dependent variable: 4
'Stalin was a wise leader who brought power and prosperity to the Soviet Union'
'The most important thing is that under Stalin’s leadership the Soviet people won the WWII'
'Stalin was a cruel, inhuman tyrant, responsible for the deaths of millions of innocent people'
'Our people will always have need of a leader like Stalin, who will come and restore order'
Independent variables F-ratio (η2) F-ratio (η2) F-ratio (η2) F-ratio (η2) Birth cohorts 25.4 (0.07)*** 16.8 (0.05)*** 29.0 (0.09)*** 38.6 (0.11)*** Years of education 3.62 (0.03)*** 2.22 (0.01)*** 3.41 (0.02)*** 4.75 (0.04)*** Proficiency in Russian 9.96 (0.01)*** 6.93 (0.01)*** 10.9 (0.02)*** 18.5 (0.03)*** Proficiency in English 35.1 (0.05)*** 8.62 (0.02)*** 20.9 (0.03)*** 42.1 (0.07)*** Settlement 41.5 (0.03)*** 21.5 (0.02)*** 35.8 (0.04)*** 53.5 (0.06)*** Unemployment 0.04 (-0.00) 0.88 (-0.00) 6.37 (0.00)** 5.78 (0.00)** Number of households items 16.1 (0.05)*** 10.4 (0.03)*** 11.4 (0.04)*** 17.0 (0.06)*** Subjective income rung 8.73 (0.03)*** 14.4 (0.05)*** 5.62 (0.02)*** 6.95 (0.03)*** Attitudes towards democracy 0.84 (-0.00) 2.54 (0.00)* 8.20 (0.01)*** 5.92 (0.01)*** Attitudes towards privatization 6.77 (0.01)*** 7.57 (0.00)*** 5.32 (0.01)*** 9.21 (0.02)*** Ethnicity 0.61 (-0.00) 13.1 (0.01)*** 1.24 (-0.00) 10.6 (0.01)*** Religiosity 1.42 (0.00) 6.59 (0.01)*** 2.88 (0.01)*** 3.11 (0.01)*** Russia is the biggest enemy 21.9 (0.01)*** 11.2 (0.01)*** 19.0 (0.01)*** 10.9 (0.01)*** Gender 7.04 (0.00)*** 1.23 (0.00) 2.21 (0.00) 3.34 (0.00)*
Notes: Notes: ***, **, and * denote statistical significance at the 0.01, 0.05, and 0.10 levels. Source: Authors’ calculations based on data from Caucasus Barometer (CRRC 2013).

63
Table 2: Covariates of Attitudes towards Stalin in Georgia Log-odds from generalized logistic regressions
Model 1 Model 2 Model 3 Model 4 'Stalin was a wise
leader who brought power and prosperity to the Soviet Union'
'The most important thing is that under Stalin’s leadership the Soviet people won the WWII'
'Stalin was a cruel, inhuman tyrant, responsible for the deaths of millions of innocent people'
'Our people will always have need of a leader like Stalin, who will come and restore order'
Coef (Robust std err.)
Coef (Robust std err.)
Coef (Robust std err.)
Coef (Robust std err.)
1. Completely disagree vs. Mostly disagree, mostly agree, completely agree
Cohort 1925-34 1.64 (0.79)** 13.7 (1.03)*** –2.26 (0.51)*** 2.23 (0.49)*** Cohort 1935-44 1.60 (0.60)*** –0.96 (1.25) –1.78 (0.48)*** 1.43 (0.29)*** Cohort 1945-54 1.39 (0.46)*** 0.55 (0.82) –1.04 (0.48)** 1.08 (0.25)*** Cohort 1955-64 0.77 (0.37)** –0.70 (0.77) –0.95 (0.47)** 0.66 (0.22)*** Cohort 1965-74 0.37 (0.31) 0.17 (0.67) –0.34 (0.50) 0.48 (0.22)** Cohort 1975-84 0.38 (0.32) 0.15 (0.65) 0.02 (0.52) 0.42 (0.21)** Years of education –0.06 (0.04) –0.16 (0.08)** 0.01 (0.04) –0.02 (0.03) Proficiency in Russian –0.40 (0.18)** –0.49 (0.31) 0.02 (0.14) –0.21 (0.09)** Proficiency in English 0.02 (0.14) 0.72 (0.24)*** 0.06 (0.15) –0.00 (0.08) Tbilisi residence 0.30 (0.27) 1.18 (0.56)** –0.32 (0.28) –0.48 (0.15)*** Rural residence 0.84 (0.38)** 1.64 (0.50)*** –0.68 (0.24)*** 0.07 (0.16) Unemployed 0.21 (0.26) –0.69 (0.51) –0.16 (0.26) –0.05 (0.15) Material items –0.04 (0.07) 0.11 (0.11) –0.07 (0.06) –0.02 (0.04) Subjective income rung –0.07 (0.10) –0.79 (0.17)*** 0.06 (0.06) –0.00 (0.04) Democracy is preferable 1.06 (0.42)** 0.52 (0.96) 0.57 (0.32)* –0.41 (0.29) Authoritarian is preferable 0.84 (0.51)* –1.39 (0.89) 0.64 (0.45)* –0.14 (0.34) Privatization –0.05 (0.05) –0.19 (0.07)*** 0.10 (0.03)*** –0.10 (0.02)*** Armenian ethnicity 0.70 (0.87) –1.02 (1.29) 2.42 (1.04)** 0.92 (0.36)** Azerbaijani ethnicity –0.47 (0.96) 0.00 (0.00) 15.2 (0.41)*** –18.1 (0.60)*** Other ethnicity –0.34 (0.74) 1.04 (0.82) –0.45 (0.47) 0.43 (0.39) Religiosity 0.06 (0.07) 0.12 (0.14) 0.03 (0.05) 0.02 (0.03) Russia is the biggest enemy –0.67 (0.23)*** –0.67 (0.35)* 0.24 (0.21) 0.03 (0.13) Gender (Male=1) 0.85 (0.25)*** 0.63 (0.39) –0.17 (0.19) 0.26 (0.13)* Constant 2.88 (0.76)*** 9.34 (1.91)*** 1.85 (0.79)** 1.85 (0.51)***
2. Completely disagree, Mostly disagree vs. Mostly agree, completely agree
Cohort 1925-34 1.90 (0.55)*** 0.64 (0.49) –2.29 (0.35)*** 1.85 (0.36)*** Cohort 1935-44 1.79 (0.35)*** 1.32 (0.40)*** –1.81 (0.29)*** 1.75 (0.28)*** Cohort 1945-54 1.08 (0.28)*** 0.93 (0.35)** –1.35 (0.27)*** 0.91 (0.25)*** Cohort 1955-64 0.54 (0.25)** 0.93 (0.30)*** –1.21 (0.26)*** 0.62 (0.24)** Cohort 1965-74 0.36 (0.24) 0.44 (0.28) –0.85 (0.26)*** 0.47 (0.25)* Cohort 1975-84 0.45 (0.23)* 0.18 (0.26) –0.70 (0.26)*** 0.22 (0.25) Years of education –0.04 (0.03) 0.07 (0.03)** –0.00 (0.02) –0.02 (0.02) Proficiency in Russian –0.15 (0.11) –0.25 (0.13)* 0.24 (0.09)*** –0.19 (0.09)* Proficiency in English –0.00 (0.09) 0.11 (0.11) –0.08 (0.09) –0.05 (0.09) Tbilisi residence 0.30 (0.16) –0.19 (0.22) –0.06 (0.17) 0.10 (0.17) Rural residence 1.01 (0.19)*** 0.42 (0.22)* –0.34 (0.14)*** 0.42 (0.15)*** Unemployed 0.24 (0.17)* 0.26 (0.21) 0.04 (0.16) 0.08 (0.16) Material items –0.04 (0.04) 0.03 (0.05) 0.06 (0.04) –0.08 (0.04)*

64
Model 1 Model 2 Model 3 Model 4 'Stalin was a wise
leader who brought power and prosperity to the Soviet Union'
'The most important thing is that under Stalin’s leadership the Soviet people won the WWII'
'Stalin was a cruel, inhuman tyrant, responsible for the deaths of millions of innocent people'
'Our people will always have need of a leader like Stalin, who will come and restore order'
Coef (Robust std err.)
Coef (Robust std err.)
Coef (Robust std err.)
Coef (Robust std err.)
Subjective income rung –0.15 (0.05)*** –0.35 (0.06)*** 0.05 (0.04) –0.08 (0.04)** Democracy is preferable 0.42 (0.31) –0.78 (0.45)* –0.06 (0.25) –0.07 (0.27) Authoritarian is preferable 0.62 (0.38)* –0.45 (0.52) –0.53 (0.31)* 0.30 (0.32) Privatization –0.10 (0.03)*** 0.00 (0.03) 0.07 (0.02)*** –0.08 (0.02)*** Armenian ethnicity –0.45 (0.31) 0.88 (0.59) 0.06 (0.30) 0.35 (0.28) Azerbaijani ethnicity 0.00 (0.72) 0.00 (0.00) 1.43 (0.65)** 16.9 (0.41)*** Other ethnicity –0.02 (0.43) –0.12 (0.48) –0.04 (0.37) 0.42 (0.37) Religiosity 0.00 (0.03) –0.03 (0.04) 0.01 (0.03) –0.00 (0.04) Russia is the biggest enemy –0.34 (0.14)** –0.33 (0.17)** 0.13 (0.13) –0.20 (0.14) Gender (Male=1) 0.55 (0.15)*** 0.17 (0.17) –0.30 (0.13)** 0.24 (0.13)* Constant 2.25 (0.54)*** 3.40 (0.66)*** 0.59 (0.47) 0.33 (0.48)
3. Completely disagree, mostly disagree,. mostly agree vs. completely agree
Cohort 1925-34 1.17 (0.31)*** 0.86 (0.31)*** –2.25 (0.48)*** 1.42 (0.45)*** Cohort 1935-44 1.43 (0.26)*** 1.16 (0.24)*** –1.35 (0.28)*** 1.33 (0.42)*** Cohort 1945-54 1.10 (0.25)*** 0.74 (0.23)*** –1.09 (0.24)*** 0.61 (0.39)* Cohort 1955-64 0.57 (0.24)** 0.59 (0.21)*** –0.74 (0.22)*** 0.12 (0.39) Cohort 1965-74 0.54 (0.23)** 0.51 (0.21)*** –0.48 (0.22)** –0.10 (0.44) Cohort 1975-84 0.37 (0.23) 0.19 (0.21) –0.39 (0.21)* 0.04 (0.41) Years of education 0.03 (0.02) 0.05 (0.02)** 0.01 (0.02) 0.03 (0.03) Proficiency in Russian –0.02 (0.08) –0.04 (0.08) 0.21 (0.09)** –0.05 (0.12) Proficiency in English –0.07 (0.08) 0.01 (0.08) –0.10 (0.08) –0.12 (0.16) Tbilisi residence 0.18 (0.15) 0.13 (0.14) 0.33 (0.15)** 0.42 (0.27) Rural residence 0.41 (0.14)*** 0.20 (0.13) –0.10 (0.15) 0.89 (0.22)*** Unemployed 0.24 (0.14)* 0.14 (0.13) 0.01 (0.14) –0.09 (0.23) Material items –0.03 (0.03) –0.04 (0.03) –0.01 (0.04) –0.07 (0.06) Subjective income rung –0.08 (0.04)** –0.12 (0.04)*** 0.09 (0.04)** –0.12 (0.06)** Democracy is preferable 0.36 (0.25) 0.16 (0.23) 0.09 (0.27) 0.30 (0.37) Authoritarian is preferable 0.18 (0.31) 0.28 (0.28) –0.60 (0.34) –0.24 (0.51) Privatization –0.07 (0.02)*** –0.03 (0.02)* 0.04 (0.02)* –0.10 (0.03)*** Armenian ethnicity –0.29 (0.28) –0.12 (0.28) –0.41 (0.33) –0.13 (0.43) Azerbaijani ethnicity 1.11 (0.58)** 15.8 (0.32)*** –0.79 (0.61) 1.53 (0.60)*** Other ethnicity –0.36 (0.38) –0.28 (0.34) –0.32 (0.36) 0.90 (0.46)** Religiosity –0.02 (0.03) –0.07 (0.03)*** –0.03 (0.03) –0.04 (0.04) Russia is the biggest enemy –0.32 (0.12)** –0.19 (0.12) 0.26 (0.12)* –0.19 (0.19) Gender (Male=1) 0.14 (0.12) 0.11 (0.11) –0.18 (0.12) 0.29 (0.19) Constant –0.92 (0.45)** –0.18 (0.43) –1.04 (0.46)** –1.79 (0.71)***
Statistics Observations 1497 1511 1390 1367 AIC 3412 3035 3492 3402 McFadden’s Pseudo R2 0.09 0.09 0.08 0.11
Notes: ***, **, and * denote statistical significance at the 0.01, 0.05, and 0.10 levels. Source: Authors’ calculations based on data from Caucasus Barometer (CRRC 2012).
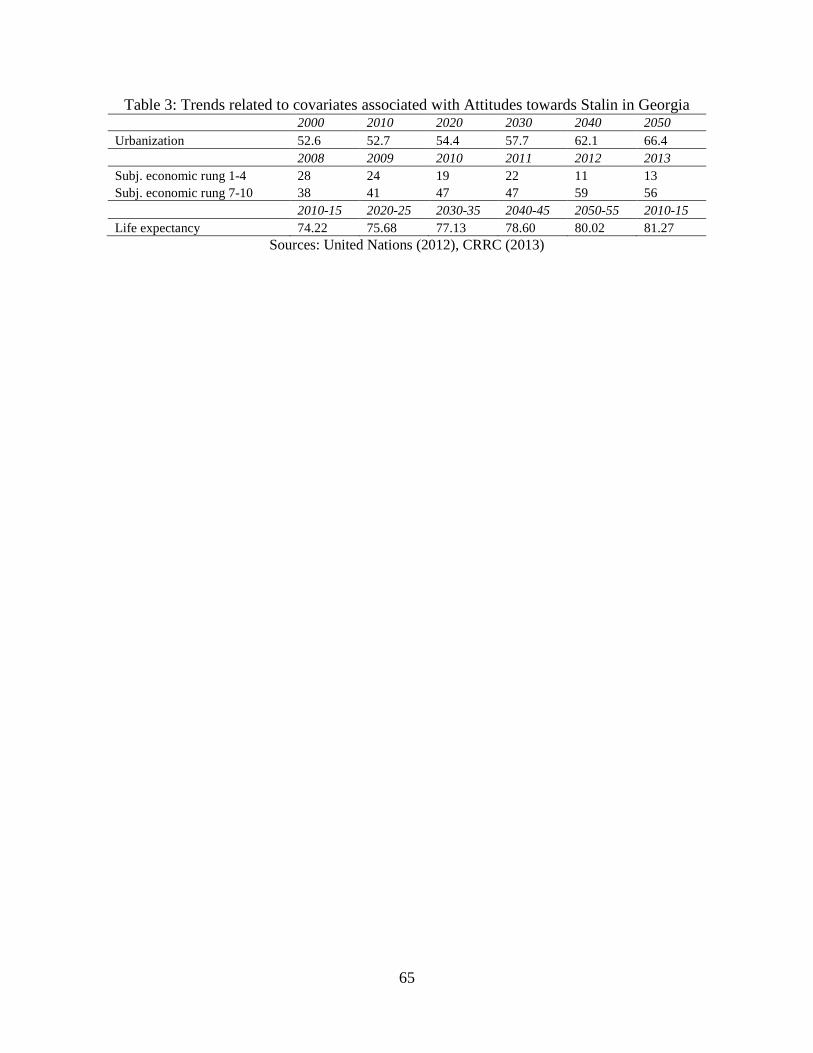
65
Table 3: Trends related to covariates associated with Attitudes towards Stalin in Georgia 2000 2010 2020 2030 2040 2050
Urbanization 52.6 52.7 54.4 57.7 62.1 66.4 2008 2009 2010 2011 2012 2013 Subj. economic rung 1-4 28 24 19 22 11 13 Subj. economic rung 7-10 38 41 47 47 59 56 2010-15 2020-25 2030-35 2040-45 2050-55 2010-15 Life expectancy 74.22 75.68 77.13 78.60 80.02 81.27
Sources: United Nations (2012), CRRC (2013)
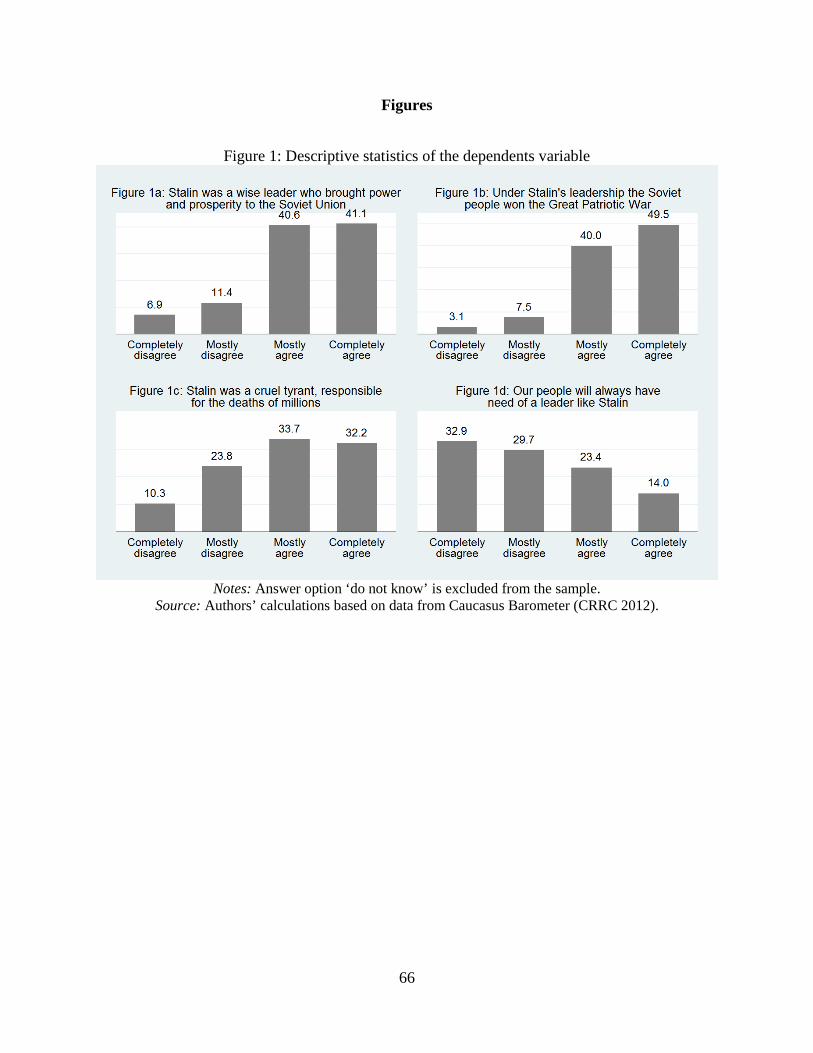
66
Figures
Figure 1: Descriptive statistics of the dependents variable
Notes: Answer option ‘do not know’ is excluded from the sample.
Source: Authors’ calculations based on data from Caucasus Barometer (CRRC 2012).

67
Figure 2: Linear predictions of covariates of attitudes towards Stalin (0=oppose Stalin, 12= support Stalin)
Notes: Bars represent 95% confidence intervals. Coefficients show the effect when controlling for all other variables.
Source: Authors’ calculations based on data from Caucasus Barometer (CRRC 2012).

68
Figure 3: The marginal effect of settlement, subjective income rung, attitudes towards privatization, non-Georgian ethnicity, the perception of Russia, and gender on
cumulative index of perception of Stalin across respondents’ birth years
Notes: Interaction effects derive from models with the same specification as in Table 1. Dashed lines give 95% confidence interval. Source: Authors’ calculations based on data
from Caucasus Barometer (CRRC 2012).