Arsenic removal from high-arsenic water by enhanced coagulation with ferric ions and coarse calcite
Upload
independentCategory
view
0download
0
This article appeared in a journal published by Elsevier. The attachedcopy is furnished to the author for internal non-commercial researchand education use, including for instruction at the authors institution
and sharing with colleagues.
Other uses, including reproduction and distribution, or selling orlicensing copies, or posting to personal, institutional or third party
websites are prohibited.
In most cases authors are permitted to post their version of thearticle (e.g. in Word or Tex form) to their personal website orinstitutional repository. Authors requiring further information
regarding Elsevier’s archiving and manuscript policies areencouraged to visit:
http://www.elsevier.com/copyright
Author's personal copy
Stable isotope-guided analysis of biomagnification profiles of arsenic species ina tropical mangrove ecosystem
Nguyen Phuc Cam Tu a, Tetsuro Agusa b,c, Nguyen Ngoc Ha b, Bui Cach Tuyen d,1, Shinsuke Tanabe b,Ichiro Takeuchi a,⇑a Faculty of Agriculture, Ehime University, Tarumi 3-5-7, Matsuyama, Ehime 790-8566, Japanb Center for Marine Environmental Studies (CMES), Ehime University, Bunkyo-cho 2-5, Matsuyama, Ehime 790-8577, Japanc Department of Legal Medicine, Shimane University Faculty of Medicine, Enya 89-1, Izumo, Shimane 693-8501, Japand Research Institute for Biotechnology and Environment (RIBE), Nong Lam University, Hochiminh City, Vietnam
a r t i c l e i n f o
Keywords:Arsenic speciesArsenobetaineBiomagnificationStable isotope ratioTropical mangrove ecosystemVietnam
a b s t r a c t
We performed stable carbon and nitrogen-guided analyses of biomagnification profiles of arsenic (As)species, including total As, lipid-soluble As, eight water-soluble As compounds (arsenobetaine (AB), arse-nocholine (AC), tetramethylarsonium ion (TETRA), trimethylarsine oxide (TMAO), dimethylarsinic acid(DMA), monomethylarsonic acid (MMA), arsenate (As[V]), and arsenite (As[III])), and non-extracted Asin a tropical mangrove ecosystem in the Ba Ria Vung Tau, South Vietnam. Arsenobetaine was the predom-inant As species (65–96% of water-soluble As). Simple linear regression slopes of log-transformed concen-trations of total As, As fractions or individual As compounds on stable nitrogen isotopic ratio (d15N) valuesare regarded as indices of biomagnification. In this ecosystem, lipid-soluble As (slope, 0.130) and AB(slope, 0.108) were significantly biomagnified through the food web; total As and other water-solubleAs compounds were not. To our knowledge, this is one of the first reports on biomagnification profilesof As compounds from a tropical mangrove ecosystem.
� 2011 Elsevier Ltd. All rights reserved.
1. Introduction
In the last decade, arsenic (As), a metalloid released from bothnatural and anthropogenic sources, has been detected in variousbiota and environmental samples across South Vietnam (e.g.,Ikemoto et al., 2008a; Tu et al., 2008a,b; Agusa et al., 2009). Thereis concern about sources and concentrations in food items that arefrequently consumed by humans and wildlife. Arsenic ranks as thenumber one toxic agent in the Agency for Toxic Substances andDisease Registry Priority List of Hazardous Substances (ATSDR,2007). Toxicity, bioavailability and trophic transfer of As dependon its chemical form (Neff, 1997). Generally, toxicity of inorganicAs (arsenate, As[V] and arsenite, As[III]) is higher than that ofmethylated molecules, such as monomethylarsonic acid (MMA),dimethylarsinic acid (DMA), trimethylarsine oxide (TMAO) andtetramethylarsonium ion (TETRA) (Gebel, 2001). Arsenobetaine(AB) and other organoarsenic compounds found in seafoods arenot toxic, mutagenic, or carcinogenic when ingested in food by
mammals (Neff, 1997). Marine algae are able to accumulate dis-solved As[V] from seawater and then synthesize organoarseniccompounds including MMA, DMA and several As-containing ribo-sides (Francesconi and Edmonds, 1994). Arsenobetaine is the mostabundant form of As in marine animals, including fish, crustaceans,and mollusk (Francesconi and Edmonds, 1993). The origin of AB inanimals is likely to be the As-containing ribosides in algae(Francesconi and Edmonds, 1994). The sources of other Ascompounds found in the marine environment are still not clear.
The determination of As species in a variety of samples from dif-ferent trophic levels might help reveal the biosynthetic pathway ofAs in marine environments and its transfer through food chains. Todate, there have been few studies of the accumulation and distri-bution of As compounds in marine animals in relation to trophicstatus (Goessler et al., 1997; Kirby and Maher, 2002; Kirby et al.,2002; Foster et al., 2005, 2006, 2008; Khokiattiwong et al., 2009),and none has used stable isotope analysis to guide determinationsof trophic level-dependent accumulation of As compounds in mar-ine food webs.
In order to evaluate food web structure and energy pathways inaquatic ecosystems, stable isotope ratio analyses of bio-elementssuch as carbon and nitrogen have become increasingly useful fortracing contaminants in food webs. In general, the stable nitrogenisotope ratio (d15N) of a predator is about 3–5‰ higher on averagethan that of its prey (Minagawa and Wada, 1984), allowing identi-
0025-326X/$ - see front matter � 2011 Elsevier Ltd. All rights reserved.doi:10.1016/j.marpolbul.2011.03.002
⇑ Corresponding author. Address: Department of Life Environment Conservation,Faculty of Agriculture, Ehime University, Tarumi 3-5-7, Matsuyama, Ehime 790-8566, Japan. Tel./fax: +81 89 946 9899.
E-mail address: [email protected] (I. Takeuchi).1 Present address: Vietnam Environmental Protection Administration, 67 Nguyen
Du Street, Hai Ba Trung District, Hanoi, Vietnam.
Marine Pollution Bulletin 63 (2011) 124–134
Contents lists available at ScienceDirect
Marine Pollution Bulletin
journal homepage: www.elsevier .com/locate /marpolbul

Author's personal copy
fications of species’ trophic position in a food web. In contrast, thestable carbon isotope ratio (d13C) increases only slightly withincreasing trophic level (about 1‰ per trophic level). For this rea-son, d13C is used mostly to identify dietary carbon sources in a foodweb (DeNiro and Epstein, 1978; Peterson and Fry, 1987). Accord-ingly, simultaneous measurement of d15N, d13C and contaminantsin the same biota samples can be used to determine biomagnifica-tion profiles of contaminants through food webs. In particular,regression slopes of log transformed contaminant levels on d15Nhave been used for quantitative representation of trophic positionin determinations of biomagnification rates of trace element andanthropogenic chemicals through food webs in South-East andEast Asia (e.g., Ikemoto et al., 2008a,b; Murai et al., 2008; Matsuoet al., 2009; Takeuchi et al., 2009).
The objective of this study was to assess stable isotope-guidedtrophic transfers of As compounds in a tropical mangrove ecosys-tem; we analyzed total As, lipid-soluble As, eight water-solubleAs compounds (AB, arsenocholine (AC), TETRA, TMAO, DMA,MMA, As[V], and As[III]), and non-extracted As in a wide range ofspecies collected from an integrated shrimp mangrove farmingsystem (ISMFS) in Ba Ria Vung Tau Province (BRVT), SouthVietnam.
2. Materials and methods
2.1. Study area and sampling
The ISMFS is a form of extensive aquaculture that relies on trap-ping wild seed during high tides; no provisions are made for sup-plementary feeding of shrimp (Binh et al., 1997). All samples in thisstudy were collected from a 12 ha ISMFS in the BRVT (10o31.3100N;107o03.4380E) (Fig. 1) from 9 to 11 March 2007. The study site waslocated approximately 70 km southeast of Hochiminh City andabout 30 km from the town of Vung Tau, BRVT.
Barramundi seabass Lates calcarifer were caught by angling on 9and 10 March 2007. On the night of 10 March 2007, we collectedthe other fish, crustaceans and octopus using a bag net mountedon the water gate. On 11 March 2007, suspended particulate mat-ter (SPM) sample was collected with a North Pacific plankton net(NORPAC) (0.1 mm mesh size) deployed horizontally at the sluicegate. SPM was washed from the sides of the net into acid-washedplastic bottles with a small volume of pond water. In the labora-tory, samples collected with the plankton net were kept in a refrig-erator for two to four hours to allow settling. After settling, abrown layer that sank close to the bottom of the bottle was desig-nated SPM. In total, five species of crustaceans, six species of fish,and one species of cephalopod and SPM were collected. These
samples were kept frozen at <�20 �C until dissection and chemicalanalysis.
2.2. Stable isotope analysis
In order to avoid contamination by digestive tract contents, weused muscle tissues of crustaceans, cephalopod, and fish as thestandard for stable isotope samples. All samples prepared ford13C and d15N analyses were rinsed in distilled water, dried in anoven for 24 h at 60 �C, pulverized to a fine powder, and treated witha 2:1 chloroform–methanol solution for 24 h to remove lipids.Samples were then dried under ambient room conditions. SPMwas soaked in 0.1 N HCl to remove carbonates, rinsed in distilledwater and then dried. Homogenized samples of 1.0 mg wereloaded into tin cups, after which, stable carbon and nitrogenisotopes were measured using a gas chromatograph–combustion–isotope ratio mass spectrometer (PDZ Europa Ltd., ANCA-SL). Sta-ble isotope abundances were expressed in the d notation as thedeviation from standards in parts per thousand (‰) according tothe following equation:
dXð‰Þ ¼ ðRsample=Rstandard � 1Þ � 1000
where X is 13C or 15N, and R is the corresponding ratio 13C/12C or15N/14N. The Rstandard values were based on PeeDee Belemnite ford13C and atmospheric nitrogen (N2) for d15N. Replicate measure-ments of the internal laboratory standard (histidine) indicated mea-surement errors of ±0.1‰ for both d13C and d15N determinations.
2.3. Analysis for total As, As fractions and As compounds
For total As, As fraction and As compound analyses, wholehomogenized samples were weighed, deep-frozen and lyophilizedfor 24 h. They were weighed again to determine water contents,and then ground to a fine powder using a mortar and pestle. Theaverage moisture contents were 84.1% in SPM, 69.1 ± 5.1% in crus-taceans, 76.8 ± 3.5% in cephalopod, and 70.3 ± 4.4% in fish.
We used previously described procedures for analyzing total As,fractions and compounds of As (Kubota et al., 2002; Agusa et al.,2008) with several considerable modifications. To analyze totalAs, approximately 0.2 g of freeze-dried samples were digested withnitric acid in Teflon vials in a microwave oven (Ethos D, MilestoneS.r.l., Sorisole, BG, Italy) under controlled pressure conditions;there were seven digestion steps: 2, 3, 5, 5, 5, and 10 min under250, 0, 250, 400, 500 and 400 W, respectively, and ventilation for5 min. The resulting clear solutions were made up to exactly50 ml with Milli-Q water. Concentration of total As was deter-mined with an inductively coupled plasma-mass spectrometer
Fig. 1. Map of the study area showing the location of sampling sites in the integrated shrimp mangrove farming system at Ba Ria Vung Tau, South Vietnam.
N.P.C. Tu et al. / Marine Pollution Bulletin 63 (2011) 124–134 125

Author's personal copy
(ICP-MS; Agilent 7500cx, Agilent Technologies, Inc., Santa Clara,CA, USA) with yttrium (Y) as the internal standard. Helium gaswas used as collision gas for analysis of ICP-MS. The total As con-centration obtained in our analysis of dogfish liver (DOLT-3) pro-vided by the National Research Council Canada was 9.9 ± 0.3 lg/gdry wt., showing good agreement with the certified value(10.2 ± 0.5 lg/g dry wt.).
2.3.1. Lipid-soluble As extractionApproximately 0.15 g of freeze-dried sample was weighed into
a glass centrifuge tube and 15 ml of hexane were added. The lidswere then securely fastened, and tubes were shaken for 12 h. Aftercentrifugation at 2500 rpm for 10 min, the supernatant was re-moved by pipette to a round bottom flask. The residue was washedthree times with 15 ml of hexane and centrifuged; the supernatantwas combined, and tube contents were transferred to the roundbottom flask. The hexane supernatant was evaporated to near dry-ness, transferred into a Teflon vial, dried, digested and then ana-lyzed by the procedure used for total As analysis.
2.3.2. Water-soluble As extractionThe residue from the hexane extraction was added to a mixture
of methanol/Milli-Q water (9:1 v/v; 15 ml) and shaken for 12 h.The supernatant was removed by pipette after centrifugation at2500 rpm for 10 min and transferred to another round bottomflask. The whole procedure, including addition of methanol/Milli-Q water, centrifugation and pipetting of supernatant was con-ducted in triplicate. After evaporation of methanol, the samplewas placed into a new centrifuge tube and diluted with Milli-Qwater. The solution was then centrifuged at 2500 rpm for 10 min,filtered through a 0.45 lm syringe-filter, and then stored at<�80 �C until As species analyses. An aliquot of methanol/Milli-Qwater was digested with nitric acid at 70 �C for 3 h and used to ana-lyze total As.
2.3.3. Residual As analysisThe remaining sample (residue) after extraction with methanol/
Milli-Q water was transferred into a Teflon vial, and digested withnitric acid for total As analysis with an ICP-MS using the procedurefor total As analysis.
2.3.4. As species analysisAn Inertsil AS column (15 cm � 2.1 mm i.d.; GL Sciences Inc.,
Japan) was used to separate the As compounds. The column wasequilibrated with the mobile phases (10 mM sodium 1-butanesulf-onate, 4 mM tetramethylammonium hydroxide, 4 mM malonicacid and 0.5% methanol; pH 3.0 was adjusted with nitric acid) ata flow rate of 0.5 ml/min at 45 �C. Rhodium was added to the mo-bile phase as an internal standard to monitor analytical interfer-ence. The injection volume was 10 ll. Eight As compounds,including As[III], As[V], MMA, DMA, AB, AC, TMAO, and TETRA weremeasured with a high-performance liquid chromatography (HPLC;Shimadzu, LC10A Series, Kyoto, Japan) connected to an ICP-MS(Agilent 7500cx, Agilent Technologies, Inc., Santa Clara, CA, USA)(HPLC/ICP-MS).
Sodium arsenate (as As[V]), sodium arsenite (as As[III]), andDMA used were commercial products from Wako Pure ChemicalIndustries (Osaka, Japan). Monomethylarsonic acid, AB, AC, TMAO,and tetramethylarsonium iodide (as TETRA) were obtained fromTri Chemical Laboratories (Yamanashi, Japan). Ion intensities atm/z 75 (75As), 77 (40Ar37Cl and 77Se), and 103 (103Rh; internal stan-dard) were monitored. No interference was observed during HPLC/ICP-MS analysis. The accuracy of the method was verified by anal-ysis of certified reference material BCR 627 (tuna fish tissue, Insti-tute for Reference Materials and Measurements) in triplicate withthe analytical method used for samples. Recoveries of AB and DMA
concentrations ranged from 84% to 90% and 92% to 126%, respec-tively, of the certified values. In this study, the concentrations ofAs compounds are presented in units of lg As/g dry wt. Total Asin hexane- and methanol/Milli-Q- extracted fractions, and the res-idue were designated lipid-soluble, water-soluble, and non-ex-tracted As, respectively, for the purposes of this study.
2.4. Statistical analysis
One half of the value of the respective limit of detection (LOD)was substituted for those values below the LOD; these half-detection limit values were used to calculate proportions of As spe-cies and for statistical analysis. Data were statistically analysedusing the statistical package SPSS 15 for Windows (SPSS, Chicago,IL, USA). A Kolmogorov–Smirnov one sample test was conductedto examine goodness of fit to normal distribution. Most of the vari-ables were not normally distributed, and non-parametric testswere used to compare groups. Nonparametric methods were usednot only because of lack of normality, but also because they aremost appropriate for small sample sizes. Differences between spe-cies were analyzed by the Mann–Whitney U test. As there was nosample replication for SPM, it was not included in this analysis.Simple linear regression was used to measure the relationshipsamong concentrations of AB and total As in organisms. The linearregressions of log-transformed concentrations of total As, As frac-tions, and As compounds on d15N were calculated as follows:
log10ðAs concentrationÞ ¼ a� ðd15NÞ þ b
The slope of the each regression, a, was regarded as an index ofbiomagnification for total As, As fractions, and As compounds. A pvalue of <0.05 was considered statistically significant.
We used principal component analysis (PCA) to classify groupsof species with similar stable isotope values and proportions of Asspecies to total As. Because of low concentrations and/or no corre-lation with the other variables, AC, MMA, As[III] and non-extractedAs were excluded from the PCA.
3. Results
3.1. Isotopic composition of ISMFS
Summaries of samples examined, body sizes, and mean d15Nand d13C values, are presented in Table 1. Average d15N values forsamples ranged from 6.4‰ in SPM to 13.8‰ in swimming crabCharybdis sp. and Barramundi seabass L. calcarifer. The lowestd13C value was also found in SPM (�26.1‰), and the highest value,�14.5‰, occurred in muscle tissue of gazami crab Portunustrituberculatus (Table 1, Fig. 2).
3.2. Concentrations of total As, and As fractions
Concentrations of total As and As fractions in organisms fromthe ISMFS are shown in Table 2. The highest mean level of totalAs was found in black tiger shrimp Penaeus monodon (10.9 lg/g),followed by cephalopod (8.54 lg/g). The concentrations of totalAs in crustaceans and cephalopod were higher than those in fish(Mann–Whitney U test, p < 0.05), though these invertebrate phylawere not significantly different from one another (p > 0.05).
The fractionation was evaluated by calculating total recovery,i.e. the sum of lipid-soluble As, non-extracted As, and water-soluble As divided by total As after acid digestion. Total recoverieswere determined for all sample types: SPM (107%), crustacean(mean, 99%; range, 62–127%), cephalopod (78%; 62–92%) and fish(97%; 88–112%) (Table 2).
126 N.P.C. Tu et al. / Marine Pollution Bulletin 63 (2011) 124–134

Author's personal copy
The lipid-soluble extract generally contained little As (0% to5.9% of total As), except in the cases of tilapia Oreochromis niloticus(11% of total As) and spotted scat Scatophagus argus (21% of totalAs) (Table 2). The concentration of lipid-soluble As in fishes andcephalopod were higher than those in crustaceans (Mann–Whit-ney U test, p < 0.05), while fish and cephalopod samples were notsignificantly different from one another (p > 0.05).
Regardless of species, water-soluble As constituted the majorityof total As (Table 2), though this was not the case in SPM (14%). Themean proportions of water soluble As were similar across phylaexamined, i.e. crustaceans: 46–90%, cephalopod: 72%, and fish:48–86% (Table 2).
The percentages of As in residual fractions were relatively highand consistent between crustaceans and fish. A higher mean pro-portion of non-extracted As relative to the total As was found inSPM (94%) than in the cephalopod (3.5%), fish (14–27%), and crus-taceans (4.2–37%) (Table 2).
3.3. Concentrations of As species
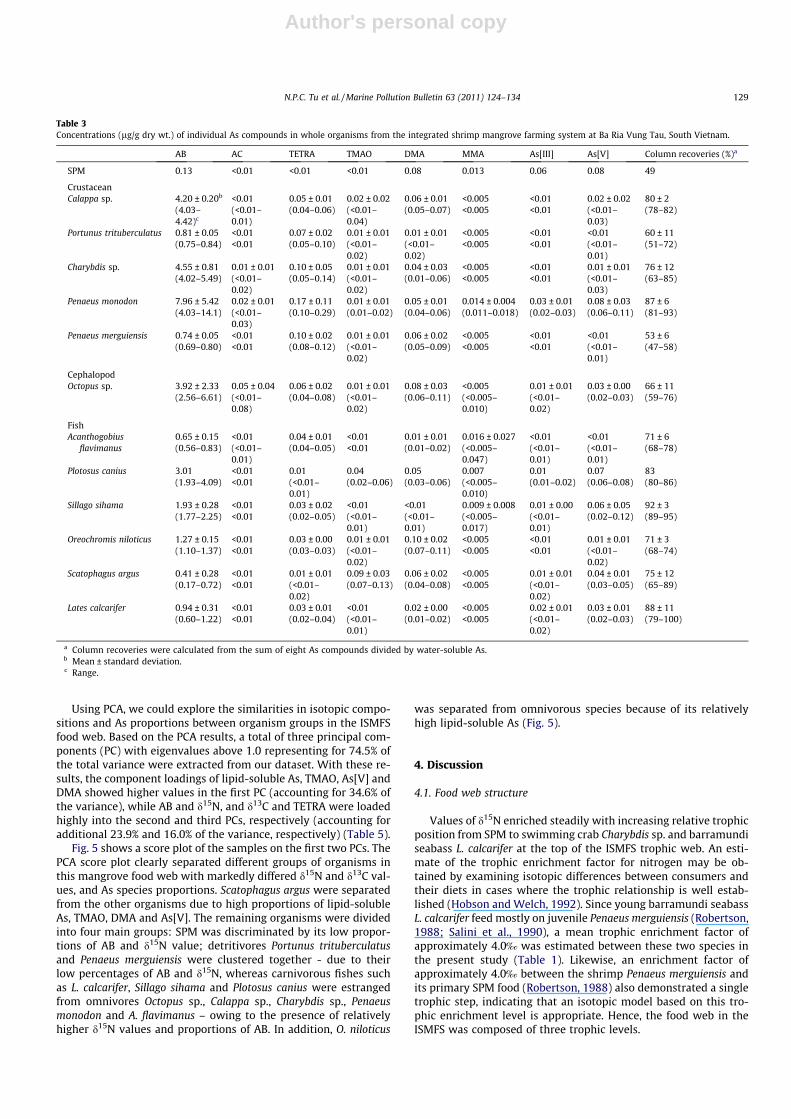
Analyses of As compounds were performed on the methanol-Milli-Q water supernatant. The separation efficiency was evaluatedby calculating column recovery, i.e. the sum of eight As compoundsdivided by water-soluble As. Mean column recoveries of As com-pounds in methanol-Milli-Q water extraction were 49% for SPM,71% for crustacean (range, 47–93%), 66% for cephalopod (59–76%), and 80% for fish (65–100%) (Table 3).
Among water-soluble As forms, AB was clearly the dominantspecies (65–96% relative to water-soluble As), except in SPM(35%), with concentrations ranging from 0.17 to 4.09 lg/g (mean,1.27 lg/g), 0.69–14.1 lg/g (mean, 3.65 lg/g), and 2.56–6.61 lg/g(mean, 3.92 lg/g) in fish, crustaceans, and cephalopod, respec-tively (Table 3). Similar concentrations of TETRA, TMAO, DMAand As[V] were determined (<0.01–0.29 lg/g) in organisms fromthe ISMFS (Table 3, Fig. 3). In contrast, concentrations of AC,MMA and As[III] were always low and these species were not de-tected in most samples (Table 3, Fig. 3); therefore, these com-pounds were excluded from further consideration. Statisticalanalyses showed significant species-specific differences in concen-trations of AB, TETRA and DMA (Mann–Whitney U test, p < 0.05),except for TMAO and As[V]. The concentrations of AB and TETRAin fishes were lower than those in crustaceans and cephalopod(p < 0.05), though crustacean and cephalopod samples were notsignificantly different from one another (p > 0.05). Moreover,DMA concentrations in crustaceans were higher than those incephalopods (p < 0.05); yet, no significant difference was found be-tween fishes and these invertebrate phyla (p > 0.05).
The concentrations of AB were positively correlated with thoseof total As (Simple linear regression, r = 0.946, p < 0.001 for all sam-ples; r = 0.986, p < 0.001 for crustaceans, and r = 0.879, p < 0.001 forfish).
Only small or negligible amounts of As[V] relative to water-sol-uble As concentrations were extracted from the ISMFS animals (0–3%) (Table 3, Fig. 3). A notable exception was the spotted scat Sca-tophagus argus, which contained 6 % of As[V]. This species also hadhigh percentages of TMAO (14%) and DMA (10%). Moreover, DMAwas determined in all organisms, except Sillago sihama (Table 3,Fig. 3). High percentages of TETRA relative to water-soluble As oc-curred in banana prawn Penaeus merguiensis (11%), gazami crabPortunus trituberculatus (8%) and spotted goby Acanthogobiusflavimanus (6 %) (Table 3, Fig. 3).
Suspended particulate matter contained high percentages ofAs[III] (16%), As[V] (21%) and DMA (20%) relative to water-solubleAs (Table 3, Fig. 3).Ta
ble
1Sa
mpl
ede
tails
and
stab
leis
otop
era
tios
ofor
gani
sms
from
the
inte
grat
edsh
rim
pm
angr
ove
farm
ing
syst
emat
BaRi
aV
ung
Tau,
Sout
hV
ietn
am.
Spec
ies
IDna
nbB
ody
len
gth
(mm
)B
ody
wei
ght
(g)
d15N
(‰)
d13C
(‰)
Mea
n±
SDR
ange
Mea
n±
SDR
ange
Mea
n±
SDM
ean
±SD
Susp
end
edp
arti
cula
tem
atte
rSP
M6
1–
––
–6.
4±
1.5
�26
.1±
0.2
Cru
stac
ean
Box
crab
Cala
ppa
sp.
C1
63
40.6
±10
.9(2
8.3–
49.1
)65
.9±
41.4
(20.
8–
102.
1)11
.8±
0.5
�21
.1±
0.3
Gaz
ami
crab
Port
unus
trit
uber
cula
tus
C2
63
39.7
±8.
2(3
3.0–
48.8
)44
.2±
33.4
(21.
0–82
.5)
9.2
±0.
3�
14.5
±0.
2Sw
imm
ing
crab
Char
ybdi
ssp
.C
35
334
.4±
3.2
(31.
4–39
.4)
25.7
±10
.7(1
7.0–
43.2
)13
.8±
1.0
�20
.3±
0.7
Bla
ckti
ger
shri
mp
Pena
eus
mon
odon
S16
319
.4±
2.7
(16.
3–21
.0)
42.3
±13
.1(3
1.2–
56.8
)11
.8±
1.0
�19
.9±
3.0
Ban
ana
praw
nc
Pena
eus
mer
guie
nsis
S27
310
.5±
1.1
(8.1
–12.
0)8.
8±
2.3
(4.0
–11.
7)10
.0±
0.8
�15
.8±
2.4
Cep
hal
op
od
Oct
opus
sp.
O6
3–
–27
.4±
15.0
(14.
8–44
.0)
12.0
±1.
3�
18.8
±1.
7
Fish
Spot
ted
goby
Aca
ntho
gobi
usfla
vim
anus
F16
3–
–10
.3±
4.7
(4.1
–18.
4)13
.6±
0.2
�18
.3±
0.3
Gre
yee
lca
tfish
Plot
osus
cani
usF2
62
35.1
(30.
4–39
.7)
197.
6(1
13.7
–281
.4)
13.6
±0.
2�
18.2
±0.
1Si
llag
ocSi
llago
siha
ma
F36
3–
–10
.4±
4.3
(2.6
–18.
3)13
.2±
0.4
�16
.2±
0.5
Tila
pia
Ore
ochr
omis
nilo
ticu
sF4
63
16.0
±1.
3(1
4.4–
17.5
)77
.9±
16.8
(53.
5–98
.4)
13.1
±0.
6�
18.6
±1.
6Sp
otte
dsc
atSc
atop
hagu
sar
gus
F56
311
.8±
2.2
(9.7
–14.
5)59
.1±
33.5
(27.
5–10
3.3)
11.0
±1.
0�
15.7
±0.
7B
arra
mu
ndi
seab
ass
Late
sca
lcar
ifer
F66
345
.1±
16.3
(28.
0–60
.4)
1693
±14
10(3
08.9
–312
8)13
.8±
0.3
�18
.1±
2.1
SD:
Stan
dard
devi
atio
n.
aN
um
bers
ofsa
mpl
esfo
rst
able
isot
ope
anal
ysis
.b
Nu
mbe
rsof
sam
ples
for
As
spec
ies
anal
ysis
.c
Com
posi
tesa
mpl
es.
N.P.C. Tu et al. / Marine Pollution Bulletin 63 (2011) 124–134 127

Author's personal copy
3.4. Biomagnification of As species
The regression slopes (a) of the log-transformed concentra-tions of total As, As fractions and As compounds on trophic level(as determined by d15N) were used to determine rates of biomag-
nification for crustaceans, fish and total species. For AB, therewere significant correlations with trophic level for total specieson both dry wt. and wet wt. basis (Simple linear regression,a = 0.108, r = 0.468, p < 0.01 on dry wt. basis; a = 0.115, r = 0.474,p < 0.01 on wet wt. basis), fish (a = 0.141, r = 0.556, p < 0.05 ondry wt. basis; a = 0.117, r = 0.500, p < 0.05 on wet wt. basis), andcrustaceans (a = 0.191, r = 0.817, p < 0.001 on dry wt. basis;a = 0.205, r = 0.816, p < 0.001 on wet wt. basis) (Table 4, Fig. 4).Furthermore, the positive relationship between d15N and the con-centration of lipid-soluble As in total species was significant(p < 0.01); the slope of this relationship was 0.130 and 0.124 ondry wt. and wet wt. basis, respectively (Table 4, Fig. 4). In addi-tion, the concentration of total As, non-extracted, and water-soluble As in crustaceans increased with increasing d15N (Table 4).The slopes of the regression equations for these As compounds incrustaceans were 0.109 and 0.122 (dry wt. and wet wt., respec-tively, p < 0.01) for total As, 0.122 and 0.135 (dry wt. and wetwt., respectively, p < 0.05) for non-extracted As, and 0.147 and0.160 (dry wt. and wet wt., respectively, p < 0.001) for water-sol-uble As, respectively. The concentration of TETRA in fish increasedsignificantly with increasing d15N (a = 0.167, r = 0.630, p < 0.01 ondry wt. basis; a = 0.141, r = 0.571, p < 0.05 on wet wt. basis)(Table 4).
In contrast, log-transformed TMAO concentrations in fish had anegative relationship with d15N (a = �0.257, r = �0.650, p < 0.01 ondry wt. basis; a = �0.282, r = �0.666, p < 0.01 on wet wt. basis)(Table 4).
Dimethylarsinic acid and As[V] concentrations in total species,in crustaceans and in fish were not significantly correlated withincreasing d15N on both wt. basis (p > 0.05) (Table 4). Furthermore,there were no trophic level-dependent accumulations of (a) TETRAand TMAO in total species and crustaceans, (b) total and residualAs in fish and total species, and (c) lipid-soluble As in fish andcrustaceans both wt. basis (p > 0.05) (Table 4).
Fig. 2. Relationship between d15N (mean ± standard deviation) and d13C(mean ± standard deviation) values in organisms from the integrated shrimpmangrove farming system at Ba Ria Vung Tau, South Vietnam. See Table 1 forsample sizes. Open diamond, suspended particulate matter (SPM); open square,fish; black square, crab; black triangle, shrimp; black circle, cephalopod Octopus sp.(O). C1, Calappa sp.; C2, Portunus trituberculatus; C3, Charybdis sp.; S1, Penaeusmonodon; S2, Penaeus merguiensis; F1, Acanthogobius flavimanus; F2, Plotosus canius;F3, Sillago sihama; F4, Oreochromis niloticus; F5, Scatophagus argus; F6, Latescalcarifer.
Table 2Concentrations (lg/g dry wt.) of total As and As fractions in whole organisms from the integrated shrimp mangrove farming system at Ba Ria Vung Tau, South Vietnam.
Total As Lipid-soluble As Non-extracted As Water-soluble As Total recovery (%)a
SPM 5.60 <0.001 5.20 0.76 107
CrustaceanCalappa sp. 6.80 ± 0.68b 0.009 ± 0.011 2.48 ± 0.13 5.48 ± 0.39 118 ± 9
(6.01–7.24)c (<0.001–0.021) (2.40–2.63) (5.25–5.93) (109–127)Portunus trituberculatus 3.32 ± 0.22 0.021 ± 0.010 0.81 ± 0.23 1.53 ± 0.34 71 ± 10
(3.13–3.55) (0.010–0.030) (0.57–1.03) (1.17–1.83) (62–81)Charybdis sp. 7.19 ± 0.60 0.061 ± 0.052 1.95 ± 0.09 6.25 ± 1.04 115 ± 6
(6.51–7.65) (0.016–0.118) (1.88–2.06) (5.06–7.01) (108–119)Penaeus monodon 10.9 ± 7.55 0.148 ± 0.094 0.36 ± 0.04 9.87 ± 6.98 96 ± 2
(5.49–19.5) (0.054–0.242) (0.33–0.40) (5.03–17.9) (94–99)Penaeus merguiensis 2.24 ± 0.32 0.108 ± 0.030 0.25 ± 0.03 1.74 ± 0.14 94 ± 7
(1.89–2.52) (0.083–0.142) (0.22–0.29) (1.59–1.86) (88–101)
CephalopodOctopus sp. 8.54 ± 3.48 0.213 ± 0.024 0.27 ± 0.14 6.50 ± 4.03 78 ± 15
(6.27–12.6) (0.185–0.227) (0.16–0.42) (3.53–11.1) (62–92)
FishAcanthogobius flavimanus 1.46 ± 0.13 0.068 ± 0.009 0.39 ± 0.06 1.04 ± 0.24 102 ± 5
(1.35–1.60) (0.057–0.075) (0.35–0.45) (0.82–1.29) (99–108)Plotosus canius 4.76 0.312 0.59 3.81 98
(3.86–5.66) (0.095–0.528) (0.28–0.90) (2.65–4.98) (94–102)Sillago sihama 2.60 ± 0.35 0.027 ± 0.013 0.53 ± 0.05 2.23 ± 0.31 108 ± 4
(2.33–3.00) (0.017–0.042) (0.49–0.59) (2.03–2.58) (104–112)Oreochromis niloticus 3.46 ± 0.34 0.384 ± 0.163 0.77 ± 0.09 2.00 ± 0.19 91 ± 3
(3.08–3.72) (0.278–0.572) (0.67–0.84) (1.79–2.18) (88–94)Scatophagus argus 1.61 ± 0.45 0.331 ± 0.072 0.38 ± 0.10 0.79 ± 0.30 93 ± 4
(1.33–2.13) (0.249–0.379) (0.30–0.50) (0.55–1.12) (89–98)Lates calcarifer 1.94 ± 0.35 0.093 ± 0.046 0.47 ± 0.16 1.17 ± 0.26 89 ± 2
(1.60–2.30) (0.041–0.120) (0.35–0.66) (0.87–1.33) (88–92)
a Total recoveries were calculated from the sum of lipid-soluble As, non-extracted As and water-soluble As divided by total As.b Mean ± standard deviation.c Range.
128 N.P.C. Tu et al. / Marine Pollution Bulletin 63 (2011) 124–134
Author's personal copy
Using PCA, we could explore the similarities in isotopic compo-sitions and As proportions between organism groups in the ISMFSfood web. Based on the PCA results, a total of three principal com-ponents (PC) with eigenvalues above 1.0 representing for 74.5% ofthe total variance were extracted from our dataset. With these re-sults, the component loadings of lipid-soluble As, TMAO, As[V] andDMA showed higher values in the first PC (accounting for 34.6% ofthe variance), while AB and d15N, and d13C and TETRA were loadedhighly into the second and third PCs, respectively (accounting foradditional 23.9% and 16.0% of the variance, respectively) (Table 5).
Fig. 5 shows a score plot of the samples on the first two PCs. ThePCA score plot clearly separated different groups of organisms inthis mangrove food web with markedly differed d15N and d13C val-ues, and As species proportions. Scatophagus argus were separatedfrom the other organisms due to high proportions of lipid-solubleAs, TMAO, DMA and As[V]. The remaining organisms were dividedinto four main groups: SPM was discriminated by its low propor-tions of AB and d15N value; detritivores Portunus trituberculatusand Penaeus merguiensis were clustered together - due to theirlow percentages of AB and d15N, whereas carnivorous fishes suchas L. calcarifer, Sillago sihama and Plotosus canius were estrangedfrom omnivores Octopus sp., Calappa sp., Charybdis sp., Penaeusmonodon and A. flavimanus – owing to the presence of relativelyhigher d15N values and proportions of AB. In addition, O. niloticus
was separated from omnivorous species because of its relativelyhigh lipid-soluble As (Fig. 5).
4. Discussion
4.1. Food web structure
Values of d15N enriched steadily with increasing relative trophicposition from SPM to swimming crab Charybdis sp. and barramundiseabass L. calcarifer at the top of the ISMFS trophic web. An esti-mate of the trophic enrichment factor for nitrogen may be ob-tained by examining isotopic differences between consumers andtheir diets in cases where the trophic relationship is well estab-lished (Hobson and Welch, 1992). Since young barramundi seabassL. calcarifer feed mostly on juvenile Penaeus merguiensis (Robertson,1988; Salini et al., 1990), a mean trophic enrichment factor ofapproximately 4.0‰ was estimated between these two species inthe present study (Table 1). Likewise, an enrichment factor ofapproximately 4.0‰ between the shrimp Penaeus merguiensis andits primary SPM food (Robertson, 1988) also demonstrated a singletrophic step, indicating that an isotopic model based on this tro-phic enrichment level is appropriate. Hence, the food web in theISMFS was composed of three trophic levels.
Table 3Concentrations (lg/g dry wt.) of individual As compounds in whole organisms from the integrated shrimp mangrove farming system at Ba Ria Vung Tau, South Vietnam.
AB AC TETRA TMAO DMA MMA As[III] As[V] Column recoveries (%)a
SPM 0.13 <0.01 <0.01 <0.01 0.08 0.013 0.06 0.08 49
CrustaceanCalappa sp. 4.20 ± 0.20b <0.01 0.05 ± 0.01 0.02 ± 0.02 0.06 ± 0.01 <0.005 <0.01 0.02 ± 0.02 80 ± 2
(4.03–4.42)c
(<0.01–0.01)
(0.04–0.06) (<0.01–0.04)
(0.05–0.07) <0.005 <0.01 (<0.01–0.03)
(78–82)
Portunus trituberculatus 0.81 ± 0.05 <0.01 0.07 ± 0.02 0.01 ± 0.01 0.01 ± 0.01 <0.005 <0.01 <0.01 60 ± 11(0.75–0.84) <0.01 (0.05–0.10) (<0.01–
0.02)(<0.01–0.02)
<0.005 <0.01 (<0.01–0.01)
(51–72)
Charybdis sp. 4.55 ± 0.81 0.01 ± 0.01 0.10 ± 0.05 0.01 ± 0.01 0.04 ± 0.03 <0.005 <0.01 0.01 ± 0.01 76 ± 12(4.02–5.49) (<0.01–
0.02)(0.05–0.14) (<0.01–
0.02)(0.01–0.06) <0.005 <0.01 (<0.01–
0.03)(63–85)
Penaeus monodon 7.96 ± 5.42 0.02 ± 0.01 0.17 ± 0.11 0.01 ± 0.01 0.05 ± 0.01 0.014 ± 0.004 0.03 ± 0.01 0.08 ± 0.03 87 ± 6(4.03–14.1) (<0.01–
0.03)(0.10–0.29) (0.01–0.02) (0.04–0.06) (0.011–0.018) (0.02–0.03) (0.06–0.11) (81–93)
Penaeus merguiensis 0.74 ± 0.05 <0.01 0.10 ± 0.02 0.01 ± 0.01 0.06 ± 0.02 <0.005 <0.01 <0.01 53 ± 6(0.69–0.80) <0.01 (0.08–0.12) (<0.01–
0.02)(0.05–0.09) <0.005 <0.01 (<0.01–
0.01)(47–58)
CephalopodOctopus sp. 3.92 ± 2.33 0.05 ± 0.04 0.06 ± 0.02 0.01 ± 0.01 0.08 ± 0.03 <0.005 0.01 ± 0.01 0.03 ± 0.00 66 ± 11
(2.56–6.61) (<0.01–0.08)
(0.04–0.08) (<0.01–0.02)
(0.06–0.11) (<0.005–0.010)
(<0.01–0.02)
(0.02–0.03) (59–76)
FishAcanthogobius
flavimanus0.65 ± 0.15 <0.01 0.04 ± 0.01 <0.01 0.01 ± 0.01 0.016 ± 0.027 <0.01 <0.01 71 ± 6(0.56–0.83) (<0.01–
0.01)(0.04–0.05) <0.01 (0.01–0.02) (<0.005–
0.047)(<0.01–0.01)
(<0.01–0.01)
(68–78)
Plotosus canius 3.01 <0.01 0.01 0.04 0.05 0.007 0.01 0.07 83(1.93–4.09) <0.01 (<0.01–
0.01)(0.02–0.06) (0.03–0.06) (<0.005–
0.010)(0.01–0.02) (0.06–0.08) (80–86)
Sillago sihama 1.93 ± 0.28 <0.01 0.03 ± 0.02 <0.01 <0.01 0.009 ± 0.008 0.01 ± 0.00 0.06 ± 0.05 92 ± 3(1.77–2.25) <0.01 (0.02–0.05) (<0.01–
0.01)(<0.01–0.01)
(<0.005–0.017)
(<0.01–0.01)
(0.02–0.12) (89–95)
Oreochromis niloticus 1.27 ± 0.15 <0.01 0.03 ± 0.00 0.01 ± 0.01 0.10 ± 0.02 <0.005 <0.01 0.01 ± 0.01 71 ± 3(1.10–1.37) <0.01 (0.03–0.03) (<0.01–
0.02)(0.07–0.11) <0.005 <0.01 (<0.01–
0.02)(68–74)
Scatophagus argus 0.41 ± 0.28 <0.01 0.01 ± 0.01 0.09 ± 0.03 0.06 ± 0.02 <0.005 0.01 ± 0.01 0.04 ± 0.01 75 ± 12(0.17–0.72) <0.01 (<0.01–
0.02)(0.07–0.13) (0.04–0.08) <0.005 (<0.01–
0.02)(0.03–0.05) (65–89)
Lates calcarifer 0.94 ± 0.31 <0.01 0.03 ± 0.01 <0.01 0.02 ± 0.00 <0.005 0.02 ± 0.01 0.03 ± 0.01 88 ± 11(0.60–1.22) <0.01 (0.02–0.04) (<0.01–
0.01)(0.01–0.02) <0.005 (<0.01–
0.02)(0.02–0.03) (79–100)
a Column recoveries were calculated from the sum of eight As compounds divided by water-soluble As.b Mean ± standard deviation.c Range.
N.P.C. Tu et al. / Marine Pollution Bulletin 63 (2011) 124–134 129

Author's personal copy
4.2. Total As and fractionation of As
Total As concentrations in the present study were consistentwith those previously reported for marine organisms fromVietnam and elsewhere (Shinagawa et al., 1983; Francesconi andEdmonds, 1993, 1997; Kirby et al., 2002; Hirata et al., 2006; Linet al., 2008; Tu et al., 2008b). According to our earlier study, levelsof total As in the hepatopancreas and muscle of black tiger shrimpfrom the coast of South Vietnam were typically high, particularly inspecimens collected from BRVT (Tu et al., 2008b). Cephalopodshave occasionally been reported to contain relatively higher Asconcentrations (Asante et al., 2008; Lin et al., 2008). The rangesof total As in whole organisms from the mangrove swamp in thisstudy were similar to those reported for other marine organisms(Shinagawa et al., 1983; Francesconi and Edmonds, 1993, 1997).
High accumulation of total As in crustaceans has been reportedin numerous previous studies (Shinagawa et al., 1983; Francesconiand Edmonds, 1993, 1997; Kirby et al., 2002; Hirata et al., 2006; Linet al., 2008). Generally, benthic feeding and bottom-dwelling ani-mals have higher total As concentrations than other trophic feed-ing and pelagic groups (Francesconi and Edmonds, 1993; Neff,1997; Kirby et al., 2002). In the present study, the bottom-livingshrimp Penaeus monodon had a total As concentration three-foldgreater than in fish species. Total As in the piscivorous top carni-vore L. calcarifer was among the lowest in this study. Arsenic con-centrations in predators are often lower than those of their prey(Neff, 1997).
The tilapia O. niloticus and the spotted scat Scatophagus argusare known to feed on a variety of food including algae, plants,and organic detritus (NACA, 1989; Thimdee et al., 2004). Marinevegetation accumulates large amounts of As in the lipid-solublefraction (Devalla and Feldmann, 2003; Thomson et al., 2007). Kirbyand Maher (2002) also reported that mullet Mugil cephalus (detri-tivore) contains high concentrations of lipid-soluble As relative tototal As in some tissues (intestine 41%, liver 18%, and gill 15%).
In the present study, we used whole homogenized organisms assamples for As compound analysis. Therefore, As in the residualfraction may have contained tissues such as bone, scales and exo-skeleton, which might not have been extracted by our method(hexane and methanol:Milli-Q water). Rattanachongkiat et al.(2004) also reported a high concentration of residual As in wholehomogenized samples of swimming crab from the Pak Pa-NangEstuary, Thailand.
4.3. Arsenic compounds
Low column recoveries from ISMFS samples may have arisenfrom difficulties in complete elution. According to Emons et al.(2003), hydrophobic interactions of protein-binding As with thestationary phase of the column may contribute to low recoveries.Reduced extraction effectiveness has also been reported in otherpublished results (Kirby et al., 2002; Hirata et al., 2006; Agusaet al., 2008). Alternatively, lower extraction efficiencies may sug-gest the existence of other As compounds, which could not be
Fig. 3. Compositions of water-soluble As species in organisms sampled from the integrated shrimp mangrove farming system at Ba Ria Vung Tau, South Vietnam. AB,arsenobetaine; AC, arsenocholine; TETRA, tetramethylarsonium ion; TMAO, trimethylarsine oxide; DMA, dimethylarsinic acid; MMA, monomethylarsonic acid; As[III],arsenite; As[V], arsenate. Organisms are arranged in ascending order of mean d15N values.
130 N.P.C. Tu et al. / Marine Pollution Bulletin 63 (2011) 124–134

Author's personal copy
determined by our methods. For example, arsenosugars are pre-dominant As species in marine algae and are also detectable insome lower trophic level animals (Lai et al., 1999; Foster et al.,2005, 2006, 2008; Khokiattiwong et al., 2009). Foster et al.(2008) reported that tissues of the detritivorous gastropod Haliotisrubra, mainly consuming macro-algae detritus, and the herbivo-rous fish Odax cyanomelas, feeding on blade of brown algae Eckloniaradiata, contain high concentrations of glycerol trimethylarsoniori-boside (0.7–22%) and phosphate arsenoriboside (25–64%), respec-tively. Furthermore, phosphate arsenoribose in temperate marinesaltmarsh amphipods made up 23% of total extracted As (Fosteret al., 2005).
Arsenobetaine was the main As species found in organisms inthe ISMFS (Table 3, Fig. 3). This corresponds with results fromother studies on As speciation in marine animals (Shinagawaet al., 1983; Francesconi and Edmonds, 1993; Kirby and Maher,2002; Kirby et al., 2002; Foster et al., 2006; Hirata et al., 2006;Liu et al., 2006; Lin et al., 2008). Arsenobetaine usually represents50% to >90% of total As in tissues of marine crustaceans, elasmo-branchs and teleosts (Neff, 1997). In the present study, there wasa significant relationship between AB and total As, indicating thathigh levels of AB may cause high accumulations of total As in theseorganisms. The source(s) of AB in the tissues of marine animals isuncertain. Arsenobetaine is not likely to be synthesised by marineinvertebrates and fish, nor is derived from water or sedimentsources; it must therefore be obtained from prey (Francesconiand Edmonds, 1994; Kirby et al., 2002). The possible trophic trans-fer of AB in mangrove swamp organisms is discussed below.
In accordance with other published results (Shinagawa et al.,1983; Francesconi and Edmonds, 1993; Kirby et al., 2002), theamounts of As[V] extracted from the ISMFS animals were marginal(Table 3, Fig. 3), except in the case of spotted scat Scatophagus arguswhose were also high percentages of TMAO and DMA. These Ascompounds are usually found in relatively high concentrations indetritivorous animals (Maher et al., 1999; Kirby and Maher,2002; Kirby et al., 2002). The spotted scat is an herbivorous fishwhose diet sometimes contains as much as 97.8% detritus (Phuonget al., 2004). Relatively high concentrations of TMAO have alsobeen identified in tissues of detritivorous mullet from LakeMacquarie, New South Wales, Australia (Kirby and Maher, 2002).The presence of TMAO may be due to microbial methylation ofingested inorganic As and/or degradation of AB (Francesconi andEdmonds, 1993; Kirby and Maher, 2002).
The presence of DMA in the organisms of this mangrove foodweb might be a result of microbial degradation of AB and/orarsenoribosides ingested with food (Kirby and Maher, 2002).Dimethylarsinic acid has also been found in high concentrationsin mullet intestine and stomach from Australia and Taiwan (Kirbyand Maher, 2002; Liu et al., 2006).
Banana prawn Penaeus merguiensis, gazami crab Portunus tritu-berculatus, and spotted goby A. flavimanus contained high propor-tions of TETRA (Table 3, Fig. 3). Tetramethylarsonium ion hasbeen reported as a possible constituent of the crab Portunus tritu-berculatus from Japan (Morita and Shibata, 1987), and it occurs insignificant concentrations in marine animals, particularly molluscs(Khokiattiwong et al., 2009). Synthesis of TETRA is thought to re-sult from degradation of AB and/or methylation of TMAO or trime-thylarsine (Kirby and Maher, 2002). The large and small quantitiesof TETRA and AB, respectively, in these organisms suggest that thispathway could be important in the ISMFS ecosystem.
Inorganic As and DMA were found in relatively high proportionsin SPM (Table 3, Fig. 3). It is important to note that SPM was col-lected from a shallow swamp (0.7–1 m) on a windy day when ver-tical mixing and re-suspension of benthic sediments might haveoccurred. Marine sediments are important suppliers of DMA andinorganic As to the overlying water column. Several species ofTa
ble
4Re
gres
sion
stat
isti
csfo
rre
lati
onsh
ips
betw
een
log-
tran
sfor
med
conc
entr
atio
ns( l
g/g)
ofto
talA
s,A
sfr
acti
ons
and
As
com
poun
dsan
dd1
5N
valu
esof
biot
afr
omth
ein
tegr
ated
shri
mp
man
grov
efa
rmin
gsy
stem
atBa
Ria
Vun
gTa
u,So
uth
Vie
tnam
.
Wei
ght
basi
sA
ssp
ecie
sA
llsp
ecie
sFi
shC
rust
acea
ns
Slop
e(a
)In
terc
ept
rp-
valu
eSl
ope
(a)
Inte
rcep
tr
p-va
lue
Slop
e(a
)In
terc
ept
rp-
valu
e
Dry
Tota
lA
s0.
008
0.45
90.
056
0.74
40.
050
�0.
293
0.34
70.
172
0.10
9�
0.52
10.
759
0.00
1
Frac
tion
Lipi
d-so
lubl
eA
s0.
130
�2.
754
0.35
70.
033
�0.
119
0.63
0�
0.32
80.
198
0.03
0�
1.80
90.
081
0.77
4N
on-e
xtra
cted
As
�0.
013
�0.
057
�0.
073
0.67
20.
027
�0.
667
0.22
40.
388
0.12
2�
1.46
60.
551
0.03
3W
ater
-sol
ubl
eA
s0.
054
�0.
267
0.29
00.
087
0.08
6�
0.95
10.
463
0.06
20.
147
�1.
081
0.80
70.
000
Com
pou
nd
AB
0.10
8�
1.12
40.
468
0.00
40.
141
�1.
839
0.55
60.
020
0.19
1�
1.78
00.
817
0.00
0TE
TRA
0.00
8�
1.50
70.
038
0.82
60.
167
�3.
853
0.63
00.
007
0.00
2�
1.08
20.
018
0.94
9TM
AO
�0.
023
�1.
682
�0.
114
0.51
0�
0.25
71.
411
�0.
650
0.00
50.
022
�2.
229
0.13
90.
621
DM
A�
0.04
6�
0.93
3�
0.21
20.
214
�0.
108
�0.
189
�0.
305
0.23
40.
019
�1.
675
0.08
80.
756
As[
V]
0.00
2�
1.74
40.
008
0.96
5�
0.09
6�
0.39
6�
0.29
10.
257
0.06
4�
2.60
80.
239
0.39
2
Wet
Tota
lA
s0.
016
�0.
169
0.10
10.
556
0.02
6�
0.52
10.
179
0.49
10.
122
�1.
174
0.75
60.
001
Frac
tion
Lipi
d-so
lubl
eA
s0.
124
�3.
206
0.36
10.
031
�0.
145
0.42
4�
0.36
20.
153
0.04
5�
2.46
90.
145
0.60
7N
on-e
xtra
cted
As
�0.
006
�0.
688
�0.
029
0.86
60.
003
�0.
894
0.02
50.
924
0.13
5�
2.12
00.
535
0.04
0W
ater
-sol
ubl
eA
s0.
062
�0.
900
0.31
30.
063
0.06
3�
1.18
50.
364
0.15
10.
160
�1.
740
0.81
00.
000
Com
pou
nd
AB
0.11
5�
1.75
20.
474
0.00
40.
117
�2.
057
0.50
00.
041
0.20
5�
2.43
70.
816
0.00
0TE
TRA
0.01
6�
2.13
70.
069
0.69
00.
141
�4.
065
0.57
10.
017
0.01
7�
1.74
80.
158
0.57
3TM
AO
�0.
016
�2.
312
�0.
070
0.68
4�
0.28
21.
203
�0.
666
0.00
40.
036
�2.
893
0.20
90.
455
DM
A�
0.03
8�
1.56
5�
0.17
10.
318
�0.
134
�0.
395
�0.
344
0.17
70.
033
�2.
339
0.15
50.
580
As[
V]
0.00
9�
2.37
40.
040
0.81
7�
0.12
1�
0.61
3�
0.35
70.
160
0.07
8�
3.27
00.
286
0.30
2
Bol
dn
um
bers
insl
ope
colu
mn
sin
dica
tesi
gnifi
can
ceat
p<
0.05
.
N.P.C. Tu et al. / Marine Pollution Bulletin 63 (2011) 124–134 131

Author's personal copy
aerobic and anaerobic sediment bacteria are able to bioaccumulateAs[V] and As[III], and convert them to MMA and DMA (Cullen andReimer, 1989). The organoarsenicals are released by the bacteriainto the sediment pore water, allowing mixing of organoarsenicup into the overlying water column. Release of MMA and DMAfrom marine sediments is not temperature sensitive, and MMA isreleased more rapidly than DMA. In addition, these two organicforms of As are found frequently in seawater (Neff, 1997).
4.4. Biomagnification profiles of As species
Arsenic in the marine environment has been studied for manyyears, and while its occurrence is well documented, there are onlyfew field data that would allow determination of As trophic trans-fer (particularly As compounds) through the food web. A study ontotal As bioaccumulation in marine fish and invertebrates fromAlaska and California showed that the fish with highest tissue con-
centrations of As came from sites where invertebrate concentra-tions were high (Meador et al., 2004).
In marine animals, the lipid-soluble As fractions mainly con-tained methylated As compounds; the major form was a DMAcompound (Devalla and Feldmann, 2003; Kunito et al., 2008). Bio-magnification of lipid-soluble arsenicals could be due to its highlipophilicity and/or attributed to increase of lipid content throughthe food web because of the concentrations of many hydrophobicorganic chemicals in organisms increase as the lipid content ofthe organism increases (Gobas and Morrison, 2000).
As pointed earlier, non-extracted As fractions in crustacean inthis study could accumulate mostly in exoskeleton. Hence, thetrophic level-dependent accumulation of residual As fraction incrustacean could be explained by the particular behavior of As,which was mainly adsorbed on external layers of invertebrates.In supporting to the above notion, adsorption to the carapace hasbeen suggested as an important accumulation mechanism for Asfor the crayfish (Mason et al., 2000).
Overall, the proportion of AB in marine animals varied depend-ing on their feeding habit and trophic position, with animals ofhigher trophic levels were contained higher proportions of AB(Kunito et al., 2008). Kirby and Maher (2002) reported that ABwas the dominant arsenical in pelagic carnivorous marine fish,whereas detritivorous and herbivorous marine fish contained avariety of compounds (TMAO, DMA, and As[V]), with correspond-ingly low relative proportions of AB.
In the present study, detritivorous and herbivorous fish andshrimp such as spotted scat Scatophagus argus (mean, 0.41 lg/g),banana prawn Penaeus merguiensis (0.74 lg/g) and gazami crabPortunus trituberculatus (0.81 lg/g) contained lower concentrationsof AB than those of omnivorous and carnivorous fish (grey eel cat-fish Plotosus canius, 3.01 lg/g), crustaceans (box crab Calappa sp.,4.20 lg/g; swimming crab Charybdis sp., 4.55 lg/g and black tigershrimp Penaeus monodon, 7.96 lg/g) and Octopus sp. (3.92 lg/g)
Fig. 4. Relationships between log-transformed total As, As fractions, and As species concentrations (lg/g dry wt.) and d15N signatures in all species of organisms from theintegrated shrimp mangrove farming system at Ba Ria Vung Tau, South Vietnam.
Table 5Principal component (PC) analysisa results of isotopic signatures and As speciesproportions (relative to total As) in organisms from the integrated shrimp mangrovefarming system at Ba Ria Vung Tau, South Vietnam.
Variable PC 1 (34.6%)b PC 2 (23.9%) PC 3 (16.0%)
Lipid-soluble As 0.881 �0.263 �0.053TMAO 0.851 �0.266 �0.018As[V] 0.702 0.314 0.061DMA 0.665 �0.518 0.075AB �0.247 0.867 �0.036d15N 0.010 0.790 �0.159d13C 0.374 �0.062 0.803TETRA �0.367 �0.156 0.772
a Extraction method: principal component analysis and rotation method: Vari-max with Kaiser Normalization.
b Percentage of variance.
132 N.P.C. Tu et al. / Marine Pollution Bulletin 63 (2011) 124–134

Author's personal copy
(Table 3). However, the piscivorous top carnivore, barramundi sea-bass L. calcarifer, had a relatively low concentration of AB (0.94 lg/g) (Table 3). The low accumulation of AB in this species probablyresults from low AB concentrations in its main prey, the bananaprawn Penaeus merguiensis. Furthermore, low AB concentrationsin barramundi seabass may indicate poor assimilation of AB or reg-ulation by this species. Arsenobetaine has been previously sug-gested to behave as an osmolyte (Francesconi et al., 1999;Clowes and Francesconi, 2004) on the basis of similarity in chem-ical structure to glycine betaine, a known organic osmolyte. Eury-haline teleosts, like seabass L. calcarifer, may have a high capacityto regulate cellular levels of organic solutes, such as AB (Amlundet al., 2006). A study on euryhaline Atlantic salmon, Salmo salarL., and stenohaline Atlantic cod fish, Gadus morhua L., by Amlundet al. (2006) found that the significantly lower elimination ratefrom cod muscle tissue compared to salmon muscle could lead tohigher AB concentrations in the gadid. Amlund et al. (2006) specu-lated that this difference may derive from the salmonid ability totolerate large changes in salinity; cod, on the other hand are morestenohaline and have a low capacity for regulating plasma levels oforganic solutes.
The pathway of formation of AB in mangrove organisms re-mains unknown. Generally, it has been proposed that herbivorousspecies accumulate arsenosugars and As-containing phospholipidsfrom algal foods and convert them through AC and other interme-diates to AB, which is accumulated in the tissues (Neff, 1997). Intropical mangrove ecosystems, carbon source and the major nutri-ent input come from mangrove trees (leaves, roots, branches, man-grove-derived detritus, etc.), whereas macroalgae and planktoncontribution are very minute (Thimdee et al., 2004). However,arsenosugars were not detected in mangrove leaves, which con-tained most As in inorganic form, MMA and DMA (Thomsonet al., 2007; Khokiattiwong et al., 2009). Thus, the presence of ABin mangrove organisms could be from the other sources. Kirbyet al. (2002) and Khokiattiwong et al. (2009) suggested that ABmight be synthesised de novo from inorganic As by microbes inrotting leaf litter, and enter the food chain in this manner. Addi-tionally, Nischwitz and Pergantis (2005) reported the presence ofAB in marine algae extracts (which might contaminated by AB-containing epifauna) was the potential source for algae-feedingorganisms accumulated directly AB.
The component score plot might reflect food web structure andtrophic transfer of As species in this mangrove ecosystem (Fig. 5).As exhibited by PC 1, spotted scat Scatophagus argus contained high
proportions of lipid-soluble As, TMAO, DMA and As[V], implyingthat this spotted scat not only feed on marine vegetation (man-grove leaves, micro- and macro-algae) but also mangrove-derivedorganic detritus as stated by Thimdee et al. (2004). While PC 2clearly revealed that there was a trend for AB to constitute thegreater proportions (relative to total As) in the higher trophic levelorganisms as guided by d15N (Fig. 5). Negligible amount of AB (2%)was present in SPM, suggesting that SPM could be diet and Assources in this mangrove ecosystem. Proportions of AB comprisedthe major As species in omnivores (Octopus sp., mean 44%; A.flavimanus, 44%; Calappa sp., 62%; Charybdis sp., 63%; and Penaeusmonodon, 74%) and carnivores (Plotosus canius, 61%; L. calcarifer,68%; and Sillago sihama, 74%), whereas various arsenicals are con-tained in detritivores and herbivores, with the corresponding pro-portions of AB being relatively low (Scatophagus argus, 24%;Portunus trituberculatus, 24%; Penaeus merguiensis, 34%; and O. nil-oticus, 37%) (Table 3).
The findings of this study indicated that the co-ordinated PCA toisotopic compositions and proportions of As species might revealeda greater resolution in biomagnification profiles of As compoundsthan in traditional food web analyses, e.g., determining As com-pounds in organisms of particular trophic levels with publishedfood web models, and data on feeding behavior (see Kirby et al.,2002; Foster et al., 2005, 2006; Khokiattiwong et al., 2009). Havinganalyzed only eight compounds in few organisms, we could notcharacterize completely the biomagnification profiles of As speciesin this tropical mangrove ecosystem. Further research is thusneeded to provide useful information on the transformation andcycling of As in the marine environment.
Acknowledgment
This study was partially supported by grants from the GlobalCOE Program from the Ministry of Education, Culture, Sports, Sci-ence, and Technology, and Grants-in-Aid for Scientific Researchfor Postdoctoral Fellows by the Japan Society for the Promotionof Science (No. 2109237 to NPCT, and No. 207871 to TA).
References
Agency for Toxic Substances and Disease Registry (ATSDR), 2007. CERCLA PriorityList of Hazardous Substances. Department of Health and Human Services.<http://www.atsdr.cdc.gov/cercla/07list.html> (accessed 03.05.2010).
Agusa, T., Takagi, K., Kubota, R., Anan, Y., Iwata, H., Tanabe, S., 2008. Specificaccumulation of arsenic compounds in green turtles (Chelonia mydas) and
Fig. 5. Plot of PCA scores coordinate for the first two principal components (PC) of all species of organisms from the integrated shrimp mangrove farming system at Ba RiaVung Tau, South Vietnam.
N.P.C. Tu et al. / Marine Pollution Bulletin 63 (2011) 124–134 133

Author's personal copy
hawksbill turtles (Eretmochelys imbricata) from Ishigaki Island. Japan. Environ.Pollut. 153, 127–136.
Agusa, T., Inoue, S., Kunito, T., Minh, T.B., Ha, N.N., Tu, N.P.C., Trang, P.T.K., Iwata, H.,Viet, P.H., Tuyen, B.C., Tanabe, S., 2009. Human exposure to arsenic fromgroundwater in the Red River and Mekong River Deltas in Vietnam. Int. J.Environ. Stud. 66, 49–57.
Amlund, H., Francesconi, K.A., Bethune, C., Lundebye, A.-K., Berntssen, M.H.G., 2006.Accumulation and elimination of dietary arsenobetaine in two species of fishAtlantic salmon (Salmo salar L.) and Atlantic cod (Gadus morhua L.). Environ.Toxicol. Chem. 25, 1787–1794.
Asante, K.A., Agusa, T., Mochizuki, H., Ramu, K., Inoue, S., Kubodera, T., Takahashi, S.,Subramanian, A., Tanabe, S., 2008. Trace elements and stable isotopes (d13C andd15N) in shallow and deep-water organisms from the East China Sea. Environ.Pollut. 156, 862–873.
Binh, C.T., Phillips, M.J., Demaine, H., 1997. Integrated shrimp-mangrove farmingsystems in the Mekong delta of Vietnam. Aquac. Res. 28, 599–610.
Clowes, L.A., Francesconi, K.A., 2004. Uptake and elimination of arsenobetaine bythe mussel Mytilus edulis is related to salinity. Comp. Biochem. Physiol. CToxicol. Pharmacol. 137, 35–42.
Cullen, W.R., Reimer, K.J., 1989. Arsenic speciation in the environment. Chem. Rev.89, 713–764.
DeNiro, M.J., Epstein, S., 1978. Influence of diet on the distribution of carbonisotopes in animals. Geochim. Cosmochim. Acta 42, 495–506.
Devalla, S., Feldmann, J., 2003. Determination of lipid-soluble arsenic species inseaweed-eating sheep from Orkney. Appl. Organomet. Chem. 17, 906–912.
Emons, H., Sebesvari, Z., Falk, K., Krachler, M., 2003. Occurrence and speciation ofarsenic, antimony and tin in specimens used for environmental biomonitoringof limnic ecosystems. In: Hirner, A.V., Emons, H. (Eds.), Organic Metal andMetalloid Species in the Environment: Analysis Distribution Process andToxicological Evaluation.. Springer-Verlag Berlin Heidelberg, New York, pp.71–95.
Foster, S., Maher, W., Taylor, A., Krikowa, F., Telford, K., 2005. Distribution andspeciation of arsenic in temperate marine saltmarsh ecosystems. Environ.Chem. 2, 177–189.
Foster, S., Maher, W., Schmeisser, E., Taylor, A., Krikowa, F., Apte, S., 2006. Arsenicspecies in a rocky intertidal marine food chain in NSW. Australia. Environ.Chem. 3, 304–315.
Foster, S., Maher, W., Krikowa, F., 2008. Changes in proportions of arsenic specieswithin an Ecklonia radiata food chain. Environ. Chem. 5, 176–183.
Francesconi, K.A., Edmonds, J.S., 1993. Arsenic in the sea. Oceanogr. Mar. Biol. Annu.Rev. 31, 111–151.
Francesconi, K.A., Edmonds, J.S., 1994. Biotransformation of arsenic in the marineenvironment. In: Nriagu, J.O. (Ed.), Arsenic in the Environment. Part I: Cyclingand Characterization. John Wiley & Sons, New York, pp. 211–261.
Francesconi, K.A., Edmonds, J.S., 1997. Arsenic and marine organisms. In: Sykes, A.G.(Ed.), Advanced in Inorganic Chemistry. Academic Press, San Diego, pp. 147–189.
Francesconi, K.A., Gailer, J.g., Edmonds, J.S., Goessler, W., Irgolic, K.J., 1999. Uptake ofarsenic-betaines by the mussel Mytilus edulis. Comp. Biochem. Physiol. CToxicol. Pharmacol. Endocrinol. 122, 131–137.
Gebel, T.W., 2001. Genotoxicity of arsenical compounds. Int. J. Hyg. Environ. Health203, 249–262.
Gobas, F.A.P.C., Morrison, H.A., 2000. Bioconcentration and biomagnification in theaquatic environment. In: Boethling, R.S., Mackay, D. (Eds.), Handbook ofproperty estimation methods for chemicals: environmental and healthsciences. CRC Press LLC, Boca Raton, Florida.
Goessler, W., Maher, W., Irgolic, K.J., Kuehnelt, D., Schlagenhaufen, C., Kaise, T., 1997.Arsenic compounds in a marine food chain. Fresen. J. Anal. Chem. 359, 434–437.
Hirata, S., Toshimitsu, H., Aihara, M., 2006. Determination of arsenic species inmarine samples by HPLC-ICP-MS. Anal. Sci. 22, 39–43.
Hobson, K.A., Welch, H.E., 1992. Determination of trophic relationships within ahigh Arctic marine food web using d13C and d15N analysis. Mar. Ecol. Prog. Ser.84, 1–8.
Ikemoto, T., Tu, N.P.C., Okuda, N., Iwata, A., Omori, K., Tanabe, S., Tuyen, B.C.,Takeuchi, I., 2008a. Biomagnification of trace elements in the aquatic food webin the Mekong Delta, South Vietnam using stable carbon and nitrogen isotopeanalysis. Arch. Environ. Contam. Toxicol. 54, 504–515.
Ikemoto, T., Tu, N.P.C., Watanabe, M.X., Okuda, N., Omori, K., Tanabe, S., Tuyen, B.C.,Takeuchi, I., 2008b. Analysis of biomagnification of persistent organic pollutantsin the aquatic food web of the Mekong Delta, South Vietnam using stable carbonand nitrogen isotopes. Chemosphere 72, 104–114.
Khokiattiwong, S., Kornkanitnan, N., Goessler, W., Kokarnig, S., Francesconi, K.A.,2009. Arsenic compounds in tropical marine ecosystems: similarities betweenmangrove forest and coral reef. Environ. Chem. 6, 226–234.
Kirby, J., Maher, W., 2002. Tissue accumulation and distribution of arseniccompounds in three marine fish species: relationship to trophic position.Appl. Organomet. Chem. 16, 108–115.
Kirby, J., Maher, W., Chariton, A., Krikowa, F., 2002. Arsenic concentrations andspeciation in a temperate mangrove ecosystem, NSW. Australia. Appl.Organomet. Chem. 16, 192–201.
Kubota, R., Kunito, T., Tanabe, S., 2002. Chemical speciation of arsenic in the livers ofhigher trophic marine animals. Mar. Pollut. Bull. 45, 218–223.
Kunito, T., Kubota, R., Fujihara, J., Agusa, T., Tanabe, S., 2008. Arsenic in marinemammals, seabirds, and sea turtles. Rev. Environ. Contam. Toxicol. 195, 31–69.
Lai, V.W.M., Cullen, W.R., Ray, S., 1999. Arsenic speciation in scallops. Mar. Chem.66, 81–89.
Lin, H.-T., Chen, S.-W., Shen, C.-J., Chu, C., 2008. Arsenic speciation in fish on themarket. J. Food Drug Anal. 16, 70–75.
Liu, C.W., Lin, K.H., Jang, C.S., 2006. Tissue accumulation of arsenic compounds inaquacultural and wild mullet (Mugil cephalus). Bull. Environ. Contam. Toxicol.77, 36–42.
Maher, W., Goessler, W., Kirby, J., Raber, G., 1999. Arsenic concentrations andspeciation in the tissues and blood of sea mullet (Mugil cephalus) from LakeMacquarie NSW. Aust. Mar. Chem. 68, 169–182.
Mason, R.P., Laporte, J.M., Andres, S., 2000. Factors controlling the bioaccumulationof mercury, methylmercury, arsenic, selenium, and cadmium by freshwaterinvertebrates and fish. Arch. Environ. Contam. Toxicol. 38, 283–297.
Matsuo, H., Kawano, M., Omori, K., Nakajima, K., Takeuchi, I., 2009. Stable isotope-guided analysis of congener-specific PCB concentrations in a Japanese coastalfood web. Mar. Pollut. Bull. 58, 1615–1623.
Meador, J.P., Ernest, D.W., Kagley, A., 2004. Bioaccumulation of arsenic in marinefish and invertebrates from Alaska and California. Arch. Environ. Contam.Toxicol. 47, 223–233.
Minagawa, M., Wada, E., 1984. Stepwise enrichment of 15N along food chains:Further evidence and the relation between d15N and animal age. Geochim.Cosmochim. Acta 48, 1135–1140.
Morita, M., Shibata, Y., 1987. Speciation of arsenic compounds in marine life by highperformance liquid chromatography combined with inductively coupled argonplasma atomic emission spectrometry. Anal. Sci. 3, 575–577.
Murai, R., Sugimoto, A., Tanabe, S., Takeuchi, I., 2008. Biomagnification profiles oftributyltin (TBT) and triphenyltin (TPT) in Japanese coastal food webselucidated by stable nitrogen isotope ratios. Chemosphere 73, 1749–1756.
NACA, 1989. Integrated fish farming in China. NACA Technical Manual 7. A WorldFood Day Publication of the Network of Aquaculture Centres in Asia and thePacific, Bangkok, Thailand. p. 278.
Neff, J.M., 1997. Ecotoxicology of arsenic in the marine environment. Environ.Toxicol. Chem. 16, 917–927.
Nischwitz, V., Pergantis, S.A., 2005. First report on the detection and quantificationof arsenobetaine in extracts of marine algae using HPLC-ES-MS/MS. The Analyst130, 1348–1350.
Peterson, B.J., Fry, B., 1987. Stable isotopes in ecosystem studies. Annu. Rev. Ecol.Syst. 18, 293–320.
Phuong, N.T., Tiem, V.T., Hien, T.T.T., Thao, P.T.N., Khanh, L.V., 2004. Study on thefeeding and reproductive biology of spotted scat (Scatophagus argus). J. Sci. Stud.2, 51–59 (in Vietnamese with English abstract).
Rattanachongkiat, S., Millward, G.E., Foulkes, M.E., 2004. Determination of arsenicspecies in fish, crustacean and sediment samples from Thailand using highperformance liquid chromatography (HPLC) coupled with inductively coupledplasma mass spectrometry (ICP-MS). J. Environ. Monit. 6, 254–261.
Robertson, A.I., 1988. Abundance, diet and predators of juvenile banana prawns,Penaeus merguiensis, in a tropical mangrove estuary. Mar. Freshw. Res. 39, 467–478.
Salini, J.P., Blaber, S.J.M., Brewer, D.T., 1990. Diets of piscivorous fishes in a tropicalAustralian estuary, with special reference to predation on penaeid prawns. Mar.Biol. 105, 363–374.
Shinagawa, A., Shiomi, K., Yamanaka, H., Kikuchi, T., 1983. Selective determinationof inorganic arsenic (III), (V) and organic arsenic in marine organisms. Bull.Japan Soc. Sci. Fis. 49, 75–78.
Takeuchi, I., Miyoshi, N., Mizukawa, K., Takada, H., Ikemoto, T., Omori, K., Tsuchiya,K., 2009. Biomagnification profiles of polycyclic aromatic hydrocarbons,alkylphenols and polychlorinated biphenyls in Tokyo Bay elucidated by d13Cand d15N isotope ratios as guides to trophic web structure. Mar. Pollut. Bull. 58,663–671.
Thimdee, W., Deein, G., Sangrungruang, C., Matsunaga, K., 2004. Analysis of primaryfood sources and trophic relationships of aquatic animals in a mangrove-fringedestuary, Khung Krabaen Bay (Thailand) using dual stable isotope techniques.Wetl. Ecol. Manag. 12, 135–144.
Thomson, D., Maher, W., Foster, S., 2007. Arsenic and selected elements in inter-tidal and estuarine marine algae, South-East coast, NSW. Australia. Appl.Organomet. Chem. 21, 396–411.
Tu, N.P.C., Ha, N.N., Ikemoto, T., Tuyen, B.C., Tanabe, S., Takeuchi, I., 2008a.Bioaccumulation and distribution of trace elements in tissues of giant riverprawn Macrobrachium rosenbergii (Decapoda: Palaemonidae) from SouthVietnam. Fish. Sci. 74, 109–119.
Tu, N.P.C., Ha, N.N., Ikemoto, T., Tuyen, B.C., Tanabe, S., Takeuchi, I., 2008b. Regionalvariations in trace element concentrations in tissues of black tiger shrimpPenaeus monodon (Decapoda: Penaeidae) from South Vietnam. Mar. Pollut. Bull.57, 858–866.
134 N.P.C. Tu et al. / Marine Pollution Bulletin 63 (2011) 124–134
Copyright © 2022 FDOKUMEN