STA Annual Meeting Syllabus The Value of Innovation
138
STA Annual Meeting Syllabus January 15-18, 2020 Four Seasons Resort Austin Austin, Texas Program Co-Chairs: Clyde Matava, MD Robert Freundlich, MD, MS, MSCI The Value of Innovation ANNIVERSARY TH THANK YOU CORPORATE MEMBERS #STA20Austin
-
Upload
khangminh22 -
Category
Documents
-
view
2 -
download
0
Transcript of STA Annual Meeting Syllabus The Value of Innovation

1
Advancing Technology Through Education & Innovation
Society for Technology in Anesthesia
STA Annual Meeting Syllabus
January 15-18, 2020Four Seasons Resort AustinAustin, TexasProgram Co-Chairs:Clyde Matava, MDRobert Freundlich, MD, MS, MSCI
The Value of Innovation
ANNIVERSARY
THAdvancing Technology Through Education & Innovation
Society for Technology in Anesthesia
T H A N K Y O U C O R P O R A T E M E M B E R S
#STA20Austin

2
Welcome to the Society for Technology in Anesthesia’s (STA) 2020 Annual Meeting! We are looking forward to an outstanding program for our 30th anniversary that was expertly organized by our program co-chairs, Drs. Robert Freundlich and Clyde Matava, and abstract co-chairs, Drs. Matthias Gorges and Ira Hofer. Also, our meeting could not happen without our excellent staff, Marie Odden, Aubrey Trecek and Jane Svinicki. Please make sure to express your thanks to all of them.
This year’s meeting theme, “The Value of Innovation,” describes exactly why the STA has met annually for 30 years, and precisely what we have done to our meeting format this year – innovate. With so many topics and content to address, shorter, more concise talks will allow us all to cover more ground without lengthening the meeting.
Key topics that are either innovations or lead to innovations include data warehouses, strategic education, medical devices, leadership, Artificial Intelligence (of course), other data sources, and a whole host of power talk topics. The concurrent workshops this year tackle communication and analytics, a millimeter wave gesture focused engineering challenge, and scientific abstracts.
Beyond the formal talks, we received feedback from our Corporate Members that more member interaction was a high priority. This year, we dedicate meeting time for Corporate Member elevator pitches at
the Thursday luncheon and speed dating events Thursday and Friday afternoon to help break the ice. We anticipate that these interactions will result in increased networking between like-minded anesthesia technologists from academia, private practice, industry, and government.
Finally, I want to especially thank our Corporate Members for their continued and sustained support of our Society. Without you, the STA Annual Meeting would not be possible. Please take advantage of our new format to interact with them, so we can all to learn and discuss innovation together.
Don’t forget to tag the STA in your Annual Meeting social media posts: @STAhq and #STA20Austin
Brian S. Rothman, MD President, Society for Technology in Anesthesia
Welcome
Invited FacultyNewaj Abdullah, MDBaylor College of Medicine
Madison Agee, MAVanderbilt University Medical Center
John Alexander, MD, MBAUT Southwestern Medical Center
Maria Katerina Alfaro, MSChildren’s Hospital of Philadelphia
Priya Arunachalam, MBAEnMed - Texas A&M Health Science Center
Marcus Badgeley, PhDMassachusetts General Hospital
Steven Barker, MD, PhD University of Arizona
Garrett Burnett, MD Icahn School of Medicine at Mount Sinai
Maxime Cannesson, MD, PhD University of California, Los Angeles
Jagdish Chaturvedi, MBBS, MBAHiiiH Innovations Pvt LTD
Michael Dinsmore, BSc, MD, PhD, FRCPCToronto Western Hospital
Jesse Ehrenfeld, MD, MPH Medical College of Wisconsin
Richard Epstein, MDUniversity of Miami, Miller School of Medicine
Neil Feinglass, MD, FCCP, FASEMayo Clinic
David Feinstein, MD, MSBeth Israel Deaconess Medical Center
Robert Fiala, MDUniversity of Miami
Robert Freundlich, MD, MS, MSCI2020 Annual Meeting Co-ChairVanderbilt University Medical Center
Clinton Fuller, MDTexas Children’s Hospital
Jorge Galvez, MD, MBIChildren’s Hospital of Philadelphia
Andrea Gomez Morad, MDBoston Children’s Hospital / Harvard Medical
School
Matthias Görges, PhD2020 Abstract Co-ChairBC Children’s Hospital Research Institute
Calvin Gruss, MD, MSVanderbilt University Medical Center
Thomas Hemmerling, MD, MSc, DEAAMcGill University
Ira Hofer, MD2020 Abstract Co-ChairRonald Reagan UCLA Medical Center
Ali Jalali, MSME, PhDJohns Hopkins All Children’s Hospital
Daniel Katz, MDIcahn School of Medicine at Mount Sinai
Gerry Koons, BSMikos Research Group
Vesela Kovacheva, MD, PhDBrigham and Women’s Hospital, Harvard Medical
School
Barrett Larson, MDStanford Medicine
Robert “Butch” Loeb, MDUniversity of Florida
Hannah Lonsdale, MBChB, FRCAJohns Hopkins All Children’s Hospital
Jeffrey Mandel, MD, MSPerelman School of Medicine at the University of
Pennsylvania
Clyde Matava, MD2020 Annual Meeting Co-ChairHospital for Sick Children, University of Toronto
Jakob Mathiszig-Lee, MBBS, BSc, FRCAImperial College Healthcare NHS Trust
Rebecca Minehart, MD, MSHPEdMassachusetts General Hospital
Olivia Nelson, MDChildren’s Hospital of Philadelphia
Vanessa Palter, MD St Michaels’ Hospital, Toronto
John Pawlowski, MD, PhDBeth Israel Deaconess Medical Center
Paul Potnuru, MDUniversity of Texas, McGovern
Medical School
Christopher Quartararo, MDWinchester Anesthesia Associates
David Reich, MDMount Sinai Hospital
Mark Rice, MDVanderbilt University School of Medicine
Chris Rishel, MD, PhDStanford University
Brian Rothman, MDPresident, STAVanderbilt University
Warren Sandberg, MD, PhDVanderbilt University Medical Center
Norma Sandrock, MD Beth Israel Deaconess Medical Center
Kirk Shelley, MD, PhD Yale University School of Medicine
Asad Siddiqui, BHSc, MD, MEd, FRCPC The Hospital for Sick Children
Nathaniel Sims, MDHarvard Medical School / Massachusetts General
Hospital
John Sudkamp, MDSt. Anthony’s Memorial Hospital
Jonathan Tan, MD, MPH, MBI Children’s Hospital of Philadelphia
Carla Todaro, MDAzienda Sanitaria Universitaria Ospedaliera
Integrata di Trieste
Kevin Tremper, MD, PhDUniversity of Michigan
Jonathan Wanderer, MD, MPhil Vanderbilt University Medical Center
Jack Wasey, BMBCh, MA, MSci, MScChildren’s Hospital of Philadelphia
Dan Wise, MBCHBClinical Simulation Centre at Aintree
Karla Wyatt, MD, MS, FAAPBaylor College of Medicine/Texas Children’s
Hospital
Julie Yu, MD, FRCPCThe Hospital for Sick Children, Toronto

3
Activity Overview The Society for Technology in Anesthesia (STA) 2020 Annual Meeting will provide a forum for discussion of merging innovations and technology in anesthesia with a particular emphasis on the value of innovation in data science and medical devices. Topics covered throughout the program include the latest advances in automated drug delivery, innovations in education through use of technology, machine learning, anesthesia EHRs, the role of entrepreneurs in medical device technology and cybersecurity in healthcare.
Educational Objectives As a result of participation in this CME activity, learners should be able to:
• Describe the current limitations of medical device cybersecurity and summarize the research being done in this area.
• Describe examples of innovations in resident education utilizing virtual reality and simulation.
• Summarize the latest advances in closed loop systems and automated drug delivery.
• Understand the strengths and limitations of next generation anesthesia EHRs.
• Describe the type of algorithms that are commonly used in machine learning in the healthcare space.
• Discuss the role that entrepreneurs can play in advancing medical device technology for clinicians and patients.
• Summarize current research being pursued by anesthesiologists and engineers in both industry and academic settings.
Barriers to change:
• Reduced ability to implement innovative or cutting edge technologies in an era of increasing EHR consolidation and centralization.
Target Audience This live activity is designated for a national and international audience of physicians, engineers and industry members, as well as other practitioners in the field of anesthesia seeking an update on the current and future state of anesthesia technology.
CME Accreditation Statement In support of improving patient care, this activity has been planned and implemented by Amedco LLC and the Society for Technology in Anesthesia (STA). Amedco LLC is jointly accredited by the Accreditation Council for Continuing Medical Education (ACCME), the Accreditation Council for Pharmacy Education (ACPE), and the American Nurses Credentialing Center (ANCC), to provide continuing education for the healthcare team.
Amedco LLC designates this live activity for a maximum of 17.00 AMA PRA Category 1 Credits™. Physicians should claim only the credit commensurate with the extent of their participation in the activity.
Pre-Conference Session 20/20 Vision for Anesthesia Innovation – A Lens to the Future (for Industry ONLY)
Wednesday, January 15, 2020 • 0800 - 1200
The 20/20 Vision Course started over ten years ago as an introduction to the practice of anesthesia for non-clinical STA members. Through the years it has evolved to its current form where STA industry members and anesthesiologists meet to discuss current trends in anesthesia practice and product development.
This half day course is planned for industry by the scientist and researcher members of the STA involved in designing, testing and marketing new developments and products to anesthesiologists. Basic talks will provide participants with an understanding of the practice of anesthesiology and how to recognize opportunities for new products. The session will include mini descriptions and group discussions on key aspects of the clinical specialty, including anesthesia work-flow: what works and what’s needed.
Discussions are driven by participant interests regarding all aspects of anesthesia care and practice. Faculty for the course are board-certified anesthesiologists from multiple geographic locations, practice settings and varieties of anesthesia care. Prior sessions have focused on the anesthesia machine, infusion pumps, AIM systems and Big Data, as well as the basics for those who are just getting acquainted with the specialty.
Work groups of anesthesiologists and participants will address challenges in the design process and how these can be overcome to market a successful product. This will be a highly interactive and stimulating workshop. Open to Industry Participants ONLY. Pre-registration required.
Meeting Accreditation Information

4
Schedule of Events
Wednesday, January 15, 2020
0700-0800 20/20 Vision Course Stone’s Crossing Registration (For Industry ONLY – Pre- Registration Required)
0800-1700 Exhibitor Registration & Ballroom AB Setup
0800-1200 20/20 Vision for Stone’s Crossing Anesthesia Innovation – A Lens to the Future (For Industry ONLY – Pre- Registration Required) David Feinstein, MD, MS, Norma Sandrock, MD, John Pawlowski, MD, PhD, Jesse Ehrenfeld, MD, MPH, Christopher Quartararo, MD, John Sudkamp, MD
1800-2000 Registration & Welcome Ballroom AB Cocktail Reception
Thursday, January 16, 2020
0700-0800 Registration & Continental Ballroom AB Breakfast
0800-0815 Welcome AddressBallroom CD Brian Rothman, MD, Clyde Matava, MD & Robert Freundlich, MD, MS, MSCI
Session 1: Keynote AddressModerators: Clyde Matava, MD & Robert Freundlich, MD, MS, MSCI
0815-0915 Finding the Data Scientist Ballroom CD and Decision Support Expert in Every Anesthesiologist: Sharing Talents Beyond the OR David Reich, MD
0915-0930 Break with Exhibitors & Ballroom AB Abstract Posters
Session 2: The Enterprise Electronic Medical Record Data Access Problem: How to Build a Perioperative Data Warehouse for Quality Improvement, Reporting and ResearchModerator: Richard Epstein, MD
0930-0950 Where’s Waldo? Ballroom CD Deconstructing a Complex EMR to Build a Perioperative Data Warehouse Ira Hofer, MD
0950-1010 Making Lemonade When Ballroom CD All You Get Are Lemons: Building a Data Warehouse in the Face of IT Roadblocks Paul Potnuru, MD
1010-1030 Holding on to the Baby Ballroom CD When IT Throws Out the Bathwater: Maintaining Your Existing Data Warehouse Jonathan Wanderer, MD, MPhil
1030-1040 Panel DiscussionBallroom CD
Session 3: Value Through Strategic EducationModerator: Daniel Katz, MD
1040-1050 Inter-professional Team Ballroom CD Simulation as a Catalyst for Innovation and Education Rebecca Minehart, MD, MSHPEd
1050-1100 Utilizing 3-D Printing Ballroom CD and Rapid Prototyping for Innovation and Education Garrett Burnett, MD
1100-1110 A Novel Web Based Platform Ballroom CD for Anesthetic Innovation and Education Barrett Larson, MD& Chris Rishel, MD, PhD
1110-1120 Panel DiscussionBallroom CD
1120-1200 Break with Exhibitors & Ballroom AB Abstract Posters
1200-1315 Industry Spotlight LuncheonFour Seasons Lawn (with Tex-Mex Buffet)
Session 4: Medical DevicesModerator: Steven Barker, MD, PhD
1315-1335 What’s Next for Drug Ballroom CD Infusion Devices - Journey from “Smart Pumps” to Physiological Closed Loop Control Nathaniel Sims, MD
1335-1355 New Medical Technology in Ballroom CD India Jagdish Chaturvedi, MBBS, MBA
1355-1415 Alarm Sounds that Mean Ballroom CD Something Robert “Butch” Loeb, MD
1415-1425 Panel DiscussionBallroom CD
1425-1505 Posters in a Minute: Ballroom CD Moderated Poster Summaries Group A Moderator: Ira Hofer, MD
1505-1525 Break with Exhibitors & Ballroom AB Abstract Posters
Session 5: Abstract Awards & PresentationsModerator: Thomas Hemmerling, MD, MSc, DEAA
1525-1545 Best Clinical Application Ballroom CD Award Presentation Clinton Fuller, MD
1545-1605 Excellence in Technology Ballroom CD Award Presentation Robert Fiala, MD
1605-1625 Best of Show Award Ballroom CD Presentation Neil Feinglass, MD, FCCP, FASE
1630-1730 “Speed Dating” with San Jacinto Corporate Members Ballroom
1730-1830 STA Cocktail Reception Ballroom AB
Friday, January 17, 2020
0715-0815 Registration & Continental Ballroom AB Breakfast
Session 6: New Sources of DataModerator: Michael Dinsmore, BSc, MD, PhD, FRCPC
0815-0835 Geospatial Analysis and Ballroom CD Location Intelligence Insights in Perioperative Care Jonathan Tan, MD, MPH, MBI
0835-0855 The OR Black Box: Big Data Ballroom CD for Big Questions Vanessa Palter, MD
0855-0915 Smartphone Apps as a Ballroom CD Valuable New Source of Data and Innovation in Healthcare John Alexander, MD, MBA
0915-0925 Panel DiscussionBallroom CD
Session 7: Power Talks: A Power-Talk of the Town: Inspired by the Next Generation of Leading ScientistsModerator: Karla Wyatt, MD, MS FAAP
0925-1025 Ballroom CDNewaj Abdullah, MDPriya Arunachalam, MBAMarcus Badgeley, PhDGerry Koons, BS
Barrett Larson, MDCarla Todaro, MDDan Wise, MBChB

5
Schedule of Events continued1025-1100 Break with Exhibitors & Ballroom AB Abstract Posters
Session 8: Leadership Through InnovationModerator: Mark Rice, MD
1100-1120 A Multifunction Display Ballroom CD for Medicine: A Safety Game Changer or Video Game? Kevin Tremper, MD, PhD
1120-1140 Assigning Value to Ballroom CD Perioperative Equipment: Are We Getting Our Money’s Worth? Mark Rice, MD
1140-1200 Should Hospital Leaders Ballroom CD Care About Our Technology? Warren Sandberg, MD, PhD
1200-1210 Panel DiscussionBallroom CD
1210-1250 Posters in a Minute: Ballroom CD Moderated Poster Summaries Group B Moderator: Matthias Görges, PhD
1250-1400 STA Business Luncheon San Jacinto & 2020 J.S. Gravenstein Ballroom Award Presentation Brian Rothman, MD & Kirk Shelley, MD, PhD
Session 9: Research Grant PresentationsModerator: Thomas Hemmerling, MD, MSc, DEAA
1400-1445 2019 Neurowave Ballroom CD Research Grant Recipient Presentation Asad Siddiqui, BHSc, MD, MEd, FRCPC
1445-1515 Break with Abstract PostersFour Seasons Ballroom Foyer
Session 10: Concurrent Sessions
1515-1715 Treating the Problem List of Ballroom CD Healthcare Communication Brian Rothman, MD & Madison Agee, MA
This interactive workshop, led by a practicing clinician and a communications expert, will begin with a dive into communication fundamentals, including channel, timing, audience and goal setting. It will then build on these fundamentals,
shifting focus to specific communications issues endemic to healthcare settings. Attendees will leave with easily-executable strategies and tools to overcome these issues, as well as a broader skill set to more powerfully and effectively communicate in a healthcare setting–to inform, persuade, inspire action and get desired results.
1515-1715 R Workshop: Finding the San Jacinto Needle in a Haystack (with a West Magnet) Jack Wasey, BMBCh, MA, MSci, MSc & Maria Katerina Alfaro, MS
This workshop will take beginner and intermediate R users from a typical raw anesthesia dataset through to a regression model. At the end of this workshop, you will be able to use standard R tools to clean and prepare data for analysis, including: finding comorbidities from ICD diagnosis codes (using the ‘icd’ package), summarizing time series, evaluating missing and invalid data, build a regression model and plot the results. Overall, the technique of “reproducible research” will be used, such that the entire analysis through to results is documented and automated. Experience with basic R will be helpful, but not absolutely required if you are prepared to leap along with us as we work through each step.
1515-1715 “Speed Dating” with San Jacinto East Corporate Members
Saturday, January 18, 2020
0730-0815 Registration & Coffee Four Seasons (no breakfast provided) Ballroom Foyer
STA Engineering ChallengeModerator: Jeffrey Mandel, MD, MS
0815-1000 Engineering ChallengeBallroom CD
1000-1020 Break with Abstract Posters Four Seasons Ballroom Foyer
Session 11: Artificial Intelligence in the Perioperative Setting: Development, Implementation and ValueModerator: Maxime Cannesson, MD, PhD
1020-1035 Artificial Intelligence in Ballroom CD Obstetrics Vesela Kovacheva, MD, PhD
1035-1050 Using Machine Learning to Ballroom CD Predict Respiratory Deterioration Robert Freundlich, MD, MS, MSCI
1050-1105 Machine Vision for Airway Ballroom CD Management and Regional Anesthesia Procedures Clyde Matava, MD1105-1115 Panel DiscussionBallroom CD
Session 12: Society for Computing and Technology in Anesthesiology (SCATA)Moderator: Robert Freundlich, MD, MS, MSCI & Clyde Matava, MD
1115-1145 Target Controlled Infusions Ballroom CD and Genetic Algorithms Jakob Mathiszig-Lee, MBBS, BSc, FRCA
Session 13: Power Talks: Technological Advances in Perioperative Medicine.. What If?Moderator: Jorge Galvez, MD, MBI
1145-1155 Evolution, Analysis, and Ballroom CD Implementation of Life-Saving Systems and Processes Calvin Gruss, MD, MS
1155-1205 Regional Anesthesia Beyond Ballroom CD Our Imagination: A Vision of the Future Andrea Gomez Morad, MD
1205-1215 What if... Everyone Wore a Ballroom CD Fitness Tracker? Hannah Lonsdale, MBChB, FRCA
1215-1225 Dystopian Data, for a Utopic Ballroom CD Anesthetic? Julie Yu, MD, FRCPC
1225-1235 Emerging Machine Learning Ballroom CD Methods and Future of Machine Learning in Healthcare Ali Jalali, MSME, PhD
1235-1245 Easing the Transition Ballroom CD to Extrauterine Life: Advances in Fetal and Neonatal Surgery Olivia Nelson, MD
1245 Meeting Adjourned

6
WiFi Network: FourSeasons Password: fsaustin
Four Seasons Resort Austin

7
Sustaining & Annual Corporate Members
Company Descriptions
Sustaining Corporate Members
Annual Corporate Members
Platinum PlusEdwards Lifesciences
PlatinumBecton Dickinson
Draeger Medical
GoldGE Healthcare
Platinum PlusMedtronic
GoldMasimoMindray North America
SilverGetingeIntelliGuard Inventory
Solutions
Entrepreneur GoldSpiraLithCa
Entrepreneur SilverAlertWatchGauss SurgicalCodonics
AlertWatch • www.alertwatch.comAlertWatch develops integrated decision support software to help anesthesiologists improve quality, safety, and efficiency across the entire continuum of care. The software integrates device and medical record information to produce real-time alerts focused on improving outcomes and reducing length of stay. At the STA meeting, we will be demoing the following solutions:
AlertWatch®:OR This application consolidates 250 real-time and historical data elements onto intuitive multi-patient and single-patient dashboards. With AlertWatch:OR, clinicians can track real-time patient status and case progress at a glance, including sophisticated alerts and clinical decision support built for the perioperative workflow.
AlertWatch®:OB This application tracks each mother throughout the entire labor, delivery and post-delivery process, automatically assessing hemorrhage risk and alerting for emerging clinical issues. By providing a complete clinical picture for each patient, AlertWatch:OB will become a key piece of your maternal safety efforts.
AlertWatch®:AC This application, pending FDA clearance, helps clinicians oversee high-risk ICU patients, with clinical decision support built for high-risk ECMO and ventilated patients. The solution could also serve as a safety net for floor and other low acuity patients.
AlertWatch®:PACU This application, pending FDA clearance, helps anesthesiologists remotely monitor and discharge PACU patients. The solution passes on useful analysis from intraoperative data and helps the entire care team provide more consistent care.

8
Company DescriptionsBecton Dickinson • www.bd.comBD is a global medical technology company that is advancing the world of health by improving medical discovery, diagnostics and the delivery of care. BD leads in patient and healthcare worker safety and the technologies that enable medical research and clinical laboratories. The company provides innovative solutions that help advance medical research and genomics, enhance the diagnosis of infectious disease and cancer, improve medication management, promote infection prevention, equip surgical and interventional procedures and support the management of diabetes.
Codonics • www.codonics.comCodonics Safe Label System (SLS), an FDA Class II medical device, helps improve safety, compliance and efficiency anywhere medications are prepared. The system integrates with anesthesia dispensing carts at preparation and EHRs such as Epic and Cerner during administration. As a medication is removed from the cart, a quick scan of the barcode on SLS visually and audibly identifies it, ensuring safety. An easy-to-read barcoded label that fully complies to TJC standards is presented, then applied to the prepared syringe. Using SLS-WAVE, syringes are scanned at administration into the AIMS to electronically document the drug, concentration and time stamp, eliminating clicks and improving documentation. NEW! SLS’s advanced integration with Epic enables interoperability with interoperable syringe pumps in the operating room to significantly improve the anesthesia workflow and more. A standard of care, SLS is installed in more than 8,000 of the world’s leading hospitals.
Draeger Medical • www.draeger.comFor more than a century, Dräger has been providing anesthesia technology clinicians can count on. As a leader in medical and safety technology, Dräger employs more than 10,000 people worldwide and is present in more than 190 countries. From anesthesia machines to anesthesia monitors to anesthesia information management systems, no other company is more focused on anesthesia care than Dräger.
Edwards Lifesciences • www.edwards.comEdwards Lifesciences is the leader in heart valve and hemodynanamic monitoring.
Gauss Surgical • www.gausssurgical.comGauss is transforming surgery with an AI-enabled mobile platform for the operating room. Based in Silicon Valley, the company leverages computer vision, machine learning, and artificial intelligence to power surgical safety protocols by delivering real-time insights, simplifying clinical workflow, and closing communication gaps. The company’s flagship iPhone and iPad- compatible Triton platform is FDA cleared and CE Marked and powers maternal hemorrhage protocols in hospitals performing over 250,000 annual deliveries. For more information, visit http://www.gauss.com.

9
Company DescriptionsGE Healthcare • www.gehealthcare.comGE Healthcare is a leading provider of anesthesia delivery and patient monitoring. GE Healthcare enables precision health through intelligent devices, data analytics, and applications to help providers and researchers in their mission to improve outcomes for patients around the world. With the Aisys CS2 anesthesia machine and cloud-based analytics platform, Carestation Insights, we are building an intelligent ecosystem of connected machines the reveal patterns and actionable insights that may help clinicians improve patient outcomes.
Getinge • www.getinge.comGetinge is a leading global provider of innovative solutions for operating rooms, intensive-care units, hospital wards, sterilization departments and for life science companies and institutions. Based on first-hand experience and close partnerships, Getinge offers innovative healthcare solutions that improve every-day life for people, today and tomorrow.
IntelliGuard Inventory Solutions • www.ig.solutionsIntelliGuard® uses advanced RFID technology to deliver unparalleled real-time visibility of critical inventory in healthcare. IntelliGuard’s® unwavering commitment to accuracy helps to eliminate human error, reduce risk and increase efficiency.
Masimo • www.masimo.comMasimo is a global medical technology company that develops and produces a wide array of industry-leading monitoring technologies, including innovative measurements, sensors, patient monitors, and automation solutions.
Medtronic • https://www.medtronic.com/us-en/healthcare-professionals/products/ patient-monitoring.htmlMedtronic plc (www.medtronic.com), headquartered in Dublin, Ireland, is among the world’s largest medical technology, services and solutions companies – alleviating pain, restoring health and extending life for millions of people around the world. Medtronic employs more than 90,000 people worldwide, serving physicians, hospitals and patients in more than 150 countries. The company is focused on collaborating with stakeholders around the world to take healthcare Further, Together.

10
Company DescriptionsMindray North America • www.mindray.comAt Mindray, we believe we can change lives by making the most advanced healthcare technology attainable for all. We are a leading developer, manufacturer and supplier of medical device solutions and technologies used in healthcare facilities around the globe. We empower healthcare professionals through innovative, high-value solutions that help create the next generation of life-saving tools across patient monitoring, anesthesia delivery, and ultrasound imaging.
Mindray is creating innovative, disruptive and game-changing products and partnerships, shaping a new conversation for healthcare providers across North America. We work with thousands of healthcare providers day-to-day to drive the development and implementation of smarter technology – solutions that are simple and affordable, easy to adapt, and return bottom line results and meaningful outcomes.
At Mindray, we are initiating a powerful and disruptive dialog around what is possible when the right tools are in the hands of the right providers. We do this by supporting the mission of our customers – to improve the delivery of healthcare by assuring the next generation of healthcare technology is more beneficial than the last.
Mindray North America is headquartered in Mahwah, New Jersey. Our Innovation Center is located in San Jose, California with additional facilities in Nashville, Tennessee and Seattle, Washington. We have an impressive infrastructure of expert field sales and support professionals covering the United States, Canada and Puerto Rico. Learn more at https://www.mindraynorthamerica.com/.
SpiraLithCa • www.spiralithusa.comSpiraLith Ca is the only CO2 Absorbent. Our Solid cartridge technology maximizes absorbent performance. SpiraLIth Ca eliminates Dusting and Channeling associated with granular absorbents. It has a Color Indicator Window System which provides a Real-Time Tool so users know remaining Cartridge Life. Made by Micropore, Inc. in Elkton, Maryland.
STA 2021 Annual Meeting January 13-16, 2021 • The Naples Beach Resort • Naples Florida
Save the Date

11
Abstract Table of Contents
Abstract # Full Abstract Title Presenting Author Institution
1 Statistical Comparison of Compartmental Propofol Pharmacokinetic Models for Designing Computer-Controlled Infusion Systems
Jingzhi An, PhD Massachusettes General Hospital, Duke-NUS
2 Need Help Navigating the Hospital Maze to a Non-operating Room Anesthesia Site? There’s an App for That
Elie Sarraf, MD Penn State Health Milton S Hershey Medical Center
3Comparing Ventilation Quality During One-Handed Versus Two-Handed Mask Holding Techniques During Induction Of Anesthesia In Children Using The Pneuriptm Device
B. Randall Brenn, MD Vanderbilt Children's Hospital
4Standard Clinical Indicators of Opioid Induced Respiratory Depression (OIRD) Do Not Consistently Detect Opioid Toxicity that is Manifest as Ataxic Breathing
Robert Farney, MD, FACP University of Utah
5 A Computerized System to Prompt Postoperative Patients to Breathe during Drug-Induced Respiratory Depression
Dennis Berry-Rieser, BS University of Utah
6 The Multisensory Benefit of Informative Sound in Visual Task Performance
Alexandra Bruder, BS Vanderbilt University
7 A Novel Device to Monitor Breathing and Deliver Oxygen During Monitored Anesthesia Care (MAC)
Tariq Chaudhry, MD Tufts Medical Center
8Effectiveness of Immersive Virtual Reality Technology as a Distraction Technique During Awake Pediatric Interventional Radiology Procedures
Kathleen Chen, MD, MS Texas Children's Hospital
9 Reducing Medication Error Intraoperatively- Feedback on the Additional Verification of Intravenous Drug (AVOID) Error System
Pamela Chia, Bmed, MCAI, MMed Singapore General Hospital
10 Reading Minds with Lasers: Extracting the Neural Activity of C. elegans
Christopher Connor, MD, PhD
Brigham and Women's Hospital
11How do you Describe a Ventilation-Mode? Iso 19223 Lung Ventilators and Related Equipment — Vocabulary and Semantics, ieee 11073 part 10101, snomed ct, hl7
Steven Dain, MD, FRCPC University of Waterloo
12 Using Respiratory Volume Monitoring to Identify Respiratory Compromise in High Risk Obstetric Patients
Anna-Maria Eid, MD Yale University
13 Utilization of HRV to Detect Impending ShockMohamed Elgamal, MB, BCh Yale New Haven Hospital
14* Epidural Ultrasound Catheter Development and Prototype Testing in Swine: A First Look
Neil Feinglass, MD Mayo Clinic
15 Utilizing Clinical Data Across Multiple Aims Encounters: Finding Meaningful Use
David Feinstein, MD, MS Beth Israel Deaconess Medical Center
16** Transdermal Monitoring of Volatile Anesthetic Concentration During Surgery
Robert Fiala, MD University of Miami
17***The Application of Immersive Technologies as a Distraction Technique to Improve Office Laryngoscopy Exam Success Rates in Pediatric Patients
Clinton Fuller, MD, MS Texas Children's Hospital/Baylor College of Medicine
18 The Telephone Game: Signal Degradation of Automated Vital Sign Recording in Anesthesia Information Management Systems
Jorge Galvez, MD, MBI Children's Hospital of Philadelphia
19 A Sandbox Test Environment for Medical Device System Cybersecurity
Julian Goldman, MDMassachusettes General Hospital/Harvard Medical School
20 Hardware-in-the-Loop Testbed and Program to Support Verification of Interoperable Medical Devices for Closed-Loop Control of Anesthesia
Julian Goldman, MDMassachusettes General Hospital/Harvard Medical School
21Non-Invasive Arterial Blood Pressure Nomograms for Children Undergoing Total Intravenous Anesthesia – Results from a Large Retrospective Cohort Study
Matthias Görges, PhD The University of British Columbia
* Best of Show Award** Excellence in Technology Award
*** Best Clinical Application Award**** Honorable Mention

12
Abstract Table of Contents continuedAbstract # Full Abstract Title Presenting Author Institution
22 Using Decision Trees for Determining Anesthetic Technique Using Only Data from Multiparameter Patient Monitors
Matthias Görges, PhD The University of British Columbia
23 Perceptions of Expert and Lay Users on Trust in the Use of Artificial Intelligence for Medical Decision-Making and Risk Prediction
Matthias Görges, PhD The University of British Columbia
24 Machine Learning Predicts intraoperative Hypotension from End-Tidal Carbon Dioxide Measurement
Nathaniel Greenbaum, MD SUNY Downstate Health Sciences University
25 NOT
DISPLAYED
Kambin’s Triangle Approach for Percutaneous Transforaminal Epidural Adhesiolysis With Inflatable Balloon Catheter; A Pilot Study
Woong Ki Han Seoul National University Bundang Hospital
26 Jeopardy! Reengineered to Maximize Recall and Participation Ali Hassanpour, MD Texas Children's Hospital
27 Non-Invasive and Continuous Blood Pressure Monitoring Using Deep Convolutional Neural Networks
Brian Hill, MS University of California, Los Angeles
28An Automatic Video Laryngoscope Archiving System with a Pilot Study of First Pass Rates for 20 Randomly Selected Archived Intubations
Gabrielle Hoyer, MS University of Utah
29 PK/PD-Inspired Dosing Approach for Propofol-Induced Burst Suppression
Jason Huang, BS University of Utah
30 Assessment of Volume Status in Spontaneously Breathing Patients Ahmad Ibrahim, MD Yale University
31 Smartphone-Based Application for Frailty: Proposal for Rapid and Routine Perioperative Frailty Assessment
Parth Iyer Khan Lab School
32 Using Virtual Reality During Intravenous Line Placement to Improve the Patient Experience
Souhail Karram, MD Texas Children's Hospital/Baylor College of Medicine
33 Monitoring Sleep, Activity and Function Using Wearable Devices in Post-Surgical Patients: A Pilot Study
Stephen Kelleher, MD Boston Children's Hospital
34**** Assessing Machine Learning and Deep Learning Models for Suggested Dosing of Anesthetic Induction Medications
Samir Kendale, MD NYU Langone Health
35 A Preliminary Investigation of the Relationship Between EEG Alpha Power During Anesthesia and Frailty
Ross Kennedy, MD, PhD Christchurch Hospital
36 Eighteen Years of Exploring Patterns of Anaesthetic Gas Flows with More Recent Data on CO2 GWP Footprint
Ross Kennedy, MD, PhD Christchurch Hospital
37 Combined Ultrasonic Sensing for Low-Cost Anesthetic Agent Detection, Concentration Measurement, and Respiratory Monitoring
Patrick Kolbay, BS University of Utah
38 Adsorption Characteristics of Isoflurane in Porous Materials Patrick Kolbay, BS University of Utah
39 Real Time Measurement of Surgical Blood Loss in Suction Tubing Using Computer Vision and Machine Learning
Steve Scherf Gauss Surgical, Inc
40 National Trends in the Use of Peripheral Nerve Block in Outpatient Breast Cancer Procedures
Stephanie Lam, MS Memorial Sloan Kettering Cancer Center
41 An Interpretable Neural Network for Prediction of Postoperative In-hospital Mortality
Christine Lee, PhD University of California, Irvine
42**** Prediction of Postinduction Hypotension with Deep Learning Christine Lee, PhD University of California, Irvine
43 Urinary Oxygen Tension - A New Biomarker for Acute Kidney Injury Risk?
Lars Lofgren, BS University of Utah
44 Augmented Reality as a Tool to Reduce Fear and Promote Cooperation During Pediatric Nasal Endoscopy
Martine Madill, BA Stanford University
45 Smartphone Image Processing for the Internet of Dumb Things Jeff E. Mandel, MD, MS Mandel Anesthesia Innovations, LLC
46 Automated Recognition of Syringe Labels for Improved Patient Safety and Record Keeping: A Feasibility Study
Kelly Michaelsen, MD, PhD University of Washington
47 Monitoring Changes in Photoplethysmography During Lower Body Negative Pressure Induced Hypovolemia: Differences by Site and Sex
Emily Nagourney, MSPH Yale University School of Medicine

13
Abstract Table of ContentsAbstract # Full Abstract Title Presenting Author Institution
48Use of Anesthesia Information Management System (AIMS) Data to Determine Factors Associated with Low Blood Pressure in Healthy Anesthetized Infants
Olivia Nelson, MD Children's Hospital of Philadelphia
49 Experiences From a Multinational Pediatric Difficult Airway Whatsapp Group – A Study From the Pedi-R Collaborative
Evelina Pankiv, MD University of Toronto
50 The Adoption and Thematic Analysis of a Social Media Platform for the Management of Pediatric Difficult Airways – A Pedi-R Study
Evelina Pankiv, MD University of Toronto
51Using Artificial Intelligence to Assist with Intubation of Pediatric Patients – Development and Evaluation of Smartscope, a Novel Machine Learning Algorithm
Evelina Pankiv, MD University of Toronto
52 Utilization of a Voice-Based Virtual Reality Advanced Cardiac Life Support Refresher Course: An Exploratory Analysis
Chang Park, MD Icahn School of Medicine at Mount Sinai
53 NOT
DISPLAYED
Nasal Mask PC Ventilation to deliver CPAP in A Morbidly Obese OSA Patient During EGD
Neel Patel, BS Robert Wood Johnson Medical School
54 Evaluation of a Novel Method for Lung Isolation Using a High Fidelity Infant Mannequin – Preliminary Results
Robert Purdy, Bsc, MSc, DVM, MD, FRCPC BC Children’s Hospital
55 Exploring ASA Score Predictability Using Machine LearningPriya Ramaswamy, MD, M.Eng
Beth Israel Deaconess Medical Center
56 A Hybrid Rule-Based/Machine Learning Closed-Loop Ventilator (HCLV) Approach
Rocky Reston, MD, PhD Cognitive Medical Systems
57 Successful Use of Immersive Technology Distraction for Non-Sedate Transthoracic Echocardiograms in Pediatric Cardiac Patients
Elizabeth Rossmann Beel, MD, MPH Baylor College of Medicine
58 Postoperative In-Hospital Mortality Prediction Using Bayesian Neural Networks for Interpretability
Muntaha Samad, MS UC Irvine
59 A Novel Method of Low Cost Capnometry Allan Shang, MD, MSE Duke University School of Engineering
60 Optimization of Perioperative Communication and Turnover Within the Operating Room
Zakariah Siyaji, BSUniversity of Illinois Hospital & Health Sciences System
61 Remote Observation of Delayed Onset Malignant Hyperthermia: A Case Report
Stuart Solomon, MD Stanford University
62 The Impact of Real-Time Clinical Alerts on the Compliance of Anesthesia Documentation: A Retrospective Observational Study
Luis Tollinche, MD Memorial Sloan Kettering Cancer Center
63 Tracking Intravascular Volume Using Frequency Analysis of Plethysmographic Waveforms
Anna-Maria Eid, MD Yale University
64 Tracking Intravascular Volume Using Frequency Analysis of Peripheral Venous Pressure Waveforms
Anna-Maria Eid, MD Yale University
65Use of Provider Education, Intra-Operative Decision Support, and an Email-Feedback System in Reducing the Overuse of Sugammadex: A Quality Improvement Effort
Jonathan Wanderer, MD, MPhil
Vanderbilt University Medical Center
66 An Analysis of Publication Trends in Anesthesiology-specific Journals Using Latent Dirichlet Allocation Natural Language Processing
Ryan Wang, MD Icahn School of Medicine at Mount Sinai
67Developing a Decision Support System to Detect and Enhance the Response to Clinical Deterioration in Patients Receiving Outpatient Care for Cancer
Matthew Weinger, MD Vanderbilt University Medical Center
68 Development of an Anesthesia Information Virtual Assistant Albert Woo, MD Beth Israel Deaconess Medical Center

14
Back to Table of Contents
ABSTRACT TITLE: STATISTICAL COMPARISON OF COMPARTMENTAL PROPOFOL PHARMACOKINETIC MOD-ELS FOR DESIGNING COMPUTER-CONTROLLED INFUSION SYSTEMS
Presenting Author: Jingzhi An, Ph.D., M.D. candidate, Massachusetts General Hospital, Duke-NUS Graduate Medical SchoolCo-Authors: Chi Feng, M.Eng, Massachusetts Institute of Technology; Emery N. Brown, M.D., Ph.D., Massachusetts Instituteof Technology, Massachusetts General Hospital
Introduction: Target controlled infusion (TCI) systems and physiological closed-loop controlled (PCLC) infusion systems forpropofol delivery rely on pharmacokinetic (PK) models to customize infusion rates for patients. More than 15 adult propofolPK models have been published [1]; all are three-compartment models that use different formulae to generate population pa-rameters from biometric information (e.g. sex, age, weight, height) and report different amounts of additional inter-individualvariability. There is no consensus on which model is the most accurate. Furthermore, no study has systematically comparedpropofol PK predictions from the different models to characterize the effect of model choice on TCI and PCLC system per-formance.
Methods: We treat the compartmental PK models as dynamical systems and perform control-theoretic statistical analyses ofsystem properties that are important for TCI and PCLC systems. We demonstrate our approach by analyzing the predictedsteady-state plasma concentration and frequency response of seven representative propofol PK models for 100,000 simulatedpatients. The selected models are: Marsh-Adult (i.e. Diprifusor), Schnider, Schuttler, Elevald (2014), Elevald (2018), Barr, andSmuskiewicz. These models are widely-used for TCI and PCLC systems, and represent the diversity of approaches and patientpopulations in which in PK studies of propofol have been conducted.
Results: Our results show that given the same patient, propofol PK predicted by different models can be quite different (Fig1A). This suggests that the performance of TCI systems—which use exact predictions of compartmental drug concentrations todesign infusion profiles—is very sensitive to model choice. We also show with a global sensitivity analysis that biometric infor-mation only explains a small fraction of the variability in predicted concentrations for all models (Fig 1B). The remaining vari-ability comes from additional inter-individual variability that cannot be easily known for individuals and accounted for whendesigning TCI infusions profiles. Finally, our frequency response results show that the PK behavior for all simulated patientspredicted by all seven models, considering both biometric-based and unexplained inter-individual variability, are approximatelystable first-order systems (Fig 1C). This suggests that is possible to design robust controllers for PCLC systems that are safeand perform well for all models regardless of which model is most accurate.
Conclusion: We have shown that using control-theoretic statistical analysis to characterize systematically compartmental PKmodels can significant inform the design of computer-controlled infusion systems. The inability for TCI systems to reduce suf-ficiently PK variability has been a key factor that has prevented their regulatory approval in the United States [2]. Our resultsprovide evidence for why this is an unrealistic demand for TCI systems and suggest that PCLC systems can perform better. Inthis study, we have only scratched the surface of possible applications of control theory in combination with advanced statisti-cal methods in pharmacology. We conjecture that further cross-fertilization of ideas from these fields will improve our under-standing of drug action, design of computer-controlled infusion systems, and as a consequence, patient care.
References1. M. M. Sahinovic, M. M. R. F. Struys, and A. R. Absalom, “Clinical Pharmacokinetics and Pharmacodynamics of Propofol,” Clin Pharma-cokinet, vol. 57, no. 12, pp. 1539–1558, Dec. 2018.2. M. M. R. F. Struys, T. De Smet, J. I. B. Glen, H. E. M. Vereecke, A. R. Absalom, and T. W. Schnider, “The History of Target-Controlled In-fusion,” Anesth. Analg., vol. 122, no. 1, pp. 56–69, Jan. 2016.

14 15
Back to Table of Contents
Need Help Navigating the Hospital Maze to a Non-operating Room Anesthesia Site? There’s an App for That
Presenting Author: Abrahm Behnam, MS MD, Department of Anesthesiology & Perioperative Medicine, Penn State Health Milton S. Hershey Medical Center Co-Author: Elie Sarraf MDCM, Department of Anesthesiology & Perioperative Medicine, Penn State Health Milton S. Hershey Medical Center Background/Introduction: In-hospital navigation is a known challenge not only for patients and visitors, but also for new hospital employees. Various programs attempt to optimize in-hospital navigation for patients and visitors. These range from simple individual patient escorts to the complex wayfinding systems with 3-D maps registered to multiple preinstalled beacons. To our knowledge, no formal programs exist specific for new hospital employees. Anesthesia personnel involved in non-operating room anesthesia (NORA) must navigate through the hospital maze often traversing multiple floors. In addition to anesthesia attendings, CRNAs and support staff, there is an annual need not only for primary orientation of new anesthesia residents to these locations, but reorientation given the complexity of navigation. Often, this requires another senior anesthesia provider for personal escort who would otherwise be occupied. Methods/Results: To solve this navigation problem, we built a simple in-hospital navigation application for anesthesia providers going to and from NORA sites. The application contains a repository of photographic step-by-step navigational directions (Fig 1) for the various NORA sites at the Department of Anesthesiology & Perioperative Medicine, Penn State Health Milton S. Hershey Medical Center. The web-app is hosted on Google sites (https://sites.google.com/view/psu-hmc-anesthesia-asa/home) and is optimized for cell-phone use, eliminating the need of downloading, ensuring platform compatibility across cell phone makes and models, and provides version control. The navigation to each NORA site begins from the Main OR board, where NORA cases are assigned and breaks for providers are managed. A paper flyer is displayed at the main OR board consisting of a description of the web-application, a QR code and shortened URL to reach the website. The NORA site application was launched on October 2019, has been accessed 1-2 times per day since launch and has been met with positive reviews throughout the anesthesiology department at Penn State University Medical Center. Conclusion: In summary, we present the design and implementation of a simple turn-by-turn in-hospital navigation application that is novel due to its utility for anesthesia providers. Future plans include expanding locations to include guidance to emergent airways and codes, and the development of a more interactive interface registering each set of directions to a hospital map allowing multiple starting points. We hope that the design of this navigation app can serve as a framework for other institutions to create a simple solution for in-hospital navigation for healthcare providers.

16
Back to Table of Contents
Figure 1: Screen-shots of the app, optimized for cell phone use. Left: homepage of the app. Right: In red – Menu for additional site navigation, access to the flyer and submission for questions or comments, In blue – Examples of the navigation interface. References:
1. Harper C., et al. (2020) Designing Hospital Wayfinding Systems, Touchscreen Kiosks, Environmental Cues and Mobile Apps: An Evaluation of a Mobile Wayfinding Application. In: Lightner N., Kalra J. (eds) Advances in Human Factors and Ergonomics in Healthcare and Medical Devices. AHFE 2019. Advances in Intelligent Systems and Computing, vol 957. Springer, Cham
2. Lee, E. Improving Surgical Start Times by Improving Wayfinding. Journal of Perianesthesia Nursing. 2019 Sept 24. pii: S1089-9472(19)30262
16 17
Back to Table of Contents
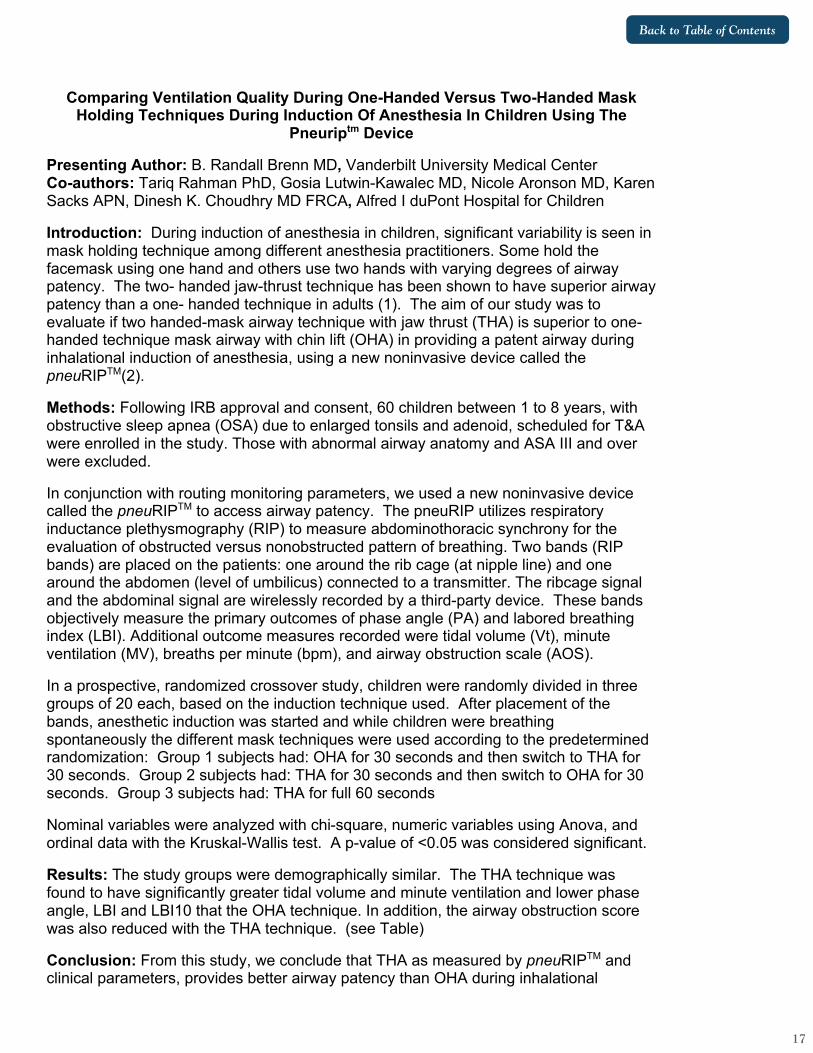
Comparing Ventilation Quality During One-Handed Versus Two-Handed Mask Holding Techniques During Induction Of Anesthesia In Children Using The
Pneuriptm Device
Presenting Author: B. Randall Brenn MD, Vanderbilt University Medical Center Co-authors: Tariq Rahman PhD, Gosia Lutwin-Kawalec MD, Nicole Aronson MD, Karen Sacks APN, Dinesh K. Choudhry MD FRCA, Alfred I duPont Hospital for Children
Introduction: During induction of anesthesia in children, significant variability is seen in mask holding technique among different anesthesia practitioners. Some hold the facemask using one hand and others use two hands with varying degrees of airway patency. The two- handed jaw-thrust technique has been shown to have superior airway patency than a one- handed technique in adults (1). The aim of our study was to evaluate if two handed-mask airway technique with jaw thrust (THA) is superior to one-handed technique mask airway with chin lift (OHA) in providing a patent airway during inhalational induction of anesthesia, using a new noninvasive device called the pneuRIPTM(2).
Methods: Following IRB approval and consent, 60 children between 1 to 8 years, with obstructive sleep apnea (OSA) due to enlarged tonsils and adenoid, scheduled for T&A were enrolled in the study. Those with abnormal airway anatomy and ASA III and over were excluded.
In conjunction with routing monitoring parameters, we used a new noninvasive device called the pneuRIPTM to access airway patency. The pneuRIP utilizes respiratory inductance plethysmography (RIP) to measure abdominothoracic synchrony for the evaluation of obstructed versus nonobstructed pattern of breathing. Two bands (RIP bands) are placed on the patients: one around the rib cage (at nipple line) and one around the abdomen (level of umbilicus) connected to a transmitter. The ribcage signal and the abdominal signal are wirelessly recorded by a third-party device. These bands objectively measure the primary outcomes of phase angle (PA) and labored breathing index (LBI). Additional outcome measures recorded were tidal volume (Vt), minute ventilation (MV), breaths per minute (bpm), and airway obstruction scale (AOS).
In a prospective, randomized crossover study, children were randomly divided in three groups of 20 each, based on the induction technique used. After placement of the bands, anesthetic induction was started and while children were breathing spontaneously the different mask techniques were used according to the predetermined randomization: Group 1 subjects had: OHA for 30 seconds and then switch to THA for 30 seconds. Group 2 subjects had: THA for 30 seconds and then switch to OHA for 30 seconds. Group 3 subjects had: THA for full 60 seconds
Nominal variables were analyzed with chi-square, numeric variables using Anova, and ordinal data with the Kruskal-Wallis test. A p-value of <0.05 was considered significant.
Results: The study groups were demographically similar. The THA technique was found to have significantly greater tidal volume and minute ventilation and lower phase angle, LBI and LBI10 that the OHA technique. In addition, the airway obstruction score was also reduced with the THA technique. (see Table)
Conclusion: From this study, we conclude that THA as measured by pneuRIPTM and clinical parameters, provides better airway patency than OHA during inhalational

18
Back to Table of Contents
induction of anesthesia in children with documented obstructive sleep apnea due to enlarged tonsils and adenoids. We also believe that the pneuRIPTM might be used as a mask ventilation training device for practitioners learning how to manage obstructed airways.
References: 1. Joffe AM, Hetzel S, Liew EC. A Two-handed Jaw-thrust Technique is Superior to the One-handed “EC-clamp” Technique for Mask Ventilation in the Apneic Unconscious Person. Anesthesiology 2010; 113: 873-9. 2. Rahman T, Page C, Bonnefoy JR, Shaffer TH. pneuRIPTM: A Novel Respiratory Inductance Plethysmography Monitor. J Med Device. 2017 Mar;11(1):110101-110106
18 19
Back to Table of Contents
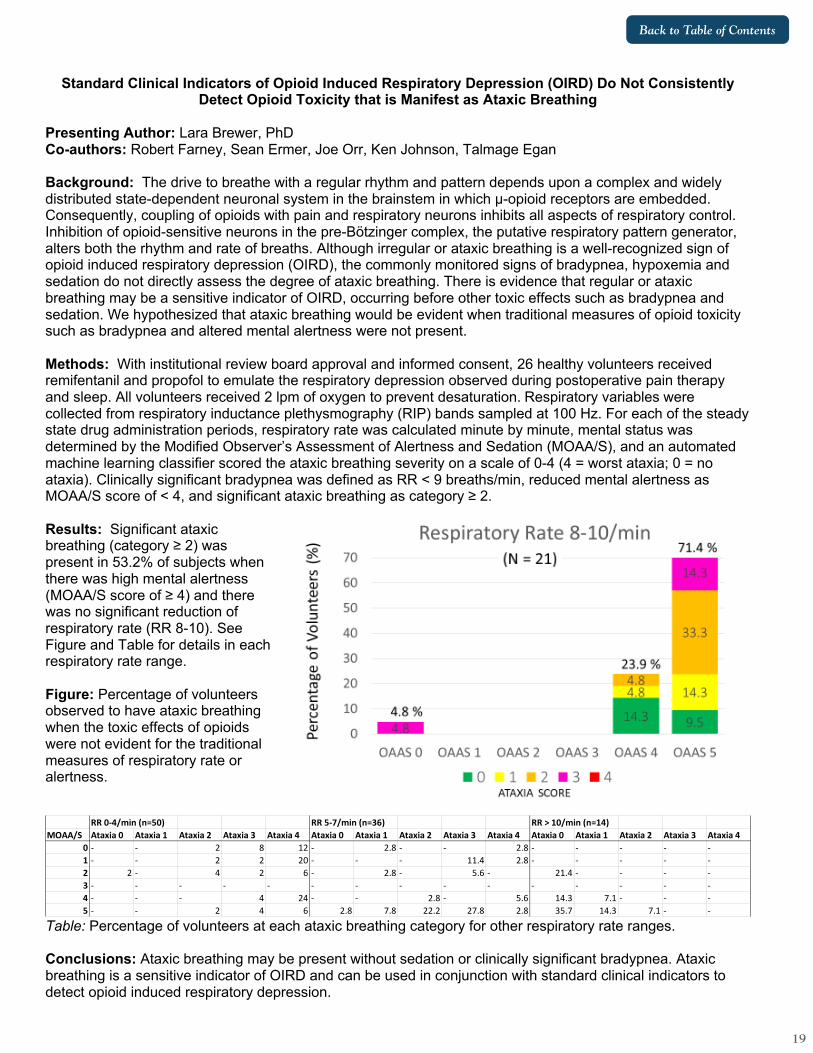
Standard Clinical Indicators of Opioid Induced Respiratory Depression (OIRD) Do Not Consistently Detect Opioid Toxicity that is Manifest as Ataxic Breathing
Presenting Author: Lara Brewer, PhD Co-authors: Robert Farney, Sean Ermer, Joe Orr, Ken Johnson, Talmage Egan Background: The drive to breathe with a regular rhythm and pattern depends upon a complex and widely distributed state-dependent neuronal system in the brainstem in which μ-opioid receptors are embedded. Consequently, coupling of opioids with pain and respiratory neurons inhibits all aspects of respiratory control. Inhibition of opioid-sensitive neurons in the pre-Bötzinger complex, the putative respiratory pattern generator, alters both the rhythm and rate of breaths. Although irregular or ataxic breathing is a well-recognized sign of opioid induced respiratory depression (OIRD), the commonly monitored signs of bradypnea, hypoxemia and sedation do not directly assess the degree of ataxic breathing. There is evidence that regular or ataxic breathing may be a sensitive indicator of OIRD, occurring before other toxic effects such as bradypnea and sedation. We hypothesized that ataxic breathing would be evident when traditional measures of opioid toxicity such as bradypnea and altered mental alertness were not present. Methods: With institutional review board approval and informed consent, 26 healthy volunteers received remifentanil and propofol to emulate the respiratory depression observed during postoperative pain therapy and sleep. All volunteers received 2 lpm of oxygen to prevent desaturation. Respiratory variables were collected from respiratory inductance plethysmography (RIP) bands sampled at 100 Hz. For each of the steady state drug administration periods, respiratory rate was calculated minute by minute, mental status was determined by the Modified Observer’s Assessment of Alertness and Sedation (MOAA/S), and an automated machine learning classifier scored the ataxic breathing severity on a scale of 0-4 (4 = worst ataxia; 0 = no ataxia). Clinically significant bradypnea was defined as RR < 9 breaths/min, reduced mental alertness as MOAA/S score of < 4, and significant ataxic breathing as category ≥ 2. Results: Significant ataxic breathing (category ≥ 2) was present in 53.2% of subjects when there was high mental alertness (MOAA/S score of ≥ 4) and there was no significant reduction of respiratory rate (RR 8-10). See Figure and Table for details in each respiratory rate range. Figure: Percentage of volunteers observed to have ataxic breathing when the toxic effects of opioids were not evident for the traditional measures of respiratory rate or alertness.
Table: Percentage of volunteers at each ataxic breathing category for other respiratory rate ranges. Conclusions: Ataxic breathing may be present without sedation or clinically significant bradypnea. Ataxic breathing is a sensitive indicator of OIRD and can be used in conjunction with standard clinical indicators to detect opioid induced respiratory depression.
RR 0-4/min (n=50) RR 5-7/min (n=36) RR > 10/min (n=14)MOAA/S Ataxia 0 Ataxia 1 Ataxia 2 Ataxia 3 Ataxia 4 Ataxia 0 Ataxia 1 Ataxia 2 Ataxia 3 Ataxia 4 Ataxia 0 Ataxia 1 Ataxia 2 Ataxia 3 Ataxia 4
0 - - 2 8 12 - 2.8 - - 2.8 - - - - -1 - - 2 2 20 - - - 11.4 2.8 - - - - -2 2 - 4 2 6 - 2.8 - 5.6 - 21.4 - - - -3 - - - - - - - - - - - - - - -4 - - - 4 24 - - 2.8 - 5.6 14.3 7.1 - - -5 - - 2 4 6 2.8 7.8 22.2 27.8 2.8 35.7 14.3 7.1 - -

20
Back to Table of Contents
A Computerized System to Prompt Postoperative Patients to Breathe during Drug-Induced Respiratory Depression
Presenting Author: Lara Brewer Co-authors: Dennis Berry-Rieser, Joe Orr, Talmage Egan, Ken Johnson Background: Adverse consequences of opioid therapy to treat postoperative pain include ventilatory depression and possibly airway obstruction if mixed with a sedative. These may cause significant morbidity and mortality during the first 72 hours after surgery.1 In this preliminary analysis of our study data, we explored the effectiveness of a computerized system that prompts postoperative patients to breathe. Our hypothesis was that the device prompting success rate would not be inferior to the nurse prompting success rate. Methods: After institutional approval and written informed consent, 70 postoperative patients were randomized to receive prompts to breathe by either a nurse or a computerized device. Prompts to breathe by the nurse were initiated by clinical standard of care. Prompts to breathe by the device were initiated by either a respiratory rate less than 9 breaths per minute or SpO2 less than 90%. A positive response to prompting was defined as an increase in respiratory rate by at least 50% or a recovery of SpO2 to above 90% within two minutes. We compared the proportions of success in R (R Foundation for Statistical Computing, Vienna, Austria) between the two groups using a 2-sample test for equality of proportions with continuity correction. Results: The computerized system and nurse delivered 82 and 75 prompts, respectively. Of these, the computerized system was successful on 81 prompts (98,7%) and the nurse was successful on 68 prompts (90.7%). The figure presents the difference between proportions of success between the device and the nurse for breath prompting. The p value was 0.051. Conclusions: Our results from this preliminary data analysis confirmed our hypothesis that breath prompting by the device was not inferior to prompting by the nurse. Future work is warranted to explore whether computerized system prompting can diminish episodes of postoperative ventilatory depression in settings where nurse availability may be limited (e.g. the hospital floor). Reference: 1) Lee, Lorri A, et al. “Postoperative Opioid-Induced Respiratory Depression: A Closed Claims Analysis.” Anesthesiology, vol. 122, 3 Aug. 2015, pp. 659–665.

20 21
Back to Table of Contents
The Multisensory Benefit of Informative Sound in Visual Task Performance Presenting Author: Alexandra L Bruder, BS Human and Organizational Development, Vanderbilt University Co-Authors: Joseph J Schlesinger, MD Department of Anesthesiology, Vanderbilt University Medical Center, Clayton D Rothwell, PhD, MS, MA, The Ohio State University, Judy Edworthy, PhD, Department of Psychology, University of Plymouth Abstract Content: Auditory alarms are relied upon to provide cues in industries with high-risk, multisensory performance tasks such as those utilized in health care environments. When simultaneous sounds enter the auditory field, this increases the difficulty of differentiating, interpreting, and responding to those sounds in the most effective manner. Without being able to respond to such alarms with precision, professionals can fail to execute their duties. In addition, those patients or individuals who are dependent on the task at hand can reap serious ramifications which include, but are not limited to, injury, distress, or even death. The purpose of this study is to examine the ways in which the performance of multiple activities that require both auditory and visual attention can be maximized in terms of efficiency, accuracy, and timeliness. This study shows how relevant sensory stimuli, containing pertinent information, influences crossmodal task performance. Using an anechoic chamber, anesthesiology residents (N = 25) were tested in a simulated multi-task setting, including a patient monitoring primary task with alarmed events, and a visual vigilance task. Throughout the study, participants were exposed to background noises and sounds relevant to anesthesiology settings, as well as to background music, during the assigned tasks. During visual vigilance tasks, observable LED signals served as distractions during simulated emergency situations that required immediate participant responses. Alarm type was varied between conventional (following the International Electrotechnical Commission Standard 60601-1-8) and novel auditory icon alarms, which provided additional information about the event causing the alarm. This study found that background music was associated with reduced accuracy of responses and increased errors in task performance. Additionally, the type of alarm utilized during medical-related tasks impacted the participants’ ability to complete demanding tasks with precision. Novel alarms demonstrated a 37% increase in vigilance accuracy and 160 ms reduction in response time when compared with traditional alarms. Such findings imply that the use of auditory icon alarms can provide multisensory benefits, enabling clinicians to distinguish between concurrent sounds and noises when under high amounts of pressure with potentially serious ramifications. Because the novel auditory icon provided more information about the type of simulated emergency, the findings suggest attention can safely spared and divided across cognitively demanding tasks. The results of this study recommend that external distractions like background music should not be used during such tasks when alarm recognition is required. These findings call for reconsideration of the conventional alarm and supported the novel auditory icon alarm design, especially in high-stakes environments, in order to improve patient safety and outcomes.

22
Back to Table of Contents
A Novel Device to Monitor Breathing and Deliver Oxygen During Monitored Anesthesia Care (MAC)
Presenting Author: Tariq Chaudhry, MD, Visiting Associate Professor, Department of Anesthesia, Tufts Medical Center, Boston. Background: Nasal Cannulas are typically used during an estimated 50-70 million MAC procedures in the US every year. Dislodgement of nasal prongs, limited oxygen flow, oral-breathing and jaw-clenching in hypoxic patients are some of the limitations seen with the nasal cannulas. Technological advancements in recent years have resulted in tremendous growth of Non-Operating Room Anesthesia (NORA) procedures.1, 2 Aging patient population with increasing comorbidities, novel procedures requiring deeper levels of sedation and anesthesia techniques that ensure same-day discharge are important considerations. NORA procedures, compared to those performed in the OR have a higher frequency of severe injury and death.3,4,5 Per ASA Closed Claims Data, MAC was the most common anesthetic technique in remote location claims (50% of claims) than the 6% OR claims.6 Over-sedation leading to respiratory depression and hypoxemia resulted in a third of all claims.7,8 Materials and Methods: Anesthesia Intra-oral Monitor (AIM) is a novel device, approximately 1x1 inch in size with a high-flow oxygen port for oro-pharyngeal oxygen delivery and a second port for oral-capnography. It can be placed on either side of a patient’s mouth, between the molars leaving the oral cavity partially open. Oro-pharyngeal oxygen delivery increases the size of oxygen reservoir while oxygen source closer to trachea causes less dilution with air resulting in FiO2 as high as 80% compared to the 50% FiO2 with a nasal cannula.9 Sedated patients mostly breathe orally during upper GI endoscopies and oral capnography captured sufficient data in 100% of the patients.10 AIM is compatible with oral breathing and could eliminate the need for bite-blocks, mouth guards, oxygen masks or retro-fitting oxygen and CO2 tubing into the patient’s mouth during upper endoscopies, bronchoscopies or awake fiber-optic intubations. The AIM’s access to a patient’s oral cavity could facilitate the placement of airway-resuscitation devices in hypoxic patients. AIM is in the initial development phase with a recently issued patent by the US Patent Office. A prototype has been developed and tested on a limited scale. Initial results have been encouraging, oral capnography waveform was successfully captured with oxygen flow as high as 18 lit/min. Conclusion: With the rapid development of novel interventional techniques in cardiology, radiology, G.I and pulmonary medicine, NORA cases are expected to constitute over 50% of the anesthesia cases during the next decade.11 As productivity pressures rise with coverage of multiple locations and some in remote areas of the hospital, general anesthesia is often chosen over MAC citing patient safety. Compared to general anesthesia, sedation is associated with lower mortality, fewer hospital days and a 28% decrease in direct hospital costs during Transcatheter Aortic Valve Replacement (TAVR).12 As the healthcare environment looks to improve value by decreasing costs, an emphasis on quality measurement and metrics reporting, a safer, inexpensive device that minimizes patient injuries during MAC is highly desirable.

22 23
Back to Table of Contents
References 1. Nagrebetsky A, Gabriel RA, Dutton RP, Urman RD. Growth of nonoperating room
anesthesia care in the United States: a contemporary trend analysis. Anesth Analg. 2017; 124:1261–7
2. Chang B, Kaye AD, Diaz JH, et al. Interventional procedures outside of the operating room: Results from the National Anesthesia Clinical Outcomes Registry. Journal of Patient Safety. 2018;14:9–16
3. Melloni C. Anesthesia and sedation outside the operating room: how to prevent risk and maintain good quality. Curr Opin Anaesthesiol. 2007;20:513–519.
4. Metzner J, Domino KB. Risks of anesthesia or sedation outside the operating room: the role of the anesthesia care provider. Curr Opin Anaesthesiol. 2010;23:523–31.
5. Metzner J, Posner KL, Domino KB. The risk and safety of anesthesia at remote locations: the US closed claims analysis. Curr Opin Anaesthesiol. 2009;22:502–508.
6. Metzner J, Domino KB. Risks of anesthesia or sedation outside the operating room: the role of the anesthesia care provider. Curr Opin Anaesthesiol. 2010;23:523–31.
7. Metzner J, Domino KB. Risks of anesthesia or sedation outside the operating room: the role of the anesthesia care provider. Curr Opin Anaesthesiol. 2010;23:523–31.
8. Metzner J, Posner KL, Domino KB. The risk and safety of anesthesia at remote locations: the US closed claims analysis. Curr Opin Anaesthesiol. 2009;22:502–508.
9. Yamamoto MD, Miyashita MD, Effects of Breathing Pattern on Oxygen Delivery Via a Nasal or Pharyngeal Cannula. Respiratory Care, 2015 Vol 60, No 12.
10. Chang, Orr, Oral capnography is more effective than nasal capnography during sedative upper gastrointestinal endoscopy. Journal of Clinical Monitoring and Computing 2015.

24
Back to Table of Contents
11. Boggs, Barnett, Urman The future of non-operating room anesthesia in the 21st century: emphasis on quality and safety. Current opinion in Anesthesiology 2017 Dec;30(6):644-651
12. Toppen, Johansen, Sarah. Improved costs and outcomes with conscious sedation vs general anesthesia in TAVR patients: Time to wake up? doi: 10.1371/journal.pone.0173777. 2017 PMCID: PMC5381861

24 25
Back to Table of Contents
Effectiveness of Immersive Virtual Reality Technology as a Distraction Technique During Awake Pediatric Interventional Radiology Procedures
Presenting Author: Kathleen Chen, MD, MS, Texas Children’s Hospital/Baylor College of Medicine Co-Authors: Katrin A. Campbell, MD, Texas Children’s Hospital/Baylor College of Medicine Clinton L. Fuller, MD, Texas Children’s Hospital/Baylor College of Medicine Background/Introduction: Non-pharmacological distraction techniques have shown to improve patient cooperation during pain and anxiety provoking interventions (1,2). Immersive virtual reality (VR) technology is a novel distraction technique that can be utilized in our pediatric population to facilitate successful invasive procedures with minimal to no pharmacological sedation (3). We aimed to evaluate the effectiveness of using VR technology in lieu of pharmacologic sedation for select interventional radiology procedures. Methods: This investigation was a collaborative effort between anesthesiology and interventional radiology departments at a pediatric tertiary referral center. Patient selection and informed consent for use of VR technology was performed. Prior to the procedure, the patient was oriented to the VR system: a Samsung Gear Virtual Reality Oculus headset, a handheld controller, and a pre-loaded library of age-appropriate games (Samsung Electronics, Suwon, South Korea). The patient was positioned in the appropriate procedural position in accord with effective and comfortable use of the VR system. During the procedure, the anesthesiologist remained at bedside, providing supplementary distraction coaching. A pre- and post-procedure survey examining pain levels and patient satisfaction scores were obtained from both the patient and the consenting legal guardian. Results: An 11-year-old female gymnast with chronic back pain requiring epidural steroid injections was selected as the pilot subject. The patient preferred not to undergo an anesthetic due to a previous adverse reaction and elected to proceed with the procedure awake. She underwent two injections while using VR technology in September 2019 and October 2019. Both procedures were technically successful without procedural complications. After each procedure, the patient expressed a maximal satisfaction score of 10 out of 10 and reported VR as her choice if repeat procedures were necessary. Lower pain scores were also reported with VR immersion intraoperatively. The patient’s mother also reported satisfaction with her daughter’s experience and would request the same method of distraction for future injections. Conclusion: With appropriate patient and procedural selection, immersive virtual reality technology is a safe, effective distraction technique that can be used to decrease pain, anxiety, and improve patient satisfaction during awake invasive interventions. By decreasing or removing the need for pharmacologic sedation for select procedures, unnecessary perioperative anesthetic risk can be reduced in our pediatric patients. References: 1) Mcqueen, Alisa, Cress, Chelsea, and Tothy, Alison. “Using a Tablet Computer During
Pediatric Procedures: A Case Series and Review of the ‘Apps.’” Pediatric Emergency Care 28.7 (2012): 712–714.
2) Petrovic, M., P. et al. “Pain-Related Cerebral Activation Is Altered by a Distracting Cognitive Task.” Pain 85.12 (2000): 19–30.

26
Back to Table of Contents
3) Yuan, Justin et al. “Provider-Controlled Virtual Reality Experience May Adjust for Cognitive Load During Vascular Access in Pediatric Patients.” Canadian Journal of Anesthesia/ 64.12 (2017): 1275–1276.

26 27
Back to Table of Contents
Reducing Medication Error Intraoperatively- Feedback on the Additional Verification of Intravenous Drug (AVOID) Error System
Presenting Author: Pamela Chia1, Co-Author: Shariq Ali Khan2
Figure 1: Hardware components of the AVOID-error system. (1a): The AVOID-error system touch screen Graphic user interface with a barcode scanner. (1b) The AVOID-error patient intravenous port and emergency drug administration (EDA) port Introduction: Medication error (ME) is defined as failure to complete a required action in the medication administration process, or the use of an incorrect plan or action to achieve a patient care aim.1 Incorrect dosing and substitution errors, defined as, drawing a drug from the wrong ampoule (ampoule swap) and/or administration of wrong drug-filled syringe (syringe swap), are responsible for up to 60% of medication errors in anaesthesia.2 Perioperative medication administration often bypasses standard safety checks. Furthermore, high-stress and time-sensitive nature of operating room care may lead to both higher rates of MEs.1 Merry et al. have shown that a system allowing syringe labels to be scanned immediately before administration with visual and auditory medication verification reduced perioperative MEs by 21%.3 We developed the “Additional verification of intravenous drug (AVOID) -error System” (Fig 1) which includes a “lock-like” device that attaches to the patient’s intravenous (IV) tubing, and allows injection of the drug only after the user performs a confirmatory scan of the barcode on the syringe label. This system was designed to reduce syringe and ampoule swaps, prevent accidental administration of allergic medication, while coming with an emergency drug administration port. Objective: Assess the incidence of medication error amongst the local anaesthetists and gather feedback on the AVOID error system. Materials and methods: 40 anaesthetists from Singapore General Hospital, Sengkang General Hospital, Changi General Hospital and KK Women’s and Children’s hospital were asked to watch a video we produced that introduced the AVOID system, followed by filling a questionnaire that gave feedback on this system. This study was conducted from June 2019 to August 2019. Results: 40 anaesthetists (23 consultants, 17 junior anaesthetists) with a median of 7.5years (IQR 4-20) of experience participated in this study. >98% of participants agree that ampoule swap and syringe swap are potential medication errors. Of the 40 anaesthetists polled, 88% have been distracted before perioperatively with a near miss ampoule or syringe swap. 65% of participants have had a medication error

28
Back to Table of Contents
before, of which 19% experienced it in the last year. The top 3 features of the AVOID system that participants rated most important are prevents injection of allergic drug, emergency injection port in case of device failure, integration with electronic charting system respectively. Overall, participants rated this device in terms of user-friendliness a median score of 6/10(IQR 5-7). Conclusion: ME is common in anaesthesia with 65% of anaesthetists reporting at least 1 ME in their careers. The AVOID error system has several features that reduces MEs as well as easily integrated with current workflows of drug administration. It has high potential for further developments. References:
1. Karen C. Nanji, Amit Patel, Sofia Shaikh, Diane L. Seger, David W. Bates; Evaluation of Perioperative Medication Errors and Adverse Drug Events. Anesthesiology 2016;124(1):25-34
2. Merry AF, Peck DJ. Anaesthetists, errors in drug administration and the law. N Z Med J 1995;108(1000):185–7.
3. Merry AF, Webster CS, Hannam J, Mitchell SJ et al. Multimodal system designed to reduce errors in recording and administration of drugs in anaesthesia: prospective randomised clinical evaluation BMJ 2011; 343

28 29
Back to Table of Contents
Reading Minds with Lasers: Extracting the Neural Activity of C. elegans Presenting Author: Christopher W Connor MD PhD Co-authors: Mehraj Awal, BS; Gregory Wirak, BS; Christopher V Gabel, PhD By using light-sheet microscopy and transgenic expression of fluorescent marker tags such as mCherry (a red fluorescent protein) and GCaMP6s (a calcium-sensitive green fluorophore)1, the position and neuronal activity of a majority of neurons in the head of C. elegans can be simultaneously imaged non-invasively, in parallel, and in vivo. Under these experimental conditions, C. elegans can then be exposed to a range of anesthetics, creating an extraordinarily powerful experimental system for determining the effect of these agents on neuron-to-neuron communication. However, obtaining these 3D volumetric movies of the microscopic activity of the C. elegans nervous system is only the beginning of the process: the imaging data so produced may occupy several hundred gigabytes. The ability to track and to automatically extract neuronal activity from these large datasets and, in effect, to distill the data into a tractable form requires considerable algorithmic sophistication and access to supercomputing resources. This abstract describes how that technical process can be achieved, and consequently how the mind of a worm can be read. Using a Dual Inverted Selective Plane Illumination (diSPIM) microscope (Applied Scientific Instrumentation, Eugene, OR), imaging was performed with a water-immersed 0.8 NA 40x objective (Nikon USA, Melville, NY) with illumination interleaved between a 488 nm laser at 5 mW power to excite GCaMP6s in the green and a 561 nm laser at 5 mW power to excite mCherry in the red (Vortran Laser Technology, Sacramento, CA). C. elegans neurons typically display slow transient changes in activity rather than rapid action potentials2,3 and a volume acquisition rate of 2 volumes/second is sufficient to capture neuron dynamics while limiting photobleaching of the fluorescent markers. The images shown are two-dimensional representations of the underlying volumetric dataset at particular timesteps, with pixel intensities assigned using the Maximum Intensity Projection (MIP) ray-casting algorithm4 as is commonly performed for visualizing PET and SPECT images. The nuclei are first localized in the red channel via the nuclear expression of RFP. A set of implicit axes is created with the origin at the centroid of the data, with orthogonal axes generated using Principal Component Analysis from the second-order moments of the data. These axes will automatically move and turn to compensate for translation or rotation of the head of the worm, which helps to stabilize the tracking. The centerpoints of each nucleus are identified by convolving the red channel data with a Laplacian-of-Gaussian function5 (colloquially known as a Sombrero function, due to its shape), which picks out nuclei by identifying bright spheres of a critical radius6 such that 150 neurons in the head are tracked. The matching of neurons from one timestep to another was performed using the Kuhn-Munkres Assignment algorithm7, always selecting the match that best minimizes the total squared-distance between neuron positions. All possible timestep matches are considered, not just proceeding forwards in temporal order. The identified locations of the nuclei are error-corrected using smoothing and consensus based on the location of the surrounding neurons8. Ultimately, a single complete chain of locations is established from the beginning to the end of the image sequence for each of the initially identified nuclei. The neuron activity is then extracted by averaging the green GCaMP signal in the soma of the neuron in a corona around the chain of 3D locations. This matching was performed in a massively parallel computation (Massachusetts Green High Performance Computing Center, Holyoke, MA). The tracking and extraction algorithms are written in Python, with inner-loop optimization in C. There is obvious organization in the patterns of neural excitation in C. elegans. Our ongoing work is to determine how anesthetic agents disrupt these patterns in inter-neuronal communication.

30
Back to Table of Contents
Image:
References: 1. Chen TW, Wardill TJ, Sun Y, Pulver SR, Renninger SL, Baohan A, Schreiter ER, Kerr RA,
Orger MB, Jayaraman V, Looger LL, Svoboda K, Kim DS: Ultrasensitive fluorescent proteins for imaging neuronal activity. Nature 2013; 499: 295-300
2. Lockery SR, Goodman MB: The quest for action potentials in C. elegans neurons hits a plateau. Nat Neurosci 2009; 12: 377-8
3. Mellem JE, Brockie PJ, Madsen DM, Maricq AV: Action potentials contribute to neuronal signaling in C. elegans. Nat Neurosci 2008; 11: 865-7
4. Wallis JW, Miller TR: Three-dimensional display in nuclear medicine and radiology. J Nucl Med 1991; 32: 534-46
5. Russ JC, Neal FB: Image Enhancement in the Spatial Domain, The Image Processing Handbook, Seventh edition. Boca Raton, CRC Press, Taylor & Francis Group, 2016.

30 31
Back to Table of Contents
6. Huertas A, Medioni G: Detection of Intensity Changes with Subpixel Accuracy Using Laplacian-Gaussian Masks. IEEE Transactions on Pattern Analysis and Machine Intelligence 1986; PAMI-8: 651-664
7. Jonker R, Volgenant A: A shortest augmenting path algorithm for dense and sparse linear assignment problems. Computing 1987; 38: 325-340
8. Nguyen JP, Linder AN, Plummer GS, Shaevitz JW, Leifer AM: Automatically tracking neurons in a moving and deforming brain. PLoS Comput Biol 2017; 13: e1005517

32
Back to Table of Contents
How do you Describe a Ventilation-Mode? Iso 19223 Lung Ventilators and Related Equipment — Vocabulary and Semantics, ieee 11073 part 10101, snomed ct, hl7
Presenting Author: Steven L Dain, MD, FRCPC, Chair ISO TC 121, Member SNOMED Anesthesia CRG, IEEE 11073, Associate Professor, Centre for Bioengineering & Biotechnology, University or Waterloo, Ontario Canada Co-authors: Norman S Jones, PhD, Project Leader, ISO 19223, Member IEEE 11073; Martin Hurrell PhD, member SNOMED Anesthesia CRG, Co-chair HL7 Anesthesia; John Walsh MD, Assistant Professor of Anaesthesia, Massachusetts General Hospital, Boston, MA, Member, ISO 19223, Co-chair HL7 Anesthesia Background/Introduction: Current ventilator terminology is often confusing. Different manufacturers call the same ventilator function by different names. A named ventilation mode on one ventilator interacts differently with the patient than one another ventilator using the same mode. Educators have difficulty teaching and evaluating students because of the wide range of meanings for the same term. How does one consistently specify ventilator settings for clinical orders, and record observations and patient-ventilator interactions in the Electronic Health Record (EHR) and data loggers (black-box)? Results: The recently published ISO 19223 Lung Ventilator Vocabulary and Semantics was developed over a 15-year period to try to solve these difficulties. After much deliberations, it was determined that a fresh approach was needed. Ventilators inflate the lungs with specified inflation-types -Volume Control, Pressure Control, Pressure Support, Volume Targeted Pressure Control, Effort Support, Dual-Control resulting in 'breaths.' These inflations are organized into ventilation patterns-CMV, A/C, IMV, SIMV, S/T, CSV. Ventilation Adjuncts include the ability for patients to breath spontaneously concurrently with and between inflations-assured constant airway pressure or ACAP; endotracheal tube compensation, and sighs. Inflations are initiated as determined by the ventilation-pattern and terminated according to the inflation-type and patient interaction. A ventilation-mode is specified as:
ventilation-mode = ventilation-pattern + inflation-type(s) + what the mode allows the patient to do by themselves + adjuncts.

32 33
Back to Table of Contents
A coding system was devised to facilitate easy clinical order writing, for example SIMV-vtPC\PS (synchronised intermittent mandatory ventilation with volume-targeted pressure-control and pressure-support), S/T-PS/PC(q) (spontaneous/timed ventilation with pressure-support for spontaneous breaths and pressure-control with flow termination for ventilator-initiated breaths) where \=‘and’ and /=‘exclusive or’. A Domain Analysis Model (below) was recently created to facilitate an unambiguous ventilation-mode description including all attributes and for breath by breath annotation for IEEE 11073, SNOMED
CT and HL7. An educational resource, www.ventilatorvocabulary.online has been created to facilitate the understanding and application of ISO 19223 for clinicians, manufacturers and other interested parties. Conclusion: An International standard for Lung Ventilator Terminology and semantics and the unification of International standards for ventilator vocabulary for clinical, EHR, data recorders, health informatics purposes will aid clinical care, research, and education and hopefully will reduce error and improve patient care. References: https://www.iso.org/standard/51164.html https://standards.ieee.org/standard/11073-10101-2019.html
VentilationMode
+ mode: CodeableConcept
A
VentilationPattern
+ ventPatternType: CodeableConcept
VentilationModeAdjunct
+ adjunctDescription: CodeableConcept
VentModeSetting
+ ventModeSettingValue: Quantity
AssuredInflationType
SupportInflationType SupportInflationTypeSetting
+ InflationType: CodeableConcept+ setValue: Quantity
PatientTriggerEvent Trigger
+ triggerType: CodeableConcept+ triggerParameterValue: Quantity
2nd SupportInflationType 2ndSupportInflationTypeSetting
+ InflationType: CodeableConcept+ setValue: Quantity
AssuredInflationTypeSetting
+ InflationType: CodeableConcept+ setValue: Quantity
InflationType
AThe ventilation-pattern instructs the ventilation mode to initiate one of the, up to 3, selected inflation-types on the basis of 1 .. * criteria
Once an inflation-type has been initiated it takes over the role of instructing the ventilation-mode how to control the ventilator’s delivery to the patient’s airway throughout the inflation phase - until it signals that one of its termination criteria has been met
1..*
0..*
1..* 1..*
1..*
1..*
0 .. 3

34
Back to Table of Contents
Using Respiratory Volume Monitoring to Identify Respiratory Compromise in High Risk Obstetric Patients
Presenting Author: Anna-Maria Eid, M.D. Co-author: Mohamed Elgamal, M.D., Antonio Gonzalez, M.D., Kristen Fardelmann, M.D., Man Ching Cheung, M.D., Aymen Alian M.D. Introduction: Current modalities used to identify Respiratory Depression (RD) include Pulse Oximetry (SpO2), Capnography (Capno, comprised of EtCO2 and respiratory rate - RRcap) and clinical assessment. These are all indirect measurements and therefore late indicators of RD. Respiratory Volume Monitoring (RVM) provides a direct quantitative measure of ventilation in non-intubated patients and has demonstrated effectiveness in identifying RD in post-operative patients following general and orthopedic surgery. The current study evaluates the utility of RVM monitoring in post-partum patients while minimizing nuisance alarms when compared to SpO2 and Capno. Methods: In this this IRB approved observational study we enrolled high risk parturients receiving neuraxial opioids during scheduled cesarean delivery with a BMI > 35 kg/m2 and at least one of the following risk factors: pre-eclampsia, gestational hypertension, diabetes, OSA. MV was measured by RVM (ExSpiron1Xi, Respiratory Motion Inc, Watertown, MA) and presented as a % of predicted MV (MVPRED) based on a body surface area formula. RD was defined as MV< 40% MVPRED for ≥ 2min (“LowMV”). Capno and SpO2 were measured by the same monitor (LifeSense, Nonin Medical Inc, Plymouth, MN), with Capno alarms set at EtCO2 < 15 and > 45 mmHg, RRcap < 8 and > 30 and SpO2 alarm set at < 90%, in keeping with standard practice. All technologies delivered an audible alarm as an indication of RD. The protocol encouraged RVM, SpO2 and Capno to all be measured continuously and for nursing staff to respond to alarms. Alarm rates were compared across the three monitoring modalities. Results: 77 patients (age: 31.7 ± 5.6 yrs; range: 20 – 43 yrs; BMI: 45.9 ± 7.5 kg/m2, range: 33.5-69.1 kg/m2) were monitored with RVM for 17.7 ± 4.8 hours (range: 1.7-25.4 hrs), SpO2 12.7±5.1 hours (range: 0.7-21.9 hrs) and Capno 4.6 ± 3.7 hours (range: 0-14.6 hrs). EtCO2 monitoring was often discontinued due to false alarms or patient non-compliance; 33 patients refused capnography monitoring after initial attempts to place nasal cannula. 37.6% of monitored patients (29) had true RVM alarms due to RD which were generally resolved by the monitor alarm noise or the nurse stimulating the patient. 5 patients had episodes with true SpO2 alarms. Only one patient had true high EtCO2 alarms. RVM had 5 false alarms due to padset misplacement across all patients, with a false alarm rate of 0.0037 false alarms/hr, significantly lower than SpO2 4.85 false alarms/hr or Capno 23.48 false alarms/hr (p < 0.001, ANOVA). Conclusions: RVM provided useful respiratory data in post-partum patients and generated actionable alarms. Here we confirmed that monitoring technologies such as pulse oximetry and capnography produce excessive alarms that contribute to alarm fatigue, with 5 and 23 false alarms per hour, respectively. Conversely, a nurse caring for 4 patients monitored by the RVM would experience only 1 false alarm every 2 weeks. High false alarm rates and low sensitivity of other monitoring technologies reduce their utility in the clinical setting to identify important respiratory depression events. Furthermore, alarm fatigue can lead to patient and sometimes staff non-compliance with monitoring technology. Here, we show that the RVM had a greater rate of patient and staff compliance compared to pulse oximetry and capnography, the latter of which was not tolerated by nearly half of the patients.. As such, RVM has the potential to improve patient safety without a negative impact on workflow while decreasing alarm fatigue.

34 35
Back to Table of Contents

36
Back to Table of Contents
Utilization of HRV to Detect Impending Shock Presenting Author: Mohamed Elgamal, Yale Medical School. Co-authors: Anna-Maria Eid, Ahmad Ibrahim, Kim Tran, Aymen Alian, M.D., Kirk Shelley, M.D., Ph.D., Yale Medical school. Background/Introduction: Trauma remains the leading cause of mortality worldwide, with half of the deaths attributed to hemorrhage (1). In trauma patients, heart rate (HR) and blood pressure (BP) are late clinical indicators of hypovolemia that are masked by compensatory changes in vascular tone that is controlled by the autonomic nervous system until the point of cardiovascular collapse. Detection of autonomic nervous system effects on the body during hypovolemia induced lower body negative pressure (LBNP) can be crucial in understanding how the body behaves during blood loss and can be also a tool in early detection of impending shock. The electrocardiogram (EKG), has the potential to be used as a non-invasive clinical tool for analyzing the autonomic nervous system effects on the body during hypovolemia induced LBNP. Using LBNP simulated hypovolemia, we examined the morphological changes in the EKG using Heart Rate Variability (HRV) which is the beat to beat variation in heart rate or the duration of the R-R interval and is believed to be a measure of the cardiac autonomic nervous system (2). The aim of the study is to use HRV in understanding the changes in the autonomic nervous system during progressive hypovolemia and to detect if it can be an effective tool to predict the magnitude of hypovolemia before the onset of hemorrhagic shock. Methods: With IRB approval, 31 healthy subjects ages 18-40 underwent progressive LBNP (baseline, -15, -30, -45, and -60 mmHg or until the subject became symptomatic). Subjects that completed the LBNP protocol without symptoms were designated as high-tolerance (HT) and symptomatic subjects were designated as low-tolerance (LT). EKG waveforms were monitored using Datex Omida. All data was digitized and continuously recorded to a laptop using LabChart (ADInstruments). LabChart Heart rate variability (HRV) was analyzed in the frequency domain wherein we distinguished between high frequency, HRV-HF (0.15–0.4 Hz) and low frequency, HRV-LF, (0.04–0.15 Hz) during each stage of the LBNP protocol. We expanded our analysis of EKG waveforms to the following frequencies; low frequency (0.04–0.15 Hz) (marker of sympathetic modulation), high frequency (0.15–0.4 Hz) (marker of Efferent vagal activity). Friedman ANOVA and Wilcoxon tests were used to identify changes in the EKG variables, p-value <0.017 was considered statistically significant after Bonferroni adjustment. Results: With progressive LBNP, there were significant reduction in HF in the presymptomatic and symptomatic phases in the LT subjects and only during the -60 in the HT subjects. There were no significant changes in the LF in both the HT and LT subjects in any of the phases during progressive LBNP (Table B, Fig 2). In the LT subjects there was a significant fall in the average HF of (87.7%) in the presymptomatic phase compared with a non-significant (0.84%) fall in the -45 mmHg phase in the HT subjects (Table A, Fig 1). In the LT subjects there was a significant fall in the average HF of (85.8%) in the symptomatic phase compared with a significant (79.4%) fall in the -60 mmHg phase in the HT subjects (Table A, Fig 1). Conclusion: During HRV the HF can be considered as a tool to predict impending shock by at least 3 to 5 minutes before the appearance of symptoms.

36 37
Back to Table of Contents
(Table A, B): They show the change in power and % change to baseline from baseline to -60 or symptomatic phase in HT and LT subjects in HF and LF respectively. (Fig 1,2): They track the change in power from baseline to -60 or symptomatic phase in HT and LT subjects in HF and LF respectively. References: 1. Transfusion, 59: 1423-1428. doi:10.1111/trf.15161 2. Frontiers in physiology, 6, 55. doi:10.3389/fphys.2015.00055

38
Back to Table of Contents
A B C
Epidural Ultrasound Catheter Development and Prototype Testing in Swine: A First Look! Presenting Author: Neil G. Feinglass MD, FASE, FCCP Co-Author: Christopher B. Robards, MD Introduction: Spinal Ultrasound and Surface Ultrasound Neuraxial Imaging has been limited by the boney skeleton which is challenging for the sonographer and current technologies1 The miniaturization of ultrasound catheters has now advanced producing images that guide the clinician through difficult invasive procedures2. This study demonstrates the first known successful ultrasound images from within neuraxis in a live swine model using a multi-array engineered ultrasound catheter prototype proof of concept design. Methods: After approval by Mayo IRB and IACUC review (2) 60kg adult pigs were anesthetized and placed in lateral position. Biplane fluoroscopy confirmation with the addition of epidural contrast Iohexol 3 cc (Omnipaque-140 GE Healthcare Marlborough, MA) administration confirmed Epidural placement of the Touhy needle and catheters. The catheters were engineered from intracoronary ICE catheters (Volcano Eagle Eye Platinum Catheter San Diego, Ca.) such that the catheter had a plurality of mechanical transverse arrays (three) able to produce images at multiple spinal levels and display onto the ultrasound console (Volcano Corporation). Each catheter (20MHz, 0.056”, 5F) offers transverse imaging planes at 3 independent levels. Results: Epidural imaging was achieved in the swine model from lumbar region to the thoracic regions without incident. A significant amount of epidural fat was identified in the epidural space and the Intrathecal placement was not achieved. All images obtained are viewed from the epidural space (Fig 1).
Fig.1. Images from the pig experiment
A. 2-dimensional image with spinal cord viewed in short axis. B. Fluoroscopy with catheter inserted with 3 US-arrays visible. C. Epidural space with epidural veins and flow identified (arrow). D. Prototype catheter V1. 3 ultrasound arrays indicated (arrows).
The epidural ultrasound catheter identified the spinal cord and Dura Mater of the pig throughout the neuraxis. 2 out of 3 arrays produced images due to presumed soldering issues. Other anatomic structures including large epidural venous vascular collections were identified. A proprietary doppler color flow mode (Volcano Corp) distinguished the flow pattern of red blood cells to be continuous further confirming the identification of these structures as venous. Pulsatile smaller tortuous structures that moved in and out of the ultrasound plane were viewed in close proximity to the spinal cord. The application of color flow doppler did not enhance our characterization of possible arterial vessels). Fluid and fat containing spaces were seen near the cord with no discernable
D
38 39
Back to Table of Contents
intrathecal space. Further attempt to identify the rudimentary intrathecal space by passing the Touhy needle and catheter through the dura mater was not successful. This finding was consistent with other studies that have reported anatomic differences between man and swine.3
Final examination of the relationship of the ultrasound catheter to the Intraspinal anatomic structures was validated by surgical laminectomy after euthanasia of the animal. The dissection revealed the ultrasound catheter epidural placement adjacent to the spinal cord.No traumatic injury could be recognized to the spinal cord, dura, or vasculature or exiting nerve roots. Discussion/Conclusion:
1. Percutaneous epidural ultrasound is feasible with miniaturization of the ultrasound catheter transducers.
2. Spinal cord, dura mater, epidural veins, epidural fat and arterial vascular structures could be identified.
3. The neuraxis (Lumbar to Thoracic) regions were effectively imaged in continuity. 4. No traumatic injury to the spinal cord post study could be identified. 5. Future refinement could lead to potential low-cost diagnostic devices for assessing spinal cord
therapies and viability which heretofore have been difficult to achieve. References:
1. Anesthesiology 6 2011, Vol.114, 1459-1485. doi:10.1097/ALN.0b013e318210f9f8 2. Seward JB, Packer DL, Chan RC, Curley M, Tajik AJ. Ultrasound Cardioscopy: embarking on a
new journey. Mayo Clin Proc. 1996; 71: 629–635. 3. Eur Spine J (2010) 19:1104–1114

40
Back to Table of Contents
Utilizing Clinical Data Across Multiple Aims Encounters: Finding Meaningful Use Presenting Author: David Feinstein, MD, MS, Beth Israel Deaconess Medical Center, Boston, MA Co-authors: John Pawlowski, MD, PhD, Beth Israel Deaconess Medical Center, Boston, MA; Sarah Nabel, MS, Beth Israel Deaconess Medical Center, Boston, MA Patient data, to have meaningful use, should be available and synthesized for the clinician at the point of care.1 Current electronic documentation systems are designed to retrieve patient data one encounter at a time. Most reports generated by AIMS are for QA, QI, Billing and research; not necessarily clinical information. A clinician must sift through entire reports from multiple encounters to glean historical perspective of clinical data. Needed data is not usually accessible in a condensed and summarized form for clinical decisions. We propose encouraging the use of AIMS data to create focused, relevant and timely reports for clinical decision support. We created a website for access to clinical reports to allow for addressing clinical questions in a timely manner. A website with reports can be linked through AIMS (or accessed outside of AIMS). Data is queried across multiple encounters, then summarized and displayed as a web report. This has been demonstrated to be useful in pediatric radiation treatment.2 Example: ECT Series Clinical Decision Support
Tx Methohexital Sux Sz (secs) ECT Next treatment 1 100 70 32 Bilateral Incr SUX 2 100 80 16 Bilateral Decr Methohexital 3 90 80 18 Bilateral 4 90 80 22 Bilateral
Discussion: In our clinical example we developed a report that looked at the anesthetic drugs given, seizure time and suggestions for next treatments. In its summarizing and tabular form the relevant, and historical, clinical data is provided to the clinician to aid in determining medications for the next/current encounter. The format, data elements and presentation are just a suggestion of how this information can be useful for clinical decisions. Often one must look through multiple anesthesia records to determine previous medications and subsequent effectiveness. By querying, synthesizing and displaying relevant data elements the clinician can appreciate previous treatments for clinical decisions. Similar data have been used to predict ECT effectiveness using ictal outcomes.3 This abstract discusses the meaningful use of ECT clinical data but this same technique can be used gleaning historical perspectives on airway management, allergies, risk stratification and many other important variables. We encourage EHR developers to include similar reporting features in their products. References:

40 41
Back to Table of Contents
1. Gálvez J, Rothman B, Doyle C, Morgan S, Simpao A, Rehman M. A Narrative Review of Meaningful Use and Anesthesia Information Management Systems. Anesthesia & Analgesia. 2015;121(3):693-706. doi:10.1213/ane.0000000000000881
2. Nelson O, Sturgis B, Gilbert K, Henry E, Clegg K, Tan J, Wasey J, Simpao A, Gálvez J.
A Visual Analytics Dashboard to Summarize Serial Anesthesia Records in Pediatric Radiation Treatment. Applied Clinical Informatics 2019; 10(04), pp.563-569. \doi: 10.1055/s-0039-1693712. Epub 2019 Aug 7.
3. Ingram WM, Weston C, Lu WD, Hodge C, Poler SM, Nahi F, Larson S. Factors Affecting Electroconvulsive Therapy Ictal Outcomes: Duration and Postictal Suppression. AMIA Jt Summits Transl Sci Proc. 2019; 2019: 672–679.Published online 2019 May 6. PMCID: PMC6568129.PMID: 31259023.

42
Back to Table of Contents
Transdermal Monitoring of Volatile Anesthetic Concentration During Surgery
Presenting Author: Robert Fiala, MD, Assistant Professor, Department of Anesthesiology, University of Miami, Department of Anesthesiology, Perioperative Medicine and Pain Management, Miller School of Medicine, University of Miami/Jackson Health System Co-Authors: Ahmed Hasnain Jalal, Ph.D., Adjunct Faculty, Department of Electrical and Computer Engineering, Postdoctoral Associate, BioMEMS and Microsystems Research Laboratory, Florida International University; Carla R. Cordova, MD Assistant Professor, Department of Anesthesiology, Perioperative Medicine and Pain Management, Miller School of Medicine, University of Miami/Jackson Health System; Shekhar Bhansali, PhD, FAAAS, FNAI, Alcatel Lucent Professor and Chair, Department of Electrical and Computer Engineering, Florida International University; Ernesto A. Pretto, MD, MPH, Professor, Department of Anesthesiology, Perioperative Medicine and Pain Management, Miller School of Medicine, University of Miami/Jackson Health System Background/Introduction: Monitoring the therapeutic dose of any anesthetic agent is critical for patient safety during surgery. Modern anesthesia machines are equipped with infrared spectroscopy monitors to detect inhaled volatile anesthetic (VA) dose. However, the latter are not readily portable, impractical for use in austere conditions and unaffordable in low resource environments. In this work, a low cost miniaturized, wearable fuel cell sensor was tested in patients undergoing surgery to determine the clinical utility of a totally non-invasive transdermal sensor to reliably monitor Isoflurane dose. Methods: A wearable device integrated with a micro-fuel cell and built-in miniaturized potentiostat was developed as a practical and portable solution for transdermal VA gas detection during surgery. The device can be modified to detect any VA. The method used in this system is amperometric and its functionality described previously (1). A customized printed circuit board (PCB) was designed to accommodate the potentiostat (LMP91000) with a low power data processing microcontroller (nRF51822) with Bluetooth (RN-42). The device begins operation when it detects a voltage less than -0.05 V across the fuel cell electrodes (reference and anode). The current corresponds to the concentration of the VA, which can be determined through calibration. The current from LMP91000 is converted to a potential and fed to the internal analog-to-digital converter (ADC) of the wireless microcontroller. Data is transmitted wirelessly to the end device (e.g. smartphone). After IRB approval we conducted an observational pilot clinical trial of the device on 11 randomly selected patients to validate its ability to sense the start, steady-state and end of Isoflurane administration during elective surgery. The platform was attached to the wrist of patients in the holding area. Baseline readings for calibration of the device were obtained before the start of Isoflurane inhalation in the OR. The reaction mechanism of the fuel cell involves oxidation at the anode and reduction at the cathode. The anodic reaction is expressed in equations (1– 3), where oxidative addition of Isoflurane occurs instead of direct oxidation reaction.
Ni + R − Cl → RNi(II), + Cl, (1) Cl- + H-O → HCl + HClO (2)
4HCl + 2Ni + 12H-O → 2NiCl-. 6H-O + 4H6 + 4e, (3) where, R-Cl is the Isoflurane. As given in equation (2), the byproduct HCl gets oxidized on the anode and the electrons are produced in this process. On the cathode, the oxygen gets reduced as given in equation (4).
O- + 4H6 + 4e, → 2H-O (4)

42 43
Back to Table of Contents
During this reaction, the electrons and H+ ions flow from anode to cathode generating Faradic current proportional to the concentration of Isoflurane. This current is detected amperometrically. The biasing voltage across working and reference electrodes was -0.3V. The platform includes nRF5 series supported BLE for wireless data transmission and smart phone readout. Electro-chemical signals from the sensor were then recorded and later converted to parts per million (ppm) using equation (5): Concentration(ppm) = {BCD.-D,(EFGHF.,EIJKLMNHL)}
P.PQR- (5)
Results: The raw sensor data plots in the Figure show real-time trends in readings for the onset, steady-state, and intraoperative variations of Isoflurane concentration, and discontinuation of Isoflurane inhalation in patients. Although the duration of anesthesia varied in all cases, the signal was sensitive and specific to changes in concentration within a therapeutic range Isoflurane (0-2.5%). Conclusions: We developed a wearable platform to measure VA gas vapors transdermally. The device was tested on 11 patients undergoing general anesthesia with Isoflurane. The resultant current was calibrated to parts per million (ppm). Our preliminary results showed that the sensor tracked anesthesia dose with good reliability within a therapeutic range for general anesthesia with Isoflurane. Further testing will require fine tuning of the signal, optimum anatomic placement, influence of external factors and validation in a larger clinical trial. Reference: Anal. Methods, 2019,11, 2007-2012

44
Back to Table of Contents
The Application of Immersive Technologies as a Distraction Technique to Improve Office Laryngoscopy Exam Success Rates in Pediatric Patients
Presenting Author: Clint Fuller, MD, Texas Children’s Hospital/Baylor College of Medicine Co-Authors: Julina Ongkasuwan, MD, FAAP, FACS, Texas Children’s Hospital/Baylor College of Medicine; Julie Colbert, MS, CCLS, Texas Children’s Hospital; Kim-Phuong T. Nguyen, MD, Texas Children’s Hospital/Baylor College of Medicine; Kathleen Chen, MD, MS, Texas Children’s Hospital/Baylor College of Medicine Background/Introduction: Awake indirect laryngoscopy is an integral part of the assessment of voice and swallowing disorders. Traditional flexible nasolaryngoscopy can be uncomfortable, anxiety provoking, and require physical restraint in children. Transoral 70-degree rigid laryngoscopy is a non-painful, alternate, approach to visualization of the larynx which can be achieved in cooperative children as young as 3 years of age1. Inconclusive in office exam may escalate patients to a perioperative setting involving tremendous financial consequence for the patients and increasing operating room resources. Distraction methods have been shown to decrease patient anxiety and discomfort during invasive procedures2,3,4. Recent technologies have elevated the level of immersion, enhancing distraction intensity with the use of a video projectors and immersive virtual reality (VR) headsets equipped with age-appropriate games and media. We aim to apply these immersive technologies as a novel distraction technique during in-office transoral 70-degree rigid laryngoscopy exams in order to improve success rates in a pediatric voice clinic. Methods: Patients were identified as requiring an awake office laryngoscopy exam. If an exam was indicated, they were approached to use the distraction devices, either video projector or VR headset. If consented, patients were oriented to the games on the device, and then coached with laryngoscopy exam prompts for a “practice session”. The patient continued to receive supplementary distraction coaching during the laryngoscopy exam. Results: Eleven out of fifteen patients (73%) successfully completed transoral rigid laryngoscopy with the aid of distraction using immersive technologies. In particular, of those who were ages 3 to 5 years, 83% of the patients completed the exam successfully with this distraction technique, versus a 65% previously published without its use1. The use of immersive technologies during rigid laryngoscopy exams showed equal efficacy across our patient cohort, with an increased benefit to our 3 to 5 years age group. The application of this distraction technique allowed for more exam attempts, despite some that were diagnostically insufficient. Families who chose to use immersive technologies as a distraction technique during their child’s exam, expressed satisfaction with its application. Conclusions: Using immersive technologies as a distraction technique enhances office laryngoscopy exam success rates in pediatric patients, particularly in those aged 3-5 years. Achieving increased office exam success rates decreases the concern for escalation to a perioperative setting. References: 1. Ongkasuwan et al. “Transoral Rigid 70-Degree Laryngoscopy in a Pediatric Voice Clinic.”
Laryngoscopy. 2019;129:1657-1659. 2. Patel et al. “Distraction with a hand-help video game reduces pediatric preoperative
anxiety.” Paediatr Anaesth. 2006;16(10):1019-1027.

44 45
Back to Table of Contents
3. McQueen et al. “Using a tablet computer during pediatric procedures: a case series and review of the “apps”.” Pediatr Emerg Care. 2012;28(7):712-714.
4. Meriri et al. “The effect of medical clowning on reducing pain, crying, and anxiety in children aged 2–10 years old undergoing venous blood drawing—a randomized controlled study.” Eur J Pediatr. 2016;175(3);373-379.

46
Back to Table of Contents
The Telephone Game: Signal Degradation of Automated Vital Sign Recording in Anesthesia Information Management Systems
Presenting Author: Jorge A. Gálvez, MD, MBI Co-authors: Diane Dao, MD; Olivia Nelson, MD; Allan F. Simpao; Jonathan M. Tan, MD, MBI, MPH; Jack O. Wasey, BMBCH, MA, Msci; Aaron Masino, PhD; Richard Tsui, PhD; James Scott; Mohammed Saeed; Larry Sloberman; Michael Hamid; Mary B. Bartko Background: Anesthesia information management systems (AIMS) enable automated vital sign documentation.(1) Automated recording of vital signs has been shown to be superior to manual recording.(2, 3) However, artifacts can be recorded inadvertently through automated systems.(4-6) AIMS are becoming increasingly complex, and many rely on medical-device interface (MDI) systems to incorporate data streams from physiological monitors to the electronic health record. This experiment was designed to evaluate the fidelity of data transfer from the patient to the electronic health record (EHR). Methods: Experiments were run at CHOP in a biomedical engineering testing environment that included a vital sign simulator (Index 2 SpO2 Simulator, Fluke Biomedical, Solon, OH), Solar B monitor (GE, Chicago, IL), MDI integration system (Capsule Tech, Andover, MA), and EHR (Epic Systems, Verona, WI). The vital sign simulator generated pulse oximetry data that was recorded by the Solar B Monitor. The Solar B monitor data are transferred to the MDI at a rate of one measurement every 6 seconds, which is then recorded by the EHR every 1 minute. We simulated scenarios by alternating the SpO2 simulator between 100% and 40% as follows (Figure 1, top row): Simulation #1: SpO2 100% for 1 minute; SpO2 40% from +01:00 to +01:40; repeated once; Simulation #2: SpO2 100% for 1 minute; SpO2 40% from +01:20 to +02:00; repeated once. Data were exported from MDI server and EHR. The experimental sessions were recorded with a video camera (Go Pro, San Mateo, CA). Results: Figure 1 shows the data measurements from the Pulse Ox Simulator, GE Monitor, MDI, and AIMS (top to bottom) for Simulations #1 and #2. Vital sign variations were seen in the MDI and AIMS records compared to the value displayed on the clinical monitor. In Simulation #1, the SpO2 values recorded in the AIMS record reflected the peaks (100% SpO2) without the troughs (40% SpO2) (Figure 1, left column). Shifting the 40-second long hypoxemia episodes by 20 seconds in Simulation #2 resulted in recording of the trough (40% SpO2) without the peaks (100% SpO2), notably without reflecting the interval improvement between the episodes of hypoxemia (Figure 1, right column). Conclusion: This experimental model demonstrates the impact of data granularity and the MDI and AIMS sampling rates on automated vital sign recording. Clinical events such as laryngospasm with hypoxemia can unfold rapidly in the operating room yet may not be documented accurately by the AIMS or EHR if the measurements are recorded at 60 second intervals.(6) Furthermore, the AIMS and EHR data sampling parameters are often unclear. MDI systems can allow recording of higher frequency vital signs. It is imperative that documentation systems that rely on automated data capture can record high-frequency vital signs to accurately

46 47
Back to Table of Contents
record each patient’s status and any clinical interventions to address transient perturbations in the patient’s state.
Figure 1
Figure 1: Pulse oximetry (SpO2) data generated by simulator (top row) and recorded by GE Solar Monitor (second row), medical-device interface (third row) and anesthesia information management system (AIMS) (fourth row) for simulation #1 and simulation #2. Hypoxemia episodes for simulation #1 and #2 highlighted in red. References 1. Tanoubi I. The electronic medical record in anesthesiology: a standard of quality healthcare and patient safety. Can J Anaesth. 2017. 2. Reich DL, et al. Arterial blood pressure and heart rate discrepancies between handwritten and computerized anesthesia records. Anesthesia & Analgesia. 2000;91:612-6.

48
Back to Table of Contents
3. Simpao AF, et al. The reliability of manual reporting of clinical events in an anesthesia information management system (AIMS). Journal of Clinical Monitoring and Computing. 2012;26:437-9. 4. Kool NP, et al. Artifacts in research data obtained from an anesthesia information and management system. Can J Anaesth. 2012;59(9):833-41. 5. Hoorweg AJ, et al. Incidence of Artifacts and Deviating Values in Research Data Obtained from an Anesthesia Information Management System in Children. Anesthesiology. 2018;128(2):293-304. 6. Simpao AF, et al. One Laryngospasm, 2 Realities: A Case Report Highlighting the Impact of Data Granularity on Post Hoc Analysis of Perioperative Events. A&A Practice. 2018;11(11):315-7.

48 49
Back to Table of Contents
A Sandbox Test Environment for Medical Device System Cybersecurity Presenting Author: Julian M. Goldman, M.D. Co-Author(s): David Guffrey, M.S., M.S.M., Michael B. Jaffe, Ph.D., Yi Zhang, Ph.D., Barbara Dumas, and Dave Arney, Ph.D. Reports of high-impact security vulnerabilities affecting medical devices and hospital IT infrastructures have put the cybersecurity of medical devices in the spotlight [1,2]. As advocated by the US FDA, medical device cybersecurity relies upon collaboration across the healthcare ecosystem [3,4]. A vendor-neutral non-clinical “sandbox” testbed can play a valuable role in enabling and promoting collaboration by providing capabilities to 1) assess medical device security vulnerabilities and their clinical impacts; 2) evaluate mitigation and remediation technologies, including deployment strategies, against security vulnerabilities; and 3) establish trust and share information to support cybersecurity preparedness and response. In collaboration with the US FDA and MITRE, we implemented a medical device cybersecurity sandbox environment for studying the use of these environments for cybersecurity preparedness. The core of the MD PnP Sandbox is a sophisticated network infrastructure with a wide range of networking systems (routers, firewalls, switches, access points, controllers, servers, and network data collection tools), which is capable of emulating hospital environments. Network segmentation and demilitarized zones can be easily configured so that each device assessment can be isolated. Multi-factor VPN enables remote access by collaborators. The sandbox is further distinguished by a wide range of physical and simulated medical devices. These capabilities enable investigators to rapidly implement clinical scenarios for medical devices and IT equipment under test, so that: 1) the discovery, testing, and validation of vulnerabilities in the device are guided by its real-world clinical use; 2) assessing the impact of security vulnerabilities is made more clinically relevant; and 3) mitigation, remediation, and response plans in face of security incidents and cyber-attacks can be designed and evaluated in a more realistic environment. We conducted a collaborative exercise with the FDA and MITRE in 2018 to evaluate and validate the capabilities of sandbox environments and their ability to support third-party device security assessment. A key facet of this project was to identify challenges encountered through the application of sandbox environments for collaborative and multi-disciplinary cybersecurity preparedness and response activities. These included governance, legal considerations, technical challenges, lab capabilities, and team expertise. We engaged two major medical device manufacturers with their widely used medical device systems. A clinical scenario based methodology to comprehensively, yet efficiently, identify and demonstrate attack scenarios utilizing previously disclosed (and corrected) vulnerabilities in the devices and how might could be exploited to impact clinical workflows. Further study allowed us to examine manufacturer recommended mitigation measures for effectively protecting against these vulnerabilities. We believe a sandbox test environment as demonstrated under this contract can bring benefits to the coordinated efforts of the healthcare community in addressing medical device cybersecurity, from supporting third-party medical device security certification, to assisting in coordinated disclosure of device vulnerabilities, and to leveraging the stakeholders’ preparedness for device vulnerabilities and malicious cyber-attacks. We welcome collaborations with stakeholders to leverage our sandbox environment for improving the safety and security of medical device systems.

50
Back to Table of Contents
Supported in part by an FDA CDRH /MITRE CAMH contract. The authors, not FDA or MITRE, bear responsibility for the content of this publication.

50 51
Back to Table of Contents
Hardware-in-the-Loop Testbed and Program to Support Verification of Interoperable Medical Devices for Closed-Loop Control of Anesthesia
Presenting Author: Julian M Goldman, M.D. Co-authors: Yi Zhang, Ph.D., David Arney, Ph.D. Closed-loop control (CLC) of anesthesia [1] has been a long-time goal of the anesthesia research and innovation community. CLC systems have been demonstrated to reduce or eliminate manual drug titration and have the potential to improve the quality, efficiency, and safety of anesthesia and intensive care [2]. We have established a hardware-in-the-loop (HIL) testbed to promote prototyping, simulation, and verification of CLC anesthesia techniques. Based on the OpenICE interoperability platform [3], the testbed follows the FDA-recognized Integrated Clinical Environment (ICE) standards-based reference architecture [4] to coordinate CLC algorithms with devices such as anesthesia machines, ventilators, and infusion pumps. Open-source ICE interfaces have been developed for a range of monitoring, IV infusion, and anesthesia delivery devices, enabling communication with the testbed and control algorithms. Studies demonstrate that our HIL testbed offers flexibility and transparency for design, deployment, and evaluation of real-time clinical decision support and CLC algorithms in a clinical context [5]. The HIL testbed provides a platform for characterizing the technical and interoperability capabilities of interoperable medical devices regarding their suitability for use in different CLC medical systems. We are currently working on extending two FDA-approved standalone infusion pumps through external control capabilities, and using the testbed to assess how quickly they achieve a stable infusion rate upon executing commands from an external CLC algorithm. Preliminary results show that these two pumps demonstrate significantly different responsiveness when the new infusion rate is low, which can affect their suitability for certain clinical applications. A key regulatory consideration for interoperable medical devices to be successfully used as components of interoperable systems, especially CLC systems, is the establishment of suitable safety assurance cases to provide compelling evidence that the CLC application will be safe [6]. This can be challenging since the devices may be used as components of (a new) CLC systems in a manner that may not have been anticipated by the component manufacturers. Characterizing the interoperability capabilities of medical devices, with the support of HIL testbeds like ours, could allow manufacturers to establish safety assurance evidence acceptable to regulators to enable adoption. We believe that realizing this vision requires all stakeholders (including regulators, device manufacturers, clinicians, and standards organizations) to collaborate to establish consensus regulatory requirements that can be used as a baseline to characterize the interoperability capabilities of medical devices. We have been continuously engaging with the US FDA, standards organizations like AAMI and UL, and device manufacturers to establish the consensus technical, interoperability, safety and security requirements for interoperable medical devices. This engagement has produced standards (e.g. AAMI 2700-1 [4] and AAMI/UL 2800-1[7]) and techniques (e.g., Medical Device Interface Data Sheet [8]) as the foundation towards such consensus requirements. We are currently establishing a forum, called Smart & Autonomous Medical Devices (SAMD) program, as a mechanism to further facilitate and improve the communication and engagement among stakeholders. We welcome participation in the SAMD program from all interested parties.

52
Back to Table of Contents
References: [1] Dumont GA and Ansermino JM, Closed-loop control of anesthesia: a primer for anesthesiologists, Anesth. Analg. 2013 Nov; 117(5):1130-8. [2] Biblan S, Dumont GA and Black I, Closed-loop target-controlled infusion systems: stability and performance aspects, Mil. Med., 2015 Mar; 180(3 Suppl): 96-103. [3] OpenICE, http://www.openice.info. [4] ANSI/AAMI 2700-1: 2019 Medical devices and medical systems – Essential safety and performance requirements for equipment comprising the patient-centric integrated clinical environment (ICE) – Part 1: General requirements and conceptual model [5] Arney D, Zhang Y, Goldman JM, and Dumas B, Implementing Real-Time Clinical Decision Support Applications on OpenICE: A Case Study Using the National Early Warning System Algorithm, Medical Cyber Physical Systems Workshop 2019, Washington, DC, Sept 2019. [6] Introduction of Assurance Case Method and its Application in Regulatory Science. https://www.fda.gov/media/125182/download [7] ANSI/AAMI/UL 2800-1: 2019, Standard for safety for medical device interoperability [8] Weininger S, Jaffe MB, Rausch T, and Goldman JM, Capturing essential information to achieve safe interoperability, Anesth Analg, 2017 Jan; 124(1): 83-94.

52 53
Back to Table of Contents
Non-Invasive Arterial Blood Pressure Nomograms for Children Undergoing Total Intravenous Anesthesia – Results from a Large Retrospective Cohort Study
Presenting Author: Matthias Görges Co-authors: Pavel Lutskov, Simon Whyte Background: Vital signs monitoring is an integral aspect of anesthetic care. Reference values for non-invasive blood pressure (NIBP) are available for healthy, non-anesthetized children [1], and for children undergoing inhalational anesthesia (IHA) [2]. However, there are currently no reference values for children undergoing total intravenous anesthesia (TIVA), a technique known to reduce some undesired side effects of general anesthesia [3]. This study aims to create age-specific NIBP reference values for children undergoing general anesthesia, and subsequently stratify NIBP values for three different anesthetic regimes: a) TIVA, b) IHA, and c) mostly intravenous anesthesia (MIVA), consisting of an inhalational induction followed by intravenous maintenance of anesthesia. Methods: With Research Ethics Board approval and waiver of informed consent, NIBP data were extracted from a de-identified vital signs database: we used NIBP measurements from children <19 years undergoing general anesthesia for procedures in the main operating rooms performed between Jan 2013 - Dec 2016, excluding cardiac surgery and cases shorter than 13 minutes in duration. Data cleaning and sampling followed the methods established in our previous work (6-month pilot data) [4]: we randomly sampled 20 NIBP values per case. The phase of the anesthetic (induction or maintenance) was identified using operating room booking times for surgical procedure start. We defined anesthetic types based on these minimum alveolar concentration (MAC) thresholds: a) TIVA, cumulative MAC of 0; b) IHA, MAC ≥0.55 for >70% of case of the maintenance phase; c) MIVA, a maximum of MAC >2 in the induction phase and MAC <0.55 for the first 70% of the maintenance phase. Finally, we performed subgroup analyses based on the phase of the anesthetic and by patient’s sex. Results: Out of a potential 36,347 cases included in the operating room booking system, we were able to match 24,457 cases meeting our inclusion criteria, for which vital signs data were available. Of these, 20,613 (84%) cases had valid NIBP data and could be assigned to one anesthetic type: TIVA 11,819 [57%], IHA 4,752 [23%], and MIVA 4,042 [20%]. We observed that, in younger patients, the mean NIBP values were significantly higher when TIVA was used compared to IHA (p < 0.001); a difference in mean NIBP of 5 mmHg was observed for patients below one year of age (Figure 1). For the NIBP nomogram split by anesthetic phase (Figure 2) and the NIBP nomogram split by sex (Figure 3), the differences were clinically insignificant between groups. Conclusions: The results from the full dataset support the findings of our pilot study [4]. We believe that these data are now sufficiently representative to guide the selection of alarm limits based on age and anesthetic type, and to motivate further prospective studies into the effects of different anesthesia regimes on vital signs, and ultimately outcomes, in children. References: [1] Pediatrics. 2011;127(4):e978-88. [2] Anesthesiology. 2016;125(5):904-913. [3] Paediatr Anaesth. 2009;19(5):521-34. [4] Anesth Analg. 2019;128(4S):63-4

54
Back to Table of Contents
Figure 1: Nomograms for non-invasive mean arterial blood pressure split by anesthetic type: total intravenous anesthesia (TIVA, blue), inhalational anesthesia (IHA, orange), and mostly intravenous anesthesia (MIVA, green). Data shown include the median (solid line) and interquartile range (IQR) as shaded areas.
Figure 2: Nomograms for non-invasive blood pressure (NIBP) split by age and anesthetic phase: induction (blue), and maintenance (red). Data are grouped by anesthetic type: total intravenous anesthesia (TIVA), inhalational anesthesia (IHA), and mostly intravenous anesthesia (MIVA). Boxplot shows median and interquartile range (IQR); whiskers reach to last datum within 1.5 IQR. The number of cases for each box is shown along the X-axis.
Figure 3: Nomograms for NIBP split by age and sex: male (blue) and female (red). Data are grouped by anesthetic type: total intravenous anesthesia (TIVA), inhalational anesthesia (IHA), and mostly intravenous anesthesia (MIVA). Boxplot shows median and interquartile range (IQR); whiskers reach to last datum within 1.5 IQR. The number of cases for each box is shown along the X-axis.

54 55
Back to Table of Contents
Using Decision Trees for Determining Anesthetic Technique Using Only Data from Multiparameter Patient Monitors
Presenting Author: Matthias Görges Co-authors: Pavel Lutskov and Simon Whyte
Background: When leveraging data from large vital signs databanks, such as the Multicenter Perioperative Outcomes Group registry [1], or the BC Children’s Hospital local databank, certain characteristics might not be (immediately) available for case classification. In the absence of an Anesthesia Information Management System (AIMS), we are forced to make decisions based on vital signs only, without being able to mine medication records. One possible problem is determining the type of anesthetic, such as total intravenous anesthesia (TIVA), inhalational anesthesia (IHA), or mostly intravenous anesthesia (MIVA), defined as an inhalational induction followed by intravenous maintenance. In determining the effect of anesthetic technique on blood pressure in children [2], a key challenge was how to distinguish cases by anesthesia regimen (TIVA, IHA, or MIVA). One possible solution is to manually define a set of rules based on minimum alveolar concentration (MAC). The drawback of this approach is that, to avoid misclassification, it discards many potentially useful cases, and also requires manual tuning of identification parameters to achieve a trade-off between cases being discarded and cases being mislabeled. Another approach is to employ human-augmented machine learning. Decision trees are preferred over other machine learning methods, since their decision process can be visualized, which aids validation [3]. Such an approach eliminates the need for manual optimization and enables automated creation of complex rules accounting for variability in the data. The aim of this work is to explore the feasibility of using decision trees to classify anesthetic technique.
Methods: With REB approval, data for 24,457 cases were extracted from a de-identified vital signs database [4]. A decision tree classifier was created to distinguish between IHA, MIVA and non-identifiable cases; classifying TIVA is straightforward (cumulative sum of MAC = 0). An interactive incremental approach was used to train the classifier on a sequence of cases: 1. A case is first classified by a manual set of conservative rules [4]. If TIVA, the case is not
used for classifier training. 2. Next, the case is classified by the decision tree classifier, based on the following features:
mean, variance, and maximum value of MAC, maximum value of MAC in the 2nd half of the case, and time spent with MAC < 0.55.
3. If the labels produced by the rules and the tree differ, the program plots the case and prompts the user to label it.
4. The resulting label and feature vector are added to a training database; the tree is retrained from scratch on the database.
5. The decision rules are visualized, and the training continues iteratively until the user is satisfied with the performance.
Results: A decision tree was trained on 490 cases, which took <5 minutes of user interaction. This tree classifier was subsequently applied to the full cohort. The number of discarded cases was lower compared to the rule-based approach [3,218 vs. 3,775]. The tree produced appropriate labels for most cases identified by the original conservative rules (Table 1).
Conclusions: We tested a machine learning method for inferring anesthetic technique from MAC, which can be generalized to classification of other parameters from vital sign recordings. This method may simplify real-world classification tasks by using a data-driven interactive approach, which iteratively refines a classification model starting from a set of roughly defined rules. Opportunities to improve classification performance include increasing the size of the

56
Back to Table of Contents
manually labeled training dataset, and engineering more features for classification. Further investigation is necessary to determine the method's full potential.
References: [1] https://mpog.org; [2] Anesth Analg. 2019;128(4S):63-4; [3] IEEE Trans Sys Man Cybern. 1991;21(3): 660-674; [4] Abstract submitted to the Proc Soc Tech Anesth. 2020
Table 1: Confusion matrix for the resulting decision tree classifier vs. labels obtained from the conservative rule set
Prediction
Label
TIVA IHA MIVA Non- identified
TIVA 11,862
IHA 4,728 1 41
MIVA 44 3,711 295
Non-identified
506 387 2,882

56 57
Back to Table of Contents
Perceptions of Expert and Lay Users on Trust in the Use of Artificial Intelligence for Medical Decision-Making and Risk Prediction
Presenting Author: Matthias Görges
Co-authors: John Sung, Elodie Portales-Casamar Background: Artificial intelligence (AI) is showing rapid uptake across all sectors, including healthcare. Adoption is enabled by increasing digitalization of medical imaging and health records, and the availability of deep learning software packages and computing power [1]. AI augmentation in clinical decision-making [2] promises reduced errors and improved outcomes. Yet, there is a disconnect between the developing technology and stakeholder expectations [3]. We aimed to assess physicians’ and general public perceptions on the use of AI to assist medical decision making; in particular, the notion of uncertainty in outcome predictions, and how this might influence treatment decisions. Methods: We created surveys based on low- and high-risk medical decision-making scenarios using real-life examples, in which we introduced AI suggestions; the low-risk decision was selecting an antiviral therapy combination; the high-risk decision was mechanical ventilation versus extracorporeal membrane oxygenation. The surveys, created in REDCap [4], were distributed to families and physicians at a tertiary pediatric hospital, recruited via posters in hospital clinics, patient engagement office and departmental mailing lists. Participation was incentivized with coffee card draws. Data were analyzed quantitatively and free text answers were analyzed using thematic analyses [5]. Results: Complete survey data from 26 family members and 21 physicians were available for analysis. Familiarity with AI varied, yet >90% of participants agreed that AI has the potential to improve medical services. Regarding liability for AI-augmented decisions, both families and physicians agreed that the physician was primarily responsible, yet families also assigned responsibility to AI design companies. In low-risk scenarios, both groups trusted the AI’s suggestion and emphasized patient-physician discussions of results: 92% of families and 95% of physicians would follow the AI’s recommendation when positive outcomes [40% vs 20% effectiveness] were predicted; 43% of physicians (vs. 67% of families) reverted to physician judgment when AI risk assessment showed equal effectiveness. High-risk scenarios revealed significant differences between the two groups: only 38% of physicians (vs. 69% of families) would follow an AI’s suggested intervention if it was against common practice and only 38% of physicians were likely to discuss options with patients. Both groups would consider AI risk metrics when making treatment decisions: 62% of physicians and 88% of families for short-term differences in outcome [44% vs. 66% mortality]; 52% of physicians and 81% for long-term differences [worse immediate mortality, but 20% vs. 50% improved 5-year outcome]. Physicians strongly reverted to physician judgment when AI-generated risk assessment showed equal effectiveness: only 5% would follow the AI recommendation, compared with 52% of families. Conclusion: These surveys suggested that families were accepting of AI-assisted medical decision making. Physicians were more hesitant in trusting AI predictions in the high-risk scenario; this may be in part due to assumed liability favoring a more conservative clinical approach. Results of this survey may inform the development of AI and decision support systems to make these technologies more acceptable to expert and lay users.

58
Back to Table of Contents
References: [1] Nat Med. 2019;25(1):44-56; [2] JAMA. 2018;320(21):2199-2200 [3] N Engl J Med. 2017;376(26):2507-2509 [4] J Biomed Inform. 2009;42(2):377–81. [5] Curr Pharm Teach Learn. 2018;10(6):807-815

58 59
Back to Table of Contents
Machine Learning Predicts Intraoperative Hypotension from End-Tidal Carbon Dioxide Measurement
Presenting Author: Nathaniel R. Greenbaum, MD, SUNY Downstate Health Sciences University Co-author: Seth T. White, MB ChB, MSc, SUNY Downstate Health Sciences University Background/Introduction: Intraoperative hypotension has been linked to acute kidney injury, myocardial infarction, and both 30-day and 1-yr mortality1. Non-invasive blood pressure (NIBP) monitoring is a vital tool in detecting hypotension, but only provides periodic snapshots of a patient’s hemodynamic status. Moreover, by the time NIBP monitoring detects hypotension the patient has already been exposed to harm. We leveraged End-Tidal Carbon Dioxide (ETCO2) data from a high resolution dataset of intraoperative biosignals2 and machine learning techniques to create a model capable of predicting new episodes of hypotension five minutes before they were detected by NIBP monitoring. Methods: All open, general surgery cases performed on patients 18 to 65 years of age in the Seoul National University College of Medicine’s VitalDB Data Bank were included (n=2084). Laparoscopic procedures were excluded to eliminate changes in ETCO2 resulting from CO2 insufflation. For each NIBP measurement we collected the mean value of ETCO2 for each minute in the window from 5 to 15 minutes before the current NIBP measurement; we also recorded the NIBP immediately prior to the current measurement. NIBP cuff cycle times were typically two and a half minutes [Median: 2.47 minutes, IQR: 1.97-2.57 minutes]. The first and last 30 minutes of each case were excluded to reduce confounding caused by induction and extubation. In total 38,790 timepoints were identified for further analysis. Timepoints with missing ETCO2 data (0.5%) were excluded. Each timepoint was evaluated independently. The VitalDB Data Bank’s acquisition and release were approved by its creator’s IRB (H-1408-101-605) and is registered at clinicaltrials.gov (NCT02914444). Timepoints with both a decrease in Mean Arterial Pressure (MAP) of more than 15% from the prior MAP and a MAP lower than 65 mmHg were labeled as new hypotension (n=643). A new dataframe, containing only ETCO2 features, was randomly sorted and then split 50%/50% into testing and training sets. Features were expanded by first creating 2 minute bins for all sequential ETCO2 measurements and then combinatorially calculating the absolute change, percent change, and log change between all features. Scikit-learn 0.21.3 was employed for normalization and instantiation of our random forest classifier. Results: Our model is a highly specific (99.99%), precise (97.50%), and accurate (98.53%) predictor of new intraoperative hypotension (Table 1). Table 1: Random Forest Classifier Performance
Sensitivity 0.1223 False Positive Rate 0.0001
Specificity 0.9999 False Negative Rate 0.8777
Precision 0.975 Accuracy 0.9853

60
Back to Table of Contents
Negative Predictive Value 0.9853 F1 Score 0.2173 Conclusion: We created a machine learning algorithm capable of predicting intraoperative hypotension five minutes before it was detected by NIBP. Early detection of hypotension has the potential to curtail both the duration and severity of these episodes — reducing morbidity and mortality. We assess that our predictions can likely be improved by incorporating additional biosignals into our model. References: 1. Brady, K., & Hogue, C. (2013). Intraoperative Hypotension and Patient Outcome. Anesthesiology, 119(3), 495-497. doi: 10.1097/aln.0b013e3182a10cce 2. Lee, H., & Jung, C. (2018). Vital Recorder—a free research tool for automatic recording of high-resolution time-synchronised physiological data from multiple anaesthesia devices. Scientific Reports, 8(1). doi: 10.1038/s41598-018-20062-4

60 61
Back to Table of Contents
Kambin’s Triangle Approach for Percutaneous Transforaminal Epidural Adhesiolysis With Inflatable Balloon Catheter; A Pilot Study
Presenting Author: Woong Ki Han, Department of Anesthesiology and Pain Medicine, Pain Center of Seoul National University Bundang Hospital Background: Spinal stenosis is a common condition for elderly people, but there are so many patients who are not responsive to conventional treatments. Percutaneous epidural adhesiolysis can relieve nerve root compression and deliver drugs effectively. Recently, it is reported that percutaneous transforaminal epidural adhesiolysis using inflatable balloon catheter can reduce patients’ pain and improve functional capacity. We would like to figure out the effectiveness and significance of Kambin’s trianglular approach as well as traditional safety triangular approach in percutaneous transforaminal epidural adhesiolysis using inflatable balloon catheter. Method: 24 patients with chronic L5 unilateral radiculopathy who did not respond to conventional treatment were enrolled. They were divided into two groups; safe triangle approach group and Kambin’s triangle approach group. The success rate of the procedure was assessed by dividing each patient into three categories (B, D, F); category B (Ballooning): the instrument enters the target area and the contrast medium spreads after the balloon is inflated; category D (Dye spread): failed in balloon inflation but success in adhesiolysis and spread of contrast media; category F (Fail): failed in balloon inflation and adhesiolysis. Both NRS and ODI were also recorded at three times; before the procedure, one month and three months after the procedure. Basic patients’ demographic data were recorded. Results: There was no difference in characteristics of patients between the two groups (Table 1). The success rate of the procedure was 80 % in safe triangular approach group, and 90 % in Kambin’s triangle approach group (Table 2). NRS at 3 months after the procedure showed statistically significant decrease and there was no significant difference between two groups (Table 3). ODI at 3 months after the procedure also showed statistically significant decrease and there was no significant difference between two groups either (Table 4). Conclusion: For patients who have difficulty in safe triangle approach when performing percutaneous transforaminal epidural adhesiolysis, Kambin’s triangle approach can be an alternative option. A randomized, controlled, double-blind, multi-center study should be followed.

62
Back to Table of Contents
Jeopardy! Reengineered to Maximize Recall and Participation
Presenting Author: Ali Hassanpour, M.D. Texas Children’s Hospital/Baylor College of Medicine Co-authors: William B. Waldrop, M.D., Olutoyin A. Olutoye, M.D., M.Sc., Lisa Caplan, M.D. Dept. of Pediatric Anesthesiology, Texas Children’s Hospital/Baylor College of Medicine, Houston, TX Background/Introduction: The classic American television game show “Jeopardy!” has long provided a fun and engaging format for quiz competitions. Contestants of this game are given clues in the form of an answer and they must respond with the corresponding question. Anesthesiology conferences and training programs1,2 have also adopted this format to test knowledge in a fun and interactive manner. However, the fundamental design of this game only allows for the participation of three contestants, thereby not allowing audience participation. Our goal was to use technology to modify this game in order to allow all audience members to partake. Additionally, we aimed to overcome the technical challenges of grading short, open-ended responses as opposed to a multiple-choice format, which is simpler to grade. Methods: A set of web applications were developed with PHP as the server-side programming language, and a combination of HTML and JavaScript for the dynamic client-side scripting. The website consisted of two main components: game host and contestant applications. To speed the development process, the host application incorporated an existing open source HTML5 Jeopardy3 with substantial modification. Contestants start gameplay without the need to download any application. By scanning a QR code on their mobile device, the contestant is directed to a website where they enter their name. The contestant’s mobile device now continuously communicates with the web server, allowing them to buzz-in and type in their response for a provided game clue. As contestants type their response, auto-fill suggestions appear based on a medical terms word list library,4 which was expanded upon to include anesthesiology-specific terminology. Scores are tallied and stored on the server’s MySQL database and are available for display by the host. Prototypes of the software were tested in department meetings and a regional conference to identify problem areas with the game’s design changes and optimize the gameplay experience. Results: We reimagined and developed an interactive Academic Jeopardy2 software for use by anesthesia staff and trainees. Contestants reported that the application is easy to use, and the auto-fill feature makes the game more efficient. Additionally, they reported increased engagement with heightened sense of competition. Conclusion: Our application encourages audience participation wherein all audience members may participate rather than spectate. By requiring short, open-ended responses, we make the game more challenging and engaging. These responses also generate data which is analyzed to optimize game clues for future games. We limit inadvertent wrong spelling by offering suggestions from a medical terms library. The software will accept inexact responses by utilizing pattern recognition. Future enhancements will aim to add host and contestant functionalities to make gameplay even more engaging. Figure 1. Game host web application projected onto the big screen. Contestant with the fastest correct response will be granted the opportunity to select the subsequent game clue. Functionality not shown inclues countdown timer, correct response, winner of current round and score board. Figure 2. Contestant response entry with phrase auto-fill feature. Functionality not shown includes the buzz-in button.

62 63
Back to Table of Contents
Figure 1. Game host web application Figure 2. Contestant web application
References:
1. Ambardekar, Aditee P., et al. "Pediatric anesthesiology fellow education: is a simulation-based boot camp feasible and valuable?" Pediatric Anesthesia 26.5 (2016): 481-487.
2. Schild, Christopher, et al. "Jeopardy! An Engaging and Efficient Strategy for Learning and Test Prep." 2019 ASA conference abstract.
3. LegacyBass. Jeopardy [Internet]. GitHub repository; 2012. Available from: https://github.com/legacybass/Jeopardy
4. Aristotelis. wordlist-medicalterms-en [Internet]. GitHub repository; 2014. Available from: https://github.com/glutanimate/wordlist-medicalterms-en

64
Back to Table of Contents
Non-Invasive and Continuous Blood Pressure Monitoring Using Deep Convolutional Neural Networks
Presenting Author: Brian L. Hill, UCLA Co-Authors: Nadav Rakocz, UCLA; Jeffrey N. Chiang, Ph.D., UCLA; Ira Hofer, M.D., UCLA; Eran Halperin, Ph.D., UCLA; Maxime Cannesson, M.D., Ph.D., UCLA Background: In 90% of surgeries and 66% of ICU patients, arterial blood pressure (ABP) is monitored non-invasively but intermittently using a blood pressure cuff. In the remaining 10% of surgeries and 33% of ICU patients, ABP is measured continuously but invasively. Since even a few minutes of hypotension increase the risk of postoperative mortality, and because invasive monitoring is associated with major complications (infection, bleeding, thrombosis, pain), the ideal ABP monitor should be non-invasive and continuous. We report the development, training, and validation of a novel, non-invasive method for imputing the arterial blood pressure waveform and its derived systolic, diastolic and mean values using the ECG waveform, the PPG waveform, and non-invasive blood pressure measurements. These measurements are collected as part of the current standard of care, and therefore no additional patient monitoring devices are needed. We demonstrate the accuracy of the method in intensive care unit (ICU) patients, and show that it successfully generalizes to new unseen patients. Methods: A deep convolutional neural network (CNN) was developed to predict the continuous arterial blood pressure waveform in a sliding window using a fixed number of seconds of electrocardiogram (ECG) and photo-plethysmographic (PPG) measurements per window, as well as other non-invasive blood pressure measurements as input. The Bland and Altman2 method was used to evaluate the agreement between the gold standard invasive blood pressure measurements (the arterial catheter) and the predictions. Results: Over 495,000 minutes of measurements from 568 ICU patients from the MIMIC Critical Care Database1 were used to train the deep learning model to accurately predict the ABP waveform using signals recorded non-invasively in the ICU patients. In a set of 137 held-out patients used for validation, the deep neural network successfully predicts the continuous blood pressure waveform, with an accuracy and precision of 2.9 ± 10.5 mmHg for systolic blood pressure and -0.3 ± 6.3 mmHg for diastolic blood pressure. The corresponding Bland-Altman plot is shown below. Conclusions: A deep learning model can accurately predict the continuous arterial blood pressure waveform in ICU patients using data obtained non-invasively in all patients as part of the current standard-of-care. References: 1. Johnson, A. E. W. et al. MIMIC-III, a freely accessible critical care database. Sci. Data 3,
160035 (2016). 2. Martin Bland, J. & Altman, DouglasG. STATISTICAL METHODS FOR ASSESSING
AGREEMENT BETWEEN TWO METHODS OF CLINICAL MEASUREMENT. The Lancet 327, 307–310 (1986).

64 65
Back to Table of Contents

66
Back to Table of Contents
An Automatic Video Laryngoscope Archiving System with a Pilot Study of First Pass Rates for 20 Randomly Selected Archived Intubations
Presenting Author: Gabrielle Hoyer, M.S. Co-authors: Alison Abitz, M.D., Gabrielle Hoyer, M.S., Sean Runnels, M.D. Currently, the record of the intubation is recalled by the operator, translated into a procedure note, and recorded in the medical record. First pass rate is a common benchmark used in intubation quality assurance.1 Self-reporting during airway procedures has been shown to be a low fidelity record of intubation events such as the number of intubation attempts.2 Use of a video laryngoscope (VLS) for intubation always produces a high-fidelity video feed from camera to the screen used by the operator to perform the intubation. Currently, the VLS video feed is not routinely databased for strategic evaluation. We hypothesized that an automatic archiving system is capable of storing VLS intubations for later strategic evaluation, study, and quality assurance. And that first pass rates can be established using that archived high -fidelity data. We used the HDMI port (meant to connect a second display) of a Glideslope VLS to ‘poach’ a digital video stream during intubations. We designed software and hardware that automatically recorded the intubation and transmitted the recording to a video database in our workroom wirelessly when the glideslope was within connecting distance of our wireless router system. Once transferred the Intubations were stored in a database for retrieval at a later date. Once our database reached 200 intubations, 20 were randomly selected for evaluation of first pass intubation rate, the total number of attempts, and the number of individual thrusts at the vocal cords with each attempt, using either an endotracheal tube or a stylet. An intubation attempt was defined as the passing of an endotracheal tube into the trachea in one continuous video laryngoscope viewing. Each viewing was designated as an additional attempt. A thrust was defined as any individual movement of an endotracheal tube toward the vocal cords. An archiving system for VLS intubations can be set up for the storage of high-fidelity recordings of intubations. Once set up, this high-fidelity data can be processed to establish benchmarks for quality assurance as well as other research. In this case, first pass rates for a randomly selected subset of data was shown to be 1.18 attempts per intubation. With an average number of thrusts per intubation to be 2.5.
1. Park L, Zeng I, Brainard A. Systematic review and meta-analysis of first-pass success rates in emergency department intubation: Creating a benchmark for emergency airway care. Emerg Med Australas. 2017; 29(1):40-47. DOI:10.1111/1742-6723.12704
2. Rinderknecht AS, Dyas JR, Kerrey BT, Geis GL, Ho MH, Mittiga MR. Studying the Safety and Performance of Rapid Sequence Intubation: Data Collection Method Matters. Acad Emerg Med. 2017; 24(4):411-421. DOI:10.1111/acem.13145

66 67
Back to Table of Contents
PK/PD-Inspired Dosing Approach for Propofol-Induced Burst Suppression Presenting Author: Jason C Huang BS; University of Utah Co-Authors: Scott Tadler MD, Brian Mickey MD PhD, Keith Garrison BS, Kai Kuck PhD; University of Utah Background: High-dose Propofol can induce similar EEG states as electroconvulsive therapy, and may also achieve similar antidepressant effects.1 We are developing an individualized propofol-dosing approach to achieve specific EEG levels of propofol-induced burst suppression (PIBS). However, dosing propofol to accurately and reliably controlling the burst suppression ratio (BSR) is challenging, because of pharmacokinetic (PK) and pharmacodynamic (PD) uncertainties in each patient. We hypothesize that individualized dosing can be inferred from a subject’s initial BSR response to a standard bolus and infusion rate. In this study, we evaluated the feasibility of adjusting the dosing based on the initial BSR response. Methods: We simulated n = 1000 subjects (1:1 male:female, 150-200 cm, 20-50 years of age, 60-120 kg); published PK coefficients of variations2; and our own unpublished observed estimations of ke0 (mean ± SD of 0.136 ± 0.027 1/min), Hill coefficient (6.57 ± 1.70), and EC50 (7.40 ± 1.61 mcg/mL) which is the effect-site concentration when BSR = 50%. Each subject (the "actual subject") would receive a standard 200 mg bolus and 200 mcg/kg/min infusion of propofol. The initial BSR response during the first 180-seconds of PIBS, or up until reaching 50% BSR, was compared to responses of 1000 additionally simulated "reference subjects" of the same patient demographics, but their PK/PD parameters were further randomized. The median absolute percentage error was used to identify the reference subject, which initial BSR response was most similar. The reference subject's PK/PD parameters were used to determine the optimal adjustment in dosing (additional bolus and changes in infusion rate) to be applied 30-seconds after 50% BSR was achieved, or 210-seconds into treatment, whichever came first. This optimal adjustment was designed to achieve a BSR range of 70%-90% within a 10-minute simulated treatment. We evaluated the BSR response after applying the optimal adjustment to the actual subject. Specifically, we determined the BSR at 6-minutes after the initial bolus (BSR6), the BSR averaged from 6 to 10 minutes (BSR6-10), the time (τ70% BSR) from the initial bolus to when a BSR of 70% was reached, and the duration (Δt0-10) within the initial 10min, for which the BSR was within the target range, i.e. between 70%-90%. Results:
Conclusions: Using only the initial BSR response, our simulation-derived dosing adjustments successfully induced target BSR levels in more than 2/3 of the 1,000 subjects. The dosing adjustments are simple to implement and do not require advanced or TCI pumps: adjustments consist of an additional bolus or infusion pause, and an infusion rate adjustment at a later time. Our dosing approach is imperfect, but is a first step towards individualized PIBS dosing. Additional control strategies must be developed in order to correct inadequate and excess levels of burst suppression, which still persist. References: [1] Mickey BJ, White AT, Arp AM, et al. Propofol for Treatment-Resistant Depression: A Pilot Study. Int J Neuropsychopharmacol. 2018;21(12):1079–1089. [2] Schnider TW, Minto CF, Gambus PL, et al. The Influence of Method of Administration and Covariates on the Pharmacokinetics of Propofol in Adult Volunteers. Anesthesiology 1998;88(5):1170-1182.
Target Mean (SD)Below Target
(%)Within Target
(%)Above Target
(%)BSR6 (%) 70–90% 77.4 (10.3) 19.8 71.3 8.90BSR6-10 (%) 70–90% 75.9 (10.7) 24.9 68.1 7.00τ70% BSR minutes 1.5–6 min N/A 4.40 80.6 15.0*Δt0-10 minutes >4 min 4.37 (2.55) 33.4 66.6 N/A
*14.2% of subjects did not surpass a BSR of 70% within the 10-minutes of treatment.*These subjects' τ70% BSR were not measured, but they were considered "Above Target."
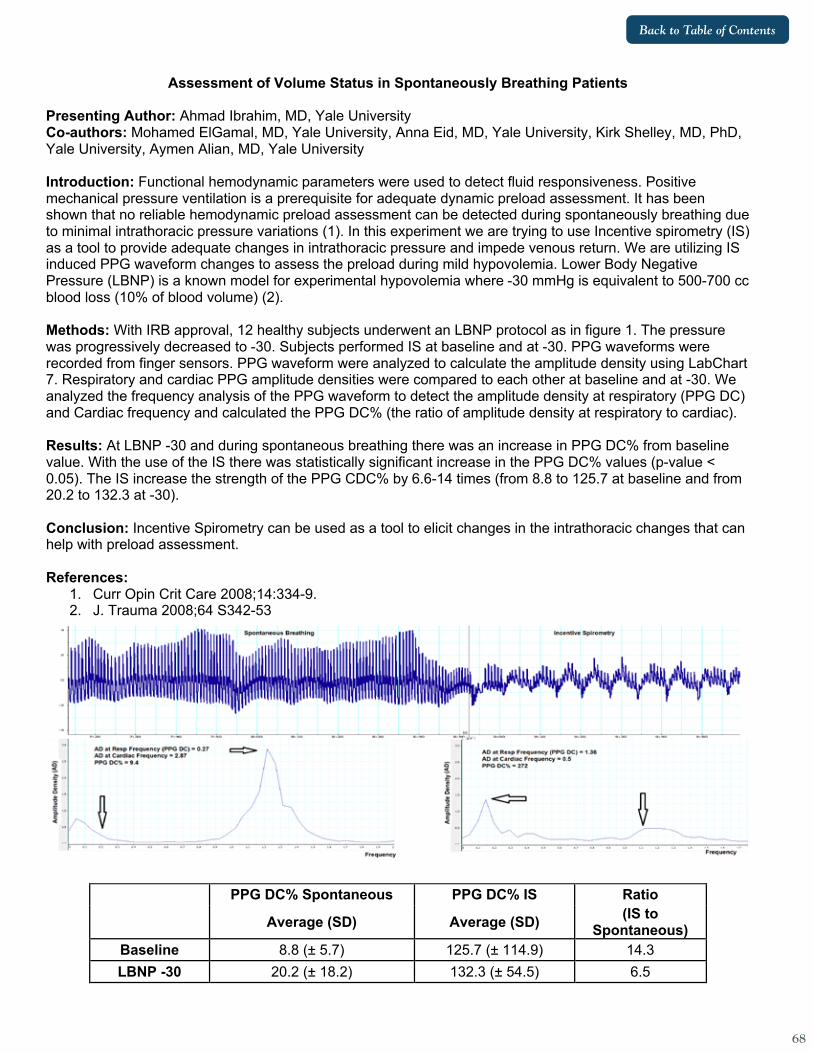
68
Back to Table of Contents
Assessment of Volume Status in Spontaneously Breathing Patients Presenting Author: Ahmad Ibrahim, MD, Yale University Co-authors: Mohamed ElGamal, MD, Yale University, Anna Eid, MD, Yale University, Kirk Shelley, MD, PhD, Yale University, Aymen Alian, MD, Yale University Introduction: Functional hemodynamic parameters were used to detect fluid responsiveness. Positive mechanical pressure ventilation is a prerequisite for adequate dynamic preload assessment. It has been shown that no reliable hemodynamic preload assessment can be detected during spontaneously breathing due to minimal intrathoracic pressure variations (1). In this experiment we are trying to use Incentive spirometry (IS) as a tool to provide adequate changes in intrathoracic pressure and impede venous return. We are utilizing IS induced PPG waveform changes to assess the preload during mild hypovolemia. Lower Body Negative Pressure (LBNP) is a known model for experimental hypovolemia where -30 mmHg is equivalent to 500-700 cc blood loss (10% of blood volume) (2). Methods: With IRB approval, 12 healthy subjects underwent an LBNP protocol as in figure 1. The pressure was progressively decreased to -30. Subjects performed IS at baseline and at -30. PPG waveforms were recorded from finger sensors. PPG waveform were analyzed to calculate the amplitude density using LabChart 7. Respiratory and cardiac PPG amplitude densities were compared to each other at baseline and at -30. We analyzed the frequency analysis of the PPG waveform to detect the amplitude density at respiratory (PPG DC) and Cardiac frequency and calculated the PPG DC% (the ratio of amplitude density at respiratory to cardiac). Results: At LBNP -30 and during spontaneous breathing there was an increase in PPG DC% from baseline value. With the use of the IS there was statistically significant increase in the PPG DC% values (p-value < 0.05). The IS increase the strength of the PPG CDC% by 6.6-14 times (from 8.8 to 125.7 at baseline and from 20.2 to 132.3 at -30). Conclusion: Incentive Spirometry can be used as a tool to elicit changes in the intrathoracic changes that can help with preload assessment. References:
1. Curr Opin Crit Care 2008;14:334-9. 2. J. Trauma 2008;64 S342-53
PPG DC% Spontaneous PPG DC% IS Ratio
Average (SD) Average (SD) (IS to Spontaneous)
Baseline 8.8 (± 5.7) 125.7 (± 114.9) 14.3 LBNP -30 20.2 (± 18.2) 132.3 (± 54.5) 6.5

68 69
Back to Table of Contents
Smart-Phone Based Application for Frailty: Proposal for Rapid and Routine Perioperative Frailty Assessment
Presenting Author: Parth Iyer Co-authors: Akshay Shanker BS, Valluvan Rangasamy MD DESA, Balachundar Subramaniam MD MPH FASA Background: Frailty, a state of decreased physiological reserve, is a distinct concept of biological rather than chronological age and underlying mechanisms are different from aging. Frailty has been associated with adverse surgical outcomes. Nevertheless, frailty is rarely assessed during the perioperative period. Some prominent reasons include complex and time consuming assessments and the lack of an universally accepted tool. We propose a readily usable smartphone-based application based on broadly used frailty models, information from patients, healthcare professionals, and laboratory investigations for perioperative frailty assessment. Methods: We describe a proposal based on a theoretical model combined with technology to develop a smartphone-based application for frailty assessment. It combines variables from frailty models such as 1) 5-meter gait speed 2) chair standing time 3) grip strength, and 4) MoCa scores with information entered by patients and healthcare professionals. Telemetric sensors on smartphones can capture specific datapoints from patients. Gait speed is assessed by Haversine formula (distance between the start and end point divided by duration). The in-built timer function can measure the time duration a patient takes to sit and stand from a chair 10 times. These data combined with medical history, grip strength, and MoCa scores could assess frailty using the validated CGA-FI Index. We designed the user interface to suit mixed age groups with large buttons to help elderly patients. The interface incorporates elements of modern design, and mixes them with intuitive usage. Conclusion: With the ubiquity of smartphones amongst healthcare providers, opportunities exist to leverage these tools for improved patient care. When used routinely, our application could create a standardized and structured summary of frailty resulting in rapid perioperative assessment. Moreover, this tool can easily be updated with validated metrics aiming to tailor specific requirements. Future directions include a series of pilot studies and a small-scale pilot randomized controlled trial to determine if the intervention can demonstrate change.

70
Back to Table of Contents
Using Virtual Reality During Intravenous Line Placement to Improve the Patient Experience
Presenting Author: Souhail Karram, MD, BS, Texas Children’s Hospital/Baylor College of Medicine Co-Authors: Clint L. Fuller, MD, Texas Children’s Hospital/Baylor College of Medicine Julie Colbert, MS, CCLS, Texas Children’s Hospital Stephanie Leung, BS, CCLS, Texas Children’s Hospital Kim-Phuong T. Nguyen, MD, Texas Children’s Hospital/Baylor College of Medicine Rahul G. Baijal, MD, Texas Children’s Hospital/Baylor College of Medicine Scott Henderson, BSN, RN, CORLN, Texas Children’s Hospital Carlos L. Rodriguez, MD, Texas Children’s Hospital/Baylor College of Medicine Shazia Mohammad, MD, Texas Children’s Hospital/Baylor College of Medicine Kathleen Chen, MD, MS, Texas Children’s Hospital/Baylor College of Medicine Background/Introduction: Distraction techniques have been used successfully to alleviate pediatric patient anxiety1. Recent technologies have elevated distraction whereby minor invasive procedures can be implemented with reported decreased pain and anxiety2,3. Virtual reality (VR) technology is a novel distraction technique that can provide full immersion during invasive procedures4. We propose that using immersive VR technology during peripheral intravenous line (PIV) insertions can improve the perioperative experience for our pediatric patients and families. Methods: Patients were evaluated to see if a preoperative PIV placement indicated. If the patient met criteria for both PIV and VR application, the VR system was offered to the patient. If the patient and family consented to using the system, the VR coach oriented the patient to the headset device and its games. For this quality improvement project, a proceduralist and VR coach worked in collaboration. The proceduralist placed the patient’s PIV while the VR Coach provided VR game enhancements and supplementary distraction coaching. Baseline perception question about previous IV pain with and without VR in use was surveyed. We queried families about the VR application’s benefit to their child’s IV placement and the overall perioperative experience. The proceduralist and VR coach were then surveyed to see if VR was useful for the patient. Results: The survey methods used were adopted from VAS, Amsterdam Preoperative Anxiety and Information Scales (APAIS), and Likert scales. A total of 22 surveys were completed. Ages ranged from 6 to 18 years old, with 59% of patients being either 11 or 12 years old. Anecdotal reported pain scores (4.3/10) of previous IV placements were decreased to (1.9/10) with the assistance of VR technology. Our patients also reported minimal stress levels during placement (2.5/10). The majority (80%) rated their preoperative experience as “8 out of 10” or greater. 95% of our patient’s families were satisfied with the application of VR technology to facilitate PIV placement and would request this process again for their child. 90% of VR coaches and

70 71
Back to Table of Contents
proceduralists surveyed that this immersive distraction technique was beneficial to the patient. Overall, families were “extremely satisfied” with the perioperative experience. Conclusion: VR technology is a valuable immersive distraction technique for awake PIV insertions in the preoperative setting for our pediatric patient population. When applied during invasive procedures, our patients have reported decreased pain and anxiety, with an “extremely satisfied” perioperative experience. References: 1) Patel, Anuradha et al. “Distraction with a Hand-held Video Game Reduces Pediatric
Preoperative Anxiety.” Pediatric Anesthesia 16.10 (2006): 1019–1027. 2) Mcqueen, Alisa, Cress, Chelsea, and Tothy, Alison. “Using a Tablet Computer During
Pediatric Procedures: A Case Series and Review of the ‘Apps.’” Pediatric Emergency Care 28.7 (2012): 712–714.
3) Petrovic, M., P. et al. “Pain-Related Cerebral Activation Is Altered by a Distracting Cognitive Task.” Pain 85.12 (2000): 19–30.
4) Yuan, Justin et al. “Provider-Controlled Virtual Reality Experience May Adjust for Cognitive Load During Vascular Access in Pediatric Patients.” Canadian Journal of Anesthesia/ 64.12 (2017): 1275–1276.

72
Back to Table of Contents
Monitoring Sleep, Activity and Function Using Wearable Devices in Post-Surgical Patients: A Pilot Study
Presenting Author: Stephen Kelleher, MD, Boston Children’s Hospital Co-Authors: Joseph Cravero, MD, Boston Children’s Hospital, Andreas Baumer, B.Sc, University of Basel, Suzanne Michele Bertisch, MD, Brigham and Women's Hospital and Joe Kossowsky, PhD, MMSc, Boston Children’s Hospital Background: The relationship between pain, sleep, activity and functioning are acknowledged as important features of pain treatment1, but their interaction is not fully understood. Emerging evidence shows that sleep disturbances are common in children after surgery and poor postoperative sleep is associated with worse postoperative pain control.2,3 Self-report measures of sleep and activity are frequently used with children and their parents, but are limited by inaccuracies and bias.4 The goal of this study was to demonstrate feasibility and acceptability of using a wearable actigraphy device to collect sleep and activity data in the pediatric perioperative setting and to compare actigraphy data with information collected in a self-reported sleep diary. Methods: We performed a prospective observational study including nine patients, between the ages of 10 and 21, undergoing various surgical procedures. Patients with a diagnosis of severe cognitive impairment or autism spectrum disorder were excluded. After enrollment, patients were provided a Philips Actiwatch Spectrum Plus at their pre-operative visit and asked to wear it continuously in the days leading up to surgery and to fill out a brief daily sleep diary. The device was then removed during the surgical procedure and reattached in the post anesthesia care unit (PACU). The actigraph was worn continuously during the patient’s hospitalization and removed prior to discharge. Data was collected in 30 second epochs. A semi structured interview was completed with the patients and parents at the conclusion of the study to assess acceptability and feasibility of wearing the device. Primary outcomes were collected including total time the wearable was worn, how comfortable the wearable was, how burdensome it was to wear, any adverse reactions to the wearable and the participant’s enjoyment of participating in the study. In addition, actigraphy data, including activity counts and sleep time, were analyzed and compared with the patient’s sleep diary and postoperative pain scores. Results: All nine patients were highly satisfied with their participation in the study (Mean: 9.5 ± 0.76 out of 10), found the wearable comfortable to wear (Mean: 8.87 ± 1.73 out of 10), and did not find it a burden to wear the device (Mean: 0.87 ± 0.83 out of 10). Eight patients wore the actigraphy units continuously throughout the study except for during surgery, while one patient also removed it for their school prom prior to surgery. The objective sleep data was very similar to the pre-surgical sleep diary data with regard to bed time and waking up time. However, most patients and their parents found it very difficult to fill out the sleep diary in the inpatient settings. Subjects slept significantly more during their postoperative stay then during the baseline period (Mean: 544 Min vs 426 Min, p=0.007). The sample was underpowered to assess associations between pain scores and sleep fragmentation. Conclusions: Use of actigraphy is an accepted and feasible method for collecting objective measures of sleep and activity in post-operative settings. Figure 1: Actigraphy data from sample patient. Note decreased activity and increased sleep after surgical procedure on 6/24/19 (first dark blue section).

72 73
Back to Table of Contents
References: 1. Smith MT, Haythornthwaite JA. How do sleep disturbance and chronic pain inter-relate?
Insights from the longitudinal and cognitive-behavioral clinical trials literature. Sleep Med Rev. 2004;8(2):119-132.
2. Kain ZN, Mayes LC, Caldwell-Andrews AA, et al. Sleeping characteristics of children undergoing outpatient elective surgery. The Journal of the American Society of Anesthesiologists. 2002;97(5):1093-1101.
3. MacLaren JE, Kain ZN. Prevalence and predictors of significant sleep disturbances in children undergoing ambulatory tonsillectomy and adenoidectomy. Journal of pediatric psychology. 2007;33(3):248-257.
4. Lauderdale DS, Knutson KL, Yan LL, Liu K, Rathouz PJ. Self-reported and measured sleep duration: how similar are they? Epidemiology (Cambridge, Mass). 2008;19(6):838-84.

74
Back to Table of Contents
Assessing Machine Learning and Deep Learning Models for Suggested Dosing of Anesthetic
Induction Medications Presenting Author: Samir Kendale, MD; NYU Langone Health Department of Anesthesiology, Perioperative Care, and Pain Medicine Introduction: As we continue to learn to apply machine learning techniques to the perioperative space, we can begin to envision automation of more complex aspects of anesthesiology. Prediction of hypotension combined with closed-loop vasopressor administration, and processed EEG-targeted medication infusions are examples of how processing large amounts of well labeled data can potentially be used for intraoperative management. Induction of general anesthesia requires careful and deliberate decision-making regarding medication choice and dosage. The training of the anesthesiologist in the complex interactions between physiology and pharmacology allows for selection of appropriate induction medications. We hypothesized that we would be able to train a suite of machine learning models to predict induction doses of commonly used medications for induction of general anesthesia, in this pilot study focusing only on propofol and fentanyl. Methods: For this pilot study, we used 6 months of data (January to June 2019) extracted from the electronic health record (Epic Systems, Veronia, WI) and initially investigated two drugs commonly used during induction of general anesthesia: propofol and fentanyl. Split-set validation was used in which 70% of data were used for training and 30% for testing. Models included age, sex, weight, body mass index, preoperative comorbidities, preoperative medications, and natural language processed procedure text as features. Three algorithms were trained on each target, using 5-fold cross validation: extreme gradient boosting model, deep learning, and elastic net, using mean absolute error as the primary performance metric. The best performer was further tuned and applied to the test set for validation. Results: After tuning, the extreme gradient boosting model for prediction of propofol dosing performed best, with a mean absolute error of 37 mg and a root mean squared error of 54 mg on the training set, and a mean absolute error of 37 mg and root mean squared error of 53 mg on the test set. The extreme gradient boosting model for prediction of fentanyl dosing performed best, with a mean absolute error of 44 mcg and a root mean squared error of 63 mcg on the training set, and a mean absolute error of 44 mcg and root mean squared error of 66 mcg on the test set. Plotting of the errors suggested a normal distribution of error for both models. Conclusions: We were able to develop two models for prediction of induction doses of propofol and fentanyl. These models could be deployed preoperatively for aid in tailoring an anesthetic plan by providing suggested induction doses, and may ultimately be daisy-chained to other models that can predict postinduction hypotension, resulting in a feedback loop for more precise induction medication selection. Performance of these models would likely improve with the addition of more data, as well as with the addition of more potentially relevant features, and should then be validated externally. Just as with any machine learning model, accurate representation is highly dependent on trusting of the labeled data. Future development of these models may include training of a multi target regression neural network model to incorporate the interaction between induction medications, though this will require significantly more data than used in this pilot study. Long-term possibilities include automated induction of general anesthesia.

74 75
Back to Table of Contents
A Preliminary Investigation of the Relationship Between EEG Alpha Power During Anesthesia and Frailty
Presenting Author: R Ross Kennedy MB., ChB., PhD Co-authors: Rachel Matthews BA(hons) MSLT; Reza Shoorangiz, PhD; Richard D. Jones, PhD Background: Monitors of the processed frontal electroencephalogram (pEEG) are being used increasingly during anesthesia both to avoid awareness and for drug titration. Devices incorporating spectrograms allow observation of characteristics of the underlying EEG including the power in various frequency bands such as the alpha band (8–13 Hz). With increasing age, EEG power (and anesthetic requirement) decreases. Empirical observation suggested that alpha power on the pEEG spectrogram maybe more related to physiological resilience than chronological age. The aim of this study was to explore the relationship between measures of general level of health and EEG characteristics, in particular power in the alpha band, during routine anesthesia. Methods: Our observational study was approved by the Northern A Health and Disability Ethics Committee. Participants were recruited between October 2018 and January 2019. Subjects were surgical candidates 65 years or older. Exclusion criteria included cardiac, neurological, or hip procedures, or inability to complete the initial health assessment questionnaires. Consenting participants completed four assessments: The WHO Disability Assessment Schedule (WHODAS), the Edmonton Frail Scale, the Timed Get Up and Go (TUG) and the Montreal Cognitive Assessment (MoCA). During anesthesia a Masimo Sedline pEEG monitor was used. Anesthesia management was not standardized. Raw EEG data from the four frontal channels used by Sedline were downloaded and analyzed offline. The primary outcome measure was mean absolute alpha power over the 20–min period commencing 15min after induction of anesthesia. WHODAS was repeated at one month. Excel, GraphPad Prism and R were used for data analysis. Results: We recruited 48 participants. Six were excluded for data collection issues leaving 42 for the final analysis: 26 female, 16 male; median age 72 years (range 65-88; IQR 68.5-76.5). The primary anesthetic agent was propofol in 21 subjects and sevoflurane in 19. The assessment scores were: MOCA median 26, [IQR 24 to 27.75], Edmonton Frailty Score 4.0 [2 to 6], TUG 10.3 [9.4 to 13.0], Change in WHODAS 0.0 [-3 to 4], absolute alpha power 0.63 [0.43 to 1.22]µV2 There were no significant correlations between absolute alpha power and age (r = 0.16), TUG (r = 0.30) or MoCA (r = 0.17). A general linear model, adjusting for differences in age and anesthetic agent, found a positive association between absolute alpha power and MoCA score (p = 0.034), and a negative association between absolute alpha power and TUG score (p = 0.028). Conclusion: We found no correlation between absolute alpha power and age, which may be due to the relatively narrow age distribution of the study population. Although there was no significant correlation between absolute alpha power and the MoCA or the TUG, once age and anesthetic agent were accounted for, our results suggest that both lower cognitive performance (MoCA) score and decreased physical ability (TUG) were associated with decreased alpha power. Overall, the participants in this study were relatively healthy with few frail subjects as shown by the relatively narrow range of MoCA and TUG results. Despite this limitation, our results suggest that patients who are less healthy are more likely to have lower average absolute alpha power during anesthesia. While there is no clear data on the relationship between EEG markers of “depth” of anesthesia and outcome, more frail patients are at increased risk of post-operative complications including delirium. Prior awareness of poor physical or cognitive health
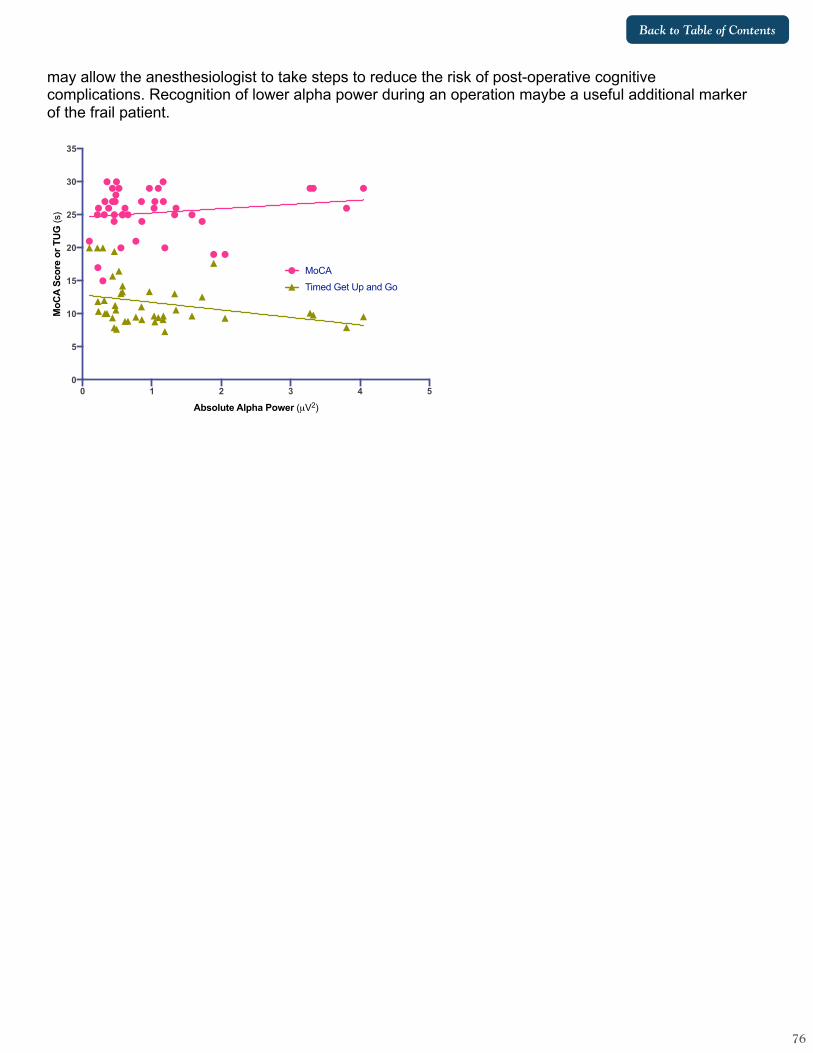
76
Back to Table of Contents
may allow the anesthesiologist to take steps to reduce the risk of post-operative cognitive complications. Recognition of lower alpha power during an operation maybe a useful additional marker of the frail patient.
0 1 2 3 4 5
0
5
10
15
20
25
30
35
Absolute Alpha Power (µV2)
MoC
A S
core
or
TUG
(s)
MoCA
Timed Get Up and Go

76 77
Back to Table of Contents
Eighteen Years of Exploring Patterns of Anaesthetic Gas Flows with More Recent Data on CO2 GWP Footprint
Presenting Author: R Ross Kennedy MB., ChB., PhD Co-author: Paul Currant MB., ChB. Background: Over the past 18 years we have intermittently collected comprehensive data on fresh gas flows (FGF) used during administration of volatile anaesthesia. This work, including the observation of the importance of the early (“induction”) phase of anesthesia has been presented to STA previously. Recently, with increasing interest in the global warming potential (GWP) of choices we make as physicians, we explored the effect of changing patterns of practice on GWP. Recent publications allow benchmarking. Methods: Christchurch Hospital is a 600 bed, 24OR tertiary hospital in the South Island of New Zealand performing 30,000 operations annually. Our FGF data was collected using various techniques and described recently (1) and includes all time points where vapor is being delivered. Choice of primary agent is derived from data logged directly from 10 anaesthetic machines using Insights (GE) which we have found consistent with short term comprehensive audits. Volatile agent consumption is based on deliveries from pharmacy to the OR, based on June years. Calculation of GWP CO2 equivalents was performed using the calculator1 described by Martindale (2). A practice survey by McGain et al (3) allows comparison with a “typical” anesthesiologist in Australia or New Zealand by scaling our agent usage and flow rates, while Zuegge et al (4) give details of the volatile GWP of an equivalent sized hospital in the USA. As use of N2O is minimal in our OR we have ignored it in our calculations and comparisons. Results: Our mean FGF with volatile agents remains around 800ml/min. Desflurane usage has decreased from 22% of cases in 2009 to <0.5% of cases in the first 10 months of 2019. There is a slow but steady increase in use of TIVA, currently 40% of cases. From pharmacy deliveries, the GWP of vapor used has fallen from 373 tonnes of CO2 equiv in 2012/13 to 102 tonnes for 2018/19. Most of this reduction is decreasing use of desflurane. The “typical” practice from McGain’s 2017 survey is: 70% sevo, with FGF 1-2l/min; 15% desflurane, FGF 0.5-1 l/min, and 15% TIVA. Adjusting our case data to these values gives a GWP of 703 tonnes of CO2 equivalent, 7 times our results and increases cost fivefold. These effects are both primarily driven by the changes in desflurane use. Zuegge et al report a 64% reduction in CO2 equivalents over a three year period (2012-15) following various educational initiatives. Their 2015 usage pattern on our case mix gives 1400 tonnes of CO2, mostly due to desflurane. Discussion: We have seen a large decrease in desflurane use over recent years resulting in a dramatic decrease in the GWP of our volatile agent use. This change and the move away from N2O have occurred without specific intervention. When compared to a survey of practice in (predominantly) Australia and New Zealand and data from a single, comparable, US hospital, the GWP impact of our agent use is dramatically less. Although FGF with sevoflurane in the survey and in many US hospitals are much higher than in our data, as McGain et al observe, the predominant driver for changing volatile GWP is desflurane usage, which has almost disappeared from our practice. Zuegge et al reinforce our observation that moving away from desflurane also results in significant cost savings. While our data is current (2019), McGain’s survey was conducted in 2017 and Zuegge’s data is from 2015. Our results suggest that the combination of low FGF and minimal desflurane use can dramatically reduce the GWP footprint of volatile anaesthesia.
1 http://www.sduhealth.org.uk/documents/publications/_carbon_hotspot_anaesthetic_gases_Feb_2014.xlsx

78
Back to Table of Contents
References:
1. Kennedy RR, et al Anaesthesia. 2019;74:875–82. 2. Martindale TG. Br J Aanesth 2016; 117: Supp el_13932 3. McGain F, et al Anaesth Intens Care 2019; 47:235-41 4. Zuegge KL et al Anesth Analg 2019128:e97-9
Figure: CO2 equivalent GWP footprint of volatile anaesthetic agent choices at Christchurch Hospital, New Zealand. Included for comparison are data derived from a 2017 survey of practice in Australia and New Zealand (McGain) and from a single, comparable US hospital in 2015 (Zuegge)
2013
2014
2015
2016
2017
2018
2019
McGain
(A/N
Z)
Zuegge (
USA)0
200
400
600
800
1000
1200
1400
CO
2 G
WP
equi
v (t)
DesIso
Sevo

78 79
Back to Table of Contents
Combined Ultrasonic Sensing for Low-Cost Anesthetic Agent Detection, Concentration Measurement, and Respiratory Monitoring
Presenting Author: Patrick Kolbay, B.S., University of Utah Co-authors: Joseph Orr, Ph.D., University of Utah; Kai Kück, Ph.D. University of Utah
Introduction: Hospitals in austere conditions have been unable to match the reduction in anesthesia-related morbidity and mortality seen in the developed world.1,2 Lack of healthcare resources and infrastructure has led many developing countries to import medical equipment to try and address this discrepancy, despite these devices often being ill-suited for their environment. Much of this healthcare equipment is being funded by both international donors and foreign governments, with donations comprising nearly 80% of the incoming anesthesia equipment for some developing countries.3 Despite these donations, the expertise and parts required to maintain them leads to as little as 10% of the donations ever becoming operational. Ultimately, this resource gap contributes to a scarcity of operating facilities in low resource areas, with the estimated number of operating rooms being more than 25 times less than high-income regions, culminating in a 40-fold increase in anesthesia-related death.1,2 Ultrasonic sensors have long been used in anesthesia care to measure respiratory flow by measuring the time-of-flight differences between ultrasonic pulses sent both upstream and downstream.4 However, the transmission times of these pulses can also change due to differences in the gas composition, largely due to changes in density and fluid elasticity.5 This presents an opportunity to determine anesthetic gas concentration simultaneously to gas flow rate. As a result, we sought to develop an ultrasonic mainstream monitor capable of combined volatile agent detection, anesthetic concentration monitoring, and respiratory flow monitoring at significantly reduced cost and simplicity compared to traditional infrared spectroscopy units in an effort to provide affordable and robust anesthesia monitoring in low-resource areas. Methods: Our initial prototype consisted of two 200 kHz transducers (Air Transducer 200 KHz, Steminc Inc., Doral, FL) driven and recorded using a development microcontroller (MSP430 Ultrasonic Gas Flow Development Board, Texas Instruments, Dallas, TX). The ultrasound transducers were externally housed perpendicular to a stream of flowing oxygen, with reflectors placed inside the housing to deflect the ultrasound pulses, causing them to run parallel to the gas stream. Isoflurane (Piramal Healthcare Limited, Andhra Pradesh, India), sevoflurane (AbbVie Inc, Chicago, IL), and desflurane (Baxter Healthcare Corporation, Deerfield, IL) were then introduced into the gas flow at concentrations of 0-3.5%, 0-4.0%, and 0-18% respectively, verified by an infrared spectroscopy monitor (Datex-Ohmeda, Helsinki, Finland). The rate of the flowing gas was additionally measured with a screened pneumotach (VT-Plus Gas Flow Analyzer, Fluke Corp., Everett, WA) and ranged from 0-55 liters/minute. Time-of-flight measurements of the ultrasound pulses both upstream and downstream were then used to determine anesthetic gas concentration and gas flow rate. The difference in time-of-flight correlated to the gas flow rate and the mean time-of-flight correlated to anesthetic gas concentration. Finally, advanced signal processing tools were used to identify which of the three anesthetic agents was present. Results And Discussion: Flow rate measurements were accurate, with a maximum error of 1.8 liters/minute at the highest flows. Similarly, anesthetic gas concentration measurements for all gases were highly accurate, with 95% of the measurements falling between ±0.17%, ±0.11%, and ±0.20% concentration by volume for isoflurane, sevoflurane, and desflurane respectively (Figure 1). Finally, the system correctly identified which anesthetic agent was present in 96.3% of the over 300,000 samples collected, which was then increased to 98.6% accuracy when the processing was applied as a 10-second filter. Striations seen in the Bland-Altman plots for volatile anesthetic concentration measurement were caused by the changes in flow during testing. Concerning our goal of reducing the cost of anesthetic monitoring, we were able to generate these results utilizing materials that came to a total cost under $80 in single part quantities.

80
Back to Table of Contents
Figure 1 – (Left) Error in flow rate measurement utilizing difference in time-of-flight measurements compared to a screened pneumotach in isoflurane (top), sevoflurane (middle), and desflurane (bottom). (Right) Error in volatile anesthetic gas concentration measurement compared to infrared spectroscopy for isoflurane (top), sevoflurane (middle), and desflurane (bottom). References: [1] Bainbridge et al. Lancet 380, 1075–1081 (2012) [2] Funk et al. Lancet 376, 1055–1061 (2010) [3] Gatrad et al. Anaesthesia 62, 90–95 (2007) [4] Jewitt et al. Anaesthesia and Intensive Care Medicine (2012) [5] Douheret et al. Chemphyschem 2, 148-161 (2001)

80 81
Back to Table of Contents
Adsorption Characteristics of Isoflurane in Porous Materials
Presenting Author: Patrick Kolbay, B.S., University of Utah Co-authors: Joseph Orr, Ph.D., University of Utah; Kai Kück, Ph.D. University of Utah
Introduction: There has been increasing interest in the emissions and associated environmental impact of volatile anesthetic gases.1 Activated charcoal has been the immediate material of choice for many product designs trying to capture these gases,2 however there exists a large variety of other porous materials that may pose superior capacity, adsorption kinetics, or direct material cost savings. Naturally occurring porous frameworks beyond activated charcoal are abundant, notably a wide variety of aluminosilicates, silicates, and alumina-oxides. These materials typically have a narrower range of pore sizes, enabling more selective adsorption uses.3 To explore these materials as an alternative to activated charcoal for adsorbing volatile anesthetic gases, we tested several of these frameworks in the presence of isoflurane and characterized each of these materials on a variety of adsorption properties indicative of the potential as an anesthetic adsorbent. Methods: An adsorption column was developed consisting of a 10 cm long glass bed reactor with internal radius of 1.25 cm. Ports were placed at both the inlet and outlet. Pellets of porous material were then packed into the column, including activated charcoal (Oxpure 1220C-75, Oxbow Activated Carbon, West Palm Beach, FL), a variety of silica gels (Silica gel-214426, technical grade 40 & Silica gel-S7500 Type II, Sigma-Aldrich, St. Louis, MO), zeolites (3Å molecular sieve-208582 & 13X molecular sieve-208639, Sigma-Aldrich, St. Louis, MO), and an aluminum oxide (Aluminum oxide-414069, Sigma-Aldrich, St. Louis, MO). Isoflurane (Piramal Healthcare Limited, Andhra Pradesh, India) was then introduced at 2 MAC in room air at a flow rate of 5 liters/minute, confirmed with a screen pneumotachograph (VT-Plus Gas Flow Analyzer, Fluke Corp., Everett, WA). The sampling ports were used to monitor, via infrared absorption (CapnoMAC Ultima, Datex-Ohmeda, Helsinki, Finland), the rate of isoflurane absorption through the column, also known as a breakthrough curve. To determine the amount of isoflurane absorbed into the particle, the porous materials were weighed before and after exposure to the anesthetic gas. The percent mass adsorbed in comparison to the mass of the material was also calculated. Finally, the time to breakpoint, specifically the time at which 0.05% of the inlet concentration is detected at the outlet, was determined. Results and Discussion: The adsorption capacities and breakpoint times of isoflurane in porous materials are summarized in Table 1. The range of adsorption capacities varied greatly, with 3Å molecular sieves containing a negligible amount of isoflurane, while activated charcoal and the 13x molecular sieve absorbing over a third of their initial mass in isoflurane. As expected, the breakpoint times largely correlated to the adsorption capacities of the materials (Figure 1). Looking more closely at the breakthrough curves, the steep slope of activated charcoal is indicative of favorable rate kinetics for rapid and complete adsorption. While the 13X molecular sieves may have a higher adsorption capacity for a given volume, the slow rate kinetics yields a less-than-ideal material when used in practical applications.
Table 1: Adsorption characteristics of tested porous materials
Material Initial
Material Mass (g)
Isoflurane Adsorbed
(g)
Percent Mass
Absorbed (%)
Time to Breakpoint
(sec) 3Å Molecular
Sieve 39.3 0.4 1.0 5.3

82
Back to Table of Contents
Aluminum Oxide 39.6 4 10.1 92.4 Silica Gel Type II 38.0 9.4 24.7 202.4
13X Molecular Sieve 33 12.1 36.7 226.1
Silica Gel Grade 40 37.0 11.4 30.8 421.2
Activated Charcoal 21.6 9.8 45.4 970.0
Figure 1 – Breakthrough curves of isoflurane at a concentration of 2 MAC at flow rates of 5 liters/minute, in a variety of porous materials in a packed bed at 25°C, with a bed length of 10 cm and radius of 1.25 cm. The time to breakpoint was determined with the outlet concentration reached 0.05% of the inlet concentration.
References: 1. Eckelman, M. J. & Sherman, J. D. Estimated Global Disease Burden From US
Health Care Sector Greenhouse Gas Emissions. Am. J. Public Health e1–e3 (2017). doi:10.2105/AJPH.2017.303846
2. Meiser, A. et al. Technical performance and reflection capacity of the anaesthetic conserving device - A bench study with isoflurane and sevoflurane. J. Clin. Monit. Comput. 23, 11–19 (2009).
3. Logar, N. Z. & Kaučič, V. Nanoporous materials: From catalysis and hydrogen storage to wastewater treatment. Acta Chim. Slov. 53, 117–135 (2006).

82 83
Back to Table of Contents
Real Time Measurement of Surgical Blood Loss in Suction Tubing Using Computer Vision and Machine Learning
Presenting Author: Mayank Kumar, PhD, Gauss Surgical, Inc. Co-authors: Keng-Tsai Lin, BS, Robert L. Thurer, MD, Siddarth Satish, MS, Gauss Surgical, Inc. Introduction: Accurate assessment of blood loss can lead to timely recognition and management of hemorrhage and help guide perioperative blood management. However, visual estimation of blood loss is inaccurate [1] and weighing sponges and volumetrically assessing canisters is labor-intensive and potentially confounded by the presence of non-sanguineous fluids such as irrigation, amniotic fluid, and ascites [2]. Artificial intelligence-based technology has been developed to photometrically monitor blood loss from digital images of suction canisters and sponges [3-5]. The use of the technology improves hemorrhage recognition and has been associated with reduced unnecessary transfusion [6-8]. A limitation of this approach is its incompatibility with closed suction canister systems, where optical resolution of fluids is challenging. To address this problem, we developed a novel device that directly measures hemoglobin (Hb) mass flow (g/min) through suction tubing in real time. Sanguineous fluids evacuated using suction can significantly vary in flow profile based on suction strength and mode of use. Whereas standard flow/volume sensors (e.g., ultrasound) are known to function erroneously when turbulence or air are present, the proposed device overcomes these limitations by also employing a high-speed camera to digitally image the flow path. Computer vision and machine learning algorithms are then used to photometrically assess Hb mass loss in different flow regimes. In this study, we characterize the accuracy of the new device with an in vitro model under laminar and turbulent flow conditions. Methods: Reconstituted expired whole blood was diluted with normal saline to various Hb concentration (0.5 to 12.0 g/dl) and hemolysis levels (0% to 50%). The experimental apparatus consisted of two canisters (source and sink) and a vacuum pump. A suction wand connected at one end of the suction tubing was employed to evacuate blood from the source canister at each concentration/hemolysis level under -67 mm Hg vacuum pressure, while two synchronized Bluetooth weighing scales continuously tracked the weight changes of source and sink canisters. The reference estimate of Hb mass flow was computed by multiplying the measured weight change with the density of blood and the known Hb concentration. The novel measurement device was attached to the suction line and simultaneously used to measure hemoglobin mass flowing through the experimental apparatus. The accuracy of the new device was compared with the reference determination under both continuous/laminar flow turbulent flow conditions. We performed Pearson correlations and Bland-Altman analysis for quantitative comparison of the two measurement methods. Results: Seventy-four minutes of data was recorded across laminar flow (11 experiments) and turbulent flow (8 experiments) conditions. Time-series measurements were divided into 1-minute, non-overlapping segments to obtain 74 independent measurements of Hb mass flow for statistical comparison. The Pearson correlation (r) between the device measures and reference standard was 0.90 (n=74) across all flow regimes; r = 0.89 (n = 34) for turbulent flow, r = 0.93 (n=40) for laminar flow (Fig 1a). The device exhibited a mean percent error of -14.1% across all measures; -6.6% for laminar flow, -20.5% for turbulent flow. Bland-Altman Analysis revealed a bias of -1.32 g/min [95% CI, -1.760 to -0.872 g/min] and narrow limits of agreement: upper LOA = 2.5 g/min [1.7 to 3.3 g/min], lower LOA = -5.1 g/min [-5.9 to -4.4 g/min] (Fig 1b). Conclusions: The novel device for measuring blood loss in suction tubing overcomes the limitations of closed suction systems and standard volumetric sensors and performs

84
Back to Table of Contents
measurements with high accuracy, in the presence of both laminar and turbulent flow. This real time approach may improve recognition of bleeding and enhance perioperative blood management. Figure 1 (a) Association between novel device and reference standard; each data point represents 1-minute, non-overlapping measures. (b) Bland-Altman plot of agreement between device measures and ground truth. (c) Example time-series plot of blood loss measurement in turbulent flow conditions (0% hemolysis, 2 g/dl) using new method, compared to reference standard.
References: 1. Schorn MN. Measurement of blood loss: review of the literature. J Midwifery Womens Health
2010;55:20–27. 2. Doctorvaladan SV, Jelks AT, Hsieh JW et al. Accuracy of Blood Loss Measurement During
Cesarean Section. Am J Perinatol Rep 2017;7(2): e93-e100. 3. Holmes AA, Konig G, Ting V, et al. Clinical evaluation of a novel system for monitoring
surgical hemoglobin loss. Anesth Analg. 2014;119:588–594.
a b
c Reference MethodNovel Method
Volumetric
84 85
Back to Table of Contents
4. Konig G, Holmes AA, Garcia R, et al. In vitro evaluation of a novel system for monitoring surgical hemoglobin loss. Anesth Analg. 2014;119:595–600.
5. Konig G, Waters JH, Hsieh EW, et al. In Vitro Evaluation of a Novel Image Processing Device to Estimate Surgical Blood Loss in Suction Canisters. Anesth Analg. 2018 ; 126:621-628.
6. Rubenstein AF, Zamudio S, Al-Khan A, et al. Clinical experience with the implementation of accurate measurement of blood loss during cesarean delivery: influences on hemorrhage recognition and allogeneic transfusion. Am J Perinatol 2018;35:655–9.
7. Katz D, Wang R, O'Neil L, et al. The association between the introduction of quantitative assessment of postpartum blood loss and institutional changes in clinical practice: an observational study [preprint]. Int J Obstet Anesth 2019; DOI: 10.1016/j.ijoa.2019.05.006 (Epub ahead of print)..
8. Bernal NP, Muniz Castro J, Burton K, Thurer RL. Accurate measurement of intraoperative blood loss leads to more appropriate transfusion andreduced blood utilization. J Anesth Clin Res. 2017, 8:11.

86
Back to Table of Contents
National Trends in the Use of Peripheral Nerve Block in Outpatient Breast Cancer Procedures
Presenting Author: Stephanie Lam, MS Co-authors: Helena Qu, Margaret Hannum, MS, Kay See Tan, PhD, Anoushka Afonso, MD, Hanae K. Tokita, MD, Patrick J. McCormick, MD, Meng
Background: Compared to general anesthesia, regional anesthesia confers several benefits including improved pain control, earlier bowel recovery, decreased postoperative opioid consumption, earlier ambulation, and decreased risk of metastasis. While there is a growing body of knowledge on the benefits of peripheral nerve blocks (PNB), there is little epidemiological data on trends of its usage in oncological surgery. The goal of our study is to assess trends in the annual proportion of PNB use in outpatient breast cancer surgery from 2010 to 2018. We will also identify factors associated with PNB use for outpatient breast cancer surgery. Methods: This study utilizes data from the Anesthesia Quality Institute National Anesthesia Clinical Outcomes Registry (AQI NACOR). Mastectomy and lumpectomy were analyzed separately due to fundamental differences in procedure invasiveness. We performed a Cochran-Armitage trend test to assess trends in the annual proportion of PNB use in outpatient lumpectomy and mastectomy from 2010 to 2018. Using mixed-effect logistic regression, we calculated odds ratio (OR), 95% confidence interval (CI), and P value, with P value threshold for significance set at P ≤ 0.001 due to the large sample size of this study. To identify potential factors associated with PNB utilization in mastectomy, we generated univariable (UVA) models for all variables of interest: age, sex, ASA PS, facility type, facility region, day of procedure on a workday or a weekend/holiday, and tissue expander use. Using the results from the UVA models, we built a multivariable (MVA) model stratified by years 2010 to 2013 and years 2014 to 2018. Results: Of the 336,618 mastectomy and lumpectomy cases from 2010 to 2018, 189,854 cases had complete data for age, sex, ASA PS, facility type, facility region, tissue expander use, year of procedure, and PNB use. For both mastectomy and lumpectomy cohorts, there was a significant increase in PNB proportion over time. Lumpectomy PNB proportion was <0.1% in 2014 and increased in each subsequent year to 1.9% in 2018. The mastectomy cohort showed similar trends, with a PNB proportion of 0.7% in 2014 increasing to 13% in 2018 (Figure 1). Prior to 2014, the OR for PNB use in mastectomy was 0.87 (95% CI 0.71–1.07; P = 0.2), suggesting little change through time in odds of receiving a PNB. After 2014, the odds of receiving PNB for mastectomy was 2.24 for every subsequent year (95% CI 2.00–2.49; P < 0.001). In addition, the following variables (other than year of procedure) were associated with

86 87
Back to Table of Contents
PNB use in the UVA model for the mastectomy cohort: age (OR 0.98; 95% CI 0.97–0.99; P < 0.001), sex (OR 0.31; 95% CI 0.17–0.57; P < 0.001), ASA PS (OR 0.71; 95% CI 0.62–0.83; P < 0.001), facility region (P < 0.001), and tissue expander use (OR 17.5; 95% CI 11.8–25.8; P < 0.001). In the MVA model stratified by years 2010 to 2013 and years 2014 to 2018, there were no factors associated with PNB use from 2010 to 2013. However, sex (OR 0.32; 95% CI 0.16–0.65; P = 0.001), facility region (P < 0.001), and tissue expander use (OR 52.9; 95% CI 29.4–95.2; P < 0.001) were associated with PNB in 2014 to 2018. Conclusion: Our analysis of the NACOR database revealed an increase in annual proportion of PNB utilization in outpatient mastectomy and lumpectomy in the years 2014 to 2018. In addition to year of procedure, sex, facility region, and use of tissue expander were found to be associated with PNB use. Given the many benefits of regional anesthesia, we expect these trends to continue with even more PNB use across oncological surgery. Figure 1: Annual proportion of peripheral nerve block (PNB) use in mastectomy and lumpectomy.

88
Back to Table of Contents
An Interpretable Neural Network for Prediction of Postoperative In-hospital Mortality Presenting Author: Christine Lee, PhD Co-authors: Muntaha Samad, Ira Hofer, Maxime Cannesson, Pierre Baldi Introduction: We recently showed that deep neural networks (DNNs) can successfully predict postoperative in-hospital mortality with an AUC of 0.91.1 While DNNs are great machine learning models and often have higher accuracy than more simple models like logistic regression, they are not intelligible. In healthcare, intelligible models not only help clinicians to understand the problem and create more targeted action plans, they also help to gain the clinicians’ trust. Caruana et al. demonstrated generalized additive models with pairwise interactions can be applied to real healthcare problems such as pneumonia risk with high accuracy.2 Through a graphical representation of each model feature’s learned contribution to the predicted risk, the intelligible model helps us to visualize learned patterns and identify new patterns in the data or confirm what clinicians already know. In this study, we applied the same idea and created a “generalized additive neural network” (GANN) to help visualize feature patterns related to risk of in-hospital mortality. Methods: Data used in these experiments came from UCLA Medical Center with IRB approval. The data consists of 59,985 patients with 46 EMR features extracted at the end of surgery as well as 33 HCUP codes (found in >1% of the data). These EMR features included ASA, intraoperative vital signs, interventions, and anesthesia events. Data included all surgical procedures performed since March 1, 2013. Cases not done with general anesthesia, and patients > 89 or < 18 years of age were excluded. This data was then randomly split into 80% for training (n= 47,988) and 20% for test (n=11,997). Missing values were filled with the means for that feature. Values that were greater than a clinically normal maximum were set to a maximum possible. Finally, all features were rescaled to have mean 0 and standard deviation 1. In the training data, the % occurrence of in-hospital mortality was 0.81% (n=389). All DNNs were trained on 80% of the data with 5-fold cross validation, and were all feedforward networks with sigmoid outputs trained using Adam optimization. L2 regularization and early stopping were used to prevent overfitting. A logistic regression model with the same features was also trained for comparison. Results reported are on the test set with 95% confidence intervals from bootstrapping. Results and Conclusions: The best performing GANN model had an AUC 0.921 (0.895-0.95). The final model hyperparameters were 1 hidden layer and 50 neurons with tanh activations; and trained with a dropout probability of 0.5 and L2 regularization lambda of 0.0001. When we visualize the top 9 features from the GANN, we see that for each feature the GANN learned a different relationship between the feature and mortality risk (Figure 2). In contrast, a logistic regression model only learned a linear relationship. Figure 1. Sample of 3 continuous features for mortality risk GANN contributions across all patients, in order of highest to lowest (left to right, top to bottom). Logistic regression (LR) contributions were also plotted for comparison. The more negative the risk contribution, the less contribution the feature’s value has to the risk of mortality. The features in order are urine output (UOP), average diastolic blood pressure of the last 10 minutes of the case (AVG_DBP_10_min), and average mean blood pressure of the last 10 minutes of the case (AVG_MAP_10_min)

88 89
Back to Table of Contents
References:
1. Lee, C. K., Hofer, I., Gabel, E., Baldi, P., & Cannesson, M. (2018). Development and validation of a deep neural network model for prediction of postoperative in-hospital mortality. Anesthesiology: The Journal of the American Society of Anesthesiologists, 129(4), 649-662.
2. Caruana, R., Lou, Y., Gehrke, J., Koch, P., Sturm, M., & Elhadad, N. (2015, August). Intelligible models for healthcare: Predicting pneumonia risk and hospital 30-day readmission. In Proceedings of the 21th ACM SIGKDD International Conference on Knowledge Discovery and Data Mining (pp. 1721-1730). ACM.

90
Back to Table of Contents
Prediction of Postinduction Hypotension with Deep Learning Presenting Author: Christine Lee, PhD Co-authors: Joe Rinehart, MD, Michael Ma, BS, Pierre Baldi, PhD, Maxime Cannesson, MD PhD
Introduction: Surgical patients with hypotension 0 to 10 minutes postinduction have been shown to have higher prevalence poor outcomes.1 However, there are few tools available to help predict who is at risk for such hypotension. Recently, Kendale et al. compared machine learning methods to predict hypotension utilizing 56 EMR features and demonstrated an AUC of 0.74 for a stochastic gradient boosting machine.2 This model utilized only static EMR features, and so we hypothesized that the use of more dynamic arterial blood pressure (ABP) waveform features and deep neural networks (DNN) could improve prediction. Methods: Data used in these experiments came from UCI Medical Center with IRB approval. The data includes all surgical procedures performed from November 2015 to August 2017 (n=19,545). Patients with no induction time, no MAP 10 minutes after induction, negative time difference between surgical start and induction, < 18 years of age, or no arterial blood pressure (ABP) waveform prior to induction were excluded resulting in 224 patients. Postinduction hypotension was defined as 1) postinduction MAP decrease of > 40% from preinduction and postinduction MAP < 70 mmHg or 2) postinductioin MAP < 60 mmHg. Induction time was defined as first recorded induction event in the EMR, etomidate or propofol administration time. For comparison, we extracted the same EMR features as described in Kendale et al., except for those related to medical comorbidities and preoperative medications due to data availability, to develop a logistic regression and deep neural network model (DNN). This resulted in 15 EMR features. We added an additional 9 EMR features of our own related to HR, MAP, and SpO2 pre-induction. Values for medications greater than a clinically normal maximum (M.C) were assumed as annotation error and set to the maximum. Missing values for other features were filled with the mean, and all features were rescaled to mean 0 and standard deviation 1. For ABP waveform features, we extracted all available ABP waveforms (100 Hz) 5 minutes prior to induction. All waveforms were processed for signal quality and 8 beat-to-beat features such as MAP using the algorithms provided by Physionet4 and the mean of the features were taken as input. These EMR and waveform features were utilized in a logistic regression and deep neural network model (DNN). Models were trained to classify hypotension 0 to 5 minutes and 5 to 10 minutes postinduction. Due to the small size of the data set, we utilized leave-one-out cross validation (LOO). Results and Conclusion: The occurrence of hypotension 0 to 5 minutes postinduction is 8.9% (n=20); for 5 to 10 minutes postinduction occurrence is 9.8% (n=22). The best performing model overall was the waveform only DNN model for the prediction of 0 to 5 minutes postinduction hypotension (AUC 0.88 (0.812-0.934)) (Table 1). This model had 2 hidden layers and 60 neurons, and was trained with dropout probability of 0.25, L2 regularization with a lambda 0.0001, batch size 128, and a learning rate 0.001. Overall, all DNN models had higher AUCs than logistic regression (LR) for each feature set, and waveform only features performed best overall (Table 1). EMR only features performed the worst, except in predicting 5 to 10 minutes postinduction hypotension with LR. Table 1. Leave-one-out validation AUC results

90 91
Back to Table of Contents
References
1. Reich, D. L., Hossain, S., Krol, M., Baez, B., Patel, P., Bernstein, A., & Bodian, C. A. (2005). Predictors of hypotension after induction of general anesthesia. Anesthesia & Analgesia, 101(3), 622-628.
2. Kendale, S., Kulkarni, P., Rosenberg, A. D., & Wang, J. (2018). Supervised machine-learning predictive analytics for prediction of postinduction hypotension. Anesthesiology: The Journal of the American Society of Anesthesiologists, 129(4), 675-688.
3. Vest, A. N., Da Poian, G., Li, Q., Liu, C., Nemati, S., Shah, A. J., & Clifford, G. D. (2018). An open source benchmarked toolbox for cardiovascular waveform and interval analysis. Physiological measurement, 39(10), 105004.

92
Back to Table of Contents
Urinary Oxygen Tension – A New Biomarker for Acute Kidney Injury Risk? Presenting Author: Lars Lofgren, B.S., University of Utah Co-Authors: Kai Kuck, Ph.D., University of Utah; Natalie Silverton, M.D., University of Utah Introduction: Up to 30% of cardiothoracic surgery patients develop acute kidney injury (AKI)1. Kidney hypoxia is recognized as an associated risk factor for AKI during surgery2. Currently, there is no intraoperative monitor or indicator of AKI or AKI risk. Studies suggest that urinary oxygen tension (PuO2) may reflect renal oxygenation3. The aim of this study is to explore the relationship between post-operative AKI diagnosis and intraoperative PuO2 and urine flow rate. The ability to detect AKI or AKI risk intra-operatively may lead to better understanding of how to mitigate kidney injury during cardiothoracic surgery. Methods: After IRB approval and informed consent 38 patients scheduled for cardiothoracic surgery were enrolled at University of Utah Health Sciences. PuO2, temperature, and urinary flow sensors were installed between the urinary catheter and the tubing going to the urinary collection bag. All sensors were sampled at 1 Hz. The concentration of five urinary biomarkers (NGAL, KIM-1, IL-18, MCP-1, YKL-40) were measured at baseline (shortly after placement of urinary catheter) and 12-hours post cardiopulmonary bypass. For each patient the percent change from baseline was calculated for each biomarker. A percent change in the upper tertile for any biomarker was defined as "subclinical AKI." "Clinical AKI" was defined as meeting the KIDGO criteria for AKI.4 Patients with subclinical or clinical AKI, were in the AKI group, patients with neither subclinical nor clinical AKI were in the "No AKI" group. The oxygen concentration and flow signals were combined to calculate the oxygen excretion rate. The average oxygen excretion rate during cardiopulmonary bypass was calculated for each patient in the “No AKI” and “AKI” groups. The means of the two groups were compared using a two-tailed t-test. Eleven patients were excluded from the analysis because they were diagnosed with clinical AKI before the procedure, they required a non-latex urinary catheter, or their baseline measurement for any of the biomarkers was in the top ten percent. Results The average oxygen excretion rate (mean ± SD) for the AKI group (n=12) was 337.62 ± 238.57 g/hr. For the No AKI group (n=14) the average rate was 669.18 ± 381.75 g/hr. Patients diagnosed with AKI had a statistically significant lower average oxygen excretion rate than those who were not diagnosed with AKI (p = 0.019). Discussion: These results indicate that oxygen excretion rate could serve as a physiological biomarker to assess AKI risk intraoperatively. Future research will include exploring the impact of clinical interventions on urinary oxygen tension and the relationship between urinary excretion rate and patient outcome.

92 93
Back to Table of Contents
References: 1. Hobson CE, Yavas S, Segal MS, Acute Kidney Injury Is Associated with Increased Long-Term Mortality After Cardiothoracic Surgery, Circulation, 2009; 119; 2444-2453; 2. Evans RG, Ince C, Jaap AJ, Haemodynamic influences on kidney oxygenation: Clinical implications of integrative physiology. Clin Exp Pharmacol Physiol 40: 106–122, 2013. 3. Okusa MD, Jaber BL, Doran P, Physiological Biomarkers of Acute Kidney Injury: A Conceptual Approach to Improving Outcomes, Contrib Nephrol 2013; 182; 65-81; 4. Kidney Disease: Improving Global Outcomes (KDIGO) Acute Kidney Injury Work Group. KDIGO Clinical Practice
Guideline for Acute Kidney Injury. Kidney inter., Suppl. 2012; 2: 1–138.
Figure 1 - A comparison of the average oxygen excretion rate during bypass for AKI and No AKI patients. The Error bars represent standard error for each group.

94
Back to Table of Contents
Augmented Reality as a Tool to Reduce Fear and Promote Cooperation During Pediatric Nasal Endoscopy
Presenting Author: Martine Madill, BA Co-Authors: Thomas J. Caruso, MD, MEd, Douglas Sidell, MD, Kara Meister, MD, Ellen Wang, MD, Maria Menendez, MD, Samuel Rodriguez, MD
Introduction: Nasal endoscopies are anxiety-provoking for children, leading to decreased cooperation and suboptimal visualizations. Augmented reality (AR) is an emerging technology that may be helpful in reducing fear during minor procedures. This case series examines the use of interactive AR gameplay during nasal endoscopy. The primary objective was to determine the effect of AR on fear during pediatric nasal endoscopy. Secondary objectives included an examination of pain scores, compliance, and participant attitudes towards AR. Methods: This case series was conducted at a freestanding academic children’s hospital. Children aged 7-17 undergoing an outpatient nasal endoscopy were approached. During their procedures, patients wore an AR headset loaded with an interactive application. Outcomes were measured using the Children’s Fear Scale, Numeric Pain Scale, and a modified Induction Compliance Checklist. Patients, parents and otolaryngologists completed satisfaction surveys after the procedure. Results: Three patients were enrolled and reported low fear (average: 0.33/4), high satisfaction (average: 4.2/5), and no pain (average: 0/10). All procedures had perfect compliance. Parents reported high satisfaction (average: 4.33/5) and interest in AR. In all cases, children, parents, and physicians recommended AR. Conclusion: These preliminary results suggest that AR may be an effective tool to reduce fear and promote cooperation during pediatric nasal endoscopy. AR is minimally obstructive to proceduralists, carries few side effects, and allows children to maintain visual contact with their parents and providers. Limitations include a small sample size, however enrollment in a prospective, randomized controlled trial is ongoing.
Figure 1: The Mira AR headset (right) requires less hardware at the nose bridge than the Samsung Gear VR headset (left), making it a minimally-obstructive tool for reducing fear and promoting cooperation in pediatric nasal endoscopy.

94 95
Back to Table of Contents
Smartphone Image Processing for the Internet of Dumb Things Presenting Author: Jeff E Mandel MD MS, Mandel Anesthesia Innovations LLC There is considerable enthusiasm for an integrated clinical environment comprised of devices that communicate with a central messaging broker – the Internet of Things. Despite this, there are many “dumb things” in the anesthesia environment that force the clinician to manually enter data into clinical information systems. We might wish that the forced air warming system could report its state wirelessly, but we won’t buy a new one whose only new feature is Bluetooth connectivity. Our infusion pumps might support the ability to report infusion rates to Epic, but the implementation is slated for 2022. A simple approach employing a smartphone and openly available software libraries is described to address this problem. In the depicted example, we want to read two numbers on the screen of an Alaris Medley pump, which the app has done. It must solve several problems:
1) The image needs to be registered, as the picture was taken off-axis and tilted 2) The areas of interest need to be identified, as shown in green 3) The characters in green need to be recognized 4) The phone must transmit the data to the broker labelled with the correct pump To perform these tasks, we employ a number of open source libraries: 1) OpenCV 2) Google Firebase/MLVisionTextModel 3) Paho MQTTClient/Websocket 4) QRCodeReaderViewController In this example, we already know the propofol with concentration 10 mg/ml has been mounted on Channel A in OR 2 by scanning a QR code; what we need transcribed is the
volume (11.23 ml). The phone app needs to understand the geometry of the image to find the characters to recognize, but does not need to know the details of the consumer of the data, as this can be done on the MQTT server using technologies such as Spark to emit HL7 FHIR. This permits the phone app to be completely generic. The utility of such a system in rapidly adding data sources to an integrated clinical environment will require clinical validation.

96
Back to Table of Contents
Automated Recognition of Syringe Labels for Improved Patient Safety and Record Keeping: A Feasibility Study
Presenting Author: Kelly Michaelsen, M.D., Ph. D. Co-authors: Justin Chan, T. Andrew Bowdle, M.D., Ph. D, Srdjan Jelacic, M.D. Shyam Gollakota, Ph. D
Although medical providers often recall error rates of less than 1%1, studies have demonstrated that medication errors occurred with far greater frequency2,3. Of note, nearly 50% of these errors are due to drug labelling errors or incorrect dosages of medication (23% and 24% respectively)2. Many solutions have been suggested to decrease these errors, such as standard syringe placement4, a second person checking the provider’s actions5, or barcode labelling and scanning (which may decrease error rates by 17%-41%2,6,7). However, barcode scanning is an additional step which must be completed prior to drug administration in order to potentially prevent medication errors. Anideal solution would provide auditory or visual feedback anytime a syringe is picked up by the anesthesia provider and automatically record drug delivery in the medical record. Recent advances in smart eyewear combined with automated visual detection algorithms could seamlessly integrate into the operating room workflow. This new technology would l everage that crucial short window of time between selection of a syringe and drug administration to provide real time feedback to prevent drug errors and also document drug delivery in real time. This initial feasibility study was performed to assess the capabilities of existing hardware and software and understand the technological advances necessary before bringing such a product to market. Open source code repositories from academic research groups and eyewear with embedded video and photo recording capabilities, shown in the figure (a), were used for this study. Two distinct steps need to occur in order to identify syringe text labels. The first step is recognition of text within the image, highlighting different groups of text using bounding boxes. The second step is optical character recognition, inferring the actual text characters contained within the bounding boxes. Initial testing involved up close photograph of four syringes labeled with the Codonics© syringe labels. A more systematic review of the effects of distance was then performed. A continuous video of three empty syringes with the labels of propofol, fentanyl and rocuronium from a distance of 42” to 4” were taken as well as photographs of the labels across the same distance taken at 2” intervals. Initial testing on promising models that perform both text recognition and character recognition yielded unacceptable results with text outputs unrecognizable from the original words. Running separate algorithms for text recognition and optical character recognition with some manual processing led to better performance. CRAFT: Character Region Awareness for Text Detection8 is an excellent tool for creating bounding boxes around the text, as shown in the figure (b). At distances up to 26”, a bounding box surrounding exactly the word fentanyl on a fentanyl syringe was created in all cases. The character recognition program that yielded the best results was MORAN: A Multi-Object Rectified Attention Network for Scene Text Recognition9. Initial tests on full images yielded unrecognizable results for a series of four syringes. However, manually cropping these images to include only the text, as shown in the figure (c), led to correct identification of every drug. Hence, this algorithm is robust for optical character recognition after some preprocessing, which could be automated using the CRAFT algorithm described above. For the analysis syringes at

96 97
Back to Table of Contents
various distances, Propofol and fentanyl syringes could be identified up to 20” from the camera, with a maximum of two letters different from the actual text (tentanyl or propolot, for example, were considered acceptable), see figure (d).
In conclusion, using existing software tools, it is possible to identify syringe text from photographs taken on an eyeglass mounted camera up to 20” away with only slight errors. However, there are no commercial or prepackaged algorithms with all the essential features for syringe text recognition at this time. It is necessary to modify existing algorithms to obtain a bounding box around text on a syringe and then run character recognition algorithms. Further improvements, such as limiting word choices to a set of common anesthetic drugs may improve the robustness of such software techniques. 1. Flynn EA, Barker KN, Pepper GA, Bates DW, Mikeal RL. Comparison of methods for
detecting medication errors in 36 hospitals and skilled-nursing facilities. Am J Health Syst Pharm. 2002;59(5):436-446. doi:10.1093/ajhp/59.5.436
2. Nanji KC, Patel A, Shaikh S, Seger DL, Bates DW. Evaluation of Perioperative Medication Errors and Adverse Drug Events. Anesthesiol J Am Soc Anesthesiol. 2016;124(1):25-34. doi:10.1097/ALN.0000000000000904
3. Merry AF, Webster CS, Hannam J, et al. Multimodal system designed to reduce errors in recording and administration of drugs in anaesthesia: prospective randomised clinical evaluation. BMJ. 2011;343:d5543. doi:10.1136/bmj.d5543
4. Martin LD, Grigg EB, Verma S, Latham GJ, Rampersad SE, Martin LD. Outcomes of a Failure Mode and Effects Analysis for medication errors in pediatric anesthesia. Pediatr Anesth. 2017;27(6):571-580. doi:10.1111/pan.13136
5. Evley R, Russell J, Mathew D, Hall R, Gemmell L, Mahajan RP. Confirming the drugs administered during anaesthesia: a feasibility study in the pilot National Health Service sites, UK. BJA Br J Anaesth. 2010;105(3):289-296. doi:10.1093/bja/aeq194
6. Merry AF, Hannam JA, Webster CS, et al. Retesting the Hypothesis of a Clinical Randomized Controlled Trial in a Simulation Environment to Validate Anesthesia Simulation in Error Research (the VASER Study). Anesthesiol J Am Soc Anesthesiol. 2017;126(3):472-481. doi:10.1097/ALN.0000000000001514

98
Back to Table of Contents
7. Bowdle TA, Jelacic S, Nair B, et al. Facilitated self-reported anaesthetic medication errors before and after implementation of a safety bundle and barcode-based safety system. Br J Anaesth. 2018;121(6):1338-1345. doi:10.1016/j.bja.2018.09.004
8. Baek Y, Lee B, Han D, Yun S, Lee H. Character Region Awareness for Text Detection. ArXiv190401941 Cs. April 2019. http://arxiv.org/abs/1904.01941. Accessed July 26, 2019.
9. Luo C, Jin L, Sun Z. MORAN: A Multi-Object Rectified Attention Network for scene text recognition. Pattern Recognit. 2019;90:109-118. doi:10.1016/j.patcog.2019.01.020

98 99
Back to Table of Contents
Monitoring Changes in Photoplethysmography During Lower Body Negative Pressure Induced Hypovolemia: Differences by Site and Sex
Presenting Author: Emily Nagourney, MSPH, Department of Anesthesiology, Yale University School of Medicine & Central Michigan University College of Medicine Co-authors: Anna-Maria Eid, MD, Kim Tran, Ahmad Ibrahim, MD, Mohamed Elgamal, MD, Kirk Shelley, MD PhD, Ayman Alian, MD, Department of Anesthesiology, Yale University School of Medicine Introduction: Lower body negative pressure (LBNP) is used as a model for induced hypovolemia by sequestration of blood in the lower extremities.1 The photoplethysmography (PPG) waveform, known for its use in monitoring arterial oxygen saturation, can also be used as a non-invasive tool to measure blood volume changes.2 The area under the curve (peak area (PA)) in the arterial waveform can be used to calculate stroke volume (SV). In states of hypovolemia, peripheral vasoconstriction has been shown to interfere with peripheral blood flow monitoring. When compared to the finger, the nasal alar site is more immune to sympathetic vasoconstriction as it is supplied by the internal and external carotid arteries.3 In comparison to male patients, female patients show a lower tolerance to hypovolemia due to more rapid reduction in compensatory mechanisms to maintain arterial perfusion.4
The purpose of this study was to monitor changes in PA and SV by pulse oximetry site (nasal alar (Xhale) vs. finger (Nellcor)) and by sex during progressive LBNP induced hypovolemia. Methods: 30 healthy subjects (15 male, 15 female), aged 21-43 years, underwent progressive LBNP protocol (LBNP -15, -30, -45, -60mmHg). Subjects who remained asymptomatic at LBNP -60 mmHg were labeled as high tolerance (HT), while subjects who became symptomatic before LBNP -60 mmHg were labeled as low tolerance (LT). Participants were monitored with EKG, continuous non-invasive arterial pressure (CNAP) to measure MAP and non-invasive cardiac output monitoring (NICOM) to measure SV and CO. Nasal alar (Philips-Xhale Assurance Nasal Alar SpO2) and finger (Nellcor) pulse oximeter probes were utilized to measure PPG waveforms. LabChart (ADInstruments) was used for data collection and waveform analysis of the PPG waveform. Friedman ANOVA and Wilcoxon tests were conducted utilizing SPSS. P-value <0.005 was considered significant (Bonferroni adjustment). Results: During progressive LBNP, MAP was maintained while there was a significant decline in SV (i.e. >~15%) in both HT and LT patients. In early phases of LBNP, there was a significant drop in finger PPG PA, which is attributed to an increase in sympathetic tone and vasoconstriction in the periphery, as indicated by an increase in low frequency of heart rate variability. Nasal alar PPG demonstrated a strong correlation with changes in SV in both HT (r=0.99) and LT (r=0.94) groups. At LBNP -30mmHg in the LT group, there was a decline in SV of 11.4% and 21.5% and a 36% and 27% reduction in nasal alar PPG PA in both female and male subjects, respectively. In the LT group, female patient showed rapid decline in nasal alar PPG PA (13%, 36%, 54%, and 65%) more than male patients (12%, 27%, 48%, and 41%) during progressive LBNP protocol. Conclusions: MAP is maintained with progressive LBNP, indicating that this is a late and non-specific sign of hypovolemia. The rapid decline in nasal alar PPG PA in females compared to males during LBNP-induced hypovolemia confirms that female patients decompensate more quickly than male patients.

100
Back to Table of Contents
The decline in nasal alar PPG PA was comparable to SV reduction in both sexes, indicating that PA can be used as a marker on arterial waveform monitors to track early changes in blood volume. Thus, nasal alar PPG waveform is a more useful clinical tool to assess early central hypovolemia compared to the finger site in both female and male patients. References: 1. Goswami, N., Blaber, A. P., Hinghofer-Szalkay, H., & Convertino, V. A. (2018). Lower body negative pressure: physiological effects, applications, and implementation. Physiological reviews, 99(1), 807-851. 2. Allen, J. (2007). Photoplethysmography and its application in clinical physiological measurement. Physiological measurement, 28(3), R1. 3. Alian, A. A., Galante, N. J., Stachenfeld, N. S., Silverman, D. G., & Shelley, K. H. (2011). Impact of central hypovolemia on photoplethysmographic waveform parameters in healthy volunteers. Part 1: time domain analysis. Journal of clinical monitoring and computing, 25(6), 377-385. 4. Schlotman, T. E., Akers, K. S., Nessen, S. C., & Convertino, V. A. (2018). Differentiating compensatory mechanisms associated with low tolerance to central hypovolemia in women. American Journal of Physiology-Heart and Circulatory Physiology, 316(3), H609-H616.
Figure:
Figure 1(a-d) – a) b) Percent change in PPG peak area, SV and MAP during LBNP in LT and HT groups; c) d) Percent change of nasal alar PPG PA and SV during LBNP in female and male HT and LT groups

100 101
Back to Table of Contents
Use of Anesthesia Information Management System (AIMS) Data to Determine Factors Associated with Low Blood Pressure in Healthy Anesthetized Infants
Presenting Author: Olivia Nelson, MD Co-Authors: Lezhou Wu, PhD, Paul Stricker, MD, Fuchiang Tsui, PhD, Aaron Masino, PhD, Jonathan M. Tan MD, MBI, MPH, Jack O. Wasey, BMBCH, MA, MSci, Jorge A. Galvez, MD, BMI, Allan F. Simpao MD, MBI. Introduction: Infants under six months of age have the highest risk of cerebral hypoperfusion during periods of low blood pressure.1 We used AIMS data to study the hemodynamics of infants who received anesthesia for inguinal hernia repair. The primary aim was to determine the patient, anesthetic and surgical factors associated with low systolic blood pressure (SBP) in healthy infants. We hypothesized that infants who received a neuromuscular blocking agent would have significantly higher SBP than infants who did not receive a muscle relaxant. Methods: ASA PS 1 and 2 patients aged 0-6 months who underwent inguinal hernia repair from January 2015 to March 2019 at CHOP were included. SBPs were analyzed during the preparation phase (20 minutes before procedure start) and the surgical phase (15 to 35 minutes after procedure start). Low SBP was defined as an SBP more than two standard deviations below the 50th percentile in phase- and weight-specific reference values for children under general anesthesia.2 Data on patient and surgical characteristics, hemodynamics and perioperative medications was retrieved from the AIMS (Epic Anesthesia Module, Verona, WI). Results: Of 280 included patients, 30 (11%) had low SBP during the preparation phase and 13 (5%) during the surgical phase. The majority of patients received neuraxial anesthesia (244 patients, 87.1%) which consisted of a caudal block in all but two patients who received spinals. During the preparation phase, after controlling for confounders, SBP decreased by 3.7 mmHg for each kg reduction in weight, and SBP decreased by 2.1 mmHg for each month younger in age (both P < 0.001). Weight had a stronger effect than age on SBP with a larger standardized regression coefficient (4.5 vs. 2.5). Similar associations were observed during the surgical phase. Patients given muscle relaxant had significantly fewer occurrences of low SBP during the preparation phase (β = -1.89 and P < 0.001). Urology patients had more occurrences of low SBP compared with general surgery patients during both phases (β = 1.12 and P = 0.028; β = 2.68 and P = 0.010). Discussion: SBP displayed linear relationships with weight and age among healthy infants. Muscle relaxant use is associated with reduced doses of other anesthetic agents; this sparing effect likely has a positive effect on SBP. Conclusion: Age and weight were linearly related to blood pressure in infants under anesthesia. The use of muscle relaxant was associated with fewer low blood pressures. References: 1) Rhondali O, et al. Impact of sevoflurane anesthesia on cerebral blood flow in children younger than 2 years. Paediatr Anaesth 2013; 23:946-51 2) de Graaff JC, et al. Reference values for noninvasive blood pressure in children during anesthesia: a Multicentered Retrospective Observational Cohort Study. Anesthesiology. 2016; 125:904-913

102
Back to Table of Contents
Figure 1. A matrix of correlation coefficients, histograms, and scatter plots among SBP, age, and weight.

102 103
Back to Table of Contents
Experiences From a Multinational Pediatric Difficult Airway Whatsapp Group – A Study From the Pedi-R Collaborative
Presenting Author: Evelina Pankiv, MD, University of Toronto, ON Co-authors: Clyde Matava, MB ChB, MMed, University of Toronto, ON, Hospital for Sick Children, Toronto, ON; John Fiadjoe, MD, Children’s Hospital of Philadelphia, PA Introduction: The management of the difficult airway in the pediatric patient remains a challenge. The Pediatric Difficult Intubation Registry (a special interest group of the Society for Pediatric Anesthesia), the Difficult Airway Society - UK, have established evidence-based guidelines on techniques for improving patient outcomes in the pediatric difficult airway population. Despite this, providers may require advise from colleagues. The Pedi-R WhatsApp™ group was started by one of the researchers in 2014 and is hosted on a WhatsApp™ discussion group whose goal was to foster discussion among pediatric anesthesia airway experts. Patient or parental consent is required to post patient information. The goal of this study was to gather information on the perceived utility of the WhatsApp™ group to members and the overall usage. Methods: Following local ethics approval, members of the Pedi-R were invited to complete an online survey. The survey was pre-tested by members of the Pedi-R scientific committee. Data were collected using Redcap. Descriptive analytics were performed. Results: 46 out of 64 members completed the survey with a response rate of 60%. Responders were from 13 countries with 25 (56.8%) responders from the United States. The majority of responders identified their sites as tertiary teaching pediatric hospitals 27 (62.8%) or tertiary teaching mixed pediatric/adult hospitals 12 (27.9%). 48% of responders were associate professor/full professor/professor emeritus with 50% as lecturer/assistant professor. The top three posts included advice seeking/suggestions regarding patient management scenarios 31 (18.0%), sharing interesting case(s) for education and/or discussion 27 (15.6%), and asking for advice related to a specific airway case 26 (15.1%). The most frequently reported reason for not posting in the PeDi Collaborative WhatsApp group was “I don’t like participating in mass chat groups but I enjoy reading the discussions that take place” 9 (45.0%) The majority of responders, 27/35 (77.1%), either agreed or strongly agreed that they found discussions translatable into their own clinical practice. 45.7% reported that they changed a plan based on the advice provided. 91.4% of respondents agreed that the group informed them on the variance in practice across the globe. 85.2% felt connected to peers via the group and 94.2% would continue being a part of the group. Discussion: We demonstrate that a Whatsapp based group is able to offer realtime and robust peer support and discussions on the management of pediatric difficult airways. Furthermore, the growth of the group to 13 countries suggests that media such as Whatsapp offer few barriers to users and can inform and potentially improve patient outcomes.

104
Back to Table of Contents
Conclusion: The Pedi-R Collaborative Whatsapp group has been successful in fostering discussion and informing the management of the pediatric difficult airway.
104 105
Back to Table of Contents
The Adoption and Thematic Analysis of a Social Media Platform for the Management of Pediatric Difficult Airways – A Pedi-R Study
Presenting Author: Evelina Pankiv, MD, University of Toronto, ON Co-Authors: Clyde Matava, MB ChB, MMed, University of Toronto, ON, Hospital for Sick Children, Toronto, ON; John Fiadjoe, MD, Children’s Hospital of Philadelphia, PA Background/Introduction: In 2014, the Pediatric Difficult Intubation Registry (a special interest group of the Society for Pediatric Anesthesia) established a WhatsApp™ discussion group whose goal was to foster discussion among pediatric anesthesia airway experts. Participants can post a case for discussion or seek advice on strategies to assess, diagnose and manage upcoming cases. Depending on the geographical location, available resources, expertise and experience, the local practice may vary somewhat. The aim of this study was to categorize the patterns of use into the following themes: advice seeking; clinical case-sharing; educational content; administrative content; and miscellaneous. Methods: Following ethics approval and approval from the Pedi-R community, data from the Pedi-R WhatsApp™ chat archive (9/30/14 through 3/23/19) was downloaded into an excel spread-sheet for analysis. Using methods previously described by Carmona (2018) the content was analyzed. We defined a stem as a new post that was not in response to a previous post. Subsequent posts in response to a stem were labelled as first generation, second generation, third generation, or greater than third generation responses. Media was defined as a post that was an image, video, document or link. Results: There was a total of 5782 messages archived in the Pedi-R WhatsApp group. With a study period of 1636 days this was an average of 3.5 posts per day. Almost 40% (2170/5782) occurred on Thursdays and Fridays. 350 (6.0%) posts were original stems; 2360 (40.8 %), 1284 (22.2%), 712 (12.3%), and 930 (16.0%) were first generation, second generation, third generation, and greater than third generation responses, respectively. 125 (35.7%) stems include media. On average stems generated 15 responses (range= 0-175). The three stem categories that generated the most responses were clinical case sharing (mean 25.8 +/- 5.8 responses), advice seeking – patient care (mean 22.7 +/- 4.4 responses), and advice seeking-medication/equipment availability (mean 15.5 +/- 6.7 responses). A total of 447 responses in the chat included media. 38 (8.5 %) included a link to a website/article/social media. The majority of media responses were images, 382 (85.0%), with videos attached in 27 (6.0%) of media responses. We identified a cluster of 6 users who were responsible for almost 60% of all the posts. An image or video that featured a patient or case was included in 155 (37.9%) of media responses, and those that featured equipment included in 62 (15.1%) There were 289 responses that included emojis. Posts with media generated more responses, mean (SD, 26.5 (SD 4.23) compared to posts without media 8.9 (1.5), P = 0.02. 29 (8.2%) of stems provided an update, suggesting the poster had used the advice provided in the chat to influence their management of a difficult airway patient

106
Back to Table of Contents
Discussion: The Pedi-R Collaborative Whatsapp is a highly active multi-national group. The use of the platform suggests that social media is able to assist in providing discussion and guidance on the management of difficult airways in children. As posts with media were popular, it is incumbent on groups using such platforms to exercise the appropriate practices for sharing patient data. Conclusion: The Pedi-R Collaborative Whatsapp group has demonstrated adoption and a pattern of use that suggests it meets a need.

106 107
Back to Table of Contents
Using Artificial Intelligence to Assist with Intubation of Pediatric Patients – Development and Evaluation of Smartscope, a Novel Machine Learning Algorithm
Presenting Author: Evelina Pankiv, MD, University of Toronto, ON Co-authors: Clyde Matava, MB ChB, MMed, University of Toronto, ON, Hospital for Sick Children, Toronto, ON Simon Denning, BMBS BMedSci FRCA, Hospital for Sick Children, Toronto, ON Oswaldo Ferro Hernandez, MSc, University of Waterloo, ON Benjamin Weingarten, University of Ottawa, ON Background/Introduction: Successful first-pass endotracheal intubation rates vary dramatically depending on the patient, personnel involved and the environment in which the procedure occurs [1]. Current methods for endotracheal intubation rely on skilled operators to plan appropriately, identify relevant airway anatomy and perform the procedure. If unrecognized, unsuccessful intubation can lead to significant patient harm [2]. Advances in machine learning programming have led to a variety of applications in medicine. We developed a novel machine-learning based algorithm that can be used to automatically identify vocal cords and airway anatomy to assist with confirmation of intubation using video-laryngoscopy and bronchoscopy. Methods: Following institutional ethics approval, we accessed bronchoscope videos of patients (ages 0 days to 12 years old); extracting and labelling 204 images. These were augmented to 1632 images with an 80:20 split for training and validation. Using ground truth, two connected convolutional networks (modules) were developed to allow:
1- Automatic real-time identification and labeling of vocal cords, tracheal and trachea-bronchial anatomy using semantic segmentation and image classification
2- Automatic localization of a bronchoscope within the upper airway, trachea and detection of successful endotracheal intubation
Accuracy of the convolutional networks was assessed using Cross Entropy loss. The probability for certainty that a given pixel corresponds to a particular class was determined as 0 = no confidence and 1 = 100% confidence. We also determined to run feasibility tests where the ML algorithm could run on a laptop real-time using a C-MAC, Glidescope and fibreoptic intubation equipment. Feasibility testing was performed on a high-fidelity pediatric intubation manikin. Results: The semantic segmentation module achieved state-of-the-art segmentation of vocal cords, tracheal rings, bifurcation and “other tissue” classes with mean pixel-wise accuracy of 96.6% and inference time of 6.4ms. Using the semantic segmentation module output, a new algorithm was developed to track key features of the airway. The localization module is able to track the camera position to the nearest tracheal ring, acting as a “tracheal GPS” with a mean iteration time of 5.5 frames per second. The ML algorithms were able to run real-time on a laptop connected to the C-MAC. Conclusion: We have developed two machine learning algorithms that function as one application, SmartScope and can be used to assist with intubation via video-laryngosopy or bronchoscopy through real-time identification of vocal cords and intubation success. Furthermore, the SmartScope is able to identify tracheal anatomy. Future applications to explore include its utility in assisting intubating among novices and also in difficult intubation scenarios. References:

108
Back to Table of Contents
[1] Hubble MW, Brown L, Wilfong DA, Hertelendy A, Benner RW, Richards ME. A meta-analysis of prehospital airway control techniques part I: orotracheal and nasotracheal intubation success rates. Prehosp Emerg Care. 2010;14:337–362. [2] T. M. Cook, S. R. MacDougall-Davis. Complications and failure of airway management, BJA: British Journal of Anaesthesia, Volume 109, Issue suppl_1, December 2012, Pages i68–i85, https://doi.org/10.1093/bja/aes393
Semantic Segmentation Localization
Airway Localizer Program
Module 1 Module 2
Input: Video Frames
Output: Camera Location
Figure 1 - Flowchart of the program highlighting the interactions between individual modules
108 109
Back to Table of Contents
Utilization of a Voice-Based Virtual Reality Advanced Cardiac Life Support Refresher Course: An Exploratory Analysis
Presenting Author: Chang Park, MD, Icahn School of Medicine at Mount Sinai, New York, NY Co-Authors: Daniel Katz, MD, Icahn School of Medicine at Mount Sinai; Ronak Shah, MD, Icahn School of Medicine at Mount Sinai; Elizabeth Kim, BS, City University of New York School of Medicine; Anjan Shah, MD, Icahn School of Medicine at Mount Sinai; Adam Levine, MD, Icahn School of Medicine at Mount Sinai; Garrett Burnett, MD, Icahn School of Medicine at Mount Sinai Background: Proper Advanced Cardiac Life Support (ACLS) training is vital due to the increasing incidence of cardiac arrests and variable in-hospital cardiac arrest survival rates in the United States. Despite requirements for healthcare professionals to have ACLS training, cardiac resuscitation survival rates are low, and clinicians demonstrate decay of skills over time. The current gold standard for ACLS training involves face-to-face, high fidelity exercises that simulate resuscitation codes. Limitations of this modality include long session duration, expensive durable equipment, and need for trained personnel. Virtual reality (VR) has been proposed as an alternative or adjunct to high fidelity simulation (HFS) in several environments, including engineering, sports, and aviation. Although fully immersive VR programs have been studied in the realm of ACLS education, no evaluations to date explored their ability to examine both technical and behavioral skills as well as demonstrate a cost comparison. Therefore, our objective was to evaluate the feasibility, human factor impact, and cost of a voice-based VR ACLS refresher course as compared to high fidelity simulation. Methods: This prospective observational study performed at an academic institution consisted of 25 Post Graduate Year-2 (PGY-2) residents. Participants were randomized to high fidelity simulation or virtual reality training, and then crossed groups after a two-week washout. Participants were graded on technical and non-technical skills. Proctors were assessed for fatigue and task saturation using the NASA Task Load Index. Cost analysis was performed using local economic data. Results: 23 of 25 participants were included in the scoring analysis. Fewer participants were familiar with VR compared to high fidelity simulation (36% vs 100% p<0.001). Although neither modality was overtly preferred, significantly more participants felt high fidelity simulation provided better feedback (99 [89-100] vs 79 [71-88], p<0.001). Scores were higher in the high-fidelity simulation group; however, non-technical scores for decision making and communication were not significantly different between modalities. VR sessions were shorter in duration than high fidelity simulation. NASA task load index scores for proctors were lower in each category for the VR group. VR sessions were estimated to be $103.68 less expensive in a single learner single session model. Conclusion: Utilization of a VR based refresher for ACLS skills is comparable to high fidelity simulation in several areas. The VR module was more cost effective and was easier to proctor; however, high fidelity simulation was better at delivering feedback to participants. Further studies are needed to examine the utility of VR based environments at scale. References:
1. Cheng A, Nadkarni VM, Mancini MB, et al. Resuscitation Education Science: Educational Strategies to Improve Outcomes From Cardiac Arrest: A Scientific Statement From the American Heart Association. Circulation. 2018;138(6):e82-e122.

110
Back to Table of Contents
2. Wang P, Wu P, Wang J, Chi H-L, Wang X. A Critical Review of the Use of Virtual Reality in Construction Engineering Education and Training. Int J Environ Res Public Health. 2018;15(6).

111
Back to Table of Contents
Nasal Mask PC Ventilation to Deliver CPAP in a Morbidly Obese OSA Patient During EGD Presenting Author: Neel Patel, BS, Rutgers Robert Wood Johnson Medical School Co-authors: James Tse, MD/PhD, Rutgers Robert Wood Johnson Medical School; Sylviana Barsoum, MD, Rutgers Robert Wood Johnson Medical School Abstract: Patients under monitored anesthesia care (MAC) receive intravenous sedation and O2 via NC. Over-sedation and/or airway obstruction may cause severe desaturation, especially in obese patients with OSA. Obese OSA patients may require frequent chin-lift, jaw- thrust and/or insertion of nasal airways. Inserting nasal airways may cause bleeding despite using small, well lubricated nasal airways. In January 2013, a nasal TSE-PAP mask/circuit was developed using an infant face mask. The nasal TSE-PAP mask is especially useful for EGD and TEE under MAC. With the bite block in place, CPAP is about 1-2 cm of H2O even with the APL valve completely closed. However, the nasal TSE-PAP circuit becomes a CF mask with fresh O2 flow of 4-5 L/min. Fresh air can be added to keep FiO2 under 0.8 to avoid causing absorption atelectasis. In March 2019, a 77y/o female, BMI 35.2kg/m2, with OSA, pulmonary HTN on home NC O2, CAD s/p 3xstents, thoracic/AAA s/p aorta-bifem bypass and melena presented for EGD/colonoscopy. SpO2 was 94% on NC O2 (4L/min). A TSE Mask was used which increased her SpO2 to 100%. During sedation with lidocaine/propofol, her airway was obstructed and she desaturated to 80% SpO2. A modified infant face mask was immediately secured to increase her saturation. Methods: Inflate the air cushion of an infant face mask with about 10 cc of air. Then secure a hook ring from a toddler mask or an adult face mask with tape. Connect to the anesthesia circuit/machine to deliver CPAP (15cm H2O) with 4L O2 /min. Results: The patient’s SpO2 promptly raised to 99%. Her ventilation was then supported with nasal pressure-control ventilation (PIP 17cm H2O, PEEP 14cm H2O, RR 10/min) maintaining 98-100% SpO2. She recovered without any complications. Conclusion: The Nasal TsePAP strategy has demonstrated an elegant and highly effective use of a pediatric facemask, slightly modified, to generate nasal pressure as an induction strategy or as a rescue method. The advantages of this method include ease of ventilation in large range of patients (obese, pediatric) and use in patients having failed facemask ventilation. The nasal TsePAP method pressurizes the nasal channels and tends to push the soft palate and tongue forward while delivering positive pressure effects.
Monitor showing SpO2 decreased to 80% due to airway obstruction
A modified infant mask provided immediate nasal CPAP and PC ventilation
Monitor showing prompt recovery of oxygenation with nasal mask PC ventilation

111 112
Back to Table of Contents
Evaluation of a Novel Method for Lung Isolation Using a High Fidelity Infant Mannequin – Preliminary Results
Presenting Author/PI: F Robert Purdy, BSc, MSc, DVM, MD, FRCPC Co-authors: Christopher Badenhorst BSc, MB, ChB, FANZCA, Andrew Poznikoff BSc, Matthias Görges PhD, Jimmy Lam MD, Michael Barker MD, FRCPC, Louis Scheepers FRCPC, Alex Zheng MSc, Richard Lee FRCPC Background: Techniques of lung isolation and one lung ventilation for infants can be challenging; several methods using an Arndt bronchial blocker have been described1-5. We developed a novel device6, whereby the bronchial blocker is securely attached to an endotracheal tube (ETT) prior to intubation and blocker placement. This study compares the novel device with five previously published methods. The primary outcome was total time to lung isolation, defined as the laryngoscope entering the oral cavity to confirming blocker placement by ventilation. Methods: After ethics approval, 18 pediatric anesthesiologists were recruited to participate in a simulation study with a high fidelity infant mannequin7. Following one practice laryngoscopy and intubation, each participant trialed six different methods for extra-luminal bronchial blocker placement in a randomized order. The six methods tested were: Novel method6, Bent blocker1, Endobronchial ETT placement of blocker2, Blind insertion of blocker3, Blocker looped to endotracheal tube4, and Blocker looped to bronchoscope5. Results: Data from 18 pediatric anesthesiologists were available for analysis. The novel method was as fast as, or faster than all methods tested. The total time to lung isolation with the novel method was significantly faster than the endobronchial ETT (91 sec; 95% CI: 36-146; p=0.002) and blind methods (97 sec; 95% CI: 42-152; p=0.001) (Figure 1). Conclusion: The novel method of bronchial blocker placement shows promise as an alternative method for lung isolation in infants. The simplicity of the design, low cost, and ease of use may allow early adoption in developing countries. We believe there may be many other advantages including: a) security of the blocker once positioned, b) opportunity to delay lung isolation until after patient positioning, c) ease of repositioning a misplaced blocker, d) improved accuracy of placement and e) improved success with blind placement. Alternate patient populations, including rapid lung isolation in adults with massive pulmonary hemorrhage, unilateral lung trauma, and lung isolation for large bronchial tree air leaks, may also benefit from this approach. Further clinical trials are needed.
References: [1] Pediatric Anesth. 2016;26(5):512-20; [2] Pediatric Anesth. 2018 ;28(7):668-669; [3] Medicine. 2016;95(19):e3687; [4] Can J Anesth. 2006;53(2):159-61; [5] Principles and Practice of Mechanical Ventilation McGraw-Hill Education/Medical: 3rd edition 2012 [6] USPTO US2018/0326168A1 [7] https://www.trucorp.com.

113 113
Back to Table of Contents
Figure 1. Total time to lung isolation; from laryngoscope entering the oral cavity to confirming blocker placement. One outlier was censored in the blind method at 756 sec. COI: Dr. F. Robert Purdy Ltd. has a patent pending for the novel bronchial blocker design. This has been assigned by Dr. Purdy to the Provincial Health Services Authority (a publicly funded health service provider in British Columbia, Canada).

114
Back to Table of Contents
Exploring ASA Score Predictability Using Machine Learning
Presenting Author: Priya Ramaswamy, MD, MEng, Beth Israel Deaconess Medical Center Co-authors: Matthias Eikermann MD, PhD, Beth Israel Deaconess Medical Center; Peter Santer, MD PhD Beth Israel Deaconess Medical Center; Stephanie Grabitz, MD Beth Israel Deaconess Medical Center Background/Introduction: The goal of this study is to investigate whether machine learning (ML) can accurately estimate ASA scores for pre-operative patients based on objective data contained in hospital Electronic Medical Records, and to incorporate a rule-based ground-truth misclassification correction method into algorithmic training of ASA score classification algorithms. ASA scores (range 1-6) is a subjective assessment of a patient’s overall health or physical status. ASA scores are used for resource allocation, improving workflow, and reimbursement. ASA misclassification can affect observed versus expected mortality ratios of surgical patients (Helkin et al. 2017). ASA misclassification can also affect billing, since ASA 4’s and 5’s generally receive more reimbursement compared to ASA 1-3. Thus it is important to document accurate ASA scores. Since ASA scores are a function of patient features such as age and medical history, ML algorithms are ideally suited for automating the ASA classification system using patient characteristics, thus removing the subjectivity of human error. Prior work for ASA score prediction using ML is either based on small sample sets of few hundred patients (Karpagavalli et al. 2009, Lazouni et al. 2013) or converts the full ASA score prediction problem to an easier, binary prediction problem, which may be unsuitable for clinical use (Zhang 2016). In this study, we utilize retrospective, single-center, de-identified patient data from 202,353 patients to train an ML model that performs 4-way classification between ASA scores 1-4. Our dataset excluded scores of 5 and above. Methods and Results: We split the dataset into training, validation, and test subsets in roughly a 60%/20%/20% split. We use 78 z-normalized features per patient for training the model; these include demographic features, medical history, and medication history. Since ASA scores are unevenly distributed across the patient population, the dataset contains significant class imbalance---the most common class contains roughly four times the samples than the least common class. Since ML algorithms do not perform well for such data, we utilize balanced sampling to convert the data to a uniform class distribution. We train four different algorithms---decision tree, bagging, random forest, and multi-class support vector machines (SVM)---and perform hyperparameter tuning using the validation set to find the algorithm with the best accuracy. We find that random forests obtain the best balanced accuracy of 71% with class-wise (1-4) recall of 90%, 50%, 54% and 83%, respectively. Note that a random classifier would obtain a balanced accuracy of 25%, showing that our method performs quite well. A previously unexplored aspect of research on ASA score prediction is that the “ground truth” ASA scores obtained from EHRs, used for training and validating ML models, are likely to contain noise due to physician errors in coding. Using the ASA guidelines (e.g., “the minimum ASA score for a patient who has had a stroke within the past three months should be 4”), we build a rule-based algorithm to correct ASA score labels in our patient records. We find that a full 8.5% of our dataset contains coding errors (17,277 cases.) We re-train our best ML algorithm using the corrected ASA score labels, which improves our prediction performance to 77% (class-wise recall of 93%, 64%, 58%, 84%), which is an improvement of 6%. This should be an essential step in future research. Conclusion: In summary, we show that machine learning can predict ASA scores from objective data contained in EHRs and prediction performance can be improved by incorporating a rule-based ASA score correction method. Future work will focus on improving prediction performance using natural language processing-based features and automated machine learning methods. References: [1] Helkin A, Jain SV, Gruessner A, et al. Impact of ASA score misclassification on NSQIP predicted mortality: a retrospective analysis. Perioperative Medicine. 2017 6:23.

114 115
Back to Table of Contents
[2] Karpagavalli, S., Jamuna, K.S., & Vijaya, M.S. Machine learning approach for preoperative anaesthetic risk prediction. International Journal of Recent Trends in Engineering, 1(2), 19-22. 2009 [3] Lazouni, M. Daho, M., Settouti, N., Chikh, M., & Mahmoudi, S. Machine learning tool for automatic ASA detection. Modeling Approaches and Algorithms for Advanced Computer Applications. Volume 488, 9-16 2013 [4] Zhang, L. Data-driven system for perioperative acuity prediction. Thesis, Graduate School of Vanderbilt University. Dec, 2016.

116
Back to Table of Contents
A Hybrid Rule-Based/Machine Learning Closed-Loop Ventilator (HCLV) Approach Presenting Author: Rocky Reston, MD, PhD, Chief Medical Information Officer, Cognitive Medical Systems Co-author: Emory Fry, MD, Chief Executive Officer, Cognitive Medical Systems
Background: In many disaster and other first-responder scenarios, care often occurs where the requisite clinical expertise to manage a ventilated patient is not readily available and conditions are ill suited to the implementation of a consistent and optimized ventilation strategy. Similarly, the standard practice in intensive care units nationwide is for these determinations to be increasingly made by residents, respiratory therapists, and nurses, often without the immediate oversight of a more experienced consultant such as the fellow or attending physician. The situation in both environments is further complicated by resource limitations (nursing shortages, unfilled shifts, increasing inpatient acuity, etc.) and their consequences on patient-staff ratios. An advanced closed loop ventilator system can augment the clinical skills of the bedside provider with at least some of the expertise a skilled physician/anesthesiologist might provide. Unfortunately, rule-based reasoning alone is not optimal for implementing such systems. With a multitude of control adjustments available, the combinatorial explosion of possibilities is extremely challenging to model using production rules and expert systems. Machine learning techniques are more appropriate technologies to use as clinical use cases become more complex, for example, recognizing and dynamically adapting to changes in underlying disease. Methods: We developed a hybrid approach consisting of rule-based logic for periods of clinical stability, but augmented with machine learning capabilities to respond to acute changes in a patient’s condition. Critical elements in the implementation of this system include not only appropriate software engineering practices, but also clinical simulation, validation and usability testing. Our approach recognizes that a minimum initial capability for scripted simulations is required for appropriate validation of the rule-based component and for training the machine learning component. In these simulations, each stage is divided into a set of possible scenarios where the developer has the responsibility of anticipating actions and scripting ventilator / patient responses in order to generate appropriate responses from the HCLV system. The ventilator / patient responses are based on physiological modeling for the initial development and validation of the HCLV system. A simulated scenario on our platform is shown in the figure below.
Results/Conclusion: As a result of our hybrid approach, we anticipate our further work in this area will have three stages of development that will result in several different subsystems, the optimal

116 117
Back to Table of Contents
configuration of which, either as a singleton or in combination with each other, will be determined through empirical testing. Phase One will encompass the data prep and development of a rule-based expert system designed to model ventilator management for a clinically stable patient. Phase Two will encompass the data prep and training of machine learning networks using simulations driven by physiologic models as described above. These models will enable more sophisticated and realistic simulations that should invoke more nuanced ventilator management and be ideally suited for multi-parameter ventilator adjustments. Phase Three will encompass the data prep and training of similar predictive models, not using simulation data, but from de-identified case data from actual clinical practice. With careful case selection, subsets from these datasets will enable training of models that represent ventilator management behavior in a real-world, operational context.

118
Back to Table of Contents
Successful Use of Immersive Technology Distraction for Non-Sedate Transthoracic Echocardiograms in Pediatric Cardiac Patients
Presenting Author: Elizabeth Rossmann Beel, MD, MPH, Baylor College of Medicine/Texas Children's Hospital, Houston TX Co-authors: Clinton L. Fuller, MD, Baylor College of Medicine/Texas Children’s Hospital, Houston, TX; Joannie Stoker APRN, MSN CPNP-PC, Texas Children’s Hospital, Houston, TX; Kathleen Chen, MD MS, Baylor College of Medicine/Texas Children's Hospital, Houston TX Background/Introduction: Though transthoracic echocardiograms (TTE) do not generally require the services of an anesthesiologist in the adult population, young children may require sedation for the acquisition of appropriate images. Dexmedetomidine is used as a front-line agent for these studies in our institution and often yields successful TTE images. However, in a subset of our pediatric patients with congenital heart disease, heart block, or those who are taking negative chronotropic medication, this sedative is a contraindication (1). Midazolam can be a safe, alternative sedative for this group of patients, but its use as the sole sedative has been associated with high failure rates.
Approximately 20,000 echocardiograms are performed per year in our pediatric quaternary care institution; of these, around 400 require sedation to complete successfully. Young children between 15 months and 3 years of age are at the highest risk for needing pharmacological assistance. Of the children who do require sedation, approximately 11% will still be unable to complete the echocardiogram and are classified as sedation failures. These patients will then need to undergo general anesthesia to obtain echocardiogram images. We report the application of immersive technology (IT) as a distracting technique for a successful TTE exam in a young pediatric patient who wasn’t an appropriate candidate for the use of dexmedetomidine and had also failed sedation with midazolam.
Methods: Patient selection was based on age (15 months and older) and those who were candidates for sedation with midazolam. The patient was a 23-month-old female with a history of a neuroblastoma and taking labetalol as part of her treatment protocol. She presented to the echo lab for routine cardiac surveillance. Preoperatively, we obtained consent and introduced our IT device. The IT device utilized was a compact, portable, bedside video projector (BERT- Bedside Entertainment Relaxation Theatre) loaded with multiple age-appropriate movies and videos. The child’s preferred movie was then dramatically projected onto an empty wall in the dark examination room for the feel of a movie theatre environment (2). The anesthesiologist remained at bedside, providing supplementary distraction coaching during times of uncomfortable probe placement. The imaging study took approximately 20-30 minutes to complete. The parent was surveyed about their child’s anxiety and their experience post-echo study.
Results: Distraction using immersive technology was successful in achieving a successful TTE exam in this 2-year-old child without the use of any sedation. During times of extra stimulation or discomfort, we re-engaged her through coaching and introducing a new movie selection to recapture her attention. The parent reported decreased anxiety and expressed satisfaction during this experience as compared to the previous TTE studies.
Conclusion: Transthoracic echocardiograms are non-invasive exams that have the potential to be successfully accomplished without sedation in select young patients. The application of immersive technologies as a distraction technique using the BERT device has been found to

118 119
Back to Table of Contents
obtain satisfactory TTE images by increasing cooperation and decreasing anxiety in these patients. The potential elimination of sedation during these exams have the benefit of decreasing preoperative preparation stress from fasting, decreasing risk of pharmacological adverse effects, while enhancing our patient’s experience and overall satisfaction.
References:
1) Hammer GB, Drover DR, Cao H et al. The effects of dexmedetomidine on cardiac electrophysiology in children. Anesthesia & Analgesia 2008; 106(1): 79-83.
3) Rodriguez S, Caruso T, Tsui B. Bedside Entertainment and Relaxation Theater: size and novelty does matter when using video distraction for perioperative pediatric anxiety. Paediatr Anaesth 2017; 27: 668-9.

120
Back to Table of Contents
Postoperative In-Hospital Mortality Prediction Using Bayesian Neural Networks for Interpretability
Presenting Author: Muntaha Samad, MS Co-Authors: Christine Lee, MS, Ira Hofer, MD, Pierre Baldi, PhD, Maxime Cannesson, MD, PhD Introduction: Lee et al. recently showed that deep neural networks (DNNs) can predict postoperative in-hospital mortality with an AUC of 0.91.1 The non-linearity of DNNs makes them powerful machine learning models, however they lack interpretability. DNNs effectively function as a black box, making it very difficult to determine how much each feature contributes to predictions and how confident the network is in each prediction. In healthcare applications, it is vital that models be interpretable in order to help clinicians make and clearly justify real-time decisions. To address this need, Overweg et al. showed that bayesian neural networks (BNNs) can be used to make predictions on clinical data (collected from the intensive care unit) with a high accuracy, while also being interpretable for clinicians.2 In this study, we apply similar concepts and create a BNN to predict the risk of postoperative in-hospital mortality. Using this BNN allows us to visualize the contribution of each feature to predictions and to evaluate the uncertainty of each prediction. Method: The dataset used in this experiment came from the UCLA Medical Center with IRB approval and includes all surgical procedures performed since March 17, 2013, excluding cases without general anesthesia, and cases where patients were >89 or < 18 years of age. The dataset includes 59,985 patients with 53 features such as: demographics, intraoperative vital signs, medication administration, anesthesia events, and type of surgery. Missing data was imputed using the mode for categorical features and using the mean for all other features. The data was then normalized and split using 80% for training and 20% for testing. This dataset is highly imbalanced, with the percent occurrence of mortality being less than 1% in the training set. To address this imbalance, we used the Synthetic Minority Over-Sampling Technique (SMOTE) to augment the mortality occurences to be approximately 50% in the training set.3 The test set was not augmented. Results/Conclusion: The 5 fold cross validation AUC for our BNN is 0.809 +/- 0.015. The BNN used in this experiment has 4 hidden layers and 100 neurons per layer. The first layer uses a sparsity inducing horseshoe prior and the subsequent layers use a gaussian prior. The network is designed so that weights connected to a single input feature all share the same prior which allows the network to suppress or promote all weights connected to a single feature and therefore suppress or promote the contribution of each feature to the prediction. By looking at the weights in the first layer connected to each input feature we are able to determine each feature’s contribution to the prediction. The figure shows the top 10 contributing features with the highest impact on predictions. We can see that total transfused red blood cells has the highest contribution to outcome prediction. An inherent property of BNNs is that all parameters and predictions are distributions rather than point estimates. By looking at the distribution of each prediction, we are also able to evaluate its uncertainty and provide clinicians with an even clearer understanding of predictions. The next steps for this experiment would be to further improve the AUC by fine tuning the model architecture and hyperparameters.

120 121
Back to Table of Contents
References: 1. Lee, C. K., Hofer, I., Gabel, E., Baldi, P., & Cannesson, M. (2018). Development and validation of a deep neural network model for prediction of postoperative in-hospital mortality. Anesthesiology: The Journal of the American Society of Anesthesiologists, 129(4), 649-662. 2. Anna-Lena Popkes, Hiske Overweg, Ari Ercole, Yingzhen Li, Jos´e Miguel Hern´andez-Lobato, Yordan Zaykov, and Cheng Zhang. Interpretable outcome prediction with sparse Bayesian neural networks in intensive care. arXiv preprint arXiv:1905.02599, 2019. 3. N. V. Chawla, K. W. Bowyer, L. O. Hall, and W. P. Kegelmeyer, “SMOTE: Synthetic minority over-sampling technique,” J. Artif. Intell. Res., vol. 16, pp. 321–357, 2002.

122
Back to Table of Contents
A Novel Method of Low Cost Capnometry Presenting Author: Allan B. Shang, MD, MSE. Assistant Adjunct Professor, Department of Biomedical Engineering, Duke University. Co-Authors: Keita Ikeda, PhD. Principal Scientist, Department of Anesthesiology, University of Virginia. Eugene W. Moretti, MD. Professor, Department of Anesthesiology, Duke University. The use of ventilation monitoring using end tidal carbon dioxide (CO2) has expanded considerably since the publication of the first set of anesthesia monitoring guidelines in 19861. Since that time, disciplines outside of anesthesia continue to explore and recognize the value of CO2 monitoring during procedural sedation and narcotic administration2 – 4. However, the cost, complexity and fragility of the current infrared (IR) based CO2 monitors has slowed their widespread implementation outside of the operating room. We describe a novel CO2 monitoring technology in a patented5, FDA approved platform6 that could greatly expand the use of CO2 monitoring. Colorimetric end tidal CO2 detection technology employed in the new device relies on pH-sensitive color change of indicator dyes embedded within the detector. Carbon dioxide is absorbed within a matrix exposed to the respiratory stream, causing a transient drop in pH via formation of carbonic acid. During inhalation, the carbonic acid is rapidly neutralized by alkaline components within the matrix. The pH sensitive indicator thereby cycles between two distinct colors representing the extremes of the breath by breath excursions in pH. The color change is followed via reflectometry using embedded LEDs and color-selective photodiodes sampling every 25 msec. The sensor chemistry is optimized such that the amplitude of color excursions can be quantitatively calibrated to end tidal CO2. As part of the required FDA bench testing, the new device was tested against a Nellcor N-85® infrared capnograph using a series of tests referenced from ANSI/AAMI/ES 60601-1, IEC 60601-1-2, and ISO 80601-2-556. Sensor cartridges were stored at temperatures of either 5°C, 24°C, and 38°C for up to 180 days before being exposed to increasing levels of CO2 at different simulated respiratory rates. The experimental readings were then compared against simultaneous measurements from the N-85® and then compared against prescribed performance standards, as per ISO 80601-2-55. Bland Altman analysis of this data is illustrated in Figure 1. The pass rate of the test device and all tested cartridges was 100% out to eight hours of continuous exposure. The new, novel capnometric device is accurate, robust, and portable. It is also much less expensive to manufacture than the corresponding IR technology. However, it does have its limitations. The chemical reaction is not as rapid as IR detection, and therefore, it can not produce the same sort of capnographic waveforms. There is a warmup time that averages just over 30 seconds. It does use a disposable sensor cartridge, but the cartridge will be RFID protected as to prevent protracted use above the certified accurate continuous 8 hours. It measures 5.75” L x 3.75” W x 1.25” H, weighs slightly less than 8 ounces and is expected to retail for a tenth of the list price of the N-85®. The size and lower cost of the novel device would allow for expansion of CO2 monitoring into a myriad of non-operating room locations, such as the post anesthesia care unit and other areas in the hospital where sedatives and/or narcotics are administered. Other potential areas of use are in dentistry, free standing clinics, sports medicine, military applications, developing world medicine, and even veterinary medicine. Having the ability to expand the use of CO2 monitoring so that it is ubiquitous and pervasive in any location where ventilation can be monitored can provide an extra layer of patient safety.

122 123
Back to Table of Contents
1) Eichhorn J.H, Cooper J.B, Cullen D.J, et al. Standards for patient monitoring during anesthesia at Harvard Medical School. JAMA. 1986;256:1017–1020. 2) Patel S, Vargo JJ, Khandwala F, et al. Deep sedation occurs frequently during elective endoscopy with meperidine and midazolam. Am J Gastroenterol 2005;100:2689-2695. 3) Becker D. E, Casabianca A.B. Respiratory Monitoring: Physiological and Technical Considerations. Anesthesia Progress: Spring 2009, Vol. 56, No. 1, pp. 14-22. 4) Lightdale J.R, Goldmann D.A, Microstream capnography improves patient monitoring during moderate sedation: a randomized, controlled trial. Pediatrics. 2006 Jun;117(6): e1170-8. 5) Moretti E.W, Wood R.L, Shang, A. B, et al. Methods, devices, systems, and compositions for detecting gases. U.S. Patent 10,393,666, Issued August 27, 2019. 6) FDA Submission, 510(k). Premarket Notification. Approved January 4, 2018.

124
Back to Table of Contents
Optimization of Perioperative Communication and Turnover Within the Operating Room Presenting Author: Zakariah K Siyaji, BS Co-authors: Fayyazul Hassan, BA; Mahnoor Baig, BS; Hokuto Nishioka, MD; Introduction: Effectively reducing the turn-over-time (TOT) between operating room (OR) cases requires the development of software to address potential miscommunication between surgical staff and ancillary services. Furthermore, the accessibility of this software should include modalities beyond traditional access which could extract attention away from the patient care (eg. computers, tablets, and phones). Therefore, a voice activated dictation system offers a solution which allows surgical staff to offer verbal requests that can be fulfilled through an automated system. Methods: A software application modeling a digital rendition of a magnetic whiteboard was developed using the Angular frontend software framework. The Anesthesia Management Tool displays employee status in the OR, lunch and break notifiers, the daily board runners, and call order for attendings and residents. Data management was handled using Google’s HIPAA compliant real-time database, Firestore, for response times of mere milliseconds. Furthermore, the voice activated module was developed using Google’s Machine Learning model, DialogueFlow, and integrated with the software using Google Assistant for dictation through the Google Home Mini. The voice activated system offers full system database calls such as pager requests to attendings, staff updates, janitorial queue updates, and turn over delays. Results: The voice activated system can address requests for turnover by notifying anesthesia technician and environmental teams of near case completion. All database responses and updates can be accessed verbally and visually through the Anesthesia Management Tool. An example request such as “Ok, Google: 10 minutes to close,” triggers a database response which updates the teams of the OR’s surgical status and their subsequent cleanup and turnover queue for effective priority of TOT when addressing multiple operating rooms. Other requests such as “Ok, Google: page Dr. Doe to OR 1” serves as a seamless method of informing the paged attending of the status of the operation while maintaining focus, directed towards the patient. A reduction in auxiliary distractions for anesthesia providers should optimize perioperative care. Furthermore, a formalized queue with software push notifications and reminders for the anesthesia technicians and environmental services will maximize efficiency, significantly reducing TOT by estimates of 10 - 15 minutes. Conclusions: Current modalities of communication suffer due to a lack of organization while a software platform tailored to the needs of the OR stratify an ecosystem where patient care, TOT, and efficiency are optimized. The Anesthesia Management Tool paired with the Google Home Mini offers communication between operating rooms without the need for direct communication between staff. Automation of repetitive commands serve as checkpoints that can be handled by machine learning algorithms. Ultimately, more development is required to connect voice activated responses to an electronic medical record (EMR) system for complete end-to-end data efficiency and distraction-free patient care. Finally, further audits of the TOT analysis will be needed to examine the overall value of our novel system.

124 125
Back to Table of Contents
Remote Observation of Delayed Onset Malignant Hyperthermia: A Case Report Presenting Author: Stuart Solomon, MD (Stanford University) Co-authors: David Trauscht, MD; Rajeev Saxena, MD MBA; Christine Fong, MS; John D Lang, MD; Bala G Nair, PhD MS (University of Washington) Case Report: A 64-year-old man with prior anesthetics and no eventful history was scheduled for resection of a left parotid mass and free flap. Induction was at 07:45 with midazolam, propofol, sufentanil and succinylcholine. The patient was intubated, and anesthesia was maintained with isoflurane, sufentanil infusion and rocuronium. The case proceeded uneventfully with a gradual hypercarbia (ETCO2 40-45mmHg) that was corrected with increases in ventilation. At approximately 19:30, or 12 hours after the case began, the ETCO2 was noted to be 67mmHg, then quickly rose to 88mmHg with worsening acidosis, hyperkalemia to 6.8, concurrent rise in temperature (Tmax 40.5° C), and tachycardia. A diagnosis of MH was established by the anesthesia team in the operating room and appropriately treated with dantrolene and supportive measures. The patient made a successful recovery and was discharged from the hospital on postoperative day eight. Remote Surveillance: We were coincidentally testing a remote vital sign surveillance system via our Operating Room Business Intelligence Software (ORBIS, University of Washington) at the time of this case. This system presents operating room data such as case location, start time and case duration in a grid-based dashboard. Vital sign data is processed from a central data storage platform (Amalga, Microsoft) obtained from our anesthesia information management system. Icon notifications were created for specific vital sign thresholds such as tachycardia, hypoxemia and hypercarbia. When a patient meets a criterion for a certain vital sign threshold, the notification icon is displayed on the grid corresponding to that case, which can then be clicked on to reveal additional vital sign data and case information (Figure 1). This system is updated in near real-time (approximately every 5 minutes). The aforementioned case of MH displayed the icon notifications for hypercarbia, hyperthermia and tachycardia. The on-call anesthesiologist was contacted due to the observed abnormal vital signs and concern for MH, who communicated that the diagnosis had already been made and was actively being treated at that time. Discussion: Malignant hyperthermia (MH) is a rare hypermetabolic disorder associated with exposure to volatile anesthetics and succinylcholine, and may present with delayed onset to exposure to these agents. Early detection, diagnosis, and treatment with dantrolene is paramount to avoiding a poor outcome. This case represents the potential for remote anesthesia surveillance systems to provide global insight to intraoperative changes and to aid in the recognition and diagnosis of anesthetic emergencies such as MH. Further research is needed to understand how human factors, software design and clinician behavior may impact implementation and effectiveness.

126
Back to Table of Contents
Figure 1: Remote surveillance dashboard depicting operating room times, case status and abnormal vital signs.

126 127
Back to Table of Contents
The Impact of Real-Time Clinical Alerts on the Compliance of Anesthesia Documentation: A Retrospective Observational Study
Presenting Author: Luis E Tollinche, MD, Memorial Sloan Kettering Cancer Center Department of Anesthesiology and Critical Care Medicine Co-Authors: Richard Shi, BS; Margaret Hannum, MS; Patrick McCormick, MD; Alisa Thorne, MD; Kay See Tan, PhD; Gloria Yang, BA; Meghana Mehta, M. Eng; Cindy Yeoh, MD Introduction: Clinical alert systems have been used to analyze deviations from hospital standards in the electronic medical record to identify missing documentations and send alerts to the appropriate providers to increase adherence to required elements. To improve compliance, an alert system for documentation of the Immediate Preoperative Assessment was implemented at our institution in August 2018 with the goal of improving documentation compliance rates. We hypothesized that implementation of this alert system would increase the compliance of on-time documentation of the IPOA. Methods: An initial data query in our institutional data warehouse was made for all patients who had a completed anesthetic during our study period. This date range corresponded to 6 months before and after August 2nd, 2018, the date when the IPOA alert was implemented and the anesthesiology department. The following analyses were performed: testing the proportion of cases compliant with on-time documentation of the IPOA pre- versus post-implementation for the full cohort and among subsets of interest, testing the time when the IPOA was completed relative to anesthesia end, and testing whether time of day of when surgery occurred had an impact on the time when the IPOA was completed relative to the drapes off/IPOA alert sent time. The proportion of compliance for pre- versus post-implementation was tested by Chi-square test. Results: Through retrospective chart review of electronic patient records, 47,417 cases matched our inclusion criteria of patients that had a completed anesthetic between February 2nd, 2018 to February 2nd, 2019. In total, we excluded 5132 cases. The compliance rate of IPOA completion increased from 76% to 88% (P < 0.001) before and after the alert implementation date. In the initial month following alert implementation, the compliance rate immediately increased to 83% and stayed in the high 80’s for the balance of the study period. Conclusion: In summary, we demonstrate that automated Clinical Alert Systems operating via a single page notification can improve the compliance rate for documentation of key anesthesia events and that this observation is sustained six months after the implementation date. Furthermore, improvement in compliance is highest shorter cases and cases that occur early in the day. This study shows promising results in the use of automatic CAS system alerts to help hospitals meet TJC and CMS standards.

128
Back to Table of Contents
Tracking Intravascular Volume Using Frequency Analysis of Plethysmographic Waveforms
Presenting Author: Kim Tran, Frank H. Netter MD School of Medicine at Quinnipiac University Co-authors: Anna-Maria Eid MD, Ahmad Ibrahim MD, Kirk Shelley MD PhD, Aymen Alian MD, Yale University School of Medicine, New Haven, CT
Background: Pediatric spinal fusion surgery offers a unique metric for the study of hemodynamic and resuscitation status monitoring in children given the procedure’s substantial blood loss (1). Previous studies have reported the utility of frequency domain analysis of plethysmographic (PPG) and arterial waveforms in children undergoing spinal fusion surgery (2). Frequency domain analysis was chosen as it is less prone to artifact than time domain analysis, and due to findings, that time domain analysis of dynamic measures, such as stroke volume in children is less reliable than in adults given their higher vascular compliance (3). The present study was undertaken to compare the frequency domain analysis of PPG and arterial waveforms before and after resuscitation against mean arterial pressure (MAP) and heart rate (HR) in children undergoing spinal fusion.
Methods: With IRB approval, 32 children undergoing spinal fusion were studied. EKG, blood pressure, invasive arterial pressure, finger pulse oximeter (finger PPG) and airway pressure were recorded at 100 Hz with a data acquisition system (Collect 5/S, GE) and analyzed using frequency analysis (spectrum, 4K, Hamming, Amplitude density) with LabChart 7 (ADInstruments). Amplitude density (AD) at the respiratory frequency yielded PPG DC and PPG AC values. Normalizing this against an internal control of the AD at cardiac frequency yielded PPG DC% and PPG AC% values to allow comparison between patients. The same was done for arterial pressure waveforms (Figure 1A). Data were analyzed before resuscitation and after resuscitation (fluid, blood, or albumin) with some patients yielding multiple data points. A total of 79 data points was obtained. Normality was checked using Shapiro-Wilk (p<0.05). We either used paired t-test or Wilcoxon signed-rank test for parametric or non-parametric, respectively. Statistical analyses were conducted using SPSS version 26.
Results: PPG DC %, PPG AC %, arterial DC % and arterial AC % showed significant reduction after resuscitation compared to HR and MAP. PPG DC % and PPG AC % percent changes were greater than arterial DC % and arterial AC %. PPG DC %, PPG AC %, arterial DC %, and arterial AC % reached statistical significance. (Figure 1B)
Discussion: Adequate resuscitation is an elusive goal with a fine line between end organ hypoperfusion and pulmonary edema. Significant change in frequency domain analysis for both PPG and arterial waveforms were seen compared to HR and MAP after resuscitation with a lesser change in the arterial waveform than PPG, which may reflect the high arterial compliance in children. As PPG is a noninvasive monitor, frequency domain analysis of PPG offers an alternative tool to arterial waveform monitoring and hemodynamic parameters in tracking intravascular volume changes to guide fluid therapy and resuscitation.

128 129
Back to Table of Contents
Figure 1: A) Frequency analysis of arterial and PPG waveforms. B) Percent change in HR, MAP, PPG DC%, PPG AC%, Arterial DC% and Arterial AC% before and after resuscitation. *statistical significance (p < 0.05)
References: 1) Spine 2014;39:1479–87. 2) Anesth Analg. 2016;123(2):346–356. 3) Anesth Analg 2013;117:1380–92.

130
Back to Table of Contents
Tracking Intravascular Volume Using Frequency Analysis of Peripheral Venous Pressure Waveforms
Presenting Author: Kim Tran, Frank H. Netter MD School of Medicine at Quinnipiac University Co-authors: Anna-Maria Eid MD, Ahmad Ibrahim MD, Kirk Shelley MD PhD, Aymen Alian MD, Yale University School of Medicine, New Haven, CT
Background: Mean arterial pressure (MAP) and central venous pressure (CVP) are both commonly used parameters in guiding fluid resuscitation. Central venous pressure measurement however, is invasive to monitor and not possible in every situation. Peripheral venous pressures are easy to obtain in ubiquitous peripheral IV lines. In this study, we investigate the use of peripheral venous pressure (PVP) as a less invasive alternative to CVP. Prior studies have shown a strong correlation between PVP and CVP during the intraoperative period (1). The aim of this study is to compare changes in MAP and PVP waveform utilizing frequency analysis, prior and after resuscitation during pediatric spinal fusion surgery for scoliosis, a procedure with substantial blood loss requiring resuscitation (2). Frequency domain analysis of PVP was chosen as it is less prone to artifact than time domain analysis (3).
Methods: With IRB approval, 32 children undergoing spinal fusion were studied. EKG, blood pressure, invasive arterial pressure, peripheral venous pressure, and airway pressure were recorded at 100 Hz with a data acquisition system (Collect 5/S, GE) and analyzed using frequency analysis (spectrum, 4K, Hamming, Amplitude density) with LabChart 7 (ADInstruments). Amplitude density of the graph at the respiratory frequency is defined as the PVP DC value. Normalizing this against an internal control of the amplitude density at the cardiac frequency yielded the PVP DC% values to allow comparison between patients (figure 1a). Mean PVP was obtained from the peripheral venous pressure waveform. Data were analyzed before resuscitation and after resuscitation (fluid, blood, or albumin) with some patients yielding multiple data points. A total of 47 data points was obtained. Normality was checked using Shapiro-Wilk (p<0.05). Paired t-test or Wilcoxon signed-rank test was used for parametric or non-parametric data, respectively. Statistical analyses were conducted using SPSS version 26.
Results: Resuscitation was associated with a greater change in PVP DC %, than MAP. PVP DC % reached statistical significance. (figure 1b-c)
Discussion: Frequency domain analysis of PVP waveforms showed a greater change after fluid resuscitation as compared to MAP, suggesting its potential use for fluid therapy and resuscitation.

130 131
Back to Table of Contents
Figure 1: A) Frequency analysis of PVP waveform. B-C) Percent change in MAP, PVP DC%, and Mean PVP before and after resuscitation. *statistical significance (p < 0.05)
References: 1. J Cardiothorac Vasc Anesth. 2001;15-40-43. 2. Spine 2014;39:1479–87. 3. Anesth Analg 2013;117:1380–92.

132
Back to Table of Contents
Use of Provider Education, Intra-Operative Decision Support, and an Email-Feedback System in Reducing the Overuse of Sugammadex: A Quality Improvement Effort
Presenting Author: Jonathan P. Wanderer, MD, MPhil, Vanderbilt University Medical Center Co-Authors: Andrew M. Pregnall, Vanderbilt University Medical Center; Rajnish K. Gupta, MD, Vanderbilt University Medical Center Background: Although sugammadex has many clinical benefits compared to neostigmine in reversing deep muscular blockade, it is expensive. Our academic medical center sought to reduce its sugammadex expenditures by decreasing the number of cases requiring high-dose sugammadex (>200 mg). We implemented dosing guidelines calculated with adjusted body weight and developed informatics-based tools to encourage provider adoption of these guidelines. Methods: In November 2018, we educated our anesthesia providers on our new adjusted body weight-based dosing guidelines. In addition, we provided them with intra-operative decision support which displayed a patient’s actual and adjusted body weights as well as a dashboard which monitored their own rates of high-dose sugammadex administration. In April 2019, we implemented an email-feedback system which reminded providers of the new guidelines. We assessed rates of high-dose sugammadex administration in three phases: Pre-intervention (May 2018 to November 2018); First Intervention (November 2018 to April 2019); and Second Intervention (April 2019 to July 2019). Results: The mean rate of high-dose sugammadex during the pre-intervention phase was 12.88% compared to 4.54% in the first-intervention phase and 3.18% in the second-intervention phase. Segmented regression analysis (see Figure 1) demonstrated a significant level change — β2 — of -3.51% (95% CI: -5.64%, -1.38%; P = .002) after provider education and the implementation of our digital improvement initiatives. Segmented regression analysis did not reveal an additional significant trend reduction — β3 — after the First Intervention, but it revealed no rebound effect either. Furthermore, our analysis did not reveal significant level or trend changes — β4 and β5, respectively — after our implementation of an email-feedback system, but we hypothesize this system contributed to maintaining sustained low rates of high-dose sugammadex administration. Overall, our interventions yielded an absolute savings of $23,631 per month and a relative savings of 68.7% per month. Conclusion: Provider education and digital quality improvement efforts were effective in reducing the rate of high-dose sugammadex administration, maintaining this reduced rate over time, and generating real cost savings at a large academic medical institution. (Figure 1 is on next page)

132 133
Back to Table of Contents
Figure 1: Results from segmented regression analysis

134
Back to Table of Contents
An Analysis of Publication Trends in Anesthesiology-specific Journals Using Latent Dirichlet Allocation Natural Language Processing
Presenting Author: Ryan Wang, MD
Co-authors: Yiftach Barash MD MSc, Eyal Klang MD, Matthew A Levin, MD Intro: Analysis of research trends can provide insight into the interests of a specialty. Yet, the large number of publications makes it infeasible to summarize trends manually. Latent Dirichlet allocation (LDA) is a state-of-the-art topic modeling algorithm. This algorithm can be applied to identify trends in a research field. We aimed to quantify trends in publications across all anesthesiology-specific journals using LDA. Methods: The entire PubMed database was downloaded on December 21, 2018. We included publications in journals categorized by Scimago as “anesthesiology and pain medicine”. Article meta-data and abstracts were then analyzed. The paper country of origin was determined based on the affiliation of the first author. Using the LDA algorithm, 200 sets of topic words were identified from the abstracts. The topics were then manually assigned to 30 research subjects. These subjects correspond to chapter titles from two prominent textbooks. More than one subject could be assigned if relevant. Results: 138,640 articles were identified as published between 1975-2018. There has been growth in both the numbers of publications and specialty-specific journals. From 647 articles in 13 journals in 1975 to 4124 articles in 60 journals in 2018. The top five countries publishing in anesthesiology journals in 2018 were the United States (26%), China (9%), India (8%), Germany (6%), and the United Kingdom (6%). In contrast, the United States contributed 35% of publications in 1990. Basic science and pain management have remained prominent subject areas of research. Quality improvement and perioperative medicine showed growth in representation in the anesthesiology literature. Neuromuscular blockade, inhalational anesthetics, and mechanical ventilation were less featured over time (Figure 1). Conclusions: In the anesthesiology literature, there has been an increase in geographical diversity and the number of publications. This mirrors trends seen in medicine as a whole. The growth in perioperative medicine and quality improvement publications corresponds with growth in fellowships and emphasis in the Accreditation Council for Graduate Medical Education curricula. This analysis of anesthesiology publications provides context for growth in the specialty, as well as practice trends and shifts in research interests.

134 135
Back to Table of Contents
Figure 1. Normalized number of publications per subject by 10 year blocks References: 1. Blei DM, Ng AY, Jordan MI. Latent Dirichlet Allocation. J Mach Learn Res. 2003;3:993-
1022. 2. Journal Rankings on Anesthesiology and Pain Medicine.
https://www.scimagojr.com/journalrank.php?area=2700&category=2703. Published 2019. Accessed October 30, 2019.
3. Pardo M, Miller R, eds. Basics of Anesthesia. 7th ed. Philadelphia, PA: Elsevier; 2018. 4. Butterworth IV J, Mackey D, Wasnick J, eds. Morgan & Mikhail’s Clinical Anesthesiology.
6th ed. New York, NY: McGraw-Hill; 2013. 5. Peccora C, Hsu R, Yazdi CA, Shanahan J, Desai SP. Publishing Trends in Two American
Journals in Anesthesiology — Results of an 80-Year Geographical Survey. JANH. 2016;2(1):6-12. doi:10.1016/j.janh.2015.10.010
6. Stossel TP, Stossel SC. Declining American representation in leading clinical-research journals. N Engl J Med. 1990;322(11):739-742.
7. Nahrwold DL, Pereira SG, Dupuis J. United States Research Published in Major Surgical Journals Is Decreasing. Ann Surg. 1995;222(3):263-266.
8. Gharapetian A, Chung F. Perioperative fellowship curricula in anesthesiology: a systematic review. 2015:403-412. doi:10.1007/s12630-014-0299-2
9. Schumacher DJ, Frohna JG. Patient safety and quality improvement: a “CLER” to move beyond peripheral participation. Med Educ Online. 2016;21:31993.

136
Back to Table of Contents
Developing a Decision Support System to Detect and Enhance the Response to Clinical Deterioration in Patients Receiving Outpatient Care for Cancer
Presenting Author: Matthew B. Weinger, MD Co-authors: Daniel France, PhD, Jason Slagle, PhD, Shilo Anders, PhD, Carrie Reale, RN, Russ Beebe, Akhil Choudhary, Robert Freundlich, MD, Adam Wright, PhD, Laurie Novak, PhD, Kim Unertl, PhD, Ralph Conwill, Barbara Yudiskas, Timothy Newman, Bishop Rhodes, Tim Vogus, Laine Stiles, Terrell Smith, Vanderbilt University Medical Center, Xiaoge Zhang, PhD, Sankaran Mahadevan, PhD, Vanderbilt University School of Engineering. Introduction: A common cause of preventable harm is the failure to promptly detect and properly respond to clinical deterioration. Although inpatients are more likely experience deterioration, occurrence in outpatients is more challenging because detection processes rely primarily on the patients and their families and the response arm is much less robust. Ambulatory patients recovering from an acute event (e.g., surgery, illness), or those undergoing potentially hazardous treatments (e.g., chemotherapy) are at the highest risk for clinical deterioration. The primary objective is to create, refine, deploy and evaluate software tools and an artificial intelligence (AI) predictive model to support a reliable surveillance-and-response system to prevent harm from unexpected all-cause clinical deterioration in outpatients receiving cancer treatment. Figure. The elements of the planned surveillance component include real-time passive data capture, at-will active patient reporting of non-routine events (NREs), weekly patient self-reported outcome variables (PROMs). These data feed into the AI model which will drive the response arm. Patient deterioration in outpatient cancer care in this study is operationalized as Unplanned Treatment Events (UTEs) extracted from the EHR.
Methods: We are starting the second year of a 4- to 5-year project. The patient data from our first study (planned enrollment of 60 patients, each studied for 6-8 weeks) will be used to create the AI model. A second study’s data (2020-1) will be used to validate the AI model while a third study (2021-2) will evaluate the fully integrated system (including the response arm). Active Surveillance: We developed and pilot tested user-friendly mobile apps to collect patient-reported NREs and PROMs as well as a REDCap database for patient demographic and other study variables. We also developed processes to assure that patients enter the required weekly data. Passive Surveillance: We developed processes to capture, via a Fitbit Charge wrist activity monitor, real-time patient data including heart rate, steps, and sleep parameters. We are using the Google Maps app to capture geolocation data. All of these data are downloaded on a weekly basis. Response Arm: We have begun to consider how best to deliver the results of the predictive AI model to responsible clinicians. This involves not only determining what to say (e.g., “Mr. Jones has a 83% probability of an unplanned treatment event in the coming week. Do you want to text him?”) but who to send this to and the technical capabilities and logistics to do so. Patient Engagement: A critical determinant of success will be to engage patients and family members enrolled the study. We have developed several methods to elicit patient input Results: As of November 1, 2019, we have enrolled in the first study nine head-and-neck cancer patients receiving outpatient chemo- or radiation therapy. We have successfully captured FitBit data

136 137
Back to Table of Contents
from all patients and 16 patient/family reported NREs have been reported from 6 patients (range 1-5/patient). There have been two UTEs in two different patients. Enrollment is ongoing. Conclusions: In this complex study, we have created innovative methods and tools to capture rich data from cancer outpatients that can be used as inputs to predictive AI models. We will present some of the challenges we have overcome as well as our preliminary results.

138
Back to Table of Contents
Development of an Anesthesia Information Virtual Assistant Presenting Author: Albert Woo MD, Beth Israel Deaconess Medical Center Co-author: Adeel Faruki MD, Beth Israel Deaconess Medical Center. Introduction: Virtual assistants are becoming an integrated part of many people’s daily life. An intelligent virtual assistant is a software agent that can perform tasks or services for an individual based on verbal commands or questions. Virtual assistants utilize artificial intelligence, machine learning, speech recognition and natural language processing technologies and connect them with knowledge banks to provide information that are useful to the end user. We have developed a proof-of-concept prototype to serve the role of a anesthesia information virtual assistant. Methods: An initial proof-of-concept prototype was created on a hardware device platform currently available on the commercial market (Amazon Echo). We created an information system application to retrieve information from our knowledge bank. This system also provides response to incoming request submitted by the end user. The knowledge bank is an expanding dataset which includes information that are regularly updated and difficult to recall for an individual. Examples of such data include the recommendations for treating malignant hyperthermia, the ASA difficult airway algorithm, and other guidelines for numerous patient conditions. Speech recognition and natural language processing are handled by a cloud-based service interface provided by the hardware device manufacturer. We use a developer console to configure the interaction model and direct the information to communicate with our knowledge bank application. Responses to end user requests are transformed into human speech by using a speech synthesis engine native to the hardware device. Images can also be displayed based on the resulting content. Results: Our proof-of-concept hardware device was successful in demonstrating a usable prototype by integrating a commercially available virtual assistant hardware with that of an anesthesia knowledge bank. Under ideal condition, the accuracy of the system exceeds 92%. Conclusion/Discussion: We anticipate our prototype can be used as a teaching tool in learning about knowledge bank and virtual assistants. Future development may include integration with the hospital’s electronic health information and the capability to retrieve patient information as well as to perform analyses on patient data. We also believe our method can be adapted for the development of virtual information assistant specific to other medical disciplines. Diagram 1