Sports Tourists’ Satisfaction with the CAN 2008 Continental Sporting Event in Ghana
30
1 SPORTS TOURISTS’ SATISFACTION WITH THE CAN 2008 CONTINENTAL SPORTING EVENT IN GHANA (1) Ishmael Mensah MPhil. (Tourism), CHE., MIH., Lecturer, Department of Hospitality and Tourism Management, University of Cape Coast, Email: [email protected] (corresponding Author) 2) Joseph Abanga MPhil. (Tourism). Lecturer, Department of Hospitality and Tourism Management, University of Cape Coast, Email:[email protected] Abstract Satisfaction is essential for the successful marketing of events, yet most studies on events have been restricted to measuring economic impacts. This study examined sports tourists’ satisfaction with the African Cup of Nations (CAN 2008) tournament in Ghana as well as identifying some of the factors influencing their satisfaction. A total of 428 sports tourists from participating countries were purposively sampled and given questionnaires to self- administer. Secondary data on the performance of the various participating teams was obtained from internet sources. The results of the study suggest that respondents were generally satisfied with the event though they were more satisfied with the sociological aspects of the event. Ticketing, pricing and dissemination of information had the lowest ratings. The study has implications for both the management of future events and for research. Specifically with regards to the issuance of tickets, information and signage, pricing of goods and services as well as research on factors enhancing sports tourists’ satisfaction. Keywords: CAN 2008, Satisfaction, Sports Tourism, Event, Marketing
Transcript of Sports Tourists’ Satisfaction with the CAN 2008 Continental Sporting Event in Ghana
1
SPORTS TOURISTS’ SATISFACTION WITH THE CAN 2008 CONTINENTAL
SPORTING EVENT IN GHANA
(1) Ishmael Mensah MPhil. (Tourism), CHE., MIH., Lecturer, Department of Hospitality
and Tourism Management, University of Cape Coast,
Email: [email protected] (corresponding Author)
2) Joseph Abanga MPhil. (Tourism). Lecturer, Department of Hospitality and Tourism
Management, University of Cape Coast,
Email:[email protected]
Abstract
Satisfaction is essential for the successful marketing of events, yet most studies on events
have been restricted to measuring economic impacts. This study examined sports tourists’
satisfaction with the African Cup of Nations (CAN 2008) tournament in Ghana as well as
identifying some of the factors influencing their satisfaction. A total of 428 sports tourists
from participating countries were purposively sampled and given questionnaires to self-
administer. Secondary data on the performance of the various participating teams was
obtained from internet sources. The results of the study suggest that respondents were
generally satisfied with the event though they were more satisfied with the sociological
aspects of the event. Ticketing, pricing and dissemination of information had the lowest
ratings. The study has implications for both the management of future events and for
research. Specifically with regards to the issuance of tickets, information and signage,
pricing of goods and services as well as research on factors enhancing sports tourists’
satisfaction.
Keywords: CAN 2008, Satisfaction, Sports Tourism, Event, Marketing
2
1.1 Introduction
Governments of most tourist destinations have recognised the importance
of sports as a tourism endeavour and are aggressively promoting sports tourism. As a
result, the right to host mega events like the Olympic Games and FIFA World Cup is
preceded by intense lobbying and bidding. A 1994 European Commission Report on the
European Community and Sport estimated that the sports industry is responsible for 2.5
percent of world trade (Commonwealth Australia, 2000). Also, growth rates for the sport
tourism industry are estimated at about 10 percent per annum (Hudson, 2003).
The government of Ghana has invested substantially into the successful hosting of
the African Cup of Nations (CAN). Modern stadia were built in Takoradi and Tamale
whilst the ones in Accra and Kumasi have been renovated, all at the cost of over $200
million. This placed enormous responsibility on the Local Organizing Committee (LOC)
to stage the event successfully in order to justify the huge financial investments. But the
success of the event also depends on the satisfaction to be derived by the attendees.
Glyptis (1991) believes the expanding market and opportunities in tourism and
sport businesses are indications of the need for studies on sports tourism. However, most
studies on sports tourism have focused on the economic impacts (Ritchie and Smith,
1991; Brunet, 1996; Dobson et al, 1997 and Gratton et al, 2000). Indeed most
governments and local authorities commit substantial resources to the staging of events
because of the anticipated economic benefits as asserted by McMahon-Beattie and
Yeoman, (2004:188). According to these researchers, “The economic impact of major
sports events is of critical importance when it comes to justifying the investments made”.
The overemphasis on economic impacts has the tendency of compromising the quality of
3
such events. However, for sports tourists to continue attending subsequent events at the
destinations, they have to be satisfied with previous events. This study therefore aims at
examining sports tourists’ satisfaction with the CAN 2008 sporting event. It also looks at
the factors influencing sports tourists’ satisfaction with the event.
1.2 Literature Review
Satisfaction is viewed generally as a post-purchase comparison of perceived
performance of a product with expectations (Herrmann et al, 2000; Lovelock et al, 2001).
It has also been described as an evaluative, affective or emotional response to a
consumptive experience (Shonk, 2006). However, Tse and Wilton (1988) are of the view
that consumer dissatisfaction is only a function of the actual performance, irrespective of
consumers’ expectations. This is because consumers evaluate each transaction on its own
terms without using their expectations as a reference point.
Satisfaction, which has been closely linked with value (Hollowell, 1996; Woodall,
2003), has also been defined severally. Fornell (1992) describes it as an overall
evaluation of a purchase. It is a judgement that a product or service feature, or the
product or service itself, provides a pleasurable level of consumption-related fulfilment”
(Oliver, 1997:13). It has also been described as the psychological outcome of
experiencing the service (MacKay and Crompton, 1990). There have also been attempts
to distinguish between satisfaction with the consumption of goods and the consumption
of services, because of the role of the consumer in the latter (Lovelock, 1991). Moreover,
measuring tourists’ satisfaction with a destination (which is the case of the CAN 2008
event), is conceptually different from measuring satisfaction at the transaction specific
4
level (Foster, 1997). This is because the destination is an amalgam of services, facilities,
products and infrastructure which must be effectively combined to meet the needs of the
tourist.
Satisfaction has generally been viewed on two levels; transaction-specific level
and cumulative level (Johnson et al., 1995). The cumulative satisfaction is seen as the
sum of the relative importance and the level of satisfaction experienced on all the single
attributes (Ajzen and Fishbein, 1980). The cumulative satisfaction method is suitable for
a study of a special event like the CAN 2008 because tourists’ satisfaction is not based on
a single expenditure item but a combination of the football matches, accommodation,
transportation, entertainment, social interactions, food and other ancillary services such
as ticketing and information dissemination.
Tourist satisfaction is important to the successful marketing of tourist products
(Crompton and Mackay, 1997; Kozak & Rimmington, 2000). This is because it leads to
customer loyalty (Fornell 1992; Musa et al, 2004). It also results in increased positive
word-of-mouth, increased market share and increased profits (Fornell, 1992; Anderson
and Sullivan, 1993; Kotler, 1994).
Some conceptual frameworks have been proposed to explain tourist satisfaction
and these include expectation/disconfirmation (Francken & Van Raaij, 1981; Chon,
1989), equity (Fisk & Young, 1985; Oliver & Swan, 1989), norm (Cadotte, Woodruff, &
Jenkins, 1987), and perceived overall performance (Tse & Wilton, 1988, Yoon and
Uysal, 2005). In addition, Pizam and Ellis (1999) in their review of the literature
identified other theories on satisfaction. These are assimilation of cognitive dissonance,
contrast, assimilation-contrast, attribution, comparison-level, generalized negativity and
5
value-precept. According to the expectation/disconfirmation models, consumers have
expectations about a product which they compare with actual performance. There is
positive disconfirmation if the actual performance is better than their expectations and
negative disconfirmation if the actual performance is worse than expectations. The
equity models suggest that people are motivated when the costs of acquiring an
experience equal the benefits to be derived. The perceived overall performance looks at
the actual performance of a product or service without reference to consumers’
expectations or their past experiences. This model is useful when tourists do not know
about the situation at the destination such as in the case of the CAN tournament which is
rotated among African countries every two years and no particular country hosts it two
times in succession. This study therefore measures the perceived overall performance of
the CAN 2008 event at the cumulative satisfaction level.
Though numerous studies have been done on customer’s satisfaction, little work
has been done on customer satisfaction in the context of sports tourism. Mullins (1985)
identified club identification and the win/lose phenomenon as two constructs that
influence the satisfaction of sport fans. Madrigal (1995) tested a model of the cognitive
and affective determinants of fan satisfaction with sport events. The model’s cognitive
variables were team identification, quality of opponent and expectancy disconfirmation
whilst the affective variables were basking in reflected glory and enjoyment. These
studies were however undertaken in the realm of sports psychology and marketing rather
than sports tourism.
Wakefield and Blodgett (1994) on the other hand examined the effects of sport
facility, perceived crowding, excitement and enduring involvement on customer
6
satisfaction and repatronage intentions. Leeuwen et al (2002) questioned the ability of the
disconfirmation of expectancy model (DEM) to capture the complexity of sport customer
satisfaction. This is because sports marketing is different from the marketing of other
goods and services. They also criticized Madrigal and Blodgett’s models as being narrow
in focus because whilst the former explored satisfaction arising from the game, the latter
focused on satisfaction derived from the sports facility. They subsequently proposed the
Sports Spectator Satisfaction Model (SSSM) which looks at satisfaction arising from both
the game and non-game components of the spectator services. However, these studies did
not look at satisfaction at the cumulative level in the context of the tourist destination
hosting a mega event.
Shonk (2006) tested a multi-dimensional model of service quality applicable to
travelling sports spectators to a major league All-Star sporting event in the United States.
He evaluated their overall satisfaction of the event based on their perceptions of four
major quality dimensions namely, access quality, accommodation quality, venue quality
and contest quality. The study indicated that the most important dimension to the
respondents was the quality of the contest itself. However, this study also did not explore
the factors that influence sports tourists’ satisfaction with the event.
1.3 Methodology
Data for this study was collected from both primary and secondary sources.
Primary data were elicited from people attending the event through a survey from the 8th
of January 2008 to the 10th of February 2008. It was not possible to get a sample frame
7
of people attending the event since they did not pre-register. There was no data on people
attending the event except a projection by the Local Organizing Committee (LOC) of
CAN 2008 which placed the number of expected attendees at one million (Statesman, 3rd
May, 2007; Africanews, 21st November, 2007). In view of this, a non-probability
sampling method was employed. Specifically, the purposive method was used to sample
attendees for the study. Respondents were approached either after a match or at their
hotels and with their consent, questionnaires were handed over to them to complete. To
eliminate the incidence of double or multiple responses, which was likely to occur in an
event situation, they were first asked if they had already completed one of the
questionnaires.
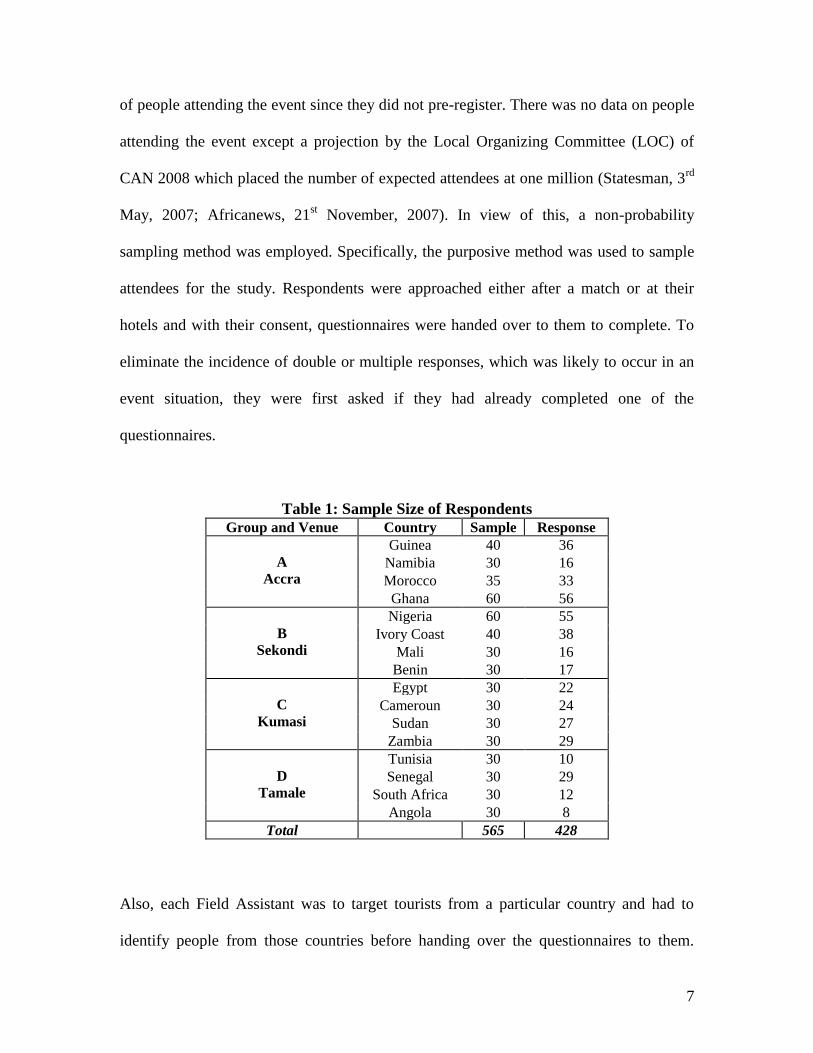
Table 1: Sample Size of Respondents
Group and Venue Country Sample Response
A
Accra
Guinea 40 36
Namibia 30 16
Morocco 35 33
Ghana 60 56
B
Sekondi
Nigeria 60 55
Ivory Coast 40 38
Mali 30 16
Benin 30 17
C
Kumasi
Egypt 30 22
Cameroun 30 24
Sudan 30 27
Zambia 30 29
D
Tamale
Tunisia 30 10
Senegal 30 29
South Africa 30 12
Angola 30 8
Total 565 428
Also, each Field Assistant was to target tourists from a particular country and had to
identify people from those countries before handing over the questionnaires to them.
8
Following Neirotti et al (2001) and Madrigal (1995) who in a related study considered
sample sizes of 400 and 232 respectively, the sample size of 565 for this study is
considered appropriate (Table 1); however, 428 completed questionnaires could be
retrieved, representing a response rate of 75.8%.
Questionnaires were the main instruments used for the study. Respondents had to
indicate their satisfaction with various aspects of the event (hospitality, entertainment,
information etc.) on a Likert scale. The original Likert scale by Likert (1970) ranged from
strongly agree to strongly disagree, for this study, it was on a scale of 1-5 (1= poor – 5=
Excellent) so that respondents level of satisfaction could be determined. The
questionnaire also sought information on their travel characteristics and socio-
demographic characteristics. Aside data relating to the performance of the various
national teams such as goal differences, team progression and FIFA ranking were
obtained from secondary sources such as FIFA.com and MTNfootball.com. In view of
the fact that a large number of the participating countries were Francophone (Guinea,
Morocco, Ivory Coast, Mali, Benin, Cameroon, Tunisia and Senegal), the questionnaire
was translated into French for the benefit of those who could not read and write English
because the questionnaires were to be self-administered.
The instrument was pre-tested during a local premiership match between Kessben
FC and Tema Youth at the Robert Mensah Sports Stadium in Cape Coast, which was not
one of the venues for the tournament. A total of 25 sports fans were purposively selected
to complete the questionnaire. This afforded the researchers the opportunity to sharpen
the instrument for the actual survey. For the actual survey, a total of ten undergraduate
9
students were trained as field assistants. The actual fieldwork started after the first
matches had been played and ended after the final match had been played.
1.4 Findings
1.4.1 Socio-demographic characteristics of respondents
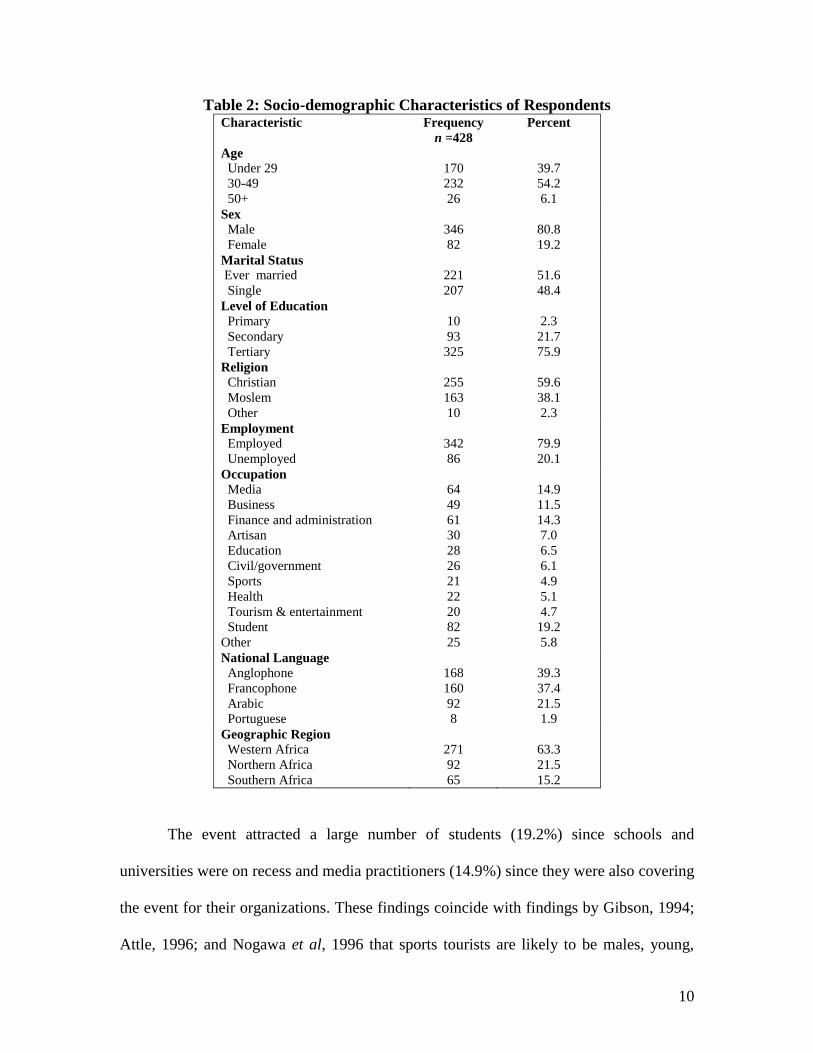
From Table 2, it can be concluded that the respondents were relatively young,
with ages mostly within the 30-49 age group. More than half of the respondents (54.2%)
were within this age category with only six percent aged 50 and above. They were
predominantly males (80.8%) which indicate that football matches in Africa are mostly
patronized by young men. In terms of marital status, the proportion of those who were
married, divorced or widowed (ever married) to singles was almost at par. The former
formed 51.6 percent while the latter were 48.4 percent. The respondents were fairly well
educated, about three-fourth of them (75.9%) had either completed or were in tertiary
institutions such as universities, polytechnics and training colleges. In terms of religious
affiliation, 59.6 percent were Christians whilst 38.1 percent were Moslems. This was
expected since these are the two predominant religions in Africa. A greater majority of
the respondents (79.9%) were employed in various professions though 20.1 percent were
unemployed. Apart from the students, a sizeable number of the respondents were
pursuing careers in the media, business, finance and administration, artisan and
education.
10
Table 2: Socio-demographic Characteristics of Respondents Characteristic Frequency
n =428
Percent
Age
Under 29
30-49
50+
170
232
26
39.7
54.2
6.1
Sex
Male
Female
346
82
80.8
19.2
Marital Status
Ever married
Single
221
207
51.6
48.4
Level of Education
Primary
Secondary
Tertiary
10
93
325
2.3
21.7
75.9
Religion
Christian
Moslem
Other
255
163
10
59.6
38.1
2.3
Employment
Employed
Unemployed
342
86
79.9
20.1
Occupation
Media
Business
Finance and administration
Artisan
Education
Civil/government
Sports
Health
Tourism & entertainment
Student
Other
64
49
61
30
28
26
21
22
20
82
25
14.9
11.5
14.3
7.0
6.5
6.1
4.9
5.1
4.7
19.2
5.8
National Language
Anglophone
Francophone
Arabic
Portuguese
168
160
92
8
39.3
37.4
21.5
1.9
Geographic Region
Western Africa
Northern Africa
Southern Africa
271
92
65
63.3
21.5
15.2
The event attracted a large number of students (19.2%) since schools and
universities were on recess and media practitioners (14.9%) since they were also covering
the event for their organizations. These findings coincide with findings by Gibson, 1994;
Attle, 1996; and Nogawa et al, 1996 that sports tourists are likely to be males, young,
11
highly educated and employed full time. Also, the event attracted almost the same
number of Anglophones and Francophones, representing 39.3 percent and 37.4 percent
respectively. Only 1.9 percent was Portuguese since Angola was the only Portuguese-
speaking country which qualified for the tournament coupled with the fact that few of
their supporters attended the tournament. Geographically, most of the respondents
(63.3%) were from the western part of Africa due to the fact that most of the countries
that qualified for the tournament were from this part of the continent. Northern Africans
and Southern Africans represented 21.5 percent and 15.2 percent respectively. East and
Central Africans were not represented because countries from that region did not qualify
for the tournament. Though Cameroon is technically a central African country, it has
been placed among the West African countries because it is geographically located in the
west of Africa and also for ease of analysis.
1.4.2 Travel Characteristics
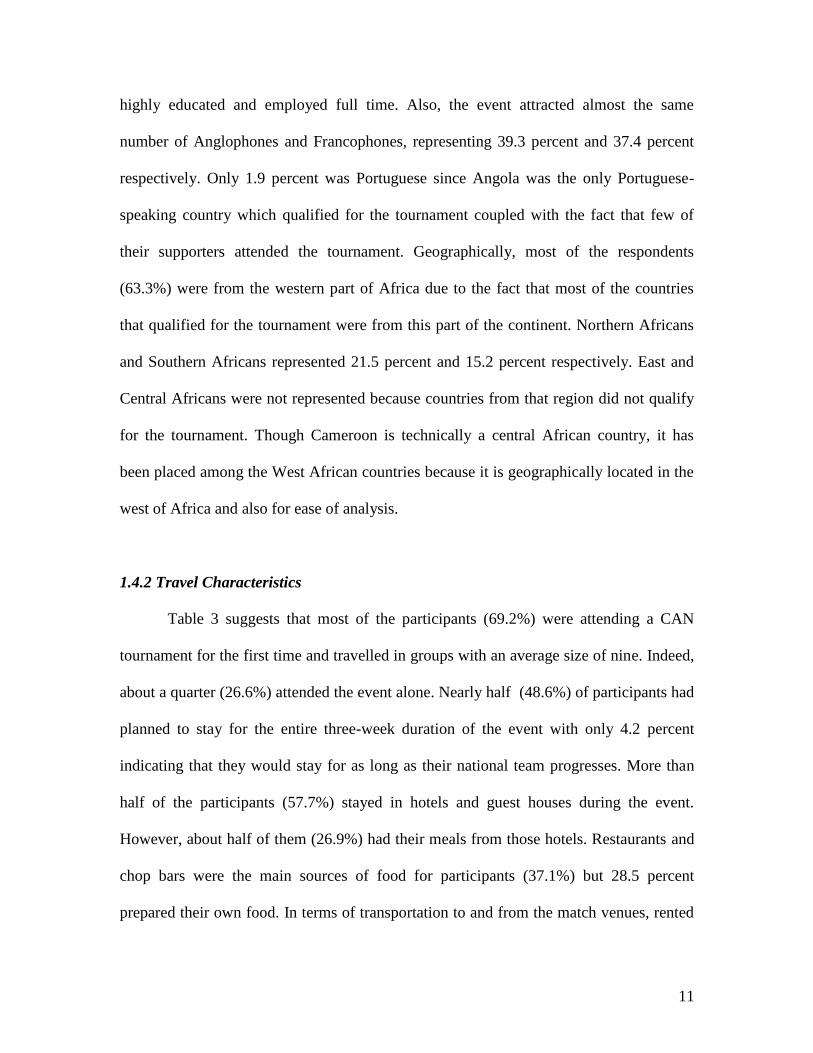
Table 3 suggests that most of the participants (69.2%) were attending a CAN
tournament for the first time and travelled in groups with an average size of nine. Indeed,
about a quarter (26.6%) attended the event alone. Nearly half (48.6%) of participants had
planned to stay for the entire three-week duration of the event with only 4.2 percent
indicating that they would stay for as long as their national team progresses. More than
half of the participants (57.7%) stayed in hotels and guest houses during the event.
However, about half of them (26.9%) had their meals from those hotels. Restaurants and
chop bars were the main sources of food for participants (37.1%) but 28.5 percent
prepared their own food. In terms of transportation to and from the match venues, rented
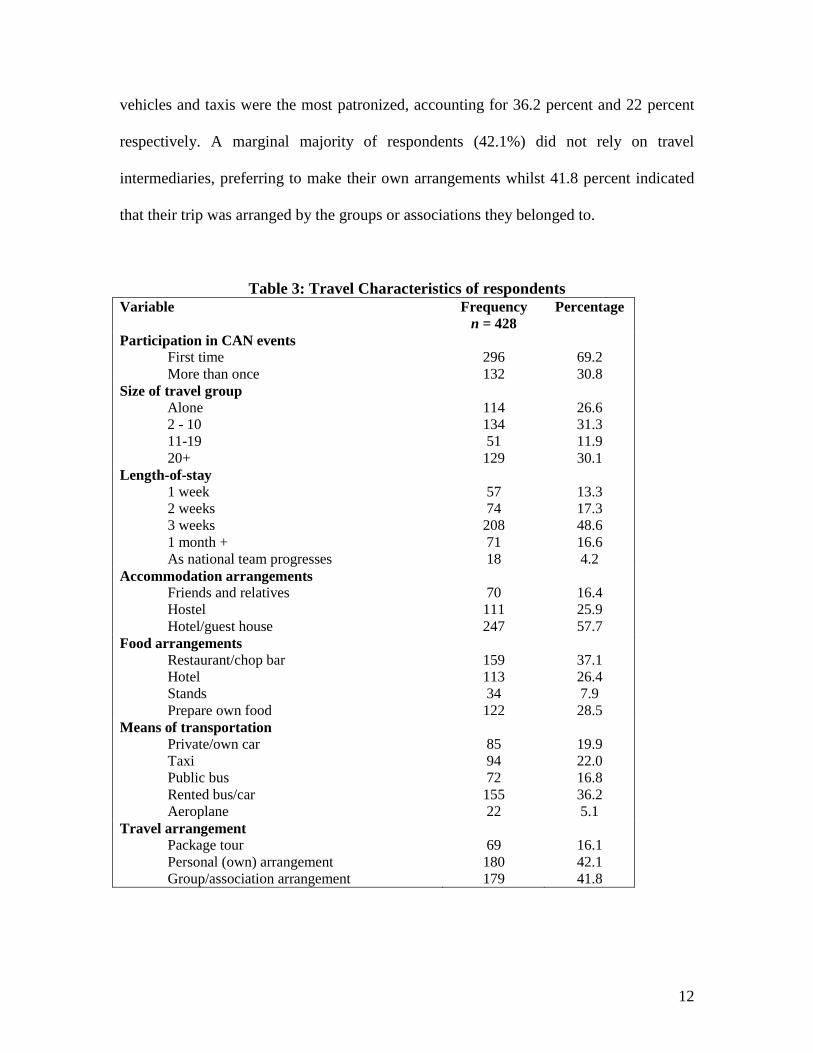
12
vehicles and taxis were the most patronized, accounting for 36.2 percent and 22 percent
respectively. A marginal majority of respondents (42.1%) did not rely on travel
intermediaries, preferring to make their own arrangements whilst 41.8 percent indicated
that their trip was arranged by the groups or associations they belonged to.
Table 3: Travel Characteristics of respondents
Variable Frequency
n = 428
Percentage
Participation in CAN events
First time
More than once
296
132
69.2
30.8
Size of travel group
Alone
2 - 10
11-19
20+
114
134
51
129
26.6
31.3
11.9
30.1
Length-of-stay
1 week
2 weeks
3 weeks
1 month +
As national team progresses
57
74
208
71
18
13.3
17.3
48.6
16.6
4.2
Accommodation arrangements
Friends and relatives
Hostel
Hotel/guest house
70
111
247
16.4
25.9
57.7
Food arrangements
Restaurant/chop bar
Hotel
Stands
Prepare own food
159
113
34
122
37.1
26.4
7.9
28.5
Means of transportation
Private/own car
Taxi
Public bus
Rented bus/car
Aeroplane
85
94
72
155
22
19.9
22.0
16.8
36.2
5.1
Travel arrangement
Package tour
Personal (own) arrangement
Group/association arrangement
69
180
179
16.1
42.1
41.8
13
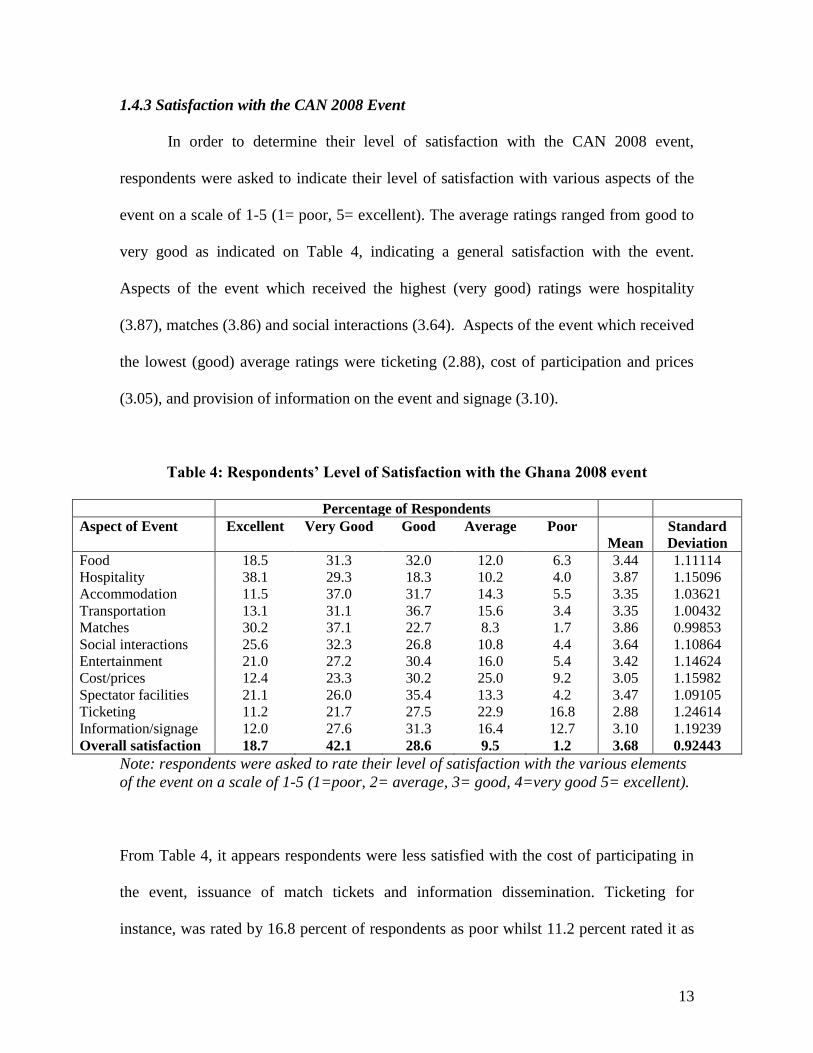
1.4.3 Satisfaction with the CAN 2008 Event
In order to determine their level of satisfaction with the CAN 2008 event,
respondents were asked to indicate their level of satisfaction with various aspects of the
event on a scale of 1-5 (1= poor, 5= excellent). The average ratings ranged from good to
very good as indicated on Table 4, indicating a general satisfaction with the event.
Aspects of the event which received the highest (very good) ratings were hospitality
(3.87), matches (3.86) and social interactions (3.64). Aspects of the event which received
the lowest (good) average ratings were ticketing (2.88), cost of participation and prices
(3.05), and provision of information on the event and signage (3.10).
Table 4: Respondents’ Level of Satisfaction with the Ghana 2008 event
Percentage of Respondents
Aspect of Event Excellent Very Good Good Average Poor
Mean
Standard
Deviation
Food 18.5 31.3 32.0 12.0 6.3 3.44 1.11114
Hospitality 38.1 29.3 18.3 10.2 4.0 3.87 1.15096
Accommodation 11.5 37.0 31.7 14.3 5.5 3.35 1.03621
Transportation 13.1 31.1 36.7 15.6 3.4 3.35 1.00432
Matches 30.2 37.1 22.7 8.3 1.7 3.86 0.99853
Social interactions 25.6 32.3 26.8 10.8 4.4 3.64 1.10864
Entertainment 21.0 27.2 30.4 16.0 5.4 3.42 1.14624
Cost/prices 12.4 23.3 30.2 25.0 9.2 3.05 1.15982
Spectator facilities 21.1 26.0 35.4 13.3 4.2 3.47 1.09105
Ticketing 11.2 21.7 27.5 22.9 16.8 2.88 1.24614
Information/signage 12.0 27.6 31.3 16.4 12.7 3.10 1.19239
Overall satisfaction 18.7 42.1 28.6 9.5 1.2 3.68 0.92443
Note: respondents were asked to rate their level of satisfaction with the various elements
of the event on a scale of 1-5 (1=poor, 2= average, 3= good, 4=very good 5= excellent).
From Table 4, it appears respondents were less satisfied with the cost of participating in
the event, issuance of match tickets and information dissemination. Ticketing for
instance, was rated by 16.8 percent of respondents as poor whilst 11.2 percent rated it as
14
excellent. On the other hand, most respondents were satisfied with the level of
hospitality, quality of matches and the opportunities for social interactions. More than a
third (38.1%) of the respondents rated hospitality as excellent and 29.3 percent also rated
it as very good, with only 4% indicating it was poor. Also, 30.2 percent and 37.1 percent
of respondents rated the matches as excellent and very good respectively with only 1.7
percent rating it as poor.
1.4.4 Satisfaction by characteristics of respondents and performance of their teams
In order to determine what influence sports tourists’ satisfaction with a mega
sporting event like CAN, the chi-square test of significance was used to determine if
there is any relationship between satisfaction, socio-demographic characteristics, travel
characteristics and performance of their national teams. The chi-square results are
presented on Tables 5, 6 and 7.
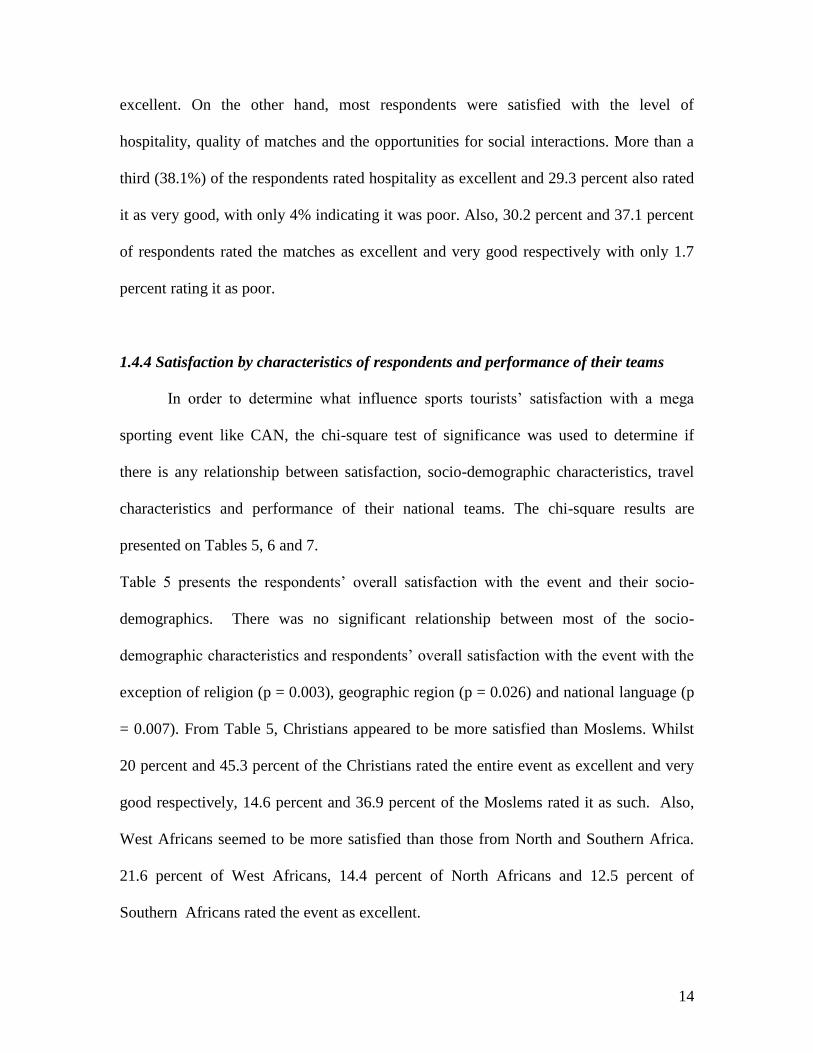
Table 5 presents the respondents’ overall satisfaction with the event and their socio-
demographics. There was no significant relationship between most of the socio-
demographic characteristics and respondents’ overall satisfaction with the event with the
exception of religion (p = 0.003), geographic region (p = 0.026) and national language (p
= 0.007). From Table 5, Christians appeared to be more satisfied than Moslems. Whilst
20 percent and 45.3 percent of the Christians rated the entire event as excellent and very
good respectively, 14.6 percent and 36.9 percent of the Moslems rated it as such. Also,
West Africans seemed to be more satisfied than those from North and Southern Africa.
21.6 percent of West Africans, 14.4 percent of North Africans and 12.5 percent of
Southern Africans rated the event as excellent.
15
Table 5: Relationship between satisfaction and socio-demographic characteristics
Variable
Excellent
(%)
Very
Good
(%)
Good
(%)
Average
(%)
Poor
(%)
x2
(P-Value)
Sex
Male
Female
18.6
19.5
41.0
48.1
28.6
27.3
10.3
5.2
1.5
0.0
(0.448)
Age
Less than 20 years
30-49 years
50 years and above
23.8
14.2
20.0
42.1
42.2
48.0
25.0
31.1
24.0
7.9
11.1
8.0
1.2
1.3
0.0
(0.456)
Marital status
Ever married
Single
14.8
22.0
42.6
42.5
30.6
26.0
11.1
8.0
0.9
1.5
(0.285)
Level of education
Primary
Secondary
Tertiary
26.8
19.4
16.7
37.5
37.5
44.9
21.4
30.6
28.6
12.5
11.1
8.7
1.8
1.4
1.0
(0.654)
Religion
Christian
Moslem
Other
20.0
14.6
30.0
45.3
36.9
60.0
25.3
35.0
0.0
7.8
13.4
0.0
1.6
0.0
10.0
(0.003*)
Geographic region
Western Africa
Northern Africa
Southern Africa
21.6
14.4
12.5
43.1
38.9
42.2
28.6
26.7
31.3
5.6
18.9
12.5
1.1
1.1
1.6
(0.026*)
Employment status
Employed
Unemployed
18.3
21.4
42.5
39.3
27.8
31.0
10.1
7.1
1.2
1.2
(0.854)
National Language
Anglophone
Francophone
Arabic
Portuguese
19.9
20.6
14.4
0.0
46.4
38.8
38.9
57.1
26.5
31.9
26.7
28.6
6.6
7.5
18.9
0.0
0.6
1.3
1.1
14.3
(0.007*)
*Significant at p<0.05
This appears to reflect the performance of their national teams since three West African
Teams (Cameroon, Cote d’Ivoire and Ghana) were in the finals. Moreover, the
Portuguese were the least satisfied since 14.3 percent rated the event as poor compared
with 1.1 percent of Arabic, 1.3 percent of Francophones and 0.6 percent of Anglophones.
16
Table 6: Relationship between satisfaction and travel characteristics
Variable
Excellent
(%)
Very
Good
(%)
Good
(%)
Average
(%)
Poor
(%)
x2
(P-Value)
Travel arrangement
Package tour
Personal arrangement
Group arrangement
30.2
17.8
14.6
36.5
43.8
45.6
27.0
30.1
26.3
6.3
7.1
12.3
0.0
1.2
1.2
(0.434)
Food arrangement
Restaurant/chop bar
Hotel
Stand
Prepare own food
21.1
20.5
12.5
17.2
36.2
42.9
37.5
50.0
30.9
25.9
37.5
25.0
9.9
10.7
12.5
6.9
2.0
0.0
0.0
0.9
(0.729)
Accommodation
arrangement
Friends and relatives
Hostel
Hotel/guest house
26.9
19.8
16.0
44.8
41.5
42.0
17.9
32.1
30.3
7.5
6.6
10.8
3.0
0.0
0.9
(0.141)
Means of transport
Private/own car
Taxi
Public bus
Rented bus
Aeroplane
12.2
19.5
21.5
21.7
4.8
37.8
44.8
46.2
43.3
28.6
34.1
27.6
23.1
28.0
42.9
12.2
6.9
9.2
7.0
23.8
3.7
1.1
0.0
0.0
0.0
(0.064)
Length of stay
1 week
2 weeks
3 weeks
1 month and beyond
As team progresses
15.7
20.0
20.0
19.4
11.8
43.1
40.0
42.1
44.8
17.6
39.2
29.2
26.8
25.4
29.4
2.0
10.8
10.0
7.5
41.2
0.0
0.0
1.1
3.0
0.0
(0.17)
Participation in CAN events
First time
More than once
19.7
17.1
43.3
38.8
29.8
27.1
6.6
15.5
0.7
1.6
(0.054)
Size of travel group
Alone
2 -10
11-19
20 and above
23.0
16.7
20.0
12.5
38.9
43.6
37.1
43.8
33.6
29.2
22.9
12.5
3.5
9.1
20.0
31.3
0.9
1.5
0.0
0.0
(0.028*)
*Significant at p<0.05
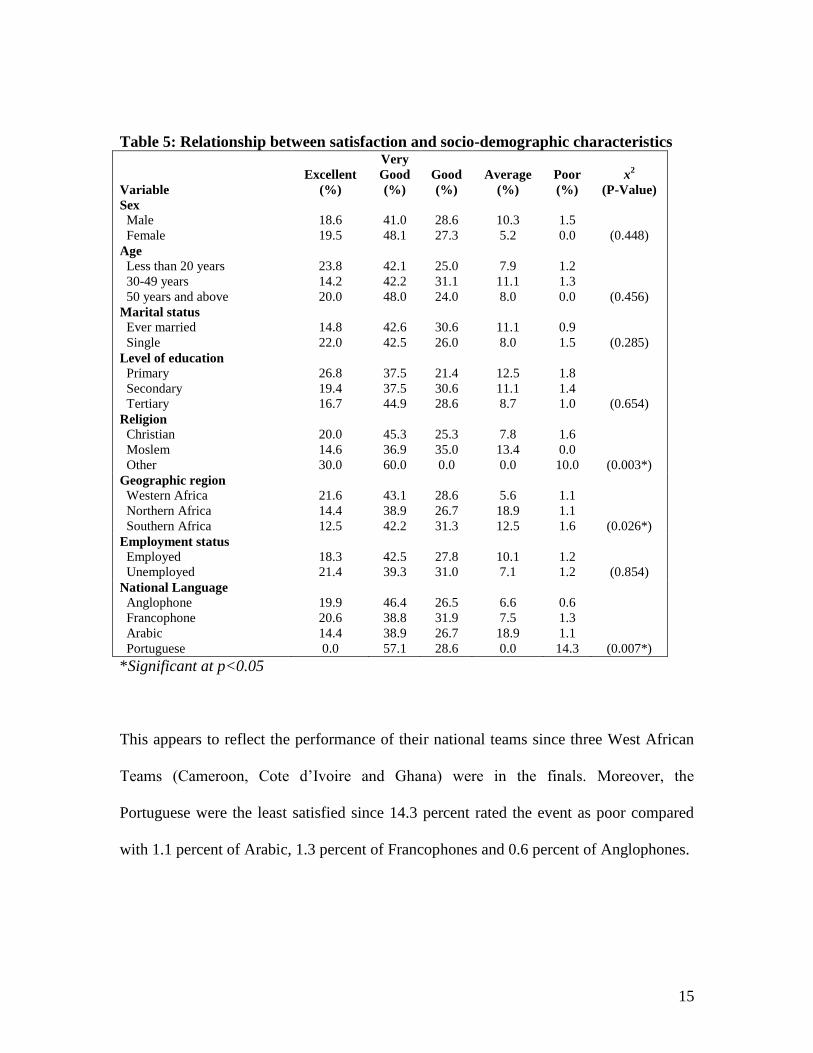
Though there was no significant relationship between satisfaction with the entire
event and most of the travel characteristics of respondents, there was a significant
relationship between size of travel group and satisfaction with the event (p = 0.028).
From table 6, those who were not tied to any group appeared to be more satisfied than
those belonging to larger groups. Also those who had attended previous events in
different countries appeared to be less satisfied. About 16 percent and 1.6 percent of them
17
rated the event as average and poor respectively whilst about seven percent and 0.7
percent of those who were attending the event for the first time rated it as such.
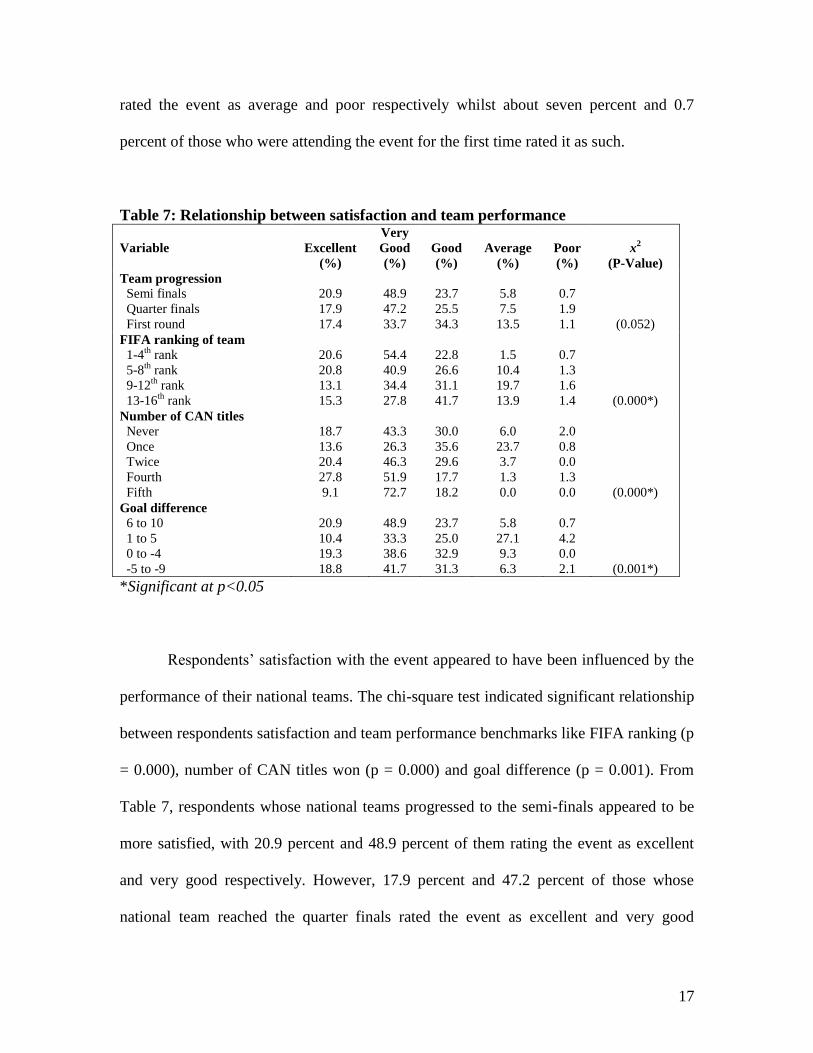
Table 7: Relationship between satisfaction and team performance
Variable
Excellent
(%)
Very
Good
(%)
Good
(%)
Average
(%)
Poor
(%)
x2
(P-Value)
Team progression
Semi finals
Quarter finals
First round
20.9
17.9
17.4
48.9
47.2
33.7
23.7
25.5
34.3
5.8
7.5
13.5
0.7
1.9
1.1
(0.052)
FIFA ranking of team
1-4th
rank
5-8th
rank
9-12th
rank
13-16th
rank
20.6
20.8
13.1
15.3
54.4
40.9
34.4
27.8
22.8
26.6
31.1
41.7
1.5
10.4
19.7
13.9
0.7
1.3
1.6
1.4
(0.000*)
Number of CAN titles
Never
Once
Twice
Fourth
Fifth
18.7
13.6
20.4
27.8
9.1
43.3
26.3
46.3
51.9
72.7
30.0
35.6
29.6
17.7
18.2
6.0
23.7
3.7
1.3
0.0
2.0
0.8
0.0
1.3
0.0
(0.000*)
Goal difference
6 to 10
1 to 5
0 to -4
-5 to -9
20.9
10.4
19.3
18.8
48.9
33.3
38.6
41.7
23.7
25.0
32.9
31.3
5.8
27.1
9.3
6.3
0.7
4.2
0.0
2.1
(0.001*)
*Significant at p<0.05
Respondents’ satisfaction with the event appeared to have been influenced by the
performance of their national teams. The chi-square test indicated significant relationship
between respondents satisfaction and team performance benchmarks like FIFA ranking (p
= 0.000), number of CAN titles won (p = 0.000) and goal difference (p = 0.001). From
Table 7, respondents whose national teams progressed to the semi-finals appeared to be
more satisfied, with 20.9 percent and 48.9 percent of them rating the event as excellent
and very good respectively. However, 17.9 percent and 47.2 percent of those whose
national team reached the quarter finals rated the event as excellent and very good
18
respectively whilst 17.4 percent and 33.7 percent of those whose national teams could not
go beyond the first round rated it as such. Using the FIFA ranking of January 2008 as a
benchmark, respondents whose teams were ranked higher (1st - 4
th rank) seemed more
satisfied than those with lower rankings. More than half of the respondents (54.4%) from
the 1st to 4
th ranked teams rated the event as very good whilst only 0.7 percent of them
rated it as poor. However, 27.8 percent and 1.4 percent of respondents from the 13th
to
16th
ranked teams rated the event as very good and poor respectively. Clearly respondents
whose teams performed better in the tournament and in the FIFA rankings such as
Ghanaians, Camerounians, Nigerians and Egyptians appeared more satisfied than those
whose national teams performed badly such as South Africans, Tunisians and Angolans.
1.5 Discussion
Customers’ satisfaction is important to the successful marketing of products and
services and so is the satisfaction of sports tourists important to the successful marketing
and hosting of events, since satisfied customers are more likely to attend subsequent
events (Shonk, 2006) and convince others to attend. The success of an event is also
determined by the number of people who attend the event especially in the case of
sporting events. No matter how interesting a match, the absence of fans will render it
uninteresting because even the players take inspiration from them. The issue of attracting
sports tourists to mega events like CAN and meeting their needs is therefore imperative.
The fact that respondents were generally satisfied with the event (overall satisfaction =
2.32) is therefore important so far as attendance to subsequent CAN events like Angola
2010 is concerned. This is because judgements made on satisfaction serve as important
19
predictors of future patronage (Madrigal 1995). This will in turn impact on profitability
since satisfaction is closely related to customer loyalty and profitability (Fornell 1992,
Greenwell et al, 2002, Musa et al, 2004). This is underscored by the fact that 73.6 percent
of the respondents indicated that they will be willing to attend the subsequent CAN event.
The study shows that with the exception of the religion (p = 0.003), geographic
region (p = 0.026), national language (p = 0.007) and size of travel group (0.028) most of
the socio-demographic and travel characteristics of tourists did not significantly relate to
respondents’ satisfaction with the event. Thus sports tourists’ satisfaction with the CAN
2008 event was not influenced by their age, sex, marital status, level of education as well
as other travel characteristics like travel arrangement, food arrangement and
accommodation arrangement. However, religion, language and geographic regions which
distinguish the sports tourists from different parts of Africa, clearly affects their
satisfaction with the event. There are differences in perceptions among the Northern
African who speak Arabic, Anglophone and Francophone West Africans and
Anglophone South Africans. Size of travel group also significantly related to satisfaction
with the event.
Also, the study shows the effect of national team performance on the satisfaction
of sports tourists. National team’s progression in the tournament (p = 0.052), FIFA
ranking of team (p = 0.000), number of CAN titles won (p = 0.000) and goal differences
in tournament (p = 0.001) were found to significantly influence sports tourists’
satisfaction with the event. Respondents whose teams performed better were found to be
more satisfied than their counterparts whose teams did not fare well. This supports the
20
concepts of team identification and win/lose phenomenon proposed by Madrigal (1995)
and Mullin (1985) respectively as factors determining sports satisfaction.
Generally, respondents were more satisfied with the sociological aspects of the
tournament such as hospitality (M = 2.13), the matches (M = 2.14), and social
interactions (M = 2.36). It is not surprising that hospitality received the highest ratings as
Ghanaians are widely recognized as hospitable (proverbial Ghanaian Hospitality). The
tournament also promoted social interactions by bringing people from different parts of
Africa and the rest of the world together to socialize. This was effectively captured by the
theme of the event, ‘sharing passions at the centre of the world.’ Respondents were
generally satisfied with the high quality of the matches which they attributed to the
quality of the stadia and pitches coupled with good officiating and the fact that most of
the players were playing regularly in top-notch leagues in Europe.
Aspects of the event which respondents were less satisfied with were those related
to organizational deficiencies. These were cost of participation and prices of goods and
services in general (M = 3.05), ticketing (M = 2.88) and dissemination of information on
the event (M = 3.10). For instance 16.8 percent of respondents rated ticketing as poor,
compared with 11.2 percent who rated it as excellent. The manner in which tickets for the
matches were issued and the accreditation process for journalists received a lot of
criticisms from which were captured by the media. There were news reports of people
forming long queues for tickets and confusion with the accreditation process (The
Statesman, 9th
January 2008; Daily Graphic, 19th
January 2008; Ghanaian Chronicle, 14th
February 2008). There were instances where tickets for some matches ran out but on the
day of those matches, the stadia were not filled and some people were seen selling tickets
21
at the gate at exorbitant prices. There were middlemen who were seen selling tickets at
exorbitant prices at the match venues. These problems underscore the importance of
prudent ticketing, accreditation and pricing arrangements to the successful staging of
mega sporting events. Issues relating to ticketing, pricing and information dissemination
are purely administrative and could be addressed by the Local Organizing Committee
(LOC) with the right management intervention.
1.6 Conclusions and Implications
This study sought to examine the satisfaction of sports tourists from different
parts of Africa with the CAN 2008 event as well as what influences their satisfaction. The
results of the study suggests that sports tourists were generally satisfied with the CAN
2008 event but appeared to be more satisfied with the sociological aspects of the event
like hospitality and social interaction than with ticketing and information dissemination
arrangements. The study has marketing, management and research implications.
First of all, the results of the study clearly point out the fact that mega sporting
events like CAN 2008 are attended by well-educated and full-time employed young
males and this has implications for marketing. Marketing efforts for subsequent events
should be directed at people with these socio-demographics since they are more likely to
attend. Single male professionals, who are usually in groups of 10 and above and make
their own travel arrangements and youth groups, should particularly be targeted. There is
the need for organizers to pay equal attention to marketing rather than just investing huge
amounts of money into the construction of stadia and other facilities based on the belief
22
that if you build it they would come. This is against the backdrop that during the event
some of the matches were played in virtually empty stadia.
Moreover, the study has implications for the organization of future events,
especially with the issuance of tickets, dissemination of information and the pricing of
other goods and services related to the event. There should be opportunities for people to
buy tickets in advance of the matches from designated outlets in their home countries
before embarking on the trip to the host country. Also, e-tickets should be issued on-line
so that people could purchase advance tickets irrespective of where they are located. This
would work especially in a situation where people are informed that advance tickets are
cheaper than those bought at the gate or a few days to the match. It would also lead to the
elimination of ticket touts. Information on upcoming matches and events should be
displayed at vantage points such as airports, bus terminals and major hotels. In addition
the organizers should provide information centres at all the match venues. The content of
the information should not be limited to only the matches but other activities, attractions
and facilities that would be of interest to tourists. Since there is the tendency for operators
of transport, attraction sites, hotels and restaurants to capitalize on the event and hike
their prices, organizers would have to build consensus with operators on the appropriate
prices to charge for their services. In fact the LOC could reach an agreement with the
various trade associations on appropriate price ceilings for their services.
Finally, the study has implications for further research into other factors that
influence sports tourists’ satisfaction. This is particularly imperative since studies on
factors influencing satisfaction with sports events have been conducted on sports fans and
spectators with very little on sports tourists. However, sports tourists are different
23
because they have to travel usually over long distances and their motivations go beyond a
mere desire to watch the matches or support their national teams but also a desire to
explore the host destination and its tourism resources. The study indicates differences in
satisfaction among Moslems and Christians as well as West Africans, North Africans and
South Africans. It is therefore imperative to conduct further research on the
psychographics of these different market segments and customize event packages to meet
their needs.
References
Africanews (2007), “3000 Malian Fans announced for Ghana 2008”, 21st November,
2007, available at: http://www.africanews.com/site/list_message/8640#m8640
(accessed 18th
May, 2008).
Ajzen, I., and Fishbein, M. (eds.) (1980). Understanding Attitudes and Predicting Social
Behaviour. New Jersey: Prentice-Hall.
Anderson, E.W. and Sullivan, M. (1993). The antecedents and consequences of
customer satisfaction for firms, Marketing Science, 12(2), 125-143.
Attle, S. (1996), Tourist role preference and the development of life style profiles:
implications for market segmentation and tourist destination selection.”
Unpublished Doctoral Dissertation, University of Connecticut.
Brunet, F. (1996). An economic analysis of the Barcelona ’92 Olympic Games, in
Miquel de Moragas and Miquel Botella (eds.), The Keys to Success, Universitat
Autonoma de Barcelona.
24
Cadotte, E. R., Woodruff, R. B., and Jenkins, R. L. (1987). Expectations and norms in
models of consumer satisfaction”, Journal of Marketing Research, 24, 305–314.
Chon, K. (1989). Understanding recreational travellers’ motivation, attitude and
satisfaction, The Tourist Review, 44(1), 3–7.
Commonwealth Department of Industry, Science and Resources (2000). Towards a
National Sports Tourism Strategy (Draft), Canberra City, available at
http://www.tourism.gov.au, (accessed 30/01/07).
Crompton, J.L. and McKay, S.L. (1997). Motives of visitors attending festival events,
Annals of Tourism Research, 24(2), 425-439.
Daily Graphic (2008), “Ghana 2008 to rake in a billion dollars”, 17th
January.
Daily Graphic (2008), “Hell at media accreditation”,19th
January.
Dobson, N., Gratton, C and Holliday, S. (1997). Football came home: the economic
impact of Euro ’96, Leisure Industries Research Centre.
Fisk, R. P., and Young, C. E. (1985). Disconfirmation of equity expectations: effects on
consumer satisfaction with services, In Hirschman, E., and Holbrook, H. (eds.),
Advances in Consumer Research. Provo, UT: Association for Consumer
Research.
Fornell, C, (1992). A national customer satisfaction barometer: the Swedish
experience, Journal of Marketing, 56, 6–21.
Foster, D. (1997). Measuring customer satisfaction in the tourism industry, a paper
presented at the 3rd International and 6th National Conference on Quality
Management, Centre for Management Quality Research, RMIT, Melbourne.
25
Francken, D. A., and van Raaij, W. F. (1981). Satisfaction with leisure time activities,
Journal of Leisure Research, 13(4), 337–352.
Gammon, S. and Robinson, T. (1997). Sport and tourism: a conceptual framework,
Journal of Sport Tourism, 4(3), 1–6.
Ghanaian Chronicle (2008). Ghana 2008- Autopsy Report, 14th
February.
Gibson, H. (1994). Some predictors of tourist role preference for men and women over
the adult life course, Unpublished Doctoral Dissertation, University of
Connecticut.
Glyptis, S. A. (1991). Sport and tourism, In Cooper, C.P., (ed.), Progress in Tourism,
Recreation, and Hospitality Management, 3, 165-183. London: Belhaven.
Graham, S., Neirotti, L. and Goldblatt, J. (eds) (2001). The Ultimate Guide to Sports
Marketing, 2nd. Edition, New York: McGraw-Hill.
Gratton, C Dobson, N. and Shibli, S. (2000). The economic importance of major sports
events: a case study of six events, Managing Leisure, 5, 17-28.
Greenwell, T. C., Fink, J., & Pastore, D. (2002). Assessing the influence of the physical
sports facility on customer satisfaction within the context of the service
experience. Sport Management Review, 5, 129-148.
Hallowell, R. (1996). The relationships of customer satisfaction, customer loyalty and
profitability: an empirical study”, International Journal of Service Industry
Management, 7(4), 27-42.
Herrmann, A., Huber, F., and Braunstein, C. (2000). Market-driven product and service
design: bridging the gap between customer needs, quality management, and
26
customer satisfaction, International Journal of Production Economics. 66(1),
77-96.
Hudson, S. (ed), (2003). Sport and Adventure Tourism, New York: Haworth Press.
Johnson, M.D., Anderson, E.W., Fornell, C. (1995). Rational and adaptive
performance expectations in a customer satisfaction framework, Journal of
Consumer Research, 21, 695-707.
Kotler, P. (1994). Marketing management: Analysis, planning, implementation, and
control, 8th edition, Englewood Cliffs: Prentice Hall.
Kozak, M., and Rimmington, M. (2000). Tourist satisfaction with Mallorca, Spain, as an
off-season holiday destination, Journal of Travel Research, 38(3), 260–269.
Leeuwen, L.V., Quick, S. and Daniel, K. (2002). The sport spectator satisfaction model: a
conceptual framework for understanding the satisfaction of spectators, Sport
Management Review, 5, 99-128.
Likert, R. (1970). A technique for the measurement of attitudes, in Summers, G.F. (ed.)
Attitude Measurement, 149-158, Chicago: Rand McNally and Company.
Lovelock, C. H. (1991). Services Marketing : Text, Cases and Readings. London:
Prentice-Hall.
Lovelock, C. H., Patterson, P. G., and Walker, R. H. (2001), Services Marketing: An
Asia-Pacific Perspective, 2nd Edition, Australia: Prentice Hall.
MacKay, K. J., and Crompton, J. L. (1990). Measuring the quality of recreation
services, Journal of Park and Recreation Administration, 8(3), 47-56.
Madrigal, R. (1995). Cognitive and affective determinants of fan satisfaction with
sporting event attendance, Journal of Leisure Research, 27, 205–227.
27
Madrigal, R.; Howard, D. R.. (1995). The development of the FANDIM scale and its
potential applications to understanding sport spectators, Conference Paper
presented at the North American Society for Sport Management (NASSM)
Conference.
McMahon-Beattie, U. and Yeoman, I. (eds.) (2004). Sport and Leisure Operations
Management, London: Thomson Learning.
Mullin, B. (1985). Characteristics of sport marketing, In Lewis, G. and Appenzeller, H.
(eds.), Successful Sport Management, 101–123, Charlottesville: The Michie
Company.
Musa, R., Pallister, J., and Robson, M., (2004). Assessing customer satisfaction within
the direct sales channel using consumption system approach: Empirical evidence
from Malaysia, Proceedings of the Australian and New Zealand Marketing
Academy, Wellington, New Zealand.
Neirotti, L.D., Bosetti, H.A., and Teed, K.C. (2001). Motivation to attend the 1996
summer. Olympic games, Journal of Travel Research, 39(3), 327-331.
Nogawa, H., Yamaguchi, Y., and Hagi, Y. (1996). An empirical study on Japanese sport
tourism in sport-for-all events : Case studies of a single-night event and a multiple
night event, Journal of Travel Research, 34, 46-54.
Oliver, R. L., and Swan, J. E. (1989). Consumer perceptions of interpersonal equity and
satisfaction in transactions: A field survey approach, Journal of Marketing,
53, 21–35.
Oliver, R.L. (1997). Satisfaction: a Behavioral Perspective on the Consumer, New York:
McGraw-Hill.
28
Pizam, A., Neuman, Y., and Reichel, A. (1979). Tourist satisfaction: uses and
misuses, Annals. of Tourism Research, 6, 96-107.
Pizam, A., and Ellis, T. (1999). Customer satisfaction and its measurement in
hospitality enterprises, International Journal of Contmporary Hospitality
Management, 11(7), 326-339.
Ritchie, J.R.B. and Smith, B, H. (1991). The impact of a Mega-Event on host region
awareness: a longitudinal study, Journal of Travel Research, 30(1), 3-10.
Shonk, D.J. (2006). Perceptions of service quality, satisfaction and the intent to return
among tourists attending a sporting event, unpublished PhD dissertation, Ohio
State University.
Standeven, J., and Deknop, P. (1999). Sport Tourism. Champaign: Human Kinetics.
The Statesman (2008). Countdown to CAN 2008, 3rd
May.
The Statesman (2008). Ghana 2008 opening ceremony tickets run out, 9th
January.
Tse, D. K., and Wilton, P. C. (1988). Models of consumer satisfaction: an extension,
Journal of Marketing Research, 25, 204–212.
Wakefield, K.L., and Blodgett, J.G. (1994). The importance of servicescapes in leisure
service settings, Journal of Services Marketing, 8, 66–76.
Woodall, T. (2003). Conceptualising ‘Value for the Customer’: an attributional,
structural and dispositional analysis, Academy of Marketing Science Review,
12, available at, http://www.amsreview.org/articles/woodall12-2003.pdf,
(accessed, 18th
May, 2008).
29
Yoon, Y. and Uysal, M. (2005). An examination of the effects of motivation and
satisfaction on destination loyalty: a structural model”, Tourism Management,
26, 45-56.
NOTE: this paper has been published in the Oguaa Social Sciences Journal (2011).
CITE: Mensah, I., & Abanga, J. (2011). ‘Sports Tourists’ Satisfaction with the CAN
2008 Continental Sporting Event in Ghana’, Oguaa Journal of Social Sciences, vol. 6,
No. 1, pp. 87-114.

30