Sports Data Mining Technology Used in Basketball Outcome ...
106
Technological University Dublin Technological University Dublin ARROW@TU Dublin ARROW@TU Dublin Dissertations School of Computer Sciences 2012 Sports Data Mining Technology Used in Basketball Outcome Sports Data Mining Technology Used in Basketball Outcome Prediction Prediction Chenjie Cao Technological University Dublin Follow this and additional works at: https://arrow.tudublin.ie/scschcomdis Part of the Computer Engineering Commons Recommended Citation Recommended Citation Cao, C.: Sports data mining technology used in basketball outcome prediction. Masters Dissertation. Technological University Dublin, 2012. This Dissertation is brought to you for free and open access by the School of Computer Sciences at ARROW@TU Dublin. It has been accepted for inclusion in Dissertations by an authorized administrator of ARROW@TU Dublin. For more information, please contact [email protected], [email protected]. This work is licensed under a Creative Commons Attribution-Noncommercial-Share Alike 4.0 License
-
Upload
khangminh22 -
Category
Documents
-
view
2 -
download
0
Transcript of Sports Data Mining Technology Used in Basketball Outcome ...
Technological University Dublin Technological University Dublin
ARROW@TU Dublin ARROW@TU Dublin
Dissertations School of Computer Sciences
2012
Sports Data Mining Technology Used in Basketball Outcome Sports Data Mining Technology Used in Basketball Outcome
Prediction Prediction
Chenjie Cao Technological University Dublin
Follow this and additional works at: https://arrow.tudublin.ie/scschcomdis
Part of the Computer Engineering Commons
Recommended Citation Recommended Citation Cao, C.: Sports data mining technology used in basketball outcome prediction. Masters Dissertation. Technological University Dublin, 2012.
This Dissertation is brought to you for free and open access by the School of Computer Sciences at ARROW@TU Dublin. It has been accepted for inclusion in Dissertations by an authorized administrator of ARROW@TU Dublin. For more information, please contact [email protected], [email protected].
This work is licensed under a Creative Commons Attribution-Noncommercial-Share Alike 4.0 License
Sports Data Mining Technology Used in
Basketball Outcome Prediction
Chenjie Cao
A dissertation submitted in partial fulfilment of the requirements of
Dublin Institute of Technology for the degree of
M.Sc. in Computing (Data Analytics)
September 2012

i
I certify that this dissertation which I now submit for examination for the award of
MSc in Computing (Knowledge Management), is entirely my own work and has not
been taken from the work of others save and to the extent that such work has been
cited and acknowledged within the test of my work.
This dissertation was prepared according to the regulations for postgraduate study of
the Dublin Institute of Technology and has not been submitted in whole or part for an
award in any other Institute or University.
The work reported on in this dissertation conforms to the principles and requirements
of the Institute‟s guidelines for ethics in research.
Signed: _________________________________
Date: 31-08-2012

ii
ABSTRACT
Driven by the increasing comprehensive data in sports datasets and data mining
technique successfully used in different area, sports data mining technique emerges
and enables us to find hidden knowledge to impact the sport industry. In many
instances, predicting the outcomes of sporting events has always been a challenging
and attractive work and is therefore drawing a wide concern to conduct research in this
field.
This project focuses on using machine learning algorithms to build a model for
predicting the NBA game outcomes and the algorithms involve Simple Logistics
Classifier, Artificial Neural Networks, SVM and Naïve Bayes. In order to complete a
convincing result, data of 5 regular NBA seasons was collected for model training and
data of 1 NBA regular season was used as scoring dataset.
After processes of automated data collection and cloud techniques enabled data
management, a data mart containing NBA statistics data is built. Then machine
learning models mentioned above is trained and tested by consuming data in the data
mart. After applying scoring dataset to evaluate the model accuracy, Simple Logistics
Classifier finally yields the best result with an accuracy of 69.67%.
The results obtained are compared to other methods from different source. It was
found that results of this project are more persuasive since such a vast quantity of data
was applied in this project. Meanwhile, it can be referenced for the future work.
Key words: NBA, data mining, machine learning, prediction, data management

iii
ACKNOWLEDGEMENTS
I would like to express my sincere thanks ……….
(thank all the people how have assisted you in completing your dissertation. Start with
your supervisor, all DIT staff that may have helped, other people can include family
and friends, industrial and academic staff from other institution, etc.)
iv
TABLE OF CONTENTS
ABSTRACT ................................................................................................................ II
TABLE OF FIGURES ............................................................................................ VII
TABLE OF TABLES ............................................................................................ VIII
TABLE OF CODE SNIPPETS ................................................................................ IX
1 INTRODUCTION ................................................................................................. 1
1.1 INTRODUCTION TO PROJECT ............................................................................... 1
1.2 BACKGROUND .................................................................................................... 1
1.3 RESEARCH PROBLEM .......................................................................................... 3
1.4 RESEARCH OBJECTIVES ...................................................................................... 3
1.5 RESEARCH METHODOLOGY ................................................................................ 4
1.6 RESOURCES ........................................................................................................ 5
1.7 SCOPE AND LIMITATIONS ................................................................................... 6
1.8 ORGANISATION OF THE DISSERTATION ............................................................... 7
2 LITERATURE REVIEW .................................................................................. 10
2.1 INTRODUCTION ................................................................................................. 10
2.2 DATA MINING ................................................................................................... 10
2.2.1 Data Mining Concept ........................................................................... 10
2.2.2 Data Mining Tasks and Functions ........................................................ 12
2.2.3 Data Mining Techniques....................................................................... 14
2.2.4 Data Mining Tools ................................................................................ 16
2.2.5 Data Mining Process ............................................................................ 17
2.2.6 Data mining applications ..................................................................... 19
2.2.7 Summary ............................................................................................... 21
2.3 DATA MINING IN SPORTS ................................................................................. 21
2.3.1 Sports Science and Sports Data Mining Research ............................... 22
2.3.2 Sports Data Mining Applications ......................................................... 23
2.3.3 Sports Data Mining Tools ..................................................................... 26
2.3.4 Conclusion ............................................................................................ 27
v
2.4 DATA MINING IN NATIONAL BASKETBALL ASSOCIATION ................................ 27
2.4.1 NBA Introduction .................................................................................. 28
2.4.2 Data Mining Techniques Used in Basketball ....................................... 31
2.4.3 Basketball Game Outcome Prediction Research .................................. 33
2.4.4 Popular Predictive Analysis Algorithm ................................................ 35
2.5 CONCLUSION .................................................................................................... 39
3 DATA COLLECTION AND DATA MANAGEMENT .................................. 40
3.1 INTRODUCTION ................................................................................................. 40
3.2 DATA SOURCES ................................................................................................ 41
3.3 DATA COLLECTION .......................................................................................... 44
3.3.1 Data Collection Tool ............................................................................ 44
3.3.2 Implementation of Data Collection Tool .............................................. 45
3.3.3 Data Collection Process and Results ................................................... 46
3.4 DATA MANAGEMENT ........................................................................................ 48
3.4.1 Hosting Environment and Setup ........................................................... 48
3.4.2 Database Table Design......................................................................... 50
3.4.3 Data Upload ......................................................................................... 53
3.4.4 Summary ............................................................................................... 56
3.5 DATA MART ..................................................................................................... 56
3.6 CONCLUSION .................................................................................................... 57
4 EXPERIMENT DESIGN ................................................................................... 59
4.1 INTRODUCTION ................................................................................................. 59
4.2 EXPERIMENT DESIGN ....................................................................................... 59
4.3 FEATURE EXTRACTION ..................................................................................... 60
4.3.1 Feature Extracted Explanation ............................................................ 61
4.3.2 Automated Feature Extraction ............................................................. 65
4.4 MODEL EVALUATION CRITERIA ....................................................................... 68
4.5 DATA PARTITION .............................................................................................. 69
4.5.1 Training and Testing (Handout) ........................................................... 69
4.5.2 Cross Validation Training .................................................................... 69
4.5.3 Experiment Setup .................................................................................. 70
4.6 MODEL TRAINING ............................................................................................ 71
vi
4.7 4.7 MODEL EVALUATION .................................................................................. 73
4.8 CONCLUSION .................................................................................................... 73
5 EVALUATION ................................................................................................... 74
5.1 INTRODUCTION ................................................................................................. 74
5.2 MODEL SCORING .............................................................................................. 74
5.2.1 Introduction .......................................................................................... 74
5.2.2 Scoring workflow .................................................................................. 75
5.2.3 Scoring result and discussion ............................................................... 75
5.3 COMPARISON TO OTHER‟S WORK ...................................................................... 76
5.3.1 Comparison to State-Of-Art Research .................................................. 76
5.3.2 Comparison to Popular NBA Game Perdition Website ....................... 78
5.3.3 Summary ............................................................................................... 78
5.4 CONCLUSION .................................................................................................... 79
6 CONCLUSION ................................................................................................... 80
6.1 RESEARCH DEFINITION & RESEARCH OVERVIEW ............................................ 81
6.2 CONTRIBUTIONS TO THE BODY OF KNOWLEDGE .............................................. 82
6.3 EXPERIMENTATION, EVALUATION AND LIMITATION ........................................ 83
6.3.1 Experimentation .................................................................................... 83
6.3.2 Evaluation ............................................................................................. 84
6.3.3 Limitation .............................................................................................. 85
6.4 FUTURE WORK & RESEARCH ........................................................................... 85
6.5 CONCLUSION .................................................................................................... 86
BIBLIOGRAPHY ...................................................................................................... 87
APPENDIX A ............................................................................................................. 91
APPENDIX B ............................................................................................................. 93
vii
TABLE OF FIGURES
FIGURE 1 ORGANISATION OF DISSERTATION ................................................................... 9
FIGURE 2 DATA MINING PROCESS ................................................................................. 19
FIGURE 3 BASKETBALL PLAYER POSITION .................................................................... 30
FIGURE 4 SHOT ZONE LAYOUT (82GAMES.COM) .......................................................... 32
FIGURE 5 NEURAL NETWORK ........................................................................................ 38
FIGURE 6 DATA FLOW ................................................................................................... 40
FIGURE 7 WEBPAGE OF GAME LOG DATA IN HTML FORMAT .............................................. 47
FIGURE 8 WEBPAGE OF GAME LOG DATA IN CSV FORMAT TEXT .......................................... 47
FIGURE 9 SCREENSHOT OF EC2 INSTANCES ....................................................................... 49
FIGURE 10 EC2 OPENED PORT ......................................................................................... 49
FIGURE 11 GAME LOG TABLE STRUCTURE ......................................................................... 51
FIGURE 12 PLAYER STATISTICS TABLE STRUCTURE ........................................................... 51
FIGURE 13 ROSTER TABLE STRUCTURE ............................................................................ 52
FIGURE 14 STARTING LINEUPS TABLE STRUCTURE ............................................................ 52
FIGURE 15 TEAM SPLIT TABLE STRUCTURE ...................................................................... 52
FIGURE 16 SQL INSERTION AUTOMATION SCRIPT LIST ...................................................... 53
FIGURE 17 SCREENSHOT OF RESULT OF TOP 500 RECORD IN GAME_LOG TABLE .......... 56
FIGURE 18 PROPOSED STAR SCHEME STRUCTURE ......................................................... 57
FIGURE 19 TIME DIMENSION TABLE STRUCTURE ............................................................... 57
FIGURE 20 DATA ANALYTICS ARCHITECTURE .................................................................... 60
FIGURE 21 FILES OF COLLECTED SAMPLE DATA................................................................. 68
FIGURE 22 TRAINING, EVALUATION AND SCORING PROCESS. ......................................... 68
FIGURE 23 EXPERIMENT WORKFLOW ............................................................................ 70
FIGURE 24 MODEL SCORING WORKFLOW ......................................................................... 75

viii
TABLE OF TABLES
TABLE 1 AVERAGING THE LAST 10 GAMES STATISTICS ........................................................ 62
TABLE 2 WIN/LOSS SCORE OF LAST TEN GAMES ................................................................ 63
TABLE 3 REST DAYS BEFORE UPCOMING GAME ................................................................... 64
TABLE 4 PREDICTION ACCURACY OF DIFFERENT CLASSIFIERS OVER TESTING DATASET .......... 73
TABLE 5 PREDICTION ACCURACY OF DIFFERENT CLASSIFIERS OVER SCORING DATASET ........... 76
TABLE 6 GAME WINNER PREDICTION FROM TEAMRANINGS.COM FOR 2010-11 NBA
REGULAR SEASONS .................................................................................................. 78
ix
TABLE OF CODE SNIPPETS
CODE SNIPPET 1 CORE FUNCTION OF GET-GAME-LOG.RB .................................................... 46
CODE SNIPPET 2 SQLBROKER CLASS FOR CONNECTING TO REMOTE MYSQL CLIENT AND
EXECUTING SQL QUERIES. .......................................................................................... 54
CODE SNIPPET 3 GET CSV FILE LIST IN DIRECTORY CONTAINING GAME LOG STATISTICS FILES 54
CODE SNIPPET 4 GENERATE_INSERTION_SQL FUNCTION FOR PARSING CSV FILE AND
GENERATING SQL INSERTION QUERIES. ....................................................................... 55
CODE SNIPPET 5 SQL FOR COLLECTING AVERAGE STATISTICS OF LAST 10 HOME GAMES OF
HOME TEAM AND LAST 10 ROAD GAMES OF ROAD TEAM. ................................................ 62
CODE SNIPPET 6 SQL FOR CALCULATING THE WIN/LOSS SCORE OF TWO TEAMS OVER LAST 10
GAMES ...................................................................................................................... 62
CODE SNIPPET 7 SQL FOR GETTING STATISTICS OF RECENT GAMES BETWEEN HOME TEAM AND
OPPONENT TEAM ....................................................................................................... 64
CODE SNIPPET 8 SQL FOR CALCULATING THE NUMBER OF GAMES IN LAST 5 DAYS FOR BOTH
TEAMS ...................................................................................................................... 64
CODE SNIPPET 9 SQL FOR GETTING NUMBER OF REST DAYS BEFORE A UP COMING GAME FOR
MIA......................................................................................................................... 65
CODE SNIPPET 10 SQL FOR GETTING THE OVERALL PERFORMANCE OF MIA IN THE LAST NBA
SEASON .................................................................................................................... 65
CODE SNIPPET 11 RUBY SCRIPT FOR GETTING ALL GAMES OF INPUT TEAM AT INPUT SEASON . 66
CODE SNIPPET 12 RUBY SCRIPT FOR RETRIEVE FEATURES CONTAINING STATISTICS ABOUT LAST
10 HOME GAMES OF HOME TEAMS AND LAST 10 ROAD GAMES OF ROAD TEAM ................. 67

1
1 INTRODUCTION
1.1 Introduction to Project
Before the advent of data mining, sports organizations mostly depended on human
experience which comes from coaches, scouts, managers, players. It was believed that
those experts will convert the history record into useful knowledge. But when the
scope of the data they collected more and more consummate, sports organisation
looked for more methods to harness those data they already had. Sports data mining
techniques can contribute for a better performance by leveraging historical game
records and combining game related information and is therefore more and more
people devote themselves to this field.
National Basketball Association (NBA) since its origin has over 60 years. During this
organisation grow up there are 30 teams formed and divided into Eastern Conference
and Western Conference. For the regular season will have 82 games for each team and
post season using a best-of-seven series scheme. So a conservative estimate, there will
be at least about 12,300 games generated.
A mass of data was generated after each NBA game played; those existed data allow
us to discover something invisible valuable knowledge. When people pay attention to
their favourite team or players, they definitely will concern about the game outcome.
However, predicting the outcomes of competitive sport has always been a challenging
and attractive work. This project focus on data mining techniques used to predict the
NBA game outcome.
1.2 Background
With the popularity of the Internet, the amount of information is explosive growth.
Faced with this boundless stretch of data, more and more people are devoted to
exploring the value of data. Although today‟s database technique can carry data size up
to hundreds of millions, there is still not a mature technique can be used to help us
2
understand data, analyse data, and covert data into useful knowledge. In the past,
people used to take the experience from experts to compare, filter, synthesize, and then
extract rules and knowledge. However, purely depend on the database knowledge to
search and combine data can not satisfy all the requirements from huge business needs.
Due to the limitation of the experts and leaders, the reliability of some of gained
knowledge will be discounted. When the traditional knowledge acquisition techniques
cannot handle the large amount of data, data mining techniques emerge as a practical
solution. Data mining is a cross-discipline subject, and its basic objective is to extract
hidden, potential and valuable knowledge from large amounts data. Now data mining
technique begin to shine in different area, and data mining technique become more and
more mature.
Likewise, the data in sports organization also increasing avaliable. In the past, sports
organization transformed historical data into useful knowledge mostly depend on the
experience from coaches, scouts and managers. However, relying only on the experts‟
experience and intuition could not discover all the value and potential of collected data.
A more science approach was needed to use the data, so sports data mining emerges as
the times require.
Currently, sports data mining has been successfully used in many fields, such as
baseball, soccer, cricket football, hockey etc. The most famous application is baseball.
People are familiar with the movie Moneyball which tells a story about team manager
Billy Beane who is The Oakland A‟s General Manager who used sports data mining
knowledge to organise his team and finally win the game. This book subverted
traditional sports management ideas. Billy Beane's philosophy is to use very little
funds to operate the club, he broke with the conventional method, using historical data
and data mining methods to build the evaluation model, and unitized low cost
purchased at low cost those undervalued players. Finally, made their team has the
ability to fight with the famous New York Yankees.()
Moneyball inspired people to ask the similar question in different types of sports. Dean
Oliver was the first data analyst who brought the data mining technique into basketball.
Currently, with the standardization and maturity of basketball rule, NBA wave rolled
up all over the world. Many data mining tools were born to NBA data mining, such as

3
Advanced Scout, Synergy Online etc. Meanwhile, those related data sources were also
more and more improvable.
When people were concerned about the highlight moments in the game, they also
started to think about forecasting the game outcome. It is different from digital lottery
which purely focus on lucky or rules, sports prediction has lots of factors to influence
the game outcome, and basketball itself is a competitive sport. But while there are
contingencies in the game result and also exists a certain level of inevitability. So In
this project, collected data will be used to explain the inevitability.
1.3 Research problem
Basketball is a valuable area for sports data mining since it already provides a readily
available database. Meanwhile, sports data mining has experienced rapid growth and it
begins with those sporting enthusiasts who seek prediction results, tools and related
techniques are developed to better measure both player and team performance.
Although lots of enthusiasts and experts devoted to research sports data mining in
basketball, these include: people used data mining methodology to adjust strategy by
coaches; like data mining used in baseball, and it also suit to basketball (e.g. choose
their players and control players‟ salary etc). There is still a broad space for
discovering more value. One of the most famous applications of data mining is
customer relationship management, especially for customer churn prediction. Data
mining gives lots of methods for forecasting.
Thus, data mining technique as a tool for performing NBA game outcome prediction is
the key research problem of this dissertation and the results can provide useful insights
on its application to data mining tasks and further research direction for this type of
resource.
1.4 Research objectives

4
Having in mind the research problem and intellectual challenges posed in the previous
sections, the objectives of this dissertation‟s research can be outlined as follows:
Investigate related field of data mining and knowledge discover technique.
Review research in sports data mining, the state of the applications, tools and
limitations for prediction performance.
Review literature on previous case and algorithms used in predicting sports game
outcome.
Collect dataset and manage data into a state of unity for the preparation of
experiment.
Divide data set into training, cross-validation, and test set; Experiment with
predictive algorithms.
Design the experiment use different techniques and evaluate the result with
applying dataset.
Analyse results and compare results with other research in the literature using the
same methodology.
1.5 Research methodology
As part of the dissertation, both primary and secondary research will be used during
the creation of this dissertation; the secondary research program will take the form of
an extensive literature review on the field of NBA history; machine learning algorithm
for predicting; data mining; sports data mining; sports data mining used in NBA and
others‟ similar research or experiment. The following resources were used to perform
research.
5
Research journals and periodicals (ACM, IEEE, SLAM etc)
Published paper in the relevant areas.
Websites and discussion groups associated to relevant research.
Published dissertation in the related areas.
Sports Newspaper.
The primary research is an experiment in prediction the results of the NBA games
which uses data mining techniques and machine learning algorithms. The experiment
is the key in this project and will involve the following process:
Automated collection of raw data from website publishing NBA statistics data.
Data management including database and data marts design and implementation
Design and implementation of predictive model fitting experiment.
Trained models scoring and evaluation.
1.6 Resources
In this dissertation, the following resources were identified as fundamental
requirements:
Data set was obtained from (basketball-reference.com); (Databasebasketball.com)
and the official NBA website (NBA.com). Some benchmark data for evaluating
this project is from some major NBA game result prediction website, such as
(Team Rankings).
Regularly contact with supervisor, for review and guidance throughout the
preparation of the dissertation.
Access to other members of DIT research staff as needed, for addressing more
technical questions and sharing ideas.
Personal Computer system or laptop of recent specification for setting up and
executing experiment.
Access to library resources for research in books and periodicals.

6
The WEKA data mining tool is chosen as the major tool for model fitting. It is
available as a stand-alone application for data analysis and it also provides Java
programming interface for deep product integration.
Ruby programming will be used in this project
Amazon EC2 cloud service will be rented for experiment due to the capability of
my own laptop is limited.
MySQL will be used for storing NBA game statistics information and game
related information and building Data Mart.
Computer with network access. The availability of a computer with Internet
access from DIT and home to remote database, relevant websites and Amazon
cloud services.
1.7 Scope and Limitations
This research aims to predict the result of the basketball game using data mining
technique with comprehensive statistical data and game related data and finally
generates a persuasive model. By taking advantages of machine learning approach,
ideally the predictive model would output reasonable prediction accuracy and this
model can be used as a reference to make game strategy before games or can be used
for sports betting.
The main research of this project is to use machine learning algorithms to predict the
result for basketball game, Logistic Regression, Support Vector Machine, Artificial
Neural Networks and Naïve Bayes respectively. So the accuracy of the prediction of
the result is the important point of this dissertation.
Although data mining technique has been used very commonly, in the field of
basketball game outcome prediction is still not mature. Most researches and
experiment utilized the statistics method and probability methodology to generate a
simple liner formula to forecast the game result, which inspires us to utilize different
method to try out. Logistic Regression is the simplest and most commonly used linear
classifier to separate linear separable classes. Support Vector Machine (SVM) with
non-linear kernels and Artificial Neural Networks are most popular non-linear

7
classifiers for capturing non-linear relationships among features. Naïve Bayes
Classifier is a model based on probability theory with assumption of conditional
indecency among features. These four models used in this project is very
representative, and they covers most common relationship among features.
Due to the most research in basketball is for coach to combine their team, the research
for predicting the game result most used the statistic method, meanwhile a different
choice of parameters than ones in this project, so a limited evaluation by experiment.
In another hand, basketball itself is a competitive sport which blends a lot of uncertain
factors like injury; competitive state good or bad; players‟ contract expired or player is
traded to other team, etc. The game result also has a close relationship with the players‟
ability. Many factors influence the game result which is the characters of competitive
sports, so the experiment outcomes maybe not fully accurate due to a number of
factors.
Because of NBA game in the whole season can be divided into pre-season; regular-
season and post season.
For pre-season, the function is to running line-up, test new and old players competitive
state; preheat the NBA regular season; promoting the NBA, the expansion of overseas
influence. Currently, most famous NBA team did not pay attention to the pre-season,
and not all the team joined the pre-season, so the dataset in the pre-season is not
representative and in this project, we did not focus on pre-season game prediction.
For post-season, because the rule is different from the regular season and teams always
continue fight with the others, so building a model is not suit for post-season.
Based on the consideration of authority and unpredictability, in this project the focus is
on predicting basketball game outcome for regular season
1.8 Organisation of the dissertation
8
The remaining chapters of this dissertation are organised into the review of relevant
research, data preparation, experiment design and execution, results evaluation and
analysis, conclusion. as follow outline:
Chapter 2 presents a review of research literature. The whole review process is a step
by step process from data mining to sports data mining specific used in basketball. It
first gives an introduction of data mining from concept to the process, and then goes
more detail to sports data mining, which includes the application and tools of data
mining in sports. Finally, stressing the sports data mining technique in basketball and
popular algorithms for prediction. In order to easily understanding the project for
readers and draw more people‟s interest to the basketball. As an extended review this
chapter also generally introduce the NBA origin, history and some basketball terms
will be used in this project.
Chapter 3 is the key of this project, in which data for this project is collected and well
managed. High quality and comprehensive data is also the premise of successful data
mining project, so this chapter will highlight the data collection and management
process, which involves data collection, data transformation, data integration, and data
marts.
Chapter 4 describes the NBA game prediction experiment: features selection and
model training workflow, the setup of the experiment, model fitting and the model
evaluation are discussed.
Chapter 5 describes model scoring workflow and the evaluation of the experiment
result. It will specifically explain the scoring result comparing with the similar research
in this field.
Finally, Chapter 6 concludes this dissertation. It reviews the dissertation‟s key
objectives, the research approach and results obtained. The key contributions to the
body of knowledge resulting of this research are presented, along with opportunities
for future research. The chapter concludes with final remarks on the overall
dissertation project.
9
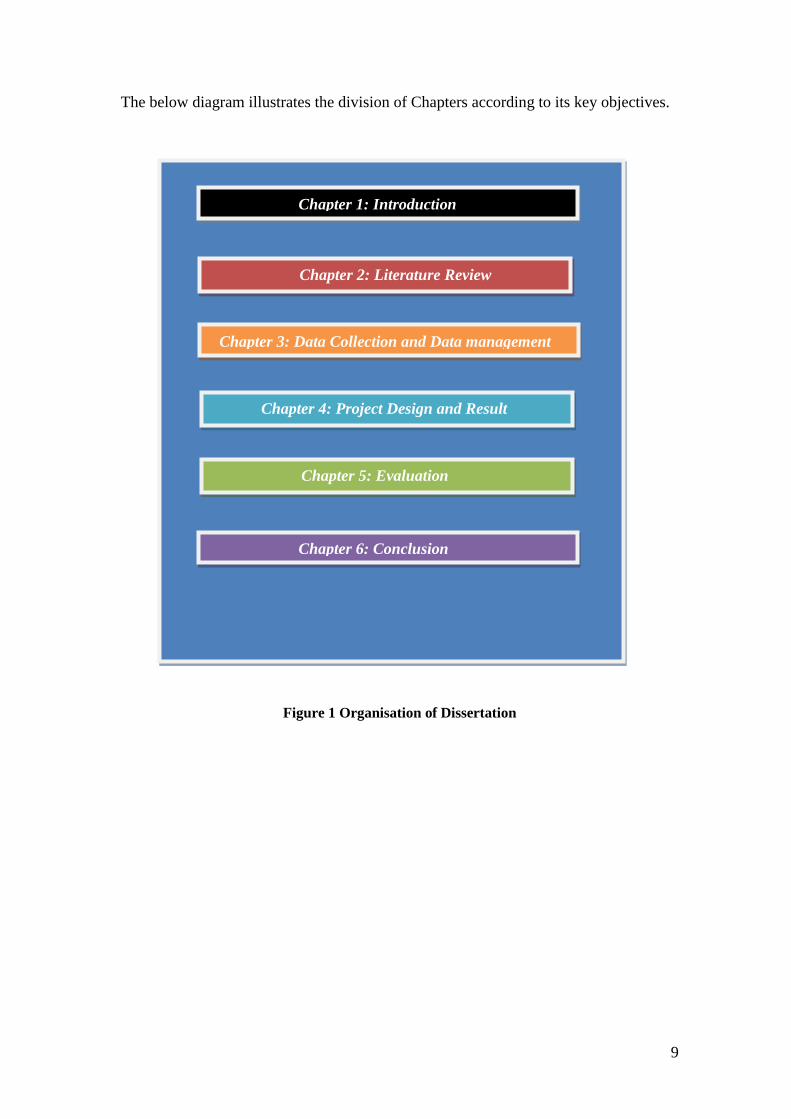
The below diagram illustrates the division of Chapters according to its key objectives.
Figure 1-1 Structure of the dissertation
Figure 1 Organisation of Dissertation
Chapter 1: Introduction
Chapter 2: Literature Review
Chapter 4: Project Design and Result
Chapter 5: Evaluation
Chapter 6: Conclusion
Chapter 3: Data Collection and Data management
10
2 LITERATURE REVIEW
2.1 Introduction
This chapter will review the source and document which related to the topic and
paves the way for future experiment. The whole review is a step by step process
which involves three main parts, from data mining, sports data mining to sports data
mining specific in basketball prediction. The following section will explain every part
in detail.
2.2 Data mining
In this chapter, research literature focus on the fields of data mining. The discussion
involves the concept of data mining, data mining functions, data mining techniques,
data mining applications and the data mining process.
2.2.1 Data Mining Concept
“Data mining is extracting or mining knowledge from large amounts of data” – Han
and Kamber (2006)
“Data mining is the extraction of implicit, previously unknown, and potentially useful
information from data”-Lan H.Written
“Data mining uses a variety of data analysis tools to discover patterns and
relationships in data that can be used to make reasonable accurate predictions. It is a
processes not a particular technique or algorithm.” – Edelstein (2008)
11
“Data mining is the process that uses statistical, artificial intelligence and machine-
learning techniques to extract and identify useful information and subsequently gain
knowledge from large databases” (Turban, E., et al., 2007, p.305).
There are different explanations for data mining, but all of those definitions give a
general consensus that data mining is discovering knowledge and information from
large amounts of data by identifying and analysing interesting patterns in data to find
the potential rules. Han and Kamber define it in terms of extracting information and
knowledge from data and the “knowledge” is explained more detail for implicit,
previously unknown, and potentially useful information by Lan H.Written. Then
Edelstein‟s definition shows a further clarification that data mining is not a set of
algorithms or a technique but a process. In the explanation of Turban, this process is
provided a more complete definition which the process involves statistical, artificial
intelligence and machine-learning techniques.
Data mining has its origins in lots of disciplines and the most important of them are
statistics and machine learning.
As Turban mentioned data mining uses many machine learning models to discover
hidden pattern in data. Machine learning is a hot topic in computer science academic
and it has its origins much in computer practice. Its goal is to develop a mathematical
model which can be reused in to predict future trends, classify unseen data or discover
hidden patterns in a data set. Clustering, Classification and Regression are popular
machine learning topics. Around these topics, a number of mathematical models have
been built and used practically widely.
Statistical method has its root in mathematics and it is also popular in Data mining.
Anomaly detection is a popular application using Gaussian statistical model to detect
outliers. Many statistical methods are also used to prepare data and evaluate the output
models.
There are many other tools such as association rule and decision tree model used in the
data mining. Visualization is also a power full way of representing hidden knowledge,
especially for business people who do not know data mining techniques well.

12
Data mining is also known as database knowledge discovery (Knowledge Discovery in
Database, of KDD), which is a new emerging database technique along with the
database and artificial intelligence. Specifically, data Mining is a technique which
focuses on the information hidden in a large number of data which seems chaotic,
noisy, fuzzy random data to extract and draw out implicit, previously unknown, but
potential useful information and knowledge, in order to find out the inherent laws of
the research object.
In recent years, data mining has caused a great concern of the IT industry and is one of
the fastest growing fields in the computer industry. Data mining has a greatest strength
that data mining is reflected in its wide range of methodologies and techniques that can
be applied to a host of problem sets. Due to large amounts of data widely available,
and the urgent need to convert these data into useful information and knowledge,
obtaining information and knowledge has been widely used in various applications,
such as business management, production control, market analysis, engineering design
and scientific exploration customer relationship management, bioinformatics, counter-
terrorism, business, and other fields.( M Kantardzic , 2011)
As the most important component of the dissertation, a clearly understanding of data
mining concept will benefit for the further research. About data mining concept, there
are different explanations, so a systematic review of data mining concept is significant
not only for researchers but also for public enthusiast
2.2.2 Data Mining Tasks and Functions
The data mining functionalities and the variety of knowledge they discover are briefly
presented in the following list (Tan et al, 2006):
Characterisation: Data characterization also called data summary. The purpose of
characterisation is summarisation of general features of objects in a target class,
and produces what is called characteristic rules. The simplest characterisation is
13
using statistic methods to calculate the sum, the mean, variance, etc of each item
in the database, or using OLAP (0nline Processing Analytical Process) to achieve
multi-dimensional query and calculation of data or draw histograms, line charts
and other statistical graphics.
Discrimination: Data discrimination is a comparison of general features of target
class data object against the general feature of objects from one or multiple
contrasting classes. It produces discriminant rules and is basically the comparison
of the general features of objects between two classes referred to as the target
class and the contrasting class.( Osmar R. Zaïane, 1999 )
Association analysis: Association analysis is from the large amounts of data to find
interesting associations or relationship between item sets. As the data keeping
collection and storage, people are increasingly interested in mining the association
rules from their databases. From a large number of business transaction records
found interesting relationship can help many business decision making. The main
association analysis algorithm involves that Apriori; AprioriTid and FP-growth.
Classification: Classification analysis also known as supervised classification. In
classification, the actual label or category for each piece of the training data is
already given. The classification algorithm learns from the training set and builds
a model. The model is used to classify new objects.
Prediction: More and more people pay attention to use the prediction method to
forecast business thing. The major idea is to use a large number of past values to
predict probable future values. The process is using the previous data to discover
the rules and build the model. Forecasting is concerned with the accuracy and
uncertainty, often used to predict the variance measure.
Clustering: It is similar to classification but different from classification, clustering
is also called unsupervised classification due to the classification is not dictated by
given class labels. The class labels are unknown in clustering, and it is up to the
clustering algorithm to discover acceptable classes.
Outlier analysis: Database may contain some data objects which are not fitted the
common behavior, those objects are outliers. They can be easily identified and also
be viewed as noise in some applications. However, the exits of outlier has very
particular meaning and analysis valuable. For example, in fraud detection, those
outliers mean fraud behaviors.
Evolution and deviation analysis: Evolution and deviation analysis belong to time

14
series analysis. Evolution analysis models can be used to discover the data trend
and search similarity. Deviation analysis considers differences between measured
values and expected values, and attempts to find the reason of the deviations from
the anticipated values.
After looked the different, we can see that prediction is one of the data mining function
which widely used in business and prediction technique also will be utilize in the
following experiment, so this plays a supplementary role for the key experiment.
2.2.3 Data Mining Techniques
Data mining involves several disciplines and approaches, based on various tasks; data
mining can be classified into Association, Classification, Clustering, Predictions,
Sequential Patterns, and Similar Time Sequences. Depend on different explore
methods; data mining can be generally divided into machine learning, statistics, neutral
network and database. In machine learning, it can be divided more detail, such as
inductive learning, case-based learning and genetic algorithm, etc. In statics, it can be
divided more detail into regression analysis, clustering, discriminant analysis and so on;
for the neural network methods, it can be divided into self-organizing neural networks
and feed-forward Neural Networks. The main method in database is Multidimensional
data analysis and On Line Analytical Processing.
There is no data mining method can cope with all the requirements. For a particular
problem, the characteristics of the data itself will affect the choice of tools. The
following paragraph will generally introduce several basic methods which involves
decision tree and logistic regression.
Decision tree
Decision tree is a method for classification by modeling a tree structure model with
leaves representing class labels and branches representing conjunctions of features.
Then method is known as "divide and conquer". The output of the learning process is a
classification tree where the split at each node of the tree represents one if -then
decision rule and each leaf correspond to one value of the target variable. Given an

15
example its target could be predicted by starting from the root and going down to a leaf
of the decision tree by matching the variables (features) of the example with the
splitting conditions at each node. The training algorithm chooses at each step the best
variable to split the set of training examples.
The criterion to compare between variables is how well the variable split the set of
training examples into homogeneous subsets of examples with respect to the values of
the target variables.
Examples of the splitting criterions used to choose a variable are
- the Gini Impurity:
- Information Gain
The popular application of decision tree in CRM domain is customer classification.
Decision tree is a very easy model and can be understand by non-professional people.
It is such a simple model that it may not perform well on complex classification
problems.
Logistic regression
Logistic regression model is one generalizations of the linear regression model where
the target variables are discrete class labels. For the binary classification problem, the
linear function is extended by the logistic function
to
be with .
The output has the value in the range (0,1) and is interpreted as the probability
that the class (target variable) is 1 given the example X . Correspondingly the
probability that the target variable is 0 given the example X is .
The example x is classified to class 1 when . The parameter is
determined using the maximum likelihood solution, which means for the training
set is determined as the solution of the minimization problem:
.
Since is a convex function it has a global minimum and its solution could be
determined by popular optimization techniques like the gradient descent algorithm.
The performance of the determined model can then be measured on the validation set.
16
Logistic regression is also a classification algorithm and can be used to do customer
classification in CRM domain. It is a power full model for complex classification
model. But it does not take nonlinear feature into consideration.
There are lots of data mining techniques and for the key model such as Logistic
Regression; Artificial Neural Networks; SVM and Naïve Bayes which used for this
project will be discuss more detail in the next section.
2.2.4 Data Mining Tools
The following section presents and introduces some popular data mining tool, and
Weka as the main tool for the experiment will be explain more detail.
SAS (Enterprise Miner)
SAS (Enterprise Miner) is very commonly used of integrated tool for data mining
which gives a variety of data manipulation and transformation choices. It can run on
different platforms such as Windows and UNIX, It enables user to discover data
patterns among large sets of data and provide tools to export the graph visualized
report via Webpage formatted report. It also provides a rich, easy-to-use set of
integrated capabilities for creating and sharing insights that can be used to drive better
decisions. However this is not an open-source tool for public, so it mostly commonly
used in colleges, originations and companies.
RapidMiner
( Ohana, B., 2009) RapidMiner is an open source data mining tool for experimenting
with machine learning and data mining algorithms which emerged from the YALE data
mining environment. Through this tool users can easily build, execute and validate
data mining models; integration with algorithms implemented for the Weka toolkit,
making them accessible from inside RapidMiner; it also supports for a wide range of
17
tasks like SAS on data loading, data transformation, data modelling, data visualization
methods, data analysis, prediction and clustering.
Weka
Weka is a data mining tool which integrates several machine-learning tools within a
common framework and a uniform GUI. Classification and summarization are the
main data-mining tasks supported by the Weka system. Users can use GUI or their
own Java consuming Weka‟s API to perform machine learning tasks directly. Weka
has the function for data pre-processing, classification, regression, clustering,
association rules, and visualization.
Weka with GUI is chosen as the tool for the model fitting process of this project.
Because Weka provides all functions required by this project, including data pre-
processing, all classification models, and result analysis tool. Weka with GUI also
provide KnowledgeFlow tool, which can help user to manage their model fitting
workflow. Weka‟s powerful functionalities and intuitive user interface are the major
factor that we choose this tool.
2.2.5 Data Mining Process
Data mining can be generally divided into 3 main processes: data preparation, data
mining and result expression understanding. Combine with the Crisp-DM steps
(Chapman et al, 2000), which are a data mining process model that describes
commonly used approaches that expert data miners use to tackle problems. The data
mining process can be generally divided into the following phases and the figure
below shows the whole process:
Problem definition
A data mining project starts with a correct understanding of the business problem.
Here the understanding can be explained into the project objectives and the
requirements from a business perspective. The project objective is then translated into
a data mining problem definition and will give a direction for the following work. In
the problem definition phase, data mining tools are not yet required.
18
Data collection pre-processing
Data collection is to acquire the data; it can be either extremely simple or very
complicated (i.e., trying to glean useful data from a large system). Obtain data can be
either automatically or manually.
These processes include: data selection, data pre-processing and data conversion.
The purpose of data selection is to determine the related objects involved in data
mining tasks, according to the specific requirements of the data mining task, extracted
from the relevant data sources and mining related data sets.
The data pre-processing usually consists of the elimination of noisy data; handling
missing data; eliminate duplicate data and data type conversion processing.
The main purpose of the data conversion is to reduce the data set and the feature
dimension (referred to as dimensionality reduction), Preparing the data for the
modelling tool by selecting tables, records, and attributes, are typical tasks in this
phase. The meaning of the data is not changed. Filtering the real feature which related
to the data mining tasks in order to improve the efficiency of data mining.
Modelling
There are many data mining functions can be used to solve different type of problems.
In this phase, through applying and selected various modelling techniques several
times to calibrate parameters into an optimal state until best values are achieved. When
the final modelling phase is completed, a model of high quality has been built. (IH
Witten, E Frank, MA Hall - 2011)
Evaluation
Evaluating the model mean to estimate the model whether satisfy the expectations or
not. If the model does not fit the original expectations, they go back to the modelling
phase and rebuild the model by changing its parameters until optimal values are
achieved. When the models are finally satisfied with the targets, they can extract
business explanations and evaluate the questions like:
Whether the model fit the business objective or not?
Did all business factors be considered?
Then, how to take advantage of the data mining results?
Deployment

19
In this step will involve deploy plan, monitor and maintenance plan, finally express the
results and understand the results. Results can be exported into database tables or into
other applications, for example, spreadsheets and also can be display by visualization
technique.
Figure 2 Data Mining Process
So follow by this step, the main process will be applied to the experiment which plays
as a guidance role for the project.
2.2.6 Data mining applications
With the increasing data volume, data mining technique has an ever increasing
utilization in different field. The following paragraph will present some famous
applications of data mining technique:
Bank
Bank has special position in the financial sector, due to the nature of the work,
operational characteristics, and the fierce market competition determines it has more
requirements about information and electron than other areas. However, for a bank
Problem definition
Data collection
Data pre-processing
Modelling
Evaluation
Deployment
20
business, the risk and profit both do coexist, In order to ensure the maximum profit and
minimum risk, using scientific way to evaluate and analysis the customer account and
do the credit assessment is necessary. Through using data mining technique can help
product development department to describe the trend in customer previous demand
and then predict the future. It helps bank to prevent fraud cheating and reduce the loan
losses. Using data mining technique also help bank to divide their customer into
different categories then focus on different group to design different programs to
increase profit and keep customers.
Sales
The most classics case in sales is the “beer and napkin” which is widely read by
industry and business. The story tells a company, which is Wal-Mart used data mining
tool to analyse vast amount of data from database and accidentally find that the most
frequent item people buy with the napkin, is the beer. The case reminds market sales to
adjust the goods layout and put the beer and napkin together to increase the sales.
However, data mining function for sales more than that. For example: data mining can
help business make sales market strategy; reduce the inventory cost; analysis and
predict seasonal, monthly sales trend; better understand customer buying habits and
manage customer relationship and discover customer purchasing ability to achieve
accurate merchandising, etc.
Medical science and DNA
Data mining used in biomedicine will undoubtedly benefit for human. For example, a
combination of genes is ever changing, what is the difference between disease genes
and normal genes? How to change the difference and turn it to be normal? Those
questions will require the support of data mining technology. Data mining also help
people to detect the character of one disease then find and treat it before the disease
progresses.
Weather forecasting
Data mining used in weather forecast is another popular field. Meteorological
department has accumulated a lot of meteorological data; take advantage of those data
can improve the accuracy of weather prediction and reduce the loss by natural disaster.
Climate will influence our daily life, it also has a close relationship with agricultural
21
production, and meanwhile, agriculture is the key component of country‟s economy.
So weather forecasting domain draws a lot of scientists‟ attentions. Neural network,
classification and clustering has been gotten a widely used in climate prediction.
Stock market
Stock market plays an important role in economy,effective stock forecast is very
important in financial investment field, however, stock market is influenced by various
complicated factors like policy, economy and investors‟ mentality, etc. Purely depends
on personal experience may not accurate enough. So data mining has extraordinary
theoretic significance and practical value for stock analyzing and predicting. Currently,
lots of algorithms have been used for predict the stock price and help stock investors
make the right decision timely. Meanwhile, people combine data mining technique to
design software to help those stock investors automated buys and sells which achieves
the effective utilize time and make decision more accurately.
2.2.7 Summary
This section introduces the basic concept of data mining from data mining tasks, data
mining techniques, data mining process to data mining tool and application which give
a comprehensive explain of data mining. The aim was to give an understanding of
what data mining is used for and what the data mining status quo. Some of the main
techniques were discussed briefly such as the decision tree, logistic regression. As data
exist everywhere, so data mining has a broad space for development and sports data
mining is one of the new rising growth areas.
2.3 Data Mining in Sports
In this section, sports data mining, which is an emerging field in data mining, will be
introduced. To begin with we will provide a brief background on the basic knowledge
about sports science, including details on sports science concept; origins and research
scopes these will be discussed in later sections. In the next section, a short review of
22
sports data mining applications is given, such as baseball, football and so on. Echo
with the above section, some popular sports data mining tool will be discussed in detail.
2.3.1 Sports Science and Sports Data Mining Research
Sport Science is a discipline that studies the scientific principles application and
techniques with the aim of improving sporting performance. It involves a broad field
like medicine, psychology, biochemistry, biomechanics, and other natural sciences, but
also includes the field of philosophy and history, economics, sociology, education and
other social sciences. (Kent, M., 2006)
Sports concept can be divided into broad and narrow scale:
From the broad view, it refers to use physical exercise as the basic methods, take
boosts health, promote human full-scale, rich social and cultural life, promoting the
construction of mental civilization as purpose. It is part of the society culture, and its
development will be constrained by political and economic, meanwhile it service for
political and economic.
From the narrow view, it refers to a technique or a skill that will increase our energy
level and it is also a process of training our will. Sports science has been added as our
daily module which is an important part of education. With the Olympics game has
been got more and more concern, sport science has been viewed as one of important
aspect to develop a comprehensive people.
Modern sport should trace back to the 19th century, Arnold who was a British educator
was the founder of modern sports. He took sports as a school curriculum in 1828. Then
the French bourgeoisie educator Pierre de Coubertin as the founder of the modern
Olympic game, put competitive sports into the international scope, and established the
foundation for modern competitive sports. Organized to carry out sport science
research from the early 20th century began. Japan set up a National Sports Institute in
1924 then the Soviet Union established the Office of Scientific Research at the
Moscow Institute of Physical Education and later developed into the Moscow Institute

23
of Sports Science. After World War II Sports science research truly carried out in the
world.
Compared with the discipline like philosophy, history, etc, Sports science is still very
young as a subject. It was very incomplete which cannot meet all the requirements of
the sports practice. (Stone, M.H., 2004) However, Sports Science is a comprehensive
scientific with the rapid development of scientific and technological level and the
growing popularity of sports, sports science has developed into a relatively
independent of the disciplinary system, and play a significant role in raising the level
of competitive sports, the rich people's cultural life. ( Burwitz et al, 1994)
The rapid development of modern science and technology has brought rapid changes
to the sports. At present, the sports science research mainly focuses on competitive
sports. From the training part to the final competition, each part closely combines with
the scientific and technological research work. On the other hand, modern science and
technology research has been introduced to the field of sports more than before. For
example, the use of the application of computer technology, the application of laser
ranging technology, radio-controlled technology, and the plastic track, artificial turf,
glass, steel pole, leather bathing suit, etc.
Speaking to the computer technology, we have to mention of the data mining
technique. Traditional decision making method which using the intuition or gut
instincts has been out of the time, instead of this is digital era embracing into the sports
analysis. Sports data mining has a lot of functions, such as matching players to certain
situations, measuring individual player contribution, evaluating the tendencies of
opposition, uncovering new knowledge and exploiting any weaknesses, etc. However,
sports data mining today is still in its infancy and there is a vast of functions awaiting
discovery.
2.3.2 Sports Data Mining Applications
Sports are ideal for application of data mining tools and techniques due to the vast
amounts of statistics are growing and collected for each player, team, game, and
24
season. Sports organizations use data mining in the form of statistical analysis,
pattern discovery, outcome prediction, performance prediction, and scouting,
selection of players, coaching and training and for the strategy planning. Currently,
Lots of different sports began to utilise data mining technique as their competitive
advantage such as football, soccer, greyhound, soccer etc. The following paragraph
will review relevant research related to sports applications and give a briefly
summary some famous sports data mining applications.
Soccer
AC Milan is the Italian professional soccer club, the most famous case by AC Milan is
that they uses the prediction model to help predict player injuries through analysing of
different channels data. The biomedical tool created by Computer Associates produces
predictions from the medical statistics amassed for each player then compared the
results against a baseline. When any workout result falls below the baseline
expectation, which is a signal either an injury has occurred but the player did not
reveal or an existing injury has worsened. (Flinders, 2002) Athletes injury is one of
the biggest investments for sport organization, so this predictive software is very
successful since it will help organization save millions of dollars. (Schumaker, 2010)
Baseball
We all familiar with the book MoneyBall, which published in 2003 by Michael Lewis
tells a story about team manager Billy Beane who is The Oakland A‟s General
Manager used sports data mining knowledge to organise his team and finally win the
game. This book was adapted into a movie and was released in 2011. Billy is starred
by famous movie stars Brad Pitt. This book subverted the traditional sports
management ideas. Billy Beane's philosophy is to use very little funds to operate the
club, he broke with the conventional method, using historical data and data mining
methods to build the evaluation model, and unitised low cost purchased those
undervalued players, and finally, made their team have the ability to fight with the
famous New York Yankees. (Gerrard, B. & Howard, D., 2007) This is one of the
most famous cases which used data mining technique to manage baseball team
performance. Therefore Billy Beane became one of pioneers in sports data mining.

25
Rugby
New England Patriots which is a rugby team come from American, this team has been
very successful recently because four league games and three victories in the Super
Cup. This result contributes to the extensive use of data analysis models, no matter in
the field or off the court. Deeply analysis can help this team chose players more
effectively and also help this team pay to their player's salary is lower than the upper
limit of the industry wage. Unlike the other teams which chose players by scouts, they
put some non-traditional feature to consider, such as, intelligence, and willingness to
integrate itself into the team and so on.
Greyhound Racing
There are many cases that data mining techniques used for predictive purposes;
greyhound racing is one of them. Dr. Hsinchun Chen who is a professor of
Management Information Systems at the University of Arizona used Machine
Learning Approach to predict greyhound racing result successfully. In their experiment,
various data components were used to train the system, which involves symbolic
Learning, and neural networks algorithms then test the predictive capabilities of
machine learning against those of human experts in greyhound racing. (Sicard et al,
1999)This idea also fit to the thoroughbred racing. Undoubtedly, data mining
technique support a broad space to discover the sport area.
Track
Dr. Gideon Ariel who is the founder and Chief Executive of the Board of Ariel
Dynamics, Inc., he founded Computerized Biomechanical Analysis, which is a
company to give analysis for athletes‟ techniques in 1968. Before the Montreal
Olympics, he analysed threw technique for Mac Wilkins who is an American athlete,
and competed mainly in the discus throw. He found that he did not make full use of his
leg power before he threw out of the discus, so he lost part of power to affect his final
performance outcome. Through computer simulation calculations, if this error could be
corrected, his results can be increased by three meters. Then Wilkins follow Ariel‟s

26
proposal to improve its own technology, and finally he improved more than three
meters and created a new world record. (Stein, 1999)
2.3.3 Sports Data Mining Tools
Currently, sports data mining tools as the derivatives of the data mining technique‟s
has been emerged in a large number, players, coaches and rivals can get a better
understanding of their competitive level by using sports data mining tools. So a new
industry is rising which takes applying data mining to sports for commercial as
purpose. The following session will introduce some popular sports data mining tools:
Advanced Scout
IBM developed Advanced Scout in the mid 1990s as a data mining tool used for
National Basketball Association (NBA) data analysis. The application is specifically
tailored for NBA coaches and statisticians to discover the hidden patterns or features in
basketball data, which provides a new insight by using the business intelligence and
data mining technique. (Colet et al, 1997)
There are two data sources for this tool, one came from a courtside collection system
include the time stamped events data such as shots, rebounds, three goal, etc. The other
source is the game tape includes game footage. This source can be kept by coaches to
prepare for upcoming opponents as well as to check mistakes and improve effective.
(Schumaker, 2010)
Digital Scout
Digital Scout is a software used for collecting and analyzing game-based statistic and
tools for baseball, basketball, and football, etc. It also supports the function of
producing reports. For instance, baseball hit charts, basketball shots charts and football
formation strengths. (Solieman , 2006)
Synergy Online
27
This product has the similar function with Advanced Scout that dedicates to
basketball-based multimedia and contains an index of live video broadcasts as
searchable media. Coaches, players and fans can query plays in real-time and receive
constantly updating player statistics by using this software. ( Schumaker, 2010)
NHL-ICE
In recent years, hockey has experienced a data-centric rebirth. The National Hockey
League established a technology development joint-stock company with IBM to
develop data mining application NHL-ICE. This data mining application is similar to
the advanced scout in principle, which is an electronic real-time game scoring and
statistics system. The coaches, broadcasters, journalists, and fans can dig the statistics
data through this application, when they visit the website of the NHL, fans can use this
system to watch the game repeatedly, and meanwhile broadcasters and reporters can
discover those data and try to find out the gossip with all sorts of addenda to their
reports. (Knorr, 1998)
2.3.4 Conclusion
This chapter gives a briefly summary of the data mining technique specific in sports.
The motivation is to generally introduce the sports data mining from sports science
history, sports data mining application to sports data mining tool. The sports data
mining application covers soccer, greyhound racing, tracking and baseball. The sport
data mining tools involve that SAS, NHL-ICE, Synergy Online, Advanced Scout and
Digital Scout which are popular currently. This section serves as a link between the
previous chapter and the following chapter.
2.4 Data Mining in National Basketball Association
Compared with the above paragraphs, which focus on the data mining technique used
in sports, the following paragraph will describe the NBA data mining technique in
detail.
28
Corresponding with the sports science development history, the first part describes the
background of NBA history, this paragraph will give those basketball fans a better
promote knowledge and meanwhile for those people who are not interested in
basketball will be a simple introduce and then review the related research of data
mining techniques used in basketball. In order to meet the need of the following
experiment design, some basis technical term will be explained. NBA game outcome
prediction related research and predictive analysis algorithm used in the following
experiment will be presented and discussed as well.
2.4.1 NBA Introduction
Basketball is one of the most popular sports in the world. It originated on American
and it is a team sport, which the target is to shoot a ball through a basket horizontally
positioned to score points with a set of rules. Usually, there are two teams of five
players play on a marked rectangular court, each width with a basket. (Griffiths, 2010)
With the basketball getting more and more attention, there are lots of organizations
formed, such as National Collegiate Athletic Association (NAA), National Wheelchair
Baskteball Association (NWBA), American Basketball League (ABA), Continental
Basketball Association (CBA) and National Basketball Association (NBA), etc.
NBA was started in 1891 by Canadian American Dr. James Naismith who was the
physical education professor and instructor of Springfield College in Massachusetts.
Due to the restrictions from the weather, Dr. James Naismith started to seek a vigorous
indoor game to keep his students occupied and at proper levels of fitness. That is just
the original intention of basketball. After fixed some of the idea, Dr. James Naismith
wrote some basic rules for basketball and nailed a peach basket onto a 3.05 m elevated
track. Different from the modern basketball, the original basketball retained its bottom,
and balls had to be retrieved mechanically after each basket was scored; then to
improve the efficient, they removed the bottom of the basket to allow the balls to be
poked out with a long dowel each time. People used to call it “Naismith ball” and after
a long time, James Naismith and his colleagues decided to give it a name: “basketball”.
29
Naismith invented basketball since he was 30 years old, but basketball was born nearly
half a century has always been neglected, basketball get its respects until the 1936
Berlin Olympic Games. Since then, basketball gradually draws more attention and
formed Basketball Association of America (BAA) in 1946, then in 1949 this
organisation renamed to National Basketball Association and this name is still use
today.
Currently, NBA has 30 teams, they are divided into Eastern Conference and Western
Conference, the Eastern Conference involves Atlanta Hawks, Boston Celtics, Charlotte
Bobcats, Chicago Bulls, Cleveland Cavaliers, Detroit Pistons, Indiana Pacers, Miami
Heat, Milwaukee Bucks, New Jersey Nets, New York Knicks, Orlando Magic,
Philadelphia 76ers, Toronto Raptors and Washington Wizards respectively. The
Western Conference includes Dallas Mavericks, Denver Nuggets, Golden State
Warriors, Houston Rockets, Los Angeles Clippers, Los Angeles Lakers, Memphis
Grizzlies, Minnesota Timberwolves, New Orleans Hornets, Oklahoma City Thunder,
Phoenix Suns, Portland Trail Blazers, Sacramento Kings, San Antonio Spurs and Utah
Jazz.
Each team has 5 players in the court; they can be classified into the five positions:
point guard, shooting guard, small forward, power forward, and centre. The following
figure shows the position of five players.

30
Figure 3 Basketball Player Position
Different position has their different functions :
1. Point guard: usually the fastest player on the team and response to organize the
team's offense by controlling the ball and insure the ball gets to the right player at
the right time. (Trninic, S. & Dizdar, D., 2000)
2. Shooting guard: plays a role to create a high volume of shots on offense and guard
the opponent's best perimeter player on defence.
3. Small forward: typically somewhat shorter, quicker, and leaner than power
forwards and centers and mainly responsible for scoring points via cuts to the
basket and dribble penetration; they are considered to be perhaps the most versatile
of the main five basketball positions on defense (WANG, L.,2008)
31
4. Power forward: plays offensively often with their back to the basket and not
allowed the opponents to penetrate and score.
5. Center: often has a great deal of strength and body mass as well, uses height and
size to score (on offense), to protect the basket closely (on defense), or to rebound.
The above descriptions just a general description, actually it is more flexible than that.
Depend on different situation; three guard offenses can replace one of the forwards or
the center with a third guard. The most commonly interchanged positions are point
guard and shooting guard when both players have good leadership and ball handling
skills. (Miller, S. & Bartlett, R., 1996)
2.4.2 Data Mining Techniques Used in Basketball
As the aftershock of Baseball, Dean Oliver does the similar question in basketball
during the 1980s and 1990s. He applied statistical analysis techniques to basketball
and created ABPRmetrics (Association of Professional Basketball Researchers) used
for creating better measurements and statistical yardsticks for comparison purposes.
ABPR metrics is similar to sabermetrics which is one of the earliest metrics to evaluate
the baseball players‟ performance but ABPR metrics attempts to view statistics in
terms of team rather than individual performance. (Schumaker, 2010)
The same function to evaluate players, Player Efficiency Rating (PER) is another way
to evaluate a player effectiveness based on per-minute rating. (Hollinger, 2002). This
formula consider many variables like assists, blocked shots, fouls, free throws, made
shots, missed shots, rebounds, steals and turnovers among others and tries to quantify
player performance in regards to their pace throughout the game and the average
performance level of the league. After understanding the contribution of each player,
coach can reward positive contribution and punish negative ones. However, PER is
still arguable due to it does not take into account all of performance related criteria,
such as hustle and desire (Hollinger, 2002). Although, this method is limited on some
occasion, it still can identify new insights into offensive capability and provide
valuable insight into player execution. (Solieman, 2006)

32
Another case of data mining technique helps to improve NBA efficiency is Shot Zones.
There are 16 areas in the basketball court where a player on offense might be inclined
to shoot a basket. Through analyzing the percentage of player success of each zone,
defensive adjustments can be made to limit scoring while offensively; coaches may try
to maximize these types of shots. (Beech, 2008)
The following figure shows the different shot zone locations.
Figure 4 Shot Zone Layout (82games.com)
Except the tools which introduced specific for basketball in the above section, such as
Advanced Scout software and Synergy Online and the evaluation metric for palyers
mentioned above,(Chen, C.Y. & Lin, Y.H., 2006.) Dick and Sack (2003) did a research
about effective marketing techniques in the NBA in order to find a more effective way
to ensure that advertising messages are received by the right target markets. This
technique used by lots of successfully teams, such as Cleveland Cavaliers, the Seattle
SuperSonics, the Portland Trail Blazers, and the Miami Heat. The Cleveland Cavaliers
created a database, which involves some personal information like customers‟ names,
addresses, telephone numbers, and other detailed information on the products
purchased. By analyzing that the relationship of those features to determine whether
they were interested in other games or events. (Bonvissuto, 2005). The Portland Trail
Blazers use predictive model to analyze their customer database and forecast
advertising revenues and spot ticket-sale trends (Whiting, 2001). By using data mining
technique ,the overall Miami Heat season-ticket renewal rate increasing about eight-
five percent in 2005 than expected. (Lombardo, 2005).
33
2.4.3 Basketball Game Outcome Prediction Research
Although data mining has been successfully used in different fields and the sports
organisation is a large business waiting to be discovered, sport data mining is not
mature enough, especially for predicting the game outcome. There are lots of uncertain
factors to influence the result; however, data mining still has its own value in
forecasting the outcome. The following section presents a brief review of data mining
technique used for basketball game outcome prediction.
NCAA College Basketball researchers are predicting tournament matchups and
victories with impressive accuracy. Jay Coleman and Allen Lynch – a professor of
Economics at Mercer University used SAS to develop a formula for predicting the
outcomes of the NCAA tournament games called the “Score Card”. This system has a
75 percent success rate in predicting winners. However, Score Card has not been
made public. (Solieman , 2006)
Bernard Loeffelholz, Earl Bednar, and Kenneth W. Bauer did a research of predicting
NBA games by using neural networks. Authors explored subsets obtained from
signal-to-noise ratios and expert opinions to identify a subset of features input to the
neural nets. Results obtained from these networks were compared to predictions made
by numerous experts in the field of basketball. After experiment, their project got
74.33 percent accurate. (Loeffelholz, B., 2009)
David Orendorff and Todd Johnson used the Bayesian Logic (BLOG) and Markov
Logic Networks (MLNs) to predict the NBA game outcome. Their project considers
the task of predicting the winner of professional basketball games based on historical
data.After the prediction accuracy of models implemented in the BLOG and MLN
frameworks are compared using cross validation for the 2006-2007 season. MLN
method got 64% accuracy and 63% accuracy for the BLOG model respectively.
(Orendorff, D., 2007)
Feifang Hu1 and James V Zidek2 forecasted NBA playoff outcome by using the
weighted likelihood method. In their experiment, they use all relevant sample

34
information also consider the reflection of the home game advantage. Finally, we
demonstrate the value of the method by showing how it could have been used to
predict the 96/97 NBA playoff results which is a high accurate. (Hu, F.,2004)
Matthew Beckler, Hongfei Wang and Michael Papamichael applied machine learning
techniques to predict the game outcome for NBA,in their experiment, Logistic
Regression get the accuracy of 68.1%, The accuracy achieved by linear regression is
65.4% and Support Vector Machines received an overall classification accuracy of
66.9%.(Beckler, M., 2008)
Neil C. Schwertman; Kathryn L. Schenk and Brett C. Holbrook used National
Collegiate Athletic Association (NCAA) regional basketball tournament data to
develop simple linear regression and logistic regression models by using seed
position to predict the probability of each of the 16 seeds winning the regional
tournament. ( Schwertman, NC.,1996)
Other research related to the competitive sports game outcome prediction
Except those experiments which focus on basketball game result prediction, the
following we will review some similar experiments which used data mining
techniques to forecast the game outcome in other competitive sports:
Harville (1980) used data mining regression methods based on historical point spread
to develop a method for forecasting the point spread of NFL (National Football
League). This research can be also used for predict the game result since these
forecasted point spreads can be used to predict NFL game winners.( Loeffelholz,
B.,2009)
Purucker (1996) did an experiment which applied back-propagation, self-organizing
maps (SOMs) and other neural structures to predict the winner of a football game in
the National football League (NFL). After he tried several training methods then he
found that backpropagation would be best to develop a model with greater predictive
accuracy than various experts in the field of football predictions. The accuracy can
35
achieved 61% accuracy as compared to the 72% accuracy of the experts. (Purucker,
M.C., 1996)
Pardee also use backpropogation for the college football prediction analysis. In his
experiment, the 1998 season data was used to train and the subsequent 1999 season
data used for testing. Over 100 trials resulted in an average prediction rate of
76.2%.( Loeffelholz, B.,2009)
Kahn applied backpropagation and neural network structure to predict NFL football
games. He extended the work of Purucker (1996) and attained 75% accuracy which
performed better than Purucker 61% accuracy and also slightly better than the experts
in the field. Both of authors used differential statistics from the box scores rather than
raw statistics. (Kahn, J.,2003)
2.4.4 Popular Predictive Analysis Algorithm
This paragraph will briefly introduce the main algorithms will be used in the following
experiment which involves Logistic Regression, Artificial Neural Networks, SVM and
Naïve Bayes. At the same time, this section also explains why using those algorithms.
Logistic Regression
Logistic regression model is one generalizations of the linear regression model where
the target variables are discrete class labels. For the binary classification problem, the
linear function is extended by the logistic function
to
be with .
The output has the value in the range (0,1) and is interpreted as the probability
that the class (target variable) is 1 given the example X . Correspondingly the
probability that the target variable is 0 given the example X is .
The example x is classified to class 1 when . The parameter is
determined using the maximum likelihood solution, which means for the training
set is determined as the solution of the minimization problem:

36
.
Since is a convex function it has a global minimum and its solution could be
determined by popular optimization techniques like the gradient descent algorithm.
The performance of the determined model can then be measured on the validation set.
Logistic Regression is also popular classification model in sport data mining domain.
It is a power full model for complex classification model. One limitation is that it does
not capture non-linear relationships between features. (Hosmer, 2000)
Naïve Bayes
The Naïve Bayes Classifier assumes that attributes are conditionally independent of
given class label, which implies that the probability of belong to a class is the
multiplication of every conditional probabilities of attributes. Naïve Bayes has a great
simplicity over other classifiers. Nevertheless, in some cases, it outperforms more
sophisticated classification models. (Langley et al., 1992)
The function of computing the likelihood of a sample being a class is given below:
where is the class, is observed variables . The posterior
probability of class is represented by the multiplication of conditional
probability and , the prior probability of class .
The final prediction of class of a given sample is:
Naïve Bayes Classifier has been widely used in a range of application domains,
including text classification, spam-filtering applications, and many predictive analysis
applications.
Support Vector Machine
Support Vector Machine (SVM) can do a better job with features with non-linear
relationships. SVM classification model can be trained by finding a maximal margin
hyper-plane.
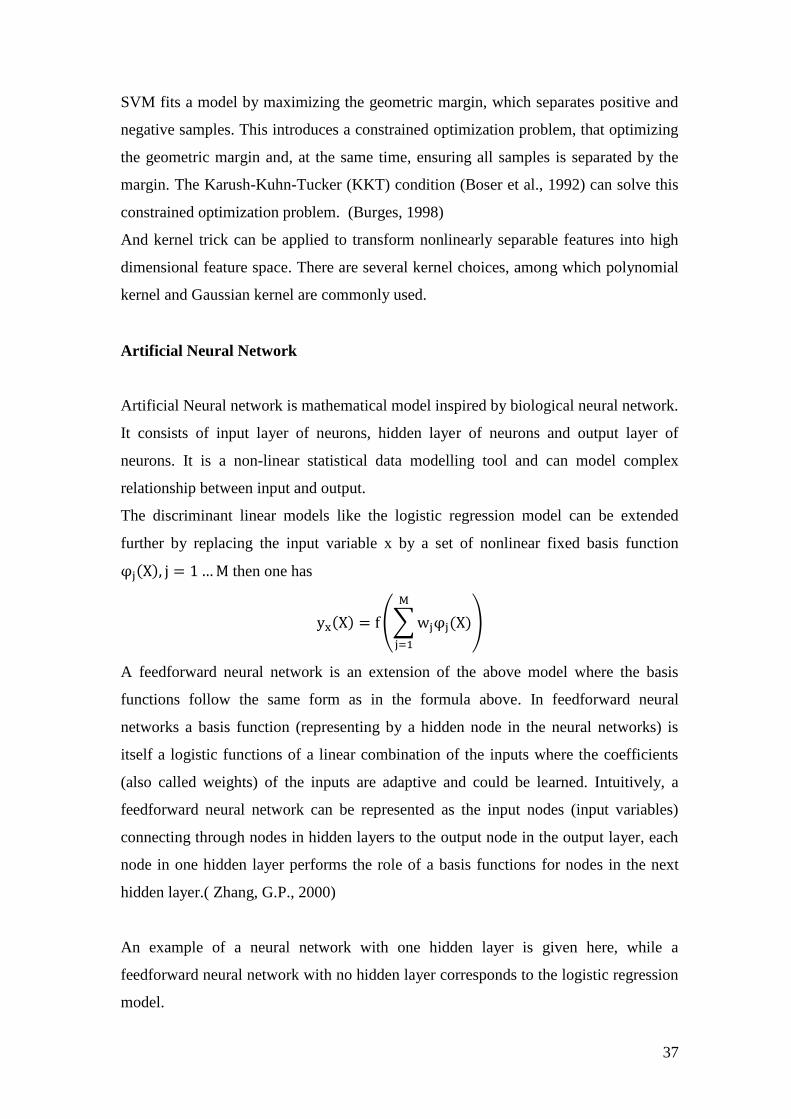
37
SVM fits a model by maximizing the geometric margin, which separates positive and
negative samples. This introduces a constrained optimization problem, that optimizing
the geometric margin and, at the same time, ensuring all samples is separated by the
margin. The Karush-Kuhn-Tucker (KKT) condition (Boser et al., 1992) can solve this
constrained optimization problem. (Burges, 1998)
And kernel trick can be applied to transform nonlinearly separable features into high
dimensional feature space. There are several kernel choices, among which polynomial
kernel and Gaussian kernel are commonly used.
Artificial Neural Network
Artificial Neural network is mathematical model inspired by biological neural network.
It consists of input layer of neurons, hidden layer of neurons and output layer of
neurons. It is a non-linear statistical data modelling tool and can model complex
relationship between input and output.
The discriminant linear models like the logistic regression model can be extended
further by replacing the input variable x by a set of nonlinear fixed basis function
then one has
A feedforward neural network is an extension of the above model where the basis
functions follow the same form as in the formula above. In feedforward neural
networks a basis function (representing by a hidden node in the neural networks) is
itself a logistic functions of a linear combination of the inputs where the coefficients
(also called weights) of the inputs are adaptive and could be learned. Intuitively, a
feedforward neural network can be represented as the input nodes (input variables)
connecting through nodes in hidden layers to the output node in the output layer, each
node in one hidden layer performs the role of a basis functions for nodes in the next
hidden layer.( Zhang, G.P., 2000)
An example of a neural network with one hidden layer is given here, while a
feedforward neural network with no hidden layer corresponds to the logistic regression
model.
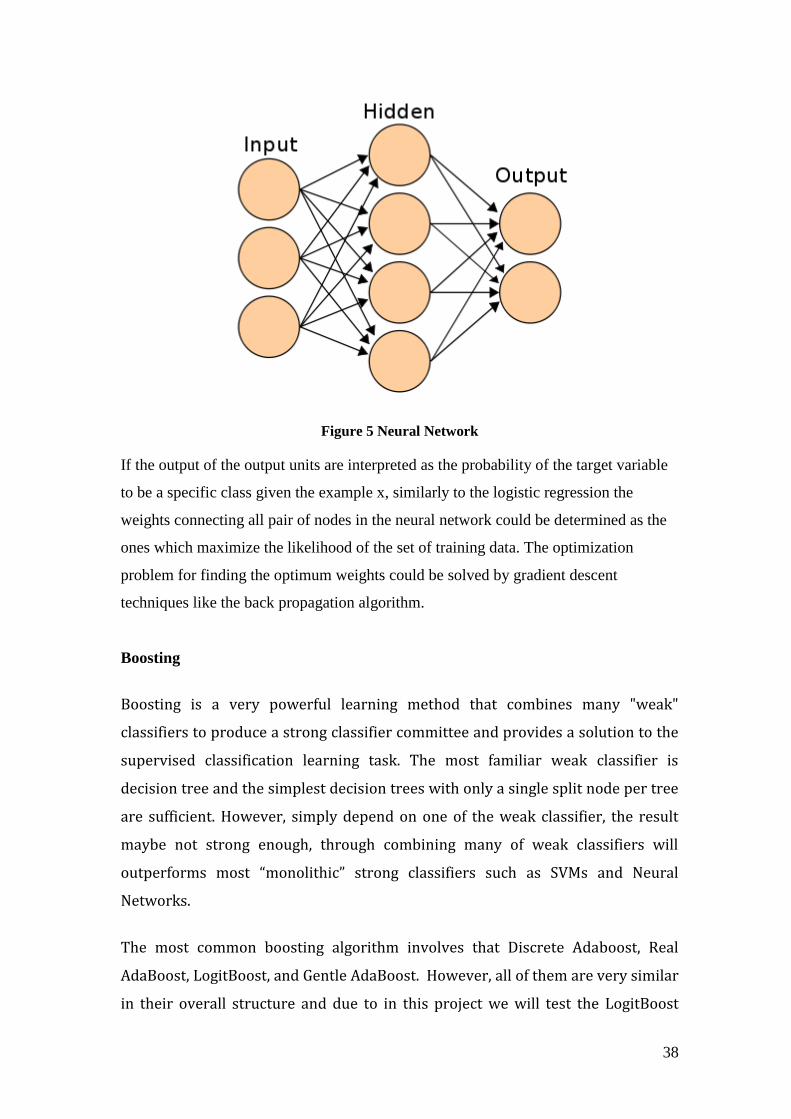
38
Figure 5 Neural Network
If the output of the output units are interpreted as the probability of the target variable
to be a specific class given the example x, similarly to the logistic regression the
weights connecting all pair of nodes in the neural network could be determined as the
ones which maximize the likelihood of the set of training data. The optimization
problem for finding the optimum weights could be solved by gradient descent
techniques like the back propagation algorithm.
Boosting
Boosting is a very powerful learning method that combines many "weak"
classifiers to produce a strong classifier committee and provides a solution to the
supervised classification learning task. The most familiar weak classifier is
decision tree and the simplest decision trees with only a single split node per tree
are sufficient. However, simply depend on one of the weak classifier, the result
maybe not strong enough, through combining many of weak classifiers will
outperforms most “monolithic” strong classifiers such as SVMs and Neural
Networks.
The most common boosting algorithm involves that Discrete Adaboost, Real
AdaBoost, LogitBoost, and Gentle AdaBoost. However, all of them are very similar
in their overall structure and due to in this project we will test the LogitBoost
39
algorithm used in predict the NBA game result. So the following section will focus
on introducing the LogitBoost algorithm.
As the solution of LogitBoost algorithm approaching to the optimal solution of
Bayesian and easy to implement, so this is a hot topic in machine learning
research.
It is a combination of algorithms with the core algorithm logistic regression. It
uses LogitBoost with simple regression function (linear or non-linear functions)
as base learners. It support automatic attribute selection and use cross validation
to control number of iterations. (Landwehr, N., 2005).
2.5 Conclusion
This chapter reviews the data mining techniques used for basketball. Firstly, the
general history of the NBA game development and the basic term of basketball are
introduced. Secondly, data mining techniques used in NBA is discussed, which include
some metric and method to evaluate players‟ performance and improve players‟ skill.
Thirdly, we focus on the previous research about basketball game outcome prediction.
Finally, two predictive algorithms which will be used in the following experiment are
briefly demonstrated.

40
3 DATA COLLECTION AND DATA MANAGEMENT
Data is core of any data mining projects. Collecting sufficient amount of data with
high quality is the fundamental and crucial step towards success of the data mining
problems.
The NBA league has been around for over 60 years. Game-by-game data has been
carefully collected and well organized by NBA analytics and NBA analysis enthusiasts.
Some NBA statistics data is available online and freely available to party of interest
without any cost. These available data is the foundation for this project, meanwhile
vast amount of high quality NBA game data is becoming the ideal test bed for data
mining.
This chapter illustrates the process of collecting NBA statistics data from popular non-
profit NBA statistics websites, managing MySQL database by Amazon Cloud services,
uploading collected data into database, and building a data mart for enabling further
data mining. The following graph illustrates major parts involved in this project and
main data flow. NBA statistics data is collected from Internet and stored to local
personal computer. Local data is then uploaded to MySQL database hosed on Amazon
Cloud. Data mart is also built in the Amazon Cloud.
Figure 6 Data Flow
3.1 Introduction
This project collects data from some non-profit websites, which publish NBA game
statistics data available to public. The following section will introduce sources of data
used in this project and data collection tools involved.

41
3.2 Data Sources
In this project, non-profit websites are the major contributor to data. For data used for
model training, testing and scoring, Basketball-reference.com is our major data source.
And there are some other sources including (Databasebasketball.com) and the official
NBA website (NBA.com). Some benchmark data for evaluating this project is from
some major NBA game result prediction website, such as (Team Rankings).
(Basketball-reference.com) is a website used for collecting data especially for
basketball and it also collects other sports data such as baseball, football and so on.
There are a number of non-profit organisations collecting and calculating NBA
statistics data and game related information. Until now, the statistic data about NBA
has been over 60 years. Basketball-reference.com is one of the most famous one for
those sports data miners, and has been used in many experiments. It was created in
2003 and data requests are comprehensive, relatively well organized, straightforward
and easy to navigate and utilize.
For this project about 6 years of NBA game statistics data has been collected, which
came from 2005-06 season to 2010-11 season. Due to the new divisional alignment has
been used since 2006, so these 6 years of data would have better consistency and
applicability to new season predictions. Among data collected, data from 2005-06
season to 2009-10 season year are used for model fitting purpose and data from 2010-
11 season is used for scoring purpose.
The statistics data covers a broad spectrum of aspects: for examples, there are per
game statistics, starting line-ups statistics, player statistics, opponent statistics,
home/road game statistics, injury information and game schedule information. Those
features will be illustrated in detail as follow.
The following table shows a fraction of game log statistics of New York Knicks in
regular season 2011-2012. It covers statistics data of each game played by New York
Knicks against their opponents.

42
A fraction of per game statistics of New York Knicks in regular season 2011-2012
(Basketball Reference)
The following table shows a fraction of player statistics of New York Knicks players
in regular season 2011-2012. Basketball-reference.com provides a wide range of
statistics like PER- Player Efficiency Rating, TS% - True Shooting Percentage and
eFG% - Effective Field Goal Percentage etc.
A fraction of player statistics of New York Knicks players in regular season 2011-12
(Basketball Reference)
The following table shows a fraction of starting lineups information of New York
Knicks in regular season 2011-2012. Starting lineups is the starters‟ combination of a
team. It shows who will start the game for the team. Players in the starting lineups are
often the key players of a team.
A fraction of starting lineups information of New York Knicks in regular season 2011-
2012 (Basketball Reference)
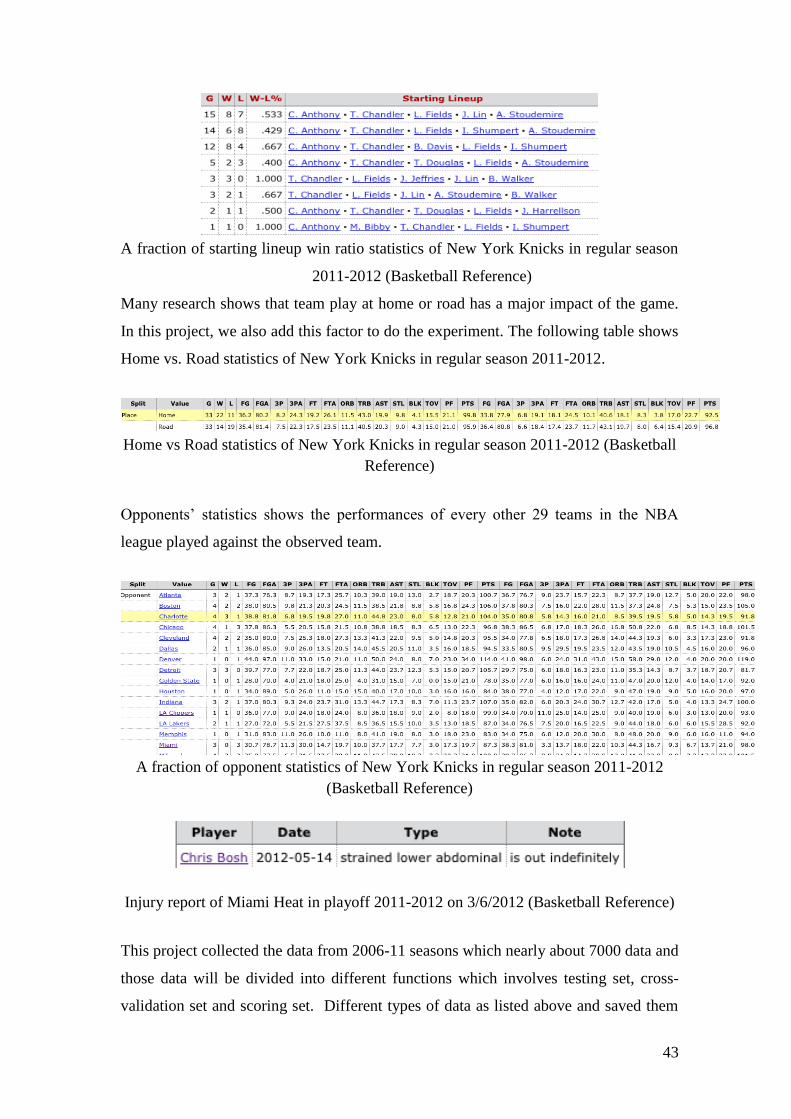
43
A fraction of starting lineup win ratio statistics of New York Knicks in regular season
2011-2012 (Basketball Reference)
Many research shows that team play at home or road has a major impact of the game.
In this project, we also add this factor to do the experiment. The following table shows
Home vs. Road statistics of New York Knicks in regular season 2011-2012.
Home vs Road statistics of New York Knicks in regular season 2011-2012 (Basketball
Reference)
Opponents‟ statistics shows the performances of every other 29 teams in the NBA
league played against the observed team.
A fraction of opponent statistics of New York Knicks in regular season 2011-2012
(Basketball Reference)
Injury report of Miami Heat in playoff 2011-2012 on 3/6/2012 (Basketball Reference)
This project collected the data from 2006-11 seasons which nearly about 7000 data and
those data will be divided into different functions which involves testing set, cross-
validation set and scoring set. Different types of data as listed above and saved them
44
as files in CSV format. The following section introduces the tools created and used for
collecting data.
3.3 Data Collection
Our major data source only publishes their data in Webpages. And the statistics data in
categorized into teams and further displayed in different types of statistics across
thousands of Webpages. In order to collecting data effectively, automated data
collection tools have been created.
3.3.1 Data Collection Tool
Our goal is to collect all statistics information from our data source website in
automated manner. There are several choices available for collecting data from
webpages. The following part shows two popular tools as this function:
Python with (Beautiful Soup) library provides powerful functions to collecting
data by parsing the HTML of a website.
Ruby is another popular language for web crawling. There are several libraries
available for collecting data from webpages:
(Mechanize) provides abilities to grab webpages, follow interlinks, and filling
forms.
Nokogirli has the outstanding abilities to search documents via XPath or CSS3
selectors. (Nokogirli) It is an ideal tool for parsing HTML based document.
Watir WebDriver is another outstanding tool. It simulates a human action by
interacting with a real browser. It is the perfect tool for dealing with JavaScript
heavy webpages or pages getting content dynamically from AJAX. It is also a
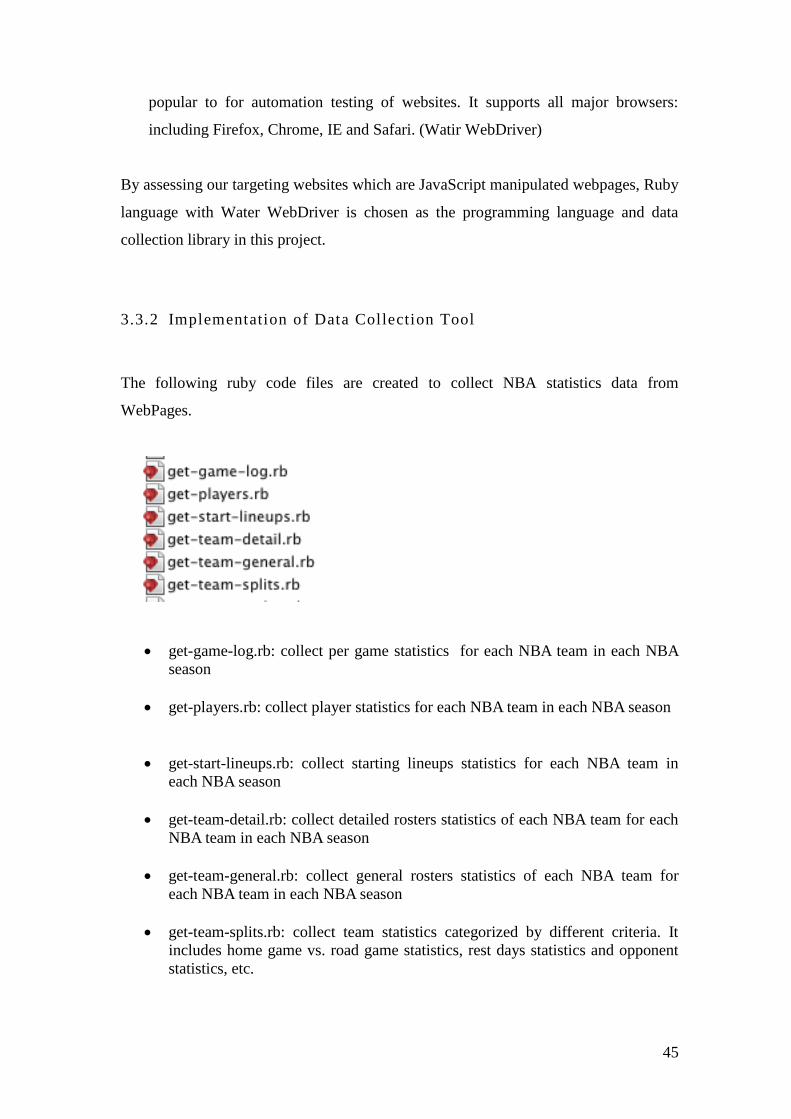
45
popular to for automation testing of websites. It supports all major browsers:
including Firefox, Chrome, IE and Safari. (Watir WebDriver)
By assessing our targeting websites which are JavaScript manipulated webpages, Ruby
language with Water WebDriver is chosen as the programming language and data
collection library in this project.
3.3.2 Implementation of Data Collection Tool
The following ruby code files are created to collect NBA statistics data from
WebPages.
get-game-log.rb: collect per game statistics for each NBA team in each NBA
season
get-players.rb: collect player statistics for each NBA team in each NBA season
get-start-lineups.rb: collect starting lineups statistics for each NBA team in
each NBA season
get-team-detail.rb: collect detailed rosters statistics of each NBA team for each
NBA team in each NBA season
get-team-general.rb: collect general rosters statistics of each NBA team for
each NBA team in each NBA season
get-team-splits.rb: collect team statistics categorized by different criteria. It
includes home game vs. road game statistics, rest days statistics and opponent
statistics, etc.

46
The core function of get-game-log.rb is shown below.
Code Snippet 1 Core function of get-game-log.rb
The function loop through each targeting NBA season (2006 to 2011) and each NBA
team to generate targeting URL and collect CSV format data from HTML content of
the generated URL.
3.3.3 Data Collection Process and Results
After the data collection scripts have been created, scripts can be run and the result is
illustrated below. Take get-game-log.rb for example:
Command to run the script: ruby get-game-log.rb
After executing the command, a browser will be automatically started and jump
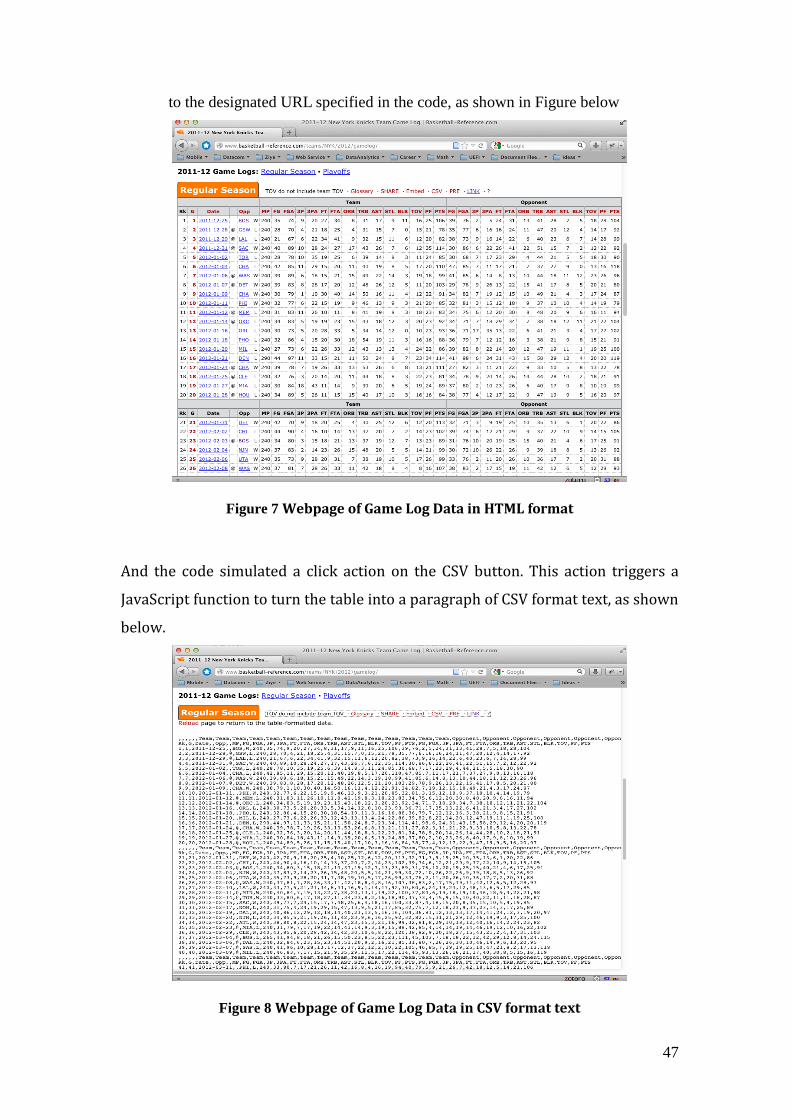
47
to the designated URL specified in the code, as shown in Figure below
Figure 7 Webpage of Game Log Data in HTML format
And the code simulated a click action on the CSV button. This action triggers a
JavaScript function to turn the table into a paragraph of CSV format text, as shown
below.
Figure 8 Webpage of Game Log Data in CSV format text
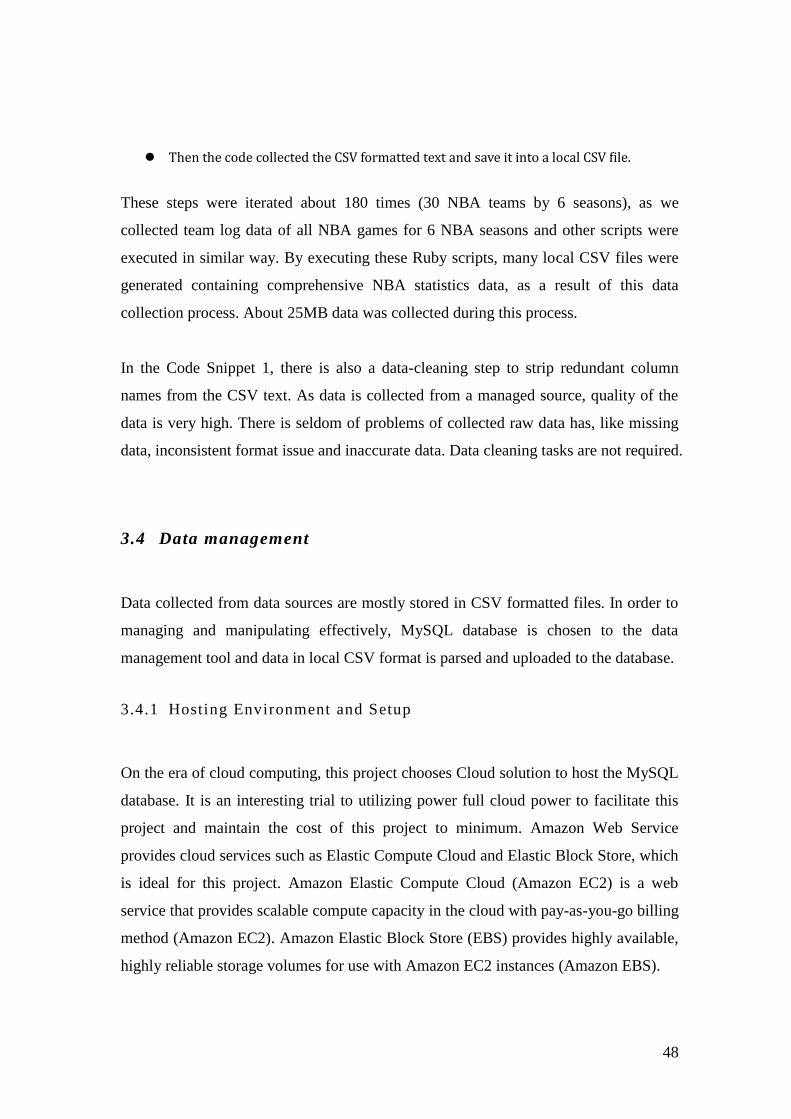
48
Then the code collected the CSV formatted text and save it into a local CSV file.
These steps were iterated about 180 times (30 NBA teams by 6 seasons), as we
collected team log data of all NBA games for 6 NBA seasons and other scripts were
executed in similar way. By executing these Ruby scripts, many local CSV files were
generated containing comprehensive NBA statistics data, as a result of this data
collection process. About 25MB data was collected during this process.
In the Code Snippet 1, there is also a data-cleaning step to strip redundant column
names from the CSV text. As data is collected from a managed source, quality of the
data is very high. There is seldom of problems of collected raw data has, like missing
data, inconsistent format issue and inaccurate data. Data cleaning tasks are not required.
3.4 Data management
Data collected from data sources are mostly stored in CSV formatted files. In order to
managing and manipulating effectively, MySQL database is chosen to the data
management tool and data in local CSV format is parsed and uploaded to the database.
3.4.1 Hosting Environment and Setup
On the era of cloud computing, this project chooses Cloud solution to host the MySQL
database. It is an interesting trial to utilizing power full cloud power to facilitate this
project and maintain the cost of this project to minimum. Amazon Web Service
provides cloud services such as Elastic Compute Cloud and Elastic Block Store, which
is ideal for this project. Amazon Elastic Compute Cloud (Amazon EC2) is a web
service that provides scalable compute capacity in the cloud with pay-as-you-go billing
method (Amazon EC2). Amazon Elastic Block Store (EBS) provides highly available,
highly reliable storage volumes for use with Amazon EC2 instances (Amazon EBS).

49
As this project only requires casual usage of MySQL database, and EC2 with EBS as
storage provide a cheap and on demand solution that meet our needs, this project uses
Amazon EC2 as the MySQL server and EBS as the storage of the server.
Lunch an EC2 Instance-
One High-CPU medium EC2 instance with 1.7 GB memories and 8GB EBS is used.
And Ubuntu is chosen as the Operating System of the database server.
Figure 9 Screenshot of EC2 instances
Setup Security Group
When setting up the security group of the EC2 instance, TCP Port 22 and 3306 should
be allowed. Port 22 is used for SSH remote command line access and Port 3306 is the
default port for accessing MySQL database.
Figure 10 EC2 opened Port
Install and Configure MySQL Database
The following command is used to setup MySQL database in the EC2 Instance:

50
Install MySQL Server software sudo apt-get install mysql-server
Grand MySQL user permission to access from outside IP
o Configure my.cnf file: sudo emacs /etc/mysql/my.cnf
o Change bind-address: bind-address = 0.0.0.0
o Grant permission
Access Remote MySQL from Local Computer
In the Mac OS, execute the following command in terminal to setup port forwarding
from port 3306 of running EC2 instant to port 33060 at local computer:
sudo ssh -i ec2key -L 33060:127.0.0.1:3306 [email protected]
1.amazonaws.com
where “ec2key” is the secure key file generated from Amazon AWS console and
“ec2-107-22-157-135.compute-1.amazonaws.com” is the dynamic IP of the running
EC2 instance. By using port forwarding command, remote MySQL database hosted in
the cloud can be accessed as a local database.
3.4.2 Database Table Design
After setting up the database for managing our data, database tables should be design
and created. As data collected is from well designed and report like webpages with
different types of statistics of NBA teams and players, table for storing such data
should follow the same structure as the collected CSV files.
Game log statistics is stored in game_log table. It includes very detailed statistics very
single games in each NBA season. The statistics is very comprehensive, which covers
statistic data of field goals, 3 points shots, free throws, rebounds, assists, etc. The
columns of game_log table is shown below (symbols are explained in Apendix X):

51
Figure 11 Game Log Table Structure
Players statistics data is stored in player related tables, including player_per_game,
player_per_36, player_advanced, player_totoal. They record players‟ seasonal
performance metrics. Taking player_advanced table for example, the table covers
players turnover percentage, offensive/defensive rating, offensive/defensive win share,
etc. (Appendix A) The columns of player_advanced table is shown below:
Figure 12 Player Statistics Table Structure
Roster information is stored in roster table, which stores the roster information of each
NBA team in every NBA season. The columns of roster table are shown below:
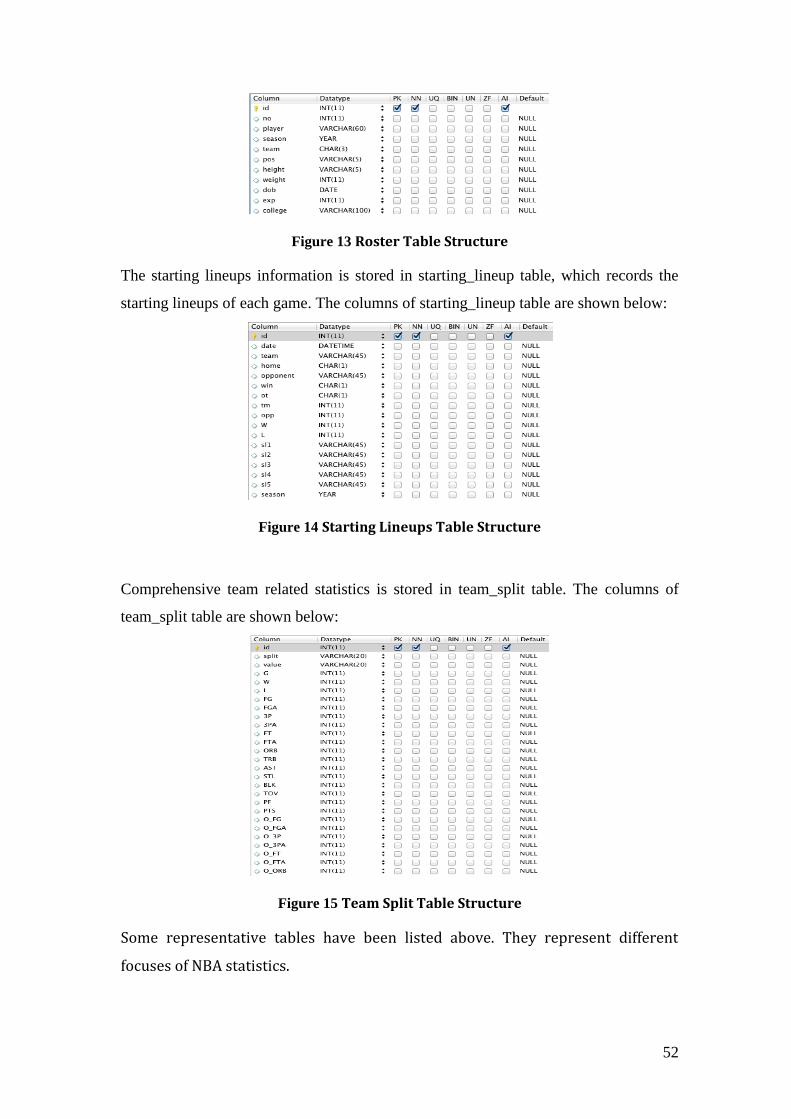
52
Figure 13 Roster Table Structure
The starting lineups information is stored in starting_lineup table, which records the
starting lineups of each game. The columns of starting_lineup table are shown below:
Figure 14 Starting Lineups Table Structure
Comprehensive team related statistics is stored in team_split table. The columns of
team_split table are shown below:
Figure 15 Team Split Table Structure
Some representative tables have been listed above. They represent different
focuses of NBA statistics.
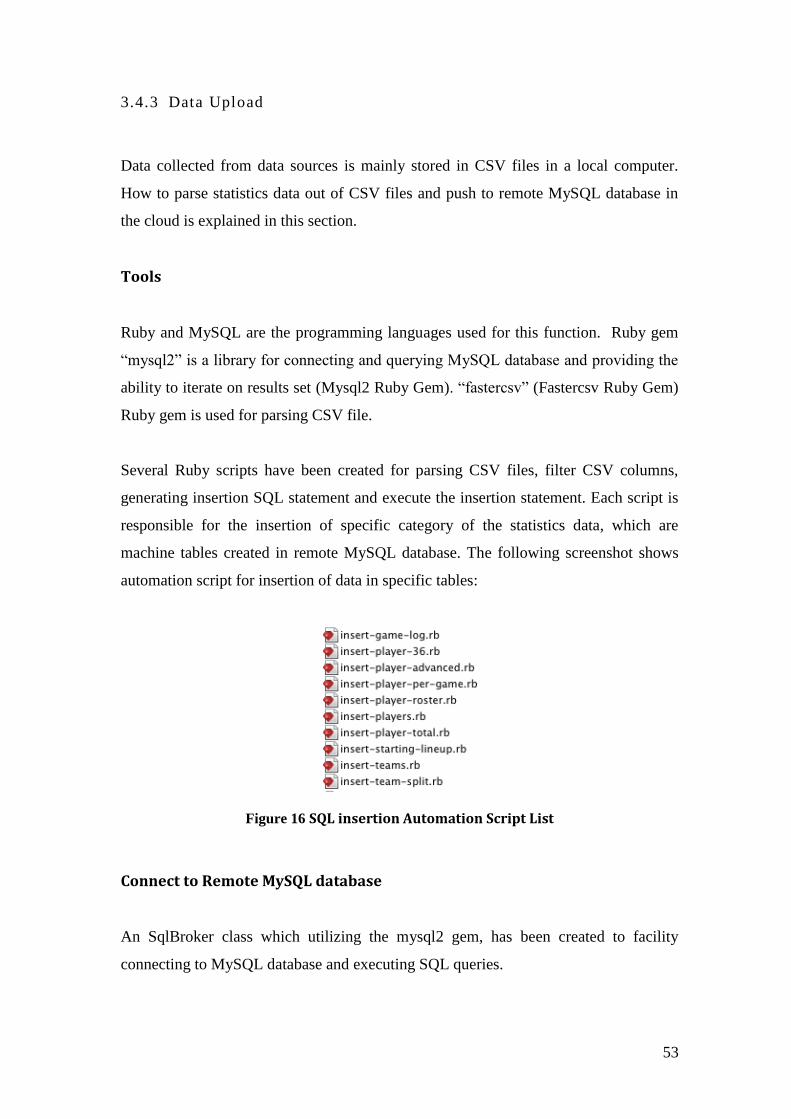
53
3.4.3 Data Upload
Data collected from data sources is mainly stored in CSV files in a local computer.
How to parse statistics data out of CSV files and push to remote MySQL database in
the cloud is explained in this section.
Tools
Ruby and MySQL are the programming languages used for this function. Ruby gem
“mysql2” is a library for connecting and querying MySQL database and providing the
ability to iterate on results set (Mysql2 Ruby Gem). “fastercsv” (Fastercsv Ruby Gem)
Ruby gem is used for parsing CSV file.
Several Ruby scripts have been created for parsing CSV files, filter CSV columns,
generating insertion SQL statement and execute the insertion statement. Each script is
responsible for the insertion of specific category of the statistics data, which are
machine tables created in remote MySQL database. The following screenshot shows
automation script for insertion of data in specific tables:
Figure 16 SQL insertion Automation Script List
Connect to Remote MySQL database
An SqlBroker class which utilizing the mysql2 gem, has been created to facility
connecting to MySQL database and executing SQL queries.

54
Code Snippet 2 SqlBroker Class for connecting to remote MySQL client and
executing SQL queries.
Parsing CSV Files and Generating Insertion SQL
Statistics data stored in CSV files are parsed by using “fastercsv” gem. The following
code snippet is the function of batch processing files in GameLog directory and
generates SQL insertion statement.
Code Snippet 3 Get CSV file list in directory containing game log statistics files
The generate_insertion_sql function parses the CSV text file and then generates
insertion SQL statement for each row in the CSV file. It also do some job on filtering
empty rows, appending missing information (season of the record in this case) and
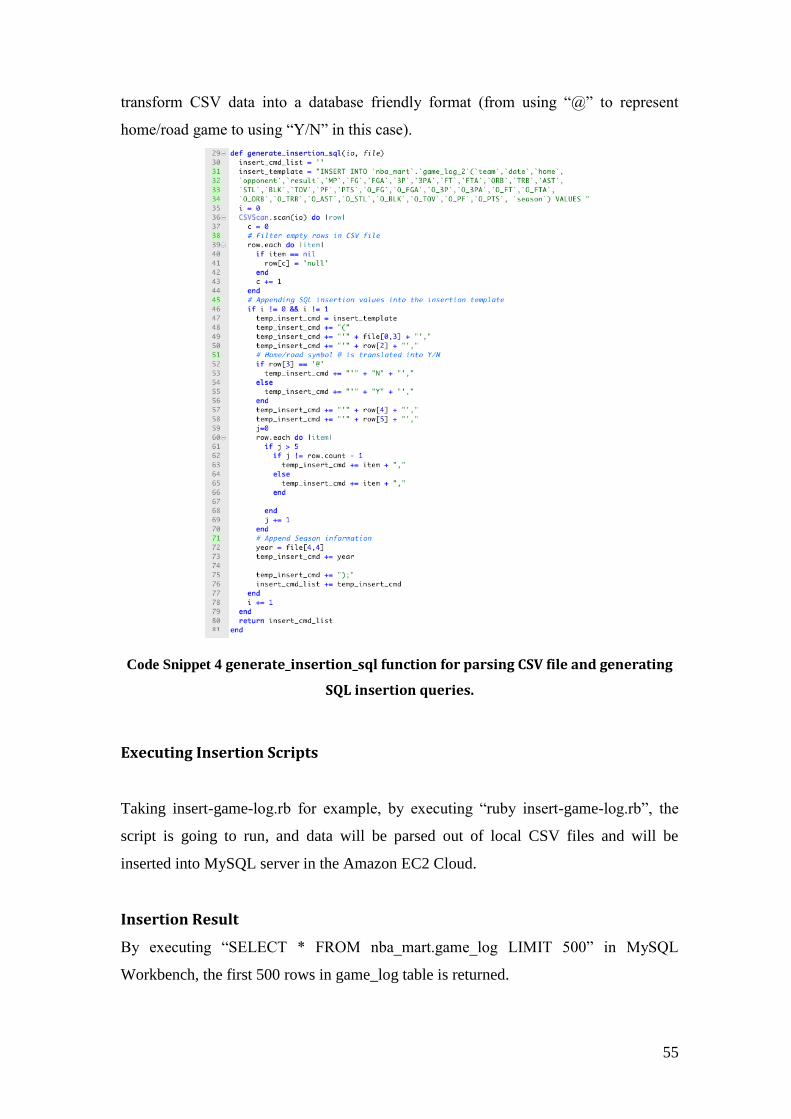
55
transform CSV data into a database friendly format (from using “@” to represent
home/road game to using “Y/N” in this case).
Code Snippet 4 generate_insertion_sql function for parsing CSV file and generating
SQL insertion queries.
Executing Insertion Scripts
Taking insert-game-log.rb for example, by executing “ruby insert-game-log.rb”, the
script is going to run, and data will be parsed out of local CSV files and will be
inserted into MySQL server in the Amazon EC2 Cloud.
Insertion Result
By executing “SELECT * FROM nba_mart.game_log LIMIT 500” in MySQL
Workbench, the first 500 rows in game_log table is returned.
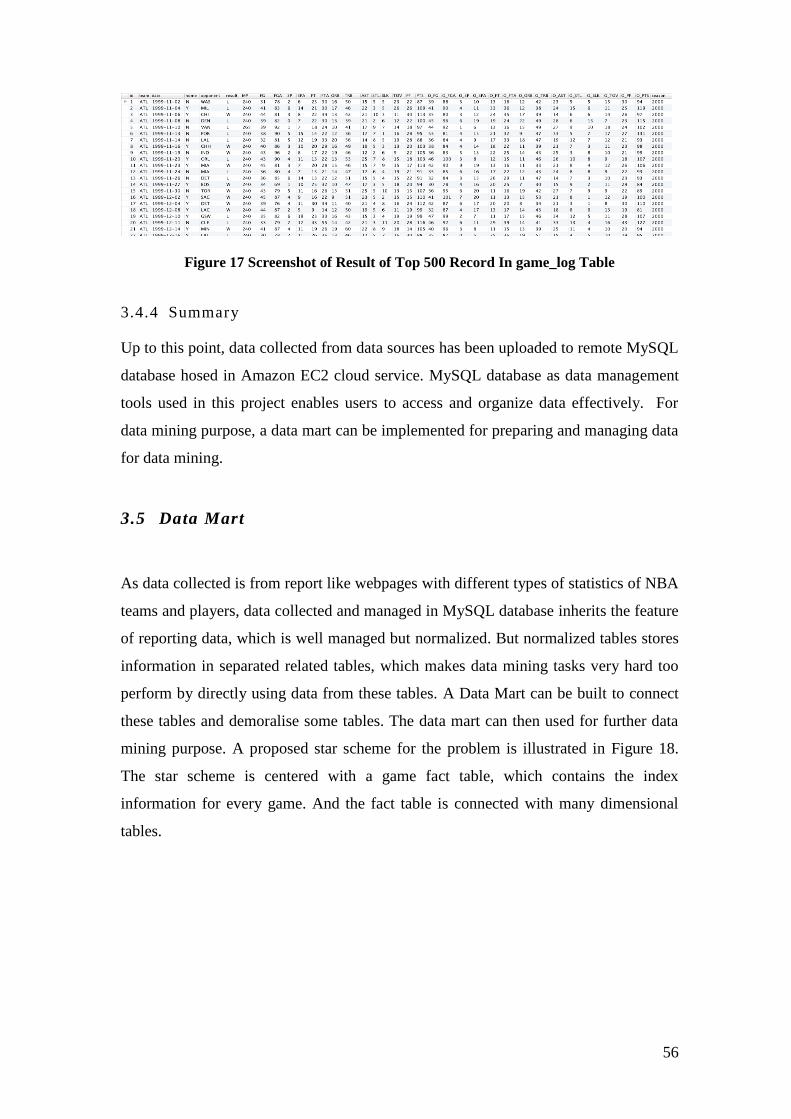
56
Figure 17 Screenshot of Result of Top 500 Record In game_log Table
3.4.4 Summary
Up to this point, data collected from data sources has been uploaded to remote MySQL
database hosed in Amazon EC2 cloud service. MySQL database as data management
tools used in this project enables users to access and organize data effectively. For
data mining purpose, a data mart can be implemented for preparing and managing data
for data mining.
3.5 Data Mart
As data collected is from report like webpages with different types of statistics of NBA
teams and players, data collected and managed in MySQL database inherits the feature
of reporting data, which is well managed but normalized. But normalized tables stores
information in separated related tables, which makes data mining tasks very hard too
perform by directly using data from these tables. A Data Mart can be built to connect
these tables and demoralise some tables. The data mart can then used for further data
mining purpose. A proposed star scheme for the problem is illustrated in Figure 18.
The star scheme is centered with a game fact table, which contains the index
information for every game. And the fact table is connected with many dimensional
tables.

57
Figure 18 Proposed Star Scheme Structure
Time dimension is very important for a data mart. It enables analysts to do time series
analysis and it is also the essential table enabling online analytical processing (OLAP).
Even though, these are not the focus of this project, it is worth noting that its
importance to other data mining projects. By creating the time dimension table, the
project preserves the ability to do more work in the future. The columns of time
dimension table are listed below:
Figure 19 Time Dimension Table Structure
3.6 Conclusion
This chapter illustrates the process of management dataset, which involves collecting
NBA statistics data from popular non-profit NBA statistics websites, managing
MySQL database by Amazon Cloud services, uploading collected into database, and

58
building a data mart for enabling further data mining. it also provides step-by-step
tutorial of the whole process.
This chapter highlights Ruby as a powerful language, which can be used for
implementing data collection tool, data processing tool and data transferring tool. This
project also makes a brave trial of using Amazon Cloud utilities as the major
infrastructure, which is proven to be very effective, powerful and economic.
The whole process from data collection to data uploading is highly automated. It
manages to collect about 25MB of data from thousands of WebPages, generates
thousands of SQL insertion statement and executing SQL automatically. This chapter
illustrated the process of collecting data and managing data and built a solid test bed
for further data mining processes.
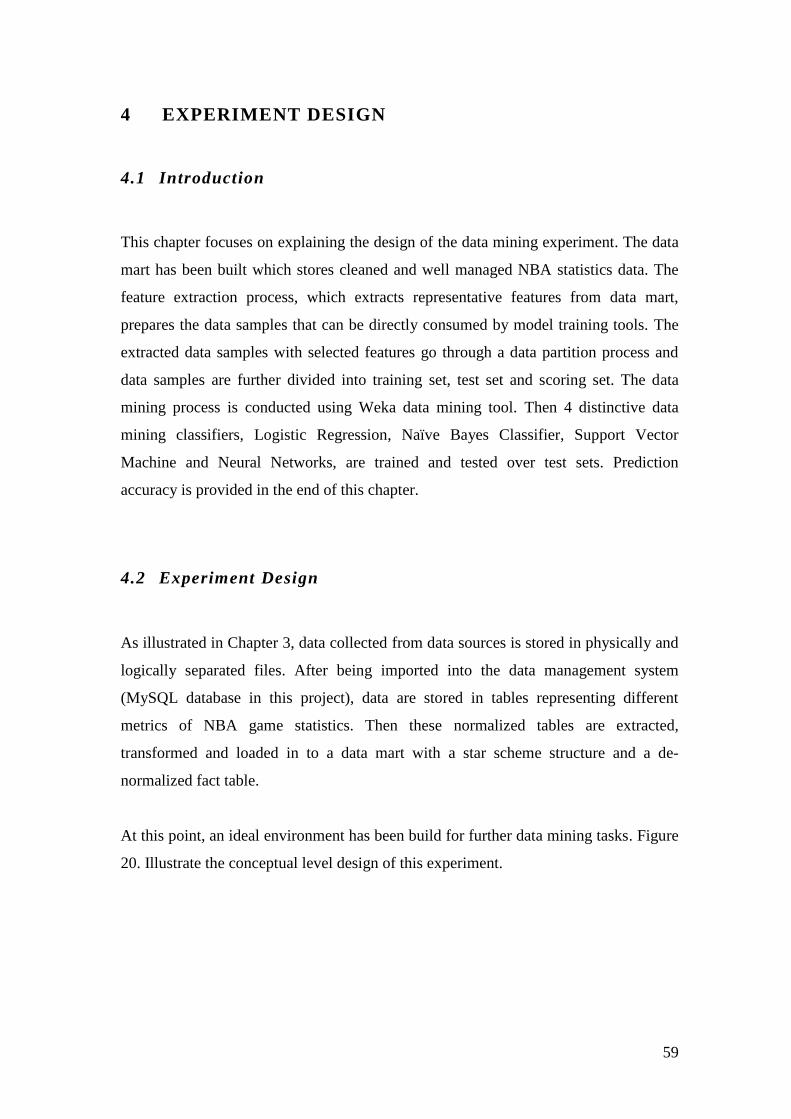
59
4 EXPERIMENT DESIGN
4.1 Introduction
This chapter focuses on explaining the design of the data mining experiment. The data
mart has been built which stores cleaned and well managed NBA statistics data. The
feature extraction process, which extracts representative features from data mart,
prepares the data samples that can be directly consumed by model training tools. The
extracted data samples with selected features go through a data partition process and
data samples are further divided into training set, test set and scoring set. The data
mining process is conducted using Weka data mining tool. Then 4 distinctive data
mining classifiers, Logistic Regression, Naïve Bayes Classifier, Support Vector
Machine and Neural Networks, are trained and tested over test sets. Prediction
accuracy is provided in the end of this chapter.
4.2 Experiment Design
As illustrated in Chapter 3, data collected from data sources is stored in physically and
logically separated files. After being imported into the data management system
(MySQL database in this project), data are stored in tables representing different
metrics of NBA game statistics. Then these normalized tables are extracted,
transformed and loaded in to a data mart with a star scheme structure and a de-
normalized fact table.
At this point, an ideal environment has been build for further data mining tasks. Figure
20. Illustrate the conceptual level design of this experiment.

60
Figure 20 Data Analytics Architecture
The goal is to build predictive models, which can assist humans to predict the result of
upcoming NBA games. The main idea behind this data-mining project is to build a
generalised model, which can take statistics of two teams who are going to play against
each other in the next game, using these statistics to predict the result of the game. As
the data mart has been built, further data mining experiments directly pull relevant data
out of data mart.
4.3 Feature Extraction
Statistics data in the data mart is already well managed, but they cover every detailed
and different focus of statistics about games, teams, game schedule and seasonal
performance metrics, which is overwhelming for the predictive model fitting tasks.
Data stored in data mart are scattered across different tables, which cannot be
consumed directly by model training tool. A feature extraction process is required, that
selects representative features and transform features into a centralised format.

61
In NBA game prediction, features selected are required to be comprehensive and
representative. The initial idea is combining team statistics, opponent statistics, game
schedule, player statistics, and recent team performance statistics (last 3 games or last
7 games) as features. The number of features can reach from 30 to 60 or more.
4.3.1 Feature Extracted Explanation
Which features will be extracted from the data mart is decided by employing NBA
domain knowledge and expert experience. In this section, the extracted features are
explained in details.
In order to make the extracted features easy to understand, this process is explained
with a concrete example, which is home team Miami Heat (MIA) play against New
York Nicks (NYK) at 2010-12-01 (NBA season 2010-11). The feature extraction
process assumes that the game to be predicted is the very next game of two teams in a
time line. And all data available is prior to that date. These features will be extracted
using SQL queries.
Statistics of Recent Games of Home Team and Opponent Team
As a known fact that, playing at home or on road is definitely a core factor affecting
the game result, due to fans‟ supports, travel schedule, weather difference and many
other reasons.
The following SQL code is created to obtain statistics of averaging statistics of last 10
home games of the home team (MIA), and statistics of averaging statistics of last 10
road games of road team (NYK).

62
Code Snippet 5 SQL for collecting average statistics of last 10 home games of home
team and last 10 road games of road team.
The query result is shown below:
team home avg_fgp avg_3pp avg_ftp avg_orb avg_trb avg_ast avg_otv avg_pf avg_pts avg_ofgp avg_o3pp avg_oftp avg_oorb avg_otrb avg_oast avg_ootv avg_opf avg_opts
MIA Y 0.48 0.34 0.78 9.2 42.1 20 12.9 20.8 106 0.45 0.34 0.73 9.6 40.1 20.5 13.5 26 97.4
NYK N 0.47 0.29 0.79 10.4 41.9 18.7 15.3 20.9 104 0.48 0.42 0.73 10.6 40.7 20.7 14.2 22.3 104
Table 1 Averaging the last 10 games statistics
Averaging the last 10 games statistics introduces stability into extracted features. On
the other hand, there is very high randomness in the last 10 games, because the team
can face teams of different level. Team had games with very strong teams may have a
worse performance statistics than facing weak teams. In order to introducing
opponents quality in to our feature list and balancing out the randomness of the 10
games, a win/loss contribution score is used by taking the performance of opponents of
last 10 games in to our equation. The following SQL query is created to calculate the
win/loss contribution score of last 10 games (last 10 home games for home team MIA,
and last 10 road games for road team NYK):
Code Snippet 6 SQL for calculating the Win/Loss score of two teams over last 10
games
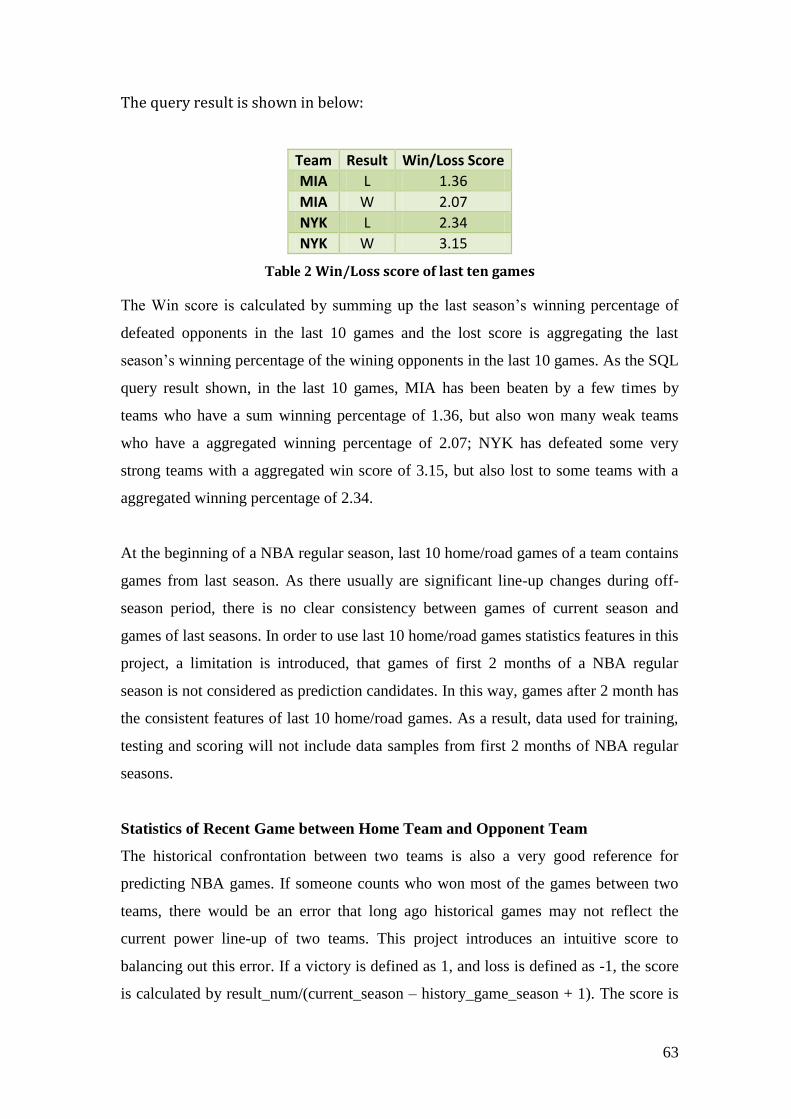
63
The query result is shown in below:
Team Result Win/Loss Score
MIA L 1.36
MIA W 2.07
NYK L 2.34
NYK W 3.15
Table 2 Win/Loss score of last ten games
The Win score is calculated by summing up the last season‟s winning percentage of
defeated opponents in the last 10 games and the lost score is aggregating the last
season‟s winning percentage of the wining opponents in the last 10 games. As the SQL
query result shown, in the last 10 games, MIA has been beaten by a few times by
teams who have a sum winning percentage of 1.36, but also won many weak teams
who have a aggregated winning percentage of 2.07; NYK has defeated some very
strong teams with a aggregated win score of 3.15, but also lost to some teams with a
aggregated winning percentage of 2.34.
At the beginning of a NBA regular season, last 10 home/road games of a team contains
games from last season. As there usually are significant line-up changes during off-
season period, there is no clear consistency between games of current season and
games of last seasons. In order to use last 10 home/road games statistics features in this
project, a limitation is introduced, that games of first 2 months of a NBA regular
season is not considered as prediction candidates. In this way, games after 2 month has
the consistent features of last 10 home/road games. As a result, data used for training,
testing and scoring will not include data samples from first 2 months of NBA regular
seasons.
Statistics of Recent Game between Home Team and Opponent Team
The historical confrontation between two teams is also a very good reference for
predicting NBA games. If someone counts who won most of the games between two
teams, there would be an error that long ago historical games may not reflect the
current power line-up of two teams. This project introduces an intuitive score to
balancing out this error. If a victory is defined as 1, and loss is defined as -1, the score
is calculated by result_num/(current_season – history_game_season + 1). The score is
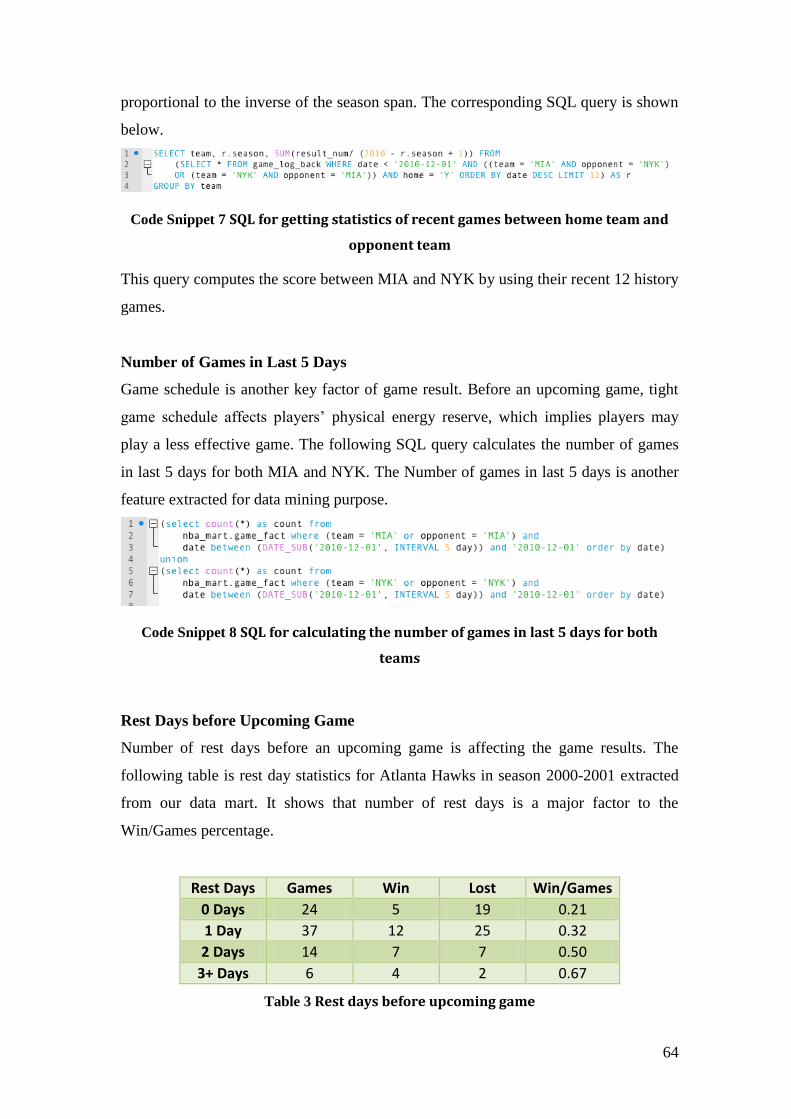
64
proportional to the inverse of the season span. The corresponding SQL query is shown
below.
Code Snippet 7 SQL for getting statistics of recent games between home team and
opponent team
This query computes the score between MIA and NYK by using their recent 12 history
games.
Number of Games in Last 5 Days
Game schedule is another key factor of game result. Before an upcoming game, tight
game schedule affects players‟ physical energy reserve, which implies players may
play a less effective game. The following SQL query calculates the number of games
in last 5 days for both MIA and NYK. The Number of games in last 5 days is another
feature extracted for data mining purpose.
Code Snippet 8 SQL for calculating the number of games in last 5 days for both
teams
Rest Days before Upcoming Game
Number of rest days before an upcoming game is affecting the game results. The
following table is rest day statistics for Atlanta Hawks in season 2000-2001 extracted
from our data mart. It shows that number of rest days is a major factor to the
Win/Games percentage.
Rest Days Games Win Lost Win/Games
0 Days 24 5 19 0.21
1 Day 37 12 25 0.32
2 Days 14 7 7 0.50
3+ Days 6 4 2 0.67
Table 3 Rest days before upcoming game
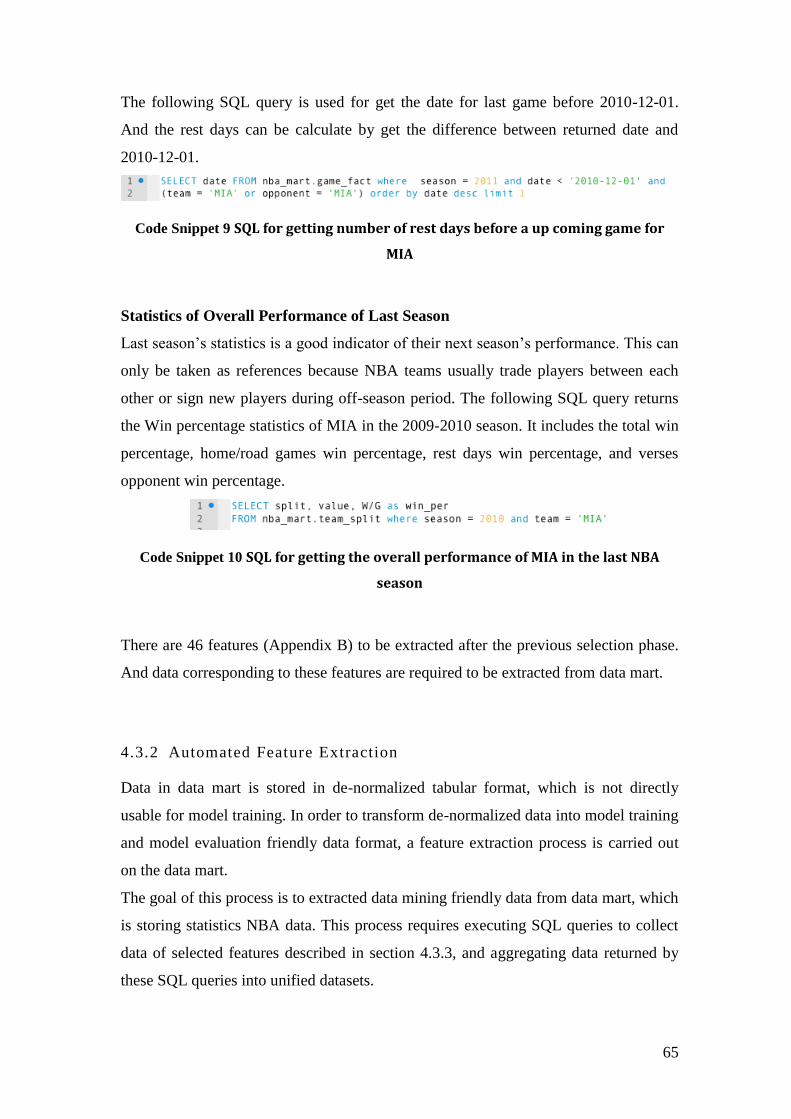
65
The following SQL query is used for get the date for last game before 2010-12-01.
And the rest days can be calculate by get the difference between returned date and
2010-12-01.
Code Snippet 9 SQL for getting number of rest days before a up coming game for
MIA
Statistics of Overall Performance of Last Season
Last season‟s statistics is a good indicator of their next season‟s performance. This can
only be taken as references because NBA teams usually trade players between each
other or sign new players during off-season period. The following SQL query returns
the Win percentage statistics of MIA in the 2009-2010 season. It includes the total win
percentage, home/road games win percentage, rest days win percentage, and verses
opponent win percentage.
Code Snippet 10 SQL for getting the overall performance of MIA in the last NBA
season
There are 46 features (Appendix B) to be extracted after the previous selection phase.
And data corresponding to these features are required to be extracted from data mart.
4.3.2 Automated Feature Extraction
Data in data mart is stored in de-normalized tabular format, which is not directly
usable for model training. In order to transform de-normalized data into model training
and model evaluation friendly data format, a feature extraction process is carried out
on the data mart.
The goal of this process is to extracted data mining friendly data from data mart, which
is storing statistics NBA data. This process requires executing SQL queries to collect
data of selected features described in section 4.3.3, and aggregating data returned by
these SQL queries into unified datasets.
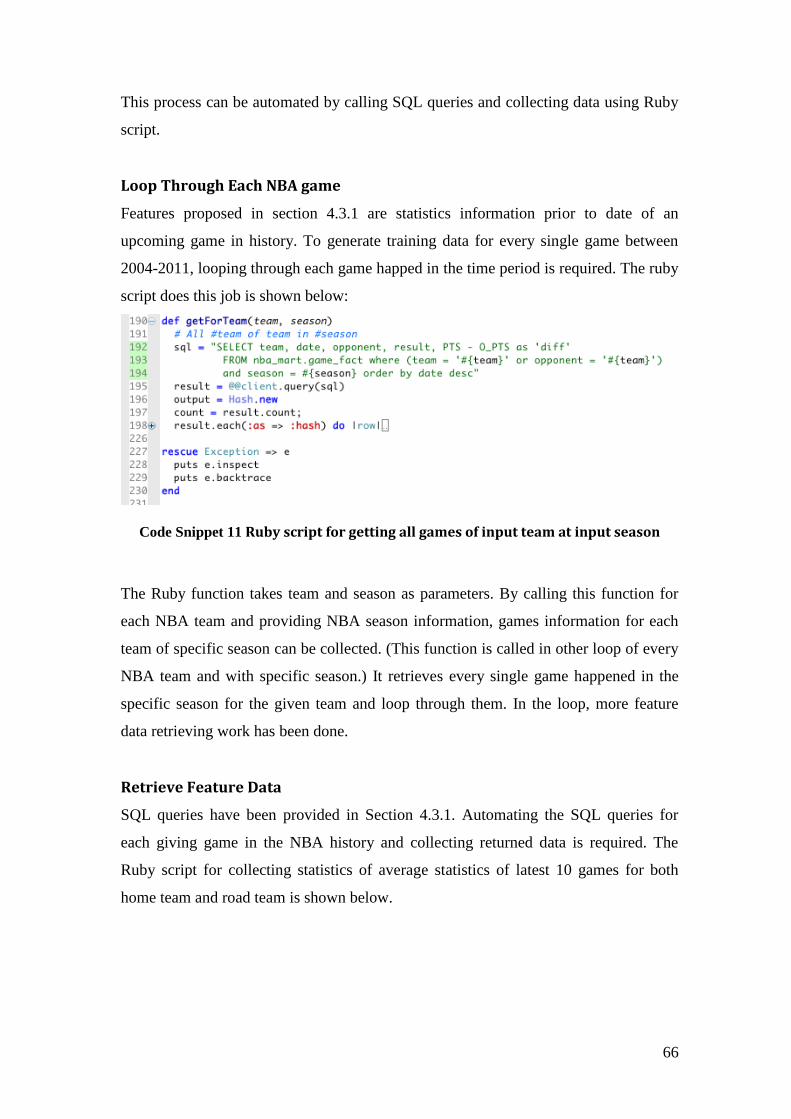
66
This process can be automated by calling SQL queries and collecting data using Ruby
script.
Loop Through Each NBA game
Features proposed in section 4.3.1 are statistics information prior to date of an
upcoming game in history. To generate training data for every single game between
2004-2011, looping through each game happed in the time period is required. The ruby
script does this job is shown below:
Code Snippet 11 Ruby script for getting all games of input team at input season
The Ruby function takes team and season as parameters. By calling this function for
each NBA team and providing NBA season information, games information for each
team of specific season can be collected. (This function is called in other loop of every
NBA team and with specific season.) It retrieves every single game happened in the
specific season for the given team and loop through them. In the loop, more feature
data retrieving work has been done.
Retrieve Feature Data
SQL queries have been provided in Section 4.3.1. Automating the SQL queries for
each giving game in the NBA history and collecting returned data is required. The
Ruby script for collecting statistics of average statistics of latest 10 games for both
home team and road team is shown below.
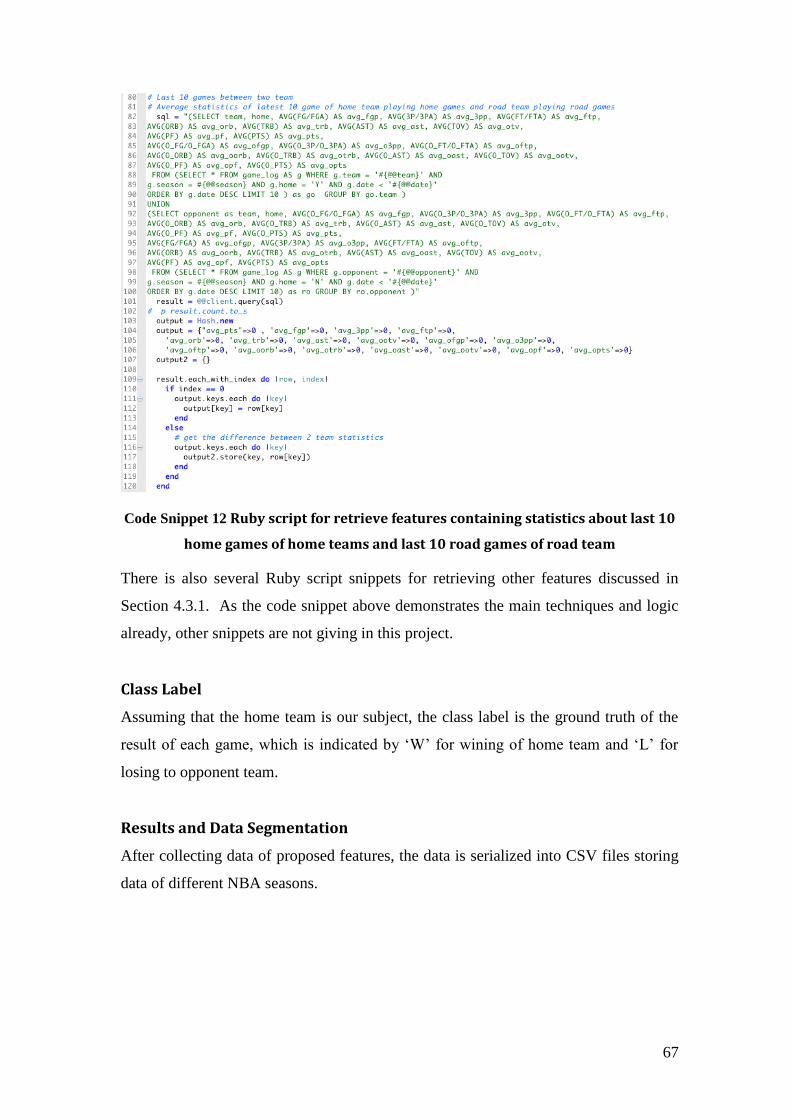
67
Code Snippet 12 Ruby script for retrieve features containing statistics about last 10
home games of home teams and last 10 road games of road team
There is also several Ruby script snippets for retrieving other features discussed in
Section 4.3.1. As the code snippet above demonstrates the main techniques and logic
already, other snippets are not giving in this project.
Class Label
Assuming that the home team is our subject, the class label is the ground truth of the
result of each game, which is indicated by „W‟ for wining of home team and „L‟ for
losing to opponent team.
Results and Data Segmentation
After collecting data of proposed features, the data is serialized into CSV files storing
data of different NBA seasons.

68
Figure 21 Files of Collected Sample Data
Among these files, datasets for 2006-2010 season are used for training and testing
purpose. And dataset for 2011 season is preserved as applied dataset for scoring
purpose. And how the scoring data is used is explained in Chapter 5.
4.4 Model Evaluation Criteria
The objective of model training is to build a model based on training dataset that
captures correctly the charecteristics of Win/Loss games. After building the model, a
test set is supplied and passed through the model. It classifies testing sample with same
set of features and test against predefined target class labels.
Figure 22 Training, evaluation and scoring process.
Model Training and Tuning Datasets
Data Mart
Train
Dataset
Validation
Dataset Test
Dataset
Apply
Dataset
2011/2012 Regular
Season
Model
Extract
Extract
Learning
Evaluate
69
In order to focus on the accuracy of the prediction model, the accuracy ratio model is
used to evaluate the model.
Accuracy ratio of the model =
4.5 Data Partition
As data available for building and tuning model is within time range from season 2006
to season 2010, there are about 6,000 data samples. Because the major part of our
features are related to last 10 games statistics, games in the first 2 months of a NBA
regular season don‟t have complete last 10 games statistics from the on-going season.
So removing data samples from first 2 months in each season from our data samples is
required. After filtering the data samples, there are about 4000 data samples available
for training and tuning predictive models. Data are then can be partitioned in two ways.
4.5.1 Training and Testing (Handout)
The most common approach is handout approach, which divide the data samples into
two complementary sets, training set and test set. Training set is used for fitting the
data-mining model and the test set is used for compute error estimate. Usually, two
thirds of data is used as training set data and the other one third of data is used as
testing data.
Cross Validation Training
If 6,000 data samples in this project are not enough to build a complex model
using handout data partition approach. This is the scenario of having limited data
for building model. Common handout approach may put representative samples
with distinctive features into test set. Model built in this case is biased which may
not cover the case of representative samples is putted in test set. Cross Validation
is a popular technique to compensate bias of handout approach when data
samples are limited.

70
Cross validation involves partitioning data samples into N folds complementary
equal size subset, fitting model using N-1 folds of data, and validating the model
on the left 1 fold of data. And repeat the process N times and each time leave
different fold out for validation. Finally, the N performance metrics is averaged to
yield an overall performance metrics. This number N is usually 5, 10 or 20.
4.5.2 Experiment Setup
Weka Knowledge Flow Tool is used to demonstrate the experiment process. Firstly,
training data and testing data is loaded from a CSV file; Secondly, the game result
attribute is chosen as the class label and order of data is randomized with a seed;
Thirdly, input data is either divided into training set and test set or organized with
cross-validation approach; Fourthly, classifier model is trained and validated; Lastly,
error estimate and other performance metrics are outputted in text format and model
performance related chart is generated. The process is illustrated below:
Figure 23 Experiment Workflow
The model evaluating in Figure 23 is Simple Logistic classifier. There are a range of
classifiers have been tested. And other then replacing the Simple Logistic classifier
with other classifiers, experiments for fitting other classifiers follows the exactly same
workflow.
71
4.6 Model Training
There are four models used in this experiment, including Simple Logistics, Naïve
Bayes, Support Vector Machine and Artificial Neural Networks. These models have
been explained in details in Chapter 2. All these models are trained and tested use
Weka data mining tool and parameters used during model fitting process and the final
result are presented below.
Simple Logistics
Simple Logistics is a combination of algorithms with the core algorithm logistic
regression. It uses LogitBoost with simple regression function (linear or non-
linear functions) as base learners. It support automatic attribute selection and use
cross validation to control number of iterations. (Landwehr, N., 2005).
The input parameters of Logistic Regression are listed as bellow:
Maximum iteration: 500
Parameter of Heuristic for early stopping of LogitBoost: 805
Weight Trimming of LogitBoost: 0.02
In this approach algorithm, the model is evaluated with 10-fold cross-validation
approach by default. 66% data is divided into training set and 34% data is used
for testing purpose.
The output model contains two classifiers, one per each class. The prediction is
depending on which classifier output the larger value.
The classification accuracy using the trained Simple Logistics Classifier is about
67.82% over the test set data.
Naïve Bayes
The Naïve Bayes Classifier assumes that attributes are conditionally independent of
given class label, which implies that the probability of belong to a class is the
multiplication of every conditional probabilities of attributes. Weka’s Naïve Bayes
Classifier training tool is used in this process.
The classification accuracy of trained Naïve Bayes Classifier is about 65.82% over the
test set data.
72
Support Vector Machine
Support Vector Machine (SVM) can do a better job with features with non-linear
relationships. SVM classification model can be trained by finding a maximal margin
hyper-plane.
In this experiment, parameters for model fitting process are listed below:
Gamma is
: 0.002
Coefficient: 0.5
After tuning the model against the test set, an optimized SVM model is outputted. The
classification accuracy of trained SVM model is about 67.22% over the test set data.
Artificial Neural Networks
An experiment by training Neural Networks to predict the NBA game result is design.
Weka provides a feedforward neural networks model named “Multilayer Perceptron”
Model. It takes all attributes as input nodes. All hidden nodes and output nodes are all
using sigmoid function.
A one hidden layer Neural Networks with two output nodes model is chosen. The
output nodes are corresponding to Class label. The input sample is classified according
to the output node with larger value.
Parameters used for training Multilayer perceptron model in Weka are assigned as
below (Weka.Sourceforge.net, 2012):
Learning rate back-propagation algorithm: 0.1
Momentum rate: 0.05
Number of epochs: 700
Seed for random initialization weights of nodes: 231
Percentage of samples in validation set used to terminate training: 30%
Network training termination condition that the consecutive number of errors
allowed for validation testing: 5
The classification accuracy of trained Neural Networks model is about 66.67% using
test set.
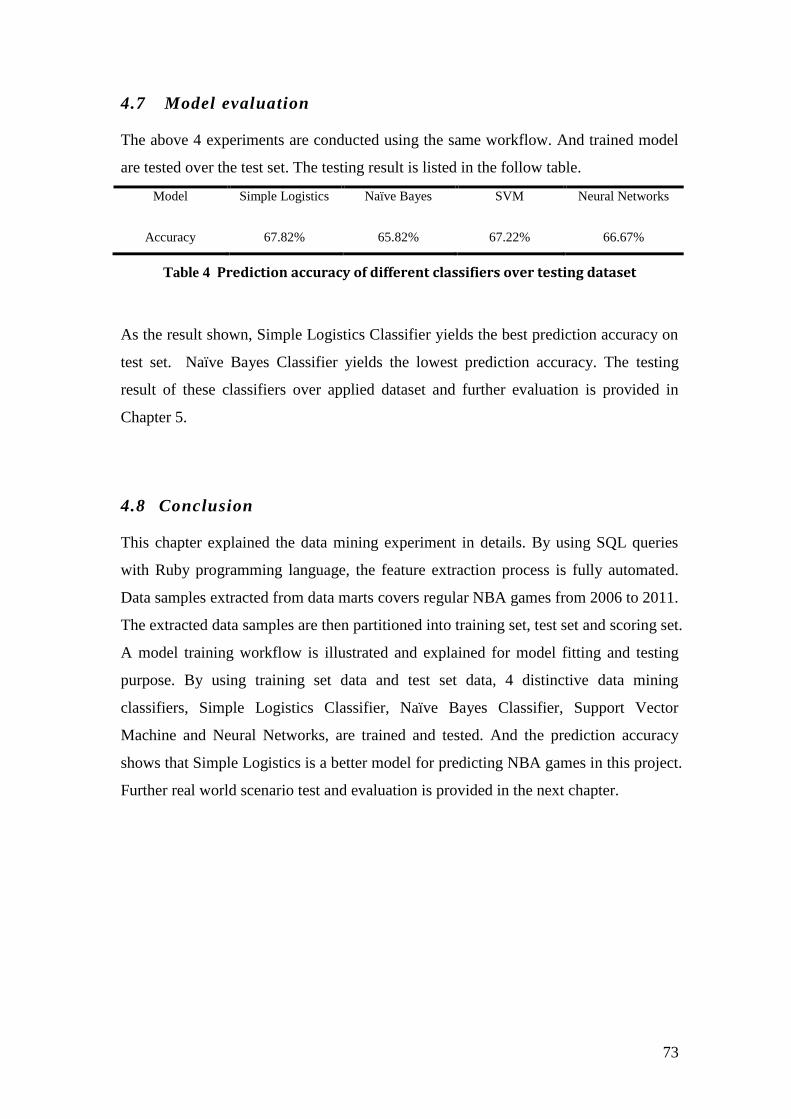
73
4.7 Model evaluation
The above 4 experiments are conducted using the same workflow. And trained model
are tested over the test set. The testing result is listed in the follow table.
Model Simple Logistics Naïve Bayes SVM Neural Networks
Accuracy 67.82% 65.82% 67.22% 66.67%
Table 4 Prediction accuracy of different classifiers over testing dataset
As the result shown, Simple Logistics Classifier yields the best prediction accuracy on
test set. Naïve Bayes Classifier yields the lowest prediction accuracy. The testing
result of these classifiers over applied dataset and further evaluation is provided in
Chapter 5.
4.8 Conclusion
This chapter explained the data mining experiment in details. By using SQL queries
with Ruby programming language, the feature extraction process is fully automated.
Data samples extracted from data marts covers regular NBA games from 2006 to 2011.
The extracted data samples are then partitioned into training set, test set and scoring set.
A model training workflow is illustrated and explained for model fitting and testing
purpose. By using training set data and test set data, 4 distinctive data mining
classifiers, Simple Logistics Classifier, Naïve Bayes Classifier, Support Vector
Machine and Neural Networks, are trained and tested. And the prediction accuracy
shows that Simple Logistics is a better model for predicting NBA games in this project.
Further real world scenario test and evaluation is provided in the next chapter.

74
5 EVALUATION
5.1 Introduction
This chapter explains the concept of model scoring, scoring workflow design for this
project and the scoring results. Our trained classifiers are also compared with other
researchers‟ work and a popular NBA game outcome prediction website. Through the
scoring process and the comparison with others‟ work, models built in this project are
proven to be effective and generalized at predicting outcomes of real world NBA
games.
5.2 Model scoring
In order to test the practicality of our fitted models, a model scoring process is
designed and used to evaluate our models. In this section, scoring workflow is
introduced and the scoring result is discussed.
5.2.1 Introduction
After producing classification models using model training and tuning techniques,
these models can be used to predict the upcoming NBA games. So far, out model has
only being tested during cross validation or on test sets. In order to simulate how our
models are going to perform on “unseen” data, a scoring process is introduced.
“Scoring” is the process of using the model which we built in our experiment to make
predictions about behaviour that has yet to happen. The “Score” is the prediction
output of the model.
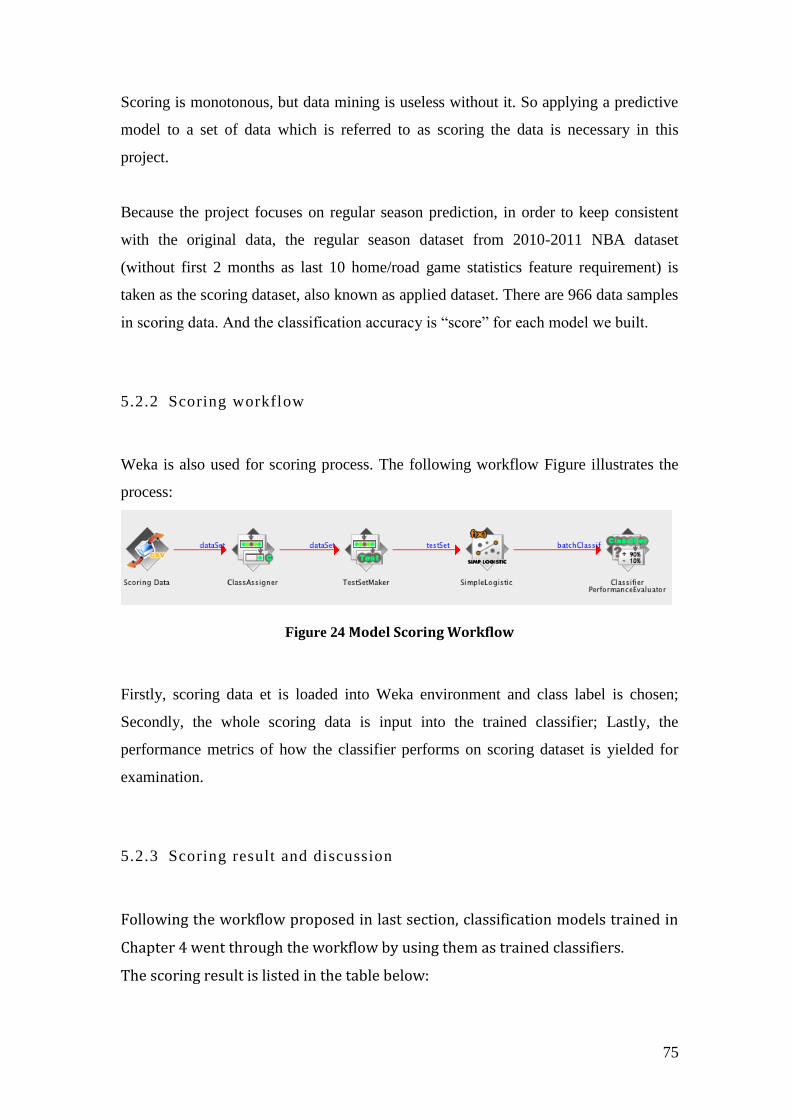
75
Scoring is monotonous, but data mining is useless without it. So applying a predictive
model to a set of data which is referred to as scoring the data is necessary in this
project.
Because the project focuses on regular season prediction, in order to keep consistent
with the original data, the regular season dataset from 2010-2011 NBA dataset
(without first 2 months as last 10 home/road game statistics feature requirement) is
taken as the scoring dataset, also known as applied dataset. There are 966 data samples
in scoring data. And the classification accuracy is “score” for each model we built.
5.2.2 Scoring workflow
Weka is also used for scoring process. The following workflow Figure illustrates the
process:
Figure 24 Model Scoring Workflow
Firstly, scoring data et is loaded into Weka environment and class label is chosen;
Secondly, the whole scoring data is input into the trained classifier; Lastly, the
performance metrics of how the classifier performs on scoring dataset is yielded for
examination.
5.2.3 Scoring result and discussion
Following the workflow proposed in last section, classification models trained in
Chapter 4 went through the workflow by using them as trained classifiers.
The scoring result is listed in the table below:
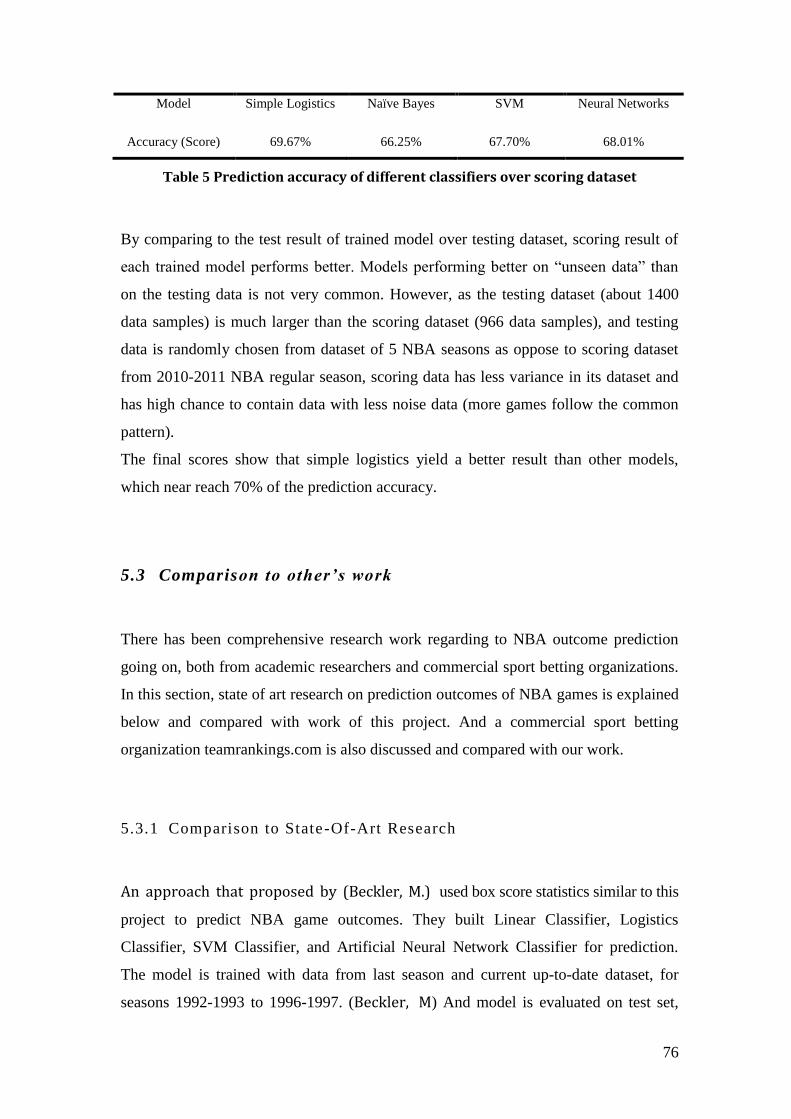
76
Model Simple Logistics Naïve Bayes SVM Neural Networks
Accuracy (Score) 69.67% 66.25% 67.70% 68.01%
Table 5 Prediction accuracy of different classifiers over scoring dataset
By comparing to the test result of trained model over testing dataset, scoring result of
each trained model performs better. Models performing better on “unseen data” than
on the testing data is not very common. However, as the testing dataset (about 1400
data samples) is much larger than the scoring dataset (966 data samples), and testing
data is randomly chosen from dataset of 5 NBA seasons as oppose to scoring dataset
from 2010-2011 NBA regular season, scoring data has less variance in its dataset and
has high chance to contain data with less noise data (more games follow the common
pattern).
The final scores show that simple logistics yield a better result than other models,
which near reach 70% of the prediction accuracy.
5.3 Comparison to other’s work
There has been comprehensive research work regarding to NBA outcome prediction
going on, both from academic researchers and commercial sport betting organizations.
In this section, state of art research on prediction outcomes of NBA games is explained
below and compared with work of this project. And a commercial sport betting
organization teamrankings.com is also discussed and compared with our work.
5.3.1 Comparison to State-Of-Art Research
An approach that proposed by (Beckler, M.) used box score statistics similar to this
project to predict NBA game outcomes. They built Linear Classifier, Logistics
Classifier, SVM Classifier, and Artificial Neural Network Classifier for prediction.
The model is trained with data from last season and current up-to-date dataset, for
seasons 1992-1993 to 1996-1997. (Beckler, M) And model is evaluated on test set,
77
which is not clearly explained that where it is collected from and how test data relates
to the training data. They built model for each NBA season and tested on test set. The
results yield shows that Linear Classifier is most accurate model with an average
accuracy rate of 70%; Logistics Regression Classifier comes second with accuracy of
68.76%; SVM yields accuracy of 67.91%; And Artificial Neural Network has the
lowest accuracy of 65.36%. Their work took the approach of building specific
predictive models for every NBA season. Models from their research use last
season’s statistics and current season’s statistics to predict game of current
season. This model training process and their vague explanation of testing dataset
make readers suspect there may be co-linearity between training data and testing
data that models trained take advantages of unwanted co-linearity when
predicting games in test set, so that the result of their research is questionable.
On the other hand, this project is focusing on building a generalized model to predict
games of any NBA seasons. And models built in our research project yield similar
accuracy in the testing result. This indicates that our generalized model works well
on “un-played games”.
Bernard Loeffelholz, Earl Bednar, and Kenneth W. Bauer did a research of predicting
NBA games by using neural networks. (Loeffelholz, B., 2009). Dataset used in their
research is the average box score statistics of first 650 games of the 2007-2008 NBA
regular season. In order to minimizing the impact of player transactions and injuries,
the first 650 games are used for prediction. And only mid-season average statistics is
used as prediction inputs. Among the chosen 650 games, 620 games are used for
training and testing, and 30 games for validation. They used fusion techniques to
integrate the contribution of different types of neural networks (Loeffelholz, B., 2009) to
yield a better result. The final model had 74.33% accuracy. Comparing to the approach
in this project, their model has unpleasant limitation and is very unpractical. Because
there is not mid-season statistics information until half of a season has been played. As
a result of using the average mid-season statistics as features, which covers statistics of
the first 650 games, used for training, testing and validation, the trained models has
very high variance and cannot yield good prediction results on games of other season
or even the rest games of the 2007-2008 NBA season. On the other hand, generalized
models trained in this project have been tested and scored on huge datasets and have
been proved their wide applicability.

78
5.3.2 Comparison to Popular NBA Game Perdit ion Websi te
Popular NBA prediction website Teamrankings.com provides several NBA game
prediction models for predicting NBA game results.
Model TR Picks Similar Games Decision Tree Power Ratings
Accuracy 69.6% 65.8% 69.6% 68.2%
Table 6 Game winner prediction from teamranings.com for 2010-11 NBA regular
seasons
They introduce 4 game prediction models. TR picks performs best among those 4
prediction models. It takes the results of various predictive models and game related
trends and statistics and breaking news. (TR picks from teamrankings.com) As shown
in the table above, it contains prediction accuracy of various algorithms from
teamrankings.com for predicting game results of 2010-2011 NBA regular season
without the first 2 months of the season (from Dec 2010 to May 2011). It covers the
same sample games as data used in scoring process of this project. Simple Logistics
Classifier yield slightly better result comparing to TR picks algorithms. It is worth
mentioning that model on teamrankings.com takes latest breaking news and trends into
account when predicting games, which enables them using richer information in their
prediction process. However, generalized models still yield slightly better results.
5.3.3 Summary
By discussing state of art research, there are many concerns regarding to the
particularity of other researchers work. Research on predicting outcomes of NBA
games by Beckler, M gave readers a vague description of testing process, and this
makes their research process questionable. In the research of Loeffelholz, B. for
predicting outcomes of NBA games, it uses mid-season statistics to prediction games
of first half season. This process is even more questionable because there is clearly
79
limitation on practicality of their model fitting process. There is no way to predict
games from first half season until the half season has been played. Comparing to their
result, our models are proved to be effective on both testing data and scoring data. And
it is very practical and generalized that it is able to predict most “un-played” games of
season.
When comparing our work with prediction result published on a popular NBA game
prediction website, teamrankings.com, our work is proven to be as effective as the
state-of-art commercial NBA game prediction application, which consume more up-to-
date information (breaking news) then our models.
Models built in this project has a high practicality, and they are generalized enough to
yield very good accuracy when predicting most games of a given season.
5.4 Conclusion
Models in this project have been evaluated in scoring dataset. Simple Logistics
Classifier yields the best result with an accuracy of 69.67%; Artificial Neural
Networks yield second best result with an accuracy of 68.01%; SVM comes next with
an accuracy of 67.70%; And Naïve Bayes yields the lowest accuracy of 66.25%.
By comparing to other researchers work in predicting NBA game outcomes, models in
this project are generalized, which conduct good prediction performance on large
number of “un-played games”. And our models are proven to be practical and can be
used as a real world game prediction application.
80
6 CONCLUSION
This chapter will summarise the work completed in earlier chapters,followed by a
discussion on the research objectives and achievements. This chapter also identifies
opportunities for further research.
Introduction
This dissertation explores the data mining techniques applied in the field of sports
predictive analysis. Driven by the increasing comprehensive of data in digital NBA
datasets are collected, and data mining technique successfully used in different area.
Sports data mining technique emerge and enable us to find more valuable information
to improve the performance and make right decisions in the right time. In many
instances, predicting the outcomes of sporting events has always been a challenging
and attractive work and is therefore forecasting problem draws a wide concern to
conduct experiment in this field.
National Basketball Association (NBA) is a multi-billion dollar industry and its
audiences are from all over the world. It is definitely one of the most popular sports
league in the world and there is a huge betting market driving predicting analysis.
Comprehensive historical statistics data has been collected to assist analysing NBA
games and players. As the dataset set grows with the NBA games, it has become the
perfect test bed for big data solution and this huge market and well-maintained
statistics dataset motivate public, statist and sports enthusiasts to discover implicit
knowledge in it.
This dissertation is aiming to achieve predicting NBA game outcome by using big data
with modern data warehousing and machine learning techniques. To further understand
the challenges of predicting basketball game outcome, a review of the previous
research in the above fields has been conducted as part of this research. This project is
implemented from the ground up. The relevant work has been done in this dissertation
81
includes automated data collection, data management and data warehousing, feature
selection, model fitting, model scoring and model evaluation.
Not only the whole workflow of practical work performed in this research and its
result can be used for future reference in sports predictive analysis, but also the
database and data warehouse created in this project can be continuously maintained
and reused for further research on a range of interesting topics. In the next sections,
research workflow, result and future research opportunities are presented in more
details.
6.1 Research Definition & Research Overview
At the beginning stage of this research, a range of topics has been reviewed in order to
gaining substantial knowledge to assist the progress of this research. The review
covers areas including data management, data mining, sports data mining, basic rules
of basketball and predictive model used in sports events. This review was then
employed to the design and implementation of an experiment aiming at predicting the
NBA game outcome. During this research, the following objectives were achieved.
Review of the literature in the area of data mining, from the definition, function,
techniques, process to the popular data mining tools.
Review of research in the fields of sports data mining: especially present the sports
science history, sports data mining applications, sports data mining tools.
Review of research literature on data mining technique used in NBA, in which
involves the research about NBA history, basic concept for basketball, data mining
used in basketball application.
Review of the previous research literature about data mining technique used for
predicting competitive sport outcome especially for basketball and popular
predictive machine learning algorithm introduction.
Preparation for the experiment, which involves automated data collection, data
cleaning, data transformation, data integration and data mart design.
82
Feature selection and model fitting, which involves extracting features used for
building predictive models by employing domain knowledge, and designing
workflow of training and testing popular classifiers for predicting NBA game
outcomes.
Evaluation of accuracy and practicality of trained models by using scoring process,
comparison with other researchers‟ work and a popular betting website which
public the sports result prediction outcome for betting to prove that this research is
an effective, generalized and practical solution.
6.2 Contributions to the Body of Knowledge
As outcomes of this dissertation‟s research and experiment results, the following
findings can be highlighted as contributions to the body of knowledge in the area of
sports predictive analysis.
The key part of experiment in this project is to perform machine learning algorithms
for NBA game outcome prediction. The output models and the data marts created in
this experiment can be used as reference for future research on utilizing machine
learning algorithms to predict the NBA game outcome.
The experiment also has shown that the data collection and data management process
as an important process before conducting machine learning process also have effect
on overall accuracy of the our put models. The experiment also consider some external
features, such as home or away, rest of time as factors of influencing the game
outcome, which inspires people in the future work to discover more interesting features
for sports analysis.
The research has also demonstrated that various algorithms influence the accuracy of
prediction. The result finally compare with the similar work from other research to
prove the technical feasibility of predicting competitive sports, so in the same way, our
experiment can be also used for other experiment comparison.
83
As the highlight of this dissertation, data from 5 NBA regular seasons was collected
for the experiment and data from 1 NBA regular season is collected for model scoring.
The fact that models fitted in this project are based on big dataset and have been
proven to be very effective on “un-played” games, makes this project more persuasive
as a data mining project. This is a meaningful aspect for measuring a data mining
prediction work comparing to other researchers work.
6.3 Experimentation, Evaluation and Limitation
6.3.1 Experimentation
This dissertation covers the whole process of a data mining project and it is
implemented from the ground up. The relevant work has been done in this dissertation
includes automated data collection, data management and data warehousing, feature
selection, model fitting, model scoring and model evaluation.
Ruby language enabled data collection tool has been created to collect raw NBA
statistics data from online data sources. Then collected raw data is organized and
uploaded to MySQL database hosted in Amazon EC2. Data collection and uploading
data to Cloud technology enabled database process are highly automated by using
Ruby programming language and relevant Ruby gems library.
Based on the organized database, a data mart is designed and created to facilitate the
data mining experiment. A star scheme with game log as fact table has been designed
and implemented.
Features for model training have been carefully designed by incorporating domain
knowledge and sample data with these features has been extracted from the data mart.
Features are mainly extracted from statistics about teams‟ performance from last
season and recent performance about teams. External features like game schedule and
home/road condition are also considered as features.
84
Extracted data samples are further dived into training set, test set and scoring set.
Training set and test set data are used for model fitting. And scoring set data is used for
model scoring.
By consuming data samples extracted from the data mart, a number of machine
learning predictive classifiers including Simple Logistics Classifier, Naïve Bayes
Classifier, Artificial Neural Network Classifier and SVM, have been trained and tested
for the purpose of predicting the NBA game outcome.
And finally a scoring process has been performed for testing performance of fitted
models on “un-seen” data. The result shows Simple Logistics yields a better result with
an accuracy of 69.67%.
6.3.2 Evaluation
Models in this project have been evaluated in scoring dataset. Simple Logistics
Classifier yields the best result with an accuracy of 69.67%; Artificial Neural
Networks yield second best result with an accuracy of 68.01%; SVM comes next with
an accuracy of 67.70%; And Naïve Bayes yields the lowest accuracy of 66.25%.
And these results have been compared with the state of art research. There appear to be
some significant concerns about other research work on their informal model
evaluation method and practicality of their models. On the other hand, models in this
project are trained using massive training dataset and have been tested by using data
sample representing a whole NBA regular season. Our models are proved to be
effective on both testing data and scoring data. And it is very practical and generalized
that it is able to predict most “un-played” games of season.
This project is also compared with prediction result published on a popular NBA game
prediction website, teamrankings.com. Models fitted in this project are proven to be as
effective as the state-of-art commercial NBA game prediction application.
Models built in this project have a high practicality, and they are generalized enough to
yield very good accuracy when predicting most games of a given season.
85
6.3.3 Limitation
One limiting factor on our approach is that, due extracted feature is relying on statistics
from last 10 home/road games; models trained in this project would not have as high
accuracy when predicting NBA games of first 2 months in a regular season as
predicting the reset of the season.
Other fact that researchers can work on is that, detailed statistics about players‟
performance has been managed in our database and data mart, but yet use in the game
result prediction. Theoretically, by add more valuable information into the model
training process, the output model could perform even better.
6.4 Future Work & Research
Human behaviour, including the game of basketball, is an inexact science with a lot of
variance, is inherited a tough problem for machine learning problem. This project takes
the approach of using big data solution by collecting massive amount of statistics data
about games happen in the last 5 years, with modern data collection, management
techniques and popular machine learning models to tackle this problem. And the result
of this project is encouraging, that models fitted in this project are proven to be
effective, generalized and practical when predicting games in real world scenarios.
The future work involves keep the database up-to-date. Due to the fact that the
targeting objects is a live NBA league. Player information will be changed when their
contract expire or retire. Meanwhile the upcoming game will happen, so update the
database will be beneficial to improve the model accuracy.
In addition, there are some substantial topics that researchers can work on. Using
clustering techniques would allow us to group players into clusters, and perhaps learn
what position they play, if they are a real standout player, or possibly reveal some
other underlying patterns for recurring new players. Another related topic worth
investigating is about outlier detection, which can help decision maker to identify
86
outstanding players or usually team status. Another interesting topic is to investigate
the impact of player performance on outcomes of NBA games.
Another interesting area of the future work is to discover the interesting feature based
on the arrangement data. There will be a broad space to carry out the hidden
knowledge existed in the box score statistics and team statistics through combine
features or compare features. Looking at how the features influence the team
performance.
6.5 Conclusion
As a research of investigating using data mining techniques for predicting outcomes of
NBA games, this project have a certain reference value for the related research work in
the future. This project is built from the ground up from collecting raw statistics data to
trained model evaluation. And data collection and data management solution is highly
automated. A popular Cloud solution is used to maintain the project budgets. The
whole process is proven to be successfully designed and implemented. Moreover, the
final output models are proven to be very effective, widely applicable and practical.
This project also provide an ideal data mining environment, data mart containing
comprehensive NBA game information, which can be reused by future research, and a
series of methods for keeping data mart up-to-date are also created. In any means, this
project can be considered as a successfully exploration of using data mining techniques
for sports result prediction, and it leaves a rich legacy for future research, that either
reusing techniques created in this project or make reference of this project.
87
BIBLIOGRAPHY
Beckler, M., Wang, H. & Papamichael, M., NBA Oracle.
Burges, C.J.C., 1998. A tutorial on support vector machines for pattern recognition.
Data mining and knowledge discovery, 2(2), pp.121–167.
Blundell, J., 2009. Numerical Algorithms for Predicting Sports Results. University of
Leeds, School of Computer Studies.
Burwitz, L., Moore, P.M. & Wilkinson, D.M., 1994. Future directions for
performance‐related sports science research: An interdisciplinary approach. Journal
of sports sciences, 12(1), pp.93–109.
Colet, E. and Parker, J. Advanced Scout: Data mining and knowledge discovery in
NBA data. Data Mining and Knowledge Discovery, Vol. 1, Num. 1, 1997, pp 121 –
125.
Deshpande, M.S.P. & Thakare, V.M., 2010. Data Mining System And Applications: A
Review. International Journal of Distributed and Parallel Systems (IJDPS) Vol, 1.
Gerrard, B. & Howard, D., 2007. Is the Moneyball approach transferable to complex
invasion team sports? International Journal of Sport Finance, 2(4), pp.214–230.
Hipp, A. & Mazlack, L., 2011. Mining Ice Hockey: Continuous Data Flow Analysis.
In IMMM 2011, The First International Conference on Advances in Information
Mining and Management. pp. 31–36
Hosmer, D.W. & Lemeshow, S., 2000. Applied logistic regression, Wiley-Interscience.
Hollinger, John (2002). Pro Basketball Prospectus: 2002 Edition. Potomac Books.
Hu, F. & Zidek, J.V., 2004. Forecasting NBA basketball playoff outcomes using the
weighted likelihood. Lecture Notes-Monograph Series, pp.385–395.
Kahn, J., Neural Network Prediction of NFL Football Games, 2003, available on
http://homepages.cae.wisc.edu/~ece539/project/f03/kahn.pdf, (accessed on
August 1, 2012).
Kantardzic, M., 2011. Data mining: concepts, models, methods, and algorithms,
Wiley-IEEE Press.

88
Kent, M., 2006. The Oxford dictionary of sports science and medicine, Oxford
University Press.
Kvam, P. & Sokol, J.S., 2006. A logistic regression/Markov chain model for NCAA
basketball. Naval research Logistics (NrL), 53(8), pp.788–803.
Knorr, E.M. & Ng, R.T., 1998. Algorithms for mining distance-based outliers in large
datasets. In Proceedings of the International Conference on Very Large Data Bases.
Citeseer, pp. 392–403.
Langley, P., Iba, W. & Thompson, K. (1992). An analysis of Bayesian classifiers. In
The Tenth National Conference on Artificial Intelligence, 399–406, AAAI Press, Sna
Jose, CA. 24, 25
Landwehr, N., Hall, M. & Frank, E., 2005. Logistic model trees. Machine Learning,
59(1), pp.161–205.
Lombardo, J., 2005. A new ball game in South Florida: Heat puts twist on marketing.
Street & Smith‟s SportsBusiness Journal, Retrieved June 24, 2005, from
SportsBusiness Journal archive database.
Loeffelholz, B., Bednar, E. & Bauer, K.W., 2009. Predicting NBA games using neural
networks. Journal of Quantitative Analysis in Sports, 5(1), p.1156
McCullagh, J., 2010. Data mining in sports: A Neural Network Approach. Intl. J. of
Sciences and Eng, 3, pp.131–138.
Miller, S. & Bartlett, R., 1996. The relationship between basketball shooting
kinematics, distance and playing position. Journal of Sports Sciences, 14(3), pp.243–
253.
Witten, I.H., Frank, E. & Hall, M.A., 2011. Data Mining: Practical machine learning
tools and techniques, Morgan Kaufmann.
Ohana, B., 2009. Opinion mining with the SentWordNet lexical resource.
Purucker, M.C, Neural Network Quarterbacking, 1996, IEEE Potentials.
Schumaker, R.P., Solieman, O.K. & Chen, H., 2010. Sports knowledge management
and data mining. Annual Review of Information Science and Technology, 44(1),
pp.115–157.

89
Solieman, O.K., 2006. Data mining in sports: A research overview. Dept. of
Management Information Systems.
Stein, G.P., 1999. Tracking from multiple view points: Self-calibration of space and
time. In Computer Vision and Pattern Recognition, 1999. IEEE Computer Society
Conference on. IEEE..
Sicard, G.K., Short, K. & Manley, P.A., 1999. A survey of injuries at five greyhound
racing tracks. Journal of small animal practice, 40(9), pp.428–432.
Stone, M.H., Sands, W.A. & Stone, M.E., 2004. The downfall of sports science in the
United States. Strength & Conditioning Journal, 26(2), p.72.
Tan, P.N., Steinbach, M. & Kumar, V., 2006. Introduction to data mining, Pearson
Addison Wesley Boston.
Trninic, S. & Dizdar, D., 2000. System of the performance evaluation criteria weighted
per positions in the basketball game. Collegium antropologicum, 24(1), pp.217–234.
Trninic, S. & Dizdar, D., 2000. System of the performance evaluation criteria weighted
per positions in the basketball game. Collegium antropologicum, 24(1), pp.217–234.
Vaz de Melo, P.O.S., Almeida, V.A.F. & Loureiro, A.A.F., 2008. Can complex
network metrics predict the behavior of NBA teams? In Proceeding of the 14th ACM
SIGKDD international conference on Knowledge discovery and data mining. ACM, pp.
695–703.
WANG, L. & YAO, Y., 2008. Analysis of characteristics of the age and figure
of„ position ambiguous‟ NBA players [J]. Journal of Physical Education, 9.
Whiting, R.,2001. Customers come into focus with combination software. Retrieved
June 11, 2005, from the LexisNexis database.
Zhang, G.P., Neural Networks for Classification: A Survey, IEEE Transactions
on Systems, Man, and Cybernetics- Part C: Applications and Reviews, 2000, 30, 4.
Weka Sourceforge Class Library (2012)
http://weka.sourceforge.net/doc.dev/weka/classifiers/AbstractClassifier.html
TR Pick algorithms from teamrankings.com
http://www.teamrankings.com/about/about-our-predictions/
Basketball Reference. Retrieved July, 2012, from www.basketball-reference.com

90
Database Basketball. Retrieved July, 2012, from www.databasebasketball.com
National Basketball Association (NBA) Official Website. Retrieved July, 2012, from
http://www.nba.com/
Team Rankings Betting Website. Retrieved July, 2012, from
http://www.teamrankings.com/
Beautiful Soup Python Library. Retrieved July, 2012, from
http://www.crummy.com/software/BeautifulSoup/
Mechanize Ruby Gem. Retrieved July, 2012, from
http://mechanize.rubyforge.org/Mechanize.html
Nokogiri. Retrieved July, 2012, from http://nokogiri.org/
Watir WebDriver. Retrieved July, 2012, from http://watirwebdriver.com/
Amazon EC2. Retrieved July, 2012, from http://aws.amazon.com/ec2/
Amazon EBS. Retrieved July, 2012, from http://aws.amazon.com/ebs/
Mysql2 Ruby Gem. Retrieved July, 2012, from
http://rubydoc.info/gems/mysql2/0.3.11/frames
Fastercsv Ruby Gem. Retrieved July, 2012, from http://fastercsv.rubyforge.org/
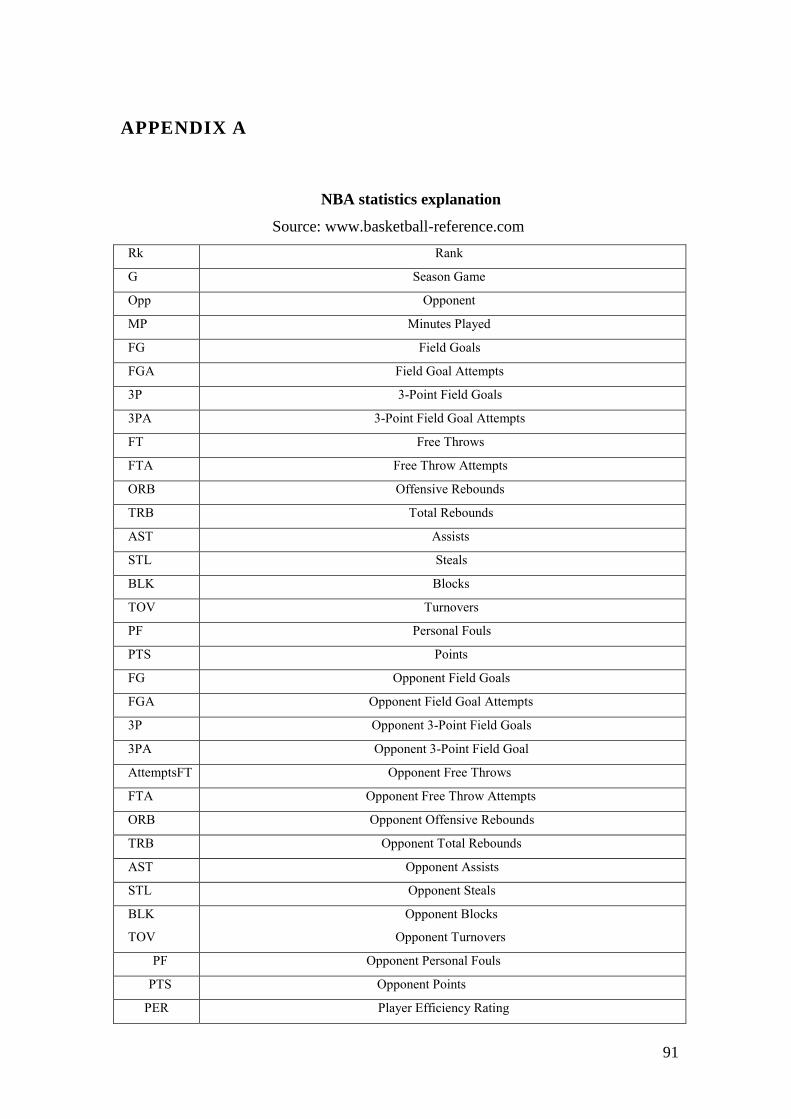
91
APPENDIX A
NBA statistics explanation
Source: www.basketball-reference.com
Rk Rank
G Season Game
Opp Opponent
MP Minutes Played
FG Field Goals
FGA Field Goal Attempts
3P 3-Point Field Goals
3PA 3-Point Field Goal Attempts
FT Free Throws
FTA Free Throw Attempts
ORB Offensive Rebounds
TRB Total Rebounds
AST Assists
STL Steals
BLK Blocks
TOV Turnovers
PF Personal Fouls
PTS Points
FG Opponent Field Goals
FGA Opponent Field Goal Attempts
3P Opponent 3-Point Field Goals
3PA Opponent 3-Point Field Goal
AttemptsFT Opponent Free Throws
FTA Opponent Free Throw Attempts
ORB Opponent Offensive Rebounds
TRB Opponent Total Rebounds
AST Opponent Assists
STL Opponent Steals
BLK
TOV
Opponent Blocks
Opponent Turnovers
PF Opponent Personal Fouls
PTS Opponent Points
PER Player Efficiency Rating
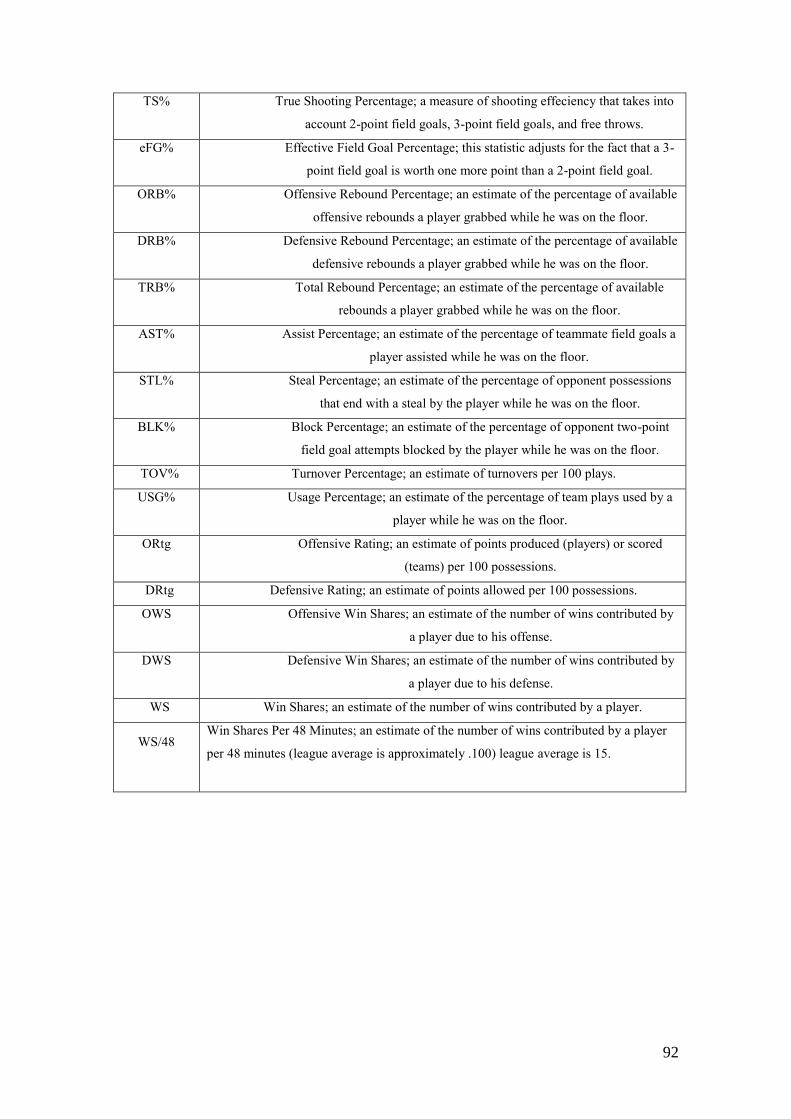
92
TS%
True Shooting Percentage; a measure of shooting effeciency that takes into
account 2-point field goals, 3-point field goals, and free throws.
eFG%
Effective Field Goal Percentage; this statistic adjusts for the fact that a 3-
point field goal is worth one more point than a 2-point field goal.
ORB%
Offensive Rebound Percentage; an estimate of the percentage of available
offensive rebounds a player grabbed while he was on the floor.
DRB%
Defensive Rebound Percentage; an estimate of the percentage of available
defensive rebounds a player grabbed while he was on the floor.
TRB%
Total Rebound Percentage; an estimate of the percentage of available
rebounds a player grabbed while he was on the floor.
AST%
Assist Percentage; an estimate of the percentage of teammate field goals a
player assisted while he was on the floor.
STL%
Steal Percentage; an estimate of the percentage of opponent possessions
that end with a steal by the player while he was on the floor.
BLK%
Block Percentage; an estimate of the percentage of opponent two-point
field goal attempts blocked by the player while he was on the floor.
TOV% Turnover Percentage; an estimate of turnovers per 100 plays.
USG%
Usage Percentage; an estimate of the percentage of team plays used by a
player while he was on the floor.
ORtg
Offensive Rating; an estimate of points produced (players) or scored
(teams) per 100 possessions.
DRtg Defensive Rating; an estimate of points allowed per 100 possessions.
OWS
Offensive Win Shares; an estimate of the number of wins contributed by
a player due to his offense.
DWS
Defensive Win Shares; an estimate of the number of wins contributed by
a player due to his defense.
WS Win Shares; an estimate of the number of wins contributed by a player.
WS/48
Win Shares Per 48 Minutes; an estimate of the number of wins contributed by a player
per 48 minutes (league average is approximately .100) league average is 15.

93
APPENDIX B
Features for Models of This Project
No. Feature
1 Total wining percentage of home team in last NBA season.
2 Total wining percentage of road team in last NBA season.
3 Total wining percentage of home team played home games in last
NBA season.
4 Total wining percentage of road team played road games in last NBA
season.
5 Total wining percentage of games of home teams with specific
number of rest days before the game in last NBA season.
6 Total wining percentage of games of road teams with specific
number of rest days before the game in last NBA season.
7 Total wining percentage of home teams against road teams in last
NBA season.
8 Home team‟s number of rest days before the game.
9 Road team‟s number of rest days before the game.
10 Average points of home teams played last 10 home games.
11 Average free throw percentage of home teams played last 10 home
games.
12 Average 3 points shots percentage of home teams played last 10
home games.
13 Average field goal percentage of home teams played last 10 home
games.
14 Average number of offensive rebounds of home teams played last 10
home games.
15 Average number of total rebounds of home teams played last 10
home games.
16 Average number of assists of home teams played last 10 home
games.
17 Average number of turnovers of home teams played last 10 home

94
games.
18 Average points of opponents of home teams played in the in the last
10 home games.
19 Average free throw percentage of opponents of home teams played in
the last 10 home games.
20 Average 3 points shots percentage of opponents of home teams
played in the last 10 home games.
21 Average field goal percentage of opponents of home teams played in
the last 10 home games.
22 Average number of offensive rebounds of opponents of home teams
played in the last 10 home games.
23 Average number of total rebounds of opponents of home teams
played in the last 10 home games.
24 Average number of assists of opponents of home teams played in the
last 10 home games.
25 Average number of turnovers of opponents of home teams played in
the last 10 home games.
26 Average points of road teams played last 10 home games.
27 Average free throw percentage of road teams played last 10 home
games.
28 Average 3 points shots percentage of road teams played last 10 home
games.
29 Average field goal percentage of road teams played last 10 home
games.
30 Average number of offensive rebounds of road teams played last 10
home games.
31 Average number of total rebounds of road teams played last 10 home
games.
32 Average number of assists of road teams played last 10 home games.
33 Average number of turnovers of road teams played last 10 home
games.
34 Average points of opponents of road teams played in the in the last
10 home games.
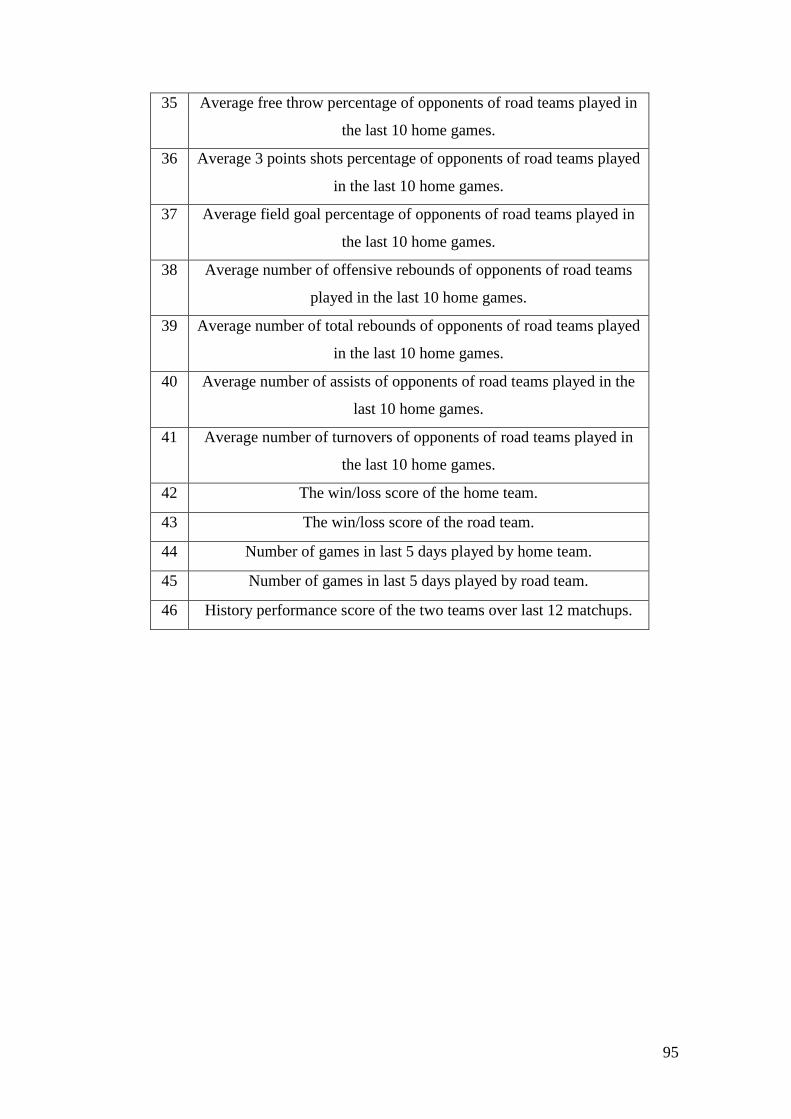
95
35 Average free throw percentage of opponents of road teams played in
the last 10 home games.
36 Average 3 points shots percentage of opponents of road teams played
in the last 10 home games.
37 Average field goal percentage of opponents of road teams played in
the last 10 home games.
38 Average number of offensive rebounds of opponents of road teams
played in the last 10 home games.
39 Average number of total rebounds of opponents of road teams played
in the last 10 home games.
40 Average number of assists of opponents of road teams played in the
last 10 home games.
41 Average number of turnovers of opponents of road teams played in
the last 10 home games.
42 The win/loss score of the home team.
43 The win/loss score of the road team.
44 Number of games in last 5 days played by home team.
45 Number of games in last 5 days played by road team.
46 History performance score of the two teams over last 12 matchups.