Splicing of designer exons informs a biophysical model for exon definition
18
Splicing of designer exons informs a biophysical model for exon definition MAURICIO A. ARIAS, 1 ASHIRA LUBKIN, 1,2 and LAWRENCE A. CHASIN 1 1 Department of Biological Sciences, Columbia University, New York, New York 10027, USA ABSTRACT Pre-mRNA molecules in humans contain mostly short internal exons flanked by longer introns. To explain the removal of such introns, exon recognition instead of intron recognition has been proposed. We studied this exon definition using designer exons (DEs) made up of three prototype modules of our own design: an exonic splicing enhancer (ESE), an exonic splicing silencer (ESS), and a Reference Sequence (R) predicted to be neither. Each DE was examined as the central exon in a three-exon minigene. DEs made of R modules showed a sharp size dependence, with exons shorter than 14 nt and longer than 174 nt splicing poorly. Changing the strengths of the splice sites improved longer exon splicing but worsened shorter exon splicing, effectively displacing the curve to the right. For the ESE we found, unexpectedly, that its enhancement efficiency was independent of its position within the exon. For the ESS we found a step-wise positional increase in its effects; it was most effective at the 3 ′ end of the exon. To apply these results quantitatively, we developed a biophysical model for exon definition of internal exons undergoing cotranscriptional splicing. This model features commitment to inclusion before the downstream exon is synthesized and competition between skipping and inclusion fates afterward. Collision of both exon ends to form an exon definition complex was incorporated to account for the effect of size; ESE/ESS effects were modeled on the basis of stabilization/destabilization. This model accurately predicted the outcome of independent experiments on more complex DEs that combined ESEs and ESSs. Keywords: exon definition; designer exons; pre-mRNA splicing; biophysical model INTRODUCTION For most mammalian genes, transcription produces pre- mRNA molecules that include exons and introns; the introns are removed and the exons are spliced together. The cellular splicing machinery identifies the boundaries between exons and introns with extreme accuracy. Early studies showed that the sequences at these boundaries (Mount 1982) are fun- damental contributors to their recognition. However, it was later realized that these sequences by themselves are not enough since many sequences that resemble the consensus are ignored in the process of splicing while others that show less similarity are used (Sun and Chasin 2000). Two alternative ideas have been implicit in thinking about the early recognition of splice sites (De Conti et al. 2013). In the first approach, intron definition, each intron is recog- nized as a unit and removed; the exons are joined as a result. In the second approach, exon definition, each exon is recog- nized as an entity and joined to another similarly recognized exon; the intron is removed as a result. Therefore, in both approaches the ends of the intervening intron must be paired, requiring intron definition. The difference lies in the initial recognition of either an intron or an exon. System- atic changes in intron lengths showed that intron definition prevails when a central intron is <200–250 nt; beyond this length exon definition takes place (Fox-Walsh et al. 2005). More than 75% of human exons are flanked by two introns that exceed this threshold and alternative exon skipping oc- curs predominantly in this group (Fox-Walsh et al. 2005). Thus the elucidation of just how exons are defined, i.e., rec- ognized as an entity, is important for understanding splicing as a fundamental step in gene expression. The development of in vitro splicing (Dignam et al. 1983; Krainer et al. 1984) has led to a detailed picture of the biochemistry of splicing and to the identification of myriad proteins regulating this process. However, this tool works well only with short introns and systems with only a single such intron are routinely used. Accordingly, splicing sub- strates with internal exons that are surrounded by long in- trons have usually been abbreviated by removing large chunks of the introns and frequently further abridged to 2 Present address: Sackler Institute of Graduate Biomedical Science, New York University School of Medicine, New York, NY 10016, USA Corresponding author: [email protected] Article published online ahead of print. Article and publication date are at http://www.rnajournal.org/cgi/doi/10.1261/rna.048009.114. © 2014 Arias et al. This article is distributed exclusively by the RNA Society for the first 12 months after the full-issue publication date (see http:// rnajournal.cshlp.org/site/misc/terms.xhtml). After 12 months, it is avail- able under a Creative Commons License (Attribution-NonCommercial 4.0 International), as described at http://creativecommons.org/licenses/ by-nc/4.0/. RNA 21:1–17; Published by Cold Spring Harbor Laboratory Press for the RNA Society 1 Cold Spring Harbor Laboratory Press on July 16, 2016 - Published by rnajournal.cshlp.org Downloaded from
-
Upload
independent -
Category
Documents
-
view
1 -
download
0
Transcript of Splicing of designer exons informs a biophysical model for exon definition
Splicing of designer exons informs a biophysical modelfor exon definition
MAURICIO A. ARIAS,1 ASHIRA LUBKIN,1,2 and LAWRENCE A. CHASIN1
1Department of Biological Sciences, Columbia University, New York, New York 10027, USA
ABSTRACT
Pre-mRNA molecules in humans contain mostly short internal exons flanked by longer introns. To explain the removal of suchintrons, exon recognition instead of intron recognition has been proposed. We studied this exon definition using designer exons(DEs) made up of three prototype modules of our own design: an exonic splicing enhancer (ESE), an exonic splicing silencer(ESS), and a Reference Sequence (R) predicted to be neither. Each DE was examined as the central exon in a three-exonminigene. DEs made of R modules showed a sharp size dependence, with exons shorter than 14 nt and longer than 174 ntsplicing poorly. Changing the strengths of the splice sites improved longer exon splicing but worsened shorter exon splicing,effectively displacing the curve to the right. For the ESE we found, unexpectedly, that its enhancement efficiency was independentof its position within the exon. For the ESS we found a step-wise positional increase in its effects; it was most effective at the 3′ endof the exon. To apply these results quantitatively, we developed a biophysical model for exon definition of internal exonsundergoing cotranscriptional splicing. This model features commitment to inclusion before the downstream exon is synthesizedand competition between skipping and inclusion fates afterward. Collision of both exon ends to form an exon definition complexwas incorporated to account for the effect of size; ESE/ESS effects were modeled on the basis of stabilization/destabilization.This model accurately predicted the outcome of independent experiments on more complex DEs that combined ESEs and ESSs.
Keywords: exon definition; designer exons; pre-mRNA splicing; biophysical model
INTRODUCTION
For most mammalian genes, transcription produces pre-mRNAmolecules that include exons and introns; the intronsare removed and the exons are spliced together. The cellularsplicing machinery identifies the boundaries between exonsand introns with extreme accuracy. Early studies showedthat the sequences at these boundaries (Mount 1982) are fun-damental contributors to their recognition. However, it waslater realized that these sequences by themselves are notenough since many sequences that resemble the consensusare ignored in the process of splicing while others thatshow less similarity are used (Sun and Chasin 2000).Two alternative ideas have been implicit in thinking about
the early recognition of splice sites (De Conti et al. 2013). Inthe first approach, intron definition, each intron is recog-nized as a unit and removed; the exons are joined as a result.In the second approach, exon definition, each exon is recog-nized as an entity and joined to another similarly recognizedexon; the intron is removed as a result. Therefore, in bothapproaches the ends of the intervening intron must be
paired, requiring intron definition. The difference lies inthe initial recognition of either an intron or an exon. System-atic changes in intron lengths showed that intron definitionprevails when a central intron is <200–250 nt; beyond thislength exon definition takes place (Fox-Walsh et al. 2005).More than 75% of human exons are flanked by two intronsthat exceed this threshold and alternative exon skipping oc-curs predominantly in this group (Fox-Walsh et al. 2005).Thus the elucidation of just how exons are defined, i.e., rec-ognized as an entity, is important for understanding splicingas a fundamental step in gene expression.The development of in vitro splicing (Dignam et al. 1983;
Krainer et al. 1984) has led to a detailed picture of thebiochemistry of splicing and to the identification of myriadproteins regulating this process. However, this tool workswell only with short introns and systems with only a singlesuch intron are routinely used. Accordingly, splicing sub-strates with internal exons that are surrounded by long in-trons have usually been abbreviated by removing largechunks of the introns and frequently further abridged to
2Present address: Sackler Institute of Graduate Biomedical Science,New York University School of Medicine, New York, NY 10016, USACorresponding author: [email protected] published online ahead of print. Article and publication date are at
http://www.rnajournal.org/cgi/doi/10.1261/rna.048009.114.
© 2014 Arias et al. This article is distributed exclusively by the RNA Societyfor the first 12 months after the full-issue publication date (see http://rnajournal.cshlp.org/site/misc/terms.xhtml). After 12 months, it is avail-able under a Creative Commons License (Attribution-NonCommercial 4.0International), as described at http://creativecommons.org/licenses/by-nc/4.0/.
RNA 21:1–17; Published by Cold Spring Harbor Laboratory Press for the RNA Society 1
Cold Spring Harbor Laboratory Press on July 16, 2016 - Published by rnajournal.cshlp.orgDownloaded from

comprise only two exons. Evenwith these restrictions, the rateof intron removal is lower in vitro than in vivo (Hicks et al.2005) and is lower yet for long introns in vitro (Lazarevand Manley 2007). These limitations in splicing long intronsare present even in current transcription-splicing coupledsystems (Lazarev and Manley 2007). Therefore, modifica-tions to the in vitro assay or the development of new toolsto complement it would be useful for the study of exondefinition.
Factors that affect inclusion of an exon in the final mRNAmolecule include the strengths of the 5′ and 3′ splice sites(SSs) and the presence of regulatory sequences both in theexon (exonic splicing enhancers, ESEs; and exonic splicing si-lencers, ESSs) and in the intron (intronic splicing enhancers,ISEs; and intronic splicing silencers, ISSs). More recently,the involvement of transcription kinetics (Dujardin et al.2013) and chromatin structure (Luco et al. 2011) have beendemonstrated. Many of these factors have been studied bysystematic variation (Graveley et al. 1998; Luco et al. 2010;Shepard et al. 2011) and in model systems functional net-works of interacting proteins bound to regulatory sequenceelements have been discovered (Li et al. 2007; Martinez andLynch 2013).
However, a set of general principles that would allow“finding splice sites within a wilderness of RNA” (Black1995) still eludes us, as is evidenced by our inability to predictthese sites within typical long transcripts. Although reason-able models for several pieces of the puzzle have been put for-ward, new approaches may be needed (Roca et al. 2013).
We have chosen to explore splicing using a reductionistpoint of view, attempting to segregate individual parametersgoverning splicing so as to identify fundamental biophysi-cal principles involved and their parameters. Toward thisend we have created simplified exon sequences of our owndesign (“designer exons” or DEs). A key feature in the designof these exons was the capability to vary the parameters ofexon length, ESE/ESS number, and ESE/ESS position withoutotherwise changing the sequence characteristics of the exon.We found that these parameters include both simple andcomplex components but that both can be modeled to con-form to straightforward molecular mechanisms.
RESULTS
DEs: effect of size
The exon definition model for splice site recognition (Berget1995) maintains that internal exons will be chosen for inclu-sion only if they have acceptable splice sites at both ends, sug-gesting a physical interaction between the two ends of theexon. Thus the distance between the two ends of the exoncould be an important parameter for the realization of thisinteraction. Consistent with this idea internal exon size in hu-mans is limited, with <4% being >300 nt (Berget 1995). Theeffect of exon size on splicing has been tested in the past, but
the experimental exon expansions changed the quality as wellas the length of the test exons. Thus splicing in those exper-iments could well have been affected by the quality and notnecessarily the quantity of the added sequence (Chen andChasin 1994; Sterner et al. 1996). Since DEs can be expandedby adding identical sequence modules, chosen to avoid exon-ic regulatory elements, the contribution of parameters otherthan length should be diminished.To assess the effect of size on exon inclusion we construct-
ed a series of 3-exonminigenes containing a DE as the centralexon flanked by introns of 299 and 635 nt (Fig. 1; Supple-mental Fig. S1). Both introns are longer than the size oftencited for intron definition (200–250 nt, [Fox-Walsh et al.2005]), although intron 1 is close to this size. However, nei-ther of these introns is removed by intron definition, sincemutations that knock out or weaken the splice sites of theseintrons have never been seen to result in intron retention((Carothers et al. 1993; Chen and Chasin 1993) and resultstherein). Importantly, in the experiments presented here inwhich scores of exon skipping results were visualized bygel electrophoresis of PCR products, we never saw any evi-dence of intron retention (data not shown and SupplementalFig. S12).The DEs are composed exclusively of repeats of the 8-nt
Reference Sequence CCAAACAA inserted between positions+1 (3′SS) and −5 (5′SS); those remaining bases at the 5′
and 3′ ends are parts of the splice sites or necessary “linker”sequences. We previously called this Reference Sequence“neutral,” as it is not predicted (Zhang and Chasin 2004)to be either a putative exonic splicing enhancer (PESE) ora putative exonic splicing silencer (PESS) and it had rela-tively little effect on the splicing of a test exon (Zhang et al.
FIGURE 1. Construction of designer exons (example). From the bot-tom: the RNA sequence with two 8-nt ESE motifs in green. Above thatis a plot of the computationally predicted enhancer/silencer strengthsof each overlapping eight-mer using two different criteria: red or blue(Zhang and Chasin 2004). The dashed lines indicate cutoffs used forclassifying a sequence as an ESE (green) or ESS (red). The exon is indi-cated by a blue bar, where E refers to the ESE motif and R or r refers tothe reference motif, with the lower case indicating its use as a spacer. Atthe top of the graph is an abbreviated version of the motif compositionin which the spacer rmotifs have been omitted. Finally, at the top of thepanel is a cartoon showing the overall structure of a minigene containinga DE, with the splice sites in blue and the ESE motifs in green.
Arias et al.
2 RNA, Vol. 21, No. 2
Cold Spring Harbor Laboratory Press on July 16, 2016 - Published by rnajournal.cshlp.orgDownloaded from
2009). More importantly this sequence has the property ofnot “creating” either a predicted ESE or a predicted ESSwhen all overlapping eight-mers formed by self-concatena-tion are considered (Zhang et al. 2009). However, in the anal-ysis presented here it appears to have weak silencing activity(see below); we therefore refer to it as the Reference Sequence(R), since the effects of the ESEs and ESSs used were evaluat-ed by substituting them for the Reference Sequence.The exon sizes used here ranged from 14 to 302 nt in steps
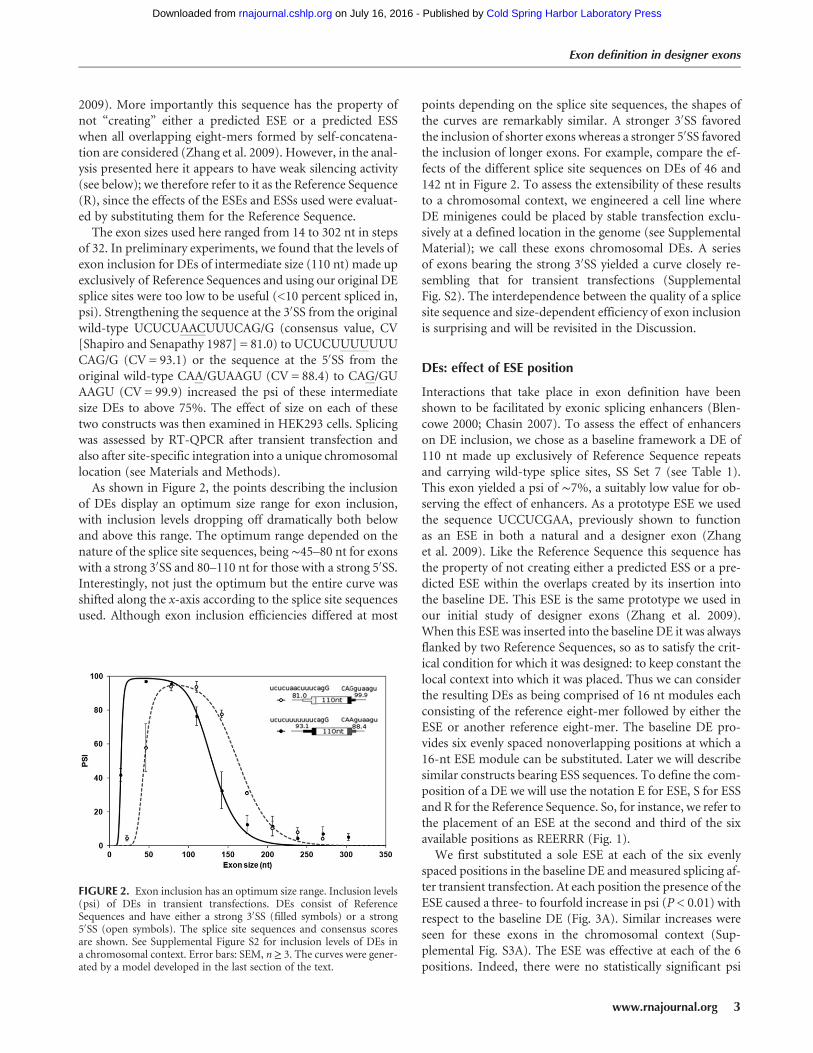
of 32. In preliminary experiments, we found that the levels ofexon inclusion for DEs of intermediate size (110 nt) made upexclusively of Reference Sequences and using our original DEsplice sites were too low to be useful (<10 percent spliced in,psi). Strengthening the sequence at the 3′SS from the originalwild-type UCUCUAACUUUCAG/G (consensus value, CV[Shapiro and Senapathy 1987] = 81.0) to UCUCUUUUUUUCAG/G (CV = 93.1) or the sequence at the 5′SS from theoriginal wild-type CAA/GUAAGU (CV = 88.4) to CAG/GUAAGU (CV = 99.9) increased the psi of these intermediatesize DEs to above 75%. The effect of size on each of thesetwo constructs was then examined in HEK293 cells. Splicingwas assessed by RT-QPCR after transient transfection andalso after site-specific integration into a unique chromosomallocation (see Materials and Methods).As shown in Figure 2, the points describing the inclusion
of DEs display an optimum size range for exon inclusion,with inclusion levels dropping off dramatically both belowand above this range. The optimum range depended on thenature of the splice site sequences, being ∼45–80 nt for exonswith a strong 3′SS and 80–110 nt for those with a strong 5′SS.Interestingly, not just the optimum but the entire curve wasshifted along the x-axis according to the splice site sequencesused. Although exon inclusion efficiencies differed at most
points depending on the splice site sequences, the shapes ofthe curves are remarkably similar. A stronger 3′SS favoredthe inclusion of shorter exons whereas a stronger 5′SS favoredthe inclusion of longer exons. For example, compare the ef-fects of the different splice site sequences on DEs of 46 and142 nt in Figure 2. To assess the extensibility of these resultsto a chromosomal context, we engineered a cell line whereDE minigenes could be placed by stable transfection exclu-sively at a defined location in the genome (see SupplementalMaterial); we call these exons chromosomal DEs. A seriesof exons bearing the strong 3′SS yielded a curve closely re-sembling that for transient transfections (SupplementalFig. S2). The interdependence between the quality of a splicesite sequence and size-dependent efficiency of exon inclusionis surprising and will be revisited in the Discussion.
DEs: effect of ESE position
Interactions that take place in exon definition have beenshown to be facilitated by exonic splicing enhancers (Blen-cowe 2000; Chasin 2007). To assess the effect of enhancerson DE inclusion, we chose as a baseline framework a DE of110 nt made up exclusively of Reference Sequence repeatsand carrying wild-type splice sites, SS Set 7 (see Table 1).This exon yielded a psi of ∼7%, a suitably low value for ob-serving the effect of enhancers. As a prototype ESE we usedthe sequence UCCUCGAA, previously shown to functionas an ESE in both a natural and a designer exon (Zhanget al. 2009). Like the Reference Sequence this sequence hasthe property of not creating either a predicted ESS or a pre-dicted ESE within the overlaps created by its insertion intothe baseline DE. This ESE is the same prototype we used inour initial study of designer exons (Zhang et al. 2009).When this ESE was inserted into the baseline DE it was alwaysflanked by two Reference Sequences, so as to satisfy the crit-ical condition for which it was designed: to keep constant thelocal context into which it was placed. Thus we can considerthe resulting DEs as being comprised of 16 nt modules eachconsisting of the reference eight-mer followed by either theESE or another reference eight-mer. The baseline DE pro-vides six evenly spaced nonoverlapping positions at which a16-nt ESE module can be substituted. Later we will describesimilar constructs bearing ESS sequences. To define the com-position of a DE we will use the notation E for ESE, S for ESSand R for the Reference Sequence. So, for instance, we refer tothe placement of an ESE at the second and third of the sixavailable positions as REERRR (Fig. 1).We first substituted a sole ESE at each of the six evenly
spaced positions in the baseline DE and measured splicing af-ter transient transfection. At each position the presence of theESE caused a three- to fourfold increase in psi (P < 0.01) withrespect to the baseline DE (Fig. 3A). Similar increases wereseen for these exons in the chromosomal context (Sup-plemental Fig. S3A). The ESE was effective at each of the 6positions. Indeed, there were no statistically significant psi
FIGURE 2. Exon inclusion has an optimum size range. Inclusion levels(psi) of DEs in transient transfections. DEs consist of ReferenceSequences and have either a strong 3′SS (filled symbols) or a strong5′SS (open symbols). The splice site sequences and consensus scoresare shown. See Supplemental Figure S2 for inclusion levels of DEs ina chromosomal context. Error bars: SEM, n≥ 3. The curves were gener-ated by a model developed in the last section of the text.
Exon definition in designer exons
www.rnajournal.org 3
Cold Spring Harbor Laboratory Press on July 16, 2016 - Published by rnajournal.cshlp.orgDownloaded from
differences between positions, except for three differences of≤5% in the chromosomal DEs.
ESEs are often thought of as acting by enhancing the re-cruitment of components of the splicing machinery to anearby splice site. In this view they would be expected toshow a position effect, being more important close to aweak splice site. The lack of a position effect here could bedue to the incorrectness of this argument or to the possibilitythat the ESE is equally effective at enhancing the use of the3′SS and the 5′SS, and so only appears to be position indepen-dent. To distinguish between these two ideas, we manipulat-ed one or the other of the DE splice sites so as to create a rangeof differences between the two in terms of SS strength.
We tested seven combinations of three 5′ and four 3′SSsequences using transient transfection. We started with aDE with two relatively strong splice sites, having consensusvalues of 93.1 and 88.4 for the 3′SS and 5′SS, respectively.This exon was efficiently included even without an ESE(psi of ∼80%) and so was not useful for evaluating enhance-ment (Table 1, SS Set 3). We then weakened one or the otherof the splice sites so as to produce a range of disparities be-tween the 3′SS and the 5′SS strengths; the differences instrength (3′SS minus 5′SS) for the four tested pairs were+10, −1, −6, and −7, measured as CV. Weakening eitherthe 3′SS or 5′SS reduced psi values to the 7%–50% range sothat the effect of adding an ESE could be evaluated (Table 1,SS Sets 4–7). Once again no statistically significant differencewas found for the effect of the ESE at the various positions: P-values were >0.10 for all pairwise comparisons (Fig. 3B,C,D;Table 1, last column). SS Set 5 was also tested in a chromo-somal context; addition of a single ESE produced increasesof similar magnitude to those found using transient transfec-tions and was once again position independent (Supplemen-tal Fig. S3B). These observations provide no support for theexistence of a position effect for splicing enhancement by thisESE in these DEs.
As might have been expected, the DEs without ESEsspliced more efficiently as the strength of the splice sitesequences increased (Table 1, column 7, R2 of 0.81 for psiversus combined CV scores). Interestingly, the average incre-ment in psi engendered by an ESE also increased with thecombined CV score (R2 = 0.96) in this range (psi of 7%–
50% without the ESE).This position independence result contrasts with other re-
ports that suggest that the positions closest to the splice sitesare the most effective for ESEs (Graveley et al. 1998;Fairbrother et al. 2004). This discrepancy could be explainedby our use of an exonic sequence context designed to mini-mize factors other than distance when ESEs are placed at dif-ferent positions. However, an alternative explanation is thatthe ESE we used, also carefully chosen for the same reason,happens to be a position-independent ESE, perhaps a minor-ity type. Toaddress this questionwe also tested threeprevious-ly described ESEs, which correspond to the SR proteinsSRSF1, SRSF2, and SRSF7. The exact sequences chosen (Table2) were based on relative binding affinities reported in theCISBP database (Ray et al. 2013). Unlike our designed ESE,these ESE sequences are not immune from creating additionalESRs through overlaps with their insertion sites; however,those creations will be the same regardless of position. Eachof these ESEswas tested singly in each of the same six positionsdescribed above. SRSF2 was tested using the same splice sitesused for the designer ESE. SRSF1 and SRSF7 produced near100% inclusion from any position with these splice sites.Therefore, these two ESEs were tested using somewhat weak-ened splice sites (Set 8, Table 1). SRSF1 and SRSF7 producedthe same enhancement of splicing at each of the six positions(Fig. 3E). The samewas true for SRSF2 at positions 1–5. SRSF2at position 6, closest to the 5′SS, did exhibit a difference, but ityielded less, not more, enhancement (Fig. 3F). These resultsthus support the conclusion that many ESEs do not show anexonic position effect for splicing (see also Discussion).
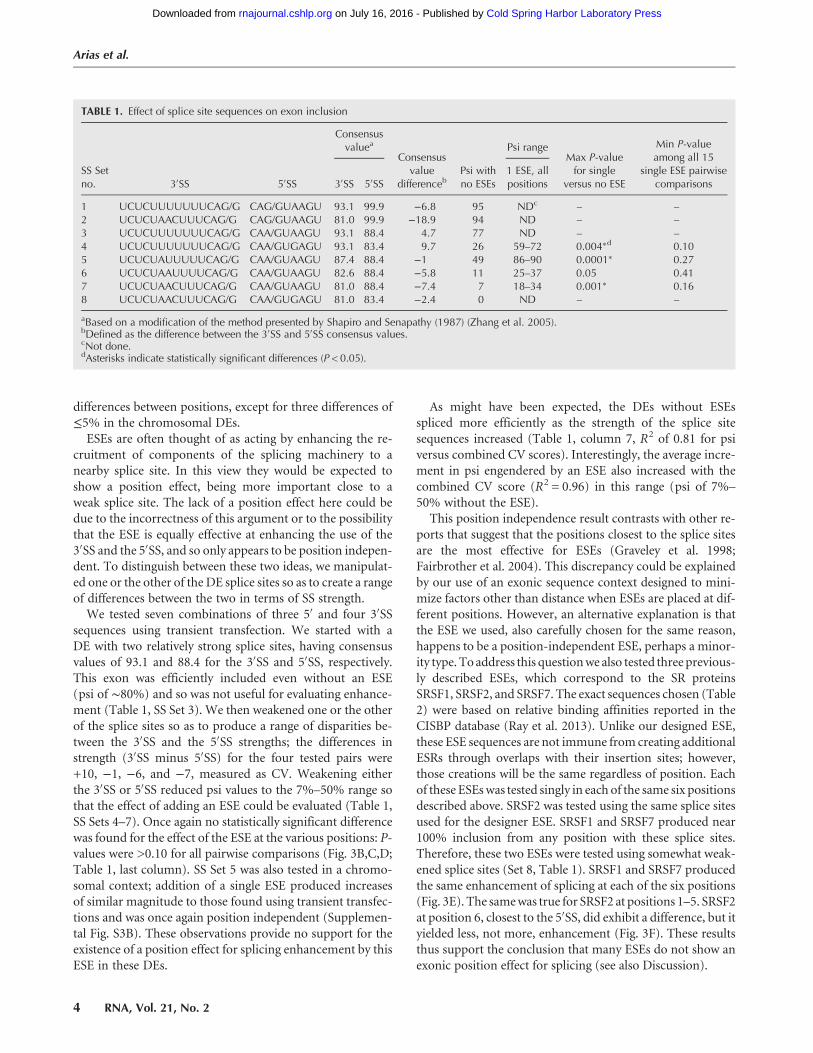
TABLE 1. Effect of splice site sequences on exon inclusion
SS Setno. 3′SS 5′SS
Consensusvaluea
Consensusvalue
differencebPsi withno ESEs
Psi rangeMax P-valuefor single
versus no ESE
Min P-valueamong all 15
single ESE pairwisecomparisons3′SS 5′SS
1 ESE, allpositions
1 UCUCUUUUUUUCAG/G CAG/GUAAGU 93.1 99.9 −6.8 95 NDc– –
2 UCUCUAACUUUCAG/G CAG/GUAAGU 81.0 99.9 −18.9 94 ND – –
3 UCUCUUUUUUUCAG/G CAA/GUAAGU 93.1 88.4 4.7 77 ND – –
4 UCUCUUUUUUUCAG/G CAA/GUGAGU 93.1 83.4 9.7 26 59–72 0.004∗d 0.105 UCUCUAUUUUUCAG/G CAA/GUAAGU 87.4 88.4 −1 49 86–90 0.0001∗ 0.276 UCUCUAAUUUUCAG/G CAA/GUAAGU 82.6 88.4 −5.8 11 25–37 0.05 0.417 UCUCUAACUUUCAG/G CAA/GUAAGU 81.0 88.4 −7.4 7 18–34 0.001∗ 0.168 UCUCUAACUUUCAG/G CAA/GUGAGU 81.0 83.4 −2.4 0 ND – –
aBased on a modification of the method presented by Shapiro and Senapathy (1987) (Zhang et al. 2005).bDefined as the difference between the 3′SS and 5′SS consensus values.cNot done.dAsterisks indicate statistically significant differences (P < 0.05).
Arias et al.
4 RNA, Vol. 21, No. 2
Cold Spring Harbor Laboratory Press on July 16, 2016 - Published by rnajournal.cshlp.orgDownloaded from

DEs: effect of multiple ESEs
The sequence of our DEs allowed us to add an ESE while di-minishing the chance of creating other regulatory sequenceswithin overlapping sequences. It also allowed us to addmultiple copies of an ESE while not adding any sequencesthat were not already present in a single ESE DE. It hasbeen shown that the ESE strength or number inversely cor-relates with splice site strength in mammalian exons, i.e.,ESEs can compensate for weak splice sites (Xiao et al. 2007;Ke et al. 2008). In addition, Hertel and Maniatis (1998)
showed that the use of multiple downstream enhancer ele-ments increased the use of a 3′SS in an additive mannerwhen tested in vitro (Hertel and Maniatis 1998). We askedwhether such additivity also holds true for the definition ofan internal exon in vivo.To assess the effect of multiple enhancers in a single exon,
splicing of DEs with 0, 1, 2, 3, or 6 ESEs was measured usingtransient transfections. For these experiments we used SSSet 7 in Table 1, which was the same set used in our previousstudy of randomly constructed DEs (Zhang et al. 2009). Thedata for no ESEs and 1 ESE at all possible positions were
FIGURE 3. Addition of a single ESE enhances inclusion level and is position independent. (A–F) Enhancement as a function of ESE position in fourdifferent splice site contexts. The cartoons show the consensus values for splice site sets used (Table 1). (A) SS Set 7; (B) SS Set 5; (C) SS Set 6; (D) SSSet 4. Error bars: SEM, n≥ 3 exceptC, where n = 2. In all cases the psi of DEs with an ESE are significantly different from that without ESEs (t-test, P <0.01), except for the rightmost position in C (P = 0.05). None of the 90 pairwise comparisons between ESEs at different positions showed significantdifferences (t-test, P > 0.05). See Supplemental Figure S3 for inclusion levels of DEs in a chromosomal context. (E) ESEs corresponding to SRSF1(black columns) and SRSF7 (gray columns) binding sites in a DE with SS Set 8. (F) An ESE corresponding to an SRSF2 binding site in a DE withSS Set 7.
Exon definition in designer exons
www.rnajournal.org 5
Cold Spring Harbor Laboratory Press on July 16, 2016 - Published by rnajournal.cshlp.orgDownloaded from

shown in Figure 3A. The analogous data for all 36 combi-nations of positions for 2, 3, and 6 ESEs are summarized inFigure 4 and provided in detail in Supplemental Table S1.As was the case for one ESE, there was no strong or consis-tent position effect when 2 or 3 ESEs were present. Psi valuesincreased with the number of ESEs in a near linear mannerup to 3 ESEs (R2 = 0.82) and leveled off when six ESEswere included. Ascribing the last point to saturation, theseresults are consistent with the additive model. The slope inthe linear range was a moderate 20% per ESE added; thiskind of limited enhancement enabled testing the effect ofmultiple ESEs.
DEs: effect of ESS position
To study the effect of the position of an exon silencer se-quence (ESS) we used SS Set 5 (Table 1), which provided apsi of ∼50% with no ESS present. The ESS sequence,CACAUGGU, was chosen so as to not create any other pre-dicted splicing regulatory sequence when placed in the DE;this same ESS was used in our previous study (Zhang et al.2009). A single ESS at positions 2–6 reduced the psi intransient transfections or in chromosomal DEs (Fig. 5; Sup-plemental Fig. S4). The ESS had no effect at the 5′ most po-sition (position 1) and an apparently greater effect at the 3′
most position (position 6). These results suggest a differencebetween positions, a conclusion that is supported by consid-ering the effects of multiple ESSs (see below).
DEs: effect of multiple ESSs
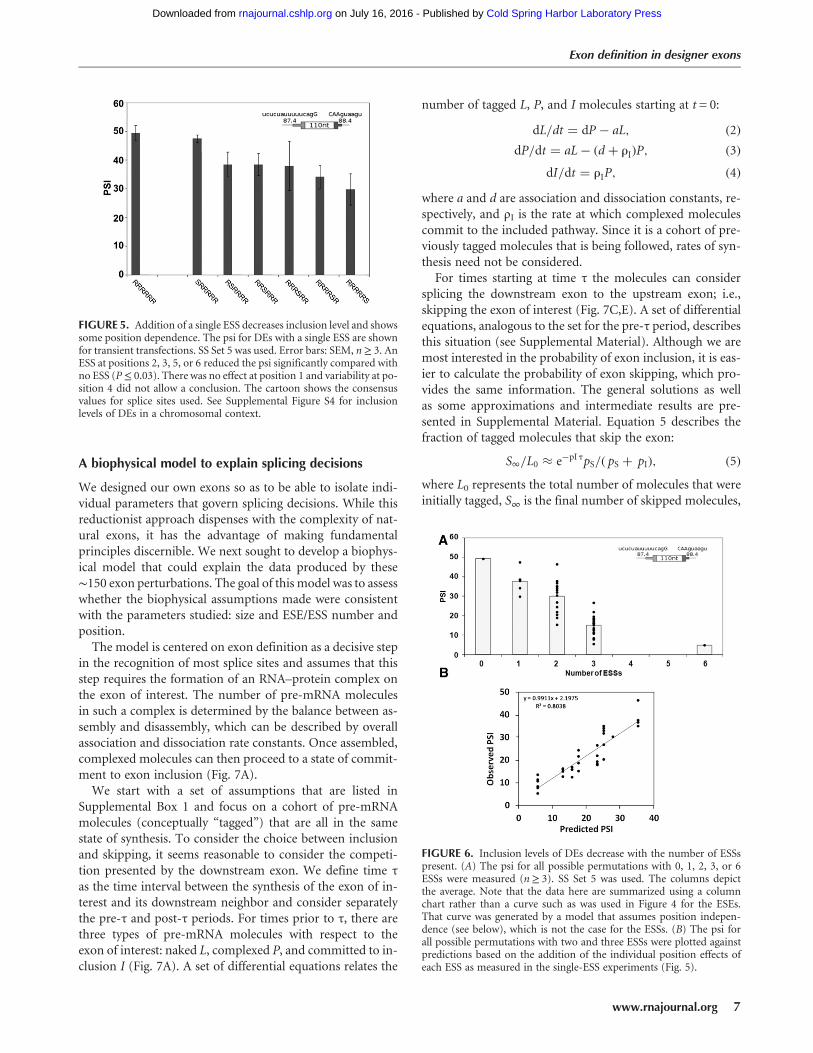
We next measured the effect of multiple ESSs, once againwith the question of additivity in mind. The results of in-cluding 0, 1, 2, 3, or 6 ESSs in all 43 positional combinationsare summarized in Figure 6A; the psi values are shown inSupplemental Table S1. Psi decreased approximately linearlyfrom 50% to 15% as 1–3 ESSs were included in the exon(R2 = 0.68); six ESSs resulted in 10-fold silencing, but showedsigns of saturation (Fig. 6A). These results are consistentwith an additive model in which each ESS contributes∼12% drop in psi.
The simple relationship between ESS number and psi de-scribed above does not take into account possible positioneffects (see Fig. 5). Thus the relationship between psi and
ESS number cannot be represented as simply as it was forthe position-independent ESEs in Figure 4. To investigatethis issue we allowed each ESS to exert a characteristic posi-tion effect, summing the effects of the individually positionedESSs as measured in the single-ESS DE experiment:
Predicted psi = baseline
+∑6
i=1Pi( psi(i) − baseline), (1)
where baseline is the psi of the DE with no ESSs, i is an indexnumber for positions 1–6, Pi is 1 if an ESS is present at posi-tion i and 0 otherwise, and psi(i) is the measured psi for aDE bearing a single ESS at position i. The observed psi mea-surements for all 35 two- and three-ESS DEs show a goodagreement to these linear combination predictions (R2 =0.80) (Fig. 6B). In contrast, when we assumed that all posi-tions were equivalent and used the average value for allthe single-ESS DEs to predict psi then the R2 value droppedto 0.56, supporting the position dependence observed inFigure 5. To explore this idea further, we examined the con-tributions of individual positions to this position effect byaveraging all but one of the positions while retaining theposition-specific contribution of that one. Retaining the po-sition-specific contribution of the first or last positions in-creased the R2 value from 0.56 to 0.68 or 0.72, respectively,while such retention at the internal positions 2–5 producedno increase in R2. Thus it appears that positional informationis important only for the two terminal positions, as was indi-cated by the significance tests of the data in Figure 5. Indeed,retention of the position effect of 1 and 6 alone returned theR2 value to 0.80, the same as the value reached using all po-sitional information. Taking all these data into account, it ap-pears that an ESS at the first position has no effect, an ESS atthe last position is the most effective and ESSs in the middlepositions have intermediate effects that are equivalent and in-dependent of their positions.
FIGURE 4. Inclusion levels of DEs increase with the number of ESEspresent. The psi for all possible DE permutations with 0, 1, 2, 3, or 6ESEs was measured (n≥ 3). SS Set 7 was used. The curve was generatedby a model developed in the last section of the text.
TABLE 2. ESEs tested for position dependence
Sequence SRSF proteinRank of leftseven-mera
Rank of rightseven-mera
AGGAGGAC SRSF1 2 1AGGAGUAG SRSF2 2 9AGACGACU SRSF7 3 21
aRanks among all 16,382 seven-mers obtained from Ray et al.(2013) and the corresponding database.
Arias et al.
6 RNA, Vol. 21, No. 2
Cold Spring Harbor Laboratory Press on July 16, 2016 - Published by rnajournal.cshlp.orgDownloaded from
A biophysical model to explain splicing decisions
We designed our own exons so as to be able to isolate indi-vidual parameters that govern splicing decisions. While thisreductionist approach dispenses with the complexity of nat-ural exons, it has the advantage of making fundamentalprinciples discernible. We next sought to develop a biophys-ical model that could explain the data produced by these∼150 exon perturbations. The goal of this model was to assesswhether the biophysical assumptions made were consistentwith the parameters studied: size and ESE/ESS number andposition.The model is centered on exon definition as a decisive step
in the recognition of most splice sites and assumes that thisstep requires the formation of an RNA–protein complex onthe exon of interest. The number of pre-mRNA moleculesin such a complex is determined by the balance between as-sembly and disassembly, which can be described by overallassociation and dissociation rate constants. Once assembled,complexed molecules can then proceed to a state of commit-ment to exon inclusion (Fig. 7A).We start with a set of assumptions that are listed in
Supplemental Box 1 and focus on a cohort of pre-mRNAmolecules (conceptually “tagged”) that are all in the samestate of synthesis. To consider the choice between inclusionand skipping, it seems reasonable to consider the competi-tion presented by the downstream exon. We define time τas the time interval between the synthesis of the exon of in-terest and its downstream neighbor and consider separatelythe pre-τ and post-τ periods. For times prior to τ, there arethree types of pre-mRNA molecules with respect to theexon of interest: naked L, complexed P, and committed to in-clusion I (Fig. 7A). A set of differential equations relates the
number of tagged L, P, and I molecules starting at t = 0:
dL/dt = dP − aL, (2)dP/dt = aL− (d + rI)P, (3)
dI/dt = rIP, (4)where a and d are association and dissociation constants, re-spectively, and ρI is the rate at which complexed moleculescommit to the included pathway. Since it is a cohort of pre-viously tagged molecules that is being followed, rates of syn-thesis need not be considered.For times starting at time τ the molecules can consider
splicing the downstream exon to the upstream exon; i.e.,skipping the exon of interest (Fig. 7C,E). A set of differentialequations, analogous to the set for the pre-τ period, describesthis situation (see Supplemental Material). Although we aremost interested in the probability of exon inclusion, it is eas-ier to calculate the probability of exon skipping, which pro-vides the same information. The general solutions as wellas some approximations and intermediate results are pre-sented in Supplemental Material. Equation 5 describes thefraction of tagged molecules that skip the exon:
S1/L0 ≈ e−pI tpS/( pS + pI), (5)where L0 represents the total number of molecules that wereinitially tagged, S∞ is the final number of skipped molecules,
FIGURE 6. Inclusion levels of DEs decrease with the number of ESSspresent. (A) The psi for all possible permutations with 0, 1, 2, 3, or 6ESSs were measured (n≥ 3). SS Set 5 was used. The columns depictthe average. Note that the data here are summarized using a columnchart rather than a curve such as was used in Figure 4 for the ESEs.That curve was generated by a model that assumes position indepen-dence (see below), which is not the case for the ESSs. (B) The psi forall possible permutations with two and three ESSs were plotted againstpredictions based on the addition of the individual position effects ofeach ESS as measured in the single-ESS experiments (Fig. 5).
FIGURE 5. Addition of a single ESS decreases inclusion level and showssome position dependence. The psi for DEs with a single ESS are shownfor transient transfections. SS Set 5 was used. Error bars: SEM, n≥ 3. AnESS at positions 2, 3, 5, or 6 reduced the psi significantly compared withno ESS (P≤ 0.03). There was no effect at position 1 and variability at po-sition 4 did not allow a conclusion. The cartoon shows the consensusvalues for splice sites used. See Supplemental Figure S4 for inclusionlevels of DEs in a chromosomal context.
Exon definition in designer exons
www.rnajournal.org 7
Cold Spring Harbor Laboratory Press on July 16, 2016 - Published by rnajournal.cshlp.orgDownloaded from
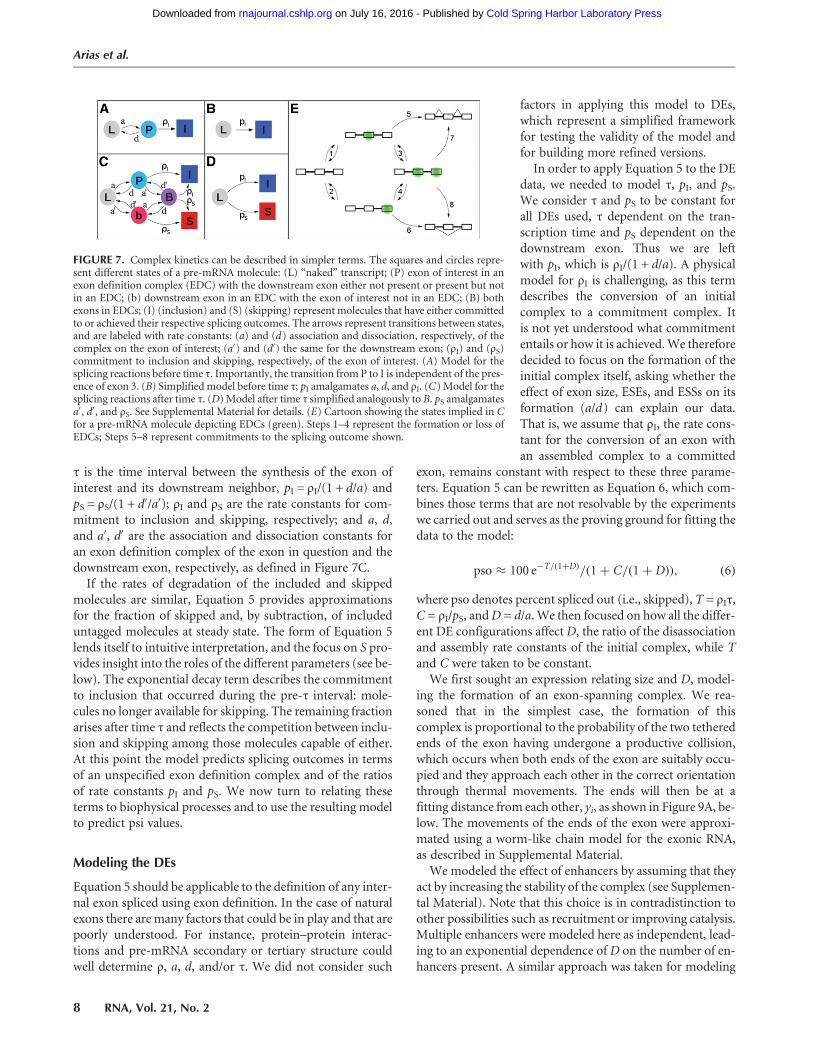
τ is the time interval between the synthesis of the exon ofinterest and its downstream neighbor, pI = ρI/(1 + d/a) andpS = ρS/(1 + d′/a′); ρI and ρS are the rate constants for com-mitment to inclusion and skipping, respectively; and a, d,and a′, d′ are the association and dissociation constants foran exon definition complex of the exon in question and thedownstream exon, respectively, as defined in Figure 7C.
If the rates of degradation of the included and skippedmolecules are similar, Equation 5 provides approximationsfor the fraction of skipped and, by subtraction, of includeduntagged molecules at steady state. The form of Equation 5lends itself to intuitive interpretation, and the focus on S pro-vides insight into the roles of the different parameters (see be-low). The exponential decay term describes the commitmentto inclusion that occurred during the pre-τ interval: mole-cules no longer available for skipping. The remaining fractionarises after time τ and reflects the competition between inclu-sion and skipping among those molecules capable of either.At this point the model predicts splicing outcomes in termsof an unspecified exon definition complex and of the ratiosof rate constants pI and pS. We now turn to relating theseterms to biophysical processes and to use the resulting modelto predict psi values.
Modeling the DEs
Equation 5 should be applicable to the definition of any inter-nal exon spliced using exon definition. In the case of naturalexons there aremany factors that could be in play and that arepoorly understood. For instance, protein–protein interac-tions and pre-mRNA secondary or tertiary structure couldwell determine ρ, a, d, and/or τ. We did not consider such
factors in applying this model to DEs,which represent a simplified frameworkfor testing the validity of the model andfor building more refined versions.In order to apply Equation 5 to the DE
data, we needed to model τ, pI, and pS.We consider τ and pS to be constant forall DEs used, τ dependent on the tran-scription time and pS dependent on thedownstream exon. Thus we are leftwith pI, which is ρI/(1 + d/a). A physicalmodel for ρI is challenging, as this termdescribes the conversion of an initialcomplex to a commitment complex. Itis not yet understood what commitmententails or how it is achieved.We thereforedecided to focus on the formation of theinitial complex itself, asking whether theeffect of exon size, ESEs, and ESSs on itsformation (a/d) can explain our data.That is, we assume that ρI, the rate cons-tant for the conversion of an exon withan assembled complex to a committed
exon, remains constant with respect to these three parame-ters. Equation 5 can be rewritten as Equation 6, which com-bines those terms that are not resolvable by the experimentswe carried out and serves as the proving ground for fitting thedata to the model:
pso ≈ 100 e−T/(1+D)/(1+ C/(1+ D)), (6)
where pso denotes percent spliced out (i.e., skipped), T = ρIτ,C = ρI/pS, andD = d/a. We then focused on how all the differ-ent DE configurations affect D, the ratio of the disassociationand assembly rate constants of the initial complex, while Tand C were taken to be constant.We first sought an expression relating size and D, model-
ing the formation of an exon-spanning complex. We rea-soned that in the simplest case, the formation of thiscomplex is proportional to the probability of the two tetheredends of the exon having undergone a productive collision,which occurs when both ends of the exon are suitably occu-pied and they approach each other in the correct orientationthrough thermal movements. The ends will then be at afitting distance from each other, yi, as shown in Figure 9A, be-low. The movements of the ends of the exon were approxi-mated using a worm-like chain model for the exonic RNA,as described in Supplemental Material.We modeled the effect of enhancers by assuming that they
act by increasing the stability of the complex (see Supplemen-tal Material). Note that this choice is in contradistinction toother possibilities such as recruitment or improving catalysis.Multiple enhancers were modeled here as independent, lead-ing to an exponential dependence of D on the number of en-hancers present. A similar approach was taken for modeling
FIGURE 7. Complex kinetics can be described in simpler terms. The squares and circles repre-sent different states of a pre-mRNA molecule: (L) “naked” transcript; (P) exon of interest in anexon definition complex (EDC) with the downstream exon either not present or present but notin an EDC; (b) downstream exon in an EDC with the exon of interest not in an EDC; (B) bothexons in EDCs; (I) (inclusion) and (S) (skipping) represent molecules that have either committedto or achieved their respective splicing outcomes. The arrows represent transitions between states,and are labeled with rate constants: (a) and (d) association and dissociation, respectively, of thecomplex on the exon of interest; (a′) and (d′) the same for the downstream exon; (ρI) and (ρS)commitment to inclusion and skipping, respectively, of the exon of interest. (A) Model for thesplicing reactions before time τ. Importantly, the transition from P to I is independent of the pres-ence of exon 3. (B) Simplified model before time τ; pI amalgamates a, d, and ρI. (C) Model for thesplicing reactions after time τ. (D) Model after time τ simplified analogously to B. pS amalgamatesa′, d′, and ρS. See Supplemental Material for details. (E) Cartoon showing the states implied in Cfor a pre-mRNA molecule depicting EDCs (green). Steps 1–4 represent the formation or loss ofEDCs; Steps 5–8 represent commitments to the splicing outcome shown.
Arias et al.
8 RNA, Vol. 21, No. 2
Cold Spring Harbor Laboratory Press on July 16, 2016 - Published by rnajournal.cshlp.orgDownloaded from

the ESSs, which are considered to be disruptive to the com-plex and therefore decrease its stability. Since the ESS usedshowed a position-dependent effect, we divided the ESSsinto three categories based on their position: first (position1), intermediate (positions 2–5), and last (position 6). Asin the case of the ESEs, multiple ESSs were modeled as inde-pendent of each other.The effect of the Reference Sequences on stability also had
to be considered, for it is unknown if they should be modeledas enhancers, silencers or something else. Since the effectof replacing Reference Sequences with ESEs was shown tobe position-independent, the effect of individual ReferenceSequences should also be position-independent. Extendingthe analogy with ESEs and ESSs, multiple Reference Sequenc-es in a single exon were modeled as independent.Taking all of this into account and modeling these size and
stability effects as independent of each other gave the follow-ing approximation for D in Equation 6 (see SupplementalMaterial for a detailed description of its derivation):
D = KiY−2i cnEE cnRR cnFSFc
nLSLc
nISIZ
3/2e3Yi2/Z, (7)
where Z is the size of the DE in nucleotides figuring 2 nt/nm(Chen et al. 2012), Yi is yi/√Kuhn length, nE is the number ofESEs in the exon, nR is the total number of Reference Se-quences present, nI is the number of nonterminal ESSs,and nF and nL are 1 if the first or last position, respectively,is occupied by an ESS and 0 otherwise. The c constants rep-resent destabilization coefficients for the ESSs (cSF, cSL, cSI),Reference Sequences (cR) and ESEs (cE). Ki is a constantthat combines all remaining constants generated by each ofthe individual terms; the index i refers to the set of splice sitespresent.To optimize the values for Ki, yi, and the c constants in
Equation 7 we used BFGS, an iterative multivariate nonlinearoptimization algorithm (Press et al. 2007), for minimizing
the sum of the squared differences between predicted andobserved pso values (see Materials and Methods). The BFGSalgorithm is capable of simultaneously dealing with the 13parameters listed in Table 3. The fitting distances y2 and y3were discoverable from the data of the size perturbation ex-periments (Fig. 2). As there were no size perturbation datafor SS Sets 5 and 7, we set y5 and y7 equal to y3, based onthe identity of the 5′SS in these 3 DEs. Evidence that thischoice was appropriate is presented below. The data usedfor optimization are described in Materials and Methodsand shown in Supplemental Table S1. The parameter setthat emerged is shown in Table 3.
Testing the model
That the model accurately predicts the results of these singleparameter perturbation experiments can be seen in the goodfits of the curves to the data in Figure 2 (for size) and Figure 4(for ESEs); these curves were generated according to the pre-dictions of the model and are not a simple heuristic fit.Additional fitting data can be seen in predicted versus ob-served relations for individual parameters (R2 values of0.86–0.99, Supplemental Fig. S5). While a good fit to thesedata is perhaps not surprising given the number of parame-ters that were optimized, it is nevertheless noteworthy thatit was achieved notwithstanding the constraints imposed bythe biophysically derived form of the equations.A more appropriate validation of the model is to test it
against experimental data that were not used in its optimi-zation. An extensive set of such data was available from ourprevious experiments with more complex designer exonsthat combined ESEs and ESSs as well as variable size (Zhanget al. 2009). These 142 DEs used SS Set 7, ranged from 62 to270 nt in length and included sequence compositions such asSES, SSSE, EEESEE, etc. We asked whether our model couldexplain the behavior of these more complex DEs, despite the
TABLE 3. Best fit for parameters in Equations 6 and 7
Parameter Description Value Parameter Description Value
T Reflects the contribution of pre-τ commitment to psoa
5.24 cE ESE destabilization factorc 0.611
C Reflects the contribution ofpost-τ commitment to pso
22.5 × 10⁻⁶ cR Reference Sequence destabilization factorc 1.48
K2 Catch-all constant for SS Set 2b 1.36 × 10⁻⁵ cSF First position ESS destabilization factorc 1.57K3 Catch-all constant for SS Set 3b 1.70 × 10⁻⁴ cSL Last position ESS destabilization factorc 3.04K5 Catch-all constant for SS Set 5b 4.76 × 10⁻⁴ cSI Middle positions ESSs destabilization factorc 2.26K7 Catch-all constant for SS Set 7b 3.36 × 10⁻³ y2 Distance between the outermost points in the exon
that are unconstrained by protein binding for SSSet 2 (in nanometers)
21.6
y3 Distance between the outermost points in the exonthat are unconstrained by protein binding for SSSet 3 (in nanometers)
12.0
apso, proportion spliced out (skipped).bSmaller values signify more effective SS sets.cA value <1 indicates stabilization; a value >1 indicates destabilization.
Exon definition in designer exons
www.rnajournal.org 9
Cold Spring Harbor Laboratory Press on July 16, 2016 - Published by rnajournal.cshlp.orgDownloaded from
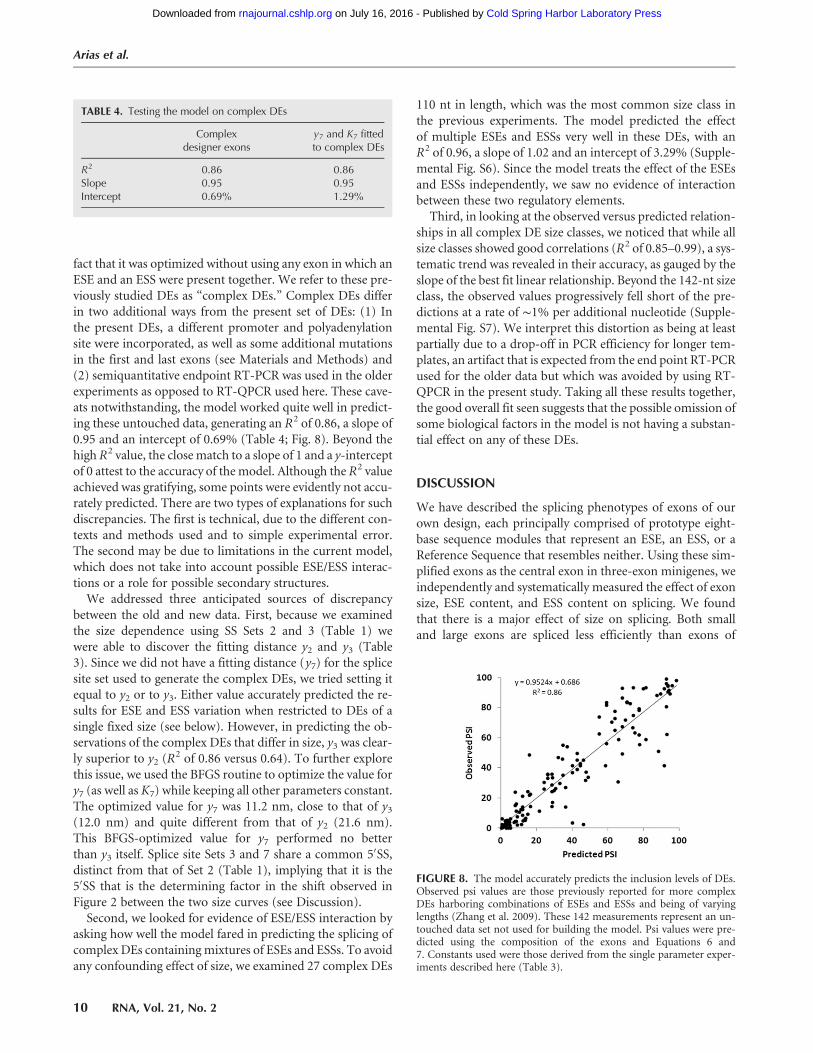
fact that it was optimized without using any exon in which anESE and an ESS were present together. We refer to these pre-viously studied DEs as “complex DEs.” Complex DEs differin two additional ways from the present set of DEs: (1) Inthe present DEs, a different promoter and polyadenylationsite were incorporated, as well as some additional mutationsin the first and last exons (see Materials and Methods) and(2) semiquantitative endpoint RT-PCR was used in the olderexperiments as opposed to RT-QPCR used here. These cave-ats notwithstanding, the model worked quite well in predict-ing these untouched data, generating an R2 of 0.86, a slope of0.95 and an intercept of 0.69% (Table 4; Fig. 8). Beyond thehigh R2 value, the close match to a slope of 1 and a y-interceptof 0 attest to the accuracy of the model. Although the R2 valueachieved was gratifying, some points were evidently not accu-rately predicted. There are two types of explanations for suchdiscrepancies. The first is technical, due to the different con-texts and methods used and to simple experimental error.The second may be due to limitations in the current model,which does not take into account possible ESE/ESS interac-tions or a role for possible secondary structures.
We addressed three anticipated sources of discrepancybetween the old and new data. First, because we examinedthe size dependence using SS Sets 2 and 3 (Table 1) wewere able to discover the fitting distance y2 and y3 (Table3). Since we did not have a fitting distance (y7) for the splicesite set used to generate the complex DEs, we tried setting itequal to y2 or to y3. Either value accurately predicted the re-sults for ESE and ESS variation when restricted to DEs of asingle fixed size (see below). However, in predicting the ob-servations of the complex DEs that differ in size, y3 was clear-ly superior to y2 (R
2 of 0.86 versus 0.64). To further explorethis issue, we used the BFGS routine to optimize the value fory7 (as well as K7) while keeping all other parameters constant.The optimized value for y7 was 11.2 nm, close to that of y3(12.0 nm) and quite different from that of y2 (21.6 nm).This BFGS-optimized value for y7 performed no betterthan y3 itself. Splice site Sets 3 and 7 share a common 5′SS,distinct from that of Set 2 (Table 1), implying that it is the5′SS that is the determining factor in the shift observed inFigure 2 between the two size curves (see Discussion).
Second, we looked for evidence of ESE/ESS interaction byasking how well the model fared in predicting the splicing ofcomplex DEs containing mixtures of ESEs and ESSs. To avoidany confounding effect of size, we examined 27 complex DEs
110 nt in length, which was the most common size class inthe previous experiments. The model predicted the effectof multiple ESEs and ESSs very well in these DEs, with anR2 of 0.96, a slope of 1.02 and an intercept of 3.29% (Supple-mental Fig. S6). Since the model treats the effect of the ESEsand ESSs independently, we saw no evidence of interactionbetween these two regulatory elements.Third, in looking at the observed versus predicted relation-
ships in all complex DE size classes, we noticed that while allsize classes showed good correlations (R2 of 0.85–0.99), a sys-tematic trend was revealed in their accuracy, as gauged by theslope of the best fit linear relationship. Beyond the 142-nt sizeclass, the observed values progressively fell short of the pre-dictions at a rate of ∼1% per additional nucleotide (Supple-mental Fig. S7). We interpret this distortion as being at leastpartially due to a drop-off in PCR efficiency for longer tem-plates, an artifact that is expected from the end point RT-PCRused for the older data but which was avoided by using RT-QPCR in the present study. Taking all these results together,the good overall fit seen suggests that the possible omission ofsome biological factors in the model is not having a substan-tial effect on any of these DEs.
DISCUSSION
We have described the splicing phenotypes of exons of ourown design, each principally comprised of prototype eight-base sequence modules that represent an ESE, an ESS, or aReference Sequence that resembles neither. Using these sim-plified exons as the central exon in three-exon minigenes, weindependently and systematically measured the effect of exonsize, ESE content, and ESS content on splicing. We foundthat there is a major effect of size on splicing. Both smalland large exons are spliced less efficiently than exons of
TABLE 4. Testing the model on complex DEs
Complexdesigner exons
y7 and K7 fittedto complex DEs
R2 0.86 0.86Slope 0.95 0.95Intercept 0.69% 1.29%
FIGURE 8. The model accurately predicts the inclusion levels of DEs.Observed psi values are those previously reported for more complexDEs harboring combinations of ESEs and ESSs and being of varyinglengths (Zhang et al. 2009). These 142 measurements represent an un-touched data set not used for building the model. Psi values were pre-dicted using the composition of the exons and Equations 6 and7. Constants used were those derived from the single parameter exper-iments described here (Table 3).
Arias et al.
10 RNA, Vol. 21, No. 2
Cold Spring Harbor Laboratory Press on July 16, 2016 - Published by rnajournal.cshlp.orgDownloaded from
intermediate size. Lower efficiencies for the splicing of smallexons (Black 1991; Dominski and Kole 1991; Hwang andCohen 1997) and large exons (Peterson et al. 1994; Sterneret al. 1996; Borensztajn et al. 2006) have been observed pre-viously. Surprisingly, when we used different splice site se-quences, we found a striking difference in exon sizedependence. One set showed a better efficiency for long ex-ons while the other was better for short exons; that is, onedependency was shifted relative to the other.Using a DE of a fixed size, the ESE sequence used increased
psi equivalently from positions throughout the exon. Thisposition independence was maintained even when the 3′SSor 5′SS was purposely weakened. Similar behaviors werealso observed when ESEs for SRSF1, SRSF2, and SRSF7were tested, with only minor decreases in efficiency in the po-sitions closest to the splice sites. When multiple ESEs wereused, enhancement of splicing increased proportionately be-fore showing saturation as psi approached 100%. The ESSsequence, on the other hand, displayed some position depen-dence. Its effect was maximal when placed close to the 5′SSbut showed almost no effect near the 3′SS. Intermediate po-sitions showed a uniform intermediate effect. When multipleESSs were present their combined effects increased propor-tionately with signs of saturation as the psi approached 0%.Thus neither the ESEs nor the ESSs used here showed signsof cooperative behavior.Given that these DEs are recognized by exon definition, we
devised a general equation for exon definition that incorpo-rated several intermediate states along a splicing pathway:Equation 5. This equation predicts that lengthening τ, thetime available for commitment exclusively to the includedfate (e.g., by slowing synthesis), should increase psi; this ki-netic effect has been observed previously in exon definitionsystems (Dujardin et al. 2013). Using these equations, we ex-plored the potential of intuitive but novel mechanisms to ex-plain our observations. While these observations have beenobtained using a simplified exon we expect the underlyingmechanisms to be applicable to the definition of naturalexons as well since they are based on straightforward bio-physical assumptions and are indeed supported by previousstudies (see below). Similarly, even though these resultswere obtained targeting only a single type of ESE and ESS,the method used provides a framework for exploring thesesame parameters using additional motifs.Although we originally chose the Reference Sequence on
the basis of its predicted relative neutrality, we found thatits presence is consistent with weak ESS activity (see Table3). A survey of the binding affinities of seven-mers in theCISBP-RNA database (Ray et al. 2013) revealed 10 humanproteins (of 91 in the database) that bind to seven-mers with-in CCAAACAACCAAACAA, a tandem pair of Reference Se-quences. Of these five are associated with splicing: hnRNP K,hnRNP LL, hnRNP R, SRSF3, and SART3. HnRNP LL isknown to cause skipping of CD45 exon 4 by binding to anexonic element (Topp et al. 2008) and so is consistent with
it having ESS activity. Sequences that are completely neutralmay indeed be rare.
The effect of size
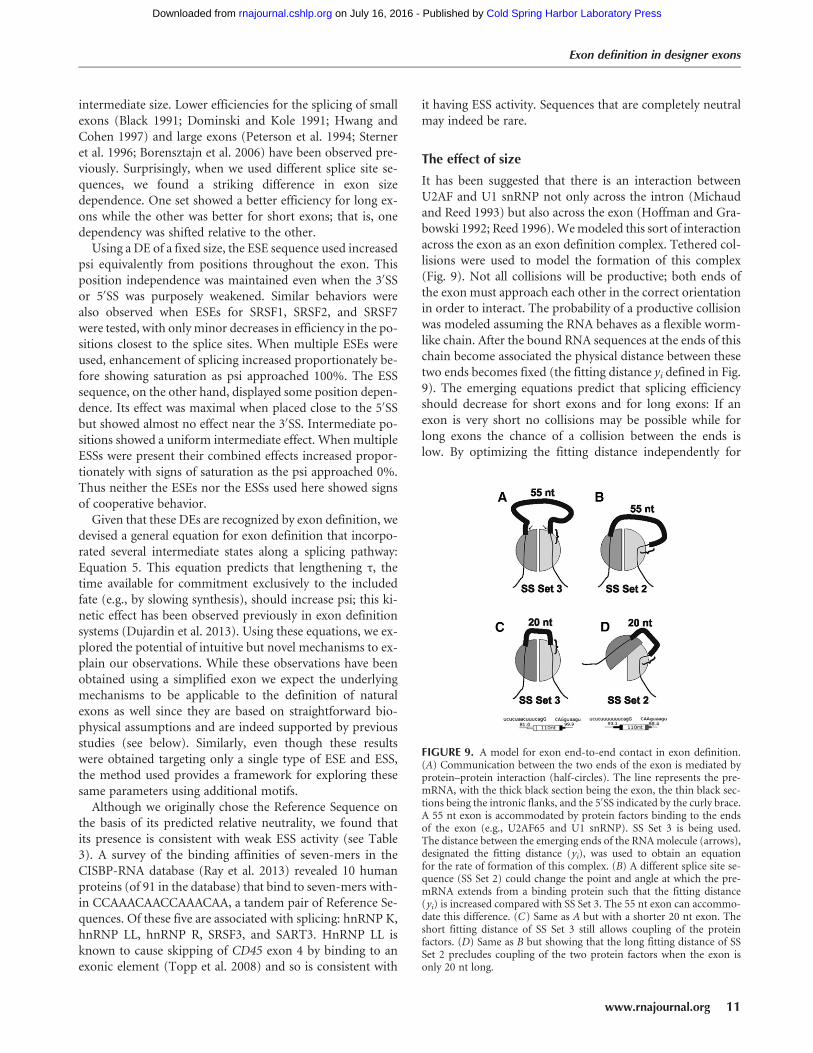
It has been suggested that there is an interaction betweenU2AF and U1 snRNP not only across the intron (Michaudand Reed 1993) but also across the exon (Hoffman and Gra-bowski 1992; Reed 1996).Wemodeled this sort of interactionacross the exon as an exon definition complex. Tethered col-lisions were used to model the formation of this complex(Fig. 9). Not all collisions will be productive; both ends ofthe exon must approach each other in the correct orientationin order to interact. The probability of a productive collisionwas modeled assuming the RNA behaves as a flexible worm-like chain. After the bound RNA sequences at the ends of thischain become associated the physical distance between thesetwo ends becomes fixed (the fitting distance yi defined in Fig.9). The emerging equations predict that splicing efficiencyshould decrease for short exons and for long exons: If anexon is very short no collisions may be possible while forlong exons the chance of a collision between the ends islow. By optimizing the fitting distance independently for
FIGURE 9. A model for exon end-to-end contact in exon definition.(A) Communication between the two ends of the exon is mediated byprotein–protein interaction (half-circles). The line represents the pre-mRNA, with the thick black section being the exon, the thin black sec-tions being the intronic flanks, and the 5′SS indicated by the curly brace.A 55 nt exon is accommodated by protein factors binding to the endsof the exon (e.g., U2AF65 and U1 snRNP). SS Set 3 is being used.The distance between the emerging ends of the RNAmolecule (arrows),designated the fitting distance (yi), was used to obtain an equationfor the rate of formation of this complex. (B) A different splice site se-quence (SS Set 2) could change the point and angle at which the pre-mRNA extends from a binding protein such that the fitting distance(yi) is increased compared with SS Set 3. The 55 nt exon can accommo-date this difference. (C) Same as A but with a shorter 20 nt exon. Theshort fitting distance of SS Set 3 still allows coupling of the proteinfactors. (D) Same as B but showing that the long fitting distance of SSSet 2 precludes coupling of the two protein factors when the exon isonly 20 nt long.
Exon definition in designer exons
www.rnajournal.org 11
Cold Spring Harbor Laboratory Press on July 16, 2016 - Published by rnajournal.cshlp.orgDownloaded from
each set of SSs used, we found that a difference in this param-eter could predict the shift seen in Figure 2. The values for y2and y3, 12 and 22 nm, respectively, are in the size range of theRNP complexes posited (Kastner and Luhrmann 1989;Pomeranz Krummel et al. 2009; Weber et al. 2010). Impor-tantly, the 5′SS is the determinant factor, since yi changedsubstantially only when the 5′SS changed. Three possibilitiescome to mind to explain this 5′SS sequence dependence: (1)a large conformational change in one or more of the proteinsbound to these sequences. Although a difference of 9.6 nm(Table 3) seems large, protuberances of this size have beenseen in U1 snRNP (Kastner and Luhrmann 1989; PomeranzKrummel et al. 2009; Weber et al. 2010); (2) a small confor-mational change that enables one or more proteins to recruitan additional “bulging” factor; (3) a sequence-dependentchange in the point or angle at which the pre-mRNA extendsfrom U1 snRNP. These options can explain the changes forboth short exons and long exons (as seen in the model-gen-erated curves in Fig. 2). An illustration of option 3 in thecase of short exons is shown in Figure 9. In the hypotheticalsituation shown, an exon of 55 nt can be recognized with ei-ther SS Set 2 or 3 (Fig. 9A,B). However, an exon of 20 ntcan be recognized with SS Set 2 (Fig. 9C) but not with SSSet 3 (Fig. 9D), as a shift in the angle and point of exitwhen SS Set 3 is used causes this exon to be too short to allowinteraction between protein complexes bound to each end.(Fig. 9D). Indeed, such a difference can be seen in two crystalstructures of U1 snRNP bound to two different mRNAligands (Pomeranz Krummel et al. [PDB ID 3CW1] 2009;Weber et al. [PDB ID 3PGW] 2010). Irrespective of anymodel, the 5′SS-dependent shift in size dependence seen inFigure 1 implies that the characterization of 5′SS strength ismore complex than the degree of similarity to a consensussequence.
Compared with these simplified exons, natural exons maybe influenced by other factors. For instance, the collision ratebetween the exon ends could be increased (or decreased)by additional protein–protein interactions or by the forma-tion of secondary structures. In this respect, DEs can providea framework for investigating such individual influences.Finally, the mechanism proposed here for across-the-exonpairing of splice sites for exon definition could apply toacross-the-intron pairing of splice sites for intron definitionas well (see Supplemental Material).
The position independence of ESEs
The 8 nt ESE studied here acted with similar efficiency fromany position within a 110 nt DE, whether it was enhancing aweakened 3′SS or a weakened 5′SS. That is, we saw no posi-tion effect within the exon. Incorporating this result by mod-eling ESE action without position dependence, we were ableto predict the effect of single or multiple ESEs in the un-touched data from complex DEs with good accuracy (Fig.8). This result stands in contrast to the prevailing view that
ESEs act by recruitment of the splicing machinery to a “near-by” splice site, i.e., position is a key general factor in splicesite recognition. How can we reconcile our observationswith this prevailing view? Support for position dependencecomes from several types of experiments. There is evidenceof interactions between activator proteins that bind ESEsand some of the proteins involved in the early steps of splic-ing (Kohtz et al. 1994; Staknis and Reed 1994). However, thisresult in and of itself does not show that a close distance isnecessary for such an ultimate interaction. More to the pointare the results of Graveley et al. (1998) who studied activa-tion of a doublesex 3′SS by five different splicing activatorsplaced at different downstream positions. The activatorsbecame progressively less effective when placed at the endsof progressively longer exons. While these results were clear,consistent and striking, they need not apply generally. Thereare notable differences between the conditions of those ex-periments and the experiments reported here. The Graveleyet al. experiments studied longer distances than we did, usingincrements of 60–100 nt to a maximum of 300 nt comparedwith the five finer increments of 16 nt to a maximum of 110used here. Thus it could be that if we had studied much lon-ger distances we would have seen a position effect. However,the 110 nt exon we studied was close to the 122 ntmedian sizeof human internal exons (Lander et al. 2001). Importantly,the pre-mRNAs they used were comprised of only two exons,the second being a truncated version of an alternative ter-minal exon lacking a poly(A) signal. Thus those results mayapply more to terminal exon definition than to internalexon definition. Additionally, since their terminal exons var-ied in size, the effects on splicing might have been due to sizeper se rather than to position relative to the 3′SS. In the DEexperiment exon size was kept constant despite a change inESE position. Another important difference lies in intronsize: The intron between their two exons was only 114 ntlong, making it a likely substrate for intron definition, where-as we focused on exon definition. Finally, the Gravely et al.experiments were done in vitro while we used transfection.Support for a position effect for ESEs also comes from
the bioinformatic analysis of Fairbrother et al. (2004), whoshowed that RESCUE-ESE sequences are ∼10% more fre-quent in the exonic 20 nt closest to the ends of exons(20 nt) compared with the next exonic 50 nt and that synon-ymous SNPs are ∼25% less frequent in these 20 nt edge re-gions. Even if these frequencies are entirely ascribable tosplicing efficiency, these same data can also be interpretedas suggesting that in the majority of cases (i.e., 90% and75%, respectively) RESCUE-ESEs and SNPs do not show aposition effect. Moreover, there are other large sets of compu-tationally or experimentally defined exonic splicing motifsthat do not exhibit a preferential location at exon edges(Zhang et al. 2009; Ke et al. 2011). Finally, these authorssearched for motifs that were enriched toward the ends ofexons which might target a specific subset of ESEs. Alterna-tively, this positional bias might not represent a functional
Arias et al.
12 RNA, Vol. 21, No. 2
Cold Spring Harbor Laboratory Press on July 16, 2016 - Published by rnajournal.cshlp.orgDownloaded from

requirement for enhancement. The position of the ESE maybe relative to other exonic features. Take, for example, thecompetition between the real 5′SS and some cryptic 5′SS lo-cated upstream in the exon. If an ESE functions within theexon in a position-independent fashion, placing this ESE be-tween the two candidate SSs would be the only option thatwould be selective for the downstream 5′SS (assuming anESEmust function fromwithin an exon). This scenario intro-duces an incidental positional bias that would favor positionscloser to the real 5′SS without placing a positional require-ment on the “function” of the ESE. Our direct observations,on the other hand, are not subject to such complexity.A third type of experiment suggesting a position effect
comes from the experiment of Goren et al. (2006), whoplaced motifs evolutionarily defined as exonic splicing reg-ulators (ESRs) at different positions within a test exon. De-pending on the position, these ESRs sometimes behaved asESEs and sometimes as ESSs. However, most of this variabil-ity could be explained by the creation of new overlappingmotifs that spanned the joint between the motif in questionand its contextual flanks (Zhang et al. 2009; Ke et al. 2011)rather than to a position per se within the exon.In the end, there may be no need to reconcile results such
as those described above with our results: Some ESEs may besensitive to position while others are not; that is, not all ESEsneed to act via the same mechanism. Indeed, there are otherexamples of a lack of a position effect by splicing regulatoryelements or proteins in this distance range. Lavigueur et al.(1993) saw equivalent splicing enhancements by an SRSF1-based enhancer at distances of 99, 187, and 293 nt, which fi-nally succumbed at distances of 370 and 380 nt. And there areseveral reports of ESEs acting bidirectionally (Bourgeois et al.1999; Selvakumar and Helfman 1999; Caputi et al. 2004).Also, proteins that bind to ESE need not be restricted to localinteractions: SRSF1 can contact a branch point sequenceacross a distance of at least 50 nt (Shen et al. 2004).The Graveley and Fairbrother papers are widely cited to
support an intuitive picture in which a protein bound to anESE situated close to a splice site recruits spliceosomal com-ponents to that splice site, a picture we expected to be con-firmed by our experiments. Once we obtained the oppositeresults, we realized that much of the support for this idealies in its reasonableness rather than in sufficiently discrimi-nating data. In the designer exon experiments reported here,the local context for each ESE has been kept fixed, the se-quences between the ESE and the splice sites have beenkept few and uniform, and exon definition is taking place.In this controlled environment, we have been able to focuson the parameter of distance between an ESE and a splicesite. We find no effect of distances in the range of typical ofexon lengths, either for our primary ESE or three otherESEs.We conclude that distances in this range present no im-pediment to many, and possibly most, ESEs. It is importantto note that none of our experiments addresses the questionof intronic versus exonic positions.
Stabilization versus recruitment
ESE-induced increases in the yield of splicing complexes(Hoffman and Grabowski 1992) can be explained by stabili-zation or by recruitment. Changes in stability, expressed asthe rate of dissociation (d in Fig. 7), respond exponentiallyto the number of ESEs. This stability model predicts a sigmoi-dal curve but with a near linear relationship between psi andthe number of ESEs over much of the range examined andaccounts for the saturation effect when >4 ESEs are used(Fig. 4). Interestingly, the sigmoidal behavior is explainedwithout invoking cooperativity, being simply the result ofthe addition of the independent ESE contributions in thedenominator of an exponent (Equations 6 and 7). The re-cruitment model leads to a negative exponential term and anonsigmoidal curve that did not fit the data as well (seeSupplemental Fig. S8; the sum of the squared differences ofthe points to the curve was 0.005 for the stability modelbut 0.026 for the recruitment model). Moreover, unlike thestability model the recruitment model performed poorlyfor the complex DEs (R2 of 0.37 compared with 0.86). It isinteresting to note that the model used here can accountfor the dependence of in vitro splicing efficiency on the num-ber of doublesex enhancers (compare Supplemental Fig. S9to Fig. 2D in Hertel and Maniatis 1998). This agreementwith long-established data supports the idea that results usinga prototype ESE of our own design reflect general mecha-nisms involved in splicing and may not be limited to internalexons. Recruitment and stabilization are not at all mutuallyexclusive; one can imagine recruitment of a factor followedby stabilization of the binding of that factor and/or the sub-sequent stabilization of a full exon definition complex.
Mechanistic interpretations
The model described here worked well to predict the splicingbehavior of 140 designer exons that were not used in its der-ivation. A central feature of this model is an early irreversiblestep in exon recognition (exon commitment). It is widelybelieved that the regulation of splicing takes place at an earlystage in splicing (Smith and Valcárcel 2000; Black 2003).In particular, Lim and Hertel (2004) demonstrated the pair-ing of splice sites across an intron is associated with an earlyirreversible step occurring after complex E and before or co-incident with ATP-dependent complex A formation. Thisstep could represent what we call here exon commitment.Commitment steps are common characteristics of biologi-cal processes, as exemplified for instance by cell deter-mination during development and promoter clearance intranscription (Darzacq et al. 2007; Wada et al. 2009). Mech-anistically, the exon commitment step proposed here couldbe the capture of an exon by a scaffold, such as the CTD ofRNA polymerase II.Undoubtedly there are elements that influence splicing in
addition to those studied here: exon size, ESE content, and
Exon definition in designer exons
www.rnajournal.org 13
Cold Spring Harbor Laboratory Press on July 16, 2016 - Published by rnajournal.cshlp.orgDownloaded from

ESS content. We attempted to keep the influence of theseother parameters unchanged, collecting their effects in acatch-all constant. This disregard notwithstanding, it is note-worthy that the predictions had such a high degree of accu-racy. Further experiments could target other factors usingthe same theoretical framework. Possible routes for ex-tending this model are to incorporate different and addition-al ESEs and ESSs, to use as an endpoint the formation ofan exon definition complex itself (Robberson et al. 1990;Schneider et al. 2010) rather than splicing, and to examinelater steps in splicing.
The values of the optimized equation coefficients used inthe model (Table 3) show expected characteristics as well assome surprises. The coefficients for dissociation for ESEs(cE) and ESSs (cSF, cSL, and cSI) were less and greater than uni-ty, respectively, as expected. We expected the coefficient forthe Reference Sequence (cR) to be close to unity if it was neu-tral, but obtained a value of 1.5. This value represents a sig-nificant contribution that cannot be ignored; that is, anarbitrary assignment of “neutrality” (1.0) to the ReferenceSequence seriously weakens the model’s predictive power(data not shown). Thus this Reference Sequence has a nega-tive effect on the formation of the exon definition complex.The values obtained for cE, cR, cSF, cSI, and cSL correspondto small incremental changes in threshold energies, explain-ing whymultiple elements are required to effect large changesin psi.
Ki is a catch-all constant in Equation 7 that notably in-cludes the effect of SS “strength.” SS Set 3 differs from Set5 by only a single base in the 3′SS (see Table 1) and resultsin a 2.8-fold increase in Ki. Set 5 differs from Set 7 by twobases in the 3′SS and results in a 7.1-fold increase in Ki.Differences in the 5′SS were found to be substantially greater.Set 2 differs from Set 7 by only a single base in the 5′SS yetresults in a ∼250-fold increase in Ki. The greater effect ofthe 5′SS suggests a more critical role of its sequence, as hasbeen suggested before (Xiao et al. 2007).
Finally, T and C in Equation 6 provide an indication of thecontributions of the pre-τ and the post-τ phases. The valuefor T represents the commitment to inclusion that takes placeeven before the third exon is synthesized while the value forCmodels the period after the third exon becomes available. Asshown in Table 3, C is several orders of magnitude smallerthan T, implying that by the time competition becomes pos-sible, essentially no additional molecules commit to inclusion(i.e., all remaining molecules will skip exon 2). Indeed, set-ting C = 0 does not change the performance of the model(data not shown). This surprising result could be due to anunexplained relative weakness of these DEs compared withthe downstream exon; or, more intriguingly, to a mechanismthat was not considered when conceiving the model: thatthere is a restricted window of commitment time that isshorter than τ. Consequently, molecules that have not com-mitted to inclusion within this window of time can no longerdo so; paradoxically, they are, by default, “committed” to
skipping even before the downstream exon is synthesized.The transcription time to the synthesis of the downstreamexon here is only a matter of seconds, a time much shorterthan the several minutes required for the splicing reactionitself (Kessler et al. 1993; Singh and Padgett 2009; Wadaet al. 2009). Thus most of the time spent before the splicedproduct is formed is spent after the commitment step hasbeen taken. A short commitment time might be dictated bythe time an uncommitted exon with an exon definition com-plex can be captured by a putative hub bearing a committedupstream exon. If the hub is associated with the CTD of theRNA polymerase II, this time might be related to the time atwhich transcription of the downstream intron places theexon too far away to ensure a collision of the exon definitioncomplex and the CTD. Four regimens can then be defined:the time involved in exon definition complex formation,which should be in the order of submilliseconds (Hyeonand Thirumalai 2012); the time required for commitment,seconds (as suggested in this paper); the time required to gen-erate the spliced product, a few minutes (Kessler et al. 1993;Singh and Padgett 2009; Wada et al. 2009); and the time re-quired to generate the final mRNA molecule, up to severalhours.
MATERIALS AND METHODS
DE minigene construction
Detailed descriptions can be found in Supplemental Material. Inoutline, DEs were constructed by the sequential ligation of 32-mers comprised of two 16-mer units: RR, RE, ER, EE, RS, SR,and SS. These units were assembled in a “drafting” plasmid, usingtype IIS restriction sites flanking a central CCAAACA sequence,which is most of the R sequence. The finished DEs were clonedinto a series of “receiving” plasmids that differed principally in theirSS sequences. Each receiving plasmid contained a modified dhfrminigene controlled by a tet-responsive promoter and a SV40poly(A) site; a start codon (a Kozak sequence), was placed in exon3. Each receiving plasmid had a specific SS set and, in place of aDE, a specifically designed removable sequence/adapter: RA. UsingBveI (Fermentas), this RA was removed, generating appropriateoverhangs for seamless incorporation of the DEs constructed inthe drafting plasmid.
The plasmid used in the generation of the cell line used forchromosomal incorporations, pMA-FW, contains a kanamycin re-sistance gene for initial selection, a promoterless puromycin resis-tance gene for subsequent selection of site-specific recombinationswith DE-containing plasmids, a ϕC31 attP site and only the down-stream portion of the modified dhfr minigene (including the lastexon only). A single copy transfectant of HEK293 cells carrying asingle integrated copy of this plasmid with the attP sequence asa site-specific target was then isolated. pMA-IC contains an attBsite for site-specific recombination, a CMV promoter to drive thepuromycin resistance gene after site-specific recombination, andthe upstream half of the modified dhfr minigene for reconstitutionof the full minigene (Supplemental Fig. S10; see SupplementalMaterial). Versions of this plasmid constructed with different DEs
Arias et al.
14 RNA, Vol. 21, No. 2
Cold Spring Harbor Laboratory Press on July 16, 2016 - Published by rnajournal.cshlp.orgDownloaded from
as exon 2 allowed the isolation of transfectant HEK293 populationscarrying minigenes with different DEs.QPCR measurements were calibrated using plasmids containing
both an exon-included and an exon-skipped sequence. These cou-pled-standard plasmids were generated by incorporating cDNAfor DE-skipped mRNA and either γ actinmRNA or mRNA that in-cluded a DE in the same plasmid. Purified plasmid was digested withEcoO109I (NEB) to generate a solution with equimolar amountsof each type of molecule. This solution provided a standard for rel-ative quantification through QPCR. Included-skipped equimolarcoupled-standards were used to calibrate the psi measurements,while actin coupled-standards allow a measurement of relative ex-pression levels. (Supplemental Fig. S11; see Supplemental Materialfor details). End point PCRs were carried out in many cases; quan-tification of representative ethidium-stained agarose gels usingImage J can be seen in Supplemental Fig. S12. These results wereas expected from the RT-QPCR measurements.
Psi measurement
RNA was extracted from transfected cells and reverse transcribed.Serial dilutions of the equimolar coupled-standard were used forQPCR quantification and the ratio of DE-skipped to DE-includedwas obtained (S/I, or SOI). This ratio was used to obtain psi bythe formula psi = 100/(1 + SOI). A similar protocol was followedfor stable transfections including γ actin quantification (see Supple-mental Material).
Transfection
Transient transfections were performed in modified HEK293 cellscarrying a tTA gene (cMA-HEK293-tTA). RNA was extractedafter 25 h. Stable transfections were performed in cMA-FW cellsusing a DE-containing pMA-IC plasmid and the plasmid codingfor the site-specific recombinase pPGKPhiC31obpA (Addgene).After puromycin selection, the resulting site-specific recombinantswere pooled and grown for RNA extraction (see SupplementalMaterial).
Cell lines
HEK293 cells were stably transfected with a plasmid coding for thetet-Off trans-activator (Gossen and Bujard 1992). A clone, cMA-HEK293-tTA, was chosen and used for all transient transfections.cMA-HEK293-tTA cells were electroporated using linearizedpMA-FW plasmid. Clone cMA-FW was selected as one that had in-corporated a single genomic copy of pMA-FW, had a high level ofexpression and showed an adequate level of site-specific recombina-tion. This clone was used for all site-specific recombinations (seeSupplemental Material).
Parameter optimization
The BFGS algorithm was adapted from Press et al. (2007), imple-menting walls to force all parameters to be nonnegative and usingexplicit gradient. A script was written in Perl for minimizing thesum of the squared differences between observed and predictedpso (Equations 6 and 7; see Supplemental Material).
CISBP survey
To associate an RNA binding protein to heptamers within theReference Sequence we downloaded the binding intensity z-scoresfrom the CISBP Website (Ray et al. 2013) and used a cutoff of 4.6as a minimum z-score.
SUPPLEMENTAL MATERIAL
Supplemental material is available for this article.
ACKNOWLEDGMENTS
We thank Vincent Anquetil, Jonathan Cacciatore, and ShengdongKe for valuable discussions and Dennis Weiss for the same plus athoughtful critique of the manuscript. We are grateful to KyleJurado for his review of the model derivation. This work was sup-ported by a grant from the National Institutes of Health (NIH)(GM072740) to L.A.C.
Received September 6, 2014; accepted October 29, 2014.
REFERENCES
Berget SM. 1995. Exon recognition in vertebrate splicing. J Biol Chem270: 2411–2414.
Black DL. 1991. Does steric interference between splice sites block thesplicing of a short c-src neuron-specific exon in non-neuronal cells?Genes Dev 5: 389–402.
Black DL. 1995. Finding splice sites within a wilderness of RNA. RNA 1:763–771.
Black DL. 2003. Mechanisms of alternative pre-messenger RNA splic-ing. Annu Rev Biochem 72: 291–336.
Blencowe BJ. 2000. Exonic splicing enhancers: mechanism of action,diversity and role in human genetic diseases. Trends Biochem Sci25: 106–110.
Borensztajn K, Sobrier ML, Duquesnoy P, Fischer AM, Tapon-Bretaudiere J, Amselem S. 2006. Oriented scanning is the leadingmechanism underlying 5′ splice site selection in mammals. PLoSGenet 2: e138.
Bourgeois CF, Popielarz M, Hildwein G, Stevenin J. 1999. Identificationof a bidirectional splicing enhancer: differential involvement of SRproteins in 5′ or 3′ splice site activation.Mol Cell Biol 19: 7347–7356.
Caputi M, Freund M, Kammler S, Asang C, Schaal H. 2004. A bidirec-tional SF2/ASF- and SRp40-dependent splicing enhancer regulateshuman immunodeficiency virus type 1 rev, env, vpu, and nef geneexpression. J Virol 78: 6517–6526.
Carothers AM, Urlaub G, Grunberger D, Chasin LA. 1993. Splicingmutants and their second-site suppressors at the dihydrofolate re-ductase locus in Chinese hamster ovary cells. Mol Cell Biol 13:5085–5098.
Chasin LA. 2007. Searching for splicing motifs. Adv Exp Med Biol 623:85–106.
Chen IT, Chasin LA. 1993. Direct selection for mutations affecting spe-cific splice sites in a hamster dihydrofolate reductase minigene. MolCell Biol 13: 289–300.
Chen IT, Chasin LA. 1994. Large exon size does not limit splicing invivo. Mol Cell Biol 14: 2140–2146.
Chen H, Meisburger SP, Pabit SA, Sutton JL, Webb WW, Pollack L.2012. Ionic strength-dependent persistence lengths of single-strand-ed RNA and DNA. Proc Natl Acad Sci 109: 799–804.
Darzacq X, Shav-Tal Y, de Turris V, Brody Y, Shenoy SM, Phair RD,Singer RH. 2007. In vivo dynamics of RNA polymerase II transcrip-tion. Nat Struct Mol Biol 14: 796–806.
Exon definition in designer exons
www.rnajournal.org 15
Cold Spring Harbor Laboratory Press on July 16, 2016 - Published by rnajournal.cshlp.orgDownloaded from
De Conti L, Baralle M, Buratti E. 2013. Exon and intron definition inpre-mRNA splicing. Wiley Interdiscip Rev RNA 4: 49–60.
Dignam JD, Lebovitz RM, Roeder RG. 1983. Accurate transcription ini-tiation by RNA polymerase II in a soluble extract from isolatedmammalian nuclei. Nucleic Acids Res 11: 1475–1489.
Dominski Z, Kole R. 1991. Selection of splice sites in pre-mRNAs withshort internal exons. Mol Cell Biol 11: 6075–6083.
Dujardin G, Lafaille C, Petrillo E, Buggiano V, Gómez Acuña LI,Fiszbein A, Godoy Herz MA, Nieto Moreno N, Muñoz MJ,Alló M, et al. 2013. Transcriptional elongation and alternative splic-ing. Biochim Biophys Acta 1829: 134–140.
Fairbrother WG, Holste D, Burge CB, Sharp PA. 2004. Single nucleotidepolymorphism–based validation of exonic splicing enhancers. PLoSBiol 2: E268.
Fox-Walsh KL, Dou Y, Lam BJ, Hung SP, Baldi PF, Hertel KJ. 2005. Thearchitecture of pre-mRNAs affects mechanisms of splice-site pair-ing. Proc Natl Acad Sci 102: 16176–16181.
Goren A, RamO, Amit M, Keren H, Lev-Maor G, Vig I, Pupko T, Ast G.2006. Comparative analysis identifies exonic splicing regulatory se-quences—the complex definition of enhancers and silencers. MolCell 22: 769–781.
Gossen M, Bujard H. 1992. Tight control of gene expression in mam-malian cells by tetracycline-responsive promoters. Proc Natl AcadSci 89: 5547–5551.
Graveley BR, Hertel KJ, Maniatis T. 1998. A systematic analysis of thefactors that determine the strength of pre-mRNA splicing enhancers.EMBO J 17: 6747–6756.
Hertel KJ, Maniatis T. 1998. The function of multisite splicing enhanc-ers. Mol Cell 1: 449–455.
Hicks MJ, Lam BJ, Hertel KJ. 2005. Analyzing mechanisms of alterna-tive pre-mRNA splicing using in vitro splicing assays. Methods 37:306–313.
Hoffman BE, Grabowski PJ. 1992. U1 snRNP targets an essential splic-ing factor, U2AF65, to the 3′ splice site by a network of interactionsspanning the exon. Genes Dev 6: 2554–2568.
Hwang DY, Cohen JB. 1997. U1 small nuclear RNA-promoted exonselection requires a minimal distance between the position of U1binding and the 3′ splice site across the exon. Mol Cell Biol 17:7099–7107.
Hyeon C, Thirumalai D. 2012. Chain length determines the folding ratesof RNA. Biophys J 102: L11–L13.
Kastner B, Luhrmann R. 1989. Electron microscopy of U1 small nuclearribonucleoprotein particles: shape of the particle and position of the5′ RNA terminus. EMBO J 8: 277–286.
Ke S, Zhang XH, Chasin LA. 2008. Positive selection acting onsplicing motifs reflects compensatory evolution. Genome Res 18:533–543.
Ke S, Shang S, Kalachikov SM, Morozova I, Yu L, Russo JJ, Ju J,Chasin LA. 2011. Quantitative evaluation of all hexamers as exonicsplicing elements. Genome Res 21: 1360–1374.
Kessler O, Jiang Y, Chasin LA. 1993. Order of intron removal dur-ing splicing of endogenous adenine phosphoribosyltransferaseand dihydrofolate reductase pre-mRNA. Mol Cell Biol 13: 6211–6222.
Kohtz JD, Jamison SF, Will CL, Zuo P, Lührmann R, Garcia-Blanco MA, Manley JL. 1994. Protein—protein interactions and5′-splice-site recognition in mammalian mRNA precursors. Nature368: 119–124.
Krainer AR,Maniatis T, Ruskin B, GreenMR. 1984. Normal andmutanthuman β-globin pre-mRNAs are faithfully and efficiently spliced invitro. Cell 36: 993–1005.
Lander ES, Linton LM, Birren B, Nusbaum C, Zody MC, Baldwin J,Devon K, Dewar K, Doyle M, FitzHugh W, et al. 2001. Initialsequencing and analysis of the human genome. Nature 409:860–921.
Lavigueur A, La Branche H, Kornblihtt AR, Chabot B. 1993. A splicingenhancer in the human fibronectin alternate ED1 exon interactswith SR proteins and stimulates U2 snRNP binding. Genes Dev 7:2405–2417.
Lazarev D, Manley JL. 2007. Concurrent splicing and transcrip-tion are not sufficient to enhance splicing efficiency. RNA 13:1546–1557.
Li Q, Lee JA, Black DL. 2007. Neuronal regulation of alternative pre-mRNA splicing. Nat Rev Neurosci 8: 819–831.
Lim SR, Hertel KJ. 2004. Commitment to splice site pairing coincideswith A complex formation. Mol Cell 15: 477–483.
Luco RF, Pan Q, Tominaga K, Blencowe BJ, Pereira-Smith OM,Misteli T. 2010. Regulation of alternative splicing by histone modi-fications. Science 327: 996–1000.
Luco RF, Allo M, Schor IE, Kornblihtt AR, Misteli T. 2011. Epigeneticsin alternative pre-mRNA splicing. Cell 144: 16–26.
Martinez NM, Lynch KW. 2013. Control of alternative splicing in im-mune responses: many regulators, many predictions, much still tolearn. Immunol Rev 253: 216–236.
Michaud S, Reed R. 1993. A functional association between the 5′ and 3′splice site is established in the earliest prespliceosome complex (E) inmammals. Genes Dev 7: 1008–1020.
Mount SM. 1982. A catalogue of splice junction sequences.Nucleic AcidsRes 10: 459–472.
Peterson ML, Bryman MB, Peiter M, Cowan C. 1994. Exon size affectscompetition between splicing and cleavage-polyadenylation in theimmunoglobulin μ gene. Mol Cell Biol 14: 77–86.
Pomeranz Krummel DA, Oubridge C, Leung AK, Li J, Nagai K. 2009.Crystal structure of human spliceosomal U1 snRNP at 5.5 Å resolu-tion. Nature 458: 475–480.
Press WH, Teukolsky SA, Vetterling WT, Flannery BP. 2007. Numericalrecipes: the art of scientific computing, 3rd ed. Cambridge UniversityPress, New York.
Ray D, Kazan H, Cook KB, Weirauch MT, Najafabadi HS, Li X,Gueroussov S, AlbuM, Zheng H, Yang A, et al. 2013. A compendiumof RNA-binding motifs for decoding gene regulation. Nature 499:172–177.
Reed R. 1996. Initial splice-site recognition and pairing during pre-mRNA splicing. Curr Opin Genet Dev 6: 215–220.
Robberson BL, Cote GJ, Berget SM. 1990. Exon definition may facilitatesplice site selection in RNAs with multiple exons. Mol Cell Biol 10:84–94.
Roca X, Krainer AR, Eperon IC. 2013. Pick one, but be quick: 5′splice sites and the problems of too many choices. Genes Dev 27:129–144.
Schneider M, Will CL, Anokhina M, Tazi J, Urlaub H, Luhrmann R.2010. Exon definition complexes contain the tri-snRNP and canbe directly converted into B-like precatalytic splicing complexes.Mol Cell 38: 223–235.
Selvakumar M, Helfman DM. 1999. Exonic splicing enhancers contrib-ute to the use of both 3′ and 5′ splice site usage of rat β-tropomyosinpre-mRNA. RNA 5: 378–394.
Shapiro MB, Senapathy P. 1987. RNA splice junctions of different clas-ses of eukaryotes: sequence statistics and functional implications ingene expression. Nucleic Acids Res 15: 7155–7174.
Shen H, Kan JL, Green MR. 2004. Arginine-serine-rich domains boundat splicing enhancers contact the branchpoint to promote prespli-ceosome assembly. Mol Cell 13: 367–376.
Shepard PJ, Choi EA, Busch A, Hertel KJ. 2011. Efficient internal exonrecognition depends on near equal contributions from the 3′ and 5′splice sites. Nucleic Acids Res 39: 8928–8937.
Singh J, Padgett RA. 2009. Rates of in situ transcription and splicing inlarge human genes. Nat Struct Mol Biol 16: 1128–1133.
Smith CW, Valcárcel J. 2000. Alternative pre-mRNA splicing: the logicof combinatorial control. Trends Biochem Sci 25: 381–388.
Staknis D, Reed R. 1994. SR proteins promote the first specific recogni-tion of pre-mRNA and are present together with the U1 small nucle-ar ribonucleoprotein particle in a general splicing enhancer complex.Mol Cell Biol 14: 7670–7682.
Sterner DA, Carlo T, Berget SM. 1996. Architectural limits on splitgenes. Proc Natl Acad Sci 93: 15081–15085.
Sun H, Chasin LA. 2000. Multiple splicing defects in an intronic falseexon. Mol Cell Biol 20: 6414–6425.
Arias et al.
16 RNA, Vol. 21, No. 2
Cold Spring Harbor Laboratory Press on July 16, 2016 - Published by rnajournal.cshlp.orgDownloaded from

Topp JD, Jackson J, Melton AA, Lynch KW. 2008. A cell-based screenfor splicing regulators identifies hnRNP LL as a distinct signal-in-duced repressor of CD45 variable exon 4. RNA 14: 2038–2049.
Wada Y, Ohta Y, Xu M, Tsutsumi S, Minami T, Inoue K, Komura D,Kitakami J, Oshida N, Papantonis A, et al. 2009. A wave of nascenttranscription on activated human genes. Proc Natl Acad Sci 106:18357–18361.
Weber G, Trowitzsch S, Kastner B, Luhrmann R, Wahl MC. 2010.Functional organization of the Sm core in the crystal structure of hu-man U1 snRNP. EMBO J 29: 4172–4184.
Xiao X, Wang Z, Jang M, Burge CB. 2007. Coevolutionary networksof splicing cis-regulatory elements. Proc Natl Acad Sci 104: 18583–18588.
Zhang XH, Chasin LA. 2004. Computational definition of sequencemo-tifs governing constitutive exon splicing. Genes Dev 18: 1241–1250.
Zhang XH, Leslie CS, Chasin LA. 2005. Computational searches forsplicing signals. Methods 37: 292–305.
Zhang XH, Arias MA, Ke S, Chasin LA. 2009. Splicing of designer exonsreveals unexpected complexity in pre-mRNA splicing. RNA 15:367–376.
Exon definition in designer exons
www.rnajournal.org 17
Cold Spring Harbor Laboratory Press on July 16, 2016 - Published by rnajournal.cshlp.orgDownloaded from

published online December 9, 2014RNA Mauricio A. Arias, Ashira Lubkin and Lawrence A. Chasin definitionSplicing of designer exons informs a biophysical model for exon
Material
Supplemental
http://rnajournal.cshlp.org/content/suppl/2014/12/02/rna.048009.114.DC1.html
P<P
Published online December 9, 2014 in advance of the print journal.
License
Commons Creative
.http://creativecommons.org/licenses/by-nc/4.0/4.0 International), as described at months, it is available under a Creative Commons License (Attribution-NonCommercial
). After 12http://rnajournal.cshlp.org/site/misc/terms.xhtmlfull-issue publication date (see This article is distributed exclusively by the RNA Society for the first 12 months after the
ServiceEmail Alerting
click here.right corner of the article or
Receive free email alerts when new articles cite this article - sign up in the box at the top
http://rnajournal.cshlp.org/subscriptions go to: RNATo subscribe to
© 2014 Arias et al.; Published by Cold Spring Harbor Laboratory Press for the RNA Society
Cold Spring Harbor Laboratory Press on July 16, 2016 - Published by rnajournal.cshlp.orgDownloaded from