spend their time Everyday life of - European Commission
125
2004 EDITION 3 THEME 3 Population and social conditions EUROPEAN COMMISSION How Europeans spend their time Everyday life of women and men Data 1998-2002 P O C K E T B O O K S
-
Upload
khangminh22 -
Category
Documents
-
view
0 -
download
0
Transcript of spend their time Everyday life of - European Commission
20
04
ED
ITIO
N
3THEME 3Population and social conditions
E U R O P E A NCOMMISSION
How Europeansspend their time
Everyday life of
women and menData 1998-2002
PO
CK
ET
BO
OK
S

A great deal of additional information on the European Union is available on the Internet.It can be accessed through the Europa server (http://europa.eu.int).
Luxembourg: Office for Official Publications of the European Communities, 2004
ISBN 92-894-7235-9
© European Communities, 2004
Europe Direct is a service to help you find answers to your questions about the European Union
New freephone number:
00 800 6 7 8 9 10 11

Preface
This pocketbook is the first compendium of European statistics onhow Europeans spend their time. It aims to shed light on howwomen and men organise their everyday life in 10 Europeancountries. It has been funded by the fifth Community actionprogramme to promote gender equality 2001–05.
The statistical source for this publication is national time use surveysthat have been conducted in several European countries. Time usesurveys fill a number of gaps in the statistical information available inthe social domain. For instance, they unveil gaps between womenand men correlated to existing differences in their position on thelabour market and their participation in education, cultural activitiesand other spheres of life.
In particular, time use surveys provide knowledge about thepossibilities of reconciling professional and family life – statisticsabout the division of gainful and domestic work between women andmen. Data on voluntary work, care, mobility and leisure time canalso be produced from time use surveys.
Ten European countries, Belgium, Germany, Estonia, France,Hungary, Slovenia, Finland, Sweden, the United Kingdom andNorway, have been included in this presentation because the surveymethods that have been used in these countries follow very closelythe Guidelines on harmonised European time use surveys publishedin September 2000. Therefore, the results are considered to becomparable. There are certain exceptions to this, and they arepointed out in notes and texts. See also the separate chapter ondata sources, classifications and definitions.
Time use survey results are also available for Denmark, Romania,the Netherlands and Portugal but they have not been included in thispocketbook since the survey methods used in these countriesdeviated from the European guidelines and comparable resultscould not be produced. However, it would be possible to includethem for other purposes and other comparisons.
Results from Bulgaria, Italy, Latvia, Lithuania and Spain will beavailable in the near future and those from Poland and Slovakia aredue within a couple of years.
Acknowledgements
This publication has been managed by the Eurostat unit responsiblefor labour market statistics, Unit D-1, under Head of Unit, Mr AntonioBaigorri. The opinions expressed are those of the individual authorsalone and do not necessarily reflect the position of the EuropeanCommission.
Support was provided by the Directorate-General for Employmentand Social Affairs, Unit G1 – Equality for Women and Men.
1

Coordinator
Karin Winqvist (Eurostat, Unit D-1)Jean Monnet BuildingL-29 20 LuxembourgTel. (352) 43 01 35581
Production
The data processing, statistical analysis, design and desktoppublishing for this pocketbook has been done by the following teamat Statistics Finland under the coordination of Iiris Niemi:
Hannu PääkkönenUlla HannulaHilkka LehikoinenIrma Ollila
Data providers
National statistical agencies and research institutes have providedthe statistical tables; see the list in the chapter on data sources,classifications and definitions.
Published by
Office for Official Publications of the European Communities,Luxembourg 2004
More results from time use surveys are available in publicationsproduced by Eurostat at:
http://europa.eu.int/comm/eurostat/Public/datashop/print-catalogue/EN?catalogue=Eurostat&collection=12-Working%20papers %20and %20studies&product=KS-CC-03-001-__-N-EN
http://europa.eu.int/comm/eurostat/Public/datashop/printcatalogue/EN?catalogue=Eurostat&collection=02-Statistics%20in %20Focus&product=KS-NK-03-012-__-N-EN
A great deal of additional information on the European Union isavailable on the Internet. It can be accessed through the server at:http://europa.eu.int
European Communities, 2004
2

Reading instructions
Most tables and figures in this publication show hours and minutesper day, average time spent on an activity. The average time is anaverage for the whole group of persons that is investigated and anaverage across the whole year. This means that all persons areincluded, whether they have performed this activity or not, and thatall days of the week, as well as working and holiday periods areincluded. Although the average time is an abstract measure anddoes not describe concrete everyday life at the individual level, it is aproper indicator of time use at the aggregate level and allowscomparisons between countries and population groups.
Some tables also show the proportion of people who spent any timeon the activity. This measures the proportion of persons whoperform the activity on an average day. It does not give informationabout how many persons perform the activity in general, or howmany persons perform the activity every day.
Sometimes average time by those who spent any time on the activityis also included. If the two first measures are shown in the table, thethird can be calculated in the following way.
Average time by those who spent any time on the activity =(average time per day/proportion of people who spent any time onthe activity) x 100
The tables and figures of daily rhythms show the proportions ofpeople who were performing the different activities at different hoursof the day.
In the figures, the countries are ranked in terms of the variablepresented for women in order to give a clearer indication of variationacross the presented countries.
Symbols and abbreviations
.. not available0 less than half of the unit used
Participating countries
BE BelgiumDE GermanyEE EstoniaFR FranceHU HungarySI SloveniaFI FinlandSE SwedenUK United KingdomNO Norway
3

Contents
Preface . . . . . . . . . . . . . . . . . . . . . . . . . . . . . . . . . . . . . . . . . . . 1
Reading instructions . . . . . . . . . . . . . . . . . . . . . . . . . . . . . . . . . 3
Symbols and abbreviations . . . . . . . . . . . . . . . . . . . . . . . . . . . . 3
Contents . . . . . . . . . . . . . . . . . . . . . . . . . . . . . . . . . . . . . . . . . . 4
General structure of time use . . . . . . . . . . . . . . . . . . . . . . . . . . 5
Daily rhythm . . . . . . . . . . . . . . . . . . . . . . . . . . . . . . . . . . . . . . 15
Employment . . . . . . . . . . . . . . . . . . . . . . . . . . . . . . . . . . . . . . 29
Study . . . . . . . . . . . . . . . . . . . . . . . . . . . . . . . . . . . . . . . . . . . . 37
Domestic work. . . . . . . . . . . . . . . . . . . . . . . . . . . . . . . . . . . . . 43
Total hours worked . . . . . . . . . . . . . . . . . . . . . . . . . . . . . . . . . 73
Free time . . . . . . . . . . . . . . . . . . . . . . . . . . . . . . . . . . . . . . . . . 83
Location and travel . . . . . . . . . . . . . . . . . . . . . . . . . . . . . . . . 105
Tables . . . . . . . . . . . . . . . . . . . . . . . . . . . . . . . . . . . . . . . . . . 123
Data sources, classifications and definitions. . . . . . . . . . . . . 127
4

GENERAL STRUCTURE OF TIME USE
5
General structure of time use
6
1.1 Time use structure of women aged 20 to 74
Hours and minutes per day
BE DE EE FR HU SI FI SE UK NO
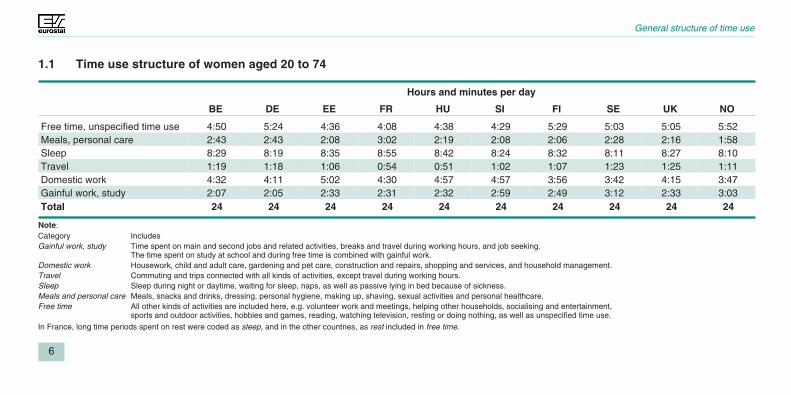
Free time, unspecified time use 4:50 5:24 4:36 4:08 4:38 4:29 5:29 5:03 5:05 5:52Meals, personal care 2:43 2:43 2:08 3:02 2:19 2:08 2:06 2:28 2:16 1:58Sleep 8:29 8:19 8:35 8:55 8:42 8:24 8:32 8:11 8:27 8:10Travel 1:19 1:18 1:06 0:54 0:51 1:02 1:07 1:23 1:25 1:11Domestic work 4:32 4:11 5:02 4:30 4:57 4:57 3:56 3:42 4:15 3:47Gainful work, study 2:07 2:05 2:33 2:31 2:32 2:59 2:49 3:12 2:33 3:03Total 24 24 24 24 24 24 24 24 24 24
Note:Category IncludesGainful work, study Time spent on main and second jobs and related activities, breaks and travel during working hours, and job seeking.
The time spent on study at school and during free time is combined with gainful work.Domestic work Housework, child and adult care, gardening and pet care, construction and repairs, shopping and services, and household management.Travel Commuting and trips connected with all kinds of activities, except travel during working hours.Sleep Sleep during night or daytime, waiting for sleep, naps, as well as passive lying in bed because of sickness.Meals and personal care Meals, snacks and drinks, dressing, personal hygiene, making up, shaving, sexual activities and personal healthcare.Free time All other kinds of activities are included here, e.g. volunteer work and meetings, helping other households, socialising and entertainment,
sports and outdoor activities, hobbies and games, reading, watching television, resting or doing nothing, as well as unspecified time use.
In France, long time periods spent on rest were coded as sleep, and in the other countries, as rest included in free time.

General structure of time use
7
BE DE EE FR HU SI FI SE UK NO0%
20%
40%
60%
80%
100%
Gainful work, studyDomestic workTravel
SleepMeals, personal careFree time, unspecified time use
1.1 Time use structure of women aged 20 to 74Domestic work emphasised in female use of time
Women aged 20 to 74 spend on average more time on domestic thanon gainful work. The share of gainful work is the largest in Sweden andNorway, and the smallest in Germany and Belgium. Travel takes moretime than in the other countries for women in the United Kin gdom andSweden, and less in Hungary and France.
Women sleep over eight hours during an average day of the year. Napsduring daytime are also included. Women in France seem to spendmore time on sleeping than others but the coding of rest in Francediffered somewhat from the other countries. The differences betweenthe countries are small and the shortest hours of sleep are foundamong Norwegian and Swedish women. Women in these countriesalso spend more time on employment.
Women in France, Belgium and Germany spend more time on meals andpersonal care than in the other compared countries. This may reflectdifferent habits of combining meals with socialising. Norwegian womenseem to enjoy the largest amount of free time. This is, however, partlyexplained by a different way of recording socialising during meals. Theleast amount of free time is found among French women.

General structure of time use
8
1.2 Time use structure of men aged 20 to 74
Hours and minutes per day
BE DE EE FR HU SI FI SE UK NO
Free time, unspecified time use 5:22 5:53 5:28 4:46 5:29 5:34 6:08 5:24 5:30 6:03Meals, personal care 2:40 2:33 2:15 3:01 2:31 2:13 2:01 2:11 2:04 1:47Sleep 8:15 8:12 8:32 8:45 8:31 8:17 8:22 8:01 8:18 7:57Travel 1:35 1:27 1:17 1:03 1:03 1:09 1:12 1:30 1:30 1:20Domestic work 2:38 2:21 2:48 2:22 2:39 2:39 2:16 2:29 2:18 2:22Gainful work, study 3:30 3:35 3:40 4:03 3:46 4:07 4:01 4:25 4:18 4:31Total 24 24 24 24 24 24 24 24 24 24
Note: See Table 1.1.

General structure of time use
9
BE DE EE FR HU SI FI SE UK NO0%
20%
40%
60%
80%
100%
Gainful work, studyDomestic workTravel
SleepMeals, personal careFree time, unspecified time use
1.2 Time use structure of men aged 20 to 74Gainful work emphasised in male use of time
On average, men spend more time on gainful work than on domestictasks while the situation is the opposite with women. The share ofgainful work is the largest in Norway, Sweden and the United Kingdomand the smallest in Belgium and Germany. The total time spent on workactivities – gainful work, study and domestic work – is slightly shorterfor men than for women in the compared countries except for Norwayand Sweden, where it is equal (see Chapter 6).
On average, men spend slightly more time on daily travel than womendo. Men sleep on average slightly less than women in the countriescompared. Among men, differences across the countries are similar tothose observed among women on the previous page. Men spend thelongest time sleeping in France, Estonia and Hungary, and the shortestin Norway and Sweden. In all the countries men enjoy more free timethan women do. The amounts of free time for men vary between lessthan five hours to around six hours per day. The least amount of freetime is found in France.

General structure of time use
10
1.3 Time use structure of employed women
Hours and minutes per day
BE DE EE FR HU SI FI SE UK NO
Free time, unspecified time use 3:51 4:49 4:00 3:08 3:43 3:51 4:38 4:27 4:21 5:22Meals, personal care 2:36 2:31 2:06 2:57 2:21 2:02 2:02 2:23 2:07 2:02Sleep 8:16 8:11 8:23 8:38 8:18 8:12 8:22 8:05 8:25 8:07Travel 1:30 1:27 1:15 1:05 1:02 1:09 1:16 1:28 1:33 1:17Domestic work 3:52 3:11 4:04 3:40 3:54 4:24 3:21 3:32 3:28 3:26Gainful work, study 3:53 3:52 4:13 4:32 4:43 4:23 4:20 4:05 4:06 3:46Total 24 24 24 24 24 24 24 24 24 24
Note: See Table 1.1.

General structure of time use
11
BE DE EE FR HU SI FI SE UK NO0%
20%
40%
60%
80%
100%
Gainful work, studyDomestic workTravel
SleepMeals, personal careFree time, unspecified time use
1.3 Time use structure of employed womenEmployed women are busy
Women employed both full time and part time are included in the table.Among working women the share of time used for gainful work exceedsthe time spent on domestic work in most of the countries compared.Most hours of gainful work for employed women are found in Hungary,France, Slovenia and Finland. However, it is likely that the situation inFrance has changed since 1998 because of reduced working time to 35hours per week. Working hours are also analysed in Chapter 3.
Time spent on domestic work varies notably by country. Employedwomen in Slovenia, Estonia, Hungary and Belgium spend more timeon these tasks than employed women in the other countries.Concurrently women in Slovenia, Estonia and Hungary are veryactively involved in employment. This leads to a considerable totalwork time (see Chapter 6).

General structure of time use
12
1.4 Time use structure of employed men
Hours and minutes per day
BE DE EE FR HU SI FI SE UK NO
Free time, unspecified time use 4:23 5:11 4:47 3:51 4:37 4:52 5:06 4:51 4:41 5:37Meals, personal care 2:35 2:21 2:11 2:58 2:30 2:07 1:55 2:05 1:55 1:58Sleep 8:01 8:00 8:22 8:24 8:08 8:06 8:12 7:52 8:11 7:53Travel 1:43 1:31 1:20 1:10 1:10 1:14 1:17 1:32 1:36 1:23Domestic work 2:15 1:52 2:20 1:53 2:09 2:24 1:59 2:23 1:54 2:12Gainful work, study 5:03 5:05 5:00 5:44 5:25 5:20 5:32 5:17 5:42 4:56Total 24 24 24 24 24 24 24 24 24 24
Note: See Table 1.1.
General structure of time use
13
BE DE EE FR HU SI FI SE UK NO0%
20%
40%
60%
80%
100%
Gainful work, studyDomestic workTravel
SleepMeals, personal careFree time, unspecified time use
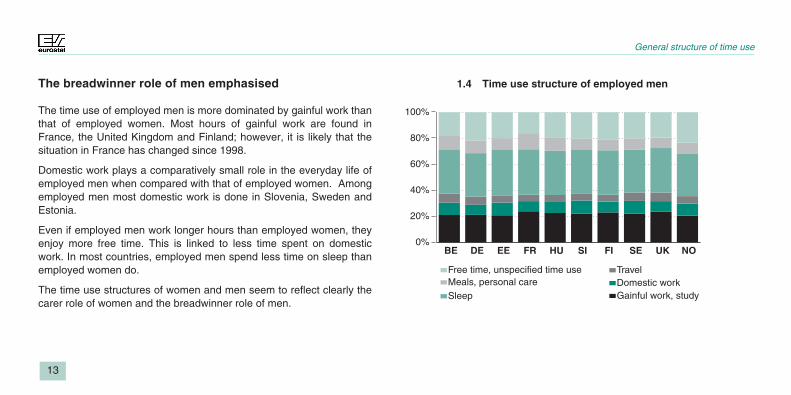
1.4 Time use structure of employed menThe breadwinner role of men emphasised
The time use of employed men is more dominated by gainful work thanthat of employed women. Most hours of gainful work are found inFrance, the United Kingdom and Finland; however, it is likely that thesituation in France has changed since 1998.
Domestic work plays a comparatively small role in the everyday life ofemployed men when compared with that of employed women. Amongemployed men most domestic work is done in Slovenia, Sweden andEstonia.
Even if employed men work longer hours than employed women, theyenjoy more free time. This is linked to less time spent on domesticwork. In most countries, employed men spend less time on sleep thanemployed women do.
The time use structures of women and men seem to reflect clearly thecarer role of women and the breadwinner role of men.

DAILY RHYTHM
15

Daily rhythm
16
2.1 Gainful work at 10.30 am and 5.30 pm on weekdays.Percentage of persons aged 20 to 74
Participation in activities, %
Time of day BE DE EE FR HU SI FI SE UK NO
10:30Total 37 38 45 41 39 39 42 48 44 47Women 29 30 38 33 33 33 36 41 36 39Men 44 48 52 49 45 45 48 55 53 56
17:30Total 14 12 18 24 11 14 12 14 16 12Women 10 9 14 19 8 12 9 11 10 9Men 17 15 23 30 14 17 16 17 22 15
Note: Gainful work includes time spent on main and second jobs and related activities, breaks andtravel during working hours, and job seeking.
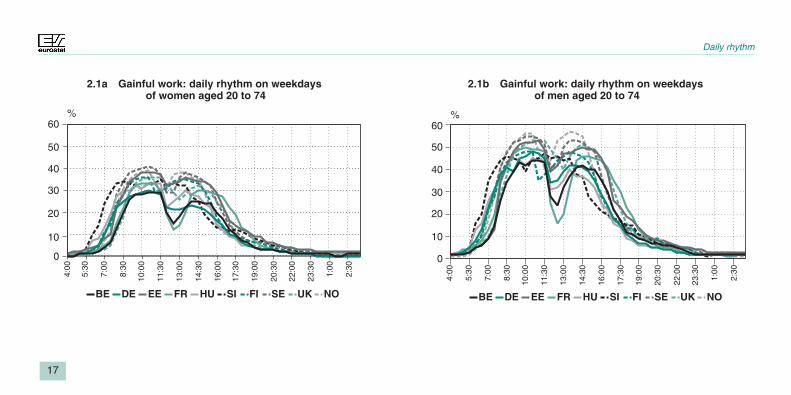
Men and women have a similar daily rhythm ofgainful work
European men and women have a similar daily rhythm of gainful work.Men's participation in work is clearly higher than women's throughoutthe day. Most people are at work by 10 am. The lunch, often takenbetween 12 noon and 1 pm, breaks up the day, and in the afternoonparticipation in work is almost as high as before noon.
Slovenians and Hungarians start their working day earliest and theyalso finish earlier than others. To some extent the French andEstonians do the opposite – start later and finish later.
Men's working days end mostly between 5 and 5.30 pm. The ending ofwomen's working days varies more than that of men.
Daily rhythm
17
0
10
20
30
40
50
60%
BE DE EE FR HU SI FI SE UK NO
4:00
5:30
7:00
8:30
10:0
0
11:3
0
13:0
0
14:3
0
16:0
0
17:3
0
19:0
0
20:3
0
22:0
0
23:3
0
1:00
2:30
2.1a Gainful work: daily rhythm on weekdaysof women aged 20 to 74
0
10
20
30
40
50
60%
BE DE EE FR HU SI FI SE UK NO
4:00
5:30
7:00
8:30
10:0
0
11:3
0
13:0
0
14:3
0
16:0
0
17:3
0
19:0
0
20:3
0
22:0
0
23:3
0
1:00
2:30
2.1b Gainful work: daily rhythm on weekdaysof men aged 20 to 74

Daily rhythm
18
2.2 Domestic work at 10.30 am and 5.30 pm on weekdays.Percentage of persons aged 20 to 74
Participation in activities, %
Time of day BE DE EE FR HU SI FI SE UK NO
10:30Total 31 29 24 32 35 30 23 19 24 19Women 40 38 31 42 44 38 30 24 31 25Men 22 20 15 21 24 22 15 13 16 12
17:30Total 32 29 27 28 30 34 24 29 26 24Women 39 35 35 35 37 40 29 34 35 27Men 24 23 18 21 23 28 18 23 16 21
Note: Domestic work includes housekeeping, child and adult care, gardening and pet care,construction and repair, shopping and services, and household management.
Meals determine timing of domestic work
The rhythm of domestic work resembles in its structure that of gainfulemployment. In the morning most domestic work is done just beforelunchtime. Having lunch reduces the proportion of domestic work aroundnoontime. The afternoon peak for domestic work occurs around 5 pm – justbefore supper. Contrary to gainful work, the proportion of women doingdomestic work is higher than that of men all through the day.
Domestic work has a clear peak in the morning (between 10 and 11.30 am)in Hungary, France, Belgium, Slovenia and Germany. Around 40 % ofwomen and 20 % of men take part in domestic work at that time. In the otherexamined countries the proportion of women and men doing domestic workis more constant throughout the day and much lower – about one thirdamong Estonian, British and Finnish women and about one quarter amongSwedish and Norwegian women. Men's rhythm of domestic work followsthat of women, though at a markedly lower level.
Cooking makes up a large part of domestic work. In the afternoon this ismost visible in France, where around 40 % of women do domestic workbetween 6 and 7 pm. Slovenia shows a relatively high percentage of bothwomen and men in domestic work in the afternoon - women around 40 %and men about 25 %.

Daily rhythm
19
0
10
20
30
40
50
60%
BE DE EE FR HU SI FI SE UK NO
4:00
5:30
7:00
8:30
10:0
0
11:3
0
13:0
0
14:3
0
16:0
0
17:3
0
19:0
0
20:3
0
22:0
0
23:3
0
1:00
2:30
2.2a Domestic work: daily rhythm on weekdaysof women aged 20 to 74
4:00
5:30
7:00
8:30
10:0
0
11:3
0
13:0
0
14:3
0
16:0
0
17:3
0
19:0
0
20:3
0
22:0
0
23:3
0
1:00
2:30
0
10
20
30
40
50
60 %
BE DE EE FR HU SI FI SE UK NO
2.2b Domestic work: daily rhythm on weekdaysof men aged 20 to 74

Daily rhythm
20
2.3 Travel at 7.30 am, 12 noon and 5 pm on weekdays. Percentage of persons aged 20 to 74
Participation in activities, %
Time of day BE DE EE FR HU SI FI SE UK NO
07:30Total 10 10 25 9 12 7 9 10 10 11Women 7 10 20 7 12 7 9 11 7 10Men 13 10 30 11 11 8 9 10 13 11
12:00Total 10 9 13 10 6 6 7 12 9 6Women 9 9 14 9 6 6 7 12 10 7Men 10 8 13 11 7 6 8 13 8 6
17:00Total 18 13 24 12 11 10 12 15 16 12Women 17 12 21 11 10 10 12 14 15 12Men 20 14 27 12 13 10 12 17 17 13
Note: Travel includes commuting and trips connected with all kinds of activities, except travel during working hours.

Daily rhythm
21
4:00
5:30
7:00
8:30
10:0
0
11:3
0
13:0
0
14:3
0
16:0
0
17:3
0
19:0
0
20:3
0
22:0
0
23:3
0
1:00
2:30
0
5
10
15
20
25
30%
BE DE EE FR HU SI FI SE UK NO
2.3 Travel: daily rhythm on weekdaysof persons aged 20 to 74
Commuting dominates travel on weekdays
Travel to and from work clearly dominates the timing of travel onweekdays. People go to work mostly between 7.30 and 8.30 am. Travelfrom work is distributed over a longer period of time in the afternoonwith peaks around 4 and 5 pm. In addition to travel to and from work,the third peak time for travel in some countries is at about noon inconnection with the lunch break. Slovenia, Hungary, Finland, Swedenand Norway have their peak hours earlier and Belgium, France and theUnited Kingdom have theirs somewhat later than the other countries.
The results showing distinct peak times of travel indicate that Estonianshave the most fixed hours for commuting. This is true for both womenand men.
Daily rhythm
22
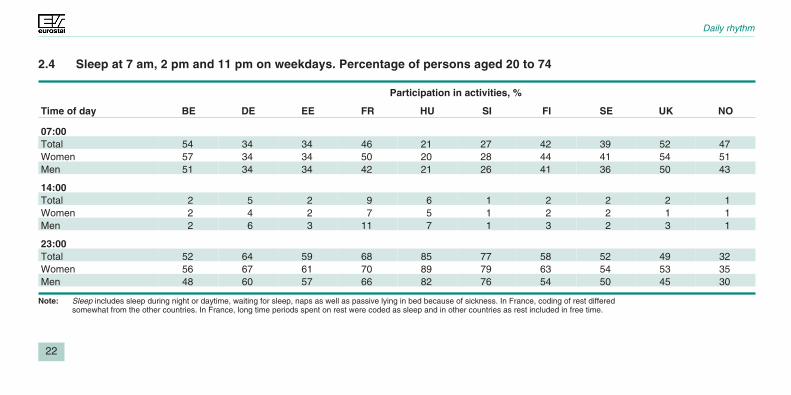
2.4 Sleep at 7 am, 2 pm and 11 pm on weekdays. Percentage of persons aged 20 to 74
Participation in activities, %
Time of day BE DE EE FR HU SI FI SE UK NO
07:00Total 54 34 34 46 21 27 42 39 52 47Women 57 34 34 50 20 28 44 41 54 51Men 51 34 34 42 21 26 41 36 50 43
14:00Total 2 5 2 9 6 1 2 2 2 1Women 2 4 2 7 5 1 2 2 1 1Men 2 6 3 11 7 1 3 2 3 1
23:00Total 52 64 59 68 85 77 58 52 49 32Women 56 67 61 70 89 79 63 54 53 35Men 48 60 57 66 82 76 54 50 45 30
Note: Sleep includes sleep during night or daytime, waiting for sleep, naps as well as passive lying in bed because of sickness. In France, coding of rest differedsomewhat from the other countries. In France, long time periods spent on rest were coded as sleep and in other countries as rest included in free time.

Daily rhythm
23
0
20
40
60
80
100%
BE DE EE FR HU SI FI SE UK NO
4:00
5:30
7:00
8:30
10:0
0
11:3
0
13:0
0
14:3
0
16:0
0
17:3
0
19:0
0
20:3
0
22:0
0
23:3
0
1:00
2:30
2.4 Sleep: daily rhythm on weekdays of personsaged 20 to 74
Weekday early risers in Hungary –late to bed in Norway
Of the countries examined, Hungarians and Slovenians wake up earlierand go to bed earlier than others, while Norwegians go to sleep laterthan the rest.
The sleeping rhythms of women and men during weekdays are similarin the investigated countries. Less sleep among men than women isvisible in many countries as men are waking up earlier and going tosleep later.
On weekdays, most women and men are awake by 7 am. Most peoplego to sleep by 11 pm. In Hungary, people go to bed one hour earlierand in Norway half-an-hour later than in most of the other examinedcountries.
Daytime naps are usually taken between 1 and 3 pm and habits varybetween countries. Sleeping during the daytime is most common inFrance, Hungary and Germany, but for France some of this may be theresult of differences in coding.

Daily rhythm
24
2.5 Meals and personal care at 7 am, 12.30 pm and 7 pm on weekdays. Percentage of persons aged 20 to 74
Participation in activities, %
Time of day BE DE EE FR HU SI FI SE UK NO
07:00Total 18 25 14 28 30 21 16 19 20 21Women 17 27 11 27 32 22 19 20 20 21Men 18 22 19 29 27 19 13 17 19 21
12:30Total 38 20 5 57 29 14 10 17 14 10Women 38 20 4 56 28 14 9 18 16 10Men 38 19 6 59 30 14 10 17 13 10
19:00Total 21 20 6 27 30 19 11 13 16 8Women 21 21 6 27 30 17 11 13 15 7Men 21 20 7 27 31 21 11 14 17 8
Note: Meals/personal care also include snacks and drinks, dress, personal hygiene, making up, shaving, sexual activities and personal care for health.

Daily rhythm
25
0
10
20
30
40
50
60%
BE DE EE FR HU SI FI SE UK NO
4:00
5:30
7:00
8:30
10:0
0
11:3
0
13:0
0
14:3
0
16:0
0
17:3
0
19:0
0
20:3
0
22:0
0
23:3
0
1:00
2:30
2.5 Meals and personal care: daily rhythm onweekdays of persons aged 20 to 74
The French have the most uniform meal times
Three peak times can be seen in the category meals and personalcare: breakfast and other morning activities at around 7 am, lunchbetween 12 noon and 1 pm and supper between 6 and 8.30 pm. TheFrench, Belgians and Hungarians have clearly the most uniform mealtimes.
Lunchtime is between 11 am and 1.30 pm all across the examinedcountries. At 12.30 pm more than half of the French have lunch. So doalmost 40 % of Belgians and 30 % of Hungarians. Finns andNorwegians have lunch earlier.
The timing of supper varies more than that of lunch. Nearly 40 % of theFrench have supper between 7.30 and 8 pm, while 20 to 30 % ofHungarians, Belgians, Germans, Britons and Slovenians have supperabout one hour earlier.

Daily rhythm
26
2.6 Free time at 7.30 pm and 9.30 pm on weekdays. Percentage of persons aged 20 to 74
Participation in activities, %
Time of day BE DE EE FR HU SI FI SE UK NO
19:30Total 45 50 50 22 51 54 56 53 52 55Women 43 48 48 18 48 48 56 51 52 56Men 48 53 53 27 54 61 56 56 52 54
21:30Total 68 68 61 67 56 55 59 64 67 69Women 68 66 58 67 55 52 57 62 65 65Men 68 69 65 67 58 59 62 65 69 72
Note: Free time is defined here as all other kinds of activities, for example, volunteer work and meetings, helping other households, social life and entertainment,sports and outdoor activities, hobbies and games, reading, watching television, resting or doing nothing, as well as unspecified time use.

Daily rhythm
27
20
40
60
80%
BE DE EE FR HU SI FI SE UK NO
4:00
5:30
7:00
8:30
10:0
0
11:3
0
13:0
0
14:3
0
16:0
0
17:3
0
19:0
0
20:3
0
22:0
0
23:3
0
1:00
2:30
0
2.6 Free time: daily rhythm on weekdaysof persons aged 20 to 74
Free time increases towards the evening
During weekdays men and women have free time at around the sametime. The proportion of those having free time increases towards theevening in all the countries and one half are at leisure between 7.30and 8 pm. Free time peaks at around 8.30 to 9.30 pm. Then around twothirds of women and men have free time.
Finns and Norwegians start their free time about one hour before theothers. Late supper delays the start of free time among the French.Free time ends earlier for Hungarians and Slovenians and later forNorwegians compared with the other examined countries.

EMPLOYMENT
29

30
Employment
30
3.1 Key indicators on employment, 2002
BE DE EE FR HU SI FI SE UK NO
Employment rate among population aged 15 to 64, %
Total 59.7 65.4 61.7 62.9 56.5 64.3 69.1 74.0 71.5 77.3Women 51.1 58.8 57.6 56.4 49.9 59.8 67.3 72.5 65.3 73.8Men 68.1 71.8 66.2 69.6 63.4 68.7 70.9 75.5 77.7 80.3
Percentage of employed persons working part-time, %
Total 19.4 20.8 6.7 16.2 3.6 6.6 12.4 21.4 25.0 26.3Women 37.7 39.5 9.6 29.7 5.1 8.3 17.1 32.9 44.0 42.7Men 6.2 8.7 3.9 7.8 2.3 5.2 8.0 11.2 9.4 11.0
Unemployment rate, %
Total 6.9 8.5 9.4 8.7 5.6 5.9 10.4 5.0 5.0 4.0Women 7.8 8.2 8.5 9.8 5.1 6.3 10.2 4.6 4.3 3.6Men 6.2 8.7 10.3 7.8 6.1 5.6 10.7 5.3 5.6 4.0
Sources: Ana Franco – Sylvain Jouhette, Labour force survey, Principal results 2002. EU and EFTA countries, Eurostat, Statistics in focus, Population and social conditions, Theme 3 – 15/2003;Ana Franco – Larus Blöndal, Labour force survey, Principal results 2002, Acceding countries, Eurostat, Statistics in focus, Population and social conditions, Theme 3 – 16/2003.
31
Employment
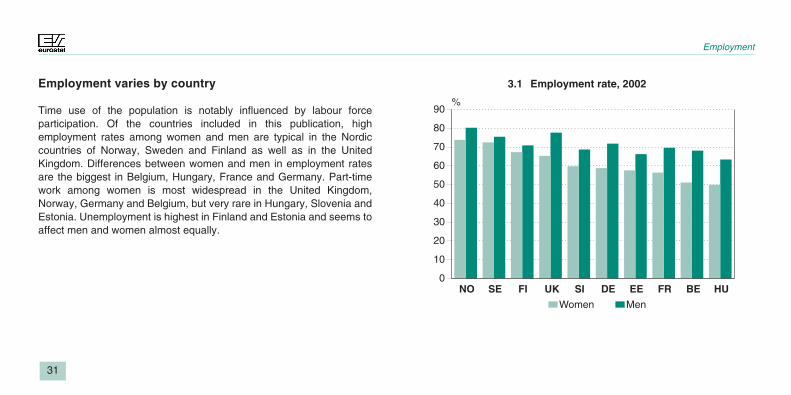
Employment varies by country
Time use of the population is notably influenced by labour forceparticipation. Of the countries included in this publication, highemployment rates among women and men are typical in the Nordiccountries of Norway, Sweden and Finland as well as in the UnitedKingdom. Differences between women and men in employment ratesare the biggest in Belgium, Hungary, France and Germany. Part-timework among women is most widespread in the United Kingdom,Norway, Germany and Belgium, but very rare in Hungary, Slovenia andEstonia. Unemployment is highest in Finland and Estonia and seems toaffect men and women almost equally.
NO SE FI UK SI DE EE FR BE HU0
10
20
30
40
50
60
70
80
90%
Women Men
3.1 Employment rate, 2002
3232
Employment
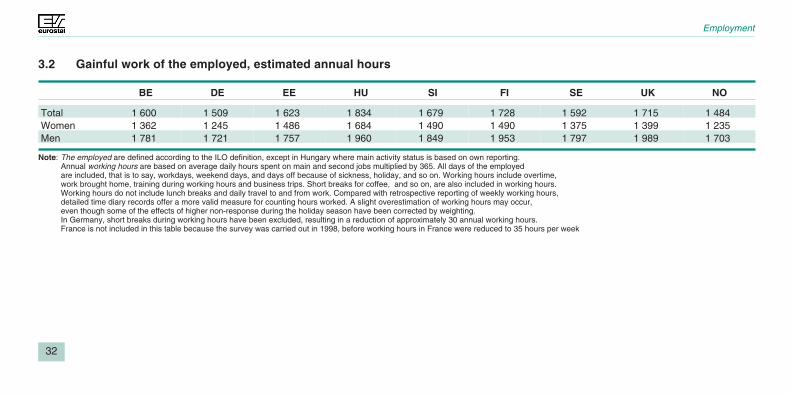
3.2 Gainful work of the employed, estimated annual hours
BE DE EE HU SI FI SE UK NO
Total 1 600 1 509 1 623 1 834 1 679 1 728 1 592 1 715 1 484Women 1 362 1 245 1 486 1 684 1 490 1 490 1 375 1 399 1 235Men 1 781 1 721 1 757 1 960 1 849 1 953 1 797 1 989 1 703
Note: The employed are defined according to the ILO definition, except in Hungary where main activity status is based on own reporting.Annual working hours are based on average daily hours spent on main and second jobs multiplied by 365. All days of the employedare included, that is to say, workdays, weekend days, and days off because of sickness, holiday, and so on. Working hours include overtime,work brought home, training during working hours and business trips. Short breaks for coffee, and so on, are also included in working hours.Working hours do not include lunch breaks and daily travel to and from work. Compared with retrospective reporting of weekly working hours,detailed time diary records offer a more valid measure for counting hours worked. A slight overestimation of working hours may occur,even though some of the effects of higher non-response during the holiday season have been corrected by weighting.In Germany, short breaks during working hours have been excluded, resulting in a reduction of approximately 30 annual working hours.France is not included in this table because the survey was carried out in 1998, before working hours in France were reduced to 35 hours per week

33
Employment
Annual working hours longer for men than women
Working hours are shorter for women than for men in all the comparedcountries. Based on time use estimates, men in the United Kingdom,Hungary and Finland spend more than 1 900 hours annually onemployment. Men in Norway and Germany spend the least number ofhours on employment, or slightly above 1 700. Hungarian women workon average almost 1 700 hours per year, which is the most among allthe compared countries. In Norway and in Germany, where part-timeemployment is common among women, the average annual hourswomen spend on employment number under 1 300.
HU FI SI EE UK SE BE DE NO0
500
1 000
1 500
2 000
2 500Hours per year
Women Men
3.2 Time spent on gainful work by the employed

34
Employment
BE DE HU SI FI SE UK NO
Women Hours and minutes per dayMonday 4:53 4:38 5:50 5:02 5:07 4:34 4:43 4:04Tuesday 5:22 4:46 6:11 4:57 5:23 4:53 4:58 4:28Wednesday 4:37 4:42 6:02 5:41 5:41 5:28 5:12 4:33Thursday 4:58 4:58 6:08 5:37 5:12 5:05 4:58 4:23Friday 4:24 4:07 5:39 5:01 4:51 4:19 4:30 4:14Saturday 1:11 1:02 1:35 1:48 1:16 1:02 1:31 1:26Sunday 0:41 0:34 0:46 0:57 1:11 0:59 1:00 0:46
MenMonday 6:19 6:20 6:41 6:11 6:51 6:28 6:39 5:55Tuesday 6:44 6:44 6:50 6:19 6:57 6:36 7:10 6:33Wednesday 6:30 6:47 6:44 6:28 7:11 6:57 7:02 5:52Thursday 6:20 6:42 6:52 6:38 6:45 6:19 7:11 6:08Friday 5:45 5:32 6:26 6:15 6:26 5:53 6:14 6:00Saturday 1:41 1:25 2:29 2:38 1:53 1:14 2:25 1:33Sunday 0:52 0:53 1:31 1:31 1:29 1:04 1:26 1:08
Note: See Table 3.2.
3.3 Gainful work of the employed by day of the week
35
Employment
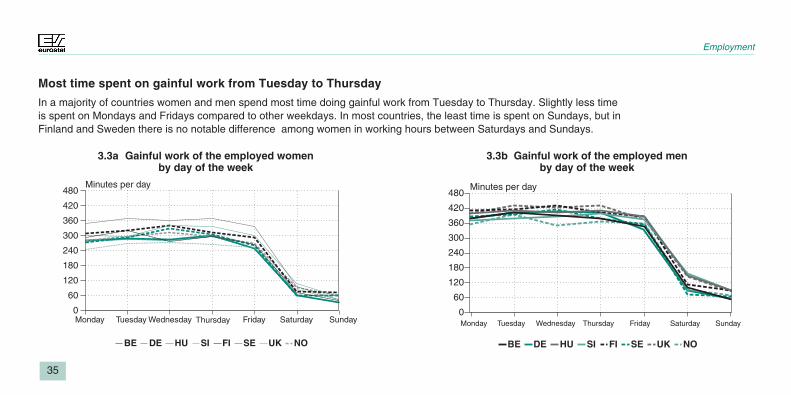
Most time spent on gainful work from Tuesday to Thursday
In a majority of countries women and men spend most time doing gainful work from Tuesday to Thursday. Slightly less timeis spent on Mondays and Fridays compared to other weekdays. In most countries, the least time is spent on Sundays, but inFinland and Sweden there is no notable difference among women in working hours between Saturdays and Sundays.
Monday Tuesday Wednesday Thursday Friday Saturday Sunday0
60
120
180
240
300
360
420
480Minutes per day
BE DE HU SI FI SE UK NO
3.3a Gainful work of the employed womenby day of the week
Monday Tuesday Wednesday Thursday Friday Saturday Sunday0
60
120
180
240
300
360
420
480Minutes per day
BE DE HU SI FI SE UK NO
3.3b Gainful work of the employed menby day of the week

STUDY
37

Study
38
4.1 Studies by persons aged 20 to 74
BE DE EE FR HU SI FI SE UK
Study total Hours and minutes per dayTotal 0:15 0:14 0:08 0:14 0:14 0:15 0:15 0:17 0:09Women 0:14 0:13 0:07 0:14 0:14 0:17 0:16 0:19 0:09Men 0:15 0:15 0:06 0:15 0:14 0:13 0:13 0:14 0:08
Proportion of people who spent any time on the acitivity, % per dayTotal 6 6 3 6 5 6 6 7 4Women 6 6 3 6 5 7 6 8 4Men 6 7 3 7 5 6 5 5 4
Hours and minutes per day on study at school or university and free time studySchool or universityWomen 0:10 0:09 0:04 0:13 0:13 0:15 0:14 0:17 0:07Men 0:11 0:11 0:04 0:14 0:12 0:12 0:11 0:11 0:06Free time studyWomen 0:03 0:04 0:02 0:01 0:02 0:01 0:02 0:02 0:02Men 0:03 0:04 0:01 0:01 0:02 0:01 0:03 0:02 0:02
Note: Time spent on studies includes studying at school and university, homework, and education during free time. Training during working hours is not included.Norway is not included because of missing information on free time study.

Study
39
SE SI FI BE FR HU DE UK EE0
5
10
15
20Minutes per day
Women Men
4.1 Time spent on studies by persons aged 20 to 74Hardly any differences between women and men intime for study
Time use surveys offer an indicator on participation in and time spenton studying among persons aged 20 to 74. The figures per averageday of the year are very low. The participation rates and average timesare about equal in all the examined countries, but slightly less studyingis observed in Estonia and the United Kingdom.
There are minor differences between women and men. In Sweden,Slovenia and Finland, women study slightly more than men. No cleardifferences can be observed in the other countries. These genderdifferences refer only to education at school and university. Free timestudies do not show such differences.
Study
40
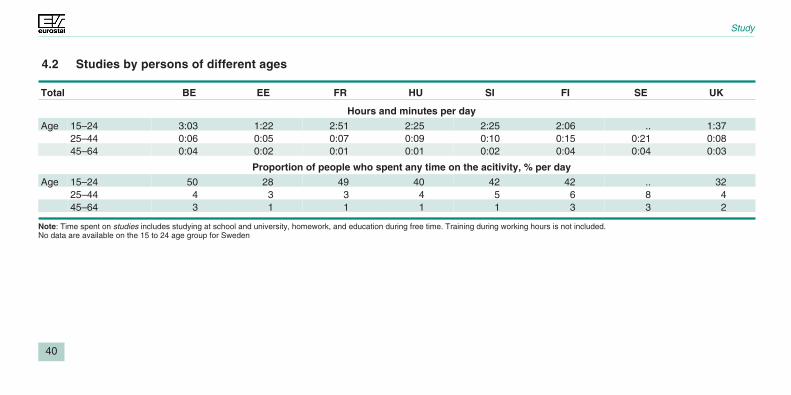
4.2 Studies by persons of different ages
Total BE EE FR HU SI FI SE UK
Hours and minutes per day
Age 15–24 3:03 1:22 2:51 2:25 2:25 2:06 .. 1:3725–44 0:06 0:05 0:07 0:09 0:10 0:15 0:21 0:0845–64 0:04 0:02 0:01 0:01 0:02 0:04 0:04 0:03
Proportion of people who spent any time on the acitivity, % per day
Age 15–24 50 28 49 40 42 42 .. 3225–44 4 3 3 4 5 6 8 445–64 3 1 1 1 1 3 3 2
Note: Time spent on studies includes studying at school and university, homework, and education during free time. Training during working hours is not included.No data are available on the 15 to 24 age group for Sweden

Study
41
BE EE FR HU SI FI SE UK0
30
60
90
120
150
180
210Minutes per day
15–24 25–44
4.2 Time spent on studies by ageA clear drop in studies after youth
Study is clearly concentrated into young population groups. Between30 and 50 % of the youngest age group of 15 to 24 spend some timeon studies on an average day. It is more common in Belgium andFrance and less common in Estonia and the United Kingdom than inthe other countries.
There is a clear drop in time spent on studies after the early 20s.Compared with the other countries, people continue studying to a laterage in Sweden and Finland. This may be because of different schoolsystems, possibilities of combining studies with employment, or laterentry into the labour force.

DOMESTIC WORK
43

Domestic work
44
5.1 Domestic work total of persons aged 20 to 74
BE DE EE FR HU SI FI SE UK NO
Hours and minutes per day
Total 3:36 3:17 4:01 3:28 3:51 3:50 3:08 3:06 3:18 3:04Women 4:32 4:11 5:02 4:30 4:57 4:57 3:56 3:42 4:15 3:47Men 2:38 2:21 2:48 2:21 2:39 2:39 2:16 2:29 2:18 2:22
Share of total time spent by women and by men %
Women 63 64 64 66 65 65 63 60 65 62Men 37 36 36 34 35 35 37 40 35 38
Proportion of people who spent any time on the activity, % per day
Total 94 92 93 89 92 90 94 95 93 95Women 97 97 98 97 97 97 98 98 97 98Men 90 88 87 81 86 82 90 92 88 93
Note: Domestic work comprises work done for own household. The most important categories are food management, care for textiles, cleaning andhousehold upkeep, gardening, repairs, shopping and childcare.

Domestic work
45
EE SI HU BE FR UK DE FI NO SE0
60
120
180
240
300
360Minutes per day
Women Men
5.1 Total time spent on domestic work bypersons aged 20 to 74
Women do two thirds of all domestic work
Women perform between 60 and 66 % of all domestic work in thecountries included in this comparison. Most time on domestic work isspent by women in Estonia, Hungary and Slovenia, around five hoursper day. Less than four hours per day is spent on domestic work bywomen in Sweden, Norway and Finland. Men's share is the biggest inSweden, even though men in Estonia, Slovenia, Hungary and Belgiumspend more time daily on domestic tasks than men in the rest of thecountries. Women's and men's shares of domestic work are moreequal in Sweden.
A difference between women and men is also observed in theproportions of persons who do any domestic work on an average day.Almost all women, but slightly fewer men do some domestic work perday.

Domestic work
46
5.2 Domestic activities of persons aged 20 to 74
BE DE EE FR HU SI FI SE UK NO
Hours and minutes per day
Women
Food preparation 1:01 0:49 1:21 1:06 1:27 1:25 0:55 0:50 0:59 0:50
Dish washing 0:22 0:21 0:26 0:20 0:30 0:28 0:15 0:21 0:18 0:21
Cleaning and upkeep 0:57 0:53 0:53 1:08 0:47 0:56 0:49 0:32 0:50 0:36
Laundry, ironing andhandicrafts 0:37 0:29 0:36 0:30 0:33 0:32 0:29 0:21 0:27 0:27
Gardening 0:06 0:09 0:14 0:09 0:19 0:25 0:08 0:10 0:07 0:09
Construction andrepairs 0:05 0:03 0:03 0:04 0:02 0:02 0:04 0:04 0:04 0:04
Shopping and services 0:36 0:38 0:29 0:37 0:25 0:21 0:32 0:29 0:39 0:27
Childcare 0:35 0:26 0:34 0:28 0:35 0:29 0:28 0:29 0:33 0:34
Other domestic 0:13 0:23 0:26 0:08 0:19 0:16 0:15 0:25 0:17 0:17
Domestic work total 4:32 4:11 5:02 4:30 4:57 4:57 3:56 3:42 4:15 3:47
BE DE EE FR HU SI FI SE UK NO
Hours and minutes per day
Men
Food preparation 0:22 0:16 0:22 0:18 0:14 0:17 0:21 0:25 0:26 0:23
Dish washing 0:10 0:08 0:06 0:06 0:04 0:04 0:04 0:10 0:09 0:08
Cleaning and upkeep 0:21 0:25 0:36 0:22 0:28 0:32 0:34 0:20 0:20 0:19
Laundry, ironing andhandicrafts 0:03 0:03 0:03 0:02 0:01 0:01 0:02 0:04 0:04 0:02
Gardening 0:17 0:10 0:12 0:18 0:31 0:32 0:06 0:11 0:12 0:10
Construction andrepairs 0:24 0:18 0:33 0:32 0:17 0:24 0:21 0:20 0:17 0:23
Shopping and services 0:26 0:28 0:21 0:27 0:16 0:16 0:26 0:22 0:24 0:21
Childcare 0:19 0:10 0:11 0:09 0:15 0:12 0:11 0:16 0:12 0:17
Other domestic 0:16 0:21 0:24 0:07 0:31 0:23 0:11 0:21 0:14 0:16
Domestic work total 2:38 2:21 2:48 2:21 2:39 2:39 2:16 2:29 2:18 2:22

Domestic work
47
EE SI HU BE FR UK DE FI NO SE0
60
120
180
240
300
360Minutes per day
5.2a Domestic activities of women aged 20 to 74
EE HU SI BE SE NO FR DE UK FI0
60
120
180
240
300
360 Minutes per day
5.2b Domestic activities of men aged 20 to 74
Food preparationDish washingCleaning and upkeep
Laundry, ironingand handicrafts
Gardening
ChildcareOther domestic
Shopping andservicesConstructionand repairs
Women and men involved in different domestic tasks
Domestic activities are gender segregated. Women do housework and caring, men do maintenance and repair work.With women, food preparation is the most time-consuming activity, especially in Hungary, Slovenia and Estonia. Cleaning andupkeep takes the second largest amount of time among women. Men are most active in cleaning and upkeep, constructionand repairs, and in shopping. Domestic activities are described in more detail on the next pages.

Domestic work
48
5.3 Food preparation among persons aged 20 to 74
BE DE EE FR HU SI FI SE UK NO
Hours and minutes per day
Total 0:42 0:33 0:55 0:43 0:53 0:52 0:39 0:38 0:43 0:36Women 1:01 0:49 1:21 1:06 1:27 1:25 0:55 0:50 0:59 0:50Men 0:22 0:16 0:22 0:18 0:14 0:17 0:21 0:25 0:26 0:23
Share of total time spent by women and by men, %
Women 73 75 79 79 86 83 72 67 69 68Men 27 25 21 21 14 17 28 33 31 32
Proportion of people who spent any time on the activity, % per day
Total 69 63 70 63 59 61 73 76 75 77Women 85 80 90 84 84 85 86 87 87 88Men 53 46 45 40 32 33 58 64 62 66
Average time by those who spent any time on the activity, hours and minutes per day
Women 1:12 1:01 1:30 1:19 1:44 1:40 1:04 0:57 1:08 0:57Men 0:42 0:35 0:49 0:45 0:44 0:52 0:36 0:39 0:42 0:35
Note: Food preparation comprises all activities connected with the preparation of meals, snacks, drinks, and so on.It also includes baking and preserving as well as setting the table and serving.

Domestic work
49
HU SI EE FR BE UK FI SE NO DE0
10
20
30
40
50
60
70
80
90Minutes per day
Women Men
5.3 Time spent on preparing food by personsaged 20 to 74
Food preparation is time consuming for women
Food preparation is a typical female task, especially in countries wheremore time is spent on it. Almost all women, but clearly fewer men,perform tasks connected with the preparing of food daily. In Sweden,Norway and the United Kingdom more men prepare meals per daythan in the other countries.
Food preparation is more equally shared between women and men inSweden, Norway and the United Kingdom than in the other countries.Nevertheless, even in these countries, the women's share of the totaltime spent on preparing meals is two thirds.
Women who prepare food spend more than one hour per day, onaverage, on it. In Hungary, Slovenia and Estonia, more time is spenton preparing food than in the other countries. Men who prepare mealsspend less time on it than women do – less than one hour during theday.

Domestic work
50
5.4 Dish washing among persons aged 20 to 74
BE DE EE FR HU SI FI SE UK NO
Hours and minutes per day
Total 0:16 0:15 0:17 0:13 0:18 0:16 0:10 0:16 0:13 0:14Women 0:22 0:21 0:26 0:20 0:30 0:28 0:15 0:21 0:18 0:21Men 0:10 0:08 0:06 0:06 0:04 0:04 0:04 0:10 0:09 0:08
Share of total time spent by women and by men, %
Women 69 72 81 77 88 88 79 68 67 72Men 31 28 19 23 12 12 21 32 33 28
Proportion of people who spent any time on the activity, % per day
Total 50 46 51 39 47 44 40 56 48 49Women 64 59 73 57 75 71 58 69 62 66Men 35 31 24 20 15 13 20 42 34 32
Average time by those who spent any time on the activity, hours and minutes per day
Women 0:34 0:36 0:36 0:35 0:40 0:39 0:26 0:30 0:29 0:32Men 0:29 0:26 0:25 0:30 0:27 0:31 0:20 0:24 0:26 0:25
Note: Dish washing also includes connected activities before and after washing up, for example, clearing the table after a meal and puttingthe rest of the food into the fridge, drying up, tidying away dishes, and loading and unloading the dishwasher.

Domestic work
51
HU SI EE BE DE SE NO FR UK FI0
10
20
30
40
50
60Minutes per day
Women Men
5.4 Time spent on dish washing by personsaged 20 to 74
Women responsible for dish washing
Like food preparation, dish washing is a typical female task. About twothirds of the women in the surveyed countries wash dishes on anaverage day compared to one third of men. It is most time consumingfor women in Hungary, Slovenia and Estonia, and least so in Finlandand the United Kingdom.
Women and men who washed dishes on an average day spent aboutthe same amount of time on it, about half-an-hour, on average.
Women do around three quarters of all washing of dishes. It is mostevenly shared between women and men in the United Kingdom,Sweden and Belgium.

Domestic work
52
5.5 Cleaning dwelling and other household upkeep among persons aged 20 to 74
BE DE EE FR HU SI FI SE UK NO
Cleaning dwelling Hours and minutes per dayWomen 0:48 0:39 0:37 1:00 0:37 0:40 0:26 0:30 0:38 0:33Men 0:13 0:11 0:11 0:12 0:08 0:08 0:08 0:15 0:11 0:14Other upkeepWomen 0:09 0:14 0:16 0:08 0:09 0:16 0:23 0:02 0:12 0:03Men 0:08 0:14 0:25 0:10 0:20 0:24 0:26 0:05 0:09 0:05
Cleaning dwelling Share of total time spent by women and by men, %Women 79 78 77 83 82 83 76 67 78 70Men 21 22 23 17 18 17 24 33 22 30Other upkeepWomen 53 50 39 44 31 40 47 29 57 38Men 47 50 61 56 69 60 53 71 43 62
Cleaning dwelling Proportion of people who spent any time on the activity, % per dayWomen 67 66 69 77 65 67 60 64 62 64Men 27 26 27 25 23 16 22 38 24 32
Note: Cleaning dwelling includes vacuuming, washing and waxing floors, washing windows, making beds, tidying, arranging the home, sorting papers, bottles, tins, and so on.The category of other household upkeep includes cleaning the yard, heating and water supply, and various arrangements at home, such as looking for lost items,packing and unpacking, or tending to houseplants.
Domestic work
53
FR BE SI DE EE UK FI HU NO SE0
10
20
30
40
50
60
70
80
90Minutes per day
Women Men
5.5 Time spent on cleaning and household upkeepby persons aged 20 to 74
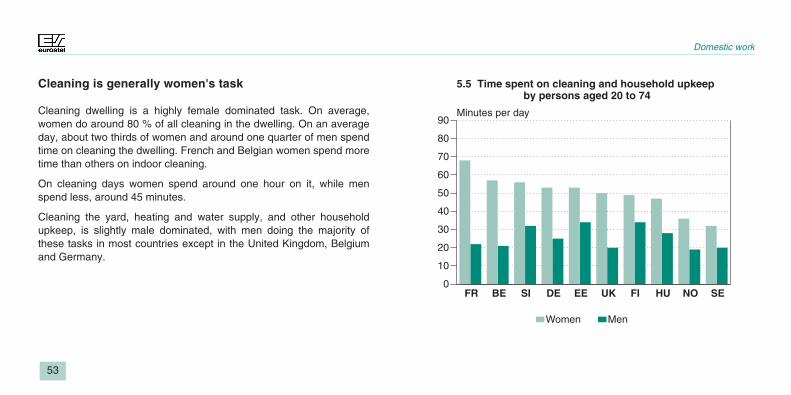
Cleaning is generally women's task
Cleaning dwelling is a highly female dominated task. On average,women do around 80 % of all cleaning in the dwelling. On an averageday, about two thirds of women and around one quarter of men spendtime on cleaning the dwelling. French and Belgian women spend moretime than others on indoor cleaning.
On cleaning days women spend around one hour on it, while menspend less, around 45 minutes.
Cleaning the yard, heating and water supply, and other householdupkeep, is slightly male dominated, with men doing the majority ofthese tasks in most countries except in the United Kingdom, Belgiumand Germany.

Domestic work
54
5.6 Laundering among persons aged 20 to 74
BE DE EE FR HU SI FI SE UK NO
Hours and minutes per day
Total 0:05 0:07 0:09 0:04 0:10 0:05 0:08 0:08 0:06 0:07Women 0:09 0:12 0:15 0:07 0:18 0:09 0:13 0:12 0:11 0:11Men 0:01 0:02 0:01 0:01 0:01 0:00 0:02 0:03 0:02 0:02
Share of total time spent by women and by men, %
Women 90 86 94 88 95 100 87 80 85 85Men 10 14 6 12 5 0 13 20 15 15
Proportion of people who spent any time on the activity, % per day
Total 18 19 14 12 14 15 24 20 20 24Women 30 32 24 21 26 27 39 33 33 40Men 5 6 3 2 2 2 8 8 6 8
Average time by those who spent any time on the activity, hours and minutes per day
Women 0:30 0:38 1:03 0:33 1:09 0:33 0:33 0:36 0:33 0:28Men 0:20 0:33 0:33 0:50 0:50 .. 0:25 0:38 0:33 0:25
Note: Laundry includes loading and unloading the washing machine, hand washing, hanging out and putting away laundry when not ironed or mangled.

Domestic work
55
HU EE FI DE SE UK NO BE SI FR0
5
10
15
20Minutes per day
Women Men
5.6 Time spent on laundry by personsaged 20 to 74
Women responsible for laundry
Women take care of most laundry work in all the compared countries.On an average day almost one third of women but fewer than one tenthof men wash clothes. Laundering is most frequent in Norwegian andFinnish households.
Women's share of doing the laundry varies from 80 to 100 % bycountry. It is rare for men to wash clothes in the countries surveyed.
Laundering takes around half-an-hour of both women's and men's timeon the days when they do it, except in Hungary and Estonia wherewomen spend an hour doing the laundry.

Domestic work
56
5.7 Ironing among persons aged 20 to 74
BE DE EE FR HU SI FI SE UK NO
Hours and minutes per day
Total 0:10 0:06 0:04 0:08 0:06 0:08 0:03 0:03 0:07 0:02Women 0:19 0:10 0:08 0:15 0:11 0:16 0:05 0:05 0:11 0:04Men 0:01 0:01 0:00 0:01 0:00 0:00 0:00 0:01 0:02 0:00
Share of total time spent by women and by men, %
Women 95 91 100 94 100 100 100 83 85 100Men 5 9 0 6 0 0 0 17 15 0
Proportion of people who spent any time on the activity, % per day
Total 16 10 8 12 9 14 8 7 13 8Women 29 18 14 23 17 25 13 12 22 14Men 3 2 1 2 1 1 2 2 5 2
Average time by those who spent any time on the activity, hours and minutes per day
Women 1:06 0:56 0:57 1:05 1:05 1:04 0:38 0:42 0:50 0:29
Note: Ironing also comprises mangling and connected tasks, such as folding and putting textiles into the wardrobe.

Domestic work
57
BE SI FR HU UK DE EE FI SE NO0
5
10
15
20Minutes per day
Women Men
5.7 Time spent on ironing by personsaged 20 to 74
Ironing men are exceptional
Ironing is an even more female dominated task than laundering. Meniron very seldom. On an average day, 1 to 5 % of men do ironing.
The frequency of ironing by women varies clearly between thecountries. Ironing is more common in Belgium, Slovenia, France andthe United Kingdom, where around 25 % of women do ironing on anaverage day. In Sweden, Finland, Norway and Estonia only one eighthof women are involved in ironing. Women spend about an hour on thedays they do ironing, except in Norway, Finland and Sweden wherehalf-an-hour or slightly more is spent.

Domestic work
58
5.8 Handicrafts among persons aged 20 to 74
BE DE EE FR HU SI FI SE UK NO
Hours and minutes per day
Total 0:05 0:03 0:07 0:04 0:01 0:04 0:05 0:02 0:03 0:05Women 0:09 0:06 0:12 0:08 0:02 0:07 0:10 0:03 0:05 0:10Men 0:00 0:00 0:00 0:00 0:00 0:01 0:00 0:00 0:00 0:00
Share of total time spent by women and by men, %
Women 95 99 97 100 99 88 100 96 95 100Men 5 1 3 0 1 12 0 4 5 0
Proportion of people who spent any time on the activity, % per day
Total 6 3 7 5 1 4 6 2 3 5Women 11 6 12 10 1 7 11 4 5 10Men 0 0 0 0 0 0 0 0 0 0
Average time by those who spent any time on the activity, hours and minutes per day
Women 1:21 1:34 1:41 1:23 .. 1:40 1:35 1:22 1:46 1:40
Note: Handicrafts and care for textiles consists of making new products, such as knitting, needlework, sewing by machine or hand, or weaving. Repairing and caringfor clothes and shoes also come under this category. Handicrafts as a simultaneous activity, for example,. while watching television, is not included.

Domestic work
59
EE FI NO BE FR SI DE UK SE HU0
5
10
15
20Minutes per day
Women Men
5.8 Time spent on handicrafts by persons aged 20 to 74Handicrafts is in women's hands
Handicrafts is almost entirely a women's task. However, the time spenton it by country differs. Handicrafts is most common among women inEstonia, Norway, Finland and Belgium, and least so in Hungary,Sweden and the United Kingdom.
Even though the average time spent on handicrafts is low for allwomen, those doing it spend a lot of time on it. The average time spentby its performers is around one-and-a-half hours per day. Thisdescribes handicrafts as a primary activity only. Handicrafts is alsodone as simultaneous activity, for example, while watching television.This has not been included here but it would increase the total timespent on handicrafts.

Domestic work
60
5.9 Gardening among persons aged 20 to 74
BE DE EE FR HU SI FI SE UK NO
Hours and minutes per day
Total 0:11 0:09 0:13 0:13 0:25 0:28 0:07 0:11 0:10 0:10Women 0:06 0:09 0:14 0:09 0:19 0:25 0:08 0:10 0:07 0:09Men 0:17 0:10 0:12 0:18 0:31 0:32 0:06 0:11 0:12 0:10
Share of total time spent by women and by men, %
Women 26 47 55 33 37 44 57 48 37 47Men 74 53 45 67 63 56 43 52 63 53
Proportion of people who spent any time on the activity, % per day
Total 12 13 11 13 15 22 9 17 11 14Women 9 15 13 12 13 23 11 22 10 16Men 16 11 9 15 17 21 7 12 12 13
Average time by those who spent any time on the activity, hours and minutes per day
Women 1:10 0:55 1:53 1:18 2:21 1:49 1:11 0:47 1:13 0:56Men 1:48 1:25 2:09 2:02 3:01 2:32 1:32 1:34 1:40 1:17
Note: Gardening includes all kinds of work in the kitchen garden – tending and harvesting vegetables, potatoes, and so on. It also comprisestending to outdoor plants and flowers, mowing the lawn, and so on.

Domestic work
61
SI HU EE SE FR NO DE FI UK BE0
10
20
30
40
50
60Minutes per day
Women Men
5.9 Time spent on gardening by personsaged 20 to 74
Gardening takes much time of its performers
The examined countries differ clearly in time spent on gardening. Mostgardening work is done by people in Slovenia and Hungary, whileclearly less gardening is done in the other countries.
Gardening work is not a self-evident male task. Men do moregardening than women in Belgium, France, Hungary, the UnitedKingdom and Slovenia, but the same amount as women in the othercountries.
When looking at those who do gardening during a day, men spend onaverage more time than women on it, one to three hours, with mosttime spent in Hungary and Slovenia. On the days women dogardening, they spend three quarters of an hour to two-and-a-halfhours on it, with women in Hungary spending the most time.

Domestic work
62
5.10 Construction and repairs among persons aged 20 to 74
BE DE EE FR HU SI FI SE UK NO
Hours and minutes per day
Total 0:15 0:11 0:17 0:18 0:09 0:13 0:12 0:12 0:11 0:14Women 0:05 0:03 0:03 0:04 0:02 0:02 0:04 0:04 0:04 0:04Men 0:24 0:18 0:33 0:32 0:17 0:24 0:21 0:20 0:17 0:23
Share of total time spent by women and by men, %
Women 19 15 8 11 10 8 16 18 20 15Men 81 85 92 89 90 92 84 82 80 85
Proportion of people who spent any time on the activity, % per day
Total 15 12 14 14 6 12 12 13 11 12Women 9 5 3 5 1 3 6 7 6 5Men 21 19 27 23 11 21 20 19 16 19
Average time by those who spent any time on the activity, hours and minutes per day
Women 0:59 1:03 1:33 1:27 .. 1:07 1:09 1:01 1:10 1:20Men 1:54 1:36 2:02 2:20 2:29 1:54 1:47 1:44 1:46 2:01
Note: Construction and repairs comprise all kinds of major construction, renovation and repairs of the dwelling, garage or outhouse,as well as indoor repairs, making and repairing equipment, and vehicle maintenance, and so on.

Domestic work
63
BE FR NO FI SE UK EE DE SI HU0
10
20
30
40
50
60Minutes per day
Women Men
5.10 Time spent on construction and repairsby persons aged 20 to 74
Men do almost all construction and repairs
The most typical male tasks in the households are construction andrepairs. Men take care of 80 to 90 % of these tasks in the countriessurveyed. Most time on construction and repairs is spent in France andEstonia. One fifth of men but only one out of 20 women were involvedin some repairing work on an average day.
Even though the average amount of time spent on these activities islow, a lot of time is spent on them on the days they are done. Whenmen do them they spend on average 90 minutes to two-and-a-halfhours on them, while women spend around an hour.

Domestic work
64
5.11 Shopping and services among persons aged 20 to 74
BE DE EE FR HU SI FI SE UK NO
Hours and minutes per day
Total 0:31 0:33 0:26 0:32 0:21 0:19 0:29 0:26 0:32 0:24Women 0:36 0:38 0:29 0:37 0:25 0:21 0:32 0:29 0:39 0:27Men 0:26 0:28 0:21 0:27 0:16 0:16 0:26 0:22 0:24 0:21
Share of total time spent by women and by men, %
Women 58 57 58 58 61 57 55 57 62 56Men 42 43 42 42 39 43 45 43 38 44
Proportion of people who spent any time on the activity, % per day
Total 49 47 50 43 43 33 54 49 45 54Women 53 53 60 49 53 39 58 54 52 58Men 44 42 40 36 32 28 50 44 38 49
Average time by those who spent any time on the activity, hours and minutes per day
Women 1:07 1:11 0:49 1:15 0:48 0:54 0:55 0:54 1:15 0:47Men 0:59 1:07 0:54 1:15 0:51 0:57 0:53 0:50 1:02 0:43
Note: Shopping includes purchasing consumer and capital goods, browsing at shops or markets. Services include visiting public offices,and commercial or personal services. Trips connected with shopping are excluded when separated in the diary.
Domestic work
65
UK DE FR BE FI SE EE NO HU SI0
10
20
30
40
50
60Minutes per day
Women Men
5.11 Time spent on shopping and servicesby persons aged 20 to 74
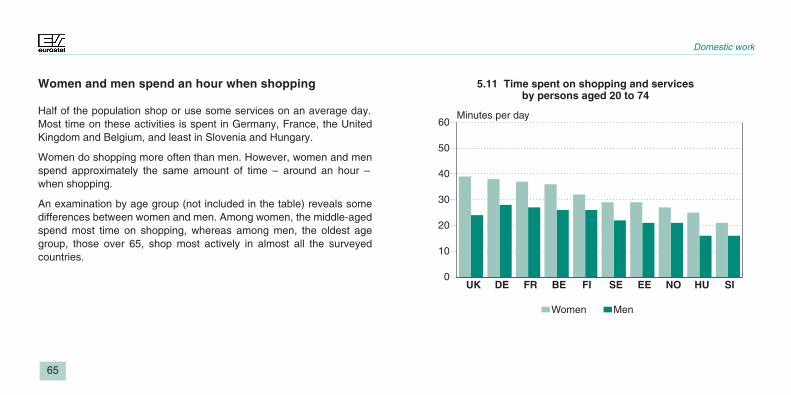
Women and men spend an hour when shopping
Half of the population shop or use some services on an average day.Most time on these activities is spent in Germany, France, the UnitedKingdom and Belgium, and least in Slovenia and Hungary.
Women do shopping more often than men. However, women and menspend approximately the same amount of time – around an hour –when shopping.
An examination by age group (not included in the table) reveals somedifferences between women and men. Among women, the middle-agedspend most time on shopping, whereas among men, the oldest agegroup, those over 65, shop most actively in almost all the surveyedcountries.

Domestic work
66
5.12 Childcare among parents living as couple with children aged up to 6
BE DE EE FR HU SI FI SE UK NO
All parents living as couple Hours and minutes per dayTotal 1:21 1:39 1:46 1:19 2:03 1:39 1:50 1:39 1:41 1:44Women 1:54 2:18 2:39 1:57 2:56 2:23 2:34 2:10 2:22 2:17Men 0:51 0:59 0:50 0:40 1:11 0:56 1:03 1:07 1:00 1:13
Share of total time spent by women and by men, %Women 69 70 76 75 71 72 71 66 70 65Men 31 30 24 25 29 28 29 34 30 35
Proportion of people who spent any time on the activity, % per dayTotal 82 84 77 73 82 77 84 88 82 89Women 94 95 93 91 94 91 96 96 94 97Men 70 73 59 55 69 62 72 79 70 80
Employed parents living as couple Hours and minutes per dayWomen 1:40 1:44 1:40 1:41 1:58 2:16 2:02 2:08 2:08 2:11Men 0:50 0:57 0:50 0:37 1:09 0:55 1:01 1:07 0:58 1:12
Note: Childcare includes of active care given to a child living in own household.In addition to physical care, teaching, reading, playing and talking with a child, accompanyinga child to a doctor, visiting the school, and so on, are also included. Going together to the cinema, watching television with a child, and so on, are excluded.Only parents living as a couple are included.Childcare as a simultaneous activity, for example, while preparing food, is not included.
Domestic work
67
HU EE FI SI UK DE NO SE FR BE0
30
60
90
120
150
180Minutes per day
Women Men
5.12 Time spent on childcare by parents living as couplewith children aged up to 6
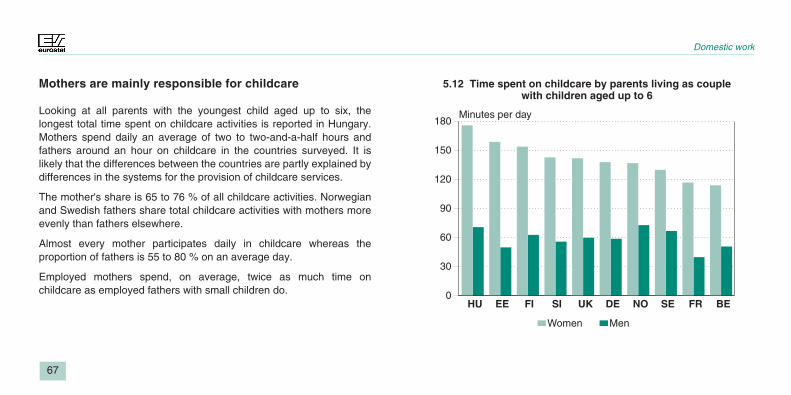
Mothers are mainly responsible for childcare
Looking at all parents with the youngest child aged up to six, thelongest total time spent on childcare activities is reported in Hungary.Mothers spend daily an average of two to two-and-a-half hours andfathers around an hour on childcare in the countries surveyed. It islikely that the differences between the countries are partly explained bydifferences in the systems for the provision of childcare services.
The mother's share is 65 to 76 % of all childcare activities. Norwegianand Swedish fathers share total childcare activities with mothers moreevenly than fathers elsewhere.
Almost every mother participates daily in childcare whereas theproportion of fathers is 55 to 80 % on an average day.
Employed mothers spend, on average, twice as much time onchildcare as employed fathers with small children do.

Domestic work
68
5.13 Childcare among parents living as couple with youngest child aged 7 to 17
BE DE EE FR HU SI FI SE UK NO
All parents living as couple Hours and minutes per dayTotal 0:24 0:22 0:19 0:20 0:30 0:13 0:14 0:32 0:20 0:19Women 0:32 0:32 0:28 0:30 0:40 0:19 0:19 0:39 0:26 0:28Men 0:16 0:13 0:10 0:09 0:21 0:07 0:09 0:24 0:12 0:11
Share of total time spent by women and by men, %Women 66 70 73 77 66 73 68 61 68 72Men 34 30 27 23 34 27 32 39 32 28
Proportion of people who spent any time on the activity, % per dayTotal 39 39 39 31 37 23 35 58 36 35Women 49 52 52 45 47 31 46 66 47 48Men 29 27 24 18 28 14 22 48 25 24
Employed parents living as couple Hours and minutes per dayWomen 0:29 0:26 0:26 0:25 0:32 0:17 0:17 0:38 0:23 0:26Men 0:16 0:14 0:10 0:09 0:20 0:07 0:09 0:25 0:12 0:11
Note: Childcare includes active care given to a child living in own household. In addition to physical care, teaching, reading, playing and talking with a child, accompanyinga child to a doctor, visiting the school, and so on, are also included. Going together to cinema, watching television with a child, and so on, are excluded.Only parents living as a couple are included.Childcare as a simultaneous activity, for example, while preparing food is not included.

Domestic work
69
HU SE BE DE FR EE NO UK SI FI0
10
20
30
40
50
60Minutes per day
Women Men
5.13 Time spent on childcare by parents living as couplewith youngest child aged 7 to 17
Clear drop in childcare when children go to school
Parents with the youngest child of school age spend clearly less timeon childcare than parents with small children do. Mothers spend anaverage of half-an-hour and fathers 10 to 20 minutes per day onchildcare. Half of the mothers and one quarter of the fathers reportsome childcare activity on an average day.
Swedish fathers have a more active role than fathers in the othersurveyed countries. They report more participation in childcare morefrequently and more time spent on it. Swedish fathers seem to accountfor almost 40 % of all childcare time in the family whereas in the othersurveyed countries, the fathers' share of childcare time is around 30 %.

5.14 Time spent by parents with children aged up to 9
DE SI FI SE UK NO
Hours and minutes per day
All parentsTotal 5:37 5:14 6:21 6:06 7:03 5:24Women 6:58 6:09 7:57 7:10 8:35 6:19Men 4:06 4:07 4:24 4:56 5:10 4:22
Employed parentsTotal 3:58 5:02 5:35 5:56 6:19 5:10Women 6:00 5:55 7:08 7:01 7:44 6:04Men 4:46 4:05 4:18 4:50 5:09 4:20
Note: Time spent with children aged up to nine living in the same household was measured with a separate diary column. Being together covered doingthings together, or just being in the same place or room as the child. Sleeping time was excluded.Minor differences in the measurement of time spent with children occurred between the countries that limit accurate cross-national comparisons,for example, in the United Kingdom, being together covered being in the same house, which may have resulted in over-reporting.This table includes parents with children aged up to 9.
Domestic work
70

Domestic work
71
UK FI SE DE SI NO0
60
120
180
240
300
360
420
480
540Minutes per day
Women Men
5.14 Time spent with children up to 9 by all parentsMothers spend two to three hours more per daywith children than fathers do
Mothers spend on an average day six to eight-and-a-half hours andfathers between four and five hours with their children aged up to ninewhen all parents are observed. National differences are probablyclosely linked to the employment patterns and systems for the provisionof childcare services.
Looking only at employed parents, it is clear that employed mothersspend daily somewhat more time with their children than employedfathers do. This is linked with, for example, shorter average workinghours of women.

TOTAL HOURS WORKED
73

Total hours worked
74
6.1 Gainful and domestic work of persons aged 20 to 74
BE DE EE FR HU SI FI SE UK NO
Women Hours and minutes per dayGainful work 1:53 1:52 2:27 2:17 2:19 2:42 2:33 2:53 2:24 2:38Domestic work 4:32 4:11 5:02 4:30 4:57 4:57 3:56 3:42 4:15 3:47Work total 6:25 6:03 7:29 6:47 7:16 7:39 6:29 6:36 6:39 6:25MenGainful work 3:15 3:20 3:35 3:48 3:34 3:54 3:48 4:11 4:10 4:04Domestic work 2:38 2:21 2:48 2:21 2:39 2:39 2:16 2:29 2:18 2:22Work total 5:53 5:41 6:23 6:09 6:13 6:33 6:04 6:41 6:29 6:26
Women Shares of gainful and domestic work, %Gainful work 29 31 33 34 32 35 39 44 36 41Domestic work 71 69 67 66 68 65 61 56 64 59Work total 100 100 100 100 100 100 100 100 100 100MenGainful work 56 59 56 62 57 60 63 63 65 63Domestic work 44 41 44 38 43 40 37 37 35 37Work total 100 100 100 100 100 100 100 100 100 100
Note: Gainful work includes hours worked in first and second jobs, overtime, work brought home, training during working hours and business trips.Working hours do not include lunch breaks and daily travel to and from work.Domestic work includes work done for own household. The most important categories are food management, care for textiles, cleaning andhousehold upkeep, gardening, repairs, childcare and shopping.

Total hours worked
75
Majority of women's work is unpaid
Total hours worked consists of gainful and domestic work. In most ofthe surveyed countries women's total hours exceed those of men.Norway, Sweden and the United Kingdom are exceptions with almostequal hours. Women in Slovenia, Estonia and Hungary have thelongest total work hours.
A greater part of women's work consists of unpaid domestic work.Around two thirds of all work done by women is unpaid, while themajority of the work done by men is paid work.
0 60 120 180 240 300 360 420 480 540 600
Minutes per day
Gainful work Domestic work
WM
M
HUM
FRM
UKM
SEM
FIM
BEM
NOM
DEM
SI
EEW
W
W
W
W
W
W
W
W
6.1 Gainful and domestic work of persons aged 20 to74

Total hours worked
76
6.2 Gainful and domestic work of parents living as couple with youngest child aged up to 6
BE DE EE FR HU SI FI SE UK NO
Hours and minutes per dayWomenGainful work 2:38 1:12 2:03 2:13 1:31 3:01 2:14 2:17 2:00 2:15Domestic work 5:27 6:11 6:51 5:49 7:33 6:15 6:05 5:29 6:09 5:26Work total 8:05 7:23 8:54 8:02 9:04 9:16 8:19 7:45 8:10 7:41MenGainful work 4:47 4:32 4:32 4:55 4:47 5:38 5:15 4:53 5:33 4:47Domestic work 2:57 3:00 2:41 2:30 3:11 2:54 2:48 3:21 2:46 3:12Work total 7:44 7:32 7:13 7:25 7:58 8:32 8:03 8:14 8:19 7:59
Shares of gainful and domestic work, %WomenGainful work 33 16 23 28 17 33 27 29 25 29Domestic work 67 84 77 72 83 67 73 71 75 71Work total 100 100 100 100 100 100 100 100 100 100MenGainful work 62 60 63 66 60 66 65 59 67 60Domestic work 38 40 37 34 40 34 35 41 33 40Work total 100 100 100 100 100 100 100 100 100 100
Note: See Table 6.1.

Total hours worked
77
SI
HU
EE
FI
UK
BE
FR
SE
NO
DE
0 60 120 180 240 300 360 420 480 540 600
Minutes per day
Gainful work Domestic work
WM
M
M
M
M
M
M
M
M
M
W
W
W
W
W
W
W
W
W
6.2 Gainful and domestic work of parents living as couplewith children up to 6
Small children intensify the traditional work divisionbetween women and men
Parents with small children have longer working hours. Their totalworking time per day is between one and two hours longer than theaverage for persons aged 20 to 74. Mothers do more total hours thanfathers in Estonia, Finland, Hungary, Slovenia, France and Belgium.Fathers work more hours in Sweden, Norway, the United Kingdom andGermany.
Mothers with small children spend between 70 and 85 % of their totalworking hours on domestic tasks. In this family phase, they seemclearly to reduce their hours in gainful work. A similar connectionbetween gainful and domestic work cannot be seen in fathers' timeuse. They work mainly full-time irrespective of the age of the children.In France, Estonia, Sweden and Germany,however, fathers with smallchildren work shorter hours in gainful work than fathers with childrenaged above seven. The opposite seems to be the case in Slovenia, theUnited Kingdom and Finland, where fathers with small children worklonger hours than fathers with older children.

Total hours worked
78
6.3 Gainful and domestic work of parents living as couple with youngest child aged 7 to 17
BE DE EE FR HU SI FI SE UK NO
Hours and minutes per dayWomenGainful work 2:13 2:17 3:35 2:56 3:35 4:17 3:51 3:54 3:07 3:29Domestic work 5:04 4:44 4:50 5:00 5:24 4:39 3:59 3:58 4:21 3:43Work total 7:17 7:01 8:25 7:56 8:59 8:56 7:50 7:52 7:28 7:12MenGainful work 4:38 4:46 4:52 5:19 4:51 5:12 5:01 5:09 5:09 4:46Domestic work 2:28 2:10 2:26 2:12 2:44 2:22 2:18 2:34 2:15 2:28Work total 7:06 6:56 7:18 7:31 7:35 7:34 7:19 7:43 7:24 7:14
Shares of gainful and domestic work, %WomenGainful work 30 33 43 37 40 48 49 50 42 48Domestic work 70 67 57 63 60 52 51 50 58 52Work total 100 100 100 100 100 100 100 100 100 100MenGainful work 65 69 67 71 64 69 69 67 70 66Domestic work 35 31 33 29 36 31 31 33 30 34Work total 100 100 100 100 100 100 100 100 100 100
Note: See Table 6.1.

Total hours worked
79
HU
SI
EE
FR
SE
FI
UK
BE
NO
DE
0 60 120 180 240 300 360 420 480 540 600
Minutes per day
Gainful work Domestic work
WM
M
M
M
M
M
M
M
M
M
W
W
W
W
W
W
W
W
W
6.3 Gainful and domestic work of parents living as couplewith youngest child aged 7 to 17
Mothers increase gainful hours when children get older
Compared with parents having young children, the total working hoursare shorter for parents with children aged 7 to 17. This is true formothers as well as fathers.
With mothers, the reduction of domestic work is marked. Fathers alsoreduce the time spent on domestic tasks when children grow older, butthe reduction is not as clear as with mothers. In most countries, womenincrease hours in gainful work when the youngest child reaches schoolage. This happens in all other countries surveyed except in Belgiumwhere mothers with young children are more active on the labourmarket than mothers with older children. For fathers, there is no clearpattern.
Mothers with school age children spend between 50 and 70 % of totalworking hours on domestic work. The corresponding proportion forfathers is about 30 %.

Total hours worked
80
6.4 Gainful and domestic work of single women with children aged up to 17
BE DE EE FR HU SI FI SE UK NO
Hours and minutes per day
Gainful work 2:30 2:22 3:26 2:55 3:25 2:51 2:39 3:29 1:59 2:16Domestic work 4:47 4:50 4:51 4:42 5:11 5:31 4:18 3:52 4:52 4:04Work total 7:17 7:12 8:17 7:37 8:36 8:22 6:57 7:21 6:51 6:20
Shares of gainful and domestic work, %
Gainful work 34 33 41 38 40 34 38 47 29 36Domestic work 66 67 59 62 60 66 62 53 71 64Work total 100 100 100 100 100 100 100 100 100 100
Note: See Table 6.1.

Total hours worked
81
HU
SI
EE
FR
SE
BE
DE
FI
UK
NO
0 60 120 180 240 300 360 420 480 540 600
Minutes per day
Gainful work Domestic work
6.4 Gainful and domestic work of single womenwith children up to 17
Total working hours of single mothers not higherthan that of mothers living as a couple
The time spent on gainful work by single mothers varies by country.Most time is spent in Sweden, Estonia and Hungary. Time spent ondomestic work by single mothers is roughly the same as that spent bymothers with youngest child aged 7 to 17.
The total working hours of single mothers do not exceed those ofmothers living as a couple. They seem to be slightly lower in most ofthe surveyed countries. The total working time per average day isabove eight hours among single mothers in Hungary, Slovenia andEstonia. Less than seven hours are worked by single mothers inNorway, the United Kingdom and Finland.

FREE TIME
83

Free time
84
7.1 Free time activities of women aged 20 to 74
BE DE EE FR HU SI FI SE UK NO
Women Hours and minutes per dayTelevision and videos 2:09 1:41 2:11 1:55 2:37 1:44 2:02 1:40 2:09 1:39Socialising 0:50 1:09 0:37 0:44 0:40 0:57 0:54 1:07 1:00 2:04Reading 0:26 0:38 0:38 0:23 0:22 0:23 0:47 0:35 0:25 0:39Sports and exercise 0:15 0:28 0:17 0:23 0:13 0:26 0:28 0:25 0:11 0:28Resting 0:28 0:20 0:18 0:06 0:22 0:30 0:20 0:25 0:23 0:12Hobbies and games 0:14 0:25 0:06 0:11 0:08 0:07 0:13 0:19 0:15 0:15Volunteer work andhelp 0:10 0:15 0:13 0:14 0:08 0:06 0:16 0:12 0:14 0:10Entertainment andculture 0:09 0:14 0:05 0:05 0:03 0:04 0:05 0:06 0:06 0:06Other or unspecified 0:09 0:09 0:10 0:05 0:07 0:10 0:11 0:09 0:10 0:14Free time total 4:50 5:19 4:35 4:06 4:40 4:27 5:16 4:57 4:53 5:47
BE DE EE FR HU SI FI SE UK NO
Percentage of total free time, %Television and videos 45 32 48 47 56 39 39 34 44 29Socialising 17 22 13 18 14 21 17 23 21 34Reading 9 12 14 9 8 9 15 11 9 11Sports and exercise 5 9 6 9 5 10 9 8 4 8Resting 10 6 7 2 8 11 6 8 8 4Hobbies and games 5 8 2 5 3 3 4 6 5 4Volunteer work andhelp 3 5 5 6 3 2 5 4 5 3Entertainment andculture 3 4 2 2 1 2 2 2 2 4Other or unspecified 3 3 4 2 3 4 4 3 3 4Free time total 100 100 100 100 100 100 100 100 100 100
Note: Volunteer work and informal help are included in free time.In this summary table, walking the dog is not included in sports and outdoor activitiesas in Table 7.6.Hobbies and games include use of computer during free time and all kinds of hobbies,for example, performing arts, writing, collecting and playing games. Only computing isanalysed more closely in this publication.
Socialising is not comparable between Norway and the other countries because reportingconversation as main activity was encouraged by diary instruction in Norway but not elsewhere.Resting is not comparable between France and the other countries because of a coding difference.A long time period spent on rest was coded as sleep in France but as rest in the other countries ifnot specifically reported as sleep. This produces an underestimation of total free time in France.Unspecified time use is not here included in free time as in Chapter 1.

Free time
85
NO DE FI SE UK BE HU EE SI FR0
60
120
180
240
300
360Minutes per day
Television andvideos
SocialisingReading
Sports and exerciseRestingHobbies and games
Volunteer work and helpEntertainment and cultureOther or unspecified
7.1 Free time activities of women aged 20 to 74Women have four to five hours of free time per day
Free time is defined as the time that remains when sleep, meals andother personal care, gainful and domestic work, and daily travel areaccounted for. The amount of free time for women is around four to fivehours on an average day of the year.
Watching television takes the lion's share of free time, for women,between 29 and 56 % of the free time total in the countries surveyed.Socialising with family and friends comes next, taking around 20 % ofthe free time. The time spent on reading, around 10 %, exceeds slightlythe time spent on sports and outdoor activities.
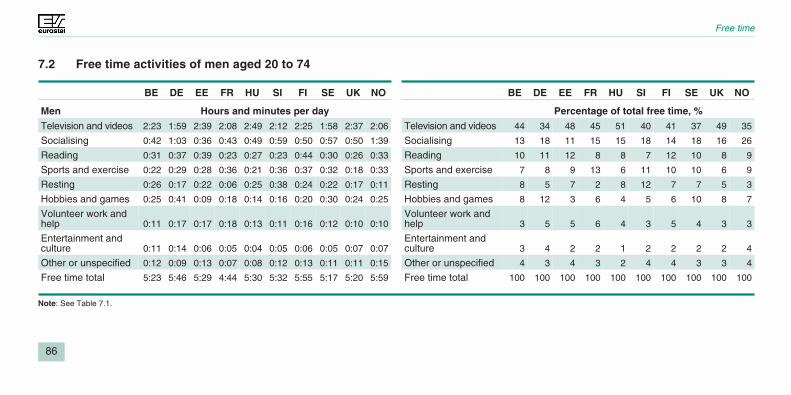
Free time
8686
7.2 Free time activities of men aged 20 to 74
BE DE EE FR HU SI FI SE UK NO
Men Hours and minutes per day
Television and videos 2:23 1:59 2:39 2:08 2:49 2:12 2:25 1:58 2:37 2:06
Socialising 0:42 1:03 0:36 0:43 0:49 0:59 0:50 0:57 0:50 1:39
Reading 0:31 0:37 0:39 0:23 0:27 0:23 0:44 0:30 0:26 0:33
Sports and exercise 0:22 0:29 0:28 0:36 0:21 0:36 0:37 0:32 0:18 0:33
Resting 0:26 0:17 0:22 0:06 0:25 0:38 0:24 0:22 0:17 0:11
Hobbies and games 0:25 0:41 0:09 0:18 0:14 0:16 0:20 0:30 0:24 0:25
Volunteer work andhelp 0:11 0:17 0:17 0:18 0:13 0:11 0:16 0:12 0:10 0:10
Entertainment andculture 0:11 0:14 0:06 0:05 0:04 0:05 0:06 0:05 0:07 0:07
Other or unspecified 0:12 0:09 0:13 0:07 0:08 0:12 0:13 0:11 0:11 0:15
Free time total 5:23 5:46 5:29 4:44 5:30 5:32 5:55 5:17 5:20 5:59
BE DE EE FR HU SI FI SE UK NO
Percentage of total free time, %
Television and videos 44 34 48 45 51 40 41 37 49 35
Socialising 13 18 11 15 15 18 14 18 16 26
Reading 10 11 12 8 8 7 12 10 8 9
Sports and exercise 7 8 9 13 6 11 10 10 6 9
Resting 8 5 7 2 8 12 7 7 5 3
Hobbies and games 8 12 3 6 4 5 6 10 8 7
Volunteer work andhelp 3 5 5 6 4 3 5 4 3 3
Entertainment andculture 3 4 2 2 1 2 2 2 2 4
Other or unspecified 4 3 4 3 2 4 4 3 3 4
Free time total 100 100 100 100 100 100 100 100 100 100
Note: See Table 7.1.

Free time
87
NO FI DE SI HU EE BE UK SE FR0
60
120
180
240
300
360 Minutes per day
Television andvideos
SocialisingReading
Sports and exerciseRestingHobbies and games
Volunteer work and helpEntertainment and cultureOther or unspecified
7.2 Free time activities of men aged 20 to 74Men have over five hours of free time per day
On an average day, men have around five to five-and-a-half hours offree time, around half-an-hour more than women.
Relative to the total amount of free time, the share of watchingtelevision, 34 to 51 %, is almost the same for men and women eventhough men spend more time watching television in all the countriessurveyed. Socialising is the second largest free time activity. Itaccounts for a slightly smaller proportion of the free time of men than ofwomen. In most countries reading is the third largest, taking up around10 % of men's total free time. Sports and exercise play a moreprominent role in men's than in women's free time. The same is true forhobbies and games, especially because of differences in the time spenton computing as seen in Table 7.7.

Free time
88
7.3 Watching television and videos among persons aged 20 to 74
BE DE EE FR HU SI FI SE UK NO
Hours and minutes per day
Total 2:16 1:50 2:24 2:01 2:43 1:58 2:13 1:49 2:23 1:52Women 2:09 1:41 2:11 1:55 2:37 1:44 2:02 1:40 2:09 1:39Men 2:23 1:59 2:39 2:08 2:49 2:12 2:25 1:58 2:37 2:06
Proportion of people who spent any time on the activity, % per day
Total 84 78 86 77 88 85 86 82 87 83Women 84 76 86 76 88 83 86 81 86 82Men 85 80 86 78 87 87 86 83 87 84
Average time by those who spent any time on the activity, hours and minutes per day
Total 2:42 2:21 2:47 2:37 3:05 2:19 2:35 2:13 2:44 2:15Women 2:34 2:13 2:32 2:31 2:58 2:05 2:22 2:03 2:30 2:01Men 2:48 2:28 3:05 2:44 3:14 2:32 2:49 2:22 3:00 2:30
Note: Watching television and videos as a simultaneous activity is not included.

Free time
89
HU EE BE UK FI FR SI DE SE NO0
60
120
180Minutes per day
Women Men
7.3 Time spent on watching television and videosby persons aged 20 to 74
Men watch more television than women do
In all the surveyed countries, men spend more time watching televisionand videos than women do. However, in most countries the proportionof those who watch television on an average day is nearly the sameamong women and men.
Men watch television at least two hours per day in all the surveyedcountries, and women, at least two hours in half of the surveyedcountries. In Hungary, Estonia and the United Kingdom, men watchtelevision over two-and-a-half hours, but in Sweden and Germanyaround two hours per day.
Among women, the Hungarians watch television most, aroundtwo-and-a-half hours per day. Women watch television least in Norway,Sweden, Germany and Slovenia, slightly over one-and-a-half hours.

Free time
9090
7.4 Socialising among persons aged 20 to 74
BE DE EE FR HU SI FI SE UK
Hours and minutes per day
Total 0:46 1:06 0:36 0:44 0:44 0:58 0:52 1:02 0:55Women 0:50 1:09 0:37 0:44 0:40 0:57 0:54 1:07 1:00Men 0:42 1:03 0:36 0:43 0:49 0:59 0:50 0:57 0:50
Proportion of people who spent any time on the activity, % per day
Total 54 70 .. 45 47 63 59 68 60Women 58 73 .. 48 45 65 66 76 66Men 49 67 .. 42 49 61 52 60 53
Note: Socialising includes visits and parties, phone calls and conversation with family, relatives or friends when no other activities are mentioned.Discussions while eating, watching television, and so on, are not included in socialising but in the activity done simultaneously.Norway is excluded because reporting conversation as main activity was encouraged by diary instructions in Norway but not elsewhere.

Free time
91
DE SE UK SI FI BE FR HU EE0
10
20
30
40
50
60
70Minutes per day
Women Men
7.4 Time spent on socialising by persons aged 20 to 74Socialising is an essential part of free time
Social life is easily forgotten in descriptions of how people spend theireveryday life. However, pure socialising fills one fifth of entire free time.Germans and Swedes seem to spend more time on socialising thanpeople in the other countries. Women spend slightly more time onsocialising than men in most of the compared countries, except forFrance, Estonia, and Slovenia where no difference between womenand men was found. In Hungary, men spend more time on socialisingthan women do.
A large part of what is normally thought of as socialising is linked towork, meals and other activities. It is not included here and in order toget a more complete view of the total time spent on social life it wouldbe necessary to also analyse socialising as a simultaneous activity.

Free time
9292
7.5 Reading among persons aged 20 to 74
BE DE EE FR HU SI FI SE UK NO
Hours and minutes per dayTotalReading books .. 0:07 0:17 .. 0:09 0:07 0:12 0:11 0:06 0:09
Other reading .. 0:30 0:22 .. 0:15 0:16 0:34 0:21 0:20 0:27
Reading total 0:29 0:37 0:39 0:23 0:24 0:23 0:46 0:33 0:26 0:36
WomenReading books .. 0:08 0:18 .. 0:10 0:09 0:14 0:13 0:07 0:11
Other reading .. 0:30 0:20 .. 0:12 0:14 0:33 0:21 0:18 0:28
Reading total 0:26 0:38 0:38 0:23 0:22 0:23 0:47 0:35 0:25 0:39
MenReading books .. 0:06 0:15 .. 0:08 0:04 0:09 0:09 0:05 0:07
Other reading .. 0:31 0:24 .. 0:19 0:19 0:35 0:21 0:21 0:26
Reading total 0:31 0:37 0:39 0:23 0:27 0:23 0:44 0:30 0:26 0:33
BE DE EE FR HU SI FI SE UK NO
Proportion of people who spent any time on the activity, % per dayTotalReading books .. 11 20 .. 10 9 16 19 11 16
Other reading .. 54 40 .. 27 31 64 46 36 55
WomenReading books .. 13 24 .. 10 13 20 23 13 20
Other reading .. 56 39 .. 21 27 65 49 36 59
MenReading books .. 9 16 .. 9 5 13 13 8 12
Other reading .. 53 41 .. 33 34 62 44 37 52
Note Reading includes reading books, newspapers, magazines, brochures, advertisements,and so on. Reading connected with work is included in employment, and reading foran exam is included in studies.Reading as a simultaneous activity, for instance reading whilst travelling, is not included.
In Belgium and France, reading books was not separated from other reading. To some extent, otherreading may include reading books in the other countries, too. This could lead to underestimation ofthe time used for reading books.

Free time
93
FI NO DE EE SE BE UK FR SI HU0
10
20
30
40
50Minutes per day
Women Men
7.5 Time spent on reading by persons aged 20 to 74Differences between countries in time used for reading
There are differences among Europeans in the amount of time used forreading. The time spent on it ranges from 23 to 46 minutes per averageday. The longest time used for reading is in Finland.
Women spend more time than men on reading in Norway, Sweden andFinland. The situation is the opposite in Belgium and Hungary, where men usemore time for reading than women. In France, Slovenia, Germany, Estoniaand the United Kingdom, there is no clear difference between men andwomen.
Women devote more time than men to reading books in all the countries thathad recorded reading books separately. In most of the surveyed countries,men use more time than women for reading something other than books.
Persons who read books do so between about 55 minutes and about onehour and 35 minutes per day.
Reading is also done as a simultaneous activity, for example, while havingbreakfast or travelling. This has not been included here but it wouldincrease the total time spent on reading.

Free time
9494
7.6 Sports and exercise among persons aged 20 to 74
BE DE EE FR HU SI FI SE UK NO
Hours and minutes per dayWomenWalking, hiking 0:09 0:16 0:12 0:17 0:10 0:18 0:13 0:13 0:03 0:11Walking dog 0:03 0:04 0:05 .. 0:02 0:03 0:07 0:07 0:06 0:03Active sports 0:05 0:12 0:04 0:05 0:02 0:07 0:11 0:09 0:07 0:12Productive exercise 0:00 0:00 0:01 0:01 0:00 0:01 0:03 0:01 0:00 0:01Sports related 0:00 0:00 0:00 .. 0:00 0:00 0:01 0:02 0:00 0:02Sports total 0:18 0:32 0:22 0:23 0:15 0:29 0:35 0:33 0:17 0:31
MenWalking, hiking 0:11 0:14 0:11 0:20 0:12 0:19 0:12 0:09 0:04 0:09Walking dog 0:04 0:03 0:05 .. 0:02 0:04 0:05 0:07 0:06 0:04Active sports 0:10 0:13 0:06 0:11 0:06 0:12 0:15 0:16 0:12 0:15Productive exercise 0:02 0:01 0:09 0:05 0:04 0:04 0:07 0:05 0:01 0:04Sports related 0:00 0:00 0:01 .. 0:00 0:00 0:02 0:03 0:01 0:03Sports total 0:26 0:32 0:33 0:36 0:23 0:40 0:42 0:39 0:24 0:37
BE DE EE FR HU SI FI SE UK NO
Proportion of people who spent any time on the activity, % per dayWomenWalking, hiking 11 19 17 17 9 23 20 21 5 17Walking dog 6 5 9 .. 3 5 11 11 10 6Active sports 7 17 11 6 3 10 19 11 9 14Productive exercise 0 0 1 1 0 1 2 1 0 1Sports related 0 1 0 .. 0 0 4 6 2 5Sports total (withoutwalking dog) 17 33 .. 22 11 31 37 33 13 31MenWalking, hiking 13 17 15 18 10 21 17 15 5 13Walking dog 7 4 8 .. 3 6 8 10 10 7Active sports 10 15 10 10 5 13 20 16 12 16Productive exercise 1 0 3 2 1 3 5 3 1 3Sports related 0 2 2 .. 1 1 6 6 2 7Sports total (withoutwalking dog) 23 29 .. 28 16 33 38 32 17 30
Note: Walking the dog here is included in sports and exercise. Normally, it is included in domesticwork. In France, walking the dog could not be distinguished separately from pet care indomestic work.
Active sports include jogging, ball games, gymnastics and fitness exercises, and so on.Productive exercise covers hunting, fishing, and picking berries, mushrooms and herbs.Sports-related activities include activities that are related to but are not actual exercise,for example, assembling sports equipment or changing clothes at the sports centre.
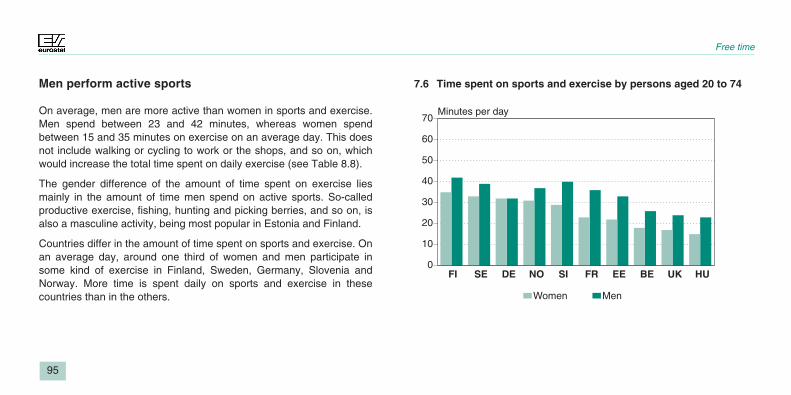
Free time
95
Women Men
FI SE DE NO SI FR EE BE UK HU0
10
20
30
40
50
60
70Minutes per day
7.6 Time spent on sports and exercise by persons aged 20 to 74Men perform active sports
On average, men are more active than women in sports and exercise.Men spend between 23 and 42 minutes, whereas women spendbetween 15 and 35 minutes on exercise on an average day. This doesnot include walking or cycling to work or the shops, and so on, whichwould increase the total time spent on daily exercise (see Table 8.8).
The gender difference of the amount of time spent on exercise liesmainly in the amount of time men spend on active sports. So-calledproductive exercise, fishing, hunting and picking berries, and so on, isalso a masculine activity, being most popular in Estonia and Finland.
Countries differ in the amount of time spent on sports and exercise. Onan average day, around one third of women and men participate insome kind of exercise in Finland, Sweden, Germany, Slovenia andNorway. More time is spent daily on sports and exercise in thesecountries than in the others.

Free time
9696
7.7 Computing among persons aged 20 to 74
BE DE EE FR HU SI FI SE UK NO
Women Hours and minutes per dayComputer and video games 0:01 0:02 0:00 .. 0:00 0:00 0:01 0:01 0:01 0:01Other computing 0:02 0:06 0:01 .. 0:01 0:02 0:02 0:06 0:04 0:04Computing total 0:03 0:08 0:01 0:02 0:01 0:02 0:03 0:06 0:05 0:05
MenComputer and video games 0:04 0:05 0:01 .. 0:02 0:01 0:04 0:04 0:04 0:03Other computing 0:07 0:17 0:02 .. 0:03 0:06 0:06 0:13 0:10 0:10Computing total 0:11 0:22 0:03 0:07 0:05 0:07 0:10 0:17 0:14 0:13
Women Proportion of people who spent any time on the activity, % per dayComputer and video games 2 3 1 .. 1 1 2 2 2 2Other computing 2 9 1 .. 1 2 4 11 6 8
MenComputer and video games 4 5 1 .. 2 2 5 3 4 3Other computing 7 17 2 .. 2 5 8 18 11 15
Note: Computing includes computer and video games, seeking and reading information by means of a computer, as well as reading, writing and sending e-mail.It also includes programming, fixing and repairing the computer. In France, computer and video games were not separated from other computing.Computing refers here only to its hobby use during free time, not to computer use connected with work or studying.

Free time
97
DE SE UK NO BE FI FR SI EE HU
0
5
10
15
20
25Minutes per day
Computer and video gamesOther computing
WM WM WM WM WM WMWM WM WM WM
7.7 Time spent on computing by persons aged 20 to 74Computing more men's than women's hobby
Computing is a rapidly growing free time hobby. This is why differencesbetween the countries in the time used for computing may reflect thesurvey dates, which vary across the countries. France was the firstcountry to conduct the survey, in 1998, and Germany the latest to havedone so, in 2001-02 (see the chapter on data sources, classificationsand definitions).
In all the countries, men clearly use more time for computing thanwomen. When looking at the entire populations aged 20 to 74,computers are used more for purposes other than playing gamesduring free time.

Free time
98
7.8 Computing by age
BE DE EE FR HU SI FI SE UK NO
Women Hours and minutes per day
10–14 .. 0:24 0:06 .. .. 0:10 0:22 .. 0:16 0:2515–24 0:13 0:22 0:04 0:05 0:04 0:08 0:12 .. 0:08 0:1125–44 0:03 0:09 0:02 0:02 0:02 0:02 0:03 0:07 0:06 0:0745–64 0:02 0:07 0:00 0:01 0:00 0:00 0:02 0:06 0:05 0:0465+ 0:00 0:03 0:00 0:00 0:00 0:00 0:01 0:02 0:02 0:01
Men
10–14 .. 0:58 0:29 .. .. 0:33 1:14 .. 0:49 1:0815–24 0:34 1:05 0:19 0:24 0:21 0:26 0:46 .. 0:32 0:5125–44 0:12 0:23 0:04 0:08 0:06 0:09 0:12 0:19 0:17 0:1345–64 0:09 0:16 0:01 0:03 0:02 0:02 0:05 0:11 0:12 0:0765+ 0:02 0:11 0:00 0:03 0:01 0:00 0:03 0:05 0:07 0:03
Note: Computing includes computer and video games, seeking and reading information by means of a computer during free time, as well as reading, writing and sending e-mail messages.It also includes programming, fixing and repairing the computer. In France, computer and video games were not separated from other computing.Computing refers here only to its hobby use during free time, and not to computer use connected with work or studying.No data are available on the 10- to 14-year-old age group for Belgium, France and Hungary, and on the 10- to 24-year-old age group for Sweden.The upper age limit was 79 in Norway, 84 in Hungary and Sweden, and 95 in Belgium. There was no upper age limit in the other countries.

Free time
99
BE DE EE FR HU SI FI SE UK NO0
10
20
30
40
50
60
70Minutes per day
15–24 25–44 45–64 65+
7.8b Time spent on computing by men according to age
BE DE EE FR HU SI FI SE UK NO0
10
20
30
40
50
60
70Minutes per day
15–24 25–44 45–64 65+
7.8a Time spent on computing by women according to age
Young boys most eager computer users
Time used for computing is strongly dependent on age. Young persons, especially boys, are the most eager users ofcomputers during free time. Computer use diminishes clearly towards older age. Germany, where the largest amountof time is spent on computer use also by the oldest age group, has the most recent survey.

Free time
100100
7.9 Volunteer work and informal help to other households among persons aged 20 to 74
BE DE EE FR HU SI FI SE UK NO
Volunteer work Hours and minutes per day
Women 0:04 0:06 0:01 0:05 0:00 0:00 0:04 0:03 0:03 0:01Men 0:06 0:09 0:02 0:08 0:00 0:02 0:06 0:05 0:03 0:03
Informal help
Women 0:06 0:09 0:13 0:09 0:08 0:06 0:12 0:09 0:11 0:08Men 0:05 0:08 0:15 0:10 0:13 0:10 0:11 0:07 0:08 0:07
Volunteer work Proportion of people who spent any time on the activity, % per day
Women 2 4 0 4 0 0 3 2 2 1Men 3 7 1 5 0 1 4 4 2 2
Informal help
Women 8 9 12 9 5 6 12 13 13 10Men 7 7 11 7 6 7 9 9 8 7
Note: Volunteer work is work for an organisation or work directed to people via an organisation. It is done free of charge or for a minor fee.Informal help to other households is direct help given by persons not arranged by any organisation. This help is recorded only whenmentioned in the diary that it was done for another household. Some help was not reported because it was given simultaneously withwork for own household.

Free time
101
FI DE FR UK EE SE NO BE HU SI0
5
10
15
20Minutes per day
Women Men
7.9 Time spent on volunteer work and informal helpby persons aged 20 to 74
Help to other households more common thanvolunteer work via organisations
Volunteer work means here work done for an organisation and workdirected to people via an organisation. On an average day, it issomewhat more common for men than for women to do volunteer work,even though the proportion of people having spent any time onvolunteer work is very low. Slightly more volunteer work is done inGermany and France than in the other countries surveyed.
Informal help to other households is more common than volunteerwork, especially when looking at the proportion of people who spentany time during a day on this activity. Informal help is most common inEstonia and Finland but differences between the countries are minor. Inmost countries, women and men spend almost the same amount oftime on informal help.
Comparing women and men, the total time spent on volunteer workand informal help is slightly higher for men in most of the countries. InFinland, Sweden and Norway, the time is equal for women and menand in the United Kingdom, women spend more time on these tasks.

Free time
102
7.10 Entertainment and cultural participation among persons aged 20 to 74
BE DE EE FR HU SI FI SE UK NO
Hours and minutes per day
Total 0:10 0:14 0:05 0:05 0:04 0:04 0:06 0:06 0:07 0:06Women 0:09 0:14 0:05 0:05 0:03 0:04 0:05 0:06 0:06 0:06Men 0:11 0:14 0:06 0:05 0:04 0:05 0:06 0:05 0:07 0:07
Proportion of people who spent any time on the activity, % per day
Total 7 9 4 4 3 4 6 5 6 5Women 6 9 4 3 2 4 6 5 6 5Men 8 9 4 4 3 5 6 5 6 5
Note: Entertainment and culture includes going to the cinema, theatre, concerts, exhibitions or museums, or sports events.Visits to leisure parks, zoos, and so on, are also included.

Location and travel
103
DE BE SE UK NO EE FR FI SI HU0
5
10
15
20Minutes per day
Women Men
7.10 Time spent on entertainment and cultureby persons aged 20 to 74
National differences observed in entertainmentand cultural participation
The surveyed countries seem to differ in respect of participation inentertainment and culture. Germans and Belgians spend more timethan the others attending sporting events and cultural institutions, suchas the cinema, theatre or exhibitions. The other countries are almostequal in these activities.
No clear differences between women and men can be observed whenanalysing participation overall.

LOCATION AND TRAVEL
105

Location and travel
106
8.1 Location of women aged 20 to 74
BE DE EE HU SI FI SE NO
Women Hours and minutes per day
Home 17:48 17:02 17:14 18:48 17:50 16:30 15:55 16:13
Weekend house 0:04 0:10 0:31 0:05 0:19 0:32 0:20 0:36
Working place or school 1:57 1:54 3:02 2:23 2:47 2:30 2:58 2:52
Other people's homes 0:37 0:56 0:42 0:43 0:34 1:14 0:58 1:14
Restaurant, cafe or pub 0:17 0:10 0:03 0:08 0:08 0:11 0:09 0:11
Travelling 1:19 1:17 1:01 0:51 1:16 1:10 1:21 1:14
Other, unspecifiedlocation 1:58 2:28 1:26 1:02 1:07 1:54 2:19 1:40
Total 24:00 24:00 24:00 24:00 24:00 24:00 24:00 24:00
BE DE EE HU SI FI SE NO
Women Percentage of total hours of the day, %
Home 74 71 72 78 74 69 66 68
Weekend house 0 1 2 0 1 2 1 3
Working place or school 8 8 13 10 12 10 12 12
Other people's homes 3 4 3 3 2 5 4 5
Restaurant, cafe or pub 1 1 0 1 1 1 1 1
Travelling 6 5 4 4 5 5 6 5
Other, unspecifiedlocation 8 10 6 4 5 8 10 7
Total, % 100 100 100 100 100 100 100 100
Note: Location was usually coded from the activities written in the diary.At home includes being at home indoors, in the yard or garden. Weekend house also includes second homes ofstudents in Estonia and Slovenia. Other location includes school, shop, in the street, other outdoors, and so on.France did not record location.In the United Kingdom, location was not asked for when the respondents recorded work, sleep or study.

Location and travel
107
BE DE EE HU SI FI SE NO0%
20%
40%
60%
80%
100%
HomeWeekend houseWorking place or schoolOther people's homes
Restaurant, cafe or pubTravellingOther, unspecified location
8.1 Location of women aged 20 to 74Women spend more than two thirds of their time at home
Women spend more than two thirds of their time at home in thecountries surveyed. Women in Hungary, Slovenia and Belgium spendmost time, and women in Sweden, Norway and Finland least time athome. Most time at the workplace or school is spent by women inEstonia, Sweden, Norway and Slovenia.
Most time in other people's homes is spent by women in Norway andFinland, followed by Sweden and Germany. Visiting a restaurant, cafeor pub is slightly more common for women in Belgium than in the othercountries surveyed.
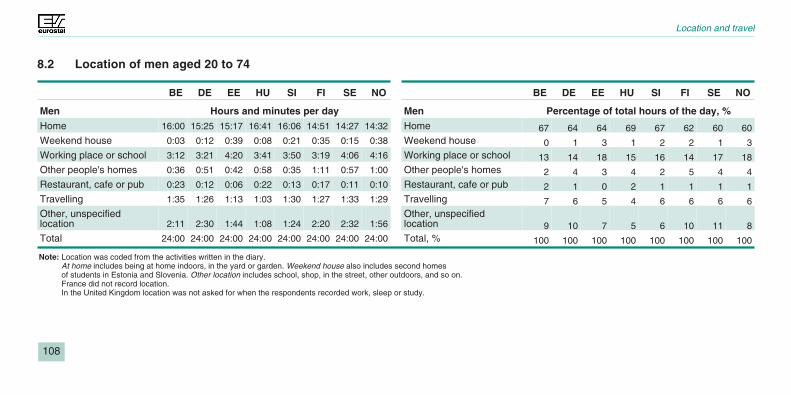
Location and travel
108108
8.2 Location of men aged 20 to 74
BE DE EE HU SI FI SE NO
Men Hours and minutes per day
Home 16:00 15:25 15:17 16:41 16:06 14:51 14:27 14:32
Weekend house 0:03 0:12 0:39 0:08 0:21 0:35 0:15 0:38
Working place or school 3:12 3:21 4:20 3:41 3:50 3:19 4:06 4:16
Other people's homes 0:36 0:51 0:42 0:58 0:35 1:11 0:57 1:00
Restaurant, cafe or pub 0:23 0:12 0:06 0:22 0:13 0:17 0:11 0:10
Travelling 1:35 1:26 1:13 1:03 1:30 1:27 1:33 1:29
Other, unspecifiedlocation 2:11 2:30 1:44 1:08 1:24 2:20 2:32 1:56
Total 24:00 24:00 24:00 24:00 24:00 24:00 24:00 24:00
BE DE EE HU SI FI SE NO
Men Percentage of total hours of the day, %
Home 67 64 64 69 67 62 60 60Weekend house 0 1 3 1 2 2 1 3Working place or school 13 14 18 15 16 14 17 18Other people's homes 2 4 3 4 2 5 4 4Restaurant, cafe or pub 2 1 0 2 1 1 1 1Travelling 7 6 5 4 6 6 6 6Other, unspecifiedlocation 9 10 7 5 6 10 11 8Total, % 100 100 100 100 100 100 100 100
Note: Location was coded from the activities written in the diary.At home includes being at home indoors, in the yard or garden. Weekend house also includes second homesof students in Estonia and Slovenia. Other location includes school, shop, in the street, other outdoors, and so on.France did not record location.In the United Kingdom location was not asked for when the respondents recorded work, sleep or study.
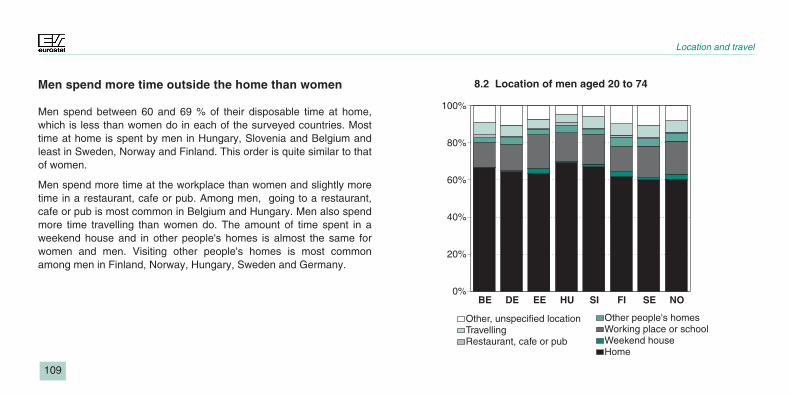
Location and travel
109
BE DE EE HU SI FI SE NO0%
20%
40%
60%
80%
100%
HomeWeekend houseWorking place or schoolOther people's homes
Restaurant, cafe or pubTravellingOther, unspecified location
8.2 Location of men aged 20 to 74Men spend more time outside the home than women
Men spend between 60 and 69 % of their disposable time at home,which is less than women do in each of the surveyed countries. Mosttime at home is spent by men in Hungary, Slovenia and Belgium andleast in Sweden, Norway and Finland. This order is quite similar to thatof women.
Men spend more time at the workplace than women and slightly moretime in a restaurant, cafe or pub. Among men, going to a restaurant,cafe or pub is most common in Belgium and Hungary. Men also spendmore time travelling than women do. The amount of time spent in aweekend house and in other people's homes is almost the same forwomen and men. Visiting other people's homes is most commonamong men in Finland, Norway, Hungary, Sweden and Germany.

Location and travel
110
8.3 Time spent at home by age
BE DE EE HU SI FI SE NO
15–24 Hours and minutes per dayTotal 15:12 13:53 15:15 15:46 15:22 14:13 .. 13:15Women 15:27 13:57 16:04 16:38 15:45 14:42 .. 13:51Men 14:57 13:49 14:30 14:56 14:59 13:37 .. 12:37
25–44Total 15:46 15:28 16:04 16:41 15:45 14:49 14:23 14:50Women 16:50 16:29 16:58 17:47 16:37 15:38 15:21 15:35Men 14:43 14:24 15:01 15:36 14:48 13:59 13:26 14:06
45–64Total 17:35 16:41 17:00 18:32 17:49 16:01 15:10 15:39Women 18:26 17:25 17:42 19:19 18:48 16:44 15:45 16:47Men 16:43 15:59 16:08 17:37 16:49 15:14 14:31 14:33
65+Total 20:41 19:14 20:05 21:37 21:05 19:52 19:41 19:18Women 20:59 19:32 20:27 21:55 21:39 20:28 20:07 19:32Men 20:14 18:45 19:27 21:07 20:19 18:54 19:08 19:01
Note: The upper age limit of the survey was 79 in Norway, 84 in Hungary and Sweden, and 95 in Belgium. There was no upper age limit in the other countriesFrance did not record location.In the United Kingdom, location was not asked for when the respondents recorded work, sleep or study.

Location and travel
111
BE DE EE HU SI FI SE NO0
200
400
600
800
1 000
1 200
1 400Minutes per day
15–24 25–44 45–64 65+
8.3 Time spent at home by ageTime spent at home increases by age
Time spent at home increases clearly by age in all the countries, bothfor women and men. Young people spend most time outside the home.Retirement has a clear impact on time spent at home. Persons agedover 65 spend daily around 20 hours at home. This is five to six hoursmore than in the youngest age group, and the difference is the largestin Norway and Hungary and the smallest in Estonia.
In all age groups, women stay at home more than men do. This is truefor all the countries surveyed. The difference is greatest among womenand men aged 25 to 64, when men are more active in the labour force.

Location and travel
112
8.4 Time spent in other people's homes by age
BE DE EE HU SI FI SE NO
15–24 Hours and minutes per dayTotal 0:46 1:39 1:35 1:10 0:46 2:22 .. 2:11Women 0:48 1:46 1:21 0:58 0:50 2:18 .. 2:20Men 0:44 1:33 1:48 1:22 0:42 2:27 .. 2:0125–44Total 0:37 0:57 0:51 0:54 0:34 1:19 0:59 1:09Women 0:34 0:59 0:50 0:45 0:32 1:18 0:57 1:17Men 0:39 0:56 0:52 1:03 0:37 1:20 1:01 1:0245–64Total 0:34 0:41 0:40 0:43 0:29 0:51 0:50 0:56Women 0:37 0:45 0:42 0:38 0:28 0:58 0:51 0:59Men 0:31 0:38 0:38 0:48 0:30 0:43 0:48 0:5365+Total 0:29 0:38 0:39 0:36 0:31 0:46 0:41 0:55Women 0:30 0:41 0:46 0:37 0:30 0:45 0:43 1:07Men 0:28 0:34 0:26 0:33 0:32 0:49 0:40 0:42
Note: This category includes all kinds of activities in other households, for example, parties and visits, meals or drinks, watching television or using the computer.The upper age limit was 79 in Norway, 84 in Hungary and Sweden, and 95 in Belgium. There was no upper age limit in the other countries.France did not record location.In the United Kingdom location was not asked for when the respondents recorded work, sleep or study. Time spent in other people's homes was not recorded.

Location and travel
113
BE DE EE HU SI FI SE NO0
20
40
60
80
100
120
140
160Minutes per day
15–24 25–44 45–64 65+
8.4 Time spent in other people's homes by ageYoung people spend most time visiting other homes
Young people aged 15 to 24 spend more time than other age groups inother people's homes. National differences are large in this age group.In Finland and Norway, they spend more than two hours per averageday, in Germany and Estonia around 90 minutes, and in the othercountries around an hour, in someone else's home.
Time spent in other people's homes decreases clearly by age in all thecountries. There is no overall gender pattern in the investigatedcountries. However, some national features can be seen. Women ofall age groups spend more time in other people's homes in Norway andGermany.

Location and travel
114
8.5 Time spent in a restaurant, cafe or pub by age
BE DE EE HU SI FI SE UK NO
15–24 Hours and minutes per dayTotal 0:25 0:13 0:14 0:23 0:26 0:21 .. 0:30 0:15Women 0:24 0:14 0:13 0:16 0:22 0:21 .. 0:28 0:15Men 0:26 0:12 0:15 0:29 0:29 0:21 .. 0:31 0:1525–44Total 0:22 0:11 0:05 0:17 0:09 0:18 0:12 0:22 0:11Women 0:17 0:10 0:03 0:10 0:07 0:13 0:10 0:17 0:11Men 0:26 0:12 0:06 0:24 0:12 0:23 0:15 0:27 0:1145–64Total 0:17 0:12 0:03 0:12 0:09 0:09 0:07 0:17 0:08Women 0:16 0:10 0:02 0:05 0:06 0:07 0:07 0:13 0:09Men 0:19 0:13 0:04 0:19 0:11 0:13 0:07 0:21 0:0865+Total 0:11 0:08 0:00 0:03 0:03 0:05 0:02 0:09 0:03Women 0:09 0:08 0:01 0:01 0:01 0:04 0:02 0:07 0:03Men 0:14 0:10 0:00 0:07 0:05 0:06 0:03 0:13 0:04
Note: This category includes meals, drinks, socialising and other activities in a restaurant, cafe or pub.The upper age limit was 79 in Norway, 84 in Hungary and Sweden, and 95 in Belgium. There was no upper age limit in the other countries.
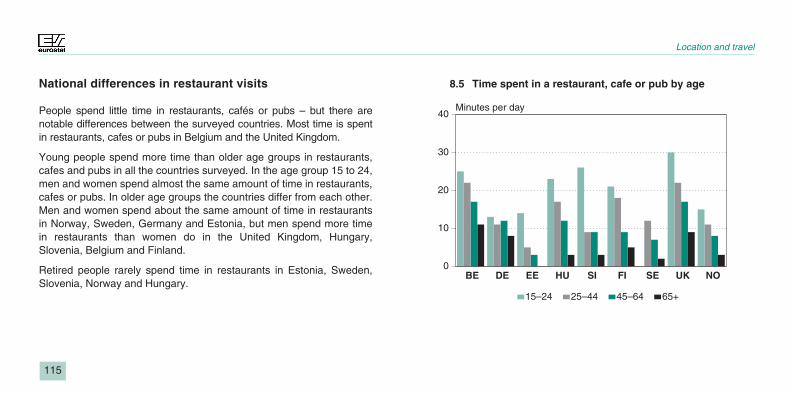
Location and travel
115
BE DE EE HU SI FI SE UK NO0
10
20
30
40Minutes per day
15–24 25–44 45–64 65+
8.5 Time spent in a restaurant, cafe or pub by ageNational differences in restaurant visits
People spend little time in restaurants, cafés or pubs – but there arenotable differences between the surveyed countries. Most time is spentin restaurants, cafes or pubs in Belgium and the United Kingdom.
Young people spend more time than older age groups in restaurants,cafes and pubs in all the countries surveyed. In the age group 15 to 24,men and women spend almost the same amount of time in restaurants,cafes or pubs. In older age groups the countries differ from each other.Men and women spend about the same amount of time in restaurantsin Norway, Sweden, Germany and Estonia, but men spend more timein restaurants than women do in the United Kingdom, Hungary,Slovenia, Belgium and Finland.
Retired people rarely spend time in restaurants in Estonia, Sweden,Slovenia, Norway and Hungary.

Location and travel
116
8.6 Time spent on daily travel by age
BE DE EE HU SI FI SE UK NO
15–24 Hours and minutes per dayTotal 1:35 1:32 1:21 1:17 1:44 1:34 .. 1:35 1:42Women 1:33 1:33 1:15 1:14 1:39 1:32 .. 1:37 1:38Men 1:37 1:31 1:26 1:21 1:50 1:36 .. 1:33 1:4625–44Total 1:35 1:25 1:15 1:02 1:30 1:29 1:33 1:34 1:26Women 1:28 1:22 1:09 0:56 1:26 1:22 1:29 1:33 1:21Men 1:41 1:29 1:23 1:08 1:35 1:37 1:38 1:36 1:3145–64Total 1:23 1:20 1:00 0:50 1:16 1:13 1:27 1:25 1:18Women 1:16 1:15 0:58 0:47 1:07 1:04 1:21 1:20 1:09Men 1:32 1:25 1:03 0:54 1:25 1:22 1:35 1:30 1:2765+Total 0:53 1:01 0:42 0:34 0:51 0:38 0:52 0:58 0:52Women 0:45 0:57 0:39 0:31 0:42 0:34 0:46 0:54 0:42Men 1:03 1:07 0:47 0:40 1:04 0:44 1:00 1:04 1:04
Note: Daily travel is here based on location code. It includes travel related to work, school, domestic tasks and free time.Travel during working hours is also included but may be under-reported.The upper age limit was 79 in Norway, 84 in Hungary and Sweden, and 95 in Belgium. There was no upper age limitin the other countries.France did not record location.

Location and travel
117
BE DE EE HU SI FI SE UK NO0
102030405060708090
100110120
Minutes per day
15–24 25–44 45–64 65+
8.6 Time spent on daily travel by ageDaily travel decreases with age
People aged 20 to 74 spend, on average, between one hour and 90minutes per day on travel. Men spend more time on daily travel thanwomen (see also Tables 8.1 and 8.2). This seems to be the case withall age groups and countries.
The amount of time spent on travel is the highest among young peopleand decreases gradually with age. Retirement means a clear drop intravel time. This trend is similar among women and men even thoughthe reduction is slightly clearer for women.
Time spent on daily travel differs by country. Least time is spent ontravel in Hungary and Estonia (see also Table 8.8).

Location and travel
118
8.7 Daily travel by purpose among persons aged 20 to 74
DE EE HU SI FI SE UK NO
Total Hours and minutes per dayGainful work and study 0:21 0:19 0:23 0:21 0:18 0:22 0:24 0:24Domestic 0:25 0:22 0:16 0:18 0:17 0:24 0:24 0:19Free time 0:34 0:25 0:19 0:22 0:32 0:36 0:35 0:34Travel total 1:23 1:06 0:57 1:06 1:09 1:26 1:27 1:16
WomenGainful work and study 0:15 0:16 0:18 0:18 0:16 0:20 0:18 0:20Domestic 0:27 0:21 0:18 0:20 0:18 0:24 0:27 0:19Free time 0:34 0:23 0:16 0:20 0:31 0:35 0:34 0:32Travel total 1:18 1:01 0:51 1:02 1:07 1:23 1:25 1:11
MenGainful work and study 0:27 0:22 0:28 0:23 0:20 0:24 0:31 0:28Domestic 0:22 0:22 0:13 0:17 0:16 0:23 0:21 0:19Free time 0:35 0:27 0:22 0:24 0:33 0:37 0:36 0:36Travel total 1:27 1:12 1:03 1:09 1:12 1:30 1:30 1:20
Note: Daily travel is here based on main activity. In the rest of Chapter 8 it is based on location, which is why there are minor differences in total times spent on travel.France did not record travel by purpose to enable comparison.
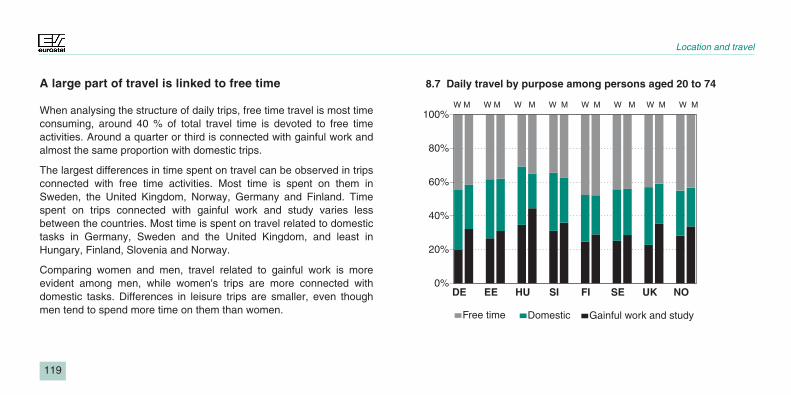
Location and travel
119
DE EE HU SI FI SE UK NO0%
20%
40%
60%
80%
100%
Gainful work and studyDomesticFree time
W M W M W M W M W M W M W M W M
8.7 Daily travel by purpose among persons aged 20 to 74A large part of travel is linked to free time
When analysing the structure of daily trips, free time travel is most timeconsuming, around 40 % of total travel time is devoted to free timeactivities. Around a quarter or third is connected with gainful work andalmost the same proportion with domestic trips.
The largest differences in time spent on travel can be observed in tripsconnected with free time activities. Most time is spent on them inSweden, the United Kingdom, Norway, Germany and Finland. Timespent on trips connected with gainful work and study varies lessbetween the countries. Most time is spent on travel related to domestictasks in Germany, Sweden and the United Kingdom, and least inHungary, Finland, Slovenia and Norway.
Comparing women and men, travel related to gainful work is moreevident among men, while women's trips are more connected withdomestic tasks. Differences in leisure trips are smaller, even thoughmen tend to spend more time on them than women.

Location and travel
120
8.8 Mode of travel among persons aged 20 to 74
BE DE EE HU SI FI SE UK NO
Total Hours and minutes per dayCar, motorcycle 0:58 0:54 0:21 0:14 0:44 0:49 0:52 0:53 0:56Public transport 0:09 0:12 0:16 0:16 0:06 0:13 0:13 0:12 0:11On foot or bicycle 0:18 0:18 0:27 0:25 0:29 0:14 0:19 0:18 0:14Unspecified mode 0:02 0:01 0:03 0:01 0:04 0:02 0:03 0:05 0:03Travel total 1:27 1:21 1:07 0:57 1:23 1:18 1:27 1:27 1:21WomenCar, motorcycle 0:52 0:48 0:13 0:09 0:36 0:38 0:44 0:49 0:48Public transport 0:08 0:12 0:17 0:16 0:07 0:13 0:12 0:12 0:11On foot or bicycle 0:17 0:19 0:28 0:26 0:30 0:17 0:22 0:18 0:15Unspecified mode 0:03 0:01 0:03 0:00 0:04 0:02 0:03 0:05 0:02Travel total 1:19 1:17 1:01 0:51 1:16 1:10 1:21 1:25 1:14MenCar, motorcycle 1:05 1:00 0:30 0:21 0:52 1:01 1:00 0:57 1:03Public transport 0:10 0:12 0:14 0:16 0:04 0:12 0:14 0:12 0:12On foot or bicycle 0:18 0:16 0:25 0:24 0:28 0:11 0:16 0:16 0:14Unspecified mode 0:02 0:01 0:04 0:01 0:05 0:02 0:04 0:06 0:04Travel total 1:35 1:26 1:13 1:03 1:30 1:27 1:33 1:30 1:29
Note: Daily travel is based on location code. It includes travel related to work, school, domestic tasks and free time. Travel during working hours isalso included but may be under-reported. In the United Kingdom, mode of travel did not cover travel during working hours.
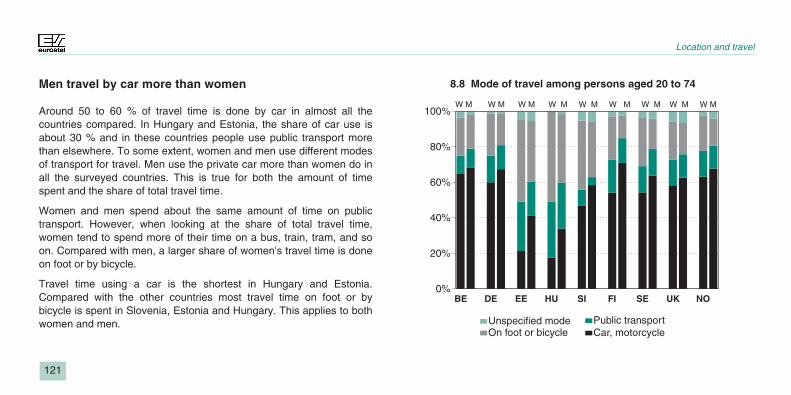
Location and travel
121
BE DE EE HU SI FI SE UK NO0%
20%
40%
60%
80%
100%
Car, motorcyclePublic transport
On foot or bicycleUnspecified mode
W M W M W M W M W M W M W M W M W M
8.8 Mode of travel among persons aged 20 to 74Men travel by car more than women
Around 50 to 60 % of travel time is done by car in almost all thecountries compared. In Hungary and Estonia, the share of car use isabout 30 % and in these countries people use public transport morethan elsewhere. To some extent, women and men use different modesof transport for travel. Men use the private car more than women do inall the surveyed countries. This is true for both the amount of timespent and the share of total travel time.
Women and men spend about the same amount of time on publictransport. However, when looking at the share of total travel time,women tend to spend more of their time on a bus, train, tram, and soon. Compared with men, a larger share of women's travel time is doneon foot or by bicycle.
Travel time using a car is the shortest in Hungary and Estonia.Compared with the other countries most travel time on foot or bybicycle is spent in Slovenia, Estonia and Hungary. This applies to bothwomen and men.

TABLES
Tables
123

1. General structure of time use
1.1 Time use structure of women aged 20 to 741.2 Time use structure of men aged 20 to 741.3 Time use structure of employed women1.4 Time use structure of employed men
2. Daily rhythm
2.1 Gainful work at 10.30 am and 5.30 pm on weekdays.Percentage of persons aged 20 to 74
2.2 Domestic work at 10.30 am and 5.30 pm on weekdays.Percentage of persons aged 20 to 74
2.3 Travel at 7.30 am, 12 noon and 5 pm on weekdays.Percentage of persons aged 20 to 74
2.4 Sleep at 7 am, 2 pm and 11 pm on weekdays.Percentage of persons aged 20 to 74
2.5 Meals and personal care at 7 am, 12.30 pm and 7 pmon weekdays. Percentage of persons aged 20 to 74
2.6 Free time at 7.30 pm and 9.30 pm on weekdays.Percentage of persons aged 20 to 74
3. Employment
3.1 Key indicators on employment, 20023.2 Gainful work of the employed, estimated annual hours3.3 Gainful work of the employed by day of the week
4. Study
4.1 Studies by persons aged 20 to 744.2 Studies by persons of different ages
5. Domestic work
5.1 Domestic work total of persons aged 20 to 745.2 Domestic activities of persons aged 20 to 745.3 Food preparation among persons aged 20 to 745.4 Dish washing among persons aged 20 to 745.5 Cleaning dwelling and other household upkeep among
persons aged 20 to 745.6 Laundering among persons aged 20 to 745.7 Ironing among persons aged 20 to 745.8 Handicrafts among persons aged 20 to 745.9 Gardening among persons aged 20 to 745.10 Construction and repairs among persons
aged 20 to 745.11 Shopping and services among persons aged 20 to 745.12 Childcare among parents living as couple with
children aged up to 65.13 Childcare among parents living as couple with
youngest child aged 7 to 175.14 Time spent by parents with children aged up to 9
Tables
124
6. Total hours worked
6.1 Gainful and domestic work of persons aged 20 to 746.2 Gainful and domestic work of parents living as couple
with youngest child aged up to 66.3 Gainful and domestic work of parents living as couple
with youngest child aged 7 to 176.4 Gainful and domestic work of single women with
children aged up to 17
7. Free time
7.1 Free time activities of women aged 20 to 747.2 Free time activities of men aged 20 to 747.3 Watching television and videos among persons
aged 20 to 747.4 Socialising among persons aged 20 to 747.5 Reading among persons aged 20 to 747.6 Sports and exercise among persons aged 20 to 747.7 Computing among persons aged 20 to 747.8 Computing by age7.9 Volunteer work and informal help to other households
among persons aged 20 to 747.10 Entertainment and cultural participation among
persons aged 20 to 74
8. Location and travel
8.1 Location of women aged 20 to 748.2 Location of men aged 20 to 748.3 Time spent at home by age8.4 Time spent in other people's homes by age8.5 Time spent in a restaurant, cafe or pub by age8.6 Time spent on daily travel by age8.7 Daily travel by purpose among persons aged 20 to 748.8. Mode of travel among persons aged 20 to 74
Tables
125
Data sources,classifications
anddefinitions
127

Data sources, classifications and definitions
The data originate from national time use surveys conductedbetween 1998 and 2002 in Europe. A representative sample ofindividuals completed a diary during one weekday and one weekendday distributed over the whole year. For exceptions, see below. Onehas to bear in mind that the results are estimates and that samplingerrors affect them. For small groups of individuals the errors may belarge. For examples of the standard errors of the mean estimates forsome activities, see below. The response rates vary between thecountries. This has been taken into account in the estimationprocedures. The results are considered to be representative for thepopulation indicated in the tables and figures.
The harmonised European time use (HETUS) activity coding list wasbased on international practices and previous classifications used inEurope. The coding system and index were tested and revised onthe basis of time use pilot surveys in 18 countries. The final systemwas completed in 2000. There have been some deviations from theguidelines, for example in France where the survey was conductedalready in 1998. Some other countries with long national traditionsdid not follow the harmonised guidelines completely either, sincethey wanted to maintain comparability with previous surveys.Deviations are mentioned in the related tables.
The European activity coding list allows several groupings ofactivities depending on the purpose of the analysis. For thispocketbook, the activity and location codes are grouped into 40major activities and 10 location categories (see below). Time useactivities are here aggregated to personal care, gainful work, study,domestic work, volunteer work and help, and free time. This followstheories and traditions based on the extent of time commitment andnot, for example, subjective needs fulfilled by the activity. Domesticwork implies that there is a task that must be carried out. This iswhy, for example, gardening is domestic work and not free time.This is also why, for example, walking the dog is primarily grouped indomestic work even if it is also analysed in the context of exercise.
In European time use surveys main and simultaneous activities,social context (other persons present) and location were reported inthe diary in temporal order at ten-minute intervals. In this publicationno simultaneous activities are analysed. This means that activitiesfrequently done simultaneously with other activities areunder-reported. These are, for example, childcare, watchingtelevision, reading, socialising and doing handicrafts.
The sampled persons answered questions related to the individualand to the household. The answers have been used to classify thepersons according to employment status, level of education, age, lifecycle and sex and these variables have been presented asbackground information in the descriptions.
Data sources, classifications and definitions
128
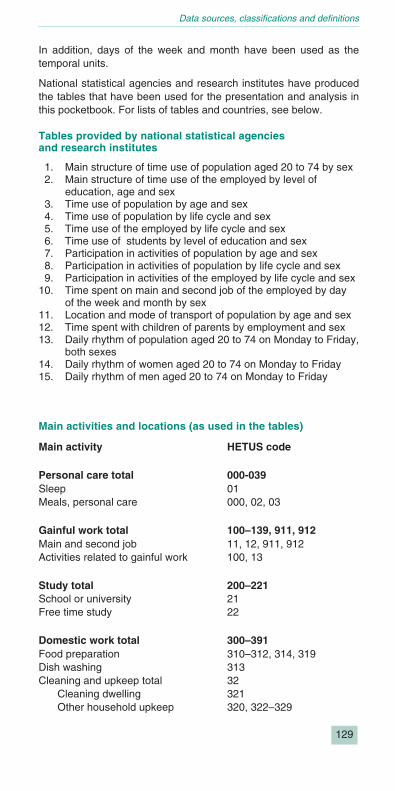
In addition, days of the week and month have been used as thetemporal units.
National statistical agencies and research institutes have producedthe tables that have been used for the presentation and analysis inthis pocketbook. For lists of tables and countries, see below.
Tables provided by national statistical agenciesand research institutes
1. Main structure of time use of population aged 20 to 74 by sex2. Main structure of time use of the employed by level of
education, age and sex3. Time use of population by age and sex4. Time use of population by life cycle and sex5. Time use of the employed by life cycle and sex6. Time use of students by level of education and sex7. Participation in activities of population by age and sex8. Participation in activities of population by life cycle and sex9. Participation in activities of the employed by life cycle and sex
10. Time spent on main and second job of the employed by dayof the week and month by sex
11. Location and mode of transport of population by age and sex12. Time spent with children of parents by employment and sex13. Daily rhythm of population aged 20 to 74 on Monday to Friday,
both sexes14. Daily rhythm of women aged 20 to 74 on Monday to Friday15. Daily rhythm of men aged 20 to 74 on Monday to Friday
Main activities and locations (as used in the tables)
Main activity HETUS code
Personal care total 000-039Sleep 01Meals, personal care 000, 02, 03
Gainful work total 100–139, 911, 912Main and second job 11, 12, 911, 912Activities related to gainful work 100, 13
Study total 200–221School or university 21Free time study 22
Domestic work total 300–391Food preparation 310–312, 314, 319Dish washing 313Cleaning and upkeep total 32
Cleaning dwelling 321Other household upkeep 320, 322–329
Data sources, classifications and definitions
129

Laundry, ironing and handicrafts 330–339Laundry 331Ironing 332Handicraft 333Other care for textiles 330, 339
Gardening 341Construction and repairs 35Shopping and services 36Childcare 38Other domestic work 300, 340, 342–344, 37, 39
Volunteer work and help total 41, 42Volunteer work 41Informal help to other households 42
Free time total 400, 430–832, 998Socialising 510–519Entertainment and culture 52Resting 53Sports and exercise total 600–631 (344)
Walking and hiking 611(Walking the dog) (344)Active sports 610, 612–619Productive exercise 62Sports related and unspecified 63, 600
Hobbies and games total 71–73Computer and video games 733Other computing 722–725Other hobbies and games 71, 720, 721,726,729,
730–732, 734, 739Reading total 81
Reading books 812Other reading 810, 811, 819
Watching television and videos 82Other or unspecified free time 400, 43, 500, 700, 800,
83, 998
Travel total 900, 901, 913–982Travel to/from work and school 913, 921, 922Travel related to domestic work 931–939Travel related to free time 941–943, 951, 952, 961,
971, 981, 982
Unspecified time use 995, 999
Data sources, classifications and definitions
130

Location HETUS codeHome 11Weekend house 12Working place or school 13Other people's home 14Restaurant, cafe or pub 15Travel total 20–40
On foot or bicycle 21, 22Car, motorcycle 23–25Public transport 30–39Unspecified mode 20, 29, 40
Other, unspecified location 00, 10, 19
Examples of the standard errors of the mean estimates forselected activities among persons aged 20 to 74 in Finland
Samplesize
Days
Mean
Minutesper day
Standarderror
95%confidenceinterval
Domestic work totalWomen 4 370 236.2 3.3 229.8–242.6Men 3 883 136.1 2.8 130.7–141.5
HandicraftWomen 4 370 9.7 0.9 8.0–11.4Men 3 883 0.4 0.3 0.0–1.0
Computing totalWomen 4 370 3.1 0.3 2.4–3.7Men 3 883 10.0 0.9 8.3–11.7
Data sources, classifications and definitions
131

Data sources, classifications and definitions
132 Sources, reference years and sample sizes
Country Fieldworkperiod
Age ofpopulationcovered
Sample size(Number ofrespondents)
Size ofpopulation,1 0001
Comments
Belgium (BE) – Statistics Belgium and VrijeUniversiteit Brussel
December 1998 – February 2000 12–95 8 382 8 755
Germany (DE) –Federal Statistical Office Germany
April 2001 – April 200210– 12 655 73 641
Two week-days, oneweekend day
Estonia (EE) – Statistical Office of Estonia April 1999 – March 2000 10– 5 728 1 290France (FR) – INSEE February 1998 – February 1999, except
4–18 August and 21 December –4 January
15– 15 441 47 231 One diary day
Hungary (HU) –Hungarian Central Statistical Office
September 1999 – September 2000 15–84 10 792 8 206
Slovenia (SI) – Statistical Office of theRepublic of Slovenia
April 2000 – March 2001 10– 6 190 1 990
Finland (FI) – Statistics Finland March 1999 – March 2000 10– 5 332 4 451Sweden (SE) – Statistics Sweden October 2000 – September 2001 20–84 3 998 6 538United Kingdom (UK) –Office for National Statistics
June 2000 – September 2001 8– 10 366 53 016
Norway (NO) – Statistics Norway February 2000 – February 20019–79 3 211 3 674
Twoconsecutivedays
1 Source: Population Statistics.