Special Issue: Advances in Network Systems Guest Editors
122
Volume 36 Number 4 December 2012 Special Issue: Advances in Network Systems Guest Editors: Andrzej Chojnacki Andrzej Kowalski Bohdan Macukow Maciej Grzenda 1977
-
Upload
khangminh22 -
Category
Documents
-
view
2 -
download
0
Transcript of Special Issue: Advances in Network Systems Guest Editors

Volume 36 Number 4 December 2012
Special Issue:Advances in Network Systems
Guest Editors:Andrzej ChojnackiAndrzej KowalskiBohdan MacukowMaciej Grzenda
1977

Editorial Boards, Publishing CouncilInformatica is a journal primarily covering intelligent systems inthe European computer science, informatics and cognitive com-munity; scientific and educational as well as technical, commer-cial and industrial. Its basic aim is to enhance communicationsbetween different European structures on the basis of equal rightsand international refereeing. It publishes scientific papers ac-cepted by at least two referees outside the author’s country. In ad-dition, it contains information about conferences, opinions, criti-cal examinations of existing publications and news. Finally, majorpractical achievements and innovations in the computer and infor-mation industry are presented through commercial publications aswell as through independent evaluations.
Editing and refereeing are distributed. Each editor from theEditorial Board can conduct the refereeing process by appointingtwo new referees or referees from the Board of Referees or Edi-torial Board. Referees should not be from the author’s country. Ifnew referees are appointed, their names will appear in the list ofreferees. Each paper bears the name of the editor who appointedthe referees. Each editor can propose new members for the Edi-torial Board or referees. Editors and referees inactive for a longerperiod can be automatically replaced. Changes in the EditorialBoard are confirmed by the Executive Editors.
The coordination necessary is made through the Executive Edi-tors who examine the reviews, sort the accepted articles and main-tain appropriate international distribution. The Executive Boardis appointed by the Society Informatika. Informatica is partiallysupported by the Slovenian Ministry of Higher Education, Sci-ence and Technology.
Each author is guaranteed to receive the reviews of his article.When accepted, publication in Informatica is guaranteed in lessthan one year after the Executive Editors receive the correctedversion of the article.
Executive Editor – Editor in ChiefAnton P. ŽeleznikarVolariceva 8, Ljubljana, [email protected]://lea.hamradio.si/˜s51em/
Executive Associate Editor - Managing EditorMatjaž Gams, Jožef Stefan InstituteJamova 39, 1000 Ljubljana, SloveniaPhone: +386 1 4773 900, Fax: +386 1 251 93 [email protected]://dis.ijs.si/mezi/matjaz.html
Executive Associate Editor - Deputy Managing EditorMitja Luštrek, Jožef Stefan [email protected]
Executive Associate Editor - Technical EditorDrago Torkar, Jožef Stefan InstituteJamova 39, 1000 Ljubljana, SloveniaPhone: +386 1 4773 900, Fax: +386 1 251 93 [email protected]
Contact Associate EditorsEurope, Africa: Matjaz GamsN. and S. America: Shahram RahimiAsia, Australia: Ling FengOverview papers: Maria Ganzha
Editorial BoardJuan Carlos Augusto (Argentina)Costin Badica (Romania)Vladimir Batagelj (Slovenia)Francesco Bergadano (Italy)Marco Botta (Italy)Pavel Brazdil (Portugal)Andrej Brodnik (Slovenia)Ivan Bruha (Canada)Wray Buntine (Finland)Zhihua Cui (China)Ondrej Drbohlav (Czech Republic)Hubert L. Dreyfus (USA)Jozo Dujmovic (USA)Johann Eder (Austria)Ling Feng (China)Vladimir A. Fomichov (Russia)Maria Ganzha (Poland)Marjan Gušev (Macedonia)N. Jaisankar (India)Dimitris Kanellopoulos (Greece)Samee Ullah Khan (USA)Hiroaki Kitano (Japan)Igor Kononenko (Slovenia)Miroslav Kubat (USA)Ante Lauc (Croatia)Jadran Lenarcic (Slovenia)Shiguo Lian (China)Huan Liu (USA)Suzana Loskovska (Macedonia)Ramon L. de Mantras (Spain)Angelo Montanari (Italy)Pavol Návrat (Slovakia)Jerzy R. Nawrocki (Poland)Nadia Nedjah (Brasil)Franc Novak (Slovenia)Marcin Paprzycki (USA/Poland)Ivana Podnar Žarko (Croatia)Karl H. Pribram (USA)Luc De Raedt (Belgium)Shahram Rahimi (USA)Dejan Rakovic (Serbia)Jean Ramaekers (Belgium)Wilhelm Rossak (Germany)Ivan Rozman (Slovenia)Sugata Sanyal (India)Walter Schempp (Germany)Johannes Schwinn (Germany)Zhongzhi Shi (China)Oliviero Stock (Italy)Robert Trappl (Austria)Terry Winograd (USA)Stefan Wrobel (Germany)Konrad Wrona (France)Xindong Wu (USA)

Informatica 36 (2012) 339–339 339
Editors’s Introduction to the Special Issue on “Advances in Network Systems”
Tremendous development of network systems and network applications observed over the last years has opened even more new research areas. The success of WWW applications, API exposition via web services or ubiquitous mobile access is immediately followed by significant challenges related to performance, security, or privacy issues of network systems. In particular, large network operators managing core high bandwidth networks and providing services to millions of end users are facing growing demand for increased data transfer, quality of service and novel services. This results in unprecedented research and development of numerous network services, applications and systems. To stimulate the cooperation between commercial research community and academia, the first edition of Frontiers in Network Applications and Network Systems symposium was organized in 2012. The main idea of providing a forum for academia and application-oriented research was fulfilled by the organizers of the event. These are: Orange Labs Poland – a part of a global chain of R&D centres or France Telecom group and two leading Polish academic communities, namely Warsaw University of Technology, Faculty of Mathematics and Information Science and Faculty of Cybernetics of the Military University of Technology.
Unlike many other network-related events, the conference was a part of a larger event providing the opportunity to discuss network-related issues in a wider community. The symposium was a part of Federated Conference on Computer Science and Information Systems (FedCSIS), organized in 2012 in Wrocław. This provided basis for active cooperation with other events of the multiconference. Among other areas, artificialintelligence (AI) and soft computing can be mentioned in this context. On the one hand, AI models are frequently used to deal with network-related problems and among other applications provide basis for Network Intrusion Detection. On the other hand, unprecedented volume of data transferred in modern network systems opens new areas in modern data analysis.
This special issue includes selected extended versions of papers presented during the Frontiers in Network Applications and Network Systems symposium. The selection of papers illustrates the wide range of active research areas in modern network systems. Theseinclude the exposition of Telco infrastructure via web services i.e. opening the complex world of telecom systems via standardized web services and the benefits arising from this trend. Another aspect is the monitoring of network systems with particular emphasis on anomaly and intrusion detection. Finally, new questions raised by the constantly growing range of mobile solutions have to be answered.
The first paper, entitled “E-health oriented application for mobile phones” authored by A. Podziewski, K. Litwiniuk and J. Legierski shows new
perspectives created by opening telecommunication infrastructure via the set of web services. E-health application using services such as determining the approximate location of a mobile terminal is proposed. Its key part is the use of web services exposing underlying mobile network functionalities. This illustrates the promising perspective of integrating complex, mobile infrastructure capabilities with third-party applications in accordance with SOA paradigm. At the same time, this provides one more example of the need for system security, and the balance between the usability of the system and user’s privacy.
The intrusion detection area has been active research area for many years. The second work, entitled “Artificial Immune System Inspired Intrusion Detection System Using Genetic Algorithm” authored by Amira Sayed A. Aziz, Mostafa Salama, Aboul ella Hassanien, and Sanaa El-Ola Hanafi, contributes to this area. The authors present the use of genetic algorithms and different distance measures for network anomaly detection. The next work, “Usage of Holt-Winters model and Multilayer Perceptron in Network Traffic Modelling and Anomaly Detection”, authored by M. Szmit, A. Szmit, S. Adamus and S. Bugała also contributes to this area. In particular it shows the way network-related research is frequently combined with network application development in this case being network anomaly detection application. Finally, P. Bžoch, L. Matějka, L. Pešička, and J. Šafařík in their work „Design and Implementation of a Caching Algorithm Applicable to Mobile Clients“ address the need for novel caching algorithms. This refers to another aspect of modern network systems i.e. mobile network systems and the need for more efficient data handling methods addressing unique features of mobile networks.
The guest editors would like to thank Professor Matjaz Gams for the opportunity to publish this special volume and share the ideas raised during the conference with international research community. The editorswould like also to thank authors for sharing the results of their research and Program Committee Members for their contribution to this conference and reviewing the papers submitted to this special issue.
Andrzej ChojnackiAndrzej KowalskiBohdan Macukow
Maciej Grzenda
Guest Editors

340 Informatica 36 (2012) 339–339 A. Chojnacki et al.

Informatica 36 (2012) 341-346 341
E-health Oriented Application for Mobile Phones
Andrzej PodziewskiWarsaw University of Technology, Faculty of Electronics and Information Technology15/19 Nowowiejska Street, 00-665 Warsaw, Poland E-mail: [email protected]
Kamil LitwiniukWarsaw University of Technology, Faculty of Electronics and Information Technology15/19 Nowowiejska Street, 00-665 Warsaw, Poland E-mail: [email protected]
Jarosław LegierskiOrange Labs Poland, 7 Obrzeżna Street, 02-691 Warsaw, Poland E-mail: [email protected]
Keywords: service delivery platform, SDP, API exposure, telco 2.0, e-health
Received: September 25, 2012
This paper presents the idea of using mobile operators APIs with an e-health usage scenario. Since numerous elderly people are going missing every year, proposed emergency location service presents a way in which mobile operators’ networks, the Internet and possibilities given by rapid improvement of phones’ functionalities can converge in order to relieve the problem. The description of presented solution is supplemented with sets of accuracy measurements and usability tests, conducted during test deployment. The results confirm usability potential of the service, giving green light for further research and development. Still, in order to make the service reliable, the algorithms used to determine location and detect falls need to be improved. The article presents a method, which may be used to improve the location accuracy.
Povzetek: Prispevek opisuje metode za pomoč starejšim, predvsem lociranje s pomočjo mobilnega telefona.
1 IntroductionThe societies of highly-developed countries are graduallybecoming older, and therefore the phenomenon of elderly people going missing becomes noticeable [1]; the main reason being health issues, such as memory losses and spatial orientation problems. Additionally, elderly people are more likely to lose consciousness and fall due to theirhealth problems – such situations always require instantreaction and often hospitalization. Rapid response is notalways possible, especially if the location of the person isunknown. Therefore, the main idea behind the proposedservice is to provide its users with a reliable and fast-touse location service that could be easily – or even automatically – invoked in case of emergency, without the need to carry additional electronic equipment.
2 Existing Solutions At the moment, there are numerous GPS-based location systems available, that can be used in medical assistance,such as Finder On-Line [2]. Those solutions are solely designed to work outdoors, where GPS signal is available. Other systems, like ZUPS [3] are designed for indoor location and require dedicated devices and infrastructure. Since mobile network cell-based location
outperforms both solutions in range and reliability, it stands out as an interesting area of research. Despite its lower accuracy it has the additional advantage of very low cost. In this paper we investigate the functionality of a simple emergency location system built upon cellular network infrastructure.
3 The Idea of Telco 2.0 and Telco Web Services
In the last years the Internet has gone through major changes. The idea of Web 2.0 has transformed the way in which the network is used and perceived. In the days of Web 1.0, the typical Internet user was mainly a passive consumer of the content such as web portals. Possible user activities were not related to the then-static World Wide Web and limited to sending e-mails, participating in chats or newsgroups. At the moment, Internet users have numerous possibilities of dynamically creating their own content: participating in social networking sites, writing blogs, collaborating on wikis and building web sites using content mashup from other pages and portals [4], [5]. Telecom operators, seeing the immense potential behind the Web 2.0, have aggressively tried to implement a similar, two-sided business models, based on service exposure platforms [6], [7]. Their goal was to

342 Informatica 36 (2012) 341–346 A. Podziewski et al.
monetize existing network assets more efficiently by leveraging third party developers and service providers. This concept is currently known as Telco 2.0 and is actively researched, resulting in numerous new applications like [8],[9],[10],[11],[12]. In the Telco 1.0 model, telecommunication networks are closed for external entities and only the operator is able to create services and telecom applications. In the Telco 2.0 model, operator’s networks functionalities are made available for external developers by exposing sets of interfaces in the Internet. This approach allows companies and universities to build, test and deploy their own services based on telecom infrastructure.
From the practical point of view, the most significantdifference between Telco 1.0 and 2.0 is the way in which telecom resources are accessed. In Telco 2.0 it is done using the Web Services technology (Fig. 1), which is predominant in the IT sector, as opposed to telecom network- specific protocol stack used in Telco 1.0. Through Telco Web Services, Telco 2.0 implementation supports the most popular access models such as RESTful architecture style (Representational State Transfer – most popular in the Internet [13]) and SOAP (Simple Object Access Protocol), in accordance with SOA (Service-Oriented Architecture) guidelines – a “de facto” standard in the enterprise sector [14].
In comparison with the traditional way, use of Telco 2.0 interfaces allowed for a significant reduction in time required to develop a service. Therefore, as our goal was to confirm whether it was possible to build a usable emergency location service upon mobile network infrastructure, Telco Web Services was chosen as an optimal solution.
Figure 1: Telco Web Services architecture. Source: [10].
The key operator’s network element responsible for communication APIs exposition is the Service Delivery Platform (SDP). South interfaces of this system are connected directly to the network enablers, responsible for telecommunication functions and using telecom oriented specific binary protocols, such as: SMPP (Short Message Peer-to-Peer) and UCP (Universal Computer
Protocol) for SMS services; MAP (Mobile Application Part of SS7 Stack) for USSD (Unstructured Supplementary Service Data) or MM7 interface for MMS messages. Because of binary character and specific telecommunication function oriented implementation,these protocols are difficult to use for (mostly) IT oriented programmers. North interfaces of SDP areconnected to the Internet. Exposed APIs provide the developers with more user-friendly interfaces in Web Services form. First implementation of WS, dedicated for exposition of communication APIs, was implemented in SOA model as ParlayX standard [15]. In the last years we have observed an expansion of RESTful Web Services in the Internet. In response to this trends, the newest telecommunication APIs specification are resource oriented (e.g. OneAPI standard [16]).
4 The Emergency Button ServiceThe majority of emergency information and fall detection systems require specifically designed hardware and software, which limits the commercial availability to the wealthiest users. This paper proposes a low priced system that uses reliable, ubiquitous technology – mobile phones that most people carry every day. Every cell phone is suitable to activate the basic service, and using a slightly more expensive smartphone significantly boosts its functionality.
In spite of the above, as typical end users for the service we have chosen people with orientation disorders, memory losses or in danger of losing consciousness, their families or people in any way responsible for their wellbeing (social workers, nursing homes etc.). As will be described later – due to its nature, use of the service can be tailored to fit any situation where base-station location is of enough accuracy.
5 System ArchitectureIn this chapter, service activation is presented as a way to establish interaction between the Seniors and Guardians.Seniors are the people who require attention due to their health issues. They will be the ones to invoke the service (intentionally – when lost, or automatically – when a fall is detected). Guardians, on the other hand, are those to be informed about senior’s location in case of emergency. When the Emergency Button service is invoked, a message containing approximate GPS coordinates and address is sent to Guardian’s cell phone. (
Figure 2).
Figure 2: Service invocation scenarios Source: [10].
As stated before, Emergency Button may be invoked in numerous ways. The most basic one is by sending a USSD (Unstructured Supplementary Service Data)

E_HEALTH ORIENTED APPLICATION FOR… Informatica 36 (2012) 341–346
message. Specific code can be stored in phone’s memory or SIM card and assigned a speed dial button for the ease of access. Change sentence to: Besides, a full-screen widget for Android smartphones was developed.Therefore, the EB Service can be activated by simply touching almost anywhere in the screen while the phone is unlocked. The most prospective way to invoke the service, that was implemented, is the EB Fall. It is an Android application that controls a background service (not to be confused with EB service itself, as it is, in simple words, an application without a user interface running in the background). It is responsible for detecting a fall caused by losing consciousness by the owner using data from built-in accelerometer. If the Senior does not respond within a given period of time, the EB service is activated. The implemented heuristic model of a fall is based on measurements and findings presented in [17]and [18].In order to implement the service, the following Telco2.0 API functionalities were used: • Send USSD – for invoking the service from Senior’s
cell phone• Terminal Location – for determining Senior’s cell
phone location by means of cell identification • Send SMS – to inform the Guardian about an
emergency situation.As shown in Fig. 3, the main component of the developed service is the application server, where main software components are deployed. The first one is responsible for running the logic of the service –receiving USSD messages, location and sending SMS messages to Guardians. It cooperates with the second module, designed to maintain communication with the database and process incoming requests. The last module is the graphical user interface – a web page allowing theGuardians to register in the service, add Seniors and maintain associations between them and registered Seniors, as well as view recent service activations on a map.
Figure 3: Structure of the developed service. Source [10].
6 MeasurementsIn order to check the accuracy of location returned by the mobile network, measurements in 60 random locations
were taken in Warsaw area – using both GSM and 3G (UMTS) Radio Access Networks (RAN). As reference position we used data from an external GPS device. To assess reliability and actual usability, 7 tests were conducted in order to determine whether it was possible to find a lost person without using measures different than the EB service.
6.1 Accuracy testsThe histograms represent the distribution of location
error for both the GSM mode (Fig. 4) and the UMTS mode (Fig. 5). Obtained accuracy was higher in the GSM mode. The reason behind those results is that in Warsaw, GSM cells of the mobile network in use (Orange) were significantly smaller than the UMTS cells [19].
Figure 4: Error of location prediction for the GSM RAN. Source: [10].
Since every mobile carrier’s RAN structure is different (ex. an operator might maintain only one type of access network, have higher base station location density etc.), it cannot be stated with certainty that a specific type of network allows for better accuracy. Chances are that if a UMTS network was the only type of RAN maintained by an operator, its performance in means of location error could be much better due to UMTS networks characteristics (relatively small cells to provide good HSPA coverage [20], wide use of picocells [21] adding capacity in areas with dense phone usage).
Figure 5: Error of location prediction for the UMTS RAN. Source: [10].

344 Informatica 36 (2012) 341–346 A. Podziewski et al.
6.2 Usability testsThe results of usability tests were obtained in accordance with the following rules:• one person (Senior) had to choose a random place in
Warsaw to invoke the service and then wait for rescue,
• the other tester (Guardian) had to find the Seniorwasting as little time as possible,
• Guardian was only allowed to use means of publictransport,
• the service could be invoked only once per test,• no way of communication between the Guardian and
the Senior was allowed other than activating the service.
All the measured distances are “as the crow flies” – the length of a straight line segment connecting the points is given.
Nb.
Distance Guardian-Senior [m]
Senior location error
[m]Time to
find [min]1 1655 198 192 3153 210 443 1092 125 154 377 686 n/a5 852 377 486 3710 290 357 410 144 41
Table 1: Results of the usability tests. Source: own research.
Usability tests (tab. 1) show that if the location error is smaller than 200 m, finding a lost person in a very short period of time is possible, like in tests 1 and 3. Still, even if the error is relatively small, it might take a long time if the conditions are unfavorable, like in tests 2 (university campus) and 7 (Warsaw Metro construction site).When an emergency situation occurs in a densely built up residential area and the location error is higher than 300 meters, finding the Senior is still possible, but requires a very methodical, lengthy search (like in test 5), as the area to be explored grows quadratically with the error. As it increases, and the person in need is not in within sight, time needed to find them increases dramatically, up to a point when doing so in a reasonably short time is almost impossible (test 4). Therefore, small error (less than 200 m) does not necessarily guarantee a short search time, but large (more than 200 m) always results in a lengthy walk.
7 ChallengesUsing a mobile phone for location and fall detection has numerous advantages over specialized systems, the main being its low cost and the fact, that it is already considered an indispensable device by most people and is therefore, carried on a daily basis. Still, there are numerous weaknesses to the EB service that need to be
taken into account and addressed during future development.
As opposed to GPS-based systems, proposed service works indoors as well as outdoors and is relatively invulnerable to difficult weather conditions. Unfortunately, due to relatively large size of cells in cellular networks, if cell identification alone is used, location errors may be up to several kilometers in sparsely populated areas. This issue might be resolved by implementing a client-side GPS support or triangulation algorithms that would process data from Senior’s phone such as signal strength and neighboring base stations. This would require phone-specific software to run on Senior’s mobile phone as well as a reliable data connection, making the service more precise, but considerably less universal.
In order to improve the handset location accuracy without any client-side support, the operator should implement more advanced network-based tracking techniques. It is possible to determine the sector in which the mobile phone resides -and estimate the distance to the current station by measuring radio signal propagation time delay [22]. Moreover, triangulation techniques can be used to determine position by using data concerning signal parameters from neighboring base stations.Methods dedicated for terminal location accuracy improvement are discussed in chapter 8.
Since the service is intended to be used in case of loses of consciousness as well, improving the reliability of the implemented fall detection algorithm is a matter of utmost importance. The greatest challenge is the reduction in number of false positives while maintaining high sensitivity to real falls.
In its current form, the service strictly relies on the interfaces provided by the mobile network operator. Consequently, as not all of the cellular operators expose necessary Telco 2.0 interfaces, it is only possible to use it within one network. Hopefully this matter will be resolved by the operators themselves by exposing proper APIs and providing with functional inter-operator links for USSD messages and location services.
Another concern is the possibility of confidentiality breaches that applies to all location-based services. Subscriber’s location and movement data is controlled and owned by mobile network operators. Since it has the potential to be used in adversary purposes, it may only be revealed under strict conditions that are defined by telecommunications law of a given country [23]. Therefore, before any commercial deployment, legal precautions need to be taken in order to prevent any misuse of the data provided.
8 Terminal Location Accuracy Improvement Methods
The simplest method used in Location Based Services for mobile terminal location is based on network CelID, sometimes extended by radius calculation between BTS

E_HEALTH ORIENTED APPLICATION FOR… Informatica 36 (2012) 341–346
and mobile station defined by Timing Advance (TA)parameter. In this method, the approximate longitude and latitude of mobile terminal are calculated by GMLC (ang. Gateway Mobile Location Centre) based on geographical center of mobile cell. This method is dedicated for GSM system and is currently used by the Emergency Button application. Another mobile terminal location methods in this area are presented bellow [25]:• U-TDOA (Uplink Time Difference of Arrival) –
dedicated for GSM and UMTS, based on the delay of radio signal propagation from terminal to network,
• E-OTD (Enhanced Observed Time Difference) –standard hybrid method for GSM conceptually, method is similar to U-TDOA.
• OTDOA (Observed Time Difference Of Arrival) –standard defined in UMTS system, based on measurement of delay radio propagation signal from network to terminal. OTDOA is based on the measurement of signal delay from minimum three base stations [25],[26],[27]. Using this method,location error can be minimized to 50 m in the cites.
Methods presented above, based on signal propagation time measurement (U-TDOA, E-OTD OTDOA) can be implemented by installing specific hardware and software on provider’s side.
Another approach for reducing location error is focused on methods dedicated for implementation on mobile terminal side.
Standard method in this area is A-GPS (Assisted GPS) – typical mobile terminal location method usingassisted GPS receiver installed in mobile terminal (dedicated for UMTS).
In last years we cloud observe rapid development of hybrid methods. This kind of location services is based on observation of information from different sources:• Wireless Network SSID presence,• Network Measurement Report (signal strength from
up to 6 Basic Transceiver Station) observed by mobile terminal [27],[29].
• GPS, Accelerometer and gyroscope.Information from all the sources presented above iscorrelated with existing database and utilized to support the calculation of mobile station position.
Unfortunately, hybrid methods are available only for users with smartphones and tablets because of dedicatedhardware requirements (WiFi, accelerometer, gyroscope, GPS). An example API based on hybrid methods is described in [30] and is defined as common source of location information (GPS and location inferred from network signals such as IP address, RFID, WiFi and Bluetooth, MAC addresses, and mobile networks cell IDs).
Method country suburban cityInside the buildings
Cell ID 1-35km 1-10km 50m-1km 50m-1km
Cell ID +TA
1-35km 1-10km 50m-1km 50m-1km
U-TDOA OTDOA
80m 50m 50m 50m
E-OTD 50-150m 50-150m 50-150m 50-150m
A-GPS 30m 40m 30-150m 200m
Table 2: Comparison the accuracy of methods dedicated for mobile terminal location [25].
9 ConclusionPresented system is a viable solution to low-cost emergency location. Using existing technologies and simplest cell-identification based location, we proved that it is possible to find a lost person in a densely populated area with only the data from the received text message. Further improvement in accuracy and better reliability can be obtained if the operators decide to better their handset tracking technologies. It is probable, since by exposing Telco 2.0 interfaces they received an easy-to-use way of providing location services to external entities. If that is not the case, better accuracy can be obtained by using less universal client-side solutions.
Future work ought to focus on improving the accuracy of returned location, which is crucial in reducing time necessary for finding a lost person. Another problem that needs to be addressed is the limited reliability of the implemented fall detection algorithm.
Despite presented use-case, the service can be easily adapted to different emergency situations, e.g. informing municipal police about dangerous situations in means of public transportation or finding lost children.
References[1] M. J. Patterson: Who is missing? A study of
missing persons in B.C., Simon Fraser University, 2005
[2] Finder Telematic Solutions, available: http://www.finder.pl/
[3] A. Marco, R. Casas, J. L. Falco, H. J. Gracia, J. I. Artigas, A. Roy: Location-based services for elderly and disabled people, Computer Communications Journal, April 2008
[4] N. Banerjee, K. Dasgupta, Telecom Mashups: Enabling Web 2.0 for Telecom Services, ICUIMC '08 Proceedings of the 2nd international conference on Ubiquitous information management and communication, Korea, 2008
[5] S. A. Ahson, M. Ilyas, Service Delivery Platforms, Developing and Deploying Converged Multimedia Services, CRC Press Taylor Francis Group, 2011
346 Informatica 36 (2012) 341–346 A. Podziewski et al.
[6] M. Średniawa, Telecommunications Reinvented, Proceedings of the XIV Poznań Telecommunications Workshop, Poznań 2010
[7] portal STL Partners http://www.telco2.net/[7.11.2012]
[8] D. Bogusz, A. Podziewski, K. Litwiniuk, J. Legierski ., Telco 2.0 for UC – an example of integration telecommunications service provider’s SDP with enterprise UC system, Conference FedCSIS/FINANS, Wrocław, 2012, IEEE Explore
[9] Litwiniuk K., Czarnecki T., Grabowski S., Legierski J., Bus Stop – Telco 2.0 application supporting public transport in agglomerations, Conference FedCSIS/FINANS, Wrocław, 2012, IEEE Explore
[10] Podziewski A., Litwiniuk K., Legierski J., Emergency Button – a Telco 2.0 application in the e-health environment, Conference FedCSIS/FINANS, Wrocław, 2012, IEEE Explore
[11] H. Rosa, D. Krasińska, USSD Survey Guide, Orange Labs, 2011
[12] A. Tylman, J. Jankowski, Assumptions and scope of Work Control – trial service based on Parlay X technology, Orange Labs, 2010
[13] L. Richardson, Sam Ruby, David HeinemeierHansson, RESTful Web Services, O’Reilly, 2007
[14] E. Newcomer, Understanding Web Services: XML, WSDL, SOAP, and UDDI, Independent Technology Guides, 2003
[15] Open Service Access (OSA); Parlay X web services, 3GPP Technical Specification TS 29.199-01 ÷ TS 29.199-22
[16] Portal OneAPI http://www.oneapi.gsma.com/ [7.11.2012]
[17] F. Sposaro, G. Tyson, iFall: An Android Application for Fall Monitoring and Response
[18] T. Zhang, J. Wang, P. Liu, and J. Hou: Fall detection by embedding an accelerometer in cellphone and using kfd algorithm. IJCSNS International Journal of Computer Science and Network Security, 6(10), October 2006.
[19] Orange RAN map, available: http://mapa.btsearch.pl/
[20] D. Maidment: Understanding HSDPA's Implementation Challenges, picoChip Designs 2005
[21] R. Kumar: A picocell primer, Texas Instruments 2006
[22] M. O. Sunay, I. Tekin: Mobile location tracking in DS CDMA networks using forward link time difference of arrival and its application to zone-based billing, Global Telecommunications Conference, 1999. GLOBECOM '99
[23] L. Ackerman, J. Kempf, T. Miki: Wireless Location Privacy: Law and Policy in the U.S., EU and Japan
[24] Portal Orange Labs Telco 2.0 University www.tu.rd.tp.pl
[25] J. Stefanski. Metody i standardy pozycjonowania terminali w systemach komórkowych Przegląd Telekomunikacyjny, nr 6, 2006, Wydawnictwo Sigma-NOT, Warszawa, Poland
[26] M. Miernik, Metody i procedury lokalizacjiabonenta w sieciach komórkowych GSM2+/3G,Przegląd Telekomunikacyjny 5/2003, Wydawnictwo Sigma-NOT, Warszawa, Poland
[27] J. Stefanski, Radio Link Measurement Methodology for Location Service Applications, Metrology and Measurement Systems, vol. XIX, no. 2
[28] P. Korbel, P. Wawrzyniak, P. Pątek, J. Legierski, NMR Recorder- narzędzie do gromadzenia informacji pomiarowych z terminala komórkowego, KKRRIT 2012, Przegląd Telekomunikacyjny 4/2012
[29] B. Zacharuk, A. Tylman, P. Pątek, S. Grabowski J. Legierski, NMR API – nowy interfejs programistyczny w modelu Telco 2.0 i propozycje jego zastosowań, KKRRiT 2012, Przegląd Telekomunikacyjny 4/2012
[30] Geolocation API http://www.w3.org/TR/ geolocation-API/ [7.11.2012]

Informatica 36 (2012) 347–357 347
Artificial Immune System Inspired Intrusion Detection System Using GeneticAlgorithm
Amira Sayed A. AzizFrench University in Egypt, Scientific Research Group in Egypt (SRGE), Cairo, EgyptE-mail: [email protected] and www.egyptscience.net
Mostafa A. SalamaBritish University in Egypt, Scientific Research Group in Egypt (SRGE), Cairo, EgyptE-mail: [email protected] and www.egyptscience.net
Aboul ella HassanienFaculty of Computers and Information, Cairo University,Chairman of Scientific Research Group in Egypt (SRGE), Cairo, Egyptwww.egyptscience.net
Sanaa El-Ola HanafiFaculty of Computers and Information, Cairo University, Cairo, Egypt
Keywords: artificial immune system, intrusion detection, genetic algorithm, Minkowski distance
Received: October 11, 2012
Computer security is an issue that will always be under investigation as intruders never stop to find waysto access data and network resources. Researches try to find functions and approaches that would increasechances to detect attacks and at the same time would be less expensive, regarding time and space. In thispaper, an approach is applied to detect anomalous activity in the network, using detectors generated bythe genetic algorithm. The Minkowski distance function is tested versus the Euclidean distance for thedetection process. It is shown that it Minkowski distance give better results than the Euclidean distance,and can give very good results using less time. It gives an overall average detection rate of 81.74% against77.44% with the Euclidean distance. In addition, formal concept analysis was applied on the data setcontaining only the selected features and used to visualize correlation between highly effective features.
Povzetek: Predstavljena je varnostna metoda na osnovi umetnega imunskega sistema.
1 Introduction
Anomaly detection has been a widely researched problemin several application domains such as system health man-agement, intrusion detection, health-care, bio-informatics,fraud detection, and mechanical fault detection. Traditionalanomaly detection techniques analyse each data instance(as a uni-variate or multivariate record) independently. Andignore the sequential aspect of the data. Often, anoma-lies in sequences can be detected only by analysing datainstances together as a sequence, and hence cannot be de-tected by traditional anomaly techniques [1]. Gonzalez andDasgupta in [2] used sequential niching technique with thegenetic algorithm to generate the rules. Then, in [3] theysuggested using deterministic-crowding niching techniqueto limit the crowd by replacing parents with more fittedchildren. This time, the algorithm gave same results withless number of rules, which is better because the populationsize will not change.
This paper applies an approach for detecting networktraffic anomalies using genetic algorithm based intrusiondetection system, but without the levels of abnormality.
The algorithm is put under investigation to find which val-ues for its parameters can lead to better results, using therelatively new NSL-KDD data set.
The rest of this paper is organized as follows. Section2 presents a background of anomaly intrusion detection,artificial immune systems, genetic algorithms and formalconcept analysis. Section 3 gives a review on work sim-ilar to the one mentioned in this paper. Section 4 gives adescription of the applied approach and its phases as well.Section 5 shows the experimental results and discusses ob-servations. Finally, section 6 addresses the conclusions.
2 Background
2.1 Anomaly Detection
An Intrusion Detection System (IDS) is a system builtto detect outside and inside intruders to an environmentby collecting and analysing its behaviour data. In ear-lier times, system administrators were detecting intrusionsmanually. They did that by noticing anomalous actions

348 Informatica 36 (2012) 347–357 A.S.A. Aziz et al.
Figure 1: Intrusion Detection Systems classification
then by monitoring audit logs, which was during 70’s and80’s. The problem was that suspicious or anomalous ac-tions were discovered after that have took place. Anotherproblem was that audit logs were stacked by lots of activ-ities which was a burden to view and would need a lot oftime to review and high expertise to notice suspicious be-havioural pattern. So, the need for real-time systems thatcan detect such activities while they happen emerged. Bythe 90’s, IDSs were created to review audit data while theybuild up, and by time, they were developed to take actionsas responses to attacks [4].
IDSs can be categorized in many terms [5], all categoriesare summarized in Figure 1.
Misuse-based and Anomaly-based detection are two ba-sic approaches are followed to implement an IDS. In amisuse-based IDS, attacks are represented as a pattern ora signature to use for detection. It’s very good in de-tecting known attacks and provide detailed information onthe detected ones, but is of little use for unknown attacks.Anomaly-based IDS build a model for a system’s normalbehaviour to use for detection, assuming all deviated ac-tivities to be anomalous or intrusions. It is very useful forfinding unknown attacks but it has a high false negative orpositive rates, beside it needs to be updated with system be-haviour and can not provide much information on detectedattacks. In some IDSs, a hybrid of both techniques is used[6].
Different approaches exist for Anomaly-based NetworkIDS (A-NIDS), but in general they all consist of the fol-lowing modules: (1) Parametrization: representing theobserved instances in some pre-defined form, (2) Train-ing: a model is built using the normal or abnormal sys-tem behaviour. It can be done manually or automatically,and (3) Detection: the (parametrized) monitored traffic issearched for anomalous behaviour using the system modelbuilt through previous stage.
The techniques used to build the system behaviouralmodel can be: statistical, knowledge-based, or machinelearning-based. The Genetic Algorithms (GA) is amongthe machine learning-based techniques. The flexible androbust global search is the main advantage of applying GAsin A-NIDS, where it looks for a solution from multiple di-rections with no prior knowledge required about the system[7, 8].
2.2 Genetic Algorithms
Genetic Algorithms (GAs) is one of the Evolutionary Com-putation (EC) approaches. In general,EC can be involved inmany tasks in IDSs, such as optimization, automatic modeldesign, and in classification [9]. GAs are basically usedin IDSs to generate rules (build a classifier) used to de-tect anomalies [8]. They were inspired by the biologicalevolution (development), natural selection, and genetic re-combination. GAs use data as chromosomes that evolvethrough: selection (usually random selection), cross-over(recombination to produce new chromosomes), and muta-tion operators. Finally, a fitness function is applied to selectthe best (highly-fitted) individuals. The process is repeatedfor a number of generations until reaching the individual(or group of individuals) that closely meet the desired con-dition [8, 2].
GA is very promising in the computer security field, es-pecially in IDSs. It has been applied for intrusion detec-tion since the 1990’s, and still being used up till the currenttime. GA is usually used to generate rules for intrusion de-tection, and they usually take the form if {condition} then{action}, where the condition part test the fields of incom-ing network connections to detect the anomalous ones [8].
Niching techniques are known to assist EC techniquesto find multiple local optimal solutions in a population bycreating sub-populations which assemble local optima sothere would be diversity in the population [9]. They can beused in conjunction with GAs to find multiple solutions inone round without the need to run the GA multiple times.
2.3 Artificial Immune Systems
The Artificial Immune Systems (AIS) were inspired by theHuman Immune System which is robust, decentralized, er-ror tolerant, and adaptive. The HIS has different cells withso many different tasks, so the resultant mimic algorithmsgive differing levels of complexity and can accomplish arange of tasks. There are a number of AIS models used inpattern recognition, fault detection, computer security, anda variety of other applications in the field of science andengineering. Most of these models emphasize on designingand applying computational algorithms and techniques us-ing simplified models of various immunological processesand functionalities [10, 11].
There exists no single algorithm from which all immunealgorithms are derived, as AISs are designed using a num-ber of algorithms [12]. The Negative Selection approach

ARTIFICIAL IMMUNE SYSTEM INSPIRED INTRUSION. . . Informatica 36 (2012) 347–357 349
(NSA) explains how T-cells are being selected and theirmaturation in the system. T-cells are blood cells that be-long to a group of white blood cells called lymphocytes. Inthe NSA, whenever the T-Cells are produced, they undergoan immaturely period to learn which antigen recognitionresults in their death. The T-cells need activation to de-velop the ability to remove pathogens. They are exposedto a comprehensive sample of self antigens, then they aretested against self and non-self antigens to match the non-self ones. If a T-Cell matched a self antigen, it is thenremoved until they are mature and released to the system[13, 14].
2.4 Formal Concept AnalysisFormal Concept Analysis (FCA) is one of the data miningresearch methods and it has been applied in many fields asmedicine. The basic structure of FCA is the formal contextwhich is a binary-relation between a set of objects and a setof attributes. The formal context is based on the ordinaryset, whose elements has one of two values, 0 or 1 [15],[16]. A formal concept is defined as a pair(A, B) with A ⊆G,B ⊆ M , intent(A)=B and extent(B) = A. The set Ais called the extent and the set B called the intent of theconcept (A, B). The extent and the intent are derived bytwo functions, which are defined as:
intent(A) ={m ∈ M |∀g ∈ A : (g,m) ∈ I},A ⊆ G,
(1)
extent(B) ={g ∈ G|∀m ∈ B : (g,m) ∈ I},B ⊆ M.
(2)
Usually the attributes of a real life data set are not ina binary form, attributes could be expressed in a many-valued form that are either discrete or continuous values.In that case the many-valued context will take the form(G,M, V, I) which is composed of a set G of objects, a setM of attributes, a set V of attribute values and a ternary-relation I between G, M and V . Then the many-valuedcontext of each attribute is transformed to a formal con-cepts, the process of creating single-valued contexts from amany-valued data set is called conceptual scaling. The pro-cess of creating a conceptual scale must be performed byusing expert knowledge from the domain from which thedata is drawn. Often these conceptual scales are created byhand, along with their concept lattice, since they are rep-resented by formal contexts often laid out by hand. Suchthat a threshold t is chosen for each many-valued attributeand replace it by the two one-valued attributes "expressionvalue" [15], [16].
3 Related WorkMany researches combined GAs with IDSs either for op-timization or to build classifiers for the intrusion detection
process. Dasgupta and Gonzalez have done some researchconcerning AIS-inspired network security systems [2, 3, 8].In [2] they built a model applying the Positive Characteriza-tion (PC) concept which follows the NSA algorithm, wherea model is built representing the self space and character-ize the connections (as normal or anomalous) according totheir distance to that self model. They also implementedanother algorithm that applies the Negative Characteriza-tion (NC) concept which builds a model for the non-selfspace and use it to detect attacks. Both algorithms usedGA with sequential Niching algorithm to generate the rulesused to define the models. Real-valued variables were usedinstead of binary encoding, so the model is representingself/non-self samples in the hyperspace and the detectorscover that complementary space. They concluded that PCgives more precise results than NC but NC requires lesstime and space resources. In [3] they implemented and al-gorithm to build a model representing the self space foranomaly detection too. They used a variability parameterto defines levels of abnormality. Again, GA was used togenerate the detectors but this time using the deterministic-crowding Niching technique. Their new technique had bet-ter computational power and showed very good results de-tecting the attacks. They used the Darpa intrusion detectionevaluation data set.
In [8], they implemented a Rule-based system (RBS) bycreating artificial intelligence rules using GAs for intrusiondetection. They followed NC where detectors are gener-ated to match anomalous connections. They used the hy-perspace fitness function originally suggested by Gonzalezand Dasgupta. Wei Li and Iss Traore [17] proposed a ruleevolution approach based on GA, but they used parse treesto represent population instead of chromosomes. Theyused the Darpa data set for evaluation. In [18] GA wasused to generate a set of rules where each rules identifies aparticular attack type. As a result to their experiment, theygenerated a set of six rules that classify six different attacktypes that fall into two classes: DoS and probe. They usedthe following fitness function:
F =a
A− b
B(3)
with threshold 0.95. Pillai et al. in [19] also imple-mented a NIDS using GA to create rules automatically forspecific connections and they used real network data forevaluation. McFadden [20] created a similar system butused a different fitness function. It depends on the degree ofmatching between the fields values and the suspected fieldswith predefined weights for each field. Then a penalty iscalculated based on the matching measures and the rank-ing. He used JGAP – which is an open source Java basedGA framework – to develop the system. In [21] they fo-cused on feature selection to reduce the number of featuresused in the intrusion detection. They used the mutual infor-mation to define relation between decision variable X andconnection feature variable Y. In other words, they werelooking into the amount of information about connection

350 Informatica 36 (2012) 347–357 A.S.A. Aziz et al.
type contained in each connection feature.Fan Li in [22] proposed an intelligent IDS which com-
bines both anomaly and misuse techniques. GA is used forthe fuzzy logic in the learning component of system, to tunethe fuzzy membership functions and to select an appropri-ate set of features. Other work involving the use of GAsfor intrusion detection can be found in [23], [24], [25], and[26]. Also, [27] gives a detailed survey on such systems.
4 The Proposed Network AnomalyDetection Approach
Genetic Algorithms produce the best individual as a solu-tion, but in an A-NIDS a set of rules is needed - hence,running GA multiple times. The technique used here wasoriginally proposed in [28], where an algorithm was imple-mented to generate detectors for network anomaly intru-sion detection, using GA with the deterministic-crowdingNiching technique. The strengths of the deterministic-crowding Niching technique are that it requires no addi-tional parameters to those that are already used in a GA,beside that it is fast and simple [29].
The self (normal behaviour) individuals are representedin a self space S, where each individual is represented asa vector of features of dimension n, with the values nor-malized to the interval [0.0,1.0]. This can be written asS = x1, . . . , xm, where m is the number of the self sam-ples. Algorithm (1) shows the main steps of the detectorsgeneration approach.
The final solution was a set of rules, represented as in-dividuals with low and high limits for each dimension, asthe conditions used to define the AIS detectors. So, eachrule R has a condition part (xn ∈ [lowi, highi]), hence afeature vector xi satisfies a rule R if its hyper-sphere inter-cepts the hyper-cube represented by the rules defines by itspoints [3].
To calculate the fitness of an individual (or a rule), twothings are to be taken into account: the number of elementsin the training sample that can be included in a rule’s hyper-cube, calculated as [2, 3]:
num_elements(R) = xi ∈ S and xi ∈ R (4)
The volume of the hyper-cube that the rule represents isdefined by the following form:
volume(R) =n∏
(i=0)
(highi − lowi) (5)
Consequently, the fitness is calculated using the follow-ing equation.
fitness(R) = volume(R)− C × num_elements(R)(6)
where C is a coefficient of sensitivity that represents apenalty if a rule covers anomaly samples. The bigger the
Algorithm 1 Detectors generation algorithmInitialize population by selecting random individualsfrom the space S.for The specified number of generations do
for The size of the population doSelect two individuals (with uniform probability) asparent1 and parent2.Apply crossover to produce a new individual(child).Apply mutation to child.Calculate the distance between child and parent1as d1, and the distance between child and parent2as d2.Calculate the fitness of child, parent1, andparent2 as f , f1, and f2 respectively.if (d1 < d2) and (f > f1) then
replace parent1 with childelse
if (d2 <= d1) and (f > f2) thenReplace parent2 with child.
end ifend if
end forend forExtract the best (highly-fitted) individuals as your finalsolution.
C value, the higher the sensitivity - hence the penalty - is.The fitness can take negative values. The same equationsare used if you’re calculating the fitness of an individual ingeneral. To calculate the distance between two individu-als (a child c and a parent p), volumes of the hyper-cubessurrounding the individuals (represented by low and highpoints in each dimension) are used as follows:
distance(c, p) =volume(p)− volume(p
∩c)
volume(p)(7)
The purpose of using the volume is to check how muchthe child covers of the area of the parent, so this distancemeasure is not symmetric. The algorithm had very goodresults (compared to some others as will be shown later inthe paper) with the highest detection rate 81.76%. The Eu-clidean distance was used in the comparison and detectionprocess. In this paper, the use of other distance metrics isproposed — precisely the Minkowski distance. It is a gen-eral metric in which other metrics can be included withinas special cases of its form [30] [31].
The Minkowski distance between two vectors X and Ycan be expressed as,
d(X,Y ) = (n∑
i=0
(|xi − yi|p))1/p (8)
where p is the Minkowski metric order, and it can takevalues from 0 to infinity (and can even be a real value be-tween 0 and 1). If p=1 then it is the Manhattan distance, if
ARTIFICIAL IMMUNE SYSTEM INSPIRED INTRUSION. . . Informatica 36 (2012) 347–357 351
p=2, then it is the Euclidean distance, and as it approachesinfinity it becomes the maximum (or Chebyshev) distance.
5 Experimental Results andDiscussion
5.1 Data SetsThe experiment was performed on the NSL-KDD data setwhich was suggested to solve some problems in the KDDCup’99 data set that is widely used for IDS evaluation. Thisdata set contains less number of records in both the trainand the test, which helps researchers to run their exper-iments on the whole sets instead of only small portions.Hence, the evaluation results will be comparable and con-sistent [32]. Fifteen parameters (features) were selected touse in the experiment, which have real values that can beused in the approach and can be used to detect basic DoSattacks. These features values are already in the interval[0.0,1.0], and they are mentioned in Table (1) in [28].
5.2 Experiment SettingsThe self (normal) data only was used in the training phaseto generate best rules that represent the Self profile, as thenegative selection approach suggests, then the rules werecompared against the test sample. The parameters valuesused for the genetic algorithm are mentioned below in table(1).
Variable ValuePopulation Size 200, 400, 600Number of Generations 200, 500, 1000, 2000Mutation Rate 0.1Sensitivity Coefficient 1.0Variability Value 0.05, 0.10, 015, 0.20p (Minkowski Order) 0.5
Table 1: The classification accuracy of known classifiers
Following the NSA, the algorithm is basically trained(to generate rules) on self (normal) samples, then use theserules to find non-self (anomalies) which will be the vectorsvery far from the self rules. To characterize the samples toself or non-self, the characterization function was:
µnon_self(x) = D(x, Self)
= min{d(x, s) : s ∈ Self}(9)
which mean the closer a vector x is to a self point s, theless it is a non-self sample. The distance measure d(x, s),is the Minkowski distance as mentioned above.
5.3 Experiment ResultsThe training phase was held using normal samples ex-tracted from the 20% Train Set to generate intrusion de-
Figure 2: Euclidean Distance Average Detection Rates ver-sus Threshold Levels.
Figure 3: Minkowski Distance Average Detection Ratesversus Threshold Levels.
tectors. Using different population sizes ran for differentnumbers of generations, the algorithm was executed foreach combination, resulting in a group of detectors. Eachdetectors is expressed as values for each features, wherethe variability value defines the upper and lower boundsfor that feature. Each set of detectors was tested against theTest Set of the NSL-KDD data set for detection of anoma-lies, once using the Euclidean distance, and another timeusing the Minkowski distance.
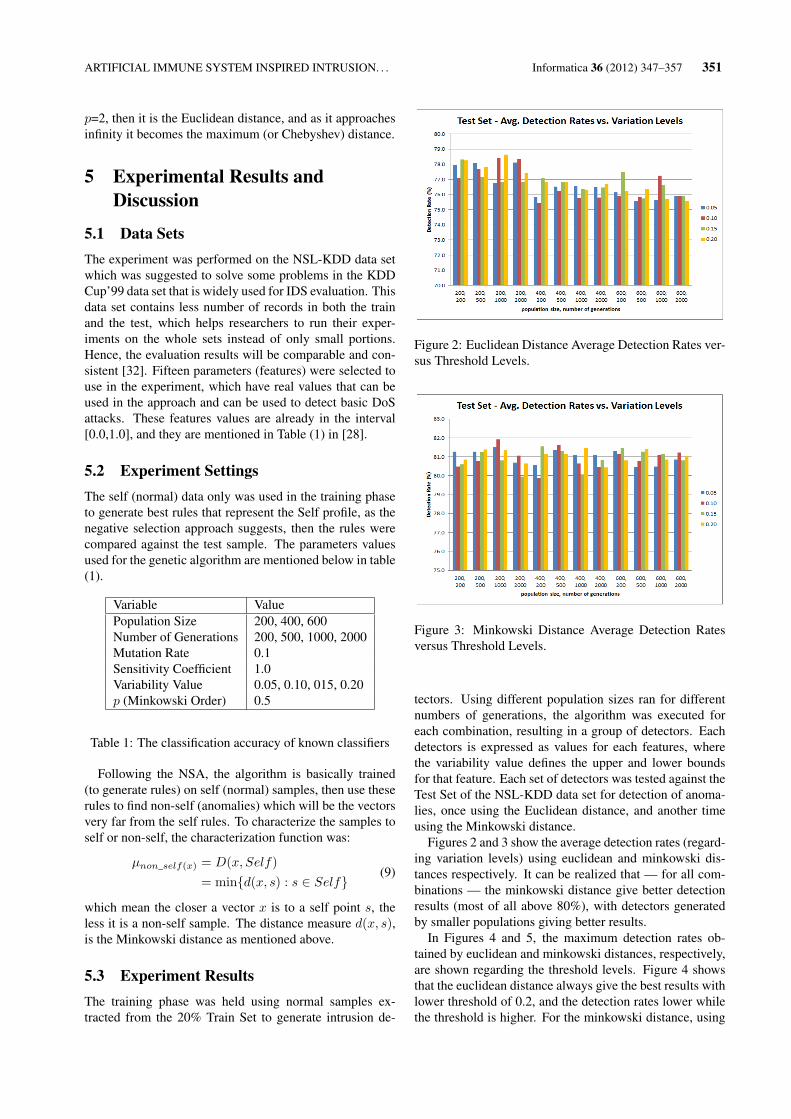
Figures 2 and 3 show the average detection rates (regard-ing variation levels) using euclidean and minkowski dis-tances respectively. It can be realized that — for all com-binations — the minkowski distance give better detectionresults (most of all above 80%), with detectors generatedby smaller populations giving better results.
In Figures 4 and 5, the maximum detection rates ob-tained by euclidean and minkowski distances, respectively,are shown regarding the threshold levels. Figure 4 showsthat the euclidean distance always give the best results withlower threshold of 0.2, and the detection rates lower whilethe threshold is higher. For the minkowski distance, using

352 Informatica 36 (2012) 347–357 A.S.A. Aziz et al.
Figure 4: Euclidean Distance Maximum Detection Ratesversus Threshold Levels.
Figure 5: Minkowski Distance Maximum Detection Ratesversus Threshold Levels.
higher threshold gives better results with detectors gener-ated by smaller populations. Using lower threshold gavebetter results when used with detectors generated by big-ger populations.
Comparing the maximum rates regarding variation lev-els, they are shown in Figures 6 and 7 for euclidean andminkowski distances respectively. With the euclidean dis-tance, detectors generated by less number of generationsgive better results with smaller variation levels. Highervariations levels are better for detectors generated by morenumber of generations. For the minkowski distance results,variation levels of 0.10 and 0.15 give higher detection rateswith detectors generated by bigger population. But usingless number of generations give better detection rates withlower variation levels (0.05 and 0.10).
5.4 Comparison analysisIn [33], they ran the machine learning algorithms imple-mented in the project WEKA [34] against the NSL-KDDTest Set. The detection accuracy is listed in table (2) along
Figure 6: Euclidean Distance Maximum Detection Ratesversus Variation Levels.
Figure 7: Minkowski Distance Maximum Detection Ratesversus Variation Levels.
with the suggested algorithm, and it shows that using theminkowski distance has very good detection accuracy com-pared to those approaches used
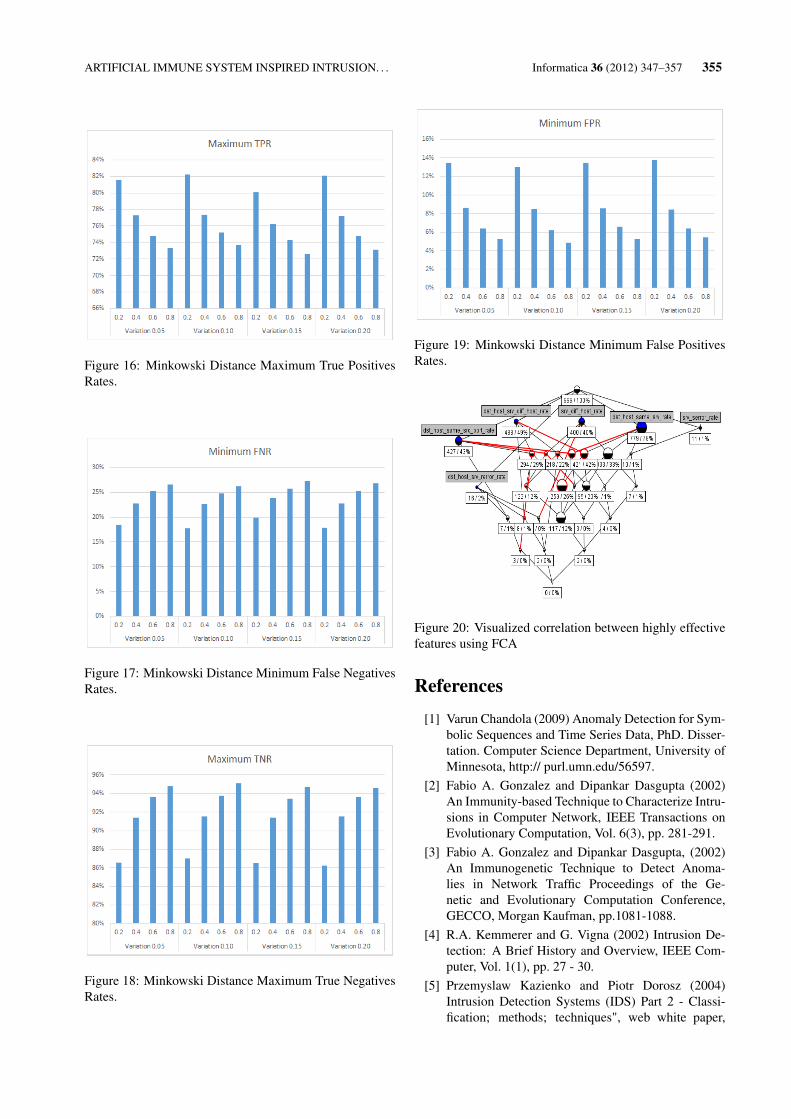
Analysing the performance of the proposed approachfor intrusion detection, evaluation measures are calculated,which are: true/false positives and negatives rates andshown in the following Figures. In Figures 8 and 9, wecan realize that detectors generated by GA using biggerpopulations give higher True Negatives Rates (TNR) (andlower False Positives Rates (FPR)) than those generated us-ing smaller population. Consequently, using smaller pop-ulation result in higher True Positives Rates (TPR) andlower False Negatives Rates (FNR) than using bigger pop-ulations, as shown in Figures 10 and 11 respectively.Looking more into results regarding variation values (thatdefine upper and lower limits of detectors conditions), highvariation levels result in higher TNRs and lower FPRs withthe detectors generated by bigger populations as realizedin Figures 12 and 13. Figures 14 and 15 show that TPRsare higher (and FNRs are lower) with lower variation lev-els. Based on threshold values — mentioned in table

ARTIFICIAL IMMUNE SYSTEM INSPIRED INTRUSION. . . Informatica 36 (2012) 347–357 353
Classifier Classificationname accuracyj47 81.05%Naive Bayes 76.56%NBTree 82.03%Random Forest 80.67%Random Tree 81.59%Multi-layer Perception 77.41%SVM 68.52%Suggested Algorithm - Eu-clidean
81.76 %
Suggested Algorithm -Minkowski
82.13 %
Table 2: The classification accuracy of known classifiers
Figure 8: Minkowski Distance True Negatives Rates.
(2) — used in the experiment, low threshold values helpdetect more anomalous activities, especially with low vari-ation levels. Hence, as higher the threshold becomes, thehigher the TNRs and the lower the TPRs, and it’s all shownin Figures 16 to 19.
5.5 Visualization of the correlation betweenhighly effective features
The first step applied here, is the selection of the most im-portant and effective features. A forward feature selectiontechnique is applied on the input data set based on basedon naïve Bayesian tree classification technique. The usedinput data set contains 2000 records, with a balanced dis-tribution between normal or abnormal system behaviour.For ensuring the effectiveness of the resulted accuracy, a10 fold classification methodology is applied. The resultedclassification accuracy after the selection of the features is91.3%. The selected features sorted according their impor-tance from higher to lower are:
– dst_host_same_srv_rate,
– dst_host_same_src_port_rate,
Figure 9: Minkowski Distance False Positives Rates.
Figure 10: Minkowski Distance True Positives Rates.
– srv_serror_rate,
– srv_diff_host_rate,
– dst_host_srv_rerror_rate,
– dst_host_srv_diff_host_rate
In the second step, Formal Concept Analysis is appliedon the data set containing only the selected featuresfrom the previous step. Figure 20 shows that attributesdst_host_same_srv_rate, dst_host_same_src_port_rate,srv_diff_host_rate, and dst_host_srv_diff_host_rate arehighly correlated and represent the most effective featuresin the discrimination between normal and anomalousconnections.
6 Conclusions and Future WorkIn this paper, the Minkowski distance function was appliedto detect anomalies, against using the euclidean distance.The investigation was held using different values for the pa-rameters used in the genetic algorithm to find those whichcan give better results. The system is basically an intrusiondetection system which uses detectors generated by genetic

354 Informatica 36 (2012) 347–357 A.S.A. Aziz et al.
Figure 11: Minkowski Distance False Negatives Rates.
Figure 12: Minkowski Distance Average True NegativesRates.
algorithm combined with deterministic-crowding nichingtechnique, applied on NSL-KDD IDS test data set underthe scope of negative selection theory. The Minkowski or-der can be a small value (between 0 and 1) or a big value(up to infinity). Lower values of the order are aimed ifone is interested in finding how much the objects are simi-lar. So, a value of 0.5 was used in the experiment. Withall values used within the GA, the Minkowski distancefunction gave better detection rates. Threshold values givevery good results in different cases – use detectors gener-ated by bigger populations with lower threshold values oruse detectors generated by smaller populations with higherthreshold values. Also, medium levels of variation are bet-ter used for best results (0.10 and 0.15). So, we recommendusing smaller populations to generate detectors for: (1) tak-ing less time to run, and (2) give less number of detectorshence, less time detecting anomalies against the detectorsset. Finally, it’s a matter of balancing between the IDSsensitivity (TPRs) and specificity (TNRs) that helps in thedecision of which threshold and variability values to usefor best results.
Figure 13: Minkowski Distance Average False PositivesRates.
Figure 14: Minkowski Distance Average True PositiveRates.
Figure 15: Minkowski Distance Average False NegativesRates.
ARTIFICIAL IMMUNE SYSTEM INSPIRED INTRUSION. . . Informatica 36 (2012) 347–357 355
Figure 16: Minkowski Distance Maximum True PositivesRates.
Figure 17: Minkowski Distance Minimum False NegativesRates.
Figure 18: Minkowski Distance Maximum True NegativesRates.
Figure 19: Minkowski Distance Minimum False PositivesRates.
Figure 20: Visualized correlation between highly effectivefeatures using FCA
References
[1] Varun Chandola (2009) Anomaly Detection for Sym-bolic Sequences and Time Series Data, PhD. Disser-tation. Computer Science Department, University ofMinnesota, http:// purl.umn.edu/56597.
[2] Fabio A. Gonzalez and Dipankar Dasgupta (2002)An Immunity-based Technique to Characterize Intru-sions in Computer Network, IEEE Transactions onEvolutionary Computation, Vol. 6(3), pp. 281-291.
[3] Fabio A. Gonzalez and Dipankar Dasgupta, (2002)An Immunogenetic Technique to Detect Anoma-lies in Network Traffic Proceedings of the Ge-netic and Evolutionary Computation Conference,GECCO, Morgan Kaufman, pp.1081-1088.
[4] R.A. Kemmerer and G. Vigna (2002) Intrusion De-tection: A Brief History and Overview, IEEE Com-puter, Vol. 1(1), pp. 27 - 30.
[5] Przemyslaw Kazienko and Piotr Dorosz (2004)Intrusion Detection Systems (IDS) Part 2 - Classi-fication; methods; techniques", web white paper,

356 Informatica 36 (2012) 347–357 A.S.A. Aziz et al.
http://www.windowsecurity.com/articles/ids-part2-classification-methods-techniques.html.
[6] Tarek S. Sobh and Wael M. Mostafa (2011) A co-operative immunological approach for detecting net-work anomaly", Applied Soft Computing, Elsevier,Vol. 11(1), pp. 1275-1283.
[7] P. Garcia Teodorro, J. Diaz-Verdejo, G. Marcia-Fernandez, E. Vazquez (2009) Anomaly-based net-work intrusion detection: Techniques, systems andchallenges, Computers and Security, Elsevier, Vol.28(1-2), pp.18-28.
[8] Wei Li (2004) Using Genetic Algorithm for Net-work Intrusion Detection", Proceedings of the UnitedStates Department of Energy Cyber Security Grou,Training Conference, Vol. 8, pp. 24-27.
[9] S.X. Wu and W. Banzhaf (2010) The use of computa-tional intelligence in intrusion detection systems: Areview, Applied Soft Computing, Vol. 10, pp. 1-35.
[10] L.N. De Castro and J. Timmi (2002) Artificial Im-mune Systems: a new computational intelligence ap-proach, Springer, Book Chapter, 1st Edition., XVIII,380 p.
[11] Dipanker Dasgupta (2006) Advances in ArtificialImmune Systems, IEEE Computational IntelligenceMagazine, Vol. 1(4), pp. 40-49.
[12] U. Aickelin and D. Dasgupta (2003) Artificial Im-mune Systems, Book Chapter, Search Methodolo-gies: Introductory Tutorials in optimization and de-cision support techniques, Springer, pp. 375-399.
[13] Julie Greensmith, Amanda Whitbrook, Uwe Aick-elin (2010) Artificial Immune Systems, Handbookof Metaheuristics, International Series in Opera-tions Research and Management Science, Springer,Springer US, Vol. 146, pp. 421-448.
[14] Dipankar Dasgupta, Senhua Yu, Fernando Nino(2011) Recent Advances in Artificial Immune Sys-tems: Models and Applications, Applied Soft Com-puting, , Vol. 11(2), pp. 1574-1587.
[15] Mehdi Kaytoue, Sébastien Duplessis, Sergei O.Kuznetsov and Amedeo Napoli (2009) Two FCA-Based Methods for Mining Gen Expression Data",Lecture Notes in Computer Science, Vol. 5548, pp.251-266.
[16] Richard Cole, Peter Eklund, Don Walker (1998) Us-ing Conceptual Scaling In Formal Concept Analy-sis For Knowledge And Data Discovery In Medi-cal Texts", Proceedings of the Second Pacific AsianConference on Knowledge Discovery and Data Min-ing, pp. 378-379.
[17] Wei Li and Issa Traore (2004) Detecting New Formsof Network Intrusion Using Genetic Programming",Computational Intelligence, Vol. 20(3), pp. 475-494.
[18] Anup Goyal, Chetan Kumar (2008) GA-NIDS: AGenetic Algorithm based Network Intrusion Detec-tion System.
[19] M. M. Pillai, Jan H. P. Eloff, H. S. Venter (2004) AnApproach to implement Network Intrusion DetectionSystem Using Genetic Algorithms", SAICSIT ’04Proceedings of the 2004 annual research conferenceof the South African institute of computer scientistsand information technologists on IT research in de-veloping countries, pp. 221-221.
[20] McFadden (2008) Genetic Algorithms and NetworkIntrusion Detection", MBI 640 Data Communica-tions & Network Security, Northern Kentucky Uni-versity.
[21] Hossein M. Shirazi and Kalaji Y (2010) An Intelli-gent Intrusion Detection System Using Genetic Al-gorithms and Feature Selection", Majlesi Journal ofElectrical Engineering, Vol. 4, No. 1, pp. 33-37.
[22] Fan Li (2010) Hybrid Neural Network Intrusion De-tection System Using Genetic Algorithm, Multime-dia Technology (ICMT), International Conference,pp. 1-4.
[23] Sadiq Ali M Khan. (2011) Rule based Network In-trusion Detection using Genetic Algorithm, Interna-tional Journal of Computer Applications, Vol. 18,Np. 8, pp. 26-29, Published by Foundation of Com-puter Science.
[24] Mohammad Sazzadul Hoque, Md. Abdul Mukit, Md.Abu Naser Bikas (2012) An Implementation of In-trusion Detection System using Genetic Algorithm,International Journal of Network Security & Its Ap-plications, Vol. 4, No. 2, pp. 109-120.
[25] Alabsi,F. and Naoum,R. (2012) Fitness Function forGenetic Algorithm used in Intrusion Detection Sys-tem". International Journal of Applied Science andTechnology, Vol. 2, No. 4, pp. 129-134.
[26] Kshirsagar, Vivek K., Sonali M. Tidke, and SwatiVishnu (2012) Intrusion Detection System using Ge-netic Algorithm and Data Mining: An Overview., In-ternational Journal of Computer Science and Infor-matics ISSN (PRINT): pp. 2231-5292.
[27] Owais, Suhail, Vaclav Snasel, Pavel Kromer, andAjith Abraham (2008) Survey: using genetic algo-rithm approach in intrusion detection systems tech-niques, In IEEE Computer Information Systemsand Industrial Management Applications, CISIM’08.7th, pp. 300-307.
[28] Amira Sayed A. Aziz, Mostafa Salama, Aboul ellaHassanien, Sanaa EL-Ola Hanafi (2012) DetectorsGeneration using Genetic Algorithm for a NegativeSelection Inspired Anomaly Network Intrusion De-tection System", In proceeding of: IEEE FedCSIS,At Wroclaw, Poland, pp. 625-631, ISBN 978-83-60810-51-4.
[29] Ole Mengshoel and David E. Goldberg (2008) TheCrowding Approach to Niching in Genetic Algo-rithms, Evolutionary Computation, MIT Press Cam-bridge, Vol. 16(3), pp. 315-354.
[30] Jan Schultz (2008) Minkowski Distance,http://en.wikipedia.org/wiki/Minkowski_distance.

ARTIFICIAL IMMUNE SYSTEM INSPIRED INTRUSION. . . Informatica 36 (2012) 347–357 357
[31] John P. Van de Geer (2003) Some Aspects ofMinkowski Distances, Department of Data Theory,Leiden University, RR-95-03.
[32] NSL-KDD data set, http://nsl.cs.unb.ca/NSL-KDD/[33] M. Tavallaee, E. Bagheri, W. Lu, A. A. Ghorbani
(2009) A detailed analysis of the KDD CUP 99 dataset, IEEE Symposium on Computational Intelligencefor Security and Defense Applications, CISDA, pp.1-6.
[34] WEKA “Waikato Environment for KnowledgeAnalysis (weka) version 3.5.9", available on:http://www.cs.waikato.ac.nz/ml/weka/, Junr, 2008.

358 Informatica 36 (2012) 347–357 A.S.A. Aziz et al.

Informatica 36 (2012) 359-368 359
Usage of Holt-Winters Model and Multilayer Perceptron in Network Traffic Modelling and Anomaly Detection
Maciej SzmitOrange Labs Poland, 7 Obrzeżna Street, 02-691 Warsaw, Poland E-mail: [email protected], http://maciej.szmit.info
Anna SzmitTechnical University of Lodz, Department of Management, 266 Piotrkowska Street, 90-924 Lodz, Poland E-mail: [email protected], http://anna.szmit.info
Sławomir AdamusTechnical University of Lodz, Computer Engineering Department, 18/22 Stefanowskiego Street, 90-924 Lodz, Poland AMG.lab, 11 Lakowa Street, 90-562 Lodz, PolandE-mail: [email protected]
Sebastian BugałaTechnical University of Lodz, Computer Engineering Department, 18/22 Stefanowskiego Street, 90-924 Lodz, Poland E-mail: [email protected]
Keywords: network behavioral anomaly detection, Holt-Winters model, multilayer perceptron
Received: September 16, 2012
This paper presents results of analysis of few kinds of network traffic using Holt-Winters methods and Multilayer Perceptron. It also presents Anomaly Detection – a Snort-based network traffic monitoring tool which implements a few models of traffic prediction.
Povzetek: Predstavljena je metoda za modeliranje in iskanje anomalij v omrežju.
1 IntroductionIn modern computer networks and high-loaded business or industrial systems there is a need of continuous availability of services and hosts (see e.g. [28], [29] [30] [34]). Inaccessibility of some mission critical can cause large impact to business processing continuity and this as a result would generate looses. Solution for such potential problems could be permanent and uninterrupted supervision on network health. This in turn can be achieved by implementation of some monitoring solution. Efficient monitoring method helps achieve high service availability and it will be a good idea to extend network security by tools such as Intrusion Detection System, Intrusion Prevention System and Unified Thread Managers (see e.g. [32] [33]). IDS is a tool which monitors and analyses in real time every aspect of inbound and outbound traffic of the network. Based on the analysis and based on one of the mechanisms responsible for threat detection creates reports of the abnormalities of network traffic. Most common mechanisms which detect threats used in IDS are misuse detection and anomaly detection, they are two different approaches to threat detection, first one relays on determination abnormal parameters and network traffic behavior, everything which we do not know is treated as normal, second one is a reverse of the first one, it treats everything which deviates from the standard is treated as potential threat. IDS on its own only reports and logs the
abnormalities and does not take any further actions and his role is to report to administrator which is whom decides what action should be taken to prevent imminent danger which can be a cumbersome for the administrator with a large number of notifications. In order to relieve the amount of work of administrator, ideas of IDS have been extended by possibility to take defined actions immediately in case of detection of typical and schematic threats for the network, as a result IPS was created which is a variety of IDS which is compatible with tools such as firewalls and control its settings in order to counter the threat.
A typical representative of the above-described tool is Snort (see e.g. [2] [3] [31]), a software type of IDS/IPS based on mechanism which detects attack signatures originally intended only for the Unix platform, but now also transferred to the Windows operating system, developed on the principles of open source software licenses. Large capacity and performance are characteristics that gained snort popularity among users. Its modular design makes the software very flexible and thus can be easily adapted to the requirements of the currently analyzed network environments, and expand its functionality.
This article extends demonstration of the capabilities of the AnomalyDetection tool (basic overview of the tool was published in [15] and [36]) created for network

360 Informatica 36 (2012) 359–368 M. Szmit et a.
monitoring and future network traffic forecasting Snort-based applications using the flexibility and easy extensibility (the ability to create own preprocessors and postprocessors) of this program. The preprocessor was developed to extends Snorts possibilities of network traffic analysis by anomaly detection mechanism [4]. Combination of the two mechanisms (i.e., misuse detection and anomaly detection) provides more comprehensive protection against all types of threats, even those partially abstract, such as the malice of employees. Tools included in the Anomaly Detection 3.0 allows analysis of movement, its forecasting with help of its advanced statistical algorithms, evaluation of created forecasts, real-time monitoring and verifying that the individual volumes of network traffic parameters do not exceed the forecasted value and in case of exceeding the norms to generate the appropriate messages for the administrator who should check each alarm for potential threats.
Current (3.0) version (see e.g. [5], [6]) of AnomalyDetection provides monitoring of following network traffic parameters: total number of TCP, UDP, and ICMP packets, number of outgoing TCP, UDP, and ICMP packets, number of incoming TCP, UDP, and ICMP packets, number of TCP, UDP, and ICMP packets from current subnet, number of TCP packets with SYN/ACK flags, number of outgoing and incoming WWW packets – TCP on port 80, number of outgoing and incoming DNS packets – UDP outgoing on port 53, number of ARP-request and ARP-reply packets, number of non TCP/IP stacks packets, total number of packets, TCP, WWW, UDP, and DNS upload and download speed [kBps].
Whole Anomaly Detection application consists of three parts: Snorts preprocessor, Profile Generator and Profile Evaluator. Data exchange between these parts is realized by CSV (Comma Separated Values) files (see: Figure 1).
Figure 1: Anomaly Detection data flow diagram. Source: [15].
Gray solid arrows means saving to file and black dotted –reading from file. Particular files stands for: Log file – this file gathers all network traffic data
collected with AD Snort preprocessor. Data from
this file is next used by Profile Generator for network traffic forecasting.
Profile file – this file stores network profile computed with Profile Generator. This file is generated by Profile Generator and used by AD preprocessor for detecting anomalies and generating alerts. After every passed time period preprocessor reads profile file and looks for data corresponding to current period. If value for some counter exceeds minimum (MIN) to maximum (MAX) range then alert is generated.
Predicted pattern file – predicted pattern file contains predicted future data for network – in fact this is the same file as profile file, but with single value for each counter. This is necessary for evaluating profile in AD Evaluator script. Structure of pattern file is the same as log file.
Pattern file – this file is created like predicted pattern file, but network traffic profile stored in this file is historical data.
Parameters file – this file stores information for method of profile generation and method parameters values. This file has different structure for every algorithm of profile generation.
Structures of log and profile files can be found in [15]. Anomaly Detection have two main modes:
data acquisition mode – only network traffic statistics are saved into log file. Only log file is created in this mode.
alerting mode – instead of data acquisition there is also created profile file and current traffic statistics are compared to values stored in profile file. In thismode log and profile file are required.
Pattern, predicted pattern and parameters files are always optional and they're useful for future research.
Anomaly Detection 3.0 can be downloaded from http://anomalydetection.info [24]. Preprocessor is available as source or RPM package. Both Profile Generator and Evaluator are available as R scripts –additional R CRAN (free) software is required for use R scripts. Additional instalation, update and removal scripts are provided for Profile Generator and Evaluator.
2 PreprocessorThe main part of the Anomaly Detection system is a preprocessor written in C programming language, designed to enhance Snort possibilities to monitor, analyze and detect network traffic anomalies using NBAD (Network Behavioral Anomaly Detection) approach. The first version of AnomalyDetection preprocessor [6] for Snort version 2.4x was published in a Master’s Thesis [25] in 2006. Next the project has been developed (see e.g. [5] [7] [8] [9] [17]) till the current version 3.0 designed for Snort 2.9.x.
The main task of the preprocessor is anomaly detection, realized by using a simple algorithm based on data acquisition and subsequent comparison of the collected values with pattern. Preprocessor reads a predicted pattern of the network traffic (of all

USAGE OF HOLT-WINTERS MODEL AND… Informatica 36 (2012) 359–368 361
parameters) from the ‘profile’ file and generates alert when the current value exceeds ‘minimum’ to ‘maximum’ range for the current moment (the moment is given by day of the week, hour, minute and second corresponding to the intervals from the log file) from the profile file.
The profile can be generated ‘manually’, using external tools, or by a Profile Generator using appropriate model, based on historic values from the log file. The architecture affords easy implementation of different statistical models of the traffic and usage of different tools (i.e. statistical packets) for building profiles. Data from the profile is read in intervals defined by the user, there is only one line read into the structure at a time, this gives possibility to dynamically alter the profile file. In case of failure to find the correct entry in the profile, anomaly report module is automatically disabled to prevent generation of false positive alerts.
As mentioned above the current version of the preprocessor can work with adaptive network models through changes in the algorithm which loads profile information. Abandoned single network profile load for the load of single-line in specified time interval. Profile data is loaded at exact time of writing counter to the log file. This solution although increases the number of I/O operations adversely affecting the performance but also supports replacing another model during runtime without having to restart whole application. In addition, all the calculations have been relegated to third-party applications and the profile has been changed so that it contains the minimum and maximum value. This approach makes the preprocessor is more flexible and efficient, does not limit the user to use a single method to generate a network profile, the profile can be freely generated by any application while maintaining only the appropriate input format. Reporting anomalies was adjusted to snort standards by implementing a mechanism which reports events and handle these events by dedicated preprocessor rules. The user can freely adjust the rules to fit his needs, for example; the content of messages stored in the log, which is a priority or which action should be taken when matching rules. These changes make the application more customizable and user-friendly. Improving algorithm for packet acquisition by removing unnecessary comparisons and optimizations of other ones and increased capacity of counters made it possible to use preprocessor in networks with high bandwidth 1Gb and above.
The next function of the preprocessor is generating alerts. Preprocessor reads a predicted pattern of the network traffic (of all parameters) from the ‘profile’ file and generates alert when the current value exceeds ‘minimum’ to ‘maximum’ range for the current moment (the moment is given by day of the week, hour, minute and second corresponding to the intervals from the log file) from the profile file.
The profile can be generated ‘manually’, using external tools, or by a Profile Generator using appropriate model, based on historic values from the log file. The architecture affords easy implementation of different statistical models of the traffic and usage of
different tools (i.e. statistical packets) for building profiles. Data from the profile is read in intervals defined by the user, there is only one line read into the structure at a time, this gives possibility to dynamically alter the profile file. In case of failure to find the correct entry in the profile, anomaly report module is automatically disabled to prevent generation of false positive alerts.
3 Profile GeneratorIn previous versions of AnomalyDetection system profile generation module was included in preprocesor module –because of this whole application was inflexible. The current version of Profile Generator (see e.g. [7] [8] [9]) have been separated into independent module which can be used to compute statistical models not only for AD preprocessor. Furthermore current version is based on R language / environment (The R Project for Statistical Computing) (see e.g. [10] [11] [12] [13] [14]) which is more flexible and user-friendly than previous implementation in C language. R-project is an free, open source packet for statistical computing and graphics. In this implementation optional packages for R: tseries, quadprog, zoo and getopt are used.
The whole implementation of Profile Generator is divided into few parts. First part prepares data from log file for further calculations and other parts – depending on the given parameters – calculates future network traffic forecasts. At the end all computed values are written into proper files – based on given runtime parameters. Data flow in ProfileGenerator module is shown on Figure 2.
Figure 2: Profile Generator data flow diagram. Source: [35].
Profile Generator is controlled with parameters passed for script execution – all script parameters are handled with getopt() function.
Particular columns of specification matrix contains respectively:
long flag name short flag

362 Informatica 36 (2012) 359–368 M. Szmit et a.
parameters arguments arguments type description
Profile Generator actually implements five methods of profile file generation: moving average, naive method, autoregressive time series model, Holt-Winters model and Brutlags version of HW model (see e.g. [1] [17]). The value of dependent variable is given as follows:Moving average:
k
yy
t
ktii
t
1
(1)
Naive method:
Ttt yy (2)
where T is day or week period, or
1 tt yy
(3)
Autoregressive time series model:
ktkttt yayayaay ...22110
(4)
Holt-Winters model:
Ttttt SPLy 11
(5)
where:L is level component given by:
))(1()( 11 ttTttt PLSyL (6)
P is trend component given by:
11 )1()( tttt PLLP (7)
S is seasonal component given by:
Ttttt SLyS )1()( (8)
Brutlag method:
TtTtttt mdSPLy 11max
(9)
TtTtttt mdSPLy 11min
(10)
where:
L , P and S are the same as in Holt-Winters modeld is predicted deviation given by:
1)1(ˆ ttt dyyd (11)
where:
k is number of measurements in time seriest is moment in time
y
is predicted value of variable in moment t
yt is real (measured) value of variable in
moment t
T is time series period is data smoothing factor
is trend smoothing factor
is the seasonal change smoothing factor
m is the scaling factor for Brutlags confidence bands
4 Implementation of Naïve Method Naïve method is the simplest method implemented in Profile Generator module. For computing profile with this method PG must be launched with '-m NAIVE' parameter. Additional '--naive' parameter can be used for defining detailed method 'periodicity'. Method implement three version of naïve prediction – LAST, DAILY and WEEKLY. For LAST version forecasted data are defined as the same as previous measurement. DAILY version means that predicted values for some day would be the same as values in previous day of given time-series. The last version stand for algorithm in which forecasted values are determined based on logged data for the same day-of-week in previous week.
Because of simplicity if this method it should be used only in adaptive startup mode – this will cause less false-positive alerts and more dynamically prediction. In this mode profile is recalculated in regular intervals of time, so predicted values refreshes with every oncoming period of counter values registration. Figure 3 shows graph with predicted values with 5 period interval of method recalculation. It can be observed step changes of predicted values in succeeding periods.
Y-axis on Fig 5 stands for minimal and maximal border of permitted values for total number of TCP packets. X-axis stands for sample number in forecasted time-series
Figure 3: Naive method running in adaptive mode with 5 period interval of recalculation. Source: [35].
5 Implementation of Moving Average Method
Moving average method is computed when ProfileGenerator is run with '-m AVG' parameter set. Detailed method periodicity and length of the horizon of values used for calculation can be defined with '--avg' parameter.
Similar to the naïve method – there are three versions of periodicity: LAST, DAILY and WEEKLY.

USAGE OF HOLT-WINTERS MODEL AND… Informatica 36 (2012) 359–368 363
There is also required second parameter which stands for number of values used to compute moving average. For example 'DAILY,3' means that values from three previous days would be used to compute prediction, 'LAST,5' means that average would be computed using five previous values registered in log file.
6 Implementation of Autoregressive Model
AR model can be calculated when run with '-m AR' parameter. Calculations in this method are based on ar() function from package stats in R environment. Function ar() fits an autoregressive time series model to given data and it is wrapper for the functions: ar.yw, ar.burg, ar.ols and ar.mle. Setting 'method' parameter to ar() function defines the method used to fit the model.
There are available four algorithms used to fit model to given time-series: Yule-Walkers, Burgs, MLE (maximum likelihood) and OLS (ordinary least squares).
7 Implementation of Holt-Winters Model
The Holt-Winters model, called also the triple exponential smoothing model, is a well-known adaptive model used to modeling time series characterized by trend and seasonality (see e.g. [20], [19] p. 248, [18], [21], [22]). The model is sometimes used to modeling and prediction of network traffic (see e.g. [23],[7], [8]).
For computing an Holt-Winters model Profile Generator must be launched with parameter '-m HW'. Optional parameter '--hw' can be set for defining model periodicity and subset of data used to build model.
Implementation of Holt-Winters prediction method in Profile Generator is based on function HoltWinters() from package stats. HoltWinters() functions requires time series data as object of class 'ts' (time-series object). Object 'ts' is created as follows:ts_obj<-
ts(log.data[,column.log], frequency=profile.config.frequency, start=c(as.numeric(log.first.date),log.first.sample.no))Function 'ts' gets in this implementation 3 parameters: data – a numeric vector of the observed time-series
values frequency – the number of observations per unit of
time start – the number of observations per unit of time.
This parameter can be a single number or a vector of two integers – because of this in our implementation human-readable date from log file is converted into numeric value and second value is number of sample of first observation in the day.
Next HoltWinters() function computes Holt-Winters filtering of a given time series. Function tries to find the optimal values of or or by minimizing the
squared one-step prediction error with optim()
function. Start values for L , P and S are inferred by performing a simple decomposition in trend and seasonal component using moving averages – it is realized with decompose() function.
Figure 4 shows one weekly period (from January 1st to January 7th) of testing data.
Figure 4: One period of testing data. Source: own research.
Decompose() function decomposes a time series into seasonal, trend and irregular components using moving averages. For testing data decompose()function returns values with trend, seasonal and random component. Figure 5 shows those decomposed data.
Figure 5: Decomposed time series. Source: own research.
HoltWinters() function estimates HW model smoothing parameters (alpha, beta and gamma), which were for testing data as follows (see: Figure 6). Figure 7shows Holt-Winters fitted to observed comparison.
Figure 6: Fitted Holt-Winters. Alpha=0.8140128; beta=0; gamma=1. Source: own research.
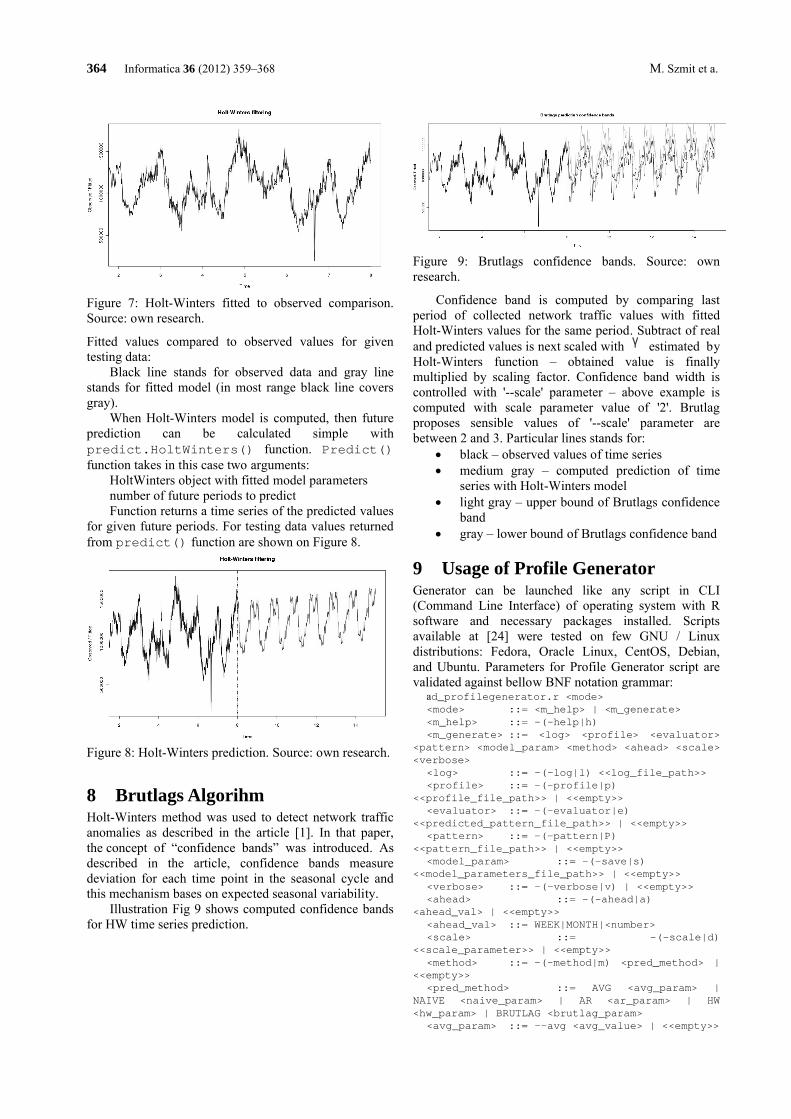
364 Informatica 36 (2012) 359–368 M. Szmit et a.
Figure 7: Holt-Winters fitted to observed comparison.Source: own research.
Fitted values compared to observed values for given testing data:
Black line stands for observed data and gray line stands for fitted model (in most range black line covers gray).
When Holt-Winters model is computed, then future prediction can be calculated simple with predict.HoltWinters() function. Predict()function takes in this case two arguments:
HoltWinters object with fitted model parametersnumber of future periods to predictFunction returns a time series of the predicted values
for given future periods. For testing data values returned from predict() function are shown on Figure 8.
Figure 8: Holt-Winters prediction. Source: own research.
8 Brutlags AlgorihmHolt-Winters method was used to detect network traffic anomalies as described in the article [1]. In that paper, the concept of “confidence bands” was introduced. As described in the article, confidence bands measure deviation for each time point in the seasonal cycle and this mechanism bases on expected seasonal variability.
Illustration Fig 9 shows computed confidence bands for HW time series prediction.
Figure 9: Brutlags confidence bands. Source: own research.
Confidence band is computed by comparing last period of collected network traffic values with fitted Holt-Winters values for the same period. Subtract of real and predicted values is next scaled with γ estimated by Holt-Winters function – obtained value is finally multiplied by scaling factor. Confidence band width is controlled with '--scale' parameter – above example is computed with scale parameter value of '2'. Brutlag proposes sensible values of '--scale' parameter are between 2 and 3. Particular lines stands for:
black – observed values of time series medium gray – computed prediction of time
series with Holt-Winters model light gray – upper bound of Brutlags confidence
band gray – lower bound of Brutlags confidence band
9 Usage of Profile GeneratorGenerator can be launched like any script in CLI (Command Line Interface) of operating system with R software and necessary packages installed. Scripts available at [24] were tested on few GNU / Linux distributions: Fedora, Oracle Linux, CentOS, Debian, and Ubuntu. Parameters for Profile Generator script are validated against bellow BNF notation grammar:
ad_profilegenerator.r <mode> <mode> ::= <m_help> | <m_generate> <m_help> ::= -(-help|h) <m_generate> ::= <log> <profile> <evaluator>
<pattern> <model_param> <method> <ahead> <scale> <verbose>
<log> ::= -(-log|l) <<log_file_path>> <profile> ::= -(-profile|p)
<<profile_file_path>> | <<empty>> <evaluator> ::= -(-evaluator|e)
<<predicted_pattern_file_path>> | <<empty>> <pattern> ::= -(-pattern|P)
<<pattern_file_path>> | <<empty>> <model_param> ::= -(-save|s)
<<model_parameters_file_path>> | <<empty>> <verbose> ::= -(-verbose|v) | <<empty>> <ahead> ::= -(-ahead|a)
<ahead_val> | <<empty>> <ahead_val> ::= WEEK|MONTH|<number> <scale> ::= -(-scale|d)
<<scale_parameter>> | <<empty>> <method> ::= -(-method|m) <pred_method> |
<<empty>> <pred_method> ::= AVG <avg_param> |
NAIVE <naive_param> | AR <ar_param> | HW <hw_param> | BRUTLAG <brutlag_param>
<avg_param> ::= --avg <avg_value> | <<empty>>

USAGE OF HOLT-WINTERS MODEL AND… Informatica 36 (2012) 359–368 365
<naive_param> ::= --naive <naive_value> | <<empty>>
<ar_param> ::= --ar <ar_value> | <<empty>> <hw_param> ::= --hw <hw_value> | <<empty>> <brutlag_param>::= --brutlag <brutlag_value>
| <<empty>> <avg_value> ::= (LAST|DAILY|WEEKLY),<number> <naive_value>::= (LAST|DAILY|WEEKLY) <ar_value> ::=
(DAILY|WEEKLY),(YW|BURG|MLE|OLE) <hw_value> ::= (DAILY|WEEKLY) <brutlag_value> ::= (DAILY|WEEKLY) <number> ::=
<number><number>|0|1|2|3|4|5|6|7|8|9
Sense of each parameter impact is clarified under '--help' parameter. At least one of <profile>,<evaluator>,<pattern>, or <model_param> parameter should be set for any sense of running script.
For example the simplest naïve prediction for real data stored in 'log.csv' file with saving profile data to 'profile.csv' file can be launched with: ./ad_profilegenerator.r -l log.csv -p profile.csv -m NAIVE --naive LAST
Prediction for one week for the same file based on Holt-Winters algorithm with daily periodicity and with 'verbose' mode can be calculated with:./ad_profilegenerator.r -l log.csv -p profile.csv -m HW --hw DAILY –ahead WEEK -v
10 EvaluatorProfile Evaluator is` the third part of Anomaly Detection project. This script is designed for fast evaluation of profile file compared to log file. This script calculates
simple statistic M
MAEfor two files. Main application of
Evaluator is to check fit between pattern and current logged values (with log and pattern file) or between model and historical data (log and predicted pattern file).
MAE means Mean Absolute Error and M means Mean.
n
t
n
tttt e
nyy
nMAE
1 1
1ˆ
1(12)
n
tty
nM
1
1(13)
where:
ty is real (current) value of counter in moment t
tyis predicted (estimated) value of counter in
moment t
te is prediction error in moment tCalculated values for each counter can be stored in output file when '-s' parameter is set. Exemplary comparison of real registered values with its prediction is shown on Fig 10.
Figure 10: Real values compared to AVG - DAILY,3 prediction. Source: [35].
Profile Evaluator script is launched likewise Profile Generator script. Profile Evaluator script parameters grammar looks as follows:
ad_evaluator.r <mode> <mode> ::= <m_help> |
<m_evaluate> <m_help> ::= -(-help|h) <m_evaluate> ::= <log> <pattern> <save> <skip>
<verbose> <log> ::= -(-log|l) <<log_file_path>> <pattern>::= -(-pattern|p)
<<pattern_file_path>> <save> ::= -(-save|s)
<<save_maem_file_path>> <<empty>> <skip> ::= -(-skip|S) <number> |
<<empty>> <verbose> ::= -(-verbose|v) | <<empty>>
Evaluation of pattern stored in 'pattern.csv' file compared with log data stored in 'log.csv' file can be done with:./ad_evaluator.r -l log.csv -p pattern.csv --verbose
11 Multilayer PerceptronAll our previous models can be classified as statistical model assigned to one of two groups: Time Series Models and descriptive models. The next step is usage of artificial-intelligence methods, particularly Artificial Neural Networks (ANN) which are implemented only as offline models in the current state of our research.
Artificial Neural Networks are the mathematical models inspired by biological neural networks. ANN consist of an interconnected group of artificial neurons operating in parallel. ANN function is determined by the weights of the connections between neurons, which usually change during a learning phase. There are a lot oftypes and architectures of ANN according on their purpose.
Because of the nature of IDS there are two main groups of issues: pattern recognition, especially classification and prediction. These issues correspond with two main areas of application of ANN. In consequence ANN can be used for intrusion detection in two main ways: as a classifier which determine whether a given object (for example: network packet, e-mail, network flow) is normal or suspicious and as a predictor which try to forecast a future values of system parameters (for example: network traffic, CPU utilization, number of network connections). There are a lot of publications about usage different types of ANN for network traffic prediction (See e.g.: [22], [23], [24], [25]) or intruder detection (See e.g.: [19], [20], [21]).

366 Informatica 36 (2012) 359–368 M. Szmit et a.
In our current research we choose the simplest artificial neural network – Multilayer Perceptron (MLP) for prediction of traffic time series values.
An MLP is a network of neuron called perceptrons. The perceptron is a binary classifier which compute a single output from multiple inputs (and the 'bias', a constant term that does not depend on any input value) as function of its weighted sum.
n
iii bwxwy
10 (14)
where:y is the output value is activation function w is weight vectorx is input vector
b is bias
MLP is a feedforward artificial neural network model consisting of layers of perceptrons, that maps sets of input data onto a set of appropriate output (see: Figure 11).
Figure 11: Overall look of MLP. Source: own research.
There are a few possible MLP architectures which can be used for time series prediction. One can use output layer with single neuron and its output value can be interpreted as the predicted value of the time series in the next moment or output layer with a group of neurons, which represent predicted time series values in a few next moments. The input layer can consist of different number of neurons too. When modelled time series has periodical character it seems to be good idea to set the number of input neuron equal to the period length or as multiple of the length, but when the whole period consists of big number of observations (i.e. our series day has 144 and week – 1008 observations), the ANN constructed in this way may be too big. Number of hidden layers and number of neurons in the hidden layers may be arbitrarily preselected or automatically set by ANN emulator.
In the research we decided to use the architectureswith input neurons concerning the investigated time series value delayed by one, two, three measurements, one day, one day and one measurement, one week and one week and one measurement, one hidden layer and one output neuron. The network architecture were automatically optimized by adding input neurons (the neurons that did affect to output value).
12 Results and ConclusionsWe decided to collect network traffic data from a few small- and middle-sized networks, described in the Table 1.
W1 Amateur campus network consisting of circa 25 workstrations. IDS has worked on the router which act also as the gateway to the Intenret as well as a few servers (www, ftp etc.).
T2 Campus network provided by middle-size IAP (about 400 clients)
T3 A network in a block of flats; one of networks mentioned in T1, containing about 20 clients
MM Home network connected to the campus amateur network (with maximum speed of inbound traffic set on the bandwidth manager to 4 Mbps. The home network consist of five computers and two servers protected by firewall.
II Local Area Network in small company (about 40 computers, two intranet servers).
Table 1: Investigated networks description(detailed information about these networks and descriptive statistics of collected time series are described in [9]). Source: own research.
Ser
ies
Pro
toco
l
Hol
t-W
inte
rsMLP
Topology
MA
E/M
W1 TCP 45,922-1-1(-1,-3)
46,18
W1 UDP 30,191-2-1(-1)
31,73
W1 ICMP 31,274-2-1(-1, -2, -3, -144)
34,54
T2 TCP 4,191-1-1(-1)
4,23
T2 UDP 15,875-1-1(-1, -2, -3, -144, -1009)
15,41
T2 ICMP 8,532-2-1(-1, -2)
8,66
T3 TCP 4,111-1-1(-1)
4,07
T3 UDP 15,451-1-1(-1)
15,05
T3 ICMP 8,693-1-1(-1, -3, -1008)
8,91
MM TCP 64,402-2-1(-1, -2)
75,72
MM UDP 28,884-1-1(-1, -3, -145, -1009)
30,12
MM ICMP 10,573-1-1(-1,-2,-3)
10,93
II TCP 36,422-1-1(-1,-2)
41,14
II UDP 49,555-1-1(-1, -2, -3, -144, 1008)
48,42
II ICMP 110,651-1-1(-1)
116,44
Table 2: Models fit. Source: own research.

USAGE OF HOLT-WINTERS MODEL AND… Informatica 36 (2012) 359–368 367
Detailed results (in percent) of Holt-Winters models from the previous research and the MLP from the current one are shown on the Table 2. The “topology” column describes structure of particular MLP: number of neurons in input, hidden and output layer (f.e. “3-2-1” means “three input, two hidden and one output neuron”) and information about delayed variables in input layer (f.e. “-1, -145” means: delayed by one measurement on the first input and delayed by 145 measurements on the second one; because we use time series with 10-minutes interval 144 means one day and 1008 means one week).
As one can see ANN appears to be promisingsolutions for traffic modelling. In the most of cases its fit is similar to the Holt-Winters Model and to the other models form our previous research. In the future works we plan to develop appropriate anomaly detection algorithm for MLP model and implement it as anadditional model in profile generator. Also we plan to test another ANN models and architectures to improve the fit of our models.
13 Direction for future researchAt the moment the most needed improvement to out program is to use a database for logging network traffic parameters instead of flat comma separated values file. For short logging time interval log file would grow rapidly and in the course of time access to log data will raise. Usage of database would have one other more major advantage – obtaining a needed sub-collection of log data will be easier and faster. Moreover by not using file for log data there should be lower memory and disk usage consumption – actually all data from log file are loaded into memory during forecasts calculations. With simple SQL queries there would be no need to do this –only data for current counter (time series) are necessary.
Second awaited development is use of NetFlow / IPFIX standard in storing and calculating network data. By this it would be simple to collect network data from many observation points. Afterwards device which support IPFIX protocol can filter and aggregate data and send it to Anomaly Detection server for further analysis. Implementation of IPFIX protocol would be good starting point for further improvements such as flow or route analysis (see e.g. [26] [27]).
References[1] J. D. Brutlag, “Aberrant Behavior Detection in
Time Series for Network Monitoring” 14th System Administration Conference Proceedings, New Orleans 2000, pp. 139-146
[2] J. Koziol, “Intrusion Detection with Snort”, Sams Publishing, Indianapolis, 2003
[3] R. Rehman, “Intruder Detection with Snort”, New Jersey 2003
[4] M. Skowroński, R. Wężyk, M. Szmit, “Preprocesory detekcji anomalii dla programu Snort” [inw:] Sieci komputerowe. T. 2. Aplikacje i zastosowania, Wydawnictwa Komunikacji i Łączności, Gliwice 2007, pp. 333-338
[5] M. Szmit, R. Wężyk, M. Skowroński, A. Szmit, “Traffic Anomaly Detection with Snort” [in:] Information Systems Architecture and Technology. Information Systems and Computer Communication Networks, Wydawnictwo Politechniki Wrocławskiej, Wrocław 2007, pp. 181-187
[6] M. Skowroński, R. Wężyk, M. Szmit, “Detekcja anomalii ruchu sieciowego w programie Snort,”„Hakin9” Nr 3/2007, pp. 64-68
[7] M. Szmit, A. Szmit, Usage of Modified Holt-Winters Method in the Anomaly Detection of Network Traffic: Case Studies, Journal of Computer Networks and Communications, vol. 2012, DOI:10.1155/2012
[8] M. Szmit, A. Szmit, “Use of Holt-Winters method in the analysis of network traffic. Case study”, Springer Communications in Computer and Information Science vol. 160, pp. 224-231.
[9] M. Szmit, “Využití nula-jedničkových modelů pro behaviorální analýzu síťového provozu”, [in:] Internet, competitiveness and organizational security, TBU, Zlín 2011
[10] The R Project for Statistical Computing Homepagehttp://www.r-project.org/
[11] P. Biecek, “Przewodnik po pakiecie R”, Gewert i Skoczylas, 2011, Partly available on www http://www.biecek.pl/R/Rwydanie2.pdf
[12] Ł. Komsta, “Wprowadzenie do środowiska R ”,2004, Available:http://cran.r-project.org/doc/contrib/Komsta-Wprowadzenie.pdf
[13] P. Teetor, “R Cookbook”, O'Reilly Media, 2011[14] P. Teetor, “25 Recipes for Getting Started with R”,
O'Reilly Media, 2011[15] Szmit Maciej, Adamus Sławomir, Bugała
Sebastian, Szmit Anna: Anomaly Detection 3.0 for Snort(R), [in:] SECURITATEA INFORMAŢIONALĂ 2012, pp. 37-41, Laboratorul de Securitate Informaţională al ASEM, Chişinău 2012
[16] M. Szmit, A. Szmit, Usage of Pseudo-estimatorLAD and SARIMA Models for Network Traffic Prediction. Case Studies, Communications in Computer and Information Science, 2012, Volume 291, 229-236, DOI: 10.1007/978-3-642-31217-5-25
[17] M. Szmit, Modelování, simulace a behaviorální analýza procesů síťového provozu jako výzkumné metody plánování efektivního využití síťového provozu, [in:] Internet, competitiveness and organizational security, pp. 139-144, Tomas Bata University, Zlín 2012
[18] S. Gelper, R. Fried, C. Croux, “Robust forecasting with exponential and Holt–Winters smoothing” [in]: Journal of Forecasting, Volume 29, Issue 3, pp. 285–300, April 2010
[19] B. Guzik, D. Appenzeller, W. Jurek, Prognozowanie i symulacje. Wybrane zagadnienia, Wydawnictwo AE w Poznaniu, Poznań 2004
368 Informatica 36 (2012) 359–368 M. Szmit et a.
[20] P. Goodwin, “The Holt-Winters Approach to Exponential Smoothing: 50 Years Old and Going Strong”, FORESIGHT Fall 2010 pp. 30-34
[21] E.S. Gardner, Jr., Exponential Smoothing: The state of the art – Part II, International Journal of Forecasting, 22/2006, pp. 637-666.
[22] R. J. Hyndman, A. B. Koehler, J.K. Ord, R. D. Snyder, Forecasting with Exponential Smoothing: The State Space Approach, Springer, Berlin 2008
[23] P. Cortez, M. Rio, M. Rocha, P. Sousa: Multi-scale Internet traffic forecasting using neural networks and time series methods, Expert Systems: The Journal of Knowledge Engineering, (accepted paper, in press),http://onlinelibrary.wiley.com/doi/10.1111/j.14680394.2010.00568.x/abstract
[24] AnomalyDetection Homepagehttp://www.anomalygetection.info
[25] M. Skowroński, R. Wężyk, "Systemy detekcji intruzów i aktywnej odpowiedzi", Master Thesis, Politechnika Łódzka, 2004
[26] Byungjoon Lee, Hyeongu Son, Seunghyun Yoon, Youngseok Lee, “End-to-End Flow Monitoring with IPFIX” [in:] Lecture Notes in Computer Science, 2007, Volume 4773/2007, pp. 225-234, Available at:http://www.springerlink.com/content/l868g0x635324129/
[27] Youngseok Lee, Seongho Shin, Taeck-geun Kwon, “Signature-Aware Traffic Monitoring with IPFIX” [in:] Lecture Notes in Computer Science, 2006, Volume 4238/2006, pp. 82-91. Available at:http://www.springerlink.com/content/w312715821374007/
[28] James W. Hong, Sung-Uk Park, Young-Min Kang, Jong-Tae Park, “Enterprise Network Traffic Monitoring, Analysis, and Reporting Using Web Technology” [in:] Journal of Network and Systems
Management Volume 9, Number 1 (2001), pp. 89-111.
[29] Miroslaw Malek, Bratislav Milic, Nikola Milanovic, "Analytical Availability Assessment of IT Services" [in:] Lecture Notes in Computer Science, 2008, Volume 5017/2008, pp. 207-224.
[30] A. N. Nazarov, M. M. Klimanov, "Estimating the informational security level of a typical corporate network".
[31] J. Gómez, C. Gil, N. Padilla, R. Baños, C. Jiménez, "Design of a Snort-Based Hybrid Intrusion Detection System" [in:] Lecture Notes in Computer Science, 2009, Volume 5518/2009, pp. 515-522.
[32] Joshua Ojo Nehinbe, "A Simple Method for Improving Intrusion Detections in Corporate Networks" [in:] Lecture Notes of the Institute for Computer Sciences, Social Informatics and Telecommunications Engineering, 2010, Volume 41, pp. 111-122.
[33] Nathalie Dagorn, "Cooperative Intrusion Detection for Web Applications" [in:] Lecture Notes inComputer Science, 2006, Volume 4301/2006, pp. 286-302.
[34] Kulesh Shanmugasundaram, Nasir Memon, "Network Monitoring for Security and Forensics" [in:] Lecture Notes in Computer Science, 2006, Volume 4332/2006, pp. 56-70.
[35] S. Adamus, S Bugała, “Some aspects of network anomaly detection”, Master Thesis (in Polish), Technical University of Lodz, 2012
[36] M. Szmit, S. Adamus, S. Bugała, A. Szmit: “Implementation of Brutlag's algorithm in Anomaly Detection 3.0”, Proceedings of the Federated Conference on Computer Science and Information Systems, pp. 685–691, PTI, IEEE, Wrocław 2012, IEEE Catalog Number CFP1285N-USB, ISBN:978-83-60810-51-4

Informatica 36 (2012) 369–378 369
Design and Implementation of a Caching Algorithm Applicable to
Mobile Clients
Pavel Bžoch, Luboš Matějka, Ladislav Pešička and Jiří Šafařík
University of West Bohemia, Faculty of Applied Sciences
Department of Computer Science and Engineering
Univerzitní 8, 306 14 Plzeň, Czech Republic
E-mail: [email protected], [email protected], [email protected], [email protected]
Keywords: mobile device, cache, caching policy
Received: October 24, 2012
Usage of mobile devices has grown over the past years. The term “mobile devices” covers many
different kinds of devices (e.g. smart phones, cell phones, personal digital assistant (PDA), tablets,
netbooks, etc.). A typical example that shows the growth of technologies is the smart phone. A Smart
phone serves not only for voice calls and typing SMS, but can be used to access the internet and e-mails,
play music and movies, and access remote storages. The Disadvantage of mobile devices is that they do
not have a wired connection to the internet and thus the connection can vary. It can be fast while using
WI-FI or the 3G mobile network or very slow using an old GRPS technology. 3G and other
state-of-the-art technologies are not available everywhere. But users want to access their files as quickly
and reliably as they can access them on a wired connection.
If data are demanded repeatedly, they can be stored on mobile devices in an intermediate component
called a cache. However, the capacity of the cache is limited; thus we should store only the data that
will probably be demanded again in the future. In this article, we present a caching algorithm which is
based on client and server statistics. These statistics are used to predict a user’s future behaviour.
Povzetek: Opisana je nova metoda za predpomnjenje pomnilniških naprav.
1 IntroductionOver the past years, more and more people can access the
internet and produce data. The need of storing this data
has also grown. Whether data are of multimedia types
(e.g. images, audio, or video), text files, or are produced
by scientific computation, they should be stored for
sharing among users and further use. The data files can
be stored on a local file system, on a remote file system
or on a distributed file system.
A local file system (LFS) provides the data quickly
compared to other solutions. On the other hand, LFS
does not have enough capacity for storing a huge amount
of data in general. LFS is also prone to failure. Because
the data on LFS are usually not replicated, failure of the
LFS usually causes more or less temporary loss of data
accessibility, or even loss of data. Another disadvantage
of LFS is that the local data cannot be accessed remotely.
A remote file system (RFS) provides the data
remotely. RFS has otherwise the same disadvantages as
LFS. It is prone to hardware failure. RFS is also hardly
scalable. While using remote access, RFS has to use user
authentication and authorization for preventing data
stealing or corruption.
A Distributed file system (DFS) provides many
advantages over a remote file system. These advantages
are reliability, scalability, capacity, security, etc.
Accessing files from mobile devices has to take into
account changing communication channels caused by the
user’s movement. DFSs that are widely used were
designed before mobile devices spread. Now, it is hard to
develop mobile client applications and to implement
algorithms for mobile devices into a DFS. None of the
current DFSs, e.g. Andrew File System (AFS), Network
File System (NFS), Coda, InterMezzo, BlueFS,
CloudStore, GlusterFS, XtreemFS, dCache, MooseFS,
Ceph and Google File System, has suitable clients for
mobile devices [1] [2] [3].
Mobile devices have limited capacity for storing user
content. They can store up to GBs of the data. Some of
the devices can extend their capacity by using a memory
card, but the capacity of these cards is also limited
(usually to 32GB [4]). On the other hand, a DFS can
store TBs of the data.
The speed of a wireless connection is low in
comparison to a wired connection. The highest wireless
speed is often limited by the use of the Fair User Policy
(FUP) by the mobile connection provider. The FUP
restricts the quantum of the downloaded data in a period
of time [5]. In addition, the speed of a wireless
connection can vary. The newest connection technologies
are not available everywhere, but mobile users wish to
access their data as fast as possible. So far, users
download the same data repeatedly; we can use a cache
to increase system performance. In this article, we will
focus on use of the cache by mobile clients in a
distributed file system
A cache is an intermediate component which stores
data that can be potentially used in the future. While
using a cache, the overall system performance is

370 Informatica 36 (2012) 369–378 P. Bžoch et al.
improved. The cache is commonly used in database
servers, web servers, file servers, storage servers, etc. [6].
However, cache capacity is not usually sufficient to store
all requested content. When the cache is full, a system
designer must adopt an algorithm which marks old
content in the cache to be replaced. This algorithm
implements replacement policy.
Cache functionality is depicted in Figure 1. The
cache in the DFS can be on the client side as well as on
the server side.
Figure 1: Cache.
The cache on the client side stores content that has
been downloaded by a user who is running a client
application. In this case, replacement policy is usually
based on statistical information gathered from the user's
behaviour. The cache on the server side contains data
which has been requested by the most users.
Replacement policy in this case uses statistics gathered
from all users' requests. Using a cache on the server and
the client sides at the same time does not increase system
performance. Increasing the cache hit ratio on the client
side causes increasing the miss ratio on the server side
and vice versa [7].
In section 2, we introduce cache policies commonly
used. We discuss simple, statistics-based and hybrid
caching algorithms.
We present a new caching replacement policy in
section 3. We use client and server statistics in a manner
which increases system performance. In section 4, we
present results of performance analysis for the new
algorithm. The results were acquired via simulation of
user behaviour. As a remote storage for user files, we
used KIVFS. KIVFS is a distributed file system which is
being developed at the Department of Computer Science
and Engineering, University of West Bohemia [8]. KIV
is an acronym for the Czech name of our department
(Katedra Informatiky a Výpočetní techniky). KIVFS is
also designed to support mobile devices.
2 Overview of Caching Algorithms We describe replacement policies which are commonly
used in distributed file systems or in operating systems.
Clearly, an optimal replacement policy replaces data
whose next use will occur farthest in the future.
However, this policy is not implementable. We cannot
look into the future to get needed information about
usage of the data. Hence, no implementable caching
policy can be better than an optimal policy.
Caching policies can be divided into three
categories: simple, statistics-based and hybrid policies.
2.1 Simple caching algorithms
Simple caching algorithms do not use any statistics
or additional information. For replacement decisions,
they usually employ other mechanisms. Examples of
simple caching algorithms are Rand, FIFO, FIFO with
2nd
chance, and Clock None of these caching policies
takes user behaviour into account.
RAND. RAND or Random is a simple replacement
policy which chooses data to be replaced based on
random selection [9]. It is very easy to implement this
replacement policy.
FIFO. First-In First-Out is another simple
replacement policy. The data that are chosen to be
replaced are the oldest in the cache. Data in the cache are
ordered in a queue. The new data are placed on the tail of
the queue. When the cache is full and new data come into
the cache, the data from the head of the queue are
replaced [10].
FIFO with 2nd
chance (FIFO2). First-In First-Out
with second chance is a modification of the FIFO
caching policy. FIFO2 stores the data units in a queue. In
contrast to FIFO, FIFO2 stores a reference bit for each
data unit in the queue. If a cache hit occurs, the reference
bit is set to 1. When a replacement is needed, the oldest
unit in the cache with a reference bit set to 0 is replaced
and the reference bit of the older units is set to 0 at the
same time [11].
CLOCK. The Clock replacement policy stores the
data units in a circular buffer [12]. Clock stores a
reference bit for each cached unit, and a pointer into the
buffer structure. If a cache hit occurs, the reference bit of
the requested data unit is set to 1. The data to be replaced
are chosen by circularly browsing the buffer, and
searching for the unit with a reference bit set to 0. The
reference bit of each data unit with the reference bit set to
1 found during the browsing is reset to 0 [13] .
2.2 Statistics-based caching algorithms
Statistics-based algorithms employ statistical information
about data in the cache: frequency of the accesses, and
recency of the last use of data. Frequency is used by an
LFU algorithm and recency by LRU and MRU
algorithms.
LRU. The Least Recently Used replacement policy
uses the temporal locality of the data [9]. Temporal
locality means that the data units that have not been
accessed for the longest time will not be used in the near
future and can be replaced when the cache is full [14].
According to the tests [15], LRU seems to be the best
solution for caching large files. LRU is frequently
implemented with a priority queue. Priority is the
timestamp of last access. The disadvantage of the LRU
policy is that the data unit can be replaced even if the
Us
er re
qu
es
ts d
ata
Download the data and store them in the cache.
Are the data in the cache?
No, cache miss
Yes, cache hit
Pro
vid
e d
ata
to th
e u
se
r

DESIGN AND IMPLEMENTATION OF… Informatica 36 (2012) 369–378 371
unit was accessed periodically many times. In this case,
the file will probably be requested in the near future
again.
MRU. The Most Recently Used replacement policy
works conversely to LRU. MRU replaces the most
recently accessed data units. MRU is suitable for a file
which is being repeatedly scanned in a looping sequential
reference pattern [16].
LFU. The Least Frequently Used replacement policy
replaces the data that have been used least. For each data
unit there is a counter which is increased every time the
data unit is accessed [9]. The disadvantage of this
approach is that the data units in the cache that have been
accessed many times in a short period of time remain in
the cache, and cannot be replaced even if they will not be
used in the future at all.
2.3 Hybrid caching algorithms
The disadvantages of LRU and LFU replacement
policies result in hybrid algorithms. These algorithms
mostly combine LFU and LRU to get better results in the
cache hit ratio. 2Q replacement policy uses two queues. The first
queue uses the FIFO replacement policy for data units
and is used for data units that have been referenced only
once. The second queue uses LRU as a replacement
policy, and serves for so-called hot data units. Hot data
units are units that have been accessed more than once. If
a new data unit comes to the cache, it is stored in the
FIFO-queue. When the same data unit is accessed for the
second time, it is moved to the LRU-queue. The 2Q
algorithm gives approximately 5% improvement in the
hit ratio over LRU [17].
MQ replacement policy uses multiple LRU-queues.
Every queue has its own priority. The data units with a
lower hit count are stored in a lower priority queue. If the
number of the hit count reaches the threshold value, the
data unit is moved to the tail of a queue with a higher
priority. When a replacement is needed, the data units
from the queue with the lowest priority are replaced [18].
FBR replacement policy uses the benefits of both
LFU and LRU policies. FBR divides the cache into three
segments: a new segment, a middle segment, and the old
segment. Data units are placed into sections based on
their recency of usage. When a hit occurs, the hit counter
is increased only for data units in the middle and old
segments. When a replacement is needed, the policy
chooses the data unit from the old segment with the
smallest hit count [19].
LIRS replacement policy uses two sets of referenced
units: the High Inter-reference Recency (HIR) unit set
and the Low Inter-reference Recency (LIR) unit set.
LIRS calculates the distance between the last two
accesses to a data unit and also stores a timestamp of the
last access to the data unit. Based on this statistical
information, the data are divided into either LIR or HIR
blocks. When the cache is full, the least recently used
data unit from the LIR set is replaced. LIRS is suitable
for use in virtual memory management [20].
LRFU replacement policy employs both LRU and
LFU replacement policies at the same time. LRFU
calculates the so-called CRF (Combined Recency and
Frequency) value for each data unit. This value quantifies
the likelihood that the unit will be referenced in the near
future. LFRU is suitable for use and was tested in
database systems [21].
LRD replacement policy replaces the data unit with
the lowest reference density. Reference density is
a reference frequency for a given reference interval.
LRD has two variants of use. The first variant uses a
reference interval which corresponds to the age of a
page. The second variant uses constant interval time [22].
LRU-K replacement policy keeps the timestamps of
the last K accesses to the data unit. When the cache is
full, LRU-K counts so-called Backward K-Distance
which leads the marked data unit to replace. The LRU-K
algorithm is used in data base systems [23]. An example
of LRU-K is LRU-2, which remembers the last two
access timestamps for each data unit. It then replaces the
data unit with the least recent penultimate reference [24].
ARC is similar to the 2Q replacement policy. The
ARC algorithm dynamically balances recency and
frequency. It uses two LRU-queues. These queues
maintain the entries of recently evicted data units [6].
ARC has low computational overhead while performing
well across varied workloads [17], [25]. ARC requires
units with the same size; thus it is not suitable for
caching whole files.
CRASH is a low miss penalty replacement policy. It
was developed for caching data blocks during reading
data blocks from the hard disk. CRASH puts data blocks
with contiguous disk addresses into the same set. When
replacement is needed, CRASH chooses the largest set
and replaces the block with the minimum disk address
[6]. CRASH works with data blocks with the same size;
thus CRASH is not suitable for caching blocks with
different sizes.
3 The LFU-SS and LRFU-SS
Architecture All caching algorithms mentioned were designed mainly
for low-level I/O operations. These algorithms usually
work with data blocks that have the same size. When
replacement occurs, all the statistics-based and hybrid
caching policies mentioned choose the block to be
removed from the cache based on statistics gathered
during user requests. Moreover, all the caching policies
have to store statistical information for all data blocks in
the cache. We propose a new caching policy suitable for use in
mobile devices. Our first goal is to minimize costs of
counting the priority of data units in the cache. This goal
was set because mobile device are not as powerful as
personal computers ant their computational capacity is
limited. The speed of data transfer from a remote server
to the mobile device can vary. Thus, our second goal is to
increase the cache hit ratio, and thereby decrease the
network traffic caused by data transfer.

372 Informatica 36 (2012) 369–378 P. Bžoch et al.
We present an innovated LFU algorithm we call
Least Frequently Used with Server Statistics (LFU-SS),
and a hybrid algorithm we call Least Recently and
Frequently Used with Server Statistics (LRFU-SS) [26].
3.1 LFU-SS
In LFU-SS, we use server and client statistics for
replacement decisions. We will consider server statistics
first. The database module of the server maintains
metadata for the files stored in the DFS. The metadata
records contain items for storing statistics. These
statistics are number of read and number of write hits per
file, and number of global read hits for all files in the
DFS. When a user reads a file from the DFS, the
READ_HITSserver counter is increased, and sent to the
user. When a user wants to write the file content, the
WRITE_HITSserver counter is increased. Both of these
counters are provided as metadata for each requested file.
Calculation of the GLOBAL_HITSserver counter is a time-
consuming operation because of summation of the
READ_HITSserver of all files. If we presume that the DFS
stores thousands of files which are accessed by users, the
value of variable GLOBAL_HITSserver is then much
greater than the value of variable READ_HITSserver, and
we do not need to get the value of GLOBAL_HITSserver
for each file access. The value of the GLOBAL_HITSserver
counter is computed periodically, thus saving server
workload.
The caching unit in our approach is the whole file.
By caching whole files, we do not need to store read or
write hits for each block of the file; we store these
statistics for the whole file. Storing whole files also
brings another advantage – calculation of priorities for
replacement is not computationally demanding because
of the relatively low number of units in the cache.
When the LFU-SS replacement policy must mark a
file to be thrown out of the cache, LFU-SS works
similarly to regular LFU. LFU-SS maintains metadata of
files in a heap structure. In LFU-SS, we use a binary
min-heap. The file for replacement is stored in the root
node. When a user reads a cached file, the client read hits
counter READ_HITSclent is increased and the heap is
reordered if necessary. The server statistics are only used
for newly incoming files to the cache.
In a regular LFU policy, the read hits counter for a
new file is initialized to one (the file has been read once).
The idea of LFU-SS is that we firstly calculate the read
hits counter from the statistics from the server. If the new
file in the cache is frequently downloaded from the
server, the file is then prioritized in comparison to a file
which is not frequently read from the server. For
computing the initial read hits value, we use the
following formula:
We first calculate the difference between read and write
hits from the server. We prefer the files that have been
read many times, and have not been written so often.
Moreover, we penalize the files that are often written and
not often read. We do this in order to maintain the data
consistency of the cached files. The variable
GLOBAL_HITSclient represents the sum of all read hits to
the files in the cache. We add 1 because the user wants to
read this file. We must store the read hits value as a
decimal number for accuracy reasons when reordering
files in the heap. The pseudo-code for LFU-SS is in
Figure 2.
The disadvantage of using LFU-SS and general LFU
relates to ageing files in the cache. If the file was
accessed many times in the past, it still remains in the
cache even if the file will not be accessed in the future
again. We prevent this situation by dividing the variable
READ_HITSclient by 2. When the value of variable
READ_HITSclient reaches the threshold value,
READ_HITSclient variables of all cached files are divided
by 2. The threshold value was set to 15 read hits
experimentally.
Input: Request for file F
Initialization: heap of cached files
records /*ordered by client’s cache read
hit counts */
if F is not in cache
{
while cache is full
{
remove file with the least read hits
reorder heap to be min-heap
}
compute initial READ_HITS for file F
download file F into cache
insert metadata record to the heap
reorder heap to be min-heap
}
else
{
increase READ_HITS value of file F by 1
reorder heap if necessary
upload client statistics to server
if READ_HITS > threshold
{
for each FILE in cache do
{
FILE.READ_HITS = FILE.READ_HITS / 2
}
}
}
Figure 2: Pseudo-code for LFU-SS
Using statistics from the server for gaining better
results in the cache read hit ratio causes a disadvantage in
updating these statistics. If the accessed files are
provided from the cache, the statistics are updated only
on the client side, and are not sent back to the server. In
this case, the server does not provide correct metadata,
and the policy does not work correctly. A Similar case
occurs while using a cache on the server and client sides
simultaneously [7]. To prevent this phenomenon, the
client application periodically sends local statistics back
to the server. The update message contains file ids and
number of requests per each file since the last update. We
show the experimental results for LFU-SS with and

DESIGN AND IMPLEMENTATION OF… Informatica 36 (2012) 369–378 373
without uploading statistics to the server in the next
section.
We will discuss the time complexity of using
LFU-SS now. As mentioned before, we use a binary min-
heap for storing metadata records. This heap is ordered
the by read hits count. For cached files in LFU-SS, we
use three operations: inserting a new file into the cache,
removing a file from the cache, and updating file read
hits. All these three operations are O(logN) [27].
3.2 LRFU-SS
Next, we will use LFU-SS in combination with
standard LRU. As for mentioned hybrid caching
replacement policies, the combination of LRU and LFU
increases the cache hit ratio. For the combination of these
caching policies, we will compute the priority of LRU
and LFU-SS for each file in the cache. The priority of
LRU and LFU-SS is from the interval (0, 65535], where
a higher value represents a higher priority. The file with
the lowest priority is replaced. The formula for counting
the final priority of the file is the following:
In computing the final priority, we can favour one of
the caching policies by setting a higher value for K1 or K2
constants. The impact of setting these constants is shown
in section 4. Next, we will focus on computing priority
values for LFU-SS and LRU caching policies.
3.2.1 PLFU-SS
The priority value for the LFU-SS algorithm is
calculated by using linear interpolation between the
highest and the lowest read hits values. The formula for
counting this priority is the following:
In this formula, the values of variables
GLOBAL_HITSmin,client and GLOBAL_HITmax,client
correspond to the highest and lowest read hits values. In
the case that the file is new in the cache, we calculate
read hits by using the formula from the previous section.
We can expect that a new file in the cache is fresh and
will also be used in the future. Despite computing read
hits for a new file in the cache by using server statistics,
new files in the cache still have a low read hits count.
Therefore, we calculate the PLFU-SS for the new file in the
cache in a different way. We use server statistics again
and calculate the first PLFU-SS as follows:
3.2.2 PLRU
The least recently used policy usually stores the
timestamp for last access to the file. If a replacement is
needed, the file that has not been accessed for the longest
time period is discarded. In our approach, we need to
calculate the priority from the timestamp. We do this as
follows:
As shown in the formula, we again use linear
interpolation for calculating PLRU. We interpolate
between Tleast_recently_file and Tmost_recently_file . Tleast_recently_file
is the timestamp of the file that has not been accessed for
the longest time period. Tmost_recently_file is the timestamp of
the file that has been accessed most recently.
The disadvantage of using LRFU-SS relates to
computation priorities. We need to recalculate priorities
for all cached units every time one cached unit is
requested. We also need to reorder the heap of the cached
files because of changes in these priorities. By caching
whole files, we do not have many units in the cache, so
these calculations are acceptable. The pseudo-code for
the LRFU-SS is in Figure 3.
Input: Request for file F
Initialization: Min-Heap of cached files
/*ordered by priority*/
K1, K2 /*constants for computing Pfinal*/
if F is not in cache
{
while cache is full
{
remove file with the least priority
reorder heap to be min-heap
}
compute read hits for file F
compute initial PLFU-SS for file F
compute PLRU for file F
compute Pfinal := K1 * PLFU-SS + K2 * PLRU; download and Insert file F into cache
recalculate priorities of all files in
the cache and simultaneously reorder
the heap
}
else
{
increase READ_HITS value of file F by 1
upload client statistics to server
if READ_HITS > THRESHOLD
{
for each FILE in cache do
{
FILE.READ_HITS = FILE.READ_HITS / 2
}
}
store new timestamp for file F
recalculate priorities of all files in
the cache and reorder the heap
}
Figure 3: Pseudo-code for LRFU-SS.
The LRFU-SS policy uses server statistics like
LFU-SS. Using LRFU-SS causes the same problem with
updating access statistics on the server side. We will
solve this problem by periodically sending update
messages back to the server. We show the experimental

374 Informatica 36 (2012) 369–378 P. Bžoch et al.
results for LRFU-SS with and without uploading
statistics to the server in the next section.
As with LFU-SS, we will discuss the time
complexity of using LRFU-SS. Again, we use a binary
min-heap for storing metadata records of cached files.
We also employ three operations to the cached files:
inserting a new file into the cache, removing a file from
the cache, and accessing the file. Let N be the number of
the cached files:
The operation inserting a file entails recalculating
time priorities of all cached files, which takes O(N) time.
New priorities do not affect the heap structure because
the recalculation maintains the min-heap property. After
recalculating new priorities, we insert a new file into the
heap, which is O(logN). Then, insertion of a new file is
O(N). The operation removing a file is O(logN) again.
The operation accessing a file has the time complexity of
O(N). As with inserting a new file, we need to
recalculate priorities of all files taking O(N) time. For an
accessed file, we need to recalculate the PLFU-SS priority
and min-heapify the accessed file, which is O(logN). So,
accessing a file takes O(N) time.
4 Performance Evaluation In this section, we evaluate the proposed algorithms and
compare them to other caching algorithms. We carried
out two types of test. The first series of tests was
performed using a cache simulator. The second series of
tests ran on a wired client that was connected to the
KIVFS used for storing and accessing files, thus
mimicking a mobile device connection to the server.
We created 500 files with uniformly distributed
random size between 1KB and 5MB on the server side.
This distribution is based on analysis of the log from a
local AFS cell server. We monitored the AFS cell for a
month. In this period of time, users have nearly 930,000
requests to the files. The most of accessed (over 98%)
files are from (0-5MB] in size
The number of requests to the files is not equal. We
observed in the AFS log that some files are requested
more often than other files. Accesses to the files are
simulated by using a Gaussian random generator which
corresponds to the observations gained from the log.
We evaluated the performance of LFU-SS and
LRFU-SS algorithms on cache sizes ranging from 8MB
to 512MB, reflecting the limited capacity of mobile
devices.
We used the cache hit ratio and data transfer
decrease needed to transfer the files as performance
indicators.
4.1 Cache simulator
A cache simulator was developed to prevent the
main disadvantage of testing caching policies in a real
environment, which lies in the fact that it takes a long
period of time to test caching algorithms. This is caused
by the communication over a computer network.
The cache simulator consists of three parts: Server,
Client and Request generator.
Server represents storage of files collection. Each
file is represented by a unique ID and size in bytes.
Additionally, the server stores a number of read and
writes requests for each file. When a client demands a
file, all the metadata are provided.
Client is an entity which requests files from the
server and uses the evaluated caching algorithm. During
the simulation, the client receives requests for file access
from the Requests generator. The client increases the
counter of requested bytes by the size of the file and
looks into its cache for a possible cache hit. If the file is
found in the cache, the number of cache read hits is
increased. If the file is not in the cache, the file is
downloaded from the server and stored in the cache. At
the same time, the counter maintaining the number of
transferred bytes is increased by the size of the requested
file.
Requests generator is an entity which knows the
files’ ID from a server, and generates requests for these
files. We used a Gaussian random generator for a
simulation with parameters based on the AFS log
mentioned above.
4.2 KIVFS environment
The KIVFS distributed file system consists of two
main parts: server and client applications. The System
architecture is depicted in Figure 4.
Figure 4: Model of KIVFS.
4.2.1 KIVFS client
The client module allows the client to communicate
with KIVFS servers, and to transfer data. The client
applications exist in three main versions: the standalone
application, the core module of the operating system and
Filesystem in Userspace (FUSE).
4.2.2 KIVFS server
The KIVFS Server consists of five modules:
Authorization, Synchronization, VFS, Database, and File
System. These modules can be run on different machines
cooperating in a DFS or on a single machine. We briefly
KIVFS Server
KIVFS Client
Authorization
Synchronization
VFS
Database File system

DESIGN AND IMPLEMENTATION OF… Informatica 36 (2012) 369–378 375
describe these five modules. KIVFS is described in [8] in
more detail. Authorization Module. This module is an entry point
to the system. It ensures authorization and secure
communication with clients [8]. The communication
channel is encrypted by using OpenSSL.
Synchronization Module. The synchronization
module is a crucial part of the whole system. Several
clients can access the system via several nodes.
Generally, different delays occur in delivering the
messages. The KIVFS system uses Lamport’s logical
clocks for synchronization. Every received message gets
a unique ID corresponding to the logical clock. The
synchronisation is based on this unique ID, which also
serves as a timestamp. This ID is also used for
synchronisation among nodes.
Virtual File System Module (VFS). The VFS module
hides the technology used for data and metadata storage.
Based on the request, the module determines whether it
is aimed at the metadata, or is aimed at file access.
File System Module (FS). The File system module
stores file content on physical devices like a hard disk. It
is utilized to work with the content of the files that the
user works with.
The FS module also manages the active data
replication. The FS module starts the replication of the
file in the background. The replication process
cooperates with the synchronization layer.
Database Module. The Database module serves for
communication with the database. The database stores
metadata, the list of authorized users, and the client
request queue.
The synchronization of the databases is solved at the
synchronization level of KIVFS. It ensures the
independence of the replication and synchronization
mechanisms of different databases.
4.3 Evaluation
In this subsection, we give the results of the
simulations. The first simulation of the caching
algorithms’ behaviour used the Cache Simulator; the
second one ran on a wired client.
4.3.1 Simulation using the cache simulator
We implemented all caching policies mentioned in
Section 2 in this simulation. Coefficients were set to
K1=0.35, K2=1.1 for LRFU-SS. We chose these
coefficients after a series of experiments with LRFU-SS.
In experiments, we simulated LFRU-SS and LFU-SS
with and without sending client statistics back to the
server, to demonstrate the effect of sending client
statistics.
In the experiments, we generated 100,000 requests
on files. The cache read hit ratio is shown in Table 1.
Table 2 shows the data transfer decrease. The total size
of transferred files was 247.5GB, which is also the
number of bytes transferred without usage of a cache.
Read Hit
Ratio [%] /
Cache Policy
Caching
policy8 16 32 64 128 256 512
2Q 1.77 4.26 9.07 18.23 35.51 64.26 95.27
Clock 1.48 3.32 6.85 13.78 27.26 52.62 90.43
FBR 2.85 7.71 14.45 22.27 36.32 66.48 93.51
FIFO 1.48 3.32 6.84 13.70 26.87 51.13 85.09
FiFO 2nd 1.48 3.32 6.92 14.00 27.96 54.49 92.28
LFU 3.61 7.17 11.41 17.31 34.44 63.22 95.38
LFU-SS 3.74 7.84 13.48 22.25 38.55 65.93 94.21
LFU-SS
without
sending
statistics
2.26 6.00 8.06 13.50 21.96 36.21 61.71
LIRS 1.93 3.98 7.69 15.48 29.91 56.90 92.83
LRDv1 1.48 3.31 6.90 14.02 28.06 56.11 93.80
LRDv2 1.48 3.31 6.91 13.87 27.42 53.05 89.83
LRFU 1.94 4.05 8.60 18.18 35.19 64.65 93.89
LRFU-SS 2.98 4.63 10.15 19.77 37.72 66.67 94.48
LRFU-SS
without
sending
statistics
0.95 2.35 5.50 8.61 18.51 37.22 65.36
LRU 1.48 3.32 6.88 13.82 27.55 53.48 91.68
LRU-K 1.48 3.39 8.07 17.08 34.10 64.15 95.23
MQ 1.79 3.78 7.59 14.95 29.38 55.49 92.06
MRU 1.35 2.32 4.27 7.61 14.22 29.94 57.55
RND 1.53 3.26 6.90 13.74 26.86 50.90 85.27
Cache Size [MB]
Table 1: Cache Read Hit Ratio vs. Cache Size Using
Cache Simulator.
Without sending these statistics, both LFU-SS and
LRFU-SS have significantly worse results than the other
caching policies. This situation shows both indicators,
cache hit ratio and data transfer decrease.
LFU-SS with sending local statistics back to the
server has the best results in terms of the cache hit ratio.
The second-best is the FBR policy. Recall that we use the
whole file as the caching unit. Hence, the policy with the
best read hits ratio is not necessarily the best one in
decreasing data transfer, which is obviously caused by
the variety of file size. Although FBR has good results in
terms of the cache hit ratio, it has worse results in
decreasing network traffic. LFU-SS has the best result in
decreasing network traffic for cache sizes from 8MB to
128MB. For higher cache sizes, LRFU-FF is a better
choice.
Overall, results in this experiment show that LFU-SS
achieves up to 2% improvement in saving network traffic
in smaller cache sizes over other caching policies.
LRFU-SS achieves up to 1% improvement in higher
cache sizes.

376 Informatica 36 (2012) 369–378 P. Bžoch et al.
Data
Transfer
Decrease
[GB] / Cache
Policy
Caching
policy 8 16 32 64 128 256 512
2Q 244.20 238.52 227.93 206.48 164.15 89.86 12.12
Clock 244.08 239.48 230.74 213.57 179.73 116.76 23.14
FBR 244.65 242.78 228.18 206.35 169.36 91.02 16.64
FIFO 244.08 239.48 230.60 212.97 178.15 111.61 18.54
FiFO 2nd 244.08 239.48 230.77 213.77 180.77 120.43 36.54
LFU 243.42 238.16 229.34 210.16 170.23 98.76 12.57
LFU-SS 243.32 237.73 225.75 202.86 156.81 83.29 13.82
LFU-SS
without
sending
statistics
245.10 242.34 236.92 224.94 201.61 161.67 98.56
LIRS 243.82 239.01 229.46 209.95 173.72 105.76 17.09
LRDv1 244.08 239.50 230.67 212.91 177.89 107.90 14.90
LRDv2 244.07 239.50 230.59 213.29 179.41 115.57 24.62
LRFU 243.79 238.88 228.40 206.98 165.56 90.31 14.64
LRFU-SS 243.44 238.72 226.91 203.06 158.67 81.79 13.38
LRFU-SS
without
sending
statistics
245.64 242.69 237.30 225.89 202.18 158.99 91.84
LRU 244.08 239.48 230.69 213.40 179.11 114.49 19.97
LRU-K 244.08 239.42 229.14 207.99 166.00 90.71 12.36
MQ 243.93 238.89 229.30 210.92 174.79 109.10 19.09
MRU 243.98 239.60 230.65 213.58 180.86 121.04 36.13
RND 244.47 242.02 237.23 229.06 212.48 173.45 99.20
Cache Size [MB]
Table 2: Data Transfer Decrease vs. Cache Size Using
Cache Simulator.
4.3.2 Simulation on a wired client
The second simulation ran on a wired client to accelerate
the experiments. Because of high time consumption of
the experiments, we implemented only RND, FIFO, LFU
and LRU policies for comparison with
LFU-SS and LRFU-SS policies.
For LRFU-SS, we choose the same coefficients as in
the first simulation. In the simulation scenario, we
generated 10,000 requests. Table 3 summarizes the cache
read hit ratio for each of the implemented algorithms.
The best algorithm in this scenario is LFU-SS. While
using LFU-SS with cache capacities of 16MB and
32MB, we can achieve up to 11% improvement over
commonly used LRU or LFU caching policies. When we
use a cache with a larger capacity (64, 128, 256, and
512MB), the improvement is up to 4% in the cache hit
ratio. Again, the policy with the best read hits ratio is not
necessarily the best one in decreasing data traffic.
ReadHit
Ratio [%]/
Caching
Policy
Caching
Policy8 16 32 64 128 256 512
RND 2.98 5.68 10.36 16.03 25.46 40.39 62.34
FIFO 2.66 5.49 10.18 15.34 25.44 39.69 60.23
LFU 2.79 6.18 11.21 19.09 30.19 41.23 63.87
LRU 2.79 6.36 10.84 19.3 28.94 40.67 63.54
LFU-SS 6.55 13.05 21.68 25.14 31.47 42.47 64.23
LFU-SS
without
sending client
statistics
2.56 5.48 11.02 18.52 28.56 35.25 55.45
LRFU-SS 4.5 10.03 15.22 23.76 30.8 41.9 64.14
LRFU-SS
without
sending client
statistics
2.48 5.1 10.54 18.65 29.15 36.82 56.75
Cache Size [MB]
Table 3: Cache Read Hit Ratio vs. Cache Size on Wired
Client.
Next, we measured the data transfer decrease. The total
size of transferred files was 22,5GB. Table 4 summarizes
the data transfer decrease for different caching policies.
Data Transfer
Decrease [GB] /
Cache Policy
Caching policy 8 16 32 64 128 256 512
RND 21.97 21.38 20.47 19.25 17.57 14.09 8.63
FIFO 22.03 21.43 20.41 19.33 17.68 14.59 9.19
LFU 22.11 21.51 20.61 18.21 16.95 14.48 8.36
LRU 21.96 21.15 20.12 18.41 17.15 14.55 8.70
LFU-SS 20.99 19.32 18.61 18.14 15.16 12.55 7.95
LFU-SS
without
sending client
statistics
21.97 21.07 19.94 18.30 16.58 14.48 9.90
LRFU-SS 21.74 20.27 18.90 16.93 14.94 12.44 7.88
LRFU-SS
without
sending client
statistics
21.99 21.24 20.07 18.30 16.19 14.08 9.33
Cache Size [MB]
Table 4: Data Transfer Decrease vs. Cache Size on
Wired Client.
The best caching algorithm for cache sizes 8MB, 16MB,
and 32MB is LFU-SS again. For larger cache capacity,
the best caching policy is LRFU-SS. While using LRFU-
SS with a cache size of 512MB, we saved up 65% of the
network traffic. LFU-SS achieves up to 8% improvement
over LRU in small cache sizes. LRFU-SS achieves up to
3% improvement over LRU and LFU in larger cache
capacities.

DESIGN AND IMPLEMENTATION OF… Informatica 36 (2012) 369–378 377
5 Further Work In our future work, we will add direct generation of the
file requests from the AFS log file to the cache simulator.
The simulator will then allow the simulation of more real
situations.
Storing files in the user’s cache may cause data
inconsistency. The data on a server can be modified
while the user constantly works with the old files in the
cache. In our future work, we intend to develop an
algorithm for maintaining data consistency for cached
files.
6 Conclusion This article presented caching algorithms for caching
files in mobile devices. Our goals in developing new
caching algorithms were to decrease network traffic, and
minimize the cost of counting the priority of the data unit
in the cache. These two goals were set because of the
varying network connection quality of mobile devices
caused by the movement of the user, and because of the
limited performance of the mobile devices.
The comparison of caching policies proved that the
algorithms introduced perform better in comparison to
other caching policies except in one case. For smaller
cache sizes, LFU-FF is a suitable caching policy; for
larger cache sizes, LRFU-SS is a better choice.
Considering time consumption, LFU-SS is the
asymptotically better algorithm. When caching whole
files, both algorithms introduced are suitable for mobile
devices.
Acknowledgement This work is supported by the Ministry of Education,
Youth, and Sport of the Czech Republic – University
spec. research – 1311. We thank Radek Strejc, Václav
Steiner, and Jindřich Skupa for implementing and testing
proposed concepts and ideas.
References
[1] A. Boukerche, R. Al-Shaikh and B. Marleau,
“Disconnection-resilient file system for mobile
clients,” in Local Computer Networks, 2005. 30th
Anniversary. The IEEE Conference on, Sydney,
2005.
[2] A. Boukerche and R. Al-Shaikh, “Servers
Reintegration in Disconnection-Resilient File
Systems for Mobile Clients,” in Parallel Processing
Workshops, 2006. ICPP 2006 Workshops. 2006
International Conference on, Columbus, 2006.
[3] N. Michalakis and D. Kalofonos, “Designing an
NFS-based mobile distributed file system for
ephemeral sharing in proximity networks,” in
Applications and Services in Wireless Networks,
2004. ASWN 2004. 2004 4th Workshop on, 2005.
[4] K. T. Corporation, “microSD Cards | Kingston,”
Kingston Technology Corporation, 2012. [Online].
Available: http://www.kingston.com
/us/flash/microsd_cards#sdc10. [Accessed 10 10
2012].
[5] M. Chetty, R. Banks, A. Brush, J. Donner and R.
Grinter, “You're capped: understanding the effects
of bandwidth caps on broadband use in the home,”
in Proceedings of the 2012 ACM annual conference
on Human Factors in Computing Systems, Austin,
Texas, USA, 2012.
[6] N. Xiao, Y. Zhao, F. Liu and Z. Chen, “Dual
queues cache replacement algorithm based on
sequentiality detection,” in SCIENCE CHINA
INFORMATION SCIENCES, Volume 55, Number
1, Research paper, 2011.
[7] K. Froese and R. Bunt, “The effect of client caching
on file server workloads,” in System Sciences,
1996., Proceedings of the Twenty-Ninth Hawaii
International Conference on, Wailea, HI , USA,
1996.
[8] L. Matějka, L. Pešička and J. Šafařík, “Distributed
file system with online multi-master replicas,” in
2nd Eastern european regional conference on the
Engineering of computer based systems, Los
Alamitos, 2011.
[9] B. Reed and D. D. E. Long, “Analysis of caching
algorithms for distributed file systems,” in ACM
SIGOPS Operating Systems Review, Volume 30
Issue 3, New York, NY, USA, 1996.
[10] L. A. Belady, R. A. Nelson and G. S. Shedler, “An
anomaly in space-time characteristics of certain
programs running in a paging machine,” Commun.
ACM, vol. 12, no. 6, pp. 349-353, June 1969.
[11] R. P. Draves, “Page Replacement and Reference Bit
Emulation in Mach,” in In Proceedings of the
Usenix Mach Symposium, 1991.
[12] P. Steven W. Smith, “Digital Signal Processors -
Circular Buffering,” in The Scientist and Engineer's
Guide to Digital Signal Processing, San Diego,
California Technical Publishing, 1998, pp. 506-509.
[13] S. Jiang, F. Chen and X. Zhang, “CLOCK-Pro: an
effective improvement of the CLOCK
replacement,” in ATEC '05 Proceedings of the
annual conference on USENIX Annual Technical
Conference, Berkeley, 2005.
[14] R. Mattson, J. Gecsei, D. Slutz and I. Traiger,
“Evaluation techniques for storage hierarchies,”
IBM Systems Journal, vol. 9, no. 2, pp. 78-117,
1970.
[15] B. Whitehead, C.-H. Lung, A. Tapela and G.
Sivarajah, “Experiments of Large File Caching and
Comparisons of Caching Algorithms,” in Network
Computing and Applications, 2008. NCA '08.
Seventh IEEE International Symposium on,
Cambridge, MA, 2008.
[16] H.-T. Chou and D. J. DeWitt, “An evaluation of
buffer management strategies for relational
database systems,” in VLDB '85 Proceedings of the
11th international conference on Very Large Data
Bases - Volume 11, 1985.
[17] T. Johnson and D. Shasha, “2Q: A Low Overhead
High Performance Buffer Management
Replacement Algorithm,” in In VLDB '94:

378 Informatica 36 (2012) 369–378 P. Bžoch et al.
Proceedings of the 20th International Conference
on Very Large Data Bases, 1994.
[18] Y. Zhou, J. F. Philbin and K. Li, “The Multi-Queue
Replacement Algorithm for Second Level Buffer
Caches,” in In Proceedings of the 2001 USENIX
Annual Technical Conference, Boston, 2001.
[19] A. Boukerche and R. Al-Shaikh, “Towards building
a fault tolerant and conflict-free distributed file
system for mobile clients,” in Proceedings of the
20th International Conference on Advanced
Information Networking and Applications - Volume
02, AINA 2006., Washington, DC, USA, 2006.
[20] S. Jiang and X. Zhang, “LIRS: An Efficient Low
Interreference Recency Set Replacement Policy to
Improve Buffer Cache Performance,” in
Proceedings of the 2002 ACM SIGMETRICS
Conference on Measurement and Modeling of
Computer Systems, (SIIMETRICS'02), Marina Del
Rey, 2002.
[21] D. Lee, J. Choi, J.-H. Kim, S. Noh, S. L. Min, Y.
Cho and C. S. Kim, “LRFU: a spectrum of policies
that subsumes the least recently used and least
frequently used policies,” in Computers, IEEE
Transactions on, 2001.
[22] W. Effelsberg and T. Haerder, “Principles of
database buffer management,” in Journal ACM
Transactions on Database Systems (TODS) Volume
9 Issue 4, Dec. 1984, New York, 1984.
[23] E. J. O'Neil, P. E. O'Neil and G. Weikum, “The
LRU-K page replacement algorithm for database
disk buffering,” in SIGMOD '93 Proceedings of the
1993 ACM SIGMOD international conference on
Management of data, New York, 1993.
[24] N. Megiddo and D. S. Modha, “ARC: A Self-
Tuning, Low Overhead Replacement Cache,” in
FAST '03 Proceedings of the 2nd USENIX
Conference on File and Storage Technologies,
2003.
[25] W. Lee, S. Park, B. Sung and C. Park, “Improving
Adaptive Replacement Cache (ARC) by Reuse
Distance,” in 9th USENIX Conference on File and
Storage Technologies (FAST'11), San Jose, 2011.
[26] P. Bžoch, L. Matějka, L. Pešička and J. Šafařík,
“Towards Caching Algorithm Applicable to Mobile
Clients,” in Federated Conference on Computer
Science and Information Systems (FedCSIS), 2012,
Wroclaw, 2012.
[27] T. H. Cormen, C. E. Leiserson, R. L. Rivest and C.
Stein, Introduction To Algorithms, 3rd ed., MIT
Press and McGraw-Hill, 2009.

Informatica 36 (2012) 379–408 379
Systematic Literature Review on Regression Test Prioritization Techniques
Yogesh SinghVice Chancellor, The Maharaja Sayajirao University of Baroda, Gujarat, IndiaE-mail: [email protected]
Arvinder Kaur, Bharti Suri and Shweta SinghalUniversity School of Information and Communication Technology, G.G.S.IP.University, Delhi, IndiaE-mail: [email protected],[email protected], [email protected]
Overview paper
Keywords: regression testing, test prioritization, systematic literature review (SLR)
Received: August 31, 2011
The purpose of regression testing is to validate the modified software and detect whether the unmodified code is adversely affected. Regression testing is primarily a maintenance activity. The main motivation behind this systematic review is to provide a ground for advancement of research in the field of Regression Test Prioritization. The existing techniques were compared along with their collected empirical evidences to find if any particular approach was superior to others. 65 papers reporting 50 experiments and 15 case studies were identified. A total of 106 techniques were evaluated for regression test prioritization. Also, a rigorous analysis of the techniques was performed by comparing them in terms of various measures like size of study, type of study, approach, input method, tool, metrics etc. Encouragingly, SLR yielded that almost half of the techniques for regression test prioritization are independent of their implementation language. While on the other hand the future research should focus on bridging the large gaps that were found existing in the usage of various tools and artifacts. During the course of research, preliminary literature survey indicated that to the best of our knowledge, no systematic review has been published so far on the topic of regression test prioritization.
Povzetek: V preglednem članku so opisane regresijske metode testiranja programske opreme.
1 IntroductionRegression test prioritization aims to prioritize the test cases that need to be re-executed during regression testing. The test cases are executed in that order so as to catch the faults at the earliest within minimum time. This is an important activity during maintenance phase as it rebuilds confidence in the correctness of the modified or updated system. This paper presents the systematic review of regression test prioritization techniques. Though a few of these techniques have been evaluated and compared by many researchers [1, 2, 3, 4, 5, 6, 7, 8, 9 etc], a generalized conclusion has not been drawn by any of them. In order to come up with a base for the advancement of future work in the field of Regression Test Prioritization (RTP), a systematic review was conducted to collect and compare some common parameters of the existing techniques and their empirical evidences.
There is a growing number of researches that are being carried out in the field of software engineering. Reviews are the essential tools by which a researcher can keep up with the new evidences in a particular area. There is a need to develop formal methods for systematic reviewing of the studies. In the last decade, the medical research field has successfully adopted the evidence based paradigm [10]. In [10], it is suggested that Evidence Based Software
Engineering (EBSE) should be adopted. In [10], they have also discussed the possibility of EBSE using an analogy with the medical practices. EBSE is important as the software intensive systems are taking central place in our day to day life. EBSE can assist practitioners to adopt the appropriate technologies and to avoid the inappropriate ones. The goal of EBSE is “to provide the means by which the current best evidence from the research can be integrated with the practical experience and human values in the decision making process regarding the development and maintenance of a software” [10]. EBSE involves five basic steps [11]: 1) Convert the problem into an answerable question, 2) search the literature for the best available evidence, 3) critically appraise the evidence for its validity, impact, and applicability, 4) combining the critical appraisal with our environment and, 5) evaluating the efficiency of execution of the previous 4 steps and finding ways to improve them for future use. The first three steps constitute a systematic review. The systematic review is a specific research methodology that is aimed at gathering and evaluating the available evidences related to a focused topic area. They evaluate and interpret the relevant research that is available for the particular research questions or topic area [10].

380 Informatica 36 (2012) 379–408 Y. Singh et al.
The systematic review should consolidate the empirical studies conducted so far in the field. This review presents an overall report of all the existing regression test prioritization techniques presented till date, along with their properties and the comparisons among a few of them. It makes an attempt in displaying the amount of efforts already been put in to the field. To achieve the same, 65 test case prioritization papers were identified that reported 50 experiments, 15 case studies and 106 techniques of regression test prioritization. A qualitative analysis of the techniques was performed by comparing them with respect to the various measures like size of the study, type of the study, approach, input method, tool, and metrics etc.
2 Related WorkIn a systematic review, the main research questions, the methodological steps, and the study retrieval strategies are explicitly defined. In 2004, the procedures for performing a Systematic Literature Review (SLR) in Software Engineering were first proposed by Kitchenham [12]. In the report [12], medical guidelines for performing systematic reviews were adapted to the requirements of software engineering. The first systematic review conducted in the field of software testing was on “the testing technique experiments” published in 2004 [13]. Staples and Niazi [14] shared their experiences while using the guidelines given by Kitchenham [12]. They emphasized more on the clearer and narrower choice of research questions and also on reporting the changes made in the strategy followed during SLR in order to adapt with the respective researchscenarios. In addition to this, they [14] also found that reliability and quality assessment was difficult based on the given guidelines [12]. In-spite of these findings they [14] commend the same guidelines [12] to other researchers for performing SLR's. A systematic review in software engineering [15] presented all the systematic reviews conducted during Jan 2004-Jun 2007 in the field. Their SLR on 20 relevant found studies revealed that the topic areas covered by SLR's in software engineering are limited and that European researchers, especially the ones at Simula Labarotory [15] were the leading exponents of SLR's. Another systematic literature survey on regression test selection techniques was presented in 2009 [16]. 27 relevant studies were identified for the SLR[16] and evaluated quantitatively. According to the results obtained after relating various techniques to each other using empirical comparisons, Engstrőm, Runeson and Skoglund [16], found that due to the dependence over varying factors no technique was clearly superior. Also, they identified a need for concept based evaluation of empirical studies rather than evaluations based on small variations in implementations. Engstrőm and Runeson also presented a general industry based survey on regression testing practices in 2010 [17]. The survey was conducted for 15 industry participants and the outcomes were validated by 32 respondents via an online questionnaire. According to the authors [17], the practices were found not to be specific to regression
testing and conclusion drawn was that regression testing should not be researched in isolation.
Furthermore, a very rigorous survey on regression test minimization, selection and prioritization was presented by Yoo and Harman [18]. Though it was not a systematic literature review, nonetheless it reported a detailed summary of the current state of art and trends in the field. The number of studies included in their study is almost the same as compared to the size of selected papers for the current research. This is reasonable as 1) their's was not an SLR, thus inclusion of every relevant study is not necessary; 2) the current SLR has been conducted including the studies that were published in the time slot of almost 2.5 years after their their survey was completed. An SLR should be very selective in the inclusion of a study with respect to its research questions. Thus, some of the studies included in the survey by Yoo and Harman for RTP area, got excluded at the study selection stage of our SLR. Also, there are a few additional studies found and included in this SLR that were published during and after the time frame for the survey in [18]. Nonetheless, Yoo and Harman have summed up the various approaches used for RTP, regression test minimization and selection along with the artifacts that have been used by these techniques. The same has also been repeated in this SLR to find whether their findings are correct or not. They had not reported the language dependency, granularity of the technique and the type of input to the technique. These aspects have been reported and used as a basis for the comparison of various techniques in the current research.
3 Difference between Literature Review and Systematic Literature Review (SLR)
Following the recent rise in the number of empirical studies in the field, SLR is a necessity for providing a thorough, unbiased and valuable summary of all the existing information. Systematic reviews require the documentation of not only the search criterions but also of the different databases that are searched. The starting point of a SLR is the review protocol that specifies the focused research question(s) to be addressed and the method to be employed in the process; while in the literature review the questions may be broad in scope. SLR employs a defined search strategy, and an inclusion/exclusion criterion for identifying the maximum possible relevant literature. Traditional review can be accomplished only by a single reviewer; while on the other hand, the systematic review requires a review team to establish the objectivity of literature classification at the very minimal level [19].
4 Research MethodThis study presents a rigorous insight to various test case prioritization techniques developed and applied in regression testing area. Following the guidelines given by Kitchenham [12], the course of action undertaken for

SYSTEMATIC LITERATURE REVIEW ON…
this research has been presented in Fig.1. After being motivated for conducting this SLR, finalizing the research questions for the study was the first task to be completed. Once the research questions were reached, various databases were searched based on the search criteria to retrieve the relevant research in the area. The next and the most crucial step of the study was the selection of the most relevant papers basedfinalized parameters (discussed in section 3.3.2). After this step, 65 studies were finalized, and were rigorously examined to find the answers to our research questions. Their data extraction conforming to various parameters led to their empirical evaluation, comparison, appraisal etc., wherever possible And finally the conclusions were reached. The steps undertaken in the Systematic literature review for prioritization techniques are documented in detail in the following sections.
Figure 1: Course of action for this SLR
4.1 Research questionsThe aim is to summarize the current state of art in the RTP research by proposing answers to the set of the following questions:
RQ 1: What are the existing empirical evidences for various approaches followed by the RTP techniques?RQ 2: Is it possible to prove the independence of various RTP techniques from their implementation languages?RQ 3: What are the existing gaps in the current research regarding the use of tools, metrics and artifacts for various RTP techniques?RQ 4: Can a RTP technique be shown superior to others based on a) the level of granularity followed, or b) the type of information used in prioritization?
4.2 Search Process
4.2.1 Sources of informationAs suggested by Kitchenham in [19], searchingives more wider search space. In accordance with the guidelines, the following six databases were searched rather than the limited set of Journals and Conference proceedings to cover the maximum possible information.
Inspec (digital-library.theiet.org)
SYSTEMATIC LITERATURE REVIEW ON… Informatica
this research has been presented in Fig.1. After being motivated for conducting this SLR, finalizing the research questions for the study was the first task to be
eted. Once the research questions were reached, various databases were searched based on the search criteria to retrieve the relevant research in the area. The next and the most crucial step of the study was the selection of the most relevant papers based on various finalized parameters (discussed in section 3.3.2). After this step, 65 studies were finalized, and were rigorously examined to find the answers to our research questions. Their data extraction conforming to various parameters
ical evaluation, comparison, appraisal etc., wherever possible And finally the conclusions were reached. The steps undertaken in the Systematic literature review for prioritization techniques are documented in detail in the following sections.
Course of action for this SLR.
The aim is to summarize the current state of art in the RTP research by proposing answers to the set of the
RQ 1: What are the existing empirical evidences for RTP techniques?
RQ 2: Is it possible to prove the independence of various implementation languages?
RQ 3: What are the existing gaps in the current research metrics and artifacts for
RTP technique be shown superior to others granularity followed, or b) the
type of information used in prioritization?
As suggested by Kitchenham in [19], searching databases gives more wider search space. In accordance with the guidelines, the following six databases were searched rather than the limited set of Journals and Conference proceedings to cover the maximum possible information.
theiet.org)
ACM digital library (dl.acm.org)
IEEE eXplore (www.ieeexplore.ieee.org)
Science Direct (www.sciencedirect.com)
Springer LNCS (www.springerlink.com)
Google scholar (scholar.google.com)
These electronic sources have been mentioned in [16, 17 and 19] as being relevant to the software engineers. There was an overlapping in the papers resulting from these sources and thus the duplicate papers were excluded manually.
4.2.2 Search CriteriaThe initial search string was reached in order to find all the possibly relevant matter in the area of test case prioritization. Engström, Runeson and Skoglund [16] have already presented an SLR on regression test selection techniques. Their SLR is in a field much similar to our topic, thus the search string was reached considering the search string used by them [16] and the requirements for our topic. The keywords used were (((software) <or> (regression)) <and> ((testing) <or> (test)) <and> ((prioritisation) <or> (prioritization))). To make sure that all potentially relatefound, the above search string was applied on full text, rather than only on the title or the abstract. The start was set to January 1969 up till February 2011. The earliest paper included was published in the year 1997. Various searching standards are followed by different databases. Hence, the search strategy has to be deaccordingly. Some of the databases do not have the “and” option. In those, we had to search phrase by phrase. Search was carried out in 3 steps for such databases: 1) (software) <or> (regression) 2) (test) <or> (testing) 3) (prioritisation) <or> (prioritization).search at 2nd step was carried out only on the results from the first step. Similarly, the 3rd
from the results from the 2nd
during the search process also mentioned for the content not from books, standards, magazines, newsletters and educational courses.
4.2.3 Study SelectionThe steps followed for the study selection procedure are as in Fig. 2. Initially, the study located 12,977 potentially relevant papers from all the sources mentioned in section 4.2.1. Elementary search yielded a huge amount of literature due to the use of the terms 'regression' and 'testing' in the search string. Databases could not differentiate between “statistical regression testing” and “software regression testing”, and there exists a huge amount of literature on “statistical regression testing”. Similar abundance in initial search results was observed in [16] when SLR waon regression test selection techniques. In the next step, title based exclusions for papers irrelevant to the
Informatica 36 (2012) 379–408 381
ACM digital library (dl.acm.org)
IEEE eXplore (www.ieeexplore.ieee.org)
Science Direct (www.sciencedirect.com)
Springer LNCS (www.springerlink.com)
Google scholar (scholar.google.com)
These electronic sources have been mentioned in 19] as being relevant to the software
engineers. There was an overlapping in the papers resulting from these sources and thus the duplicate papers were excluded manually.
The initial search string was reached in order to find all bly relevant matter in the area of test case
prioritization. Engström, Runeson and Skoglund [16] have already presented an SLR on regression test selection techniques. Their SLR is in a field much similar to our topic, thus the search string was reached
nsidering the search string used by them [16] and the requirements for our topic. The keywords used were (((software) <or> (regression)) <and> ((testing) <or> (test)) <and> ((prioritisation) <or> (prioritization))). To make sure that all potentially related literature could be found, the above search string was applied on full text, rather than only on the title or the abstract. The start was set to January 1969 up till February 2011. The earliest paper included was published in the year 1997. Various
hing standards are followed by different databases. Hence, the search strategy has to be designed accordingly. Some of the databases do not have the “and” option. In those, we had to search phrase by phrase. Search was carried out in 3 steps for such
ases: 1) (software) <or> (regression) 2) (test) <or> (testing) 3) (prioritisation) <or> (prioritization). The
step was carried out only on the results from rd step search was computed step. The exclusion criteria
during the search process also mentioned for the content from books, standards, magazines, newsletters and
The steps followed for the study selection procedure are , the study located 12,977
potentially relevant papers from all the sources mentioned in section 4.2.1. Elementary search yielded a huge amount of literature due to the use of the terms 'regression' and 'testing' in the search string. Databases
uld not differentiate between “statistical regression testing” and “software regression testing”, and there exists a huge amount of literature on “statistical regression testing”. Similar abundance in initial search results was observed in [16] when SLR was conducted on regression test selection techniques. In the next step, title based exclusions for papers irrelevant to the

382 Informatica 36 (2012) 379–408 Y. Singh et al.
software or regression testing were done. Although Dybå [20] has suggested to consider papers irrespective of their language, but we had to exclude the papers in any language other than English. After the title basedexclusions, we were left with 634 studies.
Step 3 involved rejections based on the abstract for papers lying out of the search field. At this step, studies by both the students and the software professionals were included. The papers about general software testing, selection, reduction, test case generation and hybrid approach were rejected. Only those papers were included that dealt with prioritization. The number of the papers left after exclusions based on reading the abstracts were 213.
The final stage of the selection process was text based exclusions. At this stage, we made sure that each paper is selected only if has potential to contribute towards the answers of our research questions[21]. The papers presenting new technique(s) for prioritization, comparing the techniques, reviewing them or empirically validating them were included. The “lessons learned” papers, papers having pure discussion and expert opinion were excluded. Also, the studies included both qualitative and quantitative methods of research. Thus the final number of studies left after the exclusions based on the full text were 65 [1-9, 22-79]; these also formed the primary studies for our work (details listed in appendix A: Table A1).
A team of three researchers performed selection of the research papers individually at each stage. The papers were initially selected by two of the researchers that were then checked by the third team member. This process was repeated at each step of study selection (Fig.2). The conflict was mainly on the thoroughness of the works presented in the papers. And this was resolved by the opinion of the third and the fourth authors. Three papers were having conflict out of which two got selected as three authors agreed on the study being relevant while one was rejected. 49 primary studies out of the total 65 were found to report new technique(s), two were extension of the previous work and 14 were re-analyses of the previously reported studies. The same has been listed in Appendix A: Table A1.
Figure 2: Steps followed in selection procedure for the study undertaken.
4.2.4 Data extraction strategyThe papers were thoroughly explored to find some common properties which formed the basis of the comparison. These were inspired from the previous work by Engström, Runeson and Skoglund [16] and also from the methods described by Cruzes and Dybå [21]. Eacharticle was studied and appraised to detect the following:
(i) Technique description: The techniques were given the ID’s and the names.
(ii) Artifacts used: The artifacts used in the study were noted.
(iii) Type of study: The type of the study can be an “experiment” or a “case study”. It might also be possible that a study includes both the “experiment” and the “case study”. An “experiment” is a study in which intervention is deliberately introduced to observe its effect [16]. A “case study” investigates within the real life context.
(iv) Comparison: Comparisons mentioned in the study, have been used to analyze and evaluate the studies.
(v) Language Type: It includes the type of the language on which the technique presented in the study is applicable. The language types found were: procedural, binary code, language independent, COTS component based, web designing or object oriented.
(vi) Input method: It includes the type of the input on which the technique can be applied. It can be: Source code, binary form, system model, system, call graph for program structure, or requirements/specifications.
(vii) Approach: The various approaches were found to be: modification based, coverage based, history based, requirement based, fault based, genetic based, composite or other approaches.
(viii) Granularity of approach: It specifies the granularity on which the technique can be applied. The 17 granularities followed in the papers are: Statement level, function level, block of binary form, method, transition in system model, system level, program, process level, event, component, file to be changed, software units, web service, module, configuration of the software system, class level or any. The above nomenclature was being followed by the studies. Some of the granularities seem to be same but they are separately mentioned, as it is not clear from the studies that they are at the same level.
(ix) Metrics: The metrics being used in a study are noted.
(x) Tools: Researchers have been using various tools during their study. The tools being used in each of the study were recorded.
5 Categories of Prioritization Techniques
Regression test prioritization re-orders the test cases so that those with the highest priority (according to some goal) are executed earlier in the regression testing process than the lower priority test cases. To better understand the progress of research in the field of regression test prioritization, eight broad categories were identified. Classification has been made on the basis of the approach followed for prioritization. The discussion presented in the following sections (4.1 – 4.10) also provides an answer to RQ2 by specifying the compared techniques.

SYSTEMATIC LITERATURE REVIEW ON… Informatica 36 (2012) 379–408 383
5.1 Coverage Based (CB) ApproachCoverage based prioritization is based on the fact that more the coverage achieved by the test suite, more are the chances of revealing the faults earlier in the testing process. Wong et al. [22] initially included prioritization in a hybrid technique. They prioritized the test cases according to the criterion of increasing the cost per additional coverage.
In 1999, Rothermel et al. [23] proposed four coverage based techniques: total/additional statement/branch coverage respectively. The statement level granularity was followed based on source code type of input method. Aristotle program analysis system tool was used for the comparison and the results were measured using Efficacy and APFD metrics. The ordering of the test suite was compared with respect to the faster detection ability of catching faults. On comparing the techniques, Rothermel et al. found that the total coverage prioritization outperforms the additional coverage prioritization.
This work was taken a step further by Elbaum et al. [24] to address the version specific prioritization. Eight techniques were proposed out of which the “total function” and the “additional function” were based on coverage. Rate of fault detection improved by using the version specific test case prioritization. Comparisons among 12 techniques (4 statement level and 8 function level) yielded the worst and the best results for fn-total (function-total) and fn-fi-fep-addtl (function-fault existence/exposure-additional) techniques respectively. A tradeoff was established between the statement and the function level techniques. On one hand the function level techniques were found to be more cost effective and involved less intrusive instrumentation while on the other hand the statement level techniques were preferred if sufficiently high cost of delays are observed in the detection of faults.
Srivastava and Thigarajan [25] introduced the binary code based prioritization approach. A test prioritization system Echelon was built that prioritizes the set of faults based on the changes made to the program. The suggested advantage of the binary form is the elimination of recompilation step for coverage collection etc. making the integration of build process easier in the production environment. The presented case study showed that it is possible to effectively prioritize the test cases using binary matching in a large-scale software development environment.
Do et al. [26] performed a controlled experiment to examine the effectiveness of test case prioritization on programs tested under JUnit. Six block and method level granularity techniques were proposed: Total block coverage, Additional block coverage, Total method coverage, Additional method coverage, Total diff method and Additional diff method. Diff method techniques use modification information. These techniques are for JUnit environment and correspond to the already proposed techniques focusing on C language in [23, 24, 27]. The inference drawn from the comparison was that the level of granularity and the modification information had no
effect on the prioritization. The techniques using feedback information (Additional techniques) provided significant improvement in the fault detection rate. On comparing with the previous studies on C, the statement level techniques were found to be better than the function level techniques. Possible reason for this as analyzed by [26] was that the instrumentation granularity for Java differs from C.
Bryce and Memon [25] proposed five new testing techniques for software interaction testing of Event-driven software. The techniques include: interaction coverage based prioritization by length of test (longest to shortest), 3-way interaction, 2-way interaction, unique event coverage and length of test (shortest to longest). The comparison within the proposed five and the random technique resulted in the following findings: test suites including largest percentage of 2-way and 3-way interaction have the fastest fault detection rate; the proposed techniques are useful for test suites having higher interaction coverage.
A graph model based prioritization using fuzzy clustering approach was proposed by Belli et al. [29] in 2006. The paper presented a case study of graph model based approach on the web-based system ISELTA. The complexity of the method has been given as O(n2). The approach was found to be useful when test suites are ordered within restricted time and method.
The effects of time constraint on the cost benefits of regression testing were studied by Do. et al. [30] by offering four techniques out of which two were based on total/additional coverage and two on Bayesian network approach (discussed in section 4.8.3). Additional technique was found to be more efficient than total technique.
Jiang et al. [31] proposed nine new coverage based Adaptive Random Test (ART) Case Prioritization techniques in 2009. These techniques were broadly classified into three groups namely maxmin, maxavg, and maxmax. For each group the level of coverage information was based on statement, function and branch. The comparison within the proposed techniques and random ordering resulted in the following findings: ART techniques are more effective than random ordering; ART –br-maximum (br-branch) technique is the best among the entire function group of ART techniques; it is more practical and statistically effective than the traditional coverage based prioritization techniques revealing failures.
Maia et al. [32] proposed the use of Reactive GRASP (Greedy Randomized Adaptive Search Procedures) metaheuristics for prioritizing the test cases. The technique uses block, decision and statement coverage criteria. The results were compared to the search algorithms like greedy, additional greedy, genetic and simulated annealing techniques. They found that the proposed technique significantly outperformed genetic, simulated annealing and greedy algorithm. Also, the performance was not worse than the additional greedy algorithm. Proposed solution exhibited more stable behaviour as compared to other solutions.

384 Informatica 36 (2012) 379–408 Y. Singh et al.
In 2009, a multilevel coverage model based family of prioritization techniques was proposed by Mei et al. [33] to capture the business process. Mei et al. defined three data coverage levels as CM-1, 2 and 3 where CM implies Coverage Model. Ten proposed techniques (M1 to M10) include: M1: Total-CM1, M2: Addtl-CM1, M3: Total-CM2-Sum, M4:Addtl-CM2-Sum, M5:Total-CM2-Refine, M6:Addtl-CM2-Refine, M7:Total-CM3-Sum, M8:Addtl-CM3-Sum, M9:Total-CM3-Refine, and M10:Addtl-CM3-Refine. They also gave a hierarchy of the proposed techniques to analyze their effectiveness. Except the optimal technique, M6 and M7-M10 were found to be generally better and M1 was found to be the worst among all other techniques. Recently in 2010, Mei et al. [34] also proposed four black box testing techniques for service oriented application in which the regression test cases were reordered using WSDL (Web Service Description Language) information. The techniques comprise: Ascending/Descending WSDL tag coverage prioritization, Ascending/descending WSDL tag occurrence prioritization. Contrasting these four black box techniques with two benchmark (random and optimal), two traditional (Total and Additional-Activity) and two white box (Total and Additional-Transition) prioritization techniques they computed APFD, Boxplots and performed ANOVA analysis. They derived the following outcomes: Black box testing techniques are better than the random ordering in terms of the overall mean APFD. Moreover, white box testing techniques required source code for the services under test while the black box needs only interactive messages. In analogy to traditional functional prioritization techniques, black box testing techniques were able to achieve coverage based on tags. Also, the black box testing techniques achieved higher fault detection rates.
The latest study for the coverage based approach for developing a single abstract model by combining the GUI and the web applications for testing was published in 2011 by Bryce et al. [35]. The prioritization has been accomplished based on Parameter-Value Interaction Coverage, Count, or Frequency criterion. The generic prioritization criterion for both the GUI and the web applications was also defined. The comparisons concluded that both the applications showed similar behaviour when re-casted using the new model. The usefulness of the combined model for two types of event-driven software was indicated by the empirical study.
5.2 Modification Based (MF) ApproachThis approach aims to prioritize the test cases based on the modifications made to the program. As already mentioned in the previous sections, the initial paper discussing prioritization was using modification-based approach and was authored by Wong et al. [22]. In 2005, Korel et al. [37] proposed System model based selective test prioritization and Model dependence based test prioritization techniques using Extended Finite State Machine (EFSM) system models. Although the later technique was a little expensive, improvement in prioritization effectiveness was observed using rate of
fault detection metrics for both the techniques. Korel et al. [36] proposed five more heuristic based techniques and compared all the seven techniques in 2007. Model dependence based technique and a heuristic technique based on high priority assignment to test cases executing transition that execute least number of times, exhibited best effectiveness out of all the seven techniques. The later is significantly simpler and requires less information about the models than the former.
A model based prioritization approach for selection of test cases relying on traceability links between models, test cases and code artifacts was given by Filho et. al. in 2010 [38]. This technique supports the change based regression testing using timestamps and property based prioritization. They performed the prioritization and the filtering as a part of the process of test generation using test suite modifiers.
5.3 Fault Based (FB) ApproachFault based prioritization techniques have been proposed initially by Rothermel et al. in [23]. According to it, the ability of a fault to be exposed by a test case not only depends whether a test case executes a particular statement but also on the probability that the fault in the statement will cause failure for that test case. Two techniques (Total fault exposing potential (FEP) and Additional-FEP prioritization) with respect to the fault exposing potential of a test case have been presented in the study. The study also proposed four coverage-based techniques as discussed in the earlier section. Additional – FEP outperformed all the proposed coverage based technique. Total FEP outperformed the same except total branch coverage prioritization. The results shown using Efficacy and APFD suggested that these techniques can improve the fault detection rate and that the results occurred even for the least expensive techniques.
Elbaum et al. presented six function level techniques for prioritizing test cases with respect to faults [24]. Two of the techniques are function level based fault exposing potential (FEP) prioritization; other two are based on fault index that represents fault proneness for that function and two more combine both fault index and fault exposing potential by initially applying total fault index prioritization to all test cases and then applying FEP prioritization to that possessing equal fault index value as secondary ordering. Two more coverage-based techniques presented in the paper have been discussed in the coverage section. Enough statistical evidence has been provided to show that the function level techniques are less effective than the statement level techniques. Fault proneness and FEP estimators have not been found to significantly improve the power of prioritization techniques.
In addition to the above techniques, four function-level prioritization techniques were also proposed by the same authors [27]. The techniques are DIFF-based techniques. These techniques require the computation of syntactic differences between two versions of the program. The degree of change is measured for each of the function present in both the versions by adding the

SYSTEMATIC LITERATURE REVIEW ON… Informatica 36 (2012) 379–408 385
number of lines inserted, deleted or changed in the output of UNIX diff command applied to both the versions. Two of these four techniques are based only on DIFF and other two combine DIFF with FEP (Fault Exposing Potential). They have compared 18 techniques: two reference techniques (optimal and random), four statement-level and twelve functional-level techniques [23, 24, 27]. Statement level-additional FEP technique performed the best after the optimal. The second best were the function level techniques combining fault proneness measures and FEP. Additional techniques were found to be better than total techniques. Also, the statement level techniques were better than function level technique. Finally, the techniques combining FEP and fault index were better than the rest.
5.4 Requirement Based (RQ) ApproachSrikant et al. [39, 40] proposed a system level technique PORT V 1.0 (Prioritization Of Requirements for Testing) for prioritization based on the requirements and developed a tool to implement the same. The value-driven approach is based on four factors: customer assigned priority of requirements, developer-perceived implementation complexity, requirement volatility and fault proneness of the requirements. The objective is to reveal the severe faults earlier and to improve the customer-perceived software quality. Higher severity faults were mapped with the requirements with higher range of PFV where PFV is the prioritization factor value for a particular requirement computed using their formula. The study showed that the PORT technique could improve the testing efficiency by focusing on the customer’s highest value functionality and on improving the severe fault detection rate thereby minimizing field fault occurrence.
Quota constrained strategies (Total and Additional) to maximize the testing requirement coverage were proposed for a service-centric system in [41] by Hou et al. The aim is to maximize the total or the additional testing requirement coverage. It selects a subset of test cases that can satisfy the constraint imposed by the request quotas over a period of time. The comparison of Quota strategies with branch coverage approaches lead to the outcome that the Quota constraint strategies provided better branch coverage.
A model for system level test case prioritization from the software requirement specification was presented to improve user satisfaction and the rate of severe fault detection in [42]. The model prioritized the system test cases based on the following six factors: customer priority, changes in requirement, implementation complexity, usability, application flow and fault impact. Another technique by the same authors has been presented in [43] which only differs in two of the factors affecting the prioritization algorithm. The factors presented in [43] are: customer assigned priority, developer perceived code implementation complexity, changes in requirements, fault impact, completeness and traceability. On comparing the techniques with the total statement and the total method coverage, the rate of
detection of severe faults was found to be higher for their technique.
5.5 History Based (HB) ApproachKim and Porter proposed the first history-based prioritization technique in 2002 [44]. The prioritization performed in the technique is based on the historical execution data. They show that the historical information may be useful in reducing costs and increasing the effectiveness of the regression testing process. The notion of memory full regression testing was incorporated in [44]. The weakness of this approach is that only the effect of last execution of the test cases, especially in the binary manner, is used to calculate the selection probability of test cases. Evaluations yielded that regression testing may have to be done differently in the constrained environments than the non-constrained one. Also, the historical information may be useful in reducing the cost and increasing the effectiveness of a lengthy regression testing process.
A historical value based approach using the historical information to estimate the current cost and the fault severity for cost-cognizant test case prioritization is presented by Park et al. in [45]. It uses the function level gratuity and the historical information of the cost of the test cases and the fault severities of detected defects in a test suite to calculate the historical value of the test case. This value is then used for test case prioritization. In analogy with functional coverage prioritization technique, the technique produced better results in terms of APFDc metric.
Fazlalizadeh et al. [46] modified the history based prioritization technique proposed by Kim and Porter [44] to give faster fault detection in the resource and time constrained environments. The paper presented a new equation that considers the historical effectiveness of the test cases in fault detections, test case’s execution history and last priority assigned to the test cases. The proposed technique was compared to random ordering and boxplots were used to visualize the empirical results confirming faster fault detection and stability.
5.6 Genetic Based (GB) Approach A time aware prioritization technique practicing genetic approach was proposed by Walcott et al. in 2006 [47]. The experiment was conducted at program level granularity on two subjects: Gradebook and JDepend. Emma and Linux process tracking tool were operated on and the results were quantified using the APFD metric. Eventually, GA prioritization realized improvement over no ordering (by 120%), reverse ordering and fault aware prioritization.
Another Genetic Algorithm (GA) based test suite test case prioritization was proffered by Conrad et al. in 2010 [48]. The paper presented a wide variety of mutation, crossover, selection and transformation operator that were used to reorder the test suite. An experimental study was implemented on 8 case study applications (same as in [49]), using same coverage effectiveness metric [49] and their JUnit test cases at system level. The results

386 Informatica 36 (2012) 379–408 Y. Singh et al.
were analyzed with the help of beanplots. On comparison of the proposed technique with random search and hill climbing techniques, GA yielded finer results. Also GA was found to have similar execution times as that of random search and hill climbing. All in all, GA showed a greater variability and is also an upcoming area of research in the field.
5.7 Composite (CP) ApproachesThe techniques using two or more of the above (4.1-4.6) and other (4.8) approaches have been categorized under the composite approach.
5.7.1 CB+MFThe introductory study that identified prioritization for regression testing was reported by Wong et al. [22]. They combined modification and coverage approach for their hybrid technique (modification, minimization and prioritization). Though the technique is applied on statement level granularity, it can also be implemented for function level and low level granularity. A combination of modification and minimization was compared with the combination of modification and prioritization techniques. Both were found to serve as a cost effective alternative for faster regression testing in a time and cost constrained environment. The cost effectiveness of techniques was measured using size reduction, recall and precision metrics.
A case study based on the technique incorporating aspects of modification and decision coverage was conducted by Jones and Harrold [50]. The empirical study revealed that the technique significantly reduced the cost of regression testing.
The use of particle swarm optimization (PSO) algorithm for automatic prioritization of test cases based on the modified software units and fitness of the test coverage was proposed in 2008 by Hla, Choi and Park [51]. The total prioritization cost using PSO algorithm was computed to be O((m*p)kn) < O(mn2). Comparing with the random technique they found that 64% coverage could be achieved against only 47% achieved by the random technique.
5.7.2 CST+FBCost-cognizant test case prioritization techniques based on the cost and fault severity were presented by Malishevsky et al. in 2006 [52]. The author adapted and compared their already suggested function level techniques [24, 27] namely fn_total, fn_addtl, fn_diff_total, fn_diff_addtl to the cost cognizant framework. The complexity of the cost cognizant total algorithms was found to be O(n.m + nlogn) while that of additional algorithms was O(n2m) where n is the size of test suite and m is the number of functions in the system. The proposed techniques were found to be effective only in some of the cases.
5.7.3 MF +SLCA statement level slice based heuristic combining REG (regular statement/branch) executed by test case, OI (output influencing) and POI (potential OI) was expressed in an experimental study conducted by Jeffery and Gupta [53]. Aristotle Program Analysis tool was used to compare the technique with total statement and branch coverage. It was interpreted that faults were detected earlier in the testing process from the fact that the information about relevant slicing and modifications traversed by each test case is beneficial when used as a part of test case prioritization process.
5.7.4 MF+CB+FBMirarab et al. proposed a test case prioritization technique based on Bayesian networks in 2007 [54]. The demonstrated technique is a mixture of three approaches namely modification, fault and coverage based. A comparison was performed among ten prioritization techniques that included three control techniques (Original, Random and Optimal) and six total/additional techniques based on class, method and change overage and the introduced technique. It was observed that all the techniques performed better than random order and original order and that, as the number of faults grew Bayesian network yielded promising results. In 2008, the aforementioned authors presented an enhanced Bayesian networks approach [55]. The technique introduced a new feedback mechanism and a new change information gathering strategy. The results derived from APFD have showed the advantage of using feedback mechanism for some objects in terms of early fault detection.
5.7.5 RQ+HBA novel prioritization technique for black box testing was brought up by Qu et al. [56]. It is requirement based prioritization approach for which test history and run time information were used as the input method. Moreover, the technique was compared with the random ordering suggesting that the technique improved the test suite’s fault detection rate.
5.7.6 CB+IBA prioritization technique “Combinatorial Interaction Regression Testing (CIT)” combining coverage and interaction approaches has been suggested by Qu et al. [57]. NAPFD metric is used to compare CIT technique with re-generation/prioritization technique where re-generation prioritization techniques are the techniques that are combination of generation and prioritizationusing interaction testing [58]. The outcome shows that prioritized and re-generated /prioritized CIT test suites were able to find faults prior to unordered CIT test suite.
5.7.7 RQ+CSTTwo techniques “total” and “additional” combining “testing requirement priorities” and “test case cost” were set forth by Zhang et al. [59]. They worked on the simulation experiments to empirically compare 24

SYSTEMATIC LITERATURE REVIEW ON… Informatica 36 (2012) 379–408 387
combinations of the requirement priorities, test cost and test case prioritization techniques. The techniques were compared with the unordered test suite and “additional” technique performed the best among the three. An original metric to evaluate the effectiveness of prioritization based on “units of testing requirement priority satisfied per unit test case cost” was realized.
5.7.8 MF+SVDA methodology based on Singular value decomposition (SVD) with empirical change records was introduced by Sherriff et al. [60]. The case study compared the presented technique and the regression test selection (RTS) technique [61] with respect to inclusiveness, efficiency and generality. It turned out that the technique was more efficient than the RTS techniques provided the traceability information is readily available.
5.7.9 CB+MF+SLCJeffrey and Gupta [62] advanced their earlier proposed technique [53] by adding coverage requirements of the relevant slices to the modification information for prioritization. The two techniques derived from the original technique “REG+OI+POI” [50], were named as “GRP_REG+OI+PI” and “MOD*(REG+OI+PI)”. In comparison with the statement and branch coverage techniques, the extended MOD*(REG+OI+POI) proved to be an improvement over the REG approach on the grounds of the fault detection rate of prioritized test suites.
5.7.10 CB+MF+FB+PSA prioritization technique by Ma and Zhao [63] based on coverage, modification, fault and program structure was presented and compared with four other techniques: total and additional method coverage, total and additional different method coverage. It came forth that the technique performed better than original, random, total method coverage, additional method coverage, total different method coverage and additional different method coverage by 30%, 62%, 13%, 11%, 31% and 24% respectively.
5.7.11 CF+DF+CB+MFChen et al. [64] reported a test case prioritization technique in 2010 for the web service regression testing using WS-BPEL language. The paper presented a case study of an ATM example and a weighted graph was constructed that help to identify modification affected elements using impact analysis. The study was based on combination of four approaches: control flow, data flow, coverage and modification. Two techniques that were used to prioritize test cases included total and additional techniques. The main goal of prioritization was to cover the elements with the highest weight. The approach gave appropriate reasons for fake dependence in BPEL process and also gave solutions for their elimination.
5.7.12 HB+GA+CSTA cost-cognizant technique utilizing the historical records and the genetic algorithms to carry out the prioritization process was instigated by Huang et al. in 2010 [65]. A combination of three approaches (history, genetic and cost based) was used by the version specific test case prioritization technique. GA_hist was compared with a genetic based [47], two history based [45], a cost cognizant based, a function coverage based, random and optimal techniques. The results highlight greater mean APFDc value for the GA_hist than other techniques. It was also revealed that the proposed technique improvedthe effectiveness of cost-cognizant test case prioritization without taking into account the source code, test case cost and uniformity of the fault severities. The greater the number of generations, more effective is the proposed technique.
5.8 Other (O) ApproachesThe approaches for which only single technique was available in the literature have been listed in the ‘Other’ category.
5.8.1 Data flow based (DF)Rummel et al. [66] proposed a data flow based prioritization technique in 2005. It is based on the definition and use of the program variables by employing the all-DU’s test adequacy criteria. The discussed technique was compared with the random ordering. It was found that the time and space overhead increase with the size of the application. Also, it was concluded that the test suites can be prioritized according to the all-DU’s with minimal time and space overheads. Finally, the data flow based prioritization were not found to be always effective than the random order.
5.8.2 Inter Component Behaviour (ICB)In 2007, Mariani et al. [67] gave a new technique to prioritize the test cases that provided an improvement of the efficiency of the regression testing of the COTS components. The proposed techniques followed inter component behaviour approach. The technique helped in discovering many faults after the execution of a small amount of high priority test cases. It was also observed that less than 10% of the high priority test cases revealed all the faults for all the considered configurations except in one of the configurations.
5.8.3 Bayesian Network Approach (BN)Two class level Bayesian network based techniques were described by Do et al. [30] in addition to the two coverage based techniques (discussed under CB approaches). The effectiveness of the block level and the class level techniques were contrasted against the original and the random ordering. It emerged that the effect of time constraint on differences between the cost benefits increased as the time constraint level increased. As mentioned earlier, feedback techniques (additional) were found to be more effective than their non-feedback

388 Informatica 36 (2012) 379–408 Y. Singh et al.
counterparts. Overall, it was found that the BN techniques tended to have lower cost on an average than the coverage based techniques.
5.8.4 Cost Based Approach (CST)A prioritization technique for Multiple Processing Queues applying task scheduling methods was proposed by Qu et al. [68]. The technique was compared with the random approach providing an improvement in parallel testing scenario with respect to the fault detection.
5.8.5 Graph based Approach (GPH)Ramanathan et al. presented a graph based test case prioritization in 2008 [69]. A weighted graph was constructed in which the test cases denoted the nodes and the edges specified user defined proximity measures between the test cases. The de clustered linearization of nodes in the graph led to the prioritization of the test cases. Fielder (spectral) and greedy ordering approaches were used and were implemented using PHALANX framework.
5.8.6 Configuration Aware Approach (CA)A paper addressing the issue of providing configuration aware regression testing for evolving software was presented by Qu et al. [70]. A combinatorial interaction testing technique was used to generate the configuration samples that were used in the regression testing. The comparison highlighted that the median fault finding ability and NAPFD of the technique is higher than original ordering and has better fault detection capability than random ordering.
5.8.7 Classification Tree Based ApproachYu et al. [71] proposed an annotated classification tree based prioritization technique in 2003. The annotation to the classification tree is made with additional information of selector expression, occurrence tags and weight tags. The annotated classification tree was used to prepare prioritized test suite and this process was automated using EXTRACT (Extracting black boX Test cases fRom Annotated Classification Tree).
5.8.8 Knapsack Based Approach (KB)Knapsack solvers were exploited in the time aware prioritization by Alspaugh et al. in 2007 [72]. The test suites were prioritized using seven algorithms: Random, Greedy by ratio, Greedy by value, Greedy by weight, Dynamic Programming, Generalized tabular and Core. The effectiveness of each of the algorithm to prioritize was measured using code coverage, coverage preservation and order-aware coverage metrics. The comparisons revealed that Dynamic programming, Generalized tabular and Core do not always create more effective prioritization. Moreover, if correctness had utmost importance, overlap prioritizers with higher time overhead were found to be appropriate.
5.8.9 Failure Pursuit Sampling (FPS)Simons et al. [73] proposed a distribution based prioritization technique called Failure Pursuit Sampling that was previously used for prioritization of tests in general [5]. The original technique was modified by improving the clustering and the sampling phases of FPS using the fault matrix computed from the execution of test on the previous versions. It was accrued that the technique has higher rate of efficiency than the original FPS.
5.8.10 Search Algorithm based (SA)Search algorithms have been used as the basis for prioritization technique or comparisons. Some of the studies [32, 48, 65, 72] using the search algorithms have been discussed in the previous sections as they followed genetic, composite or other approaches. The papers exclusively based on search algorithms have been discussed here. All the recorded search algorithm for RTP have been summarized in Appendix A. (Table A3).
Li et al. [74] applied five search algorithms (Hill climbing, Genetic algorithm, greedy, additional greedy and 2-optimal greedy) to prioritization and compared them by empirical evaluation. Greedy algorithms enhance the initially empty test suite incrementally using some heuristics. The greedy algorithms are also compared with respect to their cost of prioritization. If m is the number of statements and n is the number of test cases, the cost of prioritization for greedy, additional greedy and 2-optimal greedy was found to be O(mn), O(mn2) and O(mn3) respectively. The results exhibited that Additional Greedy and 2-Optimal were the finest and along with Genetic Algorithm, these 3 always outperformed the Greedy Algorithm.
An extension and empirical evaluation of greedy algorithm, 2-optimal greedy algorithm and delayed greedy algorithms was presented by Smith and Kapfhammer in 2009 [49]. They incorporate the test case cost, the test coverage and the ratio of coverage to cost in the algorithm. For each of the eight observed case studies, a decrease in the testing time and the coverage of the test requirements was observed.
Lately in 2010, Sihan Li and his teammates [75] performed a simulation experiment for studying the same [74] five search algorithms for RTP. The test requirements based on statement, decision, block and other coverage criteria were measured. The results concluded that the Additional and the 2-Optimal greedy algorithm performed better in most of the cases, which is in conformance to the results of the previous study. Also, the overlap of test cases affected the performance of these algorithms with respect to the test requirements.
5.9 Comparison StudiesElbaum et al. in 2001 [1] proposed a new cost cognizant metric APFDc (adapted from APFD) that was used for measuring the rate of fault detection and included varying test cases and fault costs. A case study was performed to analyze the impact of test cost and the fault

SYSTEMATIC LITERATURE REVIEW ON… Informatica 36 (2012) 379–408 389
severity of the prioritization techniques (random, additional statement coverage, additional function coverage and additional fault index). The additional faultindex prioritization resulted better than the other techniques. All the four techniques were found to be better than the random technique.
In addition to the above three techniques, three more techniques (Total statement/ function coverage and fault index) and optimal (instead of random) techniques were analyzed in terms of APFD (initially explained in [20]) by Elbaum et al. [2]. The task was accomplished by exploring the impact of certain factors of the various prioritization techniques on the fault detection rate. The conclusion drawn by them was that a new technique incorporating information provided by the metric APFD can be developed.
Nine techniques were described and compared by Rothermel et al. in 2001 [3]. The techniques were: original order; random order; optimal; total/additional statement coverage; total/additional branch coverage; total/additional fault exposing potential prioritization. The results showed that all the techniques performed better than the original and the random order prioritization. Also, the additional fault exposing potential prioritization performed the best. Moreover, the branch coverage techniques were better than the corresponding statement coverage techniques.
Elbaum et al. [4] examined two techniques, total/additional function coverage along with the random and the optimal ordering to understand the effect of change on the cost effectiveness of the regression testing techniques. They made use of a large number of measures to accomplish the comparative case study. The analysis found that the change attributes played a significant role in the performance of the techniques. Also, the additional function coverage technique outperformed the total function prioritization technique regardless of the change characteristics. The total technique gave varied results and was sometimes worse than random prioritization.
An empirical comparison among four different prioritization techniques was put forward by Leon et al. in 2003 [5]. These techniques included test suite minimization, prioritization by additional coverage, cluster filtering and failure pursuit sampling (FPS). The former two techniques were broadly classified as coverage based and the latter two as distribution based. The comparisons yielded the following findings: when the sample sizes are small, basic coverage maximization can detect the facts efficiently; one per cluster sampling achieves comparably good results and at the same time does not achieve full coverage; for large sampling sizes, FPS is more efficient than cluster sampling. APFD demonstrated that the random ordering outperformed the repeated coverage maximization for GCC while not for Jikes and Jvac. The results also suggested that both the coverage based and the distribution based techniques were complimentary in finding different defects.
Rothermel and Elbaum [6] experimented and studied the effect of test suite granularity and test input grouping on the cost and the benefit of regression testing
methodologies. An analogy was established among the three prioritization techniques: optimal, additional and additional-modified function coverage prioritization. It revealed that the test suite granularity affected several cost-benefit factors for the methodologies and at the same time the test input grouping had limited effect. As the granularity level decreased, higher APFD values were observed. It emerged that the finer granularity precisely discriminates between the test cases. The results were recorded to be consistent with [27].
Elbaum et al. [7] thoroughly analyzed the fault detection rates of five prioritization techniques (random order, total/additional function coverage prioritization; total/ additional binary diff. function coverage prioritization) on several programs and their versions to help the practitioners chose a technique for a particular scenario. The generalized results showed that the techniques using feedback gave better results. They suggested that since the performance of the technique varied significantly with the scenarios (programs, test cases and modifications), it was therefore necessary to choose the appropriate technique. They also stressed that choosing a technique with higher APFD is oversimplifying and may not always imply a better technique. The two strategies proposed by them for the practitioners include: Basic instance-and-threshold strategy (to choose a technique that is successful for largest number of times) and Enhanced instance-and-threshold strategy (that adds attribute of the scenario using metric and then selecting the technique by building classification tree). The results suggested, like many others, that the techniques using feedback were better.
A small experimental study was performed for comparing the simple code based and the model based test prioritization method with respect to the early fault detection effectiveness in the modified system by Korel et al. [76]. The study focused on the source code faults. The results expressed that the model based test prioritization may improve the average effectiveness of early fault detection significantly when compared to code-based prioritization. The model based prioritization was less expensive but was sensitive to the information provided by the tester or the developer.
Block and method level prioritization techniques for the total and the additional coverage were assessed using the mutation faults by Do and Rothermel in 2005 [8]. They also examined the consistency of the results with the prior study [26] of Java System using hand seeded faults. The levels of coverage had no effect on the rate of fault detection whereas the additional techniques proved better over the total techniques.
The same authors along with Kinner [9] empirically performed the cost benefit analysis on the same artifacts. The comparisons were accomplished on the same techniques as mentioned above and also the method_diff total and the additional techniques. They found that the functions and the statement level in C correspond to the method and the block level in Java respectively. It hailed from the experiment that the statement level techniques were superior to the function level in C. But the block

390 Informatica 36 (2012) 379–408 Y. Singh et al.
level techniques were not found to be very different from the method level techniques in Java. This is because the block level is not as sensitive as the statement level. The cost benefit analysis also revealed that the method and the block level additional techniques resulted in the highest cost savings.
Do and Rothermel [77] further conducted an empirical assessment of the same techniques as in [8]. Same results with respect to the level of coverage were recorded. Due to large sampling errors produced using the mutation faults, they were found to have better rate of fault detection over the hand seeded faults.
Aforementioned authors [78] also put forth an improved Cost-Benefit model incorporating the context and the life-time factors and compared two prioritization techniques (total/additional block coverage) and two regression test selection techniques. Time constraint proved an important factor for the relative benefits hailing from the tradeoff between the cost of the additional tests without missing the faults and the cost of reduced testing missing the faults.
A series of controlled experiments was conducted by Do et al. in 2010 [79]. These were used to assess the effects of time constraint on the cost and the benefits of six prioritization techniques. The techniques included two control (random/original) and four heuristic techniques (two feedback and two non-feedback). The results showed that heuristic techniques(Bayesian network based and conventional code coverage based) were useful when no time constraint were applied and the software contained a large number of faults. The results also revealed the cost effectiveness of the feedback (additional) prioritization techniques over their non-feedback counterparts. In addition, the feedback techniques again performed unvaryingly better with the increase in the time constraint levels.
6 Results and AnalysisThe study resulted in the selection of 65 RTP research papers for the literature survey. 106 new prioritization techniques were identified from 49 of the studies, whereas rest 16 studies were based only on the comparative analysis.
Publication trends (Fig. 3) were observed from 1969 till the search of studies for the survey was carried out (Feb 2011). The first technique (composite) was recorded in the year 1997. Over the years, many more techniques were logged and an increasing publication trend has been observed. Maximum number of published papers appeared in 2007 and 2008 (11each) accounting for 35 of the techniques. Though most of the techniques were documented in 2009 (21), the number of studies were only six. This is due to the fact that many studies presented more than one technique in the same paper.
Figure 3: Publication trends.
6.1 Advent and usage of approaches (RQ1)The techniques were broadly categorized under eight approaches as already discussed. The advent of these approaches has been illustrated graphically in the Fig. 4.The height of the bars in fig.4 represents the recentness of the use of the particular approach to regression test prioritization. The year 1999 saw the advent of the Fault based approach for prioritization. It also proved to be the main motivation behind many evaluation measures such as APFD etc. After these, the year 2002 experienced the use of the feedback (History based) approach for test suite prioritization [44]. Generally, the errors are concentrated in the primary stages of the software development process. Realizing this fact, Requirement based techniques emerged for the first time in 2005 [40]. Genetic algorithms based techniques are an upcoming approach documented primarily in 2006 [47] for the use in prioritization. The approaches introduced after 2006 have been included in the ‘Others’ category along with the approaches that have not been used more than once in the RTP field. The earliest approaches, Coverage and Modification based (composite), came in 1997 [22]. Almost half of the recognized techniques were only coverage based (44%) followed by the composite, the fault based and other approaches as depicted by the pie chart in Fig. 5.
Figure 4: Advent of new approaches; CB-Coverage based, MF-Modification based, CP – Composite, FB-Fault based, HB- History based, O-Others, RQ-Requirements based, GB- Genetic based.
Publication Trends
10
68
0
6
2
65
3
19
16
21
12
1
0
5
10
15
20
25
1997
1998
1999200
0200
1 200
22003
2004
2005
2006
2007
2008
2009
2010
2011
Years
Num
ber
No. ofTechniques ineach year
Total no. ofpublishedpapers
Advent of new approaches
1997
2006
19921994
199619982000
20022004
20062008
CB MF CP FB HB O RQ GB
Approach
Year
of P
ropo
sal

SYSTEMATIC LITERATURE REVIEW ON… Informatica 36 (2012) 379–408 391
Figure 5: Usage of approaches by the techniques; CB-Coverage based, MF-Modification based, CP –Composite, FB- Fault based, HB- History based, O-Others, RQ- Requirements based, GB- Genetic based.
6.2 Are RTP techniques independent of their implementation language? (RQ2)
The groundwork culminated in determining 17 levels of Granularity utilized by the 106 techniques. It emerged that System level, Web services, Statement level and Function level granularity were largely utilized (Fig. 6). The input method used by majority of the techniques was found to be Source Code (as clearly shown in Fig. 7). This is justified as the majority of the prioritization techniques have been applied in the later stages of the software development life cycle (SDLC), i.e., after the source code is available. Also it can be inferred that the System Models were the next in majority to be used as the input method. System Models were mainly utilized by the techniques that came after the introduction of requirement based prioritization techniques. Thus we can observe an increase in the use of the prioritization techniques in the earlier stages of SDLC also. The distribution of the type of languages used by the techniques has been depicted in Fig. 8. About half of the techniques were found to be Language Independent, suggesting their compatibility over many languages. Approximately one-fourth of the techniques worked for Procedural languages only. An increasing use of the recent techniques for Web designing languages (16%) was noticed. Another major used language type was Object Oriented languages (11%). Binary code based and COTS component based languages also formed the basis of a few techniques.
It can be inferred from the above data that in-spite of huge variations in 1) the level of granularity at which an RTP technique is applied, and 2) Source code being majorly used as an input for an RTP technique; almost half of the RTP techniques were still found to be language independent. Although this is not sufficient to prove the independence of various RTP techniques from their implementation language, it encourages the current and future research in the field to be more language independent. This would allow various researchers to use
each other’s technique and will surely lead to better quality research and its assessment.
Figure 6: Usage of granularity by the techniques; Stmt.-Statement level, Func.-Function level, Blk.-Block of binary form, Mhd.-Method level, Tranc.-Transaction in System Model, Sys.-System level, Prg.-Program, Prs.-Process level, Evt.-Event, Cpt.-Component, File-file to be changed, SU-Software units, WS-Web services, Mdl.-Module, Cfg.-Configuration of software system, Class-class level, Any-any level.
Figure 7: Usage of input method by the techniques; SC-Source code, BF-Binary code, SM-System level, SYS-System, CG-Call graph for program structure, R&SP-Requirements and specifications.
6.3 Identifying the gaps in the usage of Artifacts, Tools and Metrics in RTP (RQ3)
6.3.1 ArtifactsArtifacts are the pre-requisites for accomplishing controlled experiments on the testing techniques. Artifacts might comprise of software, test suites, fault data, coverage data, requirements, history information etc. depending on the type of experiment utilizing the artifacts. A thorough investigation of the artifacts used by the various regression testing techniques has already been presented by Yoo and Harman in [18]. They emphasized more on the size of Subject Under Test
Usage of approaches by the techniques
MF8%
CB44%
FB11%RQ
6%
HB3%
GB2%
CP17%
O9%
CB
FB
MF
RQ
HB
GB
CP
O
Usage of Granularity by the TechniquesCfg.
1%
Any4%
Cpt.1%
File1%
Class3%
Evt.6%
SU1%
Mdl.1%
Stmt.14%
Func.13%
Blk.3%
Mhd.6%Tranc.
4%
Sys.20%
Prg.6%
Prs.1%
WS17%
Stmt.Func.Blk.Mhd.Tranc.Sys.Prg.Prs.Evt.Cpt.FileSUWSMdl.Cfg.ClassAny
Usage of Input Method by the techniques
SC72%
BF2%
SM19%
SYS4%
CG1% R&SP
2%SC
BF
SM
SYS
CG
R&SP

392 Informatica 36 (2012) 379–408 Y. Singh et al.
(SUT) and the test suites studied, and thus it has not been replicated here. They found that 60% of the researches used SUT’s less than 10 KLOC, while on the other hand 70% of the studies have benefited from test suites with less than a 1000 test cases. Regarding the usage of artifacts, our results conform to those mentioned in [18], i.e. more than half of the artifacts have been freely procured from the Software Infrastructure Repository (SIR) [80]. The same has been demonstrated in the Fig. 9 having 50% share from SIR only. The research culminated in spotting 89 artifacts mentioned in 62 studies while 3 studies [51, 71, 76] did not mention any artifacts.
The seven C programs (printtokens, printtoken2, replace, schedule, schedule2, tcas, and totinfo) developed by Siemens Corporate Research and available on SIR [80] constitute 17% of all the artifacts used in [2, 3, 23, 24, 27, 31, 32, 44, 46, 50, 53, 62, 69, 73, 74]. A single ‘Space’ program (from SIR) of 6218 LOC, alone makes up 12% of the total artifacts exercised in [1, 2, 3, 22, 24, 27, 32, 44, 46, 50, 74]. SIR has also been used for some more programs accounting for 21% artifacts mentioned in all the studies [4, 6, 7, 8, 9, 26, 27, 30, 36, 37, 45, 54, 55, 57, 63, 70, 77, 78, 79]. Another single example of ‘ATM’ has been used in 5 researches [34, 36, 37, 64, 76]. A few studies [47, 48, 49, 72] have also made use of the JDepend (JD, tool for creating design quality metric for Java programs) and the Gradebook (GB, program
performing tasks associated with creating and maintaining grade-book system for a course). Rest of the studies [5-7, 25, 27-29, 31, 33-37, 39-43, 48, 49, 52, 56, 59, 60, 65-68, 75-78] comprised of the artifacts developed using their own examples or the artifacts that have been sparsely touched upon by others. These ‘other’ artifacts amount to be a vast 37% of all. Hence it can be incurred that except the ones from SIR, no other major artifacts were found to be utilized unanimously by the RTP researchers.
The size of all the artifacts have not been mentioned by all of the respective studies and also the information about some artifacts was so less that they could not be assessed. Most (53) of the total artifacts mentioning their size were in KLOC's ( i.e. over 1000 lines of codes) while a handful (14) were having size less than 1 KLOC. While 16 other artifacts had their size mentioned in terms of classes, methods or transitions rather than in terms of lines of codes. One possible reason behind this could be the usage of source code as input by majority of the RTP techniques developed till date. Once the source code is known, LOC becomes the size measure for that artifact. On the other hand the other size metrics used for artifacts correspond to the different types of input methods required by those RTP techniques. This was also confirmed by the fact that all the artifacts used for one particular RTP technique had the same size metric used (LOC or classes or method or transitions). This gap in the usage of artifact would remain also because various techniques follow various approaches for RTP. It does not make sense to calculate size of an artifact in LOC for being applied to requirements based approach, as it would not be possible to have the source code at the requirements analysis stage of SDLC.
6.3.2 ToolsThere is an abundance of tools available nowadays, providing a fruitful means to the researchers for quick implementation and automatic analysis of their works. At the same time it is also the reason behind the unavailability of standard and worldwide accepted tools. In addition, many researchers need to develop their own tools to meet their particular requirements. Thus, various practitioners use various tools for their research instead of any single standard tool.
Though it can be perceived from Fig. 10 that ‘Aristotle Program Analysis System’ tool was used by 11 of the studies, which is the highest of all the tools used; it was used primarily by the same authors in different studies [2-4, 6, 23, 24, 27, 52, 53, 57, 62]. This tool was first used by Rothermel et al. in [23] for providing the test coverage and the control-flow graph information. Another tool used by five of the studies [30, 45, 77, 78, 79] was ‘Sofya’. It helped in gathering the coverage information and the fault data of the test cases. ‘Emma’ tool has been utilized by 4 of the studies [43, 47, 53, 54] all by different authors. Emma is an open source toolkit for reporting Java code coverage. Few studies [2, 6, 31, 47, 52] also used ‘UNIX based’ tools such as UNIX Diff tool, UNIX utilities etc. for process tracking, collecting
Figure 8: Usage of Languages by the Techniques;Proc -Procedural Language, Bin.Code- Binary code, L.Ind-Language independent, COTS-COTS component based, WB-Web designing language, OO-Object oriented language.
Figure 9: Artifacts assessed.
Usage of Languages by the techniques
Proc23%
Bin.Code1%
L.Ind48%
COTS1%
WB16%
OO11%
Proc
Bin.Code
L.Ind
COTS
WB
OO
Artifacts Assessed17%
12%
21%6%
4%3%
37%Seimens (SIR) (17%)
Space (SIR) (12%)
Others from SIR (21%)
ATM (6%)
GB & JD (4%)
Not Mentioned (3%)
Others (37%)

SYSTEMATIC LITERATURE REVIEW ON… Informatica 36 (2012) 379–408 393
dynamic coverage information or to show which lines were inserted or deleted from the basic version. ‘SPSS’ or Statistical package for Social Sciences is an upcoming data analysis tool used in the later researches [28, 71, 76, 79]. Another very promising tool used by 3 of the studies [37, 63, 72] is ‘MATLAB’. It is an analysis and programming tool developed by Matrix Laboratory and is extensively used by many more applications; we expect it to be used more in the area of software testing also. One of the earlier used tools was ‘Proteum Mutation System’ to obtain the mutation scores for use in the Fault Exposing Potential (FEP) prioritization. Initially used in context of test case prioritization by Rothermel et al [23], it was further used in [3, 24, 27]. Its use was not spotted in any of the studies after 2002. The tools mentioning Java in their names (Junit Adaptor, Filter, JTester and byte code mutant generator) were grouped under the ‘Java based’ tools. Exploited in five studies [9, 47, 66, 77, 78], these tools varied in the purpose of their use but had a common language background, Java.
A couple of studies [8, 9] made use of the ‘Galileo’ system for acquiring coverage information by running test cases on the instrumented object programs in Java. ‘Sandmark’ is a watermarking program that provides change track algorithms employed by a handful of 3 studies [30, 54, 55] only. To comply with the specific requirements, seven studies mentioned their own created tools [23, 24, 27, 44, 63, 71]. Mostly the tools were created to automate their own proposed techniques. Some of the tools like Vulcan, BMAT, Echelon, déjà vu, GCOV, testrunner, winrunner, Rational test suite, bugzilla and Canatata++ etc. are only experienced in one study each. These all have been grouped under the Others category accounting for 31 such tools mentioned in [4-7, 22, 24-27, 30, 34, 35, 38, 39, 42-44, 46, 48, 52, 57, 69, 74, 75]. Exact details of the studies and tools used by them are available in the Appendix (Table A2).
None of the tools was discovered to be used by more than 13% of all the studies. This also generally results in the final outcomes that are not in a form comparable with the outcomes obtained using the other tools. Thus, we observed a wide range of tools used by all groups of the researchers without any particular standard being followed.
Figure 10: Tools mentioned.
6.3.3 MetricsTo properly understand the effects and the outcomes of any case study or experiment, one needs to quantify the results or analyze them with respect to the measures, well known in the software testing field as metrics. Unlike the scattered distribution seen in the tools usage, many of the diverse researchers tend to use the similar type or exactly the same metrics. Fig. 11 presents the final outcomes that commenced from scrutinizing the test case prioritization field in the view of the metrics used. We noticed a total of 97 metrics utilized by 60 research papers while 5 studies [29, 38, 60, 67, 71] did not mention any used metrics.
As clearly outlined in fig. 10, APFD came forth as a striking measure for computing the Average Percentage of Faults Detected and a massive of 29 studies [2-9, 23, 24, 26-28, 31, 33-35, 41, 46, 47, 53-55, 57, 62, 69, 73, 77] took advantage of the metric directly. This metric was originally set forth by the by a group of researchers in [23] and later used immensely by other groups of researchers as well. APFD metric denotes the weighted average of the percentage of the faults detected [2]. APFD values range from 0 to 100; higher numbers imply faster (better) coverage rates. It denotes how fast a prioritized test suite detects the faults. APFD is also being used in its mutant form as APFDc, APFDp, ASFD, WPFD, TSFD, APBC, APDC, APSC, NAPFD, APMC, TPFD, APRC, and BPFG. These have been put under the ‘APFD alike’ category shown in the graph [fig. 8]. 'APFD alike' are basically the metrics which are calculating average percentage of faults detected with some variations in the calculation method. APFDc is the modified APFD to include the costs of faults and is utilized by 5 researches [1, 52, 45, 63, 65]. Again a vast number of 10 studies [32, 39, 40, 42, 43, 57, 63, 64, 68, 74] benefited from the APFD alike metrics. These all sum up to more than 50% of the metrics availed by all the studies to be APFD or its mutants. It has now become a more or less standard in measuring the rate of fault detection achieved by the RTP techniques. We say so because, almost all the comparisons, whether between 2 or at most 18 techniques, given in the 65 studies were recorded to be based on the APFD (or its mutants) metrics. A meager of 5 studies [3, 6, 24, 27, 79] also made use of Bonferroni metric for analyzing their data. Bonferroni test provides a means of multiple comparisons in the statistical analysis. Various other metrics, whether available or self developed, such as PTR, RFFT, ATEI, ckjm, FDD, Kruskal Wallis Test, size reduction, precision, recall, efficacy, LOC count, and distance etc. have also been taken advantage of by a ide range of researchers [4, 5, 22, 23, 25, 26, 30, 31, 35-37, 41, 43, 44, 48-51, 56, 59, 63, 66, 70, 72, 75, 76, 78, 79]. Nonetheless, APFD and the other metrics provide a useful insight to the in-depth analysis of the techniques.
Explaining all the metrics along with their differences is beyond the scope of the current SLR, although there might be an SLR in future only on the software metrics being used for RTP that could include
Tools Mentioned
13%
6%
5%
6%
5%4%
5%6%2%4%
8%
36%
Aristotle (13%)
Sofya (6%)
Emma (5%)
Unix Based (6%)
SPSS (5%)
Matlab (4%)
Proteum (5%)
Java Based (6%)
Gali leo (2%)
Sandmark (4%)
Own (8%)
Others (36%)

394 Informatica 36 (2012) 379–408 Y. Singh et al.
the complete explanation and comparison for each technique.
Figure 11: Metrics used.
6.4 Summarized effects of the Comparisons with respect to the granularity and the type of information used (RQ4)
A handful of articles [1, 6, 23] found the ‘additional-fault exposing potential’ technique to be better than all the compared ones. But these were only preliminary studies in the test case prioritization area. Among all the studied papers, following highlights were accrued:
6.4.1 With respect to the level of granularity (RQ4-(a))
Out of the 17 determined levels of granularity followed by the 106 techniques, the System level, Web services, Statement level and Function level granularity were the most utilized (as explained earlier in 6.2 and Fig. 6). None of the comparisons was detected to be based on the system level or the web services granularity. The techniques using the C language have only been tested for statement and function level granularity and it worked out that the statement level techniques were more advantageous over the function level techniques [9, 24, 26, 27]. The techniques for Java (Junit) environment showed no effect of granularity on the prioritization; the possible cause of this was suggested to be the difference in instrumentation granularity for Java and C [26].
6.4.2 With respect to the type of information (RQ4-(b))
An intricate scrutiny of the 65 research papers emanated the superiority of the additional techniques over the total and the other techniques. The additional techniques are the ones that are based on extra feedback information used in the process of test case prioritization. The comparisons in an enormous amount of 17 studies [1, 3, 4, 7, 8, 9, 23, 24, 26, 27, 30, 32, 33, 59, 74, 75, 79] turned out to produce similar outcomes: the additional techniques are more cost effective.
7 ConclusionAs the number of publications in the field of software testing is increasing, there is a need for a method that can
summarize a researcher about the particular field. Systematic review is a tool that can be used to formally present the research made so far in a particular field. A systematic review on regression test prioritization techniques is presented in this paper which evaluates and interprets all the research work related to the area. It presents a concise summary of the best available evidences. The research identified over a hundred RTP techniques proposed since 1969. These were further classified based on the utilized approaches, and almost half of the recognized techniques came under the coverage based approach followed by composite, fault based and other approaches respectively. The paper summarizes the research papers along with the techniques they compared and the artifacts they processed. The tools and metrics being used in the research were also identified.
The input method used by majority of the techniques was computed to be the Source Code. This is justified by the use of the majority prioritization techniques in the final stages of SDLC, i.e., after the source code is available. After 2002, we also observed a general increase in the use of the prioritization techniques in the earlier stages of SDLC. Furthermore, an increasing use of the recent techniques for Web designing languages (16%) was detected.
Noticeably, it incurred that except the ones from SIR, no other major artifacts were found to be utilized unanimously by the researchers in the RTP field. No standard or sound majority could be established in the usage of tools. It lead to the results that were not in a form comparable with the outcomes obtained using the other tools. On the other hand, an analysis of the metrics used resulted in substantial findings. All the metrics spotted in the studies availing APFD or its mutants summed up to be more than 50%. Remarkably, we noticed that almost all the comparisons performed in all the selected studies were recorded to be based on the APFD (or its mutants) metrics. But failing to find the specific APFD values evaluated in the comparisons except for a few studies, it could not be possible to contrast all the techniques in general.
Though at most only 18 techniques were found to be compared in a single study, the results obtained provided useful insights into the RTP field. The inference drawn from the comparisons was that the additional techniques provided significant improvement in the fault detection rates. The level of granularity and modification information had no effect on prioritization for Java environment in general. Statement level techniques were found to be better than the function level techniques. Almost all the techniques were found to be better than the random technique. Many papers also presented comparisons with the optimal ordering, but since all the optimal orderings are defined according to the technique followed, it was not feasible to compare the optimal for different techniques.
The SLR finally highlighted that even after different approaches being followed by the various techniques, the prime goal of test case prioritization emerged as the increase in the rate of fault detection. Since no general
Metrics Used31%
5%
19%5%5%
35% APFD (31%)
APFDc (5%)
APFD alike (19%)
Bonferroni (5%)
Not Mentioned (5%)
Others (35%)
SYSTEMATIC LITERATURE REVIEW ON… Informatica 36 (2012) 379–408 395
technique exists, there is a need to perform empirical comparisons among the existing techniques that are made to work on the same concept, implementation, metric and artifacts.
References[1] S.Elbaum, A.Malishevsky, and G.Rothermel.
“Incorporating varying test costs and fault severities into test case prioritization”, Proceedings of the International Conference on Software Engineering, May 2000.
[2] S.Elbaum, D.Gable, and G.Rothermel, “Understanding and measuring the sources of variation in the prioritization of regression test suites”, Proceedings of the International Software Metrics Symposium, pp. 167-179, Apr. 2001.
[3] G. Rothermel, R.H.Untch, C.Chu, and M.J.Harrold. “Prioritizing test cases for regression testing”, IEEE Transactions on Software Engineering, Vol.27, No. 10, pp. 929-948, Oct.2001.
[4] S.Elbaum, P.Kallakuri, A.Malishevsky, G.Rothermel and S.Kanduri, “Understanding the effects of changes on the cost-effectiveness of regression testing techniques”, Journal of Software Testing, Verification, and Reliability, Vol.12, No.2, pp.65-83, 2003.
[5] D. Leon,A. Podgurski, "A Comparison of coverage based and distribution based techniques for filtering and prioritizing test cases", In Proceedings of the 14th International Symposium on software reliability engineering(ISSRE 03),pp 442-453,2003.
[6] G. Rothermel, S.G.Elbaum, A.G.Malishevsky, P.Kallakuri, and X.Qiu. “On test suite composition and cost-effective regression testing”, ACM Transaction Software Engineering Methodology, Vol.13, No.3, pages 277-331, July 2004.
[7] S.Elbaum, G.Rothermel, S.Kanduri and A.G.Malishevsky, “Selecting a cost-effective test case prioritization technique”, Software Quality Journal, Vol.12, no.3, pp. 185-210, September 2004.
[8] H. Do, G.Rothermel. “A controlled experiment assessing test case prioritization techniques via mutation faults”, Proceedings of the International Conference on Software Maintenance (ICSM), pp.411-420, 2005.
[9] H. Do, G. Rothermel and A. Kinner, “Prioritizing JUnit Test Cases: An Empirical Assessment and Cost-Benefits Analysis”, An International Journal of Empirical Software Engineering, Vol. 11, No. 1, pp 33-70, March 2006.
[10] B.A. Kitchenham, T. Dybå, M. Jorgensen, “Evidence-based Software Engineering”, in Proceedings of the International Conference of Software Engineering, 2004.
[11] T. Dybå, B.A. Kitchenham, M. Jorgensen, “Evidence-based Software Engineering for Practitioners”, IEEE Software, Vol. 22, No. 1, pp. 58-65, 2005.
[12] B.Kitchenham, “Procedures for undertaking Systematic Reviews”, Joint Technical Report,
Computer Science Department, Keele University (TR/SE-0401) and National ICT Australia Ltd (0400011T.1), July 2004.
[13] N. Juristo, A.M. Moreno, S. Vegas, “Reviewing 25 years of testing technique experiments”, Empirical Software Engineering Journal, Vol. 1, No. 2, pp. 7-44, 2004.
[14] M. Staples, M. Niazi, “Experiences using Systematic review guidelines,” The Journal of Systems and Software, Elsevier Science Inc. USA, Vol. 80, No. 9, pp. 1425-1437, Sept 2007.
[15] B. Kitchenham, O.P. Brereton, D. Budgen, M. Turner, J. Bailey, S. Linkman, "Systematic literature reviews in software engineering – a systematic literature review", Journal of Information and Software Technology, Vol. 51, No. 1, pp. 7-15, 2009.
[16] E. Engström, P. Runeson, M. Skoglund, " A systematic review on regression test selection technique", Journal of Information and Software Technology, Vol. 52, Issue 1, pp. 14-30, 2010.
[17] E.Engström, P.Runeson, "A Qualitative Survey of Regression Testing Practices", Lecture Notes on Computer Science (LNCS), Springer Verlag, pp. 3-16, 2010.
[18] S.Yoo, M.Harman, "Regression Testing Minimization, Selection and Prioritization: A Survey", Software Testing, Verification and Reliability, Wiley Interscience, 2010.
[19] B.A. Kitchenham, “Guidelines for performing Systematic Literature reviews in Software Engineering Version 2.3”. Technical Report S.o.C.S.a.M. Software Engineering Group, Keele University and Department of Computer Science University of Durham, 2007.
[20] T. Dyba, T. Dingso yr, G.K. Hanssen, Applying systematic reviews to diverse study types: an experience report, in: First International Symposium on Empirical Software Engineering and Measurement, 2007 (ESEM 2007), 2007, pp. 225–234.
[21] D. S. Cruzes and T. Dyba, “Research synthesis in software engineering: A tertiary study,” Information Software Technology, Vol. 53, No. 5, May 2011, pp. 440-455. doi: 10.1016/j.infsof.2011.01.004.
[22] W.E. Wong, J.R.Horgan, S.London, and A.Aggarwal. “A study of effective regression testing in practice”, Proceedings of the Eighth International Symposium Software Reliability Engineering, pp. 230-238, Nov. 1997.
[23] G. Rothermel, R.Untch, C.Chu, and M.J.Harrold, “Test case prioritization: An empirical study”, Proceedings of International Conference Software Maintenance, pp. 179-188, Aug. 1999.
[24] S. Elbaum, A.Malishevsky, and G.Rothermel, “Prioritizing test cases for regression testing”, Proceedings of the International Symposium on Software Testing and Analysis, pp. 102-112, Aug.2000.
[25] A.Srivastava, and J.Thiagarajan, “Effectively prioritizing tests in development environment”,

396 Informatica 36 (2012) 379–408 Y. Singh et al.
Proceedings of the International Symposium on Software Testing and Analysis, pp.97-106, July 2002.
[26] H. Do, G.Rothermel, and Kinner. “Empirical studies of test case prioritization in a JUnit testing environment”, Proceedings of the International Symposium on Software Reliability Engineering, pp.113-124, Nov. 2004.
[27] S.Elbaum, A.G.Malishevsky, and G.Rothermel, “Test case prioritization: A family empirical studies”, IEEE Transactions on Software Engineering, Vol. 28, No. 2, pp. 159-182, Feb.2002.
[28] R.C. Bryce, A.M. Menon, “Test Suite Prioritization by Interaction coverage”, Proceedings of the workshop on domain specific approaches to software test automation (DOSTA), ACM, pp. 1-7, 2007.
[29] F.Belli, M.Eminov, N.Gokco. “Coverage-Oriented, Prioritized Testing-AFuzzy Clustering Approach and Case Study”. In :Bondavalli.A.,Brasileiro, F., Rajsbaum, S.(eds.) LADC 2007, LNCS, Springer, Heidelberg, Vol. 4746, pp. 95-110, 2007.
[30] H. Do, S. Mirarab, L. Tahvildari, G. Rothermel, "An Empirical Study of the effect of time constraints on the cost benefits of regression testing" Proceedings of the 16th ACM SIGSOFT International Symposium on Foundations of software engineering,pp71-82,2008.
[31] B.Jiang, Z.Zhang, W.K.Chan, T.H.Tse, “.Adaptive Random test case prioritizatation.” In Proceedings of International Conference on Automated Software Engineering, pp:233-243, 2009.
[32] C. L. B. Maia,R. A. F. do Carmo, F. G. de Freitas,G. A. L. de campos,and J. T. de Souza, "Automated test case prioritization with reactive GRASP,” In Proceedings of Advances in Software Engineering, pp.1-18, 2010.
[33] L.Mei, Z.Zhang, W.K.Chan, T.H.Tse, "Test case prioritization for regression testing of service oriented Business Applications", In Proceedings of the 18th International World Wide Web
Conference (WWW 2009), pp. 901-910, 2009.[34] L.Mei, W.K.Chan, T.H.Tse., R.G.Merkel, “XML-
manipulating test case prioritization for XML-manipulating services,” Journal of Systems and Software, pp.603-619, 2010.
[35] R.C.Bryce, S.Sampath, A.M.Memon, "Developing a Single Model and Test Prioritization Strategies for Event Driven Software", IEEE Transactions on Software Engineering, pp.48-63, 2010.
[36] B. Korel, G. Koutsogiannakis, L.H. Talat, “Model-based test suite prioritization Heuristic Methods and Their Evaluation”, Proceedings of 3rd workshop on Advances in model based testing (A – MOST), London, UK, pp. 34-43, 2007.
[37] B. Korel, L. Tahat, M. Harman, "Test Prioritization Using System Models", In the Proceedings of 21st IEEE International Conference on Software Maintenance (ICSM'08), pp. 247-256, 2005.
[38] R.S.S.Filho, C.J.Budnik, W.M.Hasling, M.M.Kenna, R.Subramanyam, "Supporting concern based regression testing and prioritization in a model
driven environment", In Proceedings of 34th Annual IEEE Computer software and Applications conference Workshops (COMPSA 10), pp.323-328, 2010.
[39] H. Srikanth, L. Williams, J. Osborne, "System Test Case Prioritization of New and Regressionb Test Cases", In the Proceedings of International Symposium on Empirical Software Engineering (ISESE), pp. 64-73, Nov. 2005.
[40] H. Srikanth, L.Williams, "On the Economics of requirements based test case prioritization", In Proceedings of the Seventh International conference on Economics Driven Software Engineering Research (EDSER 05), pp1-3, 2005.
[41] S. Hou, L. Zang, T. Xie, J. Sun, "Quota-Constrained Test Case Prioritization for Regression Testing of Service-Centric Systems", Proceedings of International Conference on Software Maintenance, pp. 257-266, 2008.
[42] R.Krishnamoorthi, S.A.Mary, “Incorporating varying requirement priorities and costs in test case prioritization for new and regression testing”, Proceedings of International Conference on Computing, Communication and Networking (ICCN), pp.1-9, 2008.
[43] R.Krishnamoorthi, S.A.S.A.Mart, “Factor oriented requirement coverage based system test case prioritization of new and regression test cases”, Journal of information and software technology, Vol. 51, pp. 799-808, 2009.
[44] J.M.Kim, A.Porter. “A History-Based Test Prioritization Technique for Regression Testing in Resource Constrained Environment”, Proceedings of the 24th International Conference Software Engineering, pp.119-129, May.2002.
[45] H. Park, H.Ryu, J.Baik, “Historical value-based approach for cost-cognizant test case prioritization to improve the effectiveness of regression testing”, Proceedings of second International Conference on Secure System Integration and reliability, Improvement, pp. 39-46, 2008.
[46] Y.Fazlalizadeh, A.Khalilian, H.A.Azgomi, S.Parsa, “Incorporating historical test case performance data and resource constraints into test case prioritization”, Lecture notes in Computer Science, Springer, Vol. 5668, pp. 43-57, 2009.
[47] K.R.Walcott, M.L.Soffa, G.M.Kapfhammer and R.S. Roos. “Time aware test suite Prioritization”, Proceedings of International Symposium on software Testing and Analysis (ISSTA), pp. 1-12, July 2006.
[48] A. P.Conrad,R. S.Roos, "Empirically Studying the role of selection operators during search based test suite prioritization", In the Proceedings of the ACM SIGEVO Genetic and Evolutionary Computation Conference, Portland, Oregon, 2010.
[49] A.M.Smith, G.M.Kapfhammer, “An empirical study of incorporating cost into test suite reduction and prioritization”, Proceedings of ACM Symposium on Applied Computing, pp. 461-467, 2009.

SYSTEMATIC LITERATURE REVIEW ON… Informatica 36 (2012) 379–408 397
[50] J.A. Jones, and M.J. Harrold, “Test suite reduction and prioritization for modified condition/decision coverage”, Proceedings of the IEEE Transactions on Software Engineering, Vol.29, No.3, March, 2003.
[51] K.H.S. Hla, Y. Choi, J.S. Park, "Applying Particle Swarm Optimization to Prioritizing Test Cases for Embedded Real Time Software Retesting", Proceeding of 8th International Conference on Computer and Information Technology Workshops, pp. 527-532, 2008.
[52] A.G.Malishevsky, J.Ruthruff, G. Rothermel and S.Elbaum, “Cost-cognizant test case prioritization”, Technical Report TR-UNL-CSE-2006-0004, University of Nebraska-Lincoln, 2006.
[53] D.Jeffrey, N.Gupta. “Test-case Prioritization using relevant slices”, Proceedings of the 30th annual International Computer Software and Applications (COMPSAC), Chicago, USA, pp.18-21, September 2006.
[54] S. Mirarab and L. Tahvildari, "A Prioritization Approach for Software Test Cases on Bayesian Networks", FASE, Lecture Notes in Computer Science, Springer, 4422-0276, pp. 276-290, 2007.
[55] S.Mirarab, L.Tahvildari. “An Empirical study on Bayesian Network-based approach for test case prioritization”, Proceedings of International conference on software testing verification and validation, pp. 278-287, 2008.
[56] B.Qu, C.Nei, B.Xu, X. Zhang, ”Test case prioritization for black box testing”, In Proceedings of 31st Annual International Computer Software and Applications Conference (COMSAC 2007), vol. 1, pp. 465-274, 2007.
[57] X. Qu, M. B. Cohen and K.M. Woolf, "Combinatorial Interaction Regression Testing: A Study of Test Case Generation and Prioritization", In the Proceedings of International Conference on Software Maintenance, pp. 255-264, Oct., 2007.
[58] R.Bryce, C.Colbourne. "Prioritized interaction testing for pair-wise coverage with seeding and constraints", Journal of Information and Software Technology, Vol. 48, No. 10, pp. 960-970, May 2006.
[59] X. Zhang, C. Nie, B. Xu, B.Qu, "Test Case Prioritization based on Varying Testing Requirement Priorities and Test Case Costs", Proceedings of the 7th International Conference on Quality Software, pp. 15-24, 2007.
[60] M. Sherriff, M. Lake, L. Williams, "Priroitization of Regression Tests using Singular Value Decomposition with Empirical Change Records", The 18th IEEE International Symposium on Software Reliability Engineering, Trllhattan, Sweden, pp. 82-90, Nov-2007.
[61] G.Rothermel, M.Harrold, "Analyzing Regression Test Selection Techniques", IEEE Transactions on Software Engineering, Vol. 22, pp. 529-551, Aug 1996.
[62] D. Jeffrey, N. Gupta, "Experiments with Test Case Prioritization using Relevant Slices", Journal of
Systems and Software, Vol. 81, No. 2, pp. 196-221, 2008.
[63] Z. Ma, J.Zhao, “Test Case Prioritization based on analysis of program structure”, In the Proceedings of 15th Asia-Pacific Software Engineering conference, pp. 471-478, 2008.
[64] L. Chen,Z. Wang,L. X.u,H. Lu,B. Xu, "Test Case prioritization for web service regression testing", In Proceedings of the Fifth International Symposium on servive oriented system engineering, pp. 173-178, 2010.
[65] Y. C. Huang,C.Y. Huang,J.R. Chang,T.Y. Chen, "Design and Analysis of cost cognizant test case prioritization using genetic algorithm with test history", In proceedings of 34th Annual IEEE Computer Software and Applications Conference (COMSAC 2010), pp. 413-418, 2010.
[66] M.J. Rummel, G.M. Kapfhammer, A. Thall, "Towards the Prioritization of Regression Test Suites with Data Flow Information", Proceedings of the 2005 ACM Symposium on Applied Computing, pp. 1499-1504, March 13-17, 2005.
[67] L. Mariani, S. Papagiannakis and M. Pezze, “Compatibility and Regression Testing of COTS-Component-Based Software”, Proceedings of the 29th International Conference on Software Engineering (ICSE), USA, pages 85-95, May 2007.
[68] B.Qu, C.Nie, B.Xu, “Test case prioritization for multiple processing queues”, Proceedings of International Symposium on Information Science and Engineering, pp. 646-649, 2008.
[69] M.K.Ramanathan, M.Koyuturk, A.Grama, “PHALANX : A Graph-Theoretic Framework for Test Case Prioritization”, Proceedings of ACM Symposium on Applied Computing (SAC), pp. 667-673, March 2008.
[70] X.Qu, M.B.Cohen, and G.Rothermel. “Configuration-aware regression testing: An empirical study of sampling and prioritization”, Proceedings of the ACM/SIGSOFT International Symposium on Software Testing and Analysis (ISSTA), pp.75-85, 2008.
[71] Y.T.Yu,S.P. Ng,E.Y.K.Chan, "Generating,Selecting and Prioritizing test cases from Specifications with tool support", In the Proceedings of Third International Conference on quality software (QSIC 03), pp. 83, 2003.
[72] S.Alspaugh, K.R. Walcott, M.Belanich, G.M.Kapfhammer, M.L.Soffa.”Efficient time aware prioritization with knapsack solvers”, Proceedings of the 1st ACM international workshop on empirical assessment of software engineering languages and technologies: held in conjunction with the 22ndIEEE/ACM International Symposium on Automated Software Engineering(ASE) 2007, pp.13-18, Nov.2007.
[73] C. Simons,E. C. Paraiso,"Regression Test cases Prioritization Using Failure Pursuit Sampling",In Proceedings of Tenth International Conference on Intelligent Systems Design and applications, pp.923-928, 2010.

398 Informatica 36 (2012) 379–408 Y. Singh et al.
[74] Z. Li, M. Harman and R.M. Hierons, “Search Algorithm for Regression test case prioritization”, IEEE TSE, Vol. 33, No. 4, 2007.
[75] S. Li,N. Bian,Z. Chen,D. You,Y. He, "A simulation on some search algorithms for regression test case prioritization", In Proceedings of 10th international conference on Quality software, pp. 72-81, 2010.
[76] B. Korel,G. Koutsogiannakis, "Experimental comparison of code based and model based test prioritization", In Proceedings of the IEEE International Conference on Software Testing, Verification, and Validation Workshops(ICSTW '09), pp. 77-84, 2009.
[77] H. Do, G. Rothermel, "On the use of Mutation Faults in Empirical assessment of Test Case Prioritization
Techniques", IEEE Transaction of Software Engineering, pp. 733-752, Sep-2006.
[78] H. Do, G. Rothermel, "An Empirical Study of Regression Testing Techniques Incorporating Context and Lifetime Factors and Improved Cost-Benefit Models", Proceedings of the ACM SIGSOFT Symposium on Foundations of Software Engineering, pp. 141-151, Nov. 2006.
[79] H. Do,S. Mirarab,L. Tahvildari,G. Rothermel, "The Effects of Time Constraints on Test case Prioritization :A series of Controlled Experiments", IEEE Transactions on Software Engineering, vol. 36, no. 5, pp. 593-617, 2010.
[80] http:// sir.unl.edu/portal/index.php
Appendix ATable A1: List of primary studies with their authors and techniques.
Research
Paper ID
Authors Techniques
RP1 Wong et. al T1
RP2 Rothermel et. al T2, T3, T4, T5, T6, T7
RP4 Elbaum et. al T8,T9,T10,T11,T12,T13,T14,T15
RP3 Elbaum et. al No new technique
RP5 Elbaum et. al No new technique
RP6 Rothermel et. al No new technique
RP7 Elbaum et. al T16, T17, T18, T19,
RP9 Kim and Porter T20
RP8 Srivastava and Thiagarajan
T21
RP11 Jones and Harrold
T22
RP10 Elbaum et. al No new techniques
RP12 Yu et al T22.1
RP13 Leon et al No new technique
RP15 Elbaum et. al No new technique
RP14 Rothermel et. al No new technique
RP16 Do et. al T23, T24, T25, T26, T27, T28
RP18 Srikanth et al T28.1
RP19 Do and Rothermel
No new technique
RP20 Korel et. al T29, T30
RP17 Rummel et. al T31
RP21 Srikanth et. al T32
RP25 Do and Rothermel
No new technique
RP27 Do and Rothermel
No new technique
RP22 Do et. al No new technique
RP23 Malishevsky et. al
T33
RP26 Jeffrey and Gupta
T34
RP24 Walcott et. al T35
RP36 Alspaugh et. al T36
RP38 Belli et. al T37
RP33 Bryce and Memon
T38 to T42
RP31 Korel et. al T43 to T47
RP32 Qu et al T47.1
RP28 Li et. al A1 to A5
RP30 Mariani et. al T48
RP29 Mirarab and Tahvildari
T49
RP34 Qu et. al T50
RP37 Sherrif et. al T51
RP35 Zang et. al T52, T53
RP43 Hla et. al T54
RP46 Hou et al. T55, T56
RP39 Jeffrey and Gupta
T57, T58
RP40 Ramanathan et. al
T59

SYSTEMATIC LITERATURE REVIEW ON… Informatica 36 (2012) 379–408 399
RP48 Ma and Zhao T60
RP41 Mirarab and Tahvildari
T61 (enhanced T51)
RP42 Park et. al T62
RP49 Qu et. al T63
RP44 Qu et.al T64
RP45 Ramasamy and Mary
T65
RP47 Do et al T65.1 – T65.4
RP50 Smith and Kapfhammer
Extension of algorithms in RP29(A3, A5) and delayed greedy algorithm
RP54 Fazlalizadeh et. al
T66
RP51 Krishnamoorthi and Mart
T67
RP52 Mei et al T67.1 – T67.10
RP53 Korel et al No new technique
RP55 Jiang et al T68.1 – T68.9
RP56 Maia et al T69
RP57 Chen et al T70.1, T70.2
RP58 Filho et al T71.1,T71.2
RP59 Li et al No new technique
RP60 Huang et al T72
RP61 Conrad et al T73
RP62 Do et al No new technique
RP63 Simons et al T74
RP64 Mei et al T75.1 – T75.4
RP65 Bryce et al T76
Table A2: List of Research papers, techniques, artifacts, tools and metrics used by them.
Resea-rch Paper ID
Technique(s)
Artifacts Tools Metrics
RP1 [19]
T1Space program (SIR)
ATAC (Automatic Testing Analysis Tool)
Size reduction, Precision, Recall
RP2 [20]
T2, T3, T4, T5, T6, T7
7 C programs from siemens corporate research (SIR)
Aristotle Program Analysis System, Prioritization tool (created own), Proteum Mutation
Efficacy, APFD
System
RP3 [1]
No new technique
Space program (SIR)
N.M APFDc
RP4 [21]
T8,T9,T10,T11,T12,T13,T14,T15
7 C programs from siemens and 1 space program (SIR)
Aristotle Program Analysis System, Prioritization tool (created own), Proteum Mutation System, Source code measurement tool, Comparator, Fault Index generater
APFD, Bonferroni analysis
RP5 [2]
No new technique
7 siemens program and 1 space program (SIR)
Aristotle program Analysis System, UNIX Diff tool
APFD
RP6 [3]
No new technique
7 siemens program and 1 space program (SIR)
Aristotle Program Analysis System, Proteum Mutation System
APFD, Bonferroni Means Separation Test
RP7 [24]
T16, T17, T18, T19,
8 SIR programs (7 siemens and 1 space program), 3 case studies : 2 open source UNIX utilities from SIR (grep and flex), 1 embedded real time subsystem of a level 5 RAID storage system
Aristotle Program Analysis System, Prioritization tool(created own), Proteum Mutation System, Source code measurement tool, Comparator, Fault Index generater
APFD, Bonferroni analysis
RP8 [22]
T21
Two versions of large office productivity application
Vulcan ( Rich Binary Modification Infrastructure), BMAT(Binary mathchingtool build using
Coverage of impacted blocks
400 Informatica 36 (2012) 379–408 Y. Singh et al.
Vulcan), Echelon
RP9 [41]
T20
7 siemens program and 1 space program (SIR)
déjà vu tool, Created tool for minimization, Created tool for Random technique
Total testing effort, Average fault age
RP10 [4]
No newtechnique
bash , grep, flex, gzip (SIR)
Aristotle Tool Suite, TSL tool for generating test suite, Tool to implement their process
Percentage of changed LOC, functions and files, APFD, Probability of execcutionof changed function, Average no. of LOC changed per function, Average percentage of tests executing changed functions
RP11 [47]
T22
tcas (siemens) and one space program (SIR)
N.M
Time to perform prioritization
RP12 [68]
T23 N.M.
Created EXTRACT tool forprioritization
N.M.
RP13 [5]
No new technique
Three large programs: GCC,Jikes and Javac Compilers
GCOV tool for profiling
APFD, Dissimilarity Mertic
RP14 [6]
No new technique
bash (SIR) and emp_server
Aristotle Program Analysis System, Clic Instrumenterand monitor, Unix utilities
APFD, Annova analysis, Bonferroni test
RP15 [7]
No new technique
bash, flex, grep, gzip, make, sed from SIR and emp_server, xearth
TSL Tool APFD
RP16 [23]
T24, T25, T26, T27,
ant, XML-security, Jmeter, Jtopas from
Selective Testrunner
APFD, Boxplots, ANNOVA analysis
T28, T29
SIR
RP17 [63]
T33
3 applications in JAVA: Bank, Identifier and Money
Soot 1.2.5(Java Optimization Framework)
APFD, PTR(Percentage of test suite that must be executed to find all defects)
RP18 [37]
T305 projects developed by students
N.MASFD, TSFD
RP19 [8]
No new technique
ant, XML-security, Jmeter, Jtopas from SIR
Mutation tool, Galileo system for coverage information
APFD
RP20 [34]
T31, T32
3 system models : ATM model, cruise control model (SIR), fuel pump model
N.MRate of fault detection
RP21 [36]
T34
4 Java projects developed by students
PORT tool, TCP tool
Weighted percentage of fault detected (WPFD)
RP22 [9]
No new technique
Ant , XML-security, Jmeter, Jtopas from SIR
Galileo system for coverage information, Junit adaptor, JunitFilter, TestRunner
APFD
RP23 [49]
T35
emp_server portion of Empire software
UNIX Diff tool, Aristotle program Analysis System, Tools to prioritize test cases
APFDc
RP24 [44]
T37Gradebook and Jdepend
Emma tool, Linux Process tracking tool, JTester
APFD
RP25 [74]
No new technique
Ant , XML-security, Jmeter, Jtopas, nanoxml from SIR and Galileo
Sofya system, Junit adaptor
APFD
RP26 [50]
T367 siemens program
Aristotle Program Analysis Tool
APFD

SYSTEMATIC LITERATURE REVIEW ON… Informatica 36 (2012) 379–408 401
RP27 [75]
No new technique
Ant , XML-security, Jmeter, nanoxml from SIR and Galileo
Sofya system, Java bytecode Mutant generator
Cost and Benefit
RP28 [71]
A1 to A5
print_tokens, print_tokens2, schedule, schedule2 from siemens and space, sed from SIR
Canatata++, SPSS
APBC(Average percentage of block coverage), APDC ( Average percentage of Decision coverage), APSC ( Average Perecentage of Statement Coverage)
RP29 [51]
T52Apache Ant (SIR)
ckjm, Emma, Sandmark
APFD
RP30 [64]
T51
15 configurations of Ginipad Java Editor version 2.0.3 including 316 Java classes
N.MNot Mentioned
RP31 [33]
T45 to T49
cruise control model from SIR, ATM Model, fuel pump model, TCP model, ISDN model
N.M
Most likely relative position of test case
RP32 [53]
T50
Software forMicrosoft Word and Power point(checks the performance when opening malicious documents)
N.MSpeed Of fault detection
RP33 [25]
T40 to T44
TerpCalc, TerpPaint, TerpSpeadsheet, TerpWord
N.M APFD
RP34 [54]
T53flex and make from SIR
SSLOC tool, Aristotle Coverage tool
APFD, NAPFD
RP35 [56]
T55, T56
Simulation experiments
N.M
Rate of units of testing requirement
priority satisfied per unit test case cost
RP36 [69]
T38, A7, A8, A9
Gradebook and Jdepend software
Emma tool, Linux Process tool
Code coverage, Coverage preservation, Order aware coverage
RP37 [57]
T54
3 minor releases of IBM software system
MATLABNot Mentioned
RP38 [26]
T39
web based system ISELTA(Isik's System for Enterprise Level web centric Tourist Applications)
N.M None
RP39 [59]
T60, T61
7 C pprograms from Siemens
Aristotle Program Analysis Tool
APFD
RP40 [66]
T62
7 C pprograms from Siemens
MATLAB, PIN tool
APFD
RP41 [52]
T64 (enhanced T54)
Ant , XML-security, Jmeter, nanoxml from SIR and Galileo
Sandmark tool
APFD
RP42 [42]
T65 ant (SIR)Sofya system
APFDc
RP43 [48]
T57 N.M N.M Coverage
RP44 [67]
T67Vim from SIR
Mutation testing tool
Block Coverage, Fault Detection, Change across faults, Change across tests
RP45 [39]
T68
5 J2EE application projects developed by students and 2 set of Industrial project (one VB and one PHP)
Rational Test Suite, Tbreq-Requierement tracability tool
TSFD (Total Severity of Faults Detected)
RP46 [38]
T58, T59
Travel agent system having 12
N.MTotal branch coverage,
402 Informatica 36 (2012) 379–408 Y. Singh et al.
web services with 17 methods in Java
APFD
RP47 [27]
T69 –T70
Ant, XML_security, Jmeter, nanoxml from SIR and Galileo
Sandmark Tool, Sofya System, Ckjm Tool
Boxplots, Chidamber, Kemerer(ckjm metrics)
RP48 [60]
T63
XML-security, Jtopas from SIR
Apros tool
APFDc, APMC (Average percentage of fault affected modules cleared per test case)
RP49 [65]
T66
Microsoft Power Point 2003(11.8106.8107)
N.MAPFDp(for parallel scenario)
RP50 [46]
Extension of algorithms in RP29(A3, A5) and delayed greedy algorithm
8 case study application: DS (Data Stucture application), GB (Grade Book Application), JD (Jdepend), LF (LoopFinder), RM (Reminder), SK (Sudoko), TM(Transaction Manager), RP (Reduction and Prioritization package)
N.M
RFFT (Reduction factor for time)
RP51 [40]
T74
5 J2EE application projects by students, two industrial projects (one in VB, one in PHP) and two industrial case studies (java)
Emma tool, Winrunner testing tool
ASFD (Average Severity of Faults Detected), ATEI (Average Test Effort Index), TPFD ( Total Percentage of Failures Detected)
RP52 [30]
T75 –T84
Business process Hotelbooking taken from the Triphandling
N.M APFD
project
RP53 [73]
No new technique
Seven models from the Infrastucture: ATM model, Cruise Control, Fuel Pumps, Fuel Pumps, TCP-Dialer, ISDN, Print Token, Vending Machine
SPSS ToolRelative Position Metric
RP54 [43]
T73
7 siemens program and 1 space program
SAS 9.1.3 APFD
RP55 [28]
T85 –T93
Seven Siemens programs and 4 mediun sized unix utility programs
SPSS Tool, Unix Tool Gcov to collect dynamic coverage information
APFD Metric, Distance Metric called Jaccard distance
RP56 [29]
T94, A2, A3, A4, A6
Four siemens programs: print_tokens, print_tokens2, schedule, schedule2 and one space program from SIR
N.M
APBC(AvergePercentage Block Coverage), APDC(Average percentage Decision Coverage), APSC(Average percentage statement Coverage)
RP57 [61]
T95, T96
ATM example
N.M BPFG
RP58 [35]
T97,T98
N.M.TDE/UMl model Editor
N.M.
RP59 [72]
A1 to A5
One simulated program
Microsoft Visual Studio 2008
APRC(Average percentage Requirement coverage
RP60 [62]
T99
Five versions of sed(unix utility program)
N.M APFDc
RP61 [45]
T100
8 case study application: DS (Data Stucture application), GB (Grade Book Application)
Beanplots
Coverage effectiveness Score metric

SYSTEMATIC LITERATURE REVIEW ON… Informatica 36 (2012) 379–408 403
, JD (Jdepend), LF (LoopFinder), RM (Reminder), SK (Sudoko), TM(Transaction Manager), RP (Reduction and Prioritization package)
RP62 [76]
No new technique
Five java Programs namely ant,xml security,jmeter,nanoxmlfrom SIR and galileo
Sofya system, SPSS Tool
EVOMO and LOC Model, Bonferroni Analysis, Kruskal Wallis Test(non parametric one way analysis)
RP63 [70]
T101schedule (Siemens)
N.M APFD
RP64 [31]
T102 –T105
A set of WS-BPEL applications: Atm, Buybook, Dslservice, Gymlocker, Loan Approval, Marketplace, Purcharse, TripHandling
MATLAB Tool, PTS Box chart Utility
APFD, Boxplots, Annova Analysis
RP65 [32]
T106
Four GUI Applications:Terpcalc, TerpCalc,TerPaint,TerpSpredsheet and Terpword which is an open soutce Office suite developed at University of Maryland and Three web based Applications:Book,CPM and Masplas
Bugzilla(Bug Tracking Tool)
APFD, FDD(fault detection density)
Table A3: List of techniques with the language type, input method, approach and granularity.
T.no
TechniqueLanguage type
Input Method
Approach
Granularity
T1
Hybrid technique combining modification, minimization and prioritization
Proc. SCMF and CB
Stmt.
T2Total branch coverage prioritization
Proc. SC CB Stmt.
T3
Additional branch coverage prioritization
Proc. SC CB Stmt.
T4
Total statement coverage prioritization
Proc. SC CB Stmt.
T5
Additional statement coverage prioritization
Proc. SC CB Stmt.
T6
Total fault-exposing potential (FEP) prioritization
Proc. SC FB Stmt.
T7
Additional fault-exposing potential (FEP) prioritization
Proc. SC FB Stmt.
T8
fn_total (prioritize on coverage of functions)
Proc. SC CB Func.
T9
fn_addtl (prioritize on coverage of functions not yet covered)
Proc. SC CB Func.
T10
fn_fep_total(prioritize on probability of exposing faults)
Proc. SC FB Func.
T11
fn_fep_addtl (prioritize on probability of exposing faults, adjusted to consider previous test
Proc. SC FB Func.

404 Informatica 36 (2012) 379–408 Y. Singh et al.
cases)
T12
fn_fi_total (prioritize on probability of fault existence)
Proc. SC FB Func.
T13
fn_fi_addtl (prioritize on probability of fault existence, adjusted to consider previous test cases)
Proc. SC FB Func.
T14
fn_fi_fep_total(prioritize on probability of fault existence and fault exposure)
Proc. SC FB Func.
T15
fn_fi_fep_addtl(prioritize on probability of fault existence and fault exposure adjusted to previous coverage)
Proc. SC FB Func.
T16
fn_diff_total (prioritize on probability of fault existence based on DIFF)
Proc. SC FB Func.
T17
fn_diff_addtl(prioritize on probability of fault existence adjusted to consider previous test cases based on DIFF)
Proc. SC FB Func.
T18
fn_diff_fep_total (prioritize on combined probability of fault existence with fault exposure based on DIFF)
Proc. SC FB Func.
T19
fn_diff_fep_addtl (prioritize on combined probability of fault existence
Proc. SC FB Func.
with fault exposure, adjusted on previous coverage based on DIFF)
T20
Prioritization based on history-based on test execution history in resource constrained environment
Proc. SC HB Stmt.
T21
Binary code based prioritization
Bin. Code
BF CB Blk.
T22
Prioritization incorporating aspects of MC/DC
Proc. SCCB + MF
Stmt.
T23
Annotated Classification Tree based prioritization
L.Ind.R&S
PO (CTB)
Class
T24
block_total(prioritization on coverage of blocks)
OO SC CB Blk.
T25
block_addtl(prioritization on coverage of blocks not yet covered)
OO SC CB Blk.
T26
method_total (prioritization on coverage of method)
OO SC CB Mhd.
T27
method_addtl(prioritization on coverage of methods not yet covered)
OO SC CB Mhd.
T28
method_diff_total(prioritize on coverage of method and change information)
OO SC CB Mhd.
T29
method_diff_addtl(prioritize on coverage of method and change information adjusted to
OO SC CB Mhd.
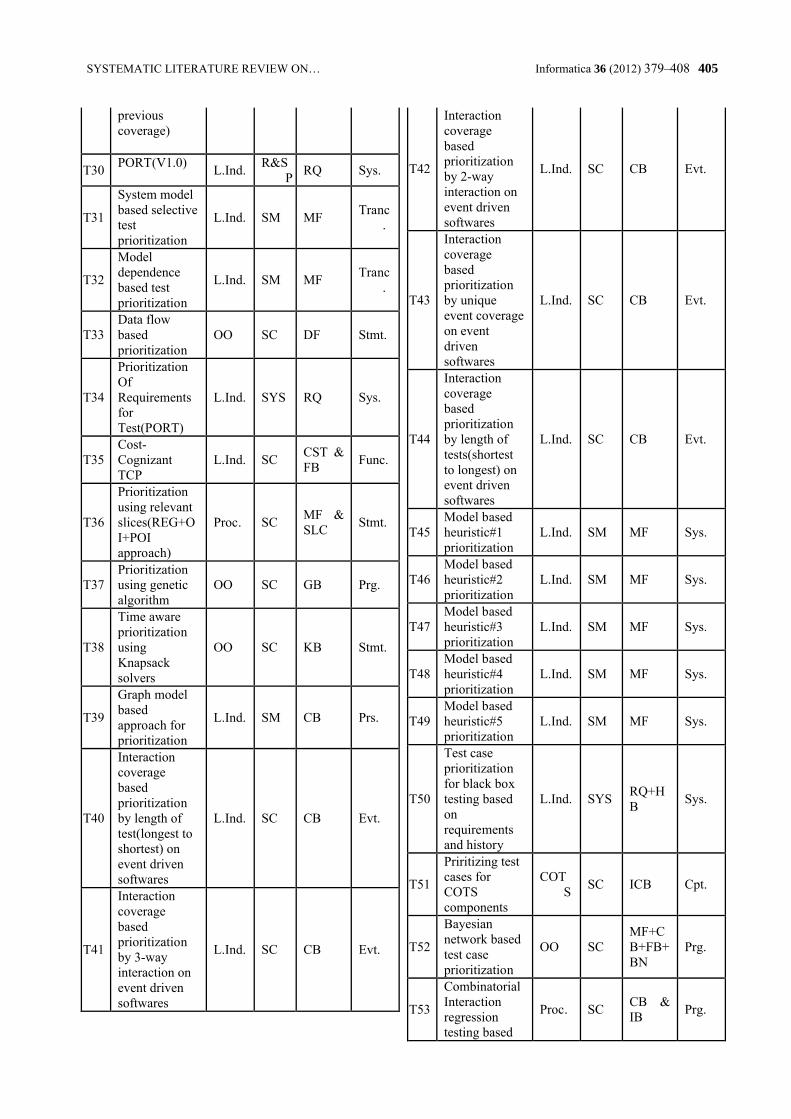
SYSTEMATIC LITERATURE REVIEW ON… Informatica 36 (2012) 379–408 405
previous coverage)
T30PORT(V1.0)
L.Ind.R&S
PRQ Sys.
T31
System model based selective test prioritization
L.Ind. SM MFTranc
.
T32
Model dependence based test prioritization
L.Ind. SM MFTranc
.
T33Data flow based prioritization
OO SC DF Stmt.
T34
Prioritization Of Requirements for Test(PORT)
L.Ind. SYS RQ Sys.
T35Cost-Cognizant TCP
L.Ind. SCCST & FB
Func.
T36
Prioritization using relevant slices(REG+OI+POI approach)
Proc. SCMF & SLC
Stmt.
T37Prioritization using genetic algorithm
OO SC GB Prg.
T38
Time aware prioritization using Knapsack solvers
OO SC KB Stmt.
T39
Graph model based approach for prioritization
L.Ind. SM CB Prs.
T40
Interaction coverage based prioritization by length of test(longest to shortest) on event driven softwares
L.Ind. SC CB Evt.
T41
Interaction coverage based prioritization by 3-way interaction on event driven softwares
L.Ind. SC CB Evt.
T42
Interaction coverage based prioritization by 2-way interaction on event driven softwares
L.Ind. SC CB Evt.
T43
Interaction coverage based prioritization by unique event coverage on event driven softwares
L.Ind. SC CB Evt.
T44
Interaction coverage based prioritization by length of tests(shortest to longest) on event driven softwares
L.Ind. SC CB Evt.
T45Model based heuristic#1 prioritization
L.Ind. SM MF Sys.
T46Model based heuristic#2 prioritization
L.Ind. SM MF Sys.
T47Model based heuristic#3 prioritization
L.Ind. SM MF Sys.
T48Model based heuristic#4 prioritization
L.Ind. SM MF Sys.
T49Model based heuristic#5 prioritization
L.Ind. SM MF Sys.
T50
Test case prioritization for black box testing based on requirements and history
L.Ind. SYSRQ+HB
Sys.
T51
Priritizing test cases for COTS components
COTS
SC ICB Cpt.
T52
Bayesian network based test case prioritization
OO SCMF+CB+FB+BN
Prg.
T53
Combinatorial Interaction regression testing based
Proc. SCCB & IB
Prg.

406 Informatica 36 (2012) 379–408 Y. Singh et al.
prioritization
T54
Prioritization using Singular Value Decomposition (SVD) with empirical change records
L.Ind. SCMF & SVD
File
T55
Prioritization based on testing requirement priorities and test case cost
L.Ind. SCRQ & CST
Any
T56
Prioritization based on additional testing requirement priorities and test case cost
L.Ind. SCRQ & CST
Any
T57
Particle Swarm Optimization based prioritization
L.Ind. SCMF + CB
SU
T58
Quota constrained test case prioritization
L.Ind. SC RQ WS
T59
Quota constrained additional test case prioritization
L.Ind. SC RQ WS
T60
Prioritization using heuristic REG_OI_POI with grouping (GRP_REG+OI_POI)
L.Ind. SCCB&MF&SLC
Stmt.
T61
Prioritization using heuristic REG_OI_POI with modification (MOD * REG+OI_POI)
L.Ind. SCCB&MF&SLC
Stmt.
T62
Graph theoretic framework for test case prioritization
L.Ind. SC GPH Any
T63
Prioritization based on analysis of program structure
Proc. CGCB&MF&PS&FB
Mdl.
T64
Enhanced Bayesian network based approach
OO SCMF+CB+FB+BN
Prg.
T65
Historical value based approach for prioritization
L.Ind. SC HB Func.
T66
Test case prioritization for multiple processing queue
L.Ind. SC CST Any
T67
Configuration aware regression testing
L.Ind. SC CA Cfg.
T68
Test case prioritization for varying requirement priorities and cost
L.Ind. SC RQ Sys.
T69
totalCC (prioritize on coverage of blocks)
L.Ind. SC CB Class
T70
totalBN(prioritize via Bayesian Networks)
L.Ind. SC O (BN) Mhd.
T71
additionalCC (prioritize on coverage of blocks with feedback mechanism)
L.Ind. SC CB Class
T72
additionalBN (prioritize via Bayesian Network with feedback mechanism)
L.Ind. SC O (BN) Mhd.
T73
Prioritization for resource constrained environment using historical test performance data
L.Ind. SC HB Prg.
T74
Factor orented requierement coverage based prioritization
L.Ind. SC RQ Sys.
T75
Total CM-1 (CM=Coverage Model, total workflow
WB SM CB WS

SYSTEMATIC LITERATURE REVIEW ON… Informatica 36 (2012) 379–408 407
branches)
T76
Addtl CM-1 (Additional CM-1, cumulative workflow branch coverage)
WB SM CB WS
T77
Total-CM2-Sum (total workflow and XRG branches)
WB SM CB WS
T78
Addtl-CM2-Sum (cumulative workflow and XRG branches)
WB SM CB WS
T79
Total-CM2-Refine (Total workflow branches, descending order of XRG branches to break tie)
WB SM CB WS
T80
Addtl-CM2-Refine (Additional CM2 Refine)
WB SM CB WS
T81
Total-CM3-Sum (total workflow branches, XRG branches and WSDL elements)
WB SM CB WS
T82
Addtl-CM3-Sum (cumulative workflow, XRG and WSDL elements)
WB SM CB WS
T83
Total-CM3-Refine (same as Total-CM2-Refine except descending order of WSDL elements to break tie)
WB SM CB WS
T84
Addtl-CM3-Refine (Additional CM3 Refine)
WB SM CB WS
T85
ART-st-maximin(Statement level, min dij = max {min dij} )
L.Ind. SC CB Sys.
T86
ART-st-maxavg (Statement level, avg dij = max {avg dij} )
L.Ind. SC CB Sys.
T87
ART-st-amxmax (Statement level, max dij = max {max dij} )
L.Ind. SC CB Sys.
T88
ART-fn-maximin(Function level, min dij = max {min dij} )
L.Ind. SC CB Sys.
T89
ART-fn-maxavg (Function level, avg dij = max {avg dij} )
L.Ind. SC CB Sys.
T90
ART-fn-amxmax (Function level, max dij = max {max dij} )
L.Ind. SC CB Sys.
T91
ART-br-maximin (Branch level,min dij = max {min dij} )
L.Ind. SC CB Sys.
T92
ART-br-maxavg (Branch level, avg dij = max {avg dij} )
L.Ind. SC CB Sys.
T93
ART-br-amxmax (Branch level, max dij = max {max dij} )
L.Ind. SC CB Sys.
T94
Reactive GRASP (Greedy Randomized Adaptive Search Procedures)
L.Ind. SC CB Stmt.
T95Total technique to
WB SYSCB+MF+CF+
WS

408 Informatica 36 (2012) 379–408 Y. Singh et al.
prioritize test cases
DF
T96
Additional technique to prioritize test cases
WB SYSCB+MF+CF+DF
WS
T97Model based prioritization
L.Ind. SM MFTranc
.
T98Concern Based Prioritization
L.Ind. SM MFTranc
.
T99
GA_hist (Genetic Algorithms and History based test case prioritization)
L.Ind. SCHB+GB+CST
Prg.
T100
GELAITONS (Genetic aLgorithm bAsed Test suIte priOritizatioN Systems)
OO SC GB Sys.
T101
Test case prioritization using Failure Pursuit Sampling
L.Ind. BFO (DTB)
Sys.
T102
Ascending-WSDL-tag coverage prioritization
WB SC CB WS
T103
Descending-WSDL-tag coverage prioritization
WB SC CB WS
T104
Ascending-WSDL-tag occurrence prioritization
WB SC CB WS
T105
Descending-WSDL-tag occurrence prioritization
WB SC CB WS
T106
GUI and web based test case prioritization
WB SC CB Evt.
Language Type:
Proc - procedural, Bin.Code - binary code, L.Ind - language independent, COTS -COTS component based, WB - web designing or OO - object oriented.
Input Method:
SC – Source Code, BF – Binary Form, SM – System Model, SYS – System, CG –Call graph for program structure, R&SP -Requirements/Specifications.
Approach:
CB – Coverage Based, MF – Modification Based, RQ – Requirement Based, FB –Fault Based, HB – History Based, GB –Genetic Based, CP – Composite, O –Others.
Granularity
Stmt-Statement level, Func-function level, Blk-block of binary form, Mhd-method, Tranc-transition in system model, Sys-system level, Prg-program, Prs-process level, Evt-event, Cpt-component, File-file to be changed, SU-software units, WS-web service, Mdl-module, Cfg-configuration of the software system, Class-class level or any.
Table A4: Search Algorithms.
ID of search
algorithmSearch Algorithm
A1 Hill Climbing
A2 Genetic Algorithm
A3 Greedy Algorithm
A4Additional Greedy Algorithm
A52-Optimal greedy algorithm
A6 Simulated Annealing
A7 Greedy by ratio
A8 Greedy by value
A9 Greedy by weight
Informatica 36 (2012) 409–424 409
Evaluating the Performance of LSA for Source-code Plagiarism Detection
Georgina CosmaDepartment of Business Computing, PA College, Larnaca, CY-7560 CyprusE-mail: [email protected]
Mike JoyDepartment of Computer Science, University of Warwick, Coventry, CV4 7AL, UKE-mail: [email protected]
Keywords: LSA, source-code similarity detection, parameter tuning
Received: October 25, 2012
Latent Semantic Analysis (LSA) is an intelligent information retrieval technique that uses mathematicalalgorithms for analyzing large corpora of text and revealing the underlying semantic information of docu-ments. LSA is a highly parameterized statistical method, and its effectiveness is driven by the setting of itsparameters which are adjusted based on the task to which it is applied. This paper discusses and evaluatesthe importance of parameterization for LSA based similarity detection of source-code documents, and theapplicability of LSA as a technique for source-code plagiarism detection when its parameters are appro-priately tuned. The parameters involve preprocessing techniques, weighting approaches; and parametertweaking inherent to LSA processing – in particular, the choice of dimensions for the step of reducing theoriginal post-SVD matrix. The experiments revealed that the best retrieval performance is obtained afterremoval of in-code comments (Java comment blocks) and applying a combined weighting scheme basedon term frequencies, normalized term frequencies, and a cosine-based document normalization. Further-more, the use of similarity thresholds (instead of mere rankings) requires the use of a higher number ofdimensions.
Povzetek: Prispevek analizira metodo LSA posebej glede plagiarizma izvirne kode.
1 Introduction
Latent Semantic Analysis (LSA) is an intelligent informa-tion retrieval technique that uses mathematical algorithmsfor analyzing large corpora of text and revealing the under-lying semantic information of documents [10, 11]. Previ-ous researchers have reported that LSA is suitable for tex-tual information retrieval and is typically used for indexinglarge text collections and retrieving documents based onuser queries. In the context of text retrieval, LSA has beenapplied to a variety of tasks including indexing and infor-mation filtering [12], essay grading [23, 38, 13, 43, 19, 18]cross-language information retrieval [44], detecting plagia-rism in natural language texts [7], and source-code cluster-ing and categorization [20, 25, 22, 26, 27, 28]. LSA hasbeen applied to source-code with the aim of categorizingsoftware repositories in order to promote software reuse[27, 28, 24] and much work has been done in the area ofapplying LSA to software components. Some of the LSAbased tools developed include MUDABlue [20] for soft-ware categorization, Softwarenaut [25] for exploring partsof a software system using hierarchical clustering, and Ha-pax [22] which clusters software components based on thesemantic similarity between their software entities (entiresystems, classes and methods). Although LSA has been
applied to source-code related tasks such as reuse and cat-egorization of source-code artifacts, there appears to be alack of literature investigating the behavior of parametersdriving the effectiveness of LSA for tasks involving source-code corpora. The current literature also lacks an evalua-tion of LSA and its applicability to detecting source-codeplagiarism [31, 32].
2 A Review of Latent SemanticAnalysis
Latent Semantic Analysis uses statistics and linear algebrato reveal the underlying “latent” semantic meaning of doc-uments [5]. Latent Semantic Indexing (LSI) is a specialcase of LSA, and the term LSI is used for tasks concerningthe indexing or retrieval of information, whereas the termLSA is used for tasks concerned with everything else, suchas automatic essay grading and text summarization.
The first step prior to applying LSA involves pre-processing the documents in the corpus in order to effi-ciently represent the corpus as a term-by-document matrix.Document pre-processing operations include the following[2].
– Tokenization. This involves identifying the spaces in
410 Informatica 36 (2012) 409–424 G. Cosma et al.
the text as word separators, and considering digits, hy-phens, punctuation marks, and the case of letters.
– Stopword elimination. This is the elimination ofwords with a high frequency in the document corpus,and involves removing prepositions, conjunctions andcommon words that could be considered as uselessfor purposes of retrieval, e.g. words such as the, and,and but, found in the English language. In source-code this involves removing programming languagereserved words (i.e. keywords).
– Stemming of words. This involves transforming vari-ants of words with the same root into a common con-cept. A stem is the portion of the remaining word afterremoving its affixes (suffixes and prefixes). An exam-ple of a stem is the word eliminat which is the prefix ofthe variants eliminated, eliminating, elimination, andeliminations.
After pre-processing is performed, the corpus of docu-ments is transformed into a m × n matrix A = [aij ], inwhich each row m represents a term vector, each columnn represents a document vector, and each cell aij of thematrix A contains the frequency at which a term i appearsin document j. Thus, the rows of matrix A represent theterm vectors, and the columns of matrix A represent thedocument vectors.
Term weighting is then applied to matrix A. The pur-pose of term-weighting is to adjust the frequency values ofterms using local and global weights in order to improveretrieval performance. Local weights determine the valueof a term in a particular document, and global weights de-termine the value of a term in the entire document collec-tion. Various local and global weighting schemes exist [4]and these are applied to the term-by-document matrix togive high weights to important terms, i.e. those that occurdistinctively across documents, and low weights to termsthat appear frequently in the document collection.
Document length normalization [41] adjusts the termvalues depending on the length of each document in thecollection. The value of a term in a document is li,j ×gi × nj , where li,j is the local weighting for term i in doc-ument j, gi is the global weighting for term i, and nj isthe document-length normalization factor [4]. Long docu-ments have a larger number of terms and term frequenciesthan short documents and this increases the number of termmatches between a query and a long document, thus in-creasing the retrieval chances of long documents over smallones. Literature claims that the cosine document lengthnormalization can improve retrieval performance [41, 40].
Tables 1, 2, and 3 contain some of the most commonlyused term-weighting formulas [4]. Symbol fij defines thenumber of times (term-frequency) term i appears in docu-ment j; let
b(fij) =
{1, if fij > 0,0, if fij = 0,
pij =fij∑j fij
Once term-weighting is applied, the matrix is then sub-mitted for Singular Value Decomposition (SVD) to derivethe latent semantic structure model. Singular Value De-composition decomposes matrix A into the product of threeother matrices: an m× r term-by-dimension matrix, U, anr × r singular values matrix, Σ, and an n × r documentby dimension matrix, V . The rank r of matrix A is thenumber of nonzero diagonal elements of matrix Σ. SVDcan provide a rank-k approximation to matrix A, where krepresents the number of dimensions (or factors) chosen,and k ≤ r. This process is known as dimensionality re-duction, which involves truncating all three matrices to kdimensions.
The reduced matrices are denoted by Uk, Σk, and Vk
where U is a m × k matrix, Σ is a k × k matrix and Vis a n × k matrix. The rank-k approximation to matrix A,can be constructed through Ak = UkΣkV
Tk . It is important
when computing the SVD that k is smaller than the rank r,because it is this feature that reduces noise in data and re-veals the important relations between terms and documents[6, 3].
One common task in information retrieval systems in-volves a user placing a query in order to retrieve docu-ments of interest. Given a query vector q, whose non-zero elements contain the weighted term frequency valuesof the terms, the query vector can be projected to the k-dimensional space using Function 1 [6].
Q = qTUkΣ−1k , (1)
On the left hand side of the equation, Q is a mapping ofq into latent semantic space, and on the right hand side ofthe equation q is the vector of terms in the user’s weightedquery; qT is the transpose of q; and qTUk is the sum ofthe k-dimensional term vectors specified in the query, mul-tiplied by the inverse of the singular values Σ−1
k . The sin-gular values are used to separately weight each dimensionof the term-document space [6].
Once the query vector is projected into the term-document space it can be compared to all other existingdocument vectors using a similarity measure. One verypopular measure of similarity computes the cosine betweenthe query vector and the document vector. Typically, usingthe cosine measure, the cosines of the angles between thequery vector and each of the other document vectors arecomputed and the documents are ranked according to theirsimilarity to the query, i.e. how close they are to the queryin the term-document space. All documents or those docu-ments with a similarity value exceeding a threshold, are re-turned to the user in a ranked list sorted in descending orderof similarity values, i.e. the documents most similar to thequery are displayed in the top of the ranked list. The qual-ity of the results can be measured using evaluation mea-sures, such as those discussed in Section 6. In the term-by-document matrix A that has columns aj (i ≤ j ≤ n where

EVALUATING THE PERFORMANCE OF LSA FOR. . . Informatica 36 (2012) 409–424 411
Symbol Name Formulab Binary b(fij)l Logarithmic log2(1 + fij)n Augmented normalised term frequency (b(fij) + (fij/maxkfkj))/2t Term frequency fija Alternate log b(fij)(1 + log2fij)
Table 1: Formulas for local term-weights (lij)
Symbol Name Formulax None 1e Entropy 1 + (
∑j(pij log2(pij))/log2n)
f Inverse document frequency (IDF) log2(n/∑
j b(fij))
g GfIdf (∑
j fij)/(∑
j b(fij))
n Normal 1/√∑
j f2ij
p Probabilistic inverse log2((n−∑
j b(fij))/∑
j b(fij))
Table 2: Formulas for global term-weights (gi)
n is the number of documents in the dataset, or equiv-alently the number of columns in the term-by-documentmatrix A) the cosine similarity between the query vectorQ = (t1, t2, . . . , tm)T and the n document vectors is givenas follows:
cosΘj =aTj Q
∥ aj ∥2∥ Q ∥2=
∑mi=1 aijQi√∑m
i=1 a2ij
√∑mi=1 Q
2i
(2)
for j = 1, . . . , n.
3 Background LiteratureThe background literature section consists of two subsec-tions. The first subsection describes existing plagiarismdetection algorithms and the second subsection describesliterature on LSA applications and their parameter settings.
3.1 Source-code plagiarism detection toolsMany different plagiarism detection algorithms exist, themost popular being the Fingerprint based algorithms andString-matching algorithms. Algorithms based on the fin-gerprint approach work by creating “fingerprints” for eachdocument which contain statistical information such as av-erage number of terms per line, number of unique terms,and number of keywords [31]. An example of these isMOSS (Measure of Software Similarity) [1]. MOSS usesa string-matching algorithm which divides programs intocontiguous substrings of length k, called k-grams. Each k-gram is hashed, and MOSS selects a subset of these hashvalues as the program’s fingerprints. The more fingerprintstwo programs share, the more similar they are consideredto be [39]. Most popular and recent string-matching basedtools include JPlag [37], and Sherlock [17]. In these toolsthe first stage is called tokenization. At the tokenization
stage, each source-code document is replaced by prede-fined and consistent tokens, for example different types ofloops in the source-code may be replaced by the same to-ken name regardless of their loop type (e.g. while loop,for loop). The tokens for each document are compared todetermine similar source-code segments.
Moussiades and Vakali have developed a plagiarismdetection system called PDetect which is based on thestandard vector-based information retrieval technique [30].PDetect represents each program as an indexed set of key-words and their frequencies found within each program,and then computes the pair-wise similarity between pro-grams. Program pairs that have similarity greater than agiven cutoff value are grouped into clusters. Their resultsalso show that PDetect and JPlag are sensitive to differ-ent types of attacks and the authors suggest that JPlag andPDetect complement each other.
3.2 LSA parameter settings
The performance of LSA is not only driven by the SVDalgorithm, but also from a variety of sources such as thecorpus, term-weighting, and the cosine distance measures[42, 23]. When LSA is introduced to a new task, the param-eters should be optimized for that specific task as these in-fluence the performance of LSA. Parameters include term-weighting algorithms, number of dimensions retained, andtext pre-processing techniques.
Dumais conducted experiments evaluating the informa-tion retrieval performance of LSA using various weight-ing schemes and dimensionality settings. LSA was ap-plied to five information science collections (consisting ofthe full text of document titles, authors, and abstracts orshort articles). Each dataset comprised of 82, 425, 1033,1400, and 1460 documents and 374, 10337, 5831, 4486,and 5743 terms respectively. Dumais reported that per-formance, measured by Average Precision (as discussed

412 Informatica 36 (2012) 409–424 G. Cosma et al.
Symbol Name Formulax None 1c Cosine (
∑i(gilij)
2)−1/2
Table 3: Formulas for document length normalization (nj)
in Section 6), improved when appropriate term weightingwas applied. Normalization and GfIdf had mixed effectson performance, depending on the dataset, but on aver-age they appear to decrease performance compared withthe raw (i.e. no weighting) term frequency. Idf, Entropyand LogEntropy result in consistently large improvementsin performance by 27%, 30%, and 40% respectively [11].Nakov et al. [34] experimented with combinations of theweighting algorithms that were also considered by Dumais[11] and Jones [16], in order to evaluate their impact onLSA performance. Their results also revealed that localand global weight functions are independent of each otherand that their performance (measured by Average Preci-sion) is dependent on the corpus. In addition, their resultsrevealed that, for some corpora of text, using the logarith-mic local weighting instead of raw term weighting resultedin higher precision, and for others it resulted in consistentlylower precision. Applying the global weighting functionsnone, normal, and GfIdf, resulted in lower precision re-gardless of the corpus text and local weighting function ap-plied, and the global weight entropy outperformed all otherglobal weighting functions. The results of experiments re-ported by Pincombe [36] concerning the performance ofLSA when applying various weighting schemes are con-sistent with those of Dumais [11] and Nakov [34]. Theirfindings also show that use of a stop-word list and addingbackground documents during the construction of the LSAspace significantly improves performance. Findings ofWild et al. [43] were quite different to those by Pincombe[36] and the rest of the literature discussed. They found thatthe IDF global weighting outperformed all other weightingfunctions, but gave no clear indication as to which localweighting function performed best. They also found thatcombining stemming with stop-word filtering resulted inreduced average correlations with the human scores. Thefindings of Wild et al. [43], who also investigated the cor-relations between LSA and human scores, were consistentwith those of Pincombe [36] who found that filtering stop-words using a stop-word list improves results. Identify-ing the optimal number of dimensions to retain in order tobest capture the semantic structure of the document collec-tion still remains an unanswered question. With regards tothe corpus size, it is well argued that more reliable resultsare gained from a larger corpus size [35, 38]. Rehder etal. [38] investigated the efficacy of LSA as a technique forevaluating the quality of student responses against humanratings, and found that for 106 student essays, the perfor-mance of LSA improved when documents contained be-tween 70-200 words. The optimal dimensions selected byKontostathis [21] for 7 large corpora containing between
1033 and 348,577 documents ranged from 75 to 500 de-pending on the corpus. Chen et al. [8] implemented an LSIsearch engine and for a collection of 600,000 documentsthey used 400 dimensions. Using a test database contain-ing medical abstracts, Deerwester et al. [10] found thatthe performance of LSA can improve considerably after 10or 20 dimensions, reaches a peak between 70 and 100 di-mensions but then performance slowly diminishes. Jessupand Martin [15] also found that for their datasets a choiceof dimensions ranged from 100 to 300, and Berry [3] sug-gests keeping at least 100 to 200 dimensions. Pincombe[36] found that, for a corpus of 50 documents, there was amajor improvement in LSA performance when the numberof dimensions was increased from 10 to 20, and that opti-mal LSA performance was achieved when no dimensional-ity reduction was applied, i.e. the classic VSM was used.Nakov [33] describes experiments concerned with the ap-plication of LSA to source-code programs written by Com-puter Science students using the C programming language.The datasets comprised of 50, 47, and 32 source-code doc-uments. The results of the experiments revealed that LSAdetected copied programs and returned relatively high simi-larity values to pairs containing non-copied programs. Theauthor assumes that this was due to the fact that the pro-grams share common language reserved terms and due tothe limited number of solutions for the given programmingproblem. In addition, the author states that, after applyingSVD, 20 dimensions were retained. Considering the size oftheir corpora, the choice of dimensions appears to be high,and it is suspected that this was the main reason that theauthors report very high similarity values to non-similardocuments. The author justifies the existence of the highsimilarity values to be due to documents sharing languagereserved terms. However, the use of a suitable weightingscheme and appropriate number of dimensions can reducethe chances of this happening. McMillan et. al. [29] cre-ated an approach for automatically detecting closely relatedapplications. Their tool, CLAN, helps users detect similarapplications for a given Java application. CLAN is basedon LSI, however the authors do not provide the parame-ter settings and state that weights and dimensionality wereselected experimentally.
4 ContributionMost popular plagiarism detection tools are based onstring-matching algorithms. The comparison process ofthose approaches are based on the source-code documentsstructural information derived from the programming lan-guage syntax. Algorithms that rely on detecting similar

EVALUATING THE PERFORMANCE OF LSA FOR. . . Informatica 36 (2012) 409–424 413
documents by analyzing their structural characteristics canbe tricked by specific attacks mainly on the structure of thesource-code and thus often fail to detect similar documentsthat contain significant code shuffling. In addition, string-matching systems are language-dependent based on theprogramming languages supported by their parsers [37].
LSA is an algorithm that adopts a more flexible approachthan existing plagiarism detection tools, i.e. one that is notbased on structural comparison and parsers. Furthermore,the similarity computation algorithms of LSA and recentplagiarism detection tools are different. One important fea-ture of LSA is that it considers the relative similarity be-tween documents, i.e two documents are considered sim-ilar by LSA if they are relatively more similar than otherdocuments in the corpus, whereas, recent plagiarism detec-tion tools compute the similarity between documents on apair-wise basis. This is important when comparing a cor-pus of student solutions to a programming problem that hasmany similar solutions and a tool is needed to extract thosesimilar document pairs that are relatively more similar thanothers. LSA is a highly parameterized statistical method,and its effectiveness is driven by the setting of its parame-ters which are set differently based on the task for which itis applied.
This paper discusses and evaluates the importance ofparameterization for LSA-based similarity detection ofsource-code documents; and the applicability of LSA asa technique for source-code plagiarism detection when itsparameters are appropriately tuned. The parameters in-volved in the experimentations include:
1. different corpus preprocessing steps (i.e. selectiveelimination of source-code elements),
2. corpus and document normalization schemes based ondifferent weighting approaches, and
3. parameter tweaking inherent to the LSA processing,in particular, the choice of dimensions for the step ofreducing the original post-SVD matrix.
Against multiple Java source-code corpora taken from aComputer Science course setting, an evaluation study onthe various parameter loadings and configurations betweenthe parameters is reported herein.
5 Experimental Setup
Experiments were performed using four Java datasetswhich comprised of source-code documents produced bystudents from the University of Warwick as part of theircomputer science programming courses. Ethical consenthad been obtained for using the datasets. The details ofthese datasets are given in Table 4.
Total number of documents is the total number of source-code documents in a corpus, and Total number of terms
is the total number of terms found in the source-code cor-pus after initial preprocessing is performed. During ini-tial preprocessing, terms that are solely composed of nu-meric characters are removed, syntactical tokens (i.e. semi-colons, and colons) and punctuation marks, and termswhich occur in only one document are all removed; andupper case letters are translated into lower case. In ad-dition, identifiers which consist of multiple terms sepa-rated by underscores are treated as single terms (i.e. afterpreprocessing “student_name” becomes one term “student-name”). The reason for merging rather than separating suchidentifiers is because each identifier represents one mean-ing in the source-code document, regardless whether it con-sists of one or two words (separated by underscore).
Total number of suspicious document pairs is the totalnumber of document pairs that were categorised as suspi-cious. The following steps were carried out for compilingthe set of suspicious document pairs:
1. The four corpora, one at a time, were initially passedinto three source-code similarity detection tools –JPlag [37], Sherlock [17], and PlaGate [9]. The per-formance of JPlag is considered to be close to that ofMOSS [1], however, only JPlag was available. Sher-lock and PlaGate were also used because these werealso readily accessible and available for performingthe experiments. The output of the tools was collatedand four preliminary lists (one corresponding to eachcorpus) were created, each containing groups of sus-picious source-code documents.
2. The documents in each group were scrutinized by aca-demics(teaching programming subjects, and who pro-vided the particular corpora) and any false positives(i.e. documents that did not contain similar source-code to the rest of the documents in the group) wereremoved.
3. The final lists contained a number of queries (one ran-dom document selected from each group) and theirrelevant documents, and these lists were used for eval-uation purposes.
Applying initial preprocessing resulted in creating fourpreprocessing versions, one for each dataset (A, B, C, andD), and these were named the KC version (in this versioncomments, keywords and skeleton code were retained inthe documents). Skeleton code is the source-code providedto students as a template for completing their solutions. Af-ter the initial preprocessing, the KC version of each datasetwas further pre-processed using various parameters con-cerning comments found in source-code, skeleton-code,and Java reserved words. The final outcome was the cre-ation of 24 versions (six versions corresponding to eachdataset: A, B, C, and D). Below is a list of abbreviationsand descriptions of the preprocessing parameters used forcreating each version.
– KC: Keep Comments, Keep Keywords and KeepSkeleton code

414 Informatica 36 (2012) 409–424 G. Cosma et al.
A(RC) A(KC) B(RC) B(KC) C(RC) C(KC) D(RC) D(KC)Total number of documents 106 106 176 176 179 179 175 175Total number of unique terms 537 1524 640 1930 348 1189 459 1408Total number of suspicious docu-ment pairs
6 6 48 48 51 51 79 79
Table 4: The Dataset Characteristics
– KCRK: Keep Comments, Remove Keywords
– KCRKRS: Keep Comments, Remove Keywords andRemove Skeleton code
– RC: Remove Comments, Keep Keywords and KeepSkeleton code
– RCRK: Remove Comments and Remove Keywords
– RCRKRS: Remove Comments, Remove Keywordsand Remove Skeleton code.
Preprocessing by removing comments involves delet-ing all comments from source-code documents such thatthey solely consist of source code. Keeping commentsinvolves retaining source-code comments and the source-code within the documents. Experimenting with stemmingor stop-word removal on the comments within the source-code documents was not conducted because the focus wasmainly on preprocessing parameters within the source-code(rather than on the comments which are part of natural-language text). A list of all known Java reserved terms wasused as a stop-list. The words contained in the stop-listwere removed from all Java documents to create the rele-vant versions (i.e. KCRK, and RCRK). All terms found inthe skeleton documents relevant to each corpus were addedto the stop list of Java reserved terms, thus creating fournew different stop lists (i.e. one for each corpus), and eachstop list was applied to the relevant corpus to create the newversions (KCRKRS, and RCRKRS).
After creating the preprocessing versions, the TMG tool[45] was applied and a term-by-document matrix was cre-ated for each version. A three-letter string was used in or-der to represent each term-weighting scheme (as shown inTables 1, 2, and 3) with the particular local, global andnormalisation factor combinations. For example, the tecweighting scheme uses the term frequency (t) local termweighting, the entropy (e) global term weighting, and thecosine document normalisation factor (c). The followingtwelve local, global, and document length normalisationweighting schemes were tested: txx, txc, tfx, tfc, tgx, tgc,tnx, tnc, tex, tec, lex, lec. The literature review suggeststhat those weighting schemes are the most commonly usedand tested by LSA researchers.
After computing the SVD of each term-by-documentmatrix, dimensionality reduction was performed. A rangeof seventeen different dimensions were tested, with k rang-ing from 2 to n (i.e. 2, 5, 10, 15, 20, 25, 30, 35, 40, 45,50, 60, 70, 80, 90, 100, n) where n is the total number ofdocuments in a corpus. The particular dimensional settings
were selected for experimentation to investigate the impactof selecting too few and too many dimensions (includingthe maximum number of dimensions). The datasets con-tained no more than 200 documents, and thus it was de-cided to show the effect of choosing too few and too manydimensions by evaluating the LSA performance while us-ing a range of 2 to 100 dimensions, and also when using themaximum possible number, n, of dimensions. When max-imum possible number of dimensions are used, the perfor-mance of LSA is equivalent to that of the standard VectorSpace Model (VSM) [21].
The cosine similarity measure to compute the distancebetween two vectors was used, as it is the most commonlyused measure of similarity in the literature and has beenshown to produce good results.
6 Performance Evaluation MeasuresThe performance of a system is measured by its retrievalefficiency. Precision represents the proportion of retrieveddocuments that are relevant. Precision is denoted by Pwhere P ∈ [0, 1], where Fr is the number of relevant doc-uments retrieved and Ft is the total number of documentsretrieved for a given query.
P =Fr
Ft(3)
Precision is 1.00 when every relevant document returnedin the ranked list is relevant to the query. Average Preci-sion (AP) is the average of the precisions of the relevantdocuments in the retrieved list. This evaluation measureproduces a single value summary of the ranking positionsof the relevant documents retrieved, by averaging the pre-cision values obtained after each new relevant document isretrieved in the ranked list of documents. The closer theAP value is to 1.00 the better the system’s retrieval perfor-mance.
A commonly used measure for evaluating the perfor-mance of an algorithm using more than one query is MeanAverage Precision (MAP), which is the mean of the APvalues of all queries. During the experiments described inthis paper, the AP for each query was computed by takinginto consideration the precision values of all relevant doc-uments for the given query (i.e. no threshold was appliedand thus the list of retrieved documents was not reduced).Thus AP was computed up to rank position n, where n isthe total number of documents in the corpus. This is be-cause the aim was to evaluate the rank position of all the

EVALUATING THE PERFORMANCE OF LSA FOR. . . Informatica 36 (2012) 409–424 415
relevant documents for each query, and by taking into con-sideration the position of all relevant documents a pictureof overall performance is gained. The higher the value ofthe MAP, the better the performance of the system, i.e. thefewer non-relevant documents exist between relevant ones.
When summarizing the behavior of a retrieval algorithm,more than a single measure is required, in order to summa-rize its full behavior [2]. The evaluation measures proposedby Hoad and Zobel [14] were employed as additional mea-sures for evaluating performance, because these take intoconsideration similarity values between the queries and theretrieved documents. These include the Lowest PositiveMatch (LPM), Highest False Match (HFM) and Separa-tion (Sep.). Lowest Positive Match is the lowest similar-ity value given to retrieved document, and Highest FalseMatch is the highest similarity value given to a non-relevantdocument, in the returned list of documents. Separation isthe difference between the LPM and HFM. Overall perfor-mance is calculated by taking the ratio of Sep./HFM, i.e. bydividing the separation by the HFM. The higher the ratiovalue, the better the performance.
Furthermore, for the purposes of the experiments de-scribed in this paper, a new evaluation measure MaximumMean Average Precision (MMAP) is defined. MMAP isthe highest MAP value achieved when using a particularweighting scheme and preprocessing parameter. For ex-ample, consider the results of the experiments presented inTables up to 9. These tables show the MMAP values foreach dataset’s version.
After computing the MAP value using various weight-ing schemes and k dimensions, the MMAP value reachedby LSA when using each weighting scheme was recordedalongside the number of dimensions that were needed forthe particular MMAP value to be achieved. For example,as shown in Table 6, column KC, the highest MMAP valuereached by the txx weighting scheme was 0.86 at 20 di-mensions. When comparing the performance of LSA us-ing various weighting algorithms, it is important to takeinto consideration the number of dimensions each weight-ing algorithm needed to reach its MMAP value. For exam-ple, observing the results for sub-dataset KC of dataset A,shown in Table 6, the highest MMAP recorded was that bythe lec algorithm, MAP=0.96 k=40, closely followed by thetnc algorithm, MAP=0.95 k=25. The difference in MAP isonly 0.01 but there is considerable difference in the numberof dimensions needed, i.e. lec needed 15 more dimensions.
7 Experimental Results
This section discusses the results obtained from conduct-ing a series of experiments for determining the impactof parameters on the performance of LSA for the taskof source-code similarity detection on four source-codedatasets. Section 7.1 describes the results concerned withthe impact of weighting schemes, dimensionality and pre-processing settings on the applicability of LSA for detect-
ing similar source-code documents. Section 7.2 discussesthe impact of choice of parameters on the similarity valuesLSA assigns to document pairs.
7.1 Investigation into Weighting Schemes,Dimensionality and Preprocessingsettings
Tables 6-9 show the MMAP values for each dataset’s ver-sions. Results suggest that the parameters chosen are inter-dependent — the performance of weighting schemes de-pends on the combined choice of preprocessing parame-ters, the corpora and the choice of dimensionality. In over-all, the average MMAP values of each dataset show thatthe tnc weighting scheme performed well on most versions,when using between 10 and 20 dimensions. With regards towhich preprocessing parameter performed best, the resultsvary depending on the weighting algorithm applied. Whenusing the tnc term-weighting scheme the highest MMAPvalues achieved for each dataset are as follows:
– Dataset A: RC (MMAP=1.00, k=15), RCRK(MMAP=1.00, k=15),
– Dataset B: RC (MMAP=0.91, k=15), RCRK(MMAP=0.91 k=15),RCRKRS (MMAP=0.91, k=15),
– Dataset C: KCRKRS (MMAP=0.97, k=15), and
– Dataset D: RC (MMAP=0.92, k=5).
The results show that highest MMAP values werereached when using the tnc weighting scheme and the RCpreprocessing parameter on datasets A, B and D. Withregards to dataset C, highest performance (MMAP=0.97k=15) was achieved using the tnc weighting scheme on theKCRKRS version, followed the tnc weighting algorithm onthe RC version (MMAP=0.88 k=20).
Figures 1, 2, 3, and 4 show the performance of datasetsA, B, C, and D respectively, when using the tnc weight-ing algorithm and various dimensional settings. As illus-trated in Figures 1 - 4, it is clear that the choice of pre-processing parameters has a major impact on LSA perfor-mance. For example, in dataset A, Figure 1 shows that ap-plying the RCRKRS preprocessing has a negative effect onperformance, which suggests that by removing comments,keywords and skeleton code altogether important meaningfrom documents is also removed.
An important finding is that although the choice of pre-processing influences precision values, it does not influencethe ideal number of dimensions needed for each dataset –the pattern of behavior across Figures 1 - 4 is very simi-lar — MAP performance improves significantly after 10 to15 dimensions and then remains steady or decreases when35 dimensions are reached, and then begins to fall slowlyand gradually. Furthermore, upon reaching the maximumnumber of possible dimensions (and thus the performance

416 Informatica 36 (2012) 409–424 G. Cosma et al.
of LSA is equivalent to that of the VSM), performance de-creases significantly which suggests that at maximum di-mensionality irrelevant information is captured by the LSAmodel, which causes LSA not to be able to differentiatebetween similar and non-similar documents.
Figure 1: Dataset A: MAP performance using the tncweighting scheme across various dimensions.
Figure 2: Dataset B: MAP performance using the tncweighting scheme across various dimensions.
The results also show that, for the corpora involved inthe experiments, when selecting between 10 and 35 dimen-sions, the performance of LSA outperforms that of VSM,i.e. when the value of k is set to n.
A contrast of the results was performed using MANOVAfor comparing the effect of weighting schemes and prepro-cessing parameters on the performance of LSA. The over-all performance (i.e. average MMAP and k values) wascompared between the KC and all other types of prepro-cessing parameters, and between the txx and all other typesof weighting schemes. The statistical results concerningthe comparison of KC and the remaining of preprocess-ing parameters revealed a significant decrease in MMAPperformance (p < 0.05, p = 0.00) and a significant in-crease in the number of dimensions (p < 0.05, p = 0.04)required for reaching MMAP when RCRKRS preprocess-ing is applied instead of the KC. The remaining compar-isons did not reveal any statistically significant differencesin MMAP performance. Thus, the statistical tests verify
Figure 3: Dataset C: MAP performance using the tncweighting scheme across various dimensions.
Figure 4: Dataset D: MAP performance using the tncweighting scheme across various dimensions.
the observations that applying the RCRKRS preprocessingparameter produces undesirable effects on the retrieval per-formance of LSA. The most effective preprocessing param-eter would achieve MMAP at less dimensions when com-pared to other preprocessing parameter choices - such ef-fect had the KCRKRS and the RC settings although theseresults are not statistically significant.
With regards to weighting schemes, the results revealeda significant decrease in MMAP performance when the tfx(p < 0.05, p = 0.03), tgx (p < 0.05, p = 0.02), tgc (p <0.05, p = 0.02), and tex (p < 0.05, p = 0.03) weightingschemes were applied and a significant increase in MMAPperformance when the tnc (p < 0.05, p = 0.02) weightingscheme was applied. Comparisons of the performance ofthe txx and the remaining of the weighting schemes, didnot return any statistically significant results. The statis-tical comparisons revealed that applying txc (p < 0.05,p = 0.02), tgc (p < 0.05, p = 0.03), lec (p < 0.05,p = 0.00) and tnc (p < 0.05¸ p = 0.00) significantlyreduced the number of dimensions required for reachingMMAP performance. These results verify the observationsgathered from Figures 1 - 4 and thus it can be concludedthat the tnc weighting scheme is the most effective to applyon the LSA model for achieving maximum MMAP perfor-mance at fewer k dimensions across all datasets.

EVALUATING THE PERFORMANCE OF LSA FOR. . . Informatica 36 (2012) 409–424 417
Figure 5: Dataset A version RC: Sep./HFM performanceusing various weighting algorithms and dimensions.
Figure 6: Dataset A version KC: Sep./HFM performanceusing various weighting algorithms and dimensions.
7.2 Investigation into Similarity Values
Based on the previous experiment discussed in Section 7.1,a hypothesis has been formed that parameters have an im-pact on the similarity values between a query and the doc-uments in the corpus. The measure of AP does not takeinto consideration the similarity values between a queryand the relevant documents. Importantly, when consideringthe most effective parameter combinations for the task ofsource-code similarity detection with LSA, it is also essen-tial to investigate the similarity values assigned to similarsource-code documents when various parameter settingsare applied. For example, with threshold-based retrieval,if the user submits a piece of code with the aim of findingsimilar pieces of code that exceed the minimum similaritythreshold value of 0.70, then the similarity values are animportant factor in the successful retrieval of relevant doc-uments.
However, a non-threshold based system would displaythe top n documents most similar to the query regardless oftheir similarity value with the query - for example, if thesimilarity value between the query and document D12 was0.50, and 0.50 was the highest value for a relevant docu-ment for that particular query, then document D12 wouldbe retrieved first in a ranked list of results followed by doc-uments which received lower similarity values, with the
most similar documents positioned at the top of the rankedlist. Now, suppose that document D12 was indeed a rele-vant document and similarity threshold was set to a valueabove 0.60 then a threshold-based system would fail to re-trieve the particular document. Thus, for the purposes ofan application that detects similar source-code documentsthat allows use of thresholds then the similarity values areimportant to information retrieval performance.
The experiments performed show that similarity valuesare dependent on the choice of parameters. Figure 5 showsthe Sep./HFM performance using various weighting algo-rithms and dimensions on the RC version of dataset A, andFigure 6 shows the Sep./HFM performance using variousweighting algorithms and dimensions on the KC version ofthe same dataset. Each figure illustrates that performance ishighly dependent on the choice of weighting scheme, andcomparing the two figures shows that similarity values arealso dependent on the choice of preprocessing parameters.
Although the best AP results were returned at 15 dimen-sions, evidence shows that with regards to similarity valuesgiven to relevant and non-relevant documents, 15 dimen-sions are too few – however, for an information retrievaltask where results are ordered in a ranked list and wherethe similarity value does not really matter, then dimensionsare appropriate for the system to retrieve the most relevantdocuments from the top ranked ones.
Figures 7-10 show the mean values of the LPM, HFM,and Sep./HFM, respectively, over all queries for eachdataset’s RC version. The average Sep./HFM values forall datasets are also displayed in each figure.
Figure 7: Datasets A, B, C, D: Mean LPM using the RCversion and the tnc weighting scheme across various di-mensions.
Figure 7 shows that, on average, values given to the rel-evant documents lowest in the retrieved list are near andabove 0.80 when using 2 to 15 dimensions. In order todecide whether 15 dimensions are sufficient, the similar-ity values given to non-relevant documents (i.e. the HFMvalues) must be investigated.
Figure 8 shows that at 15 dimensions non-relevant doc-uments received, on average, very high similarity values,i.e. above 0.70. Separation between relevant and non-relevant documents (as shown in Figure 9) is very small

418 Informatica 36 (2012) 409–424 G. Cosma et al.
Figure 8: Datasets A, B, C, D: Mean HFM using the RCversion and the tnc weighting scheme across various di-mensions.
Figure 9: Datasets A, B, C, D: Mean Separation using theRC version and the tnc weighting scheme across variousdimensions.
(0.03 and below) which indicates that many non-relevantdocuments received high similarity values.
Figure 10 shows that between 2 and 15 dimensions over-all performance measured by Sep./HFM was very low (0.22and below). These results clearly suggest that with regardsto similarity values, more dimensions are needed if thefunctionality of filtering documents above a given thresh-old will be included in system implementation. At 30 andabove dimensions, the average values given to non-relevantdocuments are 0.53 or below (see Figure 8), and there ap-pears to be a good amount of separation (see Figure 9)between the similarity values given to relevant and non-relevant documents (i.e. average separation at 30 dimen-sions is 0.14, highest average separation recorded is 0.18).
With regards to good choice of dimensionality, observ-ing the values of separation shows that there is not muchchange in the curve after 30 dimensions. Also, per-formance by means of Sep./HFM increases considerably(i.e. by 0.57 points) between 15 and 30 dimensions.
Figure 10: Datasets A, B, C, D: Mean Sep./HFM using theRC version and the tnc weighting scheme across variousdimensions.
8 DiscussionThe results revealed that the choice of parameters influ-ences the effectiveness of source-code similarity detectionwith LSA. Most evaluations of performance in the liter-ature are based on precision, however for LSA applica-tions that make use of thresholds it is important to inves-tigate the similarity values assigned to document pairs (orquery-document pairs) and tune the parameters accordinglyas these are crucial to the system’s retrieval performance.With regards to the most effective choice of preprocessingand term-weighting parameters, the experiments revealedthat removing comments during preprocessing source-codedocuments and applying the tnc weighting scheme to theterm-by-document matrix are good choice of parameterchoices for the particular application of LSA. However, theresults also suggest that removing comments, Java reservedterms and skeleton code all at once can have a negative im-pact on retrieval performance.
In summary, the findings from the experiments revealedthat applying the term frequency local weighting, and nor-mal global weighting algorithms outperformed all otherweighting schemes (with or without combining it withthe cosine document length normalization). These resultsare not consistent with those by Dumais [11] who foundthat the normal global weighting performed significantlylower than all other weighting schemes (no experimentswere conducted with document length normalization algo-rithms).
Researchers have tested various weighting schemes andbest results were reported when applying the logarithm asthe local, and the entropy as the global weighting scheme[34, 11, 36]. However, Wild et al. [43] found that the In-verse Document Frequency (IDF) global weighting outper-formed all other weighting functions, and found no clearindication as to which local weighting function performedbest.
With regards to source-code similarity detection withLSA, the findings described in this paper revealed that thelogarithm-entropy combination performed well but only

EVALUATING THE PERFORMANCE OF LSA FOR. . . Informatica 36 (2012) 409–424 419
when combined with document length normalization. Onaverage, the optimal number of dimensions depends on theparticular corpora and task (i.e. depending of whether ornot threshold values will be used by the system), and forthe corpora involved in the experiments the optimal num-ber of dimensions appears to be between 10 and 30, after30 dimensions performance begins to deteriorate.
An investigation into similarity values of document pairsrevealed that choice of dimensions influences these values.The results revealed that setting the value of k to 15 di-mensions is appropriate for all the source-code datasets in-volved in the experiments, if the task is to retrieve a rankedlist of documents sorted in order of similarity to a query.However, when threshold values are used, the results sug-gest that the number of dimensions must be increased to 30in order to maximize the retrieval performance of the sys-tem, and this is because when fewer dimensions were used,relatively high values were given to non-similar documentswhich increased the number of false positives documentsbeing retrieved.
9 Conclusion and Future Work
This paper describes the results gathered from conductingexperiments in order to investigate the impact of param-eters on the effectiveness of source-code similarity detec-tion with LSA. Results show that the effectiveness of LSAfor source-code plagiarism detection is heavily dependenton the choice of parameters, and that the parameters cho-sen are dependent on each other, on the corpus, and on thetask to which LSA has been applied. Furthermore, the re-sults indicate that choice of dimensionality has a major im-pact on the similarity values LSA gives to retrieved docu-ment pairs, and that LSA based information retrieval sys-tems which make use of threshold values as indicators ofthe degree of similarity between the query and documentsin a corpus are likely to require more dimensions. In addi-tion, there is clear evidence that when parameters are tuned,LSA outperforms the standard vector space model. Thisimprovement in performance is mainly due to the use of theSingular Value Decomposition algorithm, which appears tobe the power behind LSA – in fact, the vector space modelis a special case of LSA, without any dimensionality reduc-tion.
One limitation to this study was concerned with thedatasets used for experimentation. The only source-codedatasets that were available for conducting the experimentswere those provided by academics in the department ofComputer Science at the University of Warwick. It wasalso very time demanding to devise an exhaustive list ofsimilar document pairs for each dataset.
Furthermore, a pattern of similar behavior was observedwhen using particular weighting schemes and dimensional-ity settings. However, this raises the question, will partic-ular pattern of behavior change when using other source-code datasets with different characteristics (e.g. different
number of documents and dictionary size)? To answer thisquestion, one would need to conduct experiments usingmore source-code corpora in order to investigate the behav-ior of LSA’s parameter settings. It would also be interest-ing to investigate which parameters work best by analyzingthe corpora characteristics. For example, which parametersdrive the effectiveness of source-code similarity detectionwith LSA when using C++ corpora, or corpora written inother programming languages?
Furthermore, symbols in source-code carry meaning(e.g. y > 4 and y < 4), and by removing those symbolsduring preprocessing, important meaning from documentsmay also be removed. This raises the question of, how totreat symbols in programming languages prior to applyingLSA. Possible ways of answering this question would beto add the symbols to the term dictionary used to create theterm-by-document matrix. Another way of treating sym-bols would be to replace them with words (e.g. replacesymbol - with the word minus), or even to categorize sym-bols and to replace each one with their category name (e.g.replace occurrences of the mathematical symbols with theword arithmetic). Experiments with how to treat symbols,would be of greater importance when applying LSA to lan-guages such as Perl, which are heavily based on symbols.
References[1] A. Aiken. Moss: A system for de-
tecting software plagiarism. Software:www.cs.berkeley.edu/ aiken/moss.html, accessed:July 2008.
[2] R. Baeza-Yates and B. Ribeiro-Neto. Modern In-formation Retrieval. ACM Press / Addison-Wesley,1999.
[3] M. Berry. Large-scale sparse singular value compu-tations. The International Journal of SupercomputerApplications, 6(1):13–49, Spring 1992.
[4] M. Berry and M. Browne. Understanding SearchEngines: Mathematical Modeling and Text Retrieval(Software, Environments, Tools), Second Edition.Society for Industrial and Applied Mathematics,Philadelphia, PA, USA, 2005.
[5] M. Berry, Z. Drmac, and E. Jessup. Matrices, vec-tor spaces, and information retrieval. SIAM Review,41(2):335–362, 1999.
[6] M. Berry, S. Dumais, and G. O’Brien. Using linearalgebra for intelligent information retrieval. Techni-cal Report UT-CS-94-270, University of TennesseeKnoxville, TN, USA, 1994.
[7] A. Britt, P. Wiemer-Hastings, A. Larson, and C. Per-fetti. Using intelligent feedback to improve sourc-ing and integration in students’ essays. Interna-tional Journal of Artificial Intelligence in Education,14:359–374, 2004.
[8] C. Chen, N. Stoffel, M. Post, C. Basu, D. Bassu, andC. Behrens. Telcordia LSI engine: Implementation

420 Informatica 36 (2012) 409–424 G. Cosma et al.
and scalability issues. In RIDE ’01: Proceedings ofthe 11th International Workshop on research Issuesin Data Engineering, pages 51–58, Washington, DC,USA, 2001. IEEE Computer Society.
[9] G. Cosma and M. Joy. An approach to source-codeplagiarism detection and investigation using latent se-mantic analysis. IEEE Transactions On Computing,2009. Accepted for publication November 2009.
[10] S. Deerwester, S. Dumais, T. Landauer, G. Furnas,and R. Harshman. Indexing by latent semantic anal-ysis. Journal of the American Society of InformationScience, 41(6):391–407, 1990.
[11] S. Dumais. Improving the retrieval of informationfrom external sources. Behavior Research Methods,Instruments and Computers, 23(2):229–236, 1991.
[12] P. Foltz. Using latent semantic indexing for informa-tion filtering. SIGOIS Bulletin, 11(2-3):40–47, 1990.
[13] R. Gravina, M. Yanagisawa, and K. Akahori. Devel-opment and evaluation of a visual assesment asistantusing latent semantic analysis and cluster analysis. InProceedings of International Conference on Comput-ers in Education, pages 963–968, 2004.
[14] T. Hoad and J. Zobel. Methods for identifying ver-sioned and plagiarized documents. Journal of theAmerican Society for Information Science and Tech-nology, 54(3):203–215, 2003.
[15] E. Jessup and J. Martin. Taking a new look at thelatent semantic analysis approach to information re-trieval. In In: Proceedings of the SIAM Workshopon Computational Information Retrieval, pages 121–144. Raleigh, NC, 2001.
[16] K. Jones. A statistical interpretation of term speci-ficity and its application in retrieval. Journal of Doc-umentation, 28:11–21, 1972.
[17] M. Joy and M. Luck. Plagiarism in program-ming assignments. IEEE Transactions on Education,42(1):129–133, 1999.
[18] T. Kakkonen, N. Myller, E. Sutinen, and J. Timonen.Automatic essay grading with probabilistic latent se-mantic analysis. In Proceedings of the 2nd Workshopon Building Educational Applications Using NaturalLanguage Processing at the 43rd Annual Meeting ofthe Association for Computational Linguistics, pages29–36, Ann Arbor, Michigan, USA, 2005.
[19] T. Kakkonen and E. Sutinen. Automatic assessmentof the content of essays based on course materials. InProceedings of the International Conference on In-formation Technology: Research and Education 2004(ITRE 2004), pages 126–130, London, UK, 2004.
[20] S. Kawaguchi, P. Garg, M. Matsushita, and K. Inoue.Mudablue: An automatic categorization system foropen source repositories. In APSEC ’04: Proceedingsof the 11th Asia-Pacific Software Engineering Confer-ence, pages 184–193, Washington, DC, USA, 2004.IEEE Computer Society.
[21] A. Kontostathis. Essential dimensions of latent se-mantic indexing (lsi). In HICSS ’07: Proceedingsof the 40th Annual Hawaii International Conferenceon System Sciences, page 73, Washington, DC, USA,2007. IEEE Computer Society.
[22] A. Kuhn, S. Ducasse, and T. Girba. Enriching reverseengineering with semantic clustering. In WCRE ’05:Proceedings of the 12th Working Conference on Re-verse Engineering, pages 133–142, Washington, DC,USA, 2005. IEEE Computer Society.
[23] T. Landauer, D. Laham, B. Rehder, and M. Schreiner.How well can passage meaning be derived withoutusing word order: A comparison of latent semanticanalysis and humans. In COGSCI-97, pages 412–417,Stanford, CA, 1997. Lawrence Erlbaum.
[24] T. E. Lin M., Amor R. A Java reuse reposi-tory for eclipse using LSI. In Proceedings of the2006 Australian Software Engineering Conference(ASWEC’06). IEEE, 2006.
[25] M. Lungu, A. Kuhn, T. Gîrba, and M. Lanza. Interac-tive exploration of semantic clusters. In 3rd Interna-tional Workshop on Visualizing Software for Under-standing and Analysis (VISSOFT 2005), pages 95–100, 2005.
[26] J. Maletic and A. Marcus. Supporting program com-prehension using semantic and structural information.In International Conference on Software Engineer-ing, pages 103–112, 2001.
[27] J. Maletic and N. Valluri. Automatic software cluster-ing via latent semantic analysis. In ASE ’99: Proceed-ings of the 14th IEEE International Conference onAutomated Software Engineering, page 251, Wash-ington, DC, USA, 1999. IEEE Computer Society.
[28] A. Marcus, A. Sergeyev, V. Rajlich, and J. Maletic.An information retrieval approach to concept loca-tion in source code. In Proceedings of the 11thIEEE Working Conference on Reverse Engineering(WCRE2004), Delft, The Netherlands, pages 214–223, November 9-12 2001.
[29] C. McMillan, M. Grechanik, and D. Poshyvanyk. De-tecting similar software applications. In Proceedingsof the 2012 International Conference on Software En-gineering, ICSE 2012, pages 364–374, Piscataway,NJ, USA, 2012. IEEE Press.
[30] L. Moussiades and A. Vakali. PDetect: A clus-tering approach for detecting plagiarism in sourcecode datasets. The Computer Journal, 48(6):651–661, 2005.
[31] M. Mozgovoy. Desktop tools for offline plagiarismdetection in computer programs. Informatics in Edu-cation, 5(1):97–112, 2006.
[32] M. Mozgovoy. Enhancing Computer-Aided Plagia-rism Detection. Dissertation, Department of Com-puter Science, University of Joensuu, Department ofComputer Science, University of Joensuu, P.O.Box111, FIN-80101 Joensuu, Finland, November 2007.

EVALUATING THE PERFORMANCE OF LSA FOR. . . Informatica 36 (2012) 409–424 421
[33] P. Nakov. Latent semantic analysis of textual data.In CompSysTech ’00: Proceedings of the Conferenceon Computer systems and Technologies, pages 5031–5035, New York, NY, USA, 2000. ACM.
[34] P. Nakov, A. Popova, and P. Mateev. Weight func-tions impact on LSA performance. In Proceedings ofthe EuroConference Recent Advances in Natural Lan-guage Processing (RANLP’01), pages 187–193. JohnBenjamins, Amsterdam/Philadelphia, 2001.
[35] C. Perfetti. The limits of co-occurrence: tools andtheories in language research. Discourse Processes,25:363–377, 1998.
[36] B. Pincombe. Comparison of human and LSA judge-ments of pairwise document similarities for a newscorpus. Research Report No. AR-013-177, DefenceScience and Technology Organisation - Australia,2004.
[37] L. Prechelt, G. Malpohl, and M. Philippsen. Find-ing plagiarisms among a set of programs with JPlag.Journal of Universal Computer Science, 8(11):1016–1038, 2002.
[38] B. Rehder, M. Schreiner, M. Wolfe, D. Lahaml,W. Kintsch, and T. Landauer. Using latent semanticanalysis to assess knowledge: Some technical consid-erations. Discourse Processes, 25:337–354, 1998.
[39] S. Schleimer, D. Wilkerson, and A. Aiken. Win-nowing: local algorithms for document fingerprint-ing. In SIGMOD ’03: Proceedings of the 2003 ACMSIGMOD International Conference on Managementof Data, pages 76–85, New York, NY, USA, 2003.ACM.
[40] A. Singhal, C. Buckley, and M. Mitra. Pivoted doc-ument length normalization. In Proceedings of the19th Annual International ACM SIGIR Conference onResearch and Development in Information Retrieval,pages 21–29. ACM Press, 1996.
[41] A. Singhal, G. Salton, M. Mitra, and C. Buckley.Document length normalization. Technical report,Cornell University, Ithaca, NY, USA, 1995.
[42] P. Wiemer-Hastings. How latent is latent semanticanalysis? In Proceedings of the Sixteenth Interna-tional Joint Conference on Artificial Intelligence, IJ-CAI 99, pages 932–941. Morgan Kaufmann, July 31–August 6 1999.
[43] F. Wild, C. Stahl, G. Stermsek, and G. Neumann.Parameters driving effectiveness of automated essayscoring with LSA. In M. Danson, editor, Proceed-ings of the 9th International Computer Assisted As-sessment Conference (CAA), pages 485–494, Lough-borough, UK, July 2005. Professional Development.
[44] L. Yi, L. Haiming, L. Zengxiang, and W. Pu. A sim-plified latent semantic indexing approach for multi-linguistic information retrieval. In In Proceedings ofthe 17th Pacific Asia Conference on Language, Infor-mation and Computation (PACLIC17), pages 69–79,Sentosa, Singapore, 2003. COLIPS Publications.
[45] D. Zeimpekis and E. Gallopoulos. Design of a MAT-LAB toolbox for term-document matrix generation.Technical Report HPCLAB-SCG, Computer Engi-neering and Informatics Department, University ofPatras, Greece, February 2005.

422 Informatica 36 (2012) 409–424 G. Cosma et al.
LSA Latent Semantic AnalysisLSI Latent Semantic IndexingIDF Inverse Document FrequencySVD Singular Value DecompositionVSM Vector Space ModelLocal weighting schemesb Binaryl Logarithmicn Augmented normalized term frequencyt Term frequencya Alternate logGlobal weighting schemesx Nonee Entropyf Inverse document frequency (IDF)g GfIdfn Normalp Probabilistic inverseDocument Length Normalization schemesx Nonec CosinePreprocessing schemesKC Keep Comments, Keep Keywords and Keep Skeleton codeKCRK Keep Comments, Remove KeywordsKCRKRS Keep Comments, Remove Keywords and Remove Skeleton
codeRC Remove Comments, Keep Keywords and Keep Skeleton
codeRCRK Remove Comments and Remove KeywordsRCRKRS Remove Comments, Remove Keywords and Remove Skele-
ton codeEvaluation measuresAP Average PrecisionMAP Mean Average PrecisionLPM Lowest Positive MatchHFM Highest False MatchSep. SeparationMMAP Maximum Mean Average PrecisionWeighting schemes (local weight, global weight, document length normalization)txx Term frequency, none, nonetxc Term frequency, none, cosinetfx Term frequency, Idf , nonetfc Term frequency, Idf , cosinetgx Term frequency, GfIdf , nonetgc Term frequency, GfIdf , cosinetnx Term frequency,normal, nonetnc Term frequency, normal, cosinetex Term frequency, entropy, nonetec Term frequency, entropy, cosinelec log, entropy, cosinelex log, entropy, none
Table 5: List of Acronyms
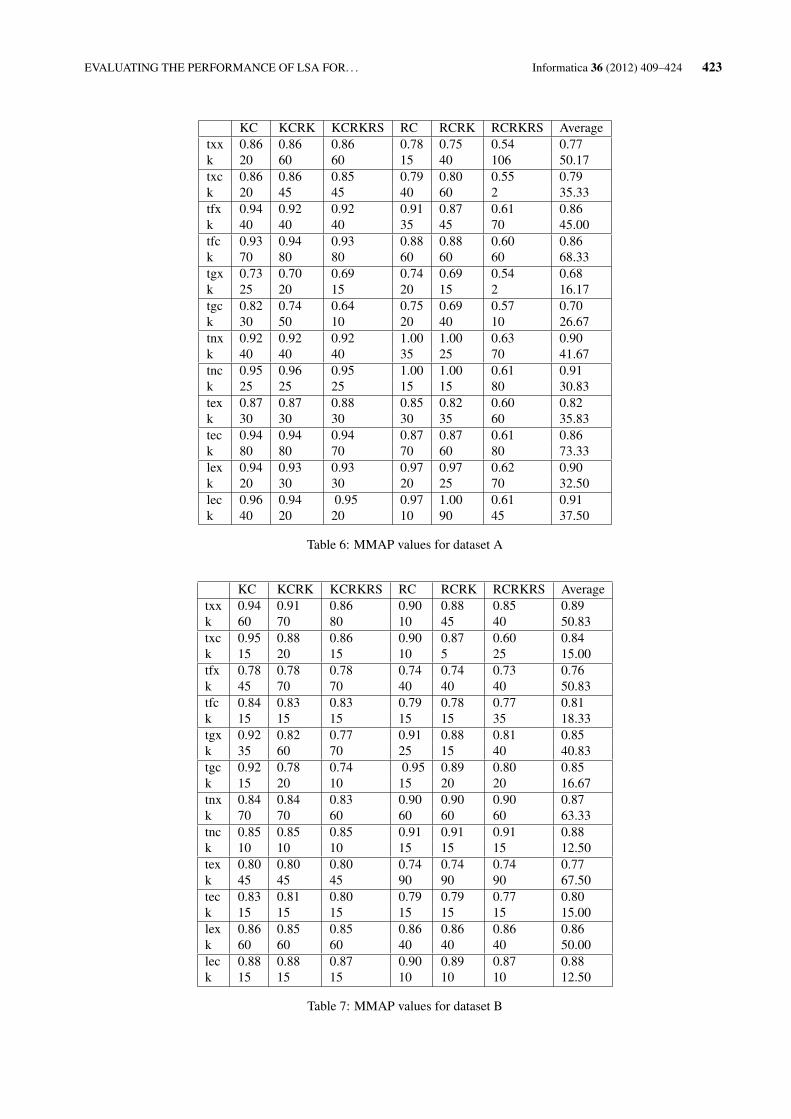
EVALUATING THE PERFORMANCE OF LSA FOR. . . Informatica 36 (2012) 409–424 423
KC KCRK KCRKRS RC RCRK RCRKRS Averagetxx 0.86 0.86 0.86 0.78 0.75 0.54 0.77k 20 60 60 15 40 106 50.17txc 0.86 0.86 0.85 0.79 0.80 0.55 0.79k 20 45 45 40 60 2 35.33tfx 0.94 0.92 0.92 0.91 0.87 0.61 0.86k 40 40 40 35 45 70 45.00tfc 0.93 0.94 0.93 0.88 0.88 0.60 0.86k 70 80 80 60 60 60 68.33tgx 0.73 0.70 0.69 0.74 0.69 0.54 0.68k 25 20 15 20 15 2 16.17tgc 0.82 0.74 0.64 0.75 0.69 0.57 0.70k 30 50 10 20 40 10 26.67tnx 0.92 0.92 0.92 1.00 1.00 0.63 0.90k 40 40 40 35 25 70 41.67tnc 0.95 0.96 0.95 1.00 1.00 0.61 0.91k 25 25 25 15 15 80 30.83tex 0.87 0.87 0.88 0.85 0.82 0.60 0.82k 30 30 30 30 35 60 35.83tec 0.94 0.94 0.94 0.87 0.87 0.61 0.86k 80 80 70 70 60 80 73.33lex 0.94 0.93 0.93 0.97 0.97 0.62 0.90k 20 30 30 20 25 70 32.50lec 0.96 0.94 0.95 0.97 1.00 0.61 0.91k 40 20 20 10 90 45 37.50
Table 6: MMAP values for dataset A
KC KCRK KCRKRS RC RCRK RCRKRS Averagetxx 0.94 0.91 0.86 0.90 0.88 0.85 0.89k 60 70 80 10 45 40 50.83txc 0.95 0.88 0.86 0.90 0.87 0.60 0.84k 15 20 15 10 5 25 15.00tfx 0.78 0.78 0.78 0.74 0.74 0.73 0.76k 45 70 70 40 40 40 50.83tfc 0.84 0.83 0.83 0.79 0.78 0.77 0.81k 15 15 15 15 15 35 18.33tgx 0.92 0.82 0.77 0.91 0.88 0.81 0.85k 35 60 70 25 15 40 40.83tgc 0.92 0.78 0.74 0.95 0.89 0.80 0.85k 15 20 10 15 20 20 16.67tnx 0.84 0.84 0.83 0.90 0.90 0.90 0.87k 70 70 60 60 60 60 63.33tnc 0.85 0.85 0.85 0.91 0.91 0.91 0.88k 10 10 10 15 15 15 12.50tex 0.80 0.80 0.80 0.74 0.74 0.74 0.77k 45 45 45 90 90 90 67.50tec 0.83 0.81 0.80 0.79 0.79 0.77 0.80k 15 15 15 15 15 15 15.00lex 0.86 0.85 0.85 0.86 0.86 0.86 0.86k 60 60 60 40 40 40 50.00lec 0.88 0.88 0.87 0.90 0.89 0.87 0.88k 15 15 15 10 10 10 12.50
Table 7: MMAP values for dataset B

424 Informatica 36 (2012) 409–424 G. Cosma et al.
KC KCRK KCRKRS RC RCRK RCRKRS Averagetxx 0.78 0.74 0.98 0.81 0.77 0.77 0.81k 15 15 35 90 80 90 54.17txc 0.81 0.76 0.96 0.82 0.78 0.78 0.82k 40 50 45 80 90 80 64.17tfx 0.65 0.65 0.91 0.71 0.71 0.70 0.72k 80 70 70 70 70 70 71.67tfc 0.73 0.71 0.94 0.75 0.70 0.69 0.75k 80 90 25 60 50 50 59.17tgx 0.72 0.71 0.93 0.73 0.69 0.64 0.74k 90 80 60 50 70 70 70.00tgc 0.75 0.74 0.92 0.74 0.69 0.67 0.75k 80 70 60 80 80 100 78.33tnx 0.83 0.79 0.95 0.82 0.80 0.79 0.83k 25 25 25 20 35 35 27.50tnc 0.84 0.82 0.97 0.88 0.85 0.85 0.87k 20 15 15 20 15 25 18.33tex 0.70 0.70 0.90 0.75 0.73 0.71 0.75k 60 90 50 70 80 80 71.67tec 0.73 0.72 0.96 0.71 0.70 0.69 0.75k 80 80 10 60 50 80 60.00lex 0.74 0.74 0.96 0.74 0.74 0.73 0.78k 20 20 25 35 60 60 36.67lec 0.78 0.77 0.93 0.78 0.78 0.75 0.80k 35 40 25 20 25 25 28.33
Table 8: MMAP values for dataset C
KC KCRK KCRKRS RC RCRK RCRKRS Averagetxx 0.80 0.77 0.75 0.83 0.80 0.79 0.79k 25 60 45 30 60 50 45.00txc 0.82 0.77 0.76 0.84 0.80 0.79 0.80k 20 20 20 30 10 10 18.33tfx 0.70 0.69 0.69 0.73 0.73 0.73 0.71k 45 40 40 25 45 45 40.00tfc 0.74 0.74 0.74 0.78 0.77 0.77 0.76k 15 15 15 25 25 25 20.00tgx 0.79 0.73 0.73 0.81 0.74 0.73 0.76k 30 25 25 35 70 25 35.00tgc 0.73 0.70 0.70 0.79 0.74 0.73 0.73k 30 30 30 10 15 15 21.67tnx 0.71 0.71 0.70 0.81 0.83 0.82 0.76k 15 20 15 10 10 10 13.33tnc 0.82 0.79 0.79 0.92 0.86 0.86 0.84k 10 15 15 5 15 15 12.50tex 0.70 0.70 0.70 0.74 0.73 0.73 0.72k 45 45 50 50 40 40 45.00tec 0.67 0.67 0.67 0.72 0.72 0.72 0.70k 10 5 15 25 25 25 17.50lex 0.64 0.65 0.65 0.70 0.72 0.72 0.68k 15 15 15 25 90 90 41.67lec 0.76 0.76 0.76 0.78 0.78 0.78 0.77k 15 15 15 20 20 20 17.50
Table 9: MMAP values for dataset D

Informatica 36 (2012) 425–429 425
A Discrete Fourier Transform Approach Searching for Compatible Sequencesand Optimal Designs
S.D. GeorgiouDepartment of Statistics andActuarial-Financial Mathematics,University of the Aegean,Karlovassi 83200, Samos, GreeceE-mail: [email protected]
K. Drosou and C. KoukouvinosDepartment of MathematicsNational Technical University of AthensZografou 15773, Athens, GreeceE-mail: [email protected], [email protected]
Keywords: linear models, optimal design, orthogonal designs, discrete Fourier transform, power spectral density, con-struction
Received: May 12, 2012
In this paper, we apply a new method of evaluating the Discrete Fourier Transform that requires signif-icantly less computational effort. In this evaluation, the Discrete Fourier Transform is defined over thesupport of the sequence of interest. The method can be applied to search for sequences with zero periodicautocorrelation function. As an example we apply the procedure and we were able to classify weighingmatrices W (2n, 9) constructed from two sequences of length n and weight (5, 4) for all 400 ≤ n ≤ 500.
Povzetek: Predstavljena je nova metoda Fourierjeve transformacije.
1 IntroductionSequences with zero or low autocorrelation function havebeen widely used in Statistics and in particular in the the-ory of optimal experimental designs. In many cases the ex-perimenter wishes to develop and study an empirical linearregression model of the form
y = Xβ + ϵ, (1)
where
y =
y1y2...yn
, X =
1 x11 · · · x1k
1 x21 · · · x2k
...1 xn1 · · · xnk
,
β =
β0
β1
...βk
, ε =
ε1ε2...εn
.
It is well known that the least square estimator for the coef-ficient vector β is β = (X′X)−1X′y with covariance ma-trix Cov(β) = σ2(X′X)−1. Orthogonality of the designmatrix X is essential to create models with optimal vari-ance. More details on linear regression analysis and opti-mal designs can be found in [2, 13]. Sequences with a zero
autocorrelation function can be used to generate orthogonaldesign matrices that achieve the optimal covariance matrixfor the estimator of β . Such sequences are also known ascompatible sequences.
Two level and three level design matrices are commonlyused for screening and weighing experiments. Recently,new methods for constructing three level screening designs,from weighing matrices, were proposed in the literature.For example, in [17] the authors used W (n, n− 1) to con-struct three-level screening designs while their results weregeneralized to the case of W (n, k) in [6]. The designs con-structed by the methods of the above papers, have theirmain effects orthogonal to each other, orthogonal to anyquadratic effects and orthogonal to any two-factors inter-actions. For quantitative factors, the linear model (1) withsuch designs can be used for screening out the main ef-fects in the presence of active second order terms, such astwo-factor interactions or pure quadratic effects, in the truemodel.
Such orthogonal designs of experiments can be easilyconstructed from sequences with zero autocorrelation func-tion. The construction of such sequences is important butthe needed computational effort is sometimes enormous,making the search for such desirable designs infeasible.Some known algorithms for developing sequences withzero autocorrelation function and the related optimal ex-

426 Informatica 36 (2012) 425–429 S.D. Georgiou et al.
perimental designs can be found in [1, 8] and the referencestherein. A method that uses the Discrete Fourier Transform(DFT) was recently developed in the literature (see [3]).
In this paper, we proposed a new evaluation of the DFTthat reduces the computational effort. This evaluation canbe used in searching for sequences with zero autocorrela-tion function. It is applicable to sequences with two, threeor more levels and the complexity of the method does notdepend on the length of the sequences but only on the num-ber of their non zero elements (weight). So, when search-ing for weighing matrices of order n and weight k, con-structed from a number of suitable circulant matrices (se-quences), the complexity depends only on k. In this way,for a fixed weight k, one may search for large optimalweighing designs. Moreover, this method can test each ofthe required sequences independently and decide whetheror not this sequence can be a candidate for a set of com-patible sequences. As an example, we apply the suggestedmethod to search for sequences with zero periodic autocor-relation function that can be used to classify a special typeof weighing matrices.
2 Preliminary ResultsA weighing matrix W = W (n, k) is a square matrix withentries 0, ±1 having k non-zero entries per row and col-umn and having zero inner product of distinct rows. HenceW satisfies WWT = kIn.. The number k is called theweight of W . Weighing matrices have long been stud-ied because of their use in weighing experiments as firststudied by Hotelling [10] and later by Raghavarao [12] andothers [1, 14].
Given a set of ℓ sequences,
A = {Aj : Aj = (aj0, aj1, ..., aj(n−1)), j = 1, . . . , ℓ},(2)
of length n, the periodic autocorrelation function (abbre-viated as PAF) PA(s) is defined, reducing i+ s modulo n,as
PA(s) =ℓ∑
j=1
n−1∑i=0
ajiaj,i+s, s = 0, 1, ..., n− 1. (3)
The set A of the above sequences is called compatibleif∑ℓ
j=1 PAj (s) = a, s = 1, 2, . . . , n − 1. Moreover, ifa = 0 then the sequences A are said to have zero periodicautocorrelation function (zero PAF).
Notation. We use the following notation throughout thispaper.
1. We use x to denote −x.
2. We use R = (rij) to denote the n × n backdiagonal matrix whose elements satisfy rij ={
1, when i+ j = n+ 10, otherwise
i, j = 1, 2, . . . , n.
3. Let A = (a0, a1, . . . , an−1) where ai ∈ {0,±1}. Thesupport of A is the set SPA = {i : ai = 0}.
The discrete Fourier transform (DFT) of a sequence B =(b0, b1, . . . , bn−1) of length n is given by
DFTB(k) = µB(k) =n−1∑i=0
biωik, k = 0, 1, ..., n− 1,
(4)where ω is the primitive n-th root of unity, e
2πin . If we
take the squared magnitude of each term in the DFT of B,the resulting sequence is called the power spectral density(PSD) of B and will be denoted by |µB(k)|2.
We make use of the following well-known theorem (see[16, chapter 10]).
Theorem 1. Let B be a sequence of length n with elementsfrom the set {0,±1}. The PSD of this sequence is equal tothe DFT of its periodic autocorrelation function:
|µB(k)|2 =n−1∑j=0
PB(j)ωjk. (5)
3 The Support Based DiscreteFourier Transform and PowerSpectral Density
The constant value of the PSD of compatible sequences canbe easily calculated using the elements of the sequences(see [3]). The following Lemma illustrates an alternativemethod for calculating this value.
Lemma 1. Let A = {Aj : Aj =(aj0, aj1, ..., aj(n−1)), j = 1, . . . , ℓ}, be a set of ℓsequences of length n, with zero periodic autocorrelationfunction. Then we have that
ℓ∑j=1
|µAj (k)|2 =
ℓ∑j=1
PAj (0) =
n−1∑i=0
ℓ∑j=1
a2ji = c.
Proof. Using equation (5) and the fact that the sequenceshave zero PAF we obtain
ℓ∑j=1
|µAj (k)|2 =ℓ∑
j=1
n−1∑s=0
PAj (s)ωsk
=n−1∑s=0
ℓ∑j=1
PAj (s)ωsk
=ℓ∑
j=1
PAj (0) +n−1∑s=1
ℓ∑j=1
PAj (s)
ωsk
=
ℓ∑j=1
PAj (0) =
n−1∑i=0
ℓ∑j=1
a2ji = c.
2
A DISCRETE FOURIER TRANSFORM APPROACH SEARCHING FOR. . . Informatica 36 (2012) 425–429 427
Thus, when searching for sequences with zero autocor-relation, it is very simple to find the constant value of thePSD since this constant will be the sum of squares of theelements of the sequences.
Let A = (a0, a1, . . . , an−1) with ai ∈ {0,±1} and letSPA be the support of A. The discrete Fourier transform(DFT) of the sequence A can be defined on SPA by
DFTA(k) = µA(k) =∑
i∈SPA
aiωik, k = 0, 1 . . . , n− 1,
(6)where ω is the primitive n-th root of unity, e
2πin .
Lemma 2. Suppose that we have a set A of compatiblesequences, as in (2), with PA(s) = a for s = 1, 2, . . . , n−1. Then
ℓ∑j=1
|µAj (k)|2 = c, (7)
where k = 0, 1, . . . n− 1 and c =
ℓ∑j=1
PAj (0)− a.
Proof. The result is a straightforward generalization of acase proved in [7] for four sequences and thus the proof isomitted. 2
Remark 1. Since |µX(k)|2 ≥ 0 and∑ℓ
j=1 |µAj (k)|2 =c we have the following. A sequence X should sat-isfy |µX(k)|2 ≤ c for all k = 0, 1, . . . , n − 1 in orderto be selected as a candidate for the compatible set A.When searching for sequences with elements from the set{−1, 0, 1} the computational effort of the PSD does notdepend on the length but only on the number of non-zeroelements (weight) of the sequence.
Example 1. Suppose we wish to search for a weighing de-sign of order 2n and weight w, constructed from two se-quences A,B of length n each and 2n ≥ w. We need 2nsummations and 2n multiplications to calculate the DFT(or the PSD) using the classic definition of DFT but onlyw summations and w multiplications are needed using thesupport based definition. If w << n then the new defini-tion is extremely fast (by comparison), while when w = nit will be shown that the needed computational effort of thePSD is reduced in half. Note that the above calculationconcerns only one candidate pair of compatible sequencesfrom the total number of possible pairs in the search space.Since the search space in such problems is huge and expo-nentially increasing with n, it is clear that any reduction inthe computational effort at each point of the search spaceresults in a huge reduction of the total computational effort(in absolute terms).
Lemma 3. Suppose we have a set A of ℓ = 2m sequencesof length n, as in (2), with elements from the set {−1, 1}and PA(s) = 0 for s = 1, 2, . . . , n− 1. Then the set
B = { B2j−1 = 12 (A2j−1 +A2j),
B2j =12 (A2j−1 −A2j), j = 1, . . . ,m
}
is a set of ℓ sequences of length n with elements from theset {−1, 0, 1} and PB(s) = 0 for s = 1, 2, . . . , n− 1. Thetotal weight of the new sequences, in B, is nm.
Remark 2. Using Lemma 3, we are able to get the ben-efits of the new definition of DFT even in the case of se-quences with elements from the set {−1, 1}. Suppose thatwe are interested in searching for four sequences with el-ements from the set {−1, 1}, zero PAF and length n. Byusing the proposed definition of DFT we need 2n summa-tions/multiplications for each evaluation of the DFT whilethe old definition of DFT requires 4n calculations. Gener-ally, each calculation of the DFT will be reduced in half.If recursively ℓ nested evaluations of the DFT are used inthe algorithm, then we have a reduction of calculation by ascale factor 1/2ℓ.
4 An Illustrating ExampleIn this section we illustrate the use of the suggested proce-dure in searching for weighing matrices constructed fromsuitable circulant matrices (sequences). The computationaladvantages of this approach, as these were discussed in theprevious section, are illustrated through numerical exam-ples. We present in details the case of weighing matricesW (2n, 9) that can be constructed from two circulants.
Weighing matrices W (2n, 9) constructed from two se-quences are of great interest but hard to find, since thenecessary conditions for their existence are not sufficient(see [9]). It is well known that if there exist a W (2n, k)constructed from two circulant matrices of order n, thenk = a2 + b2, where a and b are the row (and column)sums of A and B respectively. The next theorem givesa known construction of weighing matrices by using twosequences with elements from the set {0, 1,−1} and con-stant PSD (equivalently, by using two circulant matricesA1, A2 with elements from the set {0, 1,−1} satisfyingA1A
T1 +A2A
T2 = kI).
Theorem 2. (Geramita and Seberry (1979), Theorem4.46) If there exist two circulant matrices A1, A2 of ordern with elements from the set {0, 1,−1}, satisfying
2∑i=1
AiATi = kI,
then there exists a W (2n, k).
The construction of the corresponding weighing matrixis achieved by using either of the following two arrays
D =
(A1 A2
−AT2 AT
1
), D =
(A1 A2R
−A2R A1
).(8)
The case of weighing matrices constructed from two cir-culants A and B having (|SPA|, |SPB|) = (9, 0), whichis actually the case where a circulant weighing matrix ex-ists, was resolved in [15]. In [15] it was shown that a
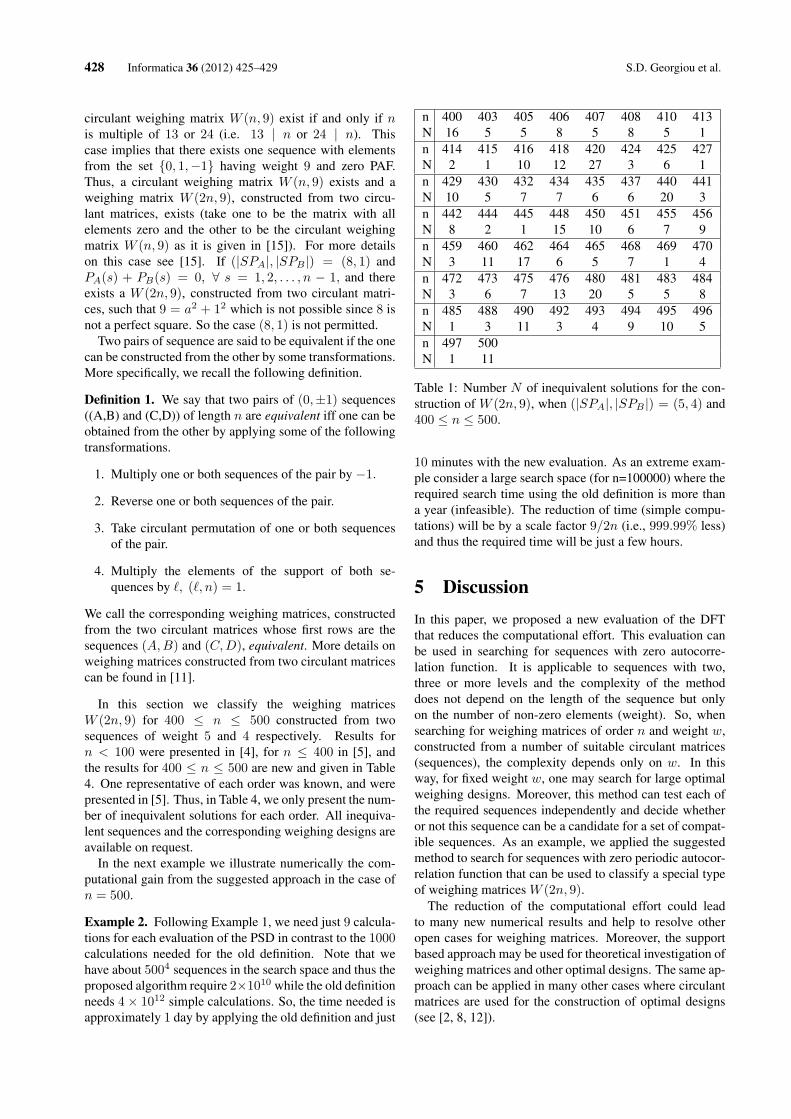
428 Informatica 36 (2012) 425–429 S.D. Georgiou et al.
circulant weighing matrix W (n, 9) exist if and only if nis multiple of 13 or 24 (i.e. 13 | n or 24 | n). Thiscase implies that there exists one sequence with elementsfrom the set {0, 1,−1} having weight 9 and zero PAF.Thus, a circulant weighing matrix W (n, 9) exists and aweighing matrix W (2n, 9), constructed from two circu-lant matrices, exists (take one to be the matrix with allelements zero and the other to be the circulant weighingmatrix W (n, 9) as it is given in [15]). For more detailson this case see [15]. If (|SPA|, |SPB |) = (8, 1) andPA(s) + PB(s) = 0, ∀ s = 1, 2, . . . , n − 1, and thereexists a W (2n, 9), constructed from two circulant matri-ces, such that 9 = a2 + 12 which is not possible since 8 isnot a perfect square. So the case (8, 1) is not permitted.
Two pairs of sequence are said to be equivalent if the onecan be constructed from the other by some transformations.More specifically, we recall the following definition.
Definition 1. We say that two pairs of (0,±1) sequences((A,B) and (C,D)) of length n are equivalent iff one can beobtained from the other by applying some of the followingtransformations.
1. Multiply one or both sequences of the pair by −1.
2. Reverse one or both sequences of the pair.
3. Take circulant permutation of one or both sequencesof the pair.
4. Multiply the elements of the support of both se-quences by ℓ, (ℓ, n) = 1.
We call the corresponding weighing matrices, constructedfrom the two circulant matrices whose first rows are thesequences (A,B) and (C,D), equivalent. More details onweighing matrices constructed from two circulant matricescan be found in [11].
In this section we classify the weighing matricesW (2n, 9) for 400 ≤ n ≤ 500 constructed from twosequences of weight 5 and 4 respectively. Results forn < 100 were presented in [4], for n ≤ 400 in [5], andthe results for 400 ≤ n ≤ 500 are new and given in Table4. One representative of each order was known, and werepresented in [5]. Thus, in Table 4, we only present the num-ber of inequivalent solutions for each order. All inequiva-lent sequences and the corresponding weighing designs areavailable on request.
In the next example we illustrate numerically the com-putational gain from the suggested approach in the case ofn = 500.
Example 2. Following Example 1, we need just 9 calcula-tions for each evaluation of the PSD in contrast to the 1000calculations needed for the old definition. Note that wehave about 5004 sequences in the search space and thus theproposed algorithm require 2×10¹⁰ while the old definitionneeds 4× 10¹² simple calculations. So, the time needed isapproximately 1 day by applying the old definition and just
n 400 403 405 406 407 408 410 413N 16 5 5 8 5 8 5 1n 414 415 416 418 420 424 425 427N 2 1 10 12 27 3 6 1n 429 430 432 434 435 437 440 441N 10 5 7 7 6 6 20 3n 442 444 445 448 450 451 455 456N 8 2 1 15 10 6 7 9n 459 460 462 464 465 468 469 470N 3 11 17 6 5 7 1 4n 472 473 475 476 480 481 483 484N 3 6 7 13 20 5 5 8n 485 488 490 492 493 494 495 496N 1 3 11 3 4 9 10 5n 497 500N 1 11
Table 1: Number N of inequivalent solutions for the con-struction of W (2n, 9), when (|SPA|, |SPB |) = (5, 4) and400 ≤ n ≤ 500.
10 minutes with the new evaluation. As an extreme exam-ple consider a large search space (for n=100000) where therequired search time using the old definition is more thana year (infeasible). The reduction of time (simple compu-tations) will be by a scale factor 9/2n (i.e., 999.99% less)and thus the required time will be just a few hours.
5 DiscussionIn this paper, we proposed a new evaluation of the DFTthat reduces the computational effort. This evaluation canbe used in searching for sequences with zero autocorre-lation function. It is applicable to sequences with two,three or more levels and the complexity of the methoddoes not depend on the length of the sequence but onlyon the number of non-zero elements (weight). So, whensearching for weighing matrices of order n and weight w,constructed from a number of suitable circulant matrices(sequences), the complexity depends only on w. In thisway, for fixed weight w, one may search for large optimalweighing designs. Moreover, this method can test each ofthe required sequences independently and decide whetheror not this sequence can be a candidate for a set of compat-ible sequences. As an example, we applied the suggestedmethod to search for sequences with zero periodic autocor-relation function that can be used to classify a special typeof weighing matrices W (2n, 9).
The reduction of the computational effort could leadto many new numerical results and help to resolve otheropen cases for weighing matrices. Moreover, the supportbased approach may be used for theoretical investigation ofweighing matrices and other optimal designs. The same ap-proach can be applied in many other cases where circulantmatrices are used for the construction of optimal designs(see [2, 8, 12]).

A DISCRETE FOURIER TRANSFORM APPROACH SEARCHING FOR. . . Informatica 36 (2012) 425–429 429
6 AcknowledgmentsWe thank the Editor and anonymous referees for their use-ful remarks which led to an improvement in the content andpreparation of the article.
References[1] Craigen, R. and Kharaghani, H. Orthogonal designs,
in: C.J. Colbourn and J.H. Dinitz (eds.), Handbookof Combinatorial Designs, 2 ed., CRC Press, BocaRaton, FL, 2007, pp. 273–280.
[2] V.V. Fedorov, Theory of Optimal Experiments, Aca-demic Press, New York, 1972.
[3] R.J. Fletcher, M. Gysin and J. Seberry, Application ofthe discrete Fourier transform, to the search for gen-eralised Legendre pairs and Hadamard matrices, Aus-tralas. J. Combin., 23 (2001), 75–86.
[4] S. Georgiou and C. Koukouvinos, New infiniteclasses of weighing matrices, Sankhya Ser. B, 64(2002), 26–36.
[5] S. Georgiou, Signed differences for weighing designs,Sankhya Ser. B, 72 (2010), 107–121.
[6] S.D. Georgiou, S. Stylianou, and M. Aggarwal, Ef-ficient three-level screening designs using weighingmatrices, (submitted).
[7] S. Georgiou, C. Koukouvinos and S. Stylianou, Ongood matrices, skew Hadamard matrices and optimaldesigns, Computational Statistics and Data Analysis,41 (2002), 171–184.
[8] A.V. Geramita, and J. Seberry, Orthogonal Designs:Quadratic Forms and Hadamard Matrices, MarcelDekker, New York, 1979.
[9] J. Horton and J. Seberry, When the necessary condi-tions are not sufficient: sequences with zero autocor-relation function, Bulletin ICA, 27 (1999), 51–61.
[10] H. Hotelling, Some improvements in weighing andother experimental techniques, Ann. Math. Stat., 16(1944), 294–300.
[11] C. Koukouvinos and J. Seberry, New weighing ma-trices and orthogonal designs constructed using twosequences with zero autocorrelation function—a re-view, J. Statist. Plann. Inference, 81 (1999), 153–182.
[12] D. Raghavarao, Constructions and CombinatorialProblems in Design of Experiments, New York, 1971.
[13] G.A.F. Seber and A.J. Lee, Linear Regression Analy-sis, Wiley, New York, 2003.
[14] J. Seberry and M. Yamada, Hadamard matrices, se-quences and block designs, in Contemporary DesignTheory—a Collection of Surveys, eds J.H. Dinitz andD.R. Stinson, Wiley, New York, 1992, pp. 431–560.
[15] Yoseph Strassler, The Classification of CirculantWeighing Matrices of Weight 9, PhD Thesis, Bar-IlanUniversity, Ramat-Gan, 1997.
[16] S.A. Tretter, Introduction to Discrete-time SignalProcessing, Wiley, New York, 1976.
[17] L. Xiao, D.K.J. Lin, and F. Bai, Constructing Defini-tive Screening Designs Using Conference Matrices,Journal of Quality Technology, 44 (2012), 2–8.

430 Informatica 36 (2012) 425–429 S.D. Georgiou et al.

Informatica 36 (2012) 431-439 431
Web GIS Albania Platform, an Informative Technology for the Albanian Territory
Medjon HysenajUniversity of Shkodër, Shkodër, AlbaniaE-mail: [email protected]
Rezarta Barjami University of Durrës, Durrës, AlbaniaE-mail: [email protected]
Keywords: GIS, technology, internet, curricula, market, economy
Received: March 11, 2012
The paper offers a detailed analysis of GIS integration as a curricula and technology in the Albanian market and institutional environment. The growing market needs for GIS utilities in Albania and the handicap, due to the lack of experts in geospatial technology constitutes a major concern. The research goal is to concentrate on the undisputed fact that the development of GIS curricula in the academicinstitutions will have an imminent impact on the integration of GIS technology in the market environment and vice versa the growing market needs for GIS specialists with increase the predisposition for a closer approach toward this technology in the academic environment. It is presented the development of a geospatial platform (Web GIS Albania) able to be managed and exploited, not only as a web mapping source of information, but also for individual scientific investigations, academic researches, business management, etc. Developing a platform such as Web GIS Albania will give a new impetus to every potential field, where geospatial technology can be integrated. It will have an imminent impact on both academic and market environment. Also it will create a new vision of managing specific issues by performing individual researches. In this paper it is presented a general overview necessary for a proper interpretation of the Web GIS Albania platform.
Povzetek: Predstavljen je albanski sistem GIS.
1 IntroductionToday, more than ever, we are living in a society where most of the decisions are based on the existence of geographic information. Maps are becoming a determinant issue with a developed ability to transform numerical and statistical information into “visual” perspective, object to a much easier analysis and manipulation process.
As in many other countries of the world, the approach toward geospatial technology has been raised to a satisfactory level in Albania in the last years, being integrated into competitive environments, educative or informative institutions, research entities, etc. However, this process requires a greater support from the state and private structures through funding and incentives regarding basically the economic aspect.
The project Web GIS Albania is a promising and demanding step towards an important change in the integration of GIS technology in Albania. Efforts are made that a large number of areas such as business, tourism, education institutions, management of natural hazards, etc, find support and incentive facilities created by this platform in many delicate and complex issues, that require effective solutions through alternatives
submission, analyzing opportunities, etc, in this way taking advantage of both from its informative character (communication) and the numerous analytical opportunities in processing and structuring geographic information.
The carried out research, unless a long-term geospatial project, aims to raise the population awareness toward the creation of a closer approach on dynamic maps and geographic information systems as a whole and as a "phenomenon" that is expanding quickly. On the other hand it is impossible to give a correct contribution into this project unless we don’t have the necessary academic preparation and the basis for a successful GIS specialist.
The role of higher education is to assist students in becoming effective thinkers with the knowledge and skills that will lead them toward becoming meaningful contributors to society "(ESRI, 2009)". Nowadays, more and more, schools are including GIS in their curricula to help their students to gain valuable background knowledge and skills which they need to face global challenges. Three are the main reasons leading to the rapid development of GIS in Albania especially in the

432 Informatica 36 (2012) 431–439 M. Hysenaj et al.
last years; education, Internet and the growing market needs for geospatial data "(Hysenaj, 2011)".
The goal of the paper is to emphasize the future GIS development policy in Albania by enforcing a strict mutual relationship between these three factors and their potential environment. For each of these categories we are going to present a full picture containing their weak and strong points.
2 GIS Education in AlbaniaGeographic Information Systems in higher education provide an integrated solution to assist faculties and students with their educational goals. The advance of GIS has opened up millions of employment opportunities. More than 3,000 colleges and universities have developed excellent courses, certificate and degree programs in GIS "(ESRI, 2010)". GIS has a vast extent starting from government level down to municipality or commune. In the state universities of Albania GIS is introduced only as a single general course called Geographical Information Systems, including this way a compressed program that many times results inadequate to be acquired by students. The main reason of this phenomenon is the fact that GIS is developed only at a single level in the Albanian Education Institutions which is the state university. The lack of the subject development at the secondary school level is the primary reason of such a handicap. The major problem is the lack of geospatial information.
In Albania only few institutions have operational GIS databases. We are facing the fact that most of geographic data is owned by private agencies for their personal needs, using inconsistent data which is mostly not updated. Inadequate development of geospatial technology is also closely connected to the evolution of computer science. In 2009, as reported in Figure 1, among 9478 students graduated in public universities, only 171 belonged to computer science profile "(INSTAT, 2012)". Still, it remains determinant the increasing role the government is playing through substantial reforms which aim to develop internet utilities in a large scale environment in Albania.
Figure 1: Computer Science attendance toward (compared) other fields.
Dealing with geospatial data is strictly connected to terrain practice. This way we can develop students concept and knowledge about GIS structure and give a sense to their theoretical conceptions. Unfortunately we have not reached this stage, which remarks us (specialists
of the field) the essential task of digitizing the Albanian territory with updated geospatial information. First of all this process needs the government enrolment which must be the primary support in fulfilling this mission basically by covering financial, logistic and technical aspect. Second it is important the collaboration between universities and private agencies offering their field experts. Actually laboratory practices are limited up to data manipulation and not data creation, which means that we do not have the proper conditions to accomplish a full map process including data collection, data processing and output.
A survey involving 1000 students was made (figure 2). The outcome of this survey intended to define the relation between their approach toward GIS utilities. These students were asked about their knowledge of GIS concept. From the results we see that 87% of them didn't know what GIS meant, 11% were familiar to the concept and only 2% of them had the chance to use GIS utilities. This is a meaningful contrast to the fact that students use GIS applications like Google Map, Google Earth, etc but are not aware of the concept of dynamic maps.
Figure 2: GIS integration into the University Environment.
According to statistics it results that among many annual conferences that take place in Albania none of them refers to Geographic Information Systems as a primary field or topic to relay on. This induce the necessity of paying greater attention by the departments in introducing step by step GIS as a modern and undisputed technology. Gradually it is necessary to start from several national conferences followed by international ones. Also another issue is the fact that students prefer to avoid GIS profile subjects as a possible theme during their master thesis defending (either professional or scientific). This is another delicate point which requires the intervention of the Ministry of Education (MASH).
3 GIS Market in AlbaniaGIS allows interactivity, querying and makes us understand better and evaluate the data by creating graphical presentation through information derived from databases "(Hysenaj, 2011)". The economic crisis that has affected the world in recent years has made it possible for many organizations to restructure their operating practices. Many of these businesses are aware of finding new ways to develop their activities, primarily

WEB GIS ALBANIA PLATFORM, AN… Informatica 36 (2012) 431–439 433
through internal sources. Now it is the time to invest in geographic information systems, a solution that has helped many organizations to overcome their operational challenges and increase profits.
According to statistics only in private universities we find 229 curricula included into different levels of programs like Bachelor, Master of Science or Professional Master. The contrast in this scenario is that during the last five years the number of private universities in Albania has increased consistently but none of them offers a GIS course.
They focus on social and economic curricula which actually are easier to integrate and adopt rather than taking the risk to involve students into a course that still suffers from government indifference in launching this “product” on the market and at the same time stimulate private companies in embracing the idea of GIS position. This scenario reflects their pessimistic point of view according to GIS technology. Their choice not to introduce GIS into their curricula makes us believe that although GIS usage has evolved and has found more space in the Albanian market than before, private university boards are still doubtful of its real capabilities and potential.
The research goal is to concentrate on the undisputed fact that the development of GIS curricula in the academic institutions will have an imminent impact on the integration of GIS technology in the market environment and vice versa the growing market needs for
Academic Institutions
4 Internet EvolutionThe evolution of GIS in Albania has been strictly connected to the evolution of Internet. The number of Internet users is an important indicator because it reflects the spread of information technology in one place and the global exchange of information "(Hafkin & Taggart, 2001)". Actually Albanian government is following a strong policy named “Albania in the age of the internet”, which aims to rank Albania among the countries with the highest internet usage in Europe. This has caused an immediate effect not only in the extend of internet distribution but also in laboratory equipments.
GIS specialists will increase the predisposition for a closer approach toward this technology in the academicenvironment (figure 3).
Up to now Albanian market has been handled from a
range of people who have been a kind of “forced-adopted” experts in an environment condition which suffered from the lack of real GIS experts. That’s why very often geospatial tasks have been performed from geographers who had little computer knowledge or computer experts who held the responsibility to manipulate and manage geographic information, producing a range of non-professional results.
Nowadays the market in Albania is eager in finding new human resources specialized in geospatial information management which can help them solve many important issues getting away from simple techniques used recently. The Digital Albania program is one of the many future projects that require GIS experts. State institutions like the prefecture, municipality, commune, private organizations and many other NGOs are more than ever aware about the great importance of dynamic mapping and satellite images, followed by the integration of these concepts and technology into the spatial decision making processes in the country.
That's why we have initiated this project with the hope of building a platform that will work not only as an informative guidance to a vast range of population, keeping simplicity and usability as primary factors, but also will be downloaded as a free software including its most recent database, containing modules that will make it much more approachable to the client eyes and to the necessities of personalizing the information according to the required tasks.
Market Request
Internet conditions such as speed, availability, price and professionalism have had a great improvement (Table 1). Almost all the secondary schools have also been equipped with new laboratories. This led to a closer approach to the internet as far as the students are concerned and online software like “Google Earth”, “Google Map”, or ESRI applications which only a couple of years ago were unknown for many people, now have turned familiar and easy to use and manage.
The World Economic Forum (WEF) has published a global report according to which Albania has improved its global ranking of The Networked Readiness Index 2012 by going 19 places upper within a year positioning itself in the 68th place and gaining the right to be part among the ten most improved countries in the NRI (Table 2).
(Internet based)
symbiotic relationship GIS Curricula GIS Technology
Figure 3: Symbiosis (GIS Curricula - GIS Technology).
2001 2002 2003 2004 2005 2006 2007 2008 2009 2010Fixed Int. sub./100 inh. 0.16 0.32 0.64 N/A N/A N/A 1.26 2.64 3.29 3.49
Note: Fixed Internet subscriptions (FIS) per 100 inhabitantsSource: International Union of Communication
Table 1: FIS Indicator.

434 Informatica 36 (2012) 431–439 M. Hysenaj et al.
This index has been calculated based on four primary sub-indexes which are: the regulatory-politic for the information technology, improvement of digital infrastructure; management of e-skills and services; using information technology by the population, business or government units; social and economic impact.
The Internet and Communication Technology sector is rapidly expanding in Albania because it is both a stand-alone sector and a cross-cutting enabling technology for other industries "(USAID, 2011)". Basically we have the necessary tools to aim at developing GIS image in the market and institutional levels.
5 Evaluation TechniqueOne of the most important advantages of using GIS technology consists in obtaining considerable amounts of information which can be subject to a better evaluation process compared to the data stored in “common“ databases. Displaying data through the exploitation of digital mapping will give us greater possibilities during the analysis and managing process. All these capabilities offered through the implementation of GIS technology combined with the “human skills“ perceptions for specific geospatial issues extend GIS potentialities beyond what most of the databases generally offer.
Below (figure 4) we are going to offer a concrete example of how expressing information through digital mapping can turn into a better solution for data authenticity. Two digital maps which presume to display
the density of the Albanian population according to the last official statistics offered by Census Albania 2011 have been presented.
The analytical process comes to be much easier and approachable from the user's side not only to distinguish but also to define the areas that need correction or the type of errors that have been made. The fact that the geographical data is expressed through digital mapping and not rough database rows increases the possibilities of perception that the map on the left is the correct one, meanwhile the one on the right contains corrupted data. The understanding of the analytical perception of the human choice for the current situation comes as a result of several factors:a) The user may have personal knowledge of the
Albanian territory b) The user may know that generally the population
trends to concentrate around the capital areas and the coastal areas and that the density gets lower moving from the center to the suburbs.
c) Generally the smaller surface areas (expressed in the map) imply higher densities.
6 Web GIS Albania PlatformBased on the recent events in Albania such as continuous floods, illegal constructions, the lack of information in business and tourism sector leading to unfair competition, educative and scientific elements, projects and platforms managed not correctly, etc it has been evaluated the possibility and the potentiality of
Figure 4: Verification of spatial issues. The density of the Albanian territory at a comparative level. Development software ArcGIS 10.1, (Data Source: INSTAT, 2011).

WEB GIS ALBANIA PLATFORM, AN… Informatica 36 (2012) 431–439 435
integrating GIS technology as an optimal solution to redirect to a well managed plan such delicate issues for the surrounding environment.
Web GIS Albania is a web mapping platform based on the combination of PHP, MySQL and Google Maps API modules. The purpose of initiating this project was to build a multi-functional system able to be exploited by a vast range of population which may not have developed computer capabilities and knowledge.
As already known one of the main directive of the European Union (EU) consists in orienting responsible authorities to develop a well managed informative and
communicative system able to act as a regulatory and instructive guidance to the population.
As a conclusion to the above mentioned notations it has been conceived to build a multifunctional platform, open-sourced (free web access and download) for a vast range of population which may not have extended computer knowledge but due to the practical and functional interface that the platform is going to develop, users will manage more effectively their specific requests and demands. This platform has been structured to act as a reliable source of information and communication that will affect directly people's decision-making process,
Figure 5: Web GIS Albania Platform v1.1
Figure 6: Flow data chart, Web GIS Albania Platform

436 Informatica 36 (2012) 431–439 M. Hysenaj et al.
raising to a higher level of professionalism the analytic process.
The main source of this platform will be a combined set of private and state institutions and organizations, but it will also be opened to any reliable entity offering consistent data and information (checked by responsible specialists).
The way how it is conceived to collect such a great amount of information is through the multi-directional replication method, which acts as a fast and effective alternative with a high security performance already tested in many global databases of maximum priority.
The schema clearly describes the fact that there are two ways the administrator can supply the platform with data in a parallel way.
Firstly, through the modules based on the geocodingservices which turns an inserted address into latitude and longitude coordinates which will be saved into a MySQL database and then retrieved as an XML file ready to be exploited as markers in the map.
Secondly, by using ArcGIS facilities like ArcMap, ArcCatalog, etc, and producing maps and statistics which will be saved into the system rough files and then retrieved as informative and indexing data for specific issues. User requirements are mutual, and each of them requires the use of one of the two types of databases contained in the platform. The geodatabase will be responsible to support detailed analysis which will lead in the generation of complex maps and diagrams.Meanwhile the web mapping database will be responsible to handle user researches through the web interface.
These databases operate independently and are not influenced by each other, and the product (output) generated by each of them serves as input to the requirements of the client.
The way the platform is conceived permits the users not only to work through the web performing researches and outputting diagrams and statistics, but also allows the
application download together with the respective database with the last updated information. The application has the front-office and the back-office layout. The front office can be managed the same way the user navigates on the web and performs researches.
The innovation of this platform is the back-office which contains a set of modules which makes the application fit to user requirements. The idea was to bring to the user a product that didn't behave strictly according to a predefined conception of managing geographical data and issues, but a product able to be adapted to the personal requirements of the client. Today more than ever through projects, tasks exchange, researches and analysis of issues, management of geographical events, etc, users require to settle the management process locally through geospatial technology such as WGA application which will increase the opportunities for further evolution through personal use.
The research process is based on the main issues and fields of interest in Albania such as natural hazards, business, tourism, institutions, etc. The research issues according to the user preferences can be deleted, modified or added as new ones. The modifications act the same with the sub-issues, research fields, marker symbols, etc.
What is most important, the application allows to add personal geographical data through an interface which converts the input address into geographical coordinates followed by extra information which in the future may be used as research elements. The application source-code will be opened to any modification. The logic of the application was to bring the user closer to the problem as much as possible, by offering several categories of structured and organized issues, which intended to reduce the distance between the application interface and the user’s knowledge in geospatial technology.
Figure 7: WGA v1.1, Module Level.
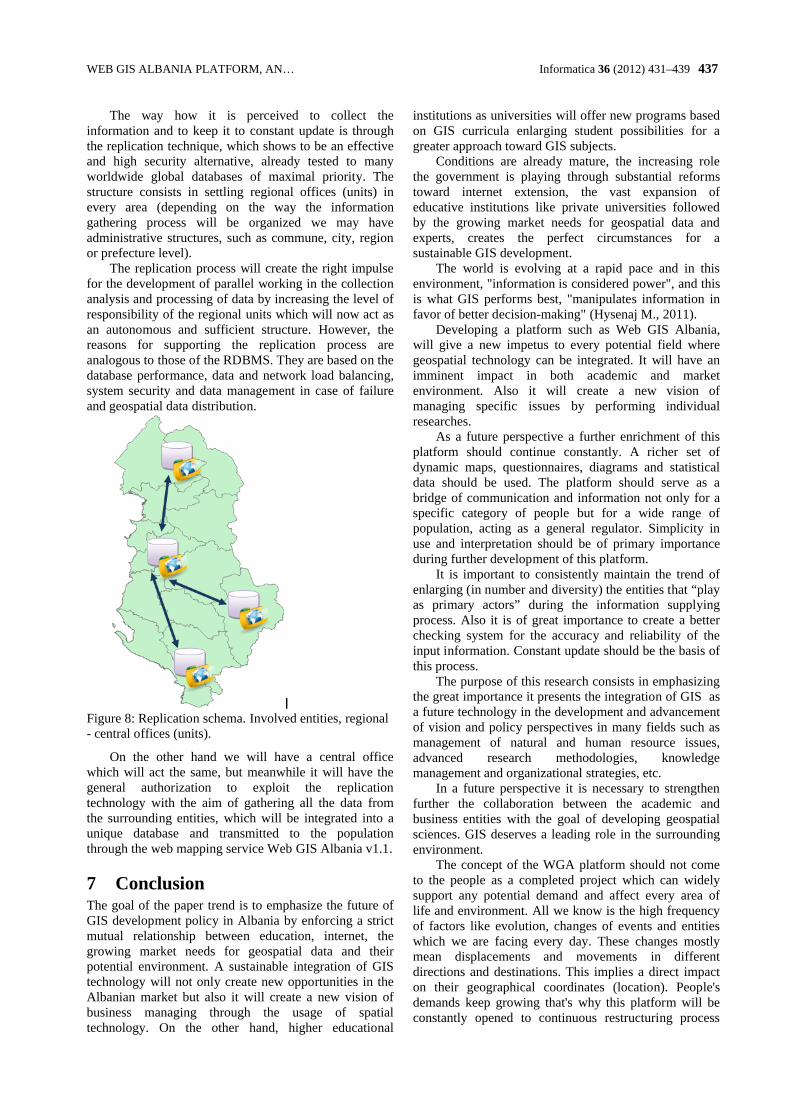
WEB GIS ALBANIA PLATFORM, AN… Informatica 36 (2012) 431–439 437
The way how it is perceived to collect the information and to keep it to constant update is through the replication technique, which shows to be an effective and high security alternative, already tested to many worldwide global databases of maximal priority. Thestructure consists in settling regional offices (units) in every area (depending on the way the informationgathering process will be organized we may have administrative structures, such as commune, city, region or prefecture level).
The replication process will create the right impulse for the development of parallel working in the collection analysis and processing of data by increasing the level of responsibility of the regional units which will now act as an autonomous and sufficient structure. However, the reasons for supporting the replication process are analogous to those of the RDBMS. They are based on the database performance, data and network load balancing, system security and data management in case of failure and geospatial data distribution.
Figure 8: Replication schema. Involved entities, regional - central offices (units).
On the other hand we will have a central office which will act the same, but meanwhile it will have the general authorization to exploit the replication technology with the aim of gathering all the data from the surrounding entities, which will be integrated into a unique database and transmitted to the population through the web mapping service Web GIS Albania v1.1.
7 ConclusionThe goal of the paper trend is to emphasize the future of GIS development policy in Albania by enforcing a strict mutual relationship between education, internet, the growing market needs for geospatial data and their potential environment. A sustainable integration of GIS technology will not only create new opportunities in the Albanian market but also it will create a new vision of business managing through the usage of spatial technology. On the other hand, higher educational
institutions as universities will offer new programs based on GIS curricula enlarging student possibilities for a greater approach toward GIS subjects.
Conditions are already mature, the increasing role the government is playing through substantial reforms toward internet extension, the vast expansion of educative institutions like private universities followed by the growing market needs for geospatial data and experts, creates the perfect circumstances for a sustainable GIS development.
The world is evolving at a rapid pace and in this environment, "information is considered power", and this is what GIS performs best, "manipulates information in favor of better decision-making" (Hysenaj M., 2011).
Developing a platform such as Web GIS Albania, will give a new impetus to every potential field where geospatial technology can be integrated. It will have an imminent impact in both academic and market environment. Also it will create a new vision of managing specific issues by performing individual researches.
As a future perspective a further enrichment of this platform should continue constantly. A richer set of dynamic maps, questionnaires, diagrams and statistical data should be used. The platform should serve as a bridge of communication and information not only for a specific category of people but for a wide range of population, acting as a general regulator. Simplicity in use and interpretation should be of primary importance during further development of this platform.
It is important to consistently maintain the trend of enlarging (in number and diversity) the entities that “play as primary actors” during the information supplying process. Also it is of great importance to create a better checking system for the accuracy and reliability of the input information. Constant update should be the basis of this process.
The purpose of this research consists in emphasizing the great importance it presents the integration of GIS as a future technology in the development and advancement of vision and policy perspectives in many fields such as management of natural and human resource issues, advanced research methodologies, knowledge management and organizational strategies, etc.
In a future perspective it is necessary to strengthen further the collaboration between the academic and business entities with the goal of developing geospatial sciences. GIS deserves a leading role in the surrounding environment.
The concept of the WGA platform should not come to the people as a completed project which can widely support any potential demand and affect every area of life and environment. All we know is the high frequency of factors like evolution, changes of events and entities which we are facing every day. These changes mostly mean displacements and movements in different directions and destinations. This implies a direct impact on their geographical coordinates (location). People's demands keep growing that's why this platform will be constantly opened to continuous restructuring process

438 Informatica 36 (2012) 431–439 M. Hysenaj et al.
involving the introduction of new modules and updating geodatabases with the last geographic data.
References[1] Hysenaj, M. (2011). Geographical Information
Systems, Shkodër, Albania.[2] Johansson, T. (2010). GIS in Teacher Education -
Facilitating GIS Applications in Secondary School Geography, pp. 66-67.
[3] Tempus (2010). Final Report: Higher Education in Albania, pp. 23-27.
[4] Open Data Albania (January 15, 2012)., http://open.data.al.
[5] Institute of Statistics Albania (January 23, 2012)., http://www.instat.gov.al/.
[6] Cabuk A., Ayday, C. (2004). GIS Education in Turkey, pp. 90-91. Kerski J. (2008). Developments in Technologies and Methods in GIS In Education, pp. 35-38.
[7] Nikolli, P., Idrizi, B. (2007). Geodetic and Cartographic Education in Albania.
[8] Nikolli, P., Idrizi, B. (2011). GIS Education in Albania.
[9] ESRI (2009). GIS in Education, http://www.eagle.co.nz/GIS/Training/GIS-in-Education.
[10] ESRI (2010). Education and Science,http://www.gis.com/content/education-and-science.
[11] USAID (2011)., http://www.rritjealbania.com.[12] Hafkin, N. & Taggart, N. (2001). Gender,
Information Technology, and Developing Countries.
[13] Michael Parma, April 2009, Lessons Learned with Geodatabase Replication, Teksas.
[14] Google API team, August 2009, Creating a Store Locator with PHP, MySQL & Google Maps.
[15] Open Source Geo - GeoJason, October 2011, Line Length and Polygon Area With Google Maps API V3,.
[16] ESRI, 2007, Geodatabase Replication: An overview,.
[17] Jacobson, Robert (1995). The GIS Networker.[18] The Geodatabase: Modeling and Managing Spatial
Data". ESRI. 2009. Retrieved 2010-11-12. "Prior to ArcGIS 9.2, ArcSDE was a stand-alone software product. At the ArcGIS 9.2 release, ArcSDE was integrated into both ArcGIS Desktop and ArcGIS Server."
[19] ESRI. Retrieved, 2012-03-17, Geodatabase (web page), ArcSDE Technology (subtitle)"..
[20] Elmasri and Navathe, 2004, Fundamentals of Database Systems, Addison Wesley, New York.
[21] Internet World stats, June 2010, Albania: Internet Usage Stats and Telecom Reports, http://www.internetworldstats.com/euro/al.htm.
[22] Un-Spider Newsletter, January 2010, Case Study: A ZKI Rapid Mapping Activation after heavy floods hit Albania, , Vol. 1/10.
[23] National Agency of Natural Resources, February 2009, World Energy Council Europe Regional Meeting, Brussels.
[24] CEZ.: www.cez.al/ : access: 20 December 2011.[25] IFRC.: Albania Floods 2010, www.ifrc.org/
docs/appeals/10/MDRAL002dpfr.pdf[26] OJL 288, 2007. Directive 2007/60/EC of the
European Parliament and of the Council of 23 October 2007 on the assessment and management of flood risks.
[27] Flood extend in Albania, January 11, 2010 ENVISAT ASAR (http://www.zkl.dlr.de).
AppendixDynamic indexing and structuring maps acting as models for the Albanian territory, Development software Web GIS Albania.
Figure 9: Active Economic Entities 2011-2012, Albania [Business Sector].
Figure 10: Turistic Entities (Hotels, Restaurant, Bars) 2011-2012, Albania [Business Sector]

WEB GIS ALBANIA PLATFORM, AN… Informatica 36 (2012) 431–439 439
Figure 11: Region of Shkodra, Northwestern part of Albania, Flooded areas period (December-January 2010) (hectare land), Commune level, [Natural Hazards Sector]
Figure 12: Surfaces covered by snow precipitation, Albania 10 February 2012, [Natural Hazards Sector]
Figure 13: Development of Transport and Communications Sector 2011-2012, Albania [Transport Sector]
Figure 14: Farming and fishing activities, Albania, [Agriculture Sector]

440 Informatica 36 (2012) 431–439 M. Hysenaj et al.

Informatica 36 (2012) 441–449 441
NLP Web Services for Slovene and English: Morphosyntactic Tagging, Lemmatisation and Definition Extraction
Senja Pollak, Nejc Trdin, Anže Vavpetič and Tomaž Erjavec Jožef Stefan Institute, Jamova cesta 39, 1000 Ljubljana, SloveniaE-mail: {senja.pollak, nejc.trdin, anze.vavpetic, tomaz.erjavec}@ijs.si
Keywords: web services, workflows, morphosyntactic tagging, lemmatisation, definition extraction
Received: November 30, 2012
This paper presents a web service for automatic linguistic annotation of Slovene and English texts. The web service enables text up-loading in a number of different input formats, and then converts, tokenises, tags and lemmatises the text, and returns the annotated text. The paper presents the ToTrTaLeannotation tool, and the implementation of the annotation workflow in two workflow construction environments, Orange4WS and ClowdFlows. It also proposes several improvements to the annotation tool based on the identification of various types of errors of the existing ToTrTaLe tool, and implements these improvements as a post-processing step in the workflow. The workflows enable the users to incorporate the annotation service as an elementary constituent for other natural language processing workflows, as demonstrated by the definition extraction use case.
Povzetek: Prispevek predstavi spletni servis ToTrTaLe za jezikoslovno označevanje slovenskega in angleškega jezika, njegovo implementacijo v okoljih za gradnjo delotokov Orange4WS in ClowdFlowster njegovo uporabo v delotoku za luščenje definicij.
1 IntroductionIn natural language processing (NLP), the first steps to be performed on the input text are tokenisation, part-of-speech tagging and lemmatisation. The output of these three steps is a string of text tokens, where each wordtoken is annotated with its context disambiguated part-of-speech tag and the base form of the word, i.e. lemma,thus abstracting away from the variability of word-forms. For example, the Slovene sentence “Hotel je dober hotel” (“[He] wanted a good hotel”) can be lemmatised and tagged as “hoteti/Verb biti/Verb dober/Adjective hotel/Noun”; as can be seen, the first and last word tokens are the same, yet their part of speech and lemma differ.
Such annotation is very useful for further processing, such as syntactic parsing, information extraction, machine translation or text-to-speech, to mention just a few. However, all three processing steps (tokenisation, part-of-speech tagging and lemmatisation) are language dependent, and software to perform them is—especially for smaller languages—often not available or difficult to install and use.
Recently, there has been an upsurge of interest in workflow construction environments, the best known being Taverna (Hull et al., 2006) developed for workflow composition and execution in the area of bioinformatics. In such workflow environments it is not necessary to locally install a tool used as a workflow ingredient, but rather use web services available elsewhere, and link them together into workflows. This frees the users from installing the needed tools (which might not be available for downloading in any case) and, indeed, from needing high-end computers to perform computationally
demanding processing over large amounts of data. While online workflow construction tools are already widely used in some domains, this approach has only recently started being used also in the field of NLP (Pollak et al., 2012a).
This paper, extending our previous work on this topic (Pollak et al., 2012b), focuses on a particular tool for automatic morphosyntactic tagging and lemmatisation, named ToTrTaLe (Erjavec, 2011), currently covering two languages, Slovene and English. Its description is presented in Section 2. As one of the main contributions of this work is the implementation of ToTrTaLe as a web service which can be used as an ingredient of complex NLP workflows, we first motivate this work in Section 3 by a short introduction to web services and workflows and by presenting two specific workflow construction environments, Orange4WS (Podpečan et al., 2012) and ClowdFlows (Kranjc et al., 2012). The main contributions of this research are presented in Sections 4 and 5. Section 4 presents the implementation of the ToTrTaLe analyser as a web service in the two workflow construction environments,while Section 5 presents some improvements of the ToTrTaLe tool based on the identification of several types of errors of the existing implementation. The utility of the ToTrTaLe web service as a pre-processing step for other NLP tasks is illustrated by a definition extraction use case in Section 6. Finally, Section 7 gives conclusions and directions for further work.

442 Informatica 36 (2012) 441–449 S. Pollak et al.
2 ToTrTaLe Annotation ToolToTaLe (Erjavec et al., 2005) is short for Tokenisation, Tagging and Lemmatisation and is the name of a script implementing a pipeline architecture comprising these three processing steps. While the tool makes some language specific assumption, they are rather broad, such as that text tokens are (typically) separated by space; otherwise, the tool itself is largely language independent and relies on external modules to perform the specific language processing tasks. The tool is written in Perl and is reasonably fast. The greatest speed bottleneck is the tool start-up, mostly the result of the lemmatisation module, which for Slovene contains thousands of rules and exceptions.
In the context of the JOS project (Erjavec et al., 2010) the tool was re-trained for Slovene and made available as a web application1. It allows pasting theinput text into the form or uploading it as a plain-text UTF-8 file, while the annotated output text can be either displayed or downloaded as a ZIP file.
The tool (although not the web application) has been recently extended with another module, Transcription, and the new edition is called ToTrTaLe (Erjavec, 2011). The transcription step is used for modernising historical language (or, in fact, any non-standard language), and the tool was used as the first step in the annotation of a reference corpus of historical Slovene (Erjavec, 2012a). An additional extension of ToTrTaLe is the ability to process heavily annotated XML document conformant to the Text Encoding Initiative Guidelines (TEI, 2007).
The rest of this section presents the main modules of ToTrTaLe and their models for Slovene and English, leaving out the description of the historical language models which are out of the main scope of this paper.
2.1 TokenisationThe multilingual tokenisation module mlToken2 is written in Perl and in addition to splitting the input string into tokens also assigns to each token its type, e.g., XML tag, sentence final punctuation, digit, abbreviation, URL, etc. and preserves (subject to a flag) white-space, so that the input can be reconstituted from the output.Furthermore, the tokeniser also segments the input text into sentences.
The tokeniser can be fine-tuned by putting punctuation into various classes (e.g., word-breaking vs. non-breaking) and also uses several language-dependent resource files: a list of abbreviations (“words” ending in period, which is a part of the token and does not necessarily end a sentence); a list of multi-word units (tokens consisting of several space-separated “words”); and a list of (right or left) clitics, i.e. cases where one “word” should be treated as several tokens. Such resource files allow for various options to be expressed, although not all, as will be discussed in Section 5.
1 The application is available at http://nl.ijs.si/jos/analyse/2 mlToken was written in 2005 by Camelia Ignat, then
working at the EU Joint Research Centre in Ispra, Italy.
The tokenisation resources for Slovene and English were developed by hand for both languages.
2.2 TaggingPart-of-speech tagging is the process of assigning a word-level grammatical tag to each word in running text, where the tagging is typically performed in two steps: the lexicon gives the possible tags for each word, while the disambiguation module assigns the correct tag based on the context of the word.
Most contemporary taggers are trained on manually annotated corpora, and the tagger we use, TnT (Brants, 2000), is no exception. TnT is a fast and robust tri-gram tagger, which is also able, by the use of heuristics over the words in the training set, to tag unknown words with reasonable accuracy.
For languages with rich inflection, such as Slovene, it is better to speak of morphosyntactic descriptions (MSDs) rather than part-of-speech tags, as MSDs contain much more information than just the part-of-speech. For example, the tagsets for English have typically 20–50 different tags, while Slovene has over 1,000 MSDs.
For Slovene, the tagger has been trained on jos1M, the 1 million word JOS corpus of contemporary Slovene (Erjavec et al., 2010), and is also given a large background lexicon extracted from the 600 million word FidaPLUS reference corpus of contemporary Slovene (Arhar Holdt and Gorjanc, 2007).
The English model was trained on the MULTEXT-East corpus (Erjavec, 2012b), namely the novel “1984”. This is of course a very small corpus, so the resulting model is not very good. However, it does have the advantage of using the MULTEXT-East tagset, which is compatible with the JOS one.
2.3 LemmatisationFor lemmatisation we use CLOG (Erjavec and Džeroski, 2004), which implements a machine learning approach to the automatic lemmatisation of (unknown) words. CLOG learns on the basis of input examples (pairs word-form/lemma, where each morphosyntactic tag is learnt separately) a first-order decision list, essentially a sequence of if-then-else clauses, where the defined operation is string concatenation. The learnt structures are Prolog programs but in order to minimise interface issues we made a converter from the Prolog program into one in Perl.
The Slovene lemmatiser was trained on a lexicon extracted from the jos1M corpus. The lemmatisation of language is reasonably accurate, with 92% on unknown words. However the learnt model, given that there are 2,000 separate classes, is quite large: the Perl rules have about 2MB, which makes loading the lemmatiser slow.
The English model was trained on the English MULTEXT-East corpus, which has about 15,000 lemmas and produces a reasonably good model, especially as English is fairly simple to lemmatise.

NLP WEB SERVICES FOR SLOVENE AND… Informatica 36 (2012) 441–449 443
3 Web Services and WorkflowsA web service is a method of communication between two electronic devices over the web. The W3C defines a web service as “a software system designed to supportinteroperable machine-to-machine interaction over a network”. Web service functionalities are described in a machine-processable format, i.e. the Web Services Description Language, known by the acronym WSDL. Other systems interact with the web service in a manner prescribed by its description using SOAP XML messages, typically conveyed using HTTP in conjunction with other web-related standards. The W3C also states that we can identify two major classes of web services, REST-compliant web services, in which the primary purpose of the service is to manipulate XML representations of web resources using a uniform set of "stateless" operations, and arbitrary web services in which the service may expose an arbitrary set of operations.
Main data mining environments that allow for workflow composition and execution, implementing the visual programming paradigm, include Weka (Witten et al., 2011), Orange (Demšar et al., 2004), KNIME (Berthold et al., 2007) and RapidMiner (Mierswa et al., 2006). The most important common feature is the implementation of a workflow canvas where workflows can be constructed using simple drag, drop and connect operations on the available components, implemented as graphical units named widgets. This feature makes the platforms suitable for use also by non-experts due to the representation of complex procedures as relatively simple sequences of elementary processing steps (workflow components implemented as widgets).
In this work, we use two recently developed service-oriented environments for data mining workflow construction and execution: Orange4WS and ClowdFlows, the latter being a web environment, which is not the case for the first one.
3.1 The Orange4WS platformThe first platform, Orange4WS (Podpečan et al., 2012),is a data mining platform distinguished by its capacity of including web services into data mining workflows,allowing for distributed processing. Such a service-oriented architecture has already been employed in Taverna (Hull et al., 2006), a popular platform for biological workflow composition and execution. Using processing components implemented as web services enables remote execution, parallelisation, and high availability by default. A service-oriented architecture supports not only distributed processing but also distributed development.
Orange4WS is built on top of two open source projects: (a) the Orange data mining framework (Demšar et al., 2004), which provides the Orange canvas for constructing workflows as well as core data structures and machine learning algorithms, and (b) the Python Web Services project3 (more specifically, the Zolera
3 http://pywebsvcs.sourceforge.net/
SOAP infrastructure), which provides the libraries for developing web services in the Python programming language.
Furthermore, in contrast with other workflow environments Orange4WS offers a rather unique combination of features, mainly: A large collection of data mining and machine
learning algorithms, A collection of powerful yet easy to use
visualization widgets and Easy extendibility either in Python or C++ due to
layered architecture of the Orange environment.
Unlike ClowdFlows (as will be explained in the next section) the user is required to install Orange4WS on her own machine in order to create and execute workflows. Furthermore, local widgets (widgets that are not implemented as web services) are executed on the client’s computer, thus using its computational resources, which can quickly become a problem when solving more complex tasks.
3.2 The ClowdFlows platformThe second platform ClowdFlows (Kranjc et al., 2012) is distinguished from other main data mining platforms especially by the fact that it requires no installation from the user and can be run on any device with an internet connection, using any modern web browser.Furthermore, ClowdFlows also natively supportsworkflow sharing between users.
Sharing of workflows has previously been implemented through the myExperiment website of Taverna (Hull et al., 2006). This website allows the users to publicly upload their workflows so that they are made available to a wider audience. Furthermore, publishing a link to a certain workflow in a research paper allows for simpler dissemination of scientific results. However, the users who wish to view or execute these workflows are still required to install the specific software in which the workflows were designed and implemented.
ClowdFlows is implemented as a cloud-based application that takes the processing load from the client's machine and moves it to remote servers where experiments can be run with or without user supervision. ClowdFlows consists of the browser-based workflow editor and the server-side application which handles the execution of workflows and hosts a number of publicly available workflows.
The workflow editor consists of a workflow canvas and a widget repository, where widgets represent embedded chunks of software code. The widgets are separated into categories for easier browsing and selection and the repository includes a wide range of readily available widgets. Our NLP processing modules have also been implemented as such widgets.
By using ClowdFlows we were able to make our NLP workflow public, so that anyone can use and execute it. The workflow is exposed by a unique URL, which can be accessed from any modern web browser. Whenever the user opens a public workflow, a copy of

444 Informatica 36 (2012) 441–449 S. Pollak et al.
this workflow appears in her private workflow repository. The user can execute the workflow and view its results or expand it by adding or removing widgets.
4 Implementation of the ToTrTaLe Web Service and Workflows
In this section we present two web services that we implemented and also some details regarding the implementations. The services were implemented in the Python programming language, using Orange4WS API and additional freeware software packages used forenabling different input types. Services are currently adapted to run on Unix-like operation systems, but are easily transferable to other operation systems. In addition, the workflows constructed using these web services are also presented.
4.1 Implemented web serviceThe implemented web service constitutes the main implementation part of this work. The web service hastwo functionalities: the first converts different input files to plain text format, while the second uses the ToTrTaLetool to annotate input texts. The two functionalitiescorrespond to two operations described in one WSDL file. In this section we give the descriptions of both functionalities, together with some implementation details.
4.1.1 Converting input files to plain textThe first operation of the web service parses the input files and converts them into plain text. The input corpusfile can be uploaded in various formats, either as a single file or as several files compressed in a single ZIP file. The supported formats are PDF, DOC, DOCX, TXT and HTML, the latter being passed to the service in the form of an URL as a document. Before being transferred, theactual files are encoded in the Base64 representation, since some files might be binary files. So the first step is to decode the Base64 representation of the document.
Based on the file extension, the program chooses the correct converter: If the file extension is HTML, we assume that an
URL address is passed and that it is written in the document variable. It is also assumed that the document contains only plain text. The web service then downloads the document via the given URL in plain text.
DOCX Microsoft Word documents are essentially compressed ZIP files containing the parts of the document in XML. The content of the file is first unzipped, and then all the plain text is extracted.
DOC Microsoft Word files are converted using an external tool, wvText (Lachowicz and McNamara, 2006), which transforms the file into plain text. The tool is needed because the whole file is a compiled binary file and it is hard to manually extract the contents without appropriate tools.
PDF files are converted with the Python pdfminer library (Shinyama, 2010). The library is a very good implementation for reading PDF files, with which one can extract the text, images, tables, etc., from a PDF file.
If the file name ends with TXT, then the file is assumed to be already in plain UTF-8 text format.The file is only read and sent to the output.
ZIP files are extracted into a flat directory and converted appropriately—as above—based on the file extension. Note that ZIP files inside ZIP files are not permitted.
The resulting text representation is then sent through several regular expression filters, in order to further normalize the text. For instance, white space charactersare merged into one character.
The final step involves sending the data. But before that, the files have their unique identifiers added to the beginning of the single plain text file. The following steps leave these identifiers untouched, so the analysis can be traced through the whole workflow. At each step of the web service process, errors are accumulated in the error output variable.
4.1.2 Tokenisation, tagging and lemmatisationThe second operation of the web service exposes the ToTrTaLe annotation tool. The mandatory parameters of this operation are: the document in plain text format andthe language of the text (English, Slovene or historical Slovene). Non-mandatory parameters are used to determine whether the user wants post-processing(default is no), and whether the output should be in the XML format (default) or in the plain text format.
Both Orange4WS and ClowdFlows send the data and the processing request to the main web service operation, i.e. ToTrTaLe annotation, which is run on a remote server. The output is written into the output variable, and the possible errors are passed to the error variable. Additionally, the input parameter for post-processing defines if the post-processing scripts are run on the text. The post-processing scripts are Perl implementations of corrections for tagging mistakes described in Section 5.
Finally, the output string variable and the accumulated errors are passed on to the output of the web service, which is then sent back to the client.
4.1.3 Implemented widgetsOrange4WS and ClowdFlows can automatically construct widgets for web services, where each operation maps into one widget (thus, the web service described in this paper maps into two widgets). They identify the inputs and the outputs of the web service’s operationsfrom the WSDL description. In addition to implementing the web service operations described above, additional functionality was required to adequately support the user in using this web service and some additional platform specific widgets were implemented accordingly. These widgets, not exposed as web services, are run locally; in the case of Orange4WS they are executed on the user’s

NLP WEB SERVICES FOR SLOVENE AND…
machine, whereas in the case of ClowdFlows they are executed on the server hosting the ClowdFlows application.
Both in Orange4WS as well as in ClowdFlows, we implemented a widget called “Load Corpus” that opens a corpus in one of the formats supported by the webservice for parsing input data, andservice’s operation for converting input dataessentially read the user selected files, encode them in Base64 and send the file to the web service. Widgets return the output produced by the web service.
4.2 ToTrTaLe workflowsThe widgets implementing the existing components are incorporated into the workflows presented in Figure 1 and Figure 2. The figuresthe implementation of the web service is platformindependent. In both figures the same workflow is
Figure 1: A screenshot of the
Figure 2: A screenshot of the
NLP WEB SERVICES FOR SLOVENE AND… Informatica
machine, whereas in the case of ClowdFlows they are ing the ClowdFlows
as well as in ClowdFlows, we implemented a widget called “Load Corpus” that opens a
supported by the webinternally calls the
for converting input data. Theyread the user selected files, encode them in
Base64 and send the file to the web service. Widgets return the output produced by the web service.
The widgets implementing the existing software components are incorporated into the workflows
The figures show that service is platform-
the same workflow is
shown: Figure 1 shows the workflow in the platform and Figure 2 the workflow in theplatform. On the left side of both figures, there is a widget repository, and the right side used for workflow constructionservice widgets, the workflowgeneral-purpose widgets (e.g., file reading, file writing, construction of strings).
The purpose of both workflows is essentially the same: they accept a file and read the file. Then the file is parsed from its original form into the prepresentation of the file by the “Load corpus” widgetAfter the parsing of the file, the plain text representation is input into the ToTrTaLe widgetthe annotated file in plain textaccording to one of the input parameters. The final file can be viewed in the rightmost widget (String to file) of the corresponding workflows.
A screenshot of the ToTrTaLe workflow in the Orange4WS workflow edit
A screenshot of the the ToTrTaLe workflow in the ClowdFlows workflow editor,available online at http://clowdflows.org/workflow/228/
Informatica 36 (2012) 441–449 445
Figure 1 shows the workflow in the Orange4WS the workflow in the ClowdFlows
. On the left side of both figures, there is a widget repository, and the right side presents the canvas
workflow construction. Apart from our web the workflows contain also some
purpose widgets (e.g., file reading, file writing,
The purpose of both workflows is essentially the same: they accept a file and read the file. Then the file is parsed from its original form into the plain text
by the “Load corpus” widget. After the parsing of the file, the plain text representation
widget. The widget returns plain text or XML representation
input parameters. The final file can be viewed in the rightmost widget (String to file) of
workflow editor.
workflow editor,http://clowdflows.org/workflow/228/.

446 Informatica 36 (2012) 441–449
There is also a minor difference in the workflows presented in Figures 1 and 2: the Orange4WS workflow has more widgets than the ClowdFlows workflow. This is due to the fact that widgets for Orange4WS were implemented to accept input data from other widgets (String widget, Boolean widget, etc.), whereas the widgets for ClowdFlows were implemented to accept inputs directly as parameters (by double clicking on the widget).
The sample output produced by either of the two workflows is shown in Figure 3. The figure shows the function of each token, the sentence splitter tags and also the morphosyntactic annotation of each token. The final output is in the form of plain text, where the input to the workflow was a Slovene PDF file.
Figure 3: A sample output from the ToTrTaLeservice, annotating sentences and toand MSD tags on words.
5 Improving ToTrTaLe TPost-processing based on the Analysis of Annotation
In this section we present the observed ToTrTaLe mistakes, focusing on Slovene, and propose some corrections to be performed in the postThe corpus used for the analysis consists of the papers of seven consecutive proceedings of Language Technology conferences, held between 1998 and 2010. Tconstruction of the corpus is described in Smailović and Pollak (2011).
5.1 Incorrect sentence segmentationErrors in sentence segmentation originate mostly from the processing of abbreviations. Since the analysed examples were taken from academicabbreviations leading to incorrect separatare frequent.
In some examples the abbreviations contain theperiod that is—if the abbreviation is not listed in the
is also a minor difference in the workflows the Orange4WS workflow
has more widgets than the ClowdFlows workflow. This is due to the fact that widgets for Orange4WS were implemented to accept input data from other widgets
ring widget, Boolean widget, etc.), whereas the widgets for ClowdFlows were implemented to accept inputs directly as parameters (by double clicking on the
The sample output produced by either of the two workflows is shown in Figure 3. The figure clearly shows the function of each token, the sentence splitter
morphosyntactic annotation of each token. The final output is in the form of plain text, where the input to the workflow was a Slovene PDF file.
A sample output from the ToTrTaLe web service, annotating sentences and tokens, with lemmas
Improving ToTrTaLe Through processing based on the
nnotation MistakesIn this section we present the observed ToTrTaLe
and propose some corrections to be performed in the post-processing step.
consists of the papers of roceedings of Language Technology between 1998 and 2010. The
construction of the corpus is described in Smailović and
Incorrect sentence segmentationErrors in sentence segmentation originate mostly from the processing of abbreviations. Since the analysed examples were taken from academic texts, specific
leading to incorrect separation of sentences
ples the abbreviations contain theif the abbreviation is not listed in the
abbreviation repository—automatically interpreted as the end of the sentence. For instance, frequently used in referring to other authors in academic writing therefore incorrectly sentence, and the year of the publication istreated by ToTrTaLe as the start of ais now corrected in ToTrTaLe post
Note, however, that the period after the abbreviation does not always mean that continues. This is the case when at the end of the sentence (“ipin this position). Consequently, in some casessentences are mistakenly tagged sentence. This mistake was also observed with the abbreviations EU or measures KB, MB, GB if at the last position of the sentence
5.2 Incorrect morphosyntactic annotationsThe tagging also at times makes mistakes, occur systematically. One example is in subject complement structures. For instancesentence “Kot podatkovne strukture so semantične mreže usmerjeni grafi.” [As data structures semantic networks are directed graphs.], the nominative plural feminine “semantične mreže” [semantic networks] is wrongly annotated as singular genitive feminine.
Another frequent type of mistake, easy to correct, is unrecognized gender/number/case agreement between adjective and noun in noun phrases. For example, sentence “Na eni strani imamo semantične leksikone [On the one hand we have “semantične” [semantic] is assigned a feminine plural nominative MSD, while “leksikone” [lexicons] is attributed a masculine plural accusative tag.
Next, in several examples, “sta” (second person, dual form of verb “to be”) is tagged as a noun. Even if “STcan be used as an abbreviation (when written with capital letters), it is much more frequent as the wordauxiliary verb.
5.3 Incorrect lemmatisationBesides the most common error of wrong lemmatisation of individual words (e.g.,lemmatised as “hipernimi” [hypernyms] and not as “hipernimija” [hypernymy]), there are systematic errors when lemmatising Slovene adjectives in comparative and superlative form, where the base form is not chosen as a lemma. Last but not least, there ain the original text and due to
5.4 ToTrTaLe post-processingThe majority of the described mistakes are currently handled in an optional post-processing step, but shouldbe taken into consideration in future veToTrTaLe, by improving tokenisation rules or changing the tokeniser, re-training the tagger with larger and better corpora and lexica, and improving the lemmatisation models or learner.
S. Pollak et al.
automatically interpreted as the For instance, abbreviation “et al.”,
frequently used in referring to other authors in academic writing therefore incorrectly implies the end of the
year of the publication is mistakenly treated by ToTrTaLe as the start of a new sentence. This is now corrected in ToTrTaLe post-processing.
the period after the abbreviation s mean that the sentence actually
continues. This is the case when an abbreviation occurs “ipd.”, “itd.”, “etc.” are often
Consequently, in some cases two sentences are mistakenly tagged by ToTrTaLe as a single sentence. This mistake was also observed with the abbreviations EU or measures KB, MB, GB if occurring
tion of the sentence just before the period.
Incorrect morphosyntactic annotationsThe tagging also at times makes mistakes, some of which occur systematically. One example is in subject complement structures. For instance, in the Slovene
“Kot podatkovne strukture so semantične mreže usmerjeni grafi.” [As data structures semantic networks
the nominative plural feminine “semantične mreže” [semantic networks] is wrongly annotated as singular genitive feminine.
frequent type of mistake, easy to correct, is unrecognized gender/number/case agreement between
and noun in noun phrases. For example, in the “Na eni strani imamo semantične leksikone …”
[On the one hand we have semantic lexicons...], semantične” [semantic] is assigned a feminine plural
nominative MSD, while “leksikone” [lexicons] is attributed a masculine plural accusative tag.
Next, in several examples, “sta” (second person, dual form of verb “to be”) is tagged as a noun. Even if “STA” can be used as an abbreviation (when written with capital letters), it is much more frequent as the word-form of the
Incorrect lemmatisationBesides the most common error of wrong lemmatisation
e.g., “hipernimija” being lemmatised as “hipernimi” [hypernyms] and not as “hipernimija” [hypernymy]), there are systematic errors when lemmatising Slovene adjectives in comparative and superlative form, where the base form is not chosen as a lemma. Last but not least, there are typographic mistakes
end-of-line split words.
rocessingThe majority of the described mistakes are currently
processing step, but shouldbe taken into consideration in future versions of ToTrTaLe, by improving tokenisation rules or changing
training the tagger with larger and better corpora and lexica, and improving the lemmatisation

NLP WEB SERVICES FOR SLOVENE AND… Informatica 36 (2012) 441–449 447
In the current post-processing implementation we added a list of previously unrecognized abbreviations (such as “et al.”, “in sod.”, “cca.”) to avoid incorrect redundant splitting of the sentence.
We corrected the wrongly merged sentences by splitting them into two different sentences if certain abbreviations (such as “etc.”) are followed by an upper-case letter in the word following the abbreviation.
Other post-processing corrections include the correction of adjective-noun agreement, where we assume that the noun has the correct tag and the preceding adjective takes its properties.
Some other individual mistakes are treated in the post-processing script, but not all the mistakes have been addressed.
6 Use Case: Using ToTrTaLe in theDefinition Extraction Workflow
In this section we present the usefulness of the presented annotation web service implementation for the task of definition extraction.
The definition extraction workflow, presented in detail in Pollak et al. (2012a), was implemented in the ClowdFlows platform and includes several widgets. The workflow starts with two widgets presented in the previous sections: Load corpus widget, which allows the user to
conveniently upload her corpus in various formats,and
ToTrTaLe tokenization, morphosyntactic annotationand lemmatization service for Slovene and English.
The workflow’s main components for definition extraction are implemented in the following widgets: Pattern-based definition extractor, which seeks for
sentences corresponding to predefined lexico-syntactic patterns (e.g., NP [nominative] is a NP [nominative]),
Term recognition-based definition extractor, which extracts sentences containing at least two domain-specific terms identified through automatic term recognition,
WordNet- and sloWNet-based definition extractor, which identifies sentences containing a wordnet term and its hypernym.
In addition, several other widgets have been implemented (Pollak et al., 2012a): Term extractor widget implementing the LUIZ term
recognition tool (Vintar, 2010) that we can use separately for extracting the terms from the corpus as well as the necessary step for the second definition extraction method,
Term candidate viewer widget, which formats and displays the terms (and their scores) returned by the term extractor widget,
Sentence merger widget, which allows the user to join (through intersection or union) the results of several definition extraction methods,
Definition candidate viewer widget, which, similarly to the term candidate viewer widget, formats and displays the candidate definition sentences returned by the corresponding methods.
The three definition extraction methods, implemented as separate operations of one web service, are described in some more detail below. The first approach, implemented in the pattern-
based definition extraction widget, is the traditional pattern-based approach. We created more than ten patterns for Slovene, using the lemmas, part-of-speech information as well as more detailed morphosyntactic descriptions, such as case information for nouns, person and tense information for verbs, etc. The basic pattern is for instance “NP-nom Va-r3[psd]-n NP-nom” where “NP-nom”denotes a noun phrase in the nominative case and the “Va-r3[psd]-n” matches the auxiliary verb in the present tense of the third person singular, dual or plural and the form is not negative, in other words it corresponds to “je/sta/so” [is/are] forms of the verb “biti” [to be]. As there is no chunker available for Slovene, the basic part-of-speech annotation provided by ToTrTaLe was needed for determining the possible noun phrase structures and the positions of their head nouns.
The second approach, implemented in the term recognition-based definition extraction widget, is primarily tailored to extract knowledge-rich contexts as it focuses on sentences that contain at least ndomain-specific single or multi-word terminological expressions (terms). The parameters of this module are the number of terms, the number of terms in the nominative case, if a verb should figure between two terms, if the first term should be a multi-word term and if the sentence should begin with a term. For setting these parameters, the ToTrTaLe information was needed.
The third approach, implemented in the WordNet-based definition extraction widget, seeks for sentences where a wordnet term occurs together with its direct hypernym. For English we use the Princeton WordNet (PWN) (Fellbaum, 1998), whereas for Slovene we use sloWNet (Fišer and Sagot, 2008), a Slovene counterpart of WordNet.

448 Informatica 36 (2012) 441–449
Figure 4: The definition extraction workflow
7 Conclusions and Further In this paper we presented the ToTrTaLe demonstrated how it can be used in workflows in two service-oriented data mining platformsClowdFlows. Together with the ToTrTaLe web service, we developed a series of widgets (workflow components) for pre-processing the text, consisting of reading the text corpus files in various formats, tokenising the text, lemmatising and morphosyntactically annotating it, as well as adding the sentence boundaries, followed by a post-processing widget for error correction.
Before starting this work, initially pPollak et al. (2012b), the ToTrTaLe toolexisted as a web application for Slovene, where the user was able to upload and add the text, but the novelty is that a web service implementation now enables the user to use ToTrTaLe as a part for various other NLP applications. For illustration, this paper presents the use case of ToTrTaLe in an elaborate workflow, which implements definition extraction for Slovene and English.
In further work we plan to develop otherfor the processing of the natural language, especially for Slovene, where the ToTrTaLe web service will be used as the initial step.
AcknowledgementWe are grateful to Vid Podpečan and Janez Kranjc for their support and for enabling us to includewidgets into Orange4WS and ClowdFlows, respectively.The definition extraction methodology was done in collaboration with Špela Vintar and Darja Fišerwork was partially supported by the Slovene Research Agency and the FP7 European Commission projects “Machine understanding for interactive storytelling” (MUSE, grant agreement no: 296703) and “Large scale
The definition extraction workflow (http://clowdflows.org/workflow/76/
urther WorkIn this paper we presented the ToTrTaLe web service and demonstrated how it can be used in workflows in two
oriented data mining platforms: Orange4WS and ClowdFlows. Together with the ToTrTaLe web service, we developed a series of widgets (workflow components)
, consisting of reading the text corpus files in various formats, tokenising the text, lemmatising and morphosyntactically annotating it, as well as adding the sentence boundaries, followed by a
processing widget for error correction. , initially presented in
the ToTrTaLe tool has already existed as a web application for Slovene, where the user was able to upload and add the text, but the novelty is that a web service implementation now enables the user to use ToTrTaLe as a part for various other NLP
For illustration, this paper presents the use case of ToTrTaLe in an elaborate workflow, which implements definition extraction for Slovene and
ther work we plan to develop other workflows for the processing of the natural language, especially for
service will be used
We are grateful to Vid Podpečan and Janez Kranjc for their support and for enabling us to include the developed widgets into Orange4WS and ClowdFlows, respectively.
tion methodology was done in Špela Vintar and Darja Fišer. This
work was partially supported by the Slovene Research Agency and the FP7 European Commission projects “Machine understanding for interactive storytelling” (MUSE, grant agreement no: 296703) and “Large scale
information extraction and integration isupporting financial decision making” (FIRST, grant agreement 257928).
References[1] Špela Arhar Holdt and Vojko Gorjanc (2007).
Korpus FidaPLUS: nova generacija slovenskega referenčnega korpusa. Jezik in slovstvo110.
[2] Michael R. Berthold, Nicolas Cebron, Fabian Dill, Thomas R. Gabriel, Tobias Kötter, Thorsten Meinl, Peter Ohl, Kilian Thiel and Bernd Wiswedel (2007). KNIME: The Konstanz Information Miner. In Preisach, C., Burkhardt, H., SchmidtDecker, R., (eds.): GfKl.Data Analysis, and Knowledge OrganizationSpringer, 319–326.
[3] Thorsten Brants (2000). TnT Speech Tagger. In Proceedings of the 6Natural Language Processing Conference2000), Seattle, WA, 224–
[4] Janez Demšar, Blaž Zupan, Gregor Leban and Tomaž Curk (2004). Orange: From experimental machine learning to interactive data mining. In Boulicaut, J.F., Esposito, F., Giannotti, F., Pedreschi, D. (eds.): Proceedings of ECML/PKDD2004, Springer LNCS Volume 3202,
[5] Tomaž Erjavec (2011). Automatic linguistic annotation of historical language: ToTrTaLe and XIX century Slovene. In ACL-HLT Workshop on Language Technology for Cultural Heritage, Social Sciences, and Humanities, ACL.
[6] Tomaž Erjavec (2012a). The goo300k corpus of historical Slovene. In International Conference on Language Resources and Evaluation, LREC 2012, Istanbul, Turkey, 2257–2260.
S. Pollak et al.
http://clowdflows.org/workflow/76/).
information extraction and integration infrastructure for supporting financial decision making” (FIRST, grant
Špela Arhar Holdt and Vojko Gorjanc (2007). Korpus FidaPLUS: nova generacija slovenskega
Jezik in slovstvo 52(2): 95–
Berthold, Nicolas Cebron, Fabian Dill, Thomas R. Gabriel, Tobias Kötter, Thorsten Meinl, Peter Ohl, Kilian Thiel and Bernd Wiswedel
KNIME: The Konstanz Information Miner. In Preisach, C., Burkhardt, H., Schmidt-Thieme, L.,
GfKl. Studies in Classification, Data Analysis, and Knowledge Organization,
Thorsten Brants (2000). TnT – A Statistical Part-of-Proceedings of the 6th Applied
Natural Language Processing Conference (ANLP –231.
Janez Demšar, Blaž Zupan, Gregor Leban and Tomaž Curk (2004). Orange: From experimental machine learning to interactive data mining. In Boulicaut, J.F., Esposito, F., Giannotti, F.,
Proceedings of ECML/PKDD-S Volume 3202, 537–539.
Tomaž Erjavec (2011). Automatic linguistic annotation of historical language: ToTrTaLe and XIX century Slovene. In Proceedings of the 5th
HLT Workshop on Language Technology for Cultural Heritage, Social Sciences, and
Tomaž Erjavec (2012a). The goo300k corpus of historical Slovene. In Proceedings of the 8th International Conference on Language Resources
EC 2012, Istanbul, Turkey,

NLP WEB SERVICES FOR SLOVENE AND… Informatica 36 (2012) 441–449 449
[7] Tomaž Erjavec (2012b). MULTEXT-East: morphosyntactic resources for Central and Eastern European languages. Language resources and evaluation 46(1): 131–142.
[8] Tomaž Erjavec and Sašo Džeroski (2004). Machine Learning of Language Structure: Lemmatising Unknown Slovene Words. Applied Artificial Intelligence 18(1):17–41.
[9] Tomaž Erjavec, Darja Fišer, Simon Krek and Nina Ledinek (2010). The JOS linguistically tagged corpus of Slovene. In Proceedings of the 7th International Conference on Language Resources and Evaluations, LREC 2010, Valletta, Malta, 1806–1809.
[10] Tomaž Erjavec, Camelia Ignat, Bruno Pouliquen and Ralf Steinberger (2005). Massive Multi-Lingual Corpus Compilation: Acquis Communautaire and ToTaLe. In Proceedings of the 2nd Language & Technology Conference, April 21–23, 2005, Poznan, Poland, 32–36.
[11] Christiane Fellbaum (1998). WordNet: An Electronic Lexical Database. Cambridge, MA: MIT Press. Online version: http://wordnet.princeton.edu.
[12] Darja Fišer and Benoît Sagot (2008). Combining multiple resources to build reliable wordnets. Text, Speech and Dialogue (LNCS 2546). Berlin; Heidelberg: Springer, 61–68.
[13] Duncan Hull, Katy Wolstencroft, Robert Stevens, Carole Goble, Matthew R. Pocock, Peter Li and Thomas M. Oinn (2006). Taverna: A tool for building and running workflows of services. Nucleic Acids Research 34 (Web-Server-Issue): 729–732.
[14] Janez Kranjc, Vid Podpečan and Nada Lavrač (2012). ClowdFlows: A cloud-based scientific workflow platform. In Proceedings of ECML/PKDD-2012. September 24–28, 2012, Bristol, UK, Springer LNCS, 816–819.
[15] Dom Lachowicz and Caolán McNamara (2006). wvWare, library for converting Word document. http://wvware.sourceforge.net/, accessed in August 2012.
[16] Ingo Mierswa, Michael Wurst, Ralf Klinkenberg, Martin Scholz and Timm Euler (2006). YALE: Rapid prototyping for complex data mining tasks. In Eliassi-Rad, T., Ungar, L.H., Craven, M., Gunopulos, D. (eds.): Proceedings of KDD-2006, ACM , 935–940.
[17] Vid Podpečan, Monika Žakova and Nada Lavrač (2012). Orange4WS environment for service-oriented data mining. The Computer Journal (2012)55(1): 82–98.
[18] Senja Pollak, Anže Vavpetič, Janez Kranjc, Nada Lavrač and Špela Vintar (2012a). In J. Jancsary (ed.): Proceedings of the 11th Conference on Natural Language Processing (KONVENS 2012), September 19–21, 2012, Vienna, Austria, 53–60.
[19] Senja Pollak, Nejc Trdin, Anže Vavpetič and Tomaž Erjavec (2012b). A Web Service Implementation of Linguistic Annotation for Slovene and English. In Proceedings of the 8th
Language Technologies Conference, Proceedingsof the 15th International Multiconference Information Society (IS 2012), Volume C, 157–162.
[20] Yusuke Shinyama (2010). PDFMiner http://www.unixuser.org/~euske/python/pdfminer/index.html, accessed in August 2012.
[21] Jasmina Smailović and Senja Pollak (2011). Semi-automated construction of a topic ontology from research papers in the domain of language technologies. In Proceedings of the 5th Language & Technology Conference, November 25–27, 2011, Poznan, Poland, 121–125.
[22] TEI Consortium (2007). TEI P5: Guidelines for Electronic Text Encoding and Interchange. http://www.tei-c.org/Guidelines/P5/.
[23] Špela Vintar (2010). Bilingual term recognition revisited: The bag-of-equivalents term alignment approach and its evaluation. Terminology 16(2): 141–158.
[24] Ian H. Witten, Eibe Frank and Mark Hall (2011). Data Mining: Practical Machine Learning Tools and Techniques. 3rd Edition. Morgan Kaufmann.

450 Informatica 36 (2012) 441–449 S. Pollak et al.

Informatica 36 (2012) 451
CONTENTS OF Informatica Volume 36 (2012) pp. 1–453
Papers
ALI, F.M. & , H. AL-HAMADI, A. GHONIEM, H.D. SHERALI.2012. Hardware-Software Co-design for Reconfigurable FieldProgrammable Gate Arrays Using Mixed-Integer Programming.Informatica 36:287–295.
AWOYELU, I.O. & , P. OKOH. 2012. Mathlab Implementationof Quantum Computation in Searching an Unstructured Database.Informatica 36:249–254.
AZIZ, A.S.A. & , M. SALAMA, A.E. HASSANIEN, S.E.-O. HANAFI. 2012. Artificial Immune System Inspired IntrusionDetection System using Genetic Algorithm. Informatica 36:347–357.
BŽOCH, P. & , L. MATEJKA, L. PEŠICKA, J. ŠAFARIK. 2012.Design and Implementation of a Caching Algorithm Applicableto Mobile Clients. Informatica 36:369–378.
CHUNLIN, L. & , H.J. HUI, L. LAYUAN. 2012. A Marketbased Approach for Sensor Resource Allocation in the Grid.Informatica 36:167–176.
COSMA, G. & , M. JOY. 2012. Evaluating the Performanceof LSA for Source-code Plagiarism Detection. Informatica36:409–424.
DIWAN, A. & , J. KURI, S. SANYAL. 2012. Optimal Allocationof Rates in Guaranteed Service Networks. Informatica 36:201–212.
DOVGAN, E. & , T. TUŠAR, M. JAVORSKI, B. FILIPIC. 2012.Discovering Comfortable Driving Strategies Using Simulation-Based Multiobjective Optimization. Informatica 36:319–326.
ELMISERY, A.M. & , D. BOTVICH. 2012. Privacy AwareRecommender Service using Multi-agent Middleware- an IPTVNetwork Scenario. Informatica 36:21–36.
FENG, Z.-Q. & , C.-G. LIUA. 2012. On Similarity-basedApproximate Reasoning in Interval-valued Fuzzy Environments.Informatica 36:255–262.
FOMICHOV, V.A. & , O.S. FOMICHOVA. 2012. A Contributionof Cognitonics to Secure Living in Information Society. Infor-matica 36:121–130.
GEORGIOU, S.D. & , K. DROSOU, C. KOUKOUVINOS. 2012.A Discrete Fourier Transform Approach Searching for Compati-ble Sequences and Optimal Designs. Informatica 36:425–429.
GLAZEBROOK, J.F. & , R. WALLACE. 2012. ‘The FrozenAccident’ as an Evolutionary Adaptation: A Rate DistortionTheory Perspective on the Dynamics and Symmetries of GeneticCoding Mechanisms. Informatica 36:53–73.
GRANOS, M. & , A. ZGRZYWA. 2012. Linguistic ModelPropositions for Poetry Retrieval in Web Search. Informatica36:137–143.
HYSENAJ, M. & , R. BARJAMI. 2012. Web GIS AlbaniaPlatform, an Informative Technology for the Albanian Territory.Informatica 36:431–440.
JALAL, A.S. & , V. SINGH. 2012. The State-of-the-Art in VisualObject Tracking. Informatica 36:227–248.
KÄMPKE, T. & . 2012. Optimal Motion Paths in AmbientFields. Informatica 36:305–317.
KOCEV, D. & . 2012. Ensembles for Predicting StructuredOutputs. Informatica 36:113–114.
KOSEC, G. & . 2012. Simulation of Multiphase Thermo-FluidPhenomena by a Local Meshless Numerical Approach. Informat-ica 36:221–222.
KRASINSKI, T. & , S. SAKOWSKI, T. POPŁAWSKI. 2012.Autonomous Push-down Automaton Built on DNA. Informatica36:263–276.
KULKARNI, S.A. & , G.R. RAO. 2012. Issues in Energy Opti-mization of Reinforcement Learning Based Routing AlgorithmApplied to Ad-hoc Networks. Informatica 36:213–220.
LAVBIC, D. & . 2012. Rapid Ontology Development ModelBased on Rule Management Approach in Business Applications.Informatica 36:115–116.
LIU, P. & , Y. SU. 2012. Multiple Attribute Decision MakingMethod Based on the Trapezoid Fuzzy Linguistic HybridHarmonic Averaging Operator. Informatica 36:83–90.
MAO, C. & . 2012. Adaptive Random Testing Based onTwo-Point Partitioning. Informatica 36:297–303.
MEGHANATHAN, N. & . 2012. Graph Theory Algorithms forMobile Ad hoc Networks. Informatica 36:185–199.
MICARELLI, R. & , G. PIZZIOLO. 2012. The Experiencesof Landscape Social Perception as a Remedy for Plunging intoVirtual Reality. Informatica 36:145–151.
MIHAESCU, M.C. & , D.D. BURDESCU. 2012. Using MTree Data Structure as Unsupervised Classification Method.Informatica 36:153–160.
MIKÓCZY, E. & , I. VIDAL, D. KANELLOPOULOS. 2012. IPTVEvolution Towards NGN and Hybrid Scenarios. Informatica36:3–12.

452 Informatica 36 (2012)
MIYAJI, A. & , M.S. RAHMAN. 2012. Privacy-preservingTwo-party Rational Set Intersection Protocol. Informatica36:277–286.
PIPPAL, R.S. & , S. TAPASWI, C.D. JAIDHAR. 2012. SecureKey Exchange Scheme for IPTV Broadcasting. Informatica36:47–52.
PODZIEWSKI, A. & , K. LITWINIUK, J. LEGIERSKI. 2012.E-health Oriented Application for Mobile Phones. Informatica36:341–346.
POLLAK, S. & , N. TRDIN, A. VAVPETIC, T. ERJAVEC. 2012.NLP Web Services for Slovene and English: MorphosyntacticTagging, Lemmatisation and Definition Extraction. Informatica36:441–449.
RAMOND, F. & , D. DE ALMEIDA, S. DAUZÉRE-PÉRÉS,H.D. SHERALI. 2012. Optimized Rostering of WorkforceSubject to Cyclic Requirements. Informatica 36:327–336.
SHIBESHI, Z.S. & , A. TERZOLI, K. BRADSHAW. 2012. AnRTSP Proxy for Implementing the IPTV Media Function Using aStreaming Server. Informatica 36:37–46.
SINGH, Y. & , A. KAUR, B. SURI, S. SINGHAL. 2012.Systematic Literature Review on Regression Test PrioritizationTechniques. Informatica 36:379–408.
SONG, S. & , H. MOUSTAFA, H. AFIFI. 2012. IPTV ServicesPersonalization Using Context-Awareness. Informatica 36:13–20.
SZMIT, M. & , A. SZMIT, S. ADAMUS, S. BUGALA. 2012.Usage of Holt-Winters Model and Multilayer Perceptron inNetwork Traffic Modelling and Anomaly Detection. Informatica36:359–368.
TAVCAR, A. & . 2012. Analysis of a Single-Agent Search.Informatica 36:177–183.
VALCIC, M. & , L. DOMŠIC. 2012. Information Technologyfor Management and Promotion of Sustainable Cultural Tourism.Informatica 36:131–136.
VELÁZQUEZ-GUZMAN, M.G. & , F. LARA-ROSANO. 2012.Computer-Aided Educational Intervention in Teenagers ViaInternet Social Networking. Informatica 36:161–166.
WAN, M. & , S. GAI, J. SHAO. 2012. Local Graph EmbeddingBased on Maximum Margin Criterion (LGE/MMC) for FaceRecognition. Informatica 36:103–112.
YANG, K-P. & , W. ZHANG, F. PETRY. 2012. Physics MarkupApproaches Based on Geometric Algebra Representations.Informatica 36:91–102.
ZHAO, X. & , F. ZHANG. 2012. Times Limited Accountable
Anonymous Online Submission Control System from Single-Verifier k-times Group Signature. Informatica 36:75–82.
EditorialsMIKÓCZY, E. & , I. VIDAL, D. KANELLOPOULOS. 2012. Edi-tors’ Introduction to the Special Issue on IPTV and MultimediaServices. Informatica 36:1–2.
FOMICHOV, V.A. & , O.S. FOMICHOVA. 2012. Editors’Introduction to the Special Issue on "Human Being in the DigitalWorld". Informatica 36:119–120.
CHOJNACKI, A. & , A. KOWALSKI, B. MACUKOW,M. GRZENDA. 2012. Editors’ Introduction to the SpecialIssue on "Advances in Network Systems". Informatica 36:339–339.

Informatica 36 (2012) 453
JOŽEF STEFAN INSTITUTE
Jožef Stefan (1835-1893) was one of the most prominent physi-cists of the 19th century. Born to Slovene parents, he obtainedhis Ph.D. at Vienna University, where he was later Director of thePhysics Institute, Vice-President of the Vienna Academy of Sci-ences and a member of several scientific institutions in Europe.Stefan explored many areas in hydrodynamics, optics, acoustics,electricity, magnetism and the kinetic theory of gases. Amongother things, he originated the law that the total radiation from ablack body is proportional to the 4th power of its absolute tem-perature, known as the Stefan–Boltzmann law.
The Jožef Stefan Institute (JSI) is the leading independent sci-entific research institution in Slovenia, covering a broad spec-trum of fundamental and applied research in the fields of physics,chemistry and biochemistry, electronics and information science,nuclear science technology, energy research and environmentalscience.
The Jožef Stefan Institute (JSI) is a research organisation forpure and applied research in the natural sciences and technology.Both are closely interconnected in research departments com-posed of different task teams. Emphasis in basic research is givento the development and education of young scientists, while ap-plied research and development serve for the transfer of advancedknowledge, contributing to the development of the national econ-omy and society in general.
At present the Institute, with a total of about 900 staff, has 700researchers, about 250 of whom are postgraduates, around 500of whom have doctorates (Ph.D.), and around 200 of whom havepermanent professorships or temporary teaching assignments atthe Universities.
In view of its activities and status, the JSI plays the role of anational institute, complementing the role of the universities andbridging the gap between basic science and applications.
Research at the JSI includes the following major fields:physics; chemistry; electronics, informatics and computer sci-ences; biochemistry; ecology; reactor technology; applied math-ematics. Most of the activities are more or less closely connectedto information sciences, in particular computer sciences, artifi-cial intelligence, language and speech technologies, computer-aided design, computer architectures, biocybernetics and robotics,computer automation and control, professional electronics, digitalcommunications and networks, and applied mathematics.
The Institute is located in Ljubljana, the capital of the indepen-dent state of Slovenia (or S♡nia). The capital today is considereda crossroad between East, West and Mediterranean Europe, offer-ing excellent productive capabilities and solid business opportuni-ties, with strong international connections. Ljubljana is connectedto important centers such as Prague, Budapest, Vienna, Zagreb,Milan, Rome, Monaco, Nice, Bern and Munich, all within a ra-dius of 600 km.
From the Jožef Stefan Institute, the Technology park “Ljubl-jana” has been proposed as part of the national strategy for tech-nological development to foster synergies between research and
industry, to promote joint ventures between university bodies, re-search institutes and innovative industry, to act as an incubatorfor high-tech initiatives and to accelerate the development cycleof innovative products.
Part of the Institute was reorganized into several high-tech unitssupported by and connected within the Technology park at theJožef Stefan Institute, established as the beginning of a regionalTechnology park "Ljubljana". The project was developed at a par-ticularly historical moment, characterized by the process of statereorganisation, privatisation and private initiative. The nationalTechnology Park is a shareholding company hosting an indepen-dent venture-capital institution.
The promoters and operational entities of the project are theRepublic of Slovenia, Ministry of Higher Education, Science andTechnology and the Jožef Stefan Institute. The framework of theoperation also includes the University of Ljubljana, the NationalInstitute of Chemistry, the Institute for Electronics and VacuumTechnology and the Institute for Materials and Construction Re-search among others. In addition, the project is supported by theMinistry of the Economy, the National Chamber of Economy andthe City of Ljubljana.
Jožef Stefan InstituteJamova 39, 1000 Ljubljana, SloveniaTel.:+386 1 4773 900, Fax.:+386 1 251 93 85WWW: http://www.ijs.siE-mail: [email protected] relations: Polona Strnad

Informatica 36 (2012)
INFORMATICAAN INTERNATIONAL JOURNAL OF COMPUTING AND INFORMATICS
INVITATION, COOPERATION
Submissions and Refereeing
Please submit a manuscript at:http://www.informatica.si/Editors/PaperUpload.asp. At least tworeferees outside the author’s country will examine it, and they areinvited to make as many remarks as possible from typing errors toglobal philosophical disagreements. The chosen editor will sendthe author the obtained reviews. If the paper is accepted, the edi-tor will also send an email to the managing editor. The executiveboard will inform the author that the paper has been accepted,and the author will send the paper to the managing editor. Thepaper will be published within one year of receipt of email withthe text in Informatica MS Word format or Informatica LATEXformat and figures in .eps format. Style and examples of paperscan be obtained from http://www.informatica.si. Opinions, news,calls for conferences, calls for papers, etc. should be sent directlyto the managing editor.
QUESTIONNAIRESend Informatica free of charge
Yes, we subscribe
Please, complete the order form and send it to Dr. Drago Torkar,Informatica, Institut Jožef Stefan, Jamova 39, 1000 Ljubljana,Slovenia. E-mail: [email protected]
ORDER FORM – INFORMATICA
Name: . . . . . . . . . . . . . . . . . . . . . . . . . . . . . . . . . . . . . . . . . . . . . . . . . . . .
Title and Profession (optional): . . . . . . . . . . . . . . . . . . . . . . . . . . . . . .
. . . . . . . . . . . . . . . . . . . . . . . . . . . . . . . . . . . . . . . . . . . . . . . . . . . . . . . . . . .
Home Address and Telephone (optional): . . . . . . . . . . . . . . . . . . . .
. . . . . . . . . . . . . . . . . . . . . . . . . . . . . . . . . . . . . . . . . . . . . . . . . . . . . . . . . . .
Since 1977, Informatica has been a major Slovenian scientificjournal of computing and informatics, including telecommunica-tions, automation and other related areas. In its 16th year (morethan eightteen years ago) it became truly international, althoughit still remains connected to Central Europe. The basic aim of In-formatica is to impose intellectual values (science, engineering)in a distributed organisation.
Informatica is a journal primarily covering intelligent systems inthe European computer science, informatics and cognitive com-munity; scientific and educational as well as technical, commer-cial and industrial. Its basic aim is to enhance communicationsbetween different European structures on the basis of equal rightsand international refereeing. It publishes scientific papers ac-cepted by at least two referees outside the author’s country. In ad-dition, it contains information about conferences, opinions, criti-cal examinations of existing publications and news. Finally, majorpractical achievements and innovations in the computer and infor-mation industry are presented through commercial publications aswell as through independent evaluations.
Editing and refereeing are distributed. Each editor can conductthe refereeing process by appointing two new referees or refereesfrom the Board of Referees or Editorial Board. Referees shouldnot be from the author’s country. If new referees are appointed,their names will appear in the Refereeing Board.
Informatica is free of charge for major scientific, educational andgovernmental institutions. Others should subscribe (see the lastpage of Informatica).
Office Address and Telephone (optional): . . . . . . . . . . . . . . . . . . . .
. . . . . . . . . . . . . . . . . . . . . . . . . . . . . . . . . . . . . . . . . . . . . . . . . . . . . . . . . . .
E-mail Address (optional): . . . . . . . . . . . . . . . . . . . . . . . . . . . . . . . . . .
Signature and Date: . . . . . . . . . . . . . . . . . . . . . . . . . . . . . . . . . . . . . . . .

Informatica WWW:
http://www.informatica.si/
Referees from 2008 on:
Ajith Abraham, Siby Abraham, Renato Accornero, Raheel Ahmad, Cutting Alfredo, Hameed Al-Qaheri, GonzaloAlvarez, Wolfram Amme, Nicolas Anciaux, Rajan Arora, Costin Badica, Zoltán Balogh, Andrea Baruzzo, BorutBatagelj, Norman Beaulieu, Paolo Bellavista, Steven Bishop, Marko Bohanec, Zbigniew Bonikowski, BorkoBoskovic, Marco Botta, Pavel Brazdil, Johan Brichau, Andrej Brodnik, Ivan Bruha, Maurice Bruynooghe, WrayBuntine, Dumitru Dan Burdescu, Yunlong Cai, Juan Carlos Cano, Tianyu Cao, Norman Carver, Marc Cavazza,Jianwen Chen, L.M. Cheng, Chou Cheng-Fu, Girija Chetty, G. Chiola, Yu-Chiun Chiou, Ivan Chorbev, ShauvikRoy Choudhary, Sherman S.M. Chow, Lawrence Chung, Mojca Ciglaric, Jean-Noël Colin, Vittorio Cortellessa,Jinsong Cui, Alfredo Cuzzocrea, Darko Cerepnalkoski, Gunetti Daniele, Grégoire Danoy, Manoranjan Dash, PaulDebevec, Fathi Debili, Carl James Debono, Joze Dedic, Abdelkader Dekdouk, Bart Demoen, SareewanDendamrongvit, Tingquan Deng, Anna Derezinska, Gaël Dias, Ivica Dimitrovski, Jana Dittmann, SimonDobrišek, Quansheng Dou, Jeroen Doumen, Erik Dovgan, Branko Dragovich, Dejan Drajic, Jozo Dujmovic, UmutRiza Ertürk, CHEN Fei, Ling Feng, YiXiong Feng, Bogdan Filipic, Iztok Fister, Andres Flores, VladimirFomichov, Stefano Forli, Massimo Franceschet, Alberto Freitas, Jessica Fridrich, Scott Friedman, Chong Fu,Gabriel Fung, David Galindo, Andrea Gambarara, Matjaž Gams, Maria Ganzha, Juan Garbajosa, Rosella Gennari,David S. Goodsell, Jaydeep Gore, Miha Grcar, Daniel Grosse, Zhi-Hong Guan, Donatella Gubiani, Bidyut Gupta,Marjan Gusev, Zhu Haiping, Kathryn Hempstalk, Gareth Howells, Juha Hyvärinen, Dino Ienco, NatarajanJaisankar, Domagoj Jakobovic, Imad Jawhar, Yue Jia, Ivan Jureta, Dani Juricic, Zdravko Kacic, SlobodanKalajdziski, Yannis Kalantidis, Boštjan Kaluža, Dimitris Kanellopoulos, Rishi Kapoor, Andreas Kassler, Daniel S.Katz, Samee U. Khan, Mustafa Khattak, Elham Sahebkar Khorasani, Ivan Kitanovski, Tomaž Klobucar, JánKollár, Peter Korošec, Valery Korzhik, Agnes Koschmider, Jure Kovac, Andrej Krajnc, Miroslav Kubat, MatjazKukar, Anthony Kulis, Chi-Sung Laih, Niels Landwehr, Andreas Lang, Mohamed Layouni, Gregor Leban, AlexLee, Yung-Chuan Lee, John Leggett, Aleš Leonardis, Guohui Li, Guo-Zheng Li, Jen Li, Xiang Li, Xue Li,Yinsheng Li, Yuanping Li, Shiguo Lian, Lejian Liao, Ja-Chen Lin, Huan Liu, Jun Liu, Xin Liu, SuzanaLoskovska, Zhiguo Lu, Hongen Lu, Mitja Luštrek, Inga V. Lyustig, Luiza de Macedo, Matt Mahoney, DomenMarincic, Dirk Marwede, Maja Matijasevic, Andrew C. McPherson, Andrew McPherson, Zuqiang Meng, FranceMihelic, Nasro Min-Allah, Vojislav Misic, Vojislav Mišic, Mihai L. Mocanu, Angelo Montanari, JesperMosegaard, Martin Možina, Marta Mrak, Yi Mu, Josef Mula, Phivos Mylonas, Marco Di Natale, Pavol Navrat,Nadia Nedjah, R. Nejabati, Wilfred Ng, Zhicheng Ni, Fred Niederman, Omar Nouali, Franc Novak, Petteri Nurmi,Denis Obrul, Barbara Oliboni, Matjaž Pancur, Wei Pang, Gregor Papa, Marcin Paprzycki, Marek Paralic,Byung-Kwon Park, Torben Bach Pedersen, Gert Schmeltz Pedersen, Zhiyong Peng, Ruggero G. Pensa, DanaPetcu, Marko Petkovšek, Rok Piltaver, Vid Podpecan, Macario Polo, Victor Pomponiu, Elvira Popescu, BožidarPotocnik, S. R. M. Prasanna, Kresimir Pripuzic, Gabriele Puppis, HaiFeng Qian, Lin Qiao, Jean-JacquesQuisquater, Vladislav Rajkovic, Dejan Rakovic, Jean Ramaekers, Jan Ramon, Robert Ravnik, Wilfried Reimche,Blagoj Ristevski, Juan Antonio Rodriguez-Aguilar, Pankaj Rohatgi, Wilhelm Rossak, Eng. Sattar Sadkhan, SattarB. Sadkhan, Khalid Saeed, Motoshi Saeki, Evangelos Sakkopoulos, M. H. Samadzadeh, MariaLuisa Sapino,Piervito Scaglioso, Walter Schempp, Barabara Koroušic Seljak, Mehrdad Senobari, Subramaniam Shamala,Zhongzhi Shi, LIAN Shiguo, Heung-Yeung Shum, Tian Song, Andrea Soppera, Alessandro Sorniotti, LianaStanescu, Martin Steinebach, Damjan Strnad, Xinghua Sun, Marko Robnik Šikonja, Jurij Šilc, Igor Škrjanc,Hotaka Takizawa, Carolyn Talcott, Camillo J. Taylor, Drago Torkar, Christos Tranoris, Denis Trcek, KatarinaTrojacanec, Mike Tschierschke, Filip De Turck, Aleš Ude, Wim Vanhoof, Alessia Visconti, Vuk Vojisavljevic,Petar Vracar, Valentino Vranic, Chih-Hung Wang, Huaqing Wang, Hao Wang, Hui Wang, YunHong Wang, AnitaWasilewska, Sigrid Wenzel, Woldemar Wolynski, Jennifer Wong, Allan Wong, Stefan Wrobel, Konrad Wrona, BinWu, Xindong Wu, Li Xiang, Yan Xiang, Di Xiao, Fei Xie, Yuandong Yang, Chen Yong-Sheng, Jane Jia You, GeYu, Borut Zalik, Aleš Zamuda, Mansour Zand, Zheng Zhao, Dong Zheng, Jinhua Zheng, Albrecht Zimmermann,Blaž Zupan, Meng Zuqiang

InformaticaAn International Journal of Computing and Informatics
Web edition of Informatica may be accessed at: http://www.informatica.si.
Subscription Information Informatica (ISSN 0350-5596) is published four times a year in Spring, Summer,Autumn, and Winter (4 issues per year) by the Slovene Society Informatika, Vožarski pot 12, 1000 Ljubljana,Slovenia.The subscription rate for 2012 (Volume 36) is– 60 EUR for institutions,– 30 EUR for individuals, and– 15 EUR for studentsClaims for missing issues will be honored free of charge within six months after the publication date of the issue.
Typesetting: Borut Žnidar.Printing: ABO grafika d.o.o., Ob železnici 16, 1000 Ljubljana.
Orders may be placed by email ([email protected]), telephone (+386 1 477 3900) or fax (+386 1 251 93 85). Thepayment should be made to our bank account no.: 02083-0013014662 at NLB d.d., 1520 Ljubljana, Trg republike2, Slovenija, IBAN no.: SI56020830013014662, SWIFT Code: LJBASI2X.
Informatica is published by Slovene Society Informatika (president Niko Schlamberger) in cooperation with thefollowing societies (and contact persons):Robotics Society of Slovenia (Jadran Lenarcic)Slovene Society for Pattern Recognition (Franjo Pernuš)Slovenian Artificial Intelligence Society; Cognitive Science Society (Matjaž Gams)Slovenian Society of Mathematicians, Physicists and Astronomers (Bojan Mohar)Automatic Control Society of Slovenia (Borut Zupancic)Slovenian Association of Technical and Natural Sciences / Engineering Academy of Slovenia (Igor Grabec)ACM Slovenia (Dunja Mladenic)
Informatica is surveyed by: ACM Digital Library, Citeseer, COBISS, Compendex, Computer & InformationSystems Abstracts, Computer Database, Computer Science Index, Current Mathematical Publications, DBLPComputer Science Bibliography, Directory of Open Access Journals, InfoTrac OneFile, Inspec, Linguistic andLanguage Behaviour Abstracts, Mathematical Reviews, MatSciNet, MatSci on SilverPlatter, Scopus, ZentralblattMath
The issuing of the Informatica journal is financially supported by the Ministry of Higher Education, Science andTechnology, Trg OF 13, 1000 Ljubljana, Slovenia.

Volume 36 Number 4 December 2012 ISSN 0350-5596
Editors’ Introduction to the Special Issue on"Advances in Network Systems"
A. Chojnacki, A. Kowalski,B. Macukow, M. Grzenda
339
E-health Oriented Application for Mobile Phones A. Podziewski,K. Litwiniuk, J. Legierski
341
Artificial Immune System Inspired IntrusionDetection System using Genetic Algorithm
A.S.A. Aziz, M. Salama,A.e. Hassanien,S.E.-O. Hanafi
347
Usage of Holt-Winters Model and MultilayerPerceptron in Network Traffic Modelling andAnomaly Detection
M. Szmit, A. Szmit,S. Adamus, S. Bugala
359
Design and Implementation of a Caching AlgorithmApplicable to Mobile Clients
P. Bžoch, L. Matejka,L. Pešicka, J. Šafarik
369
End of Special Issue / Start of normal papers
Systematic Literature Review on Regression TestPrioritization Techniques
Y. Singh, A. Kaur, B. Suri,S. Singhal
379
Evaluating the Performance of LSA for Source-codePlagiarism Detection
G. Cosma, M. Joy 409
A Discrete Fourier Transform Approach Searchingfor Compatible Sequences and Optimal Designs
S.D. Georgiou, K. Drosou,C. Koukouvinos
425
Web GIS Albania Platform, an InformativeTechnology for the Albanian Territory
M. Hysenaj, R. Barjami 431
NLP Web Services for Slovene and English:Morphosyntactic Tagging, Lemmatisation andDefinition Extraction
S. Pollak, N. Trdin,A. Vavpetic, T. Erjavec
441

Informatica 36 (2012) Number 4, pp. 339–453


![Post-qualitative research methodology. [Guest lecture]](https://static.fdokumen.com/doc/165x107/632542807fd2bfd0cb035ec1/post-qualitative-research-methodology-guest-lecture.jpg)