Special Interest Groups and Trade Policy in the EU
22
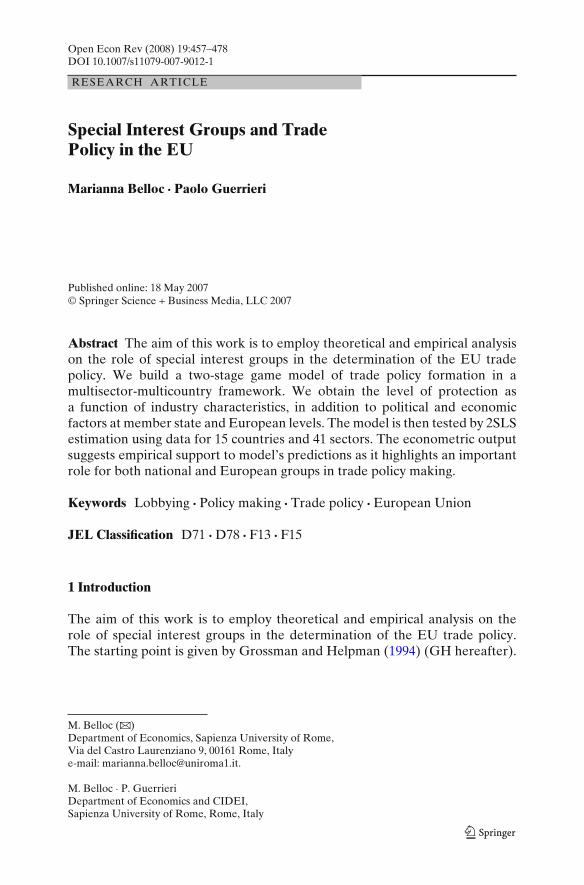
Open Econ Rev (2008) 19:457–478 DOI 10.1007/s11079-007-9012-1 RESEARCH ARTICLE Special Interest Groups and Trade Policy in the EU Marianna Belloc · Paolo Guerrieri Published online: 18 May 2007 © Springer Science + Business Media, LLC 2007 Abstract The aim of this work is to employ theoretical and empirical analysis on the role of special interest groups in the determination of the EU trade policy. We build a two-stage game model of trade policy formation in a multisector-multicountry framework. We obtain the level of protection as a function of industry characteristics, in addition to political and economic factors at member state and European levels. The model is then tested by 2SLS estimation using data for 15 countries and 41 sectors. The econometric output suggests empirical support to model’s predictions as it highlights an important role for both national and European groups in trade policy making. Keywords Lobbying · Policy making · Trade policy · European Union JEL Classification D71 · D78 · F13 · F15 1 Introduction The aim of this work is to employ theoretical and empirical analysis on the role of special interest groups in the determination of the EU trade policy. The starting point is given by Grossman and Helpman (1994) (GH hereafter). M. Belloc (B ) Department of Economics, Sapienza University of Rome, Via del Castro Laurenziano 9, 00161 Rome, Italy e-mail: [email protected]. M. Belloc · P. Guerrieri Department of Economics and CIDEI, Sapienza University of Rome, Rome, Italy
Transcript of Special Interest Groups and Trade Policy in the EU
Open Econ Rev (2008) 19:457–478DOI 10.1007/s11079-007-9012-1
RESEARCH ARTICLE
Special Interest Groups and TradePolicy in the EU
Marianna Belloc · Paolo Guerrieri
Published online: 18 May 2007© Springer Science + Business Media, LLC 2007
Abstract The aim of this work is to employ theoretical and empirical analysison the role of special interest groups in the determination of the EU tradepolicy. We build a two-stage game model of trade policy formation in amultisector-multicountry framework. We obtain the level of protection asa function of industry characteristics, in addition to political and economicfactors at member state and European levels. The model is then tested by 2SLSestimation using data for 15 countries and 41 sectors. The econometric outputsuggests empirical support to model’s predictions as it highlights an importantrole for both national and European groups in trade policy making.
Keywords Lobbying · Policy making · Trade policy · European Union
JEL Classification D71 · D78 · F13 · F15
1 Introduction
The aim of this work is to employ theoretical and empirical analysis on therole of special interest groups in the determination of the EU trade policy.The starting point is given by Grossman and Helpman (1994) (GH hereafter).
M. Belloc (B)Department of Economics, Sapienza University of Rome,Via del Castro Laurenziano 9, 00161 Rome, Italye-mail: [email protected].
M. Belloc · P. GuerrieriDepartment of Economics and CIDEI,Sapienza University of Rome, Rome, Italy
458 M. Belloc, P. Guerrieri
The fundamental idea of their model is to microfound the behavior of orga-nized lobbies and politicians, in order to derive a clear-cut expression for thelevel of endogenous protection as a function of industry characteristics. Threemain predictions are obtained: (1) Protection is higher in organized sectorsthan in unorganized ones; (2) Protection is higher in industries with lowerimport elasticity; (3) Protection is a decreasing (increasing) function of theimport penetration ratio in the organized (unorganized) sectors. The validityof these predictions has been verified for single-country studies: Gawande andBandyopadhyay (2000) and Goldberg and Maggi (1999)—United States; Mitraet al. (2002)—Turkey; and McCalman (2004)—Australia. In the more recentliterature, the GH framework has offered the basis to a number of extensionsand adaptations for the analysis of related topics: trade blocs formation, tradebargaining, liberalization reforms, and so on (e.g. Grossman and Helpman1995a,b; Karacaovali and Limão 2005).
A common denominator for much of the literature on special interestgroups (SIGs hereafter) and trade policy is that it is highly suited for theinstitutional features of the US political system (Persson 1998). In this paperwe tailor the GH model to fit the EU institutional environment and developa framework meant to describe trade policy formation in the EU. In so doingwe seek to unravel the role of SIGs at the different stages of the policy-makingprocess and to distinguish lobbying at the national level from lobbying at theEuropean level.
We borrow from Grossman and Helpman (1994) the microfoundationsto the behavior of lobbies and politicians in a multi-sector framework.Nonetheless our model is different from theirs in two major respects. First,policy-making is a two-stage game: it includes two macro-stages, respectivelystate-level and European-level; the latter consisting of two sub-stages, lobbyingactivity and government decision making. Second, we allow pressure groupsto resort to other means of political influence besides financial contributionsto politicians, namely, selective information provision. Grounding on thistheoretical framework we derive the level of protection as a function ofindustry characteristics, in addition to political and economic factors at themember state level and at the European level.
Despite the increasing interest on European policy formation and interestgroups in the literature (see for instance: Broscheid and Cohen 2003; Cohen1997; Crombez 2002), surprisingly few works have been addressed to analyzesuch an issue with a special regard to trade policy.
Belfrage (2004) generalizes the GH model to account for the possibility ofdownstream lobbying and optimum tariff concerns and tests it on a number ofOECD countries and regions including the EU. Since however, the author’smain concern is not on the special EU institutional environment, the model ismaintained single-stage without considering the two levels of policy formationin a custom union. As a consequence, Belfrage’s model fits very well all thecountries in his sample but the EU, in which case the estimated coefficients areweakly significant or with the wrong sign. Furthermore, due to the lack of dataon lobbying activity, Belfrage (2004) assumes that all sectors are organized.
Special interest groups and trade policy in the EU 459
While it is not hard to believe that this hypothesis has some empirical support,in our paper we preferred to find out some criterion to distinguish organizedfrom unorganized groups as well as European lobbying from national one.
Balaoing and Francois (2006) focus on trade policy formation in the specialEU institutional environment without entirely grounding on the GH model.As a consequence, while Balaoing and Francois’ paper has many points in com-mon with our work, the framework adopted differs remarkably. The authorsuse a computational general equilibrium model to estimate the marginal im-pacts of a set of import policies in the EU. They obtain the implied weights ofthe various industries in the policy process. Accordingly, rather than classifyingindustries as either organized or unorganized as standard in the “protection forsale” literature, the authors aim to assess the relative importance of individualsectors against overall economic welfare. Moreover, linking lobbying ability toindustry characteristics they are able to indirectly derive the relation betweenweights attached to different sectors and the respective amount of lobbying.Finally, specific national characteristics are analyzed to derive their effects onthe amount of protection.
A further work relevant to our concern is offered by Tavares (2006). Theauthor investigates on whether the European trade policy making reflects a“deep” process of integration or it is only a form of “shallow” integrationresulting from the bargaining between national governments (Cadot et al.1999). To accomplish this goal, Tavares (2006) develops a two-stage model:in the first stage, interest groups lobby national governments; in the second,voting in the Council of Ministers defines the common tariff. In the empiricalpart of the paper, the first stage is then used to predict the preferred nationaltariff, while in the second one a model for common trade policy determinationis estimated to test different decision making rules in the Council of Ministers(unanimity, qualified majority, simple majority). Results are supportive thedeep integration hypothesis. The main reason of departure of this paper fromours is that, while it offers an interesting analysis of the decision makingprocess at the EU level, it lacks microfoundation of government and lobbies’behavior. No guess, as a consequence, can be provided on the value of thestructural parameters that drive agents’ decisions.
Finally, Karacaovali and Limão (2005) model the political economy weightsattached to each sector in the economy, in order to convey information aboutthe ranking of industries in governments’ preferences in terms of structural pa-rameters rather than policy outcomes. Under the hypothesis that all sectors areorganized, they obtain that industrial sectors with higher share of employmentand higher regional concentration receive higher tariff protection. Moreover,industries with lower wages are associated to slightly larger weights; howeverthe latter effect is never significant.
The remainder of our paper is as follows. Section 2 presents a brief analysisof the European institutional environment where trade policy formation takesplace. Section 3 presents an exposition of the theoretical model and derivesthe equilibrium policy. Grounding on the theoretical basis so provided, in thesame section we also derive the model to estimate. Section 4 describes the
460 M. Belloc, P. Guerrieri
econometric strategy and the empirical results. Finally Section 5 draws theconclusions.
2 The EU institutional environment
The major actors in the formation of EU trade policy are the Commission,the Council, and the European Parliament (articles 133, 300, 308 and 310of the Treaty Establishing the European Community). The inter-institutionalprocedure for the common trade policy consists of two stages: the proposaland the approval. In the first stage the Commission drafts the proposal underauthorization of the Council and in consultation with special committeesappointed by the Council (art. 300). In the second stage, the Council ofMinisters approves (rejects/amends) the draft generally by qualified majority.The Council has the duty to inform the European Parliament of any decisiontaken by the Commission, although consultations on trade agreements are notmandatory.
The general aim of the common commercial policy is “to contribute, inthe common interest, to the harmonious development of world trade, theprogressive abolition of restrictions on international trade and the loweringof customs barriers, instruments and scope” (art. 133 of the Treaty). Thereforewe assume that “in principle” the European institutions are called to representthe interests of the citizens of the EU as a whole. However, each memberstate’s representatives tend to pay a special attention to their own country’sinterests. Furthermore, community policy makers (as well as national ones)are susceptible to pressure by lobby groups.
SIGs can affect policy decisions by operating either at the national or at theinternational level. Generally speaking, the measures available to lobbies tosway EU government’s favor are similar to those used by national lobbying:political pressure, economic contributions, information provision, and so on.Yet the policy making environment that characterizes the EU is much morecomplex than the national one: it is a focal point of different and contrastinginterests, and relies on a very open and decentralized decision process. Insuch an uncertain surrounding business groups have especially to gain fromalliances and coalitions (Mazey and Richardson 1993).
Before the adoption of the Single European Act in 1986, most of the EUlobbying was wielded by national groups through political and administrativechannels. This was due to the fact that the decision making process was mainlyin the hands of the Council of Ministers. Later on, when the Single EuropeanAct became effective, the Commission has been endowed with the power toinitiate EU policies and has started to play a crucial role in the formulation ofpolicy proposals. This implied a particular need for SIGs coalition-building atthe EU level at the early stages of the lobbying process.
Unlike the Council, the Commission is meant to be a supranational body.As a consequence, commissioners are supposed to be independent of memberstates in taking their decisions. Furthermore the Commission is essentially
Special interest groups and trade policy in the EU 461
a technical bureaucracy that counts in large measure on private actors togather the necessary information to draft legislation; while it does not needfunds for re-election. It follows that the Commission is not very exposed topolitical contribution lobbying but is very dependent on information provisionby interest groups. Lobbies have indeed become an important source forgrass-roots information and have started to play a very active role during thelegislative process. They bring issues to the policy makers’ attention, provideinformation, and often take part in the committees (Directorates-General)that assist the Commission in preparing its proposals (Broscheid and Cohen2003). On the contrary, the Council is at most susceptible to direct lobbyingfrom groups that operate at the national level and by the means of thetraditional channels of political pressure.
To represent this complicated picture and also in view of empirical tractabil-ity for the following application, we need to introduce some simplifyinghypotheses in order to stress as much as possible the different roles of thevarious players and the distinct interests at stake. As we have already said,the final decision maker is the Council, which is composed of each memberstate’s government representatives but works on the basis of Commission’sproposal. Then the final decision must reflect the following interests: generalwelfare at the European level (that is the sum of the general welfare of everysingle member state), SIGs at the European level (that mainly wield pressurethrough the Commission), and SIGs at the national level (that tend to lobbydirectly the Council). Hence the policy making process can be pictured in twostages: the choice of the preferred tariff level for each member state’s repre-sentative that is part of the Council, and the formation of a common tariff levelthat summarizes somehow the individual preferences.
National governments define the preferred tariff level that maximizes na-tional welfare. However, in so doing, they are susceptible to political pressuresfrom two directions. First, since the Council decides after the initiative takenby the Commission, each member state forms her preferences on the basis ofthe information included in the proposal (that reflects the action of Europeanlobbies to sway the Commission’s favor). Second, the Council is subject to thepressure wielded directly by national lobbies. As a consequence, we adoptthe following modelling strategy. The European government is consideredas a unitary actor composed of the representatives of the various membercountries. Each member state’s representative forms her preferred tariff levelmaximizing the weighted sum of general national welfare, contributions (finan-cial, informative or other) by European lobbies and contributions (financial,informative or other) by national lobbies. This maximization leaves us with Kpreferred tariff rates (where K is the number of member states at the timeconsidered). To close the model we need to choose a rule, which obtainsa single common tariff from those K. Because voting in the Council is notpublicly observable, we do not know exactly how decisions are taken (seeTavares 2006, for theoretical and empirical analysis of the possible collectivedecision-making). Since, however, disentangling this point is not the maingoal of the present paper, and in order to significantly simplify the theoretical
462 M. Belloc, P. Guerrieri
model that follows, we resort to an indirect method: the equilibrium collectivedecision is the tariff level that minimizes the penalty in terms of welfareloss that is associated to the misalignment between the common trade policydefined by the European government and the rate of protection that is optimalfor each single country. The subsequent section describes the theoretical modelin more detail.
3 Theoretical model
3.1 Economy
We consider a region (the EU), whose member states agree to form a singlemarket, and the rest of the world. The region consists of K countries (membersof the EU), but it negotiates with its trade partners as a single entity with asingle common trade policy. Countries, taken one by one, are considered smallwith respect to the rest of the world, while the EU is deemed to be a largeeconomy. Each country is populated by Nk (with N = ∑
k∈K Nk) individualsidentical in every relevant respect but factor endowments. There are M + 1consumption goods, out of which good 0 is the numeraire. Individuals ownlabor and possibly a specific factor (at most one).
In each country k ∈ K, individuals seek to maximize their utility given bythe quasi-linear function:
uk = x0k +M∑
i=1
uik (xik) (1)
where u is differentiable, increasing and strictly concave, x0k is consumptionof the numeraire good and xik is consumption of good i with i = 1, 2...M.dik (pi) = xik = 1/u′
ik (xik) is individual demand of the non-numeraire good i,whereas x0k = Ek − ∑
i pidik (pi) is demand of the numeraire good. Indirectutility is:
vk(p, E
) = Ek + sk(p)
(2)
where E is expenditure, s the consumer surplus, and p the vector of domesticprices of non-numeraire goods (bold stands for vector). Consumer surplus incountry k (∈ K) is defined as:
sk(p) ≡
M∑
i=1
uik[dik (pi)
] −M∑
i=1
pidik (pi) (3)
All technologies exhibit constant returns to scale and specific inputs areavailable in inelastic supply. While the numeraire good is produced only withlabor, any good i �= 0 is produced with labor and a sector-specific factor.
Special interest groups and trade policy in the EU 463
Denoting by πik (pi) the reward for the use of the specific factor i, domesticoutput of sector i (∈ M) in country k (∈ K) is given by:
yik (pi) = π ′ik (pi) (4)
The only instrument available to the policy makers is trade taxes. Callingp∗
i the exogenous world price, ti = (pi − p∗
i
)> 0 (< 0) is trade tariff (subsidy).
The common pool of tax revenues is used to provide an array of publicgoods whose benefits are enjoyed by each individual in the whole region. Netgovernment transfer to each individual in country k (∈ K) is:
rk(p) =
∑
i∈N
(pi − p∗
i
)[
dik (pi) − 1
Nkyik (pi)
]
(5)
Thus, individual income consists of three elements: labor income (wage,equal to one), government transfer (public good consumption), and, possibly,rewards from the ownership of the specific factor. Total welfare in countryk (∈ K) can hence be defined as:
Wk(p) = lk +
∑
i∈N
πik (pi) + Nk[rk
(p) + sk
(p)]
(6)
where l is total labor supply (and labor income, given that wage is equalto unity).
Finally denoting by mik (pi) = Nkdik (pi) − yik (pi) the net import of goodi (∈ M) by country k (∈ K), by mi (pi) = ∑
k∈K mik (pi) the total net import ofgood i by the EU, and by m∗
i (pi) = N∗d∗i (pi) − y∗
i (pi) the net import of goodi by the rest of the world (where N*, d* and y* are, respectively, population,demand for and output of good i in the rest of the world), we have:
mi (pi) + m∗i
(p∗
i
) = 0 (7)
3.2 Lobbying
L interest groups manage to get organized at either state member level (S ) orEuropean level (E). While in practice, national and European lobbies adoptdifferent measures to sway political favor, we only pay attention to the factthat an amount Ci of resources is spent by group i to wield influence on policymaking. It is worth noting that while Ci in the previous literature is constrainedto be the contribution function as the vector of funds for re-election offered bylobby groups to policy makers, here we adopt a broader definition including allthe resources spent for either political contributions or information provision.In deciding how much of their budget to devote to lobby action, SIGs seek tomaximize net joint welfare of group members that is given by gross welfareless expenditure for lobbying activity. Gross-of-contribution joint welfare forthe organized sector i (∈ L) in country k (∈ K) is:
Wik(p) ≡ lik + πik (pi) + αik N
[r(p) + s
(p)]
(8)
where αi is the fraction of voting population that owns factor i (for simplicitywe assume symmetry among countries so that αi = αik ∀k ∈ K).
464 M. Belloc, P. Guerrieri
For the sake of generality and of realism, we imagine that interest groupsdo not need to choose between national and supranational action. It followsthat a certain group i, let us say producers of leather apparel, can indeedbe organized in country A and not in country B, and at the same time takepart in a transnational organization of European producers of leather apparel.Therefore, denoting by E the number of European lobbies and by S thenumber of national lobbies, we have that L = S ∪ E.
Net lobby welfare for lobby i (∈ L) and country k (∈ K) is:
Vik = Wik − Cik (9)
where Cik is total amount of resources spent in lobbying activity.
3.3 Trade policy formation
As we have explained in Section 2, each member state’s representative inthe European government aims at maximizing the weighted sum of aggregategeneral welfare and the contribution from all the lobbies (either national orEuropean). We can then formulate the objective function as follows:
Gk(p) =
∑
i∈S
Cik + b∑
i∈E
Cik + aWk(p)
a, b ≥ 0
where Wk(p) = lk +
∑
i∈M
πik (pi) + N[rk
(p) + sk
(p)]
(10)
is total welfare in country k (∈ K); a is the weight each country attachesto aggregate welfare (for simplicity we assume that a = ak ∀k); and b isthe political weight that denotes how much more (or less) importance eachnational government places on European lobbying with respect to nationallobbying.
The level of protection that satisfies the maximization of Gk(p)
defines theplatform that member states’ representatives will regard as point of referenceto defend while bargaining for the common European trade policy. We denotethis policy platform for the generic sector i by tik (with k = 1, 2, ..K).
We need now to synthesize these K platforms into a single commontariff. This is not a simple task. The European institutional environment isindeed a patchwork of different, sometime contrasting, interests, representedby national government, national lobbies, European lobbies and social non-government actors. To represent such a complicated picture, we inevitablyneed to resort to some simplification to describe the collective policy making.We choose a solution that is consistent with the present theoretical frameworkand, at the same time, suitable for the empirical analysis carried out in thesecond part of the paper. We assume that the European government minimizesthe penalty in terms of welfare loss that is associated to the misalignmentbetween the common trade policy and each national platform. As a conse-quence, the EU government maximizes its utility minimizing the weighted sumof squares of those penalties as perceived by each member state. The weights
Special interest groups and trade policy in the EU 465
are given by the number of votes for each country in the Council of Ministers.We have:
Q j(p) = −
∑
k∈K
1
2θk
(tEU
j − t jk
)2(11)
where we have chosen the quadratic formulation for mathematical tractability,tEU
j is the common policy in sector j (∈ M), t jk is the optimal tariff platform insector j and country k (∈ K), and θk is the weight of country k within the EUpolitical arena.
3.4 Equilibrium
We can now find the equilibrium proceeding by backward induction. Theequilibrium concept adopted is subgame-perfect Nash equilibrium, that is:given the information available, the expectations on other agents’ behaviorand the specified rules of the game, agents define and follow the best strategysuch that they cannot gain from deviations at each stage.
Stage two
In the second stage, the European government minimizes Eq. 11, i.e. shemaximizes −Q j
(p). After setting:
tEUj = arg max
tEUj
∑
k∈K
1
2θk
(tEU
j − t jk
)2(12)
it is straightforward (see Appendix A) to obtain:
1
2
∂∑
k∈K θk
(tEU
j − t jk
)2
∂tEUj
=∑
k∈K
θk
(tEU
j − t jk
)+
∑
k∈K
θk
∂p∗j
∂tEUj
(13)
which, for tEUj that satisfies Eq. 12, equals zero, and we can write:
tEUj =
∑k∈K θkt jk
∑k∈K θk
+ ∂p∗j
∂tEUj
. (14)
where ∂p∗j/∂tEU
j is the terms of trade effect.
Stage one
To find the national platform t jk is more elaborate. Following Grossmanand Helpman (1994), an equilibrium trade policy in country k must be anequilibrium for each lobby and the member state k’s government. Given C jk,
a feasible lobby spending function ∀ j ∈ L = E ∪ S, this occurs if the followingtwo conditions are met:
1. tk = arg maxtk
(Wik − Cik) ∀i ∈ L
2. tk = arg maxtk
(W jk − C jk
) + b∑
i∈E Cik + ∑i∈S Cik + aWk ∀ j ∈ L.
466 M. Belloc, P. Guerrieri
As explained in Appendix A, the tariff rate that simultaneously satisfies 1.and 2. can be expressed as:
t jk = − ISjk + b IE
j − αL
αL + a
y jk(
pj)
m′jk
(pj
) , (15)
where j ∈ M and k ∈ K. In Eq. 15 symbols’ definitions are as follows: IEj is an
indicator that equals one if j ∈ E (European lobby) and zero otherwise; ISj is
an indicator that equals one if j ∈ S (state level lobby) and zero otherwise; αL isthe fraction of total population of voters represented by an organized (eithernational or European) group. Finally, we remark that a is the weight attachedto general welfare, b is the weight placed on European level pressure, andm′
jk
(pj
)stands for first derivative of m jk
(pj
).
To get the common tariff rate, we substitute t jk for Eq. 15 in Eq. 14and obtain:
tEUj = − 1
αL + a
∑
k∈K
φk
(IS
jk + b IEj − αL
) y jk(
pj)
m′jk
(pj
) + ∂p∗j
∂tEUj
, (16)
where j ∈ M and φk = θk/∑
k∈K θk.
Finally, after dividing both sides of Eq. 16 by pj and defining τ j = t j/pj =(pj − p∗
j
)/pj, we can also write:
τ EUj = 1
αL + a
∑
k∈K
φk
(IS
jk + b IEj − αL
) z jk(
pj)
e jk(
pj) + ∂p∗
j
∂tEUj
1
pj, (17)
where again j ∈ M, τ EUj is a construct based on the ad-valorem rate of protec-
tion for the EU , z jk = y jk/m jk is the inverse of the import penetration ratio,and e jk = −pjm′
jk/m jk is the absolute elasticity of import demand. Equation 17is very similar to the equation for the protection structure in Grossman andHelpman (1994) and so are the derived predictions. Since (1 + b − αL) ispositive, the model predicts that, if sector j is organized, the level of protectionis the higher, the larger the inverse of the import penetration and the smallerthe elasticity of import demand (in absolute terms). Indeed:
– z jk (= y jk/m jk) relates to the stakes from protection. The larger domesticoutput in a certain sector (numerator of z jk), the more specific-factorowners have to gain from protection (higher price) in that sector. Thelarger domestic import of a certain good (denominator of z jk), the less theeconomy as a whole has to lose from larger protection.
– The elasticity of import demand (e jk) is associated to the deadweight lossdue to deviations from free trade. The higher the import elasticity, thelarger the deadweight loss, the less the government is willing to grantprotection at the total population’s expenses.
– Finally, the terms of trade (∂p∗j/∂tEU
j × 1/pj) reflects the large countryeffect of trade policy. We expect the protection rate to be the higher, thestronger the large country effect.
Special interest groups and trade policy in the EU 467
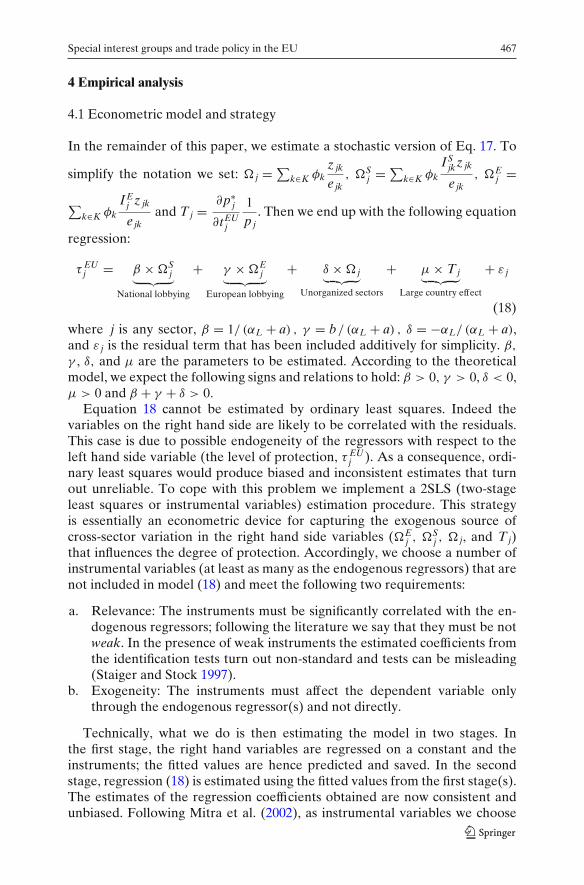
4 Empirical analysis
4.1 Econometric model and strategy
In the remainder of this paper, we estimate a stochastic version of Eq. 17. To
simplify the notation we set: � j = ∑k∈K φk
z jk
e jk, �S
j = ∑k∈K φk
ISjkz jk
e jk, �E
j =∑
k∈K φk
IEj z jk
e jkand T j = ∂p∗
j
∂tEUj
1
pj. Then we end up with the following equation
regression:
τ EUj = β × �S
j︸ ︷︷ ︸
National lobbying
+ γ × �Ej
︸ ︷︷ ︸European lobbying
+ δ × � j︸ ︷︷ ︸
Unorganized sectors
+ μ × T j︸ ︷︷ ︸
Large country effect
+ ε j
(18)
where j is any sector, β = 1/ (αL + a) , γ = b/ (αL + a) , δ = −αL/ (αL + a),and ε j is the residual term that has been included additively for simplicity. β,
γ , δ, and μ are the parameters to be estimated. According to the theoreticalmodel, we expect the following signs and relations to hold: β > 0, γ > 0, δ < 0,μ > 0 and β + γ + δ > 0.
Equation 18 cannot be estimated by ordinary least squares. Indeed thevariables on the right hand side are likely to be correlated with the residuals.This case is due to possible endogeneity of the regressors with respect to theleft hand side variable (the level of protection, τ EU
j ). As a consequence, ordi-nary least squares would produce biased and inconsistent estimates that turnout unreliable. To cope with this problem we implement a 2SLS (two-stageleast squares or instrumental variables) estimation procedure. This strategyis essentially an econometric device for capturing the exogenous source ofcross-sector variation in the right hand side variables (�E
j , �Sj , � j, and T j)
that influences the degree of protection. Accordingly, we choose a number ofinstrumental variables (at least as many as the endogenous regressors) that arenot included in model (18) and meet the following two requirements:
a. Relevance: The instruments must be significantly correlated with the en-dogenous regressors; following the literature we say that they must be notweak. In the presence of weak instruments the estimated coefficients fromthe identification tests turn out non-standard and tests can be misleading(Staiger and Stock 1997).
b. Exogeneity: The instruments must affect the dependent variable onlythrough the endogenous regressor(s) and not directly.
Technically, what we do is then estimating the model in two stages. Inthe first stage, the right hand variables are regressed on a constant and theinstruments; the fitted values are hence predicted and saved. In the secondstage, regression (18) is estimated using the fitted values from the first stage(s).The estimates of the regression coefficients obtained are now consistent andunbiased. Following Mitra et al. (2002), as instrumental variables we choose
468 M. Belloc, P. Guerrieri
variables that include different forms of domestic (non-trade) support andrepresent sector-specific characteristics. They are likely to be strongly corre-lated with sectoral performance such as the level of output, imports, marketpower and organization ability, but not to exert direct effects (besides thoseproduced through the just mentioned channels) on the rate of protection (thesehypothesis are verified in Subsection 4.3).
Finally, in the estimation, we allow for errors to be correlated throughclustering across sectors by using heteroskedasticity robust standard errors.
4.2 Data and variables’ construction
To estimate model (18) we need data on output and demand, prices, sectoralcharacteristics and protection rates, behavioral parameters for the membercountries forming the EU as well as for the EU as an aggregate. To satisfy ourdata requirements we mainly use the Global Trade Analysis Project (2005)(GTAP) dataset version 6, which provides data on trade, production anddemand for several countries and regions, and for 57 sectors. In what followswe briefly describe the variables used.
Protection The dependent variable τ EUj is the ad-valorem equivalent rate of
protection. It includes tariff as well as non-tariff barriers. Following Belfrage(2004), it is obtained by the ratio of the sum of import tax revenue and exportsubsidy to the sum of imports and exports. This measure includes both tariffand non-tariff barriers as the non-tariff barriers have been converted to tradetax/subsidy equivalents in the GTAP database.
Import penetration ratio, demand elasticity and political weights To construct
� j = ∑k∈K
φkz jk
e jkwe need data on national value output, volumes of domestic
imports and private demand (that is, in turn, the sum of total private domesticpurchases and import) that are directly provided by the GTAP database. e jk isobtained following Hertel (1997) and Belfrage (2004) to whom we refer thereader for further details. The weights φk are equal to the share of votesavailable to each member country in the Council of Ministers (reported inAppendix B.2).
Terms of trade effect Departing from the previous literature, our model in-cludes the large country effect of tariff formation. This is analytically obtainedfrom the maximization of Eq. 12 and the assumption that the EU as a wholeis indeed large with respect to the rest of the world. The large country effect,T j, is proxied by the share of European imports in world trade for each sectorj (see also Belfrage 2004).
Instrumental variables Resorting again to the GTAP database, we use dif-ferent forms of domestic (non-trade) support that represent sector-specificcharacteristics, namely: output subsidies, tax on primary factors (labor), taxon primary factors (capital), private domestic consumption taxes, government
Special interest groups and trade policy in the EU 469
domestic consumption taxes, government’s domestic purchases taxes, firms’purchases of primary factors, spending for unskilled labor, dummy variablesfor manufacturing and agricultural sectors.
Political dummies To construct ISjk and IE
j , where the former represents adummy for lobbies at the national level, while the latter stands for lobbies atthe European level, is not straightforward. Indeed contributions data in theEuropean countries simply do not exist, as they would denote illegal activities.This is maybe the major reason why the literature on lobbying and tradepolicy has so far privileged the US. In this paper, we try to circumvent theproblem by constructing proxy variables. In particular, we rely on a heuristicapproach and assume that industries that are most likely to be organized inpressure groups are those characterized by large firms. This choice is coherentwith the literature on organized groups and collective action for three mainreasons. First, bigger industry size is associated with larger stakes involved incooperation among producers to ask for protection. As emphasized by Tavares(2006), the larger the industry asking for protection, the greater is the incentiveto take part in the tariff-setting process. Second, larger firms are associatedto a larger number of votes in the elections, then to more effective lobbying.Finally, big size enterprises tend to concentrate a large number of people inthe same environment so leading to cooperation. Although collective actionand free-riding problems can also arise (see, in particular Olson 1965), webelieve the above motivations sufficient to assume that larger firms are betterable to exert pressure on policy makers (see also Balaoing and Francois 2006;Karacaovali and Limão 2005; Tavares 2006). Thus, we collect data on valueadded and number of firms present in each sector from the Eurostat Industry,Trade and Services (2006) database. IS
jk is set equal to one if the average valueadded per firm in the considered industry is in the 70th percentile of the sector-specific and country-specific distribution, and zero otherwise. IE
j is defined inan analogous way with respect to the European aggregates’ distribution. Thisreasoning is not valid, however, for agricultural sectors that, as well known,enjoy a privileged position with regard to protection in the EU, regardlessfarms’ size. Consequently, rather than constructing the proxy as explainedabove, we always set the European political dummy variable equal to one ifthe sector is agricultural.
The methodology explained above presents two major problems. First, itsuffers from arbitrariness since the criterion chosen to identify organized sec-tors is only one among several possible alternatives, all coherent with theory.Second, our identification strategy distinguishes organized from unorganizedsectors regardless the specific policy issue considered. In facts we are unableto establish the reason why a sector is said to be organized, and to separatetrade policy concerns from any other, for instance from domestic policies notrelated to trade (for a discussion on this limitation of the identification strategywith regard to previous empirical works on the political economy of trade seeGawande and Krishna 2003).
To verify the proposed classification, we implement a validation proceduresuggested by Mitra et al. (2002). Accordingly, we run a probit regression of the
470 M. Belloc, P. Guerrieri
(ex-ante) political dummy, constructed as explained above, on a number ofvariables that denote industry characteristics and are likely to be correlatedwith the ability of a given sector to sheer political favor, some explicitlyrelating to trade policy. They are: percentage of value of total purchase ofa certain good over total expenditures, elasticity of import demand, firms’domestic purchases and imports of intermediate goods, value of imports,spending for unskilled labor, dummies for agricultural and manufacturing(versus extraction) sectors. Then we construct a new dummy (ex-post) thatis equal to one if the predicted probability that a sector is organized exceedsthe 60% and zero otherwise. As a last step, we compare pairwise the politicaldummies constructed with the two alternative procedures (respectively ex-anteand ex-post classification). With regard to national lobbies we obtain that ex-ante classification is validated in the 84% of cases; whereas with regard toEuropean lobbies the 90% of cases are correctly predicted. These percent-ages are fairly large (also considering the small size of the sample used) tosupport the ex-ante classification that will be used in the econometric analysisthat follows.
We are aware, however, that severe problems of misclassification may affectour econometric analysis, and this is why we warn the reader to take resultswith prudence. Further effort to find a more appropriate identification strategyis required in the future, in order to single out organized sectors with moreaccuracy and to focus on trade policy concerns only. This seems a fertile fieldfor research.
Sample A last notice concerns the sample of sectors and countries used inthe estimation. The GTAP database covers 57 industries out of which weextract only those that produce tradable goods and for whom market pricescomparisons among countries is sensible. This leaves us with 41 sectors. Thelist of included sectors is provided in Appendix B.1. Data are referred to2001. We thus refer to the 15 countries belonging to the EU in that year(Austria, Belgium, Denmark, Finland, France, Germany, Greece, Ireland,Italy, Luxemburg, Netherlands, Portugal, Spain, Sweden, and the UK). Ag-gregation is implemented as required by the model and explained in the text.
4.3 Results
Table 1 reports our results from the 2SLS estimation of model (18).As one can notice, our econometric output strongly supports the predic-
tions suggested by the theoretical model: protection to (either national orEuropean) organized sectors is positively related to the level of weightedaverage of the inverse of the import penetration ratio in the 15 EU countriesand negatively related to the weighted average of absolute values of nationalimport elasticity. The opposite holds for unorganized sectors. This result isconsistent with the predictions of the original GH model.
To confirm the reliability of our conclusions, some checks on instruments’reliability are compelling. First (condition a.), we want to be sure that
Special interest groups and trade policy in the EU 471
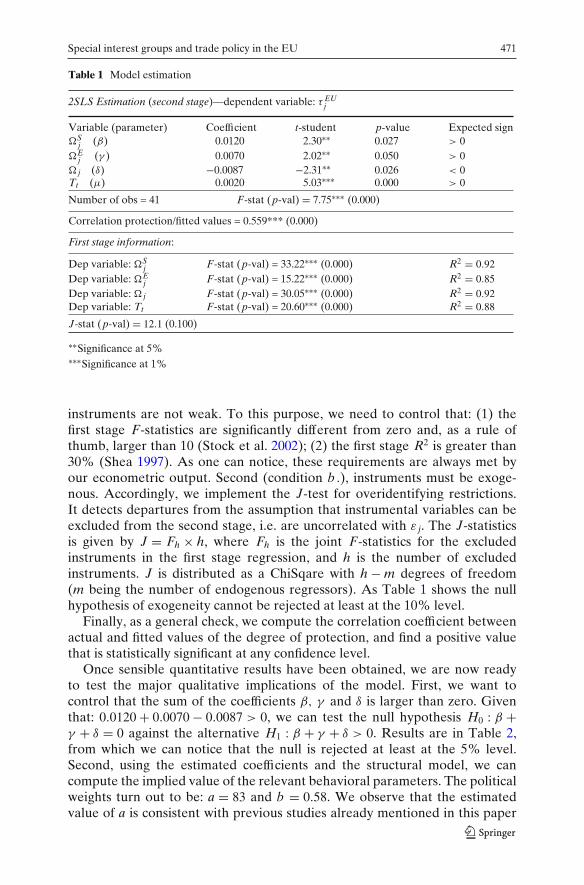
Table 1 Model estimation
2SLS Estimation (second stage)—dependent variable: τ EUj
Variable (parameter) Coefficient t-student p-value Expected sign�S
j (β) 0.0120 2.30∗∗ 0.027 > 0
�Ej (γ ) 0.0070 2.02∗∗ 0.050 > 0
� j (δ) −0.0087 −2.31∗∗ 0.026 < 0Tt (μ) 0.0020 5.03∗∗∗ 0.000 > 0
Number of obs = 41 F-stat (p-val) = 7.75∗∗∗ (0.000)
Correlation protection/fitted values = 0.559*** (0.000)
First stage information:
Dep variable: �Sj F-stat (p-val) = 33.22∗∗∗ (0.000) R2 = 0.92
Dep variable: �Ej F-stat (p-val) = 15.22∗∗∗ (0.000) R2 = 0.85
Dep variable: � j F-stat (p-val) = 30.05∗∗∗ (0.000) R2 = 0.92Dep variable: Tt F-stat (p-val) = 20.60∗∗∗ (0.000) R2 = 0.88
J-stat (p-val) = 12.1 (0.100)
∗∗Significance at 5%∗∗∗Significance at 1%
instruments are not weak. To this purpose, we need to control that: (1) thefirst stage F-statistics are significantly different from zero and, as a rule ofthumb, larger than 10 (Stock et al. 2002); (2) the first stage R2 is greater than30% (Shea 1997). As one can notice, these requirements are always met byour econometric output. Second (condition b .), instruments must be exoge-nous. Accordingly, we implement the J-test for overidentifying restrictions.It detects departures from the assumption that instrumental variables can beexcluded from the second stage, i.e. are uncorrelated with ε j. The J-statisticsis given by J = Fh × h, where Fh is the joint F-statistics for the excludedinstruments in the first stage regression, and h is the number of excludedinstruments. J is distributed as a ChiSqare with h − m degrees of freedom(m being the number of endogenous regressors). As Table 1 shows the nullhypothesis of exogeneity cannot be rejected at least at the 10% level.
Finally, as a general check, we compute the correlation coefficient betweenactual and fitted values of the degree of protection, and find a positive valuethat is statistically significant at any confidence level.
Once sensible quantitative results have been obtained, we are now readyto test the major qualitative implications of the model. First, we want tocontrol that the sum of the coefficients β, γ and δ is larger than zero. Giventhat: 0.0120 + 0.0070 − 0.0087 > 0, we can test the null hypothesis H0 : β +γ + δ = 0 against the alternative H1 : β + γ + δ > 0. Results are in Table 2,from which we can notice that the null is rejected at least at the 5% level.Second, using the estimated coefficients and the structural model, we cancompute the implied value of the relevant behavioral parameters. The politicalweights turn out to be: a = 83 and b = 0.58. We observe that the estimatedvalue of a is consistent with previous studies already mentioned in this paper
472 M. Belloc, P. Guerrieri
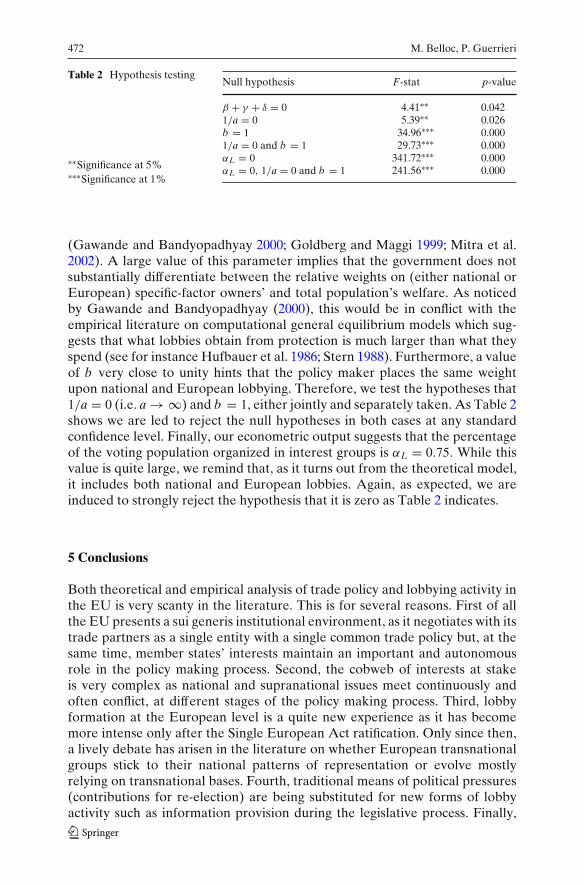
Table 2 Hypothesis testing
∗∗Significance at 5%∗∗∗Significance at 1%
Null hypothesis F-stat p-value
β + γ + δ = 0 4.41∗∗ 0.0421/a = 0 5.39∗∗ 0.026b = 1 34.96∗∗∗ 0.0001/a = 0 and b = 1 29.73∗∗∗ 0.000αL = 0 341.72∗∗∗ 0.000αL = 0, 1/a = 0 and b = 1 241.56∗∗∗ 0.000
(Gawande and Bandyopadhyay 2000; Goldberg and Maggi 1999; Mitra et al.2002). A large value of this parameter implies that the government does notsubstantially differentiate between the relative weights on (either national orEuropean) specific-factor owners’ and total population’s welfare. As noticedby Gawande and Bandyopadhyay (2000), this would be in conflict with theempirical literature on computational general equilibrium models which sug-gests that what lobbies obtain from protection is much larger than what theyspend (see for instance Hufbauer et al. 1986; Stern 1988). Furthermore, a valueof b very close to unity hints that the policy maker places the same weightupon national and European lobbying. Therefore, we test the hypotheses that1/a = 0 (i.e. a → ∞) and b = 1, either jointly and separately taken. As Table 2shows we are led to reject the null hypotheses in both cases at any standardconfidence level. Finally, our econometric output suggests that the percentageof the voting population organized in interest groups is αL = 0.75. While thisvalue is quite large, we remind that, as it turns out from the theoretical model,it includes both national and European lobbies. Again, as expected, we areinduced to strongly reject the hypothesis that it is zero as Table 2 indicates.
5 Conclusions
Both theoretical and empirical analysis of trade policy and lobbying activity inthe EU is very scanty in the literature. This is for several reasons. First of allthe EU presents a sui generis institutional environment, as it negotiates with itstrade partners as a single entity with a single common trade policy but, at thesame time, member states’ interests maintain an important and autonomousrole in the policy making process. Second, the cobweb of interests at stakeis very complex as national and supranational issues meet continuously andoften conflict, at different stages of the policy making process. Third, lobbyformation at the European level is a quite new experience as it has becomemore intense only after the Single European Act ratification. Only since then,a lively debate has arisen in the literature on whether European transnationalgroups stick to their national patterns of representation or evolve mostlyrelying on transnational bases. Fourth, traditional means of political pressures(contributions for re-election) are being substituted for new forms of lobbyactivity such as information provision during the legislative process. Finally,
Special interest groups and trade policy in the EU 473
and as a consequence of the above points, data on political contributions aresimply not available for European countries.
Our study has been addressed to cope with the mentioned difficulties. Thechosen strategy has consisted in taking a well theoretically founded modelof trade policy formation in the presence of lobby groups (Grossman andHelpman 1994), and tailoring it to fit, as much as possible, the EU institutionalenvironment. To accomplish this goal we resorted to a game model wherepolicy formation at the European level is the result of two stages: in the firststage national representatives’ preferences are formed, and in the second onethey are aggregated in a common trade policy measure. We have then derivedan estimable model and tested it with data from the Global Trade AnalysisProject and the Eurostat. Our results are interesting. We obtain that the modelfits very well the data as all the theoretical predictions are largely confirmed.Lobby groups, at both national and international levels, manage to obtainhigher protection the higher the inverse of the import penetration ratio andthe lower the deadweight loss for protection (price effect on imports). Theterms of trade exerts a further positive effect on the level of trade protection.While these results seem very promising a note of caution is due. Indeed, theabsence of data on political contributions (or on sensible proxies) represents astrong constraint to the research on the political economy of trade in the EU.As already noticed, this has strongly affected our identification strategy thathad to rely on indirect and approximate selection criteria. On the other side,the increasing role acquired by supranational interest groups in the Europeanarena suggests that the issues presented in this paper represent a rich andfertile field for inquiry. We believe that further research effort should bedirected, in the future, to data collection in order to obtain more robust andreliable empirical evidence in this field.
Acknowledgements This work is part of the Research Program of National Scientific Relevance(PRIN) on “The new multilateral trade negotiations within the World Trade Organization (DohaRound): liberalisation prospects and the impact of the Italian economy”. Financial support by theItalian Ministry of Universities and Scientific Research is gratefully acknowledged. We would liketo thank Carl-Johan Belfrage and Betina V. Dimaranan for useful suggestions. Usual disclaimersapply.
Appendix:
A: Mathematical appendix
A.1 Proof of Eq. 14:
To obtain Eq. 14, we maximize (∀ j ∈ M):
∑
k∈K
1
2θk
[tEU
j − t jk
]2(19)
474 M. Belloc, P. Guerrieri
The first order condition is:
1
2
∂∑
k∈K θk
[tEU
j − t jk
]2
∂tEUj
=∑
k∈K
θk
[tEU
j − t jk
]+
∑
k∈K
θk
∂p∗j
∂tEUj
= 0 (20)
Whence:
tEUj =
∑k∈K θkt jk
∑k∈K θk
+ ∂p∗j
∂tEUj
(21)
A.2 Proof of Eq. 15:
To find Eq. 15 for each member country, we need to find t jk such that thefollowing two conditions are met:
1. tk = arg maxtk
(Wik − Cik) , ∀i ∈ L;2. tk = arg max
tk
(W jk − C jk
) + b∑
i∈E Cik + ∑i∈S Cik + aWk, ∀ j ∈ L.
From 1., we get (∀ j ∈ L and k ∈ K):
∇C jk = ∇W jk (22)
and, from 2.:
∇ (W jk − C jk
) + b∑
i∈E
∇Cik +∑
i∈S
∇Cik + a∇Wk = 0 (23)
Summing Eq. 22 over j, and combining with Eq. 23, it follows:
b∑
i∈E
∇Wik +∑
i∈S
∇Wik + a∇Wk = 0 (24)
where Wik(p) ≡ lik + πik (pi) + αik Nk
[r(p) + s
(p)]
. Since t j =(
pj − p∗j
)and
p∗j is exogenous, we can derive with respect to pj (notice that some mathemat-
ical details are skipped for reasons of space). We have:
∂sik
∂pj= p jd′
jk
(pj
) − p jd′jk
(pj
) − d jk(
pj) = −d jk
(pj
), j ∈ M (25)
∂rik
∂pj= 1
Nkm jk
(pj
) + 1
Nk
(pj − p∗
j
)m′
jk
(pj
), j ∈ M (26)
∂Wik
∂pj= y jk
(pj
) − αi Nkd jk(
pj) + αim jk
(pj
) + αi
(p j − p∗
j
)m′
jk
(pj
),
i ∈ L, j ∈ M (27)
Special interest groups and trade policy in the EU 475
where we have used the fact that: m jk(
pj) − Nkd jk
(pj
) = −y jk(
pj), αi = αik
∀k ∈ K and u′ [d jk(
pj)] = pj. Separating national from European lobbies, it
follows that:
∂Wik
∂pj= (
δ jS − αiS)
y jk(
pj) + αiS
(pj − p∗
j
)m′
jk
(pj
), i ∈ S, j ∈ M (28)
∂Wik
∂pj= (
η jE − αiE)
y jk(
pj) + αiE
(pj − p∗
j
)m′
jk
(pj
), i ∈ E, j ∈ M (29)
where δ jS = 1 if i ∈ S and = 0 otherwise, whereas η jE = 1 if i ∈ E and = 0otherwise. Then, aggregating Eqs. 28 and 29 over i ∈ L, the first two termsof the summation in Eq. 24 turn out to be (with j ∈ M):
∑
i∈S
∂Wik
∂pj+ b
∑
i∈E
∂Wik
∂pj=
(IS
jk + b IEj − αL
)y jk
(pj
) + αL
(pj − p∗
j
)m′
jk
(pj
)
(30)
where IEi ≡ ∑
i∈E ηiE = 1 if i ∈ E and = 0 otherwise, ISik ≡ ∑
i∈S δiS = 1 if i ∈ Sin country k and = 0 otherwise. For simplicity we set αL = αS + bαE, whereαS ≡ ∑
i∈S αiS (αE ≡ ∑i∈E αiE) is the fraction of total population of voters
represented by an organized national (European) group. We derive now Wk
with respect to pj and get (with k ∈ K and j ∈ M):
∂Wk
∂pj= y jk
(pj
) + N[
−d jk(
pj) + 1
Nm jk
(pj
) + 1
N
(pj − p∗
j
)m′
jk
(pj
)]
=(
pj − p∗j
)m′
jk
(pj
)(31)
Thus, combining Eqs. 30 and 31 in Eq. 24, we have:
(IS
j + b IEj − αL
)y jk
(pj
) + αL
(pj − p∗
j
)m′
jk
(pj
) + a(
pj − p∗j
)m′
jk
(pj
) = 0
αLt jkm′jk
(pj
) + at jkm′jk
(pj
) +(
ISj + b IE
j − αL
)y jk
(pj
) = 0
t jk = − ISj + b IE
j − αL
αL + a
y jk(
pj)
m′jk
(pj
) , where ISi + b IE
i − αL > 0, (32)
that is the tariff platform for country k. From Eq. 21 and substituting t jk forEq. 32, we can finally write:
tEUj = − 1
∑k∈K θk
ISj + b IE
j − αL
αL + a
∑
k∈K
θky jk
(pj
)
m′jk
(pj
) + ∂p∗j
∂tEUj
(33)
476 M. Belloc, P. Guerrieri
Dividing both sides of Eq. 33 by pj, defining e jk = −m′jk p j/m jk, and
using the fact that:
− 1∑
k∈K θk
∑
k∈K
θk y jk
m′jk
1
pj= − 1
∑k∈K θk
(θ1 y j1
m′j1 pj
m j1
m j1+ θ2 y j2
m′j2 pj
m j2
m j2+ ...
+ θK y jK
m′jK p j
m jK
m jK
)
= 1∑
k∈K θk
(
θ1y j1/m j1
e j1+ θ2
y j2/m j2
e j2+ ...
+ θKy jK/m jK
e jK
)
= 1∑
k∈K θk
∑
k∈K
(
θkz jk
e jk
)
, (34)
we obtain Eq. 17.
B: Appendix to the empirical analysis
B.1 List of sectors included in the analysis:
1—Paddy rice; 2—Wheat; 3—Cereal grains nec; 4—Vegetables, fruit, nuts; 5—Oil seeds; 6—Sugar cane, sugar beet; 7—Plant-based fibers; 8—Crops nec;9—Bovine cattle, sheep and goats, horses; 10—Animal products nec; 12—Wool, silk-worm cocoons; 13—Forestry; 14—Fishing; 15—Coal; 16—Oil; 17—Gas; 18—Minerals nec; 19—Bovine cattle, sheep and goat, horse meat prods;20—Meat products nec; 21—Vegetable oils and fats; 22—Dairy products;23—Processed rice; 24—Sugar; 25— Food products nec; 26—Beverages andtobacco products; 27—Textiles; 28—Wearing apparel; 29—Leather products;30—Wood products; 31—Paper products, publishing; 32—Petroleum, coalproducts; 33—Chemical, rubber, plastic products; 34—Mineral products nec;35—Ferrous metals; 36—Metals nec; 37—Metal products; 38—Motor vehiclesand parts; 39—Transport equipment nec; 40—Electronic equipment; 41—Machinery and equipment nec; 42—Manufactures nec.
Source: http://www.gtap.agecon.purdue.edu/.Note: All the services are excluded. Furthermore we do not include in
the analysis those sectors where market prices comparisons among countrieswould be misleading. The criterion (suggested by Belfrage 2004) is not toinclude in the analysis sectors for whom concordance with the internationalclassification system for tradable goods (SITC/HS) is not available. This leadsus to exclude the raw milk sector.
Special interest groups and trade policy in the EU 477
B.2 List of countries and relative political weights:
1—Austria (4); 2—Belgium (5); 3—Denmark (3); 4—Finland (3); 5—France(10); 6—Germany (10); 7—Greece (5); 8—Ireland (3); 9—Italy (10); 10—Luxembourg (2); 11—Netherlands (5); 12—Portugal (5); 13—Spain (8); 14—Sweden (4); and the 15—UK (10).
Source: http://europa.eu.int/
References
Balaoing A, Francois J (2006) The political economy of protection in a customs union: what drivesthe tariff structure of the EU? Mimeo, Tinbergen Institute, Erasmus University Rotterdam
Belfrage C-J (2004) Special interest politics and trade policy—an empirical challenge. Mimeo,Department of Economics, Lund University
Broscheid A, David C (2003) Insider and outsider lobbying of the European commission aninformational model of forum politics. Eur Union Polit 4(2):1465–1165
Cadot O, de Melo J, Olarreaga M (1999) Regional integration and lobbying for tariffs againstnon-members. Int Econ Rev 40(3):635–657
Cohen D (1997) The European business lobby. Bus Strateg Rev 8(4):17–25Crombez C (2002) Information, lobbying and the legislative process in the European Union. Eur
Union Polit 3(1):7–32Eurostat Industry, Trade and Services (2006) http://epp.eurostat.cec.eu.int/pls/portal/url/page/
SHARED/PER_INDCOMGawande K, Bandyopadhyay U (2000) Is protection for sale? Evidence on the Grossman–
Helpman theory of endogenous protection. Rev Econ Stat 82(1):139–152Gawande K, Krishna P (2003) The political economy of trade policy: empirical approaches. In:
Kwan Choi E, Harrigan J (eds) Handbook of international trade, vol I. Blackwell, Malden,MA, pp 213–250
Goldberg P, Maggi G (1999) Protection for sale: an empirical investigation. Am Econ Rev89(5):1135–1155
Grossman GM, Helpman E (1994) Protection for sale. Am Econ Rev 84(4):833–850Grossman GM, Helpman E (1995a) Trade wars and trade talks. J Polit Econ 103(4):675–708Grossman GM, Helpman E (1995b) The politics of free trade agreements. Am Econ Rev 85:
667–690Global Trade Analysis Project (2005) GTAP version 6 database. Purdue University Press, West
Lafayette, INHertel TW (1997) Global trade analysis: modeling and applications. Cambridge University Press,
CambridgeHufbauer GC, Clyde B, Elliott KA (1986) Trade protection in the US, 31 case studies. Institute
for International Economics, Washington, DCKaracaovali B, Limão N (2005) The clash of liberalizations: preferential vs. multilateral trade
liberalization in the European Union. World Bank WP 3493Mazey S, Richardson J (1993) Transference of power, decision rules, and the rules of the game.
In: Mazey S, Richardson J (eds) Lobbying in the European community. Oxford UniversityPress, Oxford, pp 3–26
McCalman P (2004) Protection for sale and trade liberalization: an empirical investigation. RevInt Econ 12(1):81–94
Mitra D, Thomakos DD, Ulubasoglu MA (2002) Protection for sale in a developing country:democracy vs. dictatorship. Rev Econ Stat 84(3):497–508
Olson M (1965) The logic of collective action. Harvard University Press, Cambridge, MAPersson T (1998) Economic policy and special interest politics. Econ J 108(447):310–327Shea J (1997) Instrument relevance in multivariate linear models: a simple measure. Rev Econ
Stat 2(49):348–352Stern PM (1988) The best congress money can buy. Pantheon, New York
478 M. Belloc, P. Guerrieri
Staiger D, Stock JH (1997) Instrumental variable regression with weak instruments. Econometrica5(65):557–586
Stock JH, Wright JH, Yogo M (2002) A survey of weak instruments and weak identification ingeneralized method of moments. J Busi Econ Stat 20(4):518–529
Tavares S (2006) Deeper integration and voting on the common European external. MPRA Paper960, University Library of Munich, Germany