Spatiotemporal distribution of facilitation and inhibition of return arising from the reflexive...
53
1 Spatio-temporal distribution of facilitation and inhibition of return arising from the reflexive orienting of covert attention. Alexander Collie 1,2, , Paul Maruff 1,2 , Murat Yucel 1,2 , James Danckert 1,2 & Jon Currie 1,3 From 1. The Neurophysiology and Neurovisual Research Unit, Mental Health Research Institute of Victoria, Parkville, Victoria, Australia. 2. School of Psychological Sciences, La Trobe University, Bundoora, Victoria, Australia. 3. Brain Research Unit, Drug and Alcohol Services, Westmead Hospital, Westmead, Sydney, Australia. All correspondence should be addressed to: Paul Maruff Neurophysiology and Neurovisual Research Unit Mental Health Research Institute of Victoria Parkville Victoria Australia 3052 Telephone -61 3 9388 1633 Fax -61 3 9387 5061 Email [email protected]
Transcript of Spatiotemporal distribution of facilitation and inhibition of return arising from the reflexive...

1
Spatio-temporal distribution of facilitation and inhibition of return arising from the
reflexive orienting of covert attention.
Alexander Collie1,2,, Paul Maruff 1,2, Murat Yucel 1,2, James Danckert 1,2 & Jon Currie1,3
From 1. The Neurophysiology and Neurovisual Research Unit,
Mental Health Research Institute of Victoria,
Parkville, Victoria, Australia.
2. School of Psychological Sciences,
La Trobe University,
Bundoora, Victoria, Australia.
3. Brain Research Unit, Drug and Alcohol Services,
Westmead Hospital, Westmead,
Sydney, Australia.
All correspondence should be addressed to: Paul Maruff Neurophysiology and Neurovisual Research Unit Mental Health Research Institute of Victoria Parkville Victoria Australia 3052
Telephone -61 3 9388 1633 Fax -61 3 9387 5061 Email [email protected]

2
Abstract
Currently, there is debate regarding both the spatial and temporal relationship between
facilitation and inhibition of return (IOR) components of attention, as observed on the
covert orienting of visual attention task (COVAT). These issues were addressed in a
series of experiments where the spatial and temporal relationships between cue and target
were manipulated. Facilitation occured only when the SOA was short and there was
temporal overlap between cue and target. IOR occurred only when SOA was long and
there was no temporal overlap between cue and target. Facilitation encompased the cued
location and all locations between the cue and fixation, while IOR arose for the entire
cued hemifield. These findings suggest that the facilitation and IOR found on COVATs
which use non-informative peripheral cues are separable and stimulus driven processes.

3
Introduction
The covert orienting of visual attentional task (COVAT), developed by Posner (1980),
has been influential in the development of psychological theories of visual attention. In
almost all COVAT studies that have used non-informative peripheral cues, response
times (RT) to targets at cued locations are faster than RTs to uncued targets when the
time between the onset of the cue and the onset of the target (stimulus onset asynchrony;
SOA) is less than approximately 250msec (facilitation; see Table 1). At SOAs greater
than 250msec, RTs to cued locations are slower than RTs to uncued locations (inhibition
of return [IOR]; see Table 1). While IOR to cued locations is almost always observed to
follow facilitation on the COVAT when target onset is indicated by the appearance of a
new object or item (see Table 1), there are still unresolved issues regarding the nature of
reflexive attentional shifts to COVAT displays. One of these concerns the nature of, and
relationship between, facilitation and IOR.
The relationship between facilitation and IOR
The debate concerning the relationship between facilitation and IOR centres on the
question of whether these phenomena are two parts of a single biphasic process or
independent processes. While the majority of researchers have observed that IOR at long
SOAs always follows facilitation at short SOAs (ie; the biphasic effect; Lambert &
Hockey, 1991; Posner et al, 1985; Posner et al, 1987; Rafal et al, 1989; Rafal & Henik,
1994), other groups have found that RTs to cued targets are slower than RTs to uncued
targets at both short or long SOAs (Berlucchi et al, 1989; Tassinari et al, 1989; Tassinari
et al, 1994; Tassinari & Berlucchi, 1996). Importantly, these different patterns of

4
COVAT performance have led to very different theories about how attention is oriented
covertly. For example, the biphasic effect has been interpreted to reflect that facilitation
arises at short SOAs because the attentional focus is attracted reflexively to the location
of the peripheral cue (Jonides, 1981; Rafal et al, 1989; Rafal & Henik, 1994). The
inhibition observed on the COVAT has been proposed to reflect either a bias against
returning the attentional focus to a previously examined location (Reuter-Lorenz et al,
1996), or a motor bias against responding in the direction of the cued location (Klein &
Taylor, 1994; Rafal & Henik, 1994).
In contrast to the biphasic model, some research finds very little or no significant
facilitation at short SOAs. In fact, IOR has been found for SOAs ranging from 0 to
4000msec (Tassinari et al, 1989; Tassinari et al, 1994; Tassinari & Berlucchi, 1996).
This inhibition has been inferred to occur as a consequence of the COVAT requirement
that subjects maintain fixation at the central location. While peripheral cues initiate the
preparation of a saccade toward the cued location, the COVAT requires that this saccade
be inhibited. As a consequence, the motor system is biased against responding to targets
appearing at previously cued locations. The magnitude of IOR is assumed to be constant
across the entire cued visual field. More specifically, this motor theory proposes that
facilitation observed at short SOAs arises only because there is a summation of light
energy when there is temporal overlap between the cue and target (Tassinari et al, 1989;
Tassinari et al, 1994; Tassinari & Berlucchi, 1996), while the inhibition observed at long
SOAs occurs due to a motor bias such as that described above. A review of covert
orienting studies that have used non-informative peripheral cues and onset target
detection accords well with this observation (see Table 1). The motor hypothesis of IOR
is also supported by findings from attentional paradigms which require saccadic and

5
manual responses to previously cued locations, and from temporal order judgement tasks
(see Taylor & Klein, 1998 for review; Gibson & Egeth, 1994a; 1994b; Klein & Taylor,
1994). In contrast, attentional models are unable to account for IOR occurring at early
SOAs, such as that found by Tassinari and colleagues. For example, the spotlight model
(described below) proposes that targets appearing in the cued location will be facilitated
at short SOAs.
An analysis of studies that have investigated reflexive attentional shifts in response to
uninformative peripheral cues indicates that the interaction between SOA, the temporal
relationship between cue and target, and the target duration can account for the presence
or absence of facilitation and IOR in nearly all COVAT experiments conducted to date
(see Table 1). Taken together, these results suggest that facilitation and IOR are
separable processes, and that the relative speed of RTs to targets appearing at the cued
location for any SOA (and therefore the presence of a RT advantage for targets appearing
at either the cued or uncued location) is dependent on the interaction between the two
processes.
In a recent study of reflexive orienting, we identified a set of conditions necessary for
facilitation to occur at short SOAs (Maruff et al, 1999). Facilitation required temporal
overlap between cue and target and the target to remain visible until the response was
made. Without both of these conditions no significant facilitation occurred at the short
SOAs. Interestingly, this facilitation was not restricted to the early SOA as proposed by
Tassinari and colleagues and by most current models of reflexive orienting. Instead, RTs
to targets appearing at the cued location were reduced by approximately 20msec across
all SOAs when there was temporal overlap between the cue and target. At short SOAs

6
this caused RTs to cued targets to become significantly faster than RTs to uncued targets,
and this was hypothesised to reflect the effects of facilitation.
In a series of recent studies, Tassinari and colleagues failed to find significant facilitation
in their covert orienting experiments even under conditions in which there was temporal
overlap between cue and target at short SOAs. More specifically, Tassinari et al (1994)
observed significant IOR at 0msec SOA, and consequently inferred that the onset of IOR
precedes the onset of facilitation, a proposition which conflicts directly with the results of
most recent covert orienting studies (see Table 1). One explanation for Tassinari et al’s
(1994) results was offered recently by Lupianez and Weaver (1998), who suggested that
their findings are due to a change in the task requirements at 0msec SOA. In Tassinari et
al’s experiments, at both long and short SOAs, subjects were required to detect a
luminance increase (target onset). However, trials where cue and target appeared
simultaneously and at the same location (0msec SOA) could easily have been confused
with trials where the target is delayed and the cue appears alone. Effectively, subjects
were then required to discriminate between these two types of trials, which resulted in
slower RTs to trials where cue and target appear simultaneously and at the same location.
Therefore, the early inhibitory effect observed at 0msec SOA by Tassinari and colleagues
(1994) is most likely due to a change in task requirements rather than the effects of IOR.
Lupianez and Weaver (1998) also point out that discriminating 0msec SOA trials where
cue and target appear in the same location is more difficult than discriminating 0msec
SOA trials where cue and target appear in opposite hemifields, another factor which
could account for Tassinari et al’s (1994) observation of an early inhibitory effect.

7
When considered together, the results of recent covert orienting experiments suggest that
temporal overlap between cue and target results in a reduction in RT at both short and
long SOAs. The reduction in RT under overlapping cue-target conditions at long SOAs
found by Maruff et al (1999) may be accounted for by two alternative explanations. If
the continued presence of the cue at the subsequent target location means that IOR does
not arise, or is delayed such that it is not evident at long SOAs, then the 20 msec
reduction observed by Maruff et al (1999) must be due to the increased preparation time
prior to response. In this case, it would be argued that neither facilitation nor IOR are
affecting RTs at long SOAs. Alternatively, it may be that the continued presence of the
cue causes facilitatory processes to remain active, and that the effect of this facilitation at
long SOAs is to cancel out the IOR that has arisen by that time, such that RTs to both
cued and uncued targets are equal. In this case, it would be argued that both facilitation
and IOR are having an effect on RT at long SOAs. Both explanations account for the
finding that significant IOR occurred only at later SOAs when there was no temporal
overlap between cue and target. Specifically, the former hypothesis would propose that
inhibition has time to arise when the cue is only present at the subsequent target location
for a short period of time. The latter hypothesis would propose that IOR is observed
because facilitation is unable to mask the effects of IOR when temporal conditions are
not optimal for the appearance of facilitation.
These observations suggest that facilitation arises because of the physical properties of
the spatial cues themselves, consistent with the energy summation hypothesis of Tassinari
and colleagues. However, the Tassinari hypothesis contradicts conventional models of
reflexive attention which propose that facilitation arises because of attentional shifts, the
speed of which depend on the direction and distance over which the shift must occur

8
(Posner et al, 1987; Shepherd & Muller, 1988; Henderson, 1991; Rafal & Henik, 1994).
One method of assessing whether facilitation arises from sensory or attentional processes
is to investigate whether the spatial distribution of facilitation extends beyond the
location where a spatial cue is presented. Tassinari’s hypothesis would predict that
facilitation does not extend beyond the cued location, whereas conventional models of
attention would predict that it does.
The spatial distribution of facilitation and IOR.
This observation leads to a second unresolved issue concerning the nature of reflexive
attentional shifts; the spatial distribution of facilitation and IOR. Although a number of
different models have been proposed to account for the distribution of attention following
a spatial cue, these have been based mainly on performance on COVATs which measure
voluntary shifts of attention (Posner & Cohen, 1984; Eriksen & Yeh, 1985; Tsal, 1983;
Henderson, 1990; Henderson & MacQuistan, 1993; Eriksen & St.James, 1986; LaBerge,
1983) or on other attentional paradigms such as the flanker task (LaBerge, 1983). As a
consequence, no single model can account for the spatial distributions of both facilitation
and IOR following peripheral cues. For example, studies which propose that the spatial
distribution of attention is akin to a spotlight with a fixed area (Posner et al, 1987; Tsal,
1983) have based such models on COVATs which use discrimination responses and
probabilistic symbolic cues or probabilistic peripheral cues (Shulman et al, 1979: Posner,
1980; Tsal 1983; Eriksen & Yeh, 1985). On the other hand, the gradient model of
attention proposes that the spread of attention over the visual field is fixed, and that the
areas immediately surrounding the cued location are allocated the most attention while
those on the boundary receive the least. This model is based primarily on the results of

9
studies which require letter discrimination following non-predictive cues (Henderson &
MacQuistan, 1993; Henderson, 1990), or which require identification of a central letter in
the presence of distractors (ie. flanker task; LaBerge, 1993). A model that seeks to
integrate both the spotlight and gradient models, the zoom lens model, contends that the
attentional focus has a variable size, limited resources and requires time to constrict and
expand. Therefore, the focus of attention can take the form of a spotlight and be focused
closely around attentional fixation, or it can zoom out to encompass a wider area. It is
generally assumed that in a resting state this type of zoom lens acts much like the
gradient model, having graduated levels of attention moving out from the centre (Eriksen
and St James, 1986). The zoom lens model is based on the performance found when
subjects were required to discriminate letters in the presence of distractors following
predictive spatial cues appearing at the target locations (Eriksen & St James, 1986) or
when subjects were required to detect targets following probabilistic central symbolic
cues or predictive peripheral cues (Shepherd & Muller, 1989). While detection
paradigms have also been used to investigate these models, studies employing such
techniques use either probabilistic central symbolic cues (McCormick & Klein, 1990) or
analyse their data in such a way that makes accurate interpretation difficult (see above
critique of Tassinari et al, 1994). Therefore, none of these models are based on data from
investigations of purely reflexive shifts of attention. As a result, none of the attentional
models proposed to date are able to account for both the facilitation and IOR components
of reflexive attentional shifts.
The motor theory makes different predictions than any of these attentional models. First,
the motor theory attempts only to account for the IOR component of reflexive attentional
shifts. The motor theory proposes that attention is allocated en masse to the uncued

10
visual hemifield, and that inhibition of the cued hemifield results (Tassinari et al, 1994;
Tassinari et al, 1989). Thus, objects appearing in the cued visual field are inhibited
relative to objects appearing in the uncued visual field at long SOAs. In contrast, the
attentional models described above propose that the orienting of attention is a dynamic
phenomenon that is readily affected by changes in the immediate visual environment.
The aim of the current set of experiments was to investigate the spatial and temporal
distributions of both the facilitation and IOR components of reflexive attentional shifts.
The first experiment replicated and extended the findings of Maruff et al (1999) to ensure
that the temporal relationship between cue and target also constrained the appearance of
facilitation and IOR at 18 degree locations. Experiment 2 investigated the spatial
distribution of facilitation and IOR using both optimal and non-optimal temporal
conditions and compared RTs to targets that appeared at either 9 or 18 degrees
eccentricity following cues presented at 9 or 18 degrees. Finally, Experiment 3
investigated the time course of the facilitation and IOR components of reflexive
attentional shifts.

11
Experiment 1
The first experiment sought to replicate and extend the findings of Maruff et al (1999),
who found that significant facilitation occurred only at short SOAs when there was
temporal overlap between cue and target, whereas significant IOR occurred only at
longer SOAs when there was no temporal overlap between cue and target. However,
Maruff et al (1999) investigated performance at an eccentricity of 10 degrees. Therefore,
before inferences about shifts of attention can be based on the comparison of
performance between 9 and 18 degree locations (see Experiment 2), it is important to
ensure that facilitation and IOR also depend on the cue-target temporal relationships
when stimuli are presented at eccentricities greater than 10 degrees.
Methods
Subjects
Fourteen subjects (6 males) aged between 21-53 years (mean = 26.07 years, SD = 10.75
years) participated in the study after giving informed consent. All subjects had normal or
corrected-to-normal vision. All subjects were naive to the purpose of the experiment,
although some had experience with reaction time tasks.
Apparatus
All testing was conducted in a sound attenuated, dimly lit ocular motor laboratory. An
IBM compatible 486 computer and a colour monitor were used to present visual stimuli

12
and record responses. The stimulus presentation and response recording software are
accurate to +/- 1 msec and the stimulus parameters used here were identical to those used
by us in all of our previous studies (e.g. Maruff et al, 1999; Maruff & Currie, 1995).
Subjects responded using a hand held microswitch. Throughout the experimental session
three landmark circles remained visible on the computer screen. The background was
black with a luminance of 0.05 cd/m3. Each landmark circle subtended 1.5 degrees of the
visual angle. The centre of the middle landmark circle was in the centre of the display.
The centres of the two peripheral landmark circles were 18 degrees from fixation. Each
landmark circle was coloured green with a luminance of 40.2 cd/m3. Spatial cues were
presented by drawing a second green circle, with a luminance of 60.6 cd/m3, around one
of the three display circles. Therefore, cue onset was marked by a simultaneous increase
in luminance and line width. The target was a small filled red circle (0.6 degrees) that
could appear in either the left or right landmark circle. The luminance of the target was
63.2 cd/m3.
Procedure
Subjects were seated and instructed to hold the response button in their preferred hand.
They were instructed to fix their eyes on the central landmark circle of the COVAT
display but to attend to all three landmark circles and to respond, as quickly as possible,
to the appearance of a target in any one of the circles. Subjects were instructed that
although they may see spatial cues at different locations, these had no meaning and that
their task was to detect the onset of a target in any of the marked locations as quickly as
possible. In previous studies examining the effect of cue expectancies on target detection
we have found that COVAT data is most reliable when subjects are provided with no

13
information about cue-target relationships (Maruff & Currie, 1995; Danckert et al, 1998).
Therefore, subjects were not instructed about the possible locations of targets, the
possible cue duration or the probability with which the target would appear at any
location. Eye movements were monitored by the experimenter using an infrared scleral
reflectance technique which sampled eye position at 1kHz (Maruff et al, 1999). Trials
where eye movements occurred were excluded from the testing session and rescheduled
automatically to the end of the block of trials. Trials where saccadic drift of greater than
0.5 degrees occurred were removed from the analysis and rerun in later blocks if the
percentage of trials removed was greater than 5% (Muller & Rabbitt, 1989). The timing
of a COVAT trial is shown in Figure 1. Each trial began with an inter-trial-interval (ITI)
that could vary randomly between 1010 and 1090 msec. Following the ITI, a spatial cue
was presented. The spatial cue could have a duration of 50msec (non-overlapping cue) or
remain present until a response was made (overlapping cue). Spatial cues could appear at
either of the two peripheral landmark circles with equal probability. The SOA varied
between intervals of 150 and 850 msec. The target then appeared inside one of these
locations and remained visible until the subject responded or until five seconds had
elapsed. Targets appeared at the cued or uncued location with equal probability, but were
never presented at the centre landmark circle. Within a single block of 176 trials, 16
trials where no target followed the cue were also included. These catch trials were
included to discourage anticipatory responses. Subjects completed two blocks of trials in
separate testing sessions giving 40 RTs for each combination of cue duration, cue type
and SOA.

14
Data analysis
For each subject the distributions of data were inspected and RTs less than 100msec and
greater than 1000msec were defined as anticipatory responses or abnormally slow
responses and excluded from the data analysis. In this experiment, each subject was
presented with 32 catch trials. The median percent of responses on these trials (ie false
alarm rate) was 3% (range 0% -5%). When catch trials were further analysed in
overlapping and non-overlapping cue conditions, median false alarm rates were 4% and
2%, respectively. The mean number of the remaining 320 trials that were excluded
because of abnormally slow responses or saccadic drift of greater than 0.5 degrees from
fixation was 0.9% (range 0.3% - 1.3%). For each subject, the mean RT for each
experimental condition was calculated. As the major hypotheses were tested by the
presence or absence of significant differences between RTs to targets appearing at the
cued and uncued location, these differences were compared with a series of within groups
t-tests. The differences also gave the magnitude of facilitation and IOR under each
experimental condition. Facilitation was inferred to have occurred when RTs to targets
appearing at the cued location were significantly faster than RTs to targets appearing at
the same location in the uncued field. Inhibition of return was inferred to have occurred
when RTs to targets appearing at the cued location were significantly slower than RTs to
targets appearing at the same location in the uncued field (Posner & Cohen, 1984;
Maylor, 1985; Tassinari et al, 1994; Egly et al, in press). Therefore, facilitation always
had a positive value and IOR a negative value.

15
Results
The group mean RTs for each cuetype at each SOA under the non-overlapping and the
overlapping cue conditions are shown in Table 2 (Experiment 1), as are the magnitude of
the facilitation and IOR associated with each SOA for the non-overlapping and
overlapping cue conditions. For the non-overlapping condition, there was no significant
facilitation or IOR for the 150msec SOA (t(13)<1), but significant IOR at the 850msec
(t(13)= 4.3, p=0.001) SOA. For the overlapping cue condition, there was significant
facilitation at the 150msec SOA (t(13) = 3.9, p = 0.005), but no significant facilitation or
IOR at the 850msec (t(13) = 1.6, p = 0.1) SOA.
Discussion
The pattern of facilitation and IOR observed with cues and targets at 18 degrees
eccentricity in Experiment 1 was identical to that found previously at 10 degrees
eccentricity (Maruff et al, 1999). Facilitation occurred only when the SOA was short and
there was temporal overlap between cue and target. IOR occurred only when the SOA
was long and there was no temporal overlap between cue and target. Table 2 shows that
RTs to uncued trials were nearly identical in the overlap and non-overlap conditions
whereas under the overlap condition, RTs to cued trials decreased by approximately
20msec at both the short and long SOA. Therefore, a required condition for facilitation
and IOR to be observed is that the cue appears in the same spatial location as the
subsequent target. This suggests that the cue is the source of facilitation at short SOAs,
and also that the cue differentially effects the presence of IOR. Specifically, if IOR
begins when attention leaves the cue and returns towards fixation, then the continued

16
presence of the cue either delays the departure of attention, or holds attention at the cued
location, both of which would result in a reduction in the magnitude of IOR.
Alternatively, it may be that the continued presence of the cue results in facilitatory
processes remaining active at long SOAs, and overcoming the effects of IOR that have
arisen by then.
The absence of facilitation at 150 msec SOA with a non-overlapping cue in Experiment
1, when considered in light of previous research which has shown that facilitation can be
observed at SOAs as short as 50 msec (Posner & Cohen, 1984; Lambert & Hockey, 1991;
Rafal et al, 1991), suggests that cue offset results in the withdrawal of attention from the
cued location. This early withdrawal of attention also leaves enough time for IOR to be
initiated at longer SOAs. In the current study, the RTs were consistently slower than
those observed in our previous experiments (Maruff et al, 1999), although the magnitude
of facilitation and IOR was equivalent. The slower RTs probably reflect the greater
eccentricity of targets in the current study, and suggest that the effect of retinal
eccentricity should be considered when attempting to describe the spatial distribution of
either facilitation or IOR.

17
Experiment 2
The aim of Experiment 2 was to investigate the spatial distribution of the facilitation and
IOR components of reflexive attentional shifts. The comparison of RTs to 18 degree
targets following 9 degree cues with RTs to 9 degree targets following 18 degree cues
will provide some insight into the way in which facilitation and IOR are distributed
across the visual field. If facilitation is purely a sensory phenomenon, as Tassinari and
colleagues propose (Tassinari et al, 1989; Tassinari et al, 1994; Tassinari & Berlucchi,
1996; Berlucchi et al, 1989), then it should occur only at locations where the cue and
target appear simultaneously. However, if facilitation arises because of attentional
processes (Posner, 1980; Tsal, 1983; LaBerge & Brown, 1989; Eriksen & St.James,
1986; LaBerge, 1983; Henderson & MacQuistan, 1993) then it should occur at other
locations within the same hemi-field as the cue, though the gradient model would predict
reductions in the magnitude of that facilitation at distances further from the cue. If IOR is
dependent on facilitation as the biphasic model predicts, then its spatial distribution
should mirror that found for facilitation. The absence of any correlation between the
spatial distributions of facilitation and IOR would suggest that the two processes are
independent. Experiment 1 and Maruff et al (1999, Experiment 1) showed that the
magnitude of IOR at long SOAs was decreased if there was temporal overlap between the
cue and target. A likely explanation for the reduction in the magnitude of IOR at long
SOAs is that the facilitatory processes arising from spatial cues which overlap the target
in time can overcome the IOR that occurs when there is no temporal overlap between cue
and target (Maruff et al, 1999). Therefore, it should be possible to investigate the spatial
distribution of facilitation at long SOAs by determining the extent to which temporally
overlapping cues can overcome IOR at locations in the same visual field.

18
Method
Subjects
Twenty eight subjects (10 males) aged between 19-32 years (mean = 23.01 years, SD =
5.67 years) participated in the study after giving informed consent. All had normal or
corrected-to-normal vision. Subjects were naive to the purpose of the experiment
although some had experience with RT tasks. No subject had participated in Experiment
1.
Apparatus and Procedure
The COVAT display, materials and recording procedure were identical to that described
for Experiment 1. However, in this experiment five landmark circles remained visible
on the computer screen (see Figure 1). Each landmark circle subtended 1.5 degrees of
the visual angle. The centre of the middle landmark circle was in the centre of the
display. The centres of the two peripheral landmark circles in each visual field were 9
and 18 degrees from fixation. Subjects were instructed to fix their eyes on the central
landmark circle of the COVAT display but to attend to all five landmark circles and to
respond, as quickly as possible, to the appearance of a target in any one of the circles.
One group of 14 subjects performed a version of the COVAT where the cue remained
present until the subject responded for the 150msec SOA and the cue duration was 50
msec for the 850msec. The second group of 14 subjects performed a version of the
COVAT where the cue duration was 50msec for the 150msec SOA and the cue remained
present until the subject responded for the 850msec SOA. In all conditions the target
19
remained visible until the subject responded or until five seconds had elapsed. Within a
single block of trials, when the cue appeared at the 18 degree location, the target could
appear at the 18 degree location in the same hemifield (20 trials), at the 9 degree location
in the same hemifield (20 trials) at the 9 degree location in the opposite hemifield (20
trials) or at the 18 degree location in the opposite hemifield (20 trials). When the cue
appeared at the 9 degree location, the target could appear at the 18 degree location in the
same hemifield (20 trials), at the 9 degree location in the same hemifield (20 trials) at the
9 degree location in the opposite hemifield (20 trials), or at the 18 degree location in the
opposite hemifield (20 trials). Catch trials (10 trials for each cue condition interspersed
evenly across cue locations), where no target appeared after the spatial cue, were also
included in a block of trials to discourage subjects from making anticipatory responses
(180 trials per block). To complete an experiment, each subject performed four blocks
of trials over two testing sessions. Therefore, each subject gave a total of 40 trials for
each combination of cue location, target location and SOA. Rest periods of 2 to 3
minutes were given between blocks of trials.
Data analysis
The mean number of trials excluded for abnormally slow responses or saccadic drift of
greater than 0.5 degrees from fixation was 0.19% (SD = 0.1%). In this experiment
subjects were presented with 80 catch trials. The median percent of responses on these
trials (ie false alarm rate) was 4% (range 0-12%). False alarm rates were further analysed
according to cue/target temporal relationship and cue eccentricity. When there was
temporal overlap between the cue and the target, median false alarm rates for cues
appearing at 9° and 18° were 3% and 8%, respectively. When there was no temporal

20
overlap between the cue and the target, median false alarm rates for cues appearing at 9°
and 18° were 1% and 4%, respectively. For each subject, the mean RT of included trials
for each experimental condition was calculated. Once again the major hypotheses were
tested by the direction and significance of any difference in RTs to targets appearing at
the cued and uncued locations. However, in calculating these difference scores it was
noted that previous research has found that RTs to targets varies as a function of their
distance from fixation (Haines & Gilliland, 1973). In addition, a comparison of
Experiment 1 in the current study with that of Maruff et al (1999, Experiment 1)
indicated that RTs to 18 degree targets were generally slower than to 10 degree targets.
Pilot studies conducted on the current display indicated that RTs to uncued targets
appearing at the 18 degree location were on average 40msec slower than RTs to targets
appearing at the 9 degree location. Therefore, to control for the effect of retinal
eccentricity when calculating the magnitude of facilitation and IOR, RTs to targets
appearing at each location in the cued field were subtracted from RTs to targets appearing
at the mirror symmetric location in the opposite visual field. For example, RTs to targets
appearing at the 18 degree location in the cued visual field were subtracted from RTs to
targets appearing at the 18 degree location in the opposite field.
Results
The group means of mean RTs to each target location following each cue location at both
SOAs under the optimal and non-optimal conditions are shown in Table 2 (Experiment
2). Table 2 also shows the magnitude of facilitation and IOR for 9 and 18 degree targets
following 9 and 18 degree cues under the temporal overlap and no temporal overlap
conditions. For the 150msec SOA, when there was temporal overlap between the cue and

21
target and the cue appeared at the 18 degree location, RTs to targets appearing at the 18
degree location in the cued field were significantly faster then RTs to targets appearing at
the 18 degree location in the uncued hemifield (t(13) = 5.85, p<0.001). Similarly, RTs to
targets appearing at the 9 degree location in the cued field were significantly faster than
RTs to targets appearing at the 9 degree location in the uncued field (t(13) = 4.22,
p<0.01). The facilitation found for targets appearing at the 18 degree location was
significatnly greater than for targets appearing at the 9 degree location (t(13) = 5.6;
p<0.01). When the cue appeared at the 9 degree location, RTs to targets appearing at the
18 degree location in the cued field were not significantly different from RTs to targets
appearing at the 18 degree location in the uncued field (t(13)<1). However, RTs to
targets appearing at the 9 degree location in the cued field were significantly faster than
RTs to targets appearing at the 9 degree location in the uncued field (t(13) = 3.44,
p<0.01). When there was no temporal overlap between the cue and target at the
150msec SOA and the cue appeared at the 18 degree location, there was no significant
difference between RTs to targets appearing in the cued or uncued location at either the
18 degree or 9 degree locations. Similarly, when the cue appeared at the 9 degree
location there was no significant difference between RTs to targets appearing in the cued
or uncued location at either the 9 or 18 degree locations.
For the 850msec SOA, when there was no temporal overlap between cue and target and
the cue appeared at the 18 degree location, RTs to targets appearing at the 18 degree
location were significantly slower than RTs to targets appearing at the 18 degree location
in the uncued field (t(13) = -2.9, p < 0.01). Similarly, RTs to targets appearing at the 9
degree location in the cued hemifield were significantly slower than RTs to targets

22
appearing at the 9 degree location in the uncued visual hemifield (t(13) = -4.03, p<0.01).
For the 9 degree cue, RTs to targets appearing at the 18 degree location in the cued field
were significantly slower than RTs to targets appearing at the 18 degree location in the
uncued field (t(13) = -4.80, p<0.001). Similarly, RTs to targets appearing at the 9 degree
location in the cued field were significantly slower than RTs to targets appearing at the 9
degree location in the uncued field (t(13) = -3.87, p<0.01).
When there was temporal overlap between the cue and target at the 850msec SOA and
the cue appeared at the 18 degree location, there was no difference between RTs to
targets appearing at the 18 degree location in the cued and uncued fields or between RTs
to targets appearing at the 9 degree location in the cued and uncued fields. For the 9
degree cue, there was no significant difference between RTs to targets appearing at the 9
degree location in the cued and uncued fields. However, RTs to targets appearing at the
18 degree location in the cued field were significantly slower than RTs to targets at the 18
degree location in the uncued field (t(12) = -3.2, p<0.01).
Discussion
The results of Experiment 2 indicate that facilitation at the short SOA was not restricted
to the cued location. When the cue appeared at the 18 degree location, significant
facilitation was found for targets appearing at both the 18 and 9 degree locations in the
same field. However, the magnitude of this facilitation was larger for targets appearing
at the 18 degree location. When the cue appeared at the 9 degree location, facilitation
was observed only for targets appearing at the 9 degree location in the same field. Taken

23
together, these results suggest that facilitation arises as a consequence of attentional shift
rather than reflecting sensory processes, which would be restricted to the cued location.
Reflexive attentional shifts initiated by peripheral cues extend from fixation to the cue
but not beyond the cue to more lateral locations.
For the long SOA, significant IOR was observed for targets appearing at both the 9 and
18 degree locations irrespective of the eccentricity of the cue. This result is consistent
with the hypothesis that IOR arises due to a motor bias (Klein & Taylor, 1994) against
responding to targets in the cued hemifield (Tassinari et al, 1989; Tassinari et al, 1994;
Tassinari & Berlucchi, 1996). It also suggests that the motor bias is reduced as targets
appear further from fixation. Importantly, the different spatial distributions found for
facilitation and IOR suggest strongly that the two processes are separable, and may be
independent.
The results also show that the magnitude of IOR at long SOAs was reduced when there
was temporal overlap between cue and target. This is consistent with the findings of
Experiment 1. At the 850msec SOA, when cues were presented at 18 degrees, no
significant IOR was found at either the 18 or 9 degree locations. When the cue was
presented at the 9 degree location at the 850msec SOA, no significant IOR was found at
the 9 degree location. However, significant IOR was still found for targets appearing at
the 18 degree location. These results suggest that the facilitation of RTs that occurs with
temporal overlap between cue and target can cancel out the effect of IOR at long SOAs
and that the spatial distribution of this facilitation at long SOAs is the same as that found
for significant facilitation at early SOAs. The results also suggest that facilitation is a
unitary process that is independent of IOR. For the 150msec SOA, when there was no

24
temporal overlap between cue and target, the magnitude of facilitation was small and
non-significant for all combinations of cue location and target location. This is consistent
with the hypothesis that facilitation is not the result of sensory processes restricted to the
cued location. The absence of facilitation at short SOAs when there was no temporal
overlap between cue and target is also consistent with previous studies which have found
no, or small non-significant, facilitation under the same conditions (Tassinari et al, 1994;
Bowman et al, 1993; Possamai, 1986; see Table 1).

25
Experiment 3
The results of Experiments 2 suggest that the spatial distributions of facilitation and IOR
are different, and may reflect the independence of these two processes. Facilitation
spreads from the cued location to fixation, but IOR is evident across the entire visual
field, with medial locations receiving more inhibition than more lateral locations. The
aim of Experiment 3 was to the determine the temporal properties of the spatial
distributions of facilitation and IOR by manipulating SOA and the temporal relationship
between cue and target, and comparing RTs to targets appearing at the 18 and 9 degree
locations following 18 degree cues. Experiment 2 found that facilitation was greater for
18 degree targets than 9 degree targets following 18 degree cues at 150msec SOA. If
facilitation moves from fixation toward the peripheral cue then at 50msec SOA this
pattern should reverse and the magnitude of facilitation for 9 degree targets should be
greater than for 18 degree targets. Alternatively, if facilitation begins at the cued location
and then moves toward fixation, the magnitude of facilitation should be greater at the 18
degree location irrespective of SOA, and the magnitude of facilitation for 9 degree targets
should increase with SOA. Experiment 2 also showed that the magnitude of IOR was
greater for 9 degree targets than for 18 degree targets irrespective of the cued location.
Therefore, if IOR arises because of a motor bias, its magnitude should be consistently
greater for 9 degree targets than for 18 degree targets as SOA increases beyond 750msec.
Experiment 2 and a previous study (Maruff et al, 1999) have suggested that the effects of
facilitation are not restricted to early SOAs, but are also active at longer SOAs. More
specifically, Experiment 2 and Maruff et al (1999) showed that facilitation can overcome
IOR at long SOAs when there is temporal overlap between the cue and the target. If

26
facilitation is a unitary process independent of IOR, then the nullifying effect of
facilitation on IOR should remain evident as SOA increases beyond 750 msec. Similarly,
Experiment 2 and Maruff et al (1999) showed that neither facilitation nor IOR occurred at
short SOAs when there is no temporal overlap between cue and target. Two factors can
account for these results: the hypothesis that facilitation is a result of sensory processes
that are not active in the absence of a continuous cue, and the finding that IOR takes
longer than 150 msec to have an effect. Experiment 3 also investigated whether these
effects remained at SOAs ranging from 50 to 150 msec.
Subjects
Twenty subjects (4 males) aged between 20-40 years (mean = 23.6 years, SD = 8.43
years) participated in the study after giving informed consent. All subjects had normal or
corrected to normal vision on self report. All subjects were naive to the purpose of the
experiment. None of the subjects had participated in Experiment 1 or 2 but all had
participated in reaction time studies previously.
Apparatus and Procedure
The COVAT display, materials, recording procedure and cue durations were identical to
that described for Experiment 2. Spatial cues appeared only at the 18 degree location,
although cues and targets were presented to the left and right visual fields with equal
probability. On half of the trials there was temporal overlap between the cue and target
and on the other half there was no overlap between cue and target. Within a single block
of trials, when the cue appeared at the 18 degree location, the target could appear at the

27
18 degree location in the same hemifield (30 trials), at the 9 degree location in the same
hemifield (30 trials), at the 9 degree location in the opposite hemifield (30 trials) or at the
18 degree location in the opposite hemifield (30 trials). Catch trials (5 trials at each
location), where no target appeared after the spatial cue, were also included in a block of
trials to discourage subjects from making anticipatory responses (total 20 catch trials).
In each block of 140 trials, SOA varied pseudorandomly between 50, 100, 150, 750, 800
and 850msec and the location of cues and targets varied pseudorandomly between visual
fields. As the size of facilitation and IOR for 9 degree targets following 18 degree cues
was found to be small in Experiment 1, the number of trials per condition for each subject
was increased to provide the additional statistical power necessary to investigate these
potentially small effects. Therefore, to complete the experiment each subject performed
28 blocks of trials in fourteen testing sessions. These testing sessions were carried out
over a one month period. Each subject performed three testing sessions per day with an
median of four days between testing sessions (range 2-7 days). This gave a total of 80
trials for each combination of cue duration, target location and SOA. Rest periods of 2 to
3 minutes were given between blocks of trials.
Data analysis
In this experiment, each subject was presented with 560 catch trials. The median percent
of responses on these trials for the experiment overall (ie false alarm rate) was 3% (range
0% -5%). When catch trials were analysed according to overlapping and non-overlapping
cue conditions, median false alarm rates were 4% and 3%, respectively. The mean
number of the remaining 3360 trials that were excluded for abnormally slow responses or
saccadic drift of greater than 0.5 degrees from fixation was 1.19% (range 0.07% - 2.2%).

28
For each subject, the mean RT of included trials for each experimental condition was
calculated. These means were submitted to a cue duration (overlapping, non-overlapping)
x cuetype (cued, uncued) x target location (18°, 9°) x SOA (50, 100, 150, 750, 800, 850)
repeated measures analysis of variance (ANOVA). The major hypothesis was tested
using ANOVA to determine the significance of a cue duration x cue type x target location
x SOA interaction. Because different patterns of performance were expected between the
three short SOAs (50, 100, 150) and the three long SOAs (750, 800, 850), data from these
two sets of SOAs were analysed separately. As a very large number of trials were
necessary to investigate the hypotheses in Experiment 3, it is possible that there was a
change in performance across time, although the random presentation of trials ensured
that any such changes would have affected all trials equally. However, to determine
whether there was a change in performance across testing sessions, a facilitation and IOR
value was calculated for each subject for each of their fourteen testing sessions.
Facilitation and IOR were calculated for trials in the overlapping and non-overlapping
conditions across all SOAs less than 150msec and separately across all SOAs greater than
750msec. Each value was submitted to a one-way repeated measures ANOVA with trial
block number treated as the independent variable.
Results
The group means of mean RTs to each target location following each cue location at both
SOAs under the optimal and non-optimal conditions are shown in Table 2 (Experiment
3). ANOVA indicated that interaction between cue duration x cuetype x target location x
SOA was significant (F(15,285) = 4.2; p<0.05). For short SOAs, when the cue appeared
at the 18 degree location and there was temporal overlap between cue and target,

29
significant facilitation was found when targets appeared at the 18 degree location. There
was no significant difference between SOAs in the magnitude of this facilitation.
However, when targets appeared at the 9 degree location the magnitude of facilitation
increased significantly from the 50msec SOA to the 100msec SOA (t(13) = 4.24; p<0.01)
and from the 100msec SOA to the 150msec SOA (t(13) = 5.34; p<0.01). When there was
no overlap between cues and targets, no significant facilitation or IOR was found for any
of these early SOAs at either target location.
For long SOAs, when the cue appeared at the 18 degree location and there was no
temporal overlap between the cue and target, significant IOR was found when targets
appeared at both the 9 or 18 degree locations. There was no difference in the magnitude
of IOR between the SOAs for targets appearing at either the 9 degree or 18 degree
location. However, the magnitude of IOR was larger for 9 degree targets (mean =
22.03msec) than for 18 degree targets (mean = 14.7msec) when averaged across all SOAs
(F(2,18) = 83.6; p<0.001). When there was temporal overlap between cue and target no
significant facilitation or IOR was found for any of these long SOAs at either target
location. Finally, there was no significant effect of testing session on the magnitude of
facilitation averaged across the 50, 100 and 150msec when there was temporal overlap
between cue and target (F(8,12) < 1, mean facilitation = 19.9, range 15.5 - 25.1) and no
significant effect of testing session on the magnitude of IOR averaged across the 750, 800
and 850msec when there was no temporal overlap between cue and target (F(8,12) <1,
mean = 21.3, range = 17.5 - 24.5).

30
Discussion
These results show that the spatio-temporal distribution of the facilitation and IOR
components of reflexive attentional shifts are quite different. Initially, facilitation occurs
only at the cued location and spreads from there toward fixation as the time between cue
and target increases. IOR is always greater for the location closer to fixation, and
although the magnitude of IOR at both the 9 and 18 degree locations increases with SOA,
the spatial distribution does not change. These results show that the spatio-temporal
distributions of facilitation and IOR are qualitatively different and provide further support
for the hypothesis that the two components of reflexive attentional shifts are separable.
Examination of Table 2 (Experiment 3) also reveals that the continued presence of the
cue at long SOAs results in a lack of IOR, consistent with the results of Experiment 2 and
previous research (Maruff et al, 1999). One explanation for this finding is that IOR fails
to be generated, or is delayed, when the cue remains on. Alternatively, it may be that the
continued presence of the cue results in facilitation of the cued location even at long
SOAs, which is manifested as a reduction in the magnitude of IOR so that RTs to both
cued and uncued target locations become equal.
Perhaps surprisingly given recent research which has found that the magnitude of
location-based, as well as object-based and static-display IOR, diminishes with practice
(Weaver, Lupianez & Watson, 1999), there was no effect of practice on COVAT
performance in Experiment 3. However, the current result is not without support, as both
Muller & Von Muhlenen (1996) and Pratt & McAuliffe (1999) have reported a lack of
practice effects on the magnitude of IOR in static displays, such as that used in the
current study.

31
General Discussion
The results of the current experiments suggest that facilitation cannot be described
adequately as reflecting only sensory processes at the cued location. Instead, they
suggest that facilitation arises because attentional shifts are made toward the peripheral
cue. These attentional processes are restricted initially to the cued location but as the
time between cue and target increases they spread from the cued location toward fixation.
Experiment 2 found that facilitation did not extend to locations that were more lateral
than the cued location. These results are consistent with the zoom lens or focusing model
of attention, where the attentional focus is initially attracted to the location of the
peripheral cue, but spreads to other locations in the same field as time passes. Unlike
facilitation, the spatial distribution of IOR extends across the entire cued field, although
its magnitude is greater for targets which appear closer to fixation. In addition, the
spatial distribution of IOR is not altered when SOA increases beyond 750msec. These
data are consistent with a motor view of IOR.
The difference between the spatial distributions of facilitation and IOR strongly suggest
that the two processes are separable, and that they do not arise because of the temporally
defined ‘biphasic’ effect of peripheral cueing (Rafal et al, 1989; Rafal & Henik, 1994).
Instead, the current data and that of a previous study (Maruff et al, 1999) suggest that
non-informative peripheral cues give rise to facilitation and IOR separately. The effect of
these two separable processes on RT depends upon the SOA and the temporal
relationship between cue and target, and are restricted to targets which appear in the cued
field. Responses to targets appearing at the cued location are approximately 20msec
faster when there is temporal overlap between cue and target (compared to the non-

32
overlapping condition) (Table 2; see also Maruff et al, 1999). While this reduction in RT
occurs equally across SOAs, its consequences for the appearance of facilitation at short
SOAs and IOR at long SOAs are different. More specifically, the reduction in RT that
occurs with temporal overlap between cue and target at short SOAs results in RTs to
targets appearing at the cued location becoming faster than RTs to targets appearing at
the uncued location. However, at long SOAs this reduction leads RTs to targets
appearing at the cued location to become equal to RTs to targets appearing at the uncued
location. Conversely, when there is no temporal overlap between cue and target and
SOAs are short, RTs to targets appearing at the cued and uncued location are equal,
whereas at long SOAs RTs to targets appearing at the cued location are significantly
slower than RTs to targets appearing at the uncued location. These results suggest that
the appearance of facilitation or IOR depends upon the SOA, the temporal relationship
between cue and target and the interaction between facilitatory and inhibitory processes.
Similarly, these results suggest that IOR and facilitation may be independent processes,
however, further empirical investigation needs to be undertaken before such a claim can
be substantiated.
While the effects of facilitation are evident at long SOAs under optimal conditions
(temporal overlap between cue and target), the effects of IOR are absent at short SOAs
under optimal conditions (no temporal overlap between cue and target, Experiment 1, 2
& 3; Maruff et al, 1999). This suggests that IOR takes longer than 150msec to take
effect. As a consequence, the reduction in RT that occurs when there is temporal overlap
between cue and target is sufficient for facilitation to appear at SOAs less than 150msec.
However, at longer SOAs the RT advantage associated with temporally overlapping cues
and targets can only reduce the magnitude of the IOR. Evidence to support the

33
hypothesis that peripheral cues give rise to both facilitatory and inhibitory processes is
seen in the results of the current Experiments.
These results are consistent with some aspects of previous studies. For example,
Shepherd & Muller (1989; Experiment 2) investigated the spatio-temporal distribution of
reflexive attention by using predictive peripheral cues at SOAs which extended from
50msec to 500msec. While in this study the magnitude of costs and benefits were
calculated relative to a neutral cue, their raw data (Table 3) can be recalculated in the
same way as in the current study. At short SOAs (50msec) facilitation was restricted to
the cued location (18 degrees) and spread from this location to other locations in the cued
visual field (8 degrees) as SOA increased to 200 msec. No facilitation was observed for
targets appearing at 18 degrees following cues at the 8 degree location at any SOA.
These results are generally consistent with the current findings although the magnitude of
facilitation reported by Shepherd & Muller (1989) was larger than that found in the
current study. In addition, they found no IOR at the 500msec SOA despite using a cue
duration of 50msec. However, Shepherd & Muller (1989) used predictive peripheral
cues, which have been shown to confound reflexive attentional shifts with voluntary
attentional shifts (Rafal & Henik, 1994; Maruff & Currie, 1995). For example, it has
been observed that the magnitude of facilitation found at early SOAs increases when
predictive peripheral cues signal attentional shifts compared to when non-predictive
peripheral cues are used (Maruff & Currie, 1995; Maruff et al, 1999; Danckert et al,
1998; Jonides, 1980). A number of studies using predictive peripheral cues of a brief
duration (50-70msec) have reported significant facilitation at SOAs of 150msec or
greater (Maruff & Currie, 1995; Maruff et al, 1995). Finally, the voluntary attentional
component of predictive peripheral cues can overcome the IOR that is found at SOAs
34
greater than approximately 250msec (Maruff et al, 1995; Rafal & Henik, 1994; Posner et
al 1982; Egly et al, in press). Confirming these findings, Shepherd and Muller (1989)
also found no significant IOR at their 500msec SOA. Therefore, Shepherd & Muller’s
(1989) findings cannot be considered to be contrary to the current results.
The current results support the model of IOR proposed by Klein and Taylor (1994; see
also Taylor & Klein, 1998), and Tassinari and colleagues (Tassinari et al, 1989; Tassinari
et al, 1994; Tassinari et al, 1996; Berlucchi et al, 1989), which postulates that IOR arises
as a motor bias against responding to stimuli appearing in the cued hemifield. The motor
bias model of IOR can account for the fact that inhibition was found to effect the entire
cued hemifield in the current study, regardless of cue location. In contrast, an attentional
model of IOR would propose that only the cued location would be inhibited, while targets
appearing in other locations in the cued hemifield would not be inhibited. In regards to
the debate concerning how IOR is generated (see Taylor & Klein, 1998 for a review), two
possible explanations for a motor bias have been proposed: (1) that IOR arises as a result
of response inhibition, in particular, the inhibition of a saccade toward the cued location;
and (2) that IOR is a result of activation of an oculomotor program to fixate the cue.
While previous research suggests that the latter may be the more likely of these proposals
(Rafal et al, 1989; see Taylor & Klein, 1998 for other evidence), the current results are
unable to make such a distinction.
With respect to the spatial distribution of the IOR component of attention, Tassinari and
colleagues (Tassinari et al, 1989; Tassinari & Berlucchi, 1996; Tassinari et al, 1994;
Berlucchi et al, 1989) have proposed that IOR is always greatest at the cued location, but
extends to other locations in the cued field. The current results do not support this view.

35
Instead, they suggest that IOR is always greatest at locations closer to fixation
irrespective of where the cue appears (provided it is in the same hemi-field). Tassinari
and colleagues results may have been confounded by their method of data analysis, where
they combine RTs to targets appearing at medial and lateral locations in a number of their
studies in order to calculate facilitation and IOR (Tassinari et al, 1993; Tassinari et al,
1994; see Tassinari & Berlucchi, 1996 for a review). The current results indicate that as
much as 40msec difference can occur between RTs to targets appearing at 9 and 18
degree locations in the uncued visual field, irrespective of the location of any preceding
cue. Tassinari and colleagues' calculations do not take into account this eccentricity
effect, which results in the relationship between the magnitude of IOR and and the effect
of retinal eccentricity being obscured.
A recently proposed attentional model, that of attentional momentum, must also be
considered in relation to the current results (Pratt, Spalek & Bradshaw, 1999). The
attentional momentum model proposes that targets appearing along the path on which
attention is travelling receive a RT benefit relative to targets appearing off the path of
attentional momentum. Thus, in the standard COVAT paradigm, facilitation occurs at
short SOAs because attention is moving toward the cue when the target appears, whereas
IOR occurs at long SOAs because attention is first drawn to the cue, and then has enough
time to begin to move back in the opposite direction towards central fixation. Therefore,
at long SOAs responses to targets appearing in the uncued hemifield would be faster than
targets appearing in the cued hemifield as targets in the cued hemifield are off the path of
attentional momentum. The attentional momentum model adequately accounts for the
IOR observed in the current study. However, this model would predict that targets

36
appearing lateral to the cued location in the cued hemifield would receive facilitation
relative to targets appearing in the uncued hemifield at short SOAs. The results of
Experiments 1 and 2, where no facilitation was observed for such lateral targets at short
SOAs, therefore argue against an attentional momentum account of covert orienting.
A number of issues arise from the current results. One important issue is why IOR
doesn’t occur when the cue remains present at long SOAs. While it appears that the
continued presence of the cue means that facilitatory effects are sufficient to remove any
effect of IOR on RTs, it also seems clear that IOR is not cancelled out. Evidence to
support this proposal can be seen in the results of Experiment 2, where under non-optimal
temporal conditions at 850 msec SOA, the facilitatory processes overcomes the IOR at 9
degree target locations regardless of cue location, whereas IOR at the 18 degree target
location is only overcome when there is an 18 degree cue. This masking pattern is
identical to the pattern of facilitation observed at 150 msec SOA when there was no
temporal overlap between cue and target. The continued presence of IOR outside these
facilitatory boundaries suggests that the peripheral cue does not cancel out the motor bias
at a longer SOA, but is sufficient to overcome it.
Another issue that needs to be raised is the conflict between the current results, where
brief cues (that do not overlap the target) fail to produce facilitation, and results observed
in discrimination paradigms, where facilitation is commonly observed with such cues (eg;
see Henderson & MacQuistan, 1993). While it may be that successful performance of
discrimination tasks requires more or different aspects of attention than performance of
simple detection tasks, the current results provide little insight into what such differences
may be, or exactly what effects these differences have on the orienting of attention.

37
Finally, it must be noted that the current study employed experimental methods which
were similar to that used by Tassinari et al (1994). However, there are a number of
important differences between the current experiments and those of Tassinari. First, at no
stage in the current study was a 0 msec SOA employed, which is a critical distinction
given Lupianez and Weaver’s (1998) critique of Tassinari’s use of such an SOA. Second,
the effects of retinal eccentricity were accounted for when determining the magnitude of
facilitation and IOR in the current study through the comparison of mirror symmetric
locations. Tassinari and colleagues (1994) failed to take these effects into account. Third,
and perhaps most importantly, the current study employed catch trials where Tassinari et
al (1994) did not.
Conclusion
The current results suggest that the facilitation and IOR components of reflexive
attentional shifts are at least separable, and may be shown to be independent upon further
investigation. While abrupt onset peripheral cues initiate a motor bias against
responding to targets appearing in the same field (see Klein & Taylor, 1994), the rise
time of this motor bias is greater than 150msec and it’s effects can be nullified if there is
temporal overlap between cue and target. The process by which the motor bias is
masked is not a cancellation of the bias. Instead, when there is temporal overlap between
the cue and the target, attentional processes initiated by the continued presence of the cue
act against the motor bias. The cue can hold attention at its location until the target
appears, thereby allowing faster RTs. Initially, the area facilitated by the continually
present cue is restricted to the cued location. As the time between cue onset and target

38
onset increases, the distribution of attention spreads from the cue across locations
between the cue and the fixation point. However, it does not spread beyond the cued
location to include more peripheral locations. This spread of attention always begins at
the cued location and is consistent with the metaphor of an attentional zoom lens or a
variable attentional focus. Initially, the size of this focus is under the control of the cue
but it increases in size quickly. This increase in size occurs only toward fixation. In
addition, the magnitude of facilitation is always greatest at the cued location and is
reduced at other locations within the attentional focus.
When there is no temporal overlap between cue and target, facilitation does not arise and
therefore cannot act against the effect of the motor bias. This has different effects for
when there are short and long intervals between cue and target, respectively. More
specifically, as the motor bias takes longer than 150 msec to arise, neither facilitation nor
IOR are observed when the time between the cue and target is short. At longer cue-target
intervals, the motor bias has had time to take effect and IOR is observed. While the
spatial distribution of the motor bias remains constant as time between cue and target
increases, with medial locations in the uncued visual field displaying greater IOR than
lateral locations, the magnitude of the motor bias increases as time between cue and
target increases.

39
Acknowledgements
The authors would like to acknowledge those people who reviewed this manuscript and
provided many valuable suggestions. In particular, we would like to thank Raymond
Klein for his helpful and incisive comments on earlier versions of the manuscript. We
would also like to thank Bradley Gibson and an anonymous reviewer for their comments.

40
References
1. Berlucchi, G., Tassinari, G., Marzi, C.A., & DiStefano M. (1989). Spatial distribution
of the inhibitory effect of peripheral non-informative cues on simple reaction time to
non-fixated visual targets. Neuropsychologia, 27, 201-221.
2. Berger, A., Dori, H., & Henik, A. (1999). Peripheral non-informative cues do induce
early facilitation of target detection. European Journal of Cognitive Psychology,
11(1), 119-137.
3. Bowman, E. M., Brown, V. J., Kertzman, C., Schwarz, U., & Robinson, D. L. (1993).
Covert orienting in Macaques I. Effects of behavioural context. Journal of
Neurophysiology, 70, 431-443.
3. Danckert, J., Maruff, P., Crowe, S., & Currie, J. (1998). Inhibitory processes in covert
orienting in patients with Alzheimer’s disease. Neuropsychology, 12(2), 225-241.
4. Egly, R., Rafal, R., Henik, A., & Berger, A. (in press). Reflexive and voluntary covert
orienting in detection and discrimination tasks. Journal of Experimental Psychology:
Human Perception and Performance.
5. Eriksen, C.W., & St James, J.D. (1986). Visual attention within and around the field
of focal attention: A zoom lens model. Perception and Psychophysics, 40, 225-240.

41
6. Eriksen, C.W., & Yeh, Y. (1985). Allocation of attention in the visual field. Journal
of Experimental Psychology: Human Perception and Performance, 11, 583-597.
7. Gibson, B.S., & Egeth, H. (1994b). Inhibition of return to object-based and
environment-based locations. Perception and Psychophysics, 55, 323-339.
8. Gibson, B.S., & Egeth, H. (1994a). Inhibition and disinhibition of return: Evidence
from temporal order judgements. Perception and Psychophysics, 56, 669-680.
9. Haines, R.F., & Gilliland, K. (1973). Response time in the full visual field. Journal
of Applied Psychology, 58(3), 289-295.
10. Henderson, J.M. (1991). Stimulus discrimination following covert attentional
orienting to an exogenous cue. Journal of Experimental Psychology: Human
Perception and Performance, 17(1), 91-106.
11. Henderson, J.M., & MacQuistan, A.D. (1993). The spatial distribution of attention
following an exogenous cue. Perception and Psychophysics, 53(2), 221-230.
12. Jonides, J. (1980). Towards a model of the mind’s eye’s movement. Canadian Journal
of Psychology, 34, 103-112.
13. Jonides, J. (1981). Voluntary versus automatic control over the mind's eye's
movement. In Long, J. & Baddeley, A. (Eds), Attention and performance IX, (pp.187-
203). Hillsdale, N.J.: Erlbaum.

42
14. Klein, R.M. (1994). Perceptual-motor expectancies interact with covert visual
orienting under conditions of endogenous but not exogenous control. Canadian
Journal of Experimental Psychology, 48, 167-181.
15. Klein, R.M., & Taylor, T.L. (1994). Categories of cognitive inhibition with reference
to attention. In D. Dagenbach & T.H. Carr (Eds.), Inhibitory processes in attention,
memory and language (pp. 113-150). San Diego: Academic Press.
16. LaBerge, D. (1983). The spatial extent of attention to letters and words. Journal of
Experimental Psychology: Human Perception and Performance, 9, 371-397.
17. La Berge, D., & Brown, V. (1989). Theory of attentional operations in shape
identification. Psychological Review, 96, 101-124.
18. Lambert, A., & Hockey, P. (1991). Peripheral visual changes and spatial attention.
Acta Psychologia, 76, 149-163.
19. Lupianez, J., Milan, E.G., Tornay, F.J., Madrid, E., & Tudela, P. (1997). Does IOR
occur in discrimination tasks? Yes, it does, but later. Perception and Psychophysics,
59(8), 1241-1254.
20. Lupianez, J., & Weaver, B. (1998). On the time course of exogenous cueing effects:
A commentary on Tassinari et al. (1994). Vision Research, 38, 1619-1621.

43
21. Maruff, P., & Currie, J. (1995). An attentional grasp reflex in patients with
Alzheimer’s disease. Neuropsychologia, 33(6), 689-701.
22. Maruff, P., Malone, V., & Currie, J. (1995). Asymmetries in the covert orienting of
visual spatial attention to spatial and non-spatial cues in Alzheimer’s disease. Brain.
118, 1421-1426.
23. Maruff, P., Yucel, M., Danckert, J., Stuart, G., & Currie, J. (1999). Facilitation and
inhibition arising from the exogenous orienting of covert attention depends on the
temporal properties of spatial cues and targets. Neuropsychologia, 37, 731-744.
24. Maylor, E.A. (1985). Facilitatory and inhibitory components of orienting in visual
space. In Posner, M.I., & Martin, O.S.M. (Eds.), Attention and Performance (Vol. XI,
pp. 184-204). Hillsdale,NJ: Erlbaum.
25. Maylor, E.A., & Hockey, R. (1987). Effects of repetition on the facilitatory and
inhibitory components of orienting in visual space. Neuropsychologia, 25, 41-54.
26. McCormick, P.A., & Klein, R. (1990). The spatial distribution of attention during
covert visual orienting. Acta Psychologica, 75, 225-242.
27. Muller, H.J., & Rabbitt, P.M.A. (1989). Reflexive and voluntary orienting of visual
attention: Time course of activation and resistance to interruption. Journal of
Experimental Psychology: Human Perception and Performance, 15, 315-330.

44
28. Muller, H.J., & von Muhlenen, A. (1996). Attentional tracking and inhibition of
return in dynamic displays. Perception & Psychophysics, 58, 224-249.
29. Posner, M.I. (1980). Orienting of attention. Quarterly Journal of Experimental
Psychology, 32, 3-25.
30. Posner, M.I., & Cohen, Y. (1984). Components of visual orienting. In H. Bumpy & T.
U. Bouwhuis (Eds.), Attention and Performance, X. Erlsbaum: Hillsdale.
31. Posner, M.I., Rafal, R.D., Choate, L.S. & Vaughan, J. (1985). Inhibition of return:
Neural basis and function. Cognitive Neuropsychology, 2, 211-228
32. Posner, M.I., Inhoff, A.W., Friederich, F.J., & Cohen, A. (1987). Isolating attentional
systems: A cognitive-anatomical analysis. Psychobiology, 15, 107-121.
33. Possamai, C. (1986). Relationship between inhibition and facilitation following a
visual cue. Acta Psychologia, 61, 243-258.
34. Pratt, J., & McAuliffe, J. (1999). Examining the effect of practice on inhibition of
return in static displays. Perception and Psychophysics, 61(4), 756-765.
35. Pratt, J., Spalek, T.M., & Bradshaw, F. (1999). The time to detect targets at inhibited
and noninhibited locations: Preliminary evidence for attentional momentum. Journal
of Experimental Psychology: Human Perception and Performance, 25(3), 739-746.

45
36. Rafal, R.D., Calabresi, P.A., Brennan, C.W., & Sciolto, T.K. (1989). Saccade
preparation inhibits reorienting to recently attended locations. Journal of
Experimental Psychology: Human Perception and Performance, 15(4), 673-685.
37. Rafal, R., Henik, A. & Smith, J. (1991). Extrageniculate contributions to reflex
visual orienting in normal humans: A temporal hemifield advantage. Journal of
Cognitive Neuroscience 3, 322-328.
38. Rafal, R., & Henik, A. (1994). The neurology of inhibition. Integrating controlled
and automatic processes. In: Dagenbach, D., & Carr, T. (Eds.), Inhibitory processes
in attention, memory and language (pp. 1-50). San Diego: Academic Press.
39. Reuter-Lorenz, P.A., Jha, A., & Rosenquist, J.N. (1996). What is inhibited in
inhibition of return? Journal of Experimental Psychology: Human Perception and
Performance, 22, 367-378.
40. Shepherd, M., & Muller, H.J. (1989). Movement versus the focusing of visual
attention. Perception & Psychophysics, 46, 146-154.
41. Shulman, G.L., Remington, R.W., & McLean, J.P. (1979). Moving attention through
visual space. Journal of Experimental Psychology: Human Perception and
Performance, 5, 522-526.

46
42. Tassinari, G., Biscaldi, M., Marzi, C., & Berlucchi, G. (1989). Ipsilateral inhibition
and contralateral facilitation of simple reaction time non-foveal visual target from
non-informative visual cues. Acta Psychologia, 70, 267-291.
43. Tassinari, G., Aglioti, S., Chelazzi, L., Peru, A., & Berlucchi, G. (1994). Do
peripheral non-informative visual cues induce early facilitation of target selection?
Vision Research, 34, 179-189.
44. Tassinari, G., & Berlucchi, G. (1996). Covert orienting to non-informative cues:
reaction time studies. Behavioural Brain Research, 71, 101-112.
45. Taylor, T.L., & Klein, R.M. (1998). On the causes and effects of inhibition of return.
Psychonomic Bulletin and Review, 5(4), 625-643.
46. Tsal, Y. (1983). Movement of attention across the visual field. Journal of
Experimental Psychology: Human Perception and Performance, 9, 523-550.
47. Weaver, B., Lupianez, J., & Watson, F.L. (1998). The effects of practice on object-
based, location-based, and static-display inhibition of return. Perception and
Psychophysics, 60(6), 993-1003.

47
Table 1. Summary of findings in previous COVAT studies.
STUDY
CUE DURATION
SOA
FACILITATION
INHIBITION OF RETURN
DATA FROM
Posner & Cohen (1984) Experiment 1
150
50 100 150 200 500 600
15* 17* 20*
0* -15* -50*
Figure 32.2
Posner & Cohen (1984) Experiment 2
[1] 150 [2] 150
100 650
25* -30*
Figure 32.3
Maylor (1985) Experiment 1a
[1] 100 [2] 100
100 300 500
25* -8* -25*
Figure 1
Possamai (1986) 35 50 75 100 250 500
5* 10* 5*
-10* -20*
Figure 2
Maylor & Hockey (1987) Experiment 1 (random condition)
[1] 100 [2] 100
100 300 500
15* - 8* -25*
Figure 1
Berlucchi et al., (1989) Experiment 1
5 300 900 1500 4000
-43.5 -38.3 -18.1 -10.6
Table 1
Tassinari et al., (1989) 5 200 600 1500 5000
-41.4 -55.9 -47.5 -2.3
Table 1
Lambert & Hockey (1991) Experiment 1 Initial blocks
100 50 100 300 500 1000
25* 10*
- 5* -35* -25*
Figure 1
Lambert & Hockey (1991) Experiment 2
100 50 100 300 500 1000
25* 20*
-3* -25* -25*
Figure 2
Lambert & Hockey (1991) Experiment 3
100 100 600
10*
-15*
Figure 3
Rafal et al., (1991)
On until response
50 100 150 200
18* 70* 75* 80*
Figure 2
Bowman et al., (1993) 83 100 400 700
-1* -20* -30*
Figure 5
Tassinari et al., (1994) Experiment 1
5
0 65 130 300
-56 -40.5 -39 -37.5

48
900
-38.8
Table 1
Tassinari et al., (1994) Experiment 2
SOA + 300 0 65 130 300 900
4.9 3.2
-12.9 -6.8 -7.8
Table 2
Tassinari et al., (1994) Experiment 3
130 0 65 130 300 900
-40 -3.6 -24.1 -24.3 -28.9
Table 3
Tassinari et al., (1994) Experiment 4
130 0 65 130 300 900
3.0
-13.4 -11.9 -20.9 -22.7
Table 4
Muller & vonMuhlenen (1996) Experiment 1 (Static condition)
[1] 100 [2] 100
100 250 400 1000 1300
9
-1 -6 -14 -18 -21
Table 1
Reuter-Lorenz et al., (1996). Experiment 4
[1] 200 [2] 300
1000 1300
-92*
Table 4
Egly et al., (in press) 200 50 150 750 1000
45* 25*
-45* -45*
Figure 1
Lupianez et al., (1997) Experiments 1a, 2a, 3a, 4a.
50 100 400 700 1000 1300
19 -26 -50 -41 -32
Table 1
Maruff et al., (1999) Experiment 1
50 On until response
150 350 850 150 350 850
1.5 19.5
-18.6 -28.2 -1.5 -3.9
Table 1
Maruff et al., (1999) Experiment 2
50 550
150 850 150 850
24.1
-8.6 -23.6 -23.6
Table 2
Berger et al., (1999) Experiment 2
50 100
50 100 150 200 250 300 600 50 100 150 200
4* 12* 12* 10* 10* 4* 42* 36* 22* 8*
-12*

49
200
250 300 600 50 100 150 200 250 300 600
10* 10* 28* 20* 20* 12*
-20* -2* -10* -24*
Figure 3
Note: Table 1 describes those studies where target location is not predicted by the previous location of the cue, and the subject is required to detect onset targets. Neither discrimination nor detection tasks with predictive cues are included in this table. To be included in Table 1, studies were required to have RT as their primary dependent variable. All studies in Table 1 calculated facilitation and inhibition by subtracting RT to a validly cued target from RT to an invalidly cued target. For the Cue Duration column the numbers in square brackets indicates the cue number. When more than one cue was used, the second cue always appeared at fixation in these studies. * = exact data not available, so effect size was estimated from figure or table indicated in last column.

50
Table 2: Summary of experimental results. Group mean RTs (+SD) and cue effect sizes for all conditions in Experiments 1,2 and 3. ------------------------------------------------------------------------------------------------------------------------------------------------------------------------------------------------------------- cue/target cue 18O target 9 O target cue effect size Exp relationship SOA location cued uncued cued uncued 18O target 9 O target ------------------------------------------------------------------------------------------------------------------------------------------------------------------------------------------------------------- 1 overlap 150 18 413.2 (20.1) 433.1 (22.4) 19.9 850 18 388.3 (19.7) 386.2 (21.3) -2.1 no overlap 150 18 438.7 (23.7) 436.2 (19.8) -2.5 850 18 410.7 (20.5) 389.6 (16.7) -21.1 2 overlap 150 18 406.5 (24.1) 427.1 (24.3) 350.9 (16.7) 360.9 (24.5) 20.6 10.0 9 427.3 (22.3) 425.4 (29.8) 345.2 (23.4) 361.7 (29.8) -1.9 16.5
850 18 453.4 (29.6) 449.6 (26.7) 383.1 (25.6) 390.4 (27.8) -3.8 -7.3 9 449.3 (27.2) 424.2 (25.2) 369.1 (29.2) 364.3 (19.8) -25.1 -4.8 no overlap 150 18 433.5 (25.4) 441.1 (26.7) 379.8 (31.1) 384.6 (24.1) 7.6 4.8
9 419.3 (23.4) 422.4 (19.1) 365.5 (25.3) 360.4 (27.5) 3.1 -5.1 850 18 414.9 (22.3) 402.3 (17.9) 364.7 (27.1) 344.7 (23.5) -12.6 -20.0
9 414.5 (23.1) 402.2 (21.4) 373.6 (27.6) 354.5 (23.0) -12.3 -19.1
3 overlap 50 18 416.7 (21.3) 439.2 (30.8) 391.1 (21.3) 385.3 (28.3) 22.5 -5.8 100 18 411.3 (27.6) 430.2 (24.8) 360.2 (23.1) 372.4 (29.7) 18.9 12.2
150 18 394.1 (18.6) 415.6 (24.5) 346.5 (14.5) 366.6 (24.7) 21.5 20.1 750 18 405.6 (21.3) 411.6 (32.1) 349.2 (24.7) 351.1 (28.9) 5.0 1.9 800 18 400.7 (19.8) 405.2 (13.7) 353.4 (34.0) 357.5 (20.5) 5.2 4.1
850 18 404.1 (29.6) 402.2 (24.6) 355.4 (29.1) 358.6 (20.7) -1.9 3.2
no overlap 50 18 436.5 (21.4) 439.3 (32.4) 380.3 (13.5) 383.2 (16.4) 2.9 2.9 100 18 427.3 (23.5) 427.1 (23.2) 376.3 (18.9) 373.9 (23.4) -0.2 -2.4
150 18 411.7 (24.5) 415.3 (19.7) 357.6 (25.6) 365.1 (34.1) -3.6 7.5 750 18 434.3 (21.3) 420.3 (29.5) 394.6 (25.4) 373.3 (26.1) -14.1 -21.3 800 18 425.3 (20.0) 408.2 (19.1) 390.7 (19.6) 367.7 (27.1) -17.1 -23.0
850 18 411.9 (12.4) 399.1 (23.8) 372.4 (25.7) 350.6 (18.6) -12.8 -21.8 -----------------------------------------------------------------------------------------------------------------------------------------------------------------------------
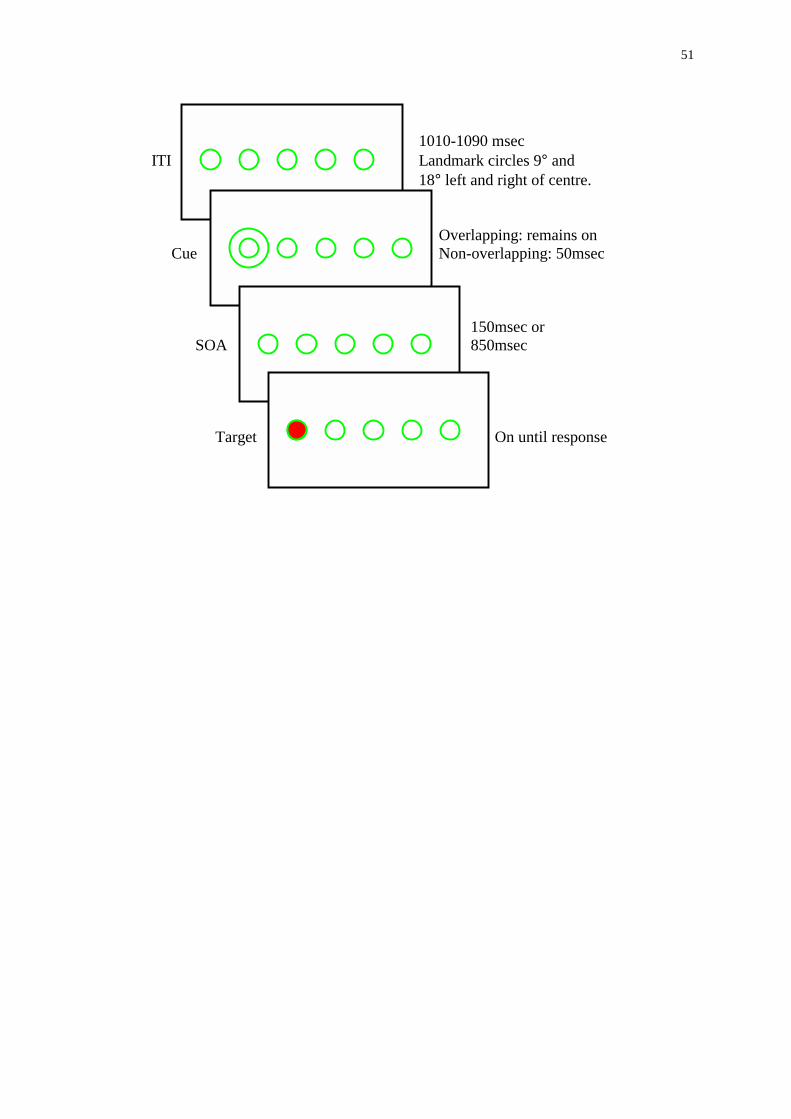
51
1010-1090 msec ITI Landmark circles 9° and 18° left and right of centre.
Overlapping: remains on Cue Non-overlapping: 50msec
150msec or SOA 850msec
Target On until response


53
Figure Legend
Figure 1: The timecourse of events in a COVAT trial in the current study. Figure 1
describes the COVAT display and timing of events for Experiments 2 and 3 of the
current study. In this example, the target appears in the cued location. In Experiment 2,
cues and targets could also appear in the other three peripheral locations, while in
Experiment 3 cues could appear in both 18 degree locations and targets in any of the four
peripheral locations. In Experiment 1, only three landmark circles were used; one each at
18 degrees left and right of fixation and one at the centre of the display. ITI = inter-trial
interval; SOA = stimulus onset asynchrony.