Spatial Thinking in Search Methodology: A Case Study of the ‘No Body Murder Enquiry’, West of...
18
Chapter 18 Spatial Thinking in Search Methodology: A Case Study of the ‘No Body Murder Enquiry’, West of Ireland Jennifer McKinley, Alastair Ruffell, Mark Harrison, Wolfram Meier- Augenstein, Helen Kemp, Conor Graham and Lorraine Barry Abstract Geographical information systems (GIS), recognised as instrumental in the documentation, mapping and analysis of spatial crime data, can provide a frame- work for the integration and analysis of spatial data whether remotely generated on a regional scale, ground surveyed or sampled on a local scale at a crime scene. In this paper a missing person homicide case study is discussed to illustrate the role of spatial thinking in search methodologies and the application of GIS and spatial analysis techniques. Differential global positioning systems were used to collect data from an area of mixed moorland, bog and agricultural ground in the west of Ireland where police intelligence suggested human remains may have been hidden by a murderer. These data allowed the creation of a digital terrain model (DTM) at a resolution not achieved by conventional terrain mapping. The resultant topographic maps and 3D visualisations allowed a sector, or topographic domain, approach to be used at a scale finer than usual in geomorphology. This in turn allowed small water catchments to be defined. These data informed the sampling of shallow groundwater for carbon content and isotope analysis. Two anomalies were indicated, in places consistent with known criminal behaviour. The locations were surveyed by a ground penetrating radar system, and by a cadaver dog. Ground penetrating radar (GPR) failed to indicate any subsurface disturbance or grave, yet the cadaver dog indicated a point of interest close to the location of one anomaly identified from groundwater sampling. Further searching near this location failed to discover human remains, yet the isotope, topography and dog indications showed K. Ritz et al. (eds.), Criminal and Environmental Soil Forensics 285 © Springer Science + Business Media B.V. 2008 J. McKinley(* ü ), A. Ruffell, C. Graham, and L. Barry School of Geography, Archaeology and Palaeoecology, Queen’s University, Belfast Belfast BT7 1NN, UK e-mail: [email protected] M. Harrison National Policing Improvement Agency, Wyboston Lakes, Green North Road, Wyboston MK44 3AL, UK W. Meier-Augenstein and H. Kemp Stable Isotope Laboratory, Scottish Crop Research Institute, Invergowrie, Dundee DD2 5DA, UK.
-
Upload
independent -
Category
Documents
-
view
0 -
download
0
Transcript of Spatial Thinking in Search Methodology: A Case Study of the ‘No Body Murder Enquiry’, West of...

Chapter 18Spatial Thinking in Search Methodology:A Case Study of the ‘No Body Murder Enquiry’, West of Ireland
Jennifer McKinley, Alastair Ruffell, Mark Harrison, Wolfram Meier-Augenstein, Helen Kemp, Conor Graham and Lorraine Barry
Abstract Geographical information systems (GIS), recognised as instrumental in the documentation, mapping and analysis of spatial crime data, can provide a frame-work for the integration and analysis of spatial data whether remotely generated on a regional scale, ground surveyed or sampled on a local scale at a crime scene. In this paper a missing person homicide case study is discussed to illustrate the role of spatial thinking in search methodologies and the application of GIS and spatial analysis techniques. Differential global positioning systems were used to collect data from an area of mixed moorland, bog and agricultural ground in the west of Ireland where police intelligence suggested human remains may have been hidden by a murderer. These data allowed the creation of a digital terrain model (DTM) at a resolution not achieved by conventional terrain mapping. The resultant topographic maps and 3D visualisations allowed a sector, or topographic domain, approach to be used at a scale finer than usual in geomorphology. This in turn allowed small water catchments to be defined. These data informed the sampling of shallow groundwater for carbon content and isotope analysis. Two anomalies were indicated, in places consistent with known criminal behaviour. The locations were surveyed by a ground penetrating radar system, and by a cadaver dog. Ground penetrating radar (GPR) failed to indicate any subsurface disturbance or grave, yet the cadaver dog indicated a point of interest close to the location of one anomaly identified from groundwater sampling. Further searching near this location failed to discover human remains, yet the isotope, topography and dog indications showed
K. Ritz et al. (eds.), Criminal and Environmental Soil Forensics 285© Springer Science + Business Media B.V. 2008
J. McKinley(*ü ), A. Ruffell, C. Graham, and L. BarrySchool of Geography, Archaeology and Palaeoecology, Queen’s University, Belfast Belfast BT7 1NN, UKe-mail: [email protected]
M. HarrisonNational Policing Improvement Agency, Wyboston Lakes, Green North Road, Wyboston MK44 3AL, UK
W. Meier-Augenstein and H. KempStable Isotope Laboratory, Scottish Crop Research Institute,Invergowrie, Dundee DD2 5DA, UK.

286 J. McKinley et al.
that some anomaly existed. This finding may be a false-positive, the result of previous excavation activity or that the remains had ‘returned to earth’, in the light of the missing person never having been found. Regardless, the spatial search methodology described is an innovative combination of new technology, traditional landscape interpretation and hydrological chemical analysis. Adaptation, testing and use of this protocol for similar searches are recommended. The approach also has broader application to environmental, humanitarian and military investigations.
Introduction
An appreciation that criminal activity takes place over different geographic scales enables an investigator to utilise a spatial approach to analyse the criminal activity (Canter et al. 2000; Hirschfield and Bowers 2001). Behavioural profiling and/or intelligence-led information (e.g. the last known movements of victim and/or suspect) may define a search area for a deposition site (of a body or illegal environmental waste), the areal extent of which can cover a range of scales, from a few metres to tens or hundreds of kilometres. It becomes unfeasible as regards cost and time to attempt to intensively investigate a search area across large areas: a spatial approach may be used to address this issue.
Harrison (2006) describes a scenario-based search method to focus an investigation of criminal activity potentially covering tens or hundreds of kilometres to several key locations as indicated by behavioural profiling and intelligence led information. Depending on the spatial scale at which the search is conducted, the emphasis of the search method changes: from a scenario-based, at broad scales (kilometres), to a feature-based approach, at fine scales (metres). The feature-based approach uses landforms, vegetation, access and points of geographic note (trees, streams, hills, buildings) as markers used by possible perpetrators to navigate and return to scenes. The nature of the environment (e.g. urban and rural) will have implications for both types of search strategy and this must be addressed when considering spatial scale in the analysis of the criminal activity. In a feature-based search approach, human and physical anchor points such as a key building, windbreaks or a fork in a stream will determine the geographic extent of the search subsequently informing any spatial approach adopted.
Geographical Information Systems (GIS), widely recognised and utilised in the documentation, mapping and analysis of spatial crime data (e.g. Hirschfield and Bowers 2001; Chainey and Ratcliffe 2005), can provide a framework for the integra-tion and analysis of spatial data whether remotely generated on a regional scale or ground surveyed or sampled on a local scale. The use of GIS and spatial analysis techniques have been used at an urban crime scene (McKinley and Ruffell 2008) where sampling at a fine scale (centimetres) indicated spatial variability that placed the suspect close to an identified location (within 0.50 m) at the scene of crime, confirming witness reports. This paper investigates the multi-scale aspect of search methodology and discusses a missing person homicide case to demonstrate the role of spatial

18 Spatial Thinking in Search Methodology 287
thinking in search methodologies. Aspects of the missing person case are investigated in more detail in Ruffell and McKinley (2008). This paper describes the spatial approach that was deployed in the investigation and the importance of integrating spatial information generated at multiple scales. Broader applications of the approach to environmental, humanitarian and military investigations are also discussed.
Case Study: Missing Person (No Body Murder) West of Ireland
Background
In late September 1995, a teenage girl attending a club at a seaside town in the west of Ireland accepted a midnight lift home by a mature man who was known, informally, to her, although she did not know of his previous criminal records, including abduction and rape. Neither person can be named because the enquiry is ongoing and, as such, some details of the case have been changed. The man’s estate car was noticed by an off-duty member of the police some three hours later, parked in a lay-by to a farm track, on a quiet country road. The officer, two colleagues and a dog team returned to this location some 30 minutes later and a police dog indi-cated a point of interest at a location along the farm track where fields passed into scrubland (‘turning area’, Figure 18.1). Concerned at their proximity to the Northern Irish – Irish Republic border, and thus both causing problems of juris-diction and at the presence of republican terrorists, the police abandoned their
Fig. 18.1 Composite terrestrial Lidar image of the search site. Image created by a composite of laser scanned images of the area (see colour plate section for colour version)

288 J. McKinley et al.
search until daylight. A follow-up search was made, but heavy rain and tractor and cattle movement limited the use of tyre marks or footprints as meaningful clues or evidence. The teenage girl was reported missing some days later. The reason for the delay in reporting of her disappearance was stated as her habit of staying with friends and even the possibility that she had absconded to her sepa-rated father’s house in Dublin.
Enquiries led to the mature man who was the last person to see the girl, but conflicting reports of her being seen elsewhere in Ireland and England were inconsistent with her disappearance. Only when the mature man was arrested, four years later, for the abduction and rape of a 15-year old girl was a possible connection made, and a search made, the focal point of which was his flat at the time of the disappearance of the teenager in 1995. As the search widened from this point, so the area of his last known position on the night in question was considered.
The Search Location (Scenario-Based Search Methodology)
A broad scale (covering tens of kilometres) scenario-based search method was employed to investigate the disappearance of the teenage girl. Intelligence, in the form of the last known actions of the teenager and the sighting of unusual activity by the last known person to have been in the company of the teenager, along with geographical profiling of the suspect, refined the search to an area of scrubland. The search location includes a range of vegetation and soil types. The vegetation around the area comprises planted pine adjacent to the main road and silver birch along the track and around the ridge that formed the core of the search area. Scrubby grassland with metre-high stands of gorse or reeds, with some bedrock exposure, occurs throughout the area. Low-lying ground is characterised by reeds growing on bog, some of which showed evidence of being drained in the past. The vegetation was initially used to classify the landscape, but proved unsuitable as a basis for focusing a search.
Search Limitations and Domains (Feature-Based Search Methodology)
No surface remains of clothing, persons or personal items were found, indicating that if the victim was in the location, she would be buried. Four years had passed since the area was last searched: the location has high rainfall (1400 mm/year) with extensive cattle movement, masking the expression of surface features. Some fundamental controls on the search were established. A main road forms a border to the east. A major river occurs to the south, with housing some 500 m distant, with open, arable farmland to the west. An extensive bog that cannot be walked upon even in summer borders the area to the north. Within the search area, individual locations were limited by views, inaccessible and were due to thick trees, bog, river, or rock (i.e. insufficient depth of soil for burial). To facilitate a

18 Spatial Thinking in Search Methodology 289
feature-based search scenario for potential body deposition or burial, a land-scape domain-based approach was deployed. The search strategy (Figure 18.2) entailed the acquisition of remotely-sensed imagery (aerial photography), a ground-based elevation survey using differential GPS (DPGS) to facilitate landform mapping and the generation of elevation derived maps (e.g. slope) and other derived analysis (e.g. line of sight mapping). This approach enabled the most appropriate location for water sampling to be defined. A complementary geo-physical survey was undertaken to map target locations using ground penetrating radar (GPR).
Global Positioning Information
Aerial photography was used to provide an overview of the full geographic extent included in the search area and to provide an initial visualisation of the landscape. However, since topography was important to define landscape domains, elevation data were also collected by DPGS. Decisions on the most appropriate spatial resolution of generated elevation data were based on a balance between the accurate representation of the topography and the time available to
Fig. 18.2 Flow diagram illustrating the multi-scale search methodology and the range of geo-graphical and spatial information used
290 J. McKinley et al.
collect the elevation data. In this case, DGPS data were collected over one day using a base station and rover system using a stop and record procedure to collect DGPS data.
An important consideration in undertaking the ground GPS survey was to combine the requirement of representing the topography accurately with an awareness of what the accused was suspected of doing. Hence, the need for a spatial resolution of generated elevation data to adequately record the presence of low ground. Such an area would be consistent with the covert activity of burial requiring isolation and low ground, perceived as not being visible from the farm track off the quiet country road. DGPS data were taken approximately every metre over the area but higher resolution data were collected (at 0.5 m) when required to adequately record changes in terrain (e.g. the presence of low ground). Approximately 100 DGPS points were recorded in total.
Elevation data were transferred to the Irish Grid co-ordinate system and stored and managed in a GIS. DGPS data enabled the creation of a Digital Elevation Model (DEM) and provided a georeference system for the integration of aerial photography, and the production of several derivative maps (slope map) and other surface analyses (viewshed analysis).
Landform (or Geomorphological) Mapping
Geomorphological mapping, based on the concept of dividing up the landscape using the boundaries between landforms, most especially changes in relief, remains one of the fundamental research methods of geomorphology (Waters 1958; Cooke and Doornkamp 1990; Minár 1992). Landforms can be summarised with regard to relief units with increasing complexity. In this way, the identification of elementary landform units forms the first stage in the study of the spatial interaction between landforms, soil, vegetation, local climate or hydrological regime. Such a study can be facilitated further by the integration of remotely-sensed data and GPS technologies in a GIS framework. Collection of DGPS elevation data and the creation of a terrain model (overlain with aerial photography) allows a view of topography at a greater resolution than is possible from paper maps. Most especially, this topography can be assessed with regard to external views into the site, and when linked to visual observations, ground-based photography, and ground-based Lidar, to views through trees and bushes. Topography can then be linked to soil depths likely offender behaviour. Most critical for this study is that the fine-resolution DEM can be used to define small fluvial catchments (often no more than ditches, streams and rivulets) that can be used to inform the location of water samples. Ten individual catchments were defined from topography alone by this means. Areas defined in Figure 18.3 include the boundary features and the landscape domain-based approach described previously. Clockwise, from the southeast of the area defined by the road, these are labelled on Figure 18.3 as 6, 9, 8, 8, 8, 5, 3, 2, 1, 9, 7, 4 and 10.

18 Spatial Thinking in Search Methodology 291
Catchments and Soils
The ten catchments were then considered with regard to soil thickness and type. In the same order as above (Figure 18.3), the southern catchments (6, 9, 8, 8, 8) were all located in a field of mixed rough pasture and rushes, with occasional bed-rock exposures (9). Catchments 5 and 3 were located in areas of low rocky outcrop with silver birch and thin (1 m augered depth) peat. Catchments 2, 1 and 9 com-prised peat (1–2 m depth) with silver birch. Catchments 7 and 4 comprised peat with pine forest. Catchment 10 is a flat peat bog of over 3 m depth.
Domains
A composite landform mapping approach (combining the above topographic analysis and soil type/depth information) was used to create a priority of ten search domains on which to focus a feature-based search approach for the missing person. Areas undefined in Figure 18.3 include the boundary features described previously. The domains are described in terms of the spatial interaction between landform, soil type/depth, vegetation, catchments and offender profiling.
Domain 10 (Figure 18.3) comprised the bog, in which a dug hole became quickly waterlogged. Domain 9 was the opposite – having bedrock exposed or within 20–30 cm of ground level. Nonetheless, pockets of deeper, softer material
Fig. 18.3 Landscape mapping domain-based search approach (adapted from Ruffell and McKinley 2008). Numbers 1 to 10 refer to domains discussed in the text. Highlighted area refers to target search area with Domains 1 and 2

292 J. McKinley et al.
could occur, for instance if this was in a limestone area prone to deep weather-ing. The bedrock comprises hard sandstones with limited hollows and pockets. The domains were collectively grouped as eight were all on grazed land, which could be viewed from houses. Under cover of darkness, this ground could have been excavated but the resultant scar on the landscape would have been visible for sometime thereafter.
The potential burial locations in Domain 7 are limited by bedrock, bog and by views from the road, most especially where police vehicles parked on the night in question. Domain 6 has the same limitation as 7 and 8, being visible from the road and the houses. Domain 6 is also actively grazed by cattle and is an unlikely target area. Domain 5 has all the correct spatial attributes for a burial location in being covert and underlain by soft ground with no waterlogged soil. However, the distance to Domain 5 that the suspect would have been forced to walk, or would have to drag a victim, through rough terrain is considerable compared to other locations. As the modus operandi of the suspect shows him to be a lone-operator, this reduces Domain 5 as a likely body deposition site. Domain 4 has the correct mix of cover and proximity to vehicular access. The possible area within Domain 4 where a covert burial could occur is limited by views from the road and the waterlogged bog to the north and west.
Domain 3 is similar to Domain 5 in location and topography. The only factor which makes this domain a possible burial site is access. Domain 5 is inaccessible because of the thick trees and scrub vegetation, whilst Domain 3 is accessible across rough grassland on a central plateau area. Thus, distance to a vehicle is about the same as Domains 4 and 5, but Domain 4 would necessitate movement over rocks, ditches and bog, whereas Domain 3 is a relatively easy walk west-wards over grass.
Domains 1 and 2 are much the same, with their northern limits, adjacent to the bog being below the 2 m elevation of the plateau, and with no dwellings to the north. A highlighted area in Figure 18.4 indicates where the search limits within these areas could be, with bog to the north, and visibility to the south. Domains 1, 2 and 4 all have the advantage of pre-existing ditches, which at their upslope end could have been dry enough to be re-excavated.
Domain 1 represented the priority search location in being proximal to the vehi-cle access point (Figure 18.3 ‘turning circle’). The combined use of geomorpho-logical mapping, integrated with other feature-based search criteria, presents an example at one scale of how the human mind may divide up the landscape in order to target resources of time and cost. A similar methodology could be used at smaller or larger scales, depending on the area which has to be searched and on the com-plexity of the terrain.
Landform classification enabled the division of the area into manageable tracts of ground, each with individual characteristics that focused a feature-based search approach and refined the application of specific search techniques. Broad (metres to decimeters) areas of soft ground provided ideal locations for the application of geophysics whereas much smaller (metre or less) areas, more problematic for geophysics, were found to be more suitable for investigation by probing.

18 Spatial Thinking in Search Methodology 293
Fig. 18.4 Digital elevation maps (DEM) generated in GIS using inverse distance weighting (IDW) interpolation of DGPS elevation data (IDW 12 indicates the number (12) of neighbouring DGPS data used in the interpolation procedure). (a) Two-dimensional. (b) Three-dimensional. 3D DEM has been overlain with the domain-based search areas shown in Figure 3 described in the text. Highlighted area refers to target search area with Domains 1 and 2. Key locations for water sampling throughout the area along with a larger area in Domain 1 are shown on the 3D DEM. The viewing perspective has been changed to aid landscape interpretation (see colour plate section for colour version)

294 J. McKinley et al.
Integration of Spatial Search Criteria in GIS
GIS provided the framework to integrate the landscape domain-based approach with aerial photography, elevation data and derived maps. The outputs generated using the GIS provided a 3D visualisation, or representation, of the area that, although involving some degree of generalisation and simplification of the real world, provided the opportunity to interactively explore the entire search area and scrutinise different search domains. Secondary attributes, comprising aerial imagery and search domains, were draped over the DEM (Figure 18.4a).
Shaded relief maps (using information from slope and aspect) increased the level of realism of the 3D visualisation in which the angle of view, viewing azimuth and viewing distance could all be adjusted (Figure 18.4b). This allowed further verifica-tion of the mapped domains, and enabled feature-based search strategies to be worked through, to reduce time and cost on the ground and focus resources and provide optimum time to conduct the field search. Search domains could be ruled in or out at this stage with those such as Domains 1 and 2 warranting greater field-based investigation (e.g. water sampling Figure 18.4b).
Part of the landscape mapping approach to define areas to focus search efforts involved evaluating visibility of the different domain: defining areas of the topog-raphy that were not visible from the track, country road or nearby dwellings. Certain domains could be ruled out very quickly in this aspect; namely Domains 6 and 7. At the time of the disappearance of the teenager, the suspected body deposi-tion site was accessible by vehicle down a narrow country track. Vehicle accessibility, however, would have diminished some 50 m along the track, suggesting that any further movement or transport of a body would have to be made on foot over the rough moorland and bog. It was particularly useful, therefore, to know which areas of the terrain would have been hidden from view from the furthest access point of the country track.
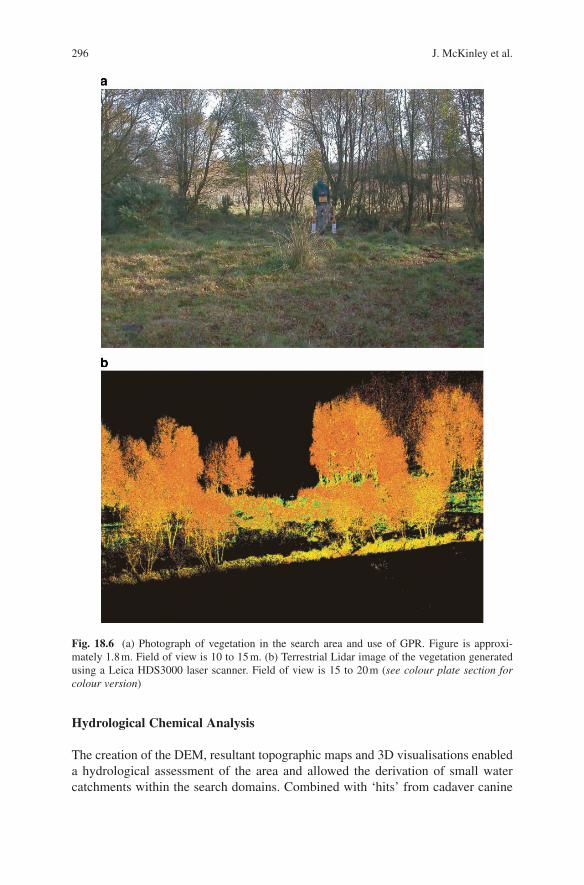
The DEM and derived slope map were used to produce a line-of-sight or viewshed map of the area (Figure 18.5), and in particular search Domains 1 and 2. The viewshed map enabled a feature-based assessment of the terrain, and in this case the important features were hollows or hidden depressions that would have concealed covert activi-ties of burial or deposition. However, vegetation cover (bracken with interspersed saplings) would also have provided some concealment (Figure 18.6a).
Terrestrial Lidar generated using a Leica HDS3000 laser scanner recorded the vegetation of the area at the time of the current search (Figure 18.6b). Laser scan-ning is an increasingly popular and practical technique in the visualisation of land-scapes. A laser scanner effectively ‘blankets’ a scene generating a rich dataset in the form of high density 3D point clouds (thousands of data points are recorded). Although the application of a technique such as laser scanning is obviously more useful when deployed at the time of an incident, and may be of limited value for cold cases, the use of the technique was justified in this case by the limited change in the vegetation involved (i.e. rough moorland and bog). Terrestrial Lidar combined with viewshed analysis provided a comprehensive picture of the degree of concealment afforded to covert activities in the area.

18 Spatial Thinking in Search Methodology 295
Fig. 18.5 (a) 2D and (b) 3D Viewshed (line of sight) map generated in GIS from the DEM and slope map. IDW 12 and IDW 32 indicate the number of neighbouring DGPS data (12 and 32) used in the interpolation procedures
296 J. McKinley et al.
Hydrological Chemical Analysis
The creation of the DEM, resultant topographic maps and 3D visualisations enabled a hydrological assessment of the area and allowed the derivation of small water catchments within the search domains. Combined with ‘hits’ from cadaver canine
Fig. 18.6 (a) Photograph of vegetation in the search area and use of GPR. Figure is approxi-mately 1.8 m. Field of view is 10 to 15 m. (b) Terrestrial Lidar image of the vegetation generated using a Leica HDS3000 laser scanner. Field of view is 15 to 20 m (see colour plate section for colour version)

18 Spatial Thinking in Search Methodology 297
searches, hydrological mapping was used to inform a sampling strategy of shallow groundwaters for carbon content and isotope analysis. Stable isotope analysis of organic and inorganic carbon in groundwater and shallow sub-surface water may provide an indication of a clandestine burial, similar to use in environmental foren-sics to detect contaminant plumes. The average human body contains approximately 20% body weight carbon. When a body decays, proteins, fats and carbohydrates will start to break down to their constituent parts: amino acids, fatty acids and sugars. The collective carbon contained within the breakdown products termed ‘dissolved organic carbon’ (DOC) and will be released from human remains relatively shortly after death or deposition (dependant on burial conditions and pH of the environ-ments). As the DOC starts to breakdown over time, dissolved inorganic carbon (DIC) levels will rise in ‘aged’ depositions. This human-remain derived carbon (DOC and DIC) can then leach into the surrounding environment (through soil and groundwater movement), thus altering the usual carbon signature of the local envi-ronment. The supposition is therefore that pure stable isotope profiles of DIC/DOCs from human origin should exhibit a distinct profile that is markedly different from that derived solely from environmental, plant material or animal origin. In the current missing person case, given the terrain (acidic, peaty conditions), a slow rate of decomposition (i.e. bog-body/mummification) seemed plausible and as such any sub-surface water coming into contact with a body might well still exhibit elevated levels in the composition of either DIC or DOC or both, providing a distinct ‘human-carbon stable isotope profile’. Key locations throughout the area were sampled along with a larger area within Domain 1 where 50 sub-surface water samples were collected using a regular grid scheme at a site where some scoping excavation had taken place (Figure 18.4b). These samples were analysed for Total Organic Carbon (TOC) content only.
Spatial Analysis
Spatial variation in the distribution of isotope data, concentrations in ppm of TOC in water, collected from Domain 1 was characterised using spatial analysis techniques (i.e. GIS and geostatistics). The variogram, central to geostatistics and used for spatial prediction and simulation, characterises spatial dependence in the property of interest: in this case carbon isotope content of shallow groundwaters. A spherical model was used (Figure 18.7a), estimated using Gstat (Pebesma and Wesseling 1998) and fitted using the weighted least squares (WLS) functionality of Gstat with a nugget and two spherical components. The various components of the model fit-ted to the variogram can be related to the spatial structure of the carbon content of shallow groundwaters at the search site.
The nugget effect of the variogram represents unresolved variation and indicates a degree of randomness, which may be explained by a mixture of spatial variation at a finer scale than the sample spacing and measurement error (Journal and Huijbregts 1978). The ranges of the variogram model give information about the dominant scale of spatial variation or correlation distance. In this instance, the ranges of

298 J. McKinley et al.
Fig. 18.7 (a) Omnidirectional variogram. (b) Kriged map. (c) Simulated realisation (adapted from Ruffell and McKinley 2008)

18 Spatial Thinking in Search Methodology 299
the variogram model indicate a restricted geographical distribution within which a similar carbon isotope signature is found (1.72 and 0.87 m). The use of geostatistics through variogram analysis maximises the information available on the spatial distribution of carbon isotope content from sampling shallow groundwaters. However, the unresolved variation and degree of randomness indicated by the nugget effect of the variogram needs to be acknowledged and accounted for in any conclusions drawn from variogram analysis. The modelled variogram is only one possible solution and is dependent on several factors including the model used (spherical in this case) and user experience. In this case, the unresolved variation is attributed to background variability in decaying vegetation. Indeed, the value of the nugget effect, comprising approximately 7% of the total sill value (structured and nugget component) indicates a limited amount of unresolved variation and a low degree of randomness. Readers are encouraged to read Ruffell and McKinley (2008) and other dedicated geostatis-tics texts (e.g. Deutsch and Journel 1998) for a full explanation of the methods used. The coefficients of the model fitted to the variogram were used to generate kriged predictions (Figure 18.7b) as a first step to investigate spatial patterns in isotope values across the search site. Kriged predictions are weighted moving averages of the sampled water and, as such, represent a smoothed interpolation or approximation of the carbon isotope signature across the sampled area.
With the use of GIS and geostatistics in forensic applications, any mapped output needs to be accompanied by information on the sampling strategy employed, any transformation methods applied to the data, the interpolation and geostatistical techniques used and the associated uncertainty. The kriging variance (not shown) provided a measure of confidence in the kriged predictions and was used to indicate places where a higher degree of certainty can be placed on the output. However, the kriging variance is not conditional on (does not honour) the sampled values of carbon isotope content and for this reason conditional simulation was used to esti-mate spatial uncertainty over the area.
Simulated values in conditional simulation are conditional on the original data (carbon isotope content) and previously simulated values (Deutsch and Journel 1998), and therefore conditional simulation is not subject to the smooth-ing associated with kriging. For this reason, a conditional simulation approach, sequential Gaussian simulation, was used to generate many different possible realisations (100 simulated realisations were produced) representing a ‘possible reality’ of the search site (Figure 18.7c). This allowed greater assessment of the uncertainty in the simulated outputs of the search site (Goovaerts 1997; Chilès and Delfiner 1999; Deutsch 2002).
Zones of high and low carbon isotope signature (TOC) are indicated on the output maps (Figure 18.7b and 18.7c). The kriged map (Figure 18.7b) has a smoothed appearance, whereas the sequential Gaussian simulation realisation (Figure 18.7c) appears visually noisy but does not seem to be entirely random. Areas of more or less constant TOC concentration in the outputs represent the ‘background’ and can be inferred as derived from decaying vegetation. However, two anomalies are indi-cated through this approach where ‘ripples’, ‘peaks’ or ‘spikes’ in the distribution

300 J. McKinley et al.
may indicate concentrations comprising the sum of background and decaying soft tissue. This information was used to further inform survey locations for cadaver dogs and the two anomalous locations were surveyed by GPR.
GPR failed to indicate any subsurface disturbance or grave, yet the dog indicated close to one isotope anomaly. The advantage of this approach enabled a feature-based search scenario to be better defined and the subtlety of ‘peaks’ or ‘spikes’ against background TOC concentration values to be visually highlighted, which could have indicated a body deposition or burial location. Further search near this location failed to discover human remains, yet the TOC results, topography and dog indications showed that some anomaly existed. This may be a false-positive or artefacts caused by previous excavation activity. However, in the light of the missing person never having been found, the isotope analysis, topography and dog indications cannot be discounted but instead the anomaly may indicate that the remains had ‘returned to earth.’
Concluding Comments
One of the main advantages of the search methodology described is the opportunity to incorporate a large range of spatially-located data sets, digital terrain mapping, landform classification and water sampling for isotope analysis, into a GIS frame-work, to enable an informed assessment of the search area. The use of GIS in the integration of spatial data in the Missing Person case allowed a sector, or topographic domain, approach to be used at a scale finer than usual in geomorphol-ogy. Small water catchments were used to define an intensive sampling scheme of shallow groundwater for carbon content and isotope analysis.
The interpolated surface (kriged) and simulated realisation of water chemistry (isotope data) of the sediment could then be overlain on the DEM (Figure 18.8) to provide a 3D visualisation of the search domains, and used to highlight anoma-lies of interest. In this case, the visualisations were used to interpret potential body deposition sites but they could be applied to environmental criminal activity (e.g. illegal dumping of waste). The integrated domain-based approach of parti-tioning the landscape into topographic or hydrological search units, with clearly defined boundaries, created an object-based priority scenario of search areas. This was most easily described within a GIS framework, which facilitated the spatial interaction between landform, soil type, vegetation, and hydrological aspects of the search area.
The priority scenario of search areas combined with ‘hits’ from cadaver canine searches was used to inform a sampling strategy of shallow groundwaters for car-bon content and isotope analysis. Integral to this was sampling the spatial variability of soil and sediment water characteristics of the scene using a spatial analysis (geostatistics) model of prediction.
Although the missing person has never been found, the methodology used in this case describes an innovative combination of GIS and spatial analysis techniques,

18 Spatial Thinking in Search Methodology 301
comprising traditional landscape interpretation and hydrological chemical analysis, which offers a potential protocol for similar search scenarios.
Acknowledgements Thanks to John Gilmore, Raymond Murray and Steve McIlroy for their guidance and assistance in the field. The work was considerably improved by the comments of the anonymous reviewers.
References
Canter D, Coffey T, Huntley M and Missen C (2000). Predicting serial killers home base using a decision support system. Journal of Quantitative Criminology 16:4.
Chainey S and Ratcliffe J (2005). GIS and Crime Mapping. Wiley, Chichester.Chilès JP and Delfiner P (1999). Geostatistics: Modeling Uncertainty.Wiley, New York.Cooke RU and Doornkamp JC (1990). Geomorphology in Environmental Management.
Clarendon, Oxford.Deutsch CV (2002). Geostatistical Reservoir Modelling. Oxford University Press, New York.Deutsch CV and Journel AG (1998). GSLIB: Geostatistical Software Library and User’s Guide,
Second Edition. Oxford University Press, New York.
Fig. 18.8 3D DEM visualisation with overlain domain-based search areas shown in Figure 3 described in the text. Target search areas Domain 1 and 2 and the interpolated TOC distribution of the water sampling grid. The DEM and isotope distribution are generated in GIS using inverse distance weighting (IDW) interpolation (IDW 12 indicates the number (12) of neighbouring data used in the interpolation procedure) (see colour plate section for colour version)

302 J. McKinley et al.
Goovaerts P (1997).Geostatistics for Natural Resources Evaluation. Oxford University Press, New York.
Harrison M (2006). Search Methodologies. Geoscientists at Crime Scenes Conference Abstract. The Geological Society of London, 20th December 2006.
Hirschfield A and Bowers K (2001). Mapping and Analysing Crime Data: Lessons from Research and Practice. Taylor & Francis, New York.
Journel AG and Huijbregts CJ (1978). Mining Geostatistics. Academic, London.McKinley J and Ruffell A (2008). Contemporaneous spatial sampling at scences of crime: advan-
tages and disadvantages. Forensic Science International 172:196–202.Minár J (1992). The principles of the elementary geomorphological regionalization. Acta
Facultatis Rerum Naturalium Universitatis Comenianae. Geographica 33:185–198.Pebesma EJ and Wesseling CG (1998). Gstat, a program for geostatistical modelling, prediction
and simulation. Computers in Geoscience 24:17–31.Ruffell A and McKinley J (2008). Geoforensics. Wiley, UK.Waters RS (1958). Morphological mapping. Geography 43:10–17.