Spatial distribution of PCDDs, PCDFs and dl-PCBs along the cascade of urban reservoirs
18
Provided for non-commercial research and educational use only. Not for reproduction or distribution or commercial use. This article was originally published by IWA Publishing. IWA Publishing recognizes the retention of the right by the author(s) to photocopy or make single electronic copies of the paper for their own personal use, including for their own classroom use, or the personal use of colleagues, provided the copies are not offered for sale and are not distributed in a systematic way outside of their employing institution. Please note that you are not permitted to post the IWA Publishing PDF version of your paper on your own website or your institution’s website or repository. Please direct any queries regarding use or permissions to [email protected]
Transcript of Spatial distribution of PCDDs, PCDFs and dl-PCBs along the cascade of urban reservoirs

Provided for non-commercial research and educational use only. Not for reproduction or distribution or commercial use.
This article was originally published by IWA Publishing. IWA Publishing recognizes the retention of the right by the author(s) to photocopy or make single electronic
copies of the paper for their own personal use, including for their own classroom use, or the personal use of colleagues, provided the copies are not offered for sale and
are not distributed in a systematic way outside of their employing institution.
Please note that you are not permitted to post the IWA Publishing PDF version of your paper on your own website or your institution’s website or repository.
Please direct any queries regarding use or permissions to [email protected]

614 © IWA Publishing 2013 Hydrology Research | 44.4 | 2013
Spatial distribution of PCDDs, PCDFs and dl-PCBs along
the cascade of urban reservoirs
Magdalena Urbaniak, Marek Zielinski, Zbigniew Kaczkowski
and Maciej Zalewski
ABSTRACT
The river environment is a highly complex system with a variety of processes continuously changing
along its continuum (River Continuum Concept). Therefore identification of the threats that result
from different elements of the river ecosystem is an intricate task, mainly because of the
transportation and biological, geological and chemical processes occurring in such a system. The
overall objective of the presented study was to examine the concentration and pattern of
polychlorinated dibenzo-para-dioxins (PCDDs), polychlorinated dibenzofurans (PCDFs) and dioxin-like
polychlorinated biphenyls (dl-PCBs) in the five urban, cascade reservoirs. The obtained data
demonstrated an increasing total concentration of toxic PCDDs/PCDFs and dl-PCBs along the studied
reservoirs starting from 266 ng/kg d.w. in the first pond up to 11,400 ng/kg d.w. in the last pond,
wherein the highest World Health Organization – Toxic Equivalent (WHO-TEQ) concentration (18.9 ng
TEQ/kg d.w.) was also recorded. The exception from this rule, with the lowest total and WHO-TEQ
concentrations (182 ng/kg d.w. and 1.31 ng TEQ/kg d.w., respectively) was the middle newly
constructed III reservoir, equipped with the sediment traps and sand separators at the stormwater
outlets and ecotone zones around its catchment for enhancing the purification of inflowing
stormwater. This situation may indicate the importance of such solutions for the reduction of PCDDs,
PCDFs and dl-PCBs in the urban water ecosystems.
doi: 10.2166/nh.2012.236
Magdalena Urbaniak (corresponding author)Maciej ZalewskiEuropean Regional Centre for Ecohydrology under
the auspices of UNESCO,Tylna 3, 90–364 Łódz,PolandandDepartment of Applied Ecology,University of Łódz,Banacha 12/16, 90–237 Łódz,PolandE-mail: [email protected]
Marek ZielinskiNofer Institute of Occupational Medicine,Teresy 8,91–348 Łódz,Poland
Zbigniew KaczkowskiDepartment of Applied Ecology,University of Łódz,Banacha 12/16,90–237 Łódz,Poland
Key words | dl-PCB, PCDD, PCDF, spatial distribution, urban reservoir
INTRODUCTION
Polychlorinated dibenzo-para-dioxins (PCDDs), poly-
chlorinated dibenzofurans (PCDFs) and dioxin-like
polychlorinated biphenyls (dl-PCBs) are groups of synthetic
organic chemicals that can be found in many compartments
of the environment, especially in organisms that are at the
top of the food chain and may accumulate in significant
amounts in these organisms. Their distribution in the
environment is related to water and biogeochemical
cycles. Moreover, toxicity, persistence and accumulation of
PCDDs, PCDFs and dl-PCBs in the environment, and their
biomagnification throughout the aquatic and terrestrial
food chains affect these organisms, as the chemicals consti-
tute a long-term health risk to humans and animals. The low
volatility and low solubility of PCDDs, PCDFs and dl-PCBs
in water predispose these substances to association with
organic matter (Compilation of EU Dioxin Exposure &
Health Data ). Therefore, the constructed reservoirs,
where the flow velocity decreases and consequently the
amount of suspended matter increases, create optimal con-
ditions for the deposition of PCDDs, PCDFs and PCBs
derived from various pathways such as atmospheric depo-
sition, surface runoff, and industrial/wastewater treatment
plant discharges. It is estimated that 97% of the released
PCDDs, PCDFs and dl-PCBs in a water column are depos-
ited in sediments (DiPinto et al. ), which serve as
storage compartments for long-term release of the sediment-
associated PCDDs, PCDFs and dl-PCBs, and therefore
pose a threat to aquatic organisms (Knezovich et al. ).

615 M. Urbaniak et al. | Spatial distribution of PCDDs, PCDFs and dl-PCBs Hydrology Research | 44.4 | 2013
Thus, sediments in the reservoir act as a sink for most of the
PCDDs/PCDFs and dl-PCBs, and are important in long-
term pollution assessment studies and the monitoring of
ecosystem stress (Thompson et al. ).
According to ecohydrology theory, strategy for
reduction of the threat posed by PCDDs, PCDFs and dl-
PCBs to aquatic ecosystems, and consequently to human
health, should be based not only on reduction of their emis-
sion into the river environment (a gradual process based on
clean technologies and policy) but mostly on: (1) under-
standing the role of reservoirs in the transport of PCDDs,
PCDFs and dl-PCBs along the river continuum; (2) their
accumulation in reservoir sediments and biotransformation
into less or non-toxic compounds; and (3) development of
tools and methods for enhancement of the ecosystem resili-
ence against this impact. Both monitoring of the appearance
and concentration of these contaminants in aquatic ecosys-
tems, and the identification of the original processes that
affect their concentration and risk for the water environ-
ment postulated by the first principle (I) of ecohydrology
have been critical to regulation of the hydrological pattern
and to reservoir construction that is aimed at enhancement
of river resilience and the reservoir ecosystem advocated by
the second principle (II) of ecohydrology (Zalewski et al.
; Zalewski , ). Therefore in this study, in
accordance with the first principle of ecohydrology, we
examined the concentrations and patterns of PCDDs,
PCDFs and dl-PCBs in sediments of five cascade reservoirs
located along the urban Sokołówka River. The results
were discussed to identify possible sources that contribute
to contamination of the sediment by PCDDs, PCDFs and
dl-PCBs and to determine the role of hydrological and bio-
logical processes in the obtained values.
MATERIALS AND METHODS
Study site
The Sokołówka River (drainage area of 45.40 km2) is situ-
ated in the north-western part of the city of Łódz, Central
Poland (Figure 1) and represents a highly urbanized and
industrialized catchment area that is contaminated with
organic compounds due to sewer and stormwater overflows.
The main stretch of the river was channelized to straighten
the course and deepen the bed for the purpose of storm-
water retention. Two landscaped retention reservoirs were
restored (ponds nos. III and IV) to improve the retention
capacity of the urban landscape, and to reduce the storm-
water flow peaks along the river length. These ponds,
together with the pre-existing old ponds nos. I, II and V,
were selected as a study area for the presented research.
The new multipurpose reservoirs fit within the river
valley and create a picturesque landscape, nesting sites for
birds and recreation areas. The ecohydrology theory postu-
lates the use of such reservoirs as sites that are friendly
both to the environment and to humans, and act as an
element of the ‘blue-green network’ of the city of Łódz
(Wagner & Zalewski , ).
The studied reservoirs differ from each other in age, size,
theoretical water residence time, light intensity and input
flow. Nevertheless, all of these reservoirs can be regarded
as small impoundments, with riverine character and short
water retention time (Table 1).
Reservoir I
The first pond, situated in the AdamMickiewicz Park, in the
vicinity of a large housing development, has a surface area
of 16,400 m2 and a capacity of 22,500 m3. The average
water retention time is 8.7 days. The age of the reservoir
was assessed as more than 100 years old (Jokiel & Maksy-
miuk ; Biezanowski ; Kujawa & Kujawa ;
Wagner et al. ). The deposited bottom sediments have
been removed periodically from the reservoir, the last time
in 2000.
Reservoir II
The second pond, also situated in the Adam Mickiewicz
Park, covers an area of 11,000 m2 with a capacity of
11,100 m3 and an average water retention time of 3.9 days.
The age of this reservoir, similarly to reservoir I, is more
than 100 years old (Jokiel & Maksymiuk ; Biezanowski
; Kujawa & Kujawa ; Wagner et al. ). Similarly
to reservoir I, the deposited bottom sediments were removed
in 2000.

Figure 1 | Location of the Sokołówka River catchment against a background of the city of Łódz.
616 M. Urbaniak et al. | Spatial distribution of PCDDs, PCDFs and dl-PCBs Hydrology Research | 44.4 | 2013
Reservoir III
The third reservoir located in the estate area was built in
2004 in a trough of an old fish pond (called Chachuły
Pond) as a first element of the Sokołówka River valley rena-
turalization. The surface area of reservoir III is 18,600 m2, its
capacity is 24,000 m3, and the mean water retention time
was 7.7 days (Jokiel & Maksymiuk ; Biezanowski
; Kujawa & Kujawa ; Wagner et al. ). The near-
est catchment, as well as the littoral zone of the reservoir,
has been planted with terrestrial and aquatic plants used
for purification of inflowing stormwater and road runoff.
Moreover, the outlets of stormwater canals were equipped
with separators and sedimentation ponds for the reduction
of organochemical compounds (Wagner & Zalewski ,
).
Reservoir IV
Pond IV is also a newly constructed pond, built in 2006, and
situated in the estate area within a trough of the old Kon-
dracki Pond. The reservoir was built laterally on the right
riverbank. The surface area is 4,000 m2 with the capacity
of 4,100 m3 (Jokiel & Maksymiuk ; Biezanowski ;
Kujawa & Kujawa ; Wagner et al. ).
Reservoir V
Reservoir V is located on the outskirts of the city, in the
middle section of the river valley, which has maintained a
semi-natural character. Additionally, the reservoir is a recipi-
ent of waters from a tributary of the Sokołówka River – the
Brzoza River (Figure 1), which is also a stormwater receiver.
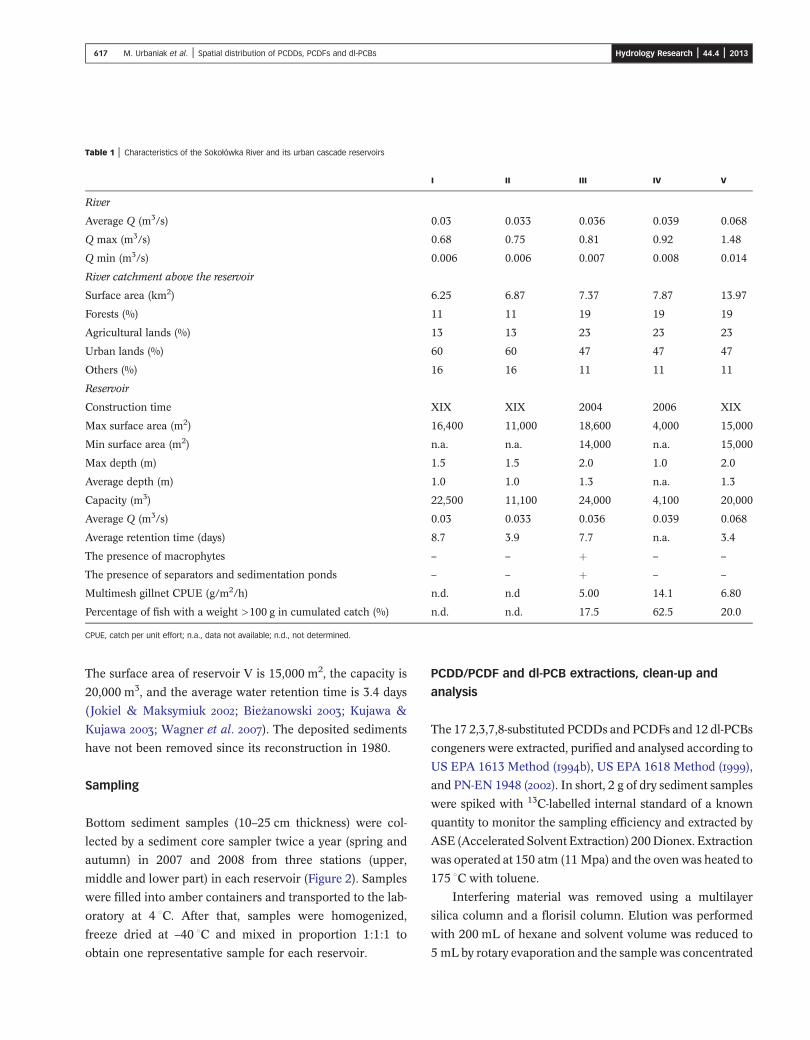
Table 1 | Characteristics of the Sokołówka River and its urban cascade reservoirs
I II III IV V
River
Average Q (m3/s) 0.03 0.033 0.036 0.039 0.068
Q max (m3/s) 0.68 0.75 0.81 0.92 1.48
Q min (m3/s) 0.006 0.006 0.007 0.008 0.014
River catchment above the reservoir
Surface area (km2) 6.25 6.87 7.37 7.87 13.97
Forests (%) 11 11 19 19 19
Agricultural lands (%) 13 13 23 23 23
Urban lands (%) 60 60 47 47 47
Others (%) 16 16 11 11 11
Reservoir
Construction time XIX XIX 2004 2006 XIX
Max surface area (m2) 16,400 11,000 18,600 4,000 15,000
Min surface area (m2) n.a. n.a. 14,000 n.a. 15,000
Max depth (m) 1.5 1.5 2.0 1.0 2.0
Average depth (m) 1.0 1.0 1.3 n.a. 1.3
Capacity (m3) 22,500 11,100 24,000 4,100 20,000
Average Q (m3/s) 0.03 0.033 0.036 0.039 0.068
Average retention time (days) 8.7 3.9 7.7 n.a. 3.4
The presence of macrophytes – – þ – –
The presence of separators and sedimentation ponds – – þ – –
Multimesh gillnet CPUE (g/m2/h) n.d. n.d 5.00 14.1 6.80
Percentage of fish with a weight >100 g in cumulated catch (%) n.d. n.d. 17.5 62.5 20.0
CPUE, catch per unit effort; n.a., data not available; n.d., not determined.
617 M. Urbaniak et al. | Spatial distribution of PCDDs, PCDFs and dl-PCBs Hydrology Research | 44.4 | 2013
The surface area of reservoir V is 15,000 m2, the capacity is
20,000 m3, and the average water retention time is 3.4 days
(Jokiel & Maksymiuk ; Biezanowski ; Kujawa &
Kujawa ; Wagner et al. ). The deposited sediments
have not been removed since its reconstruction in 1980.
Sampling
Bottom sediment samples (10–25 cm thickness) were col-
lected by a sediment core sampler twice a year (spring and
autumn) in 2007 and 2008 from three stations (upper,
middle and lower part) in each reservoir (Figure 2). Samples
were filled into amber containers and transported to the lab-
oratory at 4 WC. After that, samples were homogenized,
freeze dried at –40 WC and mixed in proportion 1:1:1 to
obtain one representative sample for each reservoir.
PCDD/PCDF and dl-PCB extractions, clean-up and
analysis
The 17 2,3,7,8-substituted PCDDs and PCDFs and 12 dl-PCBs
congeners were extracted, purified and analysed according to
US EPA 1613 Method (b), US EPA 1618 Method (),
and PN-EN 1948 (). In short, 2 g of dry sediment samples
were spiked with 13C-labelled internal standard of a known
quantity to monitor the sampling efficiency and extracted by
ASE (Accelerated Solvent Extraction) 200Dionex. Extraction
was operated at 150 atm (11 Mpa) and the ovenwas heated to
175 WC with toluene.
Interfering material was removed using a multilayer
silica column and a florisil column. Elution was performed
with 200 mL of hexane and solvent volume was reduced to
5 mL by rotary evaporation and the samplewas concentrated

Figure 2 | Sampling sites along the Sokołówka cascade reservoirs. Numbers I–V indicate the reservoir numbers.
618 M. Urbaniak et al. | Spatial distribution of PCDDs, PCDFs and dl-PCBs Hydrology Research | 44.4 | 2013
to 100 μL under a gentle stream of nitrogen, replacing n-
hexane by n-nonane and adding external standards.
Samples were analysed by high resolution gas chromato-
graphy/high resolution mass spectrometry: HP 6890N
Agilent Technologies (Santa Clara, USA) equipped with a
DB5-MS column (60 m × 0.25 mm, i.d. film thickness
0.25 μm) in the splitless injectionmode, coupled to a high res-
olution mass spectrometer Auto Spec Ultima (Milford, USA)
using perfluorokerosene (PFK) as a calibration reference.
Samples were quantified with the isotope dilution method.
PCDD/PCDF and dl-PCB quality assurance/quality
control
The analytical method used for PCDD, PCDF and dl-PCB
analysis was properly validated on the basis of internal refer-
ence materials; the analytical laboratory involved in 2005
and 2009 successfully passed the accreditation procedure.
All glassware and bottles used in the field and laboratory
were cleaned with detergent, rinsed with ultra-pure water,
followed by heating at 450 WC overnight. Before use, the
glassware was rinsed with acetone and hexane.
Each analytical batch contained a method blank, a
matrix spike and duplicate samples. A reagent blank was
used to assess artifacts and precision was verified by dupli-
cate analyses. Samples spikes were used as an additional
check of accuracy. Recoveries of an analyte were deter-
mined by analysing samples spiked with PCDD/PCDF
and dl-PCB standards. Recoveries of 13C-labelled PCDD,
PCDF and dl-PCB congeners through the analytical pro-
cedure ranged from 74 to 146%. The recovery coefficient
was taken into account for calculating the final concen-
trations of analytes. The effectiveness of the presented
analytical method was evaluated by analysis based on the
updated Standard Reference Material: Certificate of Analy-
sis for SRM 1939a, Polychlorinated Biphenyls (Congeners)
in River Sediment A (National Institute of Standards and
Technology ). The precision, the limits of detection
and the limit of quantification of the analysed PCDD,
PCDF and dl-PCB congeners are presented in Table 2.
Statistics
The presented data were subjected to statistical analyses
using ‘Statistica’ software for Windows. The non-parametric
Friedman analysis of variance (ANOVA) test was used to
detect differences in the treatments across the studied cas-
cade reservoirs. The Wilcoxon matched pairs test was used

Table 3 | The results of statistical analysis using the Wilcoxon matched pairs test
Reservoirscompared
PCDDs/PCDFsand dl-PCBs PCDDs PCDFs dl-PCBs
I and II – – – þI and III þ – – þI and IV – – – –
I and V þ þ – –
Table 2 | The basic parameters of the analytical method used
PCDD/PCDF Precision (%)
Limit ofDetection(LoD) (pg/kg)
Limit ofQuantification(LoQ) (pg/kg)
2,3,7,8-TCDD 5.0 0.12 0.41
1,2,3,7,8-PeCDD 9.0 0.25 0.84
1,2,3,4,7,8-HxCDD 7.0 0.14 0.45
1,2,3,6,7,8-HxCDD 4.0 0.080 0.28
1,2,3,7,8,9-HxCDD 5.0 0.090 0.31
1,2,3,4,6,7,8-HpCDD 11 0.25 0.83
OCDD 6.0 0.13 0.42
2,3,7,8-TCDF 11 0.31 1.03
1,2,3,7,8-PeCDF 5.0 0.090 0.30
2,3,4,7,8-PeCDF 1.0 0.030 0.11
1,2,3,4,7,8-HxCDF 3.0 0.040 0.15
1,2,3,6,7,8-HxCDF 5.0 0.13 0.42
1,2,3,7,8,9-HxCDF 2.0 0.19 0.64
2,3,4,6,7,8-HxCDF 10 0.060 0.19
1,2,3,4,6,7,8-HpCDF 8.0 0.15 0.51
1,2,3,4,7,8,9-HpCDF 3.0 0.080 0.26
OCDF 6.0 0.12 0.38
PCB 77 3.0 0.050 0.12
PCB 81 4.5 0.11 0.35
PCB 126 1.8 0.040 0.15
PCB 169 2.4 0.040 0.13
PCB 105 7.0 0.14 0.48
PCB 118 3.9 0.070 0.25
PCB 123 4.2 0.11 0.37
PCB 156 2.9 0.060 0.21
PCB 157 2.4 0.070 0.22
PCB 167 3.6 0.040 0.21
PCB 189 7 0.11 0.37
PCB 114 2.4 0.030 0.13
619 M. Urbaniak et al. | Spatial distribution of PCDDs, PCDFs and dl-PCBs Hydrology Research | 44.4 | 2013
to compare the obtained concentrations in two paired reser-
voirs. Significance was determined based on a probability
level of p� 0.05.
II and III þ – þ þII and IV þ – – þII and V þ – – þIII and IV þ – þ þIII and V þ – – þIV and V þ þ – ––, statistically not significant; þ, statistically significant with p-value �0.05.
RESULTS
The data obtained demonstrated that the 17 total 2,3,7,8-
substituted PCDDs, PCDFs and 12 dl-PCB congeners incre-
ased along the studied cascade reservoirs from 266 ng/kg d.w.
in reservoir I to 11,400 ng/kg d.w. in reservoir V with the
exception of newly constructed reservoir III, in which the
lowest value was recorded (183 ng/kg d.w.; Table 3).
Spatial distribution of PCDDs and PCDFs along the
cascade reservoirs of the Sokołówka River
Among all the analysed groups of toxins, a predominance of
PCDDs was observed with the following values: 9.10, 58.2,
127, 303 and 10,400 ng/kg d.w. in I, II, III, IV and V,
respectively, and accounted for 40.6, 70.2, 89.4, 81.5 and
98.4% of the total concentration of PCDDs/PCDFs. The sig-
nificant increase in PCDD percentage contribution in the
total PCDDs/PCDFs (of about 57.0%) along reservoirs was
generated by the increasing concentration of the octachloro-
dibenzo-p-dioxin (OCDD) congener ranging from 19.3 to
93.2% (Tables 3 and 4).
The pattern of PCDDs differed between reservoirs, with
the decreasing content of hexachlorodibenzo-p-dioxin
(HxCDD) and heptachlorodibenzo-p-dioxin (HpCDD) con-
geners along the cascade. The decrease was observed
especially for 1,2,3,6,7,8-HxCDD, 1,2,3,7,8,9-HxCDD and
1,2,3,4,6,7,8-HpCDD, whose contribution to the total
PCDDs in reservoir I accounted for 12.4, 41.1 and 21.9%,
respectively, whereas in other ponds it ranged from 0 to
9.79% (Table 4).

Table 4 | Spatial variation of PCDD, PCDF and dl-PCB concentrations along the cascade of urban reservoirs
I (ng/kg d.w.) II (ng/kg d.w.) III (ng/kg d.w.) IV (ng/kg d.w.) V (ng/kg d.w.)
Reservoir A SD A SD A SD A SD A SD
2378-TCDD n.d. n.d. n.d. n.d. 0.0800 0.150 n.d. n.d. n.d. n.d.
12378-PeCDD 0.480 0.960 0.840 0.940 0.0700 0.130 0.210 0.430 0.0200 0.0400
123478-HxCDD n.d. n.d. 0.420 0.770 n.d. n.d. n.d. n.d. 1.00 2.01
123678-HxCDD 1.13 2.14 n.d. n.d. 0.780 0.570 0.310 0.620 6.86 13.7
123789-HxCDD 3.74 3.94 0.420 0.810 0.780 1.57 n.d. n.d. 4.90 9.33
1234678-HpCDD 1.99 3.91 6.83 12.0 6.93 4.07 29.7 29.03 736 1,050
OCDD 1.76 3.51 49.7 95.0 118 66.6 273 245 9,680 13,500
Total PCDD 9.10 1.78 58.2 110 127 71.9 303 273 10,400 14,500
2378-TCDF 1.85 2.82 0.190 0.250 0.410 0.820 0.830 1.66 n.d. n.d.
12378-PeCDF 1.78 2.51 0.460 0.830 0.960 1.170 0.840 1.37 n.d. n.d.
23478-PeCDF 1.42 2.84 1.94 2.30 1.14 1.56 1.88 2.92 0.870 1.71
123478-HxCDF 1.85 3.68 1.75 2.03 1.15 0.820 1.35 2.30 7.19 14.2
123678-HxCDF n.d. n.d. 2.10 2.40 0.850 0.620 0.890 1.23 n.d. n.d.
234678-HxCDF 3.81 5.66 6.60 4.87 1.61 1.17 3.02 5.78 50.03 56.7
123789-HxCDF 0.150 0.290 1.32 1.47 0.490 0.650 0.830 1.45 n.d. n.d.
1234678-HpCDF 1.46 2.92 6.17 5.47 4.20 5.43 11.3 9.59 58.9 79.2
1234789-HpCDF 0.140 0.270 n.d. n.d. 0.370 0.750 1.52 1.76 0.170 0.350
OCDF 0.840 1.08 4.20 6.37 3.76 3.08 46.5 50.4 47.3 93.9
Total PCDF 13.3 12.4 24.7 18.3 14.9 14.2 69.0 72.2 164 157
PCB-77 6.87 9.18 11.9 17.6 3.51 0.95 16.5 22.0 25.8 40.92
PCB-81 1.13 1.97 2.77 4.62 1.19 1.60 33.1 51.8 47.5 93.41
PCB-126 3.89 6.73 0.680 1.35 0.270 0.310 2.91 3.78 7.07 10.0
PCB-169 0.0200 0.0400 0.0300 0.0600 0.140 0.280 n.d. n.d. n.d. n.d.
PCB-105 45.3 78.3 4.60 5.18 4.54 1.73 23.4 23.6 42.2 82.1
PCB-114 6.70 13.0 4.31 4.83 1.63 1.86 50.5 70.5 1.24 2.48
PCB-118 126.1 139.0 92.6 77.0 24.3 23.1 745 1390 291 332
PCB-123 20.4 25.2 13.4 12.9 2.87 3.44 29.9 58.7 39.9 69.2
PCB-156 2.96 3.00 1.12 2.23 0.560 0.690 1.37 2.73 5.15 10.3
PCB-157 4.64 8.48 0.500 0.990 0.460 0.560 0.690 1.36 3.39 4.86
PCB-167 22.8 27.4 15.3 27.4 0.910 1.09 100 200 295 584
PCB-189 2.68 3.25 3.50 3.11 0.490 0.350 0.0900 0.18 n.d. n.d.
Total dl-PCB 243 306 151 127 40.9 28.1 1,000 1,820 758 1,220
Total PCDD, PCDFand dl-PCB
266 320 234 253 182 114 1,380 2,170 11,400 15,900
WHO-TEQ 2.64 2.92 2.94 2.28 1.31 1.28 2.38 2.31 18.9 15.8
A, average; SD, standard deviation; n.d., not detected.
620 M. Urbaniak et al. | Spatial distribution of PCDDs, PCDFs and dl-PCBs Hydrology Research | 44.4 | 2013

621 M. Urbaniak et al. | Spatial distribution of PCDDs, PCDFs and dl-PCBs Hydrology Research | 44.4 | 2013
The concentration of PCDFs ranged from 13.3 ng/kg d.
w. in reservoir I, 24.7 ng/kg d.w. in II, 14.9 ng/kg d.w. in III,
69.0 ng/kg d.w. in IV to 164 ng/kg d.w. in the last (V) reser-
voir (Table 3).
The contribution of PCDF congeners varied along the
cascade of reservoirs, starting from a high contribution of
lower chlorinated congeners in the first reservoir (mainly
tetrachlorodibenzofuran (TCDF) and pentachlorodibenzo-
furan (PeCDF) accounting respectively for 13.9 and 13.4%
of the total amount of PCDFs) in favour of the highly
chlorinated chemicals in the last ponds (mainly 1,2,3,4,6,7-
heptachlorodibenzofuran (1,2,3,4,6,7-HpCDD) and octa-
chlorodibenzofuran (OCDF)) contributed to 67.4 and
35.8% in ponds IV and V. The exception to this rule was
1,2,3,4,6,7,8-heptachlorodibenzofuran (1,2,3,4,6,7,8-HpCDF),
which showed a 11.7% decrease between reservoirs III and
IV. Moreover, 38.6% reduction of the OCDF congener contri-
bution was observed between the last two ponds (Table 4).
Spatial distribution of dl-PCBs along the cascade
reservoirs of the Sokołówka River
The dl-PCB concentrations decrease from reservoirs I–III,
from 243 in I to 40.9 ng/kg d.w. in III (Table 1). Whereas,
the next reservoir, no. IV, was characterized by a large
increase in the total dl-PCBs up to 1,000 ng/kg d.w. The
last reservoir (V) also demonstrated the elevated concen-
tration of those compounds – 758 ng/kg d.w. (Table 4).
Dl-PCBs were classified into two categories as follows:
the first category (non-ortho) consisted of four dl-PCB
congeners (PCB-77, PCB-81, PCB-126 and PCB-169),
whereas the second one (mono-ortho) included PCB-
105, PCB-114, PCB-118, PCB-123, PCB-157, PCB-167
and PCB-189.
The most abundant congeners were mono-ortho PCB,
which contributed to 95.1 and 87.5% of the total dl-PCB
in reservoirs II and III, respectively. The high contribution
of these congeners was generated by the accelerated concen-
tration of PCB-118. The average contribution of this
congener varied from 38.3 to 73.9% of the total dl-PCBs con-
centration (Table 4).
The concentrations of non-ortho PCB were within the
range 11.9, 15.4, 5.11, 52.5 and 80.4 ng/kg d.w., contributing
to 4.89, 10.2, 12.5, 5.23 and 10.6% of the total dl-PCB in
reservoirs I–V, respectively (Table 4).
Spatial distribution of WHO-TEQ concentration along
the cascade reservoirs of the Sokołówka River
The highest World Health Organization – Toxic Equivalent
(WHO-TEQ) concentration, expressing the net toxicity of a
complex mixture of all analysed PCDD/PCDF and dl-PCB
congeners, amounted to 18.9 ng TEQ/kg d.w. and was
recorded in the last reservoir (V). Other sites were character-
ized by having about six times lower toxicity, and varied
between 1.31 and 2.94 ng TEQ/kg d.w. The lowest WHO-
TEQ concentration was recorded in the newly constructed
reservoir III (1.31 ng TEQ/kg d.w.; Table 4).
Statistical analysis
The comparison of PCDD congeners concentrations using
the Friedman ANOVA test showed no statistically relevant
differences among the reservoirs studied; the same result
was observed for PCDF congeners. Opposite results were
obtained for dl-PCB and WHO-TEQ concentrations with
differences confirmed.
Statistical analysis using the Wilcoxon matched pairs
test showed that, in case of all congeners, concentrations
of almost all testing pairs of reservoirs were statistically
different, with the exception of the two pairs: I and II
and I and IV (Table 3). In the case of PCDD congeners
the statistically relevant differences were obtained for the
following pairs: I and V, and IV and V (Table 3). Also in
the case of PCDF congeners only two pairs showed statisti-
cally significant differences (II and III; III and IV). The dl-
PCB congeners concentrations were different in case of
seven pairs of reservoirs (Table 3). Among all the tested
reservoir pairs the most similar were: I and IV, and I
and II, as for the first pair there were no statistically rel-
evant differences and for the second pair significant
differences were noted only for dl-PCB. The two pairs of
reservoirs II and III, and III and IV differed the most as
relevant differences were obtained in three out of the
four cases.

622 M. Urbaniak et al. | Spatial distribution of PCDDs, PCDFs and dl-PCBs Hydrology Research | 44.4 | 2013
DISCUSSION
The concentrations of total PCDDs, PCDFs and dl-PCBs
and WHO-TEQ obtained in the reservoirs studied
(Table 5) were in the range of the concentrations recorded
in other water ecosystems worldwide (Table 6). Differences
between the presented levels may result from the variety of
PCDD, PCDF and dl-PCB sources, including atmospheric
Table 5 | Spatial variation in the pattern of PCDDs (the contribution in the total of 2,3,7,8-substi
congeners (the contribution in the total of dl-PCBs) along the cascade of urban rese
I (%) II (%) IReservoir A SD A SD A
2378-TCDD 0 0 0 0
12378-PeCDD 5.28 25.0 1.44 8.26
123478-HxCDD 0 2.49 0.730 0
123678-HxCDD 12.4 2.43 0 18.3
123789-HxCDD 41.1 2.45 0.730 44.7
1234678-HpCDD 21.9 3.74 11.7 43.5
OCDD 19.3 53.6 85.4 47.9 9
2378-TCDF 13.9 5.88 0.78 47.7
12378-PeCDF 13.4 1.76 1.85 7.30
23478-PeCDF 10.7 17.5 7.84 9.32
123478-HxCDF 13.9 5.84 7.06 11.9
123678-HxCDF 0 5.88 8.50 0
234678-HxCDF 28.7 45.1 26.7 19.2 1
123789-HxCDF 1.09 5.88 5.33 2.07
1234678-HpCDF 11.0 47.7 25.0 20.8 2
1234789-HpCDF 1.04 0.590 0 1.96
OCDF 6.35 24.9 17.0 40.9 2
PCB-77 2.82 2.79 7.93 6.86
PCB-81 0.470 0.390 1.84 1.36
PCB-126 1.60 0.960 0.450 0.460
PCB-169 0.0100 0.0100 0.0200 0.110
PCB-105 18.6 8.55 3.05 7.79 1
PCB-114 2.75 1.73 2.86 1.69
PCB-118 51.8 8.13 61.4 13.48 5
PCB-123 8.38 3.57 8.87 2.85
PCB-156 1.21 5.32 0.740 6.50
PCB-157 1.90 1.08 0.330 1.88
PCB-167 9.36 4.64 10.2 8.20
PCB-189 1.10 1.81 2.32 0.61
A, average; SD, standard deviation.
deposition, industrial and domestic effluents, stormwater,
spills and others.
In our study, the highest accumulation of PCDDs,
PCDFs and dl-PCBs was recorded in the reservoirs situated
at the end of the river system (reservoirs IV and V). More-
over, all samples contained very high concentrations of
OCDD and OCDF, and relatively high concentrations of
HpCDDs and HpCDFs (Tables 4 and 5). This situation
tuted PCDDs), PCDFs (the contribution in the total of 2,3,7,8-substituted PCDFs) and dl-PCB
rvoirs
II (%) IV (%) V (%)SD A SD A SD
0.0600 0 0 0.070 0 0
0.0500 22.1 0.0700 0.180 0 0.570
0 0.790 0 0 0.0100 0
0.61 0 0.100 0.460 0.0700 0.820
0.62 49.9 0 0.710 0.0500 0
5.47 25.2 9.79 1.49 7.05 3.99
3.2 51.7 90.0 1.61 92.8 2.65
2.74 2.08 1.20 2.33 0 1.08
6.44 2.53 1.22 6.63 0 2.31
7.64 6.63 2.72 5.61 0.530 6.14
7.70 4.89 1.96 6.02 4.37 4.02
5.66 6.58 1.29 4.19 0 6.23
0.8 35.9 4.38 3.51 30.4 3.85
3.27 8.13 1.20 5.06 0 1.98
8.1 30.6 16.4 14.9 35.8 17.5
2.50 0 2.20 5.77 0.110 1.47
5.2 12.4 67.4 16.1 28.76 24.7
8.60 9.29 1.64 7.42 3.40 5.49
2.91 1.94 3.28 2.59 6.26 3.43
0.660 0.640 0.290 0.620 0.930 1.07
0.340 0.670 0 0 0 0
1.1 10.2 2.32 10.32 5.56 3.01
3.99 4.06 5.01 8.65 0.16 1.66
9.5 15.0 73.9 15.5 38.3 31.9
7.03 3.17 2.96 3.08 5.26 5.32
1.38 2.77 0.140 0.0700 0.680 0.400
1.13 1.31 0.0700 0.0700 0.450 1.04
2.22 3.65 9.94 4.96 38.9 21.8
1.20 1.06 0.0100 0 0 0

Table 6 | Levels of PCDDs, PCDFs, dl-PCBs and WHO-TEQ concentrations measured in reservoirs, lakes and river sediments located in different parts of the world, with urban/industrial catchment characteristics
Country Site Compound Concentration References
Germany Small dam reservoirs Σ PCDDs and PCDFs 19,000–20,000 ng/kg d.w. Koh et al. ()
Holland Ren River Σ dl-PCBs 200,000 ng/kg d.w. Rose & McKay ()
Great Britain;Great Britain
Shallow lake; smalldam reservoir
Σ PCDDs and PCDFs; WHO-TEQ concentration;Σ PCDDs and PCDFs; WHO-TEQ concentration
590 ng/kg d.w; 6 ng TEQ/kg d.w.;2,000 ng/kg d.w.; 92 ng TEQ/kg d.w.
Rose & McKay ();Kannan et al. ()
USA Detroit River Σ PCDDs and PCDFs; WHO-TEQ concentration 69 ng/kg d.w.; 3.99 ng TEQ/kg d.w. Kannan et al. ()
USA Lower Rouge River Σ PCDDs and PCDFs; WHO-TEQ concentration 1,415 ng/kg d.w; 62 ng TEQ/kg d.w. Kannan et al. ()
USA Tittabawssee River Σ PCDDs; Σ PCDFs 59–120 ng/kg d.w; 2,400–53,600 ng/kgd.w.
Hilscherova et al. ()
USA Lake Ontario Σ PCDDs and PCDFs 728.6–2,712 ng/kg d.w. Marvin et al. ()
USA Lake Erie Σ PCDDs and PCDFs 778.8 ng/kg d.w. Marvin et al. ()
USA Housatonic River Σ PCDDs, PCDFs and dl-PCBs 160–5,400 ng/kg d.w. (max.82,000 ng/kg d.w.)
Eitzner ()
Korea Masan Bay Σ PCDDs and PCDFs 102–6,493 ng/kg d.w Eitzner ()
Northern Taiwan Small dam reservoir WHO-TEQ concentration 0.95–14.4 ng TEQ/kg d.w. Chi et al. ()
South Africa Rivers Σ PCDDs; Σ PCDFs; Σ dl-PCBs; WHO-TEQconcentration
2.8–170 ng/kg d.w; 0.86–13 ng/kg d.w;130–1,300 ng/kg d.w; 0.2–1.4 ng
TEQ/kg d.w.
Nieuwoudt et al. ()
623M.Urbaniak
etal. |
Spatialdistributionof
PCDDs,
PCDFs
anddl-PC
Bs
Hyd
rologyResearch
|44.4
|2013

624 M. Urbaniak et al. | Spatial distribution of PCDDs, PCDFs and dl-PCBs Hydrology Research | 44.4 | 2013
can be linked to the input of PCDDs, PCDFs and dl-PCBs
from the range of sources mentioned above, including the
input of wastewater and stormwater as well as hydraulic
transportation along the reservoirs that can affect their
final spatial distribution in the cascade reservoirs studied.
Input of wastewater
The results showed the strong predominance of PCDDs in
the total PCDD/PCDF concentration (accounted for up to
98.4%), generated mainly by the increased concentration
of the OCDD congener. These findings demonstrate the
serious effects caused by illegal disposal of untreated waste-
water into the Sokołówka River from human settlements,
which was confirmed in the field observations (Urbaniak
et al. ). The similarity between PCDD/PCDF profiles
in wastewater influent (Oleszek-Kudlak et al. ) and
studied reservoir sediments (Table 5) suggests the influence
of this source on the noted concentrations. According to
Oleszek-Kudlak et al. (), the PCDD/PCDF profiles in
wastewater influent to the Municipal Wastewater Treatment
Plant in Zabrze, Poland, were characterized by the elevated
contribution of 1,2,3,4,6,7,8-HpCDD (28.5%) and OCDD
(69.5%) to the total of seven toxic PCDD congeners and
increased contribution of 1,2,3,3,6,7,8-HpCDF (23.5%) and
OCDF (55.9%) to the total of toxic PCDF congeners. In
our study, the contribution of those congeners varied
between 5.47 and 21.9% for 1,2,3,4,6,7,8-HpCDD, between
19.3 and 93.2% for OCDD, between 11.0 and 35.8% for
1,2,3,3,6,7,8-HpCDF and between 6.35 and 67.4% for
OCDF (Table 5). Moreover, the results of McLachlan et al.
() demonstrated that all of the higher chlorinated conge-
ners and a large part of the lower chlorinated ones in sludge
from Stuttgart-Busnau originated from household waste-
water of which the main source was laundry (Horstmann
et al. ), as washing of contaminated clothing results in
the increased amount of PCDD/PCDF in washing waste-
water. Additionally, Rappe et al. () reported that some
amounts of PCDD/PCDF were also found in detergents. It
was also demonstrated that some PCDDs/PCDFs can be
transported from clothing to the skin surface and then
removed during showering, providing the secondary
source of these contaminants in the household wastewater
(McLachlan et al. ). This finding agrees well with results
presented by Huntley et al. () who analysed the concen-
trations of PCDDs, PCDFs and coplanar PCBs in the surface
sediments adjacent to four combined sewer overflows
(CSOs) that discharged to the Lower Passaic River. Accord-
ing to Huntley et al. (), the obtained results with the
elevated contribution of OCDD and 1,2,3,4,6,7,8-HpCDD
in the total of seven PCDDs (ranging from 34.7 to 85.7%
and from 7.31 to 36.5%, respectively) indicated that CSOs
are significant mechanisms for boosting the sediment with
PCDDs/PCDFs. The high conductivity of the riverine and
the reservoir water demonstrated in our earlier study by
Urbaniak et al. (), as well as the results of weekly moni-
toring of the Sokołówka River conducted since 2006, where
conductivity intermittently exceeds 4,500 μS/cm, suggest
that there is illegal input of domestic sewage.
The highest total and WHO-TEQ concentrations were
recorded in the reservoirs with strong anthropogenic influ-
ence. This situation applies mainly to reservoirs IV and V
located in the basin with the highest percentage of urba-
nized and industrialized areas (47% in the middle and
60% in the lower section of the Sokołówka River catch-
ment). Furthermore, very high concentrations in the
downstream reservoir (V) of the longest time of sediment
accumulation (since 1980), which also contains water of
the small tributary (Brzoza River) used to drain a 30,000
inhabitants residential estate of the city, and served as part
of the municipal stormwater and sewage system, may
imply a contribution of untreated sewage from the surround-
ing housing estates and industrial areas (Urbaniak et al.
, , ). The highest time of sediment storage in
the V reservoir (circa 30 years; Table 1), in which a variety
of micropollutants from the catchment has been accumu-
lated, may also indicate the impact of textile industry that
operated intensively in Łódz until the end of the 1990s.
The use of pigments and dyes in the textile processing may
have discharged some amounts of PCDDs/PCDFs to the
sewer system and subsequently to the rivers, due to the
fact that the sewer system of Łódz collects domestic and
industrial wastewater and stormwater and that the rivers
are frequently used as wastewater receivers. Allock &
Jones () and Bostian et al. () reported that pigments
such as chloranil or dyes produced on the basis of chloranil
may contain from 300 to 2,900 and from 2 to 200 μg TEQ/kg
of dioxins, respectively, with the predominance of OCDD
625 M. Urbaniak et al. | Spatial distribution of PCDDs, PCDFs and dl-PCBs Hydrology Research | 44.4 | 2013
congener ranged from 77 to 100% of the total of the seven
PCDD studies, a finding that was similar to that of our
study in which OCDD predominance (up to 93%) was
also observed (Table 4).
The disposal of domestic sewage and industrial effluents
from the neighbouring factory into reservoir IV (confirmed
during field visits) and the extended water retention time
of this reservoir related to its location on the right river
bank, caused the accelerated growth of phytoplankton
(Urbaniak et al. ). The exchange of pollutants between
the deposited sediments and the water column due to fora-
ging of benthivorous fish such as crucian (Carassius
carassius) and Prussian carps (Carassius gibelio), tench
(Tinca tinca) and roach (Rutilus rutilus) can lead to an
increased concentration of pollutants in the water column.
In reservoir IV not only was twice as much fish biomass
noted as catch per unit effort (CPUE; Puertas & Bodmer
) but also the proportion of larger specimens, which
are more effective in sediment resuspension, was clearly
higher than that found in the III and IV impoundments
(Table 1). This finding means that the highest rate of sedi-
ment and water mixing, boosting the water column in
sediment-associated pollutants, should be observed in IV
reservoir and could generate the higher PCDD/PCDF and
dl-PCB concentration in the water. Our earlier study con-
firmed this effect (Urbaniak et al. ). Also coupled with
the fact that the IV pond is the most shallow (maximum
1 m) among all the studied reservoirs, these events could
stimulate this process. This effect can cause the accelerated
accumulation of PCDDs/PCDFs and dl-PCBs on the surface
of growing phytoplankton. Larrson et al. (), Berglund
et al. () and Roessink et al. () suggested that PCBs
associated with the phytoplankton cells can be removed
from the water column due to sedimentation process and
deposited in sediments. Our previous research focused on
the investigation of transport and deposition drivers for 17
toxic PCDD/PCDF congeners in the Sokołówka cascade
reservoirs, and demonstrated a positive strong correlation
between WHO-TEQ concentrations in water and chloro-
phyll a content (R¼ 0.90, p¼ 0.04; Urbaniak et al. ).
The same study demonstrated the elevated concentrations
of the total toxic PCDD/PCDF congeners in the water
samples of reservoir IV during summer when intensive
growth of phytoplankton was observed (1,350 pg/L)
compared with the winter sampling time with no phyto-
plankton present (28.4 pg/L; Urbaniak et al. ). Similar
results were obtained for WHO-TEQ concentrations:
73.5 pg TEQ/L in summer and 0.009 pg TEQ/L in winter.
Also of note was that the peak of benthivorous fish foraging
occurred at this time, leading to increased resuspension of
sediments for the summer season. Based on the above find-
ings we concluded that the discharges of domestic sewage
and industrial effluents, the extended retention time and
small depth as well as the high fish density in the IV reser-
voir led to the association of discharged and resuspended
from sediments PCDD/PCDF and dl-PCB on the surface
of phytoplankton cells. The further sedimentation of phyto-
plankton blooms can be an important mechanism that
boosts the levels of PCDDs/PCDFs and dl-PCBs in sedi-
ments in this reservoir (Urbaniak et al. ).
Input of stormwater
The removal of natural vegetation and its replacement with
impervious cover, which consequently creates high flow
peaks and increased volumes of runoff, are regarded as one
of the major problems in the urban territory (Walker et al.
). The pollution of stormwater runoff affects the quality
of the urban aquatic ecosystem. As reported by McLachlan
et al. (), about 32% of the total amount of PCDDs/
PCDFs and dl-PCBs entering the municipal wastewater treat-
ment plants in Germany originates from the surface runoff.
The results from Stockholm indicated that this amount is
actually 20%. In addition, Marsalek et al. () reported
that the total annual precipitation in large industrialized
cities is generally 5–10% higher than that in the surrounding
areas, and for individual storms, the increase in precipitation
can be as high as 30%. Therefore, varying meteorological
changes during the research time, including seasons of
drought (April, May, September in 2007 and 2008) and inten-
sive storms (e.g. up to 38 mm rainfall/day in August 2008;
http://www.tutiempo.net/en/Climate/LUBLINEK/121055.
htm), may have influenced the scouring of PCDDs/PCDFs
and dl-PCBs from the stormwater catchment and their trans-
port down the cascade. This situation indicates that
stormwater might be the second possible source of
PCDDs/PCDFs and dl-PCBs in the urban cascade reservoirs,
as the congener profile dominated by OCDD was also found

626 M. Urbaniak et al. | Spatial distribution of PCDDs, PCDFs and dl-PCBs Hydrology Research | 44.4 | 2013
in urban stormwater (Naf et al. ), street runoff and storm-
water sediments (Horstmann & McLachlan ).
The highest average concentrations of analysed PCDDs,
PCDFs and dl-PCBs in the sediments of the studied reservoirs
were observed in samples collected in the downstream re-
servoirs – in the IV reservoir (1,380 ng/kg d.w.) and the V
reservoir (11,400 ng/kg d.w.), characterized by the largest
total catchment area of 7.87 and 14.0 km2, respectively,
from which the higher proportion of atmospherically depos-
ited PCDD/PCDF and dl-PCB can be flushed into the river
ecosystem. Within the total Sokołówka catchment the urba-
nized, residential and industrial areas cover 47% of the
middle and 60% of the upper catchment. The urbanized
areas cover 3.46 km2 of the catchment of the reservoir I,
3.69 km2 of the reservoir II, 3.75 km2 of the reservoir III,
4.12 km2 of the reservoir IV and 6.56 km2 of the catchment
of the reservoir V. The above data indicate that reservoir V,
which possesses the largest surface of the urbanized catch-
ment (6.56 km2), generates the highest amount of analysed
pollutants (Table 4). Also, the highest WHO-TEQ concen-
tration of 18.9 ng TEQ/kg d.w. is reported for this
reservoir. Additionally, it can be emphasized that the two-
fold increase in the urbanized catchment area (from
3.64 km2 for the reservoir I to 6.56 km2 for the reservoir
V) was followed by an approximately seven-fold increase
in WHO-TEQ concentration (2.64–18.9 ng TEQ/kg d.w.).
It should be also noted that the Sokołówka River
receives the stormwater from the three kinds of stormwater
catchments: residential (single-family houses); mixed resi-
dential/industrial; and apartmental (blocks of flats;
Urbaniak & Zalewski ). According to Urbaniak &
Zalewski (), the largest area of streets and parking
(23% of the catchment area) noted for mixed residential/
industrial catchment resulted in the highest WHO-TEQ con-
centration of the stormwater samples (27.5 pg TEQ/L). The
residential and apartmental catchments characterized by
lower percentage of streets and parking area of respectively
16 and 13% had correspondingly lower TEQ values (25.6
and 23.2 pg TEQ/L, respectively; Urbaniak & Zalewski
). This finding implies that rainfall and consequently
the high runoff can scour PCDDs/PCDFs deposited in the
stormwater catchment due to road transport (Mullis et al.
) – due to car exhaust gases and the normal wear and
tear of vehicle parts that contain PCDDs/PCDFs (Ngabe
et al. ; Polkowska et al. ; Kim et al. ; Helmreich
et al. ). In the case of the Sokołówka catchment, its
spatial organization indicates that car traffic can influence
the contamination of its reservoirs with PCDDs/PCDFs
and dl-PCBs. The current organization of the city funnels
the major traffic both within the centre and between the
centre and the city outskirts through the two main streets
located between reservoirs II and III (Zgierska Street) and
between reservoirs IV and V (Włókniarzy Avenue). This
situation can generate PCDD/PCDF and dl-PCB pollution
in road runoff and thus can affect river and reservoir con-
tamination. The largest amounts of PCDD/PCDF emitted
from a diesel engine are due to high chlorinated congeners,
with the dominant fraction being 1,2,3,4,6,7,8-HpCDD/
HpCDF and OCDD/OCDF and a higher proportion of
PCDF than PCDD (Hagenmaier et al. ; Geueke et al.
; Ryan & Gullet ; Kim et al. ). For the study
described here, the contribution of HpCDD and HpCDF
to the total of PCDDs and the total of PCDFs varied
between 5.47 and 21.9%, and from 11.0 to 35.8%, respect-
ively. Moreover, our previous results from the Sokołówka
River demonstrated that the riverine water samples col-
lected near the busy Zgierska Street (located between
reservoirs II and III) had elevated the concentration of
toxic PCDD/PCDF to 12.53 pg/L, whereas other samples
collected far from the roads and streets were characterized
by concentrations ranging from 0 to 0.88 pg/L (Urbaniak
et al. ). Despite the input of PCDD/PCDF from the
street runoff, reservoir III was characterized as having the
lowest value of total PCDDs/PCDFs and dl-PCBs, and
WHO-TEQ concentrations, which amounted to 182 ng/kg
d.w. and 1.31 ng TEQ/kg d.w., respectively. Analysis using
the Wilcoxon matched pairs test revealed statistically signifi-
cant differences (p� 0.05) between this pond and reservoir
II (pair II and III) and IV (pair III and IV) in three out of
four cases: (1) for all 29 PCDD, PCDF and dl-PCB conge-
ners; (2) for PCDF congeners; and (3) for dl-PCB
congeners (Table 3). Also for the other pairs, taking into
account reservoir III (I and III; III and V), statistically sig-
nificant differences were noted (Table 3). From the point
of view of comparing the level of contamination, the most
interesting differences are those noted for reservoirs III
and IV, as they are newly constructed ponds of similar
age, built in the middle of the Sokołówka River catchment

627 M. Urbaniak et al. | Spatial distribution of PCDDs, PCDFs and dl-PCBs Hydrology Research | 44.4 | 2013
under comparable conditions. Hence the concentration of
analysed compounds in those reservoirs should be similar.
The obtained differences, beside the findings described in
the previous section for IV reservoir, may be also related
to the sediment traps and sand separators constructed at
the stormwater outlets, used also as illegal sewage dis-
charges into reservoir III. The inflowing stormwater and
road runoff may also be partially purified in the land-water
ecotone (Naiman & Decamps ; Schiemer et al. )
constructed in the nearest catchment and in the littoral
zone of this reservoir. Such structures may capture and
immobilize some of the discharged PCDDs/PCDFs and dl-
PCBs, and thus may contribute to the reduction in their con-
centrations in the reservoir sediments (Macek et al. ;
Susarla et al. ; Chaudhry et al. ; Yateem et al. ).
The housing area, including residential and apartment
catchments, covers more than 59% of the upper and 21%
of the middle section of the Sokołówka catchment. At the
same time, the sediment samples from reservoir I located
in the upper part of the Sokołówka catchment, contained
a large portion of lower chlorinated tetrachlorodibenzo-
furan (TCDF) and PeCDD/PeCDF congeners (5.28% for
1,2,3,7,8-PeCDD and 13.9% for 2,3,7,8-TCDF and 13.4%
for 1,2,3,7,8-PeCDF) in a typical ‘burning profile’ (Table 5).
According to the US EPA (a), the emission of
PCDDs/PCDFs due to house heating, its further deposition
on the catchment surface and surface runoff may also con-
tribute to the final PCDD/PCDF and dl-PCB
concentration. In the case of Poland, Grochowalski &
Chrzaszcz () reported, based on the study conducted
in Krakow, that the domestic stove stack emitted about
100 ng/m3 PCDD/PCDF. Pfeiffer et al. () reported the
PCDD/PCDF emissions for experimental oil-fired and gas-
fired boilers in the range of 0.002–0.0142 ng I-TEQ/m3
and the flue gas from wood-fired furnaces ranging from
0.014 to 0.076 ng I-TEQ/m3. US EPA (a) accounted
the emission from domestic burning of about 60% of the
total PCDD/PCDF emission to the atmosphere in the USA.
CONCLUSIONS
In shallow, turbid, hypertrophic reservoirs located on small,
urban rivers, the fate of PCDDs/PCDFs and dl-PCBs is
mostly determined by the allochthonous matter (discharged
as sewage and scouring from the catchment surface) trans-
ported down the cascade during intensive storm events.
The presented study on the distribution of PCDDs/PCDFs
and dl-PCBs along the cascade of reservoirs showed that
there was increasing pollution levels, with the highest pol-
lution values in the last reservoir in the cascade – also the
biggest and the oldest reservoir. The middle reservoir III,
with the lowest total and WHO-TEQ concentrations, was
the exception to this rule. It was equipped with sediment
traps and sand separators at the stormwater outlets and eco-
tone zones around the reservoir catchment to enhance the
purification of inflowing storm-waters. The above results
implicate the role of hydrological and biological processes
towards the reduction of the micropollutant concentrations
in the water ecosystems.
ACKNOWLEDGEMENTS
The study was carried out within the scope of the following
projects: 6 FP GOCE 018530 SWITCH (Sustainable Water
management Improves Tomorrow’s Cities Health) financed
by the European Commission; and PL0074–EOG MF ‘A
Comprehensive Analysis of Risk after Exposure to Dioxin
and Dioxin-Like Polychlorinated Biphenyls in Poland’.
REFERENCES
Allock, R. E. & Jones, K. C. Pentachlorophenol (PCP) andChloranil as PCDD/Fs sources to sewage sludge and sludgeamended soils in UK. Chemosphere 35, 2317–2330.
Berglund, O., Larsson, P., Ewald, G. & Okla, L. Influence oftrophic status on PCB distribution in lake sediments andbiota. Environmental Pollution 113, 199–210.
Biezanowski, W. Łódka and Other Łódz Rivers, 2nd edition.Society for the Reservation of Historical Monuments in ŁódzPublishing Zora (in Polish).
Bostian, K., Merechal, A. M., Voncina, E. & Bronijak-Voncina, D. Textile dyes and pigments as a source of dioxins.Organohalogen Compounds 66, 931–935.
Chaudhry, Q., Blom-Zandstra, M., Gupta, S. & Joner, E. J. Utilizing the synergy between plants and rhizospheremicroorganisms to enhance breakdown of organic pollutantsin the environment. Environmental Science and PollutionResearch 12, 34–48.
628 M. Urbaniak et al. | Spatial distribution of PCDDs, PCDFs and dl-PCBs Hydrology Research | 44.4 | 2013
Chi, K. H., Chang, M. B. & Kao, S. J. Historical trends ofdioxin-like compounds in sediments buried in a reservoir inNorthern Taiwan. Chemosphere 68, 1733–1740.
Compilation of EU Dioxin Exposure & Health Data
Task 3 – Environmental Fate and Transport, EuropeanCommission Directorate-General (DG) Environment UKDepartment of the Environment, Transport and theRegions (DETR), 97/322/3040/DEB/E1 j:\dioxins\t3_f&t\f&t_rep\tsk3final.doc.
DiPinto, L. M., Coull, B. C. & Chandler, G. T. Lethal andsublethal effects of a sediment-associated PCB Aroclor 1254on a meiobenthic copepod. Environmental Toxicology andChemistry 12, 1909.
Eitzner, B. D. Comparison of point and nonpoint sources ofpolychlorinated dibenzo-p-dioxins and polychlorinateddibenzofurans to sediments of Housatonic River.Environmental Science and Technology 27, 1632–1637.
Geueke, K. J., Gessner, A., Quass, U., Broker, E. & Hiester, E. PCDD/F emission from heavy duty vehicle diesel engines.Chemosphere 38, 2791–2806.
Grochowalski, A. & Chrzaszcz, R. PCDD/Fs levels insuspended particulate matter in ambient air from the KrakówCity, Poland. Dioxin ’97. Seventeenth InternationalSymposium on Chlorinated Dioxins, PCBs and RelatedCompounds, Indianapolis, USA, August. OrganohalogenCompounds 32, 76–80.
Hagenmaier, H., Dawidowsky, N., Weberrub, U., Hutzinger, O.,Schwind, K. H., Thoma, H., Essers, U., Buhler, U. & Griner,R. Emissions of polychalogenated dibenzodioxins anddibenzofurans from combustion engines. OrganohalogenCompounds 2, 329–334.
Helmreich, B., Hilliges, R., Schriewer, A. & Horn, H. Runoffpollutants of a highly trafficked urban road–correlationanalysis and seasonal influences. Chemosphere 80, 991–997.
Hilscherova, K., Kannan, K., Nakata, H., Yamashita, N., Bradley,P., Maccabe, J. M., Taylor, A. B. & Giesy, J. P. Polychlorinated dibenzo-p-dioxin and dibenzofuranconcentration profiles in sediments and flood-plain soils ofthe Tittabawssee River, Michigan. Environmental Scienceand Technology 37, 468–474.
Horstmann, M. & McLachlan, M. Concentrations ofpolychlorinated dibenzo-p-dioxins PCDD) anddibenzofurans PCDF) in urban runoff and householdwastewater. Chemosphere 31, 2887–2896.
Horstmann, M., McLachlan, M. & Reissingeer, M. Investigations of the origin of PCDD/F in municipal sewagesludge. Chemosphere 27, 113–120.
Huntley, S. L., Iannuzzi, T. J., Avantaggio, J. D., Carlson-Lynch,H., Schmidt, C. W. & Finley, B. L. Combined seweroverflows (CSOs) as sources of sediment contamination inthe Lower Passaic River, New Jersey. II. Polychlorinateddibenzo–dioxins, polychlorinated dibenzofurans, andpolychlorinated biphenyls. Chemosphere 34, 233–250.
Jokiel, P. & Maksymiuk, Z. Atlas of the Lodz City. Map IX.Łódz Scientific Society Publishing.
Kannan, K., Kober, J. L., Kang, Y. S., Masunaga, S., Nakanishi, J.,Ostaszewski, A. & Giesy, J. P. Polychlorinatednaphthalenes, -biphenyls, -dibenzo-p-dioxins, -dibenzofurans,polycyclic aromatic hydrocarbons and alkylphenols insediment from the Detroit and Rouge Rivers, Michigan, USA.Environmental Toxicology and Chemistry 20, 1878–1889.
Kim, K.-S., Hong, K.-H., Ko, Y.-H., Yoon, K.-D. & Kim, M.-G. Emission characteristics of PCDD/Fs in diesel engine withvariable load rate. Chemosphere 53, 601–607.
Knezovich, J. P., Harrison, F. L. & Wilhelm, R. G. Thebioavailability of sediment sorbed organic chemicals: areview. Water, Air and Soil Pollution 32, 233–245.
Koh, C. H., Khim, J. S., Kannan, K., Villeneuve, D. L.,Senthilkumar, K. & Giesy, J. P. Polychlorinateddibendibenzo-p-dioxins (PCDDs), dibenzofurans (PCDFs),biphenyls (PCBs), and polycyclic aromatic hydrocarbons(PAHs) and 2,3,7,8-TCDD equivalents (TEQs) in sedimentsfrom the Hyeongsan River, Korea. Environmental Pollution123, 489–501.
Kujawa, I. & Kujawa, M. The General Project of theSokołówka River. UML Łódz Publishing.
Larrson, P., Okla, L. & Cronberg, G. Turnover ofpolychlorinated biphenyls in a eutrophic and an oligotrophiclake in relation to internal lake processes and atmospherefallout. Canadian Journal of Fisheries and Aquatic Sciences55, 1926–1937.
Macek, T., Mackova, M. & Kas, J. Exploitation of plants forthe removal of organics in environmental remediation.Biotechnology Advances 18, 23–34.
Marsalek, J., Jimenez-Cisneros, B. E., Malmaquist, P. A.,Karmazus, J., Goldenfum, K. J. & Chocat, B. UrbanWater Cycle Processes and Interactions. TechnicalDocuments in Hydrology. UNESCO, Paris, p. 78.
Marvin, Ch. H., Howell, E. T., Kolic, T. M. & Reiner, E. J. Polychlorinated dibenzo-p-dioxins and dibenzofurans anddioxin-like polychlorinated biphenyls in sediments andmussels at three sites in the lowerGreat Lakes,NorthAmerica.Environmental Toxicology and Chemistry 21, 1908–1921.
McLachlan, M. S., Horstmann, M. & Hinkel, M. Polychlorinated dibenzo-p-dioxins and dibenzofurans insewage sludge: sources and fate following sludge applicationto land. Science of the Total Environment 185, 109–123.
Mullis, R.M.D., Revitt,M.&Shutes, R. B. The impacts of urbandischarges on the hydrology and water quality of an urbanwatercourses. Science of the Total Environment 189/190, 385.
Naf, C., Broman, D., Ishaq, R. & Zebuhr, Y. PCDDs andPCDFs in water, sludge and air samples from various levelsin a wastewater treatment plant with respect to compositionchanges and total flux. Chemosphere 20, 1503–1510.
Naiman, R. J. & Decamps, H. (eds.) The Ecology andManagement of Aquatic–Terrestrial Ecotones. UNESCO,MAB, Parthenon, Paris.
National Institute of Standards and Technology Certificate ofAnalysis for SRM1939a, PolychlorinatedBiphenyls (Congeners)in River Sediment A. NIST, Gaithersburg, MD, USA.
629 M. Urbaniak et al. | Spatial distribution of PCDDs, PCDFs and dl-PCBs Hydrology Research | 44.4 | 2013
Ngabe, B., Middleman, T. F. & Scott, G. I. Polycyclicaromatic hydrocarbons in storm water runoff from urban andcoastal South Carolina. Science of the Total Environment 22,1–9.
Nieuwoudt, C., Quinn, L. P., Pieters, R., Jordan, I., Visser, M.,Kylin, H., Bergen, A. R., Giesy, J. P. & Bouwman, H. Dioxin-like chemicals in soil and sediment from residentialand industrial areas in Central South Africa. Chemosphere76, 774–783.
Oleszek-Kudlak, S., Grabda, M., Czaplicka, M., Rosik-Dulewska,Cz., Shibata, E. & Nakamura, T. Fate of PCDD/PCDFTuring mechanical-biological sludge treatment. Chemosphere61, 389–397.
Pfeiffer, F., Struschka, M., Baumbach, G., Hagenmaier, H. &Hein, K. R. G. PCDD/PCDF emissions from small firingsystems in households. Chemosphere 40, 225–232.
PN-EN 1948 Emission from Stationary Sources. Determinationof PCDD/PCDFMass Concentration. Part 3: Identification andquantification. Ars Boni Ltd Publisher (in Polish).
Polkowska, Z., Grynkiewicz, M., Zabiega, B. & Namiesnik, J. Levels of pollutants in runoff water from roads with hightraffic intensity in the city of Gdansk, Poland. Polish Journalof Environmental Studies 10, 351.
Puertas, P. & Bodmer, R. E. Hunting effort as a tool forcommunity-based wildlife management in Amazonia. In:People in Nature: Wildlife Conservation in South and CentralAmerica (K. M. Silvius, R. E. Bodmer & J. M. V. Fragoso,eds). Columbia University Press.
Rappe, C., Andersson, R., Lundstrom, K. & Wigerg, K. Levels of polychlorinated dioxins and dibenzofurans incommercial detergents and related products. Chemosphere,21, 43–50.
Roessink, I., Koelmans, A. A. & Brock, T. C. M. Interactionsbetween nutrients and organic micro-pollutants in shallowfreshwater model ecosystems. Science of the TotalEnvironment 406, 436–442.
Rose, C. L. & McKay, W. A. PCDDs (dioxins) and PCDFs(furans) in selected UK lake and reservoir sites –concentrations and TEQs in sediments and fish samples.Science of the Total Environment 177, 43–56.
Ryan, J. V. & Gullet, B. K. On-road emission sampling of aheavy-duty diesel vehicle for polychlorinated dibenzo-p-dioxins and polychlorinated dibenzofurans. EnvironmentalScience and Technology 34, 4483–4489.
Schiemer, F., Zalewski, M. & Thorpe, J. E. (eds) TheImportance of Aquatic–Terrestrial Ecotones for FreshwaterFish. Developments in Hydrobiology. Kluwer AcademicPublisher, Dordrecht, Boston, London, pp. 105.
Susarla, S., Medina, V. F. & McCutcheon, S. C. Phytoremediation: an ecological solution to organic chemicalcontamination. Ecological Engineering 18, 647–658.
Thompson, A., Allen, J. R., Dodoo, D., Hunter, J., Hawkins, S. J. &Wolff, G. A. Distribution of chlorinated biphenyls inmussels and sediments from Great Britain and Irish Sea Cast.Marine Pollution Bulletin 32, 232.
US EPA a Estimating Exposure to Dioxin-Like Compounds.Volume II: Properties, Sources, Occurrence, and BackgroundExposures. United States Environmental Protection Agency,Office of Research and Development, Washington, DC.EPA/600/6–88/005cb.
US EPA Method 1613 b Revision B: Tetra Through OctaChlorinated Dioxins and Furans by Isotope Dilution.HRGC/HRMS, US EPA.
US EPA Method 1618 Revision A: Chlorinated BiphenylsCongeners in Water, Soil, Sediment and Tissue.HRGC/HRMS, US EPA.
Urbaniak, M. & Zalewski, M. Temporal and land-useinduced variability of dioxins and dioxin-like compoundsin urban run-off. In: Proceedings of the 5th BalwoisConference: International Conference on Water,Climate and Environment (M. Morell, ed.). Faculty ofCivil Engineering, Skopje, Macedonia.
Urbaniak, M., Skowron, A., Fratczak, W., Zielinski, M. &Wesołowski, W. Transport of polychlorinated biphenylsin urban cascade reservoirs: levels, sources and correlation tothe environmental conditions. Polish Journal ofEnvironmental Studies 19, 201–211.
Urbaniak, M., Skowron, A., Zielinski, M. & Zalewski, M. Hydrological and environmental conditions as key driversfor spatial and seasonal changes in PCDD/PCDFconcentrations, transport and deposition along urbancascade reservoirs. Chemosphere 88, 1358–1367.
Urbaniak, M., Zielinski, M., Wesołowski, W. & Zalewski, M. PCBs and heavy metals contamination in bottomsediments from three reservoirs of different catchmentcharacteristics. Polish Journal of Environmental Studies 17,941–949.
Urbaniak, M., Zielinski, M., Wesołowski, W. & Zalewski, M. Sources and distribution of polychlorinated dibenzo-para-dioxins and dibenzofurans in sediments of urban cascadereservoirs, Central Poland. Environment ProtectionEngineering 3, 93–103.
Wagner, I. & Zalewski, M. Ecohydrology as a basis for thesustainable city strategic planning: focus on Lodz, Poland.Review of Environmental Science Biotechnology 8 (3),209–217.
Wagner, I. & Zalewski, M. System solutions in UrbanWater Management: the Lodz (Poland), perspective.In: Water Sensitive Cities. Cities of the Future Series(C. Howe & C. Mitchell, eds). IWA Publishing, London,pp. 231–245.
Wagner, I., Izydorczyk, K., Drobniewska, A., Fratczak, W. &Zalewski, M. Inclusion of ecohydrology concept asintegral component of systemic in urban water resourcesmanagement. The city of Lodz, case study, Poland.Scientific Conference SWITCH in Birmingham andNew Directions in IURWM, Paris. SWITCHGOCE 018530Project Report.
Walker, W. J., McNutt, R. P. & Maslanka, C. K. The potentialcontribution of urban runoff to surface sediments of the

630 M. Urbaniak et al. | Spatial distribution of PCDDs, PCDFs and dl-PCBs Hydrology Research | 44.4 | 2013
Passaic river: sources and chemical characteristics.Chemosphere 38, 363–377.
Yateem, A., Al-Sharrah, T. & Bin-Haji, A. Investigation ofmicrobes in the rhizosphere of selected grasses forrhizoremediation of hydrocarbon-contaminated soils. Soiland Sediment Contamination 16, 269–280.
Zalewski, M. Ecohydrology – the scientific background to useecosystemproperties asmanagement tools toward sustainabilityof water resources. Ecological Engineering 16, 1–8.
Zalewski, M. Ecohydrology – an interdisciplinary tool forintegrated protection and management of water bodies.Archives of Hydrobiology Supplement 158, 613–622.
Zalewski, M., Janauer, G. A. & Jolankaj, G. Ecohydrology: ANew Paradigm for the Sustainable Use of Aquatic Resources.Conceptual Background, Working Hypothesis, Rationale andScientific Guidelines for the Implementation of the IHP-VProjects 2.3/2.4, Technical Documents in Hydrology No.7.UNESCO, Paris.
First received 10 October 2011; accepted in revised form 11 September 2012. Available online 17 December 2012