
Spatial and Temporal Dynamics of Attentional Guidance during Inefficient Visual Search
10
Spatial and Temporal Dynamics of Attentional Guidance during Inefficient Visual Search Alexandre Zenon 1 *, Suliann Ben Hamed 2 , Jean-Rene ´ Duhamel 2 , Etienne Olivier 1 1 Laboratory of Neurophysiology, Universite ´ catholique de Louvain, Bruxelles, Belgium, 2 Institut des Sciences Cognitives, CNRS, Bron, France Abstract Spotting a prey or a predator is crucial in the natural environment and relies on the ability to extract quickly pertinent visual information. The experimental counterpart of this behavior is visual search (VS) where subjects have to identify a target amongst several distractors. In difficult VS tasks, it has been found that the reaction time (RT) is influenced by salience factors, such as the target-distractor similarity, and this finding is usually regarded as evidence for a guidance of attention by preattentive mechanisms. However, the use of RT measurements, a parameter which depends on multiple factors, allows only very indirect inferences about the underlying attentional mechanisms. The purpose of the present study was to determine the influence of salience factors on attentional guidance during VS, by measuring directly attentional allocation. We studied attention allocation by using a dual covert VS task in subjects who had 1) to detect a target amongst different items and 2) to report letters briefly flashed inside those items at different delays. As predicted, we showed that parallel processes guide attention towards the most relevant item by virtue of both goal-directed and stimulus-driven factors, and we demonstrated that this attentional selection is a prerequisite for target detection. In addition, we show that when the target is characterized by two features (conjunction VS), the goal-directed effects of both features are initially combined into a unique salience value, but at a later stage, grouping phenomena interact with the salience computation, and lead to the selection of a whole group of items. These results, in line with Guided Search Theory, show that efficient and rapid preattentive processes guide attention towards the most salient item, allowing to reduce the number of attentional shifts needed to find the target. Citation: Zenon A, Ben Hamed S, Duhamel J-R, Olivier E (2008) Spatial and Temporal Dynamics of Attentional Guidance during Inefficient Visual Search. PLoS ONE 3(5): e2219. doi:10.1371/journal.pone.0002219 Editor: Antonio Verdejo Garcı ´a, University of Granada, Spain Received December 21, 2007; Accepted March 25, 2008; Published May 21, 2008 Copyright: ß 2008 Zenon et al. This is an open-access article distributed under the terms of the Creative Commons Attribution License, which permits unrestricted use, distribution, and reproduction in any medium, provided the original author and source are credited. Funding: A.Z. is a research assistant supported by a grant from the Fonds pour la formation a ` la Recherche dans l’Industrie et dans l’Agriculture (FRIA). This project was supported by research grants from the Universite ´ catholique de Louvain (FSR), the Fonds de la Recherche Scientifique Me ´ dicale (FRSM) and the Fondation Me ´ dicale Reine Elisabeth (FMRE). Competing Interests: The authors have declared that no competing interests exist. * E-mail: [email protected] Introduction A rapid identification of pertinent stimuli is crucial in the natural environment and this ability relies on a selection mechanism known as spatial attention, which permits the allocation of more neural resources to process behaviorally significant elements. Our understanding of attentional mecha- nisms mainly comes from studies using covert visual search (CVS) tasks – where subjects have to detect a given target amongst distractors, without performing eye movements. Two types of CVS are classically distinguished: 1) efficient CVS in which the reaction time (RT) remains constant irrespective of the number of items, suggesting that visual information is processed in parallel, and 2) inefficient CVS in which RT increases proportionally to the number of items, a relationship known as the ‘‘set-size effect’’ and classically regarded as evidence for a serial processing of visual information. However, in inefficient CVS, the slope of the regression line between RT and the number of CVS items typically varies from 25 to 60 ms/item, leaving very little time to process each item serially [1]. Moreover, estimates of the attentional dwell time range between 200 and 400 ms, values which are incompatible with the attentional shift time estimated from the set-size slope [2,3]. This suggests that, besides serial mechanisms, parallel mechanisms most likely contribute to visual information processing in inefficient CVS [4,5]. The Guided Search Theory (GST) proposed that the role of preattentive parallel mechanisms in visual search is to guide attention on the basis of the salience value assigned to each CVS item [5–7]; this salience value is supposed to be assessed from both goal-directed (or top-down) and stimulus-driven (or bottom-up) factors. Importantly, the conclusion of most studies on CVS relied on the interpretation of changes in RT and set-size slope in different experimental conditions. However, because variations in RT may be caused by different sensory, sensori-motor and motor factors, it is always difficult to interpret them in terms of attention allocation. Indeed, several recent studies have shown that it is possible to explain the variation of performance as a function of set-size during CVS without requiring serial attentional mechanisms (e.g. see [8–10]). Therefore, in order to study thoroughly attentional allocation during CVS, it is necessary to demonstrate a spatially specific perceptual improvement during CVS, revealing the attentional selection of one – or multiple – item(s). Several studies have already used this approach. For example, Maljkovic and Nakayama [11,12], were able to demonstrate, in a pop-out visual search task, that attention systematically shifted onto the target. These results were extended to inefficient CVS by Nothdurft [13], who used the illusory line motion effect to probe attentional allocation on the target. Kim & Cave [14], went a step PLoS ONE | www.plosone.org 1 May 2008 | Volume 3 | Issue 5 | e2219
Transcript of Spatial and Temporal Dynamics of Attentional Guidance during Inefficient Visual Search

Spatial and Temporal Dynamics of Attentional Guidanceduring Inefficient Visual SearchAlexandre Zenon1*, Suliann Ben Hamed2, Jean-Rene Duhamel2, Etienne Olivier1
1 Laboratory of Neurophysiology, Universite catholique de Louvain, Bruxelles, Belgium, 2 Institut des Sciences Cognitives, CNRS, Bron, France
Abstract
Spotting a prey or a predator is crucial in the natural environment and relies on the ability to extract quickly pertinent visualinformation. The experimental counterpart of this behavior is visual search (VS) where subjects have to identify a targetamongst several distractors. In difficult VS tasks, it has been found that the reaction time (RT) is influenced by saliencefactors, such as the target-distractor similarity, and this finding is usually regarded as evidence for a guidance of attention bypreattentive mechanisms. However, the use of RT measurements, a parameter which depends on multiple factors, allowsonly very indirect inferences about the underlying attentional mechanisms. The purpose of the present study was todetermine the influence of salience factors on attentional guidance during VS, by measuring directly attentional allocation.We studied attention allocation by using a dual covert VS task in subjects who had 1) to detect a target amongst differentitems and 2) to report letters briefly flashed inside those items at different delays. As predicted, we showed that parallelprocesses guide attention towards the most relevant item by virtue of both goal-directed and stimulus-driven factors, andwe demonstrated that this attentional selection is a prerequisite for target detection. In addition, we show that when thetarget is characterized by two features (conjunction VS), the goal-directed effects of both features are initially combined intoa unique salience value, but at a later stage, grouping phenomena interact with the salience computation, and lead to theselection of a whole group of items. These results, in line with Guided Search Theory, show that efficient and rapidpreattentive processes guide attention towards the most salient item, allowing to reduce the number of attentional shiftsneeded to find the target.
Citation: Zenon A, Ben Hamed S, Duhamel J-R, Olivier E (2008) Spatial and Temporal Dynamics of Attentional Guidance during Inefficient Visual Search. PLoSONE 3(5): e2219. doi:10.1371/journal.pone.0002219
Editor: Antonio Verdejo Garcıa, University of Granada, Spain
Received December 21, 2007; Accepted March 25, 2008; Published May 21, 2008
Copyright: � 2008 Zenon et al. This is an open-access article distributed under the terms of the Creative Commons Attribution License, which permitsunrestricted use, distribution, and reproduction in any medium, provided the original author and source are credited.
Funding: A.Z. is a research assistant supported by a grant from the Fonds pour la formation a la Recherche dans l’Industrie et dans l’Agriculture (FRIA). Thisproject was supported by research grants from the Universite catholique de Louvain (FSR), the Fonds de la Recherche Scientifique Medicale (FRSM) and theFondation Medicale Reine Elisabeth (FMRE).
Competing Interests: The authors have declared that no competing interests exist.
* E-mail: [email protected]
Introduction
A rapid identification of pertinent stimuli is crucial in the
natural environment and this ability relies on a selection
mechanism known as spatial attention, which permits the
allocation of more neural resources to process behaviorally
significant elements. Our understanding of attentional mecha-
nisms mainly comes from studies using covert visual search (CVS)
tasks – where subjects have to detect a given target amongst
distractors, without performing eye movements. Two types of
CVS are classically distinguished: 1) efficient CVS in which the
reaction time (RT) remains constant irrespective of the number of
items, suggesting that visual information is processed in parallel,
and 2) inefficient CVS in which RT increases proportionally to the
number of items, a relationship known as the ‘‘set-size effect’’ and
classically regarded as evidence for a serial processing of visual
information. However, in inefficient CVS, the slope of the
regression line between RT and the number of CVS items
typically varies from 25 to 60 ms/item, leaving very little time to
process each item serially [1]. Moreover, estimates of the
attentional dwell time range between 200 and 400 ms, values
which are incompatible with the attentional shift time estimated
from the set-size slope [2,3]. This suggests that, besides serial
mechanisms, parallel mechanisms most likely contribute to visual
information processing in inefficient CVS [4,5]. The Guided
Search Theory (GST) proposed that the role of preattentive
parallel mechanisms in visual search is to guide attention on the
basis of the salience value assigned to each CVS item [5–7]; this
salience value is supposed to be assessed from both goal-directed
(or top-down) and stimulus-driven (or bottom-up) factors.
Importantly, the conclusion of most studies on CVS relied on
the interpretation of changes in RT and set-size slope in different
experimental conditions. However, because variations in RT may
be caused by different sensory, sensori-motor and motor factors, it
is always difficult to interpret them in terms of attention allocation.
Indeed, several recent studies have shown that it is possible to
explain the variation of performance as a function of set-size
during CVS without requiring serial attentional mechanisms (e.g.
see [8–10]). Therefore, in order to study thoroughly attentional
allocation during CVS, it is necessary to demonstrate a spatially
specific perceptual improvement during CVS, revealing the
attentional selection of one – or multiple – item(s).
Several studies have already used this approach. For example,
Maljkovic and Nakayama [11,12], were able to demonstrate, in a
pop-out visual search task, that attention systematically shifted
onto the target. These results were extended to inefficient CVS by
Nothdurft [13], who used the illusory line motion effect to probe
attentional allocation on the target. Kim & Cave [14], went a step
PLoS ONE | www.plosone.org 1 May 2008 | Volume 3 | Issue 5 | e2219

further by studying the attentional allocation during CVS, not only
on the target, but also on distractors. These authors probed
attentional allocation by using both a dot detection task and a
letter detection task. This study showed, notably, that in
conjunction CVS, where two features (shape and color) define
the target, letters located inside items sharing one feature with the
target were detected more often, suggesting the existence of a
preferential selection of potentially pertinent items. However, in
this study, attentional guidance was affected by strong Gestalt
grouping mechanisms [15] making the interpretation of these
results in terms of attentional guidance difficult. Moreover, Kim &
Cave did not investigate the role of stimulus-driven salience,
known to play a central role in GST. Finally, in order to avoid
saccades towards the CVS items, Kim & Cave used very short
presentation times, and, consequently, the search process was most
likely conducted in visual memory instead of on visually available
stimuli [16].
The purpose of the present study was to extend the Kim & Cave
study in order to 1) determine the magnitude, and the timing of
the effect of both goal-directed and stimulus-driven salience
factors, 2) determine whether GST and/or grouping phenomena
are responsible for the preferential selection of items sharing a
feature with the target.
To address these issues, we conducted three experiments using a
dual CVS task, in which a letter detection task was used to probe
attention allocation during the performance of a difficult CVS
where the distractors could have different levels of resemblance
with the target. We used long presentation times to allow attention
to select visually available items and eye fixation was controlled
online during the task performance.
In Experiment 1, we determined the influence of goal-directed,
stimulus-driven and spatial factors on attentional allocation during
an inefficient feature CVS task in which subjects had to detect a
vertically oriented item displayed amongst distractors of various,
non-vertical orientations. Letters were also displayed inside these
items at different intervals with respect to VS items onset (see
Fig. 1). The influence of goal-directed salience factors was
determined by analyzing the letter detection probability in each
CVS item as a function of similarity with the target. We predicted
that letters located either inside the target or inside items
resembling the target, should be detected more often. To study
the influence of stimulus-driven factors, we also analyzed the effect
of orientation contrast, i.e. the difference in orientation between
neighboring items, and our prediction was that letter detection
should be better for greater orientation differences between
adjacent items. Finally, we investigated the potential effect of
spatial location of the CVS items on attentional allocation by
analyzing letter detection as a function of their position in the
display, since it has been suggested that letters located in the
inferior hemifield should be detected more often [17,18].
Whereas Experiment 1 will allow us to investigate attentional
allocation during CVS, it cannot help us to determine whether
attentional selection of the target is a consequence of, or a
prerequisite for, the target detection. To address this issue, in
Experiment 2, we used the same dual task as in Experiment 1 but
the duration of the CVS item presentation was changed across
trials and the letters were always flashed at the end of the trial. We
predicted that if attention selection is critical to target detection,
there should be a tight correlation between letter detection
performance in the target and target detection probability.
Specifically, we expected to find that target detection should be
at chance level in the absence of attentional selection (i.e. 0% letter
detection) and that the slope of the target detection function should
link minimal and maximal performance levels of both variables.
Finally, in Experiment 3, we used conjunction search to assess
the role of grouping phenomena in the selection of the items
sharing a feature with the target. Kim & Cave [14] showed that, in
conjunction search tasks where the target was defined by color and
shape, subjects tended to detect more often the letters that were
displayed inside items that shared one feature (either color or
shape) with the target than in the other distractors. The first
interpretation of these results, in line with GST, assumes that each
feature (color and shape in this case) is encoded into a separate
feature map, where the activity induced by each item depends on
its resemblance with the target with respect to this feature. Then,
the two feature maps corresponding to color and shape are added
together to lead to a global activation map. The items that do not
share any feature with the target will induce the minimum
activation in this map, the items sharing one target feature will
induce intermediate activation, and the target will generate the
maximum activation, resulting from the addition of the maximum
activation values in the two feature maps. The second interpre-
tation of the Kim & Cave results is that color and shape, being in
this case both very easily discriminable (green versus red and
squares versus circles) induce strong gestalt grouping effects
[15,19,20]. Therefore, the group of items sharing one target
feature would be selected as a whole, and the target would be
searched only in this group [21,22]. To distinguish between these
two hypotheses, we studied attentional allocation during a
conjunction CVS (orientation and color), where three different
levels of orientation difference between target and distractors were
used (see Fig. 3). Again, a letter detection task was used to probe
attention during the CVS task, as in Experiments 1 and 2. In order
to induce grouping effects, we used only two easily discriminable
color levels. Our predictions were that, if GST is correct, the
salience effect of color and orientation should have an independent
(or additive) effect on letter detection, whereas if the grouping
hypothesis is correct, we should find an interaction between both
effects: orientation should affect detection probability of the letters
in the items sharing the target color, whereas items with the non-
target color should be all excluded from the search process, and
hence, their selection probability should not be affected by their
orientation [21].
Additionally, to have a more precise idea of the timing of these
effects, we modified the letter display, allowing us to monitor
attentional allocation with a higher temporal resolution. To
achieve this increased resolution, instead of displaying a letter
Figure 1. Experimental design of Experiment 1. A fixation pointwas displayed for 1500 ms, followed by the presentation of 7 CVS items.The target was the circle with a vertical line. After a variable delay, themask displayed inside each CVS item was replaced, for 60 ms, by letters.Eight hundred ms after the onset of the CVS item display, CVS itemswere replaced by black disks flashed for 200 ms.doi:10.1371/journal.pone.0002219.g001
Attentional Guidance in CVS
PLoS ONE | www.plosone.org 2 May 2008 | Volume 3 | Issue 5 | e2219

inside all VS items at the same time, a single letter was displayed in
a given item at a given time, and this letter was moved and
changed every 45 ms.
Materials and Methods
Experiment 1Subjects. Twelve healthy subjects (21–25 years old), with
normal, or corrected to normal, vision participated in Experiment
1; all subjects were native French speakers. All experimental
procedures were approved by the Ethics Committee of the
Universite catholique de Louvain, and subjects gave their written
informed consent.
Task. In this experiment, we used a probe paradigm [14] in
which subjects had to report the presence, or absence, of a target
displayed amongst 7 items arranged in a circle around a central
fixation point (see Fig. 1). In addition, subjects had to identify
letters flashed for 60 ms inside each CVS item, at different
stimulus onset asynchronies (SOAs) with respect to the onset of the
CVS item presentation. The rationale behind this paradigm is that
the letter detection probability should be higher at positions where
attention is located, allowing us to infer a posteriori attentional
allocation in both space and time.
Before each experiment, subjects were trained in the CVS task
alone, then on the letter identification task alone and finally they
practiced the dual task. At the end of the training session, a
staircase procedure was used to adjust the contrast of the CVS
items against the background in order to make sure that all
subjects achieved a performance of 70 % of correct trials in the
CVS task. The final contrast obtained was, on average, equal to 70
%. The gray level-luminance function of the screen was obtained
with a psychophysical method of gamma correction (Bordier C. &
Knoblauch K., personal communication).
At the beginning of each trial, a fixation point was presented at
the center of a computer screen situated at a distance of 55 cm, in
front of the subjects; the subjects had to fixate this point
throughout the task. The eye position was monitored using an
electro-oculogram and trials were interrupted, and repeated,
whenever subjects broke fixation. After a 1500 ms delay, seven
grey circles (1.8 degrees wide) were displayed equidistantly at an
eccentricity of 4 deg. These CVS items were filled with a white
noise mask and had a small bar attached to them, that could be
either vertical (target) or oriented at 30, 60 or 90 degrees from the
vertical (distractors). The target was present in 50 % of the trials
and at least two distractors of each type were present in each trial.
After a variable SOA (50, 300, 500 or 700 ms), the masks
displayed inside the circles were replaced by letters (1.1 degree
wide) which were flashed for 60 ms and then replaced by a new
mask. In a given trial, every letter was different. Eight hundred ms
after the onset of CVS item presentation, all items were replaced
by black disks displayed for 200 ms.
Subjects were instructed to press, as fast as possible, the « one »
key of the numeral pad of a computer keyboard to indicate that
the target was present or the « three » key to indicate it was absent;
then they had to type on the keyboard, without any time
constraint, the letters they identified inside the CVS items.
Subjects then triggered the next trial by pressing the space bar.
The experiment was divided in 5 blocks of 160 trials each.
Control task A: letter detection only. In order to
determine whether the effects we observed in the main
experiment were specific to CVS, and not to the letter detection
task, a control experiment was performed under the same
experimental conditions as in Experiment 1, except that subjects
(n = 10) were only asked to report as many letters as possible
without taking notice of the CVS items.
Control task B: target detection only. This second control
experiment was identical to the main experiment (Experiment 1)
except that subjects (n = 7) only had to report the presence, or
absence, of the CVS target, without paying attention to the letters.
In this experiment, the number of CVS items was either 4 or 8 in
order to allow us to determine the difficulty of the CVS task and to
estimate the ‘‘set-size effect’’.
Data analysis. A goal-directed salience value, varying from 4
to 1, was assigned to each CVS item depending on its similarity
with the target, 4 being attributed to the target and 1 to the most
dissimilar distractor. In addition, an orientation contrast index was
calculated for each CVS item by computing the sum of the
differences between the orientation of the bar attached to the item
and its two neighbors. For example, an item with a 30u oriented
bar (salience value: 3) surrounded by the target (salience: 4) and by
an item with a 90u oriented bar (salience: 1) had an orientation
contrast index of 3 (|324|+|321|).
Statistical analysis. We used ANOVAs on repeated
measurements (RM ANOVA) for most statistical analyses. In
order to achieve normality, percentages of detection were arcsine-
root transformed, a transformation appropriate for data that lie
between an upper and lower bound [23]. When data distribution
of probability differed from normality, a non-parametric ANOVA
on ranks test was performed.
Experiment 2Eight subjects (20–29 years old) participated in Experiment 2,
which was exactly the same as Experiment 1 except that 1) the
duration of the CVS item presentation varied from trials to trials,
and 2) we used a different masking stimulus, the digit 8, which has
proved to be more efficient as a mask in a letter identification task
(see Fig. 2) [24]. The duration of the CVS item presentation was
determined for each subject at the beginning of the experimental
session by means of a staircase procedure adjusted to obtain 50, 75
or 90% of correct responses in the CVS task, while the contrast
was kept constant (70%). In this staircase procedure, subjects had
to perform the CVS task only, without reporting the letters
displayed inside the CVS items. The duration of CVS items
presentation was then adjusted to these three values in the main
experiment and the three display durations were counterbalanced
across trials. In addition, also in contrast to Experiment 1, the
letters were always flashed during the last 50 ms of the CVS item
presentation. Then, all stimuli were replaced by a mask: the letters
were masked with a figure-eight and the CVS items were masked
with circles with 12 bars attached every 30u, from 0u to 330u. One,
two or no target could be displayed, these three conditions being
equally probable (33% each). In the foregoing analyses, we only
considered trials where one or no target was displayed. The
response keys used to indicate that the target was present or absent
were the same as in Experiment 1. The subjects were not informed
that two targets could appear simultaneously in some trials and the
response required in these cases was the same as when only one
target was detected. As in Experiment 1, subjects had also to type
the detected letters, with no temporal constraint and the next trial
was triggered by pressing the space bar. In this experiment, eye
movements were monitored by using an infrared camera (Thomas
Recording).
Experiment 3Eight subjects participated in Experiment 3. The task was, as in
Experiments 1 and 2, to detect the presence of the target (50%
probability), as quickly as possible, and to report as many letters as
Attentional Guidance in CVS
PLoS ONE | www.plosone.org 3 May 2008 | Volume 3 | Issue 5 | e2219

possible. Eye position was controlled by means of an infrared
eyetracker and trials were interrupted, and repeated, whenever
subjects broke fixation. In this task, three blue and three yellow
isoluminant circles were displayed on the screen, at fixed
eccentricity (4u). The orientation of the bar attached to them
was 0u, 20u or 40u from the vertical. The target was defined as the
blue circle with a vertically oriented bar. In target present trials,
each item of a given color had a different orientation. In target
absent trials, two items with the target color had a 20u orientation.
One ASCII sign was displayed inside each VS item but, in only
one item, this sign was a letter; in the other VS items, the signs
were irrelevant (‘&’, ‘%’, etc…). At every frame change (i.e. every
45 ms), the relevant letter and two irrelevant signs were changed;
the new relevant letter was flashed at another location (see Fig. 3).
The duration of the CVS items display was 810 ms, corresponding
to 18 frame changes. The letter was displayed in each VS item in a
pseudo-randomized order so that, in a given trial, a different
relevant sign appeared three times inside each VS item (n = 6),
with a variable delay between each presentation. In the analyses,
in order to have a sufficient number of trials in each condition, we
grouped adjacent letter onset times by pairs, yielding 9 different
letter onset time values (1–45 ms, 90–135 ms, 180–225 ms, …).
An additional control experiment was conducted in which the
display was exactly the same, but subjects only had to report the
letters.
Results
Experiment 1General performance. We first found that the CVS task
used in the present study was inefficient. The control task B (see
Methods) showed that RTs increased as a function of the number
of CVS items (2-way ANOVA RM : F = 8.12, p = 0.029) and were
larger when the target was absent than when present (F = 10.19,
p = 0.019). The difference between RT in the 8-items CVS task
(median6interquartile interval (IQI) : 13786673 ms for target
absent and 8636666 ms for target present) and the 4-items CVS
task (11726590 ms for target absent and 8056555 ms for target
present) was 976237 ms (median6IQI) for target absent trials and
696109 ms for target present trials. This corresponds to a mean
increase of 20 ms per item, a value compatible with the magnitude
of set-size effects classically reported in the literature for inefficient
CVS tasks [1].
In the main experiment (Experiment 1), we found that the
number of detected letters increased with SOA. On average, 0.8,
0.97, 1.18, 1.39 letters were reported for 50, 300, 500 and 700 ms
SOAs , respectively. Median RT in the CVS task was 1190 ms
(IQI = 282 ms, n = 12) and longer SOAs for letter display, were
associated with longer RTs in the CVS task. This finding can be
explained if we assume that the processing of the letters and their
storage in memory occurred during the preparation of the motor
response of the CVS task, leading to an interference. For the CVS
task, when the target was present, we found 75.2613.6% of HITS
(correct detection of the target) and 24.8613.6% of MISSES
(failure to detect the target when present); when the target was
absent, we observed 81.0613.6% of CORRECT REJECTIONS
(correct rejection of target presence) and 19.0613.6% of FALSE
ALARMS (detection of the target while absent).
Influence of goal-directed salience on attentional
allocation. We first investigated the influence of the goal-
directed salience factor (similarity with the target) on the
probability to detect letters inside CVS items. For all types of
responses (HITS, MISSES, CORRECT REJECTIONS and
FALSE ALARMS), we found that the target-distractor similarity
significantly influenced letter detection probability (main effect: F
ranged from 5 to 280, all p,0.02). For HIT responses, the
probability to detect a letter was higher when flashed inside the
target (post-hoc: all p,0.0001) and, to a lesser extent, inside level 3
distractors, i.e. the most resembling distractors (post-hoc: p = 0.03,
Fig. 4A). For MISS responses, the letter detection rate was higher
in the level 3 distractors than in the target (post-hoc: p = 0.008).
When the target was absent (CORRECT REJECTION and
FALSE ALARM), letters flashed inside the level 3 distractors were
more likely to be detected than those flashed inside level 2 and 1
distractors (post-hoc: all p,0.0001, Fig. 4B).
In addition, we investigated the influence of the SOA (delay
between the presentation of CVS items and the letter display) on
the probability of letter detection. For HIT trials, we found a
significant interaction between TARGET-DISTRACTOR SIMILARITY and
SOA (F = 49,90, p,0.0001). This interaction can be explained by
the fact that, although the detection rate of letters flashed inside
the distractors was not influenced by the SOA, the detection rate
of letters flashed inside the target increased with the SOA (post-
hoc: all p,0.0001, Fig. 5). It is noteworthy that, even for SOA as
short as 50 ms, the detection rate of letters flashed inside the target
was already significantly higher than for letters flashed inside
distractors.
Figure 2. Experimental design of Experiment 2. Only the casewhere two targets were displayed simultaneously is illustrated here.Compared to Experiment 1, the CVS items display duration was variable(50%, 75% and 90% correct response in CVS), and letters were alwaysdisplayed during the last 50 ms of the trial.doi:10.1371/journal.pone.0002219.g002
Figure 3. Experimental design of Experiment 3. The target wasthe blue circle with a vertical line. Every 45 ms, a different letter wasdisplayed in a different location (surrounded by dotted circles, notshown on actual display). All other items contained irrelevant signs.doi:10.1371/journal.pone.0002219.g003
Attentional Guidance in CVS
PLoS ONE | www.plosone.org 4 May 2008 | Volume 3 | Issue 5 | e2219

In order to determine whether these effects were actually goal-
directed, we conducted a control experiment where subjects only
had to detect the letters, without paying attention to the CVS
items (control task A, see Methods). In this task, we failed to found
an influence of the TARGET-DISTRACTOR SIMILARITY on the letter
detection (F = .03, p = .99).
Influence of stimulus-driven factors and spatial location
on attentional allocation. We then investigated the influence
of a stimulus-driven salience factor (the local orientation contrast)
on the target and letter detection rates. Orientation contrast was
computed for each item by estimating its dissimilarity with its two
neighbors (see Methods). As shown in Figure 6, the letter detection
probability increased proportionally with the local orientation
contrast (ANOVA on Ranks, chi-square = 52.81, p,0.001; post-
hoc: all pairwise multiple comparisons significant except contrast 6
vs 5). However, it may be argued that this effect was due to the
higher detection rate of letters displayed inside the target because,
on average, the target had a higher orientation contrast value than
the distractors. In order to rule out this hypothesis, we performed
the same analysis after removing all letters detected inside the
target and we found identical results i.e. an increased detection
probability of letters as a function of the local orientation contrast
(ANOVA on ranks, chi-square = 39.07, p,0.001, Fig. 6). In
addition to the effect on letter detection, we found that the local
orientation contrast also influenced the target detection probability
(RM ANOVA F = 5.26, p = 0.001). However, this effect was
essentially due to a lower detection rate of the target when
surrounded by two distractors very similar to the target (post-hoc:
p,0.001).
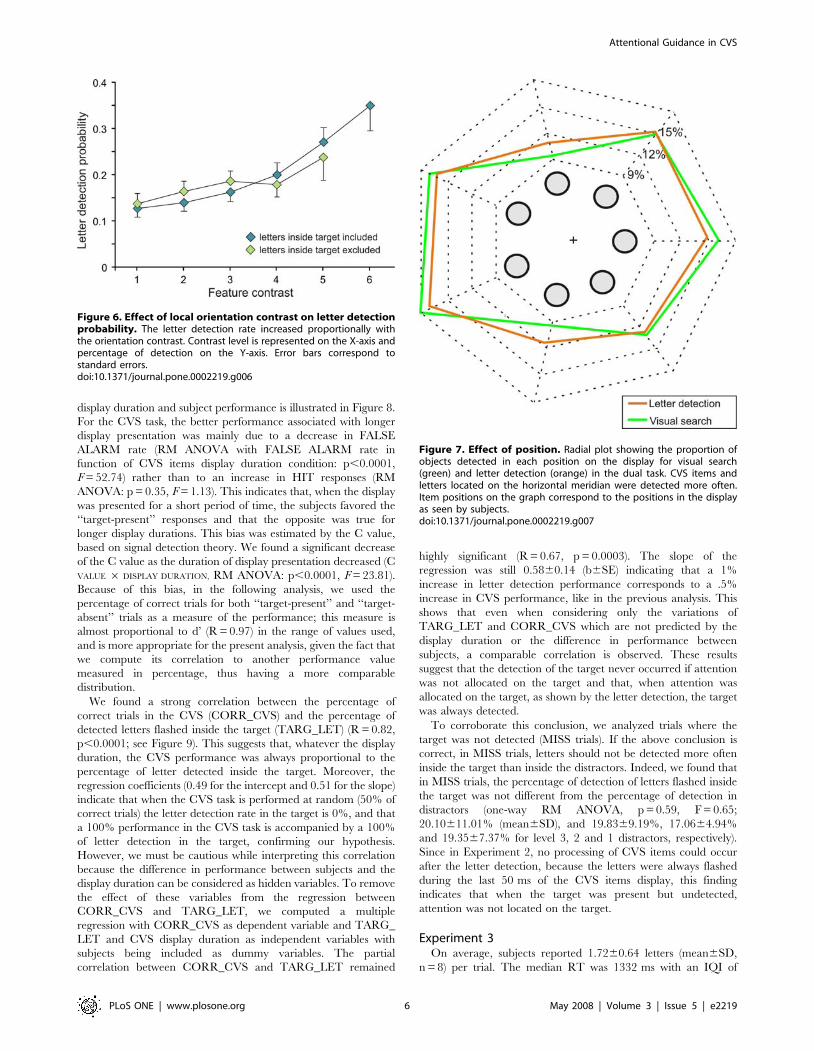
As far as the effect of spatial location on attentional allocation
was concerned, we found a significant effect of the item position in
the display on both the target (F = 6.32, p,0.0001) and letter
detection (F = 18.3, p,0.0001) rates; namely a higher detection
rate was observed for CVS items and letters located near the
horizontal meridian (Figure 7).
In order to determine whether the effect of orientation contrast
and spatial location on letter detection probability was specific to
CVS, we analyzed letter detection performance in the control task
A, where subjects were only asked to report letters without
performing the CVS task. We confirmed a significant effect of
position (F = 2.36, p = .045) with the same preference for
horizontal positions as in Experiment 1, but we failed to find an
effect of the orientation contrast (F = 1.04, p = .40). This finding
indicates that the CVS items have to be processed in order to
induce a local orientation contrast effect, suggesting that the
stimulus-driven effect of the orientation contrast is influenced by
the task at hand. In contrast, the significant effect of position for
the letter detection performed alone was expected since, if
attentional allocation probability depends on spatial location, it
will affect stimulus detection irrespective of the nature of the
stimulus to be detected.
Experiment 2The results of Experiment 2 confirmed those of Experiment 1,
i.e. we replicated the effect of target-distractor similarity
(p,0.0001, F = 17.15), of position (p = 0.036, F = 2.51) and of
orientation contrast (p = 0.012, F = 4.63) on letter detection
probability.
Relation between attention allocation on the target and
target detection. Experiment 2 was designed to allow us to
determine the relationship between attention allocation and target
detection since in this task, the letter detection can only occur at
the very end of the search process. The relationship between the
Figure 4. Effect of target-distractor similarity on letterdetection performance. A. Main effect of target-distractor similarityon ‘‘target present’’ trials for HIT (left) and MISS (right) trials. In the HITtrials, letters located inside the target were more likely to be detectedthan other letters, whereas this effect was reversed in the MISS trials. Inboth types of trials, letters located in level 3 distractors were more oftendetected than those located in level 2 and level 1 distractors (*: p,0.01;**: p,0.001; ***: p,0.0001). Y axis: percentage of letter detection. Xaxis: target-distractor similarity varying from 4 (target) to 1 (mostdissimilar distractor). Error bars correspond to standard errors. B. Maineffect of target-distractor similarity on ‘‘target absent’’ trials for REJECT(left) and FALSE ALARM (right) trials. In both types of trials, letterslocated in level 3 distractors were more likely detected than thoselocated in level 2 and level 1 distractors. Same conventions as in A.doi:10.1371/journal.pone.0002219.g004
Figure 5. Target-distractor similarity - SOA interaction for HITtrials. The benefit of letter detection inside the target for HIT trials wasalready significant for a 50 ms SOA and it increased monotonically withthe SOA. The detection probability is represented on the Y-axis, SOAson the X-axis.doi:10.1371/journal.pone.0002219.g005
Attentional Guidance in CVS
PLoS ONE | www.plosone.org 5 May 2008 | Volume 3 | Issue 5 | e2219
display duration and subject performance is illustrated in Figure 8.
For the CVS task, the better performance associated with longer
display presentation was mainly due to a decrease in FALSE
ALARM rate (RM ANOVA with FALSE ALARM rate in
function of CVS items display duration condition: p,0.0001,
F = 52.74) rather than to an increase in HIT responses (RM
ANOVA: p = 0.35, F = 1.13). This indicates that, when the display
was presented for a short period of time, the subjects favored the
‘‘target-present’’ responses and that the opposite was true for
longer display durations. This bias was estimated by the C value,
based on signal detection theory. We found a significant decrease
of the C value as the duration of display presentation decreased (C
VALUE 6 DISPLAY DURATION, RM ANOVA: p,0.0001, F = 23.81).
Because of this bias, in the following analysis, we used the
percentage of correct trials for both ‘‘target-present’’ and ‘‘target-
absent’’ trials as a measure of the performance; this measure is
almost proportional to d’ (R = 0.97) in the range of values used,
and is more appropriate for the present analysis, given the fact that
we compute its correlation to another performance value
measured in percentage, thus having a more comparable
distribution.
We found a strong correlation between the percentage of
correct trials in the CVS (CORR_CVS) and the percentage of
detected letters flashed inside the target (TARG_LET) (R = 0.82,
p,0.0001; see Figure 9). This suggests that, whatever the display
duration, the CVS performance was always proportional to the
percentage of letter detected inside the target. Moreover, the
regression coefficients (0.49 for the intercept and 0.51 for the slope)
indicate that when the CVS task is performed at random (50% of
correct trials) the letter detection rate in the target is 0%, and that
a 100% performance in the CVS task is accompanied by a 100%
of letter detection in the target, confirming our hypothesis.
However, we must be cautious while interpreting this correlation
because the difference in performance between subjects and the
display duration can be considered as hidden variables. To remove
the effect of these variables from the regression between
CORR_CVS and TARG_LET, we computed a multiple
regression with CORR_CVS as dependent variable and TARG_
LET and CVS display duration as independent variables with
subjects being included as dummy variables. The partial
correlation between CORR_CVS and TARG_LET remained
highly significant (R = 0.67, p = 0.0003). The slope of the
regression was still 0.5860.14 (b6SE) indicating that a 1%
increase in letter detection performance corresponds to a .5%
increase in CVS performance, like in the previous analysis. This
shows that even when considering only the variations of
TARG_LET and CORR_CVS which are not predicted by the
display duration or the difference in performance between
subjects, a comparable correlation is observed. These results
suggest that the detection of the target never occurred if attention
was not allocated on the target and that, when attention was
allocated on the target, as shown by the letter detection, the target
was always detected.
To corroborate this conclusion, we analyzed trials where the
target was not detected (MISS trials). If the above conclusion is
correct, in MISS trials, letters should not be detected more often
inside the target than inside the distractors. Indeed, we found that
in MISS trials, the percentage of detection of letters flashed inside
the target was not different from the percentage of detection in
distractors (one-way RM ANOVA, p = 0.59, F = 0.65;
20.10611.01% (mean6SD), and 19.8369.19%, 17.0664.94%
and 19.3567.37% for level 3, 2 and 1 distractors, respectively).
Since in Experiment 2, no processing of CVS items could occur
after the letter detection, because the letters were always flashed
during the last 50 ms of the CVS items display, this finding
indicates that when the target was present but undetected,
attention was not located on the target.
Experiment 3On average, subjects reported 1.7260.64 letters (mean6SD,
n = 8) per trial. The median RT was 1332 ms with an IQI of
Figure 7. Effect of position. Radial plot showing the proportion ofobjects detected in each position on the display for visual search(green) and letter detection (orange) in the dual task. CVS items andletters located on the horizontal meridian were detected more often.Item positions on the graph correspond to the positions in the displayas seen by subjects.doi:10.1371/journal.pone.0002219.g007
Figure 6. Effect of local orientation contrast on letter detectionprobability. The letter detection rate increased proportionally withthe orientation contrast. Contrast level is represented on the X-axis andpercentage of detection on the Y-axis. Error bars correspond tostandard errors.doi:10.1371/journal.pone.0002219.g006
Attentional Guidance in CVS
PLoS ONE | www.plosone.org 6 May 2008 | Volume 3 | Issue 5 | e2219

908 ms for ‘‘target present’’ trials and 1344 ms (IQI : 865 ms) for
‘‘target absent’’ trials. We computed a three-way RM ANOVA
with COLOR and ORIENTATION of the circles, and letter onset TIME as
independent variables, and letter detection probability as depen-
dent variable (see Fig. 10 A). We found that the letter detection
rate increased with the onset TIME (F = 2.88, p = 0.009), except for
the last onset time (765–810 ms), which was associated with a
decreased letter detection rate. This last effect can probably be
explained by the influence of the masks displayed at the end of
each trial. The main effects of ORIENTATION (F = 44.88, p,0.0001)
and COLOR (F = 24.58, p = 0.002) were significant, confirming the
results from Kim & Cave, and replicating the goal-directed
salience effect we found in the feature visual search task
(Experiment 1): letters displayed in items with the same color, or
the same orientation as the target, were better detected.
The TIME – ORIENTATION and TIME – COLOR interactions were not
significant (p.0.1). The ORIENTATION – COLOR interaction
(F = 7.27, p = 0.007) was significant, showing that the orientation
affected the letter detection probability for items sharing the target
color only, suggesting the existence of grouping phenomena.
However, the significant triple interaction (F = 1.82, p = 0.037, see
Fig. 10 A.) indicated that this effect depended on time. While the
effect of orientation for items sharing the target color clearly
increased with time, the preference for the item sharing the target
orientation, but with the non-target color, was only present for
early letter onset times and disappeared for onset times beyond
360 ms. These very interesting effects unfortunately did not reach
significance in Post-Hoc tests. As a consequence, in order to clarify
the effect of early versus late delays, we computed a two-way RM
ANOVA with orientation and color as independent variables for
letters appearing either early (1–315 ms) or late (360 ms to
675 ms). Longer letter onset times (720–765 ms) were discarded
from this analysis, because of the strong decrease in global letter
detection performance at these delays. For EARLY delays, the
orientation-color interaction was not significant at all (F = .69,
p = 0.52, see Fig. 10 B.), whereas it was significant for LATE delays
(F = 26.72, p,0.0001, see Fig. 10 C.). This suggests that, at the
beginning of the search, both color and orientation affect
attentional guidance, and their effect are independent or
combined additively, as predicted by GST. However, for longer
delays, all items with the non-target color are excluded from the
search process, irrespectively of their orientation, whereas the
selection probability of the items that share the target color
continue to depend strongly on their orientation. This finding can
be regarded as evidence for the existence of grouping phenomena.
We could not run the same analysis for target absent trials because
the design was not balanced. Indeed, the color-orientation
combination corresponding to the target never occurred.
Discussion
In the present study, we demonstrate that, during a CVS task,
very fast parallel processes guide attention towards the item with
the highest saliency, as estimated from goal-directed (target-
distractor similarity) and stimulus-driven (orientation contrast)
factors, but also from spatial location. We also show that this
guidance of attention towards the target is a prerequisite for target
detection. Finally, we demonstrate a critical role of grouping
phenomena in the later stage of conjunction search processes.
Influence of goal-directed salience on attentionalallocation
The finding that the letter detection probability increased as a
function of target-distractor similarity indicates that goal-directed
salience factors play a crucial role in attention guidance during
inefficient CVS. Indeed, the fact that letters displayed inside the
target and in the most resembling distractors were more likely to
be detected suggests that a given goal-directed salience value,
proportional to target-distractor similarity, was assigned to each
CVS item. It is noteworthy that, whereas this goal-directed
salience factor was feature-based (dependent on verticality), the
effect we measured only relies on spatial attention, namely, the
letter was detected because of its inclusion in the spotlight directed
on the target location. Our results are in agreement with the
existence of a guidance mechanism of spatial attention by features
but cannot be interpreted in terms of location-independent global
feature-based selection. In addition, we showed that this attention
Figure 9. Correlation between the percentage of correct trialsand percentage of detection of the letter in the target. Each dotrepresents data from one subject for one display duration. Note thatthe left extremity of the regression line (blue circle) corresponds to 50%correct responses in the CVS task and 0% of letter detection in thetarget and that the right extremity (red circle) corresponds to 100%correct response in the CVS task and 100% of letter detection in thetarget.doi:10.1371/journal.pone.0002219.g009
Figure 8. CVS performance as a function of display duration.Percentage of correct trials in CVS (cyan) and mean CVS items displayduration (green) for each of the three duration conditions.doi:10.1371/journal.pone.0002219.g008
Attentional Guidance in CVS
PLoS ONE | www.plosone.org 7 May 2008 | Volume 3 | Issue 5 | e2219

guidance acts very rapidly, since letters in the target were already
selected preferentially in the 50 ms SOA condition.
Role of stimulus-driven salience in attentional
allocation. The present study also demonstrates the critical
influence of a stimulus-driven salience factor, the local orientation
contrast, in the letter detection task. The local orientation contrast
was defined as the orientation difference between a given CVS
item and its two neighbors and we found that the greater this
orientation difference, the higher the letter detection rate. This
finding contrasts with previous studies showing that distractors
with a high stimulus-driven salience have no effect on CVS
performance [25,26], a result regarded as evidence for an
influence of top-down factors preventing the capture of attention
by distractors. However, this discrepancy may be explained if we
assume that the stimulus-driven salience factors used in those
studies were irrelevant, whereas in the present task, the orientation
is a target-defining feature that subjects need to process. This
hypothesis about the necessity of relevance, with respect to the task
at hand, of the feature defining stimulus-driven salience, is
supported by the finding that when subjects were asked to
report letters without performing the CVS task (see control task A),
this feature-contrast effect was no longer observed.
Effect of spatial location on attentional allocation. The
role of spatial location on attentional allocation in inefficient CVS
was also evidenced in the present study. We found a higher
detection rate for both the target and letters when located along
the horizontal meridian. Since the stimulus eccentricity was 4u, it
could be argued that this preference for stimuli located along the
horizontal meridian was due to a higher visual acuity along the
horizontal axis and not by an attentional effect [27,28]. However,
current knowledge on visual acuity anisotropies does not support
this hypothesis. Indeed, for example, Beirne et al. [29], only found
very small differences between visual acuity along the horizontal
and vertical meridians for an eccentricity of 10u and this difference
is probably even smaller at an eccentricity of 4u. Therefore, it is
unlikely that the acuity variation could explain the large benefit in
detection performance we found for letters located near the
horizontal meridian. Finally, whereas Carrasco et al. [30], using a
cueing paradigm, failed to find evidence that cued attention can
affect the shape of the performance fields, suggesting instead an
influence of visual constraints on the performance field, another
study [31] has reported a performance anisotropy comparable to
the one found in the present study, supporting an attentional
origin for this effect. Altogether, those results suggest that the
influence of spatial location that we observed in the present study
is most likely due to a higher probability of allocating attention
along the horizontal meridian. This bias could either be related to
the probabilistic structure of the natural environment and/or
correspond to a consequence of our reading and writing expertise.
Finally, it is noteworthy that, in contrast to previous studies
showing a better attentional resolution in the lower than in the
upper visual hemifield [17,18], we failed to find such a vertical
asymmetry. However, a vertical asymmetry has been exclusively
observed in crowding and tracking paradigms, suggesting that it
may not be an invariant feature of attention which can be
generalized to all CVS tasks.
Although the influence of both spatial location and orientation
contrast on CVS performance is unquestionable in the present
study, the behavioral benefit of these factors remains puzzling.
Indeed, whereas goal-directed salience factors are directly related
to the cognitive context of the task at hand, local orientation
contrast and spatial location are ineffective to help locating the
target. In Guided Search Theory, Wolfe and colleagues [5]
suggested that stimulus-driven factors are automatically included
Figure 10. Effect of color and orientation of the CVS items onletter detection performance. A. Triple interaction ORIENTATION – COLOR
– LETTER ONSET TIME with letter detection performance as dependentvariable. The Y-axis represents letter detection probability and the X-axis, letter-onset times with 90 ms intervals. The left and right graphsare for yellow (non target color) and blue (target color) itemsrespectively. Color code is for orientation. The more saturated colorcorresponds to vertical (target orientation), the gray color correspondsto the most dissimilar distractor orientation, and the intermediate coloris for the most similar distractor orientation. B. ORIENTATION – COLOR
Interaction for early delays. The Y-axis represents letter detectionprobability, the X-axis the orientation of the items and the color codeidentifies the color of the item. C. ORIENTATION – COLOR Interaction for latedelays. Same convention as in B.doi:10.1371/journal.pone.0002219.g010
Attentional Guidance in CVS
PLoS ONE | www.plosone.org 8 May 2008 | Volume 3 | Issue 5 | e2219

into the activation map, and hence, influence attention guidance
irrespective of the task at hand. The behavioral significance of
these salience factors could be revealed in more ecological
situations where it may be pertinent to pay attention to high-
contrast objects and to objects located along the horizontal
meridian. The role of these factors in the construction of the
salience map could thus be deeply rooted into the probabilistic
structure of the visual world.Relationship between attentional selection and target
detection. Regarding the question as to whether target selection
follows or precedes target detection, we showed in Experiment 2,
that the correlation between target detection rate and letter
detection rate in the target was perfectly linear. Moreover, the
regression showed that minimal (chance level) and maximal
(100%) performance in target detection corresponded to 0% and
100% performance in letter detection rate in the target. This
suggests that attentional selection is a prerequisite for target
detection. Indeed, if target selection followed target detection, and
that a better detection of the letter in the target was a consequence
of a post-detection shift of attention on the target, we should have
found instances, for short display duration, where the target was
detected but the display ended before the attentional shift could
occur. In this case, the subjects would have failed to detect the
letter flashed inside the target and the regression line represented
in Figure 9 should have been shifted upward. In addition, the
finding that the goal-directed salience exerted a strong effect on
attention allocation in trials where the target was missed and, in
Experiment 1, when no target was present, is also in contradiction
with the hypothesis that attention selection only follows target
detection.Grouping phenomena. In Experiment 3, we found that the
goal-directed effects of orientation and color are initially combined
in a global activation map but that later on, during the CVS
processing, the interaction becomes more complex: non-target
color items are excluded from the search process, irrespectively of
their orientation. We interpret these results as supporting the
existence of a two-stage process: first, salience is initially computed
from the addition of feature maps, as predicted by Guided Search
Theory, and then grouping effects are involved at a later stage,
after a 360 ms delay in our Experiment.
This long delay could appear surprising, given the fact that
perceptual grouping has been reported for very short display
durations [32]. However, it has been shown that different
mechanisms of perceptual grouping occur at different stages of
visual processing: while early grouping depends on retinal color
similarity, surface color similarity would be involved for grouping
at long durations [33]. It is likely that this latter mechanism could
be responsible for the grouping effect we observed in our task.
Several previous studies argued for a central role of grouping
processes in conjunction CVS [15,19–22]. In the present study, we
showed for the first time that such grouping phenomena are
involved at a late stage in the visual search process.
Conclusions
The present results are consistent with the existence of a
neuronal salience map [34] where different hills of activity, one for
each stimulus position, are weighted by both goal-directed [35]
and stimulus-driven salience factors, and by spatial location. This
salience map is used subsequently to guide attention. The
existence of parallel mechanisms of attentional guidance in CVS
could explain the apparent discrepancy between the slope values
of the regression line between RT and item number (‘‘set-size
effect’’), and the minimum time required to shift attention [36].
Indeed, this preattentive salience computation could make CVS
more efficient by reducing the number of attentional shifts needed
to find the target, leading therefore to a shorter processing time for
each additional item. Other phenomena, like perceptual grouping,
are also involved later, to increase further the efficiency of the
search process, by selecting a whole group of pertinent items at
once.
Additionally, the present results show that target detection
always follows attentional selection. Consequently, this suggests
that target detection never occurs in the absence of attentional
selection. An interesting study has already addressed this question
in dual tasks involving a central and a peripheral concurrent
discrimination tasks [37]. Performance in the peripheral discrim-
ination task was compared when performed together with the
central discrimination task and when performed alone. In the dual
task condition, attention was supposed to be focused on the central
discrimination task, whereas in the single task condition, attention
was able to select the peripheral target. This study showed that the
detection performance in the peripheral task when attention was
focused on the central task depended on the nature of the stimuli
used: some discrimination tasks, even very complex, were left
almost unaltered by the retrieval of attention, while other tasks,
seemingly simple, were much impaired in the absence of attention.
Along the same line, Joseph et al. [38] asked their subjects to
perform a pop-out task and were able to demonstrate that a
concurrent attention-demanding task (rapid serial visual presenta-
tion task) strongly altered performance in the CVS task, suggesting
that even pop-out CVS tasks depend on the availability of
attention. However, Van Rullen et al. [39] showed that targets
that do not trigger pop-out could be discriminated from distractors
with attention occupied elsewhere and that, conversely, certain
pop out CVS tasks need undivided attention to be performed.
Altogether, these different studies suggest that the dichotomy
between attention-demanding and not attention-demanding CVS
tasks might differ from the classic efficient (pop-out) versus
inefficient CVS tasks and this question would require further
experiments.
Acknowledgments
The authors are grateful to Marco Davare, Julie Duque, Barbara Pelgrims,
Michael Andres, Brian Corneil and Sophie Deneve for their comments on
an earlier version of this manuscript.
Author Contributions
Conceived and designed the experiments: AZ EO. Performed the
experiments: AZ. Analyzed the data: AZ SB JD. Wrote the paper: AZ
SB JD EO.
References
1. Wolfe JM (1998) What can 1 million trials tell us about visual search.
Psychological Science 9: 33–39.
2. Duncan J, Ward R, Shapiro K (1994) Direct measurement of attentional dwell
time in human vision. Nature 369: 313–315.
3. Moore CM, Egeth H, Berglan L, Luck SJ (1996) Are attentional dwell times
inconsistent with serial visual search? Psychonomic Bulletin & Review 3: 360–365.
4. Hubner R (2001) A formal version of the Guided Search (GS2) model. Percept
Psychophys 63: 945–951.
Attentional Guidance in CVS
PLoS ONE | www.plosone.org 9 May 2008 | Volume 3 | Issue 5 | e2219

5. Wolfe JM, Cave KR, Franzel SL (1989) Guided search: an alternative to the
feature integration model for visual search. J Exp Psychol Hum Percept Perform15: 419–433.
6. Wolfe JM, Horowitz TS (2004) What attributes guide the deployment of visual
attention and how do they do it? Nat Rev Neurosci 5: 495–501.7. Cave KR, Wolfe JM (1990) Modeling the role of parallel processing in visual
search. Cognit Psychol 22: 225–271.8. Palmer J, Verghese P, Pavel M (2000) The psychophysics of visual search. Vision
Res 40: 1227–1268.
9. Verghese P (2001) Visual search and attention: a signal detection theoryapproach. Neuron 31: 523–535.
10. Eckstein MP, Thomas JP, Palmer J, Shimozaki SS (2000) A signal detectionmodel predicts the effects of set size on visual search accuracy for feature,
conjunction, triple conjunction, and disjunction displays. Percept Psychophys 62:425–451.
11. Maljkovic V, Nakayama K (1994) Priming of pop-out: I. Role of features. Mem
Cognit 22: 657–672.12. Maljkovic V, Nakayama K (1996) Priming of pop-out: II. The role of position.
Percept Psychophys 58: 977–991.13. Nothdurft HC (1999) Focal attention in visual search. Vision Res 39:
2305–2310.
14. Kim MS, Cave KR (1995) Spatial attention in visual search for features andfeature conjunctions. Psychological Science 6: 376–380.
15. Kim MS, Cave KR (2001) Perceptual grouping via spatial selection in a focused-attention task. Vision Res 41: 611–624.
16. Sperling G (1960) The information available in brief visual presentations.Psychological Monographs: General and Applied 74: 1–29.
17. He S, Cavanagh P, Intriligator J (1996) Attentional resolution and the locus of
visual awareness. Nature 383: 334–337.18. Intriligator J, Cavanagh P (2001) The spatial resolution of visual attention.
Cognit Psychol 43: 171–216.19. Kim MS, Cave KR (1999) Grouping effects on spatial attention in visual search.
J Gen Psychol 126: 326–352.
20. Treisman A (1982) Perceptual grouping and attention in visual search forfeatures and for objects. J Exp Psychol Hum Percept Perform 8: 194–214.
21. Egeth HE, Virzi RA, Garbart H (1984) Searching for conjunctively definedtargets. J Exp Psychol Hum Percept Perform 10: 32–39.
22. Duncan J (1995) Target and nontarget grouping in visual search. PerceptPsychophys 57: 117–120.
23. Zar J (1996) Biostatistical analysis. Englewood Cliffs, NJ: Prentice-Hall.
24. Enns JT (2004) Object substitution and its relation to other forms of visual
masking. Vision Res 44: 1321–1331.
25. Lamy D, Tsal Y, Egeth HE (2003) Does a salient distractor capture attention
early in processing? Psychon Bull Rev 10: 621–629.
26. Olivers CN, Humphreys GW (2003) Attentional guidance by salient feature
singletons depends on intertrial contingencies. J Exp Psychol Hum Percept
Perform 29: 650–657.
27. Rovamo J, Virsu V, Laurinen P, Hyvarinen L (1982) Resolution of gratings
oriented along and across meridians in peripheral vision. Invest Ophthalmol Vis
Sci 23: 666–670.
28. Millidot M, Lamont A (1974) Letter: Peripheral visual acuity in the vertical
plane. Vision Res 14: 1497–1498.
29. Beirne RO, Zlatkova MB, Anderson RS (2005) Changes in human short-
wavelength-sensitive and achromatic resolution acuity with retinal eccentricity
and meridian. Vis Neurosci 22: 79–86.
30. Carrasco M, McElree B (2001) Covert attention accelerates the rate of visual
information processing. Proc Natl Acad Sci U S A 98: 5363–5367.
31. Mackeben M (1999) Sustained focal attention and peripheral letter recognition.
Spat Vis 12: 51–72.
32. Razpurker-Apfeld I, Kimchi R (2007) The time course of perceptual grouping:
the role of segregation and shape formation. Percept Psychophys 69: 732–743.
33. Schulz MF, Sanocki T (2003) Time course of perceptual grouping by color.
Psychol Sci 14: 26–30.
34. Itti L, Koch C (2001) Computational modelling of visual attention. Nat Rev
Neurosci 2: 194–203.
35. Navalpakkam V, Itti L (2005) Modeling the influence of task on attention. Vision
Res 45: 205–231.
36. Wolfe JM (2003) Moving towards solutions to some enduring controversies in
visual search. Trends Cogn Sci 7: 70–76.
37. Li FF, VanRullen R, Koch C, Perona P (2002) Rapid natural scene
categorization in the near absence of attention. Proc Natl Acad Sci U S A 99:
9596–9601.
38. Joseph JS, Chun MM, Nakayama K (1997) Attentional requirements in a
‘preattentive’ feature search task. Nature 387: 805–807.
39. VanRullen R, Reddy L, Koch C (2004) Visual search and dual tasks reveal two
distinct attentional resources. J Cogn Neurosci 16: 4–14.
Attentional Guidance in CVS
PLoS ONE | www.plosone.org 10 May 2008 | Volume 3 | Issue 5 | e2219