Southwest's acquisition of AirTran: an analysis of short-term ...
21
Embry-Riddle Aeronautical University From the SelectedWorks of Dawna L Rhoades PhD 2013 Southwest's acquisition of AirTran: an analysis of short-term stock performance Dawna L Rhoades, PhD, Embry Riddle Aeronautical University Available at: hps://works.bepress.com/dawna_l_rhoades/2/
-
Upload
khangminh22 -
Category
Documents
-
view
1 -
download
0
Transcript of Southwest's acquisition of AirTran: an analysis of short-term ...
Embry-Riddle Aeronautical University
From the SelectedWorks of Dawna L Rhoades PhD
2013
Southwest's acquisition of AirTran: an analysis ofshort-term stock performanceDawna L Rhoades, PhD, Embry Riddle Aeronautical University
Available at: https://works.bepress.com/dawna_l_rhoades/2/
World Review of Intermodal Transportation Research, Vol. 4, No. 4, 2013 227
Copyright © 2013 Inderscience Enterprises Ltd.
Southwest’s acquisition of AirTran: an analysis of short-term stock performance
Wilfred S. Manuela Jr.* John Gokongwei School of Management, Ateneo de Manila University, Room 302, 3rd Floor, Loyola Heights, Quezon City 1108, Philippines Fax: +63-2-426-6076 E-mail: [email protected] *Corresponding author
Dawna L. Rhoades College of Business, Embry-Riddle Aeronautical University, 600 S. Clyde Morris Blvd., Daytona Beach, FL 32114, USA Fax: +1-386-226-6694 E-mail: [email protected]
Abstract: This paper examines the short-term stock performance of Southwest Airlines and AirTran Airways using time series data consisting of daily and cumulative abnormal returns ± 60 trading days around the merger announcement and merger completion dates. The impact of Southwest’s announcement to acquire AirTran is positive. The daily abnormal returns of Southwest and AirTran, using the S&P 500 as index, are highly significant on the merger announcement date. The impact of the merger completion is mixed, however. Southwest’s share price drifted lower up to the merger date, underperforming the S&P 500, while the share price of AirTran generally drifted higher in a very narrow range. Southwest and AirTran, nevertheless, outperformed the AMEX Airline Index, suggesting that the higher fuel prices at the time of the merger may have influenced investor reaction to the merger, resulting in lower share prices of major airlines. The beta of Southwest improved after the merger announcement and completion of the merger, suggesting shareholder confidence in the merger and in Southwest’s financial performance, at least in the short-term.
Keywords: abnormal returns; airline mergers; event study; stock performance.
Reference to this paper should be made as follows: Manuela Jr., W.S. and Rhoades, D.L. (2013) ‘Southwest’s acquisition of AirTran: an analysis of short-term stock performance’, World Review of Intermodal Transportation Research, Vol. 4, No. 4, pp.227–246.
Biographical notes: Wilfred S. Manuela Jr. is an Associate Professor at the Leadership and Strategy Department, John Gokongwei School of Management, Ateneo de Manila University, Quezon City, Philippines. His research interests include liberalisation and competition in the airline industry. His work has appeared in the Journal of Business Research.
228 W.S. Manuela Jr. and D.L. Rhoades
Dawna L. Rhoades is the Associate Dean for Research and Graduate Studies at the College of Business, Embry-Riddle Aeronautical University, Daytona Beach, Florida. Her research interests include airline strategy and intermodal and sustainable transportation. Her work appeared in the Journal of Air Transport Management, Journal of Managerial Issues, Managing Service Quality, World Review of Science, Technology, and Sustainable Development, and the Handbook of Airline Strategy. She is the author of Evolution of International Aviation: Phoenix Rising (2008) and the editor of the World Review of Intermodal Transportation Research.
This paper is a revised and expanded version of a section of a paper entitled ‘The impact of airline mergers on shareholder wealth’ presented at the 16th Air Transport Research Society World Conference, Tainan, Taiwan, 27–30 June 2012.
1 Introduction
The global airline industry was profitable in 2011 despite the disaster in Japan, unrest in the Middle East, and oil price increases due to the efficiency gains of the last decade and the strengthening global economic environment, reducing the impact of higher fuel prices, but with a 0.7% margin the airline industry may not weather another shock (Francis et al., 2011). Available seats (capacity) in the US airline industry have not risen, allowing airlines to charge higher fares. The combination of capacity restraint and ancillary fees (e.g., additional charges for food and beverage, checked-in luggage, priority boarding, rebooking and cancellation) may have helped the industry return to profitability after the disastrous first decade of the 21st century (JD Powers and Associates, 2011).
Taneja (2003) argues that the airline industry is not only unprofitable but overwhelmingly complex, citing 12 characteristics that create the apparent complexity: excessive government regulation, network-driven structure, organised labour and high labour cost, capital and fuel intensity, high fixed costs, high cyclicality and seasonality, revenue vulnerability, destructive competition, commodity products, vulnerability to the weather and dependence on infrastructure and technology, uneven playing field, and extremely variable planning horizon. The airline industry’s complexity and its related unprofitability have contributed to a history of bankruptcy and consolidation (e.g., mergers and acquisitions or M&As). Hanlon (2007) argues that M&As are generally seen as a way to improve airline industry fortunes. Moreover, investment analysts tend to see consolidation as a positive development in the airline industry, expecting increased revenues and non-labour cost improvements to ensue (Chase, 2010).
The focus of our study is on the short-term performance of the stock prices of Southwest and AirTran around the merger announcement and merger completion dates. The equity price movements of the acquiring and target (acquired) firms have been shown to indicate the market (shareholder) opinion regarding the management decisions of the airlines involved. Positive equity price movement is a reflection of shareholder confidence that the proposed action is in the best interest of shareholders while a negative price movement suggests that the action does not benefit shareholders or comes at too high a cost. This paper uses an event study methodology to explore the short-term stock
Southwest’s acquisition of AirTran 229
performance of Southwest and AirTran. The major objective is to determine whether Southwest’s decision to acquire AirTran benefits its shareholders since domestic airline mergers have been shown to reduce operating costs (Brueckner and Spiller, 1991; Clougherty, 2002; Levine, 1987).
2 Airline M&As in the USA
Subsequent to the US Airline Deregulation Act in 1978, the merger activity in the 1980s led to a sharp increase in the overall concentration of the industry with eight carriers controlling 90% of the domestic industry in 1989 (Hanlon, 2007) and six carriers controlling 86% of the industry by the early 1990s (Kim and Singal, 1993). While the US Department of Transportation argued strongly that markets remained ‘contestable’ there was a great deal of criticism for mergers between carriers based at the same airport – Northwest and Republic, as well as TWA and Ozark, primarily because the mergers resulted in reduced service, fewer choices, and higher fares (Bailey and Williams, 1988).
Low cost carriers (LCCs) began to exert increasing pressure on the traditional carriers in the 1990s, exacerbating the dire financial position of full-service airlines. After the September 11, 2001 terrorist attacks in the USA, the LCCs expanded service while legacy carriers reduced capacity and departure frequency (Bond, 2003; Haddad, 2003). The terrorist attacks, rising fuel costs, and the severe acute respiratory syndrome epidemic in 2002 and 2003 created ‘the perfect economic storm’ for US airlines, according to the Air Transport Association (2003), leading to bankruptcy and a new round of M&As. A 2005 study by the US Government Accountability Office (2005) concluded that legacy airlines were not able “to reduce their costs sufficiently to profitably compete with low cost airlines”. For many of these carriers, a viable option was merger or acquisition, although only one of the 20 major airline mergers since deregulation, Delta and Western, can be deemed a long-term success (Steffy, 2007). One of these mergers, Piedmont and US Airways in 1989, the largest airline merger up to that point, is one of the least successful mergers as efforts to equalise pay between the two firms created an airline with the highest cost structure in the US airline industry (Jones and Jones, 1999).
In the case of short-term financial performance, Singal (1996) reports that the two-day abnormal returns were positive for target and acquired firms, contrary to the finding that acquiring firms earn zero or negative returns (Malatesta, 1983; Varaiya, 1986). Hanlon (2007) argues, however, that the instability and volatility of the airline industry make almost any consolidation that promises to reduce costs or lower capacity appear attractive to airline investors. While some fall short of proclaiming consolidation as an ‘unambiguous positive’ (Chase, 2010), consolidation is viewed as a means to reduce capacity and improve profitability, especially M&As among domestic airlines (Brueckner and Spiller, 1991; Levine, 1987).
Southwest Airlines acquired Muse Air in 1985, Morris Air in 1993, and acquired certain assets of bankrupt ATA Airlines in 2008. On September 27, 2010 Southwest Airlines (LUV) announced its acquisition of AirTran Airways (AAI) for USD 1.4 billion and on November 9, 2010, the Antitrust Division of the US Department of Justice requested additional information on the proposed acquisition (http://en.wikipedia.org/
230 W.S. Manuela Jr. and D.L. Rhoades
wiki/Southwest-AirTran_merger). On April 26, 2011 US antitrust regulators cleared the merger (http://www.cnbc.com/id/42769464 and http://www.cnbc.com/id/42768810) and a week later, on May 2, Southwest Airlines completed its stock acquisition of AirTran (http://www.southwest.com and http://www.cnbc.com/id/42862056).
Since a number of studies indicate that the stock prices of acquiring and target firms show abnormal returns before and after the merger (Israel, 1991; Lang, 2000), we expect that:
H1 The acquisition results in positive abnormal returns for Southwest Airlines.
H2 The acquisition results in positive abnormal returns for AirTran Airways.
3 Methodology
We collected the daily index data of the S&P 500, Dow Jones Industrial Average (DJIA), and AMEX Airline Index (XAL), an index of mostly US airline stocks, and the daily share price data of Southwest and AirTran. We collected data for two periods: 60 trading days before and after the merger announcement and 60 trading days before and after the completion of the merger. We conducted internet searches to identify the acquisition announcement date, the actual merger date, and events that might influence the share prices of Southwest and AirTran such as communication with regulators and discussion with shareholders and labour groups, as well as approval by unions, the board of directors, shareholders, and regulators.
The efficient market hypothesis states that share prices incorporate all available information, which means any information regarding a merger should be reflected in the share prices of merging firms (Mandelker, 1974). The finance literature defines abnormal returns as the extent to which returns are different from those that would have been appropriate using a model that generates ‘normal’ returns (Brown and Warner, 1980), interpreting the abnormal return over an event window as a measure of the impact of the event on the share prices of the firm (Campbell et al., 1997). The use of daily stock returns and the characteristics of daily data with regard to their effect on event study methodologies have been investigated by Brown and Warner (1980, 1985), arguing that event studies using the market adjusted returns model based on standard parametric tests are well specified, while the use of daily stock returns for an event study analysis is straightforward (Brown and Warner, 1985).
We used the S&P 500 as the market benchmark in the computation of abnormal returns because the broader market is more representative of investors’ sentiments than the DJIA. The S&P 500 also mirrors the performance of the DJIA in the 121-trading day periods, around the announcement date and around the merger date, considered in the study. We also examined any new information between the announcement date and the date of the merger by comparing the movement of the share prices around the announcement date and around the merger date. We graphed the daily abnormal returns (DARs) and cumulative abnormal returns (CARs), the sum of DARs over a period of n days, to show the performance of Southwest and AirTran against the S&P 500 and the XAL.
We used the following equations to compute for the DARs and CARs of Southwest’s and AirTran’s common shares. Equation (1) shows the market-adjusted returns model, a
Southwest’s acquisition of AirTran 231
linear model that relates stock returns to market returns whose error term has an expectation of zero and a variance equal to 2
itεσ (Campbell et al., 1997).
it i i mt itR R ε= + +α β (1)
where 0itεE = and 2 .it itε εVar σ=
Brown and Warner (1985) define the market-adjusted returns model as:
for 1 toit it mtA R R i n= − = (2)
Ait is the excess or abnormal return of security i at time t, Rit is the return on stock i at time t, and Rmt is the return on the market index at time t.
( ) ( )[ ]1 1 100%it it it itR P P P− −= − ÷ × (3)
( ) ( )[ ]1 1 100%mt mt mt mtR I I I− −= − ÷ × (4)
Pit is the price of security i at time t and Pit–1 is the price of security i at time t – 1. Imt is the market index at time t and Imt–1 is the market index at time t – 1.
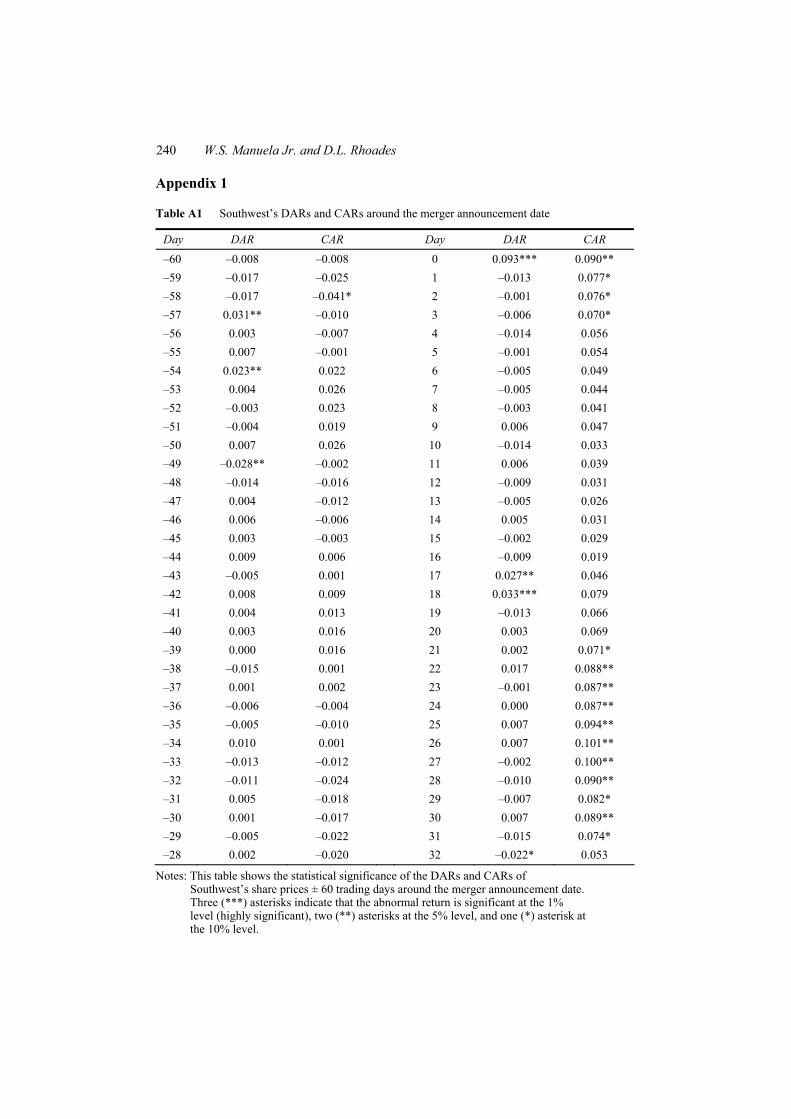
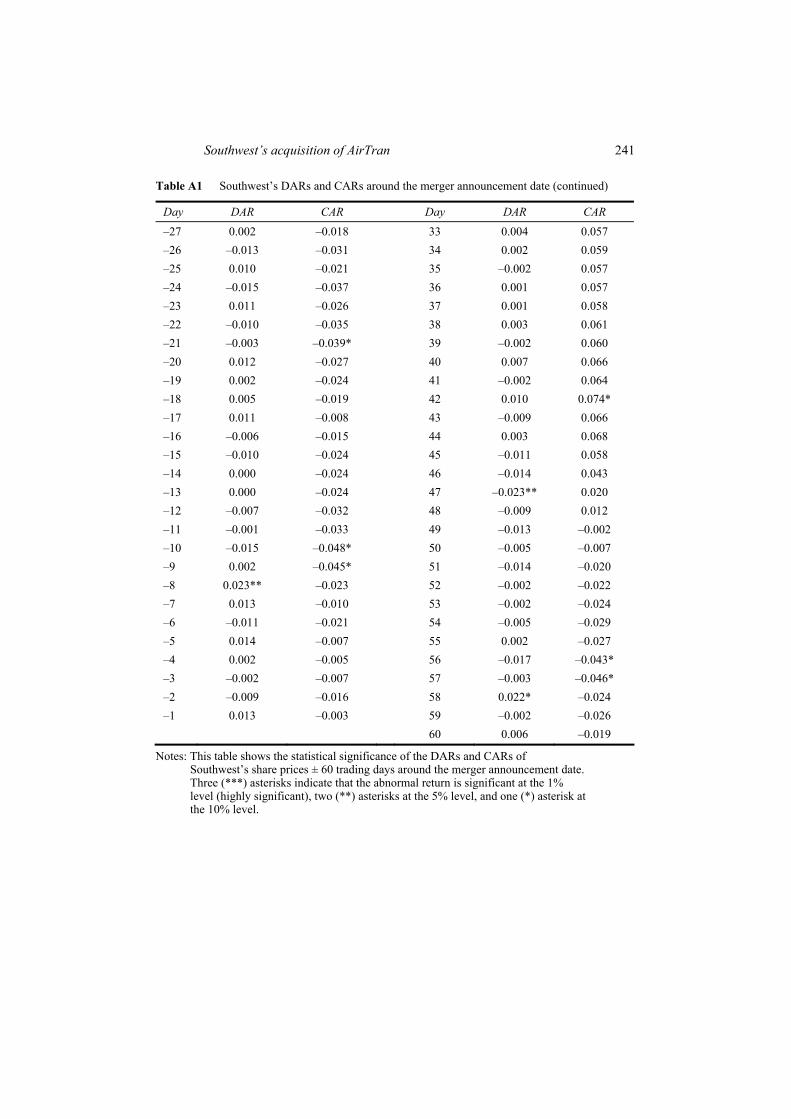
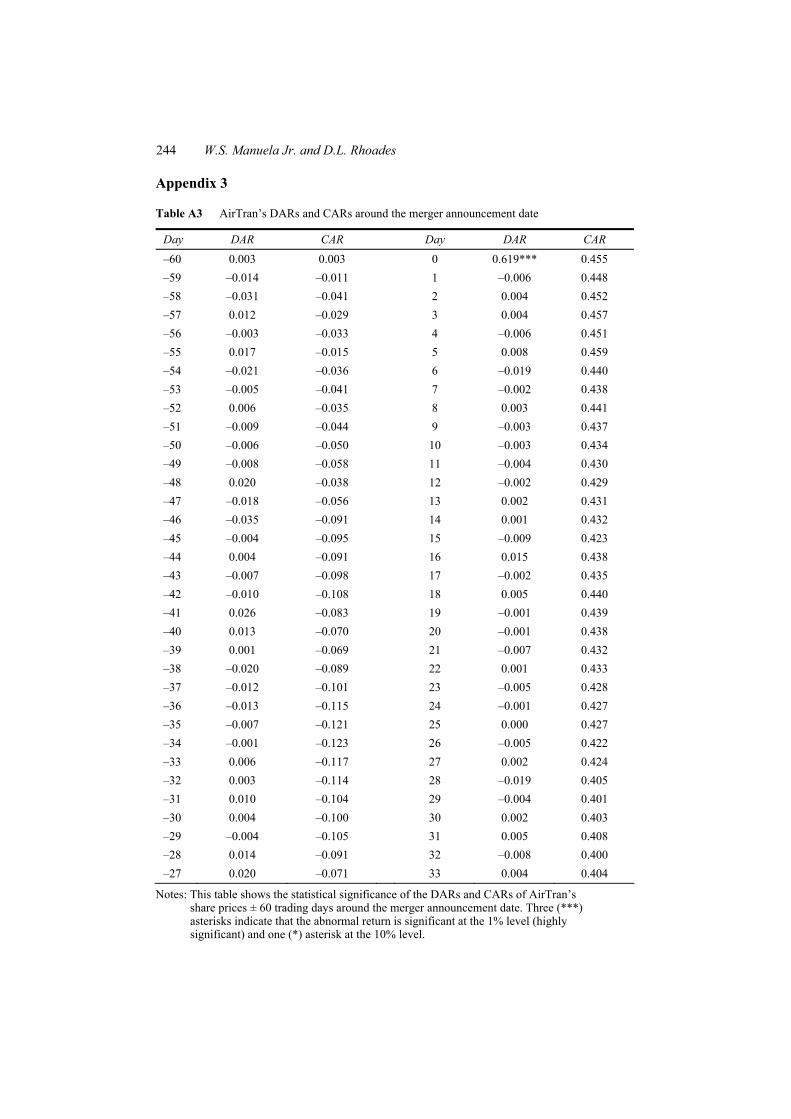
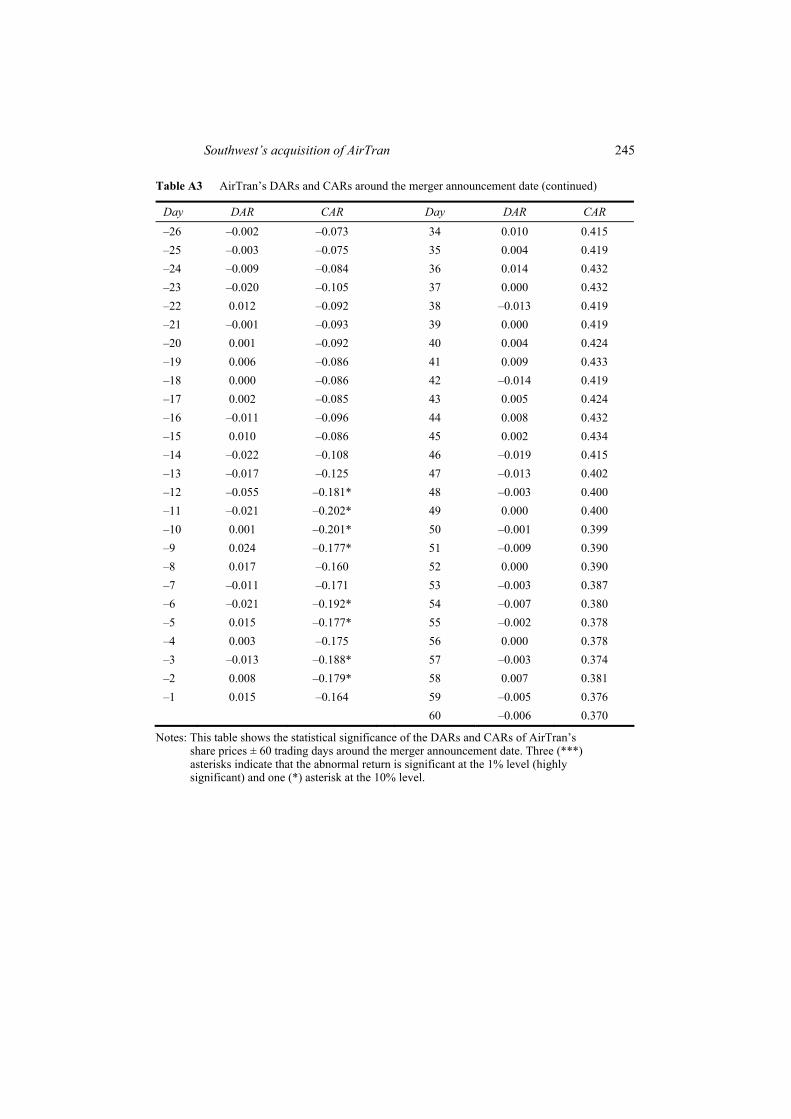
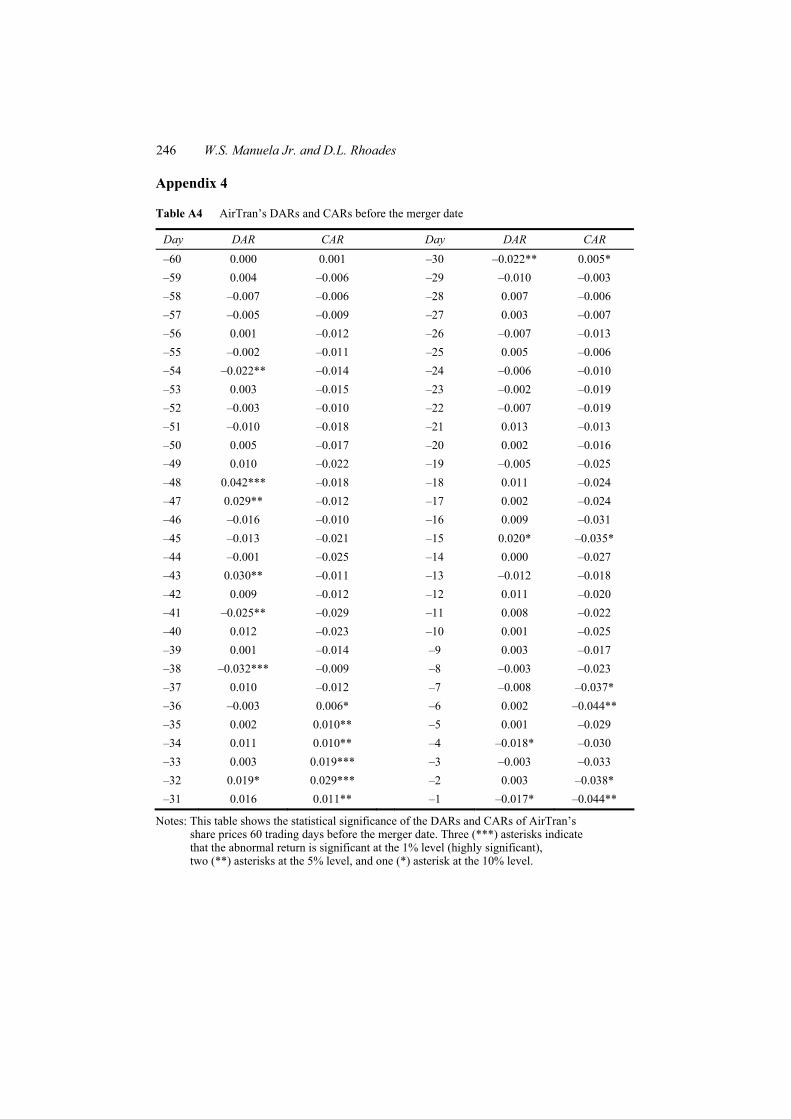
Appendices 1 and 2 show the statistical significance of the DARs and CARs, based on the t-statistics, of Southwest’s share price in the 121-trading day window around the merger announcement and merger completion dates. Appendices 3 and 4 show the statistical significance of the DARs and CARs of AirTran’s stock price in the 121-trading day period around the merger announcement date and in the 60-trading day period before the completion of the merger. Statistical significance suggests that ‘new information’ exists and the stock market has been slow to reflect all relevant information in the share prices of Southwest and AirTran. Statistically significant abnormal returns indicate that arbitrage exists, suggesting that knowledgeable investors benefit from the new information regarding the merger announcement or completion of the merger.
We computed the betas of Southwest and AirTran using equation (5), based on the ordinary least squares market model.
( )( )
cov ,var
i mi
m
r rr
=β (5)
where βi is the beta of stock i, the ratio of the covariance of the rates of return of stock i and the market; ri is the rate of return of stock i, and rm is the rate of return of the market (Brealey et al., 2006).
The capital asset pricing model (CAPM), r – rf = β(rm – rf), where r – rf is the expected risk premium of the stock (e.g., Southwest or AirTran stock) and rm – rf is the expected risk premium on the market (e.g., S&P 500 or DJIA), argues that an increase in a firm’s beta increases its cost of capital (Brealey et al., 2006), resulting in lower present values of its future cash flows. Investors invariably interpret a firm’s higher beta as negative news, resulting in lower share prices (Flouris and Swidler, 2004). Turner and Morrell (2003), in their study of airline stocks and cost of equity capital, argue that betas calculated using the CAPM tend to be lower, although they attribute the lower betas on the airlines in their sample or the market volatility at the time of their study.
232 W.S. Manuela Jr. and D.L. Rhoades
4 Results and analysis
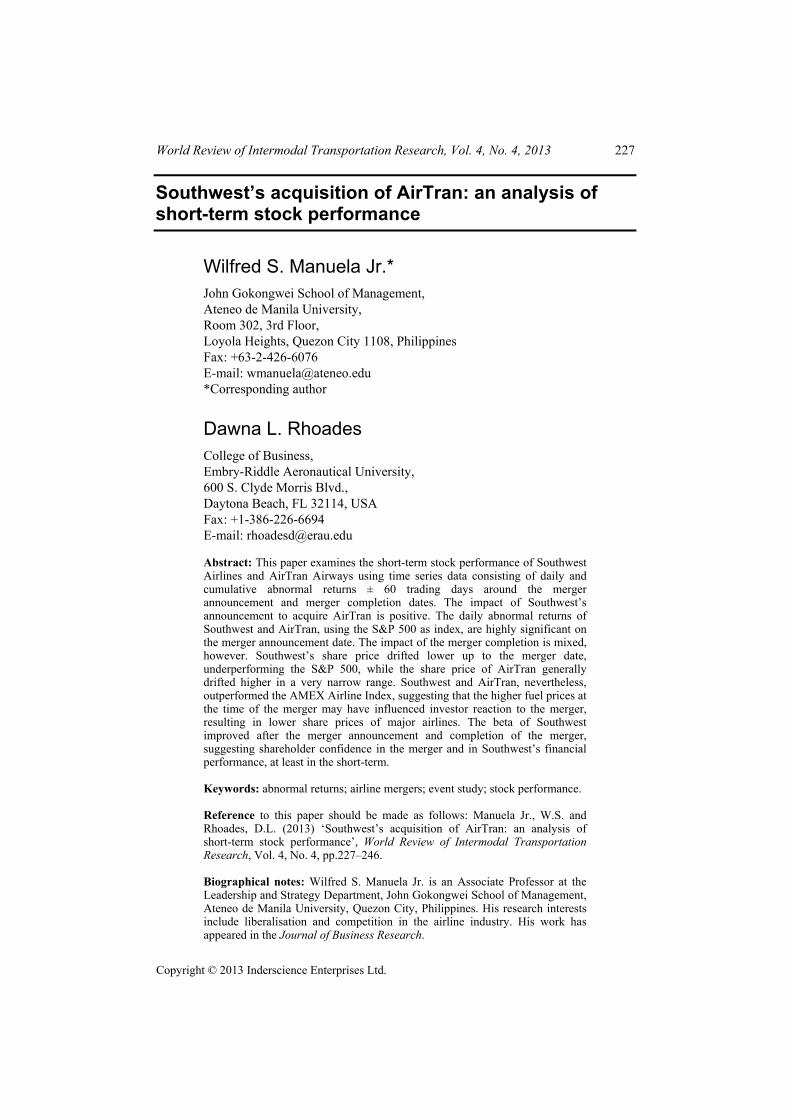
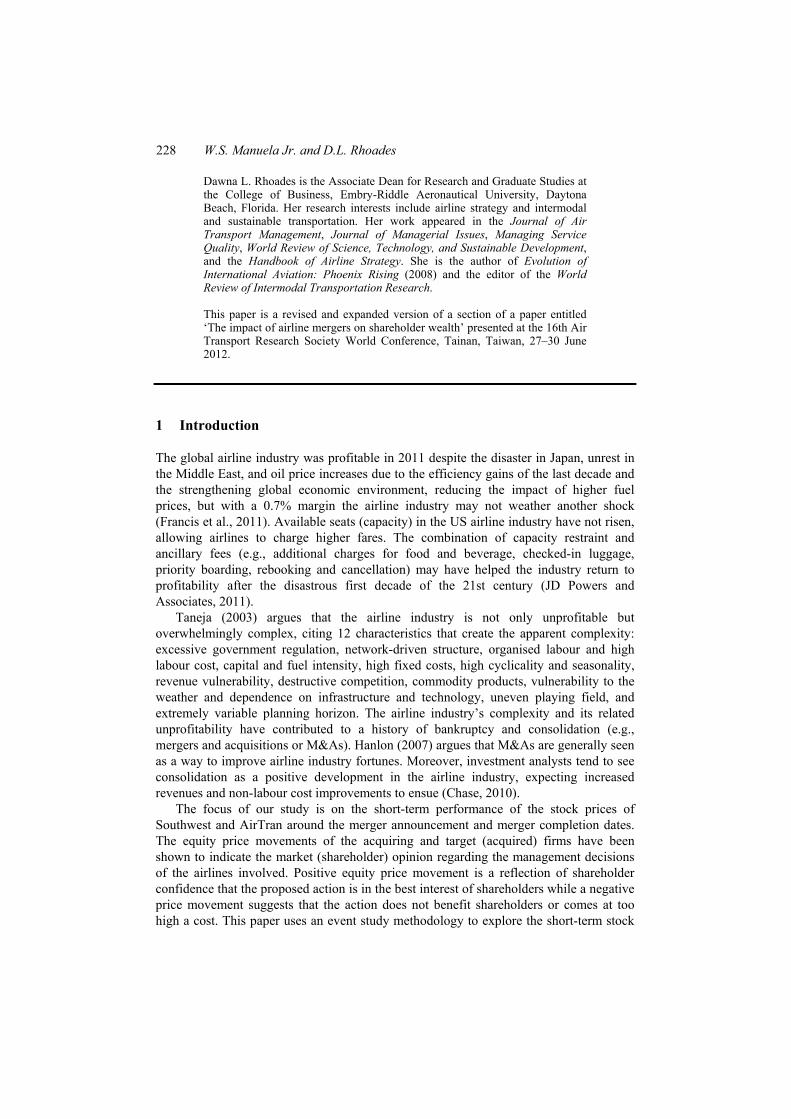
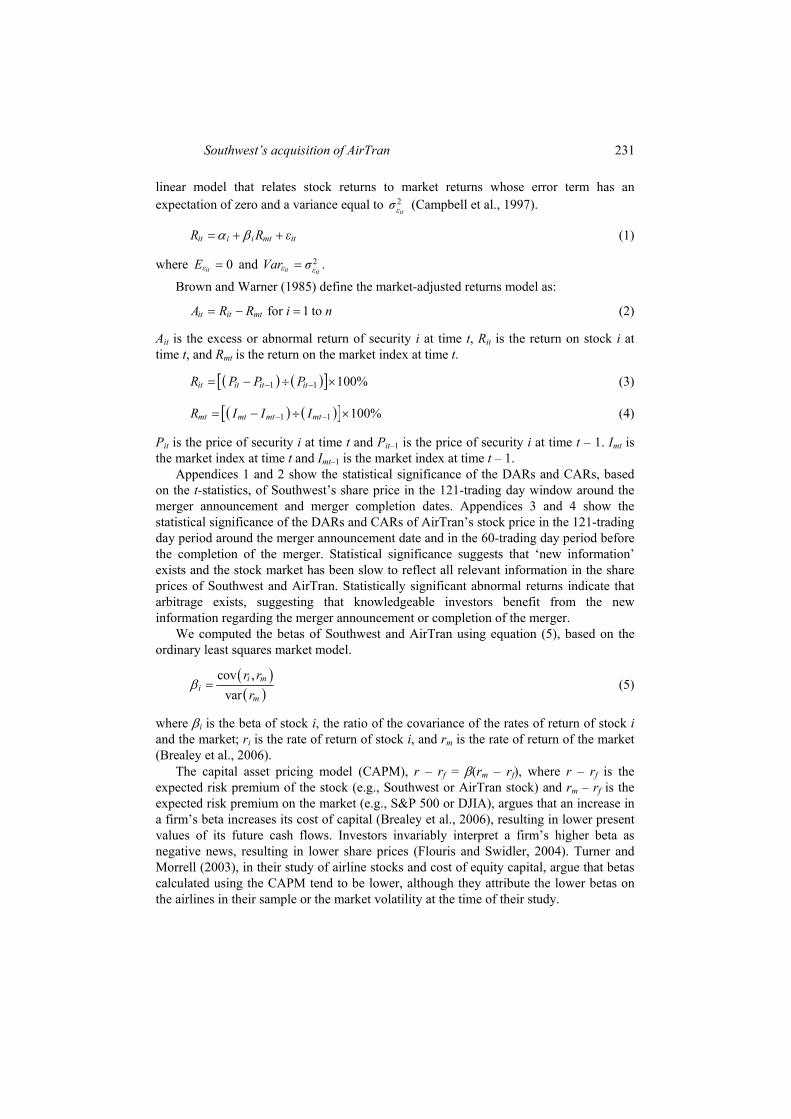
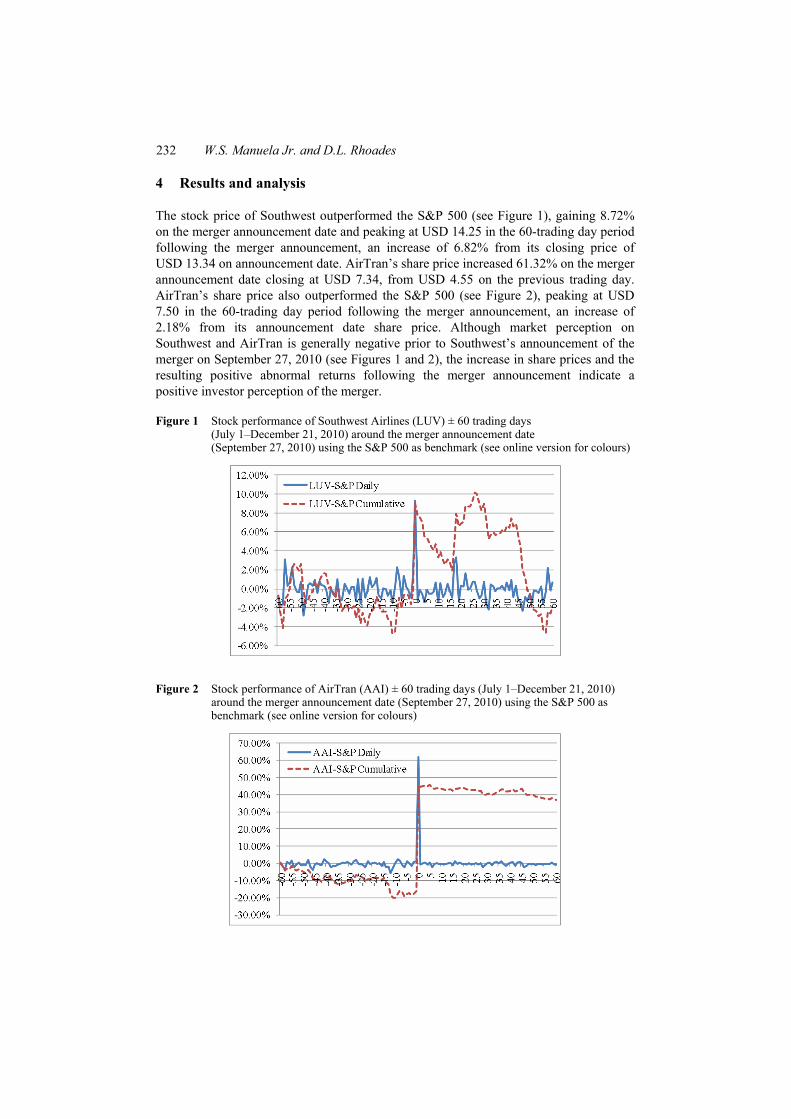
The stock price of Southwest outperformed the S&P 500 (see Figure 1), gaining 8.72% on the merger announcement date and peaking at USD 14.25 in the 60-trading day period following the merger announcement, an increase of 6.82% from its closing price of USD 13.34 on announcement date. AirTran’s share price increased 61.32% on the merger announcement date closing at USD 7.34, from USD 4.55 on the previous trading day. AirTran’s share price also outperformed the S&P 500 (see Figure 2), peaking at USD 7.50 in the 60-trading day period following the merger announcement, an increase of 2.18% from its announcement date share price. Although market perception on Southwest and AirTran is generally negative prior to Southwest’s announcement of the merger on September 27, 2010 (see Figures 1 and 2), the increase in share prices and the resulting positive abnormal returns following the merger announcement indicate a positive investor perception of the merger.
Figure 1 Stock performance of Southwest Airlines (LUV) ± 60 trading days (July 1–December 21, 2010) around the merger announcement date (September 27, 2010) using the S&P 500 as benchmark (see online version for colours)
Figure 2 Stock performance of AirTran (AAI) ± 60 trading days (July 1–December 21, 2010) around the merger announcement date (September 27, 2010) using the S&P 500 as benchmark (see online version for colours)
Southwest’s acquisition of AirTran 233
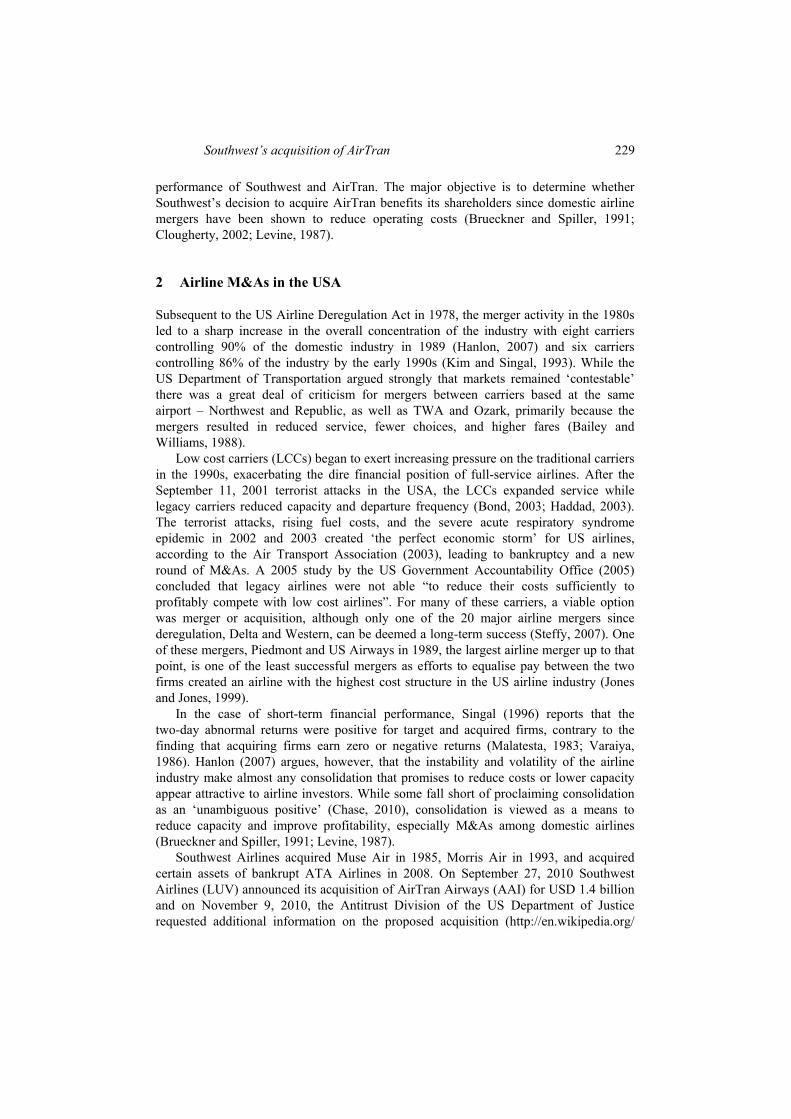
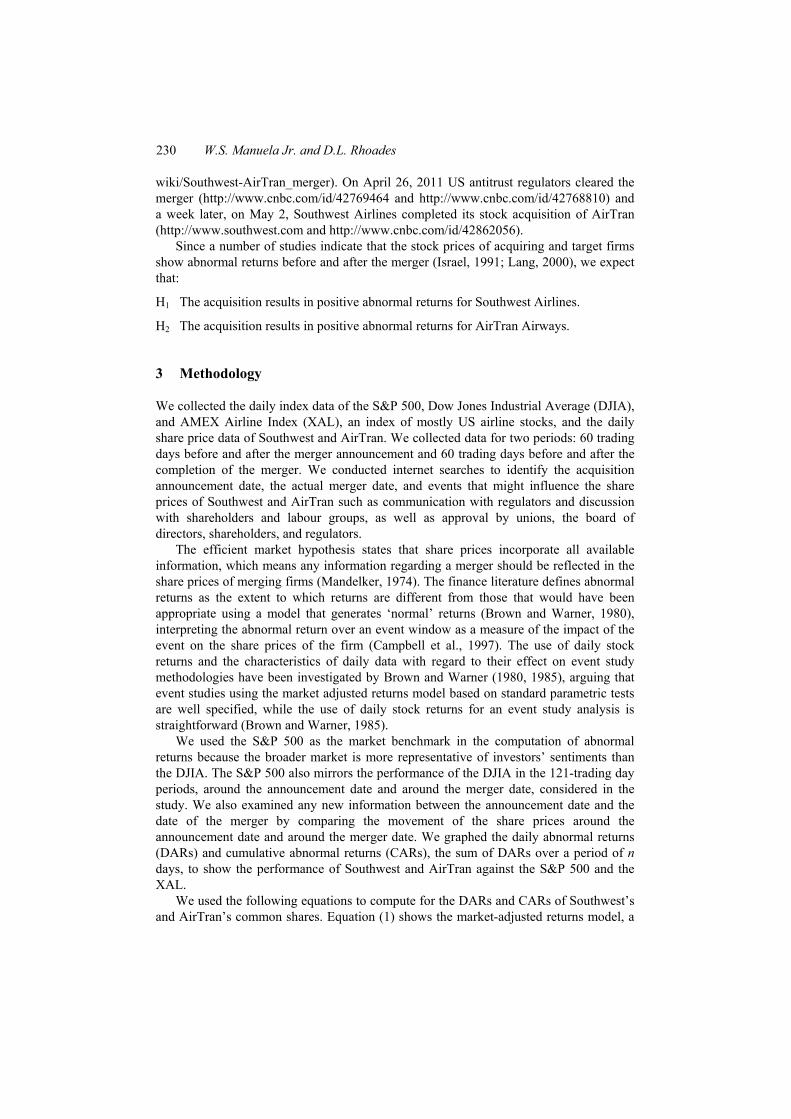
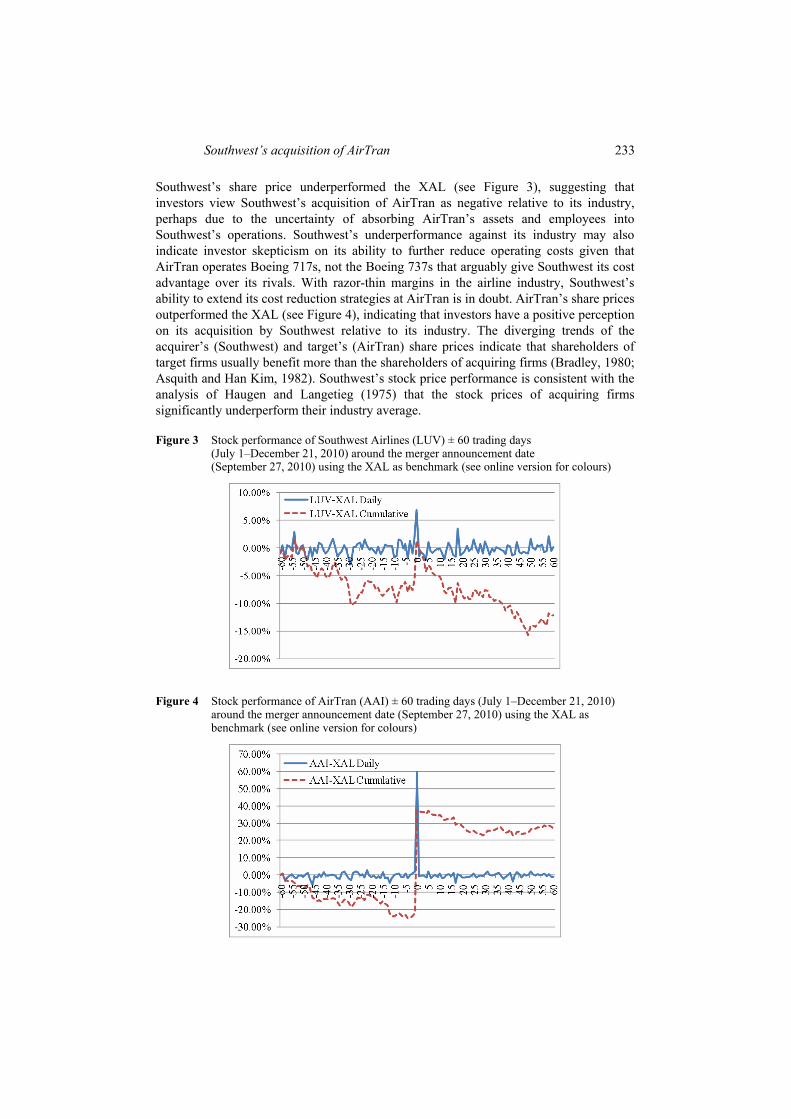
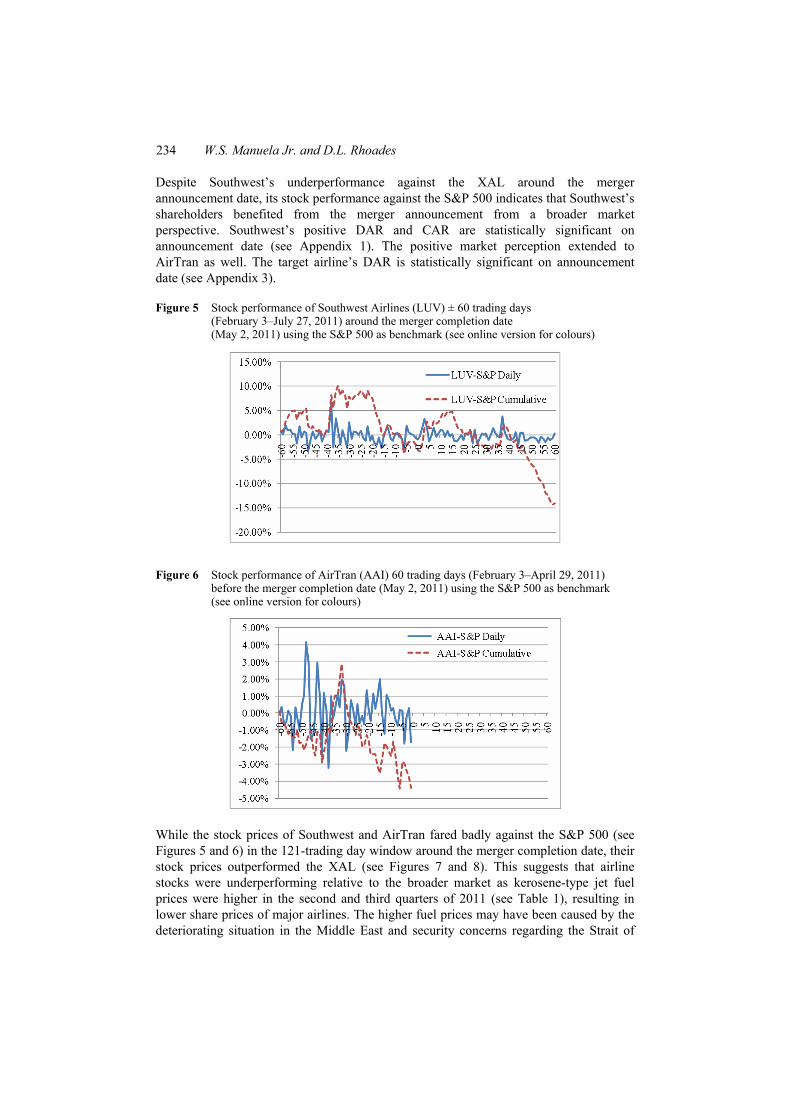
Southwest’s share price underperformed the XAL (see Figure 3), suggesting that investors view Southwest’s acquisition of AirTran as negative relative to its industry, perhaps due to the uncertainty of absorbing AirTran’s assets and employees into Southwest’s operations. Southwest’s underperformance against its industry may also indicate investor skepticism on its ability to further reduce operating costs given that AirTran operates Boeing 717s, not the Boeing 737s that arguably give Southwest its cost advantage over its rivals. With razor-thin margins in the airline industry, Southwest’s ability to extend its cost reduction strategies at AirTran is in doubt. AirTran’s share prices outperformed the XAL (see Figure 4), indicating that investors have a positive perception on its acquisition by Southwest relative to its industry. The diverging trends of the acquirer’s (Southwest) and target’s (AirTran) share prices indicate that shareholders of target firms usually benefit more than the shareholders of acquiring firms (Bradley, 1980; Asquith and Han Kim, 1982). Southwest’s stock price performance is consistent with the analysis of Haugen and Langetieg (1975) that the stock prices of acquiring firms significantly underperform their industry average.
Figure 3 Stock performance of Southwest Airlines (LUV) ± 60 trading days (July 1–December 21, 2010) around the merger announcement date (September 27, 2010) using the XAL as benchmark (see online version for colours)
Figure 4 Stock performance of AirTran (AAI) ± 60 trading days (July 1–December 21, 2010) around the merger announcement date (September 27, 2010) using the XAL as benchmark (see online version for colours)
234 W.S. Manuela Jr. and D.L. Rhoades
Despite Southwest’s underperformance against the XAL around the merger announcement date, its stock performance against the S&P 500 indicates that Southwest’s shareholders benefited from the merger announcement from a broader market perspective. Southwest’s positive DAR and CAR are statistically significant on announcement date (see Appendix 1). The positive market perception extended to AirTran as well. The target airline’s DAR is statistically significant on announcement date (see Appendix 3).
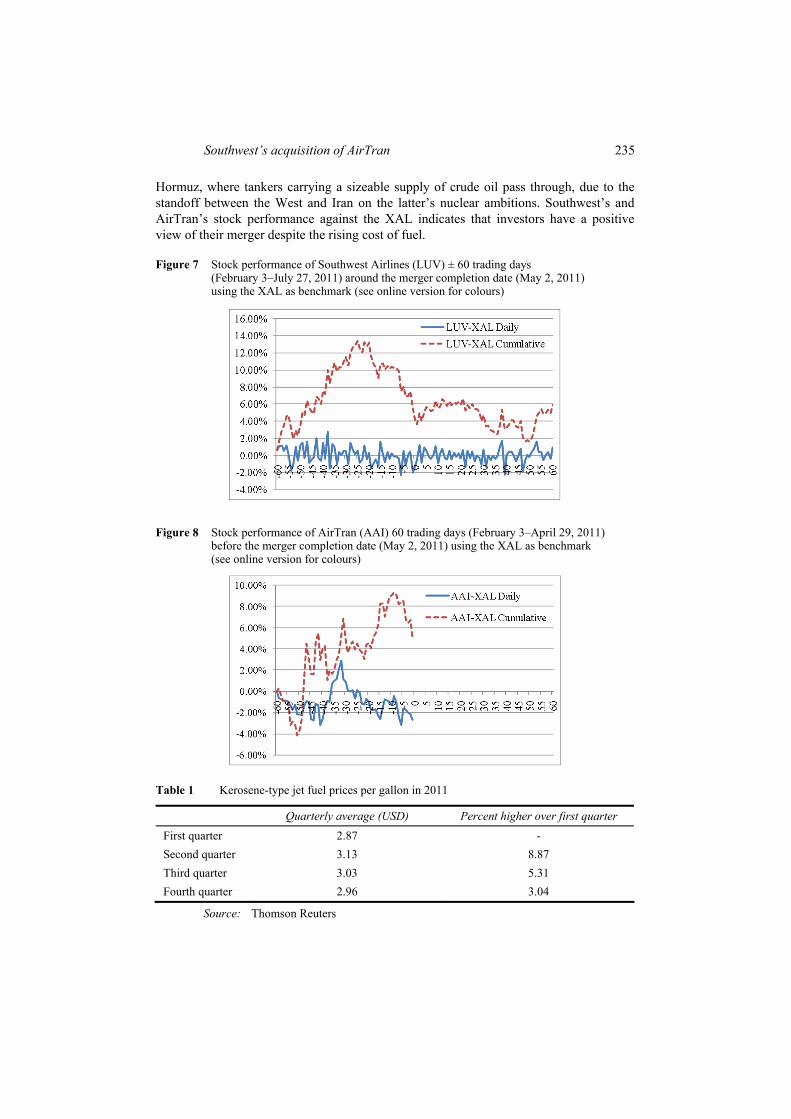
Figure 5 Stock performance of Southwest Airlines (LUV) ± 60 trading days (February 3–July 27, 2011) around the merger completion date (May 2, 2011) using the S&P 500 as benchmark (see online version for colours)
Figure 6 Stock performance of AirTran (AAI) 60 trading days (February 3–April 29, 2011) before the merger completion date (May 2, 2011) using the S&P 500 as benchmark (see online version for colours)
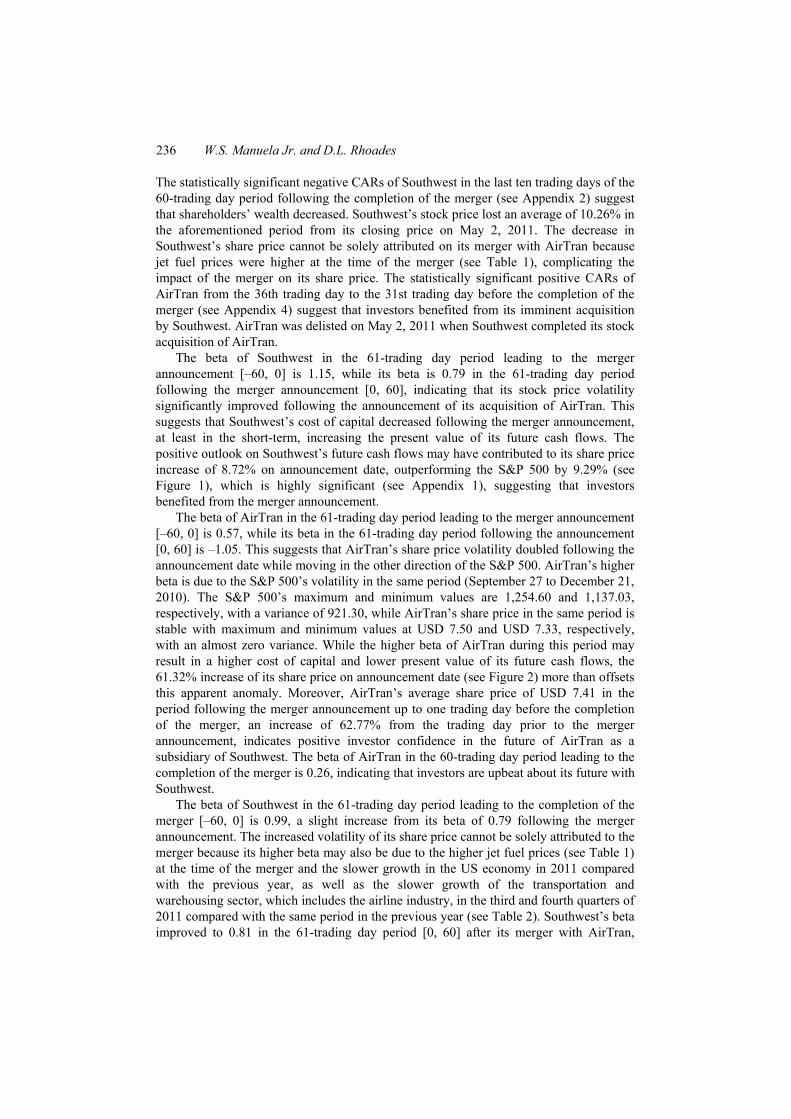
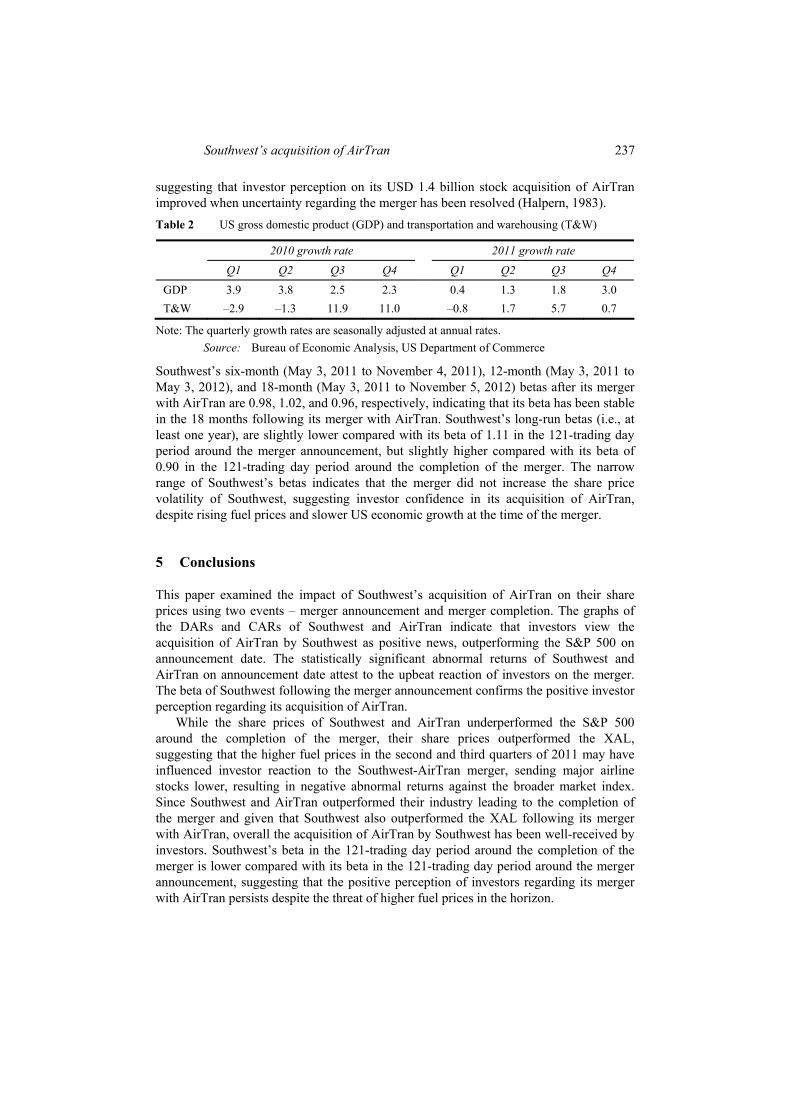
While the stock prices of Southwest and AirTran fared badly against the S&P 500 (see Figures 5 and 6) in the 121-trading day window around the merger completion date, their stock prices outperformed the XAL (see Figures 7 and 8). This suggests that airline stocks were underperforming relative to the broader market as kerosene-type jet fuel prices were higher in the second and third quarters of 2011 (see Table 1), resulting in lower share prices of major airlines. The higher fuel prices may have been caused by the deteriorating situation in the Middle East and security concerns regarding the Strait of
Southwest’s acquisition of AirTran 235
Hormuz, where tankers carrying a sizeable supply of crude oil pass through, due to the standoff between the West and Iran on the latter’s nuclear ambitions. Southwest’s and AirTran’s stock performance against the XAL indicates that investors have a positive view of their merger despite the rising cost of fuel.
Figure 7 Stock performance of Southwest Airlines (LUV) ± 60 trading days (February 3–July 27, 2011) around the merger completion date (May 2, 2011) using the XAL as benchmark (see online version for colours)
Figure 8 Stock performance of AirTran (AAI) 60 trading days (February 3–April 29, 2011) before the merger completion date (May 2, 2011) using the XAL as benchmark (see online version for colours)
Table 1 Kerosene-type jet fuel prices per gallon in 2011
Quarterly average (USD) Percent higher over first quarter
First quarter 2.87 - Second quarter 3.13 8.87 Third quarter 3.03 5.31 Fourth quarter 2.96 3.04
Source: Thomson Reuters
236 W.S. Manuela Jr. and D.L. Rhoades
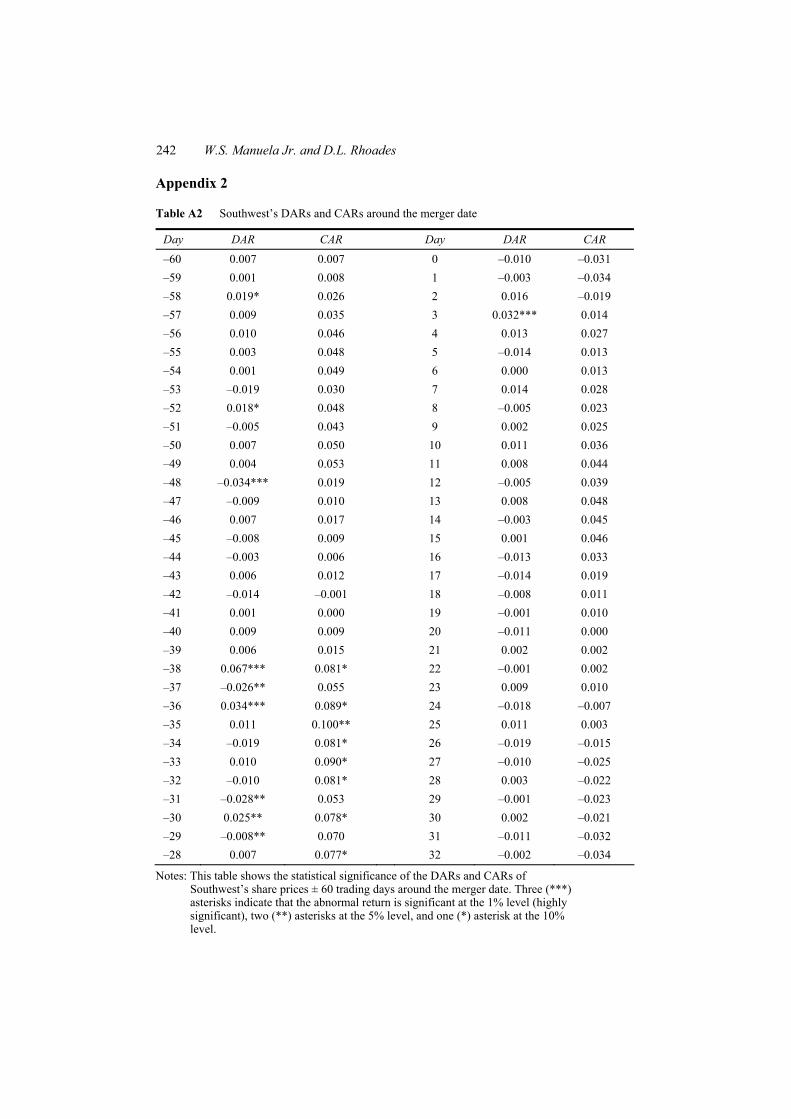
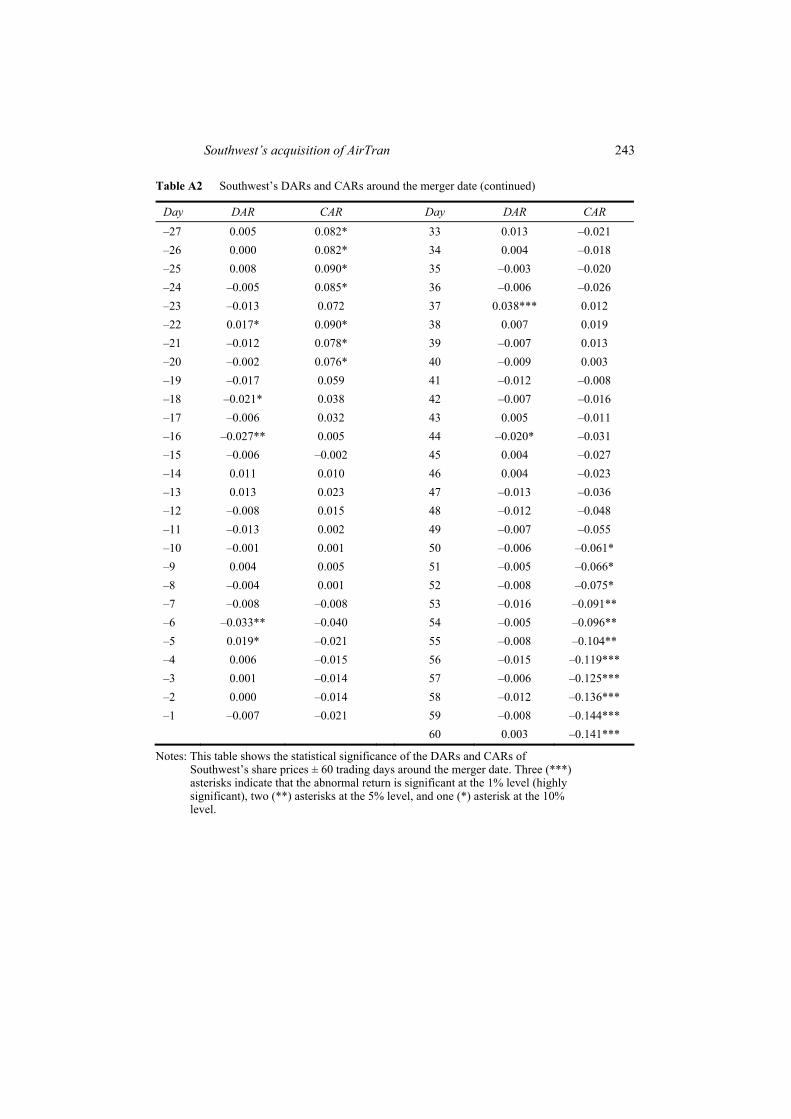
The statistically significant negative CARs of Southwest in the last ten trading days of the 60-trading day period following the completion of the merger (see Appendix 2) suggest that shareholders’ wealth decreased. Southwest’s stock price lost an average of 10.26% in the aforementioned period from its closing price on May 2, 2011. The decrease in Southwest’s share price cannot be solely attributed on its merger with AirTran because jet fuel prices were higher at the time of the merger (see Table 1), complicating the impact of the merger on its share price. The statistically significant positive CARs of AirTran from the 36th trading day to the 31st trading day before the completion of the merger (see Appendix 4) suggest that investors benefited from its imminent acquisition by Southwest. AirTran was delisted on May 2, 2011 when Southwest completed its stock acquisition of AirTran.
The beta of Southwest in the 61-trading day period leading to the merger announcement [–60, 0] is 1.15, while its beta is 0.79 in the 61-trading day period following the merger announcement [0, 60], indicating that its stock price volatility significantly improved following the announcement of its acquisition of AirTran. This suggests that Southwest’s cost of capital decreased following the merger announcement, at least in the short-term, increasing the present value of its future cash flows. The positive outlook on Southwest’s future cash flows may have contributed to its share price increase of 8.72% on announcement date, outperforming the S&P 500 by 9.29% (see Figure 1), which is highly significant (see Appendix 1), suggesting that investors benefited from the merger announcement.
The beta of AirTran in the 61-trading day period leading to the merger announcement [–60, 0] is 0.57, while its beta in the 61-trading day period following the announcement [0, 60] is –1.05. This suggests that AirTran’s share price volatility doubled following the announcement date while moving in the other direction of the S&P 500. AirTran’s higher beta is due to the S&P 500’s volatility in the same period (September 27 to December 21, 2010). The S&P 500’s maximum and minimum values are 1,254.60 and 1,137.03, respectively, with a variance of 921.30, while AirTran’s share price in the same period is stable with maximum and minimum values at USD 7.50 and USD 7.33, respectively, with an almost zero variance. While the higher beta of AirTran during this period may result in a higher cost of capital and lower present value of its future cash flows, the 61.32% increase of its share price on announcement date (see Figure 2) more than offsets this apparent anomaly. Moreover, AirTran’s average share price of USD 7.41 in the period following the merger announcement up to one trading day before the completion of the merger, an increase of 62.77% from the trading day prior to the merger announcement, indicates positive investor confidence in the future of AirTran as a subsidiary of Southwest. The beta of AirTran in the 60-trading day period leading to the completion of the merger is 0.26, indicating that investors are upbeat about its future with Southwest.
The beta of Southwest in the 61-trading day period leading to the completion of the merger [–60, 0] is 0.99, a slight increase from its beta of 0.79 following the merger announcement. The increased volatility of its share price cannot be solely attributed to the merger because its higher beta may also be due to the higher jet fuel prices (see Table 1) at the time of the merger and the slower growth in the US economy in 2011 compared with the previous year, as well as the slower growth of the transportation and warehousing sector, which includes the airline industry, in the third and fourth quarters of 2011 compared with the same period in the previous year (see Table 2). Southwest’s beta improved to 0.81 in the 61-trading day period [0, 60] after its merger with AirTran,
Southwest’s acquisition of AirTran 237
suggesting that investor perception on its USD 1.4 billion stock acquisition of AirTran improved when uncertainty regarding the merger has been resolved (Halpern, 1983). Table 2 US gross domestic product (GDP) and transportation and warehousing (T&W)
2010 growth rate 2011 growth rate
Q1 Q2 Q3 Q4 Q1 Q2 Q3 Q4
GDP 3.9 3.8 2.5 2.3 0.4 1.3 1.8 3.0 T&W –2.9 –1.3 11.9 11.0 –0.8 1.7 5.7 0.7
Note: The quarterly growth rates are seasonally adjusted at annual rates. Source: Bureau of Economic Analysis, US Department of Commerce
Southwest’s six-month (May 3, 2011 to November 4, 2011), 12-month (May 3, 2011 to May 3, 2012), and 18-month (May 3, 2011 to November 5, 2012) betas after its merger with AirTran are 0.98, 1.02, and 0.96, respectively, indicating that its beta has been stable in the 18 months following its merger with AirTran. Southwest’s long-run betas (i.e., at least one year), are slightly lower compared with its beta of 1.11 in the 121-trading day period around the merger announcement, but slightly higher compared with its beta of 0.90 in the 121-trading day period around the completion of the merger. The narrow range of Southwest’s betas indicates that the merger did not increase the share price volatility of Southwest, suggesting investor confidence in its acquisition of AirTran, despite rising fuel prices and slower US economic growth at the time of the merger.
5 Conclusions
This paper examined the impact of Southwest’s acquisition of AirTran on their share prices using two events – merger announcement and merger completion. The graphs of the DARs and CARs of Southwest and AirTran indicate that investors view the acquisition of AirTran by Southwest as positive news, outperforming the S&P 500 on announcement date. The statistically significant abnormal returns of Southwest and AirTran on announcement date attest to the upbeat reaction of investors on the merger. The beta of Southwest following the merger announcement confirms the positive investor perception regarding its acquisition of AirTran.
While the share prices of Southwest and AirTran underperformed the S&P 500 around the completion of the merger, their share prices outperformed the XAL, suggesting that the higher fuel prices in the second and third quarters of 2011 may have influenced investor reaction to the Southwest-AirTran merger, sending major airline stocks lower, resulting in negative abnormal returns against the broader market index. Since Southwest and AirTran outperformed their industry leading to the completion of the merger and given that Southwest also outperformed the XAL following its merger with AirTran, overall the acquisition of AirTran by Southwest has been well-received by investors. Southwest’s beta in the 121-trading day period around the completion of the merger is lower compared with its beta in the 121-trading day period around the merger announcement, suggesting that the positive perception of investors regarding its merger with AirTran persists despite the threat of higher fuel prices in the horizon.
238 W.S. Manuela Jr. and D.L. Rhoades
Acknowledgements
We would like to thank the three anonymous referees who reviewed our paper. Their comments and suggestions have greatly improved the final version of our paper. We would also like to thank Andrew Wilson and Izyan Ishak, our research assistants, who helped us gather data and related information for our paper.
References Air Transport Association (2003) Airlines in Crisis: The Perfect Economic Storm, Air Transport
Association of America, Washington, DC. Asquith, P. and Han Kim, E. (1982) ‘The impact of merger bids on the participating firms’ security
holders’, The Journal of Finance, Vol. 37, No. 5, pp.1209–1228. Bailey, E.E. and Williams, J.R. (1988) ‘Sources of economic rent in the deregulated airline
industry’, Journal of Law and Economics, April, Vol. 31, No. 1, pp.173–202. Bond, D. (2003) ‘Traffic on the treadmill’, Aviation Week and Space Technology, 11 August,
Vol. 159, No. 6, pp.42–43. Bradley, M. (1980) ‘Interfirm tender offers and the market for corporate control’, Journal of
Business, October, Vol. 53, No. 4, pp.345–376. Brealey, R.A., Myers, S.C. and Allen, F. (2006) Principles of Corporate Finance, 8th ed.,
McGraw-Hill, New York. Brown, S.J. and Warner, J.B. (1980) ‘Measuring security price performance’, Journal of Financial
Economics, Vol. 8, No. 3, pp.205–258. Brown, S.J. and Warner, J.B. (1985) ‘Using daily stock returns: the case of event studies’, Journal
of Financial Economics, Vol. 14, No. 1, pp.5–31. Brueckner, J. and Spiller, P.T. (1991) ‘Competition and mergers in airline networks’, International
Journal of Industrial Organization, Vol. 9, No. 3, pp.323–342. Campbell, J., Lo, A. and Mackinlay, A.C. (1997) The Econometrics of Financial Markets,
Princeton University Press, Princeton, NJ. Chase, G. (2010) Industry Overview: Consolidation Headlines a Positive, 8 April, Barclays
Capital, New York. Clougherty, J. (2002) ‘US domestic airline mergers: the neglected international determinants’,
International Journal of Industrial Organization, Vol. 20, No. 4, pp.557–576. Flouris, T. and Swidler, S. (2004) ‘American airlines’ takeover of TWA: an ex-post analysis of
financial market information’, Journal of Air Transport Management, Vol. 10, No. 3, pp.173–180.
Francis, L., Flottau, J. and Schofield, A. (2011) ‘Winds of change: carriers hope persistent demand will help mitigate high fuel prices’, Aviation Week and Space Technology, 13 June, Vol. 173, No. 21, pp.28–29.
Haddad, C. (2003) ‘Catch him if you can’, Business Week, 15 September, pp.93–94. Halpern, P. (1983) ‘Corporate acquisitions: a theory of special cases? A review of event studies
applied to acquisitions’, The Journal of Finance, Vol. 38, No. 2, pp.297–317. Hanlon, P. (2007) Global Airlines: Competition in a Transnational Industry, Elsevier, New York. Haugen, R.A. and Langetieg, T.C. (1975) ‘An empirical test for synergism in merger’, The Journal
of Finance, Vol. 30, No. 4, pp.1003–1014. Israel, R. (1991) ‘Capital structure and the market for corporate control: the defensive role of debt
financing’, The Journal of Finance, Vol. 46, No. 4, pp.1391–1409.
Southwest’s acquisition of AirTran 239
JD Powers and Associates (2011) ‘Customer satisfaction with airlines increases for a second consecutive year, but gains are tempered by dissatisfaction with costs and fees among traditional network carriers’, Press Release, 8 June 2011.
Jones, G. and Jones, G.P. (1999) US Airways, Ian Allan, Shepperton, UK. Kim, E.H. and Singal, V. (1993) ‘Mergers and market power: evidence from the airline industry’,
American Economic Review, Vol. 83, No. 3, pp.549–569. Lang, L.H.P. (2000) ‘HSBC’s Acquisition of Midland Bank’, in Cases of Mergers and
Acquisitions, pp.165–192, Prentice-Hall, Hong Kong. Levine, M. (1987) ‘Airline competition in deregulated markets: theory, firm strategy, and public
policy’, Yale Journal on Regulation, Vol. 4, No. 1, pp.393–494. Malatesta, P.H. (1983) ‘The wealth effect of merger activity and the objective function of merging
firms’, Journal of Financial Economics, Vol. 11, Nos. 1–4, pp.155–181. Mandelker, G. (1974) ‘Risk and return: the case of merging firms’, Journal of Financial
Economics, Vol. 1, No. 4, pp.303–335. Singal, V. (1996) ‘Airline mergers and competition: an integration of stock and product price
effects’, Journal of Business, Vol. 69, No. 2, pp.233–268. Steffy, L. (2007) Airline Mergers Usually Don’t Fly, Houston Chronicle online edition [online]
http://www.chron.com/disp/story.mpl/bussiness/steffy/5309876.html (accessed 1 December 2009).
Taneja, N.K. (2003) Airline Survival Kit: Breaking Out of the Zero Profit Game, Ashgate: Aldershot, UK.
Turner, S. and Morrell, P. (2003) ‘An evaluation of airline beta values and their application in calculating the cost of equity capital’, Journal of Air Transport Management, Vol. 9, No. 4, pp.201–209.
US Government Accountability Office (2005) Commercial Aviation: Structural Costs Continue to Challenge Legacy Airlines’ Financial Performance, GAO-05-834T, 13 July, Washington, DC [online] http://www.gao.gov/products/GAO-05-834T (accessed 1 December 2009).
Varaiya, N.P. (1986) ‘An empirical investigation of the bidding firm’s gains from corporate takeovers’, Research in Finance, Vol. 6, No. 1, pp.149–178.
240 W.S. Manuela Jr. and D.L. Rhoades
Appendix 1
Table A1 Southwest’s DARs and CARs around the merger announcement date
Day DAR CAR Day DAR CAR
–60 –0.008 –0.008 0 0.093*** 0.090** –59 –0.017 –0.025 1 –0.013 0.077* –58 –0.017 –0.041* 2 –0.001 0.076* –57 0.031** –0.010 3 –0.006 0.070* –56 0.003 –0.007 4 –0.014 0.056 –55 0.007 –0.001 5 –0.001 0.054 –54 0.023** 0.022 6 –0.005 0.049 –53 0.004 0.026 7 –0.005 0.044 –52 –0.003 0.023 8 –0.003 0.041 –51 –0.004 0.019 9 0.006 0.047 –50 0.007 0.026 10 –0.014 0.033 –49 –0.028** –0.002 11 0.006 0.039 –48 –0.014 –0.016 12 –0.009 0.031 –47 0.004 –0.012 13 –0.005 0.026 –46 0.006 –0.006 14 0.005 0.031 –45 0.003 –0.003 15 –0.002 0.029 –44 0.009 0.006 16 –0.009 0.019 –43 –0.005 0.001 17 0.027** 0.046 –42 0.008 0.009 18 0.033*** 0.079 –41 0.004 0.013 19 –0.013 0.066 –40 0.003 0.016 20 0.003 0.069 –39 0.000 0.016 21 0.002 0.071* –38 –0.015 0.001 22 0.017 0.088** –37 0.001 0.002 23 –0.001 0.087** –36 –0.006 –0.004 24 0.000 0.087** –35 –0.005 –0.010 25 0.007 0.094** –34 0.010 0.001 26 0.007 0.101** –33 –0.013 –0.012 27 –0.002 0.100** –32 –0.011 –0.024 28 –0.010 0.090** –31 0.005 –0.018 29 –0.007 0.082* –30 0.001 –0.017 30 0.007 0.089** –29 –0.005 –0.022 31 –0.015 0.074* –28 0.002 –0.020 32 –0.022* 0.053
Notes: This table shows the statistical significance of the DARs and CARs of Southwest’s share prices ± 60 trading days around the merger announcement date. Three (***) asterisks indicate that the abnormal return is significant at the 1% level (highly significant), two (**) asterisks at the 5% level, and one (*) asterisk at the 10% level.
Southwest’s acquisition of AirTran 241
Table A1 Southwest’s DARs and CARs around the merger announcement date (continued)
Day DAR CAR Day DAR CAR
–27 0.002 –0.018 33 0.004 0.057 –26 –0.013 –0.031 34 0.002 0.059 –25 0.010 –0.021 35 –0.002 0.057 –24 –0.015 –0.037 36 0.001 0.057 –23 0.011 –0.026 37 0.001 0.058 –22 –0.010 –0.035 38 0.003 0.061 –21 –0.003 –0.039* 39 –0.002 0.060 –20 0.012 –0.027 40 0.007 0.066 –19 0.002 –0.024 41 –0.002 0.064 –18 0.005 –0.019 42 0.010 0.074* –17 0.011 –0.008 43 –0.009 0.066 –16 –0.006 –0.015 44 0.003 0.068 –15 –0.010 –0.024 45 –0.011 0.058 –14 0.000 –0.024 46 –0.014 0.043 –13 0.000 –0.024 47 –0.023** 0.020 –12 –0.007 –0.032 48 –0.009 0.012 –11 –0.001 –0.033 49 –0.013 –0.002 –10 –0.015 –0.048* 50 –0.005 –0.007 –9 0.002 –0.045* 51 –0.014 –0.020 –8 0.023** –0.023 52 –0.002 –0.022 –7 0.013 –0.010 53 –0.002 –0.024 –6 –0.011 –0.021 54 –0.005 –0.029 –5 0.014 –0.007 55 0.002 –0.027 –4 0.002 –0.005 56 –0.017 –0.043* –3 –0.002 –0.007 57 –0.003 –0.046* –2 –0.009 –0.016 58 0.022* –0.024 –1 0.013 –0.003 59 –0.002 –0.026 60 0.006 –0.019
Notes: This table shows the statistical significance of the DARs and CARs of Southwest’s share prices ± 60 trading days around the merger announcement date. Three (***) asterisks indicate that the abnormal return is significant at the 1% level (highly significant), two (**) asterisks at the 5% level, and one (*) asterisk at the 10% level.
242 W.S. Manuela Jr. and D.L. Rhoades
Appendix 2
Table A2 Southwest’s DARs and CARs around the merger date
Day DAR CAR Day DAR CAR
–60 0.007 0.007 0 –0.010 –0.031 –59 0.001 0.008 1 –0.003 –0.034 –58 0.019* 0.026 2 0.016 –0.019 –57 0.009 0.035 3 0.032*** 0.014 –56 0.010 0.046 4 0.013 0.027 –55 0.003 0.048 5 –0.014 0.013 –54 0.001 0.049 6 0.000 0.013 –53 –0.019 0.030 7 0.014 0.028 –52 0.018* 0.048 8 –0.005 0.023 –51 –0.005 0.043 9 0.002 0.025 –50 0.007 0.050 10 0.011 0.036 –49 0.004 0.053 11 0.008 0.044 –48 –0.034*** 0.019 12 –0.005 0.039 –47 –0.009 0.010 13 0.008 0.048 –46 0.007 0.017 14 –0.003 0.045 –45 –0.008 0.009 15 0.001 0.046 –44 –0.003 0.006 16 –0.013 0.033 –43 0.006 0.012 17 –0.014 0.019 –42 –0.014 –0.001 18 –0.008 0.011 –41 0.001 0.000 19 –0.001 0.010 –40 0.009 0.009 20 –0.011 0.000 –39 0.006 0.015 21 0.002 0.002 –38 0.067*** 0.081* 22 –0.001 0.002 –37 –0.026** 0.055 23 0.009 0.010 –36 0.034*** 0.089* 24 –0.018 –0.007 –35 0.011 0.100** 25 0.011 0.003 –34 –0.019 0.081* 26 –0.019 –0.015 –33 0.010 0.090* 27 –0.010 –0.025 –32 –0.010 0.081* 28 0.003 –0.022 –31 –0.028** 0.053 29 –0.001 –0.023 –30 0.025** 0.078* 30 0.002 –0.021 –29 –0.008** 0.070 31 –0.011 –0.032 –28 0.007 0.077* 32 –0.002 –0.034
Notes: This table shows the statistical significance of the DARs and CARs of Southwest’s share prices ± 60 trading days around the merger date. Three (***) asterisks indicate that the abnormal return is significant at the 1% level (highly significant), two (**) asterisks at the 5% level, and one (*) asterisk at the 10% level.
Southwest’s acquisition of AirTran 243
Table A2 Southwest’s DARs and CARs around the merger date (continued)
Day DAR CAR Day DAR CAR
–27 0.005 0.082* 33 0.013 –0.021 –26 0.000 0.082* 34 0.004 –0.018 –25 0.008 0.090* 35 –0.003 –0.020 –24 –0.005 0.085* 36 –0.006 –0.026 –23 –0.013 0.072 37 0.038*** 0.012 –22 0.017* 0.090* 38 0.007 0.019 –21 –0.012 0.078* 39 –0.007 0.013 –20 –0.002 0.076* 40 –0.009 0.003 –19 –0.017 0.059 41 –0.012 –0.008 –18 –0.021* 0.038 42 –0.007 –0.016 –17 –0.006 0.032 43 0.005 –0.011 –16 –0.027** 0.005 44 –0.020* –0.031 –15 –0.006 –0.002 45 0.004 –0.027 –14 0.011 0.010 46 0.004 –0.023 –13 0.013 0.023 47 –0.013 –0.036 –12 –0.008 0.015 48 –0.012 –0.048 –11 –0.013 0.002 49 –0.007 –0.055 –10 –0.001 0.001 50 –0.006 –0.061* –9 0.004 0.005 51 –0.005 –0.066* –8 –0.004 0.001 52 –0.008 –0.075* –7 –0.008 –0.008 53 –0.016 –0.091** –6 –0.033** –0.040 54 –0.005 –0.096** –5 0.019* –0.021 55 –0.008 –0.104** –4 0.006 –0.015 56 –0.015 –0.119*** –3 0.001 –0.014 57 –0.006 –0.125*** –2 0.000 –0.014 58 –0.012 –0.136*** –1 –0.007 –0.021 59 –0.008 –0.144*** 60 0.003 –0.141***
Notes: This table shows the statistical significance of the DARs and CARs of Southwest’s share prices ± 60 trading days around the merger date. Three (***) asterisks indicate that the abnormal return is significant at the 1% level (highly significant), two (**) asterisks at the 5% level, and one (*) asterisk at the 10% level.
244 W.S. Manuela Jr. and D.L. Rhoades
Appendix 3
Table A3 AirTran’s DARs and CARs around the merger announcement date
Day DAR CAR Day DAR CAR
–60 0.003 0.003 0 0.619*** 0.455 –59 –0.014 –0.011 1 –0.006 0.448 –58 –0.031 –0.041 2 0.004 0.452 –57 0.012 –0.029 3 0.004 0.457 –56 –0.003 –0.033 4 –0.006 0.451 –55 0.017 –0.015 5 0.008 0.459 –54 –0.021 –0.036 6 –0.019 0.440 –53 –0.005 –0.041 7 –0.002 0.438 –52 0.006 –0.035 8 0.003 0.441 –51 –0.009 –0.044 9 –0.003 0.437 –50 –0.006 –0.050 10 –0.003 0.434 –49 –0.008 –0.058 11 –0.004 0.430 –48 0.020 –0.038 12 –0.002 0.429 –47 –0.018 –0.056 13 0.002 0.431 –46 –0.035 –0.091 14 0.001 0.432 –45 –0.004 –0.095 15 –0.009 0.423 –44 0.004 –0.091 16 0.015 0.438 –43 –0.007 –0.098 17 –0.002 0.435 –42 –0.010 –0.108 18 0.005 0.440 –41 0.026 –0.083 19 –0.001 0.439 –40 0.013 –0.070 20 –0.001 0.438 –39 0.001 –0.069 21 –0.007 0.432 –38 –0.020 –0.089 22 0.001 0.433 –37 –0.012 –0.101 23 –0.005 0.428 –36 –0.013 –0.115 24 –0.001 0.427 –35 –0.007 –0.121 25 0.000 0.427 –34 –0.001 –0.123 26 –0.005 0.422 –33 0.006 –0.117 27 0.002 0.424 –32 0.003 –0.114 28 –0.019 0.405 –31 0.010 –0.104 29 –0.004 0.401 –30 0.004 –0.100 30 0.002 0.403 –29 –0.004 –0.105 31 0.005 0.408 –28 0.014 –0.091 32 –0.008 0.400 –27 0.020 –0.071 33 0.004 0.404
Notes: This table shows the statistical significance of the DARs and CARs of AirTran’s share prices ± 60 trading days around the merger announcement date. Three (***) asterisks indicate that the abnormal return is significant at the 1% level (highly significant) and one (*) asterisk at the 10% level.
Southwest’s acquisition of AirTran 245
Table A3 AirTran’s DARs and CARs around the merger announcement date (continued)
Day DAR CAR Day DAR CAR
–26 –0.002 –0.073 34 0.010 0.415 –25 –0.003 –0.075 35 0.004 0.419 –24 –0.009 –0.084 36 0.014 0.432 –23 –0.020 –0.105 37 0.000 0.432 –22 0.012 –0.092 38 –0.013 0.419 –21 –0.001 –0.093 39 0.000 0.419 –20 0.001 –0.092 40 0.004 0.424 –19 0.006 –0.086 41 0.009 0.433 –18 0.000 –0.086 42 –0.014 0.419 –17 0.002 –0.085 43 0.005 0.424 –16 –0.011 –0.096 44 0.008 0.432 –15 0.010 –0.086 45 0.002 0.434 –14 –0.022 –0.108 46 –0.019 0.415 –13 –0.017 –0.125 47 –0.013 0.402 –12 –0.055 –0.181* 48 –0.003 0.400 –11 –0.021 –0.202* 49 0.000 0.400 –10 0.001 –0.201* 50 –0.001 0.399 –9 0.024 –0.177* 51 –0.009 0.390 –8 0.017 –0.160 52 0.000 0.390 –7 –0.011 –0.171 53 –0.003 0.387 –6 –0.021 –0.192* 54 –0.007 0.380 –5 0.015 –0.177* 55 –0.002 0.378 –4 0.003 –0.175 56 0.000 0.378 –3 –0.013 –0.188* 57 –0.003 0.374 –2 0.008 –0.179* 58 0.007 0.381 –1 0.015 –0.164 59 –0.005 0.376 60 –0.006 0.370
Notes: This table shows the statistical significance of the DARs and CARs of AirTran’s share prices ± 60 trading days around the merger announcement date. Three (***) asterisks indicate that the abnormal return is significant at the 1% level (highly significant) and one (*) asterisk at the 10% level.
246 W.S. Manuela Jr. and D.L. Rhoades
Appendix 4
Table A4 AirTran’s DARs and CARs before the merger date
Day DAR CAR Day DAR CAR
–60 0.000 0.001 –30 –0.022** 0.005* –59 0.004 –0.006 –29 –0.010 –0.003 –58 –0.007 –0.006 –28 0.007 –0.006 –57 –0.005 –0.009 –27 0.003 –0.007 –56 0.001 –0.012 –26 –0.007 –0.013 –55 –0.002 –0.011 –25 0.005 –0.006 –54 –0.022** –0.014 –24 –0.006 –0.010 –53 0.003 –0.015 –23 –0.002 –0.019 –52 –0.003 –0.010 –22 –0.007 –0.019 –51 –0.010 –0.018 –21 0.013 –0.013 –50 0.005 –0.017 –20 0.002 –0.016 –49 0.010 –0.022 –19 –0.005 –0.025 –48 0.042*** –0.018 –18 0.011 –0.024 –47 0.029** –0.012 –17 0.002 –0.024 –46 –0.016 –0.010 –16 0.009 –0.031 –45 –0.013 –0.021 –15 0.020* –0.035* –44 –0.001 –0.025 –14 0.000 –0.027 –43 0.030** –0.011 –13 –0.012 –0.018 –42 0.009 –0.012 –12 0.011 –0.020 –41 –0.025** –0.029 –11 0.008 –0.022 –40 0.012 –0.023 –10 0.001 –0.025 –39 0.001 –0.014 –9 0.003 –0.017 –38 –0.032*** –0.009 –8 –0.003 –0.023 –37 0.010 –0.012 –7 –0.008 –0.037* –36 –0.003 0.006* –6 0.002 –0.044** –35 0.002 0.010** –5 0.001 –0.029 –34 0.011 0.010** –4 –0.018* –0.030 –33 0.003 0.019*** –3 –0.003 –0.033 –32 0.019* 0.029*** –2 0.003 –0.038* –31 0.016 0.011** –1 –0.017* –0.044**
Notes: This table shows the statistical significance of the DARs and CARs of AirTran’s share prices 60 trading days before the merger date. Three (***) asterisks indicate that the abnormal return is significant at the 1% level (highly significant), two (**) asterisks at the 5% level, and one (*) asterisk at the 10% level.