International Corporate Governance and Corporate Cash Holdings
Upload
independentCategory
view
1download
0
South East Asian Corporate Board Size
Richard Heaney School of Economics, Finance and Marketing, RMIT University
Abstract There is few papers that analyse South East Asian firm board size and this paper adds to this literature; focusing on the larger listed firms in Hong Kong, Indonesia, Malaysia, the Philippines, Singapore and Thailand. While it is apparent that large firms have large boards there is also more subtle cross-country variation concerning the impact of leverage and profitability on board size. Finally, there is evidence of decreases in average board size for firms in Hong Kong and Singapore over the sample period, 1999 to 2002, with increases in average board size evident for Indonesian and Malaysian firms over the same period. Key Words: corporate governance, board size. JEL Classification: F02, G32, G34 Acknowledgements I Acknowledge RMIT (RIF/VRII grants scheme 2004) and the Melbourne Centre for Financial Studies (MCFS grant 17/2005) for funding research assistance and data. Thanks also go to Bureau van Dijk, the suppliers of OSIRIS; without the pdf copies of annual reports this analysis would not have been possible. I also thank Ami Bobe, Belete Bobe, John Fowler, Paul Holmquist, Vineet Kapour, Atul Kumar, Vineet Tawani and Thanh Truong for their much valued research assistance.
1. Introduction
The choice of the most appropriate number of directors for a firm’s board of
directors is a difficult decision. Yet, there is little investigation into the determinants
of board size (Lehn, Patro, & Zhao, 2003), particularly for South East Asian nations.
Further, it has been argued that weak governance contributed to the depth of the Asian
crisis (Clarke, 2000; Du & Dai, 2005). This paper provides some insight into post
1997 Asian crisis board size decision made by large firms listed on the stock
exchanges of Hong Kong, Indonesia, Malaysia, the Philippines, Singapore and
Thailand over the period from 1999 to 2002.
It is common to read in the popular press about the benefits of smaller boards
(Yermack, 1996). Smaller boards are said to encourage discussion of important issues
rather than compliance with CEO recommendations. It has also been suggested that
directors on smaller boards are less risk averse and that they react more quickly to
changing market conditions (Lipton & Lorsch, 1992). Indeed, Lipton and Lorsch
recommended an optimal board size of 8 to 9 directors with a maximum of 10
directors. Yet, there are arguments to suggest that board size choice is endogenous to
the firm (Hermalin & Weisbach, 2003) and recent economic modelling shows that the
level of equity agency costs and information asymmetry specific to a firm may
explain variation in board size across firms (Harris & Raviv, 2005; Raheja, 2005).
Further, while research suggests that one board size need not fit all firms, much of the
research dealing with this issue focuses on USA or the UK firms, with little research
specifically addressing the Asian firm board size question.
As the focus of this paper is the board of directors, separate director lists are
constructed where feasible for each of the firms for each of the years 1999 to 2002.
Accounting data and other firm specific data is also collected for control purposes.

Both the accounting data and the director lists are obtained from OSIRIS, supplied by
Bureau van Dijk.1 This database provides information on a range of listed firms
around the world and is available in both electronic form for selected accounting
numbers and pdf form for copies of the underlying annual reports.
Because board size is essentially a count of the number of directors on the
board, ordered logit is used in all multivariate analysis and the results of analysis
show that larger firms have larger boards, leverage is also a determinant of board size
in some of the countries and industry effect account for a considerable amount of the
variation in board size. There is some evidence of time trends in board size across the
sample with board size increasing in some countries and decreasing in other countries
over the study period. A review of the literature follows in Section 2 and data is
described in Section 3. The results of analysis are reported in section 4 and a
summary and conclusions are reported Section 5.
2. Literature Review
While there is considerable empirical literature describing corporate boards
and proposing possible explanations for what is observed (Yermack, 1996) analytical
modelling has been less prominent in the analysis of board size. Recent analytical
modelling draws upon the equity agency and information asymmetry theories of
corporate finance (Harris & Raviv, 1991; Jensen & Meckling, 1976; Myers & Majluf,
1984) and provides considerable insights into the board size decision (Harris et al.,
2005; Raheja, 2005). Further, there has also been some empirical support for the
predictions of these models (Boone, Field, Karpoff, & Raheja, 2004; Lehn et al.,
2003).
1 http://www.bvdep.com/

While the Harris and Raviv (1991) model is primarily concerned with the split
between inside (manager controlled) directors and outside (owner controlled)
directors it does provide insight into the choice of board size. It is shown that in
equilibrium there is a balance between inside and outside directors with the number of
outside directors being determined by the expertise that each additional director brings
to the board compared with the cost arising from free riding that occurs with
appointment of an additional director. It is apparent that some firms need a large
board to ensure sufficient expertise to adequately monitor management. Other firms
function efficiently with quite small boards. Indeed, Harris and Raviv show, under
fairly reasonable assumptions, the size of the board of directors is endogenous to the
firm. This is supported in the work of Raheja (2005) who provides similar results to
those of Harris and Raviv (2005). In their model, board size and board composition
are jointly determined by verification costs for outsiders (information asymmetry
costs) and the private benefits that arise from the implementation of inferior projects
for insiders (equity agency costs). Where closer monitoring is required due to greater
levels of potential agency conflicts, the optimal level of outsiders on the board tends
to increase. One result, highlighted in this literature, occurs where information
asymmetry is so severe that the owners of the firm find it optimal to pass control of
the firm to management. Essentially the costs of poorly informed owners running the
firm exceed the equity agency costs associated with management control of the firm.
It seems clear that reducing the size of the board will not necessarily improve
firm performance. Indeed, firms with substantial equity agency costs and little
information asymmetry may optimally select large boards to ensure adequate
monitoring of management while severe information asymmetry could result in small
manager controlled boards. Recent empirical tests of these models, based on USA

firms, identify a positive relation between equity agency cost proxies and the size of
the board of directors and a negative relation between information asymmetry proxies
and the size of the board of directors (Boone et al., 2004; Lehn et al., 2003).
Neither of these models deals with the situation where the owner also controls
the firm. In this case, equity agency costs and information asymmetry costs are low,
because the owner of the firm actually manages the firm. Because there is no
monitoring role for the board, the optimal board size is expected to be considerably
smaller for shareholder-managed firms, relative to firms with clear separation of
ownership and control. While it may be difficult to ascertain why the owner of a firm
might choose to also manage the firm, this situation is relatively common with South
East Asian firms (Claessens, Djankov, Fan, & Lang, 2002; Claessens, Djankov, &
Lang, 2000; La Porta, Lopez-De-Silanes, & Shleifer, 1999; La Porta, Lopez-de-
Silanes, Shleifer, & Vishny, 2000). Further, tightly controlled ownership of listed
firms (one to three controlling shareholders) is evident throughout world financial
markets (La Porta, Lopez-de-Silanes, Shleifer, & Vishny, 1998).
There has been some research into issues important to South East Asian firm
governance (Abdullah, 2004; Brewer, 1997; Clarke, 2000; Ong, 2003; Ow-Yong
2000) though there is little reference to the determinants of board size in this
literature. One exception is the analysis of Singapore boards (Mak & Chng, 2000;
Mak & Yuan, 2001) based on data drawn from the period, 1991 to 1995. It is found
that board size is negatively correlated with the proportion of outsiders on the board in
this analysis. While this result is at odds with more recent analysis (Boone et al.,
2004; Lehn et al., 2003) Mak and Yuan suggest that this arises from the unique
features of the Singapore firms at the time of the study. No other variables are found
to be statistically significantly related with board size in the Mak and Yuan study and,

given recent developments since the Asian crisis, it is important to revisit this
question for Singapore and also to analyse the variation that might exist in board size
for firms listed on other South East Asian stock exchanges.
3. Data
Board size and other firm specific data are collected for the largest 150 or so
firms listed on the stock exchanges of Hong Kong, Indonesia, Malaysia, Philippines,
Singapore and Thailand over the period from 1999 to 2002.2 For the Indonesian firms
we focus only on the board of commissioners and ignore the board of directors who
are supervised by the board of commissioners and who are usually entrusted with the
day to day management of the firm. The list of directors3 is manually entered from
pdf versions of the original annual reports underlying the OSIRIS database obtained
from Bureau Van Dijk (http://www.bvdep.com/) while the exogenous accounting data
based variables are downloaded from the OSIRIS database in electronic form.
An initial list of the largest firms in each of the markets is compiled for the
year ended 2002 (from the 2003 OSIRIS data disk). Where the information is
available, director lists are then manually collected for these firms for each of the
years, 1999, 2000, 2001 and 2002. There are a number of firms with missing data,
particularly missing annual report pdf files and incomplete OSIRIS market values or
accounting information. Descriptive statistics for board size are reported in Table 1
for each of the countries and for the years 1999 through 2002. There are some trends
evident in the data with increasing average board size over the four-year period for
2 The actual number of firms included in the sample depended on availability of data and size of the firm. 3 The director count is based on the individuals listed on the directors’ report appearing in the annual report for each firm. Alternate directors are excluded from the analysis to avoid double counting and the secretary is not included in the count unless the individual is specifically identified as holding the position of director as well as that of secretary.

Indonesia and Malaysia and decreasing average board size for Hong Kong,
Philippines, Singapore and Thailand over the same period. The standard deviation in
board size varies from around 2 board members for Singapore to around 4 board
members for Thailand. Board size ranges from 1 through 26 individual directors in a
board across the six countries.
[Insert Table 1 about here]
The variables used to capture equity agency cost and information asymmetry
are limited by data availability, particularly for Thailand and Indonesia, though it is
feasible to select a set of variables with reasonable coverage of the firms within each
of the countries. The empirical literature identifies firm size as a proxy for equity
agency costs (Lehn et al., 2003) though this could also proxy for complexity or access
to resources (Boone et al., 2004; Coles, Daniel, & Naveen, 2004). Regardless, a
positive relation is predicted between board size and firm size. While market value
based information is limited for many of the firms in the sample, total assets is
available on OSIRIS for virtually all of the firms and so the natural log of total assets
is chosen as a proxy for size to capture the impact of equity agency costs,
complexity or resource access.
( itLTA )
The level of equity agency conflicts is also related to shareholder
concentration. The more concentrated the shareholding, the lower the equity agency
conflicts because as an individual shareholder’s stake in the firm increases, eventually
the shareholder reaches a stage where they both control and manage the firm. Of
course concentrated shareholding can result in entrenchment effects with consequent
decrease in the value of the firm. The OSIRIS independence indicator provides one
measure of ownership concentration. This indicator focuses on ultimate control of the

firm and may take on values of A, B, C, U 4 or missing. The independence indicator
is coded with an A, if there is no shareholder in the firm with a total shareholding
(direct or indirect) greater that 24.99%. In this case the ownership of the firm is fairly
dispersed with considerable opportunity for equity agency conflicts. The indicator is
coded with a B if there is one or more shareholder in the firm with a total
shareholding (direct or indirect) exceeding 24.99% but not greater that 49.99%.
These shareholders will tend to control the firm and so equity agency conflicts are less
likely for this group. If the indicator has a value of C then there is one shareholder in
the firm with a total shareholding (direct or indirect) exceeding 49.99%. Equity
agency costs would not ordinarily be a problem with this classification as the owner
of the firm also controls the day-to-day decisions that govern the behaviour of the
firm. Finally, the independence indicator is set equal to U where the level of
independence cannot be determined. Each of these independence indicator values is
allocated a dummy variable, ( )iAOSIRIS _ , ( )iBOSIRIS _ , ( )iCOSIRIS _ and
with a value of one if this is the independence indicator for the firm
and zero otherwise. Holding the level of information asymmetry constant, it is
expected that the board size will be smallest where the OSIRIS indicator takes a value
of C, consistent with a shareholder owning and controlling the management of the
firm. The board size may tend to be larger where the indicator takes a value of B with
somewhat more dispersed ownership though it will be greatest with dispersed
shareholding and this is most evident with firm classified under the OSIRIS
independence indicator value of C.
( iUOSIRIS _ )
Information asymmetry is generally highest for firms with growth options
because shareholders rarely have sufficient information available to them to
4 There are some firms for which an OSIRIS indicator is not allocated and so it is possible for this variable to be missing for some firms.

accurately monitor the management of these options. They must rely on expert
management to exercise these options in the most efficient way. While market to
book and R&D to sales ratios are often used to capture the level of growth options in a
firm this data is not available for most of the firms in the sample. As a result, industry
dummy variables ( )jIND are included in the model to proxy for information
asymmetry effects. There are 10 broad SIC industry groupings used to identify
variation in industries across the firms in the sample. For example is expected that
manufacturing firms exhibit lower levels of information asymmetry than mining
firms, particularly those focusing on mining exploration and development. For this
reason the manufacturing industry dummy variable is excluded from analysis to
facilitate comparisons with this industry.
Another proxy for information asymmetry is the return on total
assets . Value firms tend to generate greater levels of cash flow and earnings
than growth firms. Further, value firms tend to exhibit lower levels of information
asymmetry than growth firms. Thus, measures of profitability may also proxy for the
level of information asymmetry that exists within the firm. In this case it is assumed
that the greater the profitability the lower the level of growth options and thus the
larger the board, all else constant.
( itROTA )
)
Banking and creditor relationships are recognised as being important (Coles et
al., 2004), particularly in the management of South East Asian firms (Claessens &
Fan, 2002; Clarke, 2000) and so a leverage variable is also included in analysis.
Where creditor or banker exposures are particularly large it is possible that boards will
include representation from these parties and so board size may tend to be larger the
greater the level of debt or creditors. The leverage measure is defined as the ratio of
total liabilities to total assets . A positive relation is predicted between ( itLEV

leverage and board size where higher levels of debt and creditors results in larger
boards.
Finally, there has been considerable awareness of governance issues among
the South East Asian nations since the Asian crisis with the development of standards
and rules dealing with the board design. Considerable attention has been directed to
the need for more independent directors, the need for smaller boards and the need for
the separation of the functions of chairman of the board and the chief executive
officer for example. While year-by-year cross-section analysis is provided in the
following discussion, panel data analysis for each of the countries is also reported and
this provides the opportunity to test for time variation in the board size over the period
from 1999 to 2002 using a time trend variable ( )tTIME to identify whether board size
is increasing or decreasing in a statistically significant way.
The results from univariate tests for differences in board size are reported
across small and large firms, high and low leverage firms and high and low return on
asset firms in the last six columns of Table 1. These tests are conducted by first
ranking the firms by the variable of interest, splitting the sample in half and then
conducting a t-test for difference in board size between the large and the small, high
leverage and low leverage and between high and low return on total assets. The size
(LTA) t-test results provide support for the predicted positive relation between firm
size and board size, particularly for Hong Kong, Indonesia and Singapore. There is
also some evidence of a size effect in the later half of the study period for Malaysia.
Neither the Philippines nor Thailand provide much statistical support for a firm size
effects though in virtually all cases the average board size for small firms is less than
the average board size for larger firms. There is very little evidence of statistically
significant leverage or return on total asset effects other than for Singaporean boards.
These t-tests ignore considerable variation in the data and so multivariate analysis is
conducted in the following section.
4. Analysis
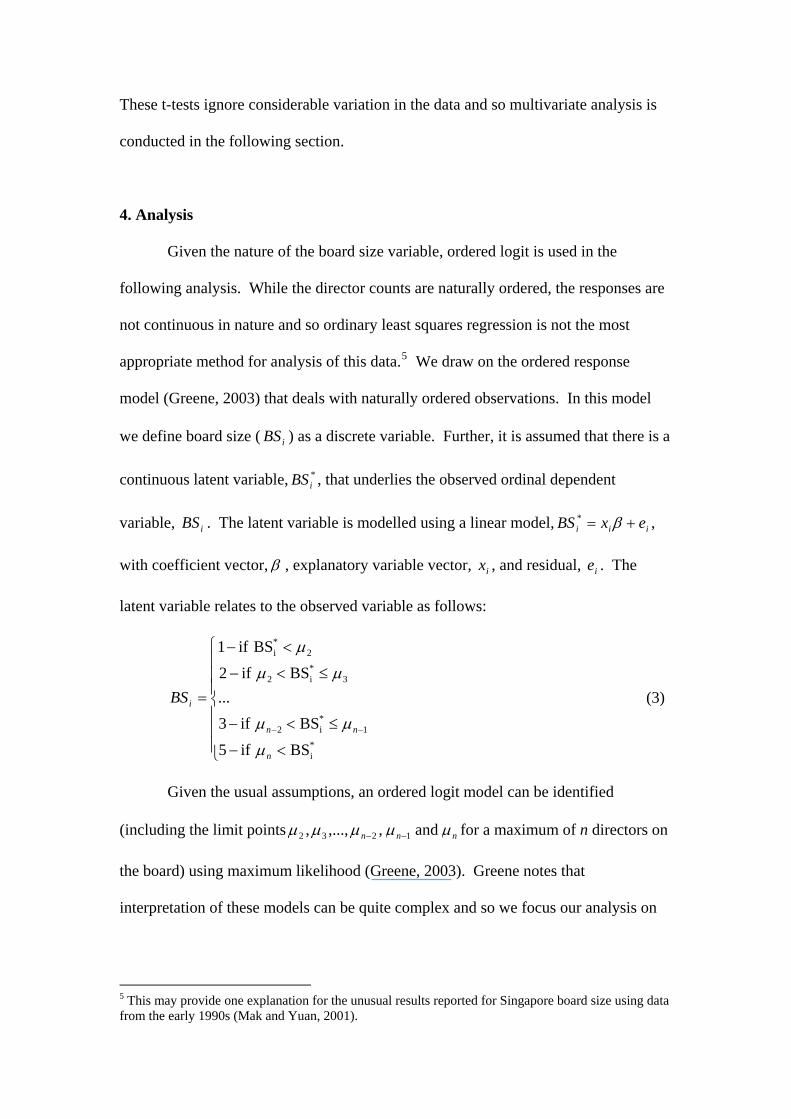
Given the nature of the board size variable, ordered logit is used in the
following analysis. While the director counts are naturally ordered, the responses are
not continuous in nature and so ordinary least squares regression is not the most
appropriate method for analysis of this data.5 We draw on the ordered response
model (Greene, 2003) that deals with naturally ordered observations. In this model
we define board size ( ) as a discrete variable. Further, it is assumed that there is a
continuous latent variable, , that underlies the observed ordinal dependent
variable, . The latent variable is modelled using a linear model, ,
with coefficient vector,
iBS
*iBS
iBS iii exBS += β*
β , explanatory variable vector, , and residual, . The
latent variable relates to the observed variable as follows:
ix ie
⎪⎪⎪
⎩
⎪⎪⎪
⎨
⎧
<−
≤<−
≤<−
<−
=
−−
*i
1*i2
3*i2
2*i
BS if5
BS if3...
BS if2
BS if1
n
nn
iBS
μ
μμ
μμ
μ
(3)
Given the usual assumptions, an ordered logit model can be identified
(including the limit points nnn μμμμμ and ,,...,, 1232 −− for a maximum of n directors on
the board) using maximum likelihood (Greene, 2003). Greene notes that
interpretation of these models can be quite complex and so we focus our analysis on
5 This may provide one explanation for the unusual results reported for Singapore board size using data from the early 1990s (Mak and Yuan, 2001).

the underlying latent variable model (Berman & Fry, 2001). The latent variable linear
model takes the form:
=*itBS
⎪⎩
⎪⎨
⎧
+++
+++++
∑≠=
itjj
jjitit
iiiit
INDLEVROTA
OSIRISUOSIRICOSIRISBLTA
εγαα
αααβαα10
4,176
54321
A time trend variable ( is included in pooled analysis to capture the
impact of trends in board size over the period of the study. This gives the second
model used specifically in pooled analysis.
)tTIME
=*itBS
⎪⎩
⎪⎨
⎧
++++
+++++
∑≠=
itjj
jjtitit
iiit
INDTIMELEVROTA
OSIRISUOSIRISCOSIRISBLTA
εγααα
αααβαα10
4,1876
54321
4.1 Cross-sectional analysis
The results from ordered logit analysis for the individual countries are reported
in Table 2. It should be noted that there were not enough firms with complete data
sets in the Thailand data set for separate analysis for the years, 1999 and 2000.
Further, industry parameters, while estimated as part of the model, are not reported
separately due to the variation across the sample both in terms of parameter sign and
significance.
The main result reported for the year-by-year cross-sectional analysis for each
of the countries is the consistency in the positive relation observed between firm size
and board size (See Table 2). Larger South East Asian firms have larger boards. This
is consistent with the USA results (Boone et al., 2004; Lehn et al., 2003). Further, the
firm size parameter is statistically significant for each of the four years for firms listed
on the Hong Kong, Indonesia, Malaysia, and Singapore stock exchanges. Exceptions
include firms listed in the Philippines, where the estimated positive parameters are not

statistically significant in any of the four years, and in Thailand, where the positive
firm size parameter is not statistically significant in the year 2002.
[Insert Table 2 about here]
The OSIRIS independence indicator parameter estimates vary considerably
across the sample. There are few statistically significant parameters. The exceptions
concern those firms listed in Indonesian, and to a lesser extent firms listed in the
Philippines, where the firms with concentrated shareholding (OSIRISC or OSIRISB)
tend to have statistically significantly larger boards the firms with more diversified
shareholding. This may be linked to the importance of political and military ties in
Indonesian business dealings, particularly where the owner of the business chooses to
allocate board positions to protect their business interests. The OSIRISU dummy
variable is included to adjust for the impact of those firms where there is no OSIRIS
independence indicator calculated.
The estimated parameter for the return on total assets is generally positive and
often statistically significant for Indonesia, Malaysia, Singapore and the Philippines.
Thus, for these countries, more profitable firms tend to have larger boards. Profitable
firms tend to be value firms, rather than growth firms, with low levels of information
asymmetry. Thus for value firms it is expected that directors are better able to
monitor management and so, given this greater monitoring ability, more profitable
firms will optimally select larger boards to facilitate management monitoring (Harris
et al., 2005; Raheja, 2005)
Leverage parameters are often statistically significant, particularly for
Malaysia, Singapore and Thailand where the parameters are generally negative and
for the Philippines where the parameters are positive. Consistent with initial
expectations firms in the Philippines with greater levels of debt tend to have larger

boards. Yet, the predicted positive relation between leverage and board size is not
common amongst the countries in this sample. There is little evidence of statistically
significant leverage parameters for either Hong Kong or Indonesia. Further, for
Malaysia, Singapore and Thailand, board size is actually decreasing in leverage; the
greater the level of debt the smaller the board. It is difficult to explain this dichotomy.
Perhaps, due to political unrest, in the Philippines lenders choose board positions as a
more direct method of surveillance while in the more stable countries this is not
necessary. Further analysis of this question is left to future research.
4.2 Pooled analysis
The pooled ordered logit country analysis appears in Table 3. The positive
relation between firm size and board size is now statistically significant at the 5%
level for each of the countries. The board independence results are also clearer with a
negative relation between board size and shareholder control in Hong Kong and
Thailand where one shareholder controls more than 25% of the shares in the firm.
While this is also true for shareholders in Singapore firms, with shareholders having
more than a 50% stake in the firm, is not apparent for shareholders with a 25% to 50%
stake in the firm. Both Indonesia and the Philippines tend to have larger boards the
more concentrated the shareholding in the firm and this effect is statistically
significant. With more concentrated ownership it is expected that the owners of the
firm would prefer smaller boards yet in Indonesia and the Philippines the reverse
relationship is observed over the period from 1999 to 2002. Perhaps there is a further
element required for board size modelling in emerging markets, particularly during
periods of severe economic and political unrest. It is possible that these boards are
larger because the dominant shareholder group uses board positions to foster political

and business connections in economies where markets are not functioning effectively
or perhaps have failed completely.
[Insert Table 3 about here]
For all the countries except for Thailand there is a positive relation between
profitability and board size and this is statistically significant at the 10% level or
better for Indonesia, Malaysia and the Philippines. More profitable firms tend to have
larger boards. Further, except for the Philippines, the greater the leverage the smaller
the board. Again, it is possible that important lenders and creditors take on board
positions as a method of protecting their investment in countries though this result is
not replicated in Thailand or in Indonesia over the period.
It is also important to note the change in the average size of the board of
directors over the study period. The time trend variable is negative for Hong Kong,
Malaysia, the Philippines and Singapore and statistically significantly so for the
Philippines and Singapore, suggesting a decrease in board size over the period from
1999 to 2002. Yet, for Indonesia this variable has a positive sign. Apparently
Indonesian boards of commissioners have tended to increase in size over the four
years from 1999 to 2002. This increase in board size for Indonesian firms is evident
both in the descriptive statistics (Table 1) and the multivariate analysis (Table 3).
Thus, while there is a general trend towards smaller boards in the sample over the
study period, Indonesia is an important exception. There is also variation in the board
size across the various industry groupings within each country though there is little
consistent pattern in the incidence of statistically significant difference in board size
between the manufacturing sector and other sectors. One exception is the Philippines
where there is no statistically significant difference between the board size in the
manufacturing industry and other industries represented in the sample.

5. Conclusions
The average board for all the firms included in the sample consists of nine
directors and there is considerable variation in board size across the countries
included in the sample. There is also some variation in the average board size of
South East Asian firms over the period from 1999 to 2002 with an increase in board
size for Indonesia and a decrease for the Philippines and Singapore.
Thus there is some evidence to support the prediction that larger firms have
larger boards. Further, firms tend to have larger boards where they earn higher
returns on assets. Yet, the impact of concentrated shareholding and leverage varies
across the countries in the sample. For example, Indonesian Boards of
Commissioners tend to be larger where the firm is large, shareholding is concentrated
and return on assets is high. Further, the boards of directors in Singaporean firms tend
to be smaller where the dominant shareholder holds over 50% of the shares in the
company, where no shareholders own 25% to 50% of the shares and where leverage is
high. While not reported separately board size also varies across industry groupings
for each of the countries except for the Philippines.
References
Abdullah, S. N. 2004. Board composition, CEO duality and performance among
Malaysian listed companies. Corporate Governance, 4(4): 47-61.
Berman, G., & Fry, T. R. L. 2001. A charitable ranking. Economic Papers, 20: 67-80.
Boone, A. L., Field, L. C., Karpoff, J. M., & Raheja, C. G. 2004. The determinants of
corporate board size and composition: An empirical analysis, University of Arkansas:
31. Arkansas.
Brewer, J. 1997. The state of corporate governance in Hong Kong. Journal of
corporate Governance, 5(2): 77-82.
Claessens, S., Djankov, S. D., Fan, J. P. H., & Lang, L. H. P. 2002. Disentangling the
incentive and entrenchment effects of large shareholdings. The Journal of Finance,
52(6): 2741-2771.
Claessens, S., Djankov, S. D., & Lang, L. H. P. 2000. The separation of ownership
and control in East Asian Corporations. Journal of Financial Economics, 58(1-2).
Claessens , S., & Fan, J. P. H. 2002. Corporate governance in Asia: A survey.
International Review of Finance, 3(2): 71-103.
Clarke, T. 2000. Haemorrhaging tigers: the power of the international financial
markets and the weakness of Asian modes of corporate governance. Journal of
Corporate Governance, 8(2): 101-116.
Coles, J., Daniel, N. D., & Naveen, L. 2004. Boards: Does one size fit all? Working
paper: 1-55.

Du, J., & Dai, Y. 2005. Ultimate corporate ownership structures and capital
structures: evidence from East Asian economies. Corporate Governance, 13(1): 60-
71.
Greene, W. H. 2003. Econometric Analysis (5th ed.): Prentice Hall, Upper Saddle
River, NJ.
Harris, M., & Raviv, A. 1991. The Theory of Capital Structure. Journal of Finance,
46(1): 297-355.
Harris, M., & Raviv, A. 2005. A theory of board control and size, University of
Chicago Working Paper: 1-41. Chicago.
Hermalin, B. E., & Weisbach, M. S. 2003. Boards of directors as an endogenously
determined institution: A survey of the economic literature. Economic Policy Review,
9(1): 7-26.
Jensen, M. C., & Meckling, W. H. 1976. Theory of the firm: Managerial behavior,
agency costs and ownership structure. Journal of Financial Economics, 3(4): 305-360.
La Porta, R., Lopez-De-Silanes, F., & Shleifer, A. 1999. Corporate ownership around
the world. The Journal of Finance, 54(2): 471-517.
La Porta, R., Lopez-de-Silanes, F., Shleifer, A., & Vishny, R. 1998. Law and Finance.
Journal of Political Economy, 106(6): 1113-1155.
La Porta, R., Lopez-de-Silanes, F., Shleifer, A., & Vishny, R. 2000. Investor
protection and corporate governance. Journal of Financial Economics, 58(1-2): 3-27.
Lehn, K., Patro, S., & Zhao, M. 2003. Determinants of the size and structure of
corporate boards: 1935-2000, University of Pittsburgh, Joseph M Katz Graduate
School of Management, Working Paper: 44. Pittsburgh.

Lipton, M., & Lorsch, J. W. 1992. A modest proposal for improved corporate
governance. Business Lawyer, 48(1): 59-77.
Mak, Y. T., & Chng, C. K. 2000. Corporate governance practices and disclosures in
Singapore: an update: 1-44. Singapore.
Mak, Y. T., & Yuan, L. 2001. Determinants of corporate ownership and board
structure: evidence from Singapore. Journal of Corporate Finance, 7(3): 235-256.
Myers, S. C., & Majluf, N. C. 1984. Corporate financing and investment decisions
when companies have information that investors do not have. Journal of Financial
Economics, 13(2): 187-221.
Ong, C.-H., Wan David, Ong Kee-Sing. 2003. An explanatory study on interlocking
directorates in listed firms in Singapore. Blackwell Publishing, 11(4): 322-334.
Ow-Yong , K., Guan Cheah Kooi. 2000. Corporate governance codes: a comparison
between Malaysia and the UK. Journal of Corporate Governance, 8(2): 125-132.
Raheja, C. G. 2005. Determinants of board size and composition: A theory of
corporate boards. Journal of Financial and Quantitative Analysis, 42(2): 283-306.
Yermack, D. 1996. Higher market valuation of companies with a small board of
directors. Journal of Financial Economics, 40(2): 185-211.

Table 1, Board size descriptive statistics Board size consists of a count of the number of individual directors that occupy a position on the board at the end of the calendar year. Directors that hold more than one position are counted only once. The company secretary is only included in the count if they are also a director. The statistics are grouped by country and year. NOBS is the number of firms (country and year). Mean is the average board size for the classification. Std. dev. is the standard deviation in board size. Min is the minimum number of directors in a firm. Max. is the maximum number of directors in a firm. Three t-tests are conducted for difference in board size across size (LTA), leverage (LEV) and profitability (ROTA). The sample is sorted by the variable of interest and the average board size for the firms in the upper 50% are compared with the board size of firms in the lower 50% of the sample. The difference between in board size between the top 50% firms and the bottom 50% firms for the variable as well as the probability associated with this test is reported for each of the three variables, t-test prob (LTA), t-test prob (LEV) and t-test prob (ROTA). * (+) statistically significant at the 5%(10%) level of significance
NOBS Mean Std. dev. Min. Max.
Brd. diff(LTV).
t test prb(LTV).
Brd..diff.(LEV)
t test prb. Brd. diff. (LEV) (ROTA)
t test prb.(ROTA).
Hong Kong 1999 68 11.41 3.37 4 19 -3.18 0.00* 0.82 0.33 -0.25 0.76 2000 109 10.92 3.34 5 19 -3.32 0.00* -0.24 0.71 0.64 0.32 2001 145 10.54 3.56 4 19 -3.69 0.00* -0.63 0.29 0.39 0.51 2002 149 10.13 3.56 4 19 -3.38 0.00* -0.54 0.36 -0.14 0.82
Indonesia 1999 180 5.54 2.78 1 18 -1.34 0.05+ -0.90 0.20 -0.35 0.62 2000 179 6.68 3.66 2 20 -3.99 0.00* 0.06 0.95 -0.84 0.39 2001 179 6.79 3.69 2 21 -2.79 0.00* 0.87 0.27 -1.47 0.06+ 2002 180 6.80 3.64 2 20 -2.74 0.00* -0.20 0.71 -0.65 0.23
Malaysia 1999 167 8.44 2.55 1 16 -0.51 0.23 0.12 0.78 0.35 0.41 2000 167 8.35 2.43 1 16 -0.58 0.15 0.22 0.58 -0.15 0.71 2001 167 8.54 2.45 1 19 -0.90 0.02* -0.30 0.45 -0.27 0.49 2002 167 8.63 2.17 1 16 -0.58 0.10+ -0.42 0.24 -0.39 0.27
Philippines 1999 145 10.19 3.49 1 20 -1.76 0.04* -1.05 0.21 -1.33 0.11 2000 146 10.03 3.52 1 20 -0.58 0.34 -0.43 0.48 0.06 0.92 2001 146 10.01 3.46 1 20 -0.45 0.43 -0.49 0.40 -0.53 0.36 2002 146 9.53 2.95 1 19 -0.76 0.15 -0.65 0.22 -0.84 0.11
Singapore 1999 70 8.26 1.91 3 12 -1.97 0.00* -0.47 0.32 1.03 0.03* 2000 117 8.09 1.97 4 13 -1.58 0.00* -0.67 0.07+ 0.71 0.06+ 2001 156 7.50 2.14 3 15 -1.40 0.00* -0.87 0.01* -0.39 0.24 2002 159 7.51 2.11 3 14 -1.47 0.00* -0.66 0.05+ -0.03 0.94
Thailand 1999 17 13.59 3.48 9 22 -3.23 0.18 -0.30 0.91 -1.40 0.55 2000 20 12.75 3.73 7 21 -0.64 0.76 -1.26 0.56 1.52 0.46 2001 37 12.46 3.94 7 24 0.83 0.56 0.42 0.77 0.97 0.51 2002 42 12.55 3.96 8 26 -0.59 0.69 1.29 0.38 0.00 1.00
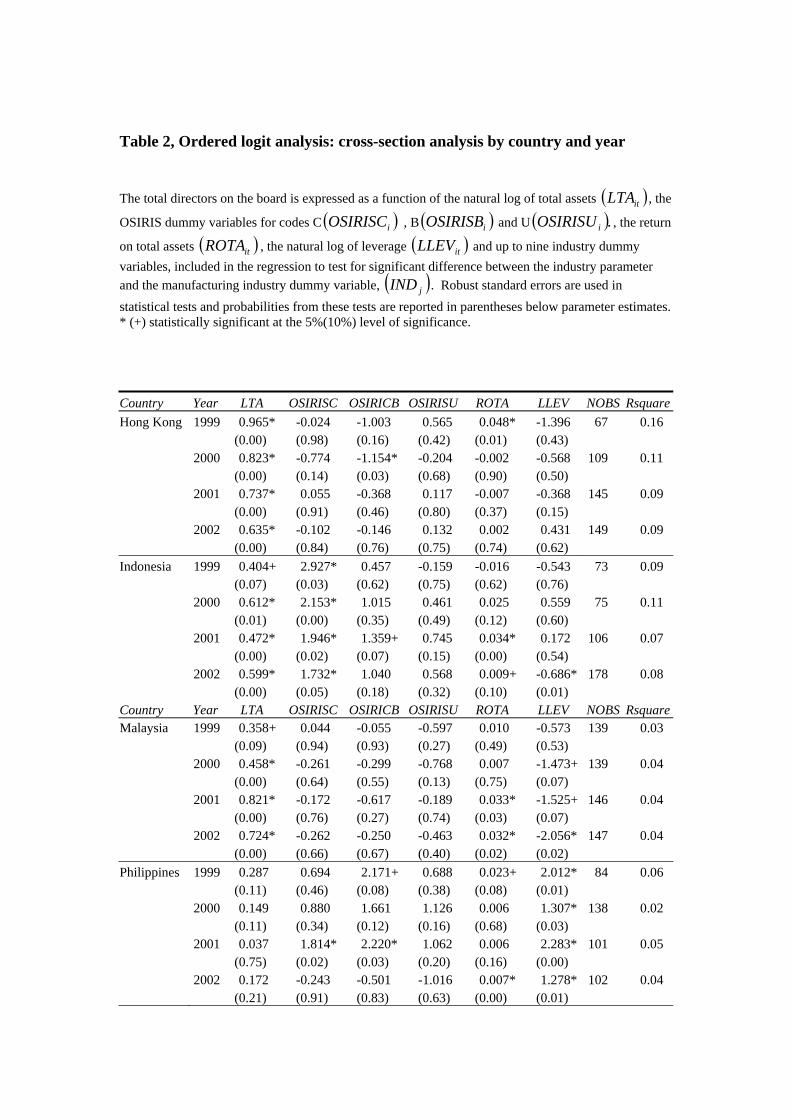
Table 2, Ordered logit analysis: cross-section analysis by country and year The total directors on the board is expressed as a function of the natural log of total assets , the
OSIRIS dummy variables for codes C , B
( )itLTA( )iOSIRISC ( )iOSIRISB and U ( ).iOSIRISU , the return
on total assets , the natural log of leverage ( itROTA ) ( )itLLEV and up to nine industry dummy variables, included in the regression to test for significant difference between the industry parameter and the manufacturing industry dummy variable, ( )jIND . Robust standard errors are used in statistical tests and probabilities from these tests are reported in parentheses below parameter estimates. * (+) statistically significant at the 5%(10%) level of significance. Country Year LTA OSIRISC OSIRICB OSIRISU ROTA LLEV NOBS RsquareHong Kong 1999 0.965* -0.024 -1.003 0.565 0.048* -1.396 67 0.16 (0.00) (0.98) (0.16) (0.42) (0.01) (0.43) 2000 0.823* -0.774 -1.154* -0.204 -0.002 -0.568 109 0.11 (0.00) (0.14) (0.03) (0.68) (0.90) (0.50) 2001 0.737* 0.055 -0.368 0.117 -0.007 -0.368 145 0.09 (0.00) (0.91) (0.46) (0.80) (0.37) (0.15) 2002 0.635* -0.102 -0.146 0.132 0.002 0.431 149 0.09 (0.00) (0.84) (0.76) (0.75) (0.74) (0.62) Indonesia 1999 0.404+ 2.927* 0.457 -0.159 -0.016 -0.543 73 0.09 (0.07) (0.03) (0.62) (0.75) (0.62) (0.76) 2000 0.612* 2.153* 1.015 0.461 0.025 0.559 75 0.11 (0.01) (0.00) (0.35) (0.49) (0.12) (0.60) 2001 0.472* 1.946* 1.359+ 0.745 0.034* 0.172 106 0.07 (0.00) (0.02) (0.07) (0.15) (0.00) (0.54) 2002 0.599* 1.732* 1.040 0.568 0.009+ -0.686* 178 0.08 (0.00) (0.05) (0.18) (0.32) (0.10) (0.01) Country Year LTA OSIRISC OSIRICB OSIRISU ROTA LLEV NOBS RsquareMalaysia 1999 0.358+ 0.044 -0.055 -0.597 0.010 -0.573 139 0.03 (0.09) (0.94) (0.93) (0.27) (0.49) (0.53) 2000 0.458* -0.261 -0.299 -0.768 0.007 -1.473+ 139 0.04 (0.00) (0.64) (0.55) (0.13) (0.75) (0.07) 2001 0.821* -0.172 -0.617 -0.189 0.033* -1.525+ 146 0.04 (0.00) (0.76) (0.27) (0.74) (0.03) (0.07) 2002 0.724* -0.262 -0.250 -0.463 0.032* -2.056* 147 0.04 (0.00) (0.66) (0.67) (0.40) (0.02) (0.02) Philippines 1999 0.287 0.694 2.171+ 0.688 0.023+ 2.012* 84 0.06 (0.11) (0.46) (0.08) (0.38) (0.08) (0.01) 2000 0.149 0.880 1.661 1.126 0.006 1.307* 138 0.02 (0.11) (0.34) (0.12) (0.16) (0.68) (0.03) 2001 0.037 1.814* 2.220* 1.062 0.006 2.283* 101 0.05 (0.75) (0.02) (0.03) (0.20) (0.16) (0.00) 2002 0.172 -0.243 -0.501 -1.016 0.007* 1.278* 102 0.04 (0.21) (0.91) (0.83) (0.63) (0.00) (0.01)

Singapore 1999 0.702* -0.373 0.363 -0.577 0.069 -0.010* 64 0.11 (0.00) (0.59) (0.55) (0.49) (0.10) (0.00) 2000 0.617* -0.458 0.601 -0.163 0.005 -0.010* 110 0.11 (0.00) (0.40) (0.22) (0.73) (0.74) (0.00) 2001 0.752* -0.717 0.619 -0.206 0.011 -0.011* 151 0.12 (0.00) (0.16) (0.18) (0.61) (0.40) (0.00) 2002 0.638* -0.361 0.424 -0.046 0.004 -0.023 152 0.09 (0.00) (0.48) (0.34) (0.91) (0.58) (0.99) Thailand 2001 1.150* 0.347 -0.104 2.965 -0.155* -6.370* 29 0.16 (0.01) (0.91) (0.98) (0.33) (0.05) (0.04) 2002 0.068 0.250 -0.340 -0.978 0.088 -0.976 34 0.09 (0.88) (0.89) (0.92) (0.41) (0.29) (0.75)

Table 3, Ordered logit analysis: pooled analysis by country The total directors on the board is expressed as a function of the natural log of total assets , the
OSIRIS dummy variables for codes C , B
( )itLTA( )iOSIRISC ( )iOSIRISB and U ( ).iOSIRISU , the return
on total assets , the natural log of leverage ( itROTA ) ( )itLLEV , a time trend ( )tTIME with values 1999, 2000, 2001, 2002 and up to nine industry dummy variables, included in the regression to test for significant difference between the industry parameter and the manufacturing industry dummy variable, ( )jIND . Robust standard errors are used in statistical tests and probabilities from these tests are reported in parentheses below parameter estimates. * (+) statistically significant at the 5%(10%) level of significance. Country LTA OSIRISC OSIRICB OSIRISU ROTA LLEV YEAR NOBS Rsquare Hong Kong 0.723* -0.194 -0.545* 0.117 0.000 -0.304 -0.122 470 0.09 (0.00) (0.46) (0.03) (0.62) (0.99) (0.23) (0.13) Indonesia 0.529* 1.832* 0.929* 0.417+ 0.009+ -0.307 0.210* 432 0.07 (0.00) (0.00) (0.01) (0.10) (0.05) (0.23) (0.01) Malaysia 0.523* -0.111 -0.282 -0.490+ 0.015* -1.178* -0.013 571 0.03 (0.00) (0.68) (0.30) (0.06) (0.04) (0.00) (0.85) Philippines 0.158* 0.883+ 1.432* 0.665 0.005* 1.274* -0.197* 425 0.03 (0.01) (0.10) (0.02) (0.18) (0.00) (0.00) (0.02) Singapore 0.640* -0.476+ 0.482* -0.238 0.007 -0.009* -0.171* 477 0.10 (0.00) (0.07) (0.04) (0.30) (0.20) (0.00) (0.03) Thailand 0.645* -1.723+ -2.223* -0.492 -0.073+ -3.388+ 0.044 87 0.07 (0.02) (0.07) (0.04) (0.53) (0.06) (0.09) (0.84)
Copyright © 2022 FDOKUMEN