Состояние, мониторинг и задачи селекционных программ
112
Russian Academy of Sciences Pоссийская академия наук Ural Division Уральское отделение Komi Science Center Коми научный центр Institute of Biology Институт биологии Состояние, мониторинг и задачи селекционных программ Материалы совещания лесных селекционеров и генетиков северных стран Европы, 13-15 сентября 2005 г ., Сыктывкар, Россия Status, monitoring and targets for breeding programs Proceedings of the Meeting of Nordic Tree Breeders and Forest Geneticists, September 13-15, 2005, Syktyvkar, Russia Сыктывкар Syktyvkar 2005
-
Upload
khangminh22 -
Category
Documents
-
view
1 -
download
0
Transcript of Состояние, мониторинг и задачи селекционных программ
Russian Academy of Sciences Pоссийская академия наукUral Division Уральское отделениеKomi Science Center Коми научный центрInstitute of Biology Институт биологии
Состояние, мониторинг и задачиселекционных программ
Материалы совещания лесных селекционеров и генетиковсеверных стран Европы, 13-15 сентября 2005 г., Сыктывкар, Россия
Status, monitoring and targetsfor breeding programs
Proceedings of the Meeting of Nordic Tree Breeders and Forest Geneticists,September 13-15, 2005, Syktyvkar, Russia
Сыктывкар Syktyvkar2005
УДК 630*165+575 055(02)7
Состояние, мониторинг и задачи селекционных программ: Материалы совещаниялесных селекционеров и генетиков северных стран Европы (Сыктывкар, РеспубликаКоми, Россия, 13-15 сентября 2005 г.). – Сыктывкар, 2005. – 112 с.
Представлены материалы докладов совещания лесных селекционеров и генетиковсеверных стран Европы, проходившего на базе Института биологии Коми научногоцентра УрО РАН (13-15 сентября 2005 г.). Работы посвящены селекционной стратегии,генетической изменчивости и сохранению генофонда лесных древесных пород, а такжесозданию и эксплуатации лесосеменных плантаций.Сборник предназначен для лесных селекционеров и генетиков, студентов, аспирантови преподавателей лесных вузов.
А.Л. Федорков (отв. ред.).
Status, monitoring and targets for breeding programs: Proceedings of the Meeting ofNordic Tree Breeders and Forest Geneticists (Syktyvkar, Komi Republic, Russia, Septem-ber 13-15, 2005). Syktyvkar, 2005. – 112 p.
The contributions of participants of the Meeting of Nordic Tree Breeders and Forest Geneti-cists are presented. The Meeting was held by the Institute of Biology, Komi Science Center,Ural Division, Russian Academy of Sciences at September 13-15, 2005. The proceedingsare devoted to breeding strategy, genetic variation, gene conservation of tree species aswell as seed orchards.The proceedings are designed for tree breeders, forest geneticists, PhD students and lecturesof universities.
Aleksey Fedorkov (ed.-in-chief).
ISBN 5-89606-249-4
© Институт биологии Коми научного центра УрО РАН, 2005© Коми научный центр Уральского отделения Российской АН, 2005

CONTENTS
Foreword .................................................................................................................................. 5
Предисловие .......................................................................................................................... 6
List of participants ................................................................................................................... 7
Full papersThe Role of Nature Protected Areas System of the Komi Republicin Gene Conservation of Forest TreesSvetlana Degteva ..................................................................................................................... 11
Siberian Larch Family Field Trial:Survival and Height Growth Three Growing Season after Planting in SwedenLars Karlman and Owe Martinsson .......................................................................................... 17
Scots pine breeding in PolandJan Kowalczyk ......................................................................................................................... 25
Progeny Growth Characteristics in 34-year-old Geographical Trial Plantationsof Scots pine (Pinus sylvestris) at Järvselja, EstoniaMalle Kurm, Tőnu Möls and Tiit Maaten ................................................................................... 35
Unbalances in Tree BreedingDag Lindgren ........................................................................................................................... 45
Using Seed Orchard Seeds with Unknown FathersJan-Erik Nilsson and Dag Lindgren.......................................................................................... 57
Seed Production in Scots Pine Seed OrchardsFinnved Prescher, Dag Lindgren, Ulfstand Wennstrom, Curt Almquist,Seppo Ruotsalainen, Johan Kroon ........................................................................................... 65
Results from Genetic Tests of Betula pendula and its Impact on Future Breedingin Southern SwedenLars-Göran Stener ................................................................................................................... 73
Extended abstractsImproved Utilization of the Internal Pollen Productionin a Pinus sylvestris Seed Orchard by the Use of a Mist BlowerCurt Almqvist and Pertti Pulkkinen ........................................................................................... 79
Considerations of Timing and Graft Density of Future Scots Pine Seed OrchardsDag Lindgren, Finnvid Prescher, Yousry A. El-Kassaby, Curt Almqvistand Ulfstand Wennström ......................................................................................................... 81
Preliminary Assumptions to «The Programme of Forest Gene Resources Conservationand Breeding of Forest Trees Species in Poland in the years 2010-2035»Jan Matras .............................................................................................................................. 85
Forests and Forestry with Emphasis to Tree Breeding in Komi RepublicPetr Perchatkin, Aleksey Fedorkov and Andrey Turkin............................................................. 91

Ultrastructure, Photosynthesis and Respirationof Scots pine Needle in Provenance experimentsSvetlana Zagirova .................................................................................................................... 95
AbstractsCharacteristics and Sustainability of Genetically Improved Northern Scots PineBengt Andersson ..................................................................................................................... 99
Genetic Parameters in Applied Tree BreedingTore Ericsson ........................................................................................................................ 100
Genetic Parameters for Wood Density in Scots PineAnders Fries and Tore Ericsson ............................................................................................ 101
Forest Tree Breeding 2050 – Finland’s New Tree Breeding PlanMatti Haapanen ..................................................................................................................... 102
Low Cost Improvement of Coastal Douglas-fir (Pseudotsuga menziesii var. menziesii (Mirb.)Franco) by Application of the Breeding Seed Orchard Approach in DenmarkJon K. Hansen, Hubert Wellendorf and Erik D. Kjćr ............................................................... 103
Scots Pine Breeding Strategy in LatviaÂris Jansons.......................................................................................................................... 104
Wood Density, Annual Ring Width and Latewood Content in Larch and Scots PineLars Karlman, Tommy Mörling and Owe Martinsson ............................................................. 105
Genetic Differences in Scots Pine Height-Diameter RelationshipJohan Kroon and Bengt Andersson........................................................................................ 106
New Seed Orchard Programme in FinlandTeijo Nikkanen, Mikko Peltonen and Jukka Antola ................................................................. 107
Similarity between Autumn Frost Hardiness and Field Performancein Northern Pinus sylvestrisTorgny Persson and Bengt Andersson................................................................................... 108
Mitochondrial DNA Variation and Postglacial Colonization Routes of Scots PineTanja Pyhäjärvi and Outi Savolainen ...................................................................................... 109
Utilization of Scots Pine Seed Orchard Seed in Direct SeedingSeppo Ruotsalainen ................................................................................................................ 110
Genetic Gain in Area-based Production in Norway SpruceJohan Westin.......................................................................................................................... 112

FOREWORD
In September 13-15, 2005, Institute of Biology, Komi Science Center, Russian Academy of Sci-ences hosted a Meeting of Nordic Tree Breeders and Forest Geneticists. The papers and ab-stracts that follow in this proceeding were presented at this meeting entitled «Status, monitoringand targets for breeding programs». This was the last meeting of the former Nordic Group for theManagement of Genetic Resources of Trees but the first meeting this group in Russia. GENECAR(Centre for Advanced Research in Forest Genetics and Tree Breeding) will replace the formerNordic Group for the Management of Genetic Resources of Trees and will be responsible for itsactivities, including common Nordic meetings and initiation of research projects. Forty tree breedersand forest geneticists from 8 countries, Denmark, Estonia, Finland, Latvia, Norway, Poland,Russia and Sweden gathered in Syktyvkar, Komi Republic, Russia. Twenty – one oral presenta-tions and seven posters presentations were made. The contributions were devoted to the breed-ing strategy, genetic variation, gene conservation and seed orchards.
The meeting consisted of two days of presentations and one day field excursion. The field excur-sion was organized to visit the Scots pine progeny/provenance field trial consisting Swedish andRussian material, Forest Museum, Kortkeros conifer provenance experiment, Scots pine seedorchard and progeny test, Siberian larch plus trees.
On behalf of all the highly satisfied participants, the organizers are grateful to the financial spon-sors. The travel of participants from Scandinavian and Baltic countries to Russia was supportedby Swedish Association of Tree Breeding. Russian participants were supported by Mondi Busi-ness Paper. I would like to thank the staff of Department of Forest Science for the practical ar-rangements of the meeting. My appreciations goes also to all colleagues, who submitted manu-scripts for these proceedings.
Meeting secretary Aleksey Fedorkov
ПРЕДИСЛОВИЕ
Совещание лесных селекционеров и генетиков северных стран Европы проходило набазе Института биологии Коми научного центра УрО РАН 13-15 сентября 2005 г. Темасовещания – «Состояние, мониторинг и задачи селекционных программ». Это былопоследнее совещание Группы по Управлению Генетическими Ресурсами Древесных Пород,но первое, которое проходило в России. В настоящее время Группа по УправлениюГенетическими Ресурсами Древесных Пород реорганизуется в GENECAR (Centre for Ad-vanced Research in Forest Genetics and Tree Breeding – Центр исследований по леснойгенетике и селекции), который будет ответственным за организацию подобных совещанийи научных проектов. В совещании приняли участие 40 селекционеров и генетиков, а такжелесоводов-практиков из восьми стран (Дании, Эстонии, Финляндии, Латвии, Норвегии,Польши, России и Швеции). Были представлены 21 устный и 7 стендовых докладов, которыекасались селекционной стратегии, генетической изменчивости, сохранения генофондалесных древесных пород, а также создания и эксплуатации лесосеменных плантаций.
В ходе совещания была организована полевая экскурсия, в течение которой участникиознакомились с испытательными культурами плюсовых деревьев сосны, географическимикультурами сосны и ели, лесосеменной плантацией и плюсовыми деревьями лиственницы.
Организаторы выражают благодарность за финансовую поддержку Шведскуюассоциацию лесной селекции, благодаря которой многие участники из Скандинавских иБалтийских стран смогли прибыть на совещание, а также ОАО «Монди Бизнес Пейпа –Сыктывкарский ЛПК», который выделил грант для российских участников. Хотел бы такжевыразить признательность сотрудникам Отдела лесобиологических проблем СевераИнститута биологии Коми научного центра за практическую работу по организациисовещания и всем участникам, представившим свои материалы в данный сборник.
Секретарь совещания А.Л. Федорков

LIST OF PARTICIPANTS
Almqvist Curt Skogforsk, Uppsala Science Park, S-751 83 Uppsala, [email protected]
Andersson Bengt Skogforsk, Box 3, SE-918 21 Savar, [email protected]
Buitink Jaap Vefsn Landbruksskole, 8658 Mosjшen, [email protected]
Beuker Egbert Finnish Forest Research Institute, Punkaharju Research Station,Finlandiantie 18 FIN-58450 Punkaharju, [email protected]
Degteva Svetlana Institute of Biology, 167982, Kommun.st., 28, Syktyvkar, [email protected]
Ericsson Tore Skogforsk, Box 3, SE-918 21 Savar, [email protected]
Fedorkov Aleksey Institute of Biology, 167982, Kommun.st., 28, Syktyvkar, [email protected]
Fries Anders Department of Forest Genetics and Plant Physiology, SwedishUniversity of Agricultural Sciences (SLU), SE-90183 Umeе, [email protected]
Graudal Lars Forest & Landscape Denmark, Hoersholm Kongevej 11,DK-2970 Hoersholm, [email protected]
Haapanen Matti Finnish Forest Research Institute, Vantaa Research Centre, Box 18,FIN-01301 Vantaa, [email protected]
Hansen Jon Kehlet Forest and Landscape, Denmark, Hшrsholm Kongevej 11, DK-2970Hшrsholm, [email protected]
Jansons Aris Rоgas 111, Salaspils, LV- 2169, [email protected] or [email protected]
Jensen Viggo Forest & Landscape Denmark, Hoersholm Kongevej 11, DK-2970Hoersholm, [email protected]
Karlman Lars JiLU, Skogsvдgen, S-840 73 Bispgеrden, [email protected]
Kowalczyk Jan Forest Research Institute, Department of Genetics and Forest TreePhysiology, ul.Bitwy Warszawskiej 1920r No.3, 00-973 Warsaw, [email protected]
Kroon Johan Skogforsk, Box 3, SE-918 21 SДVAR, [email protected]
Kurm Malle Estonian Agricultural University, Institute of Forestry and RuralEngineering, Kreutzwaldi 5 Tartu, 51014, [email protected]
Lindgren Dag Department of Forest Genetics and Plant Physiology, SwedishUniversity of Agricultural Sciences (SLU), SE-90183 Umeе, [email protected]
Lindgren Katarina Department of Forest Genetics and Plant Physiology, SwedishUniversity of Agricultural Sciences (SLU), SE-90183 Umeе, [email protected]
Lofmark Stefan Department of Forest Genetics and Plant Physiology, SwedishUniversity of Agricultural Sciences (SLU), SE-90183 Umeе, [email protected]
Maaten Tiit Institute of Forestry and Rural Engineering, Kreutzwaldi 5, Tartu,51014, [email protected]
Martinsson Owe JiLU, Skogsvдgen, S-840 73 Bispgеrden, [email protected]
Matras Jan Forest Research Institute, Department of Genetic and Physiolgy of WoodyPlants, Bitwy Warszawskiej 1920 R no 3, 00-973 Warsaw, [email protected]
Nikkanen Teijo Finnish Forest Research Institute, Punkaharju Research Station,Finlandiantie 18, FIN-58450 Punkaharju, [email protected]
Nilsson Jan-Erik Department of Forest Genetics and Plant Physiology, SwedishUniversity of Agricultural Sciences (SLU), SE-90183 Umeе, [email protected]
Persson Torgny Skogforsk, Box 3, SE-918 21 Savar, [email protected]
Perchatkin Petr Agency of Forestry for Komi Republic, 167982, Pervomayskaya st., 78,Syktyvkar, RUSSIA
Pihu Raul Institute of Forestry and Rural Engineering, Kreutzwaldi 5, Tartu,51014, [email protected]
Prescher Finnvid Svenska Skogsplantor AB, Seed Centre, SE-340 14 Lagan, [email protected]
Pruchkin Vycheslav Mondi Business Paper Syktyvkar, Bumazhnikov pr., 167026,Syktyvkar, RUSSIA
Pulkkinen Pertti Finnsh Forest Research Institute, Haapastensyrjд Breeding Station,Karkkilantie 247, FIN-12600 Lдyliдinen, [email protected]
Pyhдjдrvi Tanja Department of Biology, University of Oulu, PL3000, 90014University of Oulu, [email protected]
Roulund Hans The Royal Veterinary and Agricultural University, the ArboretumKirkegеrdsvej 3a, 2970 Hшrsholm, [email protected]
Ruosalainen Seppo Finnish Forest Research Institute, Punkaharju Research Station,Finlandiantie 18, FIN-58450 Punkaharju, [email protected]
Skolud Piotr Directorate General of the State Forests, Ul. Wawelska 52/54, 00-922Warszawa, [email protected]
Sobierajski Zbignev Forest Gene Bank Kostrzyca, 58 – 562 Miіkуw, [email protected]
Stener Lars-Gцran Skogforsk, Ekebo 2250, 268 90 Svalцv, [email protected]
Turkin Andrey Agency of Forestry for Komi Republic, 167982, Pervomayskaya st., 78,Syktyvkar, RUSSIA
Westin Johan Skogforsk, Box 3, SE-918 21 Savar, [email protected]
Zagirova Svetlana Institute of Biology, 167982, Kommun.st., 28, Syktyvkar, [email protected]
11
Status, Monitoring and Targets for Breeding Programs
THE ROLE OF NATURE PROTECTED AREAS SYSTEM OF THE KOMI REPUBLICIN GENE CONSERVATION OF FOREST TREES
Svetlana DegtevaInstitute of Biology, Komi Science Center, Ural Division, Russian Academy of Sciences,
Syktyvkar, Russia
The Komi Republic is situated in the north-east of European part of Russia and occupies about416 thousands km2. The Komi Republic borders with Archangel province in the north and north–west and Kirov and Perm provinces in the south and south-east. The Urals is the east boundaryof the Komi. There are 5 orographical regions in this territory: Vychegodsko-Mezenskaya Plane,Northern Hills, Timan Ridge, Pechorskaya Plane and Western macroslope of the Urals. Largestpart of the territory belongs to the Russian Plane. Climat of the Komi Republic is moderatecontinental and temperate cold. Northern part of the territory belongs to the area with arcticclimate. Central regions which are situatied between Polar Circle and 63°N latitude belong to thezone of atlantic-arctic climate. All others belong to the zone with atlantic-continental climate.Period of temperature above +10°C is continuing from 90 to 105 days, period of temperatureabove 0°C is up to 195 days. Average temperature of January is -15°C. Duration of the winter is5 month in the southern part of republic and about 7 month in the northern one. Territory issituated in the zone of surplus moisture. Total precepitations per year are 500-600 mm, most ofthem are felling during warm season. There are more than 3500 rivers with the lenghts above10 km here. The main rivers are Pechora, Mezen, Vychegda, Luza. Supplying of rivers, lakesand wetlands is mainly by atmospheric precipitations.
Tundra and taiga are main vegetation zones in the Komi Republic. Southern boundary of tundrazone is situated in the head of Usa and Vorkuta river basin. The main vegetation types in this zoneare shrubby-mosses tundra in the watersheds and willow’s communities along rivers. Rare foreststands (belt of pre-tundra forests) are distributing between tundra and taiga zones. Landscapesare characterized by complex of shrub communities and birch-spruce low-density stands, whichare situated in the river valleys. Density of the canopy is lower than share one fifth and heights ofthe trees are 6-8 m. In the vegetation cover mosses and lichens are dominated. Permafrost in soilunder rare stands is absent.
The largest part of territory is occupied by taiga with sub-zones of far northern, northern, middleand southern taiga. Stable primary boreal taiga communities which have been formed duringlong-time evolution of vegetation prevail in forest fund. Nowdays major share of virgin forests inthe northern Europe are situated in the Komi Republic. There are 8 coniferous and 17 deciduoustree species, more than 50 species of shrubs and dwarf-shrubs in the forest of the Komi Repub-lic. Among them such coniferous trees as Pinus sylvestris, Picea obovata, hybrid forms of Piceaabies x P. obovata, Abies sibirica, Larix sibirica, Juniperus communis, J. sibirica, Pinus sibirica,Picea abies. Last two species have breaking up areas. Birch (Betula pendula, B. pubescens,B. tortuosa), alder (Alnus incana) and aspen (Populus tremula) stands are more common amongthe deciduous ones. There are scattered stands of elm (Ulmus laevis, Ulmus scabra) and lime(Tilia cordata) in the southernmost part of Komi. Coniferous stands occupy 80 % of the forestcovered area. The share of mature and over-mature stands is about 70 % of forests.
12
Proceedings of the Meeting of Nordic Tree Breeders and Forest Geneticists
Siberian spruce (Picea obovata) and mixed spruce and birch (Betula pubescens) stands withdominance of Polytrichum and Sphagnum in the moss cover are widly spread in far north taigasub-zone. Density of the canopy is low (up 0.3 to 0.5). Average height of trees is 8-15 m. Quality ofstands is very low. Spruce stands are forming not only on the glay soils, but also on the sandy soilstoo. Areas of wetlands are large enough, rised bogs with pools and ridges as well as peat mossbogs are prevail. In the Pechora river basin willow and birch stands and meadows are distributing.Subzone of northern taiga is characterised by predominance of forest communities and decreas-ing of wetlands share. Stands are forming by Siberian spruce, Silver birch, Scots pine (Pinussylvestris) with admixture of Siberian fir (Abies sibirica), Siberian pine (Pinus sibirica), Siberianlarch (Larix sibirica), European aspen (Populus tremula). The density of canopy varies from 0.5 to0.7 and average height of trees is 13-15 m. In the moss cover green mosses (Pleurozium schreberi,Hylocomium splendens) are prevail, in ground vegetation dwarf-shrubs (Vaccinium uliginosum,Ledum palustre) and sedge Carex globularis are dominate. In watershed territories spruce for-ests are wide spread. Pine stands of lichen and green moss types are distributed in flood plainterraces with good drainage and sandy soils. In the depressions of relief paludification is develop-ing. In such sites green mosses are replaced by Sphagnum species. In ground vegetation Vacciniumuliginosum, Ledum palustre, Chamaedaphne calyculata are abundant. The main features of thenorthern taiga are fragments of tundra landscspes with prevailing of Betula nana, which are situ-ated in the valleys of small rivers.
Below 63°N latitude sub-zone of middle taiga is appearing. In the sites with good drainage the sprucestands with admixure of birch, aspen, pine, rare fir, larch, Siberian pine of III-IV quality classes andcanopy density 0.7-0.8 have been formed. Average heights of the tree’s trunks are 18-20 m. In theground cover green mosses and dwarf-shrubs (Vaccinium myrtillus, V. vitis-idaea) are dominated.In the central part of watershed territiries green mosses is replaced by Sphagnum species. A lot ofpeat moss bogs are distributed in this territory. On most of them stands are absolutly absent. Themain feature of middle taiga forests is low abundance of herbs and grasses. Pine forests are distrib-uted on sandy flood plain terraces. In the ground cover of these communities the lichens or greenmosses are prevailed. Meadows are distributed in the flooding areas along rivers only. Grasslandswhich are forming in the watershed territiries are unstable and very rapidly replaced by forests.Territory which is occupied by southern taiga is small enough. In this area spruce and mixed spruceand fir forests prevail. Good quality birch and aspen stands have been developed in the clear fellingareas. Density of the canopy is over 0.8.
In the Urals and Timan Ridge different altitude belts are represented. Before altitude 450-660 mabove see level mountain’s forests are prevail. In the highest altitudes tundra and goltzy arepresented.
Productivity of forest ecosystems in the Komi Republic is not high and decreasing from south tonorth. Average growing stand volume is 200-400 m3/ha in southern taiga sub-zone, 120-140 m3/hain northern and 60-90 m3/ha in far northern one, respectively. Total standing volume of forests is2.8 billion m3. Average annual growth increment is about 1 m3/ha. Average annual growth incre-ment is about 2.2-2.4 m3/ha in the southern taiga and 0.4-0.6 m3/ha in the northern taiga.
Diversity of ecological conditions, for example, plain and flood plain terraces forests along riversPechora, Mezen, Vychegda, etc., pre-mountain and mountain stands of the Northern and SubpolarUrals and Timan Ridge, pre-tundra forests caused unique natural diversity of the forest geneticresources. That’s why the forest genetic resources of the Komi Republic are of great value fortree breeding. Most of forest communities are characterised by not only rich genetic diversity oftree species, but high diversity of rare, protected plants and herbs, lichens, fungi.
At the same time increasing of clear cutting area, rates of the territory anthropogenic transforma-tion and some disastrous factors, such as fires, wind-falls, lead to decreasing areas of virgin and
13
Status, Monitoring and Targets for Breeding Programs
primary forests. The most serious and often disastrous changes in the composition, productivityand sustainability of forest ecosystems take place in the impact zones of large industry and trans-port installations. There are regions of oil and gas-extracting enterprises, mineral resources min-ing, areas along pipelines and etc. Disturbed natural forests are replaced by secondary birch andaspen stands. By this reason it is necessary to take all due measures for the conservation andeffective using of the boreal taiga forests genetic resources.
The most effective approach to the protection of the taiga ecosystems is creation of a system ofnature protected areas (NPA). Forest genetic research take a lot of time, so inventory and con-servation of the genetic forest resources of the Komi Republic seems to been an urgent andpriority goal.
As a result of research, which have actively developed in the Institute of Biology (Syktyvkar) fromthe end of 60’s the System of NPA was organised in the Komi Republic. The major principles ofNPA’s net creation are protection of rare and typical ecosystems, conservation of rare and threat-ened species by protecting their habitats, development of ecotourism and recreation conditions.
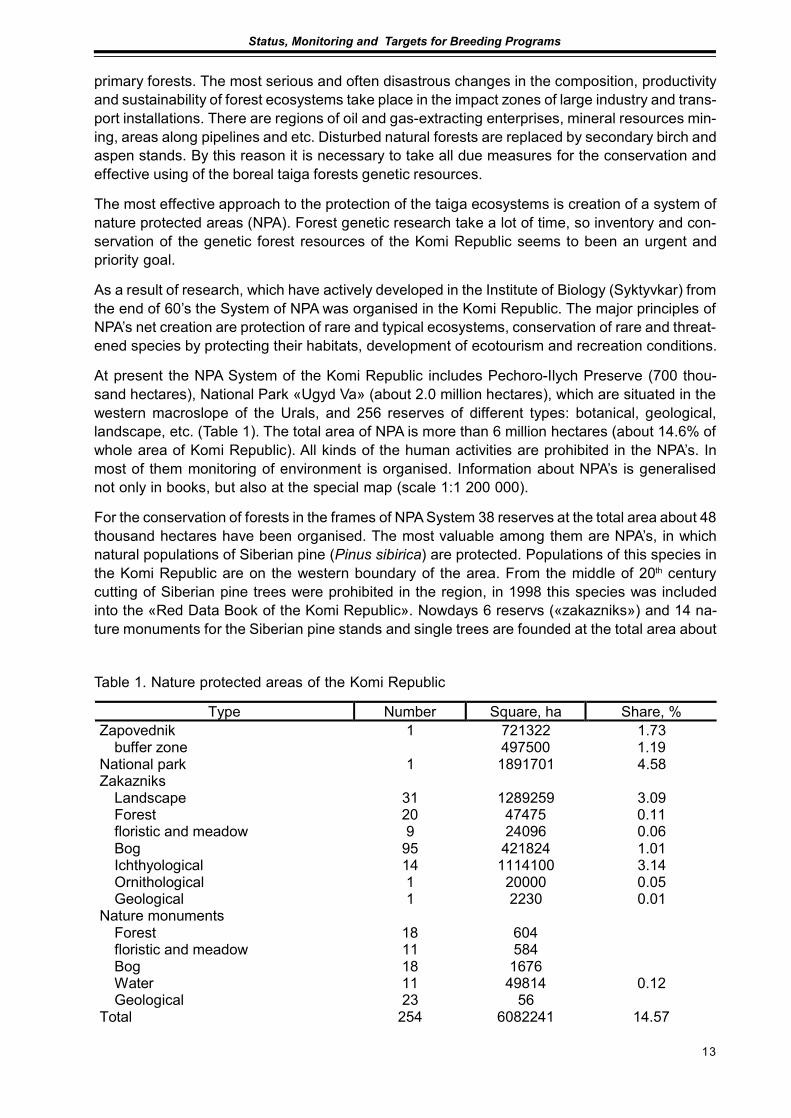
At present the NPA System of the Komi Republic includes Pechoro-Ilych Preserve (700 thou-sand hectares), National Park «Ugyd Va» (about 2.0 million hectares), which are situated in thewestern macroslope of the Urals, and 256 reserves of different types: botanical, geological,landscape, etc. (Table 1). The total area of NPA is more than 6 million hectares (about 14.6% ofwhole area of Komi Republic). All kinds of the human activities are prohibited in the NPA’s. Inmost of them monitoring of environment is organised. Information about NPA’s is generalisednot only in books, but also at the special map (scale 1:1 200 000).
For the conservation of forests in the frames of NPA System 38 reserves at the total area about 48thousand hectares have been organised. The most valuable among them are NPA’s, in whichnatural populations of Siberian pine (Pinus sibirica) are protected. Populations of this species inthe Komi Republic are on the western boundary of the area. From the middle of 20th centurycutting of Siberian pine trees were prohibited in the region, in 1998 this species was includedinto the «Red Data Book of the Komi Republic». Nowdays 6 reservs («zakazniks») and 14 na-ture monuments for the Siberian pine stands and single trees are founded at the total area about
Type Number Square, ha Share, % Zapovednik 1 721322 1.73
buffer zone 497500 1.19 National park 1 1891701 4.58 Zakazniks
Landscape 31 1289259 3.09 Forest 20 47475 0.11 floristic and meadow 9 24096 0.06 Bog 95 421824 1.01 Ichthyological 14 1114100 3.14 Ornithological 1 20000 0.05 Geological 1 2230 0.01
Nature monuments Forest 18 604 floristic and meadow 11 584 Bog 18 1676 Water 11 49814 0.12 Geological 23 56
Total 254 6082241 14.57
Table 1. Nature protected areas of the Komi Republic

14
Proceedings of the Meeting of Nordic Tree Breeders and Forest Geneticists
20000 ha. All these territories have been investigated and system of special actions for protection,support and restoration of Siberian pine populations is function.
Forest ecosystems dominate also at the territories of landscape reserves, Pechoro-Ilych Bio-sphere Zapovednic and National Park. In 1996 The National Park and Pechoro-Ilych BiosphereZapovednic were included into The UNESCO List of World Heritage and named «Virgin Forestsof Komi».
In the territory protected under UNESCO umbrella forest ecosystems are covered more than halfof the total area. Forests have been developed without any anthropogenic impact. Picea obovatadominate in most of forest lanscapes. In mountain forests of the Northern Urals Siberian fir andSiberian pine are main stand forming trees also. In northern area the share of these species isbeing decreasing. At the same time Siberian larch trees and stands are appearing. Up to 64°Nlatitude Larix sibirica is forming mountain forests and rare stands. Square of the Scots pineforests is not large. Stands of Pinus sylvestris are situated in sandy soils of moraine plain andPechora river terraces. In the pristine stands 3-5 generations of coniferous trees with differentheights are fixed. Number of coniferous seedlings is enough to support their populations. Amongdeceduous trees common component of pristine stands is birch. In plain and premountain hillsBetula pubescens widwly spread. In mountains it replaced by B. tortuosa. In flood plains andhigh mountains small plots of primary birch and willow stands are spread. After fires and windthrowconiferous forests is replaced by secondary birch and aspen stands. During last 200 years self-restoration of coniferous stands takes place.
The shrub layer in protected forest ecosystems has low density. It is formed by single low shrubsof Sorbus aucuparia and Juniperus communis, sometimes – Duschekia fruticosa and Betulanana also. Species number of ground cover in watershed forests is not high. More common dwarf-shrubs for boreal zone are: Vaccinium myrtillus, V. vitis-idaea, V. uliginosum, Ledum palustre,Empetrum hermaphroditum. Among herbaceous plants Avenella flexuosa, Carex globularis,Equisetum sylvaticum are usually presented. Under canopy of plain and pre-mountain standscover of mosses and/or lichens is developed. Green mosses are common dominants. In moun-tains forest where tall-herbs are abundant moss cover is supressed.
Most of specially protected virgin forests are characterised by not only rich genetic diversity oftrees, but high diversity of rare, protected plants and herbs, lichens and fungi, as well as animalsand birds. For example, at the territories of zapovednik and national park are 172 of 253 pro-tected vascular plant species (68 %) are presented. Some of them are included into the «RedDate Book of Russia» (Calypso bulbosa, Castillea arctica ssp. vorkutensis, Cypripedium calceolus,Dactylorhiza traunsteineri, Schiverekia podolica) and Red Lists of IUCN (Cypripedium calceolus).Few species are endemics (Anemonastrum biarmiense, Gypsophila uralensis, Linum boreale,Thymus talijevii, etc.).
60 species of protected mosses (39 %) are distributed in this territory, 5 species protectes in thewhole Europe (Dicranum viride, Schistostega pennata, Neckera pennata, Hydrohypnum norve-gicum, Scleropodium arellanum). There are a lot of rare lichens in the pristin forests (total 64 spe-cies). Sphinctrina turbinata, Pannaria conoplea, Lobaria pilmonaria are protected not only in theKomi Republic, but also in the whole Russia. Lobaria hallii, Leptogium rivulare are very rare inthe whole world. Rare lichens Pannaria confusa, Cheiromycina flabelliformis, Phaeophyscia hyr-suta, Chaenotheca subroscihda, Chaenotecopsis vainioana, Phaeocalicium praecedens are un-known in the different regions of Russia. Most of common lichens, which are fixed in the virginforests of the Komi Republic (species from Calicium, Cephelium, Chaenotheca genera, Usnealongissima, Cetrelia olivetorum, Heterodermia speciosa, etc.) are rare in northern European coun-tries with similar nature conditions (Finland, Sweden). 24 species of rare fingi are fixed in pro-tected forest areas, 4 species are included to the «Red Date Book of Russia» (Tylopilus alutarius,
15
Status, Monitoring and Targets for Breeding Programs
Leccinium percandidum, Grifola frondosa, Hericium coralloides). Among rare species of birds areHaliaeetus albicilla, Falco rusticolus, Pandion haliaetus, Aquila chrysaetos, Falco perigrinus. Allthese species are included into the Red Lists of IUCN.
About 37 % of the total forest area in the Komi Republic belongs to the protected forests category.Among them most considerable areas are occupied by pre-tundra forests and protected beltsalong the rivers.
Establishment of genetic reserves (GR) system for the conservation genetic resources of maintree species has been started. The first batch of 38 GR at the total area about 28 thousandhectares were confirmed by Government Decision in 1990. Among GR are stands with highbiological productivity and standing crop, which are characterised by intensive energy of growthand valuable features. Most of them are pristin stands common for the different taiga sub-zones.Conservation of genetic resources of trees is the most important goal of forest genetics and treebreeding. There are some data about forms diversity of coniferous and deciduous trees in theforests of the Komi Republic, but intraspecific variability of main stand-forming trees is not stud-ied yet. Investigation of genetic variation of Siberian pine, Siberian fir, Siberian larch, which arein the natural limits of their areas in Komi and also primary Scots pine, Siberian spruce andmixed forests is very important. Valuable forms, which may be found in the process of this re-search, will be useful not only for the forest genetics and selection, but also for ornamentalpurposes. It is also necessary to study biological processes connected with their flowering andcone production and to develop citoembryological, morphological and physiological, as well ascaryological research. The System of NPA is good field for such kind of investigations.

16
Proceedings of the Meeting of Nordic Tree Breeders and Forest Geneticists

17
Status, Monitoring and Targets for Breeding Programs
SIBERIAN LARCH FAMILY FIELD TRIAL: SURVIVAL AND HEIGHT GROWTHTHREE GROWING SEASON AFTER PLANTING IN SWEDEN
Lars Karlman1) and Owe Martinsson2)
1) Swedish University of Agricultural Sciences, Umeе, Sweden2) Jдmtland County council for Rural Development, Bispgеrden Sweden
Abstract
Larch (Larix sp. Mill.) is a natural element of the boreal forest. Different species of Larix dominatesthe boreal forests of Eurasia. Larch also had a natural distribution in Scandinavia nine thousandyears ago but disappeared for unknown reasons in prehistoric time. It was reintroduced by man inthe 18th century and has for a long time attracted interest from forestry in Scandinavia. One majorobstacle for reintroduction of Siberian larch in Scandinavia has been availability of seed sourcesfor establishing test plantations. A co-operation between three Russian research institutes on oneside and two organisations in Scandinavia on the other started in 1996. Seed was collected from1005 individual trees distributed over 17 regions and 45 larch stands from Kamchatka in the eastto Onega in the west. Seedlings were produced in 2002 and family field tests of 1005 families wereestablished on three sites in Sweden. According to this report the best adaptation and productivityof Siberian larch growing in Sweden were found in larch provenances originating from westernRussia with the exception that material of too northern origin do not perform well. Also the very fastgrowth and vitality of the eastern provenances are interesting. The long term vitality and growth ofthese provenances should be followed up carefully before any recommendations can be done.
Test plantations of this material were also established in Norway, Iceland, Finland, northwestRussia (Komi and Archangelsk), China, Japan, Alaska, Saskatchewan, Minnesota and Quebec.
Introduction
Larch (Larix sp. Mill.) is a natural element of the boreal forest. Different species of Larix domi-nates the boreal forests of Eurasia (Milyutin & Vishnevetskaya 1995, Putenikhin & Martinsson1995, Abaimov et al. 1998). Larch also had a natural distribution in Scandinavia nine thousandyears ago but disappeared for unknown reasons in prehistoric time (Kullman 1998). It was re-introduced by man in the 18th century and has for a long time attracted interest from forestry inScandinavia (Martinsson 1992). One major obstacle has been availability of seed sources forestablishing test plantations. A co-operation between four Russian research institutes on oneside and two organisations in Scandinavia one in Japan and one in the USA on the other startedin 1996 (Table 1).
Material
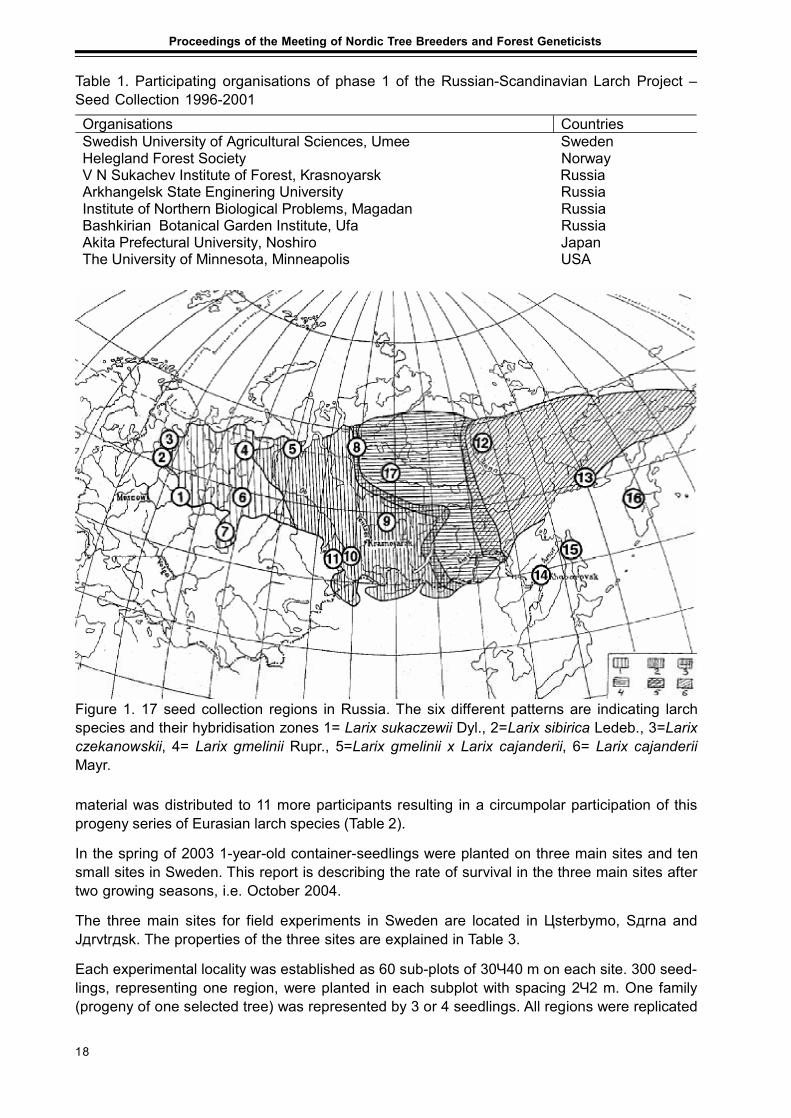
In phase 1 of the project seed was collected in 17 regions and 1005 individual trees from Kamchatkain the east to Onega in the west (Figure 1). A detailed report on the seed collection was publishedin 2002 (Abaimov et al. 2002). Material for the Swedish and Norwegian field experiments werebrought up in 2002 in Alstahaug nursery in central Norway. In addition to this, seed of the same
18
Proceedings of the Meeting of Nordic Tree Breeders and Forest Geneticists
material was distributed to 11 more participants resulting in a circumpolar participation of thisprogeny series of Eurasian larch species (Table 2).
In the spring of 2003 1-year-old container-seedlings were planted on three main sites and tensmall sites in Sweden. This report is describing the rate of survival in the three main sites aftertwo growing seasons, i.e. October 2004.
The three main sites for field experiments in Sweden are located in Цsterbymo, Sдrna andJдrvtrдsk. The properties of the three sites are explained in Table 3.
Each experimental locality was established as 60 sub-plots of 30Ч40 m on each site. 300 seed-lings, representing one region, were planted in each subplot with spacing 2Ч2 m. One family(progeny of one selected tree) was represented by 3 or 4 seedlings. All regions were replicated
Table 1. Participating organisations of phase 1 of the Russian-Scandinavian Larch Project –Seed Collection 1996-2001Organisations Countries Swedish University of Agricultural Sciences, Umeе Sweden Helegland Forest Society Norway V N Sukachev Institute of Forest, Krasnoyarsk Russia Arkhangelsk State Enginering University Russia Institute of Northern Biological Problems, Magadan Russia Bashkirian Botanical Garden Institute, Ufa Russia Akita Prefectural University, Noshiro Japan The University of Minnesota, Minneapolis USA
Figure 1. 17 seed collection regions in Russia. The six different patterns are indicating larchspecies and their hybridisation zones 1= Larix sukaczewii Dyl., 2=Larix sibirica Ledeb., 3=Larixczekanowskii, 4= Larix gmelinii Rupr., 5=Larix gmelinii x Larix cajanderii, 6= Larix cajanderiiMayr.

19
Status, Monitoring and Targets for Breeding Programs
Table 2. Participants of the International Progeny test of Eurasian Larch SpeciesCountry/province Organisation Contact person Norway Helgeland Forest Society, Mosjцen Jaap Buitink,
Gisle Skaaret Sweden SLU; Umeе Owe Martinsson Arkhangelsk NFRI, Arkhangelsk Natalia Demidova,
Vladimir Barzut Komi Komi Science Centre, Syktyvkar Aleksey Fedorkov Japan Kyushu University Katsuhiko Takata China Beijing University, Beijing Shen Xi Huan Alaska U S Forest Service, Alaska, Fairbanks John Alden Saskachewan Agriculture and Agri-Food Canada, Indian Head Bill Schroeder Minnesota University of Minnesota Andrew David Quebec Ministry of Forest Martin Perron Iceland Iceland Forest Service Thrцstur Eysteinsson France INRA,Orleans Luc Pвques
Table 3. Localities and site properties of the three main test sites in Sweden
Locality Latitude, N Longitude Altitude, m Topography Soil Цsterbymo 57є47’ 15є37’ 250 Slight southern slope Gravelly morain Sдrna 61є31’ 13є00’ 540 Slight western slope Stony morain Jдrvtrдsk 65є11’ 19є31’ 410 Steep eastern slope Sandy morain
three times in three sub-plots. Three commercial Swedish and Finnish seed sources and twoRussian collections (No 18-22) were included as standards in the experiments. All seed sourcesand their origins are explained in Table 4.
Results and discussion
In October 2005, i. e. three growing seasons after planting in the field, survival rate and treeheights were recorded of all trees in the three sites (Table 5).
Survival
The average survival rate three growing seasons after plantation was between 65 and 80 %.The overall survival was best in the northernmost site Jдrvtrдsk, 80 %. The lowest survival was inSдrna, 65 %. In the southern site Цsterbymo several of the most northern and most continentalprovenances have very low survival rate. The opposite situation does not seem to occur inJдrvtrдsk, where the southern provenances do not suffer so much from the very great moving tothe north. Even the hybrid larch Maglehem and the provenance from Irkutsk can survive inJдrvtrдsk. However, the period is still too short for this estimation, only three growing seasonsafter plantation.
Height growth
ЦsterbymoThe most fast growing larch trees are to be found in Цsterbymo. The highest individual tree hereis a hybrid larch from Maglehem, 285 cm. However, the hybrid larch from Maglehem do not havethe tallest mean height. The tallest five mean heights are: 14 Chabarovsk, 15 Sachalin, 21Maglehem, 1 Nishnij Novgorod and 7 Ufa. The most maladapted here are 12 Yakutia and 11 Altai.

20
Proceedings of the Meeting of Nordic Tree Breeders and Forest Geneticists
Tabl
e 4.
See
d so
urce
s an
d th
eir o
rigin
s in
the
thre
e Sw
edis
h m
ain
test
site
s, Ц
ster
bym
o, Sдr
na a
nd Jдr
vtrд
sk

21
Status, Monitoring and Targets for Breeding Programs

22
Proceedings of the Meeting of Nordic Tree Breeders and Forest Geneticists
Tabl
e 5.
Initi
ally
pla
nted
see
dlin
gs, s
urvi
val a
nd m
ean
tree
heig
ht th
ree
grow
ing
seas
ons
afte
r pla
ntin
g
23
Status, Monitoring and Targets for Breeding Programs
SдrnaThe over all mean height in Sдrna three growing season after planting is 44 cm. The four bestgrowing provenances in Sдrna are Nishnij Novgorod, 6 Perm, 15 Sachalin and 18 Lassinmaa.
The very northern provenances 12 Yakutia, 5 Salechard demonstrate the lowest mean height.
JдrvtrдskHere the over all result is the most even. Most provenances seem to have a relatively goodgrowth and survival here, also the most southern origins. The five fastest growing provenancesare: 14 Chabarovsk, 15 Sachalin, 13 Magadan, 18 Lassinmaa and 19 Ivanov. The mostmaladapted are: 11 Altai, 12 Yakutia and 21 Maglehem.
Conclusion
Only three growing seasons is a too short period for estimation of survival, growth rate andadaptation to the three sites. The survival rate is so far very good in the most southern and themost northern sites. In Sдrna the survival is not acceptable and one of the reasons is the planta-tion which was rather often done outside the site preparation. Another reason may be the graz-ing cattle since the fence around the area was not complete until autumn 2005.
Larch from 12 Yakutiya and 17 Evenkia are adapted to a more continental climate than any-where in Sweden and show bad adaptation in Sweden. The very fast growth and vitality of theeastern provenances are interesting. The long term vitality and fast growth of these provenancesshould be followed up carefully before any recommendations can be done.
ReferencesAbaimov, A.P., Barzut, V.M., Berkutenko, A.N., Buitink, J., Martinsson, O., Milyutin, L.I., Polezhaev, A.,
Putenikhin, V.P., Takata, K. 2002. Seed collection and seed quality of Larix spp. From Russia –Initial phase on the Russian-Scandinavian Larch Project, Eurasian J. For. Res. 4, 39-49.
Abaimov, A. P., Lesinski, J. A., Martinsson, O. and Milyutin, L.I. 1998. Variability and ecology of Siberianlarch species. Swed. Univ. Agric. Sci., Dep Silviculture, rep 43, 123 pp.
Kullman, L. 1998. Paleoecological, biogeographical and paleoclimatological implications of early Holoceneimmigration of Larix sibirica into the Scandes mountains, Sweden. Global Ecology and Biogeogra-phy Letters, 5.
Martinsson, O. 1992. 30 years of provenance research on larch in Sweden. In: Weissgerber, (editor)Results and future trends in larch breeding on the basis of provenance research. IUFRO Centennialmeeting of the IUFRO working party S2.02-07., 22-36.
Milyutin, L.I. & Vishnevetskaia, K. D. 1995. Larch and Larch forests of Siberia In: Ecology and Manage-ment of Larix Forest: A look Ahead. USDA Forest Service, Intermountain Research Station, GTR-INT-319, 50-57
Putenikhin, V. P. & Martinsson, O. 1995. Present distribution of Larix sukaczewii Dyl. in Russia. Swed.Univ. Agric. Sci., Dep Silviculture, rep 38,78 pp.

24
Proceedings of the Meeting of Nordic Tree Breeders and Forest Geneticists
25
Status, Monitoring and Targets for Breeding Programs
SCOTS PINE BREEDING IN POLAND
Jan KowalczykDepartment of Genetics and Forest Tree Physiology, Forest Research Institute, Warsaw, Poland
Abstract
The aim of this paper is to present data from all provenances and progeny experiments withPolish origins of Scots pine with emphasis to evaluation. It was considered that last data (boththese published and not published yet), should be provided by researchers taking care on par-ticular plots. For data from each experimental plot it was calculated average and their standarddeviation. The value for provenance was expressed as deviation from average value in standarddeviation unit. The proveniences are grouped under the regions of provenances. Results werecalculated first for the provenance and then for the region of provenance. The calculations wereperformed for Polish provenances only, skipping foreign origins represented on some experi-mental plots.
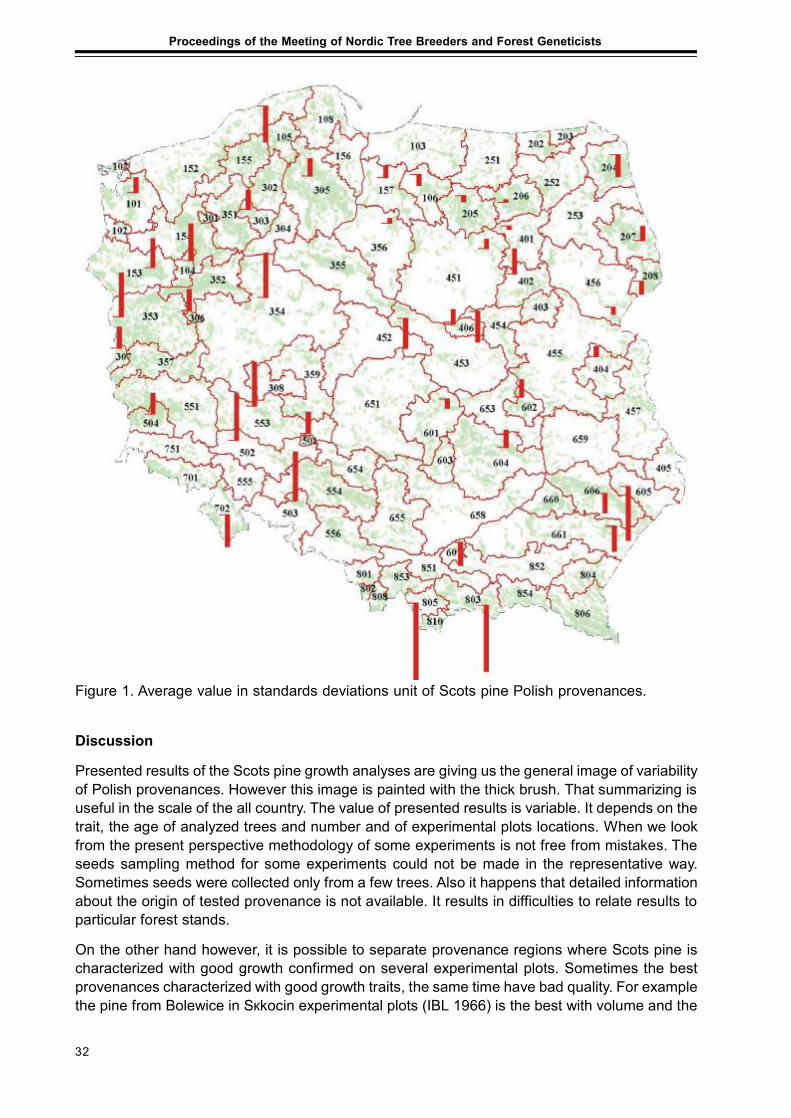
In this comparison, 27 experimental plots with 76 proveniences from 41 regions were tested (in-cluding 21 maternal regions designated for pine). Provenance regions (maternal for pine) nos.105, 107, 302 and 403 were not represented in investigations. The best origins of pine under thequantity traits grow in western Poland. From this part of the country only provenance from BystrzycaKłodzka representing seed region no 702 is growing worse. The proveniences from the south-east-ern part of Poland regions nos. 605, 606 and 661 also are growing worse than the average. Muchbetter are growing pine trees from Wyszkow (seed region 402) and Parciaki (region 451). Resultsabove the average belong to pine trees from regions 305, 356 and 157. Results of Pine fromregion 205, Tabуrz (106) and Mazurian (206) are close to the average or somewhat below. Pinetrees from Supraњl (207) show results above average. On the other hand, pine from mountain-foot region (Grybow and Nowy Targ) performs the worst in all experimental plots.
The selection in Poland based on choice of whole populations for reproduction assures largergenetic variability and assures also good economic effects.
Introduction
Scots pine is the most important forest tree species in Poland. It is forming stands both on dryand moist soils. Scots pine grows also on very poor and on more fertile soils. It results in largeareas of lowlands occupied by Scots pine (accounting for 69.3% of forest area when consideredalong with larch).
The pine is valuable also in terms of wood quality. Large possibilities of Scots pine selection existbecause of high population diversity. Many experiments were established to recognize the ge-netic value of different population of pine and to select the best for forest practice.
So far results of these experiments are an object of many publications concerning mainly singleexperimental plots. These experiments contain different sets of the population. Measurementsconcern different features and they are being made in the different age. So the overall assessment
26
Proceedings of the Meeting of Nordic Tree Breeders and Forest Geneticists
of results is very difficult and every result has a different value depending on quantity of experimen-tal plots and traits it concerns.
Overall provenance comparison experiments with the Scots pine in Poland were done by Giertych(1996). These results are more and more reliable because they are coming from more and moreold plots and they are including more origins which were included in newly established experi-ments. The aim of this paper is to evaluate the data from all experimental plots with the Scotspine in Poland.
Material and method
Accessible results from experimental plots are an input. I considered latest data both the onespublished as well as not published still but made available by researchers taking care to theexperiments. Data sources are passed in notes to Table 1. For each experimental plot an aver-age and a standard deviation were estimated. Value of the traits for the provenance was ex-pressed as deviation from the average in standard deviation units. Standardized, comparabledata are presented in Table 1. Provenances are grouped in terms of regions of the provenances,in agreement with the directive of Environmental Ministry on March 9, 2004 (DZ.U. No. 67, 621).Results were averaged at first for the provenance, and then for the region of the provenance.Average result for the region of the provenance is shown on Figure 1. The calculations weremade only for Polish origins foreign provenances represented on some experimental plots werenot analyzed.
Results
The grow traits data from all experimental plots with Scots pine in Poland are presented in Table 1.It comes from 27 experimental plots with 76 provenience tested, from 41 provenance regions,including 21 maternal regions for pine. Maternal seed regions (105, 107, 302 and 403) were notrepresented in investigations. The some well-known from literature proveniences were sampledback several times so they are represented more then in one experiment. Mean value for the allregions of provenance in the Figure 1 is marked with solid line and that means that diagramsdirected in up means positive values, and directed in bottom negative. The averaged results forall investigated regions of provenances show that the best origins of pine in terms of grow arelocated in western Poland. From this part of the country only provenance from Bystrzyca Kłodzkarepresenting seed region no 702 is worse then general mean. The provenances from the south-east-ern part of Poland (regions 605, 606 and 661) also grow worse than the average, but the resultscomes mainly from the plots located in different provenance regions. Only one experimental plot(Janуw Lubelski) is located in this region of the country. Pine from Wyszkow (seed region 402)and Parciaki (region 451) grow well. Above the average are also pine from regions 305, 356 and157. Pine trees from region 205, Tabуrz (106) and Mazurian (206) reach results close to theaverage or somewhat below. From the north-east Polish proveniences good growing pine fromSupraњl (207). Pine from mountain-foot region (Grybow and from Nowy Targ) performs worst atall experimental plots.
The detail data concerned growth of the particular provenances can be found in table 1. Analyzingthe growth of pine from Rychtal it can be concluded, that similar to Giertych (1996) paper it resultalmost everywhere with better growth. Only in experiment IBL 1987 on plot in Wyszkow andMurowana Goњlina as well as on experiment of ID-PAN in Lubien it performs slightly worse thangeneral mean value. Pine from Bolewice is growing well in almost all studied locations except offew plots only. Pine from Taborz in this comparison falls out similarly to recapitulation made byGiertych (1996). It achieves result about the average, except of few negative one.

27
Status, Monitoring and Targets for Breeding Programs
Tabl
e 1.
Dat
a co
ncer
ning
gro
wth
trai
ts fr
om P
olis
h Sc
ots
pine
exp
erim
enta
l plo
ts in
sta
ndar
d de
viat
ion
units
(for
dat
a so
urce
see
rem
arks
)

28
Proceedings of the Meeting of Nordic Tree Breeders and Forest Geneticists
Con
tinua
tion
of T
able
1.

29
Status, Monitoring and Targets for Breeding Programs
Con
tinua
tion
of T
able
1.

30
Proceedings of the Meeting of Nordic Tree Breeders and Forest Geneticists
Con
tinua
tion
of T
able
1.

31
Status, Monitoring and Targets for Breeding Programs
Rem
arks
to ta
ble
1.
Stan
dard
ized
dat
a fro
m S
cots
pin
e ex
perim
enta
l plo
ts th
e la
st m
easu
rem
ents
of g
row
ing
traits
. Exp
erim
ents
nam
es c
odin
g: 1
– IB
L 19
62, 2
- IBL
196
4, 3
- IBL
196
6,4
– IB
L 19
77, 5
– IU
FRO
198
2, 6
- IBL
198
7, 7
– IB
L 19
94, 8
– IU
FRO
193
8, 9
– ID
PA
N 1
963,
10
- ID
PAN
196
7, 1
1 - I
D P
AN
197
7, 1
2 –
AR P
oznań
1960
. Tra
its:
M –
vol
ume
m3 /h
a, P
P –
DBH
cro
ss s
ectio
ns a
rea
m2 /h
a, D
– D
BH
, W
- hei
ght.
Sour
ce o
f dat
a: 1
– (K
owal
czyk
200
4), 2
– (K
owal
czyk
et a
l. 20
00),
3 –
(Kor
czyk
2002
), 4
– (R
ożko
wsk
i 200
5), 5
– (R
ożko
wsk
i 199
9), 6
– (O
leks
yn e
t al.
1999
), 7-
(Chm
ura
2000
), 8
– (O
leks
yn 1
988)
, 9 -
(Ole
ksyn
, Rac
hwał
199
4), 1
0 –
(Bar
zdaj
n20
00),
11 –
(Rzeźn
ik 1
989)
, 12
– (B
arzd
ajn
2003
), 13
– (Ż
ybur
a 20
03),
14 –
(Sab
or 2
003)
.
End
of T
able
1.
32
Proceedings of the Meeting of Nordic Tree Breeders and Forest Geneticists
Discussion
Presented results of the Scots pine growth analyses are giving us the general image of variabilityof Polish provenances. However this image is painted with the thick brush. That summarizing isuseful in the scale of the all country. The value of presented results is variable. It depends on thetrait, the age of analyzed trees and number and of experimental plots locations. When we lookfrom the present perspective methodology of some experiments is not free from mistakes. Theseeds sampling method for some experiments could not be made in the representative way.Sometimes seeds were collected only from a few trees. Also it happens that detailed informationabout the origin of tested provenance is not available. It results in difficulties to relate results toparticular forest stands.
On the other hand however, it is possible to separate provenance regions where Scots pine ischaracterized with good growth confirmed on several experimental plots. Sometimes the bestprovenances characterized with good growth traits, the same time have bad quality. For examplethe pine from Bolewice in Sкkocin experimental plots (IBL 1966) is the best with volume and the
Figure 1. Average value in standards deviations unit of Scots pine Polish provenances.

33
Status, Monitoring and Targets for Breeding Programs
same time characterize the worst stem straitens (Kowalczyk et al. 2000). It is also not possible toestimate breeding value of provenance taking into account only one trait. The research on pineprovenance evaluation was indicated by many authors (Giertych 1993, Shutyaev, Giertych 2000,Stephan, Liesebach 1996, Sabor 1994). However the whole sense of provenance experimentsconcerns on looking for better foreign populations compare to local. Usually such populationshave been possible to find (Giertych 1993).
Scots pine selection in Poland is based mostly on population selection. It assures lower geneticgain than selection based on family selection, but in the some way is more secure, providingbigger lever of genetic variability.
Conclusion– In Poland until now, 27 experimental plots with Scots pine were established, with 76
proveniences tested from 41 regions of provenances.– The best origins of pine concerning the quantity traits grow in western Poland.– The detail data concerned grows of the particular provenances can be fond in table 1.
ReferencesBarzdajn W. 2000. Doświadczenie proweniencyjne nad zmiennością sosny zwyczajnej (Pinus sylvestris L.)
serii IUFRO 1982 w Nadleśnictwie Supraśl. Sylwan. 144, 6, 41-52.Barzdajn W. 2004. Badania porównawcze populacyjnej i rodowej zmienności cech hodowlanych wybranych
pochodzeń sosny zwyczajnej, modrzewia europejskiego, świerka pospolitego oraz dębu szy-pułkowego. Katedra Hodowli Lasu Wydziału Leśnego AR w Poznaniu. Maszynopis
Chmura D., J. 2000. Analysis of results from a 59-years-old provenance experiment with Scots pine (Pinussylvestris L.) in Lubień, Poland. Dendrobiology. 45, 21-29
Giertych M. 1993. Zmienność proweniencyjna. w: Biologia sosny zwyczajnej. Sorus. Poznań-Kórnik. 325-339.
Giertych M. 1996. Zmienność proweniencyjna sosny zwyczajnej (Pinus sylvestris L.) w Polsce. Materiałyna sesję naukową Sosna w Polsce – stan, problemy, perspektywy. PTL. Warszawa.10-19.
Korczyk A., F. 2002. Jakość hodowlana drzewostanów sosnowych oraz wartość hodowlana I genetycznadrzew doborowych I porównawczych sosny zwyczajnej (Pinus sylvestrris L.) ośmiu polskichpochodzeń. Prace Instytutu Badawczego Leśnictwa. Rozprawy i monografie. 3., 1-125. Warszawa.
Kowalczyk J. 2004. Zestawienie danych z pomiarów z powierzchni doświadczalnych z soną. IBL. Maszynopis.Kowalczyk J., Matras J., Żybura H., Sabor J., Barzdajn W. 2000. Zmienność sosny pospolitej i hodowlana
wartość jej proweniencji. Dokumentacja IBL. 1-164.Oleksyn J. 1988. Height Growth of Different European Scots Pine (Pinus sylvestris L.) Provenances in a
Heavily Polluted and a Control Environment. Environmental Pollution 55, 289-299.Oleksyn J., Rachwał L. 1994. Wzrost europejskich populacji sosny zwyczajnej (Pinus sylwestris L.)w
doświadczeniu proweniencyjnym SP-IUFRO-1982 w Puszczy Niepołomickiej. Sylwan 137, 9, 57-69Oleksyn J. Reich P. B., Chałupka W., Tjoelker M. G. 1999. Differential above - and below-ground biomass
accumulation of european Pinus sylvestris populations in a 12-year-old provenance experiment.Scand. J. For. Res. 14:7-17.
Rożkowski R. 1999. Analiza wyników 35-letniego doświadczenia proweniencyjnego z sosną zwyczajną(Pinus sylvestris L.). Arboretum Kórnickie 44: 74-86
Rożkowski R. 2005. Dane z pomiarów na powierzchniach doświadczalnych z sosną zwyczainą ID PAN wKórniku (maszynopis)
Rzeźnik Z. 1989. Ocena hodowlana drzewostanów sosny zwyczajnej (Pinus sylvestrris L.) powstałych znasion drzew dorodnych, w okresie pierwszych 25 lat życia. Roczniki Akademii Rolniczej. Poznań.207, 85-99.
Sabor J. 1994. Breeding value of Polish provenances of Scots pine in the Carpathian Mountains. Proceed-ings of the IUFRO S.02.18 Symposiom Lithuania. Kaunas/Girionys. 157-168.
Sabor J. 2003. Badania porównawcze populacyjnej i rodowej zmienności cech hodowlanych wybranychpochodzeń sosny zwyczajnej, modrzewia europejskiego, świerka pospolitego oraz dębu szypułkowego.Katedra Nasiennictwa, Szkółkarstwa i Selekcji Drzew Leśnych Wydziału Leśnego AR w Krakowie.Maszynopis.

34
Proceedings of the Meeting of Nordic Tree Breeders and Forest Geneticists
Shutyaev A.M., Giertych M. 2000. Genetic subdivisions of the range of Scots pine (Pinus sylvestris L.) basedon a transcontinental provenance experiment. Silvae Genetica. 49:3, 137-151
Stephan B. R., Liesebach M. 1996. Result of the IUFRO 1982 Scots pine (Pinus sylvestris L.) provenanceexperiment in southwestern Germany. Silvae Genetica. 45, 5-6, 342-349
Żybura H. 2003. Sprawozdanie z realizacji prac badawczych w 2003 roku. Badania porównawczepopulacyjnej i rodowej zmienności cech hodowlanych wybranych pochodzeń sosny zwyczajnej,modrzewia europejskiego, świerka pospolitego oraz dębu szypułkowego. Maszynopis, Wydział Leśny,Katedra Hodowli Lasu, SGGW Warszawa.

35
Status, Monitoring and Targets for Breeding Programs
PROGENY GROWTH CHARACTERISTICSIN 34-YEAR-OLD GEOGRAPHICAL TRIAL PLANTATIONS
OF SCOTS PINE (PINUS SYLVESTRIS) AT JДRVSELJA, ESTONIA
Malle Kurm1), Tхnu Mцls2) and Tiit Maaten1)
1) Department of Forest Biology, Institute of Forestry and Rural Engineering,Estonian Agricultural University, Tartu, Estonia
2) Department of Bioinformatics, Institute of Molecular and Cell Biology,Tartu University, Tartu, Estonia
Abstract
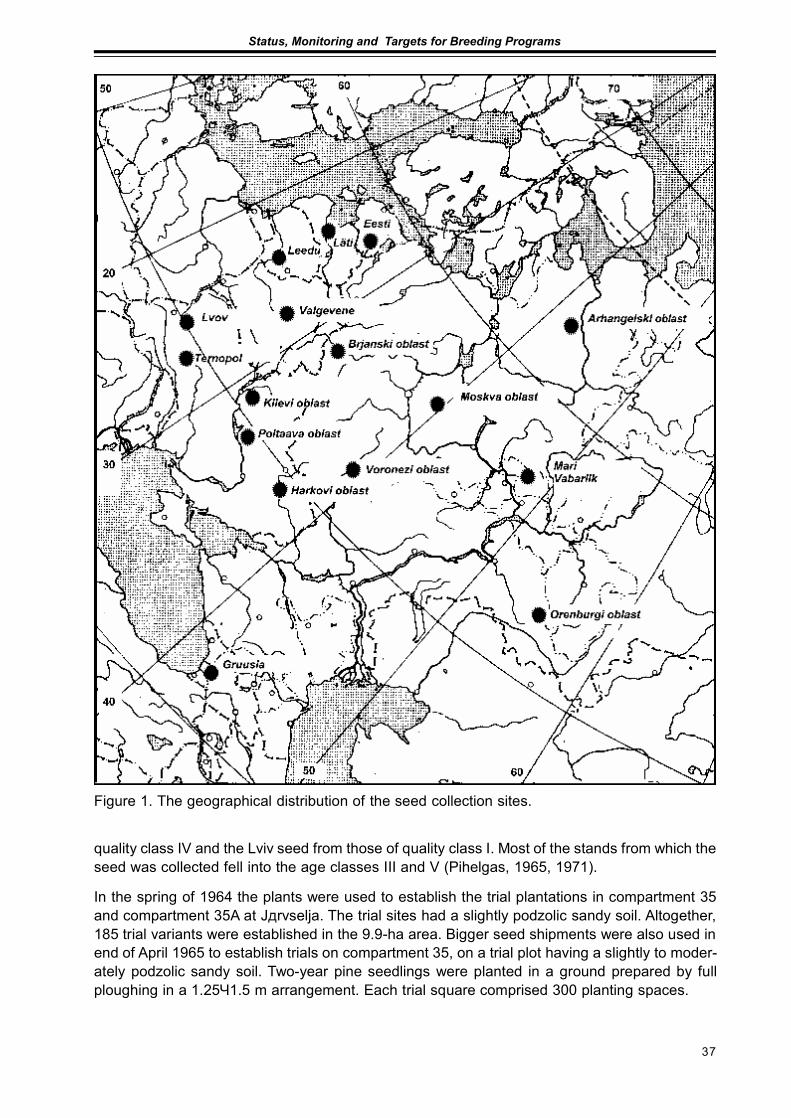
This paper analyses height and diameter increments in 33-35-year old pine plantations estab-lished at Jдrvselja, Estonia, using seeds from 34 different regions of the former Soviet Union.The northernmost seeds were obtained from Arkhangelsk Province (lat.63°N), the southernmostfrom Georgia (lat.42°N), the westernmost from Lithuania and Lviv (long.24-27°E) and the east-ernmost from Khabarovsk (long.126°E). It appeared that height increment differed considerablyfor trees of different geographical provenance. The shortest were pines grown from seeds origi-nating from Georgia (average height 12.5 m at 33.5 years of age) and the tallest were thosegrown from seeds collected in Lithuania (20.1 m), in Latvia (19.6 m) and in Mari El Republic(20.0 m). The breast height diameter of pines growing in Estonia depended on the north latitudeof the seed collection site: the higher the latitude the smaller the diameter. The influence of theeast longitude of the seed collection site on progeny height increment proved insignificant. Apartfrom north latitude, progeny height increment also depended on the local conditions of the seedcollection sites.
Introduction
Scots pine (Pinus sylvestris) grows on a large area in Europe and Asia. Compared to other pinespecies the natural habitat of Scots pine is the most extensive, reaching northwest Norway in thenorth, the British Isles in the west, the Pyrenees in the south and the Sea of Okhotsk in the east(Laas, 1987). Within this extensive habitat, the characteristics of the species evidence a highgeographical variability, which must be taken into account in seed transferrals from one region toanother. On account of its high intraspecific variability and extensive geographical spread anumber of forms are distinguished in Scots pine based on crown shape, stem height, bark,needle length, cone size and other properties.
More information about the variability of different pine populations can be obtained from prov-enance trials, which are of high importance in forest tree breeding. Eriksson and Ekberg (2001)define provenance as «a group of populations or individuals occurring within the same speciesand originating from a more or less strictly specified geographical region». Provenance trials aredesigned to compare the development of trees growing on identical territorial conditions buthaving different provenances. The primary objective of provenance research is to identify theprovenances that are the most productive on a particular growth site. As soon as the best prov-enances are identified in the trials it is possible to select the best stands for seed collection in therespective geographical regions.

36
Proceedings of the Meeting of Nordic Tree Breeders and Forest Geneticists
In the provenance trials of Anderson et al. (2003) pine height evidenced no significant dependenceon growth site conditions, seedling transfer distance or tree age. Research results from Lithuania(Danuseviиius, 2000) show that Scots pine local populations were more tolerant towards extremeenvironmental conditions and towards damage than introduced pines. Scots pine plantations grownfrom seed brought in from more southerly regions, particularly those of forest-steppe, had highergrowth rates than local provenances yet evidenced lower viability, were knottier and had morecrooked stems. Provenances more to the north had earlier growth seasons, were shorter byheight and grew shorter needles, narrower crowns and fine twigs. Abraitis and Eriksson (1996)observed that populations of northerly provenances always exhibited slower growth than thoseoriginating from southerly regions. Nevertheless, some provenances that were introduced, mostlyfrom the Baltic region, grew better than local ones. However, they were more vulnerable to theenvironmental stress than local plantations. In terms of timber mechanical properties, northerlyprovenances had no advantages over local ones.
There are reports that seed may without risk be transferred over distances of 1500 km from eastto west, 100 km from north to south or 500 km from south to east (Kupchinskii et al., 1982).According to J. Wright (1976), however, differences in hereditary properties may already beobservable over a distance of 50 miles (about 80 km). It has been observed in provenance trialsthat height gain is the greater and crown development is the better the greater the distance fromthe original habitat towards northeast or east (Gut et al., 1991). It is also held that provenancetrials reflect fairly accurately the genetic structure of parent populations, and it has been con-cluded that morphological variability of populations is due to modifications caused by environ-mental conditions (Szweykowski et al., 1994).
The objective of the present study is to compare Scots pine trial plantations of different geo-graphical provenances based on their growth characteristics by analysing the data obtainedfrom the geographical trial plantations established under the guidance of E. Pihelgas in 1964–1965 using more modern statistical methods. The results obtained would help to determine thesuitability of different subspecies of Scots pine for Estonian circumstances, which may contrib-ute to the organisation of forest seed management, the development of nursery managementand the purposeful establishment of forest plantations in Estonia.
Material and methods
Material
The geographical trial plantations of Scots pine in Estonia were established by E. Pihelgas, whoin the winter of 1961/1962 turned to a number of educational establishments and research insti-tutions dealing with forestry in the then Soviet Union with a request to send pine seed collectedfrom their respective regions to Estonia for experimental purposes. The request drew 34 Scotspine seed shipments from various regions (Figure 1). The northernmost seed was received fromArkhangelsk Province (lat.63°N.) and the southernmost from Borjomi Forest Enterprise, Geor-gia, situated 800 m above sea level (lat.42°N). The westernmost seed was sent in from Lithuaniaand Lviv (long.24-27°E.) and the easternmost from Khabarovsk (long.126°E.). The Estonianpine seedlings originated from the forest districts of Jдrvselja, Valgejхe, Sхmeru and Koorkьla(Pihelgas, 1970).
The seed shipment from Arkhangelsk Province comprised the subspecies lapponica Fries, theGeorgian seed belonged to the subspecies hamata Fomin and the seed sent from Amur Prov-ince were of the subspecies sibirica Ledebour. All the remaining seed represented ecotypes ofthe subspecies sylvestris L. According to the senders most of the seed was collected from standsof quality class II, with the exception that the Arkhangelsk seed was obtained from stands of
37
Status, Monitoring and Targets for Breeding Programs
quality class IV and the Lviv seed from those of quality class I. Most of the stands from which theseed was collected fell into the age classes III and V (Pihelgas, 1965, 1971).
In the spring of 1964 the plants were used to establish the trial plantations in compartment 35and compartment 35A at Jдrvselja. The trial sites had a slightly podzolic sandy soil. Altogether,185 trial variants were established in the 9.9-ha area. Bigger seed shipments were also used inend of April 1965 to establish trials on compartment 35, on a trial plot having a slightly to moder-ately podzolic sandy soil. Two-year pine seedlings were planted in a ground prepared by fullploughing in a 1.25Ч1.5 m arrangement. Each trial square comprised 300 planting spaces.
Figure 1. The geographical distribution of the seed collection sites.
38
Proceedings of the Meeting of Nordic Tree Breeders and Forest Geneticists
New measurements of the trial plantations established by E. Pihelgas were launched in 1998. Allthe 2278 progeny trees under study were measured for breast height diameter (at the height of1.3 m) using a calliper with a 1-cm accuracy. Based on the mean diameters of each trial variant15 model trees were selected, which were measured using a laser altimeter Vertex for tree height,breast height diameter in the directions NS and EW and live crown length. In the subsequentstatistical analysis the breast height diameter measurements were averaged and designated sim-ply as breast height diameter (D 1,3).
Statistical methods
The measurement results were statistically analysed with the SAS package, version 8.2, mostlyusing the procedure MIXED (SAS Institute Inc., 1990, 1997), which performs the dispersionanalysis of multifactor mixed models.
Two similar models were used for analysis. In the comparison and estimation of particular prov-enances, provenance was taken as a discrete fixed factor; another factor treated as fixed wasprogeny tree age, which was considered continuous. This model, hereinafter referred to as Model 1(see Appendix 1) was used to describe tree growth through third-degree age polynomial, whichwas taken to depend on provenance (site). Year of planting was taken as a random discretefactor. The selection of Model 1 corresponded to the concrete goal set – to study the effect ofseed provenance on the development of progeny trees grown in Estonia.
In the second analysis, which was performed using Model 2 (see Appendix 2), the objective wasto study the effect of the geographical location of seed collection site on progeny tree growthcharacteristics. In this analysis, seed collection site and year of planting were taken as discreterandom factors whereas progeny tree age and seed collection site geographical coordinates(north latitude and east longitude) were treated as continuous fixed factors. Before the statisticalanalysis of height increment tree height was raised to the ѕ power, which resulted in the de-pendence of tree height on tree age becoming more linear, the distribution of prediction residualsbecoming more normal and the dispersion of prediction residuals being less dependent on meanvalue. The final results of the analysis were reconverted to the original height scale (into meters).The parameters characterising tree growth were modelled with tree age a and geographicalnorth latitude p third-degree polynomials as follows:
X = c0 + c1a + c2a2 + c3a3 + c4p + c5p2 + c6p3 + c7ap + c8ap2 + c9a2p + е ,
where X is the characteristic of the tree under study, c0 – c9 are model coefficients that aredependent on characteristic X and are estimated according to the data, and е is an error term(residual term), which is assumed to be of roughly normal distribution. Based on the respectivemodel progeny tree characteristics were estimated and checks were performed on whether treegrowth parameters at that particular age had been dependent on the geographical location ofthe seed collection site.
Considering the specifics of the data progeny tree height increment was based on tree height atthe age of 33.5 years (so-called control age) – at that age the predictions calculated from themodel proved to have the highest statistical accuracy. In reality, predicted heights were used tocompare the height increments of progeny trees planted at different times, irrespective of whetheror not the trees were actually measured at the corresponding age. Such an approach was adopteddue to the fact that predictions are more accurate than simple means as they take into account,via the model, all the data, not only selected measurement results and provenance data sepa-rately.

39
Status, Monitoring and Targets for Breeding Programs
Results and discussion
It appeared from our previous data (Kurm et al., 2003) that pines grown from seed of Estonianorigin, collected from Sхmeru and Vihula, were twice taller than the lowest trees, of Georgianorigin, at the age of 35. The control height of the latter was just 12.5 m. By the use in this paper ofanother control age (33.5 years), an updated database, which was supplemented with measure-ment results from earlier growth stages, and the improved model, which, based on the yield table,also took into account measurements made at earlier tree ages, it was possible to produce moreprecise estimations of progeny control height. Table 1 presents tree height estimations at theselected control age of 33.5 years by provenances. By way of comparison, the table includes themeans of height and breast height diameter for the most extensively studied age groups – 33 and34 years. It appears from the table that the growth characteristics of trees grown from seedscollected in Estonia are somewhat inferior to those of progeny trees of southerly origin.
The dependence of tree height increment on north latitude is illustrated in Figure 2, which hasbeen derived from Model 2. It appears from the figure that in Estonian circumstances the latitudemost favourable for progeny growth is 50-58є. According to literature (Shutajev, Giertych, 20031,20032) the Baltic Region populations show good growth rates in European regions between50-60є north latitude.
Table 1. Progeny tree heights at 33.5 years of age predicted by Model 1 compared to growthparameters at tree ages of 33 and 34 years obtained by simple averaging
Seed origin
Height predicted by Model 1 (m)
± standard error
Mean height at 33 years,
m
Mean height at 34 years,
m
Mean D1,3 at 33 years,
cm
Mean D1,3 at 34 years, cm
Georgia 12.75±0.34 – 12.55 – 20.8 Arkhangelsk 16.46±0.10 16.13 16.60 16.4 15.0 Moldova 17.13±0.32 – 16.43 23.2 Sхmeru 17.23±0.17 17.03 – 16.8 – Perm 17.60±0.32 – 16.99 – 16.7 Vihula 17.88±0.17 17.96 – 17.7 – Poltava 18.15±0.11 18.62 17.78 21.6 24.0 Kirov 18.34±0.32 – 17.95 – 20.2 Kyiv 18.61±0.11 19.48 18.00 26.9 22.4 Latvia (Kalns) 18.64±0.14 – 18.82 – 19.5 Sagadi 18.65±0.14 18.96 – 18.0 – Kharkiv 18.66±0.07 18.81 18.61 22.1 23.1 Valgejхe 18.71±0.11 – 18.79 – 19.4 Jдrvselja 18.82±0.09 19.03 18.15 18.1 22.4 Ternopil 18.88±0.09 19.17 18.41 23.0 24.1 Koorkьla 18.89±0.17 19.14 – 18.6 – Voronezh 19.08±0.09 – 19.29 – 23.2 Zhytomyr 19.09±0.08 19.89 18.23 21.1 21.7 Bryansk 19.35±0.10 18.73 19.68 17.3 21.3 Orenburg 19.42±0.09 19.79 19.11 19.7 18.7 Byelorussia 19.45±0.08 – 19.67 – 20.6 Lviv 19.49±0.10 20.37 19.16 22.3 20.4 Latvia (Jelgava) 19.49±0.11 18.94 19.98 18.5 18.7 Latvia (Tukums) 19.58±0.09 19.63 19.43 18.1 20.7 Moscow 19.58±0.09 – 19.60 – 20.0 Mari El Republic 19.97±0.08 20 19.95 20.3 21.7 Lithuania 20.04±0.09 20.03 20.06 19.0 21.4

40
Proceedings of the Meeting of Nordic Tree Breeders and Forest Geneticists
According to E. Pihelgas (Pihelgas, 1980) the pine plantations established using seed brought infrom Latvia, Lithuania and Byelorussia exceeded the local plantations by growth rate already atyounger ages.
As an improvement on a previous height increment analysis (Kurm et al., 2003), this study addi-tionally analyses progeny tree breast height diameter and stem volume at the control age of 33.5years as depending on seed geographical origin (Figures 3 and 4). It was statistically proved thatin pines growing under Estonian circumstances all the above parameters are dependent onseed geographical origin (P<0.001).
Statistical analysis of our data revealed that in pines growing under Estonian circumstancesbreast height diameter depended on the north latitude of seed collection site, being inverselyproportional to it (Figure 3). The largest breast height diameter (over 21 cm) was observed inpines grown from seed collected in the regions of Kharkiv, Zhytomyr, Ternopil, Voronezh andPoltava. The smallest breast height diameter (16-19 cm) was measured in pines originating fromArkhangelsk, Perm and Estonia (particularly Sхmeru).
It is possible to try to explain all the regularities observed with the hypothesis that as solarradiation is reduced competition for light between trees intensifies and taller trees stand betterchances of adaptation. At the same time the volume of photosynthesis and, accordingly, annualtree mass increment, reduce. As a result, it follows from natural selection that the tree phenotypeadaptation that occurs in northerly populations comes as a compromise between increased
Figure 2. Progeny tree height at 33.5 years as dependent on the geographical north latitude ofseed collection site. The east longitude is adjusted to 32.7є. Dotted lines stand for height predic-tion 95% confidence limits.

41
Status, Monitoring and Targets for Breeding Programs
stem length and decreased stem diameter. Such phenotypic compromises are ingrained in treegenetic or epigenetic heredity and stored into its seed. When the seeds are transferred to Esto-nia, the tree ontogeny program is realised under Estonian circumstances and may be mani-fested precisely as observed in the present paper. At the same time, the ontogeny suitable formore southerly circumstances may not be optimal in northerly environments of lesser light andcolder climate. It may be assumed that in such harsh conditions the higher growth rate of treesof southerly origin runs increased risk against other factors (windbreaks, pathogen resistance,etc.). An indirect proof of the assumption is the fact that the pines of Amur provenance have alldied and that only two pines of Georgian provenance planted in 1964 have been found. In likefashion, pines originating from Stanislav, Zhytomyr, Kharkiv and Poltava (49-51є north latitude)have suffered substantial losses. Consequently, all the pines originating from Far East and fromthe south have died, the cause being, according to E. Pihelgas (1980), low resistance to pineneedle cast fungus and other fungal diseases. It appeared that Scots pine subspecies hamataFomin and sibirica Ledebour had proved unfit for Estonian circumstances. Apart from local plan-tations, one established using seed from Arkhangelsk (P. silvestris subs. lapponica Fries) hassurvived; however, it is growing at a relatively slow rate.
Conclusion
The results of this study enable the determination of the regions from where it would be reason-able to bring in seed for use in Estonia, as well as the identification of the regions from where it
Figure 3. The diameter of 33.5-year-old progeny trees at the height of 1.3 meters as dependenton the geographical north latitude of seed collection site. The east longitude is adjusted to 32.7є.Dotted lines stand for breast height diameter prediction 95% confidence limits.
42
Proceedings of the Meeting of Nordic Tree Breeders and Forest Geneticists
would be unreasonable to bring in seed to Estonia to avoid errors like those made in the past withthe plantations of Darmstadt pine. Statistical analysis of our data showed that in Estonian circum-stances the seed provenance latitude most favourable for progeny growth is 50-58є. Already atyounger ages pine plantations established using seed brought in from Latvia, Lithuania andByelorussia exceeded local plantations by growth rate. The breast height diameter of pines grow-ing in Estonian circumstances depended on the north latitude of seed collection site, being in-versely proportional to it. It appeared that Scots pine subspecies hamata Fomin and sibirica Ledebourhad proved unfit for Estonian circumstances. Similarly, the plantation established using seed fromArkhangelsk (P. silvestris subs. lapponica Fries) is growing at a relatively slow rate.
Acknowledgement
The authors are grateful to the Estonian Science Foundation, the research support (GrantNo. 4724 and No. 5984) of which was used in the performance of this study.
ReferencesAbraitis, R., Eriksson, G. 1996. Pinus sylvestris L. East European populations: growth and behaviour in
one Lithuanian field trial. – Baltic Forestry, 2 (2), 28–35.Anderson, B., Elfving, B., Ericsson, T., Persson, T., Gregorsson, B. 2003. Performance of improved Pinus
sylvestris in Northern Sweden. – Skandinavian Journal of Forest Research, 18(3), 199–206.Danuseviиius, J. 2000. Breeding of Pines. Kaunas, 352 p.Eriksson, G., Ekberg, I. 2001. An Intruduction to forest genetics. Uppsala, 166 p.Gut, R. T., Krinitskii, G. T., Goroshko, M. P. 1991. The ecological conditioning of the growth of Scots pine
in provenance-trial plantations. – Lesovodstvo Lesnye Kultury i Pochvovedenie, 62–72.Kupchinskii, V. L., Gorbunova, G. A., Popov, P. P. 1982. Provenance trials of Pinus sylvestris in the Sverdlovsk
region. – Lesnoe hozjaistvo, 9, 45–47.Kurm, M., Mцls, T., Tamm, Ь. 2003. Hariliku mдnni (Pinus sylvestris) kхrguskasvu sхltuvus seemnete
pдritolust (The dependence of height increment on seed provenance in Pinus sylvestris). –Metsanduslikud uurimused (Forestry studies) XXXVIII. Tartu, 46–57.
Laas, E. 1987. Dendroloogia (Dendrology). Tallinn, 824 lk (p).Pihelgas, E. 1965. Seemnete geograafilise pдritolu mхju mдnniseemikute kasvule (The influence of geo-
graphical provenance to growth characteristics of Scots pine seedlings). – EPA teaduslike tццdekogumik (Transactions of the Estonian Agricultural Academy) 41. Tartu, 17–24.
Pihelgas, E. 1970. Geneetika ja selektsioon metsamajanduses (Genetics and Tree Breeding in Forestry).Tallinn, 282 lk (p).
Pihelgas, E. 1971. Hariliku mдnni selektsiooni alused ENSV tingimustes (The Basis of Breeding of Scotspine in Estonian circumstances). – Doktoridissertatsioon (The Ph.D. Thesis). Tartu, 626 lk (p).
Pihelgas, E. 1980. Hariliku mдnni geograafilised katsekultuurid Eesti NSV- s (Geographical trial planta-tions of Scots pine in Estonia). – EPA teaduslike tццde kogumik (Transactions of the EstonianAgricultural Academy) 128. Tartu, 57–65.
Shutyaev, A. M., Giertych, M. 20031. Genetic Subdivisions of the Range of Scots Pine (Pinus sylvestris L.)Based on a Transcontinental Provenance Experiment. – Scots pine (Pinus sylvestris L.) in Euraasia –a map album of provenance site interactions. Kornik, 24–38.
Shutyaev, A. M., Giertych, M. 20032. Height Growth Variation in a Comprehensive Eurasian ProvenanceExperiment of (Pinus sylvestris L.). – Scots pine (Pinus sylvestris L.) in Euraasia – a map album ofprovenance site interactions. Kornik, 6-23.
Szweykowski, J., Prus-Glowacki, W., Hrynkiewicz, J. 1994. The genetic structure of Scots pine (Pinussylvestris L.) population from the top of Szczeliniec Wielki Mt., Central Sudetes. – Acta SocietatisBotanicorum Poloniae 63 (3/4), 315–324.
SAS Institute Inc. SAS/STAT Software: Changes and Enhancements through Relase 6.12. Cary, Nc, USA:SAS Institute Inc., 1997.
SAS Institute Inc. SAS/STAT User“s Guide Volume 2, GLM – Varcomp. Cary, NC, USA: SAS Institute Inc.,1990.
Wright J. W. 1976. Introduction to Forest Genetics. Academic Press. New York.

43
Status, Monitoring and Targets for Breeding Programs
Appendixes
Appendix 1.Core of the SAS program for predicting the height of progeny trees at the age of 33.5(Model 1). Abbreviations: geogr – initial dataset, where the height of trees or the average ofheights has the pover of ѕ (the corresponding variable is H075), koht – the seed collection site,N – number of the averaged trees, age – the age of the trees, istutusA – the year when a treewas planted, preds – the file that contains predicted heights of the trees
proc mixed data=geogr covtest;class koht istutusA;weight N;model H075= koht age(koht)|age(koht)|age(koht)
/ noint solution htype=3 outpm=preds;random istutusA ;
title “Prognoosid 33.5a”;estimate “ARHANGELSKI”
koht 1age(koht) 33.5age*age(koht) 1122.25age*age*age(koht) 37595.375 / cl;
. . . . .
estimate “LEEDU” koht 0 0 0 0 0 0 0 0 1age(koht) 0 0 0 0 0 0 0 0 33.5age*age(koht) 0 0 0 0 0 0 0 0 1122.25age*age*age(koht) 0 0 0 0 0 0 0 0 37595.375 / cl;
. . . . .run; quit;
Appendix 2. Core of the SAS program for analyzing the dependence of the growth of progenytrees on the northern latitude (Model 2). Abbreviations: puudkoos – the initial dataset, where theheight of trees, or the average of the heights, has the power of ѕ (the corresponding variable isH075), koht – the seed collection site, N – number of the averaged trees, age – the age of thetrees, pl – northern latitude, preds – the file that contains predicted heights. In order to get someadditional predictions, a fictitios dataset has been added to the initial data. Instead of H075,abbreviations RD or TR have been respectively used in the evaluation of the geographical de-pendence of breast height diameter (RD) and the volume of the trunk (TR)
proc mixed data=puudkoos covtest;class koht;weight N;model H075= age|age|age|pl|pl|pl@3
/ solution htype=3 outpm=preds;random koht;
run; quit;

44
Proceedings of the Meeting of Nordic Tree Breeders and Forest Geneticists

45
Status, Monitoring and Targets for Breeding Programs
UNBALANCES IN TREE BREEDING
Dag LindgrenDepartment of Forest Genetics and Plant Physiology,
Swedish University of Agricultural Sciences, UMEЕ, Sweden
Abstract
Applications of unbalance in tree breeding are discussed. Unbalance has the potential to makethe breeding more efficient. But management of unbalance is not fail-safe and requires oftenconsiderable competence. The benefits of unbalance may sometimes appear larger than theyare in the long run and in the real world. On the other hand, unbalance is practically unavoidableand thus breeders have to deal with it anyway, and moderate unbalances are unlikely to havesignificant negative effects and thus seem fail-safe. It could be a good idea to apply unbalancewith some moderation compared to what may seem optimal from individual simplified studies.When appreciable benefits seem likely, the implementation of moderate unbalance seemsrecommendable.
Why unbalances?
It is desirable to maintain genetic variation in breeding stock. Gene diversity is a quantitativemeasure of how well genes are conserved; from a conservation point of view it does not matterif they are good or bad, but to obtain high gain it is of course important to increase the represen-tation of the good genes. Thus balanced breeding with equal contributions is not expected to betheoretically optimal.
In the gene mass of future breeding stock and propagation populations, the best part of thecurrent breeding population will be overrepresented. It is thus more important to improve thebetter part of the gene mass than the worse. More resources can be spent on improving bettergene mass than worse. Such a strategy will increase the realized average gain.
Unequal genetic distributions are the standard in Nature, and cannot be avoided. This is thedriving force for evolution and a fundament for existence of life. It is the essence of geneticimprovement that some are selected, while others are not.
Unbalanced selection offers more degrees of freedom and a more optimal consideration ofessential elements of breeding (gain, diversity, time and cost).
Even a limited extra increase in efficiency (e.g., 5% increase of gain) may correspond to a hugesum of money for an expensive and important crop. Even if it is mathematically difficult andpractically impossible to optimize the degree of unbalance, used with common sense and somecare it ought to be possible to apply unbalance so the result become better than balance insituations when the added gain makes it worthwhile.
Utilizing unbalance may mean more gain faster, and it may be worth that even at the cost of areduced potential for more gain later.
46
Proceedings of the Meeting of Nordic Tree Breeders and Forest Geneticists
Against unbalances
In a closed ideal population, the gene diversity is maximized if different genetic components areequally represented. It is not fail-safe to apply unbalance; efforts may result in a worse situationthan perfect balance. Breeding goals, genetic parameters and environments change over time,are difficult to predict and predictions has errors, while the effect of the unbalances may remain.Optimization of unbalance requires knowledge of certain parameters which are not accuratelyknown and draws resources to get estimates of, larger resources the better estimates. Gains ofusing imbalance may be evident when measurement characters are considered, but the effectson other characters are less predictable. That means creation and optimization of unbalancesmay appear more favorable than it really is in the long run. Studies are often set up to demon-strate an effect and use simplifications. Results indicating considerable effects tend to be pub-lished and get more attention by both authors and readers compared to absence of effects orsmall effects. Therefore, if an effect is found, studies tend to overestimate the size in the realWorld. Safety bids that one does not change drastic at once from one extreme complete bal-ance to the opposite extreme of strong unbalance based on a few undigested studies withoutmuch consideration about possible loopholes. It would not be politically correct to suggest theextreme, it would probably be counter-productive and raise suspicion and make it more difficultto implement a less drastic version. Striving for balance is a clear and simple strategy. Unbalanceis demanding on competence and it takes time, effort and management skills to considerunbalances. Considering practicalities and difficulties to find the optimum, balanced breedingmay still sometimes be regarded as best from an operational point of view when the advantageof unbalance appears marginal or doubtful.
Different unbalances
There are different types of unbalances, which will be discussed to a varying degree:• Unbalance in components (parents);• Unbalance in resources;• Structure of breeding population (e.g. mating probability; PAM, Positive Assortative Mat-
ing, which means that similar parents are mated)
Unbalances in the propagation population
The simplest case is the propagation population, where only unbalance in components (clones)matter. The basic idea that unbalanced representation of genetic materials could offer advan-tages in forest tree breeding was first introduced for deployment of clones in seed orchards. Thefirst speculation that unbalances may be favorable was done by Lindgren (1974). The propaga-tion population was a seed orchard, which is the most common propagation population. Math-ematical development showed that a linear relation between the amount of deployed geneticunits (clones) and their breeding value resulted in an optimal balance between effective number(status number, gene diversity) and breeding value, the first suggested application was formu-lated by Lindgren and Matheson (1986). It was widened to deployment of clones for clonalforestry (Lindgren, Libby and Bondesson 1989) and developed to be applicable for genetic thin-ning by Bondesson and Lindgren (1993) and Prescher et al. (2004). The advantage and charac-teristics of the method have been mathematically quantified (Lindgren 1991, Lindgren 1993).

47
Status, Monitoring and Targets for Breeding Programs
Further on to the production population
The production population is generated from the propagation population, but there are somesteps between propagation population and production population. The propagation populationis typically an open pollinated seed orchard. Unequal number of ramets will occur even if it is notdirectly intended, e.g. current clonal seed orchards are usually characterised by unequal numberof ramets of different clones (Kang 2001). Thus equal representation is hardly a realistic alterna-tive, neither does it offer advantages. It may be true that - given the clone number - the effectiveclone number is highest if clones have equal number of ramets, but a moderate increase inclone number is almost always a better way to meet a demand for increased effective clonenumber. Many other factors than ramet number contribute to the unbalance in seed orchardcrops (Bila 2000, Olsson 2001, Kang 2001). Genotypes in a seed orchard differ in reproductivesuccess, and there are differences between the male and female success, and male and femalemay be correlated to different degree. There is pollen migration into the seed orchard. Relatedgenotypes may occur. Only some clones may be harvested. There are phenomena also after thecone harvest contributing to unbalance: seed extraction, seed fractionation, germination, nurs-ery mortality, field mortality, naturals in plantations... The details about these phenomena occur-ring in the steps between the propagation population and production and possible responsesare beyond the scope of this study.
Unbalances at the set up of a tree improvement program
Given a population with a structure of unrelated families it was possible to identify an optimumunbalance in selecting individuals from different families (Lindgren, Wei and Bondesson 1993).Optimum unbalance in deployment of individuals from different families is close to linear deploy-ment, thus the number of selected from a family will be approximately linear related to the breed-ing value of the family, for at least some cases (Wei and Lindgren 1995).
The optimal number of families at the start of a breeding program was calculated as a function ofcost components, heritability and desired effective population size (Lindgren, Wei and Lee 1997).The optimization allowed for unequal contribution from families, but the calculations were keep-ing the effective number constant and did not focus on unbalance. If the price of families (plustrees to use for crosses) is high, it may be worth investing a large share of available resources toget many unrelated families to start with. If the cost per family is low, it is advantageous to havea much larger number of families at the start than the effective number headed for.
Some studies mentioned below have been done more or less based on the Swedish breedingprogram, thus some information about that is given. The Swedish breeding stock is structured in46 subpopulations of Scots pine and Norway spruce, the long term breeding population size(number of trees contribution to the next generation breeding stock in one of the populations) isplanned to be 50. Ruotsalainen (2002, popularized in Swedish by Rosvall et al. 1999) studiedthe possible advantage of different contributions from different plus trees at the establishment ofthe breeding population. A comparison between unbalanced and balanced is done in Table 1. Inthe example there are 200 tested plus trees available for a population, which is rather typical.The highest ranking ones are used as founders and the contribution of the founders to thesubsequent F1 breeding population is either 1, 2 or 3 (the standard variant of the Swedish treeimprovement program is 2). The contribution of plus trees which are not used as founders anddo not contribute to the breeding population is of course 0. This was organized so that one andonly one individual was foreseen selected in each full sib family (within family selection). Thecompared alternatives (unbalanced versus balanced) use the same amount of resources: the
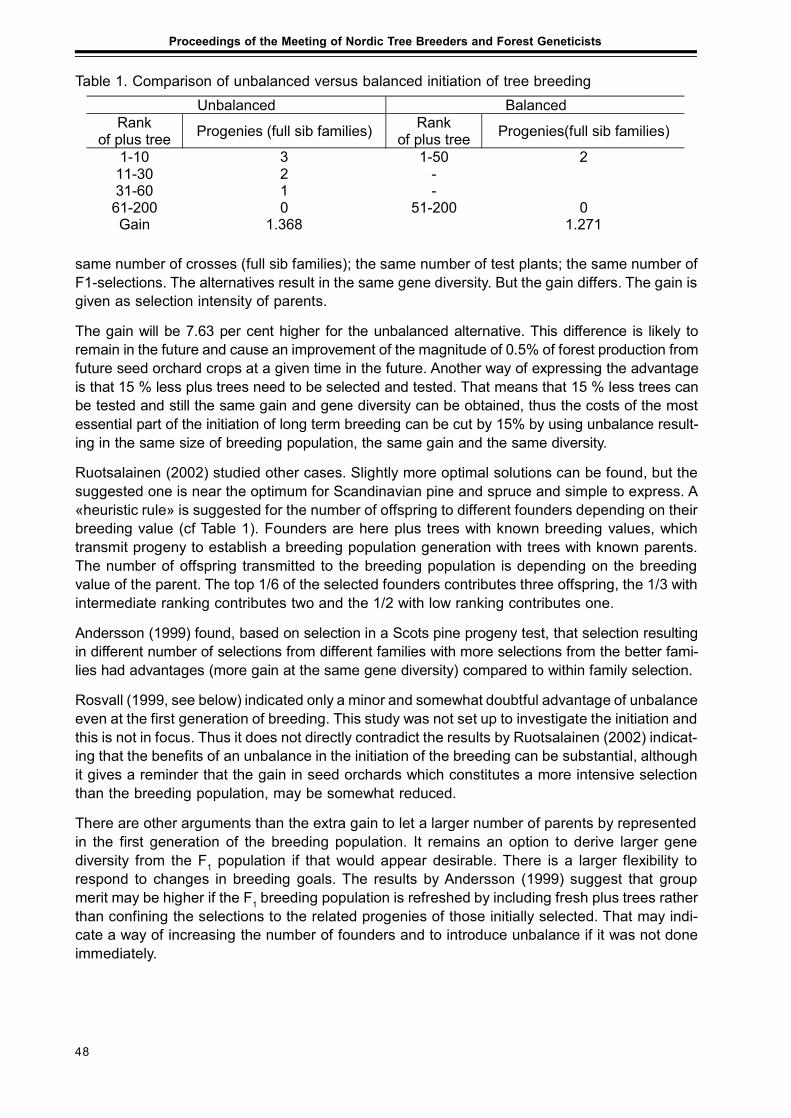
48
Proceedings of the Meeting of Nordic Tree Breeders and Forest Geneticists
same number of crosses (full sib families); the same number of test plants; the same number ofF1-selections. The alternatives result in the same gene diversity. But the gain differs. The gain isgiven as selection intensity of parents.
The gain will be 7.63 per cent higher for the unbalanced alternative. This difference is likely toremain in the future and cause an improvement of the magnitude of 0.5% of forest production fromfuture seed orchard crops at a given time in the future. Another way of expressing the advantageis that 15 % less plus trees need to be selected and tested. That means that 15 % less trees canbe tested and still the same gain and gene diversity can be obtained, thus the costs of the mostessential part of the initiation of long term breeding can be cut by 15% by using unbalance result-ing in the same size of breeding population, the same gain and the same diversity.
Ruotsalainen (2002) studied other cases. Slightly more optimal solutions can be found, but thesuggested one is near the optimum for Scandinavian pine and spruce and simple to express. A«heuristic rule» is suggested for the number of offspring to different founders depending on theirbreeding value (cf Table 1). Founders are here plus trees with known breeding values, whichtransmit progeny to establish a breeding population generation with trees with known parents.The number of offspring transmitted to the breeding population is depending on the breedingvalue of the parent. The top 1/6 of the selected founders contributes three offspring, the 1/3 withintermediate ranking contributes two and the 1/2 with low ranking contributes one.
Andersson (1999) found, based on selection in a Scots pine progeny test, that selection resultingin different number of selections from different families with more selections from the better fami-lies had advantages (more gain at the same gene diversity) compared to within family selection.
Rosvall (1999, see below) indicated only a minor and somewhat doubtful advantage of unbalanceeven at the first generation of breeding. This study was not set up to investigate the initiation andthis is not in focus. Thus it does not directly contradict the results by Ruotsalainen (2002) indicat-ing that the benefits of an unbalance in the initiation of the breeding can be substantial, althoughit gives a reminder that the gain in seed orchards which constitutes a more intensive selectionthan the breeding population, may be somewhat reduced.
There are other arguments than the extra gain to let a larger number of parents by representedin the first generation of the breeding population. It remains an option to derive larger genediversity from the F1 population if that would appear desirable. There is a larger flexibility torespond to changes in breeding goals. The results by Andersson (1999) suggest that groupmerit may be higher if the F1 breeding population is refreshed by including fresh plus trees ratherthan confining the selections to the related progenies of those initially selected. That may indi-cate a way of increasing the number of founders and to introduce unbalance if it was not doneimmediately.
Table 1. Comparison of unbalanced versus balanced initiation of tree breedingUnbalanced Balanced
Rank of plus tree Progenies (full sib families) Rank
of plus tree Progenies(full sib families)
1-10 3 1-50 2 11-30 2 - 31-60 1 - 61-200 0 51-200 0 Gain 1.368 1.271

49
Status, Monitoring and Targets for Breeding Programs
Unbalances in long-term breeding
Since some decades the major idea in creating unbalances in breeding is by «nucleus breed-ing». Nucleus breeding refers to the stratification of the breeding population into distinct groupsbased on estimated genetic value, usually a two-tier elite and a main subpopulations. The keyidea is to concentrate more of the breeding effort on the elite, where maximum gain will beachieved, with less emphasis placed on the main, which is mainly for preserving genetic varia-tion. This system was initially used in sheep breeding (James 1977), but has later been incorpo-rated into forest trees (Cotterill 1989). This basic idea of structuring the breeding population canbe developed into something more sophisticated, e.g. PAM combined with breeding effort re-lated to breeding value.
Short-term gain is maximized by selection for breeding value. Breeding value can be estimatedbased on information from relatives. A simple case is to form an index (thus calculate predictedbreeding value) of the individual performance and family performance. Selection for that can becalled index selection and maximizes gain. But in long term breeding the loss of gene diversitywill cause a loss of additive genetic variance and thus a reduction in the response to selection.Thus maximizing genetic gain in the short term will cause reduced genetic gain in the long term.It is a matter of optimization. The longer breeding program is considered, the more important forgenetic gain at the end it is to conserve gene diversity. In the real long term, the assumptions forthe used models break down (e.g. as mutations occur). Novel approaches to genetic improve-ment are likely to take over a century ahead. Current breeders responsibility may be restricted tokeep options open for the foreseeable future. Management of genetic resources of forest treesmay include guarding the genetic resources for gene diversity and other aspects so a reason-able situation a century ahead seems likely, but it is debatable if the responsibility stretchesbeyond that. Therefore it does not seem meaningful to consider more than five generationswhen cycling time is several decades.
Once the breeding population is closed, the ultimate long-term response is maximized by bal-anced within family selection (Dempfle 1975). However this ultimate limit is irrelevant for trees,as it lies a large number of generations ahead.
Breeding can be seen as a balance between gain and gene diversity. Earlier the needed numbercrunching power did not exist and that put strong constraints on what could be done, much of thetheoretical basis some decades ago appeared rather abstract. For forest tree applications anessential landmark was the PhD thesis of Wei (1995). It become evident that tree breedingmaximizing breeding value and not considering loss in gene diversity (build up of relatedness)had the potential to erode the diversity severely. For managing unbalances the application of«status number» (group coancestry) was essential (Gea 1997, Lindgren and Kang 1997).
Rosvall (1999) used the breeding simulator POPSIM (Mullin and Park 1995) to simulate a caserelevant for the planned Swedish long-term breeding of Norway spruce. (The latest version ofPOPSIM is referred to in Lstiburek, 2005). The value of the breeding population was seen as itscapacity to support seed orchards. Higher gene diversity in the breeding population makes itmore able to support selections with high breeding value to seed orchards (Figure 1). Differentways of introducing unbalance was used. Unbalance appeared to offer only minor advantages(e.g. Figure 1).
Rosvall (1999) assumed testing of the recruitment population, which means high heritability. Bal-ance is more favorable when heritability is high as then the family component of selection be-comes unimportant. An option for long term Swedish Scots pine breeding is selection of untestedgenotypes for the breeding population, and in that situation the advantage of unbalance can be

50
Proceedings of the Meeting of Nordic Tree Breeders and Forest Geneticists
Figure 1. Genetic gain as a function of gene diversity remaining after five generations in a simu-lation of a program similar to Swedish Norway spruce breeding. (Single pair mating, progenysize 50, high heritability with clone testing.) The rightmost diversity values correspond to maxi-mizing balance (strict within family selection, each member in the breeding population get ex-actly two offspring transferred to next breeding population generation). Some of the genetic gainlost in the breeding population, when that is run for high genetic gain, is recovered then formingseed orchards. The extra genetic gain obtained by applying unbalance becomes rather small.The figure is based on Rosvall (1999).
Genetic gain
0
10
20
30
40
50
60
70
80
0 5 10 15
Gene diversity (status number) in the breeding population
Seed orchard (propagation population)
Breeding population
based on Rosvall 1999
expected to be larger. An advanced generation «seed orchard» is likely to be designed in a com-plex and sophisticated way, thus the idea of classifying the «goodness» of an advanced breedingpopulation by a seed orchard derived from it could be developed and it does not seem impossiblethat unbalance in the breeding population will carry a smaller penalty with such a more developedmeasure.
It may be noted that the balance becomes less important the higher the breeding population sizeis, thus unbalance may be more justified in breeding programs using large breeding populations.
Sanchez (2000) concluded, based on quantitative simulation, that a slight unbalance could bemore favorable in breeding than complete balance, as it leads to more gain without a corre-sponding loss of genetic diversity.
Lindgren and Wei (1994) studied the effect of selection in a population composed of an infinitenumber of equally sized unrelated families. The selection criterion was a weighted average offamily value and individual value. By using different weights of family versus individual, a gain/diversity relation was developed. Among family selection and within family selection appearedas extremes, and index selection where family and individual are optimally weighted to maximizegain of cause appears as a peak. They got results, which indicated an unfavorable gain/diversityrelation for completely balanced within family selection. Their study was based on infinitepopulations and normal distributions, while later studies have used limited population andpopulations truncated by selection, and also other inputs closer to forest tree breeding. Even if a
51
Status, Monitoring and Targets for Breeding Programs
drop in efficiency has been observed also in later studies, its magnitude seemed smaller thatnoted by Lindgren and Wei (1994).
It is practically easier, more transparent, less competence demanding and more fail-safe to man-age balanced selection than intentionally unbalanced in the first breeding generations, so ad-vantages of the magnitude observed by Rosvall (1999) may not be regarded as sufficient motiveto apply intentional unbalance in the long term breeding.
Population-wide PAM appeared, based on POPSIM simulations, to offer advantages comparedto structuring of the breeding population in elite and main (Lstibщrek 2005). The advantage ofPAM was emphasized if test effort was linearly related to breeding value (see below).
Change per generation at a given breeding population size does not say everything
Perhaps it should not be the loss of gene diversity per generation but the annual loss, whichshould be in focus. Both annual gain and annual diversity loss are affected by both the degree ofunbalance and the duration of a generation. More unbalance and longer generation time maypossible result in both higher gain and less loss in gene diversity at a certain time. A high degreeof balance is one they of increasing gene diversity but another way is to increase breedingpopulations size, and there may be trade-offs. An optimization e.g. maximizing gain per year ata given gene diversity loss per year allowing variation in testing time, breeding population sizeand degree of unbalance simultaneously has never been done and unbalance may appearfavorable. Using fixed generation times and breeding population size may be somewhat mis-leading. Application and extension of the methods used by Wei and Lindgren (2001) andDanusevicius and Lindgren (2005) could be helpful in more sophisticated studies. Multi-genera-tion studies usually assume that the breeding population is managed in the same way overgenerations, but the optimum may be to deal with them differently, and that may give larger roomfor unbalance.
Rolling front breeding
Forest Tree breeding is almost certainly better made in a rolling front system (Borralho andDutkowski 1998) than in discrete generations turned over at the same time. It just does not workto get all needed crosses and other operations done at the same time in an operative breedingprogram. For Swedish breeding, the status of the breeding populations are annually reviewed(Sonesson et al. 2005), the problem of managing a breeding population synchronous is evident.In advanced breeding it will turn out advantageous to mate individuals from different genera-tions. In rolling front breeding perfectly balanced breeding become rather meaningless and doesnot appear simple any more. A rolling front strategy may be optimized by using group meritannual progress as the criterion on efficiency (Wei and Lindgren 2001, Danusevicius and Lindgren2005)
Stratified sublines with and without unbalance
Stratified sublines (Ruotsalainen 2002, Lindgren et al 2004) can be described as positiveassortative mating driven to its extreme, where the process is continued several generationsforming separate small sublines. Stratified sublining makes it possible to get orchards with morethan 10% superior gain compared to conventional sublining, it ought to get still higher improve-ment by using higher breeding efforts on the highest ranking sublines, while the low rankingsublines could have a still stronger emphasis on diversity.

52
Proceedings of the Meeting of Nordic Tree Breeders and Forest Geneticists
Stratified sublining will be implemented in the recently developed Finnish breeding strategy (Lindgrenet al. 2004). To further boost the effect of stratification and to obtain additional genetic gains fromfuture seed orchards, the Finnish breeding strategy involves the idea of distributing breeding, test-ing and selection efforts unequally, making the effort positively dependent on genetic value of thematerial being improved. This principle is implemented throughout the breeding cycle. In the firstgeneration turnover, the founders forming the first-generation breeding population are single-pairmated with regard to breeding value (in the way described above). Those of the founders that areranked to the highest quarter are, however, double-pair mated to allow more options for recombi-nation of their gene mass and reduce the risk that their gene mass is degraded by an unfortunatechoice of partner, as well as a way to increase the number of offspring. Furthermore, the targetsizes of F1 families are larger for the best quarter of the parents than for the average parent or forthe lowest quarter of parents. The F1 families (the recruitment population) are grown in forwardselection trials that last from 5 to 10 years depending on species. At this age, the best individualswithin each full-sib family are phenotypically selected for further testing. Roughly three times asmany selections (candidates) are drawn from within the larger families (representing offspring ofthe best parents) than from the smaller ones. The number of candidates selected from each full-sib family to the new breeding population varies in relation to the mean breeding value; threeindividuals are selected from the best full-sib families (determined as the mean breeding value ofthe top 3 candidates), two individuals from the average families, and one (possibly none) individualfrom the lowest ranking families (Ruotsalainen 2002). As a result, the second generation breedingpopulation, will have an unbalanced structure where the size of the stratified subline is six, four ortwo trees for the highest ranking, the average and the lowest ranking candidates, respectively.This method results in an overrepresentation of the gene mass of the best founders whereas ahigh number of low ranking founders will still be represented, but with relatively small geneticcontributions.
Unbalances in deployment of resources to families
Lstibщrek (2005, a popular presentation in Swedish by Mullin et al 2005 is based on Lstibщrek’sthesis) made a study with the tree-breeding simulator POPSIM. The recruitment population wascreated by PAM single-pair among selected tested parents. The family size was linearly relatedto the families breeding value (thus a form of «linear deployment»). The next breeding popula-tion was selected by within-family selection. The criteria of goodness of the strategy were thegenetic gain of the best share of the breeding population selected for mass multiplication (seedorchard) at a given diversity. The comparisons were done at the same resource (the same numberof trees planted). Different degrees of unbalance were used; on one extreme was balancedselection when all families are of size 30 and the other extreme strong unbalance when familysizes varied between around 2 and 60. Moderate unbalance implied differences among familysizes of the magnitude 20-40. The gain compared to balanced selection increased by 20% usingstrong unbalance and 10% if intermediate unbalance was used. There is no associated disad-vantage from increased resources or lost diversity for these gains. It seems very logic that allo-cating more resources to improving the genotypes which are more likely to be selected to seedorchards and less to those which are there more for assuring diversity in long time breeding willboost seed orchard selections. The advantage is large compared with what was indicated byearlier similar efforts, e.g. Rosvall (1999). That is probably explained by that Lstiburek (2005) inthe simulation used REML and BLUP, thus more precise methods making more efficient use ofavailable information (like a modern breeder would do).
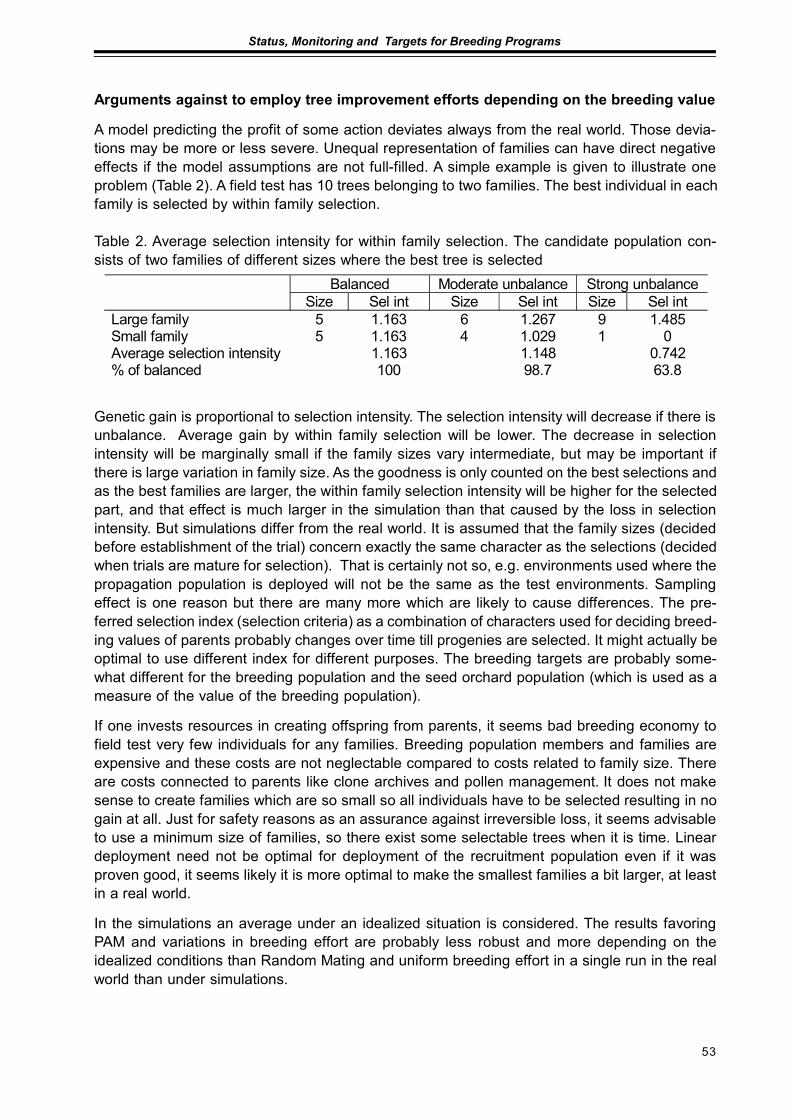
53
Status, Monitoring and Targets for Breeding Programs
Arguments against to employ tree improvement efforts depending on the breeding value
A model predicting the profit of some action deviates always from the real world. Those devia-tions may be more or less severe. Unequal representation of families can have direct negativeeffects if the model assumptions are not full-filled. A simple example is given to illustrate oneproblem (Table 2). A field test has 10 trees belonging to two families. The best individual in eachfamily is selected by within family selection.
Table 2. Average selection intensity for within family selection. The candidate population con-sists of two families of different sizes where the best tree is selected
Balanced Moderate unbalance Strong unbalance Size Sel int Size Sel int Size Sel int
Large family 5 1.163 6 1.267 9 1.485 Small family 5 1.163 4 1.029 1 0 Average selection intensity 1.163 1.148 0.742 % of balanced 100 98.7 63.8
Genetic gain is proportional to selection intensity. The selection intensity will decrease if there isunbalance. Average gain by within family selection will be lower. The decrease in selectionintensity will be marginally small if the family sizes vary intermediate, but may be important ifthere is large variation in family size. As the goodness is only counted on the best selections andas the best families are larger, the within family selection intensity will be higher for the selectedpart, and that effect is much larger in the simulation than that caused by the loss in selectionintensity. But simulations differ from the real world. It is assumed that the family sizes (decidedbefore establishment of the trial) concern exactly the same character as the selections (decidedwhen trials are mature for selection). That is certainly not so, e.g. environments used where thepropagation population is deployed will not be the same as the test environments. Samplingeffect is one reason but there are many more which are likely to cause differences. The pre-ferred selection index (selection criteria) as a combination of characters used for deciding breed-ing values of parents probably changes over time till progenies are selected. It might actually beoptimal to use different index for different purposes. The breeding targets are probably some-what different for the breeding population and the seed orchard population (which is used as ameasure of the value of the breeding population).
If one invests resources in creating offspring from parents, it seems bad breeding economy tofield test very few individuals for any families. Breeding population members and families areexpensive and these costs are not neglectable compared to costs related to family size. Thereare costs connected to parents like clone archives and pollen management. It does not makesense to create families which are so small so all individuals have to be selected resulting in nogain at all. Just for safety reasons as an assurance against irreversible loss, it seems advisableto use a minimum size of families, so there exist some selectable trees when it is time. Lineardeployment need not be optimal for deployment of the recruitment population even if it wasproven good, it seems likely it is more optimal to make the smallest families a bit larger, at leastin a real world.
In the simulations an average under an idealized situation is considered. The results favoringPAM and variations in breeding effort are probably less robust and more depending on theidealized conditions than Random Mating and uniform breeding effort in a single run in the realworld than under simulations.
54
Proceedings of the Meeting of Nordic Tree Breeders and Forest Geneticists
In the real world the PAM are not as perfect as assumed in simulations. Besides practical consid-erations reducing the degree of PAM, PAM is for the index used over the environments used,and that degree of PAM will be lower for the selection index and environments in the progenygeneration. The breeding stock is often not propagated under the same conditions or tested in asingle test. The crosses are usually done at different occasions and places, which may causeasymmetries. The individuals will often be selected in several steps, first based on the pheno-type and later based on some test.
The uncertainties are small with intermediate unbalance. The intermediate unbalance is notlarger that usually occurs unintentionally. It does not seem to exist a good reason not to applymoderate unbalance immediately (say decreasing within family selection intensity by 2%). Therisk that this results in a considerable loss seems neglectable. The implementation in Finnishbreeding mentioned above seems to be such a moderate application with limited risk.
It seems illogic that unbalance in testing effort should be strongly positive while unbalances incontributions small, that indicates a better balance between these two types of unbalances canbe found.
Acknowledgements
There are many discussions with many persons over many decades behind this review andanalysis. Helpful comments on the manuscript to this paper have been gratefully received fromMilan Lstibщrek, Seppo Ruotsalainen, Luis Gea and Nebi Bilir.
ReferencesAndersson EW 1999. Gain and Diversity in Multi-Generation Breeding Programs. Acta Universitatis
Agriculturae Sueciae. Silvestria 95 42pp+4 chapters.Bila AD 2000. Fertility variation and its effects on gene diversity in forest tree populations. Acta Universi-
tatis Agriculturae Sueciae. Silvestria 166 32pp+4 chapters.Bondesson F L & Lindgren D 1993. Optimal utilization of clones and genetic thinning of seed orchards.
Silvae Genetica, 42:157-163.Borralho NMG & Dutkowski GW 1998. Comparison of rolling front and discrete generation breeding strat-
egies for trees. Can. J. For. Res. 28(7): 987-993.Cotterill PP 1989. The nucleus breeding system. Proc South For Tree Improv Conf 20:36–42Danuseviиius D & Lindgren D 2005. Optimisation of breeding population size for long-term breeding.
Scandinavian Journal of Forest Research, 20:18-25.Dempfle L 1975. A note on increasing the limit of selection through selection within families. Genet. Res.
24: 127-135.Gea LD 1997. Genetic diversity and gain. The concept of the status number. PhD thesis, University of
Canterbury, NZ. 111p.James JW 1977. Open nucleus breeding systems. Anim Prod 24:287–30Kang KS 2001. Genetic gain and gene diversity of seed orchard crops. Acta Universitatis Agriculturae
Sueciae. Silvestria 187 75pp+ 11 chapters.Lindgren D 1974 Aspects of suitable number of clones in a seed orchard. Proc of the IUFRO joint meeting
of working parties on population and ecological genetics, breeding theory and progeny testing.Stockholm, published by the Royal College of Forestry, Stockholm, Sweden. p 293-305.
Lindgren D 1991. Optimal utilization of genetic resources. Forest Tree Improvement 23:49-67.Lindgren D 1993. Quantitative comparison between truncation selection and a better procedure. Hereditas
118:289-292.Lindgren D & Kang KS. 1997. Status number - a useful tool for tree breeding Research Report of the
Forest Genetic Research Institute of Korea 33:154-165.Lindgren D & Matheson AC 1986. An algorithm for increasing the genetic quality of seed from seed or-
chards by using the better clones in higher proportions. Silvae Genet 35, 173-177.
55
Status, Monitoring and Targets for Breeding Programs
Lindgren D, Libby W J & Bondesson F L 1989. Deployment to plantations of numbers and proportions ofclones with special emphasis on maximizing gain at a constant diversity. Theoretical and AppliedGenetics 77(6):825-831. R.
Lindgren D, Ruotsalainen S & Haapanen M 2004. Stratified sublining. In Li B & McKeand S Eds ForestGenetics and Tree Breeding in the Age of Genomics: Progress and Future. Conference Proceed-ings, pp 405-407.
Lindgren D Wei RP & Bondesson FL 1993. Optimal selection from families. Heredity 70:619-621.Lindgren D & Wei R-P 1994. Gain versus effective number. Ed. Lee S. Proceedings - Nordic Group for
Tree Breeding, Edinburgh 6-10 October 1993. 164-177. Note that the document is available in Wei,R-P (1995) PhD thesis.
Lindgren D, Wei R-P & Lee S 1997. How to calculate optimum family number when starting a breedingprogram. For. Sci. 43(2): 206-212.
Lstibщrek M 2005. Population response to positive assortative mating in forest tree breeding. PhD disser-tation. North Carolina State University, Raleigh. USA.
Mullin TJ, Park YS (1995) Stochastic simulation of population management strategies for tree breeding: anew decision-support tool for personal computers. Silvae Genet 44:132–141.
Mullin TJ, Lstibщrek M, Rosvall O & Lindgren D 2005. Korsa utvalda trдd i rangordning och lеt dessutom debдsta fе fler avkommor. Fцreningen Skogstrдdsfцrдdling Еrsbok 2004, pp 8-18. (In Swedish).
Olsson T 2001. Parameters, relationship and selections in pines. Acta Universitatis Agriculturae Sueciae.Silvestria. 192 27 pp + 4 chapters.
Prescher F, Lindgren D & Varghese M. 2004. Genetic Thinning of Clonal Seed Orchards using Linear Deploy-ment. In Li B & McKeand S Eds Forest Genetics and Tree Breeding in the Age of Genomics: Progressand Future. Conference Proceedings, pp 232-240.
Rosvall O 1999. Enhancing Gain from Long-Term Forest Tree Breeding while Conserving Genetic Diver-sity. Acta Universitatis Agriculturae Sueciae. Silvestria 109 65pp+4 chapters
Rosvall O, Lindgren D & Ruotsalainen S 1999. Hцgre vinst utan diversitetsfцrlust. (In Swedish). Fцreningenskogstrдdsfцrдdling Еrsbok 1998, pp 9-16.
Ruotsalainen S 2002. Managing breeding stock in the initiation of a long-term tree breeding program. Finnish Forest Research Institute, Research Papers 875., 95 + 61 p
Sбnchez LR 2000. Balanced vs. slight unbalanced selection. Heredity 84: 685-691.Sonesson J, Almqvist C, Ericsson T, Karlsson B, Persson T, Stener L-G and Westin J 2005. Lдgesrapport
2004-12-31 fцr fцrдdlingspopulationer av tall, Gran, Bjцrk och contortatall. Mimeograph, Skogsforsk,Sweden.
Wei R-P 1995. Predicting Genetic Diversity and Optimizing Selection in Breeding Programmes. 63 pages+ 12 papers. Dissertation Swedish University of Agricultural Sciences.
Wei R-P & Lindgren D 1995. Optimal family contributions and a linear approximation. Theor Pop Biol.48(3) 318-332.
Wei R-P & Lindgren D 2001. Optimum breeding generation interval considering build-up of relatedness.Canadian Journal of Forest Research 31:722-729.

56
Proceedings of the Meeting of Nordic Tree Breeders and Forest Geneticists
57
Status, Monitoring and Targets for Breeding Programs
USING SEED ORCHARD SEEDS WITH UNKNOWN FATHERS
Jan-Erik Nilsson and Dag LindgrenDepartment of Forest Genetics and Plant Physiology,
Swedish University of Agricultural Sciences, UMEЕ, Sweden
Abstract
The natural pollen cloud moving around with the winds in early summer may account for 50% ofpollinations in mature seed orchards with high internal pollen production. The background pollenis genetically different from seed orchard pollen produced by selected plus trees. This may affectthe adaptation of the seed crop and justify a modified use of the seeds, e.g. the best place to usethe crop. However, even seeds from young seed orchards without pollen production may usuallybe useful forest regeneration material and there are reasons to limit or eliminate demands onhigh internal pollen production when seed orchard clones and contaminating pollen do not differmuch in adaptation. Artificial freeze testing seed orchard crops of Scots pine for autumn coldhardening is often performed in Sweden to determine the area of utilization. In the same way thehardiness of the natural pollen cloud can be experimentally estimated using artificial freezetesting of progenies obtained from controlled wind pollination of selected clones. Therefore anumber of permanent small clone archives of Scots pine have been established in central andnorthern Sweden as a basis for evaluating geographical and daily variation in the hardiness ofthe background pollen cloud. An archive of mobile grafts is also under establishment. One appli-cation may be long-term mapping of changes in the natural pollen cloud following climate changesand large-scale seed transfer in Swedish forestry.
Background
The major wind-pollinated Swedish forest trees (Scots pine, Norway spruce, birch) produce largequantities of pollen able to be transported wide distances by the wind. This pollen will influenceseed orchards, the issue was discussed at a Nordic Genetic meeting 1991 (Lindgren 1991).Seed orchards trees produce pollen as well as seeds. In the early days of seed orchards, thehope was that once the pollen production in seed orchard started, it would outcompete pollensources outside the seed orchard. Calculations indicated that a pollen production around 20 kg/ha would be well compatible with other pollen sources and harvest has often not been recom-mended until that pollen production has been reached. Later research showed that even in seedorchards with a considerable pollen production, fertilizations with fathers outside the seed or-chard were important, and today we assume and accept 40-50% pollen contamination in matureseed orchards. Still cone harvest is often not recommended until the pollen production has reached20 kg/ha, that is common in Swedish seed orchards of Scots pine and Norway spruce. A detailedevaluation of the likely quantitative consequences of utilizing the contaminated crops from youngand mature seed orchard crops has never been done.
Differences between seeds fertilized by inflowing pollen versus «seed orchard pollen»
Today almost all practically used seeds in Sweden come from seed orchards with phenotypicallyselected plus trees. The superiority of the first generation seed orchard seeds compared to stand
58
Proceedings of the Meeting of Nordic Tree Breeders and Forest Geneticists
seeds is estimated to 10% and probably there are three sources for the superiority: (i) selection ofplus trees (6%), (ii) release of inbreeding (2%) as there are relatives in a stand but not in a seedorchard (can also be expressed as hybridization as plus trees are selected from a wide area,range 100 km or more) and (iii) seed orchard seeds are more «vital», or better programmed or«physiological effects» or has a higher weight and maturity which leads to an estimated 2% «gain»(Rosvall et al 2001).
The «physiological» effects are at least in the first approximation expected to be the same whetherthe pollinator is a seed orchard clone or contaminant. «By definition» we define trees in differentstands as non-related, relatedness must be «recent», the more generations back we go, themore common ancestors there will be. In advanced seed orchards, clones may be relatives andthe inbreeding higher because of relatedness.
More improved seeds
Insufficient pollination can cause early conelet abortion, empty seeds and reduced production offilled seeds. In Sweden there is usually sufficient Scots pine pollen for full seed production evenin absence of seed orchard pollen. But in other situations, like in environments where Scots pineis not among the dominating species, the pollen from the seed orchard can give an increasedseed production of improved seeds.
Pollen from native or transferred populations
In Swedish forestry large-scale transfer of trees has been carried out by forest owners for manydecades. For Scots pine the transfer direction has been mainly from north to south, which is inthe opposite direction to the main wind direction and natural pollen flow during the floweringperiod. As the transferred forests grow up and become fertile their pollen will contribute to thenatural pollen cloud with a different genetic composition compared with pollen released fromnative stands in the same region. Today pollen from transferred forests does contribute much tothe natural pollen cloud, and its influence on the seed orchard crops should still be relativelysmall, although this influence is increasing.
Breeding value
The seed orchard parents are selected while the parents of the background pollen are not se-lected. Breeding value of a seed with a plus tree mother and a father from outside the seedorchard is expected to be exactly half of that if the father was a seed orchard clone. If the outsidefather has a different geographical origin than the seed orchard father, the genetic value of theseed might be either higher or lower than half of that of a seed obtained from pollination with aplus tree father. However, unlike pollen from forests transferred by man, tree breeding has notyet advanced long enough to make contribution from bred trees in the general pollen cloudimportant. For the breeding values in the 3rd-batch seed orchards estimates by Lindgren andPrescher (2005) were considered.
Selfing
Trees of the most relevant species produce both pollen and seeds and are able to self-fertilize.As male and female structures are not very distant an estimated amount of 10% self pollinationseems reasonable. Most selfed zygotes die and most selfings results in reduced production offilled seeds. The selfing frequency among germinating seeds or young seedlings is measurable
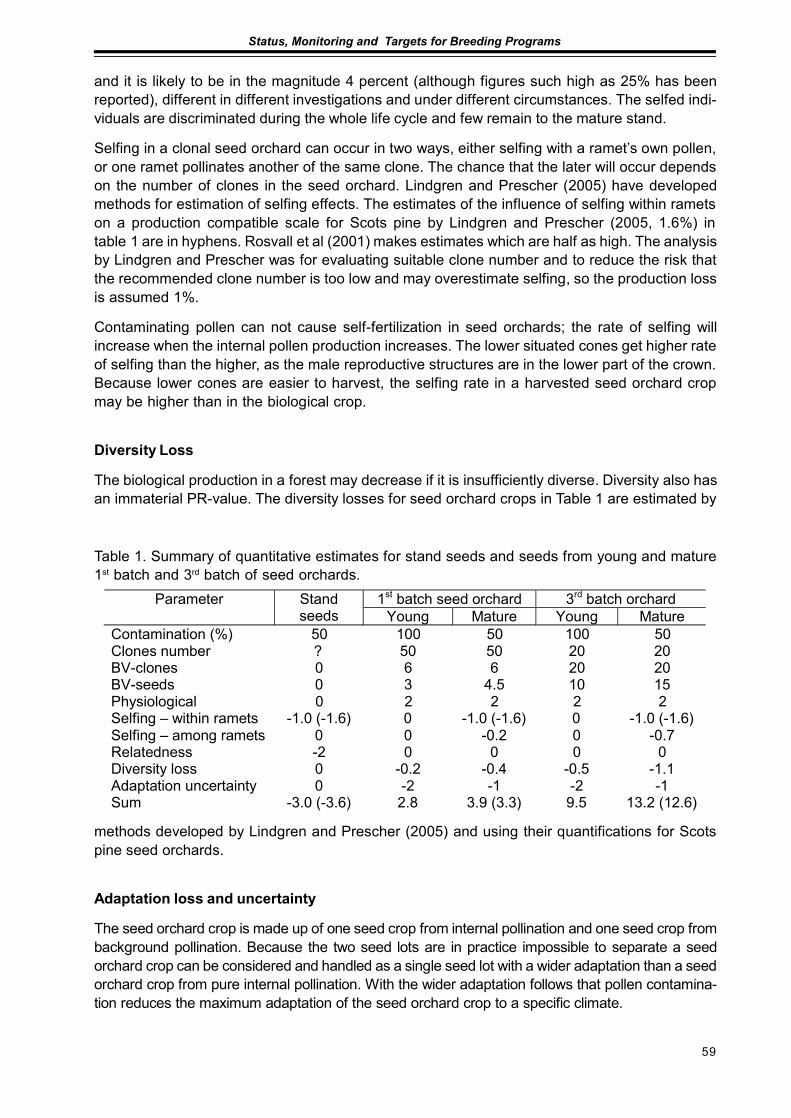
59
Status, Monitoring and Targets for Breeding Programs
and it is likely to be in the magnitude 4 percent (although figures such high as 25% has beenreported), different in different investigations and under different circumstances. The selfed indi-viduals are discriminated during the whole life cycle and few remain to the mature stand.
Selfing in a clonal seed orchard can occur in two ways, either selfing with a ramet’s own pollen,or one ramet pollinates another of the same clone. The chance that the later will occur dependson the number of clones in the seed orchard. Lindgren and Prescher (2005) have developedmethods for estimation of selfing effects. The estimates of the influence of selfing within rametson a production compatible scale for Scots pine by Lindgren and Prescher (2005, 1.6%) intable 1 are in hyphens. Rosvall et al (2001) makes estimates which are half as high. The analysisby Lindgren and Prescher was for evaluating suitable clone number and to reduce the risk thatthe recommended clone number is too low and may overestimate selfing, so the production lossis assumed 1%.
Contaminating pollen can not cause self-fertilization in seed orchards; the rate of selfing willincrease when the internal pollen production increases. The lower situated cones get higher rateof selfing than the higher, as the male reproductive structures are in the lower part of the crown.Because lower cones are easier to harvest, the selfing rate in a harvested seed orchard cropmay be higher than in the biological crop.
Diversity Loss
The biological production in a forest may decrease if it is insufficiently diverse. Diversity also hasan immaterial PR-value. The diversity losses for seed orchard crops in Table 1 are estimated by
Table 1. Summary of quantitative estimates for stand seeds and seeds from young and mature1st batch and 3rd batch of seed orchards.
1st batch seed orchard 3rd batch orchard Parameter Stand seeds Young Mature Young Mature
Contamination (%) 50 100 50 100 50 Clones number ? 50 50 20 20 BV-clones 0 6 6 20 20 BV-seeds 0 3 4.5 10 15 Physiological 0 2 2 2 2 Selfing – within ramets -1.0 (-1.6) 0 -1.0 (-1.6) 0 -1.0 (-1.6) Selfing – among ramets 0 0 -0.2 0 -0.7 Relatedness -2 0 0 0 0 Diversity loss 0 -0.2 -0.4 -0.5 -1.1 Adaptation uncertainty 0 -2 -1 -2 -1 Sum -3.0 (-3.6) 2.8 3.9 (3.3) 9.5 13.2 (12.6)
methods developed by Lindgren and Prescher (2005) and using their quantifications for Scotspine seed orchards.
Adaptation loss and uncertainty
The seed orchard crop is made up of one seed crop from internal pollination and one seed crop frombackground pollination. Because the two seed lots are in practice impossible to separate a seedorchard crop can be considered and handled as a single seed lot with a wider adaptation than a seedorchard crop from pure internal pollination. With the wider adaptation follows that pollen contamina-tion reduces the maximum adaptation of the seed orchard crop to a specific climate.

60
Proceedings of the Meeting of Nordic Tree Breeders and Forest Geneticists
Because the contaminating pollen may vary in origin and frequency due to changes in weatherconditions (temperatures, winds, rain etc.) before and during female receptivity, crops from aseed orchard exposed to pollen contamination are more uncertain and less reproducible than acrop from a seed orchard less affected by contamination.
Nilsson (1991) presented a model to estimate effects on survival of seed orchard crops plantedon different latitudes/altitudes from varying background pollination rates and origins. The modelcan handle daily variations in both rate and hardiness of the contaminating pollen (assuming anormally distributed quantitative trait) as well as for pollen and female gametes in the seedorchard. By careful studies of timing of pollen dispersal and female receptivity and estimation ofbreeding values of the seed orchard clones relevant parameters for the seed orchard genotypescan be determined for input into the model. However, little is still known about what parametervalues are relevant for the complex background pollen.
Daily variation in origin and adaptation of background pollen
In a seed orchard female receptivity may be extended over a period of one week or more. It isreasonable to assume that changes in weather condition and wind directions might cause sig-nificant changes in the origin of long distance pollen invading a seed orchard in different days ofthe receptive period. Nilsson (1995) found that the background pollen in a coastal clone archiveof Scots pine had a geographical origin and cold hardiness (estimated from artificial freezetesting of progenies from controlled wind pollination and progenies from pollination with refer-ence pollen) approximately one degree latitude north of the archive. The most likely explanationwas that immediately before female receptivity occurred in the clone archive a heavy rain washedout pollen from the air and the earlier southern winds were changed to northern ones carryingpollen from early flowering non-coastal northern localities. With a more interior localization (lessinfluence of the cold Gulf of Bothnia on early summer temperatures means earlier receptivity) orif the sudden change in weather conditions had occurred a few days later more southern pollenwould probably have contaminated the archive and reduced the hardiness of the seed crop.
Discussion
Today it is usually recommended for Scandinavian conifer seed orchards to start seed collectionwhen pollen production is above 20 kg/hectare to assure a sufficient reduction of pollen contami-nation from outside the seed orchard. It is suggested that the demand is relaxed for seed or-chards where the contaminating pollen is not drastically different from the seed orchard clones.The seed orchard material can often be assumed to be the best available for reforestation evenin cases with 100% non seed orchard pollen.
The gain from a young 3rd batch of seed orchards compared to a mature first batch seed orchardis considerable when adaptation pattern of the contaminating pollen is the same as the orchardclones, and is thus not likely to be inferior as long as there are not large problems with theadaptation of the contaminating pollen.
Selfing
Estimates of selfing are mainly done on rather young seed orchards, whereas pollen productionper graft and thus selfing may be larger in mature seed orchards. It is possible that the 3rd batchof seed orchards will be subject to more selfing as they are planned for more intensive pruning.The repeated pruning may raise the male strobili in the tree crowns and move them on average
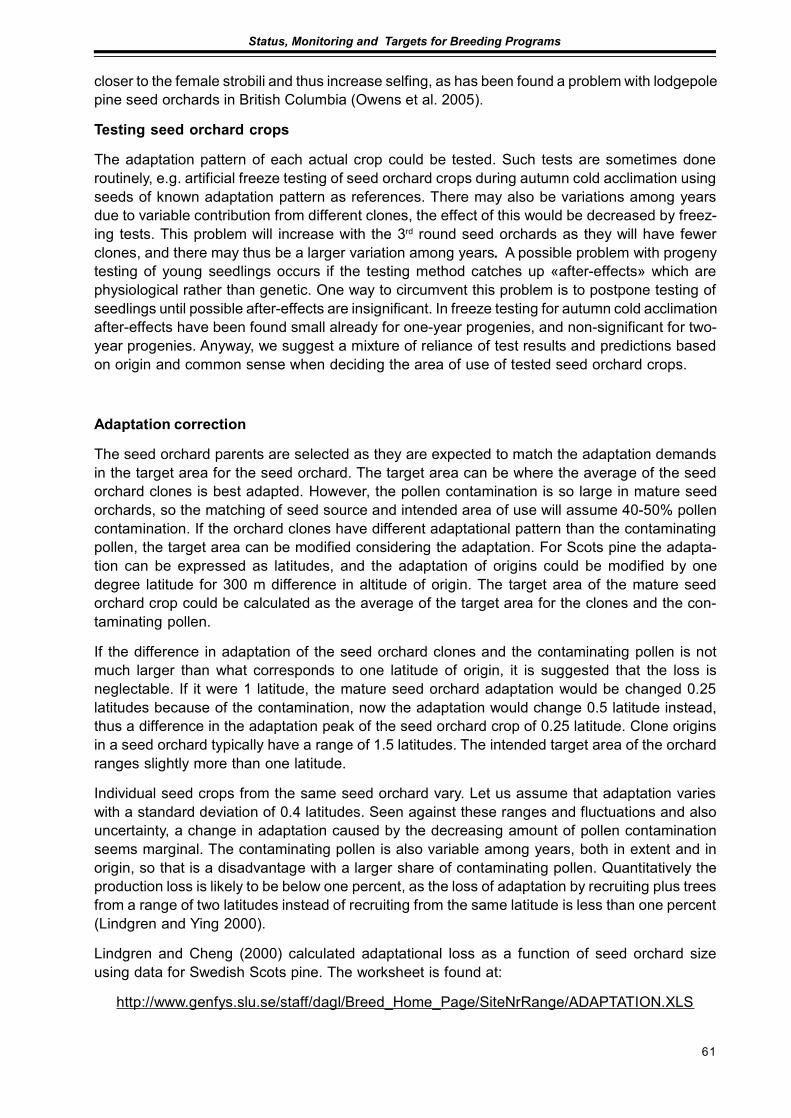
61
Status, Monitoring and Targets for Breeding Programs
closer to the female strobili and thus increase selfing, as has been found a problem with lodgepolepine seed orchards in British Columbia (Owens et al. 2005).
Testing seed orchard crops
The adaptation pattern of each actual crop could be tested. Such tests are sometimes doneroutinely, e.g. artificial freeze testing of seed orchard crops during autumn cold acclimation usingseeds of known adaptation pattern as references. There may also be variations among yearsdue to variable contribution from different clones, the effect of this would be decreased by freez-ing tests. This problem will increase with the 3rd round seed orchards as they will have fewerclones, and there may thus be a larger variation among years. A possible problem with progenytesting of young seedlings occurs if the testing method catches up «after-effects» which arephysiological rather than genetic. One way to circumvent this problem is to postpone testing ofseedlings until possible after-effects are insignificant. In freeze testing for autumn cold acclimationafter-effects have been found small already for one-year progenies, and non-significant for two-year progenies. Anyway, we suggest a mixture of reliance of test results and predictions basedon origin and common sense when deciding the area of use of tested seed orchard crops.
Adaptation correction
The seed orchard parents are selected as they are expected to match the adaptation demandsin the target area for the seed orchard. The target area can be where the average of the seedorchard clones is best adapted. However, the pollen contamination is so large in mature seedorchards, so the matching of seed source and intended area of use will assume 40-50% pollencontamination. If the orchard clones have different adaptational pattern than the contaminatingpollen, the target area can be modified considering the adaptation. For Scots pine the adapta-tion can be expressed as latitudes, and the adaptation of origins could be modified by onedegree latitude for 300 m difference in altitude of origin. The target area of the mature seedorchard crop could be calculated as the average of the target area for the clones and the con-taminating pollen.
If the difference in adaptation of the seed orchard clones and the contaminating pollen is notmuch larger than what corresponds to one latitude of origin, it is suggested that the loss isneglectable. If it were 1 latitude, the mature seed orchard adaptation would be changed 0.25latitudes because of the contamination, now the adaptation would change 0.5 latitude instead,thus a difference in the adaptation peak of the seed orchard crop of 0.25 latitude. Clone originsin a seed orchard typically have a range of 1.5 latitudes. The intended target area of the orchardranges slightly more than one latitude.
Individual seed crops from the same seed orchard vary. Let us assume that adaptation varieswith a standard deviation of 0.4 latitudes. Seen against these ranges and fluctuations and alsouncertainty, a change in adaptation caused by the decreasing amount of pollen contaminationseems marginal. The contaminating pollen is also variable among years, both in extent and inorigin, so that is a disadvantage with a larger share of contaminating pollen. Quantitatively theproduction loss is likely to be below one percent, as the loss of adaptation by recruiting plus treesfrom a range of two latitudes instead of recruiting from the same latitude is less than one percent(Lindgren and Ying 2000).
Lindgren and Cheng (2000) calculated adaptational loss as a function of seed orchard sizeusing data for Swedish Scots pine. The worksheet is found at:
http://www.genfys.slu.se/staff/dagl/Breed_Home_Page/SiteNrRange/ADAPTATION.XLS
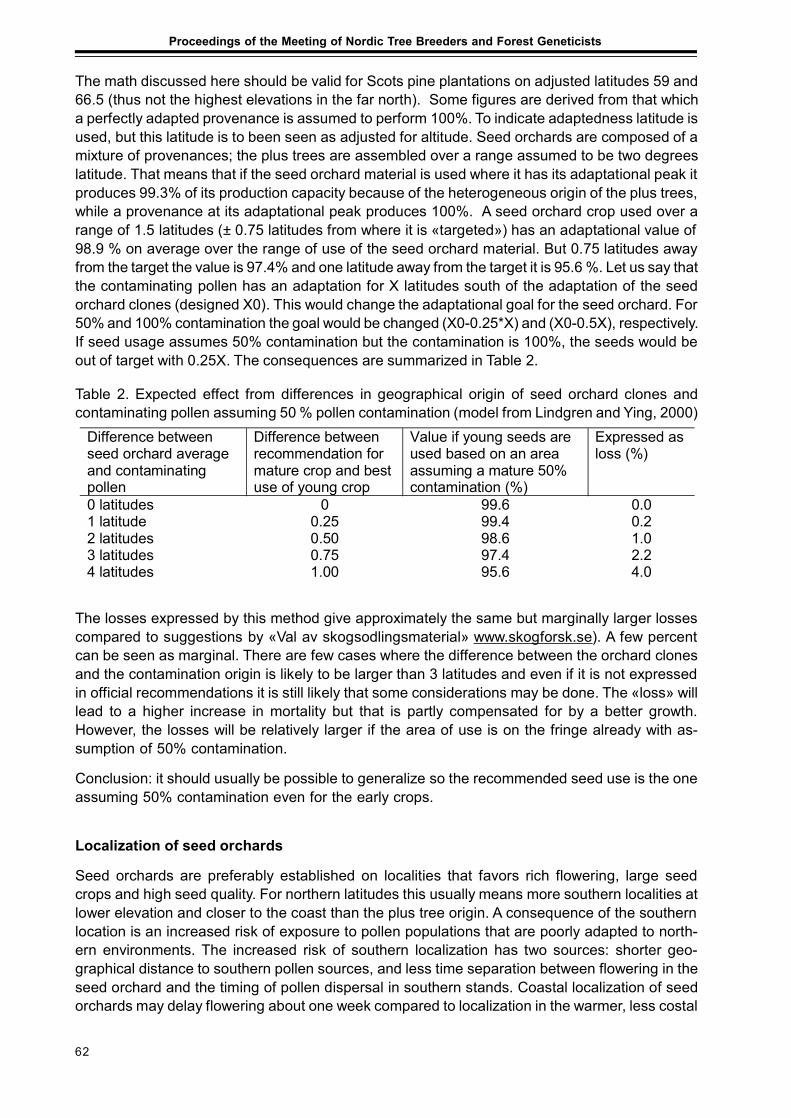
62
Proceedings of the Meeting of Nordic Tree Breeders and Forest Geneticists
The math discussed here should be valid for Scots pine plantations on adjusted latitudes 59 and66.5 (thus not the highest elevations in the far north). Some figures are derived from that whicha perfectly adapted provenance is assumed to perform 100%. To indicate adaptedness latitude isused, but this latitude is to been seen as adjusted for altitude. Seed orchards are composed of amixture of provenances; the plus trees are assembled over a range assumed to be two degreeslatitude. That means that if the seed orchard material is used where it has its adaptational peak itproduces 99.3% of its production capacity because of the heterogeneous origin of the plus trees,while a provenance at its adaptational peak produces 100%. A seed orchard crop used over arange of 1.5 latitudes (± 0.75 latitudes from where it is «targeted») has an adaptational value of98.9 % on average over the range of use of the seed orchard material. But 0.75 latitudes awayfrom the target the value is 97.4% and one latitude away from the target it is 95.6 %. Let us say thatthe contaminating pollen has an adaptation for X latitudes south of the adaptation of the seedorchard clones (designed X0). This would change the adaptational goal for the seed orchard. For50% and 100% contamination the goal would be changed (X0-0.25*X) and (X0-0.5X), respectively.If seed usage assumes 50% contamination but the contamination is 100%, the seeds would beout of target with 0.25X. The consequences are summarized in Table 2.
Table 2. Expected effect from differences in geographical origin of seed orchard clones andcontaminating pollen assuming 50 % pollen contamination (model from Lindgren and Ying, 2000)
Difference between seed orchard average and contaminating pollen
Difference between recommendation for mature crop and best use of young crop
Value if young seeds are used based on an area assuming a mature 50% contamination (%)
Expressed as loss (%)
0 latitudes 0 99.6 0.0 1 latitude 0.25 99.4 0.2 2 latitudes 0.50 98.6 1.0 3 latitudes 0.75 97.4 2.2 4 latitudes 1.00 95.6 4.0
The losses expressed by this method give approximately the same but marginally larger lossescompared to suggestions by «Val av skogsodlingsmaterial» www.skogforsk.se). A few percentcan be seen as marginal. There are few cases where the difference between the orchard clonesand the contamination origin is likely to be larger than 3 latitudes and even if it is not expressedin official recommendations it is still likely that some considerations may be done. The «loss» willlead to a higher increase in mortality but that is partly compensated for by a better growth.However, the losses will be relatively larger if the area of use is on the fringe already with as-sumption of 50% contamination.
Conclusion: it should usually be possible to generalize so the recommended seed use is the oneassuming 50% contamination even for the early crops.
Localization of seed orchards
Seed orchards are preferably established on localities that favors rich flowering, large seedcrops and high seed quality. For northern latitudes this usually means more southern localities atlower elevation and closer to the coast than the plus tree origin. A consequence of the southernlocation is an increased risk of exposure to pollen populations that are poorly adapted to north-ern environments. The increased risk of southern localization has two sources: shorter geo-graphical distance to southern pollen sources, and less time separation between flowering in theseed orchard and the timing of pollen dispersal in southern stands. Coastal localization of seedorchards may delay flowering about one week compared to localization in the warmer, less costal

63
Status, Monitoring and Targets for Breeding Programs
localities on the same latitude. Except for the mountain areas in the west that are unsuitable forabundant seed production for other reasons, the coolest early summers in central and northernSweden are probably found on islands in the sea. Such localization of a seed orchard shouldmean that female receptivity can be delayed another week or more compared today’s localizationin coastal mainland (Figure 1).
0
50
100
150
200
250
300
350
400
450
500
11 15 19 23 27
Day, June
Deg
ree
days
>5
oC
60 oN
Island, 63o40'N
64o15' N64o 45' N
64o30' N
61-62 oN
65o30-66oN
Figure 1. Degree days (> 5oC) in June 1998 on 19 weather stations (SMHI) between latitudes 60and 66 °N Sweden. The bold curve indicates Umeе (lat 63°48’N), the dotted lines indicate dateand degree days for onset of pollen dispersal in mature seed orchards close to Umeе.
Localization on islands in outer archipelagoes would usually reduce the influence of southernbackground pollen and enhance the influence of northern background pollen on the seed orchardcrop. However, so far we have too little knowledge about how the geographical origin and geneticcomposition of the background pollen are affected by weather and winds to make more than veryapproximate statements about effects of seed orchard localizations on the adaptation pattern ofseed orchard crops.
Clone archives for pollen cloud observations
In the early 1990’s nineteen small clone archives of Scots pine, each with the same ten clones,were established in central and northern Sweden between latitudes 61 and 67°N with the inten-tion that the female flowers would catch up the background pollen on the different localities.From the seeds produced by wind pollination, progeny testing can be performed to study geo-graphical variation in adaptation patterns between pollen clouds. To reduce pollination fromneighboring stands the archives were established in areas without adjacent Scots pine forests.The ten clones originating from between latitudes 62 and 67°N in Sweden are represented by fivegrafts in each archive. Clone selection was made in mature seed orchards for abundant femaleflowering but no pollen production. In addition an archive of potted grafts of Scots pine clones wasrecently initiated as a mobile complement to the permanent field archives allowing future studiesof background pollen on any places.

64
Proceedings of the Meeting of Nordic Tree Breeders and Forest Geneticists
Some of the permanent clone archives on mild localities up to latitude 64°N have now started toproduce female flowers and seeds to allow progeny testing of background pollinated progenies.Therefore the first artificial freezing experiments for autumn cold acclimation are now performedto give experimental indications on differences in cold acclimation patterns between natural pollenclouds of Scots pine on different localities in Sweden.
Norway spruce
With Scots pine and northern Norway spruce «origin» can be related to mainly «latitude» andthat makes the contamination rather manageable. With Norway spruce in southern Sweden thecritical factor is flushing phenology in early summer which is more a question of longitude oforigin. Long pollen transports ought to be less frequent for Norway spruce as the pollen is heavierand less likely to stay airborne for many hours. «Local» pollen originating some kilometers fromthe seed orchard may cause the same contamination rate; but it would at least be somewhatmore reproducible. On the other hand there may be larger variations in «local» contamination, inparticular considering the large variation in origin of spruce in southern Sweden. There are ob-served effects in seed orchards with Eastern European clones which could indicate that thelarge phenological genetic differences matter for contamination. Could it be some sort of physi-ological effects rather than contamination?
Acknowledgements
We discussed the pollen contamination on the web prior to writing this paper. We are grateful tothe participants in that discussion for their good comments, in particular Seppo Ruotsalainen.
ReferencesLindgren D (editor), 1991. Pollen Contamination in Seed Orchards. Proceedings of the Meeting of the
Nordic Group for Tree Breeding 1991. Swedish University of Agricultural Sciences. Department ofForest Genetics and Plant Physiology. Report 10, 120pp.
Lindgren D and Prescher F, 2005. Clone number for seed orchards with tested clones. Silvae Genetica 54:80-92.
Lindgren D and Ying CC, 2000. A model integrating seed source adaptation and seed use. New Forest 20:(1) 87-104.
Nilsson J-E, 1991. Estimating the effect of pollen contamination on the seed orchard progeny. In Lindgren D(editor). Pollen Contamination in Seed Orchards. Proceedings of the Meeting of the Nordic Groupfor Tree Breeding 1991. Swedish University of Agricultural Sciences. Department of Forest Genet-ics and Plant Physiology. Report 10: 66-85.
Nilsson J-E, 1995. Genetic variation in the natural pollen cloud of Pinus sylvestris: a study based onprogeny testing. Scand. J. For. Res. 10:140-148.
Owens JN, Bennett J and L’Hirondelle S. 2005. Pollination and cone morphology affect cone and seedproduction in lodgepole pine seed orchards. Can. J. For. Res., 35(2): 383-400.
Rosvall O, Jansson G, Andersson B, Ericsson T, Karlsson B, Sonesson J and Stener L-G, 2001. Genetiskavinster i nuvarande och framtida frцplantager och klonblandningar. Genetic gain from present andfuture seed orchards and clone mixes. SkogForsk, Redogцrelse nr 1, (2001). Remark: An Englishabbreviated version is found in Haapanen M & Mikola J (Eds): Integrating Tree Breeding and For-estry – Proceedings from a meeting of the Nordic Group for Management of Genetic Resources ofTrees. The Finnish Forest Research Institute Research Papers 842, p 71-85.
65
Status, Monitoring and Targets for Breeding Programs
SEED PRODUCTION IN SCOTS PINE SEED ORCHARDS
Finnvid Prescher1), Dag Lindgren2), Ulfstand Wennstrom3), Curt Almqvist4),Seppo Ruotsalainen5), Johan Kroon3,2)
1)Svenska Skogsplantor AB, Seed Production, Sweden2)Department of Forest Genetics and Plant Physiology,
Swedish University of Agricultural Sciences, Umea, Sweden3)Swedish Forest Research Institute, Savar, Sweden
4)Swedish Forest Research Institute, Uppsala Science Park, Uppsala, Sweden5)Finnish Forest Research Institute, Punkaharju Research Station, Punkaharju, Finland
Abstract
Earlier studies show that seed orchards have considerable heavier cones and seeds, but notnecessarily more seeds per cone and fluctuations in seed production are smaller than in stands.Harvest statistics are often available for seed orchards; usually the amount of harvested conesand seeds drops by age of the orchard. However, the harvest statistics seldom reflects the actualbiological seed production. Biological seed production in some Swedish Scots pine seed orchardswas calculated. No decrease in seed production when the orchard gets old was indicated. A casewas reported when dense spacing did not increase seed production at age 30. Few of the coneswere registered in a fast cone count in two mature seed orchards, indicating that manual observa-tions are unreliable. Reasonable estimates of variation in female fertility among grafts seem pos-sible with simpler measures than actual seed count. A considerable variation in female fertilityamong grafts was observed. The variation in seed weight among ramets was rather moderate.
Keywords: Seed orchards, cone production, seed production, seed weight, fertility variation, visualestimation.
Introduction
Prognoses of seed set in seed orchards are needed for projections about future seed production,for operational decisions and also for estimates of effective population size. There exist, however,a considerable difference between different meanings of seed production, which complicates theseprocedures. Reports about seed orchard harvests are frequent, but actual seed production ismore rarely reported. Even when seed production per graft is reported, it is seldom converted toarea production and often considers young grafts where seed production per area still is raising.There is a biological seed production potential, but the seed available for operational harvest isanother thing, harvest statistics further another, and seed production observed in experimentalsettings may not be representative for operational seed orchards. Here some aspects of this willbe discussed. Some estimates of biological seed production in actual mature seed orchards willbe presented. Methods for estimation will be discussed.

66
Proceedings of the Meeting of Nordic Tree Breeders and Forest Geneticists
Seed production in nature and its relevance for seed orchards
The Scots pine stand seed production has been carefully investigated in Finland; the main impor-tant studies were initiated by Heikinheimo in 1920’s (Heikinheimo 1932, 1937) and continued, bySarvas (1962) and Koski and Tallqvist (1978). There are also important Swedish studies like Hagner(1957). In natural stands, seed crop (on areal basis) is higher in rather sparse seed tree stands ascompared to dense forests (Heikinheimo 1937). The difference increases with time from the thin-ning treatment and is greater in poor seed years. On average 50 seeds/m2 are produced innorthern Finland, 100 in central Finland and 150 in southern Finland. In peak years it may be threetimes as high. Seed production increases with site class.
A comparison between natural stands and seed orchards reveals that there are at least some-times differences in their cone and seed characteristics. The number of seeds per tree (graft) canbe higher in seed orchards than in stands. The cone number and volume may be larger. Cone sizeis – not so surprisingly – clearly greater in seed orchards, but number of seeds per cone is aboutthe same (20). Seed production per volume unit of cones is higher in stands than in seed or-chards. Seed weight is considerably higher in seed orchards (see below). The annual variationsare likely to be smaller in a seed orchard than in a stand.
There are differences between seed orchards and stands, which may explain differences in seedset. Scots pine seed orchards have often a more southern location than their utilization area, anda good site class; they are often situated on former farmland. Land preparation includes ditchingand removal of competing vegetation. Sometimes they are fertilized. A natural stand under thoseconditions would probably produce 120-150 seeds/m2. A mature seed orchard is similar to the topof an old stand, thus a similar seed production would be expected. Thus we may assume thatbiological seed production in old seed orchards would approach 120-150 seeds/m2 (10 kg/ha inorchards, but only 6 in stands).
When trees are released in seed tree cuttings they react by setting more cones and producingmore and heavier seeds (Karlsson 2000). The effect is largest 4-5 years after the release and maythen pass 200 seeds/m2. The seed production is still considerable higher 10 years after the re-lease than before. Seed tree stand conditions may have some similarity with seed orchards.
Material
Observation of seed production
We report on seed production in mature Swedish Scots pine seed orchards. Information about theconcerned seed orchards is given in Table 1.
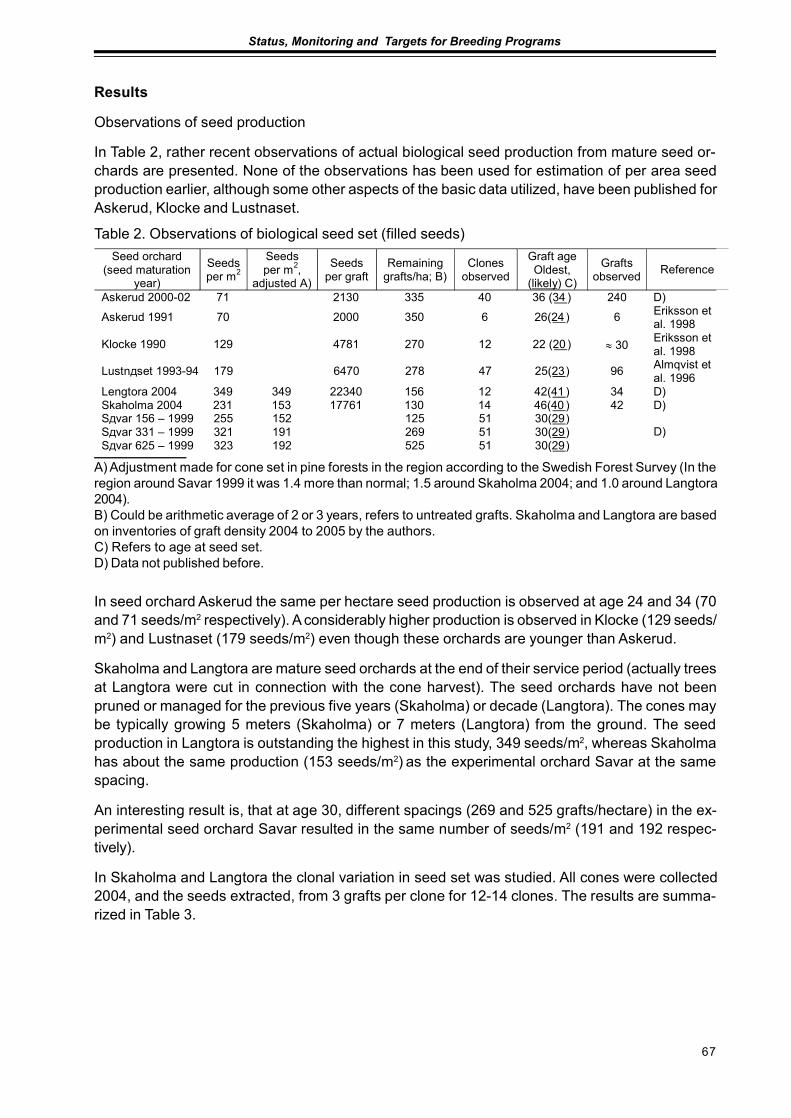
67
Status, Monitoring and Targets for Breeding Programs
Results
Observations of seed production
In Table 2, rather recent observations of actual biological seed production from mature seed or-chards are presented. None of the observations has been used for estimation of per area seedproduction earlier, although some other aspects of the basic data utilized, have been published forAskerud, Klocke and Lustnaset.
Table 2. Observations of biological seed set (filled seeds)
A) Adjustment made for cone set in pine forests in the region according to the Swedish Forest Survey (In theregion around Savar 1999 it was 1.4 more than normal; 1.5 around Skaholma 2004; and 1.0 around Langtora2004).B) Could be arithmetic average of 2 or 3 years, refers to untreated grafts. Skaholma and Langtora are basedon inventories of graft density 2004 to 2005 by the authors.C) Refers to age at seed set.D) Data not published before.
Seed orchard (seed maturation
year)
Seeds per m2
Seeds per m2,
adjusted A)
Seeds per graft
Remaining grafts/ha; B)
Clones observed
Graft age Oldest,
(likely) C)
Grafts observed Reference
Askerud 2000-02 71 2130 335 40 36 (34 ) 240 D)
Askerud 1991 70 2000 350 6 26(24) 6 Eriksson et al. 1998
Klocke 1990 129 4781 270 12 22 (20 ) ≈ 30 Eriksson et al. 1998
Lustnдset 1993-94 179 6470 278 47 25(23) 96 Almqvist et al. 1996
Lеngtora 2004 349 349 22340 156 12 42(41 ) 34 D) Skaholma 2004 231 153 17761 130 14 46(40 ) 42 D) Sдvar 156 – 1999 255 152 125 51 30(29) Sдvar 331 – 1999 321 191 269 51 30(29) Sдvar 625 – 1999 323 192 525 51 30(29)
D)
In seed orchard Askerud the same per hectare seed production is observed at age 24 and 34 (70and 71 seeds/m2 respectively). A considerably higher production is observed in Klocke (129 seeds/m2) and Lustnaset (179 seeds/m2) even though these orchards are younger than Askerud.
Skaholma and Langtora are mature seed orchards at the end of their service period (actually treesat Langtora were cut in connection with the cone harvest). The seed orchards have not beenpruned or managed for the previous five years (Skaholma) or decade (Langtora). The cones maybe typically growing 5 meters (Skaholma) or 7 meters (Langtora) from the ground. The seedproduction in Langtora is outstanding the highest in this study, 349 seeds/m2, whereas Skaholmahas about the same production (153 seeds/m2) as the experimental orchard Savar at the samespacing.
An interesting result is, that at age 30, different spacings (269 and 525 grafts/hectare) in the ex-perimental seed orchard Savar resulted in the same number of seeds/m2 (191 and 192 respec-tively).
In Skaholma and Langtora the clonal variation in seed set was studied. All cones were collected2004, and the seeds extracted, from 3 grafts per clone for 12-14 clones. The results are summa-rized in Table 3.
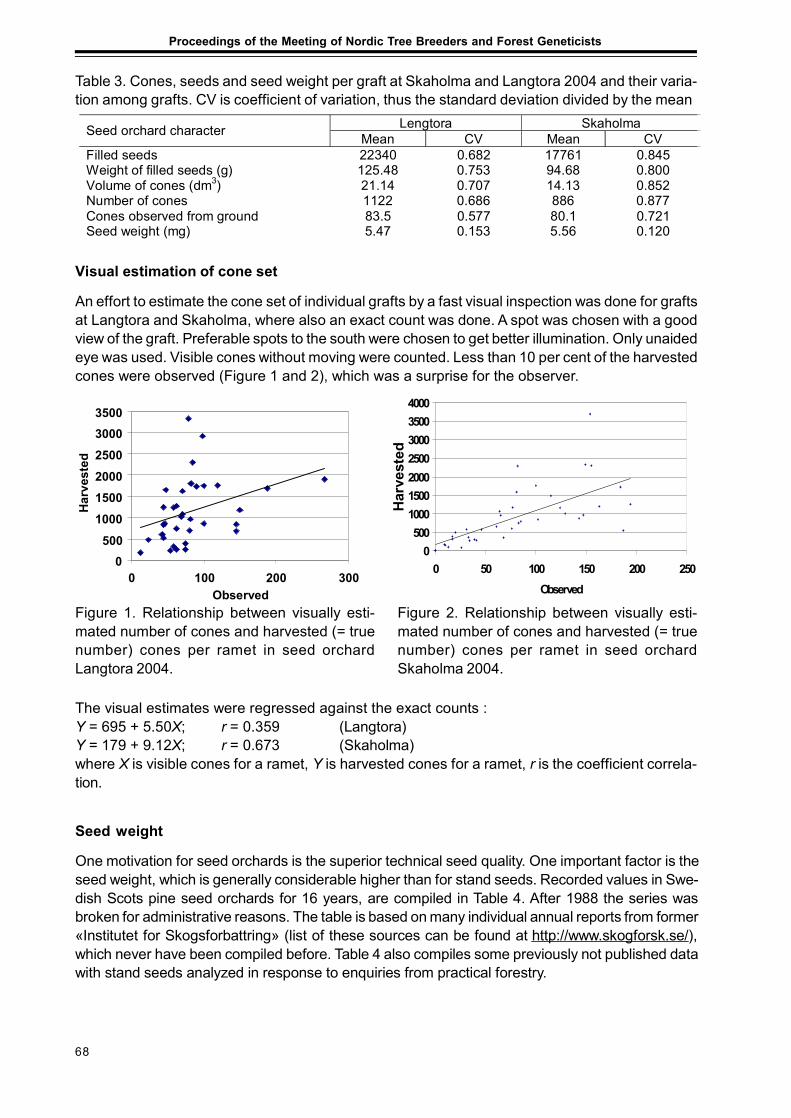
68
Proceedings of the Meeting of Nordic Tree Breeders and Forest Geneticists
Visual estimation of cone set
An effort to estimate the cone set of individual grafts by a fast visual inspection was done for graftsat Langtora and Skaholma, where also an exact count was done. A spot was chosen with a goodview of the graft. Preferable spots to the south were chosen to get better illumination. Only unaidedeye was used. Visible cones without moving were counted. Less than 10 per cent of the harvestedcones were observed (Figure 1 and 2), which was a surprise for the observer.
Table 3. Cones, seeds and seed weight per graft at Skaholma and Langtora 2004 and their varia-tion among grafts. CV is coefficient of variation, thus the standard deviation divided by the mean
Lеngtora Skaholma Seed orchard character Mean CV Mean CV Filled seeds 22340 0.682 17761 0.845 Weight of filled seeds (g) 125.48 0.753 94.68 0.800 Volume of cones (dm3) 21.14 0.707 14.13 0.852 Number of cones 1122 0.686 886 0.877 Cones observed from ground 83.5 0.577 80.1 0.721 Seed weight (mg) 5.47 0.153 5.56 0.120
Figure 1. Relationship between visually esti-mated number of cones and harvested (= truenumber) cones per ramet in seed orchardLangtora 2004.
0
500
1000
1500
2000
2500
3000
3500
0 100 200 300 Observed
Har
vest
ed
0500
1000150020002500300035004000
0 50 100 150 200 250Observed
Har
vest
ed
Figure 2. Relationship between visually esti-mated number of cones and harvested (= truenumber) cones per ramet in seed orchardSkaholma 2004.
The visual estimates were regressed against the exact counts :Y = 695 + 5.50X; r = 0.359 (Langtora)Y = 179 + 9.12X; r = 0.673 (Skaholma)where X is visible cones for a ramet, Y is harvested cones for a ramet, r is the coefficient correla-tion.
Seed weight
One motivation for seed orchards is the superior technical seed quality. One important factor is theseed weight, which is generally considerable higher than for stand seeds. Recorded values in Swe-dish Scots pine seed orchards for 16 years, are compiled in Table 4. After 1988 the series wasbroken for administrative reasons. The table is based on many individual annual reports from former«Institutet for Skogsforbattring» (list of these sources can be found at http://www.skogforsk.se/),which never have been compiled before. Table 4 also compiles some previously not published datawith stand seeds analyzed in response to enquiries from practical forestry.
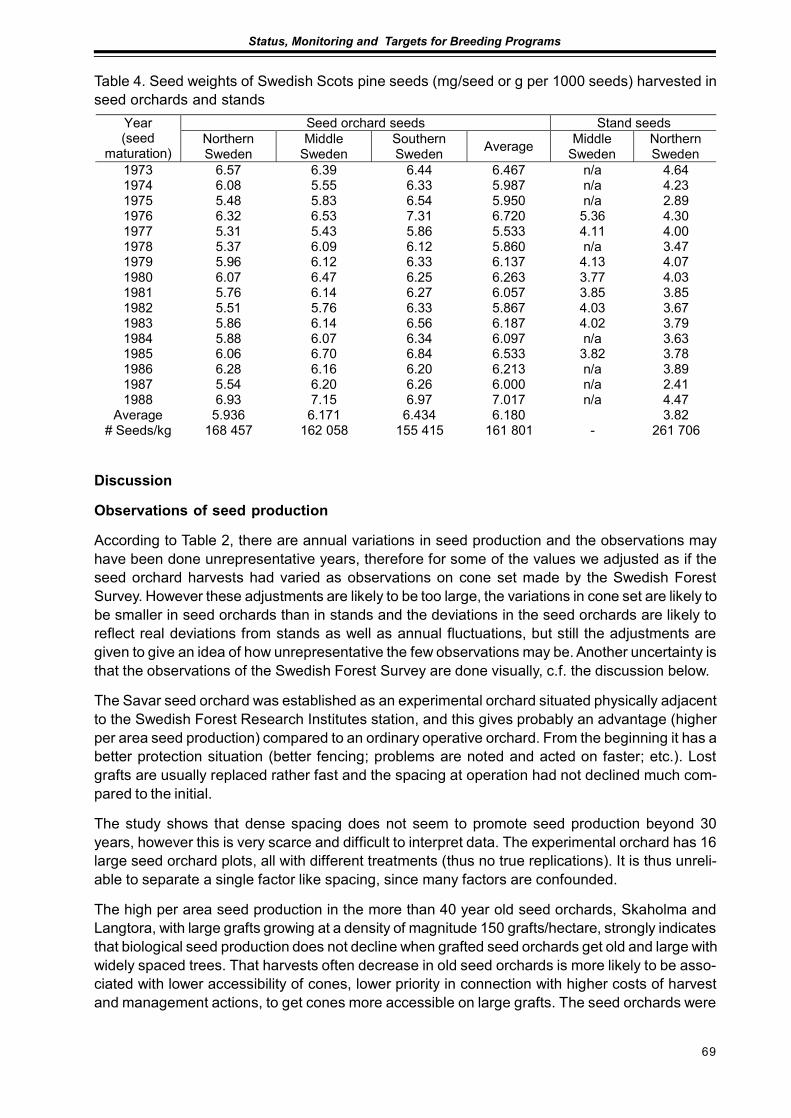
69
Status, Monitoring and Targets for Breeding Programs
Discussion
Observations of seed production
According to Table 2, there are annual variations in seed production and the observations mayhave been done unrepresentative years, therefore for some of the values we adjusted as if theseed orchard harvests had varied as observations on cone set made by the Swedish ForestSurvey. However these adjustments are likely to be too large, the variations in cone set are likely tobe smaller in seed orchards than in stands and the deviations in the seed orchards are likely toreflect real deviations from stands as well as annual fluctuations, but still the adjustments aregiven to give an idea of how unrepresentative the few observations may be. Another uncertainty isthat the observations of the Swedish Forest Survey are done visually, c.f. the discussion below.
The Savar seed orchard was established as an experimental orchard situated physically adjacentto the Swedish Forest Research Institutes station, and this gives probably an advantage (higherper area seed production) compared to an ordinary operative orchard. From the beginning it has abetter protection situation (better fencing; problems are noted and acted on faster; etc.). Lostgrafts are usually replaced rather fast and the spacing at operation had not declined much com-pared to the initial.
The study shows that dense spacing does not seem to promote seed production beyond 30years, however this is very scarce and difficult to interpret data. The experimental orchard has 16large seed orchard plots, all with different treatments (thus no true replications). It is thus unreli-able to separate a single factor like spacing, since many factors are confounded.
The high per area seed production in the more than 40 year old seed orchards, Skaholma andLangtora, with large grafts growing at a density of magnitude 150 grafts/hectare, strongly indicatesthat biological seed production does not decline when grafted seed orchards get old and large withwidely spaced trees. That harvests often decrease in old seed orchards is more likely to be asso-ciated with lower accessibility of cones, lower priority in connection with higher costs of harvestand management actions, to get cones more accessible on large grafts. The seed orchards were
Table 4. Seed weights of Swedish Scots pine seeds (mg/seed or g per 1000 seeds) harvested inseed orchards and stands
Seed orchard seeds Stand seeds Year (seed
maturation) Northern Sweden
Middle Sweden
Southern Sweden Average Middle
Sweden Northern Sweden
1973 6.57 6.39 6.44 6.467 n/a 4.64 1974 6.08 5.55 6.33 5.987 n/a 4.23 1975 5.48 5.83 6.54 5.950 n/a 2.89 1976 6.32 6.53 7.31 6.720 5.36 4.30 1977 5.31 5.43 5.86 5.533 4.11 4.00 1978 5.37 6.09 6.12 5.860 n/a 3.47 1979 5.96 6.12 6.33 6.137 4.13 4.07 1980 6.07 6.47 6.25 6.263 3.77 4.03 1981 5.76 6.14 6.27 6.057 3.85 3.85 1982 5.51 5.76 6.33 5.867 4.03 3.67 1983 5.86 6.14 6.56 6.187 4.02 3.79 1984 5.88 6.07 6.34 6.097 n/a 3.63 1985 6.06 6.70 6.84 6.533 3.82 3.78 1986 6.28 6.16 6.20 6.213 n/a 3.89 1987 5.54 6.20 6.26 6.000 n/a 2.41 1988 6.93 7.15 6.97 7.017 n/a 4.47
Average 5.936 6.171 6.434 6.180 3.82 # Seeds/kg 168 457 162 058 155 415 161 801 - 261 706
70
Proceedings of the Meeting of Nordic Tree Breeders and Forest Geneticists
not recently pruned, which probably contributed to the high seed production. Therefore the seedproduction can probably not be considered sustainable, at least if cones should stay within reach.
The estimated variation among grafts (CV) in fertility does not differ much if measured as any ofthe characters: filled seeds, weight of filled seeds, volume of cones, number of cones, or conecounts from ground. Thus probably all measures results in usable estimates of female fertilityvariation and the most cumbersome methods need not be generally used for that purpose.
Seed weights can probably be as variable among grafts in a seed orchard as among years. Theseed weight 2004 was probably lower than average for Langtora. Probably this is connected tothat no fertilization had been done for a long time and that the seed crop was high, but the seedweight is still much higher than in stands. For Skaholma the average seed weight 1973-88 was5.59 mg, 2004 does not deviate from average.
Visual estimates of cone set
That few cones are visible in a seed orchard could be as the nourishment state is usually good ina seed orchard, the crowns could be rather dense and many cones could be hidden. In our studywe saw only about 10% of all cones. The Swedish Forest Survey makes annual inventories ofcone set (mentioned in Table 2). Trees are observed by a binocular from a point chosen to seemany cones. Hagner (1957 p26-28) made such an inventory of 170 pines on different localitiescovering Sweden. The trees were felled and all cones collected. It was found that 23.1 % of thecones were seen. In a stand the crown is not so dense, so more of the cones may be visible. Alsothe use of binocular will increase the number of observed cones somewhat.
The coefficient correlation in this study is rather low, but still visual estimates seem good enoughto get an impression about the variation among grafts, and thus probably also among clones.Even if the correlation is moderate, it is still high enough to be used as a guide about which graftsproduce many or few cones.
Seed weight
Seed orchard seeds are considerable heavier than stand seeds, even in not well-maintained seedorchards. The reason why orchards produce seeds that is heavier than stand seeds seems to becomplex. Seed orchards are generally established on fertile soils on agricultural land, they arelocated in mild locations with high temperature sum and the capillarity in the soils is normallygood, but the difference is not dramatic and is larger among years than among parts of the coun-try. Trees within orchards are widely spaced and commonly pruned, the use of fertilizer, herbi-cides and moving grass are regular treatments. Clones within northern orchards are often south-erly transferred. Perhaps a contributing reason could be that plus tree selection is a selection oftrees that produce higher seed weight. Perhaps top pruning, which breaks the apical dominanceand forces more nutrition to branches and less to height growth, can be a contributing reason, butheavier seeds are observed also in non pruned seed orchards.
Acknowledgement
We kindly acknowledge Jon Hallander for help with data generation. The study was partly financedby The Swedish Tree Breeding Association.

71
Status, Monitoring and Targets for Breeding Programs
ReferencesAlmqvist,C., Eriksson, U., Eriksson, M. & Yazdani, R. 1996. Effektivare plantageutnyttjande – Tallplantagen
495 Lustnaset.. Arbetsrapport. Nr. 330. 32pp The Forestry Research Institute of Sweden (Skogforsk).Almqvist, C., Eriksson, U. & Yazdani, R. 1995. Effektivare plantageutnyttjande – Tallplantagen 493 Askerud.
Arbetsrapport. Nr. 307. 32pp The Forestry Research Institute of Sweden (Skogforsk).Eriksson, U., Jansson, G. and Almqvist, C. 1998. Seed and pollen production after stem injections of gib-
berellin A4/7 in field-grown seed orchards of Pinus sylvestris. Can Journal For Res 28: 340-346.Hagner, S. 1957. Om kott och froproduktion i svenska barrskogar Meddelande fran Statens
Skogsforskningsinstitut 47:8. 120 pp.Heikinheimo, O. 1932. Metsapuiden siementamiskyvysta I. Referat: Uber die Besamungsfahigheit der
Waldbaume. Communicationes Instituti Forestalis Fenniae 17.3. 61 pp.Heikinheimo, O. 1937. Metsapuiden siementamiskyvysta II. Referat: Uber die Besamungsfahigkeit der
Waldbaume. Communicationes Instituti Forestalis Fenniae 24.4. 67 p.Jonsson, A., Ekberg, I. & Eriksson, G. 1976. Flowering in a seed orchard of Pinus sylvertis L. Studia Forestalia
Suecica 165:38.Karlsson, C. 2000. Seed production of Pinus sylvestris after release cutting. In: Effects of release cutting and
soil scarification on natural regeneration in Pinus sylvestris shelterwoods, Acta universitatis agriculturaeSueciae, Silvestra 137.
Koski, V. & Tallqvist, R. 1978. Tuloksia monivuotisista kukinnan ja siemensadon mittauksista metsapuilla.Summary: Results of long-time measurements of the quantity of flowering and seed crop of foresttrees. Folia Forestalia 364. 60 s.
Rosvall, O., Andersson, B. & Untinen, P. 1983. Markbehandling i tallfroplantager. Foreningen skogstradsforadling,Arsbok 1982 s 71-89.
Sarvas, R. 1962. Investigations on the flowering and seed crop of Pinus silvestris. Seloste: Tutkimuksiamannyn kukkimisesta ja siemensadosta. Communicationes Instituti Forestalis Fenniae 53.4. 198 p.
Yazdani, R., Lindgren, D., Seyedyazdani, F., Pascual, L. and Eriksson, U. 1995. Flowering, phenology,empty seeds and pollen contamination in a clonal seed orchard of Pinus sylvestris in northern Sweden.In: Baradat Ph, Adams WT & Muller-Starck G (Eds) Population genetics and genetic conservation offorest trees. SPB Academic Publishing,

72
Proceedings of the Meeting of Nordic Tree Breeders and Forest Geneticists
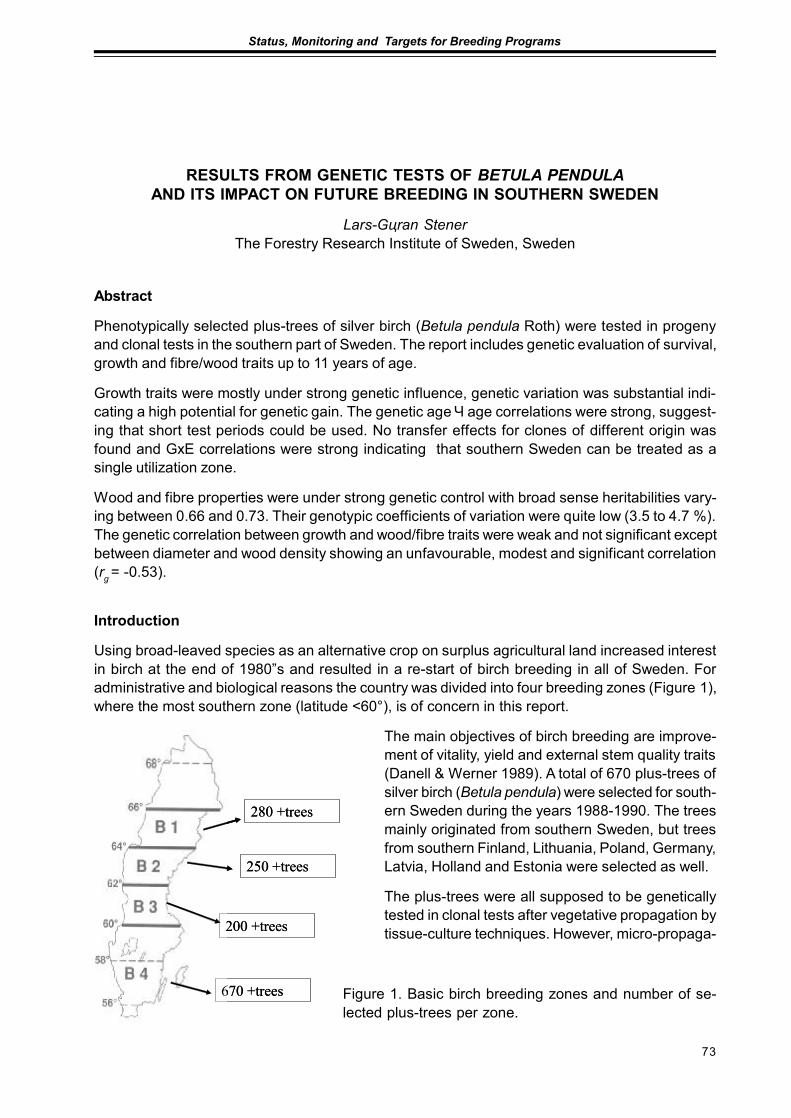
73
Status, Monitoring and Targets for Breeding Programs
RESULTS FROM GENETIC TESTS OF BETULA PENDULAAND ITS IMPACT ON FUTURE BREEDING IN SOUTHERN SWEDEN
Lars-Gцran StenerThe Forestry Research Institute of Sweden, Sweden
Abstract
Phenotypically selected plus-trees of silver birch (Betula pendula Roth) were tested in progenyand clonal tests in the southern part of Sweden. The report includes genetic evaluation of survival,growth and fibre/wood traits up to 11 years of age.
Growth traits were mostly under strong genetic influence, genetic variation was substantial indi-cating a high potential for genetic gain. The genetic age Ч age correlations were strong, suggest-ing that short test periods could be used. No transfer effects for clones of different origin wasfound and GxE correlations were strong indicating that southern Sweden can be treated as asingle utilization zone.
Wood and fibre properties were under strong genetic control with broad sense heritabilities vary-ing between 0.66 and 0.73. Their genotypic coefficients of variation were quite low (3.5 to 4.7 %).The genetic correlation between growth and wood/fibre traits were weak and not significant exceptbetween diameter and wood density showing an unfavourable, modest and significant correlation(rg = -0.53).
Introduction
Using broad-leaved species as an alternative crop on surplus agricultural land increased interestin birch at the end of 1980”s and resulted in a re-start of birch breeding in all of Sweden. Foradministrative and biological reasons the country was divided into four breeding zones (Figure 1),where the most southern zone (latitude <60°), is of concern in this report.
The main objectives of birch breeding are improve-ment of vitality, yield and external stem quality traits(Danell & Werner 1989). A total of 670 plus-trees ofsilver birch (Betula pendula) were selected for south-ern Sweden during the years 1988-1990. The treesmainly originated from southern Sweden, but treesfrom southern Finland, Lithuania, Poland, Germany,Latvia, Holland and Estonia were selected as well.
The plus-trees were all supposed to be geneticallytested in clonal tests after vegetative propagation bytissue-culture techniques. However, micro-propaga-
Figure 1. Basic birch breeding zones and number of se-lected plus-trees per zone.
250 +trees
280 +trees
200 +trees
670 +trees
250 +trees
280 +trees
200 +trees
670 +trees
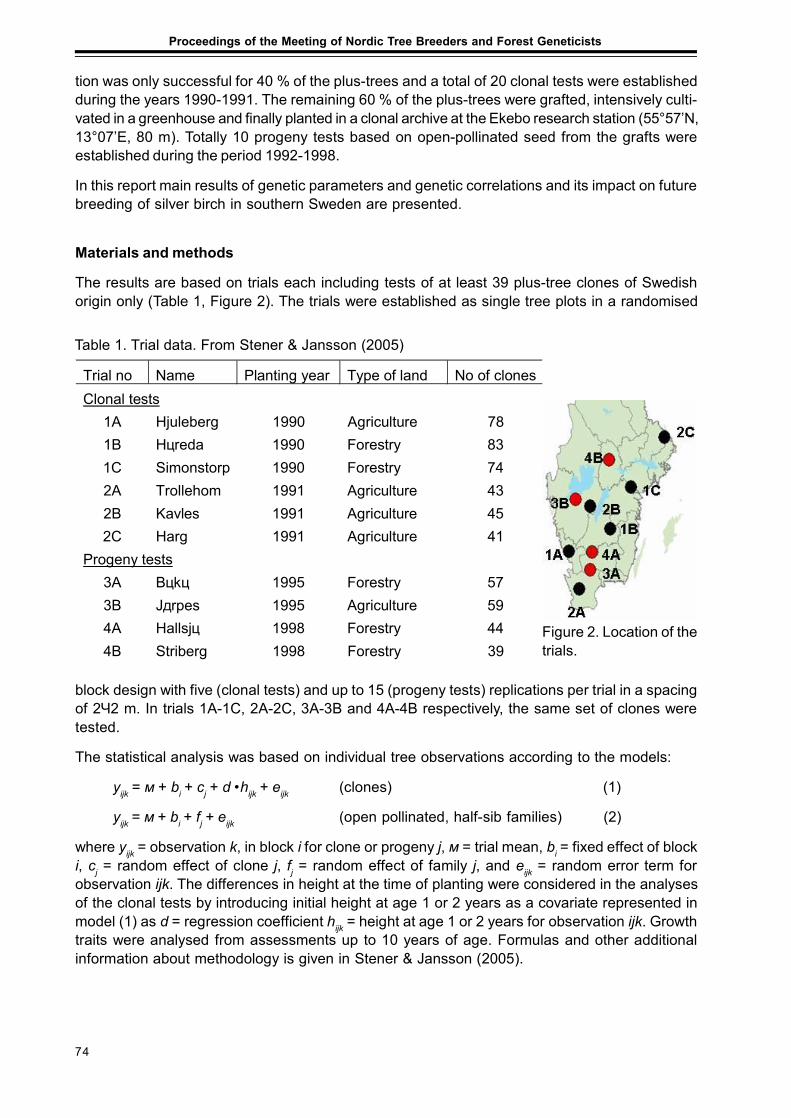
74
Proceedings of the Meeting of Nordic Tree Breeders and Forest Geneticists
tion was only successful for 40 % of the plus-trees and a total of 20 clonal tests were establishedduring the years 1990-1991. The remaining 60 % of the plus-trees were grafted, intensively culti-vated in a greenhouse and finally planted in a clonal archive at the Ekebo research station (55°57’N,13°07’E, 80 m). Totally 10 progeny tests based on open-pollinated seed from the grafts wereestablished during the period 1992-1998.
In this report main results of genetic parameters and genetic correlations and its impact on futurebreeding of silver birch in southern Sweden are presented.
Materials and methods
The results are based on trials each including tests of at least 39 plus-tree clones of Swedishorigin only (Table 1, Figure 2). The trials were established as single tree plots in a randomised
Table 1. Trial data. From Stener & Jansson (2005)
Trial no Name Planting year Type of land No of clones Clonal tests
1A Hjuleberg 1990 Agriculture 78 1B Hцreda 1990 Forestry 83 1C Simonstorp 1990 Forestry 74 2A Trollehom 1991 Agriculture 43 2B Kavlеs 1991 Agriculture 45 2C Harg 1991 Agriculture 41
Progeny tests 3A Bцkц 1995 Forestry 57 3B Jдrpеs 1995 Agriculture 59 4A Hallsjц 1998 Forestry 44 4B Striberg 1998 Forestry 39
Figure 2. Location of thetrials.
block design with five (clonal tests) and up to 15 (progeny tests) replications per trial in a spacingof 2Ч2 m. In trials 1A-1C, 2A-2C, 3A-3B and 4A-4B respectively, the same set of clones weretested.
The statistical analysis was based on individual tree observations according to the models:
yijk = м + bi + cj + d •hijk + eijk (clones) (1)
yijk = м + bi + fj + eijk (open pollinated, half-sib families) (2)
where yijk = observation k, in block i for clone or progeny j, м = trial mean, bi = fixed effect of blocki, cj = random effect of clone j, fj = random effect of family j, and eijk = random error term forobservation ijk. The differences in height at the time of planting were considered in the analysesof the clonal tests by introducing initial height at age 1 or 2 years as a covariate represented inmodel (1) as d = regression coefficient hijk = height at age 1 or 2 years for observation ijk. Growthtraits were analysed from assessments up to 10 years of age. Formulas and other additionalinformation about methodology is given in Stener & Jansson (2005).
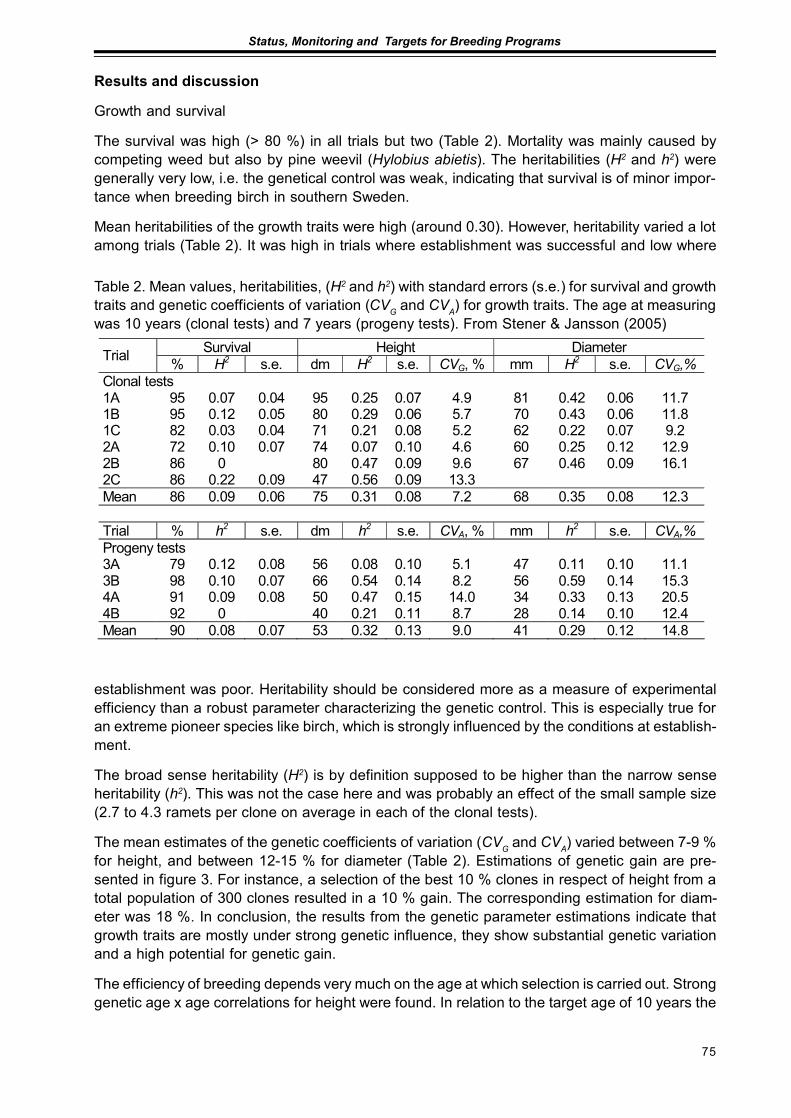
75
Status, Monitoring and Targets for Breeding Programs
Results and discussion
Growth and survival
The survival was high (> 80 %) in all trials but two (Table 2). Mortality was mainly caused bycompeting weed but also by pine weevil (Hylobius abietis). The heritabilities (H2 and h2) weregenerally very low, i.e. the genetical control was weak, indicating that survival is of minor impor-tance when breeding birch in southern Sweden.
Mean heritabilities of the growth traits were high (around 0.30). However, heritability varied a lotamong trials (Table 2). It was high in trials where establishment was successful and low where
Table 2. Mean values, heritabilities, (H2 and h2) with standard errors (s.e.) for survival and growthtraits and genetic coefficients of variation (CVG and CVA) for growth traits. The age at measuringwas 10 years (clonal tests) and 7 years (progeny tests). From Stener & Jansson (2005)
Survival Height Diameter Trial % H2 s.e. dm H2 s.e. CVG, % mm H2 s.e. CVG,% Clonal tests 1A 95 0.07 0.04 95 0.25 0.07 4.9 81 0.42 0.06 11.7 1B 95 0.12 0.05 80 0.29 0.06 5.7 70 0.43 0.06 11.8 1C 82 0.03 0.04 71 0.21 0.08 5.2 62 0.22 0.07 9.2 2A 72 0.10 0.07 74 0.07 0.10 4.6 60 0.25 0.12 12.9 2B 86 0 80 0.47 0.09 9.6 67 0.46 0.09 16.1 2C 86 0.22 0.09 47 0.56 0.09 13.3 Mean 86 0.09 0.06 75 0.31 0.08 7.2 68 0.35 0.08 12.3 Trial % h2 s.e. dm h2 s.e. CVA, % mm h2 s.e. CVA,% Progeny tests 3A 79 0.12 0.08 56 0.08 0.10 5.1 47 0.11 0.10 11.1 3B 98 0.10 0.07 66 0.54 0.14 8.2 56 0.59 0.14 15.3 4A 91 0.09 0.08 50 0.47 0.15 14.0 34 0.33 0.13 20.5 4B 92 0 40 0.21 0.11 8.7 28 0.14 0.10 12.4 Mean 90 0.08 0.07 53 0.32 0.13 9.0 41 0.29 0.12 14.8
establishment was poor. Heritability should be considered more as a measure of experimentalefficiency than a robust parameter characterizing the genetic control. This is especially true foran extreme pioneer species like birch, which is strongly influenced by the conditions at establish-ment.
The broad sense heritability (H2) is by definition supposed to be higher than the narrow senseheritability (h2). This was not the case here and was probably an effect of the small sample size(2.7 to 4.3 ramets per clone on average in each of the clonal tests).
The mean estimates of the genetic coefficients of variation (CVG and CVA) varied between 7-9 %for height, and between 12-15 % for diameter (Table 2). Estimations of genetic gain are pre-sented in figure 3. For instance, a selection of the best 10 % clones in respect of height from atotal population of 300 clones resulted in a 10 % gain. The corresponding estimation for diam-eter was 18 %. In conclusion, the results from the genetic parameter estimations indicate thatgrowth traits are mostly under strong genetic influence, they show substantial genetic variationand a high potential for genetic gain.
The efficiency of breeding depends very much on the age at which selection is carried out. Stronggenetic age x age correlations for height were found. In relation to the target age of 10 years the
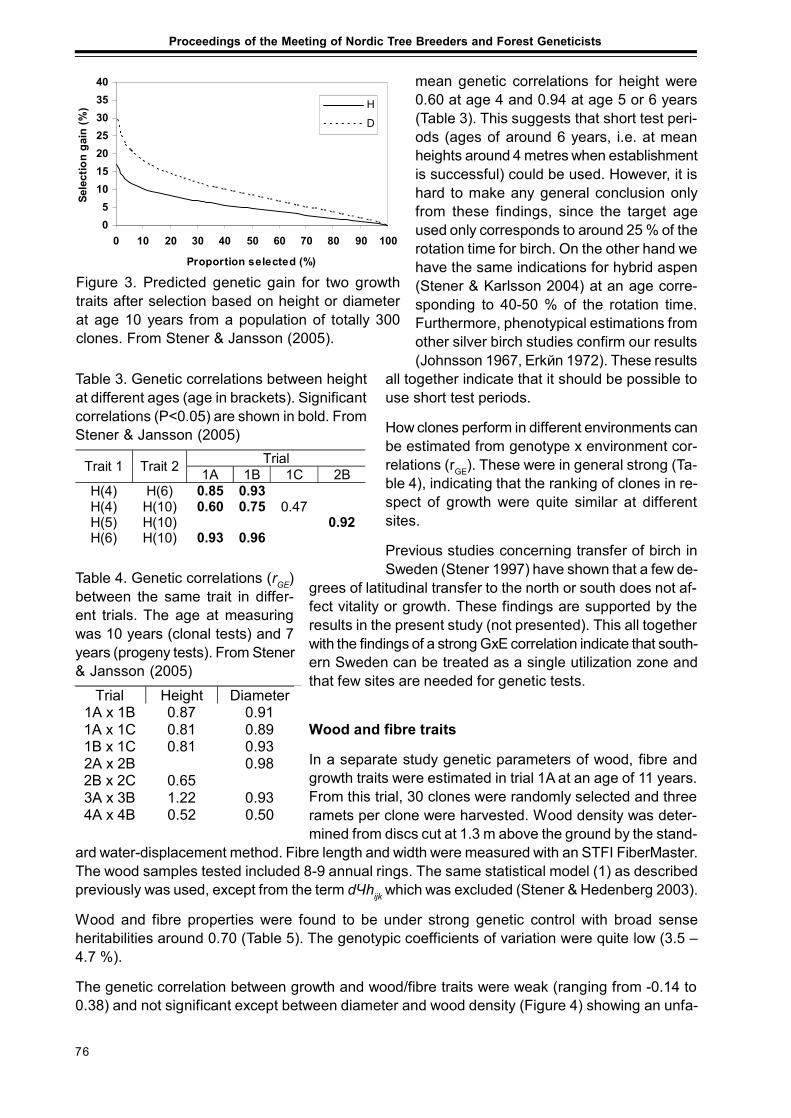
76
Proceedings of the Meeting of Nordic Tree Breeders and Forest Geneticists
mean genetic correlations for height were0.60 at age 4 and 0.94 at age 5 or 6 years(Table 3). This suggests that short test peri-ods (ages of around 6 years, i.e. at meanheights around 4 metres when establishmentis successful) could be used. However, it ishard to make any general conclusion onlyfrom these findings, since the target ageused only corresponds to around 25 % of therotation time for birch. On the other hand wehave the same indications for hybrid aspen(Stener & Karlsson 2004) at an age corre-sponding to 40-50 % of the rotation time.Furthermore, phenotypical estimations fromother silver birch studies confirm our results(Johnsson 1967, Erkйn 1972). These results
all together indicate that it should be possible touse short test periods.
How clones perform in different environments canbe estimated from genotype x environment cor-relations (rGE). These were in general strong (Ta-ble 4), indicating that the ranking of clones in re-spect of growth were quite similar at differentsites.
Previous studies concerning transfer of birch inSweden (Stener 1997) have shown that a few de-
grees of latitudinal transfer to the north or south does not af-fect vitality or growth. These findings are supported by theresults in the present study (not presented). This all togetherwith the findings of a strong GxE correlation indicate that south-ern Sweden can be treated as a single utilization zone andthat few sites are needed for genetic tests.
Wood and fibre traits
In a separate study genetic parameters of wood, fibre andgrowth traits were estimated in trial 1A at an age of 11 years.From this trial, 30 clones were randomly selected and threeramets per clone were harvested. Wood density was deter-mined from discs cut at 1.3 m above the ground by the stand-
ard water-displacement method. Fibre length and width were measured with an STFI FiberMaster.The wood samples tested included 8-9 annual rings. The same statistical model (1) as describedpreviously was used, except from the term dЧhijk which was excluded (Stener & Hedenberg 2003).
Wood and fibre properties were found to be under strong genetic control with broad senseheritabilities around 0.70 (Table 5). The genotypic coefficients of variation were quite low (3.5 –4.7 %).
The genetic correlation between growth and wood/fibre traits were weak (ranging from -0.14 to0.38) and not significant except between diameter and wood density (Figure 4) showing an unfa-
Figure 3. Predicted genetic gain for two growthtraits after selection based on height or diameterat age 10 years from a population of totally 300clones. From Stener & Jansson (2005).
05
10152025303540
0 10 20 30 40 50 60 70 80 90 100
Proportion selected (%)
Sele
ctio
n ga
in (%
) H
D
Table 3. Genetic correlations between heightat different ages (age in brackets). Significantcorrelations (P<0.05) are shown in bold. FromStener & Jansson (2005)
Trial Trait 1 Trait 2 1A 1B 1C 2B H(4) H(6) 0.85 0.93 H(4) H(10) 0.60 0.75 0.47 H(5) H(10) 0.92 H(6) H(10) 0.93 0.96
Table 4. Genetic correlations (rGE)between the same trait in differ-ent trials. The age at measuringwas 10 years (clonal tests) and 7years (progeny tests). From Stener& Jansson (2005)
Trial Height Diameter 1A x 1B 0.87 0.91 1A x 1C 0.81 0.89 1B x 1C 0.81 0.93 2A x 2B 0.98 2B x 2C 0.65 3A x 3B 1.22 0.93 4A x 4B 0.52 0.50
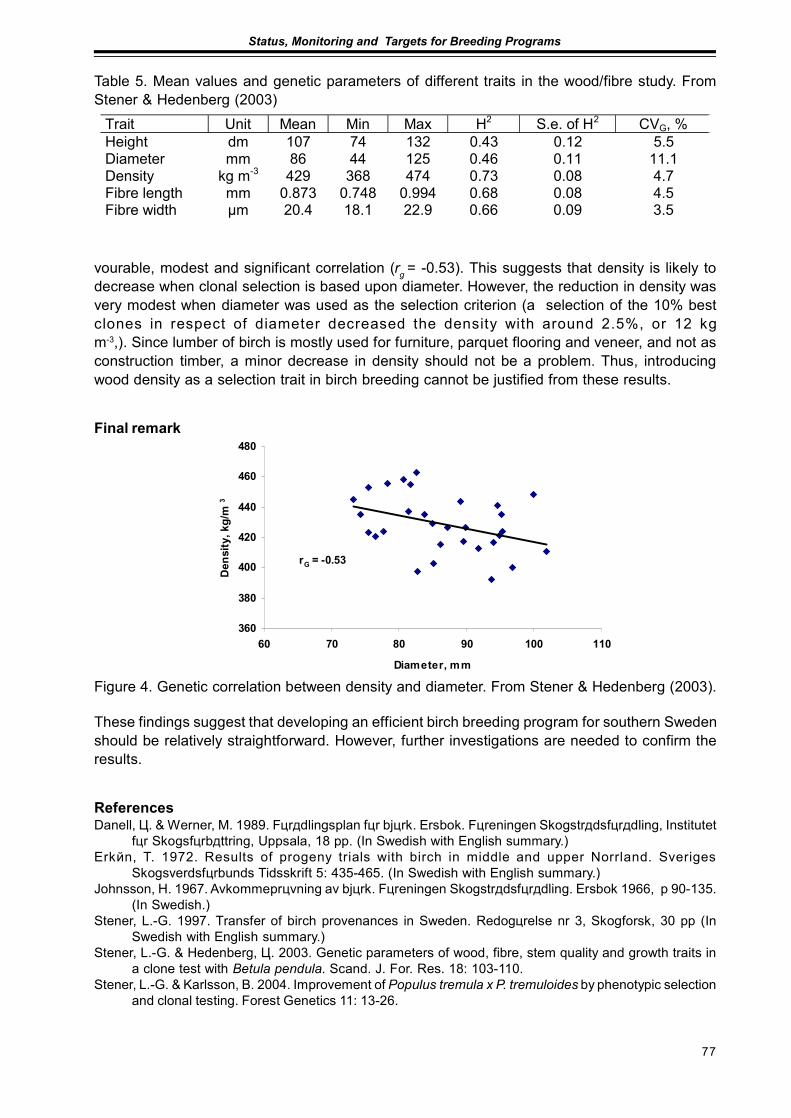
77
Status, Monitoring and Targets for Breeding Programs
vourable, modest and significant correlation (rg = -0.53). This suggests that density is likely todecrease when clonal selection is based upon diameter. However, the reduction in density wasvery modest when diameter was used as the selection criterion (a selection of the 10% bestclones in respect of diameter decreased the density with around 2.5%, or 12 kgm-3,). Since lumber of birch is mostly used for furniture, parquet flooring and veneer, and not asconstruction timber, a minor decrease in density should not be a problem. Thus, introducingwood density as a selection trait in birch breeding cannot be justified from these results.
Final remark
Table 5. Mean values and genetic parameters of different traits in the wood/fibre study. FromStener & Hedenberg (2003)
Trait Unit Mean Min Max H2 S.e. of H2 CVG, % Height dm 107 74 132 0.43 0.12 5.5 Diameter mm 86 44 125 0.46 0.11 11.1 Density kg m-3 429 368 474 0.73 0.08 4.7 Fibre length mm 0.873 0.748 0.994 0.68 0.08 4.5 Fibre width µm 20.4 18.1 22.9 0.66 0.09 3.5
Figure 4. Genetic correlation between density and diameter. From Stener & Hedenberg (2003).
360
380
400
420
440
460
480
60 70 80 90 100 110
Diameter, mm
Den
sity
, kg/
m3
rG = -0.53
These findings suggest that developing an efficient birch breeding program for southern Swedenshould be relatively straightforward. However, further investigations are needed to confirm theresults.
ReferencesDanell, Ц. & Werner, M. 1989. Fцrдdlingsplan fцr bjцrk. Еrsbok. Fцreningen Skogstrдdsfцrдdling, Institutet
fцr Skogsfцrbдttring, Uppsala, 18 pp. (In Swedish with English summary.)Erkйn, T. 1972. Results of progeny trials with birch in middle and upper Norrland. Sveriges
Skogsvеrdsfцrbunds Tidsskrift 5: 435-465. (In Swedish with English summary.)Johnsson, H. 1967. Avkommeprцvning av bjцrk. Fцreningen Skogstrдdsfцrдdling. Еrsbok 1966, p 90-135.
(In Swedish.)Stener, L.-G. 1997. Transfer of birch provenances in Sweden. Redogцrelse nr 3, Skogforsk, 30 pp (In
Swedish with English summary.)Stener, L.-G. & Hedenberg, Ц. 2003. Genetic parameters of wood, fibre, stem quality and growth traits in
a clone test with Betula pendula. Scand. J. For. Res. 18: 103-110.Stener, L.-G. & Karlsson, B. 2004. Improvement of Populus tremula x P. tremuloides by phenotypic selection
and clonal testing. Forest Genetics 11: 13-26.

78
Proceedings of the Meeting of Nordic Tree Breeders and Forest Geneticists
Stener, L-G & Jansson, G. 2005. Improvement of Betula pendula by clonal and progeny testing of phenotypicallyselected trees. Scand. J. For. Res. 20: 292-303.

79
Status, Monitoring and Targets for Breeding Programs
IMPROVED UTILIZATION OF THE INTERNAL POLLEN PRODUCTIONIN A PINUS SYLVESTRIS SEED ORCHARD BY THE USE OF A MIST BLOWER
Curt Almqvist1) and Pertti Pulkkinen2)
1) Skogforsk, Uppsala Science Park, Uppsala, Sweden2) Metla, Haapastensyrja Breeding Station, Layliainen, Finland
Few experiments with the aim of more effective utilization of the pollen production in seed or-chards without first collect the pollen have been reported. The number of filled seed has beenreported to increase after mist blower treatment in Pinus taeda (Brown, 1987). The effect ofusing a helicopter to blow pollen around the seed orchard on pollen contamination in a Pinussylvestris seed orchard varied from negative to slightly positive in a Finnish experiment (Antolaet al. 1994).
The objective of this experiment was to evaluate the effect of treatment of a Pinus sylvestrisseed orchard with a tractor-mounted mist blower during female flower receptivity. The aim was toincrease the number of seeds per cone, and to increase the number of seeds having a seedorchard clone as father. This should be achieved by releasing the pollen produced in the seedorchard as soon as possible by the use of the mist blower.
The experiment were performed in a 14 hectare Pinus sylvestris seed orchard located in centralSweden (Lat 59° 53’. 80 m.a.sl.). The clones originated from approximately the same latitude butfrom higher altitudes, resulting in a mean transfer to a location with 400 d.d. higher temperaturesum (+5°C).
The seed orchard was divided into four plots. Two plots were treated with the mist blower, andtwo plots were untreated controls. Treatment was carried out on five days each of three con-secutive years.
The amount of pollen in the air was measured with Rotrod samplers at 4 meters and 6 metersheight. Cones were collected from all clones on all four plots. Seeds were extracted and seedparameters were recorded. Pollen contamination estimates were obtained by microsatellite analy-sis. We used five loci with 20 to 50 alleles per loci.
The results show that the mist blower treatment increased the amount of pollen in the air duringthe treatment time, figure 1. The amount of pollen in the air before and after treatment each daywas not affected. There were no differences in number of filled seeds per cone or in percentageempty seeds per cone between the treated plots and the control plots, table 1.
The mist blower treatment did not change the amount of pollen contamination in the seed fromtreated plots compared to seed from the control plots, Figure 2. The level of pollen contamination
Table 1. Seed set data in the experimentYear Treatment Number filled seed per cone Percentage empty seeds 1999 Treated 16.9 24.7
Control 17.5 24.6 2000 Treated 16.3 29.4
Control 16.7 28.3 2001 Treated 21.3 21.9
Control 20.4 20.3
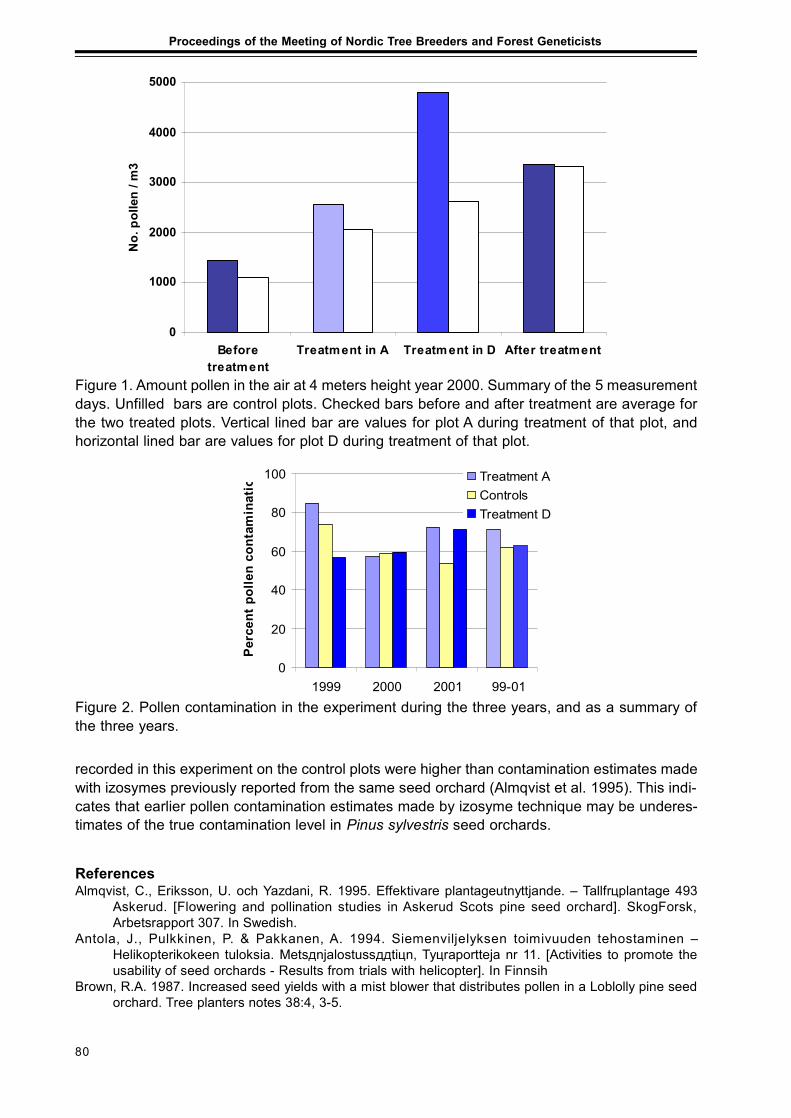
80
Proceedings of the Meeting of Nordic Tree Breeders and Forest Geneticists
recorded in this experiment on the control plots were higher than contamination estimates madewith izosymes previously reported from the same seed orchard (Almqvist et al. 1995). This indi-cates that earlier pollen contamination estimates made by izosyme technique may be underes-timates of the true contamination level in Pinus sylvestris seed orchards.
ReferencesAlmqvist, C., Eriksson, U. och Yazdani, R. 1995. Effektivare plantageutnyttjande. – Tallfrцplantage 493
Askerud. [Flowering and pollination studies in Askerud Scots pine seed orchard]. SkogForsk,Arbetsrapport 307. In Swedish.
Antola, J., Pulkkinen, P. & Pakkanen, A. 1994. Siemenviljelyksen toimivuuden tehostaminen –Helikopterikokeen tuloksia. Metsдnjalostussддtiцn, Tyцraportteja nr 11. [Activities to promote theusability of seed orchards - Results from trials with helicopter]. In Finnsih
Brown, R.A. 1987. Increased seed yields with a mist blower that distributes pollen in a Loblolly pine seedorchard. Tree planters notes 38:4, 3-5.
0
1000
2000
3000
4000
5000
Beforetreatment
Treatment in A Treatment in D After treatment
No.
pol
len
/ m3
Figure 1. Amount pollen in the air at 4 meters height year 2000. Summary of the 5 measurementdays. Unfilled bars are control plots. Checked bars before and after treatment are average forthe two treated plots. Vertical lined bar are values for plot A during treatment of that plot, andhorizontal lined bar are values for plot D during treatment of that plot.
0
20
40
60
80
100
1999 2000 2001 99-01
Perc
ent p
olle
n co
ntam
inat
ion Treatment A
ControlsTreatment D
Figure 2. Pollen contamination in the experiment during the three years, and as a summary ofthe three years.
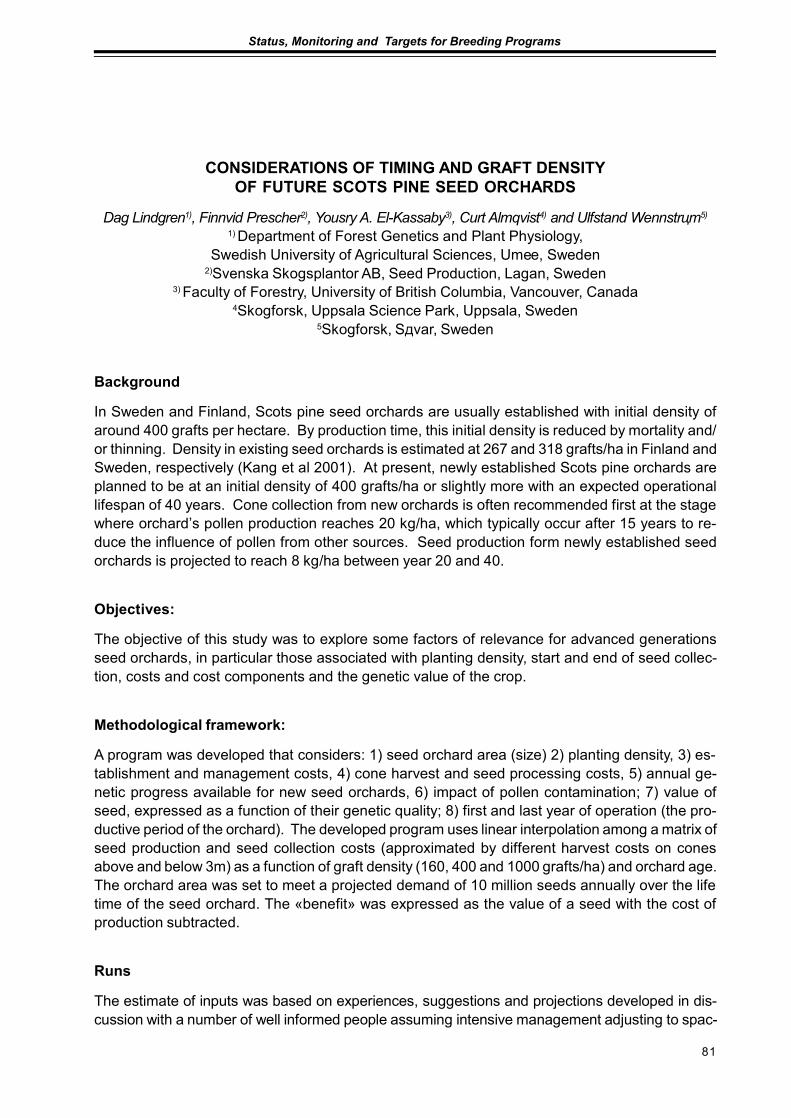
81
Status, Monitoring and Targets for Breeding Programs
CONSIDERATIONS OF TIMING AND GRAFT DENSITYOF FUTURE SCOTS PINE SEED ORCHARDS
Dag Lindgren1), Finnvid Prescher2), Yousry A. El-Kassaby3), Curt Almqvist4) and Ulfstand Wennstrцm5)
1) Department of Forest Genetics and Plant Physiology,Swedish University of Agricultural Sciences, Umeе, Sweden
2)Svenska Skogsplantor AB, Seed Production, Lagan, Sweden3) Faculty of Forestry, University of British Columbia, Vancouver, Canada
4Skogforsk, Uppsala Science Park, Uppsala, Sweden5Skogforsk, Sдvar, Sweden
Background
In Sweden and Finland, Scots pine seed orchards are usually established with initial density ofaround 400 grafts per hectare. By production time, this initial density is reduced by mortality and/or thinning. Density in existing seed orchards is estimated at 267 and 318 grafts/ha in Finland andSweden, respectively (Kang et al 2001). At present, newly established Scots pine orchards areplanned to be at an initial density of 400 grafts/ha or slightly more with an expected operationallifespan of 40 years. Cone collection from new orchards is often recommended first at the stagewhere orchard’s pollen production reaches 20 kg/ha, which typically occur after 15 years to re-duce the influence of pollen from other sources. Seed production form newly established seedorchards is projected to reach 8 kg/ha between year 20 and 40.
Objectives:
The objective of this study was to explore some factors of relevance for advanced generationsseed orchards, in particular those associated with planting density, start and end of seed collec-tion, costs and cost components and the genetic value of the crop.
Methodological framework:
A program was developed that considers: 1) seed orchard area (size) 2) planting density, 3) es-tablishment and management costs, 4) cone harvest and seed processing costs, 5) annual ge-netic progress available for new seed orchards, 6) impact of pollen contamination; 7) value ofseed, expressed as a function of their genetic quality; 8) first and last year of operation (the pro-ductive period of the orchard). The developed program uses linear interpolation among a matrix ofseed production and seed collection costs (approximated by different harvest costs on conesabove and below 3m) as a function of graft density (160, 400 and 1000 grafts/ha) and orchard age.The orchard area was set to meet a projected demand of 10 million seeds annually over the lifetime of the seed orchard. The «benefit» was expressed as the value of a seed with the cost ofproduction subtracted.
Runs
The estimate of inputs was based on experiences, suggestions and projections developed in dis-cussion with a number of well informed people assuming intensive management adjusting to spac-
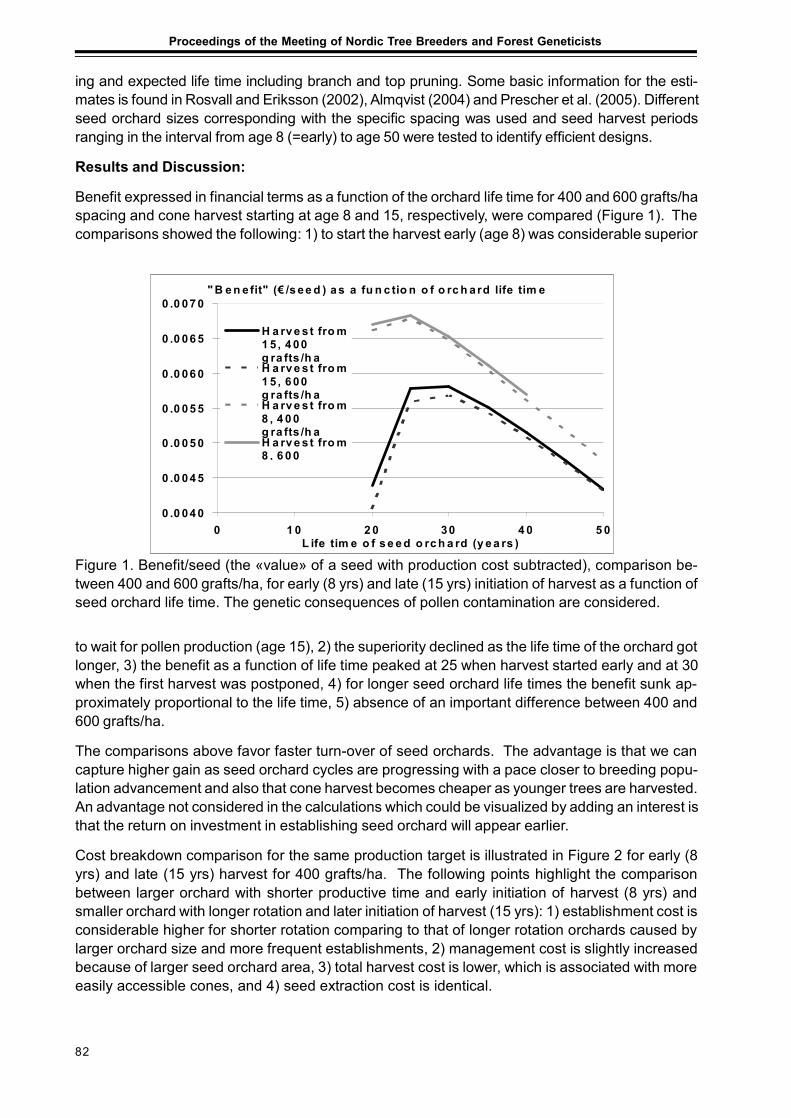
82
Proceedings of the Meeting of Nordic Tree Breeders and Forest Geneticists
ing and expected life time including branch and top pruning. Some basic information for the esti-mates is found in Rosvall and Eriksson (2002), Almqvist (2004) and Prescher et al. (2005). Differentseed orchard sizes corresponding with the specific spacing was used and seed harvest periodsranging in the interval from age 8 (=early) to age 50 were tested to identify efficient designs.
Results and Discussion:
Benefit expressed in financial terms as a function of the orchard life time for 400 and 600 grafts/haspacing and cone harvest starting at age 8 and 15, respectively, were compared (Figure 1). Thecomparisons showed the following: 1) to start the harvest early (age 8) was considerable superior
to wait for pollen production (age 15), 2) the superiority declined as the life time of the orchard gotlonger, 3) the benefit as a function of life time peaked at 25 when harvest started early and at 30when the first harvest was postponed, 4) for longer seed orchard life times the benefit sunk ap-proximately proportional to the life time, 5) absence of an important difference between 400 and600 grafts/ha.
The comparisons above favor faster turn-over of seed orchards. The advantage is that we cancapture higher gain as seed orchard cycles are progressing with a pace closer to breeding popu-lation advancement and also that cone harvest becomes cheaper as younger trees are harvested.An advantage not considered in the calculations which could be visualized by adding an interest isthat the return on investment in establishing seed orchard will appear earlier.
Cost breakdown comparison for the same production target is illustrated in Figure 2 for early (8yrs) and late (15 yrs) harvest for 400 grafts/ha. The following points highlight the comparisonbetween larger orchard with shorter productive time and early initiation of harvest (8 yrs) andsmaller orchard with longer rotation and later initiation of harvest (15 yrs): 1) establishment cost isconsiderable higher for shorter rotation comparing to that of longer rotation orchards caused bylarger orchard size and more frequent establishments, 2) management cost is slightly increasedbecause of larger seed orchard area, 3) total harvest cost is lower, which is associated with moreeasily accessible cones, and 4) seed extraction cost is identical.
Figure 1. Benefit/seed (the «value» of a seed with production cost subtracted), comparison be-tween 400 and 600 grafts/ha, for early (8 yrs) and late (15 yrs) initiation of harvest as a function ofseed orchard life time. The genetic consequences of pollen contamination are considered.
" B e n efit" (€ /s ee d ) a s a fu n c tio n o f o rc h ard life tim e
0 .0 04 0
0 .0 04 5
0 .0 05 0
0 .0 05 5
0 .0 06 0
0 .0 06 5
0 .0 07 0
0 1 0 2 0 30 4 0 5 0L ife tim e o f s e e d o rc h a rd (y e a rs )
H a rv e s t fro m1 5 , 4 00g ra fts /h aH a rv e s t fro m1 5 , 6 00g ra fts /h aH a rv e s t fro m8 , 4 0 0g ra fts /h aH a rv e s t fro m8 , 6 0 0
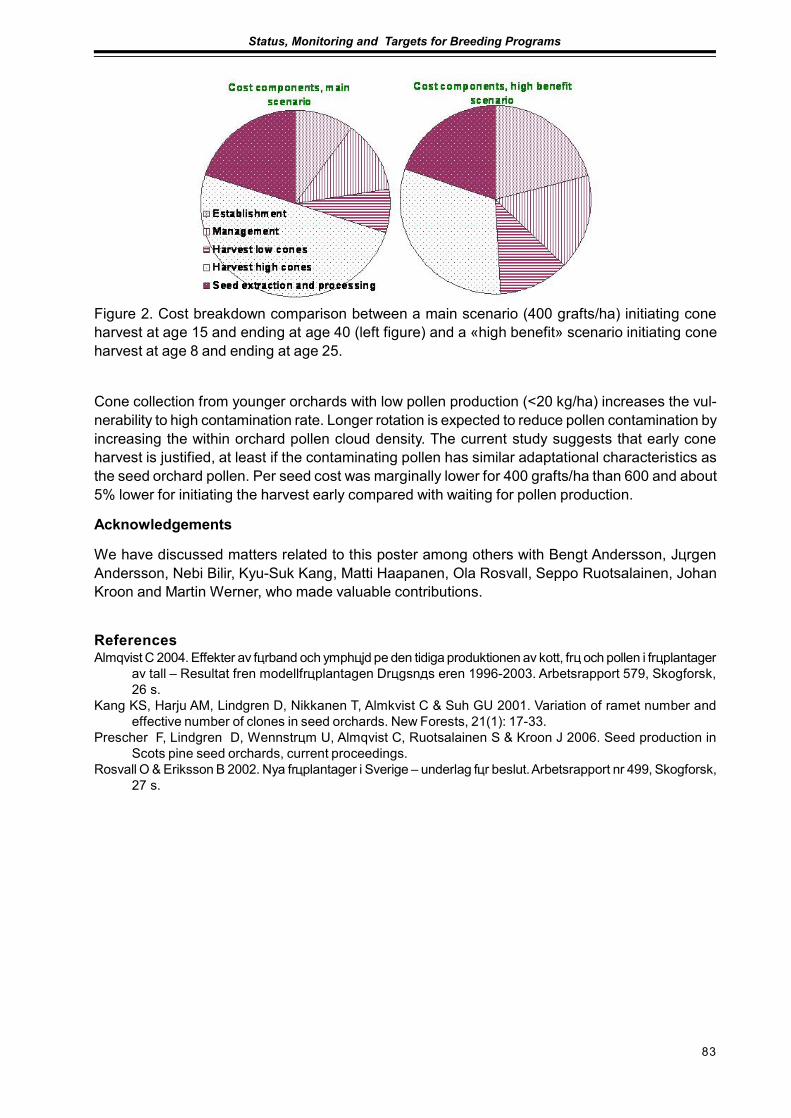
83
Status, Monitoring and Targets for Breeding Programs
Cone collection from younger orchards with low pollen production (<20 kg/ha) increases the vul-nerability to high contamination rate. Longer rotation is expected to reduce pollen contamination byincreasing the within orchard pollen cloud density. The current study suggests that early coneharvest is justified, at least if the contaminating pollen has similar adaptational characteristics asthe seed orchard pollen. Per seed cost was marginally lower for 400 grafts/ha than 600 and about5% lower for initiating the harvest early compared with waiting for pollen production.
Acknowledgements
We have discussed matters related to this poster among others with Bengt Andersson, JцrgenAndersson, Nebi Bilir, Kyu-Suk Kang, Matti Haapanen, Ola Rosvall, Seppo Ruotsalainen, JohanKroon and Martin Werner, who made valuable contributions.
ReferencesAlmqvist C 2004. Effekter av fцrband och ymphцjd pе den tidiga produktionen av kott, frц och pollen i frцplantager
av tall – Resultat frеn modellfrцplantagen Drцgsnдs еren 1996-2003. Arbetsrapport 579, Skogforsk,26 s.
Kang KS, Harju AM, Lindgren D, Nikkanen T, Almkvist C & Suh GU 2001. Variation of ramet number andeffective number of clones in seed orchards. New Forests, 21(1): 17-33.
Prescher F, Lindgren D, Wennstrцm U, Almqvist C, Ruotsalainen S & Kroon J 2006. Seed production inScots pine seed orchards, current proceedings.
Rosvall O & Eriksson B 2002. Nya frцplantager i Sverige – underlag fцr beslut. Arbetsrapport nr 499, Skogforsk,27 s.
Figure 2. Cost breakdown comparison between a main scenario (400 grafts/ha) initiating coneharvest at age 15 and ending at age 40 (left figure) and a «high benefit» scenario initiating coneharvest at age 8 and ending at age 25.

84
Proceedings of the Meeting of Nordic Tree Breeders and Forest Geneticists

85
Status, Monitoring and Targets for Breeding Programs
PRELIMINARY ASSUMPTIONSTO «THE PROGRAMME OF FOREST GENE RESOURCES CONSERVATION
AND BREEDING OF FOREST TREES SPECIES IN POLANDIN THE YEARS 2010 – 2035»
Jan MatrasDepartment of Genetics and Physiology of Woody Plants, Forest Research Institute,
Warszawa, Poland
Prerequisites for the Preparation of the «Programme»
«The Programme of Forest Gene Resources Conservation and Selective Breeding of Forest Treesin Poland», which is under way in the State Forest, has been planned for the years 1991-2010.Data presented in previous papers show that material tasks of the «Programme» have practicallybeen executed.
The pro-ecological forest management system and the increased role of other functions of theforest may by one of the factors causing the limitation of forest production functions.
Although the significant increase of the quantity of timber harvested in the last decade has beenobserved (the increase from 24 million mі to 32 million mі annually) the demand for timber is stillsignificantly higher than its supply. At the same time, the production ability of Polish forests is usedwithin the limited extent.
Global changes of climate and related threats should constitute an essential driver for the amend-ment to the new programme’s strategic objectives. Activities related to the selective breeding offorest trees must guarantee the preservation of the total forest genetic diversity and durability inthe changing environmental conditions. Counteracting the reduction of biodiversity of forest eco-systems, and biodiversity of stands in the first instance, is becoming an important objective. Theprincipal goal of selective breeding of forest trees should, first of all, be the directed modification ofthe population increasing natural adaptation processes of forest trees to changing conditions. Themost important features to be supported are flexibility and tolerance of species for changing envi-ronmental conditions, and only then there comes the timber increment.
Poland has become the European Union member state. Thus, we are obligated to implementessential changes in principles of functioning, establishment and use of the forest-tree seed re-sources – the forest basic material (FBM).
The adjustment of principles to the EU requirements means the simultaneous protection of Polishforests against seeds and cuttings of unknown origin, which may cause the erosion of individuality ofour native stands and constituting danger to the durability and stability among forest ecosystems.
Basic Assumptions
The programme should be a continuation of programmes executed so far (both the principle ob-jectives and tasks execution modes will be preserved). Only the actual changes of conditions offorestry may modify the execution of the programmes and tasks stipulated therein.

86
Proceedings of the Meeting of Nordic Tree Breeders and Forest Geneticists
The programme should cover activities related to the conservation of forest biodiversity, includinggenetic diversity, as well as selective breeding of forest trees. Such approach to the breeding offorest trees will allow to achieve the regular progress in fulfilling various functions by managedforests, including the production function.
The programme should define the scope of meritoric and material activities, as well as additionalactivities such as:
– scientific research necessary for the execution of the «Programme»,– establishment of technical infrastructure for the proper execution of the «Programme».
Strategic Objectives of the Programme
The strategic objectives adopted in 1991 for the «Programme» for the years 1991-2010 remainedpractically unchanged. Priorities of the «Programme» for years 2011-2035 should cover:
a. Conservation of forest biodiversity.b. Selective breeding of forest trees.c. Establishment and maintaining of the proper quality and quantity seed base for the purpose
of reforestation and afforestation.
Specific Activities for Individual Priorities
Conservation of forest biodiversity, including genetic diversity
The proposed scope and scheme of activities within the conservation of forest genetic diversityhas been presented in Fig 1. Basic activities planned within this programme cover the following:
Legislative activities:– preparation of an act on the conservation of forest biodiversity or amendment to the act on
the environment protection and the forestry act which would legally sanctions the applicationof the active methods of biodiversity conservation in forest management, for example: standsselected for the preservation of endangered tree populations or valuable clone archives,
– preparation and implementation of necessary measures in order to preserve the forestbiodiversity,
Field activities:– cultivation of selected stands in order to preserve the endangered tree populations chosen
according to scope of former programme,– establishment of next generations in selected stands for the in situ preservation of endan-
gered tree populations,– establishment and tendering operation in ex situ plots (based on the existing stands se-
lected for the preservation of endangered tree populations),– establishment of progeny plantations based on breeding populations,– establishment and handling of seed plantations for the purpose of breeding and the preser-
vation of endangered tree populations, plantation seed crops and clone archives (ex situconservation of single genotypes),
– obtaining the propagation material from stands selected for the preservation of endangeredtree populations, breeding populations and individual genotypes (seeds, parts of plants,pollens) for the long term storage in the Forest Gene Bank,
– complementary choice, based on systematic genetic-research, of subsequent populationsand genotypes of specific genetic features complementing the forest genetic diversity gath-ered in stands selected for the preservation of endangered tree populations and breedingpopulations.
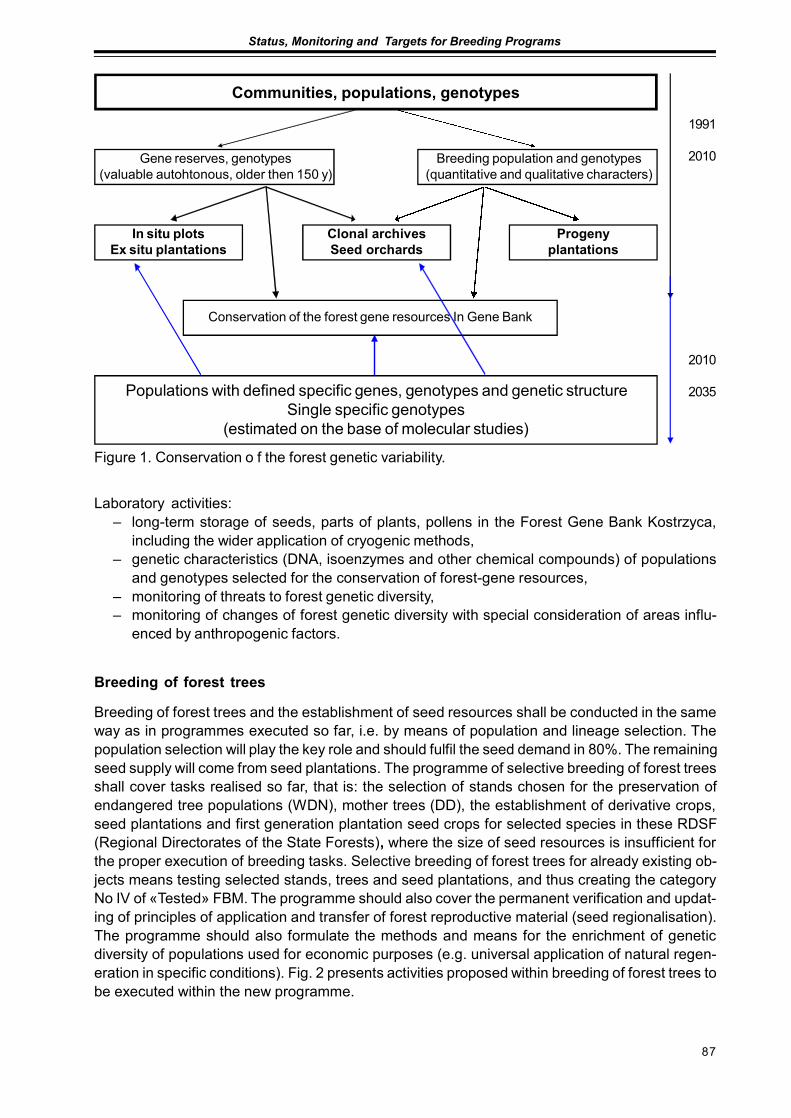
87
Status, Monitoring and Targets for Breeding Programs
Laboratory activities:– long-term storage of seeds, parts of plants, pollens in the Forest Gene Bank Kostrzyca,
including the wider application of cryogenic methods,– genetic characteristics (DNA, isoenzymes and other chemical compounds) of populations
and genotypes selected for the conservation of forest-gene resources,– monitoring of threats to forest genetic diversity,– monitoring of changes of forest genetic diversity with special consideration of areas influ-
enced by anthropogenic factors.
Breeding of forest trees
Breeding of forest trees and the establishment of seed resources shall be conducted in the sameway as in programmes executed so far, i.e. by means of population and lineage selection. Thepopulation selection will play the key role and should fulfil the seed demand in 80%. The remainingseed supply will come from seed plantations. The programme of selective breeding of forest treesshall cover tasks realised so far, that is: the selection of stands chosen for the preservation ofendangered tree populations (WDN), mother trees (DD), the establishment of derivative crops,seed plantations and first generation plantation seed crops for selected species in these RDSF(Regional Directorates of the State Forests), where the size of seed resources is insufficient forthe proper execution of breeding tasks. Selective breeding of forest trees for already existing ob-jects means testing selected stands, trees and seed plantations, and thus creating the categoryNo IV of «Tested» FBM. The programme should also cover the permanent verification and updat-ing of principles of application and transfer of forest reproductive material (seed regionalisation).The programme should also formulate the methods and means for the enrichment of geneticdiversity of populations used for economic purposes (e.g. universal application of natural regen-eration in specific conditions). Fig. 2 presents activities proposed within breeding of forest trees tobe executed within the new programme.
Figure 1. Conservation o f the forest genetic variability.
Communities, populations, genotypes
Populations with defined specific genes, genotypes and genetic structureSingle specific genotypes
(estimated on the base of molecular studies)
Gene reserves, genotypes(valuable autohtonous, older then 150 y)
Breeding population and genotypes(quantitative and qualitative characters)
In situ plotsEx situ plantations
Progenyplantations
Clonal archivesSeed orchards
Conservation of the forest gene resources In Gene Bank
1991
2010
2010
2035
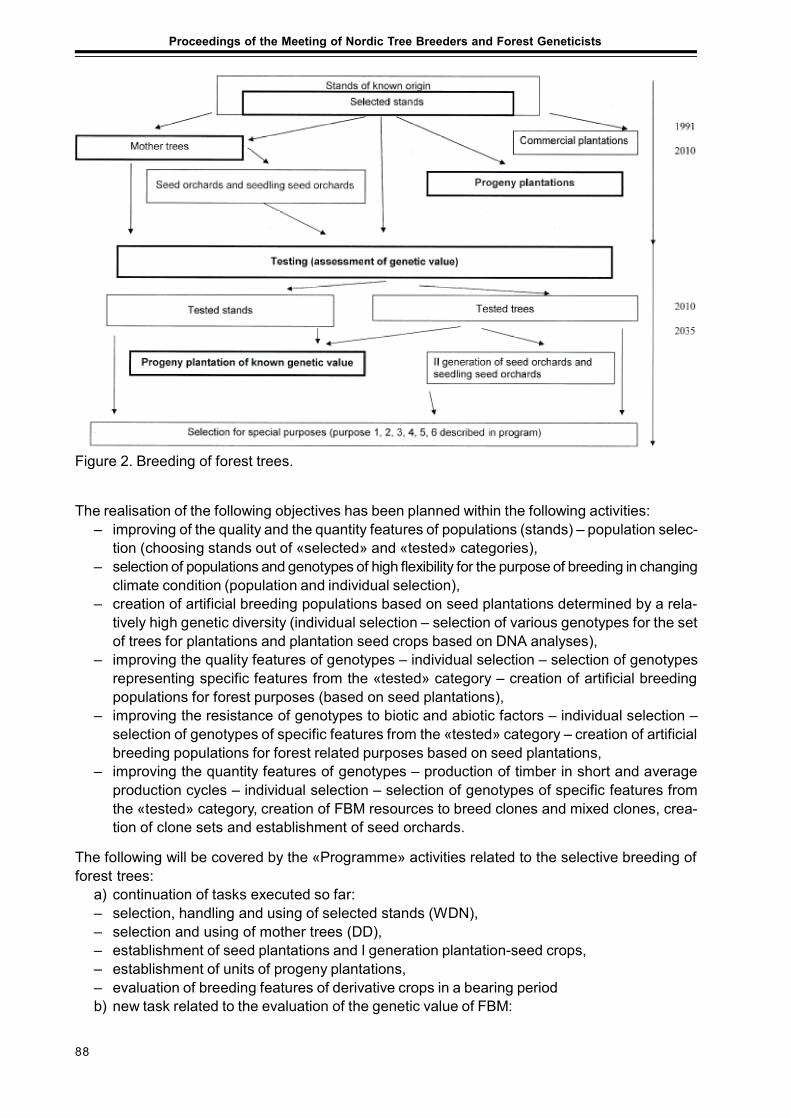
88
Proceedings of the Meeting of Nordic Tree Breeders and Forest Geneticists
The realisation of the following objectives has been planned within the following activities:– improving of the quality and the quantity features of populations (stands) – population selec-
tion (choosing stands out of «selected» and «tested» categories),– selection of populations and genotypes of high flexibility for the purpose of breeding in changing
climate condition (population and individual selection),– creation of artificial breeding populations based on seed plantations determined by a rela-
tively high genetic diversity (individual selection – selection of various genotypes for the setof trees for plantations and plantation seed crops based on DNA analyses),
– improving the quality features of genotypes – individual selection – selection of genotypesrepresenting specific features from the «tested» category – creation of artificial breedingpopulations for forest purposes (based on seed plantations),
– improving the resistance of genotypes to biotic and abiotic factors – individual selection –selection of genotypes of specific features from the «tested» category – creation of artificialbreeding populations for forest related purposes based on seed plantations,
– improving the quantity features of genotypes – production of timber in short and averageproduction cycles – individual selection – selection of genotypes of specific features fromthe «tested» category, creation of FBM resources to breed clones and mixed clones, crea-tion of clone sets and establishment of seed orchards.
The following will be covered by the «Programme» activities related to the selective breeding offorest trees:
a) continuation of tasks executed so far:– selection, handling and using of selected stands (WDN),– selection and using of mother trees (DD),– establishment of seed plantations and I generation plantation-seed crops,– establishment of units of progeny plantations,– evaluation of breeding features of derivative crops in a bearing periodb) new task related to the evaluation of the genetic value of FBM:
Figure 2. Breeding of forest trees.

89
Status, Monitoring and Targets for Breeding Programs
– establishment, handling and evaluation of FBM, used for production of FRM II and III (se-lected stands, mother trees, seed plantations, plantation-seed crops), in progeny tests,
– selection of FBM objects used for the production of “tested” FRM category,– stipulation of principles for handling and usage in forests of FBM registered in the IVth part of
the National Register,– establishment of II generation of seed orchards and seedling seed orchards,– establishment of units of crops with FBM of a known genetic value.
The following should be guaranteed by the execution of the programme:a) within the conservation of genetic diversity:– long term preservation of the existing genetic diversity,– sustainability of ecological processes in forest ecosystems,– durability of existing ecosystems and possibility of their sustainable use,b) within the selective breeding of forest tree species:– establishment of tested seed resources at the level of 10% of the national seed demand
(expected profit from selection concerning growth features will reach 15% at the level ofpopulation, and 25% at the level of lineage in relation to growth features of materials origi-nated from outside of these resources),
– maintenance of selected seed resources at the level of 30% of the national seed demand(the selection profit for growth features is expected to be 10% of population, and 15% at thelevel of lineage)
– maintenance of fixed seed resources originated from the identified source at the level of60% of the national seed demand (the selection profit for growth features is expected toreach the level of 2-5% of population).
Ending
The assumptions of the new «Programme» presented above will be widely discussed in the com-ing years. Practically, only 4 years left for such a discussion gives still enough time to implementamendments to the «Programme» (if necessary) and to make the programme assumptions morefeasible.

90
Proceedings of the Meeting of Nordic Tree Breeders and Forest Geneticists

91
Status, Monitoring and Targets for Breeding Programs
FORESTS AND FORESTRY WITH EMPHASIS TO TREE BREEDINGIN KOMI REPUBLIC
Petr Perchatkin1), Aleksey Fedorkov2) and Andrey Turkin1)
1) Agency of Forestry for Komi Republic, Syktyvkar, Russia2) Institute of Biology, Komi Science Center, Ural Division, Russian Academy of Sciences, Syktyvkar, Russia
Forest resources
Total area of Komi Republic is 41.6 million ha. The state forest fund is 38.9 million ha (includingwetlands, lakes and watercourses, non – regenerated clear felling areas and forest fire areas,roads etc.) or 95% of total territory. Forest fund is primarily owned by Agency of Forestry for KomiRepublic. The forest covered land is 30.6 million ha, so forest land share of total land area is 72%.Total growing stock volume is 2 961 million m3.
Distribution of forest covered land by species: Scots pine – 7.1 million ha, Norway spruce – 16.2,Siberian larch – 0.2, Siberian pine – 0.02, Silver and downy birch – 4.6, European aspen – 0.6 andthe others species (Siberian fir, willow and alder) – 0.1. General age structure of forest coveredland by age groups: young stands – 4.5 million ha, middle – aged – 4.5, pre – mature – 1.4 andmature and over – mature – 18.4.
Removals
The enable annual felling is 25.8 million m3 on a sustained basis. Before 20th century the commer-cial harvesting was very limited (Figure 1). The clear cuttings were introduced in 1930th and
Figure1. History of commercial roundwood removals in territory of Komi Republic.
0
5
10
15
20
25
30
1913
1932
1947
1950
1953
1956
1959
1962
1965
1968
1971
1974
1977
1980
1983
1986
1989
1992
1995
1998
2001
2004
Mill
ion
of c
ubic
met
ers
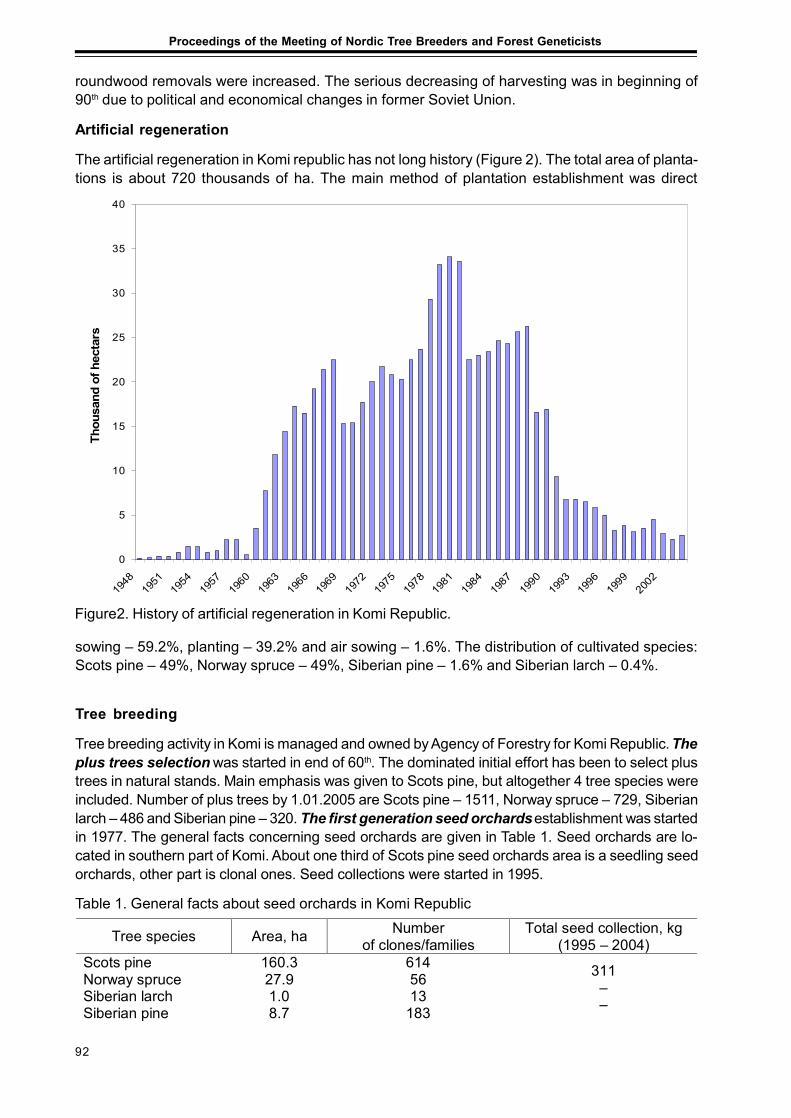
92
Proceedings of the Meeting of Nordic Tree Breeders and Forest Geneticists
Figure2. History of artificial regeneration in Komi Republic.
0
5
10
15
20
25
30
35
40
1948
1951
1954
1957
1960
1963
1966
1969
1972
1975
1978
1981
1984
1987
1990
1993
1996
1999
2002
Thou
sand
of h
ecta
rsroundwood removals were increased. The serious decreasing of harvesting was in beginning of90th due to political and economical changes in former Soviet Union.
Artificial regeneration
The artificial regeneration in Komi republic has not long history (Figure 2). The total area of planta-tions is about 720 thousands of ha. The main method of plantation establishment was direct
Table 1. General facts about seed orchards in Komi Republic
Tree species Area, ha Number of clones/families
Total seed collection, kg (1995 – 2004)
Scots pine Norway spruce Siberian larch Siberian pine
160.3 27.9 1.0 8.7
614 56 13
183
311 – –
sowing – 59.2%, planting – 39.2% and air sowing – 1.6%. The distribution of cultivated species:Scots pine – 49%, Norway spruce – 49%, Siberian pine – 1.6% and Siberian larch – 0.4%.
Tree breeding
Tree breeding activity in Komi is managed and owned by Agency of Forestry for Komi Republic. Theplus trees selection was started in end of 60th. The dominated initial effort has been to select plustrees in natural stands. Main emphasis was given to Scots pine, but altogether 4 tree species wereincluded. Number of plus trees by 1.01.2005 are Scots pine – 1511, Norway spruce – 729, Siberianlarch – 486 and Siberian pine – 320. The first generation seed orchards establishment was startedin 1977. The general facts concerning seed orchards are given in Table 1. Seed orchards are lo-cated in southern part of Komi. About one third of Scots pine seed orchards area is a seedling seedorchards, other part is clonal ones. Seed collections were started in 1995.
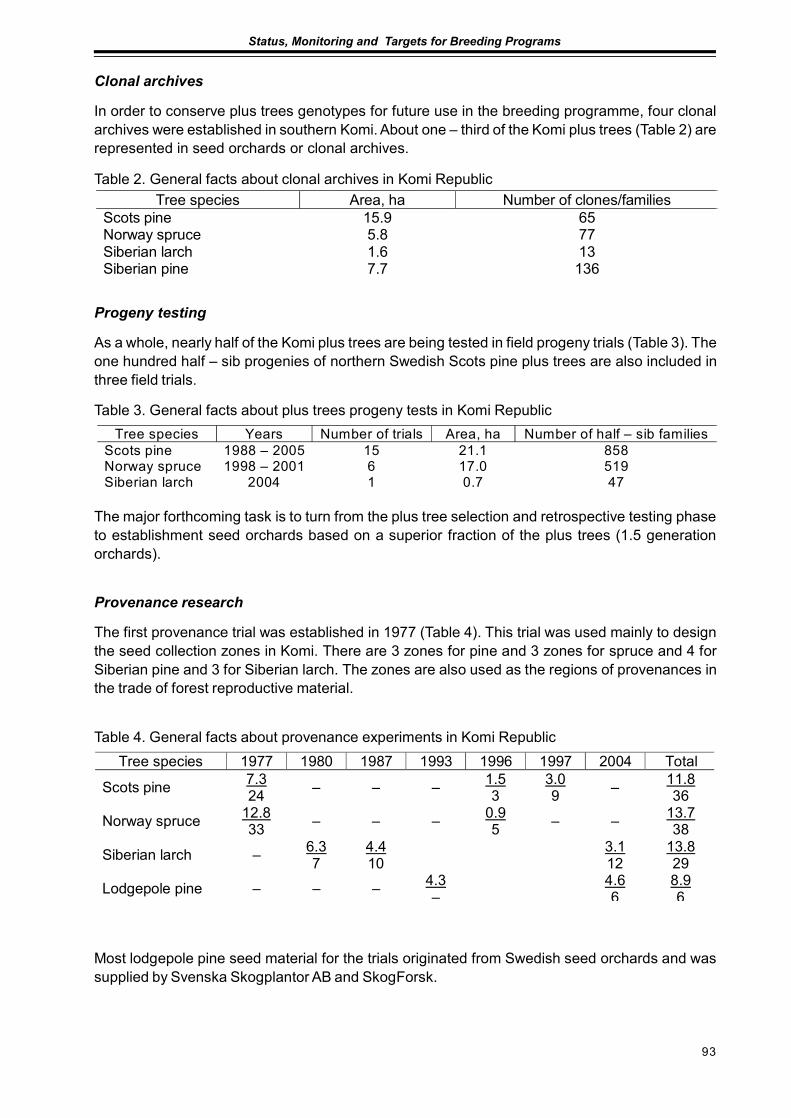
93
Status, Monitoring and Targets for Breeding Programs
Clonal archives
In order to conserve plus trees genotypes for future use in the breeding programme, four clonalarchives were established in southern Komi. About one – third of the Komi plus trees (Table 2) arerepresented in seed orchards or clonal archives.
Progeny testing
As a whole, nearly half of the Komi plus trees are being tested in field progeny trials (Table 3). Theone hundred half – sib progenies of northern Swedish Scots pine plus trees are also included inthree field trials.
The major forthcoming task is to turn from the plus tree selection and retrospective testing phaseto establishment seed orchards based on a superior fraction of the plus trees (1.5 generationorchards).
Provenance research
The first provenance trial was established in 1977 (Table 4). This trial was used mainly to designthe seed collection zones in Komi. There are 3 zones for pine and 3 zones for spruce and 4 forSiberian pine and 3 for Siberian larch. The zones are also used as the regions of provenances inthe trade of forest reproductive material.
Table 3. General facts about plus trees progeny tests in Komi RepublicTree species Years Number of trials Area, ha Number of half – sib families
Scots pine Norway spruce Siberian larch
1988 – 2005 1998 – 2001
2004
15 6 1
21.1 17.0 0.7
858 519 47
Table 2. General facts about clonal archives in Komi RepublicTree species Area, ha Number of clones/families
Scots pine Norway spruce Siberian larch Siberian pine
15.9 5.8 1.6 7.7
65 77 13
136
Table 4. General facts about provenance experiments in Komi RepublicTree species 1977 1980 1987 1993 1996 1997 2004 Total
Scots pine 7.3 24 – – – 1.5
3 3.0 9 – 11.8
36
Norway spruce 12.8 33 – – – 0.9
5 – – 13.7 38
Siberian larch – 6.3 7
4.4 10 3.1
12 13.8 29
Lodgepole pine – – – 4.3 – 4.6
6 8.9 6
Most lodgepole pine seed material for the trials originated from Swedish seed orchards and wassupplied by Svenska Skogplantor AB and SkogForsk.

94
Proceedings of the Meeting of Nordic Tree Breeders and Forest Geneticists
95
Status, Monitoring and Targets for Breeding Programs
ULTRASTRUCTURE, PHOTOSYNTHESIS AND RESPIRATIONOF SCOTS PINE NEEDLE IN PROVENANCE EXPERIMENTS
Svetlana ZagirovaInstitute of Biology, Komi Science Center, Ural Division, Russian Academy of Sciences,
Syktyvkar, Russia
Introduction
The main function of leaf is photosynthesis providing a growth and productivity of plants. Leafquantitative parameters of the same plant species have geographical, ecological, endogenousvariety. For example, Scots pine and Norway spruce in southern and northern parts of natural areadifferent in needle mass, length and anatomical characteristics (Mamaev, 1972). Mesophyll cellsin herb leaves of southern and northern populations have differences in ultustructure parameters(Miroslavov et al, 1999). The aim of this study was to determine ultrastructure parameters ofmesophyll cell, photosynthesis and dark respiration activity of Scots pine needle in province ex-periments.
Materials and methods
Table 1. General facts about Scots pine provenances used in studyVariant / year of planting Region (republic), forest farm Latitude Subzone
1-77 Murmansk, Monchegorsk 67°51` N. extreme-northern taiga 2-77 Komi, Syktyvkar 61°40` N middle taiga 3-77 Udmurtia, Votkinsk 57°03` N southern taiga 1-97 Komi, Usinsk 65°36` N extreme-northern taiga 2-97 Komi, Syktyvkar 61°40` N middle taiga 3-97 Kirov, Vjatskie poljany 56°17` N southern taiga
This study was carried out in Kortkeros and Syktyvkar provenance experiments, established in1977 and 1997. Provenances used in experiments ate shown in Table 1. For ultrastructure studytransver segments of 2d year needle were fixed in a solution of 2.5 % glutaraldehyde for 8h at cooltemperature. Speciments were postfixed in 1 % osmium tetroxide. Tissue was aspirated severaltimes during ethanol and acetate dehydration and embedded in Epon. Ultrathin sections wereexamined with electron microscope Tesla 500. Needle photosynthesis and dark respiration weremeasured by gas analysis system LiCor 6400 in field conditions.
Results and discussion
According to this study there are differences in needle sizes and needle mass among Scots pineprovenances (Table 2). Northern provenance pine trees have smaller shoots and less number ofneedles. The volume of mesophyll tissue in needle is about 50 % (Figure). Mesophyll cells ofsouthern, local and northern ecotypes have the same sizes, but some distinguishes are observed.

96
Proceedings of the Meeting of Nordic Tree Breeders and Forest Geneticists
Experimental variants differ in parcel volume of intercellular space, thylakoid number in chloroplastsand lipid droplet number per cells section (Table 3). At the same time local pine has maximumphotosynthesis. The transfer of provenance from north to south did not result in increasing ofphotosynthesis. Southern provenance has lower photosynthesis and higher ratio of respiration tophotosynthesis.
According to climatic theory of organic substance synthesis the differences in oil, protein andcarbohydrates contents in plants of different geographical origins is a result of climate effect (Ivanov,1961).
Cultivating of the plants in the same conditions have leaded to disappear of the distinctions. As forScots pine in our provenance experiments, differences of needle some physiological, morphologi-cal and anatomical parameters remained. The results agree with investigations carried out in
Table 2. Morphological parameters of experimental pine needle
Variant Length
of 2d year shoots, mm
Total number of needle
per one shoot
Length of needle, mm
Cross sectional surface of needle,
mm2
1-77 94±15 128±33 41±8 0.39±0.03 2-77 109±28 153±46 51±4 0.64±0.24 3-77 128±23 185±32 52±2 0.57±0.23
Table 3. Parameters of chloroplasts and mitochondria in mesophyll cells of pine needleVariant Parameters 1-77 2-77 3-77
Chloroplast number per cell section 20±5 20±5 24±6 Chloroplast section area, µ2 6.0±1.1 7.7±1.5 6.9±1.7 Long axis of chloroplast, µ (а) 5.4±0.7 5.7±1.0 6.7±0.6 Short axis of chloroplasts, µ (в) 1.7±0.4 1.5±0.4 1.7±0.5 а/в ratio 3.2 4.2 4.3 Number of granum per chloroplast section 28±10 20±6 37±10 Thylakoid number per granum 4±1 6±2 6±2 Total thylakoid number per chloroplast section area 112 120 222 Plastoglobul number per chloroplast section area 21±10 19±4 19±2 Mitochondria number per cell section 35±14 30±7 32±9 Diameter of mitochondria section, µ 0.7±0.1 0.7±0.2 0.8±0.1 Number of lipid droplets per cell section 70±20 62±26 49±17
Figure. Photosynthesis (а) and dark respiration (б) of pine needle in provenance experiments.Origins: 1 – Usinsk, 2 – Syktyvkar, 3 – Vjatskie poljany.
1 2 3
R/P, %: 53 53 60 -30
-20
-10
0
10
20
30
40
1 2 3
µm
ol C
O 2 m
-2 s
-1
ба

97
Status, Monitoring and Targets for Breeding Programs
other regions of Russia (Rjazantseva, Shutjaeva, 1977). Long-term investigations in the middletaiga resulted in assumption about more activity growth of local origin trees (Nakvasina et al, 1990;Tarkchanov, 1998). According to these investigations high life state of northern ecotypes con-nected with their steady to damage by frosts, diseases and insects.
Good survival of northern provenances seems to be correlated with synthesis in their needle highlevel of reserve metabolites protecting cells from low temperature damage. According to Savva etal, 2002 Scots pine provenances had differences in growth of ring width of trunks. The fact provesheritage of growth reaction of ecotypes to environmental change effects. We can suppose thatphotosynthesis and growth connection in sink-sours system of plants is a reason of lower photo-synthesis in the northern ecotype in provenance experiment planting in middle subzone of taiga. Atthe same time adaptation of plants results in increasing of respiration and photosynthesis ratio(Semichatova, 2002). High conservative of physiological processes of the northern pine prov-enances demonstrates their stress tolerance by moving from north to south. At the same timehigh ratio of respiration and photosynthesis of the southern provenance seems to be a result of itshigher sensibility to environment change.
ReferencesИванов С.Л.Климатическая теория образования органических веществ. М: Изд. АН СССР , 1961. 87 с.
(Ivanov S.L. Climatic theory of organic substance production. M., 1961. 87 p.).Мамаев С.А. Формы внутривидовой изменчивости древесных растений. М.: Наука, 1972. 282 c. (Mamaev
S.A. Variation among populations of wood plants. M., 1972. 282 p.).Мирославов Е.А., Вознесенская Е.В., Бубло Л.С. Ультраструктурные основы адаптации растений к
условиям Крайнего Севера // Проблемы фундаментальной экологии Т.1. Экология в России нарубеже XXI века (надземные экосистемы). М.: Научный мир, 1999. С. 236-251. (Miroslavov E.A.,Voznesenskaja E.V., Bublo L.S. Ultrustructural essences of plant adaptation in extreme North condi-tions // Problems of fundamental ecology. V.1. Ecology in boundary of XXI century. 1999. P. 236-251)
Наквасина Е.Н., Тарханов С.Н. Улиссова Н.В., Сизов И.И., Бедрицкая Т.В. Географические культурысосны и ели на европейском Севере // Матер. межд. симпоз. «Северные леса: состояние,динамика, антропогенное воздействие». Ч. 2. Архангельск, 1990. С. 131-138. (Nakvasina E.N.,Tarchanov S.N., Ulissova N.V., Sizov I.I. Bedritskaja T.V. Scots pine and Norway spruce provenancesin the European North // Abstr. Intern. Sympos. «Northern forests: state, dynamic, anthropogenicimpact» V.2. Archangelsk. 1990. P. 131-138).
Рязанцева Л.А., Шутяева А.М. Физиолого-биохимические особенности экотипов сосны обыкновенной вгеографических культурах Воронежской области // Генетика, селекция, семеноводство иинтродукция лесных пород / Под ред. К.К.Калуцкого и др. Воронеж, 1977.С. 91-95. (RjazantsevaL.A., Shutjaeva A.M. Physiological and biochemical features of Scots pine and Norway spruce prov-enances in Voroneg // Genetic, breading and introduction of forest species.
Семихатова О.А. О таксономических величинах интенсивности темнового дыхания листьев растений //Бот. журн. 2002. Т. 87. С.29-34. (Semichatova О.А. About taxonomic values of dark respiration of plantleaves // Bot.journ. 2002. V. 87. P. 29-34).
Савва Ю.В., Ваганов Е.А. Особенности реакции различных климатипов Pinus sylvestris L. на изменениеклиматических факторов // Бот. журн. 2003. С. 68-82. (Savva J.V., Vaganov Е.А., Miljutin L.I. Reac-tions of different Scots pine ecoclines on climatic factors changes // Bot. journ. 2003. P. 68-82)
Тарханов С.Н. Изменчивость ели в географических культурах Республики Коми. Екатеринбург, 1998.195 с. (Tarchanov S.N. Variation of Norway spruce in geographic provenances of Komi Republic. 1998.195 p.).

98
Proceedings of the Meeting of Nordic Tree Breeders and Forest Geneticists

99
Status, Monitoring and Targets for Breeding Programs
CHARACTERISTICS AND SUSTAINABILITYOF GENETICALLY IMPROVED NORTHERN SCOTS PINE
Bengt AnderssonSkogforsk, Sweden
Genetic differences between improved and unimproved Scots pine (Pinus sylvestris L.) in 36north Swedish field tests, covering wide geographical and climatic gradients (latitude 62.3-67.8°N;temperature sum 496–1056 day-degrees), are presented. Improved trees were represented byprogenies (controlled crosses) from first generation phenotypically selected plus trees (selectedmainly for superior height growth), while unimproved trees originated from unselected naturalstands. Improved trees were superior in height, stem diameter, and stem volume at the age of19-33 years. Height growth of improved trees demonstrated sustainable development and was inaccordance with height growth at different site indices. Furthermore, improved trees were moreslender (height/diameter) than unimproved, while differences in survival and frequency of ramicornsand stem breaks were only minor. Lack of interaction between tree categories and site conditionsfor growth characters imply that the results are generally applicable. No difference in response tocompetition was detected. However, improved trees showed a deviating reaction to southwardtransfer, where survival increased more and height growth decreased less compared to unim-proved trees. The results support specific growth and production functions for improved trees.The use of competition and height indices based on neighbouring trees to adjust for bias and sitevariability in single tree plots significantly improved the estimates.
100
Proceedings of the Meeting of Nordic Tree Breeders and Forest Geneticists
GENETIC PARAMETERS IN APPLIED TREE BREEDING
Tore EricssonSkogforsk, Sweden
We intend to describe Swedish forest trees in terms of genetic variation, heritability, and genotypeby environment interaction for growth and adaptive traits. Knowledge about genetic structure isneeded to predict the effect on populations due to changes in environments as well as to optimisebreeding programmes. Additive genetic variation is a prerequisite for response to selection. Withaccess to numerous populations, which grow in trials all over the country, investigation of generalgenetic structure and environmental response is possible, contrasting to more fragmented earlierstudies. We expect to reveal general relationships as well as spatial and environmental trends inthe expression of genetic characters.
The objective of the ongoing study is to determine the genetic structure of Scots pine and Norwayspruce in Swedish environments. It will be studied through genetic parameters such as additivecoefficient of variation, heritability and genetic correlations for growth traits and adaptive traits. Theaim is to answer questions such as:
– Are there basic differences between Norway spruce and Scots pine?– Do genetic parameters change over different environmental conditions?– How does assessment age affect genetic parameters?– How is the pattern of genotype by environment interaction?– How may populations be characterised due to potential for evolvability?– How will the result affect future breeding and conservation strategy for the two species?
So far, about two thirds of available estimates regarding growth and adaptation are assembled ina database. Some basic scatter graphs were presented with heritability and CVA values plottedover, for example, site characteristics (latitude, altitude, temperature sum) and tree developmentstage (tree age, mean height). The presentation is very preliminary and there has been very littledata quality control.
Acknowledgements: The project «Genetic structure in Norway spruce and Scots pine populations»is funded by FORMAS (The Swedish Council for Environment, Agricultural Sciences and SpatialPlanning). The funding was applied for by Gunnar Jansson (Skogforsk, Uppsala) in cooperationwith Bengt Andersson (Skogforsk, Sдvar), Bo Karlsson (Skogforsk, Ekebo) & Tore Ericsson.
101
Status, Monitoring and Targets for Breeding Programs
GENETIC PARAMETERS FOR WOOD DENSITY IN SCOTS PINE
Anders Fries1) and Tore Ericsson2)
1) Department of forest genetics and plant physiology, Swedish University of Agricultural Science2) Skogforsk, Sweden
Scots pine (Pinus sylvestris L.) breeding is mainly focused on volume growth. The genetic corre-lations between wood density and growth traits have, however, in many studies been negative. Abreeding gain in volume thus implies less gain in terms of wood biomass. The wood has further-more a considerable heterogeneity where the different types of wood have different wood and fibreproperties. As trees grow older, there is a change from juvenile wood to mature wood with theircertain properties, and within an annual ring, the density of earlywood is 30-40% of the the densityof latewood. This heterogeneity and the indications on negative correlations with growth traitsmake it even more important to include wood density in genetic analyses. Our study aims toelucidate the phenotypic and genetic relationships between wood density and growth traits forScots pine and their changes by age. The trees studied were around 30 years old and we make anattempt to estimate correlations of wood density between juvenile and mature wood. So far weconcentrate on whole ring wood density without making separate estimates for earlywood andlatewood. Those wood types will be in focus in coming studies.
Wood density and annual ring width were measured on increment cores from 1400 trees in a 30-year-old full-sib progeny test of Scots pine in north Sweden. Genetic parameters for wood densitywere analysed separately for ten outer annual rings, and average wood densities were similarlycalculated for the five most recent years. The evaluation included genetic correlations with heightand stem diameter at breast height. Heritabilities of density, estimated separately for each annualring, varied between 0.14 and 0.26 without any age trend, and was jointly for the ten or five latestaround 0.3; for height growth it was 0.3-0.4 and for stem diameter slightly above 0.1. Additivegenetic correlations with height and stem diameter were -0.4 and -0.5, respectively, in a straight-forward analysis but vanished or at least diminished when ring width was used as a covariate.Yearly density breeding values, which were calculated for the parent trees for each of ten ringsseparately, varied considerably between parent trees and years. The tendency was increasingbreeding values by increasing age, with a substantial increase between ages around 14 to 16years from the pith. This age fits reasonably well to literature data on the change from juvenilewood to mature wood. The high genetic correlations for wood density between years, above 0.8 inall comparisons up to ten years apart, may indicate high covariation between juvenile and maturewood.
Acknowledgements: The project received important economic support by FцreningenSkogstrдdsfцrдdling, Uppsala, Sweden. Kempestiftelserna, Цrnskцldsvik, Sweden provided eco-nomic resources for the laboratory equipment and instruments used for sample preparation andwood density analyses. Johan Lindeberg, Department of Silviculture, SLU, Umeе, Sweden, gavevaluable advice during the wood analyses.
102
Proceedings of the Meeting of Nordic Tree Breeders and Forest Geneticists
FOREST TREE BREEDING 2050 – FINLAND’S NEW TREE BREEDING PLAN
Matti HaapanenFinnish Forest Research Institute, Vantaa Research Centre, Finland
Finland’s recently developed tree breeding plan, Forest Tree Breeding 2050, replaces the formerlong-term plan which was taken into action in 1989. The plan aims at improving the cost-efficiency oftree breeding while maintaining a broad base of genetic variation from which sustainable geneticgain may be derived. Moreover, it attempts to guarantee long-term response from breeding in chang-ing circumstances (market demand, climate). To fullfill these objectives, various aspects of breed-ing, e.g., breeding goals, metapopulation sizes (a reduction from several thousands of trees to lessthan a thousand), population structure and selection and testing designs, have been revised.
Following the principles of the Multiple Population Breeding System, the breeding material will bedistributed to multiple independent populations with different climatic and product goals. Climaticdifferences are accounted for by dividing Finland into six climatically uniform (mainly with respect totemperature sum) target areas which, to alleviate the transition process, roughly correspond withthe former Norway spruce breeding zones. The new target areas are common to all the species.
A breeding population comprises 160 superior general performers selected for a «mainstreamindex» of growth, quality and vitality, with trait-weightings set appropriately with respect to thetarget area and the species. Apart from this basic setting, the plan reserves an option to breed formore diverse product goals within each climatic target area by means of Specific GoalSubpopulations. These comprise a small group of trees (recommendation is 20) which excel inspecific characteristics but may not necessarily rank high on the standard selection criteria. Suchspecific traits can include resistance to pests and diseases, crop traits (narrow-crowned trees),and certain wood quality traits (e.g., heartwood content). Specific Goal Subpopulations may alsobe formed applying a selection index with economic weights that are modestly different from thoseof the mainstream index.
Controlled matings are used to create the recruitment population from which advanced generationselections (within families) will be made. The parents for single-pair matings are selected in theorder of breeding value (positive assortative mating). Additional matings (2-3) are performed withthe 1/4 of the highest-ranked trees, which allows some additional genetic gain to be made frombetween-family selection. Here as in several other steps of breeding, the allocation of efforts willbe positively dependent on the genetic value of the material, i.e., the highest-ranking parents willhave a larger representation of their offspring in the recruitment and candidate populations thanthe rest of the tested parents. In subsequent generations, the breeding population will be subdi-vided into small sublines stratified by breeding value, that are very effective in supplying futureseed orchards with unrelated highly-bred trees.
The genetic evaluation of the breeding material is primarily based on clone testing (whenever possi-ble) or the combination of phenotypic preselection and progeny testing. The genetic field trials will bereplicated in 5–6 locations which sample a wide continuum of climatic conditions, extending to adja-cent target areas and even neighbouring countries. Simple recurrent phenotypic selection is anoption that can be used in connection with minor tree species with little commercial interest.

103
Status, Monitoring and Targets for Breeding Programs
LOW COST IMPROVEMENT OF COASTAL DOUGLAS-FIR(PSEUDOTSUGA MENZIESII VAR. MENZIESII (MIRB.) FRANCO) BY APPLICATION
OF THE BREEDING SEED ORCHARD APPROACH IN DENMARK
Jon K. Hansen, Hubert Wellendorf and Erik D. KjærThe Royal Veterinary and Agricultural University, Denmark
An evaluation of a seedling seed orchard in Denmark of Coastal Douglas-fir showed variationbetween open pollinated families in their susceptibility to windthrow, height and diameter growth,stem straightness, number of forks at age 10 and bud burst at age 9. Individual narrow-senseheritability was 0.63 for bud burst, 0.40 for height and diameter, respectively, 0.48 for stem straight-ness, 0.20 for number of forks and 0.17 for windthrow susceptibility. Fast growing families werecharacterised by late bud burst and poorer stem straightness. Predicted gains concerning a re-duction of windthrow susceptibility were poor due to low genetic variability. In multi-trait selectionscenarios aiming to improve growth, stem straightness and reducing windthrow susceptibility, theapproach of using seedling seed orchards demonstrated that it might be possible to obtain gainsin height above 5% combined with significant improvements of stem straightness while retainingan effective population size above 50.

104
Proceedings of the Meeting of Nordic Tree Breeders and Forest Geneticists
SCOTS PINE BREEDING STRATEGY IN LATVIA
Âris JansonsLatvian Forest Research Institute «Silava», Salaspils, Latvia
Ongoing research in Scots pine breeding in Latvia has two aims – select best trees for 1.5 genera-tion seed orchards and develop long term breeding strategy. Both of them are based on evaluationof plus-tree open pollinated progeny trials that have reached age 25-35 years.
Breeding strategy should be ready for implementation after 3 years, when all data from previoustrials will be collected and analyzed – in order to avoid time-gap in continuous breeding processand inefficient efforts.
Strategy should ensure continuous development, so all three sustainability cornerstones will beincluded.
Economical effect of breeding is proven in experiment, where growth and quality of progeniesfrom average seed sample from 24 first generation seed orchards and 8 stands were compared.Experiment was placed in 3 distant places in Latvia and measures made at the age of 21 year.Seed orchard progenies were superior both in yield, m3/ha (19%) and quality (stem straightness6%, branchiness 1%). Since average pine stand yield in cutting age (?101 year) is 290 m3/ha, andareas suitable for pine growth are 60% from total forest area, gain by using selected seed sourceis proven to be significant.
Single pair positive assortative mating as cheapest alternative is suggested for future develop-ment of breeding population. It could be done for 2 sets of 20-30 best clones. For the rest of clonesphenotypic forward selection within open-pollinated families could be an alternative.
Ecological aspect is safeguarded with large initial material – roughly 900 phenotypically selectedplus trees. From these material open-pollinated progeny tests as well as 697 ha first generationseed orchards have been established. Based on test results since 1983 in total 135 ha 1.5-gen-eration seed orchards from 2 sets with 64 clones each have been established.
For both – experimental and gene pool preservation reasons – 3 population seed orchards con-taining 140-220 clones each have been established in superior pine stands. Genetic diversity ispreserved also in natural regeneration that occupies ? 10% from total area regenerated by pineand in gene reserves.
Renovation of old clone archives as well as establishment of new ones is started with general ideato preserve at least half of initially selected plus trees. Besides, special archives are made and willbe maintained for trees selected as average in growth, but superior in resin production.
Social aspect is also included with main idea to be in dialogue with society. It is important sincehalf of forests in Latvia are state owned and most of breeding efforts are allocated to them. Ques-tionnaire about recreational value has been chosen as first step, since with breeding general viewof trees is (and will be) changed. Recreation is growing part of forestry-use and changes in visualview of forest influence everyone in country. Results of questionnaire could give useful informationof what society wants and how to regard it in allocation of target areas for growth of forest fromimproved seed source.
Another important aspect to take into consideration – use of improved seed sources in forest regen-eration leads to increasing yield (m3/ha) that creates possibility maintain total wood production in thesame level despite of increasing share of forest areas for nature protection and recreation.
105
Status, Monitoring and Targets for Breeding Programs
WOOD DENSITY, ANNUAL RING WIDTH AND LATEWOOD CONTENTIN LARCH AND SCOTS PINE
Lars Karlman, Tommy Mцrling and Owe MartinssonSwedish University of Agricultural Sciences, Umeе, Sweden
The wood density and late wood content in five different species of larch (Larix Mill.) and in Scotspine (Pinus sylvestris L.) were investigated using direct scanning X-ray densitometry. In total 106trees were investigated. Old, 120-150 year, Siberian larch (Larix sibirica Ledeb. and Larixsukaczewii Dyl.) grown in Krasnoyarsk and Archangelsk and 105 year-old European larch (Larixdecidua Mill.) grown in Sweden had on an average 20-25 % higher wood density than SwedishScots pine. The variation in density between different trees of the same species was big. Averagedry wood density of larch trees was 618 (535-670) kg m-3 in old Siberian larch, 621 (550-665) kgm-3 in mature European larch timber grown in Sweden. Average wood density for the young, 30-35years-old, larch trees was 536 (515-560) for European larch (L. decidua Mill.), 451(410-490) forhybrid larch (L. x eurolepis Henry) and 452 (420-490) for Japanese larch (L. kaempferi Lamb.).Corresponding figures for mature Scots pine was 504 (510-590) kg m-3. The density within themature zone of the heartwood was 20-40 % higher than in the juvenile wood zone. The density inmature European and Siberian larch heartwood, usually reached 650 kg m-3 after 25-30 annualrings from the pith.
The density of larch heartwood increased with annual ring width up to 2.5 mm and decreased withannual ring with wider than 3 mm. On an average the latewood content was 40-50 % in old Euro-pean larch, around 40 % in mature Siberian larch and 20-40 % in young hybrid larch (L. × eurole-pis Henry.). The late wood content of mature Scots pine was approximately the same as in matureEuropean larch.
The density of 35 year old European larch with narrower ring widths up to 4 mm had a higher wooddensity than old slow growing Scots pine.
106
Proceedings of the Meeting of Nordic Tree Breeders and Forest Geneticists
GENETIC DIFFERENCES IN SCOTS PINE HEIGHT-DIAMETER RELATIONSHIP
Johan Kroon and Bengt AnderssonSkogforsk (Swedish Forest Research Institute), Sweden
The aim of tree breeding is to genetically improve economically important traits as efficient aspossible. Usually volume production is one such important target trait. Still, tree height is oftenused as the selection trait. It is usually easier to measure, has high heritability, and besides, thereis also a positive correlation to stem quality. Selection for height alone could, however, cause us toselect more slender (height/diameter) stems than average, which per see might be positive ornegative, but also affect volume production through correlated response. The height-diameterrelationship is therefore an important variable to study, and few studies are conducted in this area.
The environmental impact on diameter is high and the heritability is often lower than for height.Competition effects from neighboring trees therefore need to be controlled. Further, modeling anallometric relationship like the ratio between variables, may suffer from difficulties with size de-pendency and the slenderness ratio (height/diameter) is not constant over size. As a logic andsimple measure of the slenderness of the stem we have instead tried to model the diameteramong families when adjusting for height. This was done in a material of 10 progeny trials of Scotspine (Pinus sylvestris L.) in the Swedish tree breeding program. The progenies originated fromcontrolled pollination in a partial diallell mating design with parents from three seed orchards innorthern Sweden. A linear mixed model with covariates was fit to the data. Competition and micro-heterogeneity was also adjusted for in order to diminish the differences from those effects. Toevaluate the impact on gain in volume production the families were ranked and selected withdifferent selection intensities.
The main results showed that there was a considerable genetic variation in slenderness amongthe parents in the study. However, selection based on height alone only had minor influence on thevolume gain.

107
Status, Monitoring and Targets for Breeding Programs
NEW SEED ORCHARD PROGRAMME IN FINLAND
Teijo Nikkanen1), Mikko Peltonen2) and Jukka Antola1)
1) Finnish Forest Research Institute, Punkaharju Research Station, Finland2) Ministry of Agriculture and Forestry
The first seed orchards were established in Finland in the early 1950’s. However, the major activi-ties in this field did not start until more than a decade later. In 1963 an official report was issuedabout the total area of seed orchards required for the production of genetically improved reforesta-tion seed in Finland. The large-scale realization of seed orchards started some years later, andwas completed by the mid 1970’s. The target of the first seed orchard programme was to produceall the seed needed in forest cultivation, also in direct seeding, in seed orchards. In all more than3000 ha of orchards were established. At the moment there are 141 (2202 ha) Scots pine and 25(282 ha) Norway spruce registered first generation seed orchards in Finland.
In later seed orchard programmes the target to produce all the seed needed in the whole countryhas been revised, especially concerning seed production for the northernmost part of the countryand for direct seeding. The main target of the new generation seed orchards is to produce geneti-cally as good quality seed as possible. A new master plan for forest tree seed production, made in2003-2004 by a working group appointed by the Ministry of Agriculture and Forestry, was based onearlier programmes carried out in 1989 and 1997.
The task of the new, broad-based working group was to evaluate the need for forest tree seed in2005-2030, and based on this evaluation to revise the existing seed orchard programme. Need forforest tree seed was thoroughly evaluated using the current area of annual cuttings, objectives ofregional forestry plans, and the national forest inventory data. In addition, the visions of forestryprofessionals about trends in forest regeneration were taken into account. Annual need for Norwayspruce seed orchard seed for nursery use was 1827 kg, and that for Scots pine 542 kg, but inaddition, 3416 kg of Scots pine seed orchard seed was needed for direct seeding. The total seedorchard area needed for Norway spruce was 290 ha from which still 190 ha has to be established,and the total area for Scots pine was 610 ha from which 270 ha has to be established. There isalso need for Silver birch seed in Finland, annually 39 kg for nursery use and 99 kg for directseeding. All the birch seed is produced in green house seed orchards.
Because of the high establishment costs and long waiting time for the first crops, seed productionin seed orchard is not a tempting business investment. That is why the working group recom-mended that the state should subsidy by 85 % the costs caused by establishment of seed or-chards (excluding land costs) and tending of young orchards. Also decentralized seed productionstrategy, i.e. several independent seed producers, was recommended.

108
Proceedings of the Meeting of Nordic Tree Breeders and Forest Geneticists
SIMILARITY BETWEEN AUTUMN FROST HARDINESSAND FIELD PERFORMANCE IN NORTHERN PINUS SYLVESTRIS
Torgny Persson and Bengt AnderssonSkogforsk (The Forestry Research Institute of Sweden), Sweden
During the 1980’s and 1990”s six Scots pine (Pinus sylvestris L.) seed orchards were estab-lished, which were intended to produce material for reforestation in harsh regions of northernSweden, and may supply around 50 percent of the productive forestland in these regions. Theclonal selections in the orchards were mainly based on the results of juvenile freezing tests inclimate chambers. It is clearly important, therefore, to establish how the initial freezing-test basedscreening of the orchard clones will influence the performance of new forests originating fromthese seed orchards.
The data analysed in the study were the results of artificial freezing tests of the autumn frosthardiness of 1-year-old seedlings and field measurements of 9- to 13-year-old saplings represent-ing (in both cases) the progenies of first-generation Scots pine plus-trees. The field traits analyzedwere survival, tree height, spike knot frequency, branch diameter, branch angle, stem straight-ness, and resistance to the pathogens Phacidium infestans, Gremmeniella abietina, Melampsorapinitorqua and Lophodermella sulcigena. The genetic material was clustered in four independenttest groups, each of which comprised a separate set of half-sib families replicated in one freezingtest and five field trials. The total number of half-sib families included in each test group rangedfrom 303 to 360. The material was grown from open-pollinated seed collected from the plus-treesin the forest stands. Stand locations of the plus-tree mothers and positions of the field trials rangedfrom approximately 61° to 68° N in Sweden.
There was considerable variation in both sign and significance among estimated additive geneticcorrelations between frost hardiness and the tested field characters. After sub-grouping based onthe harshness of the field sites, positive and fairly high correlations were observed between frosthardiness and field survival from the trials located in the harshest environments. In the milderenvironments, no clear association was found, probably because genes associated with hardi-ness traits were expressed at low levels. In addition, estimated correlations between frost hardi-ness and tree height were negative in 9 out of 10 cases for trials located in relatively mild environ-ments, and non-significant for trials in the harshest environments. Thus, the expression patternsof genes associated with tree height may differ between sites, depending on the harshness of theenvironment. The genetic correlation between frost hardiness and quality characters/pathogenresistance were in most cases non-significant and no clear trends were detected.
In conclusion, selection based on juvenile freezing test results should improve field survival, re-duce height growth and have minor effects on quality and pathogen resistance.
109
Status, Monitoring and Targets for Breeding Programs
MITOCHONDRIAL DNA VARIATIONAND POSTGLACIAL COLONIZATION ROUTES OF SCOTS PINE
Tanja Pyhäjärvi and Outi SavolainenDepartment of Biology, University of Oulu, Finland
Knowledge about the history of Scots pine is important in understanding its genetics and espe-cially mechanisms of adaptation during the colonization. The exact routes of colonization andorigins of different Scots pine populations are not known. Different composition of mitochondrialhaplotypes in different populations can reflect the colonization history the species. In this study weused two mitochondrial regions with polymorphic structural rearrangements to get more resolu-tion on post glacial history of the Scots pine. 26 European Scots pine populations and 29 singletrees (total 546) were sampled, covering a large part of its present day distribution. Mitotyping wasconducted by PCR and PCR-RFLP. There was a strong geographical differentiation in mitochon-drial haplotypes. GST among all the sampled populations was 0.727, which is much higher thanprevious estimates of FST from nuclear data. The most striking result was that the previouslyundetected mitotype c was present in Central Europe, Scandinavia and Eastern Europe. Severalpopulations in the Iberian Peninsula have a private haplotype b, which is in accordance with thepreviously postulated hypothesis that there have been isolated populations in the Iberian Penin-sula, and that they have not contributed to the colonization of rest of Europe. The origin of theTurkish population is also different to the European populations, since it has a private haplotype d,which is not present anywhere else in Europe. The results of this study support the view thatduring the last glacial maximum there have been populations of cold tolerant tree species such asP. sylvestris, outside the Mediterranean peninsulas and these populations have a large contribu-tion to the present day populations of the species.

110
Proceedings of the Meeting of Nordic Tree Breeders and Forest Geneticists
UTILIZATION OF SCOTS PINE SEED ORCHARD SEED IN DIRECT SEEDING
Seppo RuotsalainenFinnish Forest Research Institute, Punkaharju Research Station, Finland
Background
Direct sowing of Scots pine is an important forest regeneration method in Finland. Annually some30 000 ha of forest is regenerated by sowing. This comprises more than half of Scots pine cultiva-tion and about 1/4 of all artificial regeneration.
Direct sowing is mechanised to a high degree. In 2003 sowing by machine in connection to soilscarification was done on 59 % of all sowing area. The easiness in mechanisation and lowercosts compared to planting have helped to maintain the amount of direct sowing at a rather con-stant level, although planting of Scots pine has decreased drastically during the last two decades.
Sowing consumes rather great amounts of seed. In 2003 about 9500 kg seed (mainly Scots pine)was used for direct sowing, when at the same time the nurseries used 1740 kg seed (all species).About 1/3 of the Scots pine seed used in direct sowing is produced in seed orchards. There hasbeen discussion whether this proportion should be increased. In order to find out the usability ofseed orchard seed in direct sowing a research project was initiated at Finnish Forest ResearchInstitute in 2002.
Study methods
The study was accomplished by establishing field experiments where seed lots from several seedorchards were compared to stand seed lots in three years at four localities in southern and centralFinland (in the first year only at two localities). There were two types of seed orchards included inthe material: seed orchards with southern and northern origin, but all the tested seed lots had their0defined utilization areas in southern or central Finland.
Sowing was done on mineral soil on shallow holes made by a special tool. 16 seeds were sown oneach sowing spot and covered by a thin layer of mineral soil. The experimental design wasrandomised blocks with one sowing spot of each entry in each of the 30 blocks.
The plant establishment was monitored 3 to 5 times during the first growing season and later thenumber of the plants was counted and their condition evaluated at the end of growing season. Alsothe height of the tallest plant in each sowing spot was measured at the end of the growing season.
Observations from the experiments
The better the germination of the seed lot was in laboratory, the better was also the plant establish-ment result in the field (r = 0.855**). Plant establishment was 5 %-units higher with seed orchardseed than with stand seed, but the plant yield per equal weight unit of seeds was 15 % lower withseed orchard seed because of its greater weight. Plants from seed orchard seed were 15 % tallerthan plants from stand seed. The height difference decreased with age in relative terms, but in-

111
Status, Monitoring and Targets for Breeding Programs
creased in absolute units. The difference between seed orchard and stand seeds in plant estab-lishment rate varied greatly depending on year and site, whereas in height growth the differenceswere consistent in different years and sites.
There was great variability between seed lots within each seed type as regards plant establish-ment rate, so no general conclusions can be drawn if only a few seed lots are tested. In somecases the seed lots from seed orchard with northern origin had delayed germination which couldextent to the next spring.
Preliminary conclusions
Due to the young age of the experiments no final conclusions can be drawn yet, but at this stageseed orchard seed seems not to offer any great advantage compared to stand seed as regardsplant establishment rate. The better height growth of the seed orchard material will of courseresult in genetic gain in wood production as is also shown by planted material. It remains to beseen what is the long term effect of this better height growth as regards the competition withground vegetation and thus to the density of the stand.
The monitoring of the experiments will be continued to get more reliable results. There has alsoarisen a question whether the tested seed lots are representative to their classes and could therebe some benefit of combining differently germinating seed lots.

112
Proceedings of the Meeting of Nordic Tree Breeders and Forest Geneticists
GENETIC GAIN IN AREA-BASED PRODUCTION IN NORWAY SPRUCE
Johan WestinSkogforsk, Sweden
Results are presented from a series of 55-60 year old field tests with Norway spruce (Picea abies(L.) Karst.) in Sweden. The aim with the present study is to estimate genetic parameters in areabased production (coefficient of additive variation, CVA), the genetic correlation (rjm) between juve-nile height and mature production and the genetic gain in production when selecting for earlyheight.
Area-based production is defined as the total production of stem volume per hectare. The produc-tion includes living trees, dead or damaged trees and thinned trees. The field tests were estab-lished during the 1940’s and has almost completed a full rotation-period. In total 14 test sites arestudied – seven in mid-Sweden and seven in northern Sweden. On all sites half-sib progenieswere planted in multiple tree plots. Multiple tree plot designs are advantageous for studies of pro-duction but the low number of parents tested and the low number of replications used, lowers theprecision of the estimates.
The progenies originate from trees selected for various reasons: phenotypically selected plus-trees based on superior height growth, randomly selected trees and trees selected for uncertainreasons. The material, especially at the northern test sites, involves considerable latitudinal trans-fer. As transfer effects are expected on early tree height and production, it is considered in theanalysis. Genetic connections exist over sites but is too small to be considered significant.
Early measurements are re-used to study the early performance in height and production. Newmeasurements are performed to study current production based on diameter or stump diameterof all trees and tree height on sample trees. Approximately 16 sample trees are used to createvolume functions for each family and site. Incomplete data are evident on several of the test sitesdue to clear-cuttting, snowbreakages and non-existing early height measurements.
Results of early survival show high survival rates on most sites. Late survival is also high whichmakes it possible to trace most of the planted trees. Trees not possible to trace are trees lostmainly due to uncontrolled historic thinnings or loss of small sized trees. Data on production perhectare and early tree height are analyzed with a unisite univariate model and a unisite bivariatemodel using the AsReml software. The results show CVA’s at similar levels for both early heightand production. The genetic juvenile-mature correlation was moderate. The range in CVA andjuvenile-mature correlations were both wide.
The genetic gains are calculated as: selection intensity × CVA × rAI × rjm × rGE. Based on theresults in this study the anticipated genetic gain in production when selecting for early height ishigh. The genetic variation (CVA) appears to be higher than generally expected, which furtherincreases the gain in production. On the other hand the moderate genetic correlation (rjm) appearsto be lower than generally expected which reduces the gain somewhat.
СОСТОЯНИЕ, МОНИТОРИНГ И ЗАДАЧИСЕЛЕКЦИОННЫХ ПРОГРАММ
Материалы совещания лесных генетиков и селекционеров северных стран Европы
STATUS, MONITORING AND TARGETSFOR BREEDING PROGRAMS
Proceedings of the Meeting of Nordic Tree Breeders and Forest Geneticists
Pекомендовано к печатиученым советом Института биологии Коми НЦ УрО РАН
Оригинал-макет Н.П. Сердитов
Лицензия № 0047 от 01.01.99.
Компьютерный набор. Подписано в печать 22.11.2005.Формат 60×841/8. Печать офсетная. Бум. офсетная № 1.Усл. печ. л. 13. Уч.-изд. л. 13. Тираж 200. Заказ № 50.
Издательство Коми научного центра УрО РАН.167982, г. Сыктывкар, ул. Первомайская, 48.