
Sons, daughters, and arab-american family dynamics: does a child's gender matter
246
Wayne State University DigitalCommons@WayneState Wayne State University Dissertations 1-1-2011 Sons, daughters, and arab-american family dynamics: does a child's gender maer? Sanaa Al Harahsheh Wayne State University, Follow this and additional works at: hp://digitalcommons.wayne.edu/oa_dissertations is Open Access Dissertation is brought to you for free and open access by DigitalCommons@WayneState. It has been accepted for inclusion in Wayne State University Dissertations by an authorized administrator of DigitalCommons@WayneState. Recommended Citation Al Harahsheh, Sanaa, "Sons, daughters, and arab-american family dynamics: does a child's gender maer?" (2011). Wayne State University Dissertations. Paper 366.
Transcript of Sons, daughters, and arab-american family dynamics: does a child's gender matter
Wayne State UniversityDigitalCommons@WayneState
Wayne State University Dissertations
1-1-2011
Sons, daughters, and arab-american familydynamics: does a child's gender matter?Sanaa Al HarahshehWayne State University,
Follow this and additional works at: http://digitalcommons.wayne.edu/oa_dissertations
This Open Access Dissertation is brought to you for free and open access by DigitalCommons@WayneState. It has been accepted for inclusion inWayne State University Dissertations by an authorized administrator of DigitalCommons@WayneState.
Recommended CitationAl Harahsheh, Sanaa, "Sons, daughters, and arab-american family dynamics: does a child's gender matter?" (2011). Wayne StateUniversity Dissertations. Paper 366.
SONS, DAUGHTERS, AND ARAB-AMERICAN FAMILY DYNAMICS: DOES A
CHILD’S GENDER MATTER?
by
SANAA ALHARAHSHEH
DISSERTATION
Submitted to the Graduate School
of Wayne State University,
Detroit, Michigan
in partial fulfillment of the requirements
for the degree of
DOCTOR OF PHILOSOPHY
2011
MAJOR: SOCIOLOGY
Approved by:
____________________________________
Advisor Date
____________________________________
____________________________________
____________________________________

ii
DEDICATION
I dedicate this work to my husband Wasfi Almeshagbeh, for his unconditional
love, support, and encouragement. To my children, the light and the love of my life.
To my parents, for their continuous love, support, prayers, and inspiration. To my
sisters and brothers for all the support and encouragement. To Dr. Mary Sengstock,
for her continuous guidance, advice, outstanding professionalism, and support.

iii
ACKNOWLEDGMENTS
The moment has finally come to turn over the final page of this dissertation after a long
academic journey at Wayne State University. However, I would not have reached this end point
without these extraordinary individuals and I am greatly indebted. First and foremost I would
like to thank God for providing me with patience, knowledge, capacity, courage, and placing so
many people in my life to help get through this educational journey.
Heartfelt gratitude and appreciation go to my advisor Dr Mary Cay Sengstock, who
provided invaluable guidance, support, and encouragement since the moment I came to the
sociology Department at Wayne State University. Her comments, patience, and advice regarding
this dissertation have been priceless. I am indebted to her for the years of support, training, and
guidance that she has given me throughout my doctoral years at WSU. I am so proud to be one of
her school‘s graduates. I hope that I have produced a work that she can be proud to be a part of.
I feel fortunate to have an expert team of researchers on my dissertation committee.
My deepest appreciations are to my dissertation committee members: Dr. Leon Warshay, Dr.
Heather Dillaway, and Dr. Virginia Rice for their expertise, guidance, and support. Thank you all
for taking the time to evaluate my dissertation and providing invaluable feedback. Thanks are
also extended to all people in the sociology department who supported and encouraged me
through my academic endeavors as a graduate student. Also, special thanks go out to Dr Ozkan,
WSU Computer Information and Technology, for all the statistical inputs.
Without the unwavering support and endless love of my best friend and husband Wasfi
Almeshagbeh, this dissertation would not have been attainable. His patience and willingness to
sacrifice the quality of our home life allowed me to study and write in peace. I doubt I will ever
be able to express my appreciation fully, but I owe him my eternal gratitude. Also, special thanks

iv
go to the light of my life and heart, my children. My children made sacrifices to make
completion of this program a reality. Nothing gave me the determination to succeed more than
seeing their little faces. I hope that someday they will understand and read what I was doing for
hours on end in front of my computer.
I would like to express my deepest appreciations and thanks to my family in Jordan for
their constant support and motivation throughout my educational journey. I am especially
thankful to my father and mother for their unconditional love, support, and prayers which are
basis for all my accomplishments. I‘m also indebted to all my sisters and brothers in Jordan for
all their constant encouragement and support over the years of my academic journey in the USA.
Finally, I am indebted to all those people whom directly and indirectly participated in what I
have achieved. Special thanks go out to my study‘s participants for taking the time to fill out the
surveys, to all Arab-American community leaders who facilitated my data collection, and to all
my friends who believed in me and supported me all the way to finish this academic work.

v
TABLE OF CONTENTS
Dedication .................................................................................................................................. ii
Acknowledgements ................................................................................................................... iii
List of Tables ............................................................................................................................. vi
List of Figures ............................................................................................................................. x
CHAPTER 1- Introduction .......................................................................................................... 1
CHAPTER 2- Literature Review & Theoretical Framework ........................................................ 9
CHAPTER 3- Methodology ...................................................................................................... 58
CHAPTER 4- Results ............................................................................................................... 67
CHAPTER 5- Discussion and Conclusions ............................................................................. 158
Appendix A- HIC Approvals ................................................................................................... 184
Appendix B- Amendment Approval ........................................................................................ 185
Appendix C- Information Sheets ............................................................................................. 186
Appendix D- Questionnaires ................................................................................................... 188
References .............................................................................................................................. 201
Abstract .................................................................................................................................. 232
Autobiographical Statement .................................................................................................... 235

vi
LIST OF TABLES
Table 1: Categorical Social Background Characteristics of Arab-American Parents
in the Study ................................................................................................................ 69
Table 2: Continuous Social Background Characteristics of Arab-American Parents in the
Study .......................................................................................................................... 70
Table 3: Percentages of Gender Ideology Measures .................................................................. 71
Table 4: Categorical Social Background Characteristics of Arab-American Parents in the Study
(Continued) ................................................................................................................ 74
Table 5: Reasons for Wanting Boys and Girls in Arab- American Families ............................... 75
Table 6: Prevalence of Number of Children by Parents‘ Gender Preferences with Regard to
Children...................................................................................................................... 77
Table 7: Prevalence of Number of Children by Gender Composition of Children ..................... 78
Table 8: Reported Fathers‘ level of Involvement with Children in Interactive Activities ........... 80
Table 9: Reported Fathers‘ level of Involvement with Children in Childcare Activities when they
were Babies ................................................................................................................... 81
Table 10: Reported Mothers‘ Level of Involvement with Children in Interactive Activities ....... 84
Table 11: Reported Mothers‘ Level of Involvement with Children in Childcare Activities when
they were Babies ............................................................................................................ 85
Table 12: Percentages of level of Closeness to Boys and Girls by Gender of Parents ................. 86
Table 13: Percentages of Level of Affection Giving to Children by Gender of Parents .............. 86
Table 14: Percentages of Children‘s Level of Participation in Household Work ........................ 89
Table 15: Percentages of Marital Quality Measures ................................................................... 93

vii
Table 16: Reliability Analysis for Parental Behavioral Involvement with Children
Measures .................................................................................................................... 96
Table 17: Reliability Analysis for Parental Emotional Involvement with Children
Measures .................................................................................................................... 97
Table 18: Reliability Analysis for Parental Involvement with Children in Interactive Activities
Measures .................................................................................................................... 98
Table 19: Reliability Analysis for Parental Involvement with Children in Childcare Activities
Measures .................................................................................................................... 99
Table 20: Reliability Analysis for Household Work Measures ................................................. 100
Table 21: Reliability Analysis for Indoor Household Work Measures...................................... 101
Table 22: Reliability Analysis for Outdoor Household Work Measures ................................... 102
Table 23: Reliability Analysis for Marital Quality Measures ................................................... 103
Table 24: Reliability Analysis for Gender Ideology Measures ................................................. 104
Table 25: A Summary of Frequency Distributions for those Omitted Measures ....................... 105
Table 26: ANOVA Results of Differences in Family Size by Gender Preferences ................... 107
Table 27: Bonferoni Comparisons between Gender Preferences and Family Size .................... 107
Table 28: ANOVA Results of Differences in Family Size by Gender Composition ................. 108
Table 29: Bonferoni Comparisons between Gender Composition and Family Size .................. 108
Table 30: ANOVA Results of Differences in Parental Behavioral and Emotional Involvement
and Involvement in Interactive Activities by Gender Composition ............................ 110
Table 31: Bonferoni Comparisons between Gender Composition and Behavioral and Emotional
Involvement and Involvement in the Interactive Activities ........................................ 110
Table 32: Model Summary for Predictor of Parental Behavioral Involvement with Children ... 111
Table 33: Simple Regression Results for Parental Behavioral Involvement with Children ....... 112
Table 34: Model Summary for Predictor of Parental Emotional Involvement with Children .... 112
Table 35: Simple Regression Results for Parental Emotional Involvement with Children ........ 113
viii
Table 36: Model Summary for Predictor of Parental Involvement with Children in Interactive
Activities .................................................................................................................. 113
Table 37: Simple Regression Results for Parental Involvement in Interactive Activities with
Children.................................................................................................................... 114
Table 38: Model Summary for Predictor of Parental Involvement with Children in Childcare
Activities .................................................................................................................. 114
Table 39: Simple Regression Results for Parental Involvement with Children in Childcare
Activities .................................................................................................................. 115
Table 40: ANOVA Results of Differences in Household Work by Gender Composition ......... 116
Table 41: Bonferoni Comparisons between Gender Composition and Children‘s Participation in
Household Work ....................................................................................................... 116
Table 42: Model Summary for Predictors of Children‘s Participation in Household Work ...... 118
Table 43: Simple Regression Results for Children‘s Participationin Household Work ............. 118
Table 44: ANOVA Results of Differences in Marital Quality by Gender Preferences .............. 119
Table 45: ANOVA Results of Differences in Marital Quality by Gender Composition ............ 119
Table 46: Bonferoni Comparisons between Gender Compositionand Marital Quality .............. 120
Table 47: Simple Regression Results for Marital Quality ........................................................ 120
Table 48: Regression Coefficient of Independent Variables on Family Size ............................ 124
Table 49: Regression Coefficient of Independent Variables on Fathers‘ Behavioral Involvement
with Children ............................................................................................................ 127
Table 50: Regression Coefficient of Independent Variables on Mothers‘ Behavioral Involvement
with Children ............................................................................................................ 128
Table 51: Regression Coefficient of Independent Variables on Fathers‘ Emotional Involvement
with Children ............................................................................................................ 131
Table 52: Regression Coefficient of Independent Variables on Mothers‘ Emotional Involvement
with Children ............................................................................................................ 132
Table 53: Regression Coefficient of Independent Variables on Fathers‘ Behavioral Involvement
with Children ............................................................................................................ 134

ix
Table 54: Regression Coefficient of Independent Variables on Fathers‘ Emotional Involvement
with Children ............................................................................................................ 136
Table 55: Regression Coefficient of Independent Variables on Fathers‘ Involvement with
Children in Interactive Activities .............................................................................. 139
Table 56: Regression Coefficient of Independent Variables on Mothers‘ Involvement with
Children in Interactive Activities .............................................................................. 140
Table 57: Regression Coefficient of Independent Variables on Fathers‘ Involvement in Childcare
Activities with Children when they were Babies ....................................................... 143
Table 58: Regression Coefficient of Independent Variables on Mothers‘ Involvement in
Childcare Activities with Children when they were Babies ....................................... 144
Table 59: Regression Coefficient of Independent Variables on Fathers‘ Involvement in
Interactive Activities with Children .......................................................................... 146
Table 60: Regression Coefficient of Independent Variables on Children‘s Participation in the
Household Work ....................................................................................................... 149
Table 61: Regression Coefficient of Independent Variables on Indoor Household Work ......... 151
Table 62: Regression Coefficient of Independent Variables on Outdoor Household Work ....... 153
Table 63: Regression Coefficient of Independent Variables on Marital Quality ....................... 156
Table 64: Summary of Significant Predictors of Regression Analysis on Four Family
Processes .................................................................................................................. 157

x
LIST OF FIGURES
Figure 1: Theoretical Model ...................................................................................................... 57
Figure 2: Revised Theoretical Model ....................................................................................... 174

1
CHAPTER 1
Introduction
1.1 Statement of the problem
Differences in gender roles exist in families in all societies and cultures, but expectations
are often different. The Arab society is no exception. Differences may be found in Arab homes
situated in the United States or another culture or country. Societies and cultures expect different
things of women and men. In every society and culture, a set of learned or socially-constructed
norms, values, ideas, and guidelines affect views, attitudes, behaviors, roles, and expectations.
(Greenglass, 1982; Lorber, 1994; Bonvillain, 2001; Kramer, 2001). These norms and guidelines,
especially ones tied to gender and the equivalent gender role that society assigns to individuals
are established through the process of socialization in early childhood. Society nudges boys and
girls in different directions from an early age by expecting different behaviors of males and
females. These expectations carry over into adulthood. Parents are the first significant role
models for their children in how to follow the gender map within the home environment. Parents
may reinforce gender stereotypes even though they may not be aware they are doing so.
Newborns do not know their gender. Yet children quickly develop a gender identity and learn
their gender roles as influenced by their parents. From birth, babies are treated according to their
gender. In many cultures boys are taught to behave like men, while girls are taught to be polite,
genteel, and to rely on males for help (Thio, 2007).
Existing evidence suggests that parental behavior is affected by the genders of their
children (Raley & Bianchi, 2006). For instance, boy preference is very common in a number of
developing countries, including the Arab society (William, 1976; Arnold & Kuo, 1984; Cleland,
Verrall, & Vaessen, 1983), whereas preference for more balanced gender composition (at least

2
one child of each gender) is more common in more developed countries (Kippen, Evans, & Gary,
2007; Raley & Bianchi, 2006; Andersson, 2006; Hank & Kohler, 2000; Arnold Kuo, 1984;
Arnold, 1997). Children of a particular gender are often preferred to provide certain utilities,
such as economical, social, or psychological benefits. For example, in traditional societies sons
are presumed to have greater economic net utility than daughters, since male offspring are able to
serve as a form of social security and provide assistance in agriculture production and wage
earning (Arnold & Roy, 1998; Baedhan, 1988; Basu, 1989). In patrilineal society, sons are also
prized for carrying on the family name (A El-Gilany & Shady, 2007; Hank & Kohler, 2000). On
the other hand, parents may wish for a gender mix of children because of the different benefits
that accrue from each gender (Hank & Kohler, 2000; Fawcett, 1977). Each partner, for example,
might prefer to have at least one child of his or her own gender for the purpose of companionship
(Jacobsen, Moller, & Engholm, 1999) and for the idea that the genders will have different traits,
strengths, leisure activities, and interests (Williamson, 1976).
These gender preferences may have significant influence on a couple‘s childbearing
behavior and their family size. A strong son preference may influence additional childbearing
efforts if couples are not happy with the gender composition of their current family (Arnold &
Roy, 1997; Al-Qudsi, 1998). Some studies show an effect of gender preferences on a couple‘s
reproductive behavior and ultimate family size, even in industrialized countries (Marleau &
Saucier, 1996). Moreover, some studies show that the birth of a son, rather than a daughter,
increases both the quality and stability of marriage (Lundberg, 2007, 2003). Parents with sons
report higher levels of marital satisfaction and happiness than do parents who have only
daughters (Barnett & Baruch, 1987; Katzev, Warner, & Acock, 1994; Cox, Paley, Burchinal, &
Payne, 1999; Mizell & Steelman, 2000; Lundberg, 2007, 2003).

3
The gender of a child also has an impact on the ways in which parents treat children,
invest their time, and allocate household chores. (Raley & Bianchi, 2006). Men tend to spend
more time with sons and women spend more time with daughters (Bryant & Zick, 1996;
McHale, Crouter, & Tucker, 1999; McHale & Updegraff, 2000; Yeung, 2001). Most of the time
men spend with their children is in the form of interactive activities, such as play activities or
helping with homework rather than in the ―custodial‖ cleaning and feeding that are seen as the
mother‘s domains (Robinson & Godbey, 1997). Gender typing further occurs in the allocation of
household work for children (Raley & Bianchi, 2006; Blair, 1992; Cogle & Tasker, 1982; White
& Brinkerhoff, 1981); girls do more household chores than boys (Bianchi & Robinson, 1997;
Gager & Sanchez, 2004). Boys generally do the traditional male jobs, such as taking out the trash
and household repairs, whereas girls are typically assigned traditional female activities, such as
washing the dishes and cooking (White & Brinkerhoff, 1981; Gager, 1999; McHale, 1990). This
differential treatment is also evident in Arab societies. Girls are usually raised and taught to be
the source of love and to provide emotional support. They are encouraged to be companions to
their mothers, go on shopping trips and other kinds of outings, help with the household work,
and talk with their mothers about what is going on in their lives (Al-Sabt, 2006). On the other
hand, male children are taught to be protectors of their female siblings and relatives and to help
their fathers with their duties. Additionally, boys may enjoy being involved in sporting activities
with their fathers or by participating in some way in their fathers‘ professional lives (Al-Sabt,
2006; Aswad & Bilge, 1996). Although these trends are changing, Arab children are encouraged,
as Westerners are, to be individuated and separate from their parents. Children who disobey
and/or shame their parents are likely to be disowned by them (Abudabbeh, 2005).

4
This raises a question as to whether early gender differential treatment is a channel to
differential adult outcomes. Many issues in adulthood have their roots, at least partially, in
gender constructions that begin in early childhood. For instance, women around the world have
made considerable progress in several arenas yet they are still unequal to men in many ways.
Women still devote more time to childrearing and unpaid housework while men continue to give
more time to work ( Giddens, Duneier, Appelbaum & Carr, 2009; Macionis, 2010; Raley &
Bianchi, 2006; Baxter & Western, 1998; Brines, 1994; Gill, 1993; Gregson & Lowe, 1993;
Layte, 1993; Lennon, 1994; Seymour, 1992; Speakman & Marchington, 1999; Warde &
Hetherington, 1993). Women are poorly paid, work in the lowest-wage jobs, and are likely to
make less than men doing similar work despite their increased participation in paid employment
nationwide. Even women who are successful in the corporate world face discrimination in the
form of deeply held cultural expectations about the proper role of women in society. In
developing countries, women are likely to experience unequal job conditions. However, at the
same time, their enhanced economic role has sometimes resulted in increased economic
independence and greater social status (Giddens, Duneier, Appelbaum & Carr, 2009; Macionis,
2010). In addition, women throughout the world do not share the same political power as men,
even though thirty-eight countries have been headed by a woman since World War II. The
United States is about average among countries in terms of women's representation in the
national legislature, but has never had a female president ( Giddens, Duneier, Appelbaum &
Carr, 2009; Macionis, 2010).
Gender role differences in adulthood are a common phenomenon in Arab societies
regardless of the social, economical, technological, and educational changes, etc. that have taken
place in them. The social structure of the family is patriarchal. The male is the leader and highest
5
authority in the household, the economy, and polity, while Arab women have primary
responsibility for childbearing, childrearing, and instilling future generations with Arab values
(Al-Sadawi, 1995). Arab-American communities in the United States continue these gender
norms regardless of the progress that women have achieved worldwide. As viewed by Read
(2004a, 2003) and Read & Oselin, (2008), Arab-born American female employment rates have
been found to be among the lowest of any immigrant group even though the women are highly
educated. This is due to traditional cultural norms and ethnic and religious social networks that
encourage the maintenance of traditional gender roles. Yet, the influence of a child‘s gender on
Arab-American family dynamics has not been investigated.
This study is designed to quantitatively examine the influence of a child‘s gender on
selected family dynamics in Arab-American families. Specifically, the goals are: 1) to investigate
the relationship between parental gender preference regarding children , gender composition and
Arab-American family size when holding constant parents‘ age, age at marriage, gender, place of
birth, work status, income, education, and gender ideology; 2) to investigate the relationship
between gender ratio and gender composition of the children and parental involvement with
children when holding constant parents‘ age, number of children, income, work status,
education, average age of children, gender ideology, and place of birth; 3) to investigate the
relationship between gender ratio and gender composition of the children and children‘s
participation in the household work while holding constant parents‘ age, number of children,
income, work status, education, average age of children, gender ideology, and place of birth; and,
4) to investigate the relationship between gender ratio, children‘s gender composition, parental
gender preferences and marital quality when parents‘ age, number of children, average age of
children, gender, work status, income, education, gender ideology, place of birth, and fathers‘
6
involvement are held constant. Thus, this study attempted to answer one overall question: what is
the impact of the gender of children on Arab- American family dynamics?
1.2 Significance of the study
This study is significant because recent worldwide events have drawn attention to Arab
or Middle Eastern populations in American society which are moving toward a mosaic of
different cultures. As originally concluded by the ―melting pot‖ theory, ―America [is] not going
to continue as an Anglo-based society but [will] become an amalgamation of all of the cultures
entering it‖ (Sengstock, 2006, p. 2). The Arab-American community, like other minority groups,
is becoming a functioning part of American society. They have an impact demographically,
economically, politically, socially, and culturally. For a better understanding of the influence of
the Arab-American community on American society, we have to start with the family,
considered the basic unit of society, where interaction is embedded and from which the social
behavior of individuals emerges.
Gender differences in adulthood are well documented in family studies. A significant
body of literature describes and theorizes about the differences between husbands and wives in
relation to household labor, income, and the power they have. But the influence of a child‘s
gender has not been a major factor in the literature on gender, family, and work in the United
States (Raley & Bianchi, 2006). In addition, there is no noteworthy body of literature
investigating the influence of a child‘s gender on Arab-American family dynamics. This fact
illustrates the lack of information/knowledge on this topic and the need for additional studies in
order to fill the research gap.
Understanding and knowing how the gender of a child influences various Arab-American
family processes can help sociologists gain a better understanding of Arab-American family

7
dynamics. In addition, family counselors, social workers, etc., will be able to provide services
that are more effective to Arab-American families. This, in turn, will improve social
relationships and well-being of children, families, and society as a whole. Additionally, this
research can reinforce and spread egalitarian gender norms in our society by studying and
analyzing how the gender of a child affects diverse family outcomes. It will help advance the
conceptualization of gender, family, and children as well as enhance the body of knowledge in
this field as a whole. Many aspects of society can be improved through a better understanding of
the relationships between the gender of a child and various family dynamics. Such research
could help improve marriage relationships and the relationships between parents and their
children. This, in turn, will contribute greatly to the development of children and improve the
well-being of families and society.
For this study, a cross-sectional quantitative research survey design was used to
investigate the influence of a child‘s gender on family processes within Arab-American families.
Data was gathered using a self-administered questionnaire given to a convenience sample of
Arab-American parents in families who have children under 18 years old at home and reside in
the Tri-County area (Wayne, Macomb, and Oakland counties) of Greater Metropolitan Detroit,
Michigan. In addition, descriptive, bivariate, and multivariate statistics analyses were used to
assess the overall trends and patterns of the data and the relationship among gender composition,
gender ratio, and parental gender preferences of the children and Arab-American family
dynamics.
This dissertation consists of five chapters. Following this introduction to the study,
Chapter 2 is a review of pertinent literature about Arab families, gender differentiation regarding
children, including the gender preference of parents regarding children, reason for gender
8
preference, gender preferences and family size, parental involvement with children, children‘s
participation in household work, and marriage quality. Also included in this chapter is the
theoretical framework which is the basis of this study. Chapter 3 presents the methodology
employed, including research hypotheses, design, sample and setting, measurement, instrument
and procedure, and statistical analyses techniques. Chapter 4 presents exclusively the results of
the data analysis, including presentation of the univariate, bivariate, and multivariate results.
Finally, Chapter 5 discusses the major research findings for each of the specific family dynamics
and their relations to symbolic interactionist theory, followed by outlining the conclusion, the
strengths and limitations of the study, the directions for future, and the implications of the
results.
9
CHAPTER 2
Literature Review and Theoretical Perspectives
An overview of the pertinent literature about Arab families, gender differentiation
regarding children, including the gender preference of parents regarding children, reasons for
gender preference, gender preferences and family size, parental involvement with children,
children‘s participation in household work, and marriage quality has been reviewed and will be
presented in this chapter. The focus of the literature is primarily on the United States, with
limited references to research in other developing and developed countries. This review is
essential to learn about and understand the relationship between the gender of the child and
selected family dynamics; to help recognize trends and methodology used in the reviewed
research; to help identify appropriate variables that can be utilized to derive conclusions about
gender differences in the family; to outline the gaps; and to provide directions for future
research. Finally, the theoretical framework and the research hypotheses that inform this study
are presented.
2.1 Arab Families
2.1.1 Who are Arab-Americans? Arab-Americans are those who immigrated to North America
from one of 22 Arabic speaking countries stretching from Morocco in the West to the Arabian
Gulf in the East (Suleiman, 1999; Samhan, 2001). Arab-Americans began arriving to the United
States during the late 19th century and early 20th century in three distinct waves. The first wave,
which came between 1890 and 1940, consisted mostly of merchants and farmers who emigrated
for economic reasons from regions that were then part of the Ottoman Empire. The majority of
them were Christians, originating from Syria and Lebanon. The second wave began after World
War II and was composed mostly of people with college degrees or those seeking to earn them.
10
Unlike the first wave, the second wave differed in that its people came from regions of post-
European colonization and from sovereign Arab nations. They arrived with an Arab identity that
was absent in the first wave and the majority were Palestinians and Muslims. The third wave of
immigration occurred after 1967 and they were Arab-Israelis seeking refuge to escape the
political unrest in their countries of origin. This wave included Lebanese immigrants feeling the
unrest of civil war in their country, and Iraqis following the Gulf War (Abudabbeh, 2005). The
ethnic roots of the majority of Arab-Americans can be traced to five groups, including Lebanese
(47%), Syrians (15%), Palestinians (6%), Egyptians (9%), and Iraqis (3%) (Samhan, 2001).
Arab-Americans today can be portrayed as a heterogeneous, multicultural, multiracial, and
multiethnic group, currently estimated at nearly 3.5 million people (U.S. Census Bureau, 2000;
Samhan, 1999; Zogby, 2001). However, due to the census classification of Arabs as white, no
firm demographic data exist that provide descriptive statistics about Arab-American residents in
the United States. Arab-Americans reside in all 50 states, but 66% are concentrated in 10 states
(Zogby, 1990, 2001). The largest concentrations of Arab-Americans are in and around Detroit
(219,765), Los Angeles (300,000), and New York (162,692). Arab-Americans make up 20% of
Dearborn, Michigan, which is the most densely populated community (Samhan, 2001). The
majority of Arab-Americans are Christian (Catholic 42%, Protestant 12%. Orthodox 23%), and
23% are Muslim (Zogby, 2003). Approximately 85% of Arab-Americans have a high school
diploma, more than 4 out of 10 hold a bachelor‘s or higher degree (as compared with 24% of the
American average). Twice as many Arab-Americans have postgraduate degrees. Nearly, 64% of
Arab-Americans are in the labor force, mostly in professional and managerial posts, with only 12
% in government jobs (Abudabbeh, 2005).
11
Compared to non-Arab populations, self-employment is more common among Arab-
Americans with 72% working in managerial, professional, technical, sales, or administrative jobs
(Samhan, 2001; U.S. Bureau of the Census, 1990). About 66% of adult Arab-Americans are in
the labor force and 5.9% are officially considered unemployed. There is great diversity in the
economic status of Arab-Americans. On one hand, the older cohort tends to be rich. The income
level of Arab-Americans as a group is about $5,000 above the median U.S. income. For all Arab-
Americans, the poverty rate is about 11%, but for recent immigrants, 20% (Samhan, 2001).
Educational achievement is valued very highly by Arab-Americans. According to
statistics from the U.S. Bureau of the Census (1990), more than one third hold bachelor‘s degrees
and 15% have earned graduate degrees. Nearly 50% of Arab-Americans over 18 speak a
language other than English at home, yet only 10% reported not speaking English well.
Preservation of the Arabic language is important for reading the Qur‘an and practicing Islam.
Arabic classes and schools have been created to teach the language to immigrant descendants
(Samhan, 2001; U.S. Bureau of the Census, 1990, 2000). Despite economic and educational
contributions, Arab-Americans tend to lack recognition and remain unknown to many Americans
(Suleiman, 1999).
2.1.2 Arabic family structure and gender roles
The family is considered the foundation of the Arab community, and there is a strong
emphasis on traditional gender roles (Esposito, 1998; Haddad, 1994; Bilge & Aswad, 1996;
GhaneaBassiri, 1997). The family unit in Arab societies has different types (Al-Sabt, 2006).
First, the nuclear unit is the most familiar structure that encompasses the father, mother, and
children (Hammad, Kysia, Rhbah, Hossoun, & Connelly, 1999). Second, the extended family
‘aila or usra unit that consists of the married couple, unmarried children, married male children

12
and their wives and children, unmarried paternal aunts and uncles, and, sometimes, grandparents
(Barakat, 1993; Hammad et al., 1999). Traditionally, the ‘alia or usra represents an economic
and social unit in society and is usually governed by eldest male in the family (e.g., grandfather,
or eldest paternal uncle) (Barakat, 1993; Hammad et al., 1999). The ‗hammula‖ (clan) is the third
type of family unit in the Arabic society and usually comprises all individuals who descended
from the same paternal ancestor (Hammad et al., 1999).
The Arab family can be described as patriarchal, a hierarchal pyramid with regard to age,
gender, and extended family in terms of its functions. It is typically patrilineal, and the cultural
ideal emphasizes that men should earn enough money so their wives are not expected to work in
the labor force. The wife‘s primary role is raising children and taking care of the house. Arab
societies tend to be father dominant (patriarchal). The father is the head of the family and is
considered a powerful and charismatic figure. He commands respect as the legitimate authority
for all matters of the family (El-Islam, 1983; Barakat, 1985). The patriarchal structure extends
throughout all levels of society. The father of the nuclear family is subordinate to his own father,
who in turn defers to the authority of the head of the clan. All clan heads are subordinate to the
head of the tribe or hamula. The tribal or clan leader also serves as the spiritual and practical
father of the whole group. He represents the collective leader to the outside world, oversees the
rules for the clan or tribe, and guides their actions. In effect, the patriarchal structure creates a
complete and autonomous society within a society, functioning as a single unit (Abudabbeh,
2005; Barakat, 1985).
Today, due to factors such as industrialization, urbanization, war/conflict, and
Westernization, there are many signs of strain on the traditional family system. Despite these
pressures, the family remains the main system of support throughout the Arab world and Arabs
13
living elsewhere. For a majority of Arabs, as for virtually all other cultural groups, no institution
has yet replaced the family as a system of support (Fernea, 1985). In addition, despite the
reduced prevalence of the extended family, they remain important. Relatives generally remain
closely interlocked in a web of intimate relationships that leaves limited room for independence
and privacy. They continue to live in the same neighborhood, to intermarry, to socialize on a
kinship basis, and to expect a great deal from one another. Such relationships and expectations
are not often changed by emigration or by forced separation resulting from war or political
upheavals (Barakat, 1985).
In Arab families, elders are to be cared for by the other family members. Their place in
the family requires respect and payback for their roles as good parents (Abudabbeh, 2005). For
example, Durrani (2000) as cited in Salari (2002, p. 583-584) writes, ―Children learn from an
early age to respect and care for their parents far into their elder years. For many Arabs, the
concept of placing ‗burdensome‘ parents into nursing homes for strangers to care for violates
their family values. We Arab mothers raise our children to care for one another and most
importantly, care for us when we are older. This is something very important to us in our
culture.‖ However, not a lot is known about the care of elderly persons in Arab-American
communities (Azaiza et al., 1999).
Son preference is a prevalent phenomenon in Arabic countries, but differences are noted
from one country to another (Cleland, Verrall, & Vaessen, 1983; Arnold & Zhaoxiang, 1986;
Williamson, 1976). Having a son in the family means a lot. The birth of a boy causes more joy
than that of girls. Having a boy could contribute to the family protection and maintenance
(Schvaneveldt, Kerpelman, & Schvaneveldt, 2005). Therefore, family size and childbearing
behavior in many Arab countries are strongly influenced by the gender of the offspring. A strong
14
son preference may be a barrier to fertility decline if couples persist in having children after
reaching their overall family size goal because they are not satisfied with the gender composition
of their current family (Al-Qudsi, 1998; Arnold & Roy, 1997).
Moreover, gender differences in adulthood tend to remain strong in Arab societies, and
the social structure of the family is male dominant regardless of the social, economical,
technological, and educational changes, etc. that have taken place in Arab societies. In Libyan
society for example, women are perceived as "physically and mentally weak in comparison to
men" (Attir, 1985, p, 121). Traditionally, ethnic Arab women have been viewed as "powerless
and submissive" (Al-Haj, 1987, p, 103). The male is the leader and highest authority in the
household, the economy, and the polity (Al-Krenawi, 1996; Morsy, 1993). In many Arab
societies, women's social status is strongly dependent on being married and rearing children,
especially boys (Al-Sadawi, 1995). Arab women have primary responsibility for childbearing,
childrearing, and socializing future generations with Arab values. It is common for women not to
have careers outside the home (Grossbard-Shechtman & Neuman, 1998). Many female
professionals, even those attaining high degrees of success, defer to spouses or families for major
decisions (Hoodfar, 1997; Shalhoub-Kevorkian, 1997).
Even in Arab-American communities, gender norms are still taking place regardless of
the progress that women have achieved worldwide. As a group, Arab-Americans are highly
educated, have higher labor force participation rates, and earn higher incomes than the U.S. adult
population, all of which suggest an assimilated and progressive ethnic population (Samhan,
2001; U.S. Bureau of the Census, 1990). Arab cultural and religious customs reinforce traditional
gender roles, especially those regarding women's responsibilities in the home and family (Bilge
& Aswad, 1996; Haddad & Smith, 1996). Arab-born American female employment rates are

15
among the lowest of any immigrant group. This is due in part to traditional cultural norms and
ethnic and religious social networks which encourage the maintenance of traditional gender roles
(Read, 2004b, 2003; Read & Oselin, 2008; Ajrouch, 1999; Aswad & Bilge, 1996; Haddad &
Lummis, 1987). On the other hand, American-born Arab women have employment rates
resembling those of U.S. born white women, 71.7 and 73.2 %, respectively (U.S. Bureau of
Census, 1990).
Drawing on ethnographic field notes and in-depth interviews with Arab-Americans, Read
& Oselin (2008) found that compared to other ethnic women in U.S., Arab-American women
have higher educational attainment but lower employment rates. This is due mostly to cultural
preferences for traditional gender roles, which are maintained through religious and ethnic
network. Female education is a collective family resource to be invested in the home to ensure
the proper socialization of children, solidarity of the family, and, ultimately, the maintenance of
ethnic and religious identity rather than for use in the marketplace (Read & Oselin, 2008).
Similarly, Aswad (1991), in her study based on an intensive interview with 40 married
immigrant women, half from South Lebanon, and half from the Yemen Arab Republic, also
found that women in the study did not gain employment in the U.S. because of culture
preferences for traditional gender roles.
These gender differences in adulthood where men continue to give more time to work
and women devote more time to childrearing and unpaid work have their roots, at least partially,
in gender constructions that begin early in life as parents treat sons and daughters differently
(Raley & Bianchi, 2006). Within Arab families, children are usually taught to follow the
inherited traditions and are given responsibilities that correspond with their age and gender (Al-
Sabt, 2006). Children are raised to be responsible for the customs and traditions of the family.
16
Differential treatment of boys is not uncommon, and the instilling of traditional expectations in
girls is common practice. Although these trends are changing, Arab children are encouraged, as
Westerners are, to be individuated and separate from their parents. Children who disobey and/or
shame their parents are likely to be disowned by them (Abudabbeh, 2005). However, gender
differentiation in the early childhood of Arab-American families has not been a major emphasis
in the literature on gender and family studies in the U.S. Also, there is no significant body of
literature investigating the influence of a child‘s gender on Arab-American family dynamics.
This demonstrates the need for additional research on this topic.
2.2 Gender Differentiation Regarding Children in Families
In this next section, the focus is on gender differentiation regarding children, primarily in
the United States, with limited references to research in other developing and developed
countries.
2.2.1 Gender preference of parents regarding children
Son preference is commonly believed to be prevalent in a number of developing
countries, particularly in South Asia, East Asia, and parts of the Middle East and North Africa
(William, 1976; Arnold & Kuo, 1984; Cleland, Verrall, & Vaessen, 1983). But the degree of
such preference differs noticeably from one country to another depending on such factors as the
level of economic development, cultural and religious practices, marriage and family systems,
social norms, the nature of social security systems, and the degree of urbanization (Arnold &
Zhaoxiang, 1986). Even though preferring sons over daughters is still widespread in many
developed countries (Benntt, 1983), this preference often exists side by side with the desire for
having at least one child of each gender (Arnold & Zhaoxiang, 1986). Evidence from various
parts of non-western societies about gender preference is well documented. Using data from the

17
National Family Health Survey, the analysis indicates that son preference fundamentally affects
demographic behavior in India, Lesotho, Sudan, and very strongly in Jordan and Syria. In the
Philippines, sons were preferred for the first child, but daughters were preferred slightly more at
every other parity. A moderate degree of son preference was found in Malaysia, Thailand, and
Sri Lanka, and son preference was extremely strong in Bangladesh, Pakistan, and South Korea
(Cleland, Verrall, & Vaessen, 1983; Arnold & Zhaoxiang, 1986; Arnold & Roy, 1998). The
World Fertility Survey (WFS) results for Asia generally agree quite closely with the findings of
Williamson (1976), who reviewed the literature on gender preferences throughout the world in
the mid-1970s. Son preference has been found to be prevalent in all of East Asia and among
groups outside of that region that share a heritage of Confucian patriarchal traditions (Arnold &
Zhaoxiang, 1986). Similarly, Park (1983) indicated that Koreans have a strong preference for
sons and the gender of the most recent child strongly influences a couple‘s decisions regarding
additional births.
In Nepal there is a strong preference for sons as well. For example, Niraula & Morgan
(1996) quote an elderly woman as saying, ―I could not bear a son. God has punished me and will
continue to punish me even after my death because there is no son to look after this state of mine
and also no son for the salvation of my soul after death. So I am a living dead [person]‖ (p. 256).
This statement reveals the common reasons for wanting sons in Nepal: to support parents in their
old age and to perform religious rites for deceased parents (Pollard & Morgan, 2002). Consistent
with these findings, Karki (1988) found strong evidence of the preference for a son in Nepalese
society. Nepalese parents prefer sons to daughters because of the culture and the various roles
that sons play in family life.
18
Son preference is also a prevalent phenomenon in the Arab culture, but differences are
noted from one country to another. In world fertility surveys (WFS), asking about the preferred
gender of the next child, Arab countries with the strongest son preference were Jordan and Syria.
Sudan, Egypt, Tunisia, Algeria, Lebanon, Yemen and Morocco were among countries with
moderate son preference (Cleland, Verrall, & Vaessen, 1983; Arnold & Zhaoxiang, 1986;
Williamson, 1976). Yount (2005) and A El-Gilany & Shady (2007) further indicated that in
Egypt there is also preference for sons over daughters. Even educated women tend to prefer sons.
The reasons for the preference for a male child were mainly psychological and social.
While the common preference in developing countries is for sons, some couples reveal
little or no son preference, and there are some instances in which a preference for daughters has
been documented. For example, the WFS found that considerably more women wanted a
daughter for their next child than a son in Jamaica and Venezuela, and little or no preference in
most of South America, parts of the Caribbean, and Kenya. In Asia, son preference was found to
be weak among women from Indonesia (except for the first child) (Cleland, Verrall, & Vaessen,
1983). Chi Lin (2009) further indicated that in Taiwan there was a significant decline for son
preference and a rise of gender indifference. Results show that at the individual level, the amount
of female education was the strongest predictor for the preference. Education was negatively
associated with son preference and positively with gender indifference. While employment status
or occupation is generally not a predictor, an increase in education reduces son preference and
leads to a higher degree of gender neutrality. Cohort difference was noticeable as well. Younger
cohorts were better educated than older ones; hence, they were more neutral about gender and
less adherent to the traditional male preference.
19
There is also rich demographic literature describing how a rise in women‘s education,
social status, and social development greatly impacts the gender preference for children. By
examining two cross-sectional surveys in Korea, Chung and Das Gupta (2007) found that female
education was negatively associated with son preference, and female occupation/employment
reduced son preference. Women with white-collar jobs showed significantly lower odds of
strong son preference. The husband‘s occupation did not show a significant association in either
survey year. Clark (2000) also showed that Indian women‘s schooling significantly reduced their
preference for sons. Leone, Matthews, & Dalla Zuanna (2003) found partial evidence that years
of schooling reduced son preference of Nepalese women. These results, considering a couple‘s
education and occupations, indicated that, over time, women‘s educational level became the
dominant socioeconomic factor associated with the level of son preference.
Although preference for sons over daughters tends to be particularly pronounced in
developing countries, preference for balanced gender composition (at least one child of each
gender) is a much more frequent pattern in economically developed countries. Most empirical
evidence suggests an almost universally dominant pattern of parental gender preferences
favoring at least one child of each gender in the U.S. and Europe (Kippen, Evans, & Gary, 2007;
Raley & Bianchi, 2006; Andersson, 2006; Hank & Kohler, 2000; Arnold Kuo, 1984; Arnold,
1997). Williamson (1976) argues that although there is slight evidence of parental preference for
sons over daughters in the United States, the tendency toward a preference for a mixed gender
composition (at least one son and one daughter) remains very strong among parents.
Examination of the U.S. data views such a gender composition effect on fertility behavior and
reproductive decisions. American parents with two children of the same gender were more likely
to want a third child (hoping their offspring would be the opposite gender) than were parents
20
who had one son and one daughter (Sloane & Lee, 1983; Yamaguchi & Ferguson, 1995;
Teachman & Schollaert, 1989). In accordance with these findings, Hank and Kohler (2000), in
their comparative study of 17 European countries with a Fertility and Family Survey in the
1990s, found that despite substantial regional heterogeneity across Europe, there was a strong
tendency towards a preference for mixed gender composition (if there was any preference at all).
The preference for a mixed gender composition, instead of a preference for sons, is
consistent with the view of children as consumer goods in the sense that parents may favor a
variety of children rather than children of the same gender. This preference may be a trait of
more modern societies in which parents reproduce mainly for the purposes of receiving
satisfaction from having children, rather than for traditional purposes, such as investment or old
age support (Okun, 1996).
In recent decades, the association between the gender of previous children and the
likelihood of the occurrence of a third birth has been weakened in the U.S. and in some European
countries. Changes in American and European societies may have led to parental gender
indifference, resulting in the decreasing impact of a child‘s gender on parental reproductive
decisions (Pollard & Morgan, 2002; Bergqvist, 1999). In agreement with these findings, Hank
and Kohler (2000) found that despite the strong tendency toward a preference for a mix of
genders in Europe, there is no evidence of gender preference in Norway, West Germany, Poland,
France, and Finland. One explanation is that recent U.S. and European parents are less concerned
about the gender of their children than in the past and may even be less interested in achieving
the one girl, one boy norm that tended to dominate U.S. fertility behavior for many years (Raley
& Bianchi, 2006).

21
Even though there is a strong tendency toward a mixed gender preference in developed
countries, some evidence suggests a continuation of son preference in the U.S. and Europe. Dahl
& Moretti (2004) argue that parents in the U.S. who have two girls are somewhat more likely to
have a third child than are parents who have two boys. Further, they found that men are
approximately 23% more likely to indicate a preference for a son, controlling for covariates. Age
seems to be a statistically significant factor in preferences. As individuals get older, they prefer
boys less, perhaps indicating that life‘s experiences (including raising girls) help alleviate bias.
However, education level, region, income, and marital status have no statistically significant
impact.
Andersson (2006) and Hank & Kohler (2007) also found that in some parts of Europe
(e.g. Finland), parents are more likely to have a third child if the first two siblings are girls.
However, parents may not prefer sons to daughters, but may assume that daughters are more
costly to raise. It is also possible to interpret different tendencies for a third birth in the opposite
way: parents with two girls may be more likely to have an additional child not because they
desire a son but because they so enjoy their children that they desire another child (Raley &
Bianchi, 2006). The evidence of preferring a child of a particular gender is probably more
compelling in developed countries. In answer to the hypothetical question: ―Suppose you could
only have one child. Would you prefer that it be a boy or girl?‖ in a Gallup Poll survey, men are
more than twice as likely to report a preference for a son over a daughter (Raley & Bianchi,
2006, p. 404). Some researchers have documented in the last few decades that many women
and/or men prefer a boy rather than a girl as a first-born child in Western societies (Choi, 1986;
Steinbacher & Gilroy, 1990; Dixon & Levy, 1985; Gustavus, 1980; Marleau & Saucier, 1993;

22
Pebley & Westoff, 1982). These findings give the impression that favoring a boy as a first-born
child is common among parents, especially women in Western societies.
In contrast, a scarce hint for girl preference is observed in U.S and European societies.
Some indication for a girl preference in the Czech Republic, Lithuania, Denmark, Sweden, and
Portugal was observed by Jacobsen, Moller, and Engholm (1999), and Hank and Kohler (2000).
Such a finding might be explained by a new and more positive assessment of the role of women
in society in recent decades. A study conducted in the U.S. during the Vietnam War suggested
that in times of military disasters, there was a small preference towards daughters to avoid losing
a son to war (Peterson, 1978).
Preferring a child of a particular gender may be manifested in a variety of ways according
to Arnold (1992). First, parents may state their attitudes about the benefits and the costs of
having sons or daughters. Second, parents may actually adjust their fertility and family planning
behavior based on gender preferences. Finally, female and male children may be treated
differently in terms of the distribution of household resources, nutrition, health care, or
educational opportunities.
2.2.2 Reason for gender preference
The bulk of literature on gender preferences indicates that son preference tends to be
particularly pronounced in developing countries, while a balance of daughters and sons (or at
least one child of each gender) is very common in developed countries. The question here is
motivation. What motivates parents to prefer one gender or the other? Perhaps it can be
understood by broadening the concept of the value of children to the two genders independently.
If the benefits of having a son outweigh that of daughter, parents are likely to prefer sons to
daughters (Arnold & Roy, 1998). Compound interactions of economic, socio-cultural, and

23
psychological factors determine the cost and benefits of a child (Arnold & Roy, 1998; Bulatao,
1981; Vlasoff, 1990; Pollak & Watkins, 1993; Friedman, Hechter, & Kanazawa, 1994; Cleland,
Verrall, & Vaessen, 1983; Marleau, & Saucier, 2002). Several studies indicate that children of a
particular gender are often preferred to provide certain utilities, such as economical, social, or
psychological benefits. In traditional societies, for example, sons are presumed to have greater
economic net utility than daughters, since male offspring are able to provide assistance in
agriculture production, wage earning, and to serve as a form of social security (Arnold & Roy,
1998; Baedhan, 1988; Basu, 1989). In patrilineal society, sons are also prized for carrying on the
family name (A El-Gilany & Shady, 2007; Hank & Kohler, 2000).
Williamson (1976) further argued that gender preferences favoring sons over daughters is
a pattern consistent with the cross-cultural predominance of patriarchy. Institutionalized gender
differentiation implies that the benefits and costs of sons and daughters differ (i.e., what one
anticipates from a son may differ from what one anticipates from a daughter). When gender roles
are highly distinct, sons and daughters are not substitutable. Economic, social, and psychological
reasons to prefer sons exist given patriarchy and the non-substitutability of sons and daughters.
The same economic, social, and emotional/psychological causes of son preference were also
reported in several different studies and from different cultures (Leone, Matthews, & Zuanna,
2003; Greenhalg, 1985; Hussain, Fikree, & Berendes, 2000; Sabir & Ebrahim, 1980; Nag, 1991;
Morgan & Condran, 1988).
In some circumstances, daughters are thought to be more reliable in providing assistance
to old people, particularly emotional support. In addition, daughters are often preferred in order
to help with household tasks or to care for younger children. There is some evidence that the
desire for additional children (if there is any at all) is reduced once the minimum number of
24
existing male children is achieved. However, even in societies with persistent son preference,
many families consider it important to have at least one daughter among their children (Arnold,
1997; Cleland, Verrall, & Vaessen, 1983; Hank & Kohler, 2000; Marleau & Saucier, 2002).
As a society develops, son preference, if present, should decline and girls should be
treated increasingly with more equality. However, Brockman (2001) showed that modernization
does not necessarily counteract gender preference. In modern societies, why should there be
gender preferences when children no longer provide economic net utility, but rather become a
source of significant time and monetary costs? Debatably, children today are likely to be prized
more for social and psychological reasons (A El-Gilany & Shady, 2007; Hank and Kohler,
2000). Hoffman (1975) developed a thorough theory of the value of children by meticulously
compiling a list of categories, describing possible values that parents might attribute to their
children such as the expansion of the self, affiliation, accomplishment, social comparison,
stimulation, economic utility. Therefore, parents may wish for a gender mix because of the
different benefits that accrue from each gender for each of the categories (Hank & Kohler, 2000;
Fawcett, 1977). Each partner, for example, might prefer to have at least one child of his or her
own gender for the purpose of companionship (Jacobsen, Moller, & Engholm, 1999) and for the
idea that the genders will have different traits, strengths, leisure activities, and interests. If boys
are seen as having a special tie to their fathers and girls to their mothers, then parents may desire
at least one of each, allowing for parent-child gender balance within the family (Williamson,
1976).
2.2.3 Gender preferences and family size
Gender preferences may have significant inferences for a couple‘s fertility behavior and
thus family size. One might assume that parents who want one or more children of a certain

25
gender may have larger families than would otherwise be the case. Parents who fail to achieve a
balanced number of daughters and sons (or at least one child of each gender) by the time they
reach the number of children planned, might tend to increase their family size upward (Gray &
Morrison, 1974). Even for industrialized countries, some studies show an effect of gender
preferences on a couple‘s reproductive behavior and ultimate family size (Marleau & Saucier,
1996), while others have found no impact of gender preferences on ultimate family size (Ayala
& Falk, 1971; Repetto, 1972), and that decisions on fertility more likely derive from economic
considerations (Repetto, 1972).
Family size and childbearing behavior in many developing countries are strongly
influenced by the gender of the offspring. A strong son preference may be a barrier to fertility
decline if couples persist in having children after reaching their overall family size goal because
they are not happy with the gender composition of their current family (Arnold & Roy, 1997).
Arnold (1992) analyzed data from the Demographic and Health Survey from 26 countries and
pointed out that the stated desire by mothers to continue reproducing if they did not have at least
one son and one daughter is now the most common preference by parents from a large sample of
developing countries. Parents who prefer sons to daughters may be unwilling to stop
childbearing until their preferred number of sons has been achieved. Rahman and Da Vanzo
(1993) have argued further that if couples want to have one or more sons then they might have a
larger family than would otherwise be the case, which could create a considerable obstacle to
future fertility decline.
In Arab countries, the single, most notable demographic aspect of the Arab region is the
average number of children as 6 children per woman (Al-Qudsi, 1998). While fertility levels are
high in the Arab region, differences exist across countries. In mid-1994 the total fertility rate

26
(TFR) was less than 4 in Egypt and less than 3 in Lebanon, while Kuwait, Oman, Saudi Arabia,
the West Bank, Gaza, and Yemen maintained a TFR of between 6 and 7.5 births per female
national. Disparities are also noted within the same country. In Egypt, for example, the average
family numbers only 3.6 children in Port Said but 8.2 in Fayoum. In Algeria, women still gave
birth to more than six children in the southern part of the country but less than four in the north.
While urban Yemen had a TFR of 5.6 in 1992, its rural areas had a higher rate, 8.2 (Fargues,
1994; Al-Qudsi, 1998).
Based on fertility trends, Arab countries can be divided into three broad categories. The
first group is countries with continually high fertility rates and declining mortality. This group
includes Jordan, Oman, Syria, Yemen, the West Bank, and Gaza where the per capita income
level is low to moderate. The birth rate among these countries was 44 births per 1,000 people in
1990, well above the birth rate of 30 for all developing countries in that year. In the second
group, fertility is declining at rates that are faster than the rate of decline in mortality rates
leading to a deceleration in the natural growth rate. This group includes Morocco, Egypt, and
Lebanon whose socioeconomic development is at an intermediate level. The Gulf countries are
the third group and are characterized by high fertility and rapidly declining mortality rates. The
group includes Saudi Arabia, the United Arab Emirates, Bahrain, Iraq, Kuwait, and Qatar. In the
early 1950‘s, the birth rate for this group of countries was 49 births per 1,000, the death rate was
23 deaths per 1,000. During the next few decades, the producing of oil caused the arrival of
waves of immigrants and contributed to the rapid progress in health standards and
socioeconomic development in general. The average birthrate for these countries (which includes
substantial numbers of immigrants) dropped to 36 by 1990, while the death rate plummeted to 6
per 1,000 (Omran & Roudi, 1993; Al-Qudsi, 1998).
27
Existing evidence pointed to the impact of cultural, economic, and educational forces on
fertility in Arab countries. A study done by Al-Qudsi (1998), for example, provides empirical
evidence on fertility determinants in Arab countries. The study results indicate that son
preference and religious beliefs positively influence fertility and family size. Female education
and employment status have a negative impact on fertility. Increasing women‘s employment
opportunities and ‗exogenous‘ increases in their wages increase the cost of having children and
lower fertility. There is an inverse relationship between female age at marriage and fertility.
Women who enter into their first marriage at a young age have a higher expected fertility rate
than women who marry later in life. However, in all countries studied, younger cohorts do not
marry as young as did their older cohorts and their expected fertility is lower, hence a
demographic transition is taking place across generations.
In line with Al-Qudsi‘s study (1998), some research showed that couple‘s work status
and education have an impact on fertility in several developing countries. Rodriguez and Cleland
(1981), in their study about the impact of socioeconomic factors on marital fertility in 20
developing countries participating in the WFS showed that the wife's educational level has a
greater influence on fertility than the husband's education. A wife's work status, however, has a
large and extensive impact on fertility, with statistically significant independent effects found in
19 of the 27 populations studied, while a husband's work status has almost no independent
impact on marital fertility. This finding provides strong evidence that employment opportunities
for the wife represent a genuine alternative to continual childbearing for many couples, and can
make a major contribution to reducing fertility.
Empirical studies revealed that the relationship between son preference and fertility is
often rather weak in some developing countries (Arnold, 1997, 1992; Bairagi & Langsten, 1986;

28
Das, 1989; Koenig & Foo, 1992; Park, 1986). Even in countries such as China, South Korea, and
Indian states such as Punjab, where son preference is still frequent, fertility has declined
dramatically. This may be due to the fact that the forces of changed socioeconomic conditions
rapidly affected patterns of fertility and family planning (Okun, 1996).
There is widespread agreement among scholars and policy-makers that Western societies
have been experiencing primary changes in social and demographic aspects. Birth rates have
reached an all-time low throughout the industrialized world, with many European countries now
experiencing levels of fertility that are below replacement (Alwin, 1996). The single, most
notable demographic aspect of Western societies is the low fertility level. The TFR in the U.S. is
2.10. While fertility levels are low in this region, differences exist across Western countries. In
2005 and 2006, the TFR was 1.98 in France, Sweden, and Denmark, while Australia, Finland,
United Kingdom, Belgium, Netherlands, Canada, Switzerland, Portugal, Bulgaria, Austria, Italy,
Hungary, Spain, Germany, Russia, and Japan maintained a total fertility rate of between 1.81 and
1.25 births per female national (Preston & Hartnett, 2008).
The impact of gender preference, economic, and education forces on fertility in Western
societies is also documented in several studies. Ben-Porath and Welch (1978) find that gender
preferences have a statistically significant effect on fertility, and in U. S. data there is a U-shaped
relationship between the tendency to have more children and the ratio of boys to total children.
They interpret this relationship as evidence that parents have a taste for balance in the gender
composition of their children, rather than a difference in the economic costs and benefits of boys
and girls, which would suggest a monotonic relationship. In accordance with these findings,
Hank & Kohler (2000), Sloane & Lee (1983), Yamaguchi & Ferguson (1995), and Teachman &
Schollaert (1989) showed that a preference for balanced gender composition is found in the
29
parity progression data in many Western countries. Parents with same-gender children are more
likely to have an additional child. Consistent with these findings, evidence from Nordic countries
indicated that parents with same-gender children are more likely to have a third child. In
Sweden, Denmark, and Norway parents are more likely to have a third child if the first two
children are boys, while in Finland, parents are more likely to have a third child if the first two
children are girls. This means Danish, Norwegian, and Swedish parents prefer having a daughter,
whereas Finns display a noteworthy preference for having a son (Andersson, et al., 2006).
However, the very large samples in U.S. Census data reveal a small degree of boy preference.
Women with two girls are 2.4 percent more likely to go on to have a third child (Dahl & Moretti,
2004). One possible (but untested) interpretation of these cross-country differences in child
gender preferences effects on parity progression attributes them to differences in the relative
bargaining power of men and women. If women have a stronger preference for at least one
daughter than do their partners (and vice versa), then we may see obvious daughter preference in
data from countries in which women have relatively greater influence on fertility decisions
(Lundberg, 2005).
While some studies showed an effect of gender preferences on a couple‘s reproductive
behavior and ultimate family size, others have found no impact of gender preferences on ultimate
family size (Ayala & Falk, 1971; Repetto, 1972), and that decisions about fertility are more
likely to derive from socioeconomic considerations (Repetto, 1972; Hoffman, 1975). Preston and
Hartnett (2008) in their study about the major social and demographic forces influencing
American fertility levels, found that increases in the educational attainment and higher relative
wages for women was expected to affect fertility levels. In agreement with these results, Billari
and Philipov (2004), and Jones and Tertilt (2006) found that women‘s educational attainment is

30
negatively associated with fertility in many societies, including historically, in the U.S.
Prominent interpretations of this negative relationship are that better-educated women have
better access to contraceptives. In addition, the increase in the female labor force has been found
to have an inverse relationship with fertility level. Fertility levels will fall as female labor force
participation rates rise because of the difficulties of accommodating the demands of child rearing
to the requisites of employment (Cramer, 1980; Bettio & Villa, 1998; Rindfuss, et al., 2000;
Waite & Stolzenberg, 1976; Smith-Lovin & Tickameyer, 1978).
In reviewed studies, the relationship between son preference and fertility is confounded
by the observation that the link is weak in both high-fertility and low-fertility populations. In
high-fertility societies, most couples continue to have children regardless of the number of sons
and daughters they already have. In low-fertility societies, the influence of son preference is also
weak because few couples want to have more than one or two children even if they do not
achieve their ideal number of sons and daughters (Arnold & Roy, 1997).
2.2.4 Parental involvement with children
In recent years, social science research in the United States and other developed
countries has focused increasingly on parental involvement and emphasized its importance to
children. Increased parental involvement may contribute to children‘s overall development, their
economic outcomes in adult life, and improvements in a family‘s overall well being (Aldous,
Mulligan, & Bjarnason, 1998; Lundberg, 2006).
Several studies that investigated the relationship between parental involvement and
children‘s overall development argued that high levels of parental involvement and a close
father-child bond play an important role in the social, emotional health, and intellectual
development of children (Aldous, Mulligan, & Bjarnason, 1998; Almeida, Wethington, &

31
McDonald, 2001; Sayer, Gauthier, & Furstenberg, 2004; Lamb, 1987; Acock & Demo, 1994;
Dornbusch, 1989; Jessor & Jessor, 1977; Steinberg & Silverberg, 1986). Increased paternal
interaction with children is a crucial factor that promotes children's healthy development (Parke,
1996), creates greater satisfaction with parenting, and enhances closeness to the child (Russell,
1982; Sagi, 1982). Children with highly involved parents are found to develop better self-
confidence, self-esteem, verbal intelligence (Deutsch, Servis, & Payne, 2001; Easterbrooks &
Goldberg, 1984), and higher scores on measures of psychological and social competence
compared to those who do not experience such close relationships (Lamb, 1997; Lamborn,
Mounts, Steinberg, & Dorbusch, 1991; Almeida, Wethington, & McDonald, 2001). Moreover,
parental involvement in children‘s school activities, such as attending parent-teacher
conferences, monitoring children‘s progress, and helping with homework are found to be
positively associated with children‘s academic success (Baker & Stevenson, 1986; Steinberg,
Lamborn, et al., 1992; Stevenson & Baker, 1987). In contrast, other research suggests a
minimum impact of fathers beyond contribution to the economic well-being of the family
(Crockett, Eggebeen, & Hawkins, 1993; Kandel, 1990; Peterson & Zill, 1986), and that mothers
still shoulder the lion‘s share of parenting by managing, supervising, and organizing childrearing
activities (LaRossa, 1988).
Sociologists and developmental psychologists have long recognized that parental
involvement with children varies according to certain characteristics of children and parents.
Pleck (1997) reviewed studies of parental involvement by the child‘s versus parents‘
characteristics and noted a rather complex picture. Existing research reveals that parental
involvement with children varies by a child‘s gender, gender composition, child‘s age, and the
number of children in the household. Time-allocation data from the U.S. shows that men spend
32
more time with sons and women spend more time with daughters (Bryant & Zick, 1996;
McHale, Crouter, & Tucker, 1999; McHale & Updegraff, 2000; Yeung, 2001). Recent data from
the Fragile Families and Child Well-being Study further examined the impact of children‘s
gender on the involvement of both married and unmarried fathers with their sons and daughters
one year after the child‘s birth. The study indicated that both unmarried and married fathers
engage in significantly more caretaking of sons than daughters in activities, such as diapering,
feeding, and playing. Mothers‘ reported interactions with one-year-old sons and daughters, on
the other hand, are basically equal (Lundberg, McLanahan, & Rose, 2007).
Tucker (2003) in his investigation of two-parent families with two adolescent siblings
furthermore viewed that mothers spent more time with daughters than with sons and that fathers
spent more time with sons than with daughters. Yet, both mothers and fathers feel just as much
affection for adolescent daughters as for sons. However, Starrels (1994) found that although
mothers report being just as close to their sons as to their daughters, fathers report a greater
emotional attachment and closeness to their sons than to their daughters. To some degree, these
patterns reveal greater parental involvement with same-sex children. Nevertheless, Hofferth
(2003), Sandberg & Hofferth (2001), Hossain & Roopnarine (1993), Sanderson & Thompson
(2002), and Snarey (1993) found that a child‘s gender had no effect on fathers‘ total engagement
time with children.
Evidence from the 1987–1988 National Survey of Families and Households found that
children‘s gender composition, such as all boys or a fraction of boys, positively affects the
frequency of fathers‘ activities with their children (Cooksey & Fondell, 1996; Marsiglio, 1991;
Wilcox, 2002; Zick et al., 2001). When all children in the family are boys, fathers spend more
time in solo interaction with their children than when a girl is present among the siblings (Barnett

33
& Baruch, 1987). Additionally, Fathers with sons are more involved with their children‘s
discipline, schoolwork, and other activities than are the fathers of daughters (Lamb, 1987;
Morgan, 1988). Harris and Morgan (1991) in their study about parental involvement with
adolescents, using the 1981 National Survey of Children, also found positive and significant
results of the influence of gender (being a boy) and of gender composition (number of boys) on
parental involvement. Children of both genders (mixed gender) receive greater attention from
their father when there is a son present in the family.
Research on the relationship between age of the child and parental involvement has been
mixed. Several studies found that lower level of parental involvement, in absolute terms, with
older children (Barnett & Baruch, 1987; Marsiglio, 1991; Pleck, 1985; Yeung, 2001). However,
Anderson (2003) and Aldus (1998) found greater father involvement with sons compared to
daughters when children are older than five years. Yet, Cooksey (1996) indicated that the
presence of young children in the household tended to reduce a father‘s involvement for all
activities. Similarly, mixed findings were evident regarding the impact of number of children.
Yeung (2001), Marsiglio (1991), and Gauthier et al. (2004) found that the number of children
associates negatively with parental involvement with children. In contrast, Milkie et al. (2004),
Sayer, Bianchi et al. (2004), and Nock & Kingston (1988) pointed out that the number of
children has a positive relationship with mothers‘ investment of time.
Parents may gender-type their time investment in children because they think that fathers
have particular knowledge to share with sons while mothers need more time with daughters in
order to properly model motherhood and foster female behavior in their daughters. Also, there
may be a greater similarity of interests between the genders. Children themselves may contribute
to this process by seeking out the parent they feel is most gender suitable for the activity they
34
want to do. For instance, boys may be more likely to approach their father than their mother
when they want something they see as masculine, and girls may be more likely to approach their
mothers to fulfill needs such as the desire to go shopping (Raley & Bianchi, 2006). Furthermore,
Lundberg (2006) noted several factors that might influence parents to gender-type their time
investment in children. Same gender parents and children may more easily develop a unity of
interests. Parents may believe that boys, more than girls, need fathers as role models. This may
affect the amount of interaction between fathers and sons versus the time between fathers and
daughters. In fact, most research on parents‘ time with children showed that mothers do not
spend more extensive amounts of time with daughters than with sons (Brody & Steelman, 1985;
Crouter, 1993; Siegal, 1987; Raley & Bianchi, 2006). This is due to the fact that mothers spend
much more time engaged in childrearing than fathers and are usually responsible for meeting the
day-to-day needs of their children such as ensuring that children are dressed, fed, bathed, etc.
(Raley & Bianchi, 2006). Fathers are more likely to focus on breadwinning as their primary
parenting role (Townsend, 2002).
Even though the majority of research found that, overall, fathers spend more time with
sons than with daughters (Bryant & Zick, 1996; Yeung, 2001; Lamb, 1987; Morgan, 1988;
Tucker, 2003; Hofferth & Anderson, 2003), other research proposes that parental time
investment in children can vary according to certain parental characteristics. Parental education
was positively associated with the amount of time parents spent with children. Parents with more
education invested more time and did more enriching activities with their children than less
educated parents. Highly educated mothers were more positively engaged and invested more
time in children than less educated mothers did (Sayer, Bianchi, & Robinson, 2004; Hill &
Stafford, 1974, 1985; Leibowitz, 1974, 1977). Research emphasizes this by showing a positive

35
relationship between a mother's education and her child's achievement of cognitive skills
(Moorehouse, 1991; Mumane, May-nard, & Ohls, 1981; Bogenschneider, 1997). However, other
research reports no such association between mothers‘ education and time with children
(Sandberg & Hofferth, 2001). For fathers, several studies indicate that paternal education is
positively related to children‘s time with their father (Aldous, et al., 1998; Marsiglio, 1991;
Yeung, et al., 2001), especially in playing, reading, or going on outings. These results suggest
that parents with a higher level of education, in particular college-educated parents, may perceive
greater benefits from spending time caring for their children. They are thought to be more aware
of the importance of the investment of time in cultivating children‘s human and social capital,
and more strongly motivated to conform to the norms of involved parenting (Coleman, 1988;
Daly, 2001; Kitterod, 2002).
Employment and work hours, on the other hand, may have a negative association with the
amount of time parents spend with their children (Bryant & Zick, 1996a, 1996b; Nock &
Kingston, 1988; Robinson & Godbey, 1999), but the effects of employment are much stronger
for mothers than fathers (Coltrane, 2000; Shelton & John, 1996). Fathers who work longer hours
are less involved in engagement activities with their children (Blair, Wenk, & Hardesty, 1994;
Marsiglio, 1991; Cooksey, 1996; Muller & Kerbow, 1993; Freese & Powell, 1999) and fun
activities, such as visiting, chatting, and being entertained (Nock & Kingston, 1988). Data from
time-diary studies investigated the relationship between mothers‘ employment and parental time
spent in the direct care of children and found that employed mothers spent less time in physical
and nonphysical family care (Bryant & Zick, 1993; Dolan & Scannell, 1987; Gershuny &
Robinson, 1988; Hill & Stafford, 1985; Sanik, 1981; Walker & Woods, 1976). The negative
effect of mothers‘ employment on caring for children is also well documented (Kendig &

36
Bianchi, 2008; Bainchi, et al., 2006; Gauthier, et al., 2004; Milkie, et al., 2004; Aldous et al.,
1998; Coverman, 1985; Coverman and Sheley, 1986; Marsiglio, 1991). Mothers‘ work and
wages, in contrast, do not have the same impact (Yeung, 2001; Marsiglio, 1991). Other studies,
in contrast, found that mothers‘ employment is associated positively with time investment in
children (Bryant & Zick, 1996; Zick, Braynt, & Osterbacka, 2001). Hass (1988) further found
that parents with higher incomes engaged in less physical care. However, in a study of black
married parents with children ages 3-5, Ahmeduzzaman & Roopnarine (1992) concluded that
parents with a higher income had more positive engagement with their children. Similarly,
Cooksey (1996), Muller & Kerbow (1993), Freese & Powell (1999), and Bryant & Zick (1996)
found that income is positively related to the time that parents spend with their children. The age
of fathers was found to have a negative association with the amount of time fathers spend with
their children, especially in personal care and play/companionship activities. Mothers‘ age was
also found to have a negative relationship with time invested in children (Sayer, Bianchi, et al.,
2004; Sayer, Gauthier, et al., 2004; Zick & Bianchi, 1996). However, age was found to have a
positive association with the amount of time mothers spend with their children (Powell,
Steelman, & Carini, 2006), or was not statistically significant (Sandberg & Hofferth, 2001).
Gender ideologies represent what individuals view as appropriate roles for men and
women, which in turn affect their own behavior (McHale & Huston, 1984) as demonstrated by
how husbands with egalitarian beliefs do more housework than those with traditional views
(Coltrane & Ishii-Kuntz, 1992). Parents who have egalitarian gender role attitudes are more
likely to play an active role in parenting, including engagement activities. Deutsch et al. (1993)
and Bulanda (2004) offer support for the notion that a father's nontraditional gender ideology
predicts greater paternal involvement than traditional fathers do. However, Bulanda (2004) found
37
that the gender ideology of the mother is not associated with the breadth of paternal involvement
with children. On the other hand, Marsiglio (1991) found that gender role attitudes were seldom,
if ever, related to various models of fathers' engagement activities with their children.
Other studies concerning the types of activities in which parents are involved are more
consistent. In examining trends in parental use of time, existing research studies concluded that
most of the time men spent with their children was in the form of interactive activities, such as
play/companionship activities or helping with homework, rather than in the ―custodial‖ cleaning
and feeding that are the mother‘s domains (Robinson and Godbey, 1997), and overall, fathers
spent more time engaged in activities with boys (Hofferth & Anderson, 2003). Data from time-
diary studies that examined the association of parental time spent in the physical and nonphysical
care of children further found that mothers spend significantly more time in direct physical and
nonphysical care. However, fathers spend more time with their boys than girls in play activities,
and married fathers with sons spend more time in shared leisure family activities than do fathers
with daughters (Yeung, 2001; Zick & Bryant, 1996; Gershuny & Robinson, 1988; Kooreman &
Kapteyn, 1987; Sanik, 1981; Walker & Woods, 1976; Bonney, Kelley, & Levant, 1999; Bryant
& Zick, 1996, Katzev, 1994; Fish, New, & van Cleave, 1992;). Marsiglio (1991) further found
that fathers are more likely to take children on outings and are more involved in leisure activities
such as playing, doing projects, and talking with children when the children are boys.
Studies conducted in the 1980s and 1990s, focusing on the involvement of fathers relative
to that of mothers found that the relative engagement of fathers was more than two-fifths of that
of mothers (43.5%), and fathers‘ accessibility was nearly two-thirds that of mothers (65.6%)
Pleck, 1997). Comparing these figures with estimates averaging across studies in the 1970s and
in the1980s, Pleck concluded that there has been a clear increase in paternal involvement over

38
the past three decades. Other studies further indicated that fathers have a higher level of
involvement relative to that of mothers (Yeung, et al., 2001) and have an engagement ratio of
0.45 and accessibility ratio of 0.43 in two parent families with school age daughters (Levant,
Slattery, & Loiselle ,1987). Estimates in McBride and Mill‘s study (1993), based on a middle-
class sample, and representing an extreme high end in the literature, showed that fathers had an
engagement and accessibility level of about 83% and mothers had levels of about 82%. In
contrast, other studies reported that mothers continue to invest considerably more time in
childcare tasks than fathers do (Ahmeduzzaman & Roopnarine, 1992; Aldous et al., 1998; Bryant
& Zick, 1996; Bittman, 1999; Gauthier et al., 2001; Sayer, Bianchi, & Robinson, 2004).
Although previous research on parental involvement with children showed that parents‘
time investment with children varies according to the gender of the child, some studies argued
that fathers are becoming more egalitarian in their time investment with their children. As
suggested by Morgan & Pollard (2002), parents and children face increased social pressure to
adopt more equal roles, and pressure in support of traditional gender behavior is gradually
breaking down. Women have entered occupations that were for a long time held by men, the
wage gap has narrowed, and men are assuming a greater share of the household work (Bianchi,
2000; Bianchi & Spain, 1996).
From reviewed studies, it is clear that in many ways parents tend to treat sons and
daughters differently. This differential treatment may be due, in part, to stereotypes that parents
hold about what is appropriate behavior for a child of a given gender, or to different aspirations
they have with regard to what they want the child to become (Maccoby, 2003).
2.2.5 Children’s Participation in Household Work

39
For several decades, research concerning the division of household labor focused only on
the gendered allocation of adult household work, while ignoring children‘s contributions. A
considerable body of literature describes and theorizes about the differences between husbands
and wives in relation to household labor and the continuing inequality of the domestic division of
labor despite women‘s increased participation in paid employment (Baxter & Western, 1998;
Brines, 1994; Gill, 1993; Gregson & Lowe, 1993; Layte, 1993; Lennon, 1994; Seymour, 1992;
Speakman & Marchington, 1999; Warde & Hetherington, 1993). Following a lack of attention in
the literature, children‘s contribution to the household work has recently become the focus of a
number of investigations (e.g., Gager & Sanchez , 2004; Bianchi & Robinson, 1997; Blair,
1992a, b; Peters & Haldeman, 1987; Brody & Steelman, 1985; Lamb & Sutton-Smith, 1982;
Cogle & Tasker, 1982; White & Brinkerhoff, 1981). There are an increasing number of recent
studies that are starting to focus on the amount of household labor and the contributions children
make to family. Children have been shown to consistently perform chores within the home
(Cogle & Tasker, 1982) and represent a significant portion of total amount of labor performed by
all persons within the household (Blair, 1992a, b; Peters & Haldeman, 1987). Yet, the overall
amount and kinds of work they do vary according to certain characteristics of children and
parents.
Studies have shown that gender typing occurs in the allocation of household work for
children (Raley & Bianchi, 2006; Blair, 1992; Cogle & Tasker, 1982; White & Brinkerhoff,
1981). In the time-diary studies examining the household tasks that children actually perform,
not just what they are assigned, both Bianchi & Robinson (1997) and Gager & Sanchez (2004)
suggest that overall, girls do more household labor than boys. Differentiation by gender in
housework persists even among highly educated parents who pledge their allegiance to
40
egalitarian gender ideology (Gager & Sanchez, 2004). Timmer, Eccles, & O‘ Brien (1985) found
that teenage girls (ages 12-17) spent twice as much time as teenage boys on household work
during weekdays. On weekends, girls spent almost three times as much time performing
household labor. Berk and Berk (1978) also found that in households where there are female
children between the ages of 16 and 20, children‘s proportion of household labor is higher than
in households with younger children (Bird & Ratcliff, 1990), but that having boys between 16
and 20 is not associated with any increase in children‘s housework time. Other studies further
suggest that girls are more likely to participate in household labor and/or spend more time on
housework than boys (Blair, 1992b; Bloch, 1987; McHale et al., 1990), especially among
adolescents (White & Brinkerhoff, 1981), adult children (Spitze & Ward, 1995) or when sibling
groups are of mixed genders (Brody & Steelman, 1985). Tucker et al., (2003), however, in their
examination of parents in married-couple families, indicated that parents assign household tasks
for adolescent sons and daughters evenly.
Children are allocated chores differently by gender in terms of both the amount and kinds
of work they do. Boys generally do the outdoor jobs, such as taking out the trash and household
repairs, whereas girls are typically assigned indoor activities, such as washing the dishes and
cooking. In addition, girls devote more time to such activities than do boys (White &
Brinkerhoff, 1981; Gager, 1999; McHale, 1990), and even among adult children who live with
their parents, sons do less housework than daughters (Ward & Spitze, 1996). Brody & Steelman,
1985, in their examination of married parents‘ assignments of their children‘s work, found that
more daughters are associated with more gender typing in household activities (i.e., with
traditionally feminine work such as cooking, washing dishes, shopping, food preparation, and
vacuuming). Indeed, what children do in the home is suggestive of early socialization in the
41
gender-specialized housework and caregiving that characterizes adulthood (South & Sitze, 1994;
Raley & Bianchi, 2006).
This gender segregated pattern corresponds closely to the division of responsibilities
commonly observed among adults (Blair, 1992a, b; Burns & Homel, 1989; Cogle & Tasker,
1982; White & Brinkerhoff, 1981; Zill & Peterson, 1982). That is, women are more likely to
perform greater total amounts of household work and perform qualitatively different types of
household chores. Lawrence & Wozniak (1987) reported that girls do significantly more labor
than boys do, with girls averaging 77 minutes per day in total household work, as compared to an
average of 55 minutes per day among boys. Girls were also found to spend more time than boys
in household activities, such as housecleaning, shopping, food preparation, dishwashing, clothing
care, and clothing construction, while boys spend more time in outdoor household activities,
such as maintenance of the house and yard work (Lawrence & Wozniak,1987). Such results have
been confirmed by other studies (Cogle & Tasker, 1982; Munroe et al., 1983; Oldham, 1979;
Whiting & Whiting, 1975). However, Hilton & Haldeman (1991), Gager, Coony, & Call (1999),
and Dodson & Dickert (2004) found that children‘s household labor is less gender segregated
than that of adults.
The extent to which the gender typing of children‘s household chores is endorsed also
seems to vary by age, number of children, and several parental characteristics. Cogle and Tasker
(1982) found that the age of children has a strong effect on the extent of gender typing in their
household chores. Young children (aged 6-11) were less likely to occupy gender-typed tasks than
were older children. This trend, in particular, tends to be stronger among girls than among boys.
White & Brinkerhoff (1981) reported similar findings; between the ages of 6 and 9, 33% of boys
and 61% of girls assisted their parents in meal preparation. Between the ages of 14 and 17, only

42
22% of boys versus 72% of girls performed kitchen-oriented chores. Blair (1992a, b) also found
that the age of daughters is strongly associated with performing household chores. As daughters
increase in age, they do more total labor, contribute a greater percentage of all labor in the home,
and spend more time in female-dominated chores. As with daughters, sons take on greater total
amounts of household work as they age but to a lesser degree. In addition, the number of
children in a household was found to be associated with children‘s labor time. White and
Brinkerhoff (1981) examined the effects of the number of children and to the degree at which
children's tasks were differentiated by gender. They found that the larger the numbers of siblings,
the more ―feminine‖ were the task assignments of both boys and girls, resulting in a constant
gender difference across varying sizes of sibling groups. Bianchi & Robinson (1997) report a
positive relationship between the number of siblings in a family and the time a child spends on
household chores. The same findings were reported by Blair (1992a), who also found that the
number of children in the family is one of the strongest predictors of children‘s labor time. Brody
& Steelman (1985) found the opposite; namely, that the number of children did not have a
significant effect on children‘s household work.
Women‘s paid work hours are positively associated with children‘s proportional share of
housework in dual earner households or with daughters‘ time spent on housework, perhaps
partially accounting for the weak association between women‘s employment and husbands‘
household labor time (Blair, 1992a, b). Benin & Edwards (1990) reported that boys in dual
earner families, with mothers who are employed full-time, spend less time on housework than do
boys in single-earner families, although the opposite is true for girls. These conclusions have
been found by other studies (Hedges & Barnett, 1972; Rubin, 1983; Cogle & Tasker, 1982;
White & Brinkerhoff, 1981). However, Peters and Haldman (1987) found that the employment
43
of the adults in the home actually has no significant relationship to the amount of labor spent by
children on specific tasks, but they found that employment of adults in the family does lead to an
increase in the children‘s share of the total workload in the household. Further, Gager, Coony,
and Call (1999) found that mother‘s employment status does not predict time spent on household
chores by teens.
Level of parent‘s education is inversely associated with the acceptance of a traditional
gender-typed division of labor for children (Blair, 1992b; Duncan & Duncan, 1978; White &
Brinkerhoff, 1981). That is, parents with a high level of education were less likely to support a
gender-typed division of chores for their children, favoring instead a more egalitarian allocation
of tasks, whereas parents with low educational attainment were more likely to prefer traditional
segregation of chores by gender of children. Nevertheless, parental education was not predictive
of the amount of time children spend doing household chores (Cogle & Tasker, 1982; Bianchi &
Robinson, 1997; Blair, 1992a). Older parents, and those who express traditional gender role
attitudes, are more prone to agree with the strict gender typing of children‘s tasks than are their
opposites (Duncan & Duncan, 1978; White & Brinkerhoff, 1981; Blair, 1992b). In addition,
parental income and respondent‘s gender were not predictive of the amount of time children
spend doing household chores (Cogle & Tasker, 1982; Bianchi & Robinson, 1997; Blair, 1992a;
White & Brinkerhoff, 1981).
2.2.6 Marital quality and gender of the child
To date, researchers have not completely fleshed out potential effects of the gender of
children on marital relationships. Existing evidence shows the association between the gender of
children and their parents‘ marriage extends to parents‘ reports of happiness and satisfaction
within marriages. When married couples transition to parenthood, they are more likely to report
44
being satisfied with their marriage and to report positive marital interactions following the birth
of a son compared with the birth of a daughter, although these gender-of-child differences are
small (Raley & Bianchi, 2006;White & Brinkerhoff, 1981).
The birth of a son, relative to a daughter, increases both the quality and stability of
marriage (Lundberg, 2007, 2003). Parents with sons report higher levels of marital satisfaction
and happiness than do parents who have only daughters (Barnett & Baruch, 1987; Katzev,
Warner, & Acock, 1994; Cox et al., 1999; Mizell & Steelman, 2000; Lundberg, 2007, 2003). A
study done by Kohler et al. (2005) investigated the contributions of partnerships and children to
subjective well-being or happiness. A sample of Danish twins found that the birth of a first child
increases reported happiness, and that men enjoy an almost 75% larger happiness gain from a
first-born son than from a first-born daughter. The presence of boys in the family also increases
the likelihood that a marriage will remain intact (Spanier & Glick, 1981; Morgan, Lye, &
Condran, 1988; Heaton & Albrecht, 1991; Mott, 1994; Katzev et al., 1994). This may be because
boys continue to be more valued in society. Mothers with sons may feel more satisfied in their
marriage and hence be less disposed to consider separation from their spouse.
Having all boys is associated with higher levels of happiness and satisfaction than having
more daughters than sons or having an equal number of sons and daughters (Dahl & Moretti,
2004, Mizell & Steelman, 2000, Raley & Bianchi, 2006). If the presence of (all) sons invites
active involvement from fathers, this may make mothers happier (Raley & Bianchi, 2006).
According to Katzev et al. (1994), mothers perceived fewer disadvantages in their marital
relationships when they had sons, and this was associated with fathers‘ engagement with
children. Yet, Mizell and Steelman (2000) did not find that paternal involvement mediated the
association between sons and marital happiness. Instead, they suggest that mothers may enjoy
45
the attention or status as the lone female in a family of boys. On the other hand, some researchers
have found higher marital satisfaction and happiness among wives with daughters compared to
wives with sons (Abbott & Brody, 1985). Girls have been found to help their mothers in the
hardships of domestic life more than boys do (Brody & Steelman, 1985).
Even though the majority of research found that the presence of a son, relative to a
daughter, in the family increases the levels of marital satisfaction and happiness, other research
proposes that marital quality will vary according to certain factors such as children and parent
characteristics, fathers‘ level of involvement with children, and gender role attitudes. Folk
wisdom suggests that babies bring couples closer together, and some couples claim greater
closeness as a reason for having a baby (Brinley, 1991). Unfortunately, some researchers suggest
that couples became less satisfied with their marriage relationship after having children (Belsky
& Pensky, 1988). The number of children was found to be inversely related to marital
satisfaction. People with more children report greater marital dissatisfaction than people with
fewer children (Twenge, Campbell, & Foster, 2003). The increasing of the family size may
decrease the amount of time or opportunity spouses have to do things together and in turn affect
marriage relationships (Feldman, 1981; Houseknecht, 1975; Luckey & Bain, 1970). In addition,
children are expensive and can place significant stress on family finances, which in turn may
lead to dissatisfaction with the marriage (Twenge, Campbell, & Foster, 2003). In fact, children
have the paradoxical effect of increasing the stability of marriage, at least when the children are
relatively young, while decreasing its quality (Belsky, 1990; Waite & Lillard, 1991). Others may
argue that children will have no effect on marriage quality (Marini, 1980; Aldous & Ganey,
1999). The age of a child was also found to affect marriage satisfaction. Several studies showed
that the presence of young children is associated with decreased marital satisfaction of wives
46
(Glenn & McLanahan, 1982; Houseknecht, 1979; Ryder, 1973; Sollie & Miller, 1980). In studies
comparing parents with non-parents, mothers of infants are significantly more dissatisfied with
their marriages than men with infants as are men with older children and women with older
children (Twenge, Campbell, & Foster, 2003).
In every society, age is a socially standardized and evaluated category. In our society,
youth is generally evaluated higher than old age, while persons in the middle age categories are
most involved in work and family. Several studies have shown that the relation of happiness to
age is u-shaped: the younger, but also the older people tend to be happier (Michalos, Hubley,
Zumbo, & Hemingway, 2001; Hayo & Seifert, 2003; Christoph & Noll, 2003; Haller & Hadler,
2006).
In studies of the relation between marriage happiness and gender differences, women are
favored. The results from such studies have shown that women appear to be generally happier
than men (Wood, Rhodes, & Whelan, 1989; Aldous & Ganey, 1999). Other factors may also
contribute to marriage happiness, such as income and education. The more one has in terms of
such characteristics as income and education, the happier one supposedly will be (Aldous &
Ganey, 1999; Kohler, Behrman, & Skytthe, 2005).
Studies of the effect of child gender on marriage and divorce have suggested a positive
relationship between paternal involvement and marital satisfaction and stability. When fathers
participate more in family activities, including childcare, mothers perceive less disadvantage in
their marital relationship and are more satisfied (Blair & Johnson, 1992). Paternal involvement in
parenting can be related to marital satisfaction and stability in two ways. First, if fathers are more
involved with sons than with daughters (perhaps because fathers play a crucial role in the
emotional and social development of boys), then having a son increases marital surplus, or the
47
value of marriage relative to single parenthood. Second, fathers may simply place a higher value
on marriage and family if they have a son (Lunderberg, 2003; Kalmun, 1999; Amato & Booth,
1997; Katzev et al., 1994; Harris & Morgan, 1991; Marsiglio, 1991).
Measures reflecting gender ideology, especially attitudes toward women‘s employment
and child rearing, have been found to be associated with both marital quality and marital stability
(Amato & Booth, 1997; Sayer & Bianchi, 2000). A number of studies have found that gender
ideology is related to marriage quality. Amato & Booth (1997), Davis and Greenstein (2009),
and Mickelson et al. (2006), for instance, showed that nontraditional wives tended to report
lower levels of marital quality, whereas nontraditional men tended to report higher levels.
When partners hold more nontraditional attitudes regarding marriage, family, and gender
relations, marriages are less likely to be stable and satisfying (Heaton & Albrecht, 1991; Lye &
Biblarz, 1993). In a study of American married couples, Greenstein (1996) found that the effects
of perceptions of inequity on reported marital quality were much stronger for nontraditional
wives than for traditional wives. Lavee & Katz (2002) noted similar findings with a sample of
Israeli couples. Holding nontraditional attitudes about marriage and family relations decreases
marital satisfaction because these attitudes place an equal or greater emphasis on individual
satisfaction as compared to the value of maintaining relationships in the face of personal costs
(Lueptow, Guss, & Hyden, 1989; Lye & Biblarz, 1993). Blair (1993) and Xu & Lai (2004)
however, found no direct effects of gender ideology on marital quality.
2.3 Summary
The reviewed literature suggests that the gender of children has an influence on family
processes, and especially has implications for the ways in which parents spend time with,
allocate household work, and marriage relations as well as their fertility behavior. Although
48
some of the evidence is questionable, boys, on average, do less housework than girls, have more
engaged and committed fathers, and have parents with greater marital happiness. Variations in
the results are easily noticeable in the literature and this might be due to the variation in the
samples, the measurements, and the method design. For example, although the United States is
far from having the kind of son preference observed in developing countries, a few studies
indicated that there is still some kind of gender preference.
Although the innovative ways in which the gender of child has been analyzed in family
research have advanced our conceptualizations of gender, children, and family, the social science
research is packed with a number of evocative relationships, but the pathways through which the
gender of a child affects various family outcomes are not yet well understood (Raley & Bianchi,
2006). Further, much of the research addressed parental involvement with children in terms of its
quantity rather than its quality, which in turn necessitates developing a measure that represents
both the quantity and quality of the relationship between parents and children. Even so, there is
not a noteworthy body of literature investigating the influence of a child‘s gender on Arab-
American family dynamics. This factor illustrates the lack of information/knowledge on this
topic and the need for future research in order to fill the research gaps on the influence of gender
in Arab-American family dynamics.
2.4 Theoretical Framework
Sociologists approach the study of gender differences in society in various ways. Some
use a macro view which focuses on the large social forces that influence people. Others take a
micro view, focusing on the specific social situations in which people interact with one another.
For this study Structural Functionalism and Symbolic Interaction theories are used to help
explain gender roles and differences in Arab-American families. Symbolic Interaction theory

49
guided this study while Structural Functionalism was used as an explanatory framework to
support the foundation for the study.
2.4.1 Symbolic Interaction Theory
Symbolic interaction is one of the major theoretical perspectives in sociology. This
theory traces its roots to George Herbert Mead , Charles Cooley, and Herbert Blumer, and others
(Wallace & Wolf, 2006). Representing the micro level perspective, symbolic interactionism
focuses on face-to-face interaction, and how people define and construct personal reality (Ritzer
& Goodman, 2006; Wallace & Wolf, 2006). Herbert Blumer (1969) coined the term symbolic
interaction to refer to the process of interpersonal interaction. He set out three basic premises of
the perspective:
1. "Humans act toward things on the basis of the meanings that the things have for them"
2. "The meaning of things arises out of the social interaction that one has with fellows."
3. "These meanings are handled in and modified through an interpretative process used by
the person in dealing with the things he encounters." (Wallace & Wolf, 2006, p 217-219).
According to this perspective, people live in a symbolic world where they assign meaning
to each other‘s words and actions. Consequent interaction is the subjective interpretation of these
meanings. Consequently, people do not respond directly to words and physical actions. Instead,
they respond to their own interpretations of them (Williams, Sawyer & Wahlstorm, 2009; Nelson
& Robinson, 2002; Renzetti & Curran, 2003). As sociologists William I. Thomas & Dorothy. S.
Thomas revealed, ―If people define situations as real, they are real in their consequences‖
(Thomas & Thomas, 1928, p 572).
50
Children learn their gender identity as a ‗boy‘ or ‗girl‘ and the meaning of gender-
appropriate behavior through interaction with others, especially parents. People try to act
according to their own internalized gender definition, which may be modified through
interactions and from situation to situation (Nelson & Robinson, 2002; Renzetti & Curran, 2003;
Ritzer & Goodman, 2006).
Several studies have shown that the gender of a child has an implication for parents‘
behavior from birth. Raley and Bianchi (2006) indicated that U.S. society is more likely to have
a mixed gender preference. Fathers are more involved with their sons than daughters are, and
mothers spend more time with daughters than sons. Overall, girls do more household labor than
boys do and parents are more likely to display gender-stereotype when allocating household to
children. The birth of a son, relative to a daughter, increases both the quality and stability of
marriage. In addition, gender preferences were found to have significant inferences for a
couple‘s fertility behavior and thus family size. One might assume that parents who want one or
more children of a certain gender may have larger families than would otherwise be the case.
Parents who fail to achieve a balanced number of daughters and sons (or at least one child of
each gender) by the time they reach the number of children planned, might tend to increase their
family size upward (Gray & Morrison, 1974).
Symbolic Interactionist researchers investigate how people create meaning during social
interaction, how they present and construct the self (or "identity"), and how they define situations
of co-presence with others. They determined that people act as they do because of how they
define their present situation (Renzetti & Curran, 2003). However, this perspective ignores the
influence of the large social structure on gender differences (Williams, Sawyer, & Wahlstorm,
2009).
51
2.4.2 Structural Functionalist Theory
Structural Functionalist Theory, a macro-level orientation, evolved from the work of
Emile Durkheim, though it was shaped by Harvard sociologist Talcott Parsons and others during
the mid-20th Century. According to the Functionalist perspective, society is composed of
interrelated parts, in which each part of society (the family, the school, the economy, and the
state) performs certain functions. If all goes well, the parts of society produce order, stability,
and productivity. If all does not go well, the parts of society must then adapt to recapture a new
order, stability, and productivity. For example, this perspective views the family as a social
institution that performs essential functions such as socialization, reproduction, economic
support, sex regulation, and emotional support (Williams, Sawyer, & Wahlstorm, 2009; White &
Klein, 2008; Ritzer & Goodman, 2006; Wallace & Wolf, 2006).
The Functionalist perspective achieved its greatest popularity among American
sociologists in the 1940s, 1950s, and 1960s. The leading proponent of the Structural
Functionalist perspective was sociologist Talcott Parsons, who held that in order to maintain the
stability of the family and society as a whole, there are two types of roles that must be fulfilled in
any group. One is an instrumental role, where the male is the breadwinner, hard working, self-
confident, and competitive. The other one is the expressive role, which the wife carries out and
includes nurturing and housekeeping tasks (Williams, Sawyer, & Wahlstorm, 2009; White &
Klein, 2008; Parsons & Bales, 1955).
Structural Functionalist perspective was further developed by Robert Merton who
expanded Parsons‘ understanding of structural functionalism by explaining not only the function
of social structures, but also their dysfunction. He pointed out that not all parts of a modern,
complex society work for the functional unity of society. Some institutions and structures may
52
have other functions, and some may even be generally dysfunctional, or be functional for some
while being dysfunctional for others (Williams, Sawyer, & Wahlstorm, 2009; Ritzer &
Goodman, 2006).
The Structural Functionalist Theory allows family relations to be examined in terms of
their positive functions for the family and society as a whole. Preferring one gender over the
other (i.e., boy over girl) or achieving balance of daughters and sons (or at least one child of each
gender) can provide economic, social, or psychological functions that contribute, in turn, to
family solidarity and increase marriage stability. Functionalist perspective suggests that the
participation of children in household tasks may also have important functional, integrative, and
developmental implications, both for the child and for the family. Mainly, it helps teaching
children to be responsible, independent, and prepared for paid work in the future. However, the
differential treatment based on gender of the child, such as being involved with one gender more
than the other or allocating the household work to children based on gender of the child might
also be dysfunctional, especially for girls who become disadvantaged, affecting their overall well
being. In addition, preferring boys over girls can also be dysfunctional for the family and society
in the long run. For example, if families want boys, they might impoverish themselves by having
a larger family size. Preference for boys over girls might result in gender imbalance in the future
(i.e., more men than women), which in turn could alter the structure of marriage in society, by
creating a lack of marriage partners. Research suggests this is apparently occurring in China
(Westley & Cho, 2007). Also, an increasing number of boys over girls can lead to concerns that a
shortage of women will make difficult for men to find wives in the future. This may lead men to
marry women from other groups or cultures. Further, a shortage of women in the long run—as a
53
result of boys‘ preference—might give women more power and thus more influence within the
family, such as making important decisions, or selecting the future marriage partner.
This theory has been criticized for overstressing stability and solidity; not focusing
enough on individuals‘ everyday interaction; and, for not providing a sound clarification for the
origin of gender role differentiation (Lindsey, 1990; Renzetti& Currant, 2003; Williams, Sawyer,
& Wahlstorm, 2009).
2.4.3 Research Hypotheses
According to Symbolic Interactionism Theory, we live in a world in which people assign
value and meaning to each other‘s words and actions and our interaction is determined by our
subjective interpretation of the action (Williams, Sawyer & Wahlstorm, 2009).Therefore, the
gender of the child is a symbol to which parents attach a meaning and act according to their
internalized definition. The literature review supports this point of view and indicates that the
gender of a child has implications for parental behavior. Gender preferences have significant
inferences for a couple‘s fertility and family size behavior (Gray & Morrison, 1974; Marleau &
Saucier, 1996, Arnold & Roy, 1997). In addition, having boys tends to increase marital stability
and marital satisfaction relative to girls (Raley & Bianchi, 2006; Dahl & Moretti, 2004); fathers
spend more time with, and are more involved with, sons rather than daughters (Raley & Bianchi,
2006; Tucker, 2003); and parents use sex-typing when allocating household work to their
children (Bianchi & Robinson, 1997; Gager & Sanchez, 2004; Gager, 1999). In addition, the
literature pointed out that other factors, including average age of children, number of children,
parents‘ gender and age, income, work status, education, age at marriage, place of birth, and
gender ideology, were significant predictors of family size, parental involvement with children,
54
allocating household duties to children, and marital quality. Those factors were used as control
variables in the current study.
Figure 1 presents the conceptual model and the hypothesized relationships between the
gender ratio, gender composition, and parental gender preferences regarding children and various
family dynamics. Four dependent variables were used: family size, parental involvement with
children, allocating household work, and marriage quality. The other variables in the model are
independent variables. They include gender preferences, gender ratio, and gender composition.
Based on the literature findings and the symbolic interaction theory‘s view, the following
hypotheses are proposed:
Hypothesis I
Parental gender preference regarding children and children‘s gender composition will
significantly predict Arab-American family size when holding constant parents‘ age, age at
marriage, gender, place of birth, income, work status, education, and gender ideology.
Specific Hypotheses
1. Parents with a strong boy preference are more likely to have a larger family size than
those with a girl preference, balanced preference or no preference.
2. Parents with same-gender children (all boys or all girls) are more likely to have a larger
family size than parents with mixed-gender children.
Hypothesis II
Gender ratio and gender composition of the children will significantly predict parental
involvement with children when holding constant parents‘ age, number of children, work status,
income, education, average ages of children, gender ideology, and place of birth.
Specific Hypotheses
55
1. Gender ratio significantly predicts parental involvement (behavioral involvement) with
children. As the number of boys relative to girls in the family increases, fathers‘
involvement with children relative to mothers‘ involvement will increase.
2. Gender ratio significantly predicts parental emotional involvement with children. As the
number of boys relative to girls in the family increases, fathers‘ emotional involvement
with children relative to mothers‘ involvement will increase.
3. As the number of boys relative to girls in the family increases, fathers‘ involvement with
children‘s interactive activities (e.g., leisure, play, school work, etc.) relative to mothers‘
involvement will increase.
4. As the number of boys to girls in the family increases, fathers‘ involvement in childcare
activities (e.g., changing diapers, bathing, feeding, etc.) with children relative to mothers‘
involvement will increase.
5. Of the three sibship gender compositions (e.g., all boys, all girls, or mixed), fathers with
only boys or mixed gender children are more likely to be involved (behavioral
involvement) with children‘s activities than fathers with all girls.
6. Of the three sibship gender compositions (e.g., all boys, all girls, or mixed), fathers with
only boys or mixed gender children are more likely to be emotionally involved with
children than fathers with all girls.
7. Fathers with only boys or mixed gender children are more likely to be involved in
interactive activities with children than fathers with all girls.
Hypothesis III
Gender ratio and gender composition of the children will significantly predict children‘s
participation in household chores when holding constant parents‘ age, number of children,

56
average ages of children, gender, work status, income, education, gender ideology, and place of
birth.
Specific Hypotheses
1. Boys are less likely than girls to do household chores.
2. Parents with mixed-gender children are more likely to use gender stereotyping when
assigning household work to children than parents with all boys or all girls.
3. Boys are less likely than girls to do indoor work (traditional female tasks).
4. Boys are more likely than girls to do outdoor work (traditional male tasks).
Hypothesis IV
Gender ratio, children‘s gender composition, and parental gender preference regarding children
will significantly predict marital quality when holding constant parents‘ age, number of children,
average ages of children, age at marriage, gender, work status, income, education, gender
ideology, and place of birth as well as level of fathers‘ involvement.
Specific Hypotheses
1. Boys are more likely than girls to boost marital quality. As the number of boys, relative
to girls, increases, marital quality will increase.
2. Of the three sibship gender compositions (e.g., all boys, all girls, mixed), parents with all
boys and mixed gender sibships are more likely to report positive marital quality than
parents with only girls sibships.
3. Gender preference will significantly predict marital quality. Parents with a strong boy
preference are more likely to report positive marital quality than parents with a girl
preference, balanced gender preference, or no preference.

57
Figure 1: Theoretical Model
KEY Dependent variables Family size Total number of children at home
Parental involvement Behavioral & emotional involvement
Allocating household work Doing indoor and outdoor household work Marriage quality ENRICH scale Independent variables Gender Ratio Actual proportion of boys to girls in the family Gender Preferences Boy’s preference, girl’s preference, Balance, or no difference
Gender composition The structure of gender in the family: All boys, all girls, or mixed
Gender
composition
Gender ratio
Marriage
quality Family size Parental
involvement
Allocating
household
work
Gender
Preference
KEY Dependent variables Family size Total number of children at home
Parental involvement Behavioral & emotional involvement
Allocating household work Indoor and outdoor household work
Marriage quality ENRICH scale
Independent variables Gender Ratio Actual proportion of boys to girls in the family Gender Preferences Boy’s preference, girl’s preference, Balance, or no difference
Gender composition The structure of gender in the family: All boys, all girls, or mixed
58
CHAPTER 3
Methodology
The purpose of this study is to assess the association between the gender of a child and
various Arab-American family dynamics. In particular, this study assessed the relationships
between gender ratio, gender composition, and parental gender preferences regarding their
children and family size, parental involvement with children, allocating household work to
children, and marital quality. Given the disparate findings associated with past empirical research
concerning the relationship between gender of the child and family dynamics, the following
question was investigated: What is the effect of a child‘s gender on Arab-American family
dynamics?
This chapter describes the research methodology used to achieve the research aim, and
addresses the research‘s main question. This includes a description of the research design,
sampling technique, measurements, instrument procedures, and statistical analyses and
techniques employed.
3.1 Design
A cross-sectional quantitative survey design with a convenience sample was used to
assess the relationship between gender ratio, gender composition, and parental gender
preferences regarding children and Arab-American family dynamics (family size, parental
involvement with children, allocating household work to children, and marital quality). Data
collection began November 10/ 2010 and ended February 25/ 2011.
59
3.2 Sample and Setting
In this study, the target population was Arab-American married parents (male or female)
who have at least two children under 18 years old living at home and who reside in Southeast
Michigan. Since the number of people who would meet these criteria was unknown, a
convenience sample of 200 parents was recruited to participate. To ensure participants would
meet the criteria for the study, they were pre-screened by the researcher. Targeted participants
were asked if they were Arab-American, married, had children under 18 years of age at home,
and resided in Southeast Michigan. Only the participants who met these criteria were included in
the study. Participants were recruited from a Community Center, an Islamic Center, a local social
Organization, an elementary school, and an Orthodox Church in Southeast Michigan. Parents
were asked to complete a survey about Arab-American family patterns.
3.3 Measurements
Dependent Variables
The primary dependent variable in this study was family dynamics. For the purpose of
this study, family dynamics is defined as family size, parental involvement with children,
allocating household chores to children, and marriage relationship quality.
Family size. Family size refers to the number of children living in the home, including natural,
adopted, and step-children. Family size was measured in this study with the following survey
questions: How many of the children (now living) were born to you and your spouse? How many
adopted children do you have? How many step-children do you have?
Parental involvement. Parental involvement represented both the quality and the quantity of
relationships between parents and children by capturing both emotional and behavioral levels of
involvement. The emotional level represented parents‘ level of closeness and affection in the
60
parent/child relationship. It reflected the affective quality of the relationship. It was measured
with the questions 29-30 and 41-42 in the survey (See Appendix D) .The formats of these
questions were adopted from Harris, Furstenberg, & Maramer‘s study (1998). From these
questions a single additive measure was used to measure emotional involvement with children.
The behavioral involvement was assessed in terms of the frequency with which parents spent
time in several types of activities with their children, such as interactive activities (play, leisure
activities, school work, etc) and childcare activities (changing diapers, bathing, feeding, etc).
It was constructed from respondents‘ responses to the questions 19-22, 24-25, 31-34, 36-37, 43-
44, 46-49, 51-54, 56-59, and 61-62 in the survey (See Appendix D) ¹. Responses to these
questions were on a 6-point Likert scale from (6) every day to (1) never. Then, an additive
measure was developed to represent parental behavioral involvement as a whole. In an attempt to
look at the types of involvement in activities with children, two separate additive measures were
developed. The interactive activities measure was developed by adding the responses from the
survey questions 19-22, 24-25, 31-34, and 36-37 (See Appendix D) and the childcare activities
measure was developed by adding the responses from the questions 43-44, 46- 49, and 51- 52 in
the survey (See Appendix D). These computed scales were later used in bivariate and
multivariate analyses.
__________________________
¹ More than 85% of participants do not currently have babies at home. Therefore, items that measure how much
participants are currently involved with babies in childcare activities (items 53-62 in the survey) were omitted from
the analysis. They also were not included in the additive composite measure of parental involvement with children.
For more information, see table 25.
61
Participation in household work: Participation in household work refers to unpaid work that
children (girls/boys) may be asked to do at home, including indoor and outdoor work. This
variable was measured with questions 63-78 in the survey (See Appendix D). Responses to these
questions were on a 6-point Likert scale from (6) every day to (1) never. Then, an additive
measure was developed by adding the responses from these indicators to represent children‘s
participation in household work as a whole. In addition, two separate additive measures were
developed to represent indoor work and outdoor work. The indoor work measure was developed
by adding the responses from survey questions 63-66 and 71-47, and the outdoor work measure
was developed by adding the responses from survey questions 67-70 and 75-78 (See Appendix
D). These computed scales were later used in bivariate and multivariate analyses.
Marriage quality: Marriage quality in this study reflects a parent‘s global evaluation of the
marriage relationship by capturing spouse's personal traits, communication skills, conflict
resolution, financial management, leisure activities, sexuality, parenting, relationship with the
extended family, division of household labor, and religious practice. Marital quality is measured
by the short version of Enriching Relationship Issues, Communication, and Happiness (Fowers
& Olson, 1992), a 10-item Likert-type scale that assesses the perceived quality of one's marriage
across 10 dimensions of the relationship (See Appendix D questions 82-91). Fowers and Olson
(1992) report good reliability estimates of the short ENRICH scale as well as high concurrent
and predictive validity. The internal consistency reliability (Cronbach‘s alpha) of the marital
quality scale was .86. Responses to these items were on a 5-point Likert scale from (1) strongly
disagree to (5) strongly agree. For the purpose of this study, all the negative statements in the
marital quality scale (items 82, 84, 86, and 89 in the survey) [Appendix D] were reverse-coded
first in order to reduce response bias. Also, in the reliability analysis, these reverse-coded items
62
make a difference; in the extreme they can lead to a negative Cronbach‘s alpha (see Field, 2005
for more detail). An additive measure was then created by adding the previous ten items. This
additive measure was then later used in bivariate and multivariate analyses.
Independent Variables
There are three independent variables in this study: gender ratio, children‘s gender
composition, and parental gender preferences regarding children. The gender ratio variable refers
to the actual proportion of boys to girls in the family as a whole. Respondents were asked to
provide the gender of each child at home starting with the oldest and, based on the results,
gender ratio was constructed by calculating the number of boys to girls in the families studied
using the transform compute function in SPSS. Ratio with less than one (ratio < 1) means more
girls were born to a family than boys, ratio with one (ratio = 1) means an equal number of boys
and girls were born to a family, and ratio greater than one (ratio > 1) means more boys were born
to a family than girls. The gender composition refers to the children‘s gender distribution
(structure) in the family and represents those families with all boys, all girls, and mixed-gender
sibships. This variable was also constructed from the participants‘ responses providing the
gender of each child at home starting with the oldest (See Appendix D question 13). Gender
preferences in this study refer to desiring one gender more than the other (boy preference, girl
preference), gender indifference, or gender balance. Gender balance is defined as desiring an
equal number of boys and girls, in which the gender is still a main consideration. By contrast,
gender indifference indicates a situation in which parents feel that either gender is acceptable (a
boy is as desirable as a girl or vice versa). Therefore, no particular sex combinations are desired
(Tin-chi Lin, 2009). This variable was constructed from responses to the survey questions 14-16
(See Appendix D). These questions were adopted from the 1992 and 1998 (Knowledge,

63
Attitudes, and Practice of Contraceptives) Survey (KAP). Based on the responses to these
questions, respondents would have a boy preference if the desired number of boys is more than
girls; a girl preference if the desired number of girls is more than boys; a balanced preference if
the desired number of number of boys and girls is equal; and gender indifference if the
respondent indicated that either gender is acceptable.
Control Variables
Because previous studies show that several other factors besides gender of the child
impact family process, the following variables were controlled in the multivariate analysis;
parents‘ age, gender of parents, income, work status, education, age at marriage, place of birth,
and gender ideology as well as father involvement, number of children, and ages of children.
Age was measured by asking respondents the open-ended question: how old were you on
your last birthday? Gender was measured by the following question: what is your gender?
Responses to this question are (1) male and (2) female. Income was measured with the following
question: what is your total annual family income from all sources, before taxes? Responses to
this question included six categories (1) less than $25,000; (2) $25,000-$44,999; (3) $45,000-
$64,999; (4) $65,000-$74,999; (5) $75,000-$94,999; and (6) $95,000 or more. Work status was
measured by the question: Are you currently working outside the home? Responses to this
question required a response of (1) yes or (2) no. Education was measured by the question: What
is the highest level of education you have completed? Responses included six categories (1) less
than high school, (2) a high school diploma or GED, (3) associate degree (a two year college
degree), (4) bachelor‘s degree, (5) master‘s degree, and (6) professional degree (M.D., DDS.
Ph.D. or other doctorate degree) (See Appendix D).

64
Gender ideology refers to the extent to which men and women adhere to traditional
gender ideologies. It represents what individuals viewed as appropriate roles for men and
women. It was constructed form the survey questions 92-95 (See Appendix D). These items were
adopted from the National Survey of Family and Household wave II (NSFH2) 1992-1994.
Responses to these questions were on a 5-point Likert scale from, (1) strongly agree, to (5)
strongly disagree. For the purpose of this study, items 94 and 95 in the survey were reverse-
coded first. Then, an additive measure was created by adding all the previous items, which was
later used in the regression analyses. The age at marriage was measured by asking the following
open-ended questions: (1) How old were you when you got married? Place of birth was
measured by the following question: Where were you born? Responses to this question are (1)
In the U.S. (2) Outside the U.S. (specify the country). Number of children was also used as a
control variable and was measured by the same questions indicated earlier with regard to family
size. The ages of children was measured in years. Respondents were asked to provide the age of
each child in the house starting from the oldest. Then, the average age was computed from all
children‘s ages who were under 18 years (See Appendix D).
3.5 Instrument and Procedures
This is a quantitative study that used a self-administered questionnaire. The questionnaire
had 97 questions and contained 5 main sections: 1) background information (9 items), (2)
background information about children assessed with questions (10 items), (3) parental
involvement with children (44 items), (4) allocating household work (16 items), (5) and family
relationships (19 items) (See Appendix D for a copy of the survey instrument). The questionnaire
was structured with closed-ended and some open-ended questions with the majority of responses
set up on a Likert scale.
65
Prior to data collection, the questionnaire was pilot tested first on eight Arab-American
parents to assess the study‘s measures for reliability and to establish validity before embarking
on the full study. Parents were asked to evaluate appropriateness of response options, time to
complete, and clarity of the questions in terms of language, wording, and meaning. Necessary
corrections were considered accordingly. All measures and information sheets were then
translated from English to Arabic language. Forward translation from English to Arabic was
employed by a certified translator. Back translation from Arabic to English was conducted by a
different certified translator. The researcher compared the translated versions to insure that the
items were equivalent. Finally, the survey was pilot tested again on another ten bilingual Arab
American parents to test the measures after translation. At that time, no corrections were made.
The pilot samples were not included as part of the main sample.
Permission was sought in writing from the Human Investigation Committee (HIC) at
Wayne State University (See Appendices A &B). In addition, letters of support from Imams,
priests, and Arab-American organizations and community leaders were obtained. The study took
place at mosques, churches, Arab community centers, and Arab-American social organizations in
the tri-county area.
During data collection, copies of the information sheets were distributed with the survey.
The average time for study participation by each respondent ranged from 20-25 minutes. In order
to assure anonymity and privacy, respondents were provided with envelopes in which to place
the completed survey. At the time of data collection, parents were informed of the study‘s
purpose and were advised that they were free to refuse to participate, to abstain from answering
some questions, or to withdraw from the questionnaire at any time without penalty, and that
66
participation was voluntary. All information was kept confidential and the results were
summarized and presented in aggregate.
3.6 Statistical Analyses and Techniques
For the purpose of this study, several statistical techniques were employed. The analysis
proceeded in the following manner: univariate analysis, followed by bivariate analysis, and
finally multivariate analysis (multiple regression analysis). Initially, univariate statistics were
used to assess the overall trends and patterns of the data. These statistics were composed of
descriptive statistics (i.e., frequency and measure of central tendency, dispersions). Bivariate
statistics, such as One-Way ANOVAs, were conducted to assess whether the dependent variables
(family size, parental involvement, allocating household chores to children, and marriage
quality) differed significantly by parental gender preferences with regard to children and the
gender composition of children. In addition, a simple regression analysis was used to examine
whether the dependent variables were predicted by the gender ratio variable. Finally, multivariate
analysis, using hierarchical linear multiple regression was used to test the study research
hypotheses and to predict the relationship that exists between gender ratio, children‘s gender
composition, parental gender preference regarding children and family size, parental
involvement with children, allocating household work to children, and marital quality. Multiple
regression technique allows identification of the best predictor of an outcome or dependent
variable. It also allows control for other variables that may or may not have had an effect on the
dependent variables.

67
CHAPTER 4
Results
This chapter looks at the relationship between gender preference of parents regarding
children, gender ratio, and gender composition of children and four family dynamics:
Family size
Parental involvement with children
Children‘s participation in the household work
Marital quality
The first section of the chapter provides a univariate description of the variables under
investigation, including the independent and dependent variables as well as the control variables.
Next, bivariate analyses, including a series of One-Way ANOVA analyses, were used to test
whether the dependent variables varied by gender composition of children and gender
preferences of parents regarding children. A simple regression analysis was also used to examine
whether the gender ratio variable significantly predicted parental involvement with children,
allocation of household chores to children, and marital quality. The last section of this chapter
deals with the multivariate analysis when statistical evidences warrant. A series of hierarchical
linear multiple regressions were used to predict the relationship between the dependent variables
(family size, parental involvement, allocating household chores to children, and marriage
quality) and the independent variables (gender preference, children‘s gender composition, and
gender ratio) while controlling for other variables. This analysis will provide answers to the
previously listed hypotheses.

68
4.1 Univariate statistics
The following is a descriptive account of variables under examination. The analysis
provides the researcher with an assessment of the overall trends and patterns of the variables
included in the analysis. First, the social background characteristics are presented followed by
the analysis of key variables, including the independent variables (gender composition, gender
ratio, and gender preferences) and the dependent variables (family size, parental involvement
with children, children‘s participation in the household work, and marital quality).
4.1.1 Social Background Characteristics
Prior to the analysis, assessments of the social background characteristics of Arab-
American parents were made. The sample consisted of 200 Arab-American respondents. A total
of (115) 57.5 % of the respondents were female and (85) 42.5 % were male and the majority of
the respondents were born outside of the United States (72.5%) (See table 1). The average age of
respondents was 40.16 years and respondents were an average age of 23.2 at marriage.
Therefore, Arab-Americans were generally younger than the general population in the United
States when they married and they started their families almost immediately after marriage (see
table 2).
Income, education, and work status were also important contributors to a full
understanding of the social background characteristics of Arab-American participants in this
study. In general, Arab-Americans are highly educated, have higher labor force participation
rates, and earn higher incomes than the U.S. adult population, all of which suggest an assimilated
and progressive ethnic population (Samhan 2001; U.S.A Census Bureau, 2008). This is also
evident in the present study. The majority of respondents (58%) had four or more years of
college (bachelor‘s degree and higher), (63%) were working, and (48.2%) had a $65,000 or
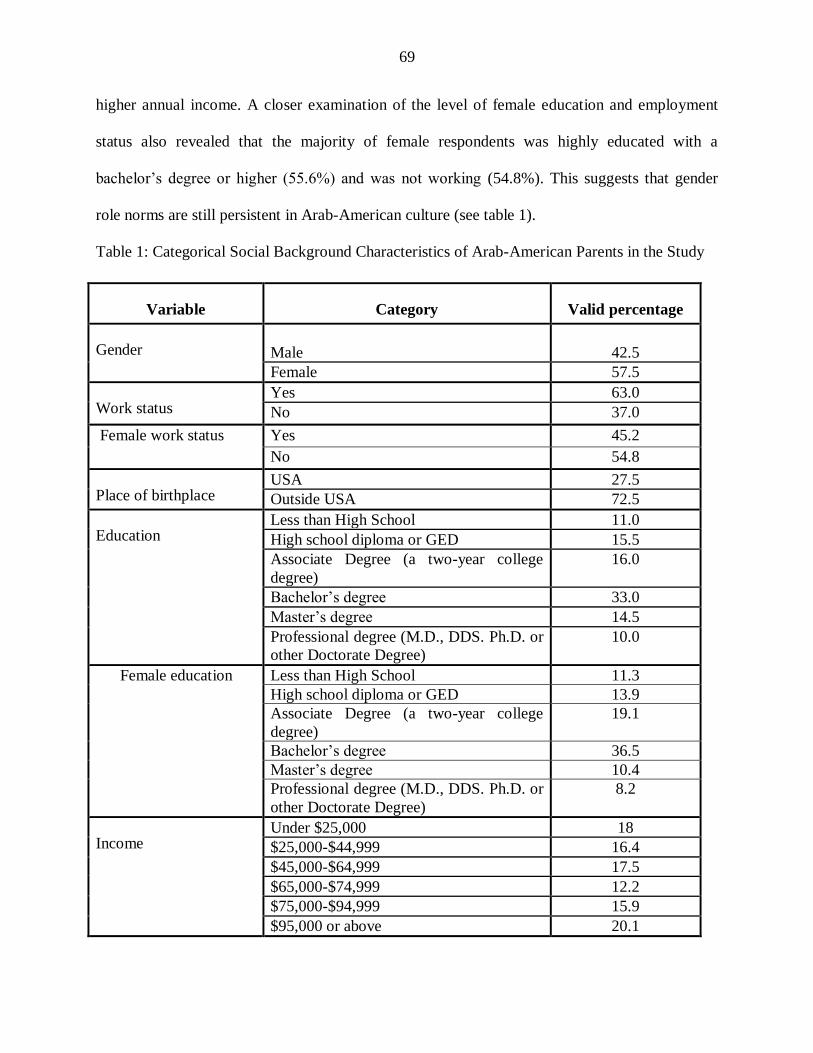
69
higher annual income. A closer examination of the level of female education and employment
status also revealed that the majority of female respondents was highly educated with a
bachelor‘s degree or higher (55.6%) and was not working (54.8%). This suggests that gender
role norms are still persistent in Arab-American culture (see table 1).
Table 1: Categorical Social Background Characteristics of Arab-American Parents in the Study
Variable Category Valid percentage
Gender
Male
42.5
Female 57.5
Work status Yes 63.0
No 37.0
Female work status Yes 45.2
No 54.8
Place of birthplace USA 27.5
Outside USA 72.5
Education Less than High School 11.0
High school diploma or GED 15.5
Associate Degree (a two-year college
degree)
16.0
Bachelor‘s degree 33.0
Master‘s degree 14.5
Professional degree (M.D., DDS. Ph.D. or
other Doctorate Degree)
10.0
Female education Less than High School 11.3
High school diploma or GED 13.9
Associate Degree (a two-year college
degree)
19.1
Bachelor‘s degree 36.5
Master‘s degree 10.4
Professional degree (M.D., DDS. Ph.D. or
other Doctorate Degree)
8.2
Income Under $25,000 18
$25,000-$44,999 16.4
$45,000-$64,999 17.5
$65,000-$74,999 12.2
$75,000-$94,999 15.9
$95,000 or above 20.1

70
In comparing these results to the entire U.S. population, it is clear that the percentage of
Arab–American respondents with four or more years of education was higher than the
percentage of the entire U.S. population with four or more years of college (age 25 and over)
(29.4%) and the majority of the respondents had income higher than the median family income
in the U.S. (61.335) (Macionis, 2010).
Table 2: Continuous Social Background Characteristics of Arab-American Parents in the Study
Variable Mean Median Standard deviation
Age 40.16 40.00 9.61
Age at marriage 23.20 23.00 5.05
Number of natural children 3.55 3.00 1.31
Average age of children 9.92 10.20 3.98
Gender ratio (boys to girls ratio) 1.02 1.00 1.00
A total of four items was adopted from the National Survey of Family and Household
wave II (NSFH2) 1992-1994 to assess the degree of gender ideology. These items were:
1. It is much better if the man earns the main living and the woman takes care of
the home and family.
2. Preschool children are likely to suffer if their mother is employed.
3. It is all right for mothers to work full time when their youngest child is under
five.
4. A husband whose wife is working full-time should spend just as many hours
doing housework as his wife.
Retrospective reports of parents‘ level of gender ideology revealed that the majority of the
respondents held to non-traditional gender ideology. An examination of combined categories
(strongly disagree and moderately disagree) revealed that (50.2 %,) of the respondents disagreed
with the statement: ―it is much better if the man earns the main living and the woman takes care
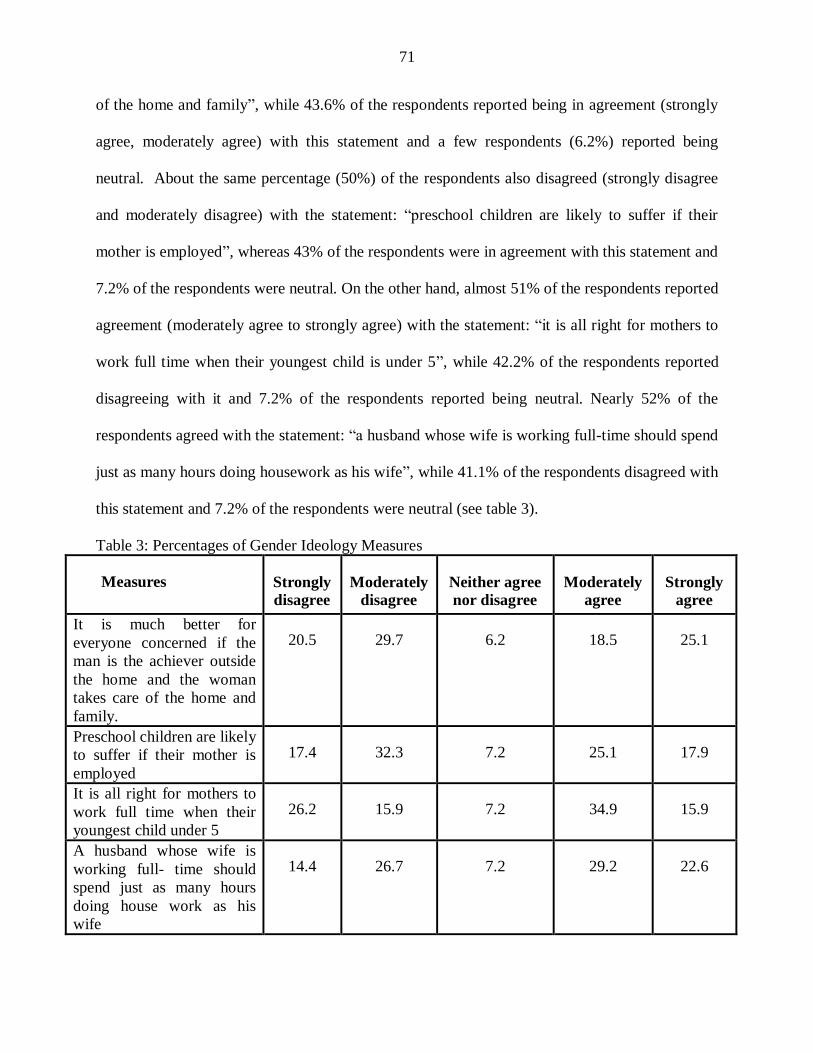
71
of the home and family‖, while 43.6% of the respondents reported being in agreement (strongly
agree, moderately agree) with this statement and a few respondents (6.2%) reported being
neutral. About the same percentage (50%) of the respondents also disagreed (strongly disagree
and moderately disagree) with the statement: ―preschool children are likely to suffer if their
mother is employed‖, whereas 43% of the respondents were in agreement with this statement and
7.2% of the respondents were neutral. On the other hand, almost 51% of the respondents reported
agreement (moderately agree to strongly agree) with the statement: ―it is all right for mothers to
work full time when their youngest child is under 5‖, while 42.2% of the respondents reported
disagreeing with it and 7.2% of the respondents reported being neutral. Nearly 52% of the
respondents agreed with the statement: ―a husband whose wife is working full-time should spend
just as many hours doing housework as his wife‖, while 41.1% of the respondents disagreed with
this statement and 7.2% of the respondents were neutral (see table 3).
Table 3: Percentages of Gender Ideology Measures
Measures Strongly
disagree
Moderately
disagree
Neither agree
nor disagree
Moderately
agree
Strongly
agree
It is much better for
everyone concerned if the
man is the achiever outside
the home and the woman
takes care of the home and
family.
20.5 29.7 6.2 18.5 25.1
Preschool children are likely
to suffer if their mother is
employed
17.4 32.3 7.2 25.1 17.9
It is all right for mothers to
work full time when their
youngest child under 5
26.2 15.9 7.2 34.9 15.9
A husband whose wife is
working full- time should
spend just as many hours
doing house work as his
wife
14.4 26.7 7.2 29.2 22.6

72
4.1.2 Analysis of key variables
This section provides descriptive information on the independent variables: gender ratio,
gender composition, and gender preferences; the dependent variables: family size, parental
involvement with children, children‘s participation in household work, and marital quality, as
well as the reasons for wanting boys and girls and the average age of children.
Independent variables: Gender composition, gender ratio, gender preference
Gender composition referred to the children‘s gender distribution (structure) in the family
and represented those families with all boys, all girls, and mixed-gender sibships. Respondents
were asked to specify the gender of each child at home. Based on the responses, gender
composition was constructed. Table 4 showed that the majority of the respondents had a mixed
gender sibship at home (59.9%), while 23% of the respondents had only boys and just 17.5% had
only girls. Gender ratio of children in the Arab-American families was also constructed from
participants‘ responses about specifying the gender of each child at home. The average boys‘ to
girls‘ ratio was 1.02, which indicated that slightly more boys were born to respondents than girls
(see table 2).
Previous studies pointed out that son preference was a common phenomenon in
developing countries, including Arab countries (William, 1976; Arnold & Kuo, 1984; Cleland,
Verrall & Vaessen, 1983, A El-Gilany & Shady, 2007), but differences were noted from one
country to another. Even though preferring sons over daughters is still widespread in many
developed countries (Bennett, 1983), this preference often exists side by side with the desire for
having at least one child of each gender (Arnold & Zhaoxiang, 1986). Preference for balanced
gender composition (at least one child of each gender) is a much more frequent pattern in
developed countries (Kippen, Evans, & Gary, 2007; Raley & Bianchi, 2006; Andersson, 2006;

73
Hank & Kohler, 2000). In the current study, preference for balanced gender composition (at least
one child of each gender) was evident. This preference existed side by side with son preference,
especially for the first child. Respondents were asked to provide the total number of children
they would have liked to have and how many boys and girls they preferred. Based on that gender
preference, a variable was constructed to represent boy preference if the desired number of boys
was higher than the number of the girls; girl preference if the desired number of the girls was
higher than the number of the boys; balanced preference if parents desired an equal number of
boys and girls; and no difference when parents felt that either gender was acceptable. Table 4
provided a summary of retrospective responses to parental gender preference regarding children.
The results revealed that about (48%) of respondents preferred balanced gender, whereas 44.1%
of the respondents preferred boys. Only 3% of the participants preferred girls and only 5.4% of
the respondents were indifferent regarding gender preference. With regard to the gender
preference of the first child, respondents were asked to specify their preference for the first child
and the results indicated that about 55% of the respondents preferred a boy for the first child,
while 37.2% of the respondents were indifferent about the gender of the first child and 8.2% of
the respondents preferred a girl as the first child. These results suggested that, despite the
tendency toward a preference for a balanced gender, a boy preference was not completely absent
from Arab-American culture, especially the preference for a boy as the first child.
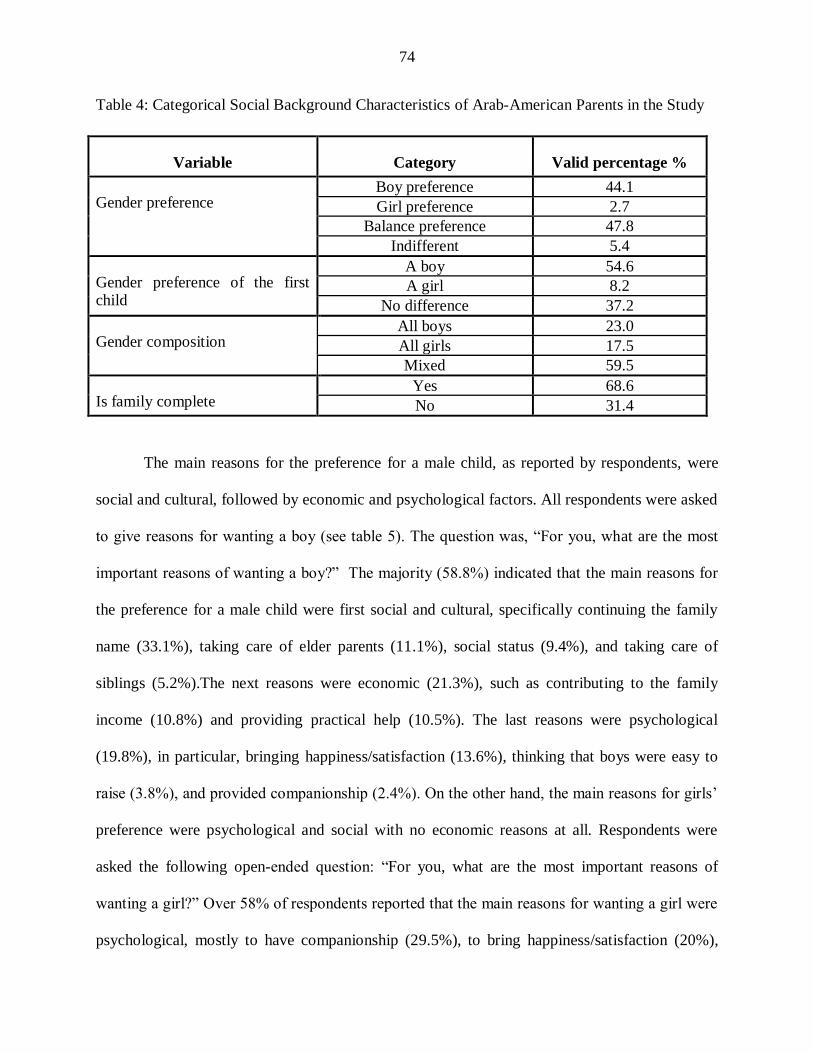
74
Table 4: Categorical Social Background Characteristics of Arab-American Parents in the Study
Variable Category Valid percentage %
Gender preference Boy preference 44.1
Girl preference 2.7
Balance preference 47.8
Indifferent 5.4
Gender preference of the first child
A boy 54.6
A girl 8.2
No difference 37.2
Gender composition All boys 23.0
All girls 17.5
Mixed 59.5
Is family complete Yes 68.6
No 31.4
The main reasons for the preference for a male child, as reported by respondents, were
social and cultural, followed by economic and psychological factors. All respondents were asked
to give reasons for wanting a boy (see table 5). The question was, ―For you, what are the most
important reasons of wanting a boy?‖ The majority (58.8%) indicated that the main reasons for
the preference for a male child were first social and cultural, specifically continuing the family
name (33.1%), taking care of elder parents (11.1%), social status (9.4%), and taking care of
siblings (5.2%).The next reasons were economic (21.3%), such as contributing to the family
income (10.8%) and providing practical help (10.5%). The last reasons were psychological
(19.8%), in particular, bringing happiness/satisfaction (13.6%), thinking that boys were easy to
raise (3.8%), and provided companionship (2.4%). On the other hand, the main reasons for girls‘
preference were psychological and social with no economic reasons at all. Respondents were
asked the following open-ended question: ―For you, what are the most important reasons of
wanting a girl?‖ Over 58% of respondents reported that the main reasons for wanting a girl were
psychological, mostly to have companionship (29.5%), to bring happiness/satisfaction (20%),

75
and because they loved females (8.9%). 41% of respondents indicated that they wanted a girl for
social reasons, particularly to take care of parents when they get older (21.8%) and to help with
household work (19.2%).
Table 5: Reasons for Wanting Boys and Girls in Arab- American Families
Reason Category Valid percentage
Reasons for wanting boys
Psychological reasons Companionship 2.4
Happiness/Satisfaction 13.6
Easy to raise 3.8
Economic reasons Contribute to the family income 10.8
Practical help 10.5
Social and cultural reasons Old age care 11.1
Continue family name 33.1
Social status (son achievement) 9.4
Take care of sibling 5.2
Reasons for wanting girls
Companionship 29.5
Psychological reasons Happiness/Satisfaction 20
Love females 8.9
Social reasons Old age care 21.8
Help with household work 19.2
Dependent variable: Family Size
Number of children was used to measure family size. In this study, respondents were
asked to identify the number of natural, adopted, and step-children living at home. None of the
respondents had adopted or step-children living in the home. All respondents gave a response
regarding the number of natural children living in the home. This study only included the number
of natural children reported by participants. The average number of natural children living in the
home was roughly 4 and the average mean of children‘s age under 18 was approximately 10
years old. (See table 2). These results suggested that the average number of children for Arab-

76
Americans was less than the average number of children in Arabic countries (6 children per
woman) (Al-Qudsi, 1998) and more than the TFR (Total Fertility Rate) in the U.S. which is 2.10
(Preston & Hartnett, 2008).
In addition, respondents were asked if their families were complete and the majority
indicated that their families were complete (68.6%) (See table 4).
Family size and gender preferences
Studies that examine the relationship between parental gender preferences regarding
children and family size reveal that gender preferences regarding children may have significant
inferences for a couple‘s fertility behavior and thus family size. This is strongly evident in many
developing countries. A strong son preference may be a barrier to family planning if couples
persist in having children after reaching their overall family size goal because they are not happy
with the gender composition of their current family (Arnold & Roy, 1997). Parents who prefer
sons rather than daughters may be unwilling to stop childbearing until their preferred number of
sons has been achieved. Even in developed countries, some studies demonstrate an effect of
gender preferences on family size (Marleau & Saucier, 1996) in order to achieve balance in the
gender composition of their children (at least one boy and one girl). Similar to previous studies
from developing countries, the data from this study disclosed that parents with a strong boy
preference were more likely to have a larger family size than parents with a girl preference, a
balanced preference, or were indifferent. A closer examination of the responses in table 6
indicated that parents who preferred a boy (77%) were more likely to have a larger family size (4
children or more) than parents with a girl preference (20%), a balanced preference (24%), or no
preference (26.9%). This suggested that parents who preferred boys over girls may have been
unwilling to stop childbearing until they achieved their desired number of sons.

77
Table 6: Prevalence of Number of Children by Parents‘ Gender Preferences with Regard to
Children
Number of
children
Boy preference Girl preference Balanced preference Indifferent
N % N % N % N %
2 7 8.5 2 40 32 36 4 40
3 12 14.7 2 40 32 36 4 40
4 24 29.3 1 20 19 21.3 --- ---
5 31 37.8 --- --- 5 5.6 2 20
6 5 6.1 --- --- --- --- --- ---
7 1 1.2 --- --- --- --- --- ---
8 2 2.4 --- --- 1 1.1 --- ---
Total 82 100% 5 100% 89 100% 10 100%
Family size and gender composition
Assessments by gender composition of children revealed that parents with only girls had
larger family size than parents with all boys or mixed gender children. The results in table 7
clearly shows that the majority of parents with only girls (45.7%) had a larger family size (5
children) than parents with all boys (41.3%) (2 children) and parents with mixed gender children
(37.8%) (3 children). This data implied that parents with only girls were more likely to have
additional children in order to achieve a boy because they were not happy with the gender
composition of their current family. On the other hand, parents with all boys were less likely to
have a large family size because they had already achieved the desired number of boys. Parents
with mixed gender children were also less likely to have a large family size because they had
achieved the preferred number of boys and girls.
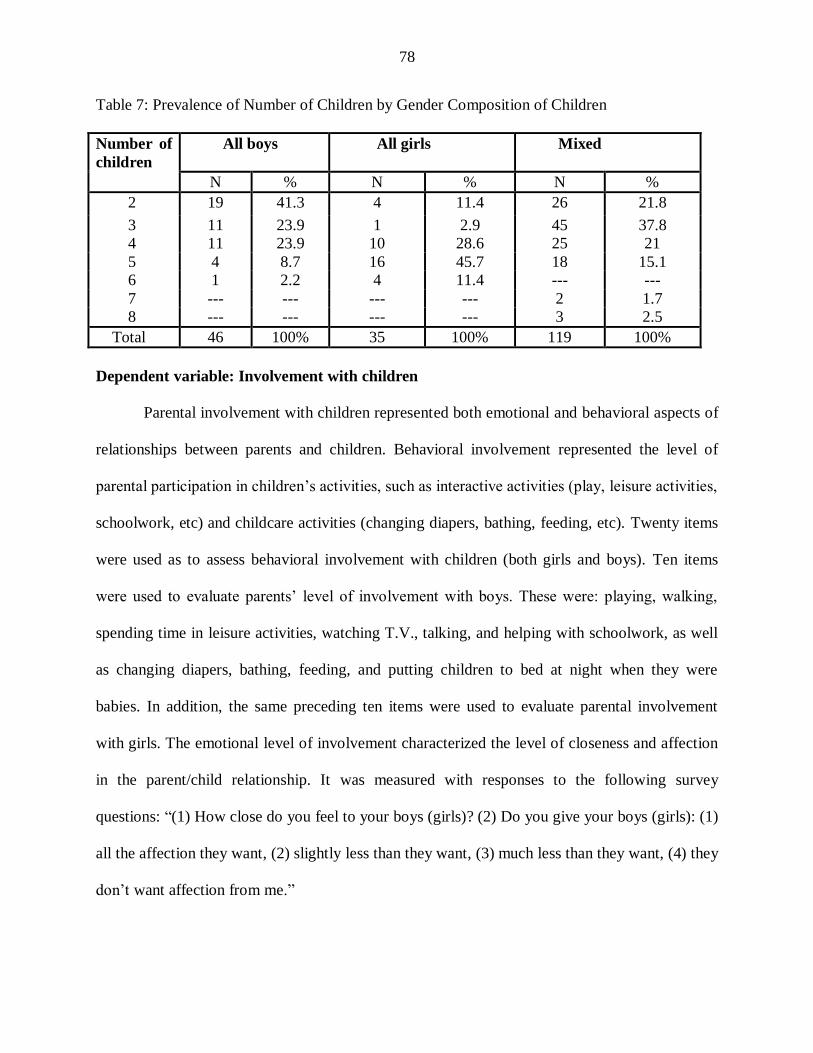
78
Table 7: Prevalence of Number of Children by Gender Composition of Children
Number of
children
All boys All girls Mixed
N % N % N %
2 19 41.3 4 11.4 26 21.8
3 11 23.9 1 2.9 45 37.8
4 11 23.9 10 28.6 25 21
5 4 8.7 16 45.7 18 15.1
6 1 2.2 4 11.4 --- ---
7 --- --- --- --- 2 1.7
8 --- --- --- --- 3 2.5
Total 46 100% 35 100% 119 100%
Dependent variable: Involvement with children
Parental involvement with children represented both emotional and behavioral aspects of
relationships between parents and children. Behavioral involvement represented the level of
parental participation in children‘s activities, such as interactive activities (play, leisure activities,
schoolwork, etc) and childcare activities (changing diapers, bathing, feeding, etc). Twenty items
were used as to assess behavioral involvement with children (both girls and boys). Ten items
were used to evaluate parents‘ level of involvement with boys. These were: playing, walking,
spending time in leisure activities, watching T.V., talking, and helping with schoolwork, as well
as changing diapers, bathing, feeding, and putting children to bed at night when they were
babies. In addition, the same preceding ten items were used to evaluate parental involvement
with girls. The emotional level of involvement characterized the level of closeness and affection
in the parent/child relationship. It was measured with responses to the following survey
questions: ―(1) How close do you feel to your boys (girls)? (2) Do you give your boys (girls): (1)
all the affection they want, (2) slightly less than they want, (3) much less than they want, (4) they
don‘t want affection from me.‖

79
For purposes of this study, general descriptive information of the nature of parental
involvement with children in Arab-American families and assessment of fathers‘ involvement
relative to that of mothers‘ are presented. As a whole, tables 8 and 9 show that fathers were
involved in various activities with children. A closer examination of the type of activities with
children reveals that fathers were more involved with children in interactive activities than in
childcare activities. Taking into account the grand mean percentage for each level of interactive
and childcare activities respectively, 67% of fathers reported a moderate to high level of
involvement with children in interactive activities (3-4 times a month to every day), while those
reporting a lower level of involvement (twice a month, once a month, or never) were just 33%
(see table 8). 56.5% of fathers reported a lower level of involvement (twice a week, once a week,
or never) in childcare activities during childhood years (see table 9), compared to just 43.5% of
those who claimed to be moderately to highly involved (3-4 times a month to every day) in
childcare activities.
As one examined the type of activities, fathers were more likely to be involved with boys
than with girls in both types of activities (interactive and childcare). In light of the mean
percentage for each level of interactive activities with boys and girls respectively,77.1% of
fathers reported a moderate to high level of involvement with boys in interactive activities (3-4
times a month to every day), while those reporting a lower level of involvement (twice a month,
once a month, or never) were 22.9%. About 57% of fathers reported a moderate to high level of
involvement with girls in interactive activities (3-4 times a month to every day), while those
reporting a lower level of involvement (twice a month, once a month, or never) were 43.1% (see
table 8). Fathers were moderately to highly involved (3-4 times a month to every day) with boys
in play activity (86%), talking about things that were important to boys (85.9%), watching T.V.
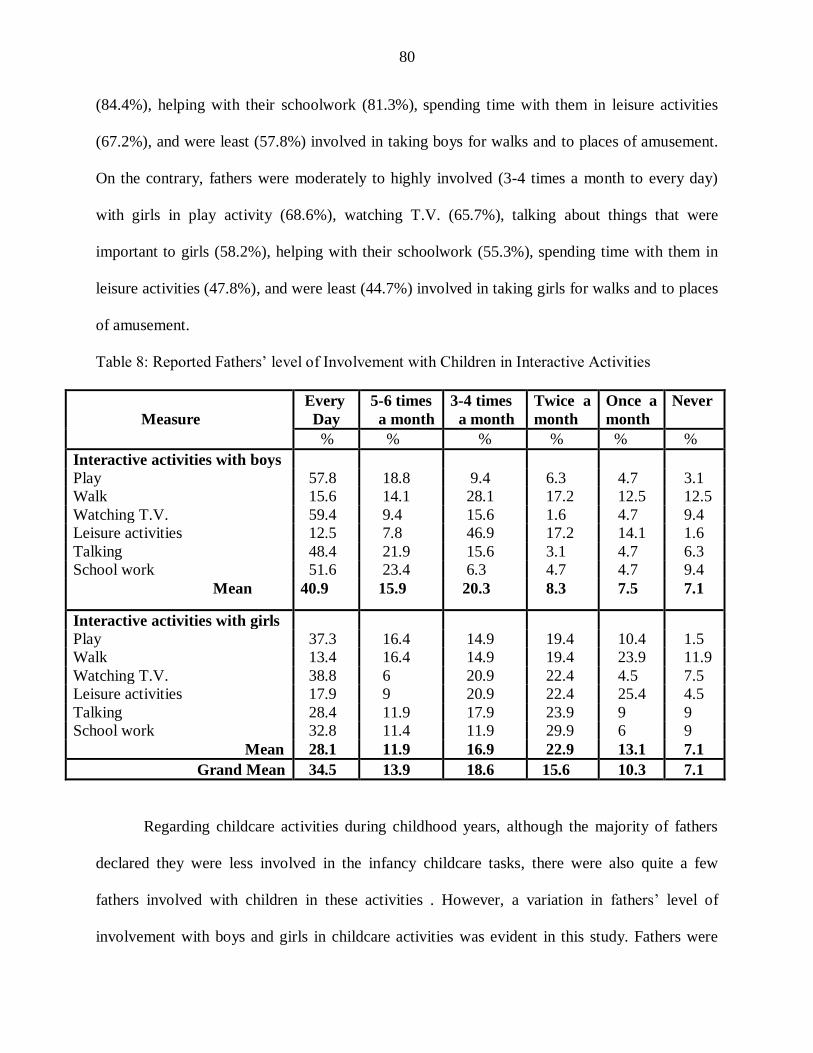
80
(84.4%), helping with their schoolwork (81.3%), spending time with them in leisure activities
(67.2%), and were least (57.8%) involved in taking boys for walks and to places of amusement.
On the contrary, fathers were moderately to highly involved (3-4 times a month to every day)
with girls in play activity (68.6%), watching T.V. (65.7%), talking about things that were
important to girls (58.2%), helping with their schoolwork (55.3%), spending time with them in
leisure activities (47.8%), and were least (44.7%) involved in taking girls for walks and to places
of amusement.
Table 8: Reported Fathers‘ level of Involvement with Children in Interactive Activities
Measure
Every
Day
5-6 times
a month
3-4 times
a month
Twice a
month
Once a
month
Never
% % % % % %
Interactive activities with boys
Play 57.8 18.8 9.4 6.3 4.7 3.1
Walk 15.6 14.1 28.1 17.2 12.5 12.5
Watching T.V. 59.4 9.4 15.6 1.6 4.7 9.4
Leisure activities 12.5 7.8 46.9 17.2 14.1 1.6
Talking 48.4 21.9 15.6 3.1 4.7 6.3
School work 51.6 23.4 6.3 4.7 4.7 9.4
Mean 40.9 15.9 20.3 8.3 7.5 7.1
Interactive activities with girls
Play 37.3 16.4 14.9 19.4 10.4 1.5
Walk 13.4 16.4 14.9 19.4 23.9 11.9
Watching T.V. 38.8 6 20.9 22.4 4.5 7.5
Leisure activities 17.9 9 20.9 22.4 25.4 4.5
Talking 28.4 11.9 17.9 23.9 9 9
School work 32.8 11.4 11.9 29.9 6 9
Mean 28.1 11.9 16.9 22.9 13.1 7.1
Grand Mean 34.5 13.9 18.6 15.6 10.3 7.1
Regarding childcare activities during childhood years, although the majority of fathers
declared they were less involved in the infancy childcare tasks, there were also quite a few
fathers involved with children in these activities . However, a variation in fathers‘ level of
involvement with boys and girls in childcare activities was evident in this study. Fathers were

81
more involved with boys than with girls in childcare activities. Considering the mean percentage
for each level of childcare activities, 52.7% of fathers reported a moderate to high level of
involvement with boys in childcare activities (3-4 times a month to every day), while those
reporting less involvement (twice a month, once a month, or never) were 47.3%. Also, 34.3% of
fathers reported a moderate to high level of involvement with girls in childcare activities (3-4
times a month to every day), while those reporting less involvement (twice a month, once a
month, or never) were 65.7% (see table 9). Fathers were most involved with boys (every day, 5-6
times a week, and 3-4 times a week) in activities like putting them to bed at night (71%),
feeding (59%), followed by changing diapers (46.8%), and were least (33.9%) involved (twice a
week, once a week, or never) in bathing. On the other hand, fathers were most involved with
girls (every day, 5-6 times a week, and 3-4 times a week) in activities such as feeding (43.3%)
putting them to bed at night (43.3%), changing diapers ( 28.4%), and were least (22.4%)
involved in giving baths to their girls when they were babies (see table 9).
Table 9: Reported Fathers‘ level of Involvement with Children in Childcare Activities when they
were Babies
Measure
Every
Day
5-6 times
a week
3-4 times
a week
Twice
a week
Once a
week
Never
% % % % % %
Childcare activities with boys
Changing diapers 21 14.5 11.3 4.8 4.8 43.5
Bathing 16.1 9.7 8.1 17.7 11.3 37.1
feeding 26.2 18 14.8 3.3 13.1 24.6
Putting in bed 50 12.9 8.1 4.8 9.7 14.5
Mean 28.3 13.8 10.6 7.7 9.7 30
Childcare activities with girls
Changing diapers 20.9 4.5 3 1.5 --- 70.1
Bathing 14.9 4.5 3 4.5 7.5 65.7
Feeding 25.4 4.5 13.4 23.9 7.5 25.4
Putting in bed 32.8 3 7.5 28.4 11.9 16.4
Mean 23.5 4.1 6.7 14.6 6.7 44.4
Grand Mean 25.9 9 8.6 11.1 8.2 37.2

82
Compared to fathers‘ levels of involvement with children, mothers had a higher level of
involvement with children than fathers in several types of activities. Tables 10 and 11 provide a
summary of retrospective reports of mothers‘ levels of involvement with children in several
activities. The results revealed that the majority of mothers were highly involved with children
(both boys and girls) in various activities. An assessment of the type of activities with children
revealed that mothers were more involved in childcare activities than in interactive activities. In
light of the grand mean percentage for each level of childcare and interactive activities with
children, respectively, 96.9% of mothers reported a high level of involvement in infancy
childcare tasks (every day, 5-6 times a week, and 3-4 times a week), while those reporting a
lower level of involvement (twice a week, once a week, or never) were just 3.1%. 76.4% of
mothers reported a moderate to high level of involvement in interactive activities (3-4 times a
month to every day) compared to 23.6% of mothers who were less involved (twice a month, once
a month, or never) in these activities. Further, when examining the type of activities, very little
variation was seen in mothers‘ levels of involvement with boys and girls in both types of
activities (interactive and childcare activities). In view of the mean percentage for each level of
interactive activities with boys and girls, 75.5% of mothers reported a moderate to high level of
involvement with boys in interactive activities (3-4 times a month to every day), while mothers
reporting a lower level of involvement (twice a month, once a month, or never) were just 24.5%.
77.4% of mothers also reported a moderate to high level of involvement with girls in interactive
activities (3-4 times a month to every day), while those reporting a lower level of involvement
(twice a month, once a month, or never) were 22.6% (see table 10). Mothers were moderately to
highly involved (every day, 5-6 times a month, and 3-4 times a month) with boys in talking
about thing that were important to boys (87.1%), watching T.V. (85.2%), helping with their
83
schoolwork (81.2%), playing with boys (81.2%), spending time with them in leisure activities
(59.4%), and were least involved in taking boys for walks and to places of amusement (58.5%).
On the other hand, mothers were moderately to highly involved with girls (every day, 5-6 times a
month, and 3-4 times a month) in talking about thing that were important to girls (88.3%),
watching T.V. (87.1%), playing (84.9%), helping with their schoolwork (76.8%), spending time
with them in leisure activities (64%), and were least involved (62.9%) in taking girls for walks
and to places of amusement.
Regarding childcare activities, an evaluation of the mean percentage for each level of
childcare activities with boys and girls revealed that 97.3% of mothers reported a high level of
involvement in infancy childcare tasks with boys (every day, 5-6 times a week, and 3-4 times a
week), while those reporting less involvement (twice a week, once a week, or never) were just
2.7%; and 96.5% of mothers also reported a moderate to high level of involvement with girls in
childcare activities (3-4 times a month to every day) compared to just 3.5% of those who claimed
to be less involved (twice a month, once a month, or never) in these activities. Mothers were
most engaged with boys (every day, 5-6 times a week, and 3-4 times a week) in activities like
putting them to bed at night (98%), bathing (98%), feeding (97%), and (96%) changing diapers.
On other hand, mothers were involved with girls (every day, 5-6 times a week, and 3-4 times a
week) in activities such as feeding (97.6%), putting girls to bed at night (97.6%), bathing
(96.5%), and changing diapers (94.2%).

84
Table 10: Reported Mothers‘ Level of Involvement with Children in Interactive Activities
Measures
Every
Day
5-6 times
a month
3-4 times
a month
Twice a
month
Once a
month
Never
% % % % % %
Interactive activities with boys
Play 47.5 23.8 9.9 5.9 7.9 5
Walk 10.9 24.8 22.8 18.8 14.9 7.9
Watching T.V. 53.5 13.9 17.8 4 4 6.9
Leisure activities 13.9 19.8 25.7 19.8 13.9 6.9
Talking 55.4 17.8 13.9 7.9 1 4
Schoolwork 66.3 12.9 2 3 4 11.9
Mean 41.3 18.8 15.4 9.9 7.5 7.1
Interactive activities with girls
Play 57 16.3 11.6 5.8 7 2.3
Walk 10.5 28 24.4 17.4 11.6 8.1
Watching T.V. 61.6 17.4 8.1 3.5 1.2 8.1
Leisure activities 16.3 19.8 27.9 14 16.3 5.8
Talking 61.2 21.2 5.9 4.7 1.2 5.9
Schoolwork 54.7 12.8 9.3 5.8 3.5 14
Mean 43.6 19.3 14.5 8.5 6.8 7.3
Grand Mean 42.4 19.1 14.9 9.2 7.2 7.2

85
Table 11: Reported Mothers‘ Level of Involvement with Children in Childcare Activities when
they were Babies
Measures
Every
Day
5-6 times
a week
3-4 times
a week
Twice a
week
Once a
week
Never
% %
% % % %
Childcare activities with boys
Changing diapers 96 --- --- --- --- 4
Bathing 71.8 14.1 12.1 --- --- 2
Feeding 96 1 --- --- 1 2
Putting in bed 95 2 1 --- 1 1
Mean 89.7 4.3 3.3 0 .5 2.2
Childcare activities with girls
Changing diapers 93 1.2 --- --- --- 5.8
Bathing 77.9 11.6 7 --- --- 3.5
Feeding 95.3 1.2 1.2 1.2 --- 1.2
Putting in bed 93 3.4 1.2 1.2 --- 1.2
Mean 89.8 4.3 2.4 .6 0 2.9
Grand Mean 89.7 4.3 2.9 .3 .3 2.6
Further assessment of parental emotional involvement with children revealed that very
little variation was seen in mothers‘ levels of emotional attachment to boys and girls, while
fathers were more emotionally attached to boys than to girls. Tables 12 & 13 show that the
majority of mothers (70.9%) reported being extremely close to their girls and (80.4%) of them
gave their girls all the affection they wanted, while (62.4%) of mothers reported being extremely
close to their boys and (85.1%) of them gave their boys all the affection they wanted. The
majority of fathers (70.3 %) reported that they were extremely close to their boys and (84.4%) of
them gave their boys all the affection they wanted, whereas (56.7%) of fathers reported that they
were extremely close to their girls and (62.7%) of them gave their girls all the affection they
wanted.

86
Table 12: Percentages of level of Closeness to Boys and Girls by Gender of Parents
Level of closeness Fathers Mothers
Boys
Extremely close 70.3 62.4
Quite close 21.9 30.7
Fairly close 7.8 6.9
Not at all --- ---
Girls
Extremely close 56.7 70.9
Quite close 28.4 26.7
Fairly close 13.4 2.3
Not at all 1.5 ---
Table 13: Percentages of Level of Affection Giving to Children by Gender of Parents
Level of affection Fathers Mothers
Boys
All the affection they want 84.4 85.1
Slightly less than they want 10.9 12.9
Much less than they want 3.1 1
They don‘t want affection from me
1.6
Girls
All the affection they want 62.7 80.4
Slightly less than they want 23.9 16.3
Much less than they want 3 ---
They don‘t want affection from me
10.4 ---
Overall, parental involvement with children indicated that both parents were involved in
various activities with children. Comparatively speaking, mothers were more involved with
children in several activities (childcare and interactive) than fathers, but fathers were not too far
behind. An examination of the types of activities revealed that fathers were more involved with
children in interactive activities than in childcare activities, while mothers were more involved
with children in childcare activities than in interactive activities. Fathers were more involved
with boys than with girls in interactive and childcare activities, and they were more emotionally
attached to boys than girls. Yet, There were no extreme variations in mothers‘ levels of

87
involvement with boys and girls in interactive and childcare activities or in their levels of
emotional attachment (for further explanation, see Chapter 5).
Dependent: Children’s participation in household work
Participation in household work refers to unpaid work that children (girls/boys) may be
asked to do at home, including indoor and outdoor work. In this study, sixteen items were used to
assess children‘s participation in household work and, for each item, parents rated their response
on a scale from 6 (Never) to 1 (every day). Eight items were used to estimate boys‘ participation
in household work. These items were: washing and drying the dishes, doing laundry, making
their beds, cleaning the house, helping with cooking, helping with grocery shopping, and helping
with general yard work. In addition, the same eight items were used to assess girls‘ participation
in household work. Table 14 provides a summary of the reported level of children‘s participation
in the household.
As one examines the type of household work that children (girls/boys) were asked to do,
more parents reported lower levels of children‘s participation in household work (indoor and
outdoor work). Keeping in mind the mean percentage for each level of indoor and outdoor
household work respectively, 61.5% of parents reported that their children‘s level of involvement
in indoor work (twice a week, once a week, or never) was low, while those reporting high level
of children‘s participation in the indoor work (every day, 5-6 times a week, and 3-4 times a
week) were just 38.5%. 78.1% of parents indicated that their children were less involved in
outdoor work (twice a week, once a week, or never) compared to 21.9% of those who reported
that their children were highly involved in outdoor work (every day, 5-6 times a week, and 3-4
times a week).

88
Although the majority of parents reported that their children were less active participants
in household work as a whole, there were also quite a few children who were highly involved in
household work. Some differences were noticeable between boys and girls who were highly
involved in household work. Girls were more likely to do household work; and girls, compared
to boys, were more likely to do indoor work on average, while boys were more likely to do
outdoor work than girls. The majority of girls were more involved in indoor work (every day, 5-6
times a week, and 3-4 times a week) such as cleaning (66.5%), making their beds (66.5%),
washing and drying dishes (63.7%), followed by cooking (61.8%), and were least involved in
doing laundry (55.2%), whereas boys who were highly active participants (every day, 5-6 times a
week, and 3-4 times a week) were involved in making their beds (37.5%), cleaning (14.2%),
cooking (6.8%), washing and drying the dishes (5.1%), ), and finally doing laundry (5%). Boys
who were active participants in outdoor work were involved (every day, 5-6 times a week, and 3-
4 times a week) in carrying out the garbage (37.9%), followed by helping with general yard work
(29.4%), and finally helping with grocery shopping (22.3%); and girls were highly involved
(every day, 5-6 times a week, and 3-4 times a week) in carrying out the garbage (15.4%),
followed by helping with general yard work (14.2%), and finally helping with grocery shopping
(11.9%).
Although children were generally less involved in household work (indoor and outdoor
work), the variation between girls and boys who were highly involved in indoor and outdoor
work, was evident in this study. Similar to the previous literature, girls, on average, did more
indoor work than boys and boys did more outdoor work than girls (for further explanation, see
chapter 5).
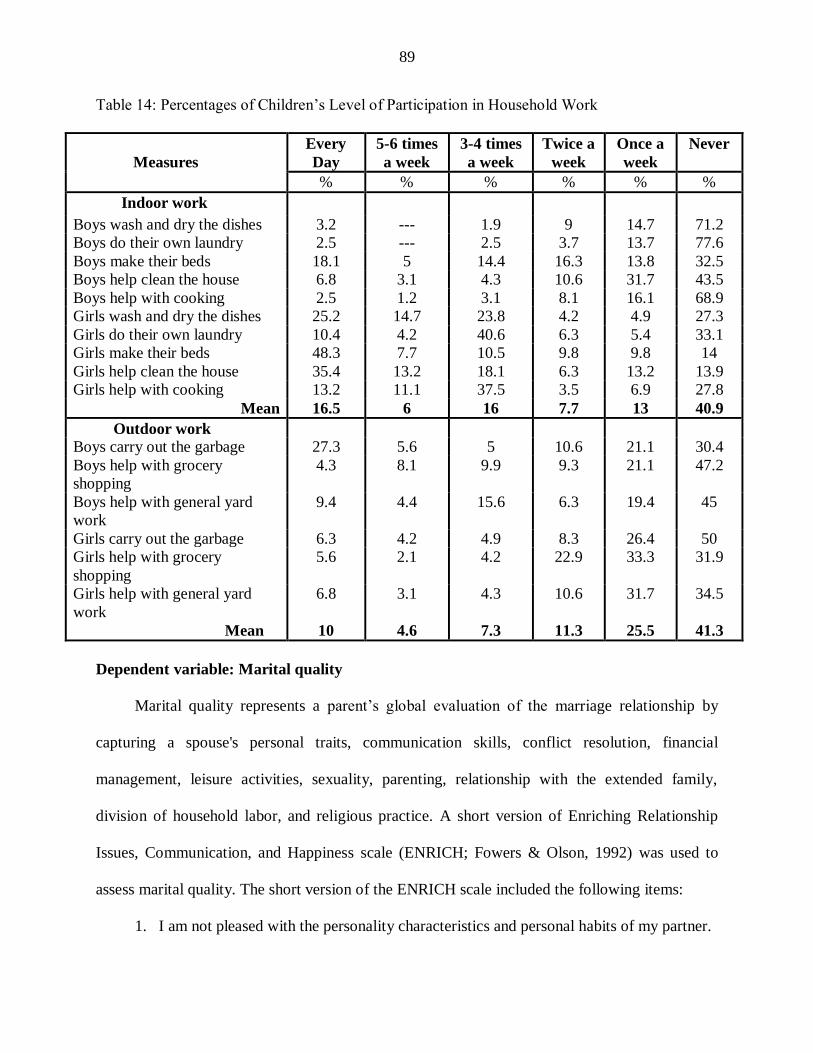
89
Table 14: Percentages of Children‘s Level of Participation in Household Work
Measures
Every
Day
5-6 times
a week
3-4 times
a week
Twice a
week
Once a
week
Never
% % % % % %
Indoor work
Boys wash and dry the dishes 3.2 --- 1.9 9 14.7 71.2
Boys do their own laundry 2.5 --- 2.5 3.7 13.7 77.6
Boys make their beds 18.1 5 14.4 16.3 13.8 32.5
Boys help clean the house 6.8 3.1 4.3 10.6 31.7 43.5
Boys help with cooking 2.5 1.2 3.1 8.1 16.1 68.9
Girls wash and dry the dishes 25.2 14.7 23.8 4.2 4.9 27.3
Girls do their own laundry 10.4 4.2 40.6 6.3 5.4 33.1
Girls make their beds 48.3 7.7 10.5 9.8 9.8 14
Girls help clean the house 35.4 13.2 18.1 6.3 13.2 13.9
Girls help with cooking 13.2 11.1 37.5 3.5 6.9 27.8
Mean 16.5 6 16 7.7 13 40.9
Outdoor work
Boys carry out the garbage 27.3 5.6 5 10.6 21.1 30.4
Boys help with grocery
shopping
4.3 8.1 9.9 9.3 21.1 47.2
Boys help with general yard
work
9.4 4.4 15.6 6.3 19.4 45
Girls carry out the garbage 6.3 4.2 4.9 8.3 26.4 50
Girls help with grocery
shopping
5.6 2.1 4.2 22.9 33.3 31.9
Girls help with general yard
work
6.8 3.1 4.3 10.6 31.7 34.5
Mean 10 4.6 7.3 11.3 25.5 41.3
Dependent variable: Marital quality
Marital quality represents a parent‘s global evaluation of the marriage relationship by
capturing a spouse's personal traits, communication skills, conflict resolution, financial
management, leisure activities, sexuality, parenting, relationship with the extended family,
division of household labor, and religious practice. A short version of Enriching Relationship
Issues, Communication, and Happiness scale (ENRICH; Fowers & Olson, 1992) was used to
assess marital quality. The short version of the ENRICH scale included the following items:
1. I am not pleased with the personality characteristics and personal habits of my partner.

90
2. I am very happy with how we handle role responsibilities in our marriage.
3. I am not happy about our communication and feel my partner does not understand me.
4. I am very happy about how we make decisions and resolve conflicts.
5. I am unhappy about our financial position and the way we make financial decisions.
6. I am very happy with how we manage our leisure activities and the time we spend
together.
7. I am very pleased about how we express affection and relate sexually.
8. I am not satisfied with the way we each handle our responsibilities as parents.
9. I am dissatisfied about our relationships with my parents, in-laws, and/or friends.
10. I feel very good about how we each practice our religious beliefs and values.
In table 15, ten measures of variable marital quality were considered. The results of all
measures of marital quality clearly indicated that the majority of respondents reported positive
marital quality. The percentage distribution of the first measure, ―I am not pleased with the
personality characteristics and personal habits of my partner,‖ suggested that the majority of the
respondents (67.8%) were more likely to disagree (strongly disagree, moderately disagree) with
this statement and about (27%) of the respondents agreed (strongly agree, moderately agree) with
it, while 5.1% remained neutral. Thus, respondents seemed to be pleased with their spouse's
personal traits.
The results for the second measure, ―I am very happy with how we handle role
responsibilities in our marriage,‖ revealed that the majority of the respondents (80.5%) were
more likely to agree (strongly agree, moderately agree) with this statement and very few
respondents (15.9%) disagreed (strongly disagree, moderately disagree) with this measure,
whereas 3.6% of respondents remained neutral.

91
With respect to the third measure, ―I am not happy about our communication and feel my
partner does not understand me,‖ the data imply that over 72% of respondents were more likely
to disagree (strongly disagree, moderately disagree) with this statement and only 22% of the
respondents agreed (strongly agree, moderately agree) with it, while 5.6% of them were neutral.
Therefore, respondents seemed to be happy about their communication with their spouse.
The fourth measure asked if respondents were very happy about how they made decisions
and resolved conflicts. The bulk of the respondents (77%) were more likely to agree (strongly
agree, moderately agree) that they were very happy about how they made decisions and resolved
conflicts, whereas few respondents (17.4%) were more likely to disagree (strongly disagree,
moderately disagree) with it and 5.6% were neutral.
The results of the fifth measure, ―I am unhappy about our financial position and the way
we make financial decisions,‖ indicated that over 67% of the respondents were more likely to
disagree (strongly disagree, moderately disagree) that they were not happy about the way they
dealt with their financial position, 27% of respondents were more likely to agree, and those who
were neutral were about 6%. This suggested that the majority of respondents seemed to be happy
with their way of dealing with their financial position and making financial decisions.
The percent distribution of the sixth measure, ―I am very happy with how we manage our
leisure activities and the time we spend together,‖ suggested that the majority of the respondents
(83.5%) were more likely to agree (strongly agree, moderately agree) about the way they
managed their leisure activities, while only 15.3 % of the respondents disagreed (strongly
disagree, moderately disagree) with this statement, and 10.2% of the respondents reported being
neutral.
92
With regard to the seventh measure, ―I am very pleased about how we express affection
and relate sexually,‖ the majority of the respondents (84%) were more likely to agree (strongly
agree, moderately agree) with this statement, although 14.3% of the respondents were more
likely to disagree (strongly disagree, moderately disagree) with this statement, and 10.2% of the
respondents reported being neutral.
Concerning the eighth measure, ―I am not satisfied with the way we each handle our
responsibilities as parents,‖ 75% of respondents were more likely to disagree (strongly disagree,
moderately disagree) with this statement, 13.3% of respondents were more likely to agree
(strongly agree, moderately agree), and 7.2% were neutral. Hence, the results implied that the
majority of respondents were satisfied with the way they handled their responsibilities as parents.
The outcomes of the ninth measure, ―I am dissatisfied about our relationships with my
parents, in-laws, and/or friends,‖ revealed that more than 70% of the respondents were more
likely to disagree (strongly disagree, moderately disagree) with this statement, few respondents
reported being in agreement (strongly agree, moderately agree), and 6.2% of the respondents
were more likely to be neutral. The results showed that the bulk of the respondents were satisfied
in their relationships with relatives.
The last measure dealt with the practice of religious beliefs and values, ―I feel very good
about how we each practice our religious beliefs and values.‖ Over 78% of the respondents were
more likely to agree (strongly agree, moderately agree) with this statement, 9.1% of the
respondents were more likely to disagree (strongly disagree, moderately disagree) with this
statement, and 12.4% were neutral.

93
Table 15: Percentages of Marital Quality Measures
Measures Strongly
disagree
Moderately
disagree
Neither agree
nor disagree
Moderately
agree
Strongly
agree
I am not pleased with the
personality characteristics and
personal habits of my partner.
40.8 27 5.1 17.3 9.7
I am very happy with how we
handle role responsibilities in
our marriage
2.6 13.3 3.6 39.5 41
I am not happy about our
communication and feel my
partner does not understand
48.5 24 5.6 17.9 4.1
I am very happy about how we
make decisions and resolve
conflicts.
3.6 13.8 5.6 41.3 35.7
I am unhappy about our
financial position and the way
we make financial decisions.
36.7 30.6 5.7 20.4 6.6
I am very happy with how we
manage our leisure activities
and the time we spend together.
3.6 11.7 10.2 40.3 43.2
I am very pleased about how we
express affection and relate
sexually.
4.6 8.7 11.7 30.6 44.4
I am not satisfied with the way
we each handle our
responsibilities as parents.
39.5 30.8 7.2 16.4 6.2
I am dissatisfied about our
relationship with my parents,
in-laws, and/or friends.
45.6 24.6 6.2 16.4 7.2
I feel very good about how we
each practice our religious
beliefs and values.
3.2 5.9 12.4 28.6 49.7
94
4.2 Data Analysis
4.2.1 Data construction and modification
Prior to multivariate analyses (multiple regression), various data modification procedures
were necessary. First, since regression analysis required interval-ratio or categorical dummy-
coded data, some variables were modified when used as predictors (independent variables).
Categorical independent variables, such as gender composition of children, gender preferences,
education, income, gender, place of birth, work status, and gender ideology were recorded to
assume dummy-coding (i.e., 0 and 1). Gender composition of children was a nominal level
variable with three categories (all boys, all girls, and mixed genders). This variable was dummy-
coded into three different variables (e.g., 1= all boys and 0 = other genders; 1= all girls and 0 =
other genders; and 1= mixed genders and 0 = other genders). For this study, the first two
dummy-coded variables (1= all boys and 0 = other genders; 1= all girls and 0 = other genders)
were included in the regression analysis of family size, whereas the following dummy-coded
variables: (1) 1= all boys and 0 = other genders; (2) 1= mixed genders and 0 = other genders
were used in the regression analyses of parental involvement with children in various activities,
children‘s participation in household work, and marital quality. Gender preference was also a
nominal level variable with four categories (boy preference, girl preference, balanced preference,
and indifferent). This variable was dummy-coded into three different variables (1= boy
preference and 0 = other preferences; 1= girl preference and 0 = other preferences; and 1=
balanced preference and 0 = other preferences). Regarding the education variable, the response
categories to this variable were: (1) less than high school, (2) a high school diploma or GED, (3)
associate degree (a two year college degree), (4) bachelor‘s degree, (5) master‘s degree, (6)
professional degree (M.D., DDS. Ph.D. or other doctorate degrees). Based on the frequency

95
distribution of the respondents in the sample, these response categories were collapsed and
dummy-coded to reflect (1= bachelor‘s degree and higher and 0 = less than bachelor‘s degree).
Further, the response categories to the income variable were: (1) less than $25,000; (2) $25,000-
$44,999; (3) $45,000-$64,999; (4) $65,000-$74,999; (5) $75,000-$94,999; and (6) $95,000 or
more. Based on the frequency distribution of the respondents in the sample and the median value
of income variable, these response categories were collapsed and recorded first to represent: (1)
low income ($44,999 and less); (2) middle income ($45,000-$64,999); and (3) high income
($65,000 and higher). Then, this variable was dummy-coded to reflect two different variables (1=
low income and 0 = others; 1= high income and 0 = others).
Composite measures or scales for the various outcomes (parental involvement with
children, children‘s participation in household work, and marital quality) also had to be created
and used in the bivariate and multivariate analyses so these variables assumed interval-ratio-like
properties. The creations of these additive scales are discussed below.
Measures of parental involvement with children
Parental involvement with children represents both behavioral and emotional
involvement. Twenty items were used to assess parents‘ behavioral involvement with children as
a whole (see table 16) and four items were used to evaluate parental emotional involvement with
children (see table 17). Factor analysis was conducted to determine if the twenty items
measuring parental behavioral involvement with children were measuring accurately. The
analysis derived six different factors. However, for purposes of this study, reliability analysis
was conducted to determine if the internal consistency of the variable (behavioral involvement
with children) was acceptable, and the results, as shown in table 16, indicated that all measures
selected were acceptable. The acceptable Cronbach alpha value (.897) ² for behavioral
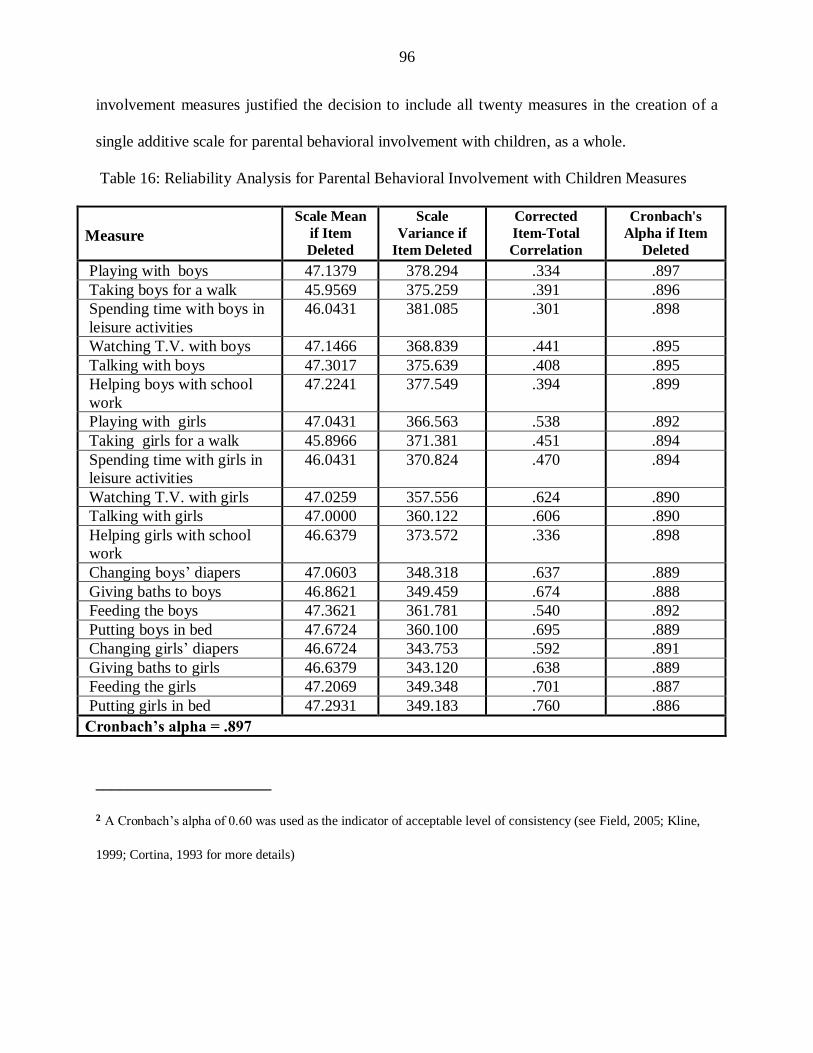
96
involvement measures justified the decision to include all twenty measures in the creation of a
single additive scale for parental behavioral involvement with children, as a whole.
Table 16: Reliability Analysis for Parental Behavioral Involvement with Children Measures
______________________
² A Cronbach‘s alpha of 0.60 was used as the indicator of acceptable level of consistency (see Field, 2005; Kline,
1999; Cortina, 1993 for more details)
Measure
Scale Mean
if Item
Deleted
Scale
Variance if
Item Deleted
Corrected
Item-Total
Correlation
Cronbach's
Alpha if Item
Deleted
Playing with boys 47.1379 378.294 .334 .897
Taking boys for a walk 45.9569 375.259 .391 .896
Spending time with boys in
leisure activities
46.0431 381.085 .301 .898
Watching T.V. with boys 47.1466 368.839 .441 .895
Talking with boys 47.3017 375.639 .408 .895
Helping boys with school
work
47.2241 377.549 .394 .899
Playing with girls 47.0431 366.563 .538 .892
Taking girls for a walk 45.8966 371.381 .451 .894
Spending time with girls in
leisure activities
46.0431 370.824 .470 .894
Watching T.V. with girls 47.0259 357.556 .624 .890
Talking with girls 47.0000 360.122 .606 .890
Helping girls with school
work
46.6379 373.572 .336 .898
Changing boys‘ diapers 47.0603 348.318 .637 .889
Giving baths to boys 46.8621 349.459 .674 .888
Feeding the boys 47.3621 361.781 .540 .892
Putting boys in bed 47.6724 360.100 .695 .889
Changing girls‘ diapers 46.6724 343.753 .592 .891
Giving baths to girls 46.6379 343.120 .638 .889
Feeding the girls 47.2069 349.348 .701 .887
Putting girls in bed 47.2931 349.183 .760 .886
Cronbach’s alpha = .897
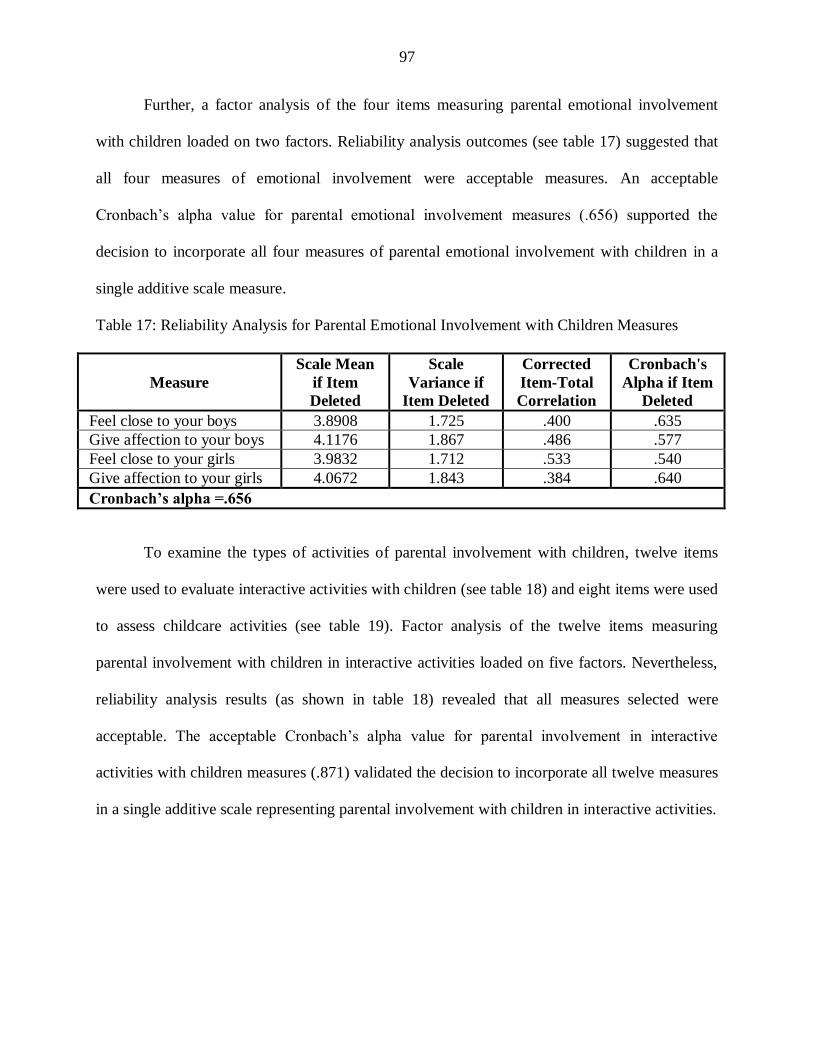
97
Further, a factor analysis of the four items measuring parental emotional involvement
with children loaded on two factors. Reliability analysis outcomes (see table 17) suggested that
all four measures of emotional involvement were acceptable measures. An acceptable
Cronbach‘s alpha value for parental emotional involvement measures (.656) supported the
decision to incorporate all four measures of parental emotional involvement with children in a
single additive scale measure.
Table 17: Reliability Analysis for Parental Emotional Involvement with Children Measures
Measure
Scale Mean
if Item
Deleted
Scale
Variance if
Item Deleted
Corrected
Item-Total
Correlation
Cronbach's
Alpha if Item
Deleted
Feel close to your boys 3.8908 1.725 .400 .635
Give affection to your boys 4.1176 1.867 .486 .577
Feel close to your girls 3.9832 1.712 .533 .540
Give affection to your girls 4.0672 1.843 .384 .640
Cronbach’s alpha =.656
To examine the types of activities of parental involvement with children, twelve items
were used to evaluate interactive activities with children (see table 18) and eight items were used
to assess childcare activities (see table 19). Factor analysis of the twelve items measuring
parental involvement with children in interactive activities loaded on five factors. Nevertheless,
reliability analysis results (as shown in table 18) revealed that all measures selected were
acceptable. The acceptable Cronbach‘s alpha value for parental involvement in interactive
activities with children measures (.871) validated the decision to incorporate all twelve measures
in a single additive scale representing parental involvement with children in interactive activities.

98
Table 18: Reliability Analysis for Parental Involvement with Children in Interactive Activities
Measures
Measure Scale Mean
if Item
Deleted
Scale
Variance if
Item Deleted
Corrected
Item-Total
Correlation
Cronbach's
Alpha if Item
Deleted
Playing with boys 29.1780 125.652 .629 .856
Taking boys for a walk 28.0085 125.034 .650 .855
Spending time with
boys in leisure activities 28.0678 130.662 .492 .864
Watching T.V. with
boys 29.1695 123.698 .609 .857
Talking with boys 29.3390 131.217 .490 .864
Helping boys with
school work 29.2203 130.071 .402 .871
Playing with girls 29.0847 123.514 .692 .852
Taking girls for a walk 27.9492 124.835 .642 .855
Spending time with girls
in leisure activities 28.0678 128.218 .546 .861
Watching T.V. with
girls 29.0508 121.502 .672 .853
Talking with girls 29.0424 127.340 .524 .862
Helping girls with
school work 28.6441 129.735 .390 .872
Cronbach’s alpha =.871
Factor analysis of the eight items measuring parental involvement with children in
childcare activities when they were babies loaded on two factors. For this study, reliability
analysis was conducted and the results, as viewed in table 19, showed that all measures selected
were acceptable measures. An acceptable Cronbach alpha value (.954) for parental involvement
with children in childcare activities measures justified the decision to include all eight measures
in the creation of a single additive scale reflecting parental involvement with children in
childcare activities.
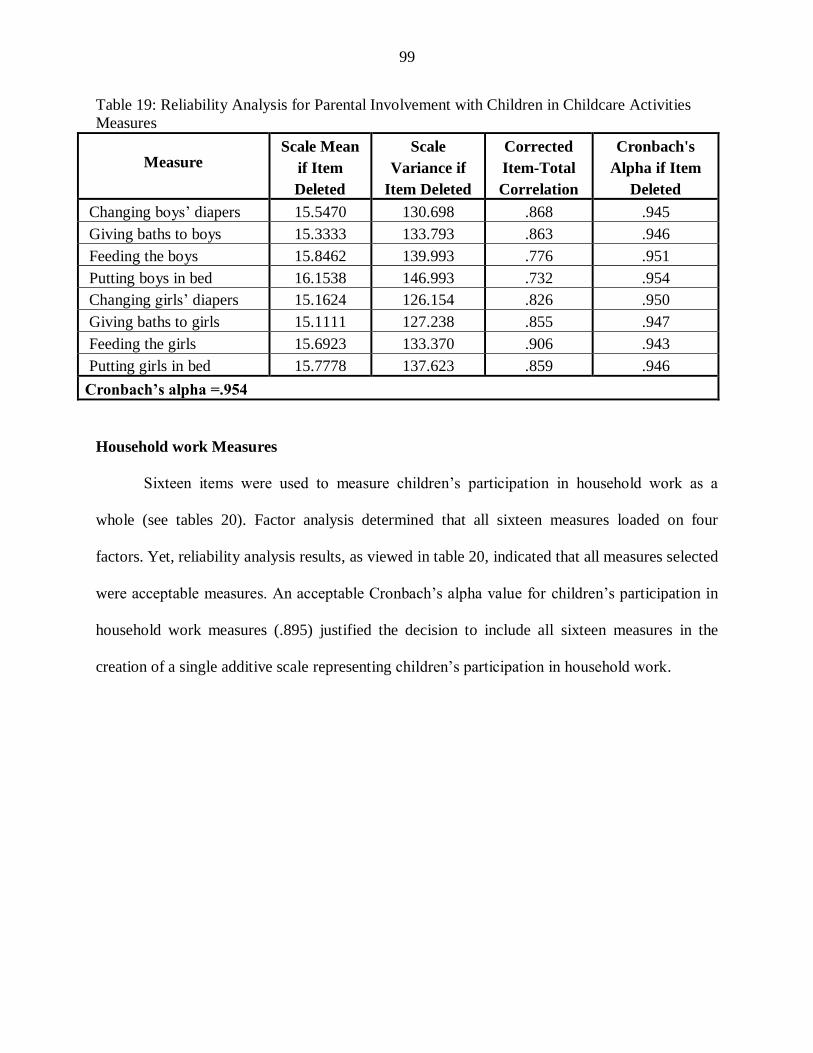
99
Table 19: Reliability Analysis for Parental Involvement with Children in Childcare Activities
Measures
Measure Scale Mean
if Item
Deleted
Scale
Variance if
Item Deleted
Corrected
Item-Total
Correlation
Cronbach's
Alpha if Item
Deleted
Changing boys‘ diapers 15.5470 130.698 .868 .945
Giving baths to boys 15.3333 133.793 .863 .946
Feeding the boys 15.8462 139.993 .776 .951
Putting boys in bed 16.1538 146.993 .732 .954
Changing girls‘ diapers 15.1624 126.154 .826 .950
Giving baths to girls 15.1111 127.238 .855 .947
Feeding the girls 15.6923 133.370 .906 .943
Putting girls in bed 15.7778 137.623 .859 .946
Cronbach’s alpha =.954
Household work Measures
Sixteen items were used to measure children‘s participation in household work as a
whole (see tables 20). Factor analysis determined that all sixteen measures loaded on four
factors. Yet, reliability analysis results, as viewed in table 20, indicated that all measures selected
were acceptable measures. An acceptable Cronbach‘s alpha value for children‘s participation in
household work measures (.895) justified the decision to include all sixteen measures in the
creation of a single additive scale representing children‘s participation in household work.

100
Table 20: Reliability Analysis of Household Work Measures
Measures Scale Mean
if Item
Deleted
Scale
Variance if
Item Deleted
Corrected
Item-Total
Correlation
Cronbach's
Alpha if Item
Deleted
Boys wash and dry dishes 64.7664 233.237 .411 .893
Boys do their own laundry 64.5514 233.533 .489 .892
Boys make their own bed 66.1308 222.285 .406 .895
Boys help cleaning the house 65.2804 228.072 .411 .893
Boys carry out the garbage 66.3458 202.474 .705 .882
Boys help with cooking 64.7944 229.938 .490 .891
Boys help with grocery shopping 65.4486 222.099 .545 .889
Boys help with general yard work 65.6075 215.505 .623 .886
Girls wash and dry dishes 66.9907 204.387 .720 .882
Girls do their own laundry 66.0748 208.070 .684 .883
Girls make their own bed 67.4953 206.705 .659 .885
Girls help cleaning the house 67.4112 213.395 .583 .888
Girls carry out the garbage 65.2243 227.081 .431 .893
Girls help with cooking 66.5514 207.665 .731 .881
Girls help with grocery shopping 65.4486 221.759 .588 .888
Girls help with general yard work 64.6822 233.917 .457 .893
Cronbach’s alpha =.895
To examine the types of household work that children (girls/boys) may have been asked
to do, ten items were used to assess children‘s participation in indoor work (see table 21) and six
items were used to evaluate their participation in outdoor work (see table 22). A factor analysis
of the ten items measuring indoor work loaded on two factors. Reliability analysis was
conducted to determine if the internal consistency of the variable (indoor work) was acceptable.
The reliability analysis results (see table 21) suggested that all measures of indoor work were
acceptable. The acceptable Cronbach‘s alpha value for children‘s participation in indoor work
measures (.85) supported the decision to create a single additive scale that incorporated all ten
measures of indoor work.

101
Table 21: Reliability Analysis for Indoor Household Work Measures
Measure Scale Mean
if Item
Deleted
Scale
Variance if
Item Deleted
Corrected
Item-Total
Correlation
Cronbach's
Alpha if Item
Deleted
Boys wash and dry dishes 36.4019 100.563 .400 .846
Boys do their own laundry 36.1869 101.946 .413 .846
Boys make their own bed 37.7664 93.445 .380 .851
Boys help cleaning the house 36.9159 97.323 .388 .847
Boys help with cooking 36.4299 99.436 .430 .844
Girls wash and dry dishes 38.6262 79.953 .772 .810
Girls do their own laundry 37.7103 85.283 .635 .826
Girls make their own bed 39.1308 81.473 .703 .818
Girls help cleaning the house 39.0467 85.385 .639 .825
Girls help with cooking 38.1869 83.833 .725 .816
Cronbach’s alpha =.85
Factor analysis was also employed to determine if the six items measuring outdoor work
were correct. The analysis revealed two different factors. Reliability analysis was also conducted
to determine if the internal consistency of the variable (outdoor work that children might have
been asked to do) was acceptable. The results (see table 22) revealed that all measures selected
were acceptable. An acceptable Cronbach alpha value of outdoor measures (.79) justified the
decision to include all six measures in the creation of a single additive scale representing
children‘s participation in outdoor work.
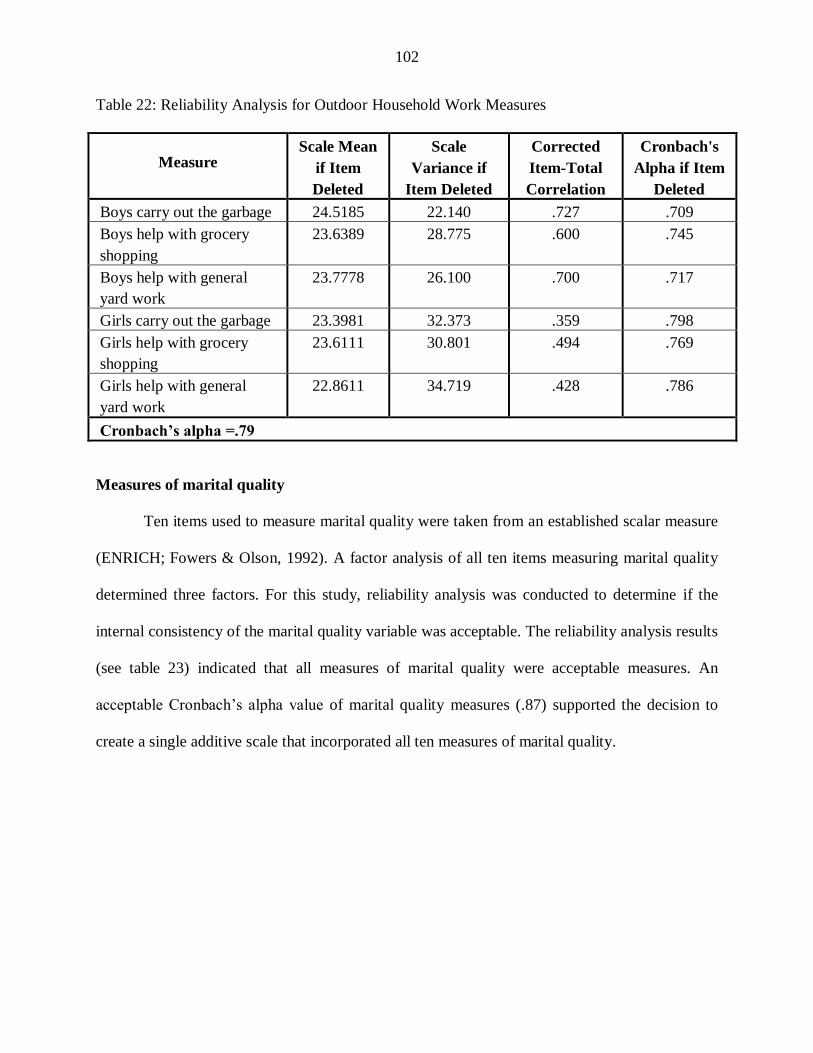
102
Table 22: Reliability Analysis for Outdoor Household Work Measures
Measure Scale Mean
if Item
Deleted
Scale
Variance if
Item Deleted
Corrected
Item-Total
Correlation
Cronbach's
Alpha if Item
Deleted
Boys carry out the garbage 24.5185 22.140 .727 .709
Boys help with grocery
shopping
23.6389 28.775 .600 .745
Boys help with general
yard work
23.7778 26.100 .700 .717
Girls carry out the garbage 23.3981 32.373 .359 .798
Girls help with grocery
shopping
23.6111 30.801 .494 .769
Girls help with general
yard work
22.8611 34.719 .428 .786
Cronbach’s alpha =.79
Measures of marital quality
Ten items used to measure marital quality were taken from an established scalar measure
(ENRICH; Fowers & Olson, 1992). A factor analysis of all ten items measuring marital quality
determined three factors. For this study, reliability analysis was conducted to determine if the
internal consistency of the marital quality variable was acceptable. The reliability analysis results
(see table 23) indicated that all measures of marital quality were acceptable measures. An
acceptable Cronbach‘s alpha value of marital quality measures (.87) supported the decision to
create a single additive scale that incorporated all ten measures of marital quality.

103
Table 23: Reliability Analysis for Marital Quality Measures
Measure
Scale Mean
if Item
Deleted
Scale
Variance if
Item Deleted
Corrected
Item-Total
Correlation
Cronbach's
Alpha if Item
Deleted
Very happy about handling role
responsibilities in marriage
35.2143 54.655 .679 .848
Happy about making decisions
& resolving conflicts
35.3242 54.872 .621 .852
Happy with managing leisure
activities & time
35.3516 55.401 .617 .852
Pleased about affection &
relating sexually
35.2143 55.374 .595 .854
Feel very good about practicing
religious beliefs and values
35.1044 60.105 .322 .873
Pleased with the personality
characteristics and personal
habits of my partner.
35.5440 53.133 .567 .857
Not happy about our
communication and feel my
partner does not understand
35.2802 51.728 .733 .842
Unhappy about our financial
position and the way we make
financial decisions.
35.5824 54.311 .532 .859
Not satisfied with the way we
each handle our responsibilities as
parents.
35.3956 54.660 .560 .856
Dissatisfied about our
relationship with my parents, in-
laws, and/or friends
35.3626 53.028 .621 .851
Cronbach’s alpha =.87
Gender Ideology
Gender ideology was used as a control variable in the regression analysis. It was
measured with four items adopted from the National Survey of Family and Household wave II
(NSFH2) 1992-1994. Factor analysis of the four items measuring gender ideology revealed two
factors. Nonetheless, an acceptable Cronbach alpha value of gender ideology measures (.93)
validated the decision to build a single additive scale that included all four measures (see table
24). This additive scale was then dummy-coded and used later in the regression analysis.
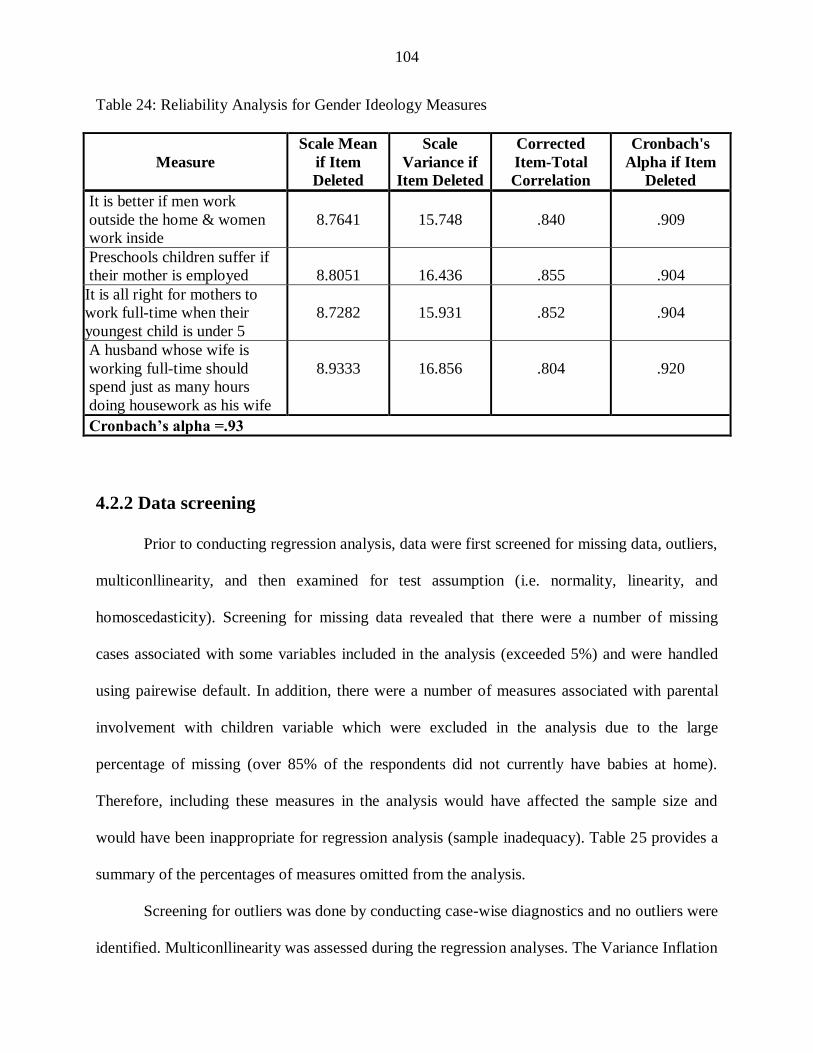
104
Table 24: Reliability Analysis for Gender Ideology Measures
Measure
Scale Mean
if Item
Deleted
Scale
Variance if
Item Deleted
Corrected
Item-Total
Correlation
Cronbach's
Alpha if Item
Deleted
It is better if men work
outside the home & women
work inside
8.7641
15.748
.840
.909
Preschools children suffer if
their mother is employed
8.8051
16.436
.855
.904
It is all right for mothers to
work full-time when their
youngest child is under 5
8.7282
15.931
.852
.904
A husband whose wife is
working full-time should
spend just as many hours
doing housework as his wife
8.9333
16.856
.804
.920
Cronbach’s alpha =.93
4.2.2 Data screening
Prior to conducting regression analysis, data were first screened for missing data, outliers,
multiconllinearity, and then examined for test assumption (i.e. normality, linearity, and
homoscedasticity). Screening for missing data revealed that there were a number of missing
cases associated with some variables included in the analysis (exceeded 5%) and were handled
using pairewise default. In addition, there were a number of measures associated with parental
involvement with children variable which were excluded in the analysis due to the large
percentage of missing (over 85% of the respondents did not currently have babies at home).
Therefore, including these measures in the analysis would have affected the sample size and
would have been inappropriate for regression analysis (sample inadequacy). Table 25 provides a
summary of the percentages of measures omitted from the analysis.
Screening for outliers was done by conducting case-wise diagnostics and no outliers were
identified. Multiconllinearity was assessed during the regression analyses. The Variance Inflation
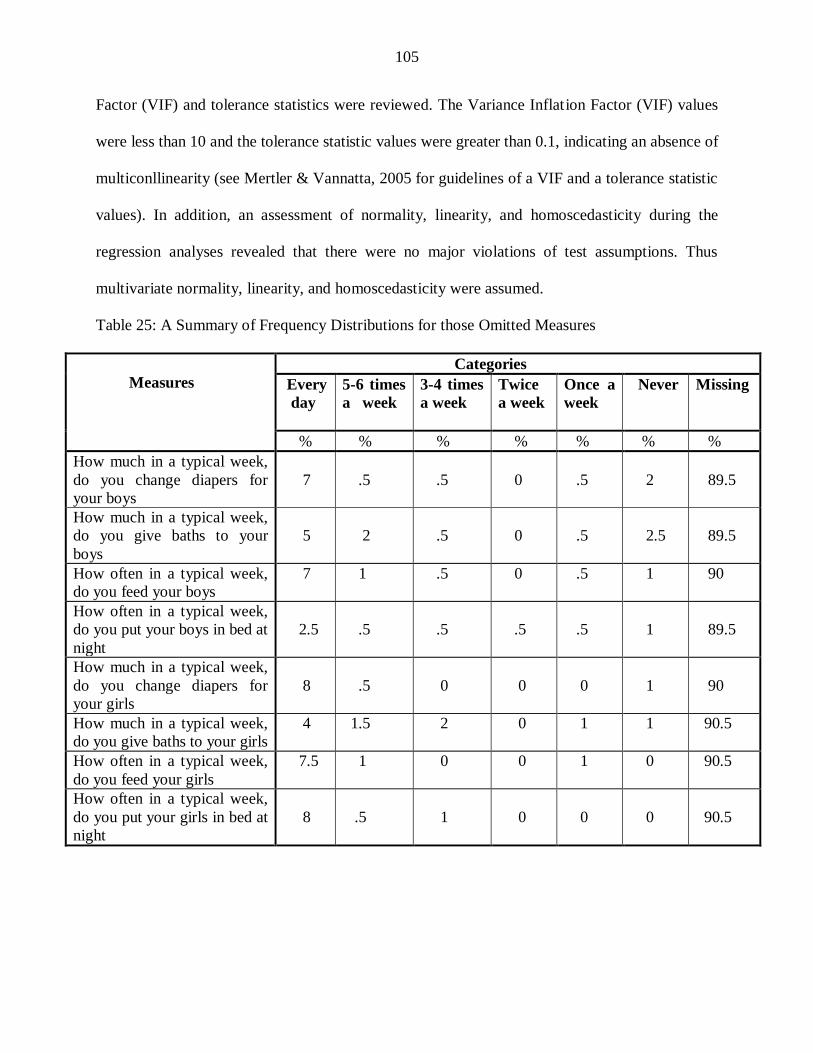
105
Factor (VIF) and tolerance statistics were reviewed. The Variance Inflation Factor (VIF) values
were less than 10 and the tolerance statistic values were greater than 0.1, indicating an absence of
multiconllinearity (see Mertler & Vannatta, 2005 for guidelines of a VIF and a tolerance statistic
values). In addition, an assessment of normality, linearity, and homoscedasticity during the
regression analyses revealed that there were no major violations of test assumptions. Thus
multivariate normality, linearity, and homoscedasticity were assumed.
Table 25: A Summary of Frequency Distributions for those Omitted Measures
Measures
Categories
Every
day
5-6 times
a week
3-4 times
a week
Twice
a week
Once a
week
Never
Missing
% % % % % % %
How much in a typical week,
do you change diapers for
your boys
7
.5
.5
0
.5
2
89.5
How much in a typical week,
do you give baths to your
boys
5
2
.5
0
.5
2.5
89.5
How often in a typical week,
do you feed your boys
7 1 .5 0 .5 1 90
How often in a typical week,
do you put your boys in bed at
night
2.5
.5
.5
.5
.5
1
89.5
How much in a typical week,
do you change diapers for
your girls
8
.5
0
0
0
1
90
How much in a typical week,
do you give baths to your girls
4 1.5 2 0 1 1 90.5
How often in a typical week,
do you feed your girls
7.5 1 0 0 1 0 90.5
How often in a typical week,
do you put your girls in bed at
night
8
.5
1
0
0
0
90.5
106
4.3 Bivariate Analysis
In this section, a series of One-Way ANOVA analyses were used to determine whether
various family processes differed by parental gender preferences regarding children and
children‘s gender composition. Specifically, whether family size varied by parental gender
preferences and children‘s gender composition; whether parental involvement with children in
various activities and children‘s participation in household work varied by gender composition;
and whether marital quality differed by parental gender preferences and children‘s gender
composition. In addition, a series of simple regression analyses were used to test whether gender
ratio predicted parental involvement with children, children‘s participation in household work,
and marital quality.
4.3.1 Differences in family size by gender preferences and gender composition
Univariate analysis indicated that family size varied by parental gender preference
regarding children and children‘s gender composition. Specifically, parents with a boy
preference were more likely to have a bigger family size than parents with girls, balanced, or
indifferent preferences. Parents with only girls were more likely to have a bigger family size than
parents with only boys or mixed gender. These results also were supported by the bivariate
analyses. Two One-Way ANOVA analyses were conducted to determine whether family size
differed by parental gender preferences regarding children and children‘s gender composition.
The first analysis was performed to test whether family size significantly differed by parental
gender preferences. The results in table 26 show that family size significantly differed by
parental gender preferences with regard to children (F =20.456, df = 3, p<.05).
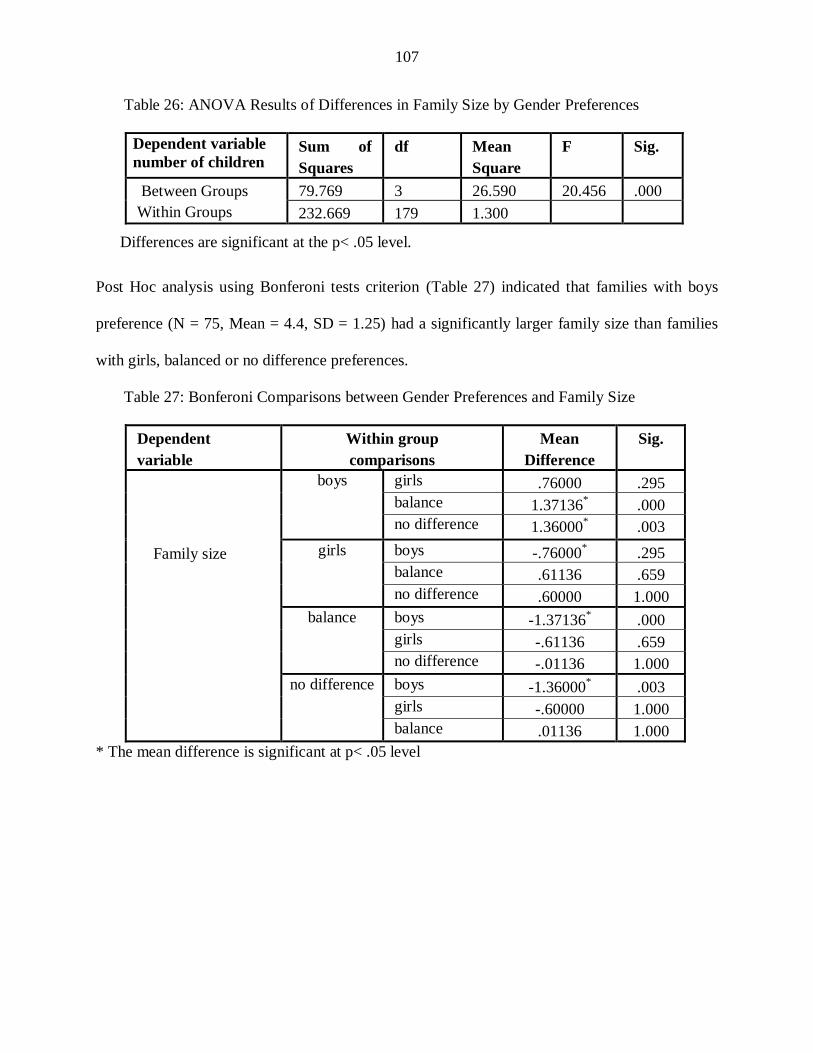
107
Table 26: ANOVA Results of Differences in Family Size by Gender Preferences
Dependent variable
number of children Sum of
Squares
df Mean
Square
F Sig.
Between Groups
Within Groups
79.769 3 26.590 20.456 .000
232.669 179 1.300
Differences are significant at the p< .05 level.
Post Hoc analysis using Bonferoni tests criterion (Table 27) indicated that families with boys
preference (N = 75, Mean = 4.4, SD = 1.25) had a significantly larger family size than families
with girls, balanced or no difference preferences.
Table 27: Bonferoni Comparisons between Gender Preferences and Family Size
Dependent
variable
Within group
comparisons
Mean
Difference
Sig.
Family size
boys
girls .76000 .295
balance 1.37136* .000
no difference 1.36000* .003
girls
boys -.76000* .295
balance .61136 .659
no difference .60000 1.000
balance
boys -1.37136* .000
girls -.61136 .659
no difference -.01136 1.000
no difference boys -1.36000* .003
girls -.60000 1.000
balance .01136 1.000
* The mean difference is significant at p< .05 level
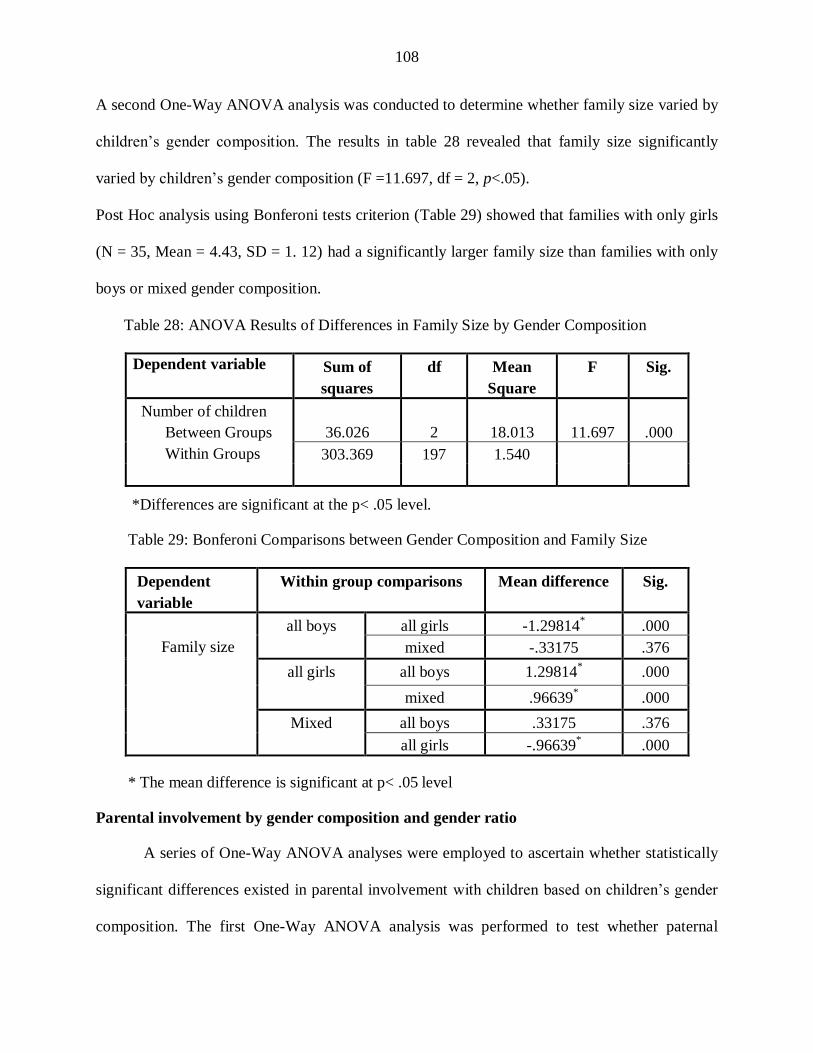
108
A second One-Way ANOVA analysis was conducted to determine whether family size varied by
children‘s gender composition. The results in table 28 revealed that family size significantly
varied by children‘s gender composition (F =11.697, df = 2, p<.05).
Post Hoc analysis using Bonferoni tests criterion (Table 29) showed that families with only girls
(N = 35, Mean = 4.43, SD = 1. 12) had a significantly larger family size than families with only
boys or mixed gender composition.
Table 28: ANOVA Results of Differences in Family Size by Gender Composition
Dependent variable
Sum of
squares
df Mean
Square
F Sig.
Number of children
Between Groups
Within Groups
36.026
2
18.013
11.697
.000
303.369 197 1.540
*Differences are significant at the p< .05 level.
Table 29: Bonferoni Comparisons between Gender Composition and Family Size
Dependent
variable
Within group comparisons Mean difference Sig.
Family size
all boys
all girls -1.29814* .000
mixed -.33175 .376
all girls all boys 1.29814* .000
mixed .96639* .000
Mixed all boys .33175 .376
all girls -.96639* .000
* The mean difference is significant at p< .05 level
Parental involvement by gender composition and gender ratio
A series of One-Way ANOVA analyses were employed to ascertain whether statistically
significant differences existed in parental involvement with children based on children‘s gender
composition. The first One-Way ANOVA analysis was performed to test whether paternal

109
behavioral involvement with children significantly varied by children‘s gender composition. The
results in table 30 declared that paternal behavioral involvement with children significantly
differed by children‘s gender composition (F =50.750, df = 2, p<.05).
An assessment of Post Hoc analysis using Bonferoni tests (Table 31) showed that fathers
with mixed gender of children (N = 46, Mean =63.97, SD = 18.57) had a significantly higher
level of involvement compared to fathers with all girls or all boys at the .05 level of
significance. The second One-Way ANOVA analysis was conducted to evaluate whether
paternal emotional involvement with children significantly differed by children‘s gender
composition. The ANOVA results in table 30 asserted that paternal emotional involvement with
children significantly varied by children‘s gender composition (F =22.929, df = 2, p<.05). Post
Hoc analysis using Bonferoni tests also (Table 31) showed that fathers with mixed gender of
children (N = 46, Mean =5.6, SD = 1.98) had a significantly higher level of emotional
involvement than fathers with all girls or all boys at the .05 level of significance.
The third One-Way ANOVA analysis was conducted to evaluate whether children‘s
gender composition differed in paternal involvement with children in interactive activities. The
ANOVA results in table 30 emphasized that paternal involvement with children in interactive
activities significantly varied by children‘s gender composition (F =30.175, df = 2, p<.05).
Post Hoc analysis using Bonferoni tests (Table 31) also showed that fathers with mixed
gender of children (N = 46, Mean =33.6, SD = 12.8) had a significantly higher level of
involvement in interactive activities than fathers with all girls or all boys at the .05 level of
significance.

110
Table 30: ANOVA Results of Differences in Parental Behavioral and Emotional
Involvement and Involvement in Interactive Activities by Gender Composition
Dependent variables Sum of
squares
df Mean
Square
F Sig.
Behavioral involvement
Between Groups
Within Groups
24429.301 2 12214.650 50.750 .000
19735.923 82 240.682
Emotional involvement
Between Groups
Within Groups
145.339
2
72.670
22.929
.000
259.884 82 3.169
Interactive activities
Between Groups
Within Groups
6620.181
2
3310.091
30.175
.000
8995.042 82 109.696
* Differences are significant at the p< .05 level.
Table 31: Bonferoni Comparisons between Gender Composition and Behavioral and
Emotional Involvement and Involvement in the Interactive Activities
Dependent
variables
Within group comparisons Mean difference Sig.
Behavioral
involvement
all boys
all girls -6.05556 .683
mixed -37.03382* .000
all girls
all boys 6.05556 .683
mixed -30.97826* .000
Mixed all boys 37.03382* .000
all girls 30.97826* .000
Emotional
involvement
all boys
all girls -1.16667 .134
mixed -3.13043* .000
all girls
all boys 1.16667 .134
mixed -1.96377* .000
mixed all boys 3.13043* .000
all girls 1.96377* .000
Interactive
activities
all boys
all girls -2.69048 1.000
mixed -19.06522* .000
all girls all boys 2.69048 1.000
mixed -16.37474* .000
mixed all boys 19.06522* .000
all girls 16.37474* .000
* The mean difference is significant at p< .05 level
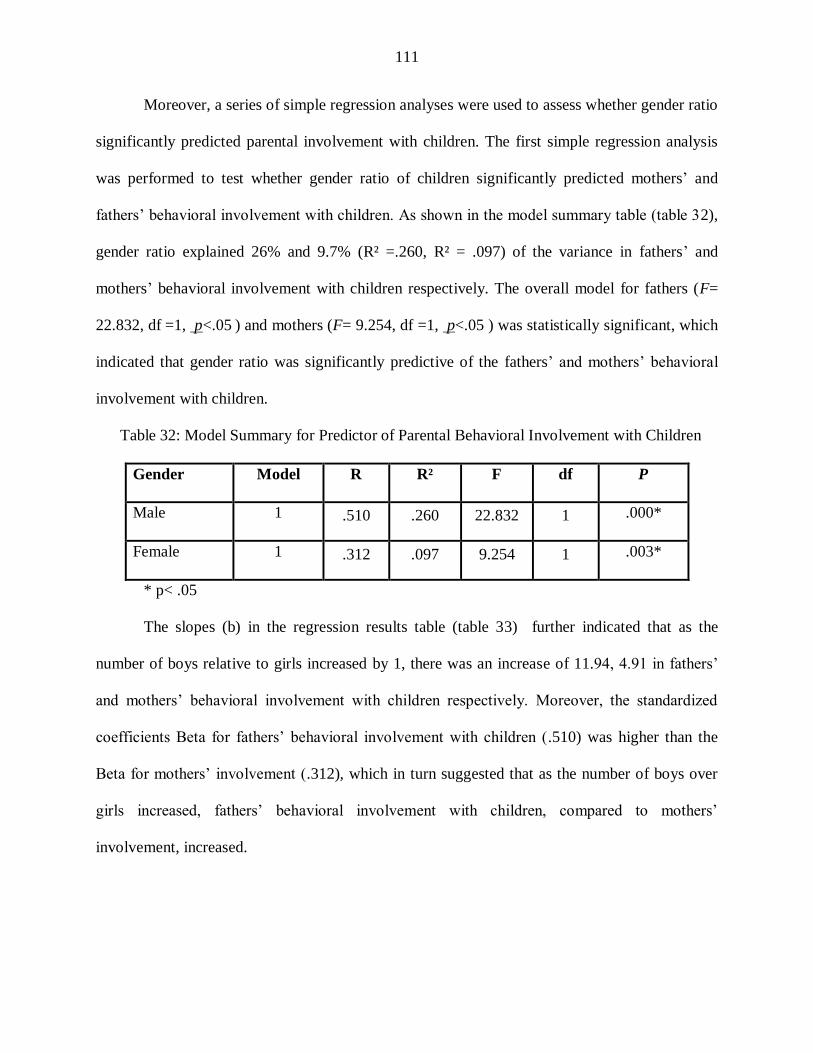
111
Moreover, a series of simple regression analyses were used to assess whether gender ratio
significantly predicted parental involvement with children. The first simple regression analysis
was performed to test whether gender ratio of children significantly predicted mothers‘ and
fathers‘ behavioral involvement with children. As shown in the model summary table (table 32),
gender ratio explained 26% and 9.7% (R² =.260, R² = .097) of the variance in fathers‘ and
mothers‘ behavioral involvement with children respectively. The overall model for fathers (F=
22.832, df =1, p<.05 ) and mothers (F= 9.254, df =1, p<.05 ) was statistically significant, which
indicated that gender ratio was significantly predictive of the fathers‘ and mothers‘ behavioral
involvement with children.
Table 32: Model Summary for Predictor of Parental Behavioral Involvement with Children
Gender Model R R² F df P
Male 1 .510 .260 22.832 1 .000*
Female 1 .312 .097 9.254 1 .003*
* p< .05
The slopes (b) in the regression results table (table 33) further indicated that as the
number of boys relative to girls increased by 1, there was an increase of 11.94, 4.91 in fathers‘
and mothers‘ behavioral involvement with children respectively. Moreover, the standardized
coefficients Beta for fathers‘ behavioral involvement with children (.510) was higher than the
Beta for mothers‘ involvement (.312), which in turn suggested that as the number of boys over
girls increased, fathers‘ behavioral involvement with children, compared to mothers‘
involvement, increased.
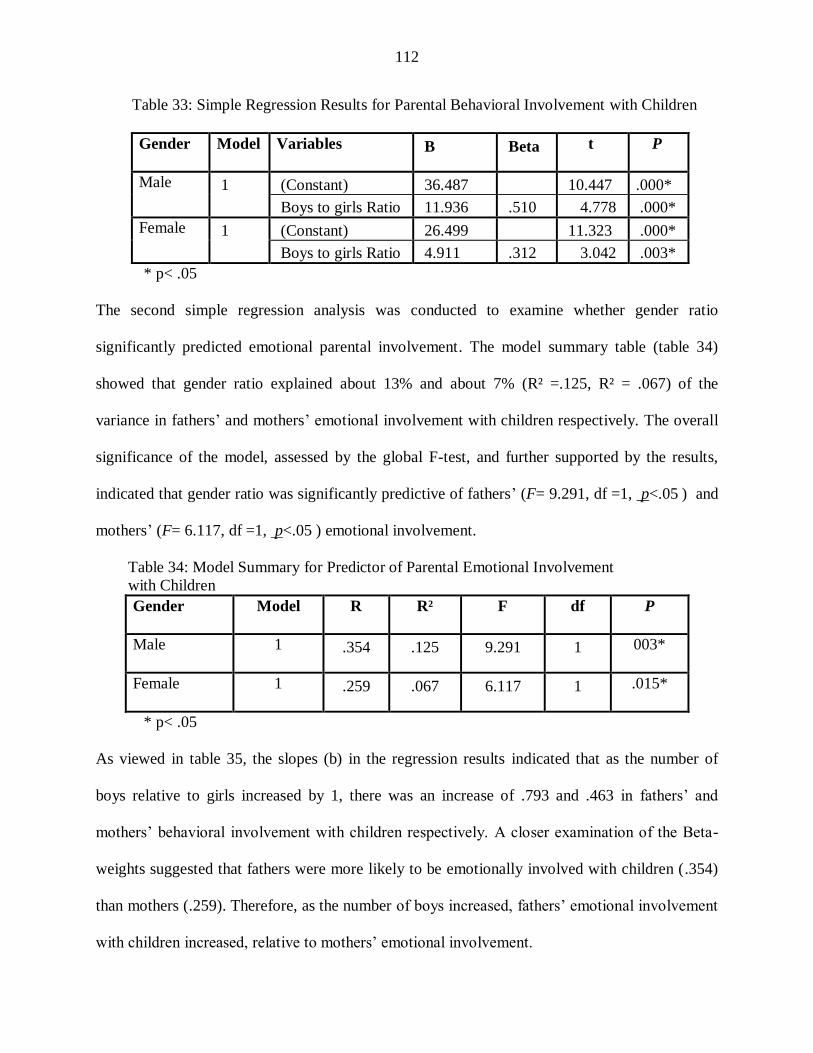
112
Table 33: Simple Regression Results for Parental Behavioral Involvement with Children
Gender Model Variables B Beta t P
Male 1 (Constant) 36.487 10.447 .000*
Boys to girls Ratio 11.936 .510 4.778 .000*
Female 1 (Constant) 26.499 11.323 .000*
Boys to girls Ratio 4.911 .312 3.042 .003*
* p< .05
The second simple regression analysis was conducted to examine whether gender ratio
significantly predicted emotional parental involvement. The model summary table (table 34)
showed that gender ratio explained about 13% and about 7% (R² =.125, R² = .067) of the
variance in fathers‘ and mothers‘ emotional involvement with children respectively. The overall
significance of the model, assessed by the global F-test, and further supported by the results,
indicated that gender ratio was significantly predictive of fathers‘ (F= 9.291, df =1, p<.05 ) and
mothers‘ (F= 6.117, df =1, p<.05 ) emotional involvement.
Table 34: Model Summary for Predictor of Parental Emotional Involvement
with Children
Gender Model R R² F df P
Male 1 .354 .125 9.291 1 003*
Female 1 .259 .067 6.117 1 .015*
* p< .05
As viewed in table 35, the slopes (b) in the regression results indicated that as the number of
boys relative to girls increased by 1, there was an increase of .793 and .463 in fathers‘ and
mothers‘ behavioral involvement with children respectively. A closer examination of the Beta-
weights suggested that fathers were more likely to be emotionally involved with children (.354)
than mothers (.259). Therefore, as the number of boys increased, fathers‘ emotional involvement
with children increased, relative to mothers‘ emotional involvement.

113
Table 35: Simple Regression Results for Parental Emotional Involvement with Children
Gender Model Variables B Beta t p
Male 1 (Constant) 3.685 10.131 .000*
Boys to girls
Ratio
.793 .354 3.048 .003*
Female 1 (Constant) 3.749 13.813 .000*
Boys to girls
Ratio
.463 .259 2.473 .015*
* p< .05
The third simple regression analysis was performed to look at whether parental
involvement in interactive activities with children was significantly predicted by gender ratio.
The results in the model summary table (table 36) showed that gender ratio explained about 13%
and about 11% (R² =.128, R² = .109) of the variance in fathers‘ and mothers‘ involvement with
children in interactive activities respectively. The overall significance of the model, assessed by
the global F-test, and further supported by the results, indicated that gender ratio is significantly
predictive of fathers‘ (F= 9.551, df =1, p<.05 ) and mothers‘ (F= 10.401, df =1, p<.05 )
involvement in interactive activities.
Table 36: Model Summary for Predictor of Parental Involvement with Children
in Interactive Activities
Gender Model R R² F df P
Male 1 .358 .128 9.551 1 .003*
Female 1 .330 .109 10.401 1 .002*
* p< .05
The slopes (b) in the regression results table (table 37) further pointed out that as the
number of boys relative to girls increased by 1, there was an increase of 4.982 and 4.113 in
fathers‘ and mothers‘ involvement with children in interactive activities respectively. In addition,
the standardized coefficients Beta for fathers‘ involvement with children (.358) was slightly
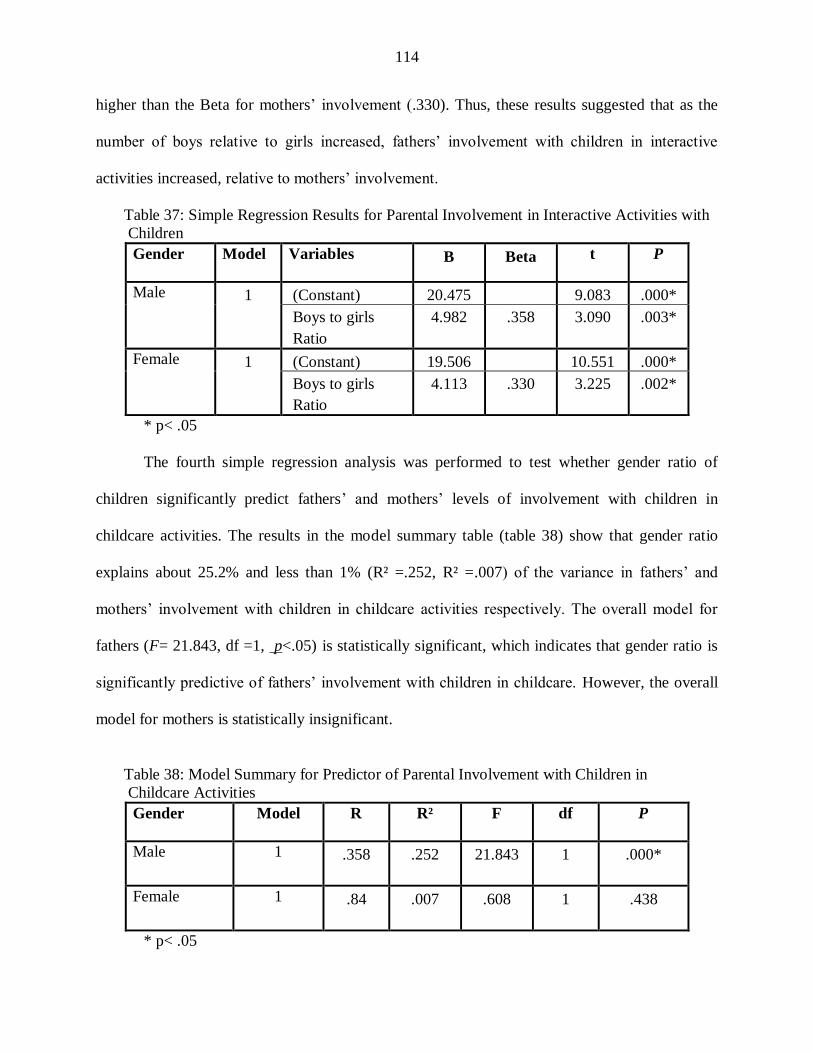
114
higher than the Beta for mothers‘ involvement (.330). Thus, these results suggested that as the
number of boys relative to girls increased, fathers‘ involvement with children in interactive
activities increased, relative to mothers‘ involvement.
Table 37: Simple Regression Results for Parental Involvement in Interactive Activities with
Children
Gender Model Variables B Beta t P
Male 1 (Constant) 20.475 9.083 .000*
Boys to girls
Ratio
4.982 .358 3.090 .003*
Female 1 (Constant) 19.506 10.551 .000*
Boys to girls
Ratio
4.113 .330 3.225 .002*
* p< .05
The fourth simple regression analysis was performed to test whether gender ratio of
children significantly predict fathers‘ and mothers‘ levels of involvement with children in
childcare activities. The results in the model summary table (table 38) show that gender ratio
explains about 25.2% and less than 1% (R² =.252, R² =.007) of the variance in fathers‘ and
mothers‘ involvement with children in childcare activities respectively. The overall model for
fathers (F= 21.843, df =1, p<.05) is statistically significant, which indicates that gender ratio is
significantly predictive of fathers‘ involvement with children in childcare. However, the overall
model for mothers is statistically insignificant.
Table 38: Model Summary for Predictor of Parental Involvement with Children in
Childcare Activities
Gender Model R R² F df P
Male 1 .358 .252 21.843 1 .000*
Female 1 .84 .007 .608 1 .438
* p< .05

115
Examination of the slopes (b) in the regression results table (table 39) also indicates that
gender ratio significantly predicts fathers‘ involvement with children in childcare activities. As
the number of boys relative to girls increases by 1, there is an increase of 6.715 in fathers‘
involvement with children in childcare activities. Gender ratio however did not significantly
predict mothers‘ involvement with children in childcare activities. In addition, the standardized
coefficients Beta for fathers‘ involvement with children (.502) indicated that the relationship
between gender ratio and fathers‘ involvement with children in childcare activities is moderate
and positive. The results imply that as the number of boys compared to girls increases, fathers‘
involvement with children in childcare activities relative to that of mothers‘ increases.
Table 39: Simple Regression Results for Parental Involvement with Children in Childcare
Activities
Gender Model Variables B Beta t P
Male 1 (Constant) 19.305 9.930 .000*
Boys to girls
Ratio
6.499 .502 4.674 .000*
Female 1 (Constant) 8.647 11.168 .000*
Boys to girls
Ratio
.414 .084 .780 .438
* p< .05
Household work by gender composition and gender ratio
One-Way ANOVA was performed to assess the relationship between children‘s
participation in household work and children‘s gender composition. The results in table 40
revealed that children‘s participation in household work significantly differed by children‘s
gender composition (F =112.363, df = 2, p<.05).
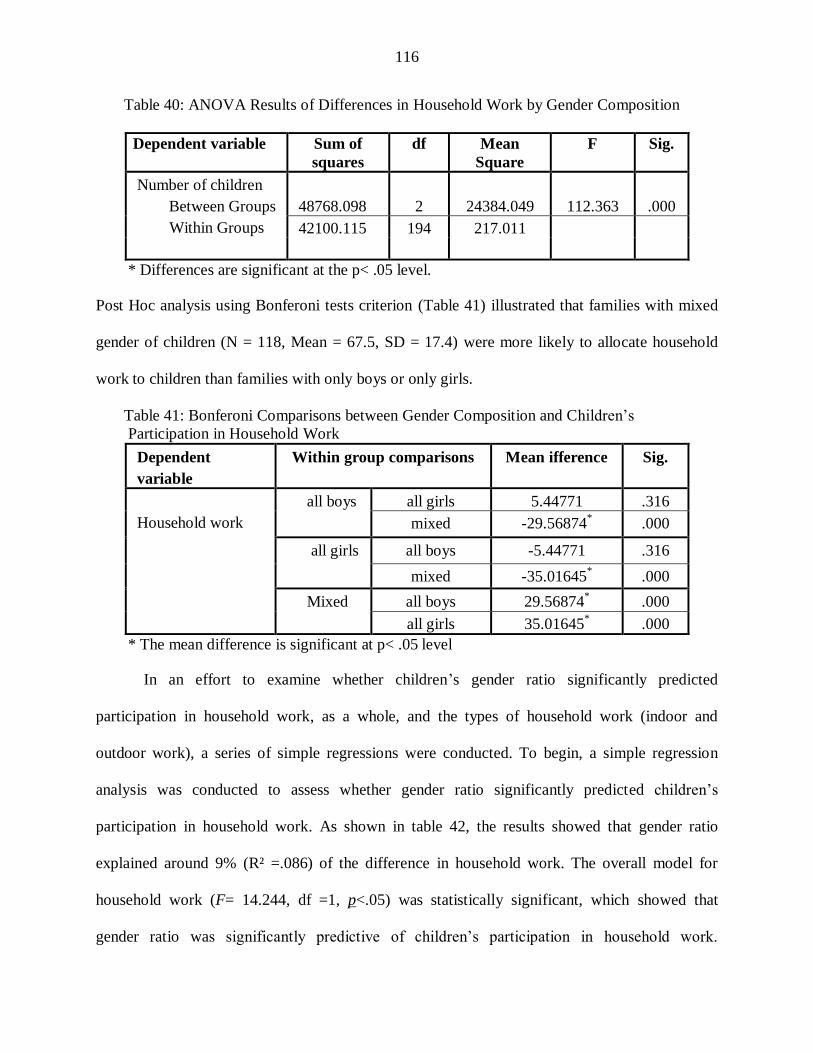
116
Table 40: ANOVA Results of Differences in Household Work by Gender Composition
Dependent variable
Sum of
squares
df Mean
Square
F Sig.
Number of children
Between Groups
Within Groups
48768.098
2
24384.049
112.363
.000
42100.115 194 217.011
* Differences are significant at the p< .05 level.
Post Hoc analysis using Bonferoni tests criterion (Table 41) illustrated that families with mixed
gender of children (N = 118, Mean = 67.5, SD = 17.4) were more likely to allocate household
work to children than families with only boys or only girls.
Table 41: Bonferoni Comparisons between Gender Composition and Children‘s
Participation in Household Work
Dependent
variable
Within group comparisons Mean ifference Sig.
Household work
all boys
all girls 5.44771 .316
mixed -29.56874* .000
all girls
all boys -5.44771 .316
mixed -35.01645* .000
Mixed all boys 29.56874* .000
all girls 35.01645* .000
* The mean difference is significant at p< .05 level
In an effort to examine whether children‘s gender ratio significantly predicted
participation in household work, as a whole, and the types of household work (indoor and
outdoor work), a series of simple regressions were conducted. To begin, a simple regression
analysis was conducted to assess whether gender ratio significantly predicted children‘s
participation in household work. As shown in table 42, the results showed that gender ratio
explained around 9% (R² =.086) of the difference in household work. The overall model for
household work (F= 14.244, df =1, p<.05) was statistically significant, which showed that
gender ratio was significantly predictive of children‘s participation in household work.

117
Examination of the slopes (b) in the regression results table (table 43) indicated that as the
number of boys, relative to girls, increased by 1, children‘s participation in household work
and/or spending time on housework decreased by 6.322. Also, Beta-weights (-.239) indicated
that the relationship between gender ratio and children‘s participation in household work was
weak and negative. This implied that more girls were associated with more household work
compared to boys.
Next, a simple regression analysis was also performed to assess whether children‘s
gender ratio significantly predicted children‘s participation in indoor work. The results suggested
that (table 42) gender ratio explained approximately 12.2% (R² =.122) of the variance in indoor
household work. The overall model for indoor work (F= 20.995, df =1, p<.05) was statistically
significant, which meant that gender ratio was significantly predictive of children‘s participation
in indoor household work. These results were further supported by the regression results. A
closer look at the slopes (b) in the regression results table (table 43) pointed out that as the
number of boys, relative to girls, increased by 1, children participation in indoor work
(traditionally female tasks) decreased by 5.252. Furthermore, Beta-weights (-.349) indicated that
the relationship between gender ratio and children‘s participation in indoor household work was
moderate and negative. Thus, boys were less likely to do indoor work compared to girls.
Finally, a simple regression analysis was done to test whether children‘s participation in
outdoor work could be significantly predicted by gender ratio. The results in the model summary
table (42) showed that gender ratio explained about 6% (R² =.056) of the variance in children‘s
involvement in outdoor work. The overall significance of the model, assessed by the global F-
test, and further supported by the results, indicated that gender ratio was significantly predictive
of outdoor work (F= 8.979, df =1, p<.05). By evaluating the slopes (b) in the regression results

118
table (table 43), the results suggested that as the number of boys compared to girls increased by
1, children contribution to outdoor work (traditionally male tasks) increased by 2.144. Beta-
weights (.237) indicated further that the gender ratio had a weak but positive effect on children‘s
participation in outdoor work. This suggested that as the number of boys, compared to girls,
increased in the family, children contribution to outdoor work (traditionally male tasks)
increased. In other words, boys are more likely to do outdoor work compared to girls.
Table 42: Model Summary for Predictors of Children‘s Participation in Household Work
Variables R R² F df P
Household work .294 .086 14.244 1 .000 *
Inside work .349 .122 20.995 1 .000 *
Outside work .237 .056 8.979 1 .003 *
* p< .05
Table 43: Simple Regression Results for Children‘s Participation in Household Work
Variables Model B Beta t P
Household
work
(Constant) 48.199 20.157 .000 *
Boys to girls Ratio -6.322 -.294 -3.774 .000 *
Inside work (Constant) 31.886 19.487 .000 *
Boys to girls Ratio -5.252 -.349 -4.582 .000 *
Outside work (Constant) 19.636 19.220 .000 *
Boys to girls Ratio 2.144 .237 2.996 .003 *
* p< .05
Marital quality by gender preferences, gender composition, and gender ratio
In order to test whether marital quality varied by parental gender preference with regard
to children and children‘s gender composition, two analyses of One-Way ANOVA were used.
ANOVA results in table 44 revealed that marital quality did not significantly differ by parental
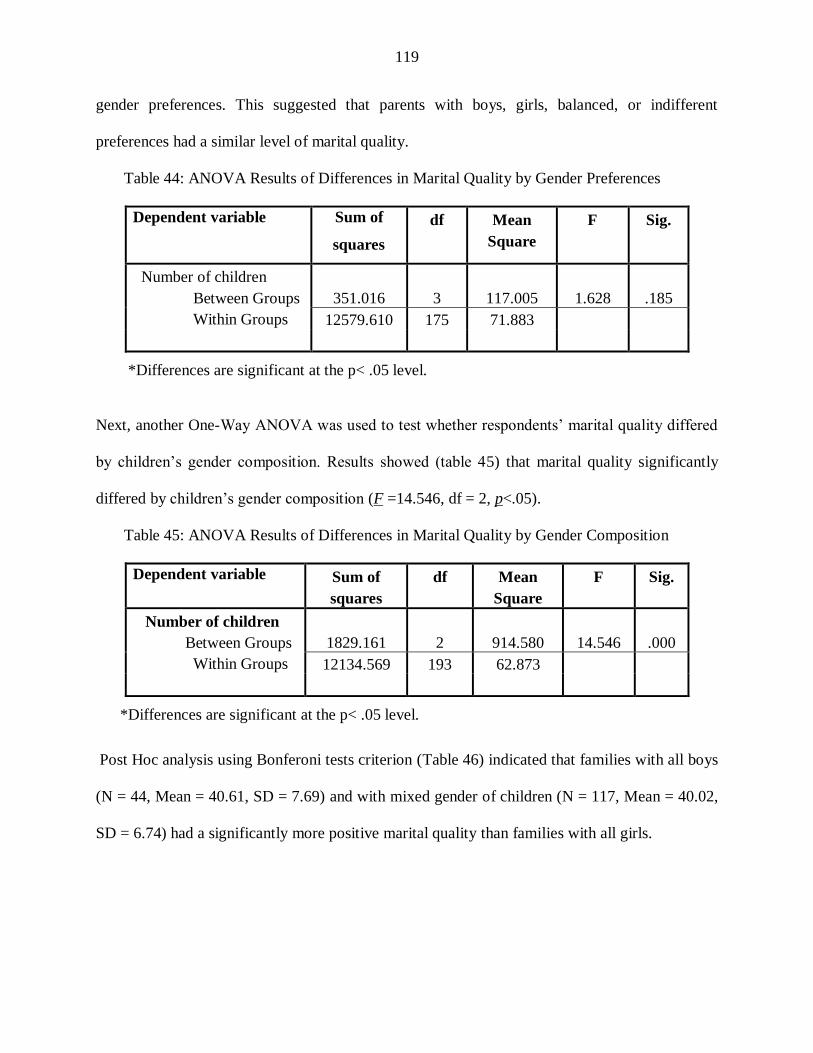
119
gender preferences. This suggested that parents with boys, girls, balanced, or indifferent
preferences had a similar level of marital quality.
Table 44: ANOVA Results of Differences in Marital Quality by Gender Preferences
Dependent variable
Sum of
squares
df Mean
Square
F Sig.
Number of children
Between Groups
Within Groups
351.016
3
117.005
1.628
.185
12579.610 175 71.883
*Differences are significant at the p< .05 level.
Next, another One-Way ANOVA was used to test whether respondents‘ marital quality differed
by children‘s gender composition. Results showed (table 45) that marital quality significantly
differed by children‘s gender composition (F =14.546, df = 2, p<.05).
Table 45: ANOVA Results of Differences in Marital Quality by Gender Composition
Dependent variable
Sum of
squares
df Mean
Square
F Sig.
Number of children
Between Groups
Within Groups
1829.161
2
914.580
14.546
.000
12134.569 193 62.873
*Differences are significant at the p< .05 level.
Post Hoc analysis using Bonferoni tests criterion (Table 46) indicated that families with all boys
(N = 44, Mean = 40.61, SD = 7.69) and with mixed gender of children (N = 117, Mean = 40.02,
SD = 6.74) had a significantly more positive marital quality than families with all girls.
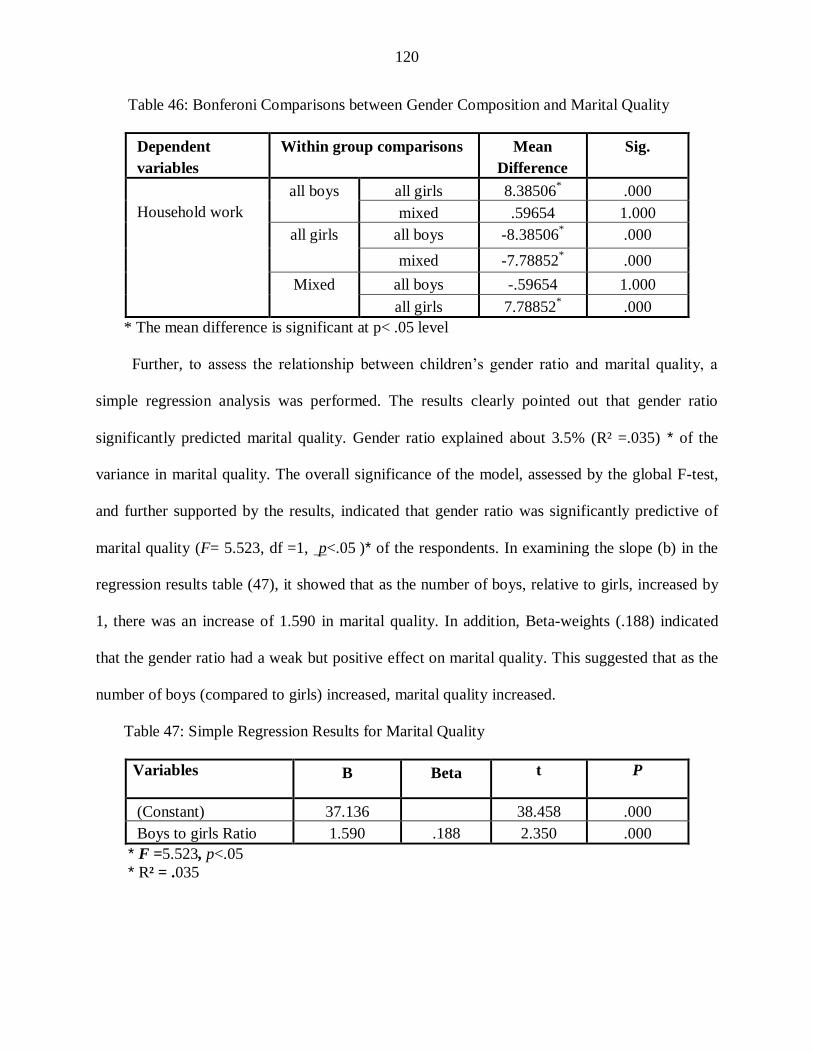
120
Table 46: Bonferoni Comparisons between Gender Composition and Marital Quality
Dependent
variables
Within group comparisons Mean
Difference
Sig.
Household work
all boys
all girls 8.38506* .000
mixed .59654 1.000
all girls
all boys -8.38506* .000
mixed -7.78852* .000
Mixed all boys -.59654 1.000
all girls 7.78852* .000
* The mean difference is significant at p< .05 level
Further, to assess the relationship between children‘s gender ratio and marital quality, a
simple regression analysis was performed. The results clearly pointed out that gender ratio
significantly predicted marital quality. Gender ratio explained about 3.5% (R² =.035) * of the
variance in marital quality. The overall significance of the model, assessed by the global F-test,
and further supported by the results, indicated that gender ratio was significantly predictive of
marital quality (F= 5.523, df =1, p<.05 )* of the respondents. In examining the slope (b) in the
regression results table (47), it showed that as the number of boys, relative to girls, increased by
1, there was an increase of 1.590 in marital quality. In addition, Beta-weights (.188) indicated
that the gender ratio had a weak but positive effect on marital quality. This suggested that as the
number of boys (compared to girls) increased, marital quality increased.
Table 47: Simple Regression Results for Marital Quality
Variables B Beta t P
(Constant) 37.136 38.458 .000
Boys to girls Ratio 1.590 .188 2.350 .000
* F =5.523, p<.05
* R² = .035

121
4.4. Multivariate analysis and hypotheses testing
A multivariate statistical technique (multiple regressions) allowed us to analyze the
relationship between a dependent variable and a set of independent variables and to determine
which independent variable or subset of variable(s) were the best predictors for a particular
outcome. This allowed the researcher to control for confounding factors and evaluate their
contribution, find structural relationships, and provide explanations (Ho, 2006; Tabachnick &
Fidell, 2007). To test the research hypotheses in this study, a series of incremental linear
regression models were estimated to independently assess the dynamic of the relationship
between gender ratio, children‘s gender composition, and parental gender preference regarding
children for various Arab-American family dynamics. These dynamics were family size, parental
involvement with children, allocation of household work to children, and marital quality, while
controlling for other variables, such as child‘s age and number of children, parents‘ gender and
age, income, employment, education, age at marriage, and gender ideology. In this study, four
general hypotheses were tested, using multiple regression analysis.
The first general hypothesis stated that parental gender preference regarding children and
children‘s gender composition will significantly predict Arab-American family size when
holding constant parents‘ age, age at marriage, gender, place of birth, income, work status,
education, and gender ideology.
The second hypothesis addressed the following: gender ratio and gender composition of
the children will significantly predict parental involvement with children when holding constant
parents‘ age, number of children, income, work status, education, average age of children,
gender ideology, and place of birth.
122
The third hypothesis examined was : gender ratio and gender composition of the children
will significantly predict children‘s participation in household chores when holding constant
parents‘ age, number of children, average ages of children, gender, work status, income,
education, gender ideology, and place of birth.
The last hypothesis tested was: gender ratio, children‘s gender composition, and
parental gender preference regarding children will significantly predict marital quality when
holding constant parents‘ age, number of children, average ages of children, age at marriage,
gender, work status, income, education, gender ideology, and place of birth as well as level of
fathers‘ involvement. Below are the results of the multiple regression analyses.
Predictors of family size
To test the hypothesis related to family size: parental gender preference regarding
children and children‘s gender composition will significantly predict Arab-American family size
when holding constant parents‘ age, age at marriage, gender, place of birth, income, work status,
education, and gender ideology, a two- step incremental model was estimated. Based on past
research, the first model included parental gender preferences and children‘s gender
composition. The second model included control variables: parents‘ age, age at marriage, gender
of parents, place of birth, work status, income, education, and gender ideology. In both models, a
force entry method was used because the literature review provided sufficient evidence that all
the predictors in each model were meaningful (Field, 2005, p.160). The results in table 48
indicated two models which were estimated incrementally. The changes from the null model to
model one, to model two indicated significant changes in R²; meaning that the final model was
significant in predicting family size. These results were supported by the partial F tests. For the
final model, the global F was 7.852, (df =14), and was significant (p< .05). The adjusted R² for

123
model 1 explained 32.5% of the variance in family size by the independent variables, parental
gender preferences regarding children and gender composition of children. An addition of the
control variables (parents‘ age, gender, income, work status, education, gender ideology, age at
marriage, and place of birth) to the model increased the explained variance to 39.3%. Therefore,
parental gender preferences regarding children (boy preference), gender composition of children
(all boys and all girls sibships), age of parents, and age at marriage all significantly contributed
to the variance explained in family size. Surprisingly, balanced gender preference, girls‘ gender
preference, gender of parents, income, work status, education, gender ideology, and place of
birth did not significantly contribute to the model. Further, these items did not modify the gender
preference and gender composition of children effects. The standardized coefficients in the final
model indicated that only five of the fourteen variables [boy preference (beta= .428); age of
parents (beta= .264); age at marriage (beta= -.239); all boys sibships (beta = -.187); and all girls
sibships (beta= .184)] significantly predicted family size. These results suggested that boy
preference was a larger contributor to family size than the others. The unstandardized Beta
coefficients in the final model showed that parents with a boy preference, compared to parents
with no preference (indifferent), were more likely to have a larger family size. As parents‘ age
increased, family size increased as well; and as parents‘ age at marriage increased, family size
decreased. Parents with only boys sibships, compared to parents with mixed gender of children,
were less likely to have a larger family size. However, parents with only girls sibships, compared
to parents with mixed gender composition, were more likely to have a larger family size.
Balanced gender preference, girl preference, gender of parents, income, work status, education,
gender ideology, and place of birth did not significantly predict family size. Consequently, these
findings strongly supported the hypothesis about family size: parental gender preference

124
regarding children and children‘s gender composition will significantly predict Arab-American
family size when holding constant parents‘ age, age at marriage, gender, place of birth, income,
work status, education, and gender ideology.
Table 48: Regression Coefficient of Independent Variables on Family Size
Variables Model 1 Model 2
B Beta t Sig B Beta t Sig
Gender preferences
Boy preference
Girl preference
Balanced preference
Indifferent (reference)
1.377
.520
3.400
.001
1.133
.428
2.871
.005*
.540 .094 1.010 .314 .517 .090 1.005 .317
.012
---
.004
---
.029
---
.977
---
-.047
---
-.018
---
-.118
---
.906
---
Gender composite
All boys
All girls
Mixed (reference)
-.623
-.201
-2.836
.005
-.580
-.187
-2.698
.008*
.631
---
.184
---
2.583
---
.011
---
.630
---
.184
---
2.619
---
.010*
---
Age of parents .036 .264 3.546 .001*
Age at marriage -.062 -.239 -3.019 .003*
Gender
Male
Female (reference)
.364
---
.138
---
1.579
---
.117
---
Place of birth
Outside U.S.A.
U.S.A. (reference)
.184
---
.063
---
.887
---
.376
---
Work status
Working
Not working (reference)
.000
---
.001
---
.010
---
.992
---
Income
High income
Low income
Middle income(reference)
.042
.015
.184
.854
-.059
---
-.022
---
-.247
---
.805
---
Education
Bachelor degree and higher
Less than bachelor(reference)
.074
---
.028
---
.402
---
.689
---
Gender ideology
Non-traditional
Traditional
-.096
---
-.037
---
-.520
---
.604
---
R²
Adjusted R²
R² changed
F
.348
.325
.348*
15.280*
.451
.393
.103*
7.852*
* p< .05
125
Predictors of Parental involvement with children
Parental involvement with children represented both behavioral and emotional
involvement. Behavioral involvement was a composite scale from the additive combination of
the variables in table 16. Emotional involvement was created by combining the variables in table
17. Therefore, a high score on the two composite measures indicated a high level of behavioral
and emotional involvement. Interactive activities is the additive scale from the variables in table
18 and the childcare activities scale was created by combining the variables in table 19, in order
to examine the types of activities in which parents were involved with their children. A series of
multiple regression analyses were used to test the second hypothesis: gender ratio and gender
composition of the children will significantly predict parental involvement with children when
holding constant parents‘ age, number of children, work status, income, education, average ages
of children, gender ideology, and place of birth.
The first multiple regression analysis was used to test whether gender ratio significantly
predicted fathers‘ and mothers‘ behavioral involvement with children as a whole, while
controlling for parents‘ age, number of children, work status, income, education, gender
ideology, and place of birth. Based on past research, the first model included gender ratio and the
second model included control variables of parents‘ age, number of children, work status,
income, education, gender ideology, and place of birth. The results in table 49 indicated two
models were estimated incrementally for fathers. The adjusted R² for model 1 explained 24.6%
of the variance in fathers‘ behavioral involvement by the independent variable of gender ratio.
An addition of the control variables (fathers‘ age, number of children, work status, income,
education, average age of children, gender ideology, and place of birth) to the model did not
increase the explained variance, but rather decreased it (23.1%). Although there was a significant
126
change in R² (.260) from the null model to model one, the change in R² from model one to model
two was not significant. The overall model was significant (F =2.678, df =10, p< .05) even
though much of the variability in fathers‘ behavioral involvement with children was explained by
variables not included in the estimated equation. Hence, the addition of the control variables to
the model did not modify the gender ratio effects in the final model. The standardized
coefficients in the final model indicated that gender ratio (beta = .465) and number of children
(beta = -.234) are the best predictors of fathers‘ behavioral involvement with children. The
unstandardized Beta coefficients in the final model revealed that as the number of boys to girls in
the family increased, fathers‘ behavioral involvement with children increased; and as the number
of children increased, fathers‘ involvement with children decreased. Fathers‘ age, income, work
status, education, average age of children, gender ideology, and place of birth did not
significantly predict fathers‘ behavioral involvement with children.
Further, two increment models were estimated for mothers. The results in table 50
indicated that the adjusted R² for model 1 explained 8.3% of the variance in mothers‘ behavioral
involvement by gender ratio. Even though the addition of the control variables of mothers‘ age,
number of children, work status, income, and education as well as average age of children,
gender ideology, and place of birth to the model increased the explained variance to 15.6%, the
change in R² was not significant. It is important to note how gender ratio contributed to model
one, but the effects of gender ratio were modified in model two once the control variables were
added to the model. Therefore, gender ratio did not significantly contribute to the final model or
the control variables (mothers‘ age, number of children, work status, income, and education as
well as average age of children, gender ideology, and place of birth). Further, the global F for the
final model was 2.241, (df =10), which was not significant (p< .05).
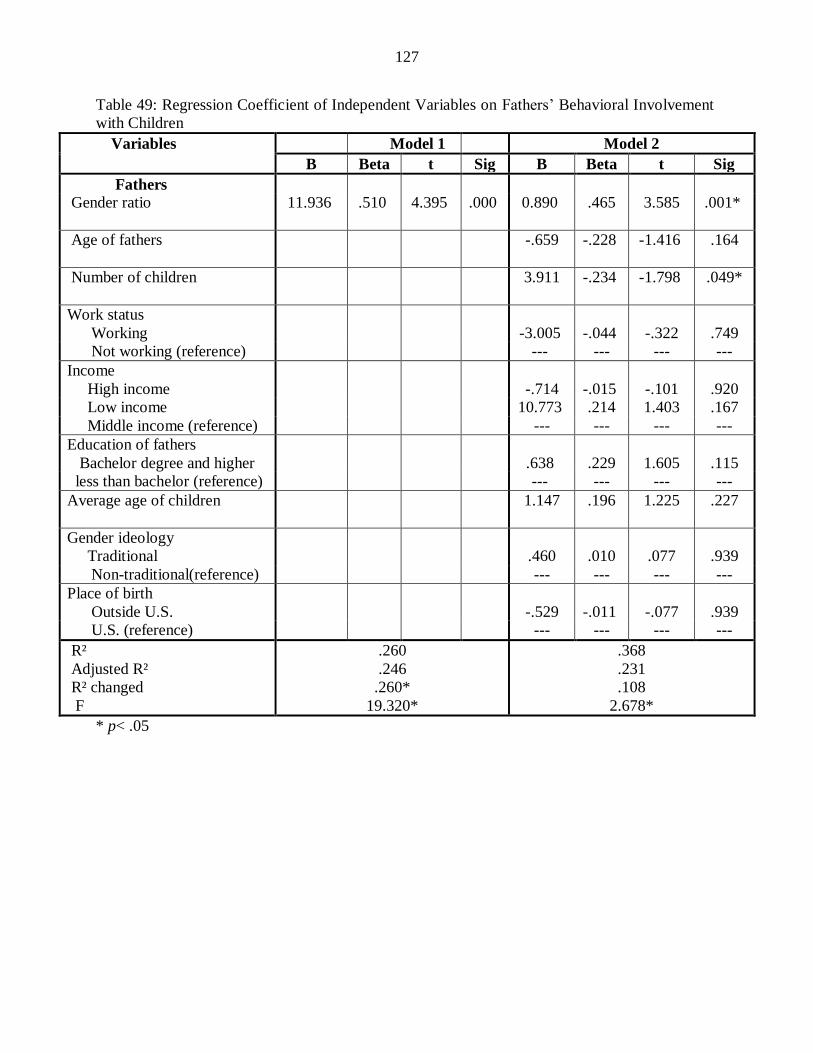
127
Table 49: Regression Coefficient of Independent Variables on Fathers‘ Behavioral Involvement
with Children
Variables Model 1 Model 2
B Beta t Sig B Beta t Sig
Fathers
Gender ratio 11.936 .510 4.395 .000 0.890 .465 3.585 .001*
Age of fathers -.659 -.228 -1.416 .164
Number of children 3.911 -.234 -1.798 .049*
Work status
Working
Not working (reference)
-3.005
-.044
-.322
.749
--- --- --- ---
Income
High income
Low income
Middle income (reference)
-.714
-.015
-.101
.920
10.773 .214 1.403 .167
--- --- --- ---
Education of fathers
Bachelor degree and higher
less than bachelor (reference)
.638
.229
1.605
.115
--- --- --- ---
Average age of children 1.147 .196 1.225 .227
Gender ideology
Traditional
Non-traditional(reference)
.460
.010
.077
.939
--- --- --- ---
Place of birth
Outside U.S.
U.S. (reference)
-.529
-.011
-.077
.939
--- --- --- ---
R²
Adjusted R²
R² changed
F
.260
.246
.260*
19.320*
.368
.231
.108
2.678*
* p< .05
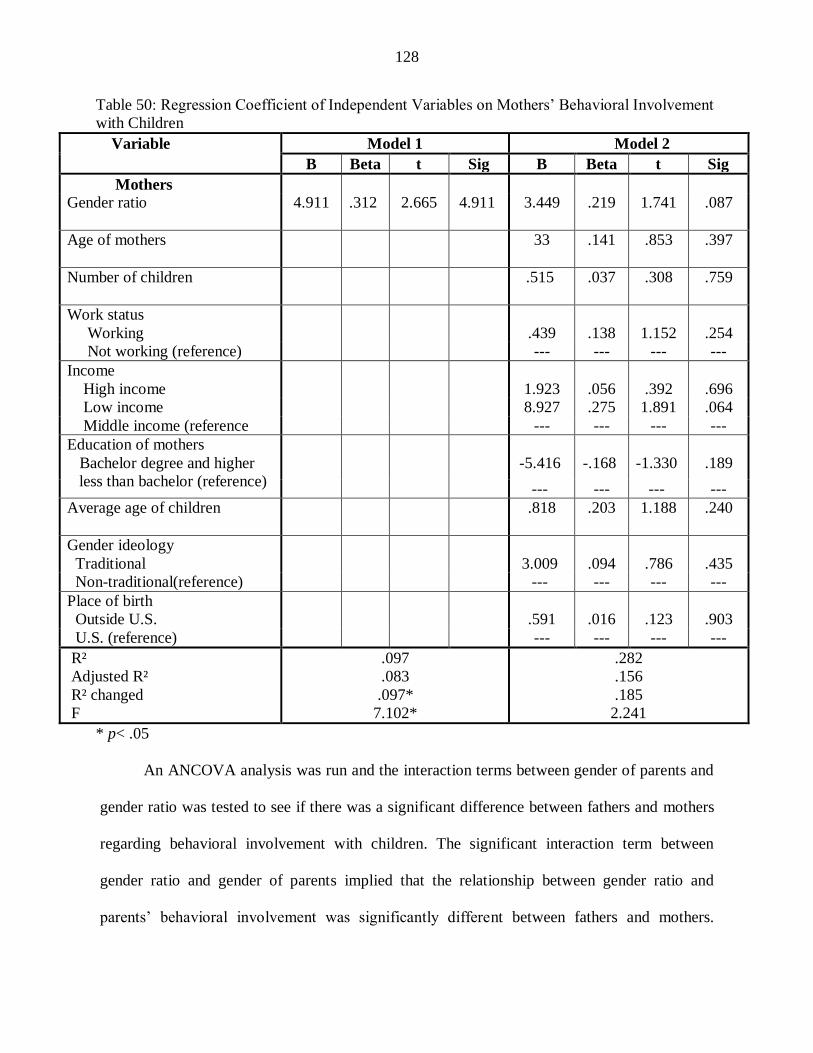
128
Table 50: Regression Coefficient of Independent Variables on Mothers‘ Behavioral Involvement
with Children
Variable Model 1 Model 2
B Beta t Sig B Beta t Sig
Mothers
Gender ratio 4.911 .312 2.665 4.911 3.449 .219 1.741 .087
Age of mothers 33 .141 .853 .397
Number of children .515 .037 .308 .759
Work status
Working
Not working (reference)
.439
.138
1.152
.254
--- --- --- ---
Income
High income
Low income
Middle income (reference
1.923
.056
.392
.696
8.927 .275 1.891 .064
--- --- --- ---
Education of mothers
Bachelor degree and higher
less than bachelor (reference)
-5.416
-.168
-1.330
.189
--- --- --- ---
Average age of children .818 .203 1.188 .240
Gender ideology
Traditional
Non-traditional(reference)
3.009
.094
.786
.435
--- --- --- ---
Place of birth
Outside U.S.
U.S. (reference)
.591
.016
.123
.903
--- --- --- ---
R²
Adjusted R²
R² changed
F
.097
.083
.097*
7.102*
.282
.156
.185
2.241
* p< .05
An ANCOVA analysis was run and the interaction terms between gender of parents and
gender ratio was tested to see if there was a significant difference between fathers and mothers
regarding behavioral involvement with children. The significant interaction term between
gender ratio and gender of parents implied that the relationship between gender ratio and
parents‘ behavioral involvement was significantly different between fathers and mothers.
129
Therefore, compared to mothers, as the boys‘ to girls‘ ratio in the family increased, behavioral
involvement of fathers with their children increased.
The second multiple regression analysis was used to test whether gender ratio
significantly predicted fathers‘ and mothers‘ emotional involvement with children as a whole,
while controlling for parents‘ age, number of children, work status, income, education, gender
ideology, and place of birth. Based on past research, the first model included gender ratio and
the second model included control variables of parents‘ age, number of children, work status,
income, education, gender ideology, and place of birth. As viewed in table 51, the results
indicated two models were estimated incrementally for fathers. The adjusted R² for model 1
explained 10.9% of the variance in fathers‘ emotional involvement by gender ratio and the
change in R² from the null model to model one was significant. Although the addition of the
control variables of fathers‘ age, number of children, work status, income, and education, as
well as the average age of children, gender ideology, and place of birth, to the model increased
the explained variance to15.5%, the change in R² (from model one to two) was not significant.
These results were further assessed by the partial F tests. For the final model, the global F was
2.027 (df=10), which was not significant. The final model indicated that gender ratio and
number of children were the only significant predictors of fathers‘ emotional involvement with
children. The standardized coefficients in the final model revealed that gender ratio (Beta=
.404) and number of children (beta =-.275) were the best predictors of fathers‘ emotional
involvement with children. The unstandardized Beta coefficients in the final model suggested
that as boys‘ to girls‘ ratio in the family increased, fathers‘ emotional involvement with
children increased; and as the number of children increased, fathers‘ emotional involvement
with children decreased. However, fathers‘ age, income, work status, education, average age of
130
children, gender ideology, and place of birth did not significantly contribute to the prediction of
fathers‘ emotional involvement with children.
In addition, two incremental models were estimated for mothers. The results in table 52
indicated that the adjusted R² for model 1 explained 5.3% of the variance in mothers‘ emotional
involvement by gender ratio and the change in R² from the null model to model one was
significant. Even though the addition of the control variables (mothers‘ age, number of children,
work status, income, and education as well as average age of children, gender ideology, and
place of birth) to the model slightly increased the explained variance to5.7%, the change in R²
(from model one to model two) was not significant. These results were further assessed by the
partial F tests. For the final model, the global F was 1.403 (df=10), which was not significant.
The final model pointed out that none of the predictors were significant in predicting mothers‘
emotional involvement with children. It is important to note the way in which gender ratio
contributed to model one, but the effects of gender ratio were modified in model two once the
control variables were added to the model. Therefore, it did not significantly contribute to the
final model.
To test if there was a significant difference between fathers and mothers regarding the
level of their emotional involvement with children, ANCOVA analysis was also performed and
the interaction terms between gender of parents and gender ratio was tested. The significant
interaction term between gender ratio and gender of parents suggested that the relationship
between gender ratio and parents‘ emotional involvement was significantly different between
fathers and mothers. Consequently, compared to mothers, as the boys‘ to girls‘ ratio in the
family increased, emotional involvement of fathers with children increased.

131
Table 51: Regression Coefficient of Independent Variables on Fathers‘ Emotional Involvement
with Children
Variables Model 1 Model 2
B Beta t Sig B Beta t Sig
Fathers
Gender ratio .793 .354 2.804 .007 .905 .404 2.969 .005*
Age of fathers .019 .069 .411 .683
Number of children -.440 -.275 -2.017 .050*
Work Status of fathers
Working
Not working (reference)
-.847
-.130
-.903
.371
--- --- --- ---
Income
High income
Low income
Middle income (reference)
.460
.101
.649
.519
.736 .153 .955 .345
--- --- ---- ---
Education of fathers
Bachelor degree and higher
less than bachelor (reference)
1.085
.244
1.632
.110
--- --- --- ---
Average age of children -.061 -.109 -.650 .519
Gender ideology
Traditional
Non-traditional(reference)
.481
.109
.799
.429
--- --- --- ---
Place of birth
Outside U.S.A
U.S.A(reference)
.319
.069
.463
.646
--- --- --- ---
R²
Adjusted R²
R² changed
F
.125
.109
.125*
7.862*
.306
.155
.181
2.027
* p< .05
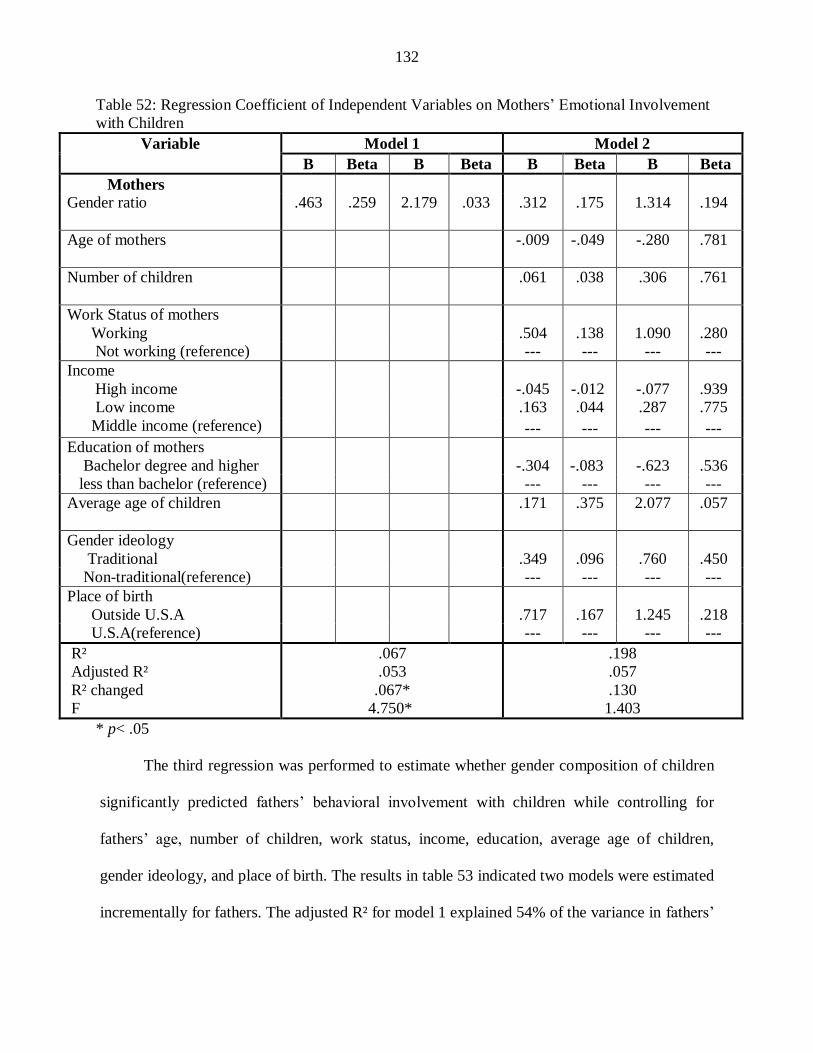
132
Table 52: Regression Coefficient of Independent Variables on Mothers‘ Emotional Involvement
with Children
Variable Model 1 Model 2
B Beta B Beta B Beta B Beta
Mothers
Gender ratio .463 .259 2.179 .033 .312 .175 1.314 .194
Age of mothers -.009 -.049 -.280 .781
Number of children .061 .038 .306 .761
Work Status of mothers
Working
Not working (reference)
.504
.138
1.090
.280
--- --- --- ---
Income
High income
Low income
Middle income (reference)
-.045
-.012
-.077
.939
.163 .044 .287 .775
--- --- --- ---
Education of mothers
Bachelor degree and higher
less than bachelor (reference)
-.304
-.083
-.623
.536
--- --- --- ---
Average age of children .171 .375 2.077 .057
Gender ideology
Traditional
Non-traditional(reference)
.349
.096
.760
.450
--- --- --- ---
Place of birth
Outside U.S.A
U.S.A(reference)
.717
.167
1.245
.218
--- --- --- ---
R²
Adjusted R²
R² changed
F
.067
.053
.067*
4.750*
.198
.057
.130
1.403
* p< .05
The third regression was performed to estimate whether gender composition of children
significantly predicted fathers‘ behavioral involvement with children while controlling for
fathers‘ age, number of children, work status, income, education, average age of children,
gender ideology, and place of birth. The results in table 53 indicated two models were estimated
incrementally for fathers. The adjusted R² for model 1 explained 54% of the variance in fathers‘
133
behavioral involvement by the independent variable of gender composition of children. An
addition of the control variables (fathers‘ age, number of children, work status, income,
education, average age of children, gender ideology, and place of birth) to the model increased
the explained variance (58.4%). Although there was a significant change in R² from the null
model to model one, the change in R² from model one to model two was not significant. The
overall model was significant (F =10.203, df =11, p< .05) even though much of the variability
in fathers‘ behavioral involvement with children was explained by variables not included in the
estimated equation. The final model pointed out that gender composition of children, number of
children, and education were significant predictors of fathers‘ behavioral involvement with
children. The addition of the control variables did not modify the gender composition effects in
the final model. The standardized coefficients in the final model indicated that gender
composition (mixed genders) (Beta = .662), education (beta = .206), and number of children
(beta = -.168) were the best predictors of fathers‘ involvement with children. But gender
composition of children (mixed genders) (Beta = .662) was the largest contributor to the final
model. The unstandardized Beta coefficients in the final model revealed that fathers with mixed
gender of children were more likely to be involved with their children than fathers with only
girls. Fathers with a bachelor‘s degree and higher were more likely to be involved with their
children than fathers with less than a bachelor‘s degree. Finally, as the number of children
increased, fathers‘ behavioral involvement with children decreased. However, fathers with only
boys, fathers‘ age, income, work status, average age of children, gender ideology, and place of
birth did not significantly contribute to the final model and were insignificant predictors of
fathers‘ behavioral involvement with children.
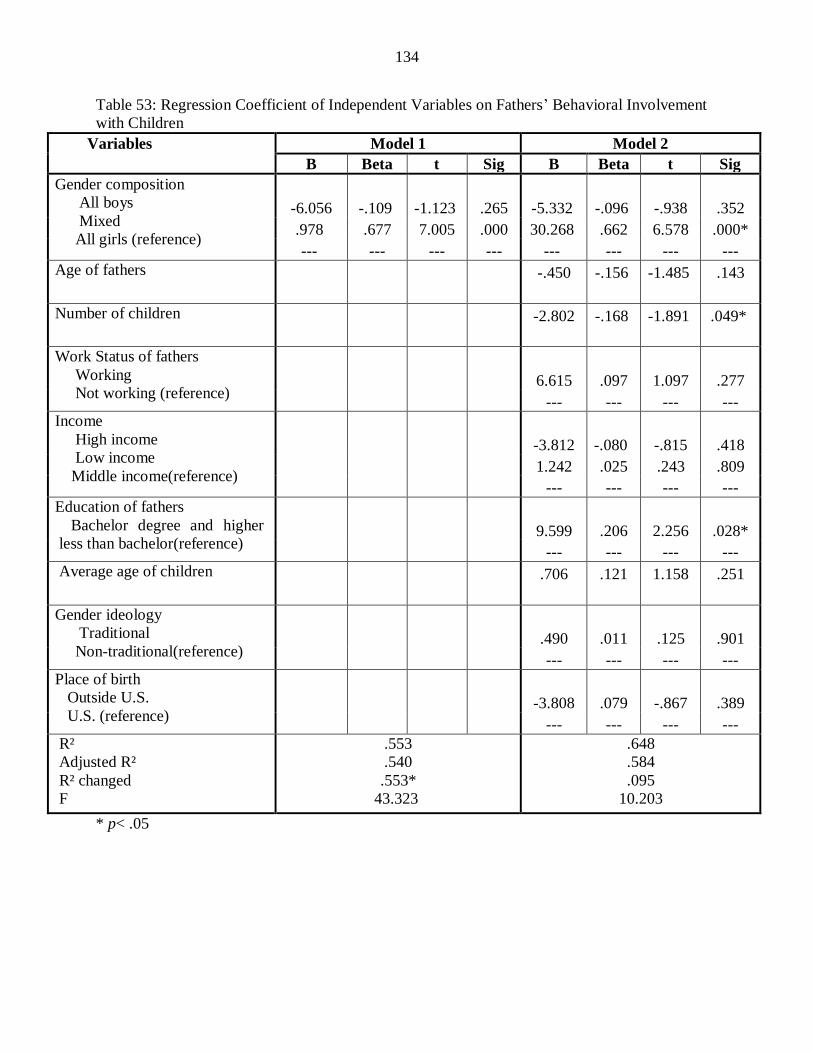
134
Table 53: Regression Coefficient of Independent Variables on Fathers‘ Behavioral Involvement
with Children
Variables Model 1 Model 2
B Beta t Sig B Beta t Sig
Gender composition
All boys
Mixed
All girls (reference)
-6.056
-.109
-1.123
.265
-5.332
-.096
-.938
.352
.978 .677 7.005 .000 30.268 .662 6.578 .000*
--- --- --- --- --- --- --- ---
Age of fathers -.450 -.156 -1.485 .143
Number of children -2.802 -.168 -1.891 .049*
Work Status of fathers
Working
Not working (reference)
6.615
.097
1.097
.277
--- --- --- ---
Income
High income
Low income
Middle income(reference)
-3.812
-.080
-.815
.418
1.242 .025 .243 .809
--- --- --- ---
Education of fathers
Bachelor degree and higher
less than bachelor(reference)
9.599
.206
2.256
.028*
--- --- --- ---
Average age of children .706 .121 1.158 .251
Gender ideology
Traditional
Non-traditional(reference)
.490
.011
.125
.901
--- --- --- ---
Place of birth
Outside U.S.
U.S. (reference)
-3.808
.079
-.867
.389
--- --- --- ---
R²
Adjusted R²
R² changed
F
.553
.540
.553*
43.323
.648
.584
.095
10.203
* p< .05
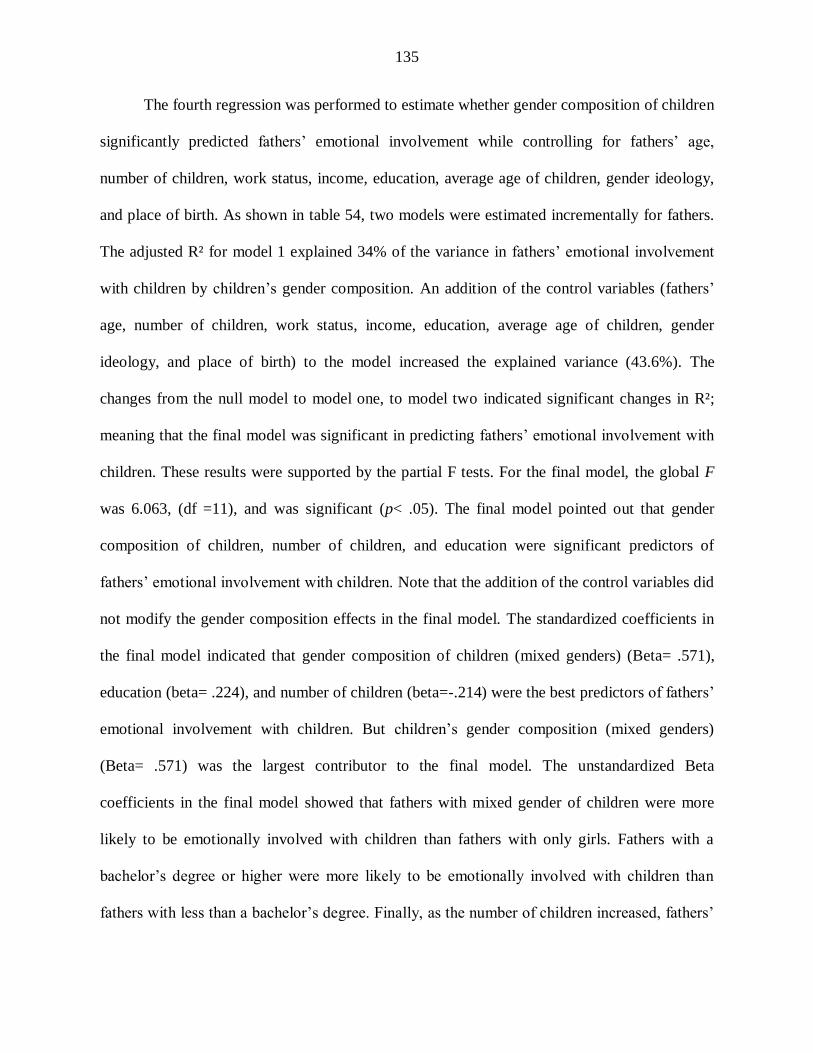
135
The fourth regression was performed to estimate whether gender composition of children
significantly predicted fathers‘ emotional involvement while controlling for fathers‘ age,
number of children, work status, income, education, average age of children, gender ideology,
and place of birth. As shown in table 54, two models were estimated incrementally for fathers.
The adjusted R² for model 1 explained 34% of the variance in fathers‘ emotional involvement
with children by children‘s gender composition. An addition of the control variables (fathers‘
age, number of children, work status, income, education, average age of children, gender
ideology, and place of birth) to the model increased the explained variance (43.6%). The
changes from the null model to model one, to model two indicated significant changes in R²;
meaning that the final model was significant in predicting fathers‘ emotional involvement with
children. These results were supported by the partial F tests. For the final model, the global F
was 6.063, (df =11), and was significant (p< .05). The final model pointed out that gender
composition of children, number of children, and education were significant predictors of
fathers‘ emotional involvement with children. Note that the addition of the control variables did
not modify the gender composition effects in the final model. The standardized coefficients in
the final model indicated that gender composition of children (mixed genders) (Beta= .571),
education (beta= .224), and number of children (beta=-.214) were the best predictors of fathers‘
emotional involvement with children. But children‘s gender composition (mixed genders)
(Beta= .571) was the largest contributor to the final model. The unstandardized Beta
coefficients in the final model showed that fathers with mixed gender of children were more
likely to be emotionally involved with children than fathers with only girls. Fathers with a
bachelor‘s degree or higher were more likely to be emotionally involved with children than
fathers with less than a bachelor‘s degree. Finally, as the number of children increased, fathers‘
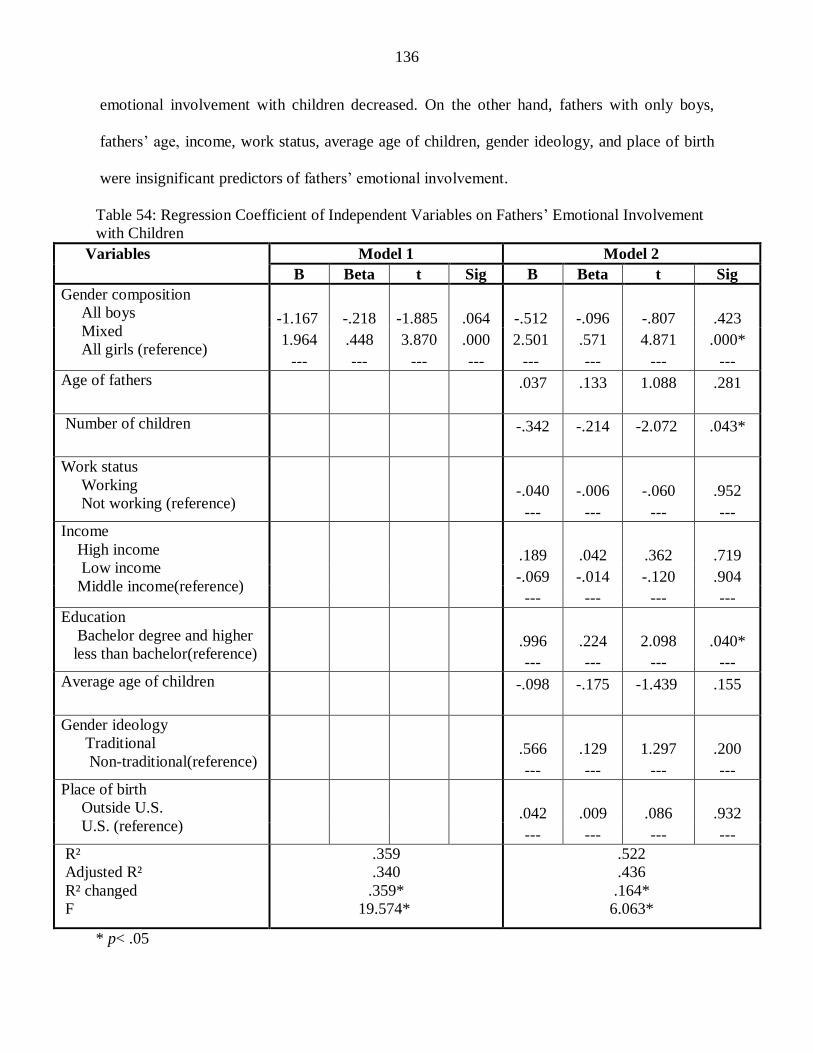
136
emotional involvement with children decreased. On the other hand, fathers with only boys,
fathers‘ age, income, work status, average age of children, gender ideology, and place of birth
were insignificant predictors of fathers‘ emotional involvement.
Table 54: Regression Coefficient of Independent Variables on Fathers‘ Emotional Involvement
with Children
Variables Model 1 Model 2
B Beta t Sig B Beta t Sig
Gender composition
All boys
Mixed
All girls (reference)
-1.167
-.218
-1.885
.064
-.512
-.096
-.807
.423
1.964 .448 3.870 .000 2.501 .571 4.871 .000*
--- --- --- --- --- --- --- ---
Age of fathers .037 .133 1.088 .281
Number of children -.342 -.214 -2.072 .043*
Work status
Working
Not working (reference)
-.040
-.006
-.060
.952
--- --- --- ---
Income
High income
Low income
Middle income(reference)
.189
.042
.362
.719
-.069 -.014 -.120 .904
--- --- --- ---
Education
Bachelor degree and higher
less than bachelor(reference)
.996
.224
2.098
.040*
--- --- --- ---
Average age of children -.098 -.175 -1.439 .155
Gender ideology
Traditional
Non-traditional(reference)
.566
.129
1.297
.200
--- --- --- ---
Place of birth
Outside U.S.
U.S. (reference)
.042
.009
.086
.932
--- --- --- ---
R²
Adjusted R²
R² changed
F
.359
.340
.359*
19.574*
.522
.436
.164*
6.063*
* p< .05

137
The fifth multiple regression analysis was used to assess whether gender ratio
significantly predicted fathers‘ and mothers‘ involvement with children in interactive activities
while controlling for parents‘ age, number of children, work status, income, education, average
age of children, gender ideology, and place of birth. The first model included gender ratio and
the second model included control variables of parents‘ age, number of children, work status,
income, education, average age of children, gender ideology, and place of birth. The results in
table 55 indicated two models were estimated incrementally for fathers. The adjusted R² for
model 1 explained 11.2% of the variance in fathers‘ involvement in interactive activities by the
independent variable of gender ratio. Addition of the control variables (fathers‘ age, number of
children, work status, income, education, average age of children, gender ideology, and place of
birth) to the model did not increase the explained variance, but rather decreased it to (6.2%).
Although there was a significant change in R² from the null model to model one, the change in
R² from model one to model two was not significant. The overall model was not significant (F
=1.368, df =10, p< .05) even though much of the variability in fathers‘ involvement with
children in interactive activities was explained by variables not included in the estimated
equation. So, although gender ratio significantly contributed to the variance explained in
fathers‘ involvement with children in interactive activities, the addition of the control variables
(fathers‘ age, number of children, income, work status, education, average age of children,
gender ideology, and place of birth) did not. Hence, the addition of these variables to the model
did not modify the gender ratio effects in the final model. The standardized coefficients in the
final model indicated that gender ratio (Beta = .323) is the best predictor of fathers‘
involvement with children in interactive activities. The unstandardized Beta coefficients in the
final model showed that as the number of boys to girls in the family increased, fathers‘

138
involvement with children in interactive activities increased. Yet, fathers‘ age, number of
children, income, work status, education, average age of children, gender ideology, and place of
birth were insignificant predictors of fathers‘ involvement with children.
In addition, two incremental models were estimated for mothers. The results in table 56
revealed that the adjusted R² for model one explained 9.6% of the variance in mothers‘
involvement with children in interactive activities by gender ratio. Even though the addition of
the control variables (mothers‘ age, number of children, work status, income, and education as
well as average age of children, gender ideology, and place of birth) to the model increased the
explained variance to14.9%, the change in R² was not significant. It is important to note how
gender ratio contributed to model one, but the effects of gender ratio were modified in model
two once the control variables were added to the model. Therefore, the control variables of
mothers‘ age, number of children, income, work status, and education as well as average age of
children, gender ideology, and place of birth did not significantly contribute to the final model.
Further, the global F for the final model was 2.177, (df =10), which was not significant (p<
.05).
An ANCOVA analysis was run and the interaction terms between gender of parents and
gender ratio was tested to see if there was a significant difference between fathers and mothers
regarding behavioral involvement with children. The significant interaction term between
gender ratio and gender of parents implied that the relationship between gender ratio and
parents‘ involvement in interactive activities was significantly different between fathers and
mothers. Accordingly, as the boys‘ to girls‘ ratio in the family increased, fathers‘ involvement
with children in interactive activities increased when compared to mothers‘ involvement.

139
Table 55: Regression Coefficient of Independent Variables on Fathers‘ Involvement with
Children in Interactive Activities
Variables Model 1 Model 2
B Beta t Sig B Beta t Sig
Fathers
Gender ratio 4.982 .358 2.843 .006 4.489 .323 2.251 .029*
Age of fathers .244 .142 .799 .428
Number of children 1.307 .131 .915 .365
Work status
Working
Not working (reference)
-2.553
-.063
-.416
.679
--- --- --- ---
Income
High income
Low income
Middle income(reference)
-3.921
-.139
-.846
.402
5.017 .168 .995 .325
--- --- --- ---
Education
Bachelor degree and higher
less than bachelor(reference)
6.426
.232
1.477
.147
--- --- --- ---
Average age of children -.278 -.080 -.453 .653
Gender ideology
Traditional
Non-traditional(reference)
3.094
.114
.786
.436
--- --- --- ---
Place of birth
Outside U.S.
U.S. (reference)
-2.559
-.089
-.567
.574
--- --- --- ---
R²
Adjusted R²
R² changed
F
.128
.112
.128*
8.081*
.229
.062
.101
1.368
* p< .05
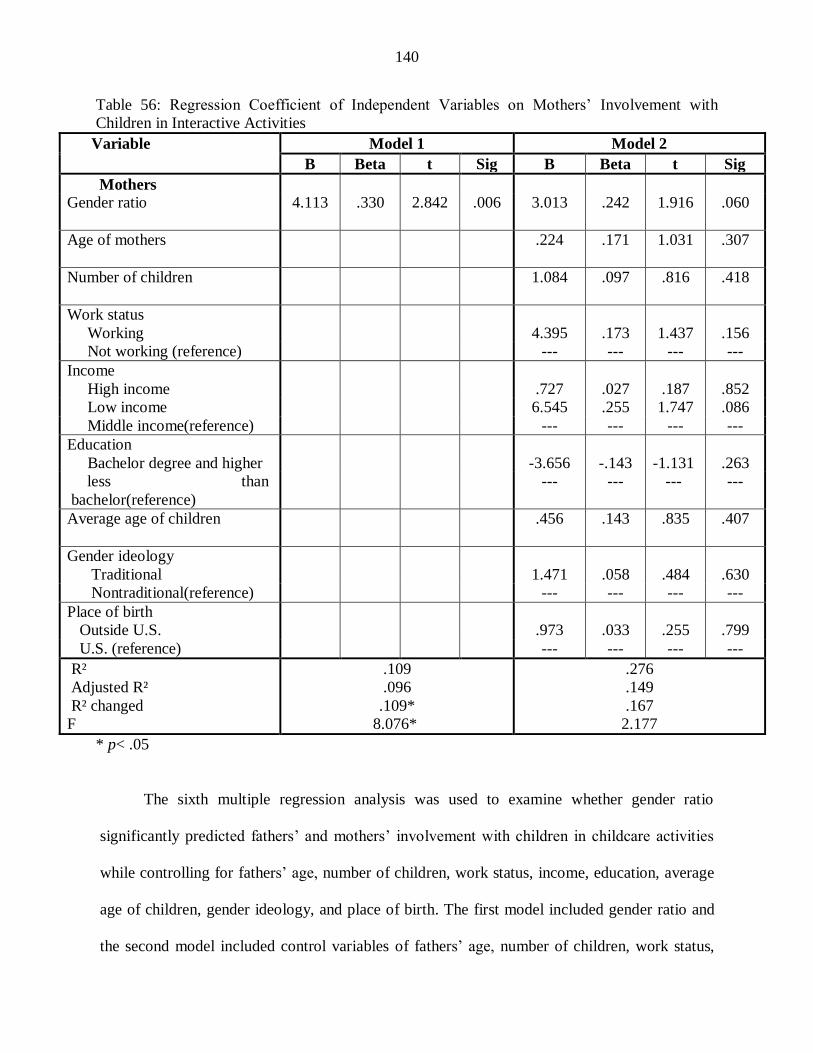
140
Table 56: Regression Coefficient of Independent Variables on Mothers‘ Involvement with
Children in Interactive Activities
Variable Model 1 Model 2
B Beta t Sig B Beta t Sig
Mothers
Gender ratio 4.113 .330 2.842 .006 3.013 .242 1.916 .060
Age of mothers .224 .171 1.031 .307
Number of children 1.084 .097 .816 .418
Work status
Working
Not working (reference)
4.395
.173
1.437
.156
--- --- --- ---
Income
High income
Low income
Middle income(reference)
.727
.027
.187
.852
6.545 .255 1.747 .086
--- --- --- ---
Education
Bachelor degree and higher
less than
bachelor(reference)
-3.656
-.143
-1.131
.263
--- --- --- ---
Average age of children .456 .143 .835 .407
Gender ideology
Traditional
Nontraditional(reference)
1.471
.058
.484
.630
--- --- --- ---
Place of birth
Outside U.S.
U.S. (reference)
.973
.033
.255
.799
--- --- --- ---
R²
Adjusted R²
R² changed
F
.109
.096
.109*
8.076*
.276
.149
.167
2.177
* p< .05
The sixth multiple regression analysis was used to examine whether gender ratio
significantly predicted fathers‘ and mothers‘ involvement with children in childcare activities
while controlling for fathers‘ age, number of children, work status, income, education, average
age of children, gender ideology, and place of birth. The first model included gender ratio and
the second model included control variables of fathers‘ age, number of children, work status,

141
income, education, average age of children, gender ideology, and place of birth. The results in
table 57 indicated two models were estimated incrementally for fathers. The adjusted R² for
model 1 explained 23.8% of the variance in fathers‘ involvement in childcare activities with
children by the independent variable of gender ratio. Addition of the control variables (fathers‘
age, number of children, work status, income, education, average age of children, gender
ideology, and place of birth) to the model increased the explained variance to (35%). The
change in R² from the null model to model one to model two was significant. These results
were further supported by the partial F tests. For the final model, the global F was 4.021, (df
=10), and was significant (p< .05). The results of the final model suggested that gender ratio,
age of fathers, number of children, and the average age of children all significantly contributed
to the variance explained in fathers‘ involvement in childcare activities with children.
Surprisingly, income, work status, education, gender ideology, and place of birth did not
significantly contribute to the model. Moreover, they did not modify the gender ratio effects.
The standardized coefficients in the final model indicated that only four of the ten variables,
gender ratio (Beta= .427); age of fathers (Beta= -.496); number of children (Beta= -.272), and
average age of children (beta= .451) significantly predicted fathers‘ involvement in childcare
activities with children. These results suggested also that age of fathers was the largest
contributor to fathers‘ involvement with children in childcare activities compared to the other
items. The unstandardized Beta coefficients in the final model revealed that as the boys‘ to
girls‘ ratio in the family increased, fathers‘ involvement with children in childcare activities
increased; as the age of fathers increased, fathers‘ involvement in childcare activities decreased;
as the number of children increased, fathers‘ involvement in childcare activities decreased as
well; and as the average age of children increased, fathers‘ involvement with children in

142
childcare activities increased. However, income, work status, education, gender ideology, and
place of birth did not contribute to the prediction of fathers‘ involvement with children in
childcare activities.
Two incremental models were also estimated for mothers. The results in table 58 showed
that the adjusted R² for model 1 explains less than 1% of the variance in mothers‘ involvement
with children in childcare activities by gender ratio. Although the addition of the control
variables of mothers‘ age, number of children, work status, income, and education, along with
the average age of children, gender ideology, and place of birth to the model slightly increases
the explained variance to almost 2%, the change in R² is not significant. Further, the global F for
the final model was 1.120, (df =10), which was not significant (p< .05). The regression results in
the final model revealed that gender ratio, the mothers‘ age, number of children, work status,
income, and education along with the average age of children, gender ideology, and place of
birth did not contribute to the prediction of mothers‘ involvement with children in childcare
activities when compared to fathers‘.
To detect a significant difference between fathers‘ and mothers‘ involvement with
children in childcare activities, an ANCOVA analysis was run and the interaction terms
between gender of parents and gender ratio was tested. The significant interaction term between
gender ratio and gender of parents indicated that the relationship between gender ratio and
parents‘ involvement with children in childcare activities was significantly different between
fathers and mothers. As the boys‘ to girls‘ ratio in the family increases, involvement of fathers
with children in childcare activities increases relative to mothers.

143
Table 57: Regression Coefficient of Independent Variables on Fathers‘ Involvement in
Child care Activities with Children when they were Babies
Variables Model 1 Model 2
B Beta t Sig B Beta t Sig
Fathers
Gender ratio 6.482 .502 4.299 .000 5.524 .427 3.585 .001*
Age of fathers -.793 -.496 -3.358 .002*
Number of children -2.509 -.272 -2.274 .028*
Work status
Working
Not working (reference)
.075
.002
.016
.987
--- --- --- ---
Income
High income
Low income
Middle income(reference)
1.157
.044
.323
.748
4.015 .145 1.031 .308
--- --- --- ---
Education
Bachelor degree and higher
less than bachelor(reference)
4.852
.189
1.443
.156
--- --- --- ---
Average age of children 1.455 .451 3.063 .004*
Gender ideology
Traditional
Non-traditional(reference)
1.813
.072
.596
.554
--- --- --- ---
Place of birth
Outside U.S.
U.S. (reference)
.051
.002
.015
.988
--- --- --- ---
R²
Adjusted R²
R² changed
F
.252
.238
.252*
18.482*
.466
.350
.215*
4.021*
* p< .05
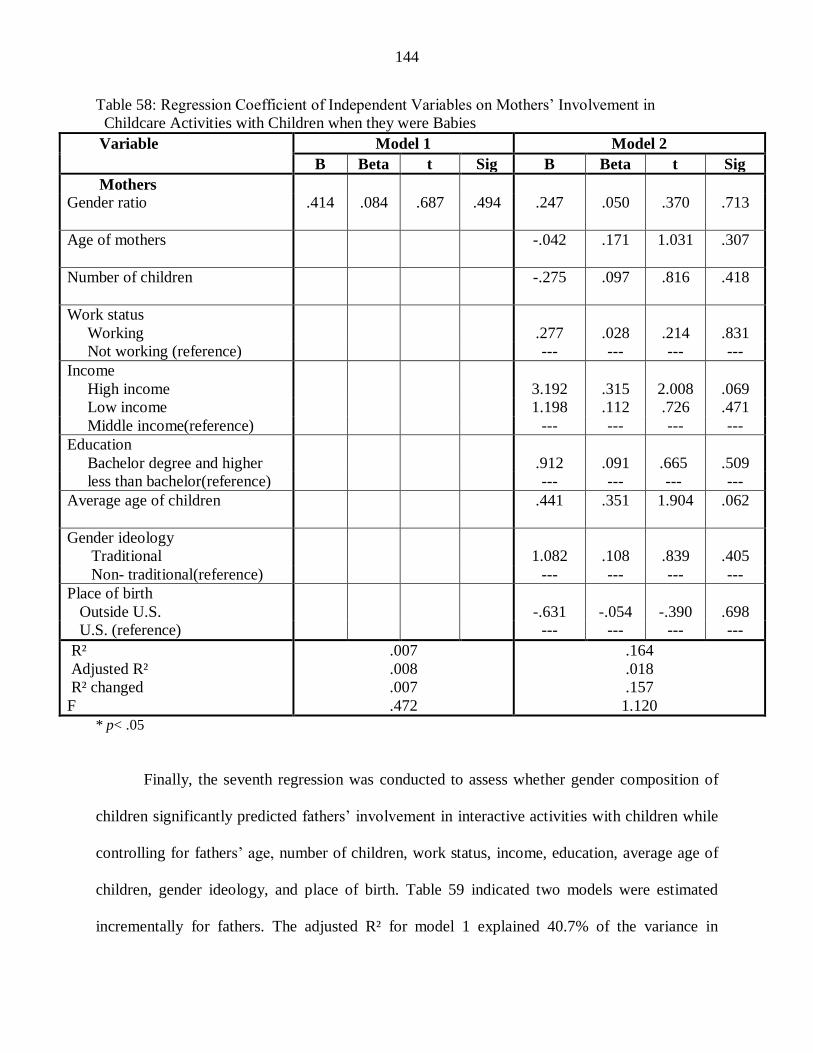
144
Table 58: Regression Coefficient of Independent Variables on Mothers‘ Involvement in
Childcare Activities with Children when they were Babies
Variable Model 1 Model 2
B Beta t Sig B Beta t Sig
Mothers
Gender ratio .414 .084 .687 .494 .247 .050 .370 .713
Age of mothers -.042 .171 1.031 .307
Number of children -.275 .097 .816 .418
Work status
Working
Not working (reference)
.277
.028
.214
.831
--- --- --- ---
Income
High income
Low income
Middle income(reference)
3.192
.315
2.008
.069
1.198 .112 .726 .471
--- --- --- ---
Education
Bachelor degree and higher
less than bachelor(reference)
.912
.091
.665
.509
--- --- --- ---
Average age of children .441 .351 1.904 .062
Gender ideology
Traditional
Non- traditional(reference)
1.082
.108
.839
.405
--- --- --- ---
Place of birth
Outside U.S.
U.S. (reference)
-.631
-.054
-.390
.698
--- --- --- ---
R²
Adjusted R²
R² changed
F
.007
.008
.007
.472
.164
.018
.157
1.120
* p< .05
Finally, the seventh regression was conducted to assess whether gender composition of
children significantly predicted fathers‘ involvement in interactive activities with children while
controlling for fathers‘ age, number of children, work status, income, education, average age of
children, gender ideology, and place of birth. Table 59 indicated two models were estimated
incrementally for fathers. The adjusted R² for model 1 explained 40.7% of the variance in
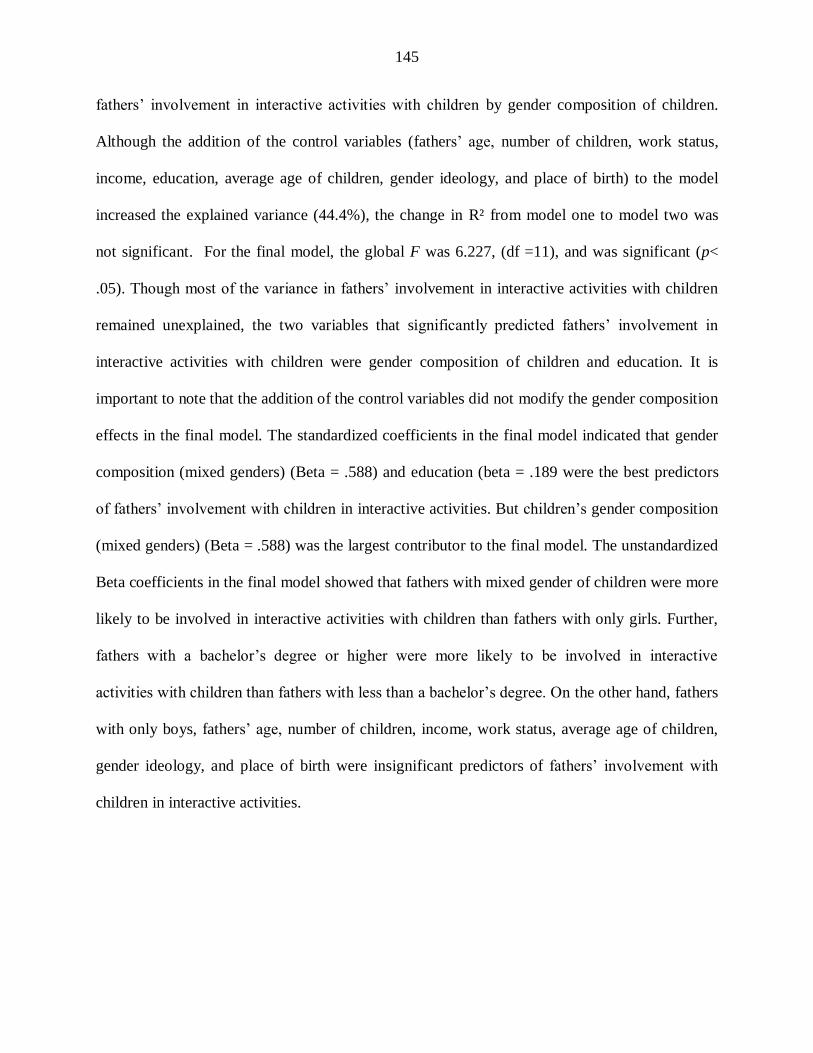
145
fathers‘ involvement in interactive activities with children by gender composition of children.
Although the addition of the control variables (fathers‘ age, number of children, work status,
income, education, average age of children, gender ideology, and place of birth) to the model
increased the explained variance (44.4%), the change in R² from model one to model two was
not significant. For the final model, the global F was 6.227, (df =11), and was significant (p<
.05). Though most of the variance in fathers‘ involvement in interactive activities with children
remained unexplained, the two variables that significantly predicted fathers‘ involvement in
interactive activities with children were gender composition of children and education. It is
important to note that the addition of the control variables did not modify the gender composition
effects in the final model. The standardized coefficients in the final model indicated that gender
composition (mixed genders) (Beta = .588) and education (beta = .189 were the best predictors
of fathers‘ involvement with children in interactive activities. But children‘s gender composition
(mixed genders) (Beta = .588) was the largest contributor to the final model. The unstandardized
Beta coefficients in the final model showed that fathers with mixed gender of children were more
likely to be involved in interactive activities with children than fathers with only girls. Further,
fathers with a bachelor‘s degree or higher were more likely to be involved in interactive
activities with children than fathers with less than a bachelor‘s degree. On the other hand, fathers
with only boys, fathers‘ age, number of children, income, work status, average age of children,
gender ideology, and place of birth were insignificant predictors of fathers‘ involvement with
children in interactive activities.
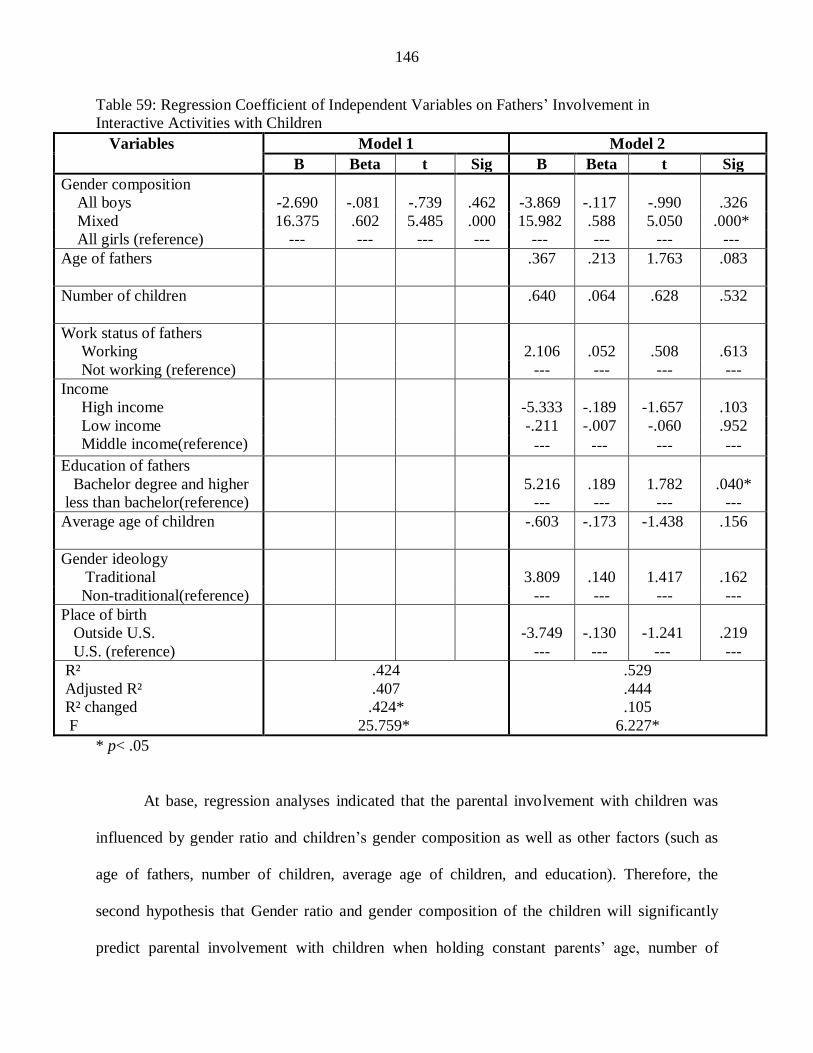
146
Table 59: Regression Coefficient of Independent Variables on Fathers‘ Involvement in
Interactive Activities with Children
Variables Model 1 Model 2
B Beta t Sig B Beta t Sig
Gender composition
All boys
Mixed
All girls (reference)
-2.690
-.081
-.739
.462
-3.869
-.117
-.990
.326
16.375 .602 5.485 .000 15.982 .588 5.050 .000*
--- --- --- --- --- --- --- ---
Age of fathers .367 .213 1.763 .083
Number of children .640 .064 .628 .532
Work status of fathers
Working
Not working (reference)
2.106
.052
.508
.613
--- --- --- ---
Income
High income
Low income
Middle income(reference)
-5.333
-.189
-1.657
.103
-.211 -.007 -.060 .952
--- --- --- ---
Education of fathers
Bachelor degree and higher
less than bachelor(reference)
5.216
.189
1.782
.040*
--- --- --- ---
Average age of children -.603 -.173 -1.438 .156
Gender ideology
Traditional
Non-traditional(reference)
3.809
.140
1.417
.162
--- --- --- ---
Place of birth
Outside U.S.
U.S. (reference)
-3.749
-.130
-1.241
.219
--- --- --- ---
R²
Adjusted R²
R² changed
F
.424
.407
.424*
25.759*
.529
.444
.105
6.227*
* p< .05
At base, regression analyses indicated that the parental involvement with children was
influenced by gender ratio and children‘s gender composition as well as other factors (such as
age of fathers, number of children, average age of children, and education). Therefore, the
second hypothesis that Gender ratio and gender composition of the children will significantly
predict parental involvement with children when holding constant parents‘ age, number of
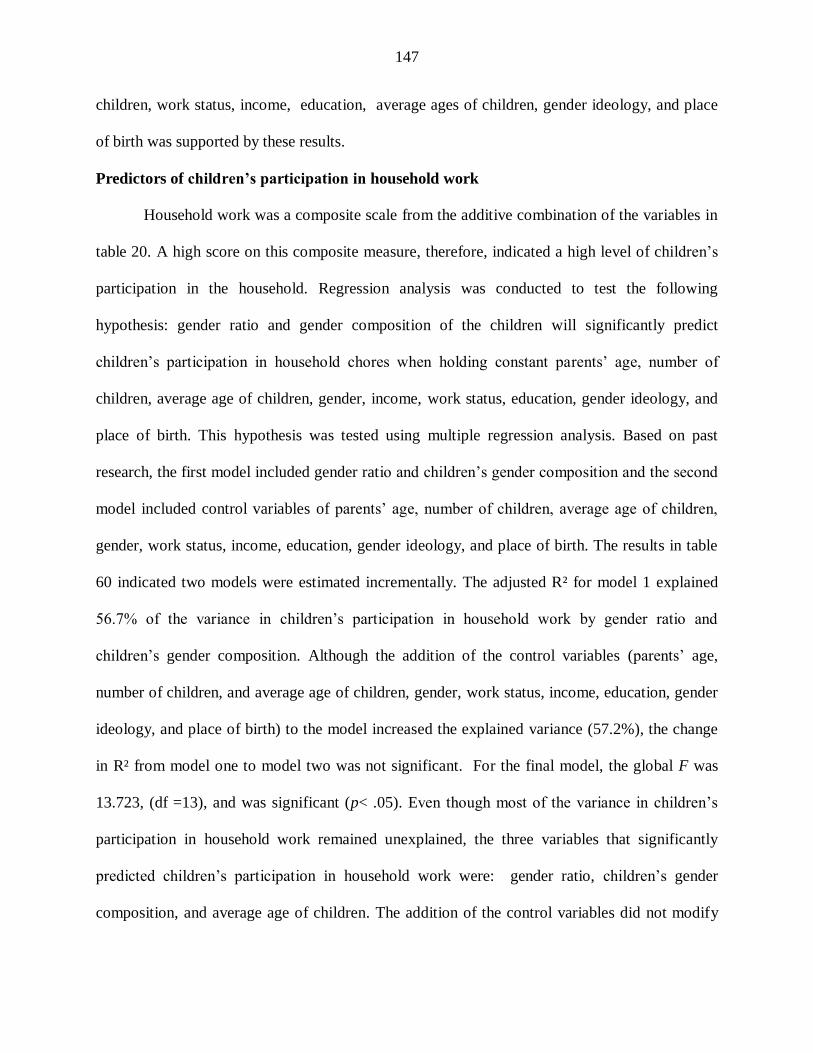
147
children, work status, income, education, average ages of children, gender ideology, and place
of birth was supported by these results.
Predictors of children’s participation in household work
Household work was a composite scale from the additive combination of the variables in
table 20. A high score on this composite measure, therefore, indicated a high level of children‘s
participation in the household. Regression analysis was conducted to test the following
hypothesis: gender ratio and gender composition of the children will significantly predict
children‘s participation in household chores when holding constant parents‘ age, number of
children, average age of children, gender, income, work status, education, gender ideology, and
place of birth. This hypothesis was tested using multiple regression analysis. Based on past
research, the first model included gender ratio and children‘s gender composition and the second
model included control variables of parents‘ age, number of children, average age of children,
gender, work status, income, education, gender ideology, and place of birth. The results in table
60 indicated two models were estimated incrementally. The adjusted R² for model 1 explained
56.7% of the variance in children‘s participation in household work by gender ratio and
children‘s gender composition. Although the addition of the control variables (parents‘ age,
number of children, and average age of children, gender, work status, income, education, gender
ideology, and place of birth) to the model increased the explained variance (57.2%), the change
in R² from model one to model two was not significant. For the final model, the global F was
13.723, (df =13), and was significant (p< .05). Even though most of the variance in children‘s
participation in household work remained unexplained, the three variables that significantly
predicted children‘s participation in household work were: gender ratio, children‘s gender
composition, and average age of children. The addition of the control variables did not modify

148
the gender ratio and gender composition of children effects in the final model. The standardized
coefficients in the final model showed that gender ratio (beta = -.274); gender composition of
children (mixed genders) (Beta = 1.034); and average age of children (beta = .150) were the best
predictors of children‘s participation in household work. But children‘s gender composition
(mixed genders) (Beta = 1.034) was the largest contributor to the final model. The
unstandardized Beta coefficients in the final model indicated that as the number of boys‘ to girls‘
ratio increased, children‘s participation in the household decreased; and as the average age of
children increased, children‘s participation in household work increased. Further, parents with
mixed gender children were more likely to use gender stereotyping when assigning household
work to children than parents with all girls. All boys gender composition, parents‘ age, number
of children, gender, income, work status, education, gender ideology, and place of birth were
insignificant predictors of children‘s participation in the household.
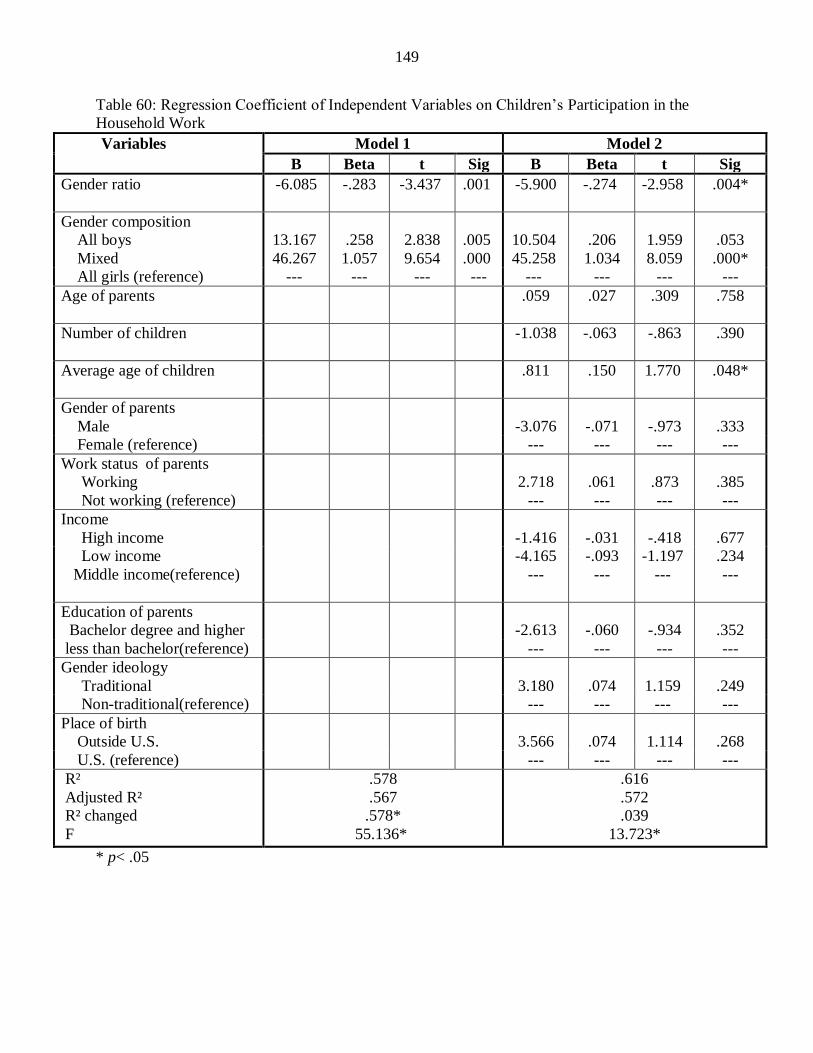
149
Table 60: Regression Coefficient of Independent Variables on Children‘s Participation in the
Household Work
Variables Model 1 Model 2
B Beta t Sig B Beta t Sig
Gender ratio -6.085 -.283 -3.437 .001 -5.900 -.274 -2.958 .004*
Gender composition
All boys
Mixed
All girls (reference)
13.167
.258
2.838
.005
10.504
.206
1.959
.053
46.267 1.057 9.654 .000 45.258 1.034 8.059 .000*
--- --- --- --- --- --- --- ---
Age of parents .059 .027 .309 .758
Number of children -1.038 -.063 -.863 .390
Average age of children .811 .150 1.770 .048*
Gender of parents
Male
Female (reference)
-3.076
-.071
-.973
.333
--- --- --- ---
Work status of parents
Working
Not working (reference)
2.718
.061
.873
.385
--- --- --- ---
Income
High income
Low income
Middle income(reference)
-1.416
-.031
-.418
.677
-4.165
---
-.093
---
-1.197
---
.234
---
Education of parents
Bachelor degree and higher
less than bachelor(reference)
-2.613
-.060
-.934
.352
--- --- --- ---
Gender ideology
Traditional
Non-traditional(reference)
3.180
.074
1.159
.249
--- --- --- ---
Place of birth
Outside U.S.
U.S. (reference)
3.566
.074
1.114
.268
--- --- --- ---
R²
Adjusted R²
R² changed
F
.578
.567
.578*
55.136*
.616
.572
.039
13.723*
* p< .05

150
In order to look at the types of household work which children might have been asked to
do, indoor work was the additive scale from the variables in table 21 and outdoor work was
created by combining the variables in table 22. Regression analysis was first conducted to assess
whether gender ratio would significantly predict children‘s participation in indoor work while
holding constant parents‘ age, number of children, average age of children, gender of parents,
work status, income, education, gender ideology, and place of birth. As seen in table 61, two
models were estimated incrementally. The adjusted R² for model 1 explained 55.9% of the
variance in children‘s participation in indoor household work by gender ratio. Though the
addition of the control variables (parents‘ age, number of children, average age of children,
gender of parents, work status, income, education, and place of birth) to the model slightly
increased the explained variance (56.2%), the change in R² from model one to model two was
not significant. For the final model, the global F was 13.236, (df =13), and was significant (p<
.05). Although most of the variance in children‘s participation in indoor household work
remained unexplained, gender ratio and gender ideology were significant predictors of children‘s
participation in indoor household work. The addition of the control variables did not modify the
gender ratio effects in the final model. The standardized coefficients in the final model pointed
out that gender ratio (beta = -.285) and gender ideology (beta = .117) were the best predictors of
children‘s participation in indoor household work. The unstandardized Beta coefficients in the
final model indicated that, as the boys‘ to girls‘ ratio increased, children‘s contribution to indoor
work (traditionally female tasks) decreased; and parents with traditional gender ideology were
more likely to use gender stereotyping when assigning household work to children than parents
with non-traditional gender ideology. In other words, boys were less likely to do indoor work
than girls. Parents‘ age, number of children, gender, income, work status, education, average age

151
of children, and place of birth did not significantly contribute to the prediction of children‘s
participation in indoor household work.
Table 61: Regression Coefficient of Independent Variables on Indoor Household Work
Variables Model 1 Model 2
B Beta t Sig B Beta t Sig
Gender ratio 4.075 -.271 -3.267 .001 -4.277 -.285 -.037 .003*
Age of parents .009 .006 .065 .948
Number of children -.578 -.050 -.681 .497
Average age of children -.498 -.132 -1.540 .126
Gender of parents
Male
Female (reference)
-1.086
-.036
-.487
.628
--- --- --- ---
Work status of parents
Working
Not working (reference)
1.701
.055
.774
.441
--- --- --- ---
Income
High income
Low income
Middle income(reference)
-.753
-.024
-.315
.753
-3.472 -.111 -1.413 .160
--- --- --- ---
Education of parents
Bachelor degree and higher
less than bachelor(reference)
-1.368
-.045
-.693
.490
--- --- --- ---
Gender ideology
Traditional
Non-traditional (reference)
3.518
.117
1.816
.042*
--- --- --- ---
Place of birth
Outside U.S.
U.S. (reference)
1.720
.051
.761
.448
--- --- --- ---
R²
Adjusted R²
R² changed
F
.570
.559
.570*
53.375*
.608
.562
.038
13.236*
* p< .05
152
Regression analysis was further employed to examine the effect of gender ratio on
children‘s participation in outdoor household work while holding constant parents‘ age, number
of children, average age of children, gender of parents, work status, income, education, gender
ideology, and place of birth. As shown in table 62, two models were estimated incrementally.
The adjusted R² for model 1 explained 4.8% of the variance in children‘s participation in outdoor
household work by gender ratio. Addition of the control variables (parents‘ age, number of
children, average age of children, gender of parents, work status, income, education, , gender
ideology, and place of birth) to the model increased the explained variance (7.2%), the change in
R² from model one to model two was not significant. For the final model, the global F was
1.880, (df =11), and was significant (p< .05). The final model revealed that gender ratio was the
only significant predictor of children‘s participation in outdoor household work. The effects of
gender ratio were not changed throughout the estimation of the models. The standardized
coefficients in the final model pointed out that gender ratio (beta = .261) is the best predictor of
children‘s participation in outdoor household work. The unstandardized Beta coefficients in the
final model indicated that, as the boys‘ to girls‘ ratio increased, children contribution to outdoor
work (traditionally male tasks) increased. In other words, boys were more likely to do outdoor
work than girls. It was interesting to note that parents‘ age, number of children, gender, income,
work status, education, average age of children, gender ideology, and place of birth did not
significantly contribute to the prediction of children‘s participation in outdoor household work.
Overall, these results provided a strong support to the third hypothesis: gender ratio and gender
composition of the children will significantly predict children‘s participation in household chores
when holding constant parents‘ age, number of children, average age of children, gender, work
status, income, education, gender ideology, and place of birth .

153
Table 62: Regression Coefficient of Independent Variables on Outdoor Household Work
Variables Model 1 Model 2
B Beta t Sig B Beta t Sig
Gender ratio 2.144 .237 2.704 .008 2.359 .261 2.858 .005*
Age of parents .001 .001 .012 .991
Number of children -1.015 -.146 -1.539 .127
Average age of children .021 .009 .076 .939
Gender of parents
Male
Female (reference)
-1.826
-.100
-.933
.353
--- --- --- ---
Work status of parents
Working
Not working (reference)
-.113
-.006
-.059
.953
--- --- --- ---
Income
High income
Low income
Middle income (reference)
.915
.048
.442
.659
3.365 .179 1.629 .106
--- --- --- ---
Education of parents
Bachelor degree and higher
less than bachelor(reference)
-1.689
-.092
-.977
.331
--- --- --- ---
Gender ideology
Traditional
Non-traditional(reference)
.707
.039
.421
.674
--- --- --- ---
Place of birth
Outside U.S.
U.S. (reference)
-.551
-.027
-.282
.779
--- --- --- ---
R²
Adjusted R²
R² changed
F
.056
.048
.056*
7.314*
.155
.072
.099
1.880*
* p< .05
154
Predictors of marital quality
Marital quality is a composite scale from the additive combination of the variables in
table 23. A high score on this composite measure therefore indicated positive marital quality.
Regression analysis was conducted to examine the following hypothesis: gender ratio, children‘s
gender composition, and parental gender preferences regarding children will significantly predict
marital quality when holding constant parents‘ age, number of children, average age of children,
age at marriage, gender, work status, income, education, gender ideology, place of birth, and
fathers‘ involvement. Based on the previous research, the first model included gender ratio,
children‘s gender composition, and parental gender preferences with regard children and the
second model included the control variables of parents‘ age, number of children, average age of
children, age at marriage, gender, work status, income, education, gender ideology, place of
birth, and fathers‘ involvement. The regression results revealed that, as seen in table 63, two
models were estimated incrementally. The adjusted R² for model 1 explained 10.6% of the
variance in marital quality by gender ratio. Addition of the control variables (parents‘ age,
number of children, average age of children, age at marriage, gender, work status, income,
education, gender ideology, place of birth, and fathers‘ involvement) to the model increased the
explained variance (11.3%).The change in R² from model one to model two was not significant.
For the final model, the global F was 1.876, (df =18), and was significant (p< .05). The final
model indicated that gender composition of children, average age of children, and fathers‘
involvement with children were the only significant predictors of marital quality. The effects of
gender composition were not changed throughout the estimation of the models. The standardized
coefficients in the final model indicated that only boys sibship (beta = .471), mixed sibeship
(beta = .721), average age of children (beta = -.266), and fathers involvement (beta =.265) are the
155
best predictors of marital quality. The unstandardized Beta coefficients in the final model
indicated that parents with only boys and mixed gender of children were more likely to have
positive marital quality than parents with only girls. In addition, as fathers‘ level of involvement
with children increased, marital quality increased; and as the average age of children increased,
marital quality decreased. Surprisingly, gender ratio, parental gender preferences regarding
children, parents‘ age, number of children, gender of parents, income, work status, education,
gender ideology, and place of birth did not significantly contribute to the prediction of marital
quality. Therefore, the fourth hypothesis that gender ratio, children‘s gender composition, and
parental gender preferences regarding children will significantly predict marital quality when
holding constant parents‘ age, number of children, average age of children, age at marriage,
gender, work status, income, education, gender ideology, place of birth, and fathers‘
involvement, was partially supported by these results.
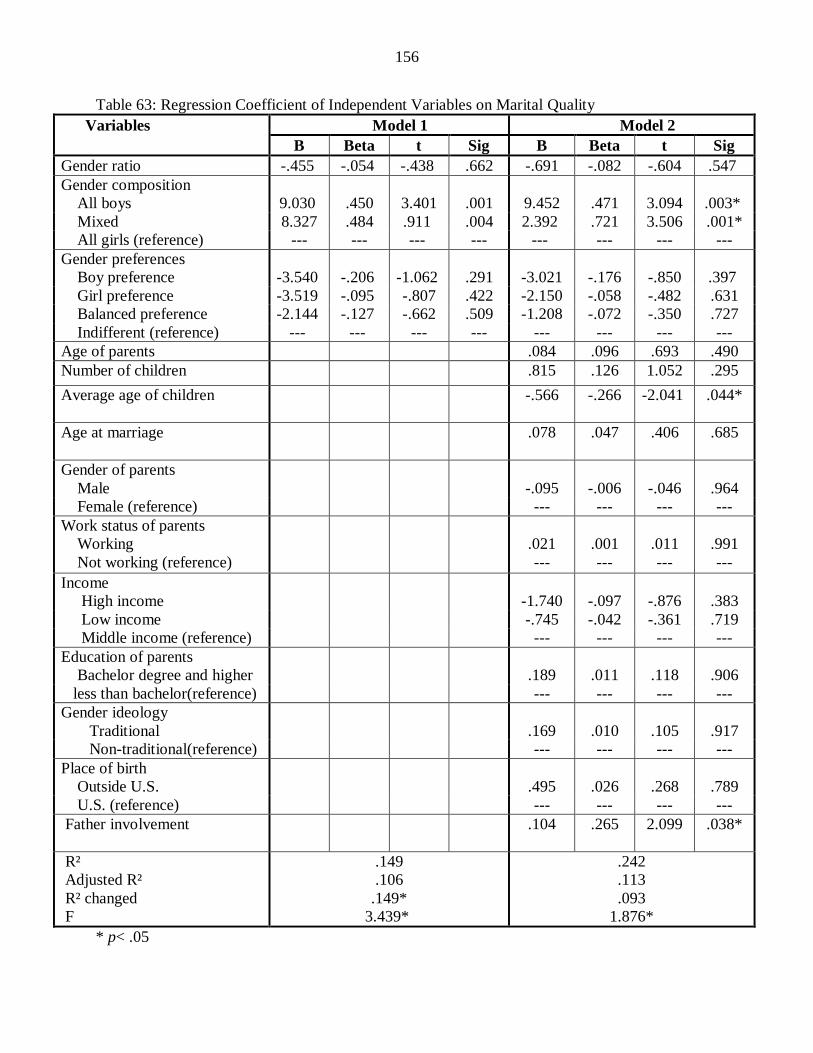
156
Table 63: Regression Coefficient of Independent Variables on Marital Quality
Variables Model 1 Model 2
B Beta t Sig B Beta t Sig
Gender ratio -.455 -.054 -.438 .662 -.691 -.082 -.604 .547
Gender composition
All boys
Mixed
All girls (reference)
9.030
.450
3.401
.001
9.452
.471
3.094
.003*
8.327 .484 .911 .004 2.392 .721 3.506 .001*
--- --- --- --- --- --- --- ---
Gender preferences
Boy preference
Girl preference
Balanced preference
Indifferent (reference)
-3.540
-.206
-1.062
.291
-3.021
-.176
-.850
.397
-3.519 -.095 -.807 .422 -2.150 -.058 -.482 .631
-2.144 -.127 -.662 .509 -1.208 -.072 -.350 .727
--- --- --- --- --- --- --- ---
Age of parents .084 .096 .693 .490
Number of children .815 .126 1.052 .295
Average age of children -.566 -.266 -2.041 .044*
Age at marriage .078 .047 .406 .685
Gender of parents
Male
Female (reference)
-.095
-.006
-.046
.964
--- --- --- ---
Work status of parents
Working
Not working (reference)
.021
.001
.011
.991
--- --- --- ---
Income
High income
Low income
Middle income (reference)
-1.740
-.097
-.876
.383
-.745 -.042 -.361 .719
--- --- --- ---
Education of parents
Bachelor degree and higher
less than bachelor(reference)
.189
.011
.118
.906
--- --- --- ---
Gender ideology
Traditional
Non-traditional(reference)
.169
.010
.105
.917
--- --- --- ---
Place of birth
Outside U.S.
U.S. (reference)
.495
.026
.268
.789
--- --- --- ---
Father involvement .104 .265 2.099 .038*
R²
Adjusted R²
R² changed
F
.149
.106
.149*
3.439*
.242
.113
.093
1.876*
* p< .05

157
Table 64: Summary of Significant Predictors of Regression Analysis on Four Family Processes
Family processes models Significant Predictors
Family size
Gender preferences-boy preference
Gender composition- all boys and all
girls sibships
Age of parents
Age at marriage
Parental Involvement with children Gender ratio
Gender composition – Mixed genders
Number of children
Fathers‘ Education-bachelor degree and
higher
Age of fathers
Participation in household work Gender ratio
Gender composition- mixed genders
Average age of children
Gender ideology-traditional gender
ideology
Marital quality Gender composition- all boys and
mixed genders
Average age of children
Fathers‘ involvement with children

158
CHAPTER 5
Discussion and Conclusion
The purpose of this study is to examine the effects of the gender of children in selected
Arab-American family processes. Specifically, it looked at assessing the relationships between
gender ratio, children‘s gender composition, and parental gender preferences regarding children
and family size, parental involvement with children, allocating household work to children, and
marital quality.
A cross-sectional quantitative research design was employed, using a self-administered
questionnaire. A convenience sample (N=200) of Arab-American parents who had at least two
children under 18 years old at home and resided in the tri-county area of Greater Metropolitan
Detroit, Michigan was recruited to participate in this study.
Four general hypotheses were examined, using multiple regression analysis.
Parental gender preference regarding children and children‘s gender composition will
significantly predict Arab-American family size when holding constant parents‘ age,
age at marriage, gender, place of birth, work status, income, education, and gender
ideology.
Gender ratio and gender composition of the children will significantly predict parental
involvement with children when holding constant parents‘ age, number of children,
work status, income, education, average ages of children, gender ideology, and place
of birth.
Gender ratio and gender composition of the children will significantly predict
children‘s participation in the household chores when holding constant parents‘ age,
159
number of children, average age of children, gender, work status, income, education,
gender ideology, and place of birth.
Gender ratio, children‘s gender composition, and parental gender preferences regarding
children will significantly predict marital quality when holding constant parents‘ age,
number of children, average age of children, age at marriage, gender, work status,
income, education, gender ideology, place of birth, and fathers‘ involvement.
All of these hypotheses were accepted in this study.
Following is an integrative discussion of the major research findings for each of the
specific family dynamics analyzed. Next, a discussion of the symbolic interactionist theory and
its relationship to family dynamics is examined. Finally, the dissertation is concluded by
outlining the major findings, its strengths and limitations, directions for the future, and the
implications of this study.
5.1 Family size
The first issue examined was family size and its relationship to parental gender
preferences with regard to children and children‘s gender composition. The bivariate analyses
revealed that parental gender preferences regarding children and children‘s gender composition
were significant predictors of family size. These results were further supported by multiple
regression analyses and the regression results provided a strong support to the first hypothesis:
parental gender preference regarding children and children‘s gender composition will
significantly predict Arab-American family size when holding constant parents‘ age, age at
marriage, gender, place of birth, work status, income, education, and gender ideology.
Specifically, the results showed that parents with a boy preference were more likely to have a
larger family size than parents no preference. Also, parents with only girls‘ sibship were more

160
likely to have more children than parents with mixed gender of children. Parents with only boys‘
sibships were less likely to have a bigger family size than parents with mixed gender of children
because they had achieved the desired number of boys. These results are consistent with the
findings of the majority of the literature in that family size and childbearing are strongly
influenced by the gender of the offspring in several societies. A strong son preference can be an
obstacle to fertility decline if couples persist in having children after reaching their overall family
size goal because they are not happy with the gender composition of their current family. Parents
who prefer sons to daughters may be unwilling to stop childbearing until their preferred number
of sons has been achieved (Dahl & Moretti, 2004; Rahman &Da Vanzo, 1993; Arnold & Roy,
1997). Also, some parents with all girls continue bearing children in hopes of achieving a boy.
Therefore, these families become relatively large.
One can assume that parents who want one or more children of a certain gender may have
larger families than would otherwise be the case. Parents who fail to achieve a balanced number
of daughters and sons (or at least one child of each gender) by the time they reach the number of
children planned, might tend to increase their family size upward (Gray & Morrison, 1974).
These results contradict some of the findings of previous research that there is no impact of
gender preferences on ultimate family size and that decisions about additional childbearing are
more likely to derive from socioeconomic considerations, such as level of education and work
status (Ayala & Falk, 1971; Repetto, 1972; Hoffman, 1975; Preston & Hartnett, 2008; Billari &
Philipov ,2004; Jones & Tertilt ,2006; Bettio & Villa, 1998; Rindfuss, et al., 2000).
The educational attainment and higher level of employment were expected to affect
fertility decisions downward. Surprisingly, education, work status, income, and other factors
were not significant predictors of family size. Although the majority of the respondents in this

161
study were highly educated, employed, and had higher incomes, cultural factors exerted a
powerful influence on fertility (to have more offspring), especially when they had a strong boy
preference. As one can see, gender preference for a boy in Arab-American families is still taking
place.
Those who have a strong boy preference and have all girls‘ sibships are more likely to
have a larger family due to the different utilities (functions) that a boy might provide to the
family, rather than a girl, such as social and economic benefits. Unlike the United States and
other developed countries, boys in traditional societies are presumed to have greater economic
net utility than daughters. Male offspring can provide assistance in wage earning, and can serve
as a form of social security to parents when they get old.
The biggest advantage for having a son is that the family name will be carried forward
(e.g., A El-Gilany & Shady, 2007; Hank & Kohler, 2000; Arnold & Roy, 1998; Baedhan 1988;
Basu, 1989). The results above are also evident in this study. When respondents were asked an
open-ended question to provide the reasons for wanting a boy and a girl, the majority indicated
that the main reasons for the preference for a male child were mainly social and cultural:
continuing the family name, taking care of elder parents, social status, and taking care of
siblings. These were followed by economic reasons, such as contributing to the family income
and providing practical help. Finally, parents cited psychological factors, such as bringing
happiness and satisfaction, thinking that boys are easy to raise, and having companionship. On
the other hand, the main reasons for wanting a girl were psychological, such as companionship,
happiness and satisfaction, and loving females; followed by social factors, such as taking care of
parents when they get older and to help with household work.

162
Moreover, the data also revealed that the age of parents and age at marriage were
significant predictors of family size. Similar to past research, there is a positive relationship
between the age of parents and family size; as the age of the respondents increased, family size
increased. Further, there is an inverse relationship between age at marriage and family size: as
the age at marriage increased, family size decreased. One explanation derived from the past
research is that older cohorts were less educated than younger ones, hence they were less neutral
about the gender and more adherent to the traditional male preference, thus having a larger
family size. In addition, parents who enter into their first marriage at a young age have a higher
expected fertility rate than those who marry later in life.
Overall, these findings are in agreement with the structural-functionalist theory that
preferring one gender over the other (boys over girls) can provide economic, social, or
psychological functions that contribute, in turn, to family solidarity. Yet, preferring boys over
girls can also be dysfunctional for the family and society, in the long term. If families want a
certain number of sons, they will continue bearing children until they achieve the desired number
of boys. This could impoverish them by having a larger family size. Further, the preference for
boys over girls could result in gender imbalance in the future (i.e., more men than women),
which could alter the structure of marriage in society by having a lack of marriage partners or
giving one gender more advantage/disadvantage in partner selection.
5.2 Parental involvement with children
This section examines the relationship of gender ratio and children‘s gender composition
to parental involvement with children. Some previous research pointed out that fathers are
becoming more egalitarian in their time investment with their children and that they feel just as
much affection for daughters as for sons (i.e., Hofferth, 2003; Tucker, 2003; Sandberg &

163
Hofferth, 2001; Sanderson & Thompson, 2002). These reported changes can be traced to the
increased social pressure that fathers face to adopt more equal roles in today‘s society (Morgan
& Pollard, 2002).
In this study, bivariate analyses indicated that gender ratio and children‘s gender
composition significantly predicted parental involvement with children. Multivariate findings
further provided support to the second research hypothesis: gender ratio and gender composition
of the children will significantly predict parental involvement with children when holding
constant parents‘ age, number of children, work status, income, education, average age of
children, gender ideology, and place of birth. In particular, the results indicated that fathers,
compared to mothers, were more behaviorally and emotionally involved with boys than with
girls. As the number of boys to girls in the family increased, fathers‘ behavioral involvement
with children relative to mothers‘ involvement increased; and as number of boys to girls in the
family increased, fathers‘ emotional involvement with children relative to mothers increased.
These findings support the majority of the previous literature suggesting that fathers spend more
time with boys than with girls in several activities; and fathers report a greater emotional
attachment and closeness to their sons than to their daughters (e.g., Bryant & Zick, 1996;
McHale, Crouter, & Tucker, 1999; McHale & Updegraff, 2000; Yeung, 2001; Tucker, 2003).
A possible explanation for these findings is that fathers may have gender-typed their time
investment in children because they believed that boys needed their fathers as role models (more
than girls) and that fathers had particular knowledge to share with their sons. This may have
affected the amount of interaction between fathers and sons versus time between fathers and
daughters. In addition, there is often a greater similarity of interests between fathers and their
sons. Children themselves may contribute to this process by seeking out the parent they feel is
164
most gender suitable for the activity they want to do. For instance, boys may be more likely to
approach their fathers, rather than their mothers, when they want to do something they see as
masculine, such as sports. Girls may be more likely to approach their mothers to fulfill needs
such as the desire to go shopping (Raley & Bianchi, 2006).
A further explanation is that this differential treatment by fathers may be due, in part, to
stereotypes which fathers hold about what is appropriate behavior for a child of a given gender,
or to different aspirations they have with regard to their child‘s future (Maccoby 2003).
However, mothers do not spend more extensive amounts of time with girls than with boys and
report being just as close to their sons as to their daughters. This is due to the fact that they spend
much more time engaged in childrearing activities than fathers do. They are usually responsible
for meeting the day-to-day needs of their children, such as ensuring that children are dressed,
fed, bathed, perform well at school, etc., while fathers are more likely to focus on breadwinning
as their primary parenting role (Raley & Bianchi, 2006).
Findings reported by some researchers indicated that children of both genders (mixed
gender) or a fraction of boys, positively affected the frequency of fathers‘ involvement with their
children (Cooksey & Fondell 1996; Marsiglio 1991; Wilcox 2002; Zick et al., 2001; Harris and
Morgan, 1991). This study revealed similar results in that fathers with mixed gender children
were more involved behaviorally and emotionally with their children than fathers with only girls.
A possible explanation, as indicated by Harris and Morgan (1991), is that children of both
genders (mixed gender) receive greater attention from their father when there is a boy present in
the family. Therefore, the presence of boys in the family can draw fathers into more active
parenting. This greater involvement, in turn, benefits girls because they receive more (but not
equal) attention from their fathers.
165
When taking into account the types of activities in which parents were involved with
children, the data analyses (e.g., descriptive statistics) indicated that both parents were involved
in various activities with children. Generally, mothers were more involved with children in
interactive and childcare activities than fathers, but fathers were not too far behind. Fathers were
found to be more involved with boys than with girls in interactive and childcare activities, but,
there were no extreme variations in mothers‘ level of involvement with both boys and girls in
interactive and childcare activities. Bivariate and multivariate analyses further suggested that as
the number of boys to girls in the family increased, fathers‘ involvement with children in
interactive activities relative to mothers‘ increased, as the number of boys to girls in the family
increased, fathers‘ involvement with children in childcare activities relative to mothers‘
increased; and fathers with mixed genders sibships were more likely to be involved with children
in interactive activities than fathers with only girls. These results are similar to previous research
in that most of the time men spent with their children was in the form of interactive activities,
such as play/companionship activities or helping with homework (e.g., Yeung, 2001; Zick &
Bryant, 1996; Gershuny & Robinson, 1988; Harris & Morgan ,1991). On the other hand, these
results are in contrast to past research, which documents that fathers were less involved in
childcare activities (Robinson and Godbey, 1997; Hofferth & Anderson, 2003). Yet, mothers do
not spend more extensive amounts of time with girls than with boys in various activities
(interactive and childcare activities) due to the fact that they still shoulder the lion‘s share of the
parenting as their primary job (doing the work). The research clearly showed that once fathers
were involved in childcare activities, they acquired a continuing taste for active childrearing,
especially when boys were present in the family.
166
The data analyses (regression analyses) also revealed that the number of children, fathers‘
education, average age of children, and fathers‘ age were significant predictors of parental
involvement with children. Consistent with previous studies, the number of children was
associated negatively with parental involvement (behavioral, emotional, and involvement in
childcare activities) with children. Having more children implied fewer parental resources going
to each child in terms of time, emotional and physical energy, attention, and ability to interact
with children as individuals (Black, 1989; Harris and Morgan, 1991).
Several previous studies highlighted that fathers‘ educational attainment was positively
associated with their involvement with children in various activities (Aldous, et al., 1998;
Marsiglio, 1991; Yeung, et al., 2001). This study revealed similar results in that fathers with
more education invested more time and did more enriching activities with their children than
less-educated fathers. These results suggest that parents with a higher level of education, in
particular college-educated parents, may perceive greater benefits from spending time caring for
their children. They are thought to be more aware of the importance of the investment of time in
cultivating children‘s human and social capital, and are more strongly motivated to conform to
the norms of involved parenting (Coleman, 1988; Daly, 2001; Kitterod, 2002). Thus, increased
fathers‘ involvement may contribute to the children‘s overall development, their economic
outcomes in adult life, and improvements in a family‘s overall well-being (Aldous, Mulligan, &
Bjarnason, 1998; Lundberg, 2006).
The average age of children was also a significant predictor of fathers‘ involvement with
children in childcare activities: as the average age of children increases, fathers‘ involvement
with children in childcare activities increases. This result validates previous research that there
was a greater involvement of fathers when children were older than five years (Anderson, 2003;
167
Aldus, 1998). However, other studies found a lower level of parental involvement, in absolute
terms, with older children (Barnett & Baruch, 1987; Marsiglio, 1991; Pleck, 1985; Yeung, 2001).
A possible explanation for this is that involvement with younger children in childcare activities
requires a large amount of time and energy. Employed fathers do not have time or energy to fully
participate in childcare duties for their older children.
The analyses results further revealed that the age of fathers had a negative association
with fathers‘ involvement with children, especially in personal childcare activities. These results
are in line with past research which suggested that as the age of fathers‘ increased, their
involvement in childcare activities with children decreased. Nevertheless, Yeung (2001) found
that the age of fathers had a positive association with the amount of time fathers spent with their
children, the results of this study revealed that. A possible interpretation is that older fathers held
more traditional attitudes and were less prone to being involved in childcare activities than
younger fathers. Taken as a whole, these results are in agreement with the structural-functionalist
theory signifying that increased parental involvement with children is functional for the overall
children‘s well-being. However, differential treatment by fathers based on the gender of their
children can be seen as dysfunctional, especially for girls whose overall well-being may be
affected by lack of attention.
5.3 Children’s participation in household work
Data on children‘s contribution to household work in relation to gender ratio and
children‘s gender composition was examined in this study. The bivariate, and multivariate
analyses revealed that children‘s gender ratio and children‘s gender composition were significant
predictors of children‘s participation in household work. Multiple regression analyses results
further provided support to the following research hypothesis: gender ratio and gender
168
composition of the children will significantly predict children‘s participation in household chores
when holding constant parents‘ age, number of children, average age of children, gender, work
status, income, education, gender ideology, and place of birth. Specifically, the results showed
that as the number of boys to girls in the family increased, children‘s contributions to household
work decreased, which implied that boys were less likely than girls to participate in household
work as a whole. Further, parents with mixed genders of children were more likely to display
gender stereotype when allocating household work to children. These results are in line with
previous research showing that gender is a key determinant in the assignment of household tasks.
In general, boys do less household work than girls do and when sibling groups are of mixed
genders, parents are more likely to allocate household work to children based on their gender
(e.g., Brody & Steelman, 1985; Raley & Bianchi, 2006; White & Brinkerhoff, 1981). Yet,
Tucker et al., (2003) indicated that parents in married-couple families assigned household tasks
to adolescent sons and daughters evenly.
When considering the types of household work (indoor and outdoor), the analyses
revealed that as the number of boys to girls increased, children‘s contribution to indoor work
decreased; and as the number of boys to girls increased, children‘s contribution to outdoor work
increased. These results validate previous literature that boys are generally do the outdoor jobs,
such as taking out the trash and household repairs, whereas girls are typically assigned indoor
activities, such as washing the dishes, cooking, etc. In addition, girls devote more time to such
activities than do boys (e.g., Cager, 1999; McHale, 1990; Brody & Steelman, 1985; White &
Brinkerhoff, 1981). A possible explanation is that parents assign household work to children
based on gender to teach them to be responsible, independent, and prepared for paid work in the
future. A further explanation is that this sex-typing of the household assignments may be due, in
169
part, to stereotypes which parents hold about what is an appropriate role for a child of a given
gender, or to future aspirations they have for their child (Maccoby, 2003).
The analyses results further pointed out that the average age of children was positively
associated with children‘s participation in household work: as the average age of children
increased, children‘s contribution to the household work increased. This finding corresponded
with previous research suggesting that the age of children is a key determinant of the assignment
of tasks (e.g., Blair 1992a, b; Cogle and Tasker, 1982; White & Brinkerhoff, 1981). Possibly, as
children get older they are physically more capable, socially more responsible, skilled, and have
acquired competence through experience and practice to take on certain tasks autonomously.
Thus, their domestic work assignments become more stereotypical and gender-segregated.
Gender ideology was also found to be associated with children‘s participation in household
work. Parents with traditional gender attitudes were more likely to allocate indoor household
work to children based on gender than parents with non-traditional gender ideology. This result
confirmed previous research that those who expressed traditional gender-role attitudes were
more prone to agree with the strict gender typing of children's household tasks than were their
opposites (Duncan & Duncan, 1978; White & Brinkerhoff, 1981; Blair, 1992b).
These results strongly suggest that girls are perceived to put in substantially more time
and effort in household work and do more indoor work than boys, while boys are more likely to
perform outdoor work than girls. This, in turn, suggests that the sex-linked assignment of
children‘s household work is a powerful societal norm which becomes more intense as the child
matures. Therefore, children continue to be socialized into gender specific roles through the
gender typing of household assignments and these role assignments become more pronounced as
children approach adulthood (Geger, Cooney & Call, 1999). Moreover, this gender-segregated

170
pattern corresponds closely to the division of responsibilities commonly observed among adults
(e.g., Blair 1992a, b; Cogle & Tasker 1982; White & Brinkerhoff 1981). That is, women are
more likely to perform greater total amounts of household work and perform qualitatively
different types of household chores.
In general, these results validate the structural-functionalist theory view that participation
of children in household tasks has important functional, integrative, and developmental
implications, both for the child and for the family. In particular, it teaches children to be
responsible, independent, and prepared for paid work in the future.
5.4 Marital quality
The relationship between gender ratio, children‘s gender composition, and parental
gender preferences regarding children and marital quality was evaluated in this study. The
bivariate analyses revealed that gender ratio and children‘s gender composition were significant
predictors of marital quality. However, the regression analyses suggested that children‘s gender
composition was a significant predictor of marital quality. Thus, these results provide partial
support to the following hypothesis: gender ratio, children‘s gender composition, and parental
gender preferences regarding children will significantly predict marital quality when holding
constant parents‘ age, number of children, average age of children, age at marriage, gender, work
status, income, education, gender ideology, place of birth, and fathers‘ involvement. Specifically,
the results indicated that parents with only boys and mixed sibships were more likely to report
positive marital quality than parents with only girls‘ sibships. These findings are consistent with
previous studies which showed that the presence of boys in the family increased the likelihood
that a marriage would remain intact; and having all boys was associated with higher levels of
happiness and satisfaction. (e.g., Dahl & Moretti, 2004, Mizell & Steelman, 2000, Raley &
171
Bianchi, 2006; Katzev et al., 1994). This may be because boys continue to be more valued in
Arab-American society. Parents with boys may feel more satisfied in their marriage and hence
are less disposed to consider separation from their spouse. In contrast, some researchers have
found higher marital satisfaction and happiness among wives with daughters compared to wives
with sons (Abbott & Brody, 1985). Surprisingly, gender ratio and gender preferences were
insignificant in predicting marital quality. A possible explanation is that the data didn't allow for
enough variation to obtain statistical variations. The other variables in the regression analysis
were so strong that they washed out any impact these variables might have had on marital
quality.
This research also indicates that the average age of children and fathers‘ involvement
with children in various activities are significant predictors of marital quality. The average age of
children has an inverse relationship with marital quality: as the average age of children increases,
marital quality decreases. These findings are inconsistent with previous research suggesting that
parents with young children are more dissatisfied with their marriages than parents with older
children (e.g., Twenge, Campbell, & Foster, 2003; Glenn & McLanahan, 1982; Sollie & Miller,
1980). Possibly, as children grow up, they become more (financially) demanding and require
more supervision placing significant stress on parents which, in turn, can lead to dissatisfaction
with the marriage. A further explanation is that parents with older children are faced with issues
of teenage dissent. These older children may challenge their parents' wishes that they conform to
Arab community rules. The resultant stress can affect parents‘ level of marital satisfaction,
happiness, and stability.
Research on the effect of child gender on marriage has suggested a positive relationship
between fathers‘ involvement and marital satisfaction and stability. When fathers significantly

172
participate in family activities, including childcare, mothers perceive less disadvantage in their
marital relationship and are more satisfied (Blair & Johnson, 1992). These results are evident in
the current study: as fathers‘ level of involvement with children increases, marital quality
increases as well. Past research suggests that paternal involvement in parenting can be related to
marital satisfaction and stability in two ways. First, when fathers are more involved with sons
than with daughters, they play a more crucial role in the emotional and social development of
their sons. Therefore, having a son increases marital surplus, or the value of marriage relative to
single parenthood. Second, fathers may simply place a higher value on marriage and family if
they have a son (e.g., Lunderberg, 2003; Kalmun, 1999; Harris & Morgan, 1991; Marsiglio,
1991). Simultaneously, these results support the structural-functionalist theory that the presence
of a boy can be functional for a couple‘s marriage by increasing marital quality and stability.
5.5 Symbolic interactionist theory and family dynamics
Symbolic interaction theory focuses on face-to-face interaction, and how people define and
construct personal reality (Ritzer & Goodman, 2006). Based on social interactions with others,
people construct their own meanings. Since meaning is created from these interactions, the
interpretations assigned to being male and female are not permanent and can be modified as
people deal with various encounters in their lives (Wallace & Wolf, 2006). Accordingly, people
do not respond directly to physical actions, but they respond to their own subjective
interpretations of these actions (Williams, Sawyer & Wahlstorm, 2009; Nelson & Robinson,
2002; Renzetti & Curran, 2003). Through interaction with others, especially parents, children
learn their gender identity as a ‗boy‘ or ‗girl‘ and the meaning of gender-appropriate behavior as
they begin to take on their defined roles. Parents bring a gendered self into situations and act
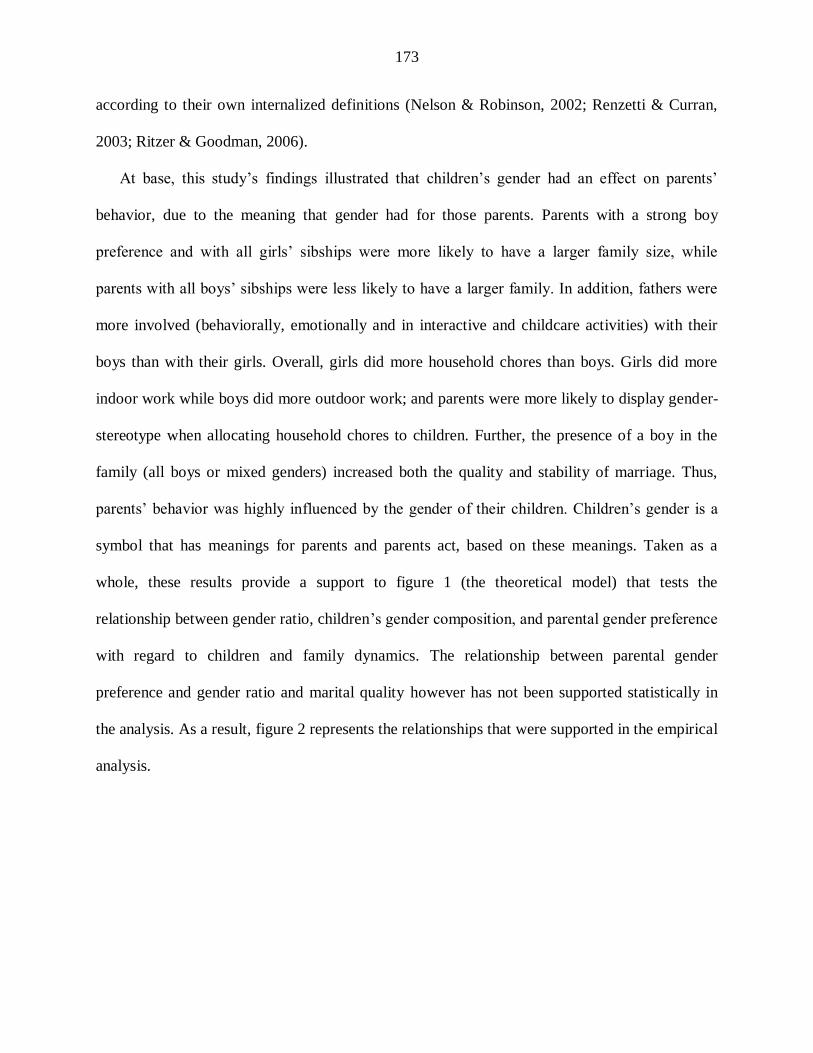
173
according to their own internalized definitions (Nelson & Robinson, 2002; Renzetti & Curran,
2003; Ritzer & Goodman, 2006).
At base, this study‘s findings illustrated that children‘s gender had an effect on parents‘
behavior, due to the meaning that gender had for those parents. Parents with a strong boy
preference and with all girls‘ sibships were more likely to have a larger family size, while
parents with all boys‘ sibships were less likely to have a larger family. In addition, fathers were
more involved (behaviorally, emotionally and in interactive and childcare activities) with their
boys than with their girls. Overall, girls did more household chores than boys. Girls did more
indoor work while boys did more outdoor work; and parents were more likely to display gender-
stereotype when allocating household chores to children. Further, the presence of a boy in the
family (all boys or mixed genders) increased both the quality and stability of marriage. Thus,
parents‘ behavior was highly influenced by the gender of their children. Children‘s gender is a
symbol that has meanings for parents and parents act, based on these meanings. Taken as a
whole, these results provide a support to figure 1 (the theoretical model) that tests the
relationship between gender ratio, children‘s gender composition, and parental gender preference
with regard to children and family dynamics. The relationship between parental gender
preference and gender ratio and marital quality however has not been supported statistically in
the analysis. As a result, figure 2 represents the relationships that were supported in the empirical
analysis.
174
Figure 2: Revised Theoretical Model
Involvement
Marital
quality
Gender
Ratio
Gender
Composition
Family Size
Gender
preference
Household
Work

175
5.6 Conclusions
The goal of this study was to address the relationship between children‘s gender and
various Arab-American family dynamics. It was designed specifically to examine the effect of
gender ratio, children‘s gender composition, and parental gender preferences regarding children
on family size, parental involvement with children, allocating household work to children, and
marital quality. The basic research question was: what is the impact of the gender of children on
Arab-American family dynamics? The study has significantly contributed to the body of the
literature on the impact of children‘s gender on family dynamics. The analysis revealed several
interesting significant findings. In summary, parental gender preference regarding children and
children‘s gender composition do predict family size when parents‘ age, age at marriage, gender,
place of birth, work status, income, education, and gender ideology hold constant. Specifically,
the results showed that parents with a boy preference were more likely to have more children
than parents with an indifferent preference. Parents with only girls‘ sibship were more likely to
have a larger family than parents with mixed genders. Nevertheless, parents with only boys‘
sibships were less likely to have more children than parents with mixed gender children. Age and
age at marriage were also significant predictors of family size; as age of the respondent
increased, family size increased; and as the age at marriage increased, family size decreased.
Gender ratio and gender composition of the children significantly predicted parental
involvement with children when holding constant parents‘ age, number of children, income,
work status, education, average age of children, gender ideology, and place of birth.
Distinctively, the analyses revealed that as the boys‘ to girls‘ ratio increased, fathers‘ behavioral
and emotional involvement with children relative to mothers‘ increased; fathers with mixed
gender children were more likely to be involved behaviorally and emotionally with children than

176
fathers with only girls; and as the number of boys to girls in the family increased, fathers‘
involvement with children in interactive and childcare activities relative to mothers‘ involvement
increased. Moreover, fathers with mixed gender children were more likely to be involved with
children in interactive activities than fathers with only girls. The number of children, fathers‘
education, average age of children, and fathers‘ age were also significant predictors of parental
involvement with children. The number of children associated negatively concerning parental
involvement with children (behavioral, emotional, and involvement in childcare activities);
fathers‘ educational attainment was positively related to fathers‘ involvement (behaviorally,
emotionally, and involvement in interactive activities) with children; and as the average age of
children increased, fathers‘ involvement with children in childcare activities increased.
Additionally, the age of fathers had a negative relationship to fathers‘ involvement with children
in childcare activities.
The results of studying the allocation of household work to children indicated household
work was more gender-segregated in the Arab-American families studied. Gender ratio and
gender composition of children predicted children‘s participation in the household. Boys overall
did less household work than girls did; boys did less indoor work than girls did, while boys did
more outdoor work relative to girls; and parents with mixed genders children were more likely to
display gender-stereotype when allocating household chores to their children. This sex-linked
assignment of children‘s household work becomes more intense as the child matures (average
age of children increases) and when parents hold to more traditional gender ideology attitudes.
Regarding marital quality, parents with only boys and with mixed gender sibships were
more likely to report positive marital quality than parents with only girls; and marital quality
increased when fathers participated more in family activities. On the other hand, marital quality
177
decreased as the average age of children increased. Therefore, these results as a whole validated
the symbolic interactionist view that gender is socially constructed and through interaction with
others, especially parents, children learn their gender identity as a ‗boy‘ or ‗girl‘ and the meaning
of gender appropriate behavior as they begin to take on the role as defined by significant others.
Parents bring a gendered self into situations and try to act according to their own internalized
definition. Thus, parents‘ behavior is highly influenced by the gender of their children.
Strengths and limitations of the study
This study makes several important contributions to the body of current literature on the
effect of children‘s gender on Arab-American family processes. This research is the first to
examine the impact of children‘s gender on various Arab-American family dynamics in the
United States, specifically family size, parental involvement with children, allocating household
work to children, and marital quality. Moreover, the majority of previous research measured
parental involvement with children in terms of its quantity rather than its quality (emotional
involvement). This study is one of the few to measure both the quality and the quantity of
parental involvement with children in various activities. This study also expands previous
research by looking at four measures of Arab-American family processes at the same time (e.g.,
family size, parental involvement with children, allocating household work to children, and
marital quality). Finally, the innovative ways in which the gender of child has been analyzed in
this study have advanced our conceptualizations and understanding of the impact of children‘s
gender on Arab-American family dynamics.
Although many significant contributions have been made by this study, there are also
some very important limitations. First, this study relied on a convenience sample technique
which, in turn, reduced the ability to generalize the results to a larger population of Arab-
178
American families, even those in the tri-county area of study. Second, the sample technique and
size did not allow for enough variation to obtain statistical variations. For example, relying on a
convenience sample procedure probably attracted only those parents who felt relatively
comfortable describing their relationships with their children. These parents were more likely to
agree to participate than those who believe in strict gender division. This is probably more true
for the men than for the women. Therefore, their behavior may not have been representative of
the Arabic community as a whole. If possible, a random sample technique should be used in
future research to collect a more diverse sample from Arab-American families to ensure findings
would be generalizable. Third, the sample in this study was limited to intact Arab-American
families with at least two children under 18 at home who reside in a tri-county area. Thus, the
results are not generalizable to families with one child, separated or divorced families, or
families that reside in other regions rather than this tri-county area. Fourth, the data used in this
study were self-reported by Arab-American parents and thus may have been subject to social
desirability. Finally, this study was based on a cross-sectional design and therefore did not allow
for establishing causality. In order to establish causality and provide data would necessitate the
use of a longitudinal research design that would enable a researcher to investigate more
sophisticated models.
Directions for Future Research
More research is needed to understand the impact of a child‘s gender on Arab-American
family processes in depth. Therefore, it may useful to employ a qualitative method, using in-
depth face-to-face interviews in order to enhance the knowledge about the relationship between
gender of children and Arab-American family dynamics. Future research is also needed to
expand the findings of the current study and generalize them to a broader population of Arab-
179
American families. This would require the use of a random sample technique, if possible, in
which findings would be generalizable to a broader population of Arab-American families.
Moreover, there is a need to replicate this study using a larger sample size from Arab-American
families in order to allow for enough variation and to obtain more statistical variations. It would
also be valuable to apply it to Arab-American families from different regions of the United
States and compare it to other ethnic groups (i.e., American, Indian, Russian, etc) in order to look
at the differences and the similarities between Arab-American families from different regions
and other ethnic groups. Further, a longitudinal research design is needed in order to establish
causality and provide data that enables the researcher to investigate more sophisticated models.
Future research should also study the impact of children‘s gender on family process in separated
and divorced Arab-American families and compare it to intact families. This would allow a view
of the differences and the similarities between intact families and other types of family
structures.
Finally: Do parents encourage gender differences or do children‘s gender-differentiated
behaviors elicit different parental treatment? Greater attention to the ways in which sons and
daughters elicit or reinforce various parental behaviors is a topic worthy of more serious
sociological attention.
Implications of the study
Based on the study‘s findings, several implications are worth mentioning. The primary
implication of this study is relevant to the education system. Educators (teachers, school
administrators, counselors, etc.) can use the study‘s findings to conduct workshops to educate
parents about the importance of treating boys and girls equally.
180
Second, findings from the present study showed that there was parental differential
treatment of boys and girls. Fathers were more involved with boys than with girls in various
activities (interactive and childcare activities), and parents with mixed gender children were
more likely to display gender stereotypes when allocating household work to children. Boys are
generally assigned the outdoor jobs, such as taking out the trash and household repairs, whereas
girls are typically assigned indoor activities, such as washing the dishes, cooking, etc. In
addition, girls devote more time to such activities than do boys. This differential treatment is due
to the Arabic culture which reinforces traditional gender roles, especially those regarding
women's responsibilities in the home and family. Arab-American communities in the United
States continue these gender norms regardless of the social, economical, technological, and
educational changes that have taken place in Arab societies and worldwide. Therefore, children
in Arab-American families continue to be socialized into gender specific roles that begin in early
childhood and continue into adulthood. In fact, this early gender differential treatment is a
channel to differential adult outcomes. Many issues in adulthood have their roots, at least
partially, in gender constructions that begin in early childhood. For example, women around the
world, including Arab societies have made considerable progress in several arenas yet are still
unequal to men in many ways. Women still devote more time to childrearing and unpaid
housework while men continue to give more time to work.
Thus, this differential treatment in early childhood can generate some long-term
disadvantages, especially for girls, which in turn may affect their overall development. It could
affect their academic success, their economic outcomes in adult life, and their overall well-being.
The equal treatment of both boys and girls contributes to children‘s overall development
including academic success, their economic outcomes in adult life, and improvements in a

181
family‘s overall well-being. For example, increased paternal interaction with children (boys and
girls) is a crucial factor that promotes children's healthy development (Parke, 1996), creates
greater satisfaction with parenting, and enhances closeness to the child (Russell, 1982; Sagi,
1982).
Children with highly involved parents develop more self-confidence, higher self-esteem,
enhanced verbal intelligence (Deutsch, Servis, & Payne, 2001; Easterbrooks & Goldberg, 1984),
and higher scores on measures of psychological and social competence compared to those who
do not experience such close relationships (Lamb, 1997; Lamborn, Mounts, Steinberg, &
Dorbusch, 1991; Almeida, Wethington, & McDonald, 2001). Furthermore, parental involvement
in children‘s school activities, such as attending parent-teacher conferences, monitoring
children‘s progress, and helping with homework are positively associated with children‘s
academic success (Baker & Stevenson, 1986; Steinberg, Lamborn, et al., 1992; Stevenson &
Baker, 1987).
In addition, the findings indicated that family size and childbearing are strongly
influenced by the gender of the offspring. In particular, parents with a boy preference are more
likely to have a larger family than parents with a girl, balanced preferences, or indifferent
preference; and parents with only girls‘ sibship are more likely to have more children than
parents with mixed gender children. On the other hand, parents with only boys‘ sibships are less
likely to have larger families than parents with mixed gender children. Therefore, preferring boys
over girls can have an effect on family and society in the long run. For example, if families want
boys, they might impoverish themselves by having a larger family. Preference for boys over girls
might also result in gender imbalance in the future (i.e., more men than women), which, in turn,
could alter the structure of marriage in society, by creating a lack of suitable marriage partners.

182
Consequently, these findings can be used by researchers and policy makers to develop social
policies that would improve Arab-American parents‘ attitudes toward girls .This would require
conducting media campaigns, workshops, and educational programs that emphasize the value of
girls, which, in turn, can improve the lives of millions of women and girls in Arab society and
limit the extent of gender imbalance in the future. Also, policy makers should develop policies
that can empower women by improving their economic, political, and social potential, since they
are primarily responsible for socializing the future generation. The reality is that no country in
the world, no matter how advanced, has achieved true gender equality, since it challenges one of
the most deeply entrenched of all human attitudes. Achieving gender equality requires
concentrated efforts on many fronts .This requires providing women with a quality of life that
equal to that of men, with comparable levels of political participation, and more equal balance of
educational and economic opportunity. Even though achieving gender equality is a grindingly
slow process, the continuous intense efforts of many agencies and organizations, and numerous
inspiring successes could help in promoting gender equality or at least narrowing the gender gap
as much as possible in the long run. I hope that this work provides the impetus for policy-makers
to strengthen their commitment to the idea of women‘s empowerment, and to concentrate the
political will, energy, and resources, in concert with aid agencies and civil society organizations,
to make gender equality a reality.
Third, there are several agencies in Michigan that provide services to the Arab-American
community in order to help them improve their well-being and adjust to American society. For
instance, the Arab-American and Chaldean Counsel (ACC) and Arab Community Center for
Economic and Social Services (ACCESS) were established to serve a unique population of
immigrants and foster the role of Arab communities in the United States. They have worked to
183
promote dialogue, understanding, and tolerance among diverse cultural groups over the past
three decades. Today, these organizations serve hundreds of thousands of clients by providing
counseling services (i.e., marriage and children‘s counseling), youth services, health care, and
educational services, etc. Therefore, the information from this study about the impact of the
gender of children on various Arab-American family processes may help counselors and social
workers in these agencies to provide services (i.e., marriage and children‘s counseling) that are
more relevant to Arab-American families. This, in turn, may improve social relationships and the
well-being of children, families, and society as a whole.
Finally, this research is the first to examine the effect of children‘s gender on various
Arab-American family dynamics in the United States, focusing specifically on family size,
parental involvement with children, allocating household work to children, and marital quality.
Thus, the findings of this study provide important baseline data for researchers and sociologists
to conduct further studies to investigate, in depth, the effect of the gender of children in Arab-
American families‘ processes. Accordingly, researchers will be able to provide the necessary
facts supported by empirical findings regarding such a social phenomena as well as identify and
develop strategies for reducing the unequal treatment of boys and girls and thus reinforce
egalitarian gender norms in society. In fact, the more we understand the social behavior of
parents and children, the more we can, as researchers, sociologists, and society, provide effective
services. This, in turn, will lead to improvements in the well-being of children, families, and
society as a whole. In addition, understanding the influence of a child‘s gender on family
processes will advance the state of knowledge in the family and gender fields.

184
APPENDIX A

185
APPENDIX B

186
APPENDIX C
Research Information Sheet
Title of Study: Survey of Arab-American family Patterns
Principal Investigator (PI): Sanaa Taha Alharahsheh
Sociology
313-577-3227
Purpose:
You are being asked to be in a research study of Arab-American family patterns because you
identify as an Arab-American , reside in the Greater Metropolitan Detroit area, Michigan , and
have at least two children under 18 years old living with you. This study is being conducted at
mosques, churches, Arab community centers, and Arab social organizations, in the Greater
Metropolitan Detroit area, Michigan.
Study Procedures:
If you take part in the study, you will be asked to complete a survey that asks about your family
activities
As part of the research, you will fill out a survey
The survey asks questions about your involvement with your children, family relationships,
and division of household labor. You have the option of not answering some of the questions
and remaining in the study.
Your active participation in the study includes the 30-35 minutes required to complete the
survey. This is a one -time activity, and once you finish the survey, your participation ends.
Benefits
o As a participant in this research study, there will be no direct benefit for you; however,
information from this study may benefit other people now or in the future.
Risks
By taking part in this study, you may experience the following risks:
o Emotional risks (e.g., feelings of discomfort or embarrassment answering questions)
Costs
o There will be no costs to you for participation in this research study.
Compensation

187
o You will not be paid for taking part in this study.
Confidentiality:
o All information collected about you during the course of this study will be kept without
any identifiers.
Voluntary Participation /Withdrawal:
Taking part in this study is voluntary. You are free to not answer any questions or withdraw at
any time. Your decision will not change any present or future relationships with Wayne State
University or its affiliates
Questions:
If you have any questions about this study now or in the future, you may contact Sanaa Taha
Alharahsheh at the following phone number 248-616-0754. If you have questions or concerns
about your rights as a research participant, the Chair of the Human Investigation Committee can
be contacted at (313) 577-1628. If you are unable to contact the research staff, or if you want to
talk to someone other than the research staff, you may also call (313) 577-1628 to ask questions
or voice concerns or complaints.
Participation:
By completing the survey you are agreeing to participate in this study.

188
APPENDIX D
Questionnaire
Arab-American Family Patterns
Part One: Background information
To begin, we would like to ask you some background questions about yourself.
Please check the box or fill in the blank.
1. How old were you on your last birthday? _______ Years
2. Where were you born? □ In the U.S.
□ Outside the U.S. (specify the country)__________
3. If you were born outside the U.S.A, how old were you when you came to the U.S.?
Age ________
4. What is your gender? □ Male □ Female
5. What is the highest level of education you have completed?
□ Less than High School
□ High school diploma or GED
□ Associate Degree (a two-year college degree)
□ Bachelor‘s degree
□ Master‘s degree
□ Professional degree (M.D., DDS. Ph.D. or other Doctorate Degree)
6. Are you currently working outside the home? □ Yes □ No
7. What is your total annual family income from all sources before taxes?
□ Under $25,000
□ $25,000-$44,999
□ $45,000-$64,999
□ $65,000-$74,999
□$75,000-$94,999

189
□ $95,000 or above
8. In general, how would you rate your health status?
___ Excellent ___ Good ___ Fair ___ poor
Part Two: Background information about Children
To get an accurate picture of Arab American families, we need to get information about the
number of children people have.
9. How many children are born to you and your spouse? _______________
10. How many adopted children do you have? ________________
11. How many step children do you have? ________________
12. Are you done having kids? □ Yes □ No
13. Now, I would like you to tell me the sex and age of each live child, whether that child lives with
you or not, and whether that child born in U.S.A or not. Let us begin with the oldest:
Child # Is that a boy or a
girl? How old is
(he/she)? Does (he/she) live
with you? Was (he/she)
born in U.S.A? 1
2
3
4
5
6
7
8
9
10

190
14. People do not have or expect to have just the number of children they most want. If you were just
getting married and could choose exactly the number you want, how many children would you most like to have when you are through having children? ___________________ Children
15. Of these children, how many would you like to be boys and how many girls?
______________ boys ____________ girls ______________either
16. What would be your preference for the first child?
______________a boy ____________a girl ______________no difference
17. For you, what are the most important reasons for wanting a boy?
_________________________________________________________________________
_________________________________________________________________________
_________________________________________________________________________
_________________________________________________________________________
18. For you, what are the most important reasons for wanting a girl?
___________________________________________________________________
___________________________________________________________________
___________________________________________________________________
___________________________________________________________________

191
Part Three: Parental Involvement with children
Now I would like to ask you some questions about things you do with your children from time to
time. Let us start with the BOYS first: If no BOYS, skip to # 31
Every
day
5-6 times
per week
3-4 times
per week
Twice per
week
Once a week Never
19. How often in a typical week, do you find the time to
play with your BOYS?
20. How often in a typical
week, do you take your BOYS
out for a walk?
21. How often in a typical
week, do you spend time with
your BOYS in leisure
activities away from home
(picnics, movies, sports, etc)?
22. How often in a typical week, do you watch T.V. with
your BOYS?
23. How often in a typical
month, do you watch video
games with your BOYS?
24. How often in a typical
week, do you spend time with
your boys just talking about
things that are important to
BOYS?
25. How often in a typical week, do you spend time
helping your BOYS with
schoolwork?
26. How often in a typical
week, do you visit your
BOYS‘ classes at school?
27. How often in a typical
week, do you attend the sport
events at your BOYS‘ school?
28. How often in a typical
week, do you attend the PTA
events at your BOYS school?

192
29. How often do you feel close to your BOYS?
___Extremely close ___ Quite close ___ Fairly close ___ Not at all
30. Do you give your BOYS:
1___ all the affection they want
2___ slightly less than they want
3___ much less than they want
4___ they don‘t want affection from me

193
Now I’m going to ask the same questions about things you do with your GIRLS from time to time.
If no Girls, skip to # 43
Every
day
5-6 times
per week
3-4 times
per week
Twice per
week
Once a
week
Never
31. Would you tell me how often
in a typical month do you find the
time to play with your GIRLS?
32. How often in a typical week do you take your GIRLS out for a
walk?
33. How often in a typical week do
you spend time with your GIRLS
in leisure activities away from
home (picnics, movies, sports,
etc)?
34. How often in a typical week do
you watch T.V. with your GIRLS?
35. How often in a typical week do
you watch video games with your
GIRLS?
36. How often in a typical week do
you spend time with your girls just
talking about things that are
important to GIRLS?
37. How often in a typical week do
you spend time helping your
GIRLS with school work?
38. How often in a typical week do
you visit your GIRLS‘ classes at
school?
39. How often in a typical week do
you attend the sport events at your
GIRLS‘ school?
40. How often in a typical week do
you attend the PTA events at your
GIRLS‘ school?
41. How often do you feel close to your GIRLS?
___Extremely close ___ Quite close ___ Fairly close ___ Not at all

194
42. Do you give your GIRLS:
1___ all the affection they want
2___ slightly less than they want
3___ much less than they want
4___ they don‘t want affection from me.
Thinking back when you have babies, I would like you to tell me how much you were involved in
the following activities with your boys: if no BOYS, skip to # 48
43. How much in a typical week, did you change diapers for your BOYS?
___Every day ___ 5-6 times per week ___ 3-4 times per week
___ Twice per week ___ Once a week ___ Never
44. How much in a typical week, did you give baths to your BOYS?
___Every day ___ 5-6 times per week ___ 3-4 times per week
___ Twice per week ___ Once a week ___ Never 45. How often in a typical week, did you prepare food for your BOYS?
___Every day ___ 5-6 times per week ___ 3-4 times per week
___ Twice per week ___ Once a week ___ Never
46. How often in a typical week, did you feed your BOYS?
___Every day ___ 5-6 times per week ___ 3-4 times per week
___ Twice per week ___ Once a week ___ Never
47. How often in a typical week, did you put your BOYS in bed at night?
___Every day ___ 5-6 times per week ___ 3-4 times per week
___ Twice per week ___ Once a week ___ Never
Now, I would like you to tell me how much you were involved in the following activities with your
girls when they were babies: If no GIRLS, skip to # 53
48. How much in a typical week, did you change diapers for your GIRLS?
___Every day ___ 5-6 times per week ___ 3-4 times per week

195
___ Twice per week ___ Once a week ___ Never
49. How much in a typical week, did you give baths to your GIRLS?
___Every day ___ 5-6 times per week ___ 3-4 times per week
___ Twice per week ___ Once a week ___ Never 50. How often in a typical week, did you prepare food for your GIRLS?
___Every day ___ 5-6 times per week ___ 3-4 times per week
___ Twice per week ___ Once a week ___ Never
51. How often in a typical week, did you feed your GIRLS?
___Every day ___ 5-6 times per week ___ 3-4 times per week
___ Twice per week ___ Once a week ___ Never
52. How often in a typical week, did you put your GIRLS in bed at night?
___Every day ___ 5-6 times per week ___ 3-4 times per week
___ Twice per week ___ Once a week ___ Never
If you currently have babies at home, I would like you to tell me how much you are involved in the
following activities with your BOYS: If no BOYS, skip to # 58
53. How much in a typical week, do you change diapers for your BOYS?
___Every day ___ 5-6 times per week ___ 3-4 times per week
___ Twice per week ___ Once a week ___ Never 54. How much in a typical week, do you give baths to your BOYS?
___Every day ___ 5-6 times per week ___ 3-4 times per week
___ Twice per week ___ Once a week ___ Never
55. How often in a typical week, do you prepare food for your BOYS?
___Every day ___ 5-6 times per week ___ 3-4 times per week
___ Twice per week ___ Once a week ___ Never
56. How often in a typical week, do you feed your BOYS?
___Every day ___ 5-6 times per week ___ 3-4 times per week

196
___ Twice per week ___ Once a week ___ Never
57. How often in a typical week, do you put your BOYS in bed at night?
___Every day ___ 5-6 times per week ___ 3-4 times per week
___ Twice per week ___ Once a week ___ Never
Could you to tell me how much you are involve in a typical week in the following activities with
your baby GIRLS: If no GIRLS, skip to # 63
58. How much in a typical week, do you change diapers for your GIRLS?
___Every day ___ 5-6 times per week ___ 3-4 times per week
___ Twice per week ___ Once a week ___ Never
59. How much in a typical week, do you give baths to your GIRLS?
___Every day ___ 5-6 times per week ___ 3-4 times per week
___ Twice per week ___ Once a week ___ Never
60. How often in a typical week, do you prepare food for your GIRLS?
___Every day ___ 5-6 times per week ___ 3-4 times per week
___ Twice per week ___ Once a week ___ Never
61. How often in a typical week, do you feed your GIRLS?
___Every day ___ 5-6 times per week ___ 3-4 times per week
___ Twice per week ___ Once a week ___ Never 62. How often in a typical week, do you put your GIRLS in bed at night?
___Every day ___ 5-6 times per week ___ 3-4 times per week
___ Twice per week ___ Once a week ___ Never

197
Part Four: Children’s participation in the household work
Now I’m going to name some household chores that children might be expected or asked to do, and
for each one I would like you to tell me how often in atypical week your boys/girls do them. Let us
start with the BOYS first: If no BOYS, skip to # 71
Every
day
5-6 times
per week
3-4 times
per week
Twice per
week
Once a
week
Never
63. In a typical week, how
often do your BOYS wash
and dry the dishes?
64. In a typical week, how
often do your BOYS do their
own laundry?
65. In a typical week, how
often do your BOYS make
their beds?
66. In a typical week, how
often do your BOYS help
clean the house and do things
like vacuuming, sweeping,
dusting?
67. In a typical week, how
often do you BOYS carry out the garbage?
68. In a typical week, how
often do your BOYS help
with cooking?
69. In a typical week, how
often do your BOYS help
with grocery shopping?
70. In a typical week, how
often do your BOYS help
with general yard work and do
things like shoveling snow and
cutting grass?

198
Now I’m going to name the same household chores that children might be expected or asked to do,
and for each one I would like you to tell me how often your GIRLS do them. If no GIRLS, skip to
#79 Every
day
5-6 times
per week
3-4 times
per week
Twice per
week
Once a week Never
71. In a typical week, how
often do your GIRLS wash and dry the dishes?
72. In a typical week, how
often do your GIRLS do their
own laundry?
73. In a typical week, how
often do your GIRLS make their beds?
74. In a typical week, how
often do your GIRLS help
clean the house and do things
like vacuuming, sweeping,
dusting?
75. In a typical week, how
often do you GIRLS carry
out the garbage?
76. In a typical week, how
often do your GIRLS help
with cooking?
77. In a typical week, how
often do your GIRLS help with grocery shopping?
78. In a typical week, how
often do your GIRLS help
with general yard work and do
things like shoveling snow or
cutting grass?
Part Five: Family Relationships
In this section, I’m going to ask you some questions about your family relations.
79. How many times have you been married? Number _________

199
80. How old were you when you get married? _________
81. How old was your spouse when you get married? _________
Now I would like to get your opinion in the following matters. For each statement, I would like you
to indicate if you strongly disagree, moderately disagree, neither agree nor disagree, moderately
agree, strongly agree.
strongly
disagree
moderately
disagree
neither agree
nor disagree
moderately
agree
strongly
agree
82. I am not pleased with the
personality characteristics and personal
habits of my partner.
83. I am very happy with how we
handle role responsibilities in our
marriage
84. I am not happy about our communication and feel my partner
does not understand
85. I am very happy about how we
make decisions and resolve conflicts.
86. I am unhappy about our financial
position and the way we make financial
decisions.
87. I am very happy with how we
manage our leisure activities and the
time we spend together.
88. I am very pleased about how we
express affection and relate sexually.
89. I am not satisfied with the way we
each handle our responsibilities as
parents.
90. I am dissatisfied about our relationship with my parents, in-laws,
and/or friends.
91. I feel very good about how we each
practice our religious beliefs and
values.
92. It is much better for everyone
concerned if the man is the achiever
outside the home and the woman takes
care of the home and family.
93. Preschool children are likely to
suffer if their mother is employed
94. It is all right for mothers to work
full time when their youngest child
under 5
95. A husband whose wife is working
full- time should spend just as many
hours doing house work as his wife

200
96. How satisfied are you with your marriage
___Very satisfied ___Somewhat satisfied ___ Somewhat dissatisfied ___Very dissatisfied
97. Overall, would you rate your marriage as
___ Very happy ___ Somewhat happy ___ Not so happy ___ Not happy at all
Thank you for your participation

201
REFERENCES
Abbott , D.A., & Brody, G.H. (1985).The Relation of Child Age, Gender, and Number of
Children to the Marital Adjustment of Wives, Journal of Marriage and Family, 47, (1),
77- 84.
Abudabbeh, N. (2005). Arab Families. In McGoldrick, M., Giordano, J., & Gracia-Preto, N.
(Eds) . Ethnicity and Family Therapy (3ed). Pearce, NY: Guilford Press, 333-46.
Acock, A.C., & Demo, D.H. (1994). Family Diversity and Well-Being. Thousand Oaks, CA:
Sage Publications.
A El-Ggilany, A., & Shady, E. (2007). Determinants and Causes of Son Preference among
Women Delivering in Mansoura, Egypt. Eastern Mediterranean Health Journal, 13 (1),
119-128.
Ahmeduzzaman, M., & Roopnarine, J.L. (1992). Sociodemographic Factors, Functioning Style,
Social Support and Father‘s Involvement with Preschoolers in African-American
Families. Journal of Marriage and the Family, 54, 699–707.
Ajrouch, K. (1999). Family and Ethnic Identity in an Arab-American Community. In Suleiman,
M.W. (ed). Arab in America: Building a new future. Philadelphia, PA: Temple
University Press, 129-139.
Aldous, J., & Ganey, R. F. (1999). Family Life and the Pursuit of Happiness: The Influence of
Gender and Race. Journal of Family Issues, 20, 155-180.
Aldous, J., Mulligan, G.M., & Bjarnason, T. (1998). Fathering Over Time: What makes the
difference ? Journal of Marriage and Family, 60, 809-20.
Al-Haj, M. (1987). Social Change and Family Processes. London: Westview.
Al-Krenawi, A. (1996). Group Work with Bedouin Widows of the Negev in a medical Clinic.
Affilia, 11, 303-318.

202
Almedia, D. M., Wethingtion, E., & McDonald, D. A. (2001). Daily variation in Parental
Engagement and Negative Mood: Implications for Emotionally Supportive and
Conflictual Interactions. Journal of marriage and Family, 63, 417-429.
Al-Qudsi, S. (1998). The Demand for Children in Arab Countries: Evidence from Panel and
Count Data Models. Journal of Population Economics, 11, 435–452.
Al-Sabt, M. (2006). Arabian Business and Cultural Guide. International Export Connections,
Traders City.com.
Al-Sadawi, N. (1995). Gender, Islam, and Orientalism: Dissidence and Creativity. Women: A
Cultural Review, 6, 1-18.
Alwin, D. (1996). From Childbearing to Childrearing: The Link between Declines in Fertility
and Changes in the Socialization of Children. Population and Development Review, 22,
176-196.
Amato, P. R., & Booth, A. (1997). A generation at Risk: Growing up in an Era of Family
Upheaval. Cambridge, MA: Harvard University Press.
Andersson, G., Hank, K., Ronsen, M., & Vikat, A. (2006). Gendering the Family Composition:
Sex Preferences for Children and Childbearing Behavior in the Nordic Countries.
Demography, 43 (2), 255.
Arnold, F. (1997). Gender Preferences for Children. Demographic and Health Surveys
Comparative Studies, 23.
________ (1992). Sex Preference and its Demographic and Health Implications. International
family planning perspectives, 18 (3), 93-101.
Arnold, F., & Kuo, E.C. (1984). The Value of Daughters and Sons: A comparative Study of the
Gender Preferences of Parents. Journal of comparative Family Studies, 15 (2), 299-318.
203
Arnold, F., & Roy, T.K. (1998). Son Preference, the Family –Building Process and Child
Mortality in India. Population Studies, 52 (3), 301-315.
Aswad, B.C. (1991). Yemeni and Lebanese Muslim Immigrant Women in Southeast Dearborn
Michigan. In Waugh, E.H., Abu-laban, S. M., & Qureshi, R. B. (eds). Muslim Families in
North America. Canada, The University of Alberta Press, 256-281.
Aswad, B. C., & Bilge. B, (eds). (1996). Family and Gender among American Muslims: Issues
Facing Middle Eastern Immigrants and Their Descendants. Philadelphia, PA: Temple
University Press.
Attir, M. O. (1985). Ideology, Value Changes, and Women's Social Position in Libyan Society.
In Al-krenawi, A., & Graham, J.R. (1999). Arab Societies. National Association of Social
Workers. Washington .
Ayla, F., & Falk, C. (1971). Sex of Children and Family Size. The Journal of Heredity. 62, 57-
59.
Azaiza, F., Lowenstein, A., & Brodsky, J. (1999). Institutionalization for the Elderly is a novel
Phenomenon among the Arab Population in Israel. Journal of Gerontological Social
Work, 31 (3–4), 65–85.
Bairagi, R., & Langsten, R, L. (1986). Sex preference for children and its implications for
fertility in rural Bangladesh. Studies in Family Planning, 17, 193-210.
Baker, D. P., & Stevenson, D. L. (1986). Mothers' Strategies for Children's School Achievement:
Managing the Transition to High School. Sociology of Education, 59, 155-166.
Barakat, H. (1985). The Arab Family and Challenge of Social Transformation. In Fernea, E.
Women and the Family in Middle East. Austin: University of Texas Press, 27-48.

204
Bardhan, P. K. (1988). Sex Disparity in Child Survival in Rural India. In Arnold, F., & Roy, T.K.
(1998). Son Preference, the Family –Building Process and Child Mortality in India.
Population Studies, 52 (3), 301-315.
Barnett, R., & Baruch, G. (1987). Determinants of Fathers‘ Participation in Family Work
Journal of Marriage and Family, 49, 29-40.
Basu, A. M. (1989). Is Discrimination in Food Really Necessary for Explaining Sex Differentials
in Childhood Mortality? Population Studies, 43, 193- 210.
Baxter, J. (1992). Power Attitudes and Time: The Domestic Division of Labour. Journal of
Comparative Family Studies, 23(2), 165-82.
Belsky, J. (1990). Children and Marriage. In Bradbury, T. N., Fincham, F. D., & Beach, S. R.
(2000). Research on the Nature and Determinants of Marital Satisfaction: A Decade in
Review. Journal of Marriage and Family, 62, 964-980.
Ben-Porath, Y., & Welch, F. (1976). Do Sex Preferences Really Matter? Quarterly Journal of
Economics, 90, 283-307.
Bergqvist, C. (1999). Equal Democracies? Gender and Politics in Nordic Countries. In Hank, K.,
& Andersson, G. (2002). Parental Gender Indifference or Persistent Sex Preferences for
Children at the Turn to the 21st Century? A reflection on Pollard and Morgan (2000) with
Reference to the Swedish case. Demographic Research, Retrieved from
http://www.demogr.mpg.edu .
Berk, R. A., & Berk, S. F. (1978). A simultaneous Equation Model for the Division of
Household Labor. Social Methods Research, 6, 431–68
205
Bettio, F., & Villa, P. (1998). A Mediterranean Perspective on the Breakdown of the
Relationship between Participation and Fertility. Cambridge Journal of Economic, 22,
137-71.
Bianchi, S. M., Milkie, M., Sayer, L., & Robinson, J. (2000). Is anyone doing the Housework?
Trends in the Gendered Division of Household Labor. Social Forces, 79,191-228.
Bianchi, S.M., & Robinson,J. (1997). What did you do today? Children‘s use of Time, Family
Composition, and the Acquisition of Social Capital. Journal of Marriage and Family, 59,
332-44.
Bianchi, S. M., Robinson, J. P., & Milkie, M. A. (2006). Changing Rhythms of American
Family Life. NY: Russell Sage.
Bianchi, S.M., & Spain, D. (1996). Women, Work, and Family in America. In Raley, S., and
Bianchi, S.( 2006). Sons, Daughters, And Family Process: Does Gender of Children
Matter? Annual Review of Sociology, 32, 401-21.
Billari, F.C. & Philipov, D. (2004). Education and the Transition to Motherhood: A comparative
Analysis of Western Europe. In Preston, S. H., & Caroline, S. (2008). The Future of
American Fertility. National Bureau of Economic Research. Retrieved from
http://www.nber.org/papers/w14498 .
Bird, G.W., & Ratcliff, B. B. (1990). Children‘s Participation in Family: Determinants of
Mothers‘ and Fathers‘ Reports. Human Relation, 43, 865– 884.
Bittman, M. (1999). Parenthood without Penalty: Time use and Public Policy in Australia and
Finland. Feminist Economics, 5, 27-42.
Black, J. (1989). Family size and Achievement. Berkeley: University of California Press.

206
Blair, S. L. (1993). Employment, Family, and Perceptions of Marital Quality among Husbands
and Wives. Journal of Family Issues, 14, 189–212
_________ (1992a). Children‘s Participation in Household Labor: Socialization versus the need
for the Household Labor. Journal of Youth and Adolescence, 21, 241-258.
________ (1992b). The sex- typing of Children‘s Household Labor: Parental Influence on
Daughters‘ and Sons‘ Housework. Youth & Society, 24, 178-203.
Blair, S. L., & Johnson, M. P. (1992). Wives' Perceptions of the Fairness of the Division of
Household Labor: The Intersection of House Work and Ideology. Journal of Marriage
and the Family, 54, 570-581.
Blumer, H. (1969). Symbolic Interactionism: Perspective and Method. New Jersey: Prentice
Hall.
Boaz, R. F., Hu, J., & Ye, Y. (1999). The Transfer of Resources from Middle-Aged Children to
Functionally Limited Elderly Parents: Providing Time, Giving Money, Sharing Space.
Gerontologist, 39, 648 – 657.
Bogenscheider, K. (1997). Parental Involvement in Adolescent Schooling: A proximal Process
with Transcontextual Validity. Journal of Marriage and Family, 59, 718-733.
Bonney, J.F., Kelley, M. L., & Levant, R. F. (1999). A model of Fathers‘ Behavioral
Involvement in Child Care in Dual-earner Families. Journal of family psychology, 13,
401-415.
Bonvillain, N. (2001). Women and Men: Cultural Constructs of Gender (3ed). NJ: Prentice Hall.
Brines, J. (1994). Economic Dependency, Gender, and the Division of Labor at Home. American
Journal of Sociology, 100(3), 652-88.
207
Brinley, M. B. (1991). Should you have Ababy? In Twenge, J. M., Campbell, W. K., & Foster,
C. A. (2003). Parenthood and Marital Satisfaction: A Meta-Analytic Review. Journal of
Marriage and Family, 65, 574-583.
Brockmann H. (2001). Girls Preferred. Changing Patterns of Sex Preferences in the Two German
States. European sociological review, 17, 189–202.
Brody, C. J., & Steelman, L. C. (1985). Sibling Structure and Parental Sex-Typing of Children's
Household Tasks. Journal of Marriage and Family, 47(2), 265-273.
Bryant, W. K., & Wang, Y. (1990). Time together, time apart: An analysis of wives' solitary time
and shared time with spouses Lifestyles: Journal of Family and Economic Issues, 11, 89-
119.
Bryant, W.K., & Zick, C.D. (1996a). An Examination of Parent-Child Shared Time. Journal of
Marriage and Family, 58, 227-37.
___________ (1996b). Are we investing less in the Next Generation? Historical Trends in Time
Spent Caring for Children. Journal of Family and Economic Issues, 17, 365-391.
Bulanda, R. E. (2004). Paternal Involvement with Children: The Influence of Gender Ideologies.
Journal of Marriage and the Family, 66, 40-45.
Burns, A., & Homel, R. (1989). Gender Division of Tasks by Parents and their Children.
Psychology of Women Quarterly, 13,113–125.
Cainkar, L. (1994). Palestinian Women in American Society: The Interaction of Social Class,
Culture, and Politics. In McCarus , M.E, (ed). The Development of Arab American
Identity. Ann Arbor: The University of Michigan Press, 85-105.
Chaill, S. (1980). Direction for an Interactionist Study of Gender Development. Journal of the
University of California press, 3 (1), 123-135

208
Chibucos, T.R., Leit, R.W., & Weis, D. (2005). Readings in Family Theory. CA: Thousand
Oaks.
Choi, C. (1986) Unique Aspects of Korean–American Mothers. In Marleau, J. D., & Saucier, J.
(2002). Preference for a First Born in Western Societies. Journal of biosocial science, 34,
13–27- Cambridge University Press.
Christoph, B., & Noll, H. (2003). Subjective Well-being in the European Community. Social
Indicators Research, 64, 521–546.
Chung, W., & Das, G. M. (2007). The Decline of Son Preference in South Korea: the Roles of
Development and Public Policy. Population and Development Review, 33(4), 757-783.
Clark, S. (2000). Son Preference and Sex Composition for Children: Evidence from India.
Demography, 37(1), 95-108.
Cleland, J., Jane, V., & Martin, V. (1983). Preferences for the Sex of Children and their
Influence on Reproductive Behavior, World Fertility Survey Comparative Studies, No.
27. Voorburg, Netherlands: International Statistical Institute.
Cogle, F.L., & Tasker, G.E. (1982). Children and Housework. Family Relations, 31, 395-99.
Coleman, J. S. (1988). Social Capital in the Creation of Human Capital. American Journal of
Sociology, 94, 95-120.
Coltrane, S. (2000). Research on Household Labor: Modeling and Measuring the Social
Embeddedness of Routine Family Work. Journal of Marriage and the Family, 62, 1208-
1233.
Coltrane, S., & Ishii-Kuntz, M. (1992). Men's House-work: A life Course Perspective. Journal of
Marriage and the Family, 54, 43-57.

209
Cooksey, E.C, & Fondell, M.M. (1996) Spending Time with his Kids: Effects of Family
Structure on Fathers‘ and Children‘s Lives. Journal of Marriage and the Family, 58(3),
693–707.
Cortina, J.M. (1993). What is Coefficient Alpha? An examination of Theory and Applications.
Journal of Applied Psychology, 78, 98-104.
Coverman, S. (1985). Explaining Husbands‘ Participation in Domestic Labor. Sociological
Quarterly, 26, 81–97.
Coverman, S., & Sheley, J. F. (1986). Change in Men‘s Housework and Child-Care Time, 1965–
1975. Journal of Marriage and the Family, 48, 413–22.
Cox, M., Paley, B., Burchinal, M., & Payne, D. C. (1999), Marital Perceptions and Interactions
Across the Transition to Parenthood, Journal of Marriage and the Family, 61(3), 611-
625.
Cramer, J. C. (1980). Fertility and Female Employment: Problems of Causal Direction.
American Sociological Review, 45(2), 167-90.
Crockett, L.J., Eggebeen, D.J., & Hawkins, A.J. (1993). Fathers' Presence and Young Children's
Behavioral and Cognitive Adjustment. Journal of Family Issues, 14, 55-77.
Crouter, A.C., McHale, E., & Bartko, T.W. (1993). Gender as an Organizing Feature in Parent-
Child Relationships. Journal of Social Issues, 49 (3), 161-74.
Dahl, G. B., & Moretti, E. (2004). The Demand for Sons: Evidence from Divorce, Fertility, and
Shotgun Marriage. UC Los Angeles: California Center for Population Research.
Retrieved from: http://www.escholarship.org/uc/item/63f8483b .
Daly, K. J. (2001). Deconstructing Family Time: From Ideology to lived Experience. Journal of
Marriage and Family, 63, 283-294.

210
Das Gupt, M., & Maribhat.P.N. (1996). Intensified Gender Bias in India: A consequence of
Fertility Decline. In Arnold F., & Roy, T.K. (1998). Son Preference, the Family –
Building Process, and Child Mortality in India. Population Studies, 52 (3), 301-315.
Davis, S. N., & Greenstein, T. N. (2009). Gender Ideology: Components, Predictors, and
Consequences. Annual Review of Sociology, 35, 87–105.
Deutsch, F. M., Lussier, J. B., & Servis, L. J. (1993). Husbands at Home: Predictors of Paternal
Participation in Childcare and Housework. Journal of Personality and Social Psychology,
65, 1154-1166.
Deutsch, F. M., Servis, L. J., & Payne, J. D. (2001). Paternal Participation in Childcare and its
Effects on Children‘s Self-Esteem and Attitudes toward Gendered Roles. Journal of
Family Issues, 22, 1000–1024.
Dixon, R., & Levy, D. (1985). Sex of Children: A community Analysis of Preferences and
Predetermination Attitudes. The Sociological Quarterly, 26, 251–271.
Dodson, L., & Dickert, J. (2004). Girls‘ Family Labor in Low-Income Households: A decade of
Qualitative Research. Journal of marriage and the Family, 66 (2), 318-332.
Dornbusch, S.M. (1989). The Sociology of Adolescence. The Annual Review of Sociology, 15,
233-59.
Duncan, B., & Duncan, O. D. (1978). Sex-Typing and Social Roles: A Research Report. NY:
Academic Press.
Durrani, A. (2000). Arab Mothers like no other. In Salari,S. (2002). Invisible in Aging Research:
Arab Americans, Middle Eastern Immigrations, and Muslim in the United States.
Gerontologist, 42(5), 580-588.
211
Easterbrooks, M. A., & Goldberg, W. A. (1984). Toddler Development in the Family: Impact of
Father Involvement and Parenting Characteristics. Child Development, 55, 740–752.
El-Islam, M. F. (1983). Cultural Change and Inter-Generational Relationships in Arabian
Families. International Journal of Family Psychiatry, 4, 321-329.
Esposito, J. L. (1998). Women in Islam and Muslim Societies: Introduction to Islam, Gender,
and Social Change. NY: Oxford University Press.
Fargues P. (1994). From Demographic Explosion to Social Rupture. Middle East Report,
October 6–10. In Al-Qudsi, S. (1998). The Demand for Children in Arab Countries:
Evidence from Panel and Count Data Models. Journal of Population Economics, 11,
435–452.
Feldman, H. (1981) A comparison of Intentional Parents and Intentionally Childless Couples.
Journal of Marriage and the Family, 43, 593-600.
Fernea, E. (1985). Women and the Family in Middle East. Austin: University of Texas Press.
Field, A. (2005). Discovering Statistics Using SPSS (2ed). London: Sage Publications
Fish, L. S., New, R. S., & Van Cleave, N. J. (1992). Shared Parenting in Dual-Income Families.
American Journal of Orthopsychiatry, 62, 83-93.
Fowers , B. J., & Olson, D. H. (1992). ENRICH Marital Satisfaction Scale: A brief Research and
Clinical Tool. Journal of Family Psychology, 7, 176-185.
Frees, J., & Powell, B. (1999). Sociobiology, Status, and Parental Investment in Sons and
Daughters: Testing the Trivers- Willard Hypothesis. The American Journal of Sociology,
104(6), 1704-1743.
Friedman, D, Hechter., M., & Kanazawa, S. (1994). A theory of the Value of Children.
Demography, 31, 375-401.

212
Gager ,C.T., Coony, T.M.,& Call, K.T. (1999). The Affects of Family Characteristics and Time
Use on Teenagers‘ Household Labor. Journal of Marriage and Family, 61(4), 982-94.
Gager, C. T., & Sanchez, L. (2004). Whose time is it? The Effect of Gender, Employment, and
Work/Family Stress on Children‘s Housework. In Raley, S., and Bianchi, S. 2006. Sons,
Daughters, And Family Process: Does Gender of Children Matter? Annual Review of
Sociology, 32, 401-21.
Gauthier, A. H., Smeeding, T. M., & Furstenberg, F. F. (2004). Are Parents Investing Less Time
in Children? Trends in Selected Industrialized Countries. Population and Development
Review, 30, 647-671.
Gershuny, J., & Robinson, J. (1988). Historical Changes in the Household Division of Labor.
Demography, 25, 537-552.
GhaneaBassiri, K., (ed). (1997). Competing Visions of Islam in the United States: A study of Los
Angeles Westport, CT: Green wood Press.
Giddens, A., Duneier, M., Appelbaum, R.P., & Carr, D. (2009). Introduction to Sociology. (7th
edition). NY: WW Norton Publishing
Gill, G. (1993). Gender Roles, Negotiations and Coping Strategies: A Qualitative Study of Two-
Income Couples. International Journal of Sociology of the Family, 23, 51-65.
Glenn, N. D., & McLanahan, S. (1982). Children and Marital Happiness: A Further Specification
of the Relationship. Journal of Marriage and Family, 4 (1), 63-72.
Goldstein, F.L., & Oldham, J. (1979). Children and Work: A study of Socialization. New
Brunswick, NJ: Transaction Books.
Gray, E., & Morrison, N.M. (1974). Influence of Combinations of Sexes of Children on Family
Size. The Journal of Heredity, 65, 169-174.

213
Greenglass, E.R. (1982). A world of Difference: Gender Roles in Perspective. Toronto: John
Wiley & Sons.
Greenhalg, S. (1985). Sexual Stratification: the other Side of Growth with Equity in East Asia.
Population and development review, 112, 265–314.
Greenstein, T.N. (1996). Gender ideology and Perceptions of the Fairness of the Division of
Household Labor: Effects on Marital Quality. Social Forces, 74, 1029–42.
Gregson, N. & Lowe, M. (1993). Renegotiating the Domestic Division of Labour? A Study of
Dual Career Households in North East and South East England. The Sociological Review,
41(3), 475-505.
Grossbard-Shechtman, S., & Neuman, S. (1998). The Extra Burden of Moslem Wives: Clues
from Israeli Women's Labor Supply. Economic Development and Cultural Change, 46,
491-518.
Gustavus, P. S. (1980). Socialization for Childbearing. Journal of Social Issue’s 36, 30–44. In
Marleau, J.D., & Saucier, S.F. (2002). Preference for a First-Born boy in Western
Societies. Journal of biosocial science, 34, 13–27.
Haddad, Y.Y. (1994). Maintaining the Faith of the Fathers: Dilemma of Religious Identity in the
Christian and Muslim Arab-American Communities. In McCarus, M. E, (ed). The
development of Arab-American Identity .Ann Arbor: The University of Michigan Press,
61-84.
Haddad, Y.Y., & Lummis, A.T. (1987). Islamic Values in the United States: A Comparative
Study. NY: Oxford University Press.
214
Haller, M., & Hadler, M. (2006). How Social Relations and Structures can Produce Happiness
and Unhappiness: An international Comparative Analysis. Social Indicators Research,
75, 169- 216.
Hammad, A., Kysia, R., Rhbah, R., Hossoun, R., & Connelly, M. (1999). Guide to Arab Culture:
Health Care Delivery to the Arab American Community. Arab Community Center for
Economic and Social Services [ACCESS]. Dearborn, MI.
Hank, K., Kohler, P. H. (2000). Gender Preferences for Children in Europe: Empirical Results
from 17 FFS Countries. Demographic Research, 2(1). Retrieved from http://
www.demographic-research.org/volumes/vol 2/1 .
Harris, K.M., Furstenberg, F., & Marmer, J. (1998). Paternal Involvement with Adolescents in
Intact Families: The Influence of Fathers over the Life Course. Demography, 35(2), 201-
16.
Harris, K.M., & Morgan, P.S. (1991). Fathers, Sons, and Daughters: Differential Paternal
Involvement in Parenting. Journal of Marriage and Family, 53, 531-44.
Hassoun, R. (1999). Arab–American Health and the Process of Coming to America: Lessons
from the Metropolitan Detroit Area. In. Suleiman, M. W (Ed.), Arabs in America:
Building A new Future. Philadelphia, PA: Temple University Press, 157–176.
Hayo, B., & Seifert, W. (2003). Subjective Economic Well-being in Eastern Europe. Journal of
Economic Psychology, 24, 329–348.
Heaton, T. B., & Albrecht, S. L. (1991). Stable Unhappy Marriages. Journal of Marriage and the
Family, 53(3), 747-758.
Hill, C. R., &. Stafford, F. P. (1974). Allocation of Time to Preschool Children and Educational
Opportunity. Journal of Human Resources, 9, 323–41.

215
Hilton, J.M., & Haldeman, V. A. (1991). Gender Differences in the Performance of Household
Tasks by Adults and Children in Single-Parent and Two-Parent, Two-Earner Families.
Journal of Family Issues, 12, 114–30.
Ho, R. (2006). Handbook of Univariate and Multivariate Data Analysis and Interpretation with
SPSS. FL: Chapman & Hall/CRC.
Hofferth, S.L. (2003). Race-Ethnic Differences in Father Involvement in Two- Parent Families:
Culture, Context or Economy? Journal of Family Issues, 24, 185–216.
Hofferth, S.L., & Anderson, K.G. (2003). Are all Dads Equal? Biology versus Marriage as a
Basis for Paternal Investment. Journal of Marriage and Family, 65, 213-32.
Hoffman, L.W., & Hoffman, M.L. (1973).The Value of Children to the Parents. In: Fawcett, J.T.
(Ed.). Psychological Perspectives on Population. New York, 19-76.
Hogan, D, & Eggebeen, D. (1995). Sources of Emergency and Routine Assistance in Old Age.
Social Forces, 73, 917–36.
Hoodfar, H. (1997). The impact of Male Migration on Domestic Budgeting: Egyptian Women
Striving for an Islamic Budgeting Pattern. Journal of Comparative Family Studies, 28(2),
74-98.
Hossain, Z, & Roopnarine, J.L. (1993). Division of Household labor and Childcare in dual-
earner African-American Families with Infants. Sex Roles, 29, 571–583.
Houseknecht, S. K. (1979). Childlessness and Marital Adjustment. Journal of Marriage and the
Family, 41, 259-265.
Hussain. R., Fikree, F.F, & Berendes, H.W. (2000). The Role of Son Preference in Reproductive
Behavior in Pakistan. Bulletin of the World Health Organization, 783, 379–88
216
Jacobsen, R., Mller, H., & Engholm, G. (1999). Fertility Rates in Denmark in Relation to the
Sexes of Preceding Children in the Family. Human Reproduction, 14, 1127-1130.
Jessor, R. & Jessor, S. (1977). Problem Behavior and Psychosocial Development. A
Longitudinal Study of Youth. NY: Academic Press.
Jones, L. E., Schoonbroodt,A., & Tertilt, M. (2008). Fertility Theories: Can they Explain the
Negative Fertility-Income Relationship? National Bureau of Economic Research. In
Preston, S. H., & Hartnett, C. S. (2008). The Future of American Fertility. National
Bureau of Economic Research. Working Paper 14498. Retrieved from
http://www.nber.org/papers/w14498 .
Kalmun, M. (1999). Father Involvement in Childrearing and the Perceived Stability of Marriage.
Journal of Marriage and Family, 61, 409-421.
Kandel, D. (1990). Parenting Styles, Drug Use, and Children's Adjustment in Families of Young
Adults. Journal of Marriage and the Family, 52, 183-96.
Karki,Y. B. (1988). Sex Preference and the Value of Sons and Daughters in Nepal. Studies of
Family Planning, 19, (3), 169-178.
Katzev, A.R., & Acock, A.C. (1994). Girls or boys? Relationship of Child Gender to Marital
Instability. Journal of Marriage and Family, 56, 89-100.
Kendig, S. M., & Bianchi, S. M. (2008). Single, Cohabitating, and Married Mothers‘ Time with
Children. Journal of Marriage and Family, 70, 1228-1240.
Khan , A. M., & Khanum ,P. A.(2000) . Influence of Son Preference on Contraceptive Use in
Bangladesh. Asia–Pacific population journal, 153, 43–56.
217
Kippen, R., Evans, A., & Gray, E. (2007). Parental Preference for Sons and Daughters in a
Western Industrial Setting: Evidence and limitations. Journal of Biosocial Science,
39,583-597.
Kitterod, R. H. (2002). Mothers' Housework and Childcare: Growing Similarities or Stable
Inequalities? Acta Sociologica, 45, 127-149.
Kline, p. (1999). The Handbook of Psychological Testing (2nd
edition). London: Routledge.
Kohler, H. P., Behrman, J. R., & Skytthe, A. (2005). Partner + Children = Happiness? An
Assessment of the Effect of Fertility and Partnerships on Subjective Well-Being.
Population and Development Review, 31 (3), 407-445.
Kooreman, P., & Kapteyn, A. (1987). A disaggregated Analysis of the Allocation of Time within
the Household. Journal of Political Economy, 95, 223-249.
Kramer. L. (2001). The Sociology of Gender: A brief Introduction. CA: Rox bury publishing.
Lamb, M. E. (ed.). (1997). The Role of the Father in Child Development (3ed.). NY: Wiley.
Lamb, M. E., & Pleck, J.A. (1987). Effects of Increased Paternal Involvement on Fathers and
Mothers. In Lundberg, S. (2006). Sons, Daughters, and Parental Behavior. Oxford Review
of Economic Policy, 21, (3), 1-30.
Lamb, M. E. & Sutton-Smith, B. (1982). Sibling Relationships: Their Nature and Significance
Across the Life Span. Hillsdale, NJ: Lawrence Erlbaum.
Lamborn, S. D., Mounts, N. S., Steinberg, L., & Dornbusch, S. M. (1991). Patterns of
Competence and Adjustment among Adolescents from Authoritative, Authoritarian, in
Dulgent, and Neglectful Families. Child Development, 62, 1049-1065.
LaRossa, R. (1988). Fatherhood and Social Change. Family Relations, 37, 451-457.
218
Lavee, Y., & Katz, R. (2002). Division of Labor, Perceived Fairness, and Marital Quality: the
Effect of Gender Ideology. Journal of Marriage and the Family, 64, 27–39.
Layte, R. (1998). Gendered Equity? Comparing Explanations of Women's Satisfaction with the
Domestic Division of Labour. Work, Employment & Society, 12(3), 511-32.
Leaper, C., Anderson,K. J., & Sanders, P. (1998). Moderators of Gender Effects on Parents‘ talk
to their Children: A meta Analysis. Developmental Psychology, 34, 3-27.
Leaper, C., & Smith, T.E. (200). A meta-analytic Review of Gender Variations in Children‘s
Language Use: Talkativeness, Affiliative Speech, and Assertive Speech. Developmental
Psychology, 40 (6), 993-1027.
Leibowitz, A. (1977). Parental Inputs and Children‘s Achievement. Journal of Human
Resources, 12, 247–67.
___________ (1974). Home Investments in Children. Journal of Political Economy, 82, 111–31.
Lennon, M. (1994). Relative Fairness and the Division of Housework: The Importance of
Options. American Journal of Sociology, 100(2), 506-31.
Leone, T., Matthews, Z., & Zuanna, G.D. (2003). Impact and Determinants of Son Preference in
Nepal. International family planning perspectives, 292, 69–72.
Levant, R. F., Slattery, S. C., & Loiselle, J. E. (1987). Fathers‘ Involvement in Housework and
Childcare with school-aged Daughters. Family Relations, 36, 152- 157.
Lin, T. (2009).The decline of Son Preference and rise of Gender Indifference in Taiwan in 1990.
Demographic Research, 20, 379-399. Retrieved from http://www.demographic-
research.org/Volumes/Vol20/16/20-16.
Lindsey, L.L. (1990). Gender Roles: A sociological perspective. NJ : Prentice Hall.
Lorber, J. (1994). Paradoxes of Gender. Connecticut: Yale University Press.
219
Luckey, E. B., & Bain, J. K. (1970). Children: A factor in Marital Satisfaction. Journal of
Marriage and the Family, 32, 43--44.
Lueptow, L. B., Guss, M. B., & Hyden, C. (1989). Sex Role Ideology, Marital Status, and
Happiness. Journal of Family Issues, 10, 383-400.
Lundberg, S. (2006). Sons, Daughters, and Parental Behavior. Oxford Review of Economic
policy, 21(3), 1-30.
__________ (2003). Child Gender and the Transition to Marriage. Demography, 40 (2), 333- 349.
Lundberg, S., McLanahan, S., & Rose, E. (2007). Child Gender and Father Involvement in
Fragile Families. Demography, 44 (1): 79–92.
Lye, D. N., & Biblarz, T. J. (1993). The Effects of Attitudes toward Family Life and Gender
Roles on Marital Satisfaction. Journal of Family Issues, 14, 157- 188.
Maccoby, E. (2003). The Gender of Child and Parent as Factors in Family Dynamics. In
Children‘s influence On Family Dynamics: The Neglected Side of Family Relationships.
Edited by Crouter, A., & Booth, A. NJ: Lawrence Erlbaum Associates, Publishers.
Macionis, J. (2010). Social Problems. (4th ed). Upper Saddle River, NJ: Pearson Education Inc.
Marini, M. (1980). Sex Differences in the Process of Occupational Attainment: A closer Look.
Social Science Research, 9, 307-61.
Marleau, J. D., & Saucier, S. F. (2002). Preference for a First-Born Boy in Western Societies.
Journal of biosocial science, 34, 13–27.
___________ (1996). Influence Du sexe Des Premiers Enfants Sur Le Comportement
Reproducteur: Une étude Canadienne. Population, 51, 460-464.
__________ (1993). First Child Sex Preferences of Non-Pregnant Canadian and Quebec
Women. Les Cahiers Québécois de Démographie 22, 363–372.
220
Marsiglio, W. (1991). Parental Engagement Activities with Minor Children. Journal of Marriage
and Family, 53, 973-86.
McBride, B. A., & Mills, G. (1993). A comparison of Mother and Father Involvement with their
Preschool Age Children. Early Childhood Research Quarterly, 8, 457-477.
McHale, S.M., Bartko, W., Todd Crouter, AC., & Perry-Jenkins, M. (1990). Children‘s
Housework and their Psychosocial Functioning: The Mediating Effects of Parents‘ Sex
Role Behaviors and Attitudes. Child Development, 61, 1413-26.
McHale, S.M., Crouter, A.C., & Tucker, C.J. (1999). Family Context and Gender Role
Socialization in Middle Childhood: Comparing Girls to Boys and Sisters to Brothers.
Child Development, 70, 990-104.
McHale, S. M., & Huston, T. L. (1984). Men and Women as Parents: Sex Role Orientations,
Employment, and Parental Roles with Infants. Child Development, 55, 1349-1361.
McHale, S.M., Updegraff, K.A., Jackson-Newsom, J., Tucker, C.J., & Crouter, A.C. (2000).
When Does Parents‘ Differential Treatment has Negative Implications for Siblings?
Social Development, 9, 149-72.
Mertler, C., & Vannatt, R. (2005). Advanced and Multivariate Statistical Methods. (3 ed).
Glendale, CA: Pyrczak Publishing.
Michalos, A. C., Hubley, A. M., Zumbo, B. D., & Hemingway, D. (2001). Health and other
Aspects of the Quality of Life of Older People. Social Indicators Research, 54, 239–274.
Mickelson, K.D., Claffey, S.T., &Williams, S.L. 2006. The Moderating Role of Gender and
Gender Role Attitudes on the Link between Spousal Support and Marital Quality. Sex
Roles, 55, 73–82.
221
Milkie, M. A., Mattingly, M. J., Nomaguchi, K. M., Bianchi, S. M., & Robinson, J. P. (2004).
The Time Squeeze: Parental Statues and Feelings about Time with Children. Journal of
marriage and Family, 66, 739- 761.
Miller, B. D. (1984). Daughter Neglect, Women‘s Work, and Marriage: Pakistan and Bangladesh
Compared. Medical anthropology, 24, 109–26. 29.
Mizell C.A. & Steelman L.C. (2000). All My Children: the Consequences of Sibling Group
Characteristics on the Marital Happiness of Mothers. Journal of Family Issues, 21, 858–
87.
Moorehouse, M. J. (1991). Linking Maternal Employment patterns to Mother-Child Activities
and Children's School Competence. Developmental Psychology, 27, 295-303.
Morgan, S. P., Lye, D. N., & Condran, G.A. (1988). Sons, Daughters, and the Risk of Marital
Disruption, American Journal of Sociology, 94 (1), 110-29.
Morsy, S. A. (1993). Gender, Sickness, and Healing in Rural Egypt: Ethnography in Historical
Context. San Francisco, CA: Westview Press.
Mott, F.L. (1994). Sons, Daughters and Father's Absence Differentials in Father-Leaving
Probabilities and in Home Environments. Journal of Family Issues, 15, 97-128.
Muller, C., & Kerbow, D. (1993). Parental Involvement in Home, School, and Community. In
Frees, J., & Powell, B. (1999). Sociobiology, Status, and Parental Investment in Sons and
Daughters: Testing the Trivers- Willard Hypothesis. The American Journal of Sociology,
104(6), 1704-1743.
Murnane, R. J., Maynard, R. A., & Ohls, J. C. (1981). Home Resources and Children's
Achievement. Review of Economics and Statistics, 63, 369-377.
222
Nag, M. (1991). Sex Preference in Bangladesh, India, and Pakistan and its Effect on Fertility.
Demography India, 20, 163–85.
Nelson, A., & Robinson, B. W. (2002). Gender in Canada. (2ed). Toronto: Prentice Hall.
Niraula,B., & Morgan,P.H. (1996). Son and Daughter Preference in Benighat Nepal:
Implications for Fertility Transition. In Pollard & Morgan. (2002). Emerging Parental
Gender Indifference? Sex Composition of Children and Third birth. American
Sociological Review, 67 (4), 600- 613.
Nock, S. L., & Kingston, P. W. (1988). Time with Children: The Impact of Couples' Work-Time
Commitments. Social Forces, 67, 59-85.
Okun, B. S. (1996). Sex Preferences, Family Planning, and Fertility: An Israeli Subpopulation in
Transition. Journal of Marriage and Family, 58 (2), 469-475.
Omran A., & Roudi, F. (1993). The Middle East Population Puzzle. Population Bulletin, 48(1),
2-40.
Park, B. (1983). Preference for Sons, Family Size, and Sex Ratio: An Empirical Study in Korea.
Demographic, 20, (3), 333-52.
Parke, R. D. (1996). Fatherhood. Cambridge, MA: Harvard University Press.
Parsons, T., & Bales, R.F. (1955). Family Socialization and Interaction Process. NY: Free Press.
Patten, M. (2000). Proposing Empirical Research: A guide to the Fundamentals. Los Angeles,
CA: Pyrczak Publishing.
Pebley, A. R., & Westoff, C. (1982). Women‘s Sex Preference in the United States: 1970 to
1975. Demography, 19, 177–189.
223
Peters, J. m., & Haldeman, V. A. (1987). Time Used for Household Work: A study of School-
Age Children from Single- Parent, Two-Parent, One – Earner, and Two-Earner Families.
Journal of Family issues, 8, 212-225.
Peterson, C.C., & Peterson, J.L. (1973). Preference for Sex of Offspring as A measure of Change
in Sex Attitudes. Psychology, 34, 3-5.
Peterson, J.L., & Zill, N. (1986). Marital Disruption, Parent-Child Relationships, and Behavior
Problems in Children. Journal of marriage and the family, 48, 295-307.
Pollak, R. A., & Watkins, S. C. (1993). Cultural and Economic Approaches to Fertility: Proper
Marriage or Misalliance. Population and Development Review, 19, 467-496.
Pollard,M., & Morgan, P. (2002). Emerging Parental Gender Indifference? Sex Composition of
Children and Third Birth. American Sociological Review, 67(4), 600-613.
Powell, B., Steelman, L. C., & Carini, R. M. (2006). Advancing Age, Advancing Youth: Parental
Age and the Transmission of Resources to Children. Social Forces, 84, 1359-1390.
Preston, S. H., & Hartnett, C. S. (2008). The Future of American Fertility. National Bureau of
Economic Research. Working Paper 14498. Retrieved from
http://www.nber.org/papers/w14498.
Rahman, M., & DaVanzo, J. (1993). Gender Preference and Birth Spacing in Matlab,
Bangladesh. Demography, 30 (3), 315–33.
Raley, S., & Bianchi, S. (2006). Sons, Daughters, And Family Process: Does Gender of Children
Matter? Annual Review of Sociology, 32, 401-21.
Read, J.G. (2004a). Cultural Influences on Immigrant Women‘s labor Force Participation: The
Arab-American Case. The Center for Migration Studies of New York, 38 (1), 52-77.
224
________ (2004b) Family, Religion, and Work among Arab American Women. Journal of
Marriage and Family, 66 (4), 1042–1050.
_________ (2003). The Sources of Gender Role Attitudes among Christian and Muslim Arab-
American Women. Sociology of Religion, 6 (2), 207-222
Read, J.G. & Oselin, S. (2008). Gender and the Education-Employment Paradox in Ethnic and
Religious Cortexes: The Case of Arab Americans. American Sociological Review, 73 (2),
296-313.
Renzetti, C. M., & Curran, D.J. (2003). Women, Men, and Society. MA: Allyn and Bacon.
Rindfuss, R.R., & Brewster, K. L. (2000). Fertility and Women's Employment in Industrialized
Nations. Annual Review of Sociology, 26, 271-296.
Rismann, B. (1998). Gender Vertigo: American Families in Transition. New haven and London,
Yale University press.
Ritzer, G., & Goodman, D. (2006). Modern Sociological Theory. (6th ed). NY, McGrawHill.
Robinson, J. P., & Godbey, G. 1997. True for Life: The Surprising Ways Americans use their
Time. University Park, PA: Pennsylvania State University Press.
Russell, G. (1982). Shared Care Giving Families: An Australian Study. In Lamb, M. E. (1982)
(ed.). Nontraditional Families: Parenting and Child Development. Hillsdale, NJ: Erlbaum,
139–172.
Ryder, R. G. (1973). Longitudinal Data Relating Marriage Satisfaction and having a child.
Journal of Marriage and the Family, 35, 604-606.
Sabatelli, R. (1988). Exploring Relationship Satisfaction: A social Exchange Perspective on the
Interdependence between Theory, Research, and Practice. Family Relations, 37, 217-222

225
Sabir, N.I, & Ebrahim, G. J. (1980). Are Daughters more at Risk than Sons in some Societies?
Journal of tropical pediatrics, 26, 144–9.
Sagi, A. (1982). Antecedents and Consequences of various degrees of Paternal Involvement in
Childrearing: The Israeli Project. In Lamb, M. E. (1982). (ed.).Nontraditional Families:
Parenting and Child Development Hillsdale, NJ: Erlbaum, 205–232.
Salari, S. (2002). Invisible in Aging Research: Arab Americans, Middle Eastern Immigrations,
and Muslim in the United States, The Gerontologist, 42(5), 580-588.
Samhan, H. H. (2001). Who are Arab Americans? In Groliers multimedia encyclopedia .
Retrieved from http://www.go. grolier.com .
__________ (1999). Not quite White: Race Classification and the Arab American Experience.
In Suleiman, M. N. (ed). Arabs in America: Building a new Future .Philadelphia, PA:
Temple University Press, 209–226.
Sandberg, J. F., & Hofferth, S.L. (2001). Changes in Children‘s Time with Parents: United
States, 1981–1997. Demography, 38, 423–36.
Sanderson, S., & Thompson, V.S. (2002). Factors Associated with Perceived Paternal
Involvement in Childrearing. Sex Roles, 46, 99–111.
Sanik, M. M. (1981). Division of Household Work: A decade Comparison-1967-1977. Home
Economics Research Journal, 10, 175-180.
Sayer, L.C., Bianchi, S. M., & Robinson, J.P. (2004). Are Parents Investing Less in Children?
Trends in Mothers‘ and Fathers‘ Time with Children. American Journal of Sociology,
110 (1), 1-43.
___________ (2000).Women‘s Economic Independence and the Probability of Divorce. Journal
of Family Issues, 21, 906-943.

226
Sayer, L. C., Gauthier, A. H., & Furstenberg, F. F. (2004). Educational Differences in Parents‘
time with Children: Cross-National Variation. Journal of Marriage and Family, 66,
1152-1169.
Schvaneveldt, P.L., Kerpelman, J.L., & Schvaneveldt, J. (2005). Generational and Cultural
Changes in Family Life in the United Arab Emirates: A comparison of Mothers and
Daughters. Journal of Comparative Family Studies, 36, 77-91.
Sengstock, M. (2006). Living in Tow Worlds: The Sociology of the Immigrant Experience.
Presentation to Humanities Center, Wayne State University, November 17.
Seymour, J. (1992). No Time to Call My Own': Women's Time As a Household Resource.
Women's Studies International Forum, 15(2), 187-92.
Shalhoub-Kevorkian, N. (1997). Wife-Abuse: A method of Social Control. Israeli Social Science
Research, 12(1), 59-72.
Shelton, B. A., & John, D. (1996). The Division of Household Labor. Annual Review of
Sociology, 22,299-322.
Siegal, M. (1987). Are Sons and Daughters Treated more differently by Fathers than by
Mothers? Development Review, 7, 183-209.
Sloane, D.M., & Lee, C.F. (1983). Sex of Previous Children and Intentions for further Birth in
the United State, 1965-1976. Demography, 20, 353-67.
Smith-Lovin, L., & Tickemeyer A.R. (1978). Nonrecursive Models of Labor Force Participation,
Fertility Behavior, and Sex Role Attitudes. American Sociological Review, 43, 541-57.
Snarey, J. (1993). How Fathers Care for the Next Generation: A four—Decade Study.
Cambridge: Harvard University Press.

227
Sollie, D. L., & Miller, B. C. (1980) The Transition to Parenthood as A critical Time for
Building Family Strengths. In Abbott , D.A., & Brody, G.H. (1985).The Relation of
Child Age, Gender, and Number of Children to the Marital Adjustment of Wives, Journal
of Marriage and Family, 47, ( 1) , 77- 84.
South, S., & Dna Spitze, G. (1994). Housework in Marital and Nonmarital Households.
American Sociological Review, 59 (3), 327-47.
Spanier, G.B. & Glick, P.C. (1981). Marital Instability in the United States: Some Correlates and
Recent Changes. Family Relations, 31,329-38.
Speakman, S. & Marchington. M. (1999). Ambivalent Patriarchs: Shift workers, 'Breadwinners'
and Housework. Work, Employment & Society, 13(1), 83-105.
Spitze, G., & Ward, R. (1995). Household Labor in Intergeneration Household. Journal of
Marriage and Family, 57, 355-61.
Starrels, M.E. (1994). Gender Differences in Parent-Child Relations. Journal of Family Issues,
15(1), 148–65
Steinberg, L. D., Lamborn, S. D., Dornbusch, S. M., & Darling,N . (1992). Impact of Parenting
Practices on Adolescent Achievement: Authoritative Parenting, School Involvement and
Encouragement to Succeed. Child Development, 63, 1266-1281.
Steinberg, L. D., & Silvergerg, S. B. (1986). The Vicissitudes of Autonomy in Early
Adolescence. Child Development, 57, 841-851.
Stevenson, D. L., & Baker, D. P. (1987). The Family-School Relation and the Child's School
Performance. Child Development, 58, 1348-1357.
Suleiman, M. W. (ed). (1999). Arabs in America: Building a new future. Philadelphia, PA:
Temple University Press.

228
Tabachnick, B.G., & Fidell, L. S. (2007). Using Multivariate Statistics. (5th
ed). MA: Allyn and
Bacon.
Teachman, J. D., & Schollaert, P. T. (1989). Gender of children and Birth Timing. Demography,
26, 411-423.
Thio, A. (2007) Society Myths and Realities: An introduction to Sociology. MA: Allyn and
Bacon.
Thomas, W.I., & Thomas, D. S. (1928). The Child in America: Behavior Problems and
Programs. NY: Knopf.
Timmer, S. G., Eccles, J., & O‘Brien, K. (1985). How Children Use Time. In Blair, S. L.
(1992b). The Sex- Typing of Children‘s Household Labor: Parental Influence on
Daughters‘ and Sons‘ Housework. Youth & Society, 24, 178-203.
Townsend, N. (2002). The Package Deal: Marriage, Work, and Fatherhood in Men‘s Lives.
Philadelphia, PA: Temple University Press.
Tucker, C. J., McHale, S. M., & Crouter, A.C. (2003). Dimensions of Mothers‘ and Fathers‘
Differential Treatment of Sibling: Links with Adolescences ‘Sex-Typed Personal
Qualities. Family Relations, 52, 82-89.
Twenge, J. M., Campbell, W. K., & Foster, C. A. (2003). Parenthood and Marital Satisfaction: A
Meta-Analytic Review. Journal of Marriage and Family, 65, 574-583.
U.S. Bureau of the Census. (1990). Census of Population and Housing, CP3–2, Ancestry of the
Population of the U.S. Washington, DC: Author.
U.S. Bureau of the Census. (2000). 2000 Summary, File 4. Washington, DC: Author.
229
U.S. Bureau of the Census. (2002). Ancestry First Reported (PCTO24) and Ancestry Second
Reported (PCTO25), Census (2000) Supplementary Survey summary Tables. Retrieved
from http://wwwfactfinder.census.gov/home/en/datanotes/exp_c2ss.html
Vlasoff, C. (1990). The value of Sons in an Indian village: How Widows see it. Population
Studies, 44, 5-20.
Waite, L. J., & Lillard, L. A. (1991). Children and Marital Disruption. American Journal of
Sociology, 96, 930-953.
Waite L.J., & Stolzenberg, R.M. (1976). Intended Childbearing and Labor Force Participation of
Young Women: Insights from Non-Recursive Models. American Sociological Review,
41, 235-52.
Walker, K. E., & Woods, M. E. (1976). Time Use: A measure of Household Production of
Family Goods and Services. Washington, DC: Center for the Family of the American
Home Economics Association.
Wallace, R. A., & Wolf, A. (2006). Contemporary Sociological Theory. (6th
ed).NJ: Prentice
Hall.
Warde, A. & Hetherington. K. (1993). A Changing Domestic Division of Labour? Issues of
Measurement and Interpretation. Work, Employment & Society, 7(1), 23-45.
Ward, R. A., & Spitze, G. (1996). Gender Differences in Parent-Child Coresidence Experiences.
Journal of Marriage and Family, 58,718-25.
Westley, S., & Cho, M. (2007). How Does Son Preference Affect Populations in Asia? East-
West Center, 84, 1-12. Retrieved from http://www.eastwestcenter.org/fileadmin/stored
/pdfs/api084.pdf

230
White, L. K., & Brinkerhoff, D.B. (1981). The Sexual Division of Labor: Evidence from
Childhood. Social Force, 60, 170-81.
Whiting, B. B., & Whiting, J. M. W. (1975). Children of Six Cultures. Cambridge: Harvard
University Press.
Wilcox, W.B. (2002). Religion, Convention, and Paternal Involvement. Journal of Marriage and
the Family, 64,780–792.
Williams, B.K., Sawyer, S.C., & Wahlstrom, C.M. (2009). Marriage, Families, and Intimate
Relationships. (2ed). MA: Allyn and Bacon.
Williamson, N. (1976). Sons or Daughters: Across-Cultural Survey of Parental Preferences.
Beverly Hills, CA: Sage publications.
Wood, C., & Bean, F. (1977). Offspring Gender and Family Size: Implications from a
Comparison of Mexican Americans and Anglo Americans. Journal of Marriage and the
Family, 39, 129-139.
Wood, W., Rhodes, N., & Whelan, M. (1989). Sex Differences in Positive Well- Being: A
consideration of Emotional Style and Marital Status. Psychological Bulletin, 106, 249-
264.
Xu, X.H., & Lai, S.C. (2004). Gender Ideologies, Marital Roles, and Marital Quality in Taiwan.
Journal of Family Issues, 25, 318–55.
Yamaguchi, K., & Ferguson, L. R. (1995). The Stopping and Spacing of Childbirths and their
Birth- History Predictors: Rational-Choice Theory and Event-History Analysis. American
Sociological Review, 60 (2), 272-98.
Yeung, W.J., Sandberg, J.E., David-Kean, P.E., & Hofferth, SL. (2001). Children‘s Time with
Fathers in Intact Families. Journal of Marriage and Family, 63, 136-54.

231
Yout, K. (2005). Women‘s Family Power and Gender Preference in Minya , Egypt. Journal of
Marriage and Family, 67, 410-28.
Zick, C. D., Bryant, W. k., & Osterbacka, E. (2001). Mothers Employment, Parental
Involvement, and the Implications for Intermediate Child Outcomes. Social Science
Research, 30, 25-49.
Zill, N., & Peterson, J. L. (1982). Learning to do things without Help. In Blair, S. L. (1992b).
The Sex- Typing of Children‘s Household Labor: Parental Influence on Daughters‘ and
Sons‘ Housework. Youth & Society, 24, 178-203.
Zogby, J. (2003). Report on Survey of Arab American Households. Washington, DC: Arab
American Institute.
________ (2001). Where we are. Retrieved from the Arab American Institute website
http://www.aaiusa.org.
________ (1990). Arab America Today: A demographic Profile of Arab Americans.
Washington, DC: Arab American Institute.

232
ABSTRACT
SONS, DAUGHTERS, AND ARAB-AMERICAN FAMILY DYANAMICS: DOES A
CHILD’S GENDER MATTER?
by
SANAA ALHARAHSHEH
December 2011
Advisor: Dr. Mary Sengstock
Major: Sociology
Degree: Doctor of Philosophy
Gender differences exist in families in all societies and cultures, but expectations are
often different from one society/culture to another. Children‘s gender and its implications for
family behavior have recently received a great deal of scholarly attention, especially in western
societies; however, the influence of a child‘s gender on Arab-American family dynamics has not
been investigated. Therefore, this study is the first to examine the impact of the gender of the
child in selected Arab-American family dynamics. This study specifically investigates the effect
of gender ratio, children‘s gender composition, and parents‘ gender preferences with regard to
children on family size, parental involvement with children, allocating household work to
children, and marital quality, while controlling for average age of children, number of children,
parents‘ gender and age, income, work status, education, age at marriage, place of birth, and
gender ideology.
A cross-sectional quantitative research design was employed, using a convenient sample
(N=200) of Arab-American parents in families who have at least two children under 18 years old
at home and reside Southeast Michigan to assess the relationship between gender ratio, parental
gender preference with regard to children , and children‘s gender composition, and selected

233
family dynamics, such as family size, parental involvement with children, allocating household
work to children, and marital quality.
Hierarchical linear multiple regression analysis was used to test the research hypotheses
and the analysis results indicated that parental gender preferences regarding children and
children‘s gender composition do predict family size. Specifically, parents with a boy preference
are more likely to have larger families than parents with a girl and balanced preferences, or an
indifferent preference; and parents with only girls‘ sibship are more likely to have more children
than parents with mixed gender children. Nevertheless, parents with only boys‘ sibships are less
likely to have larger families than parents with mixed gender children. Age of parents and age at
marriage are also significant predictors of family size. In addition, gender ratio and gender
composition (mixed genders) of the children significantly predict parental involvement with
children. Number of children, fathers‘ education, average age of children, and fathers‘ age were
also significant predictors of parental involvement with children.
Further, the results showed that household work is somewhat gender-segregated in the
Arab-American families who were studied. Girls, overall do more household work than boys;
girls do more indoor work than boys while boys do more outdoor than girls; and parents with
mixed gender children are more likely to display gender stereotype when allocating household
chores to children. This sex-linked assignment of children‘ household work becomes more
intense as the child matures (average age of children increases) and when parents hold to more
traditional gender ideology attitudes.
Finally, children‘s gender composition is a significant predictor of marital quality.
Parents with only boys and with mixed gender children are more likely to report positive marital
quality than parents with only girls. Further, marital quality increases when fathers participate

234
more in family activities. On the other hand, marital quality decreases as the average age of
children increases. Additional research is needed to further study the impact of the gender of the
child on Arab-American family dynamics.

235
AUTOBIOGRAPHICAL STATEMENT
Sanaa Taha Alharahsheh
Education
Ph.D Sociology, Wayne State University, Detroit, MI 2011
M. A Sociology, University of Jordan, Amman, Jordan 2000
B.A Sociology, Yarmouk University, Irbid, Jordan 1997
Experience
Educational Creativity Schools (instructor), Amman, Jordan 2000 –2001
International Institute (volunteer), Detroit, Michigan 2002
Graduate Teaching Assistant, Dep. Of Sociology, WSU, 2008 –2010
Adjunct Faculty, Dep. Of Sociology, WSU, 2010- present
Selected Awards and Honors
Graduate Teaching Assistantship, Wayne State University, MI, 2008-2010
Rumble Fellowship, Wayne State University, 2007
American Lebanese Heritage Club Foundation, Dearborn, MI, 2008
Academic Merit Scholarship, University of Jordan, Jordan (1998, 1999).
Academic Merit Scholarship, Yarmouk University, Jordan (1996, 1997)
Professional membership:
American Sociological Association
North Central Sociological Association
Areas of Research Interests Family, Inequality and stratification, women studies, Research method and statistics, Medical
sociology, and Deviance.