Sol–Gel-Derived Materials for Production of Pin-Printed Reporter Gene Living-Cell Microarrays
10
Sol−Gel-Derived Materials for Production of Pin-Printed Reporter Gene Living-Cell Microarrays Xin Ge,* ,†,‡ Nikolas M. Eleftheriou, †,§ Si Amar Dahoumane, † and John D. Brennan* ,† † Biointerfaces Institute and Department of Chemistry and Chemical Biology, McMaster University, Hamilton, ON, Canada L8S 4L8 ‡ Department of Chemical and Environmental Engineering, University of California, Riverside, CA 92521 § Department of Laboratory Medicine, Lund University, Lund, Sweden ABSTRACT: We report the fabrication of three-dimensional living-cell microarrays via pin-printing of soft sol−gel-derived silica materials containing bacterial cells. Bacterial cells entrapped in the silica−glycerol microarray spots can express reporter genes and produce strong fluorescence signals. The signals responded to the presence and concentration of inducers or repressors as expected, indicating that the entrapped cells remained metabolically active. Microscopic imaging of individual microarray spots at different culture times suggests that the entrapped cells can grow and divide, phenomena further confirmed by experiments in bulk sol−gel materials that demonstrated the increases of entrapped cell density and fluorescence during incubation in culture media. The cell microarrays can also be printed into 96-well glass bottom microtiter plates in a multiplexed manner, and the fluorescence signals generated were able to quantitatively and selectively respond to the concentration of inducers, thus demonstrating the potential for multitarget biosensing and high-throughput/high-content cell-based screening. The signal levels of bacterial cells in silica were significantly higher than those in alginate arrays, presumably due to viability of the entrapped cells in silica sol−gels. Microarray stability assays proved that the entrapped cells retained their physiological activity after storage for four weeks. Given that a large number of fluorescent and luminescent protein-based cell assays have been developed, the reporter gene living-cell microarrays demonstrated in this paper are expected to be applicable to a wide variety of research areas ranging from bioanalysis and chemical biology to drug discovery and probing of cell−material interactions. C ell-based assays play important roles in many applications such as whole-cell sensors, 1,2 and small-/biomacro- molecule screening. 3−5 In genomics and proteomics studies, multiplexed approaches for globally analyzing cell phenotypes have greatly facilitated our understanding of cellular function. However, genome-wide assaying of cellular phenotypes is hindered by several challenges. For example, such large-scale analyses require that cells can be grown in parallel to synchronize cell cycle and be assayed in a miniaturized format in a manner that avoids cross-contamination between cell lines. Cells must also be present on a transparent support to allow spectroscopic analysis of phenotypes, usually by microscopic imaging or spectroscopy. In addition, the solid support must be durable and yet allow cell growth under a variety of growth conditions. Finally, the cells must be able to access the necessary nutrients, chemical compounds, and other reagents as well as exogenous molecules that might affect a particular biological process. 6 Cell microarray techniques are emerging to address the problems outlined above. 7,8 A microarray is a highly parallelized miniaturized format allowing reduced cost, higher assay speed, and lower reagent consumption. 9,10 Several methods have been developed to produce cell-based microarrays, including: (1) using arrays of reagents, such as antibodies, cell-adhesive collagen I, film-deposited peptide-polymer, polymer-modified surfaces, and biocompatible anchors for membrane compo- nents to capture cells on the basis of the recognition of specific cell surface markers; 11−16 (2) transfection cell microarrays produced by growth of a layer of cells on an array of cDNA or RNAi that is immobilized in a hydrogel; 17 (3) the growth of cells within microchambers that are formed on permeable membranes; 6 and (4) entrapment of cells within alginate gels, 18−20 gelatin-based hydrogels, 21 or stretchable PDMS- derived microwell arrays, 22 and the culturing of the cells within silicon microarrays. 23 More recently, genetically engineered cells were able to be printed directly onto inert surfaces via overexpression of adhesive extra-cellular protein components. 24 An emerging method for cell immobilization is their entrapment within sol−gel-derived silica materials. 25,26 Initial studies on the encapsulation of cells within sol−gel-derived media involved Saccharomyces cerevisiae. 27 Several bacterial strains, 28−31 plant and microalgae cells 32−34 as well as Received: October 7, 2013 Accepted: November 21, 2013 Article pubs.acs.org/ac © XXXX American Chemical Society A dx.doi.org/10.1021/ac403220g | Anal. Chem. XXXX, XXX, XXX−XXX
Transcript of Sol–Gel-Derived Materials for Production of Pin-Printed Reporter Gene Living-Cell Microarrays
Sol−Gel-Derived Materials for Production of Pin-Printed ReporterGene Living-Cell MicroarraysXin Ge,*,†,‡ Nikolas M. Eleftheriou,†,§ Si Amar Dahoumane,† and John D. Brennan*,†
†Biointerfaces Institute and Department of Chemistry and Chemical Biology, McMaster University, Hamilton, ON, Canada L8S 4L8‡Department of Chemical and Environmental Engineering, University of California, Riverside, CA 92521§Department of Laboratory Medicine, Lund University, Lund, Sweden
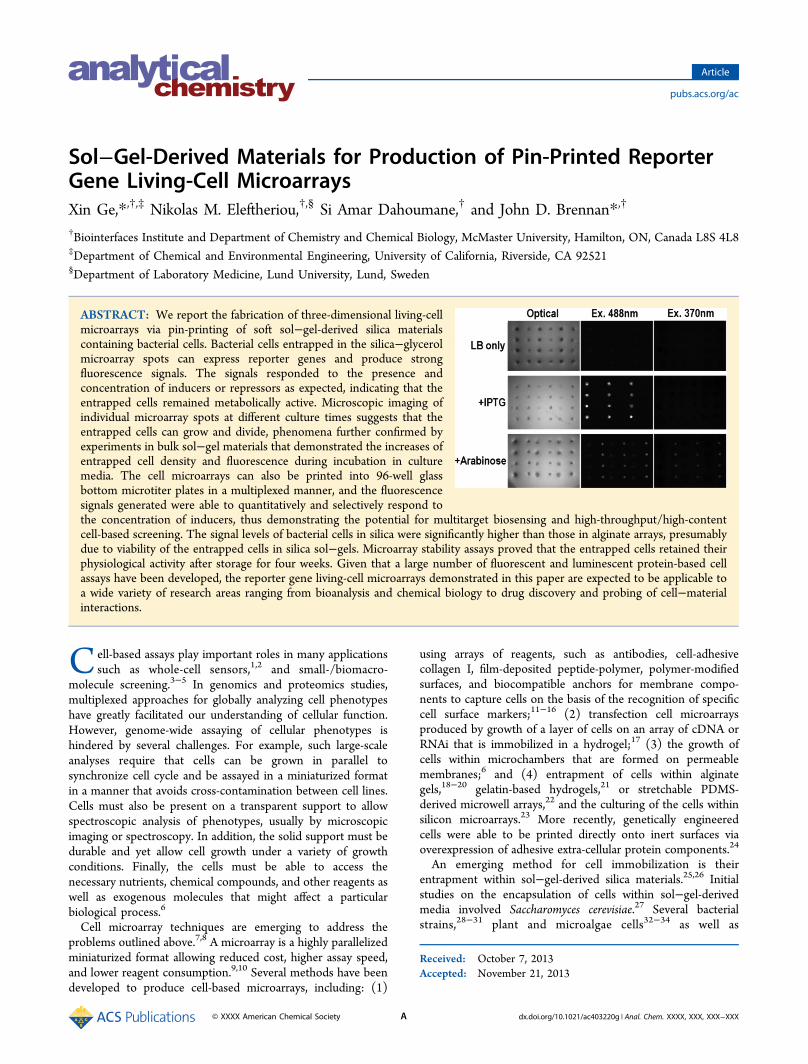
ABSTRACT: We report the fabrication of three-dimensional living-cellmicroarrays via pin-printing of soft sol−gel-derived silica materialscontaining bacterial cells. Bacterial cells entrapped in the silica−glycerolmicroarray spots can express reporter genes and produce strongfluorescence signals. The signals responded to the presence andconcentration of inducers or repressors as expected, indicating that theentrapped cells remained metabolically active. Microscopic imaging ofindividual microarray spots at different culture times suggests that theentrapped cells can grow and divide, phenomena further confirmed byexperiments in bulk sol−gel materials that demonstrated the increases ofentrapped cell density and fluorescence during incubation in culturemedia. The cell microarrays can also be printed into 96-well glassbottom microtiter plates in a multiplexed manner, and the fluorescencesignals generated were able to quantitatively and selectively respond tothe concentration of inducers, thus demonstrating the potential for multitarget biosensing and high-throughput/high-contentcell-based screening. The signal levels of bacterial cells in silica were significantly higher than those in alginate arrays, presumablydue to viability of the entrapped cells in silica sol−gels. Microarray stability assays proved that the entrapped cells retained theirphysiological activity after storage for four weeks. Given that a large number of fluorescent and luminescent protein-based cellassays have been developed, the reporter gene living-cell microarrays demonstrated in this paper are expected to be applicable toa wide variety of research areas ranging from bioanalysis and chemical biology to drug discovery and probing of cell−materialinteractions.
Cell-based assays play important roles in many applicationssuch as whole-cell sensors,1,2 and small-/biomacro-
molecule screening.3−5 In genomics and proteomics studies,multiplexed approaches for globally analyzing cell phenotypeshave greatly facilitated our understanding of cellular function.However, genome-wide assaying of cellular phenotypes ishindered by several challenges. For example, such large-scaleanalyses require that cells can be grown in parallel tosynchronize cell cycle and be assayed in a miniaturized formatin a manner that avoids cross-contamination between cell lines.Cells must also be present on a transparent support to allowspectroscopic analysis of phenotypes, usually by microscopicimaging or spectroscopy. In addition, the solid support must bedurable and yet allow cell growth under a variety of growthconditions. Finally, the cells must be able to access thenecessary nutrients, chemical compounds, and other reagents aswell as exogenous molecules that might affect a particularbiological process.6
Cell microarray techniques are emerging to address theproblems outlined above.7,8 A microarray is a highly parallelizedminiaturized format allowing reduced cost, higher assay speed,and lower reagent consumption.9,10 Several methods have beendeveloped to produce cell-based microarrays, including: (1)
using arrays of reagents, such as antibodies, cell-adhesivecollagen I, film-deposited peptide-polymer, polymer-modifiedsurfaces, and biocompatible anchors for membrane compo-nents to capture cells on the basis of the recognition of specificcell surface markers;11−16 (2) transfection cell microarraysproduced by growth of a layer of cells on an array of cDNA orRNAi that is immobilized in a hydrogel;17 (3) the growth ofcells within microchambers that are formed on permeablemembranes;6 and (4) entrapment of cells within alginategels,18−20 gelatin-based hydrogels,21 or stretchable PDMS-derived microwell arrays,22 and the culturing of the cells withinsilicon microarrays.23 More recently, genetically engineeredcells were able to be printed directly onto inert surfaces viaoverexpression of adhesive extra-cellular protein components.24
An emerging method for cell immobilization is theirentrapment within sol−gel-derived silica materials.25,26 Initialstudies on the encapsulation of cells within sol−gel-derivedmedia involved Saccharomyces cerevisiae.27 Several bacterialstrains,28−31 plant and microalgae cells32−34 as well as
Received: October 7, 2013Accepted: November 21, 2013
Article
pubs.acs.org/ac
© XXXX American Chemical Society A dx.doi.org/10.1021/ac403220g | Anal. Chem. XXXX, XXX, XXX−XXX
mammalian cells,35 including pancreatic islets of Langer-hans36,37 and rat mature ovarian follicles,38 have also beensuccessfully immobilized in silica gels using both traditionalsol−gel processing and aerosol-based methods.39 The en-trapped cells retain their ability to express fluorescentproteins31,40 or to produce hormones or other species.38
They can also be used as components of biosensors, forexample, cell-based organophosphate biosensors have beenreported.41 In most cases, entrapped cells are unable to dividewithin the silica matrix.25 However, multi-layered silica thinfilms have recently been utilized to entrap E. coli cells, whichcan survive, divide, and express fluorescent proteins in silicasol−gel materials.42 In addition, S. cerevisiae cells have beenencapsulated in poly(glycerol) silicate derived matrices, and theentrapped cells showed metabolic activity with long-termviability.43
Sol−gel-based materials have also been utilized for thefabrication of three-dimensional protein microarrays.44−47 Sucharrays have been utilized both for multiplexed biosensing,quantitative small molecule screening, and miniaturizedcytotoxicity assays.26 However, the use of sol−gel-basedencapsulation for the preparation of high-density living cellmicroarrays has not been reported. The objective of this studywas therefore to develop a method to entrap viable cellstransformed with reporter genes into soft biocompatible sol−gel-derived nanocomposite silica materials that could retain cellgrowth and division, prevent them from leaching, and be pin-printed as microarrays. Such arrays result in cells that arelocated in individual array elements, and array formation can bedone using both planar slides and microwell plates without theneed for specially treated surfaces or adherent cell lines. Thesearrays provide a platform for rapidly screening multiplecompounds against multiple targets in a single assay (i.e.,many vs many screening). Other advantages of such arraysinclude: ease of integration into HTS facilities; minimal use ofreagents; the potential for quantitative, multipoint screening;and the ability to store and transport the microarray afterproduction to allow use in the field. Herein, we describe thefabrication and evaluation of 3D reporter gene bacterial cellmicroarrays and demonstrate their utility for fluorescence-basedmultiplexed cellular assays.
■ EXPERIMENTAL SECTIONPlasmids and Bacterial Stains. Reporter gene assays were
done using E. coli for proof-of-concept studies on sol−gel-derived cell microarrays owing to the ease of transformingreporter genes into E. coli and the widespread use of E. coli as amodel system for antimicrobial research. The expression of areporter protein as a signaling method was based on the desireto have a signal that could both demonstrate cell viability uponentrapment and act as a quantitative signal for applications ofcell arrays in sensing and screening. The plasmids utilized inthis study were pGLO (Bio-Rad), which carries genes encodingfor the arabinose operon regulation protein araC, and a greenfluorescent protein (GFP) under the control of the arabinosepromoter, and pET23a-eGFP (a gift from Dr. Gerry Wright),which uses the pET23a (Novagen) as the backbone, andencodes eGFP under the control of the T7 promoter. The GFPexpressed by the pGLO plasmid is GFPuv, which has excitationmaxima at 370 nm and 490 nm, while the GFP expressed bythe pET23a plasmid is eGFP, having an excitation maximum at490 nm. pGLO was transformed into E. coli HB101 using thestandard CaCl2 competent cell method. The pET23a−eGFP
plasmid was transformed to BL21(DE3)pLys E.coli (Novagen).This host cell was chosen because it contains a plasmidencoding the T7 lysozyme gene, which lowers the backgroundexpression of the target gene, but does not interfere with theexpression level following IPTG induction.
Preparation of Cells. From the fresh transformation plates,a single colony was picked and inoculated into LB medium withthe addition of appropriate antibiotics: 100 μg/mL ampicillinfor pGLO(HB101) and 100 μg/mL ampicillin and 34 μg/mLchloramphenicol for pET23a-eGFP(BL21,DE3,pLys). Cellswere cultured at 37 °C to reach the late exponential phase,as indicated by an OD600 ∼0.8 (about 4 × 10⁸ cells/mL). Cellswere harvested by centrifugation and washed once with 0.85%NaCl. Typically, cells collected from 5 mL of culture mediawere resuspended into 100 μL of 0.85% NaCl, giving a celldensity 50× as high as that in the culture media.
Preparation of Spotting Solutions. For fabrication ofsoft silica-based cell microarrays, 2.9 g of sodium silicate (SS, 27wt % SiO2, 10 wt % NaOH, Riedel-de Haen̈) was diluted with10 mL of distilled, deionized water (Milli-Q Synthesis A10,Millipore, Inc., Billerica, MA), and mixed with 5 g of Dowexstrong acid cation-exchange resin (Sigma, Oakville, ON). Themixture was immediately stirred for 30 s to lower the pH to avalue of 4.0. The mixture was filtered through Whatman no. 1filter paper and then through a 0.2 μm membrane syringe filterto remove the resin particles, resulting in a silicate solutioncontaining 6 wt % SiO2. The silica solution was mixed with anequal volume of 80% glycerol in water, and an appropriateamount of 1.0 N NaOH was added and immediately mixed toadjust the pH to 7.0, resulting in a glycerol−silicate solution(GSS). Solutions for microarraying were prepared by mixing avolume of 80 μL of GSS with 10 μL of HEPES buffer (0.5 M,pH 7.5) and 6−12 μL of the 50× cell suspension in a 96-wellplate so that the final concentrations of the solution were 50mM HEPES, 32% glycerol, 2.4% silica, pH 7.0, containing cellshaving 3 to 6× the density in the culture media (approximatelyequal to 1.2−2.4 × 10⁹ cells/mL). Alginate-based cellmicroarray spotting solutions were prepared as describedpreviously18 with minor modifications. Briefly, 50× cellsuspensions were mixed with 3% sodium alginate (Fluka) togive a spotting solution containing 1.5% sodium alginate, 24%glycerol, 50 mM HEPES (pH 7.5), and 10% (v/v) (5×) cellsuspension. For gelatin microarrays, 2.0% gelatin (pork skin,Sigma) was prepared and melted by heating to 50 °C; it wasthen kept liquefied at 40 °C. The gelatin-based cell microarrayspotting solution contained 1% gelatin and approximately 2 ×10⁹ cells/mL. In the sodium silicate sol−gel solutionsupplemented with peptide detergent as the cell-stabilizingadditive, the final concentrations were 2.4% SS, 50 mM HEPES(pH∼7), 0.1−0.4 mg/mL peptide acetyl-AAAAAAK (A6K,Sigma Genosys) or VVVVVVD (V6D, Sigma Genosys), and∼2 × 10⁹ cells/mL.
Microspotting and Cell Microarray Incubation. Thesilica and alginate spotting solutions containing the reportergene cells were spotted using a Virtek Chipwriter contact pin-printer equipped with either a SMP3 stealth quill pin (0.7 nLdelivery; 100 μm spot diameter) or a SMP7 quill pin (2.3 nLdelivery; 235 μm spot diameter) (ArrayIt). Virtek ChipwriterPro software was used to control all the parameters associatedwith microarraying, such as sample position, spot position andinterelement spacing. Cell microarrays were printed into wellsof 96-well glass-bottom microplates (Whatman, Cat. No.7706−2370) without any surface pretreatment. Printing was
Analytical Chemistry Article
dx.doi.org/10.1021/ac403220g | Anal. Chem. XXXX, XXX, XXX−XXXB
done at room temperature (21 ± 2 °C) at ∼90% relativehumidity to retard evaporation of water from the spots.Completion of an array of 100 spots (10 × 10) took about 2min to perform, including pin wash cycles, when using aprinthead speed of 16 mm.s−1. After microspotting, silica-basedcell arrays were aged inside the arrayer chamber for 30 min,then 100 μL of LB culture media (optionally supplementedwith an appropriate inducer or repressor) was added into eachmicrowell. For alginate-based cell arrays, arrays were aged for 5min, then 100 mM CaCl2 was added to solidify the alginate gelfor 15 min. The gelled alginate cell arrays were then washedwith 0.85% NaCl, and incubated in LB media which wassupplemented with 100 mM CaCl2 to keep the alginate in thesolid form. To perform reporter gene assays, the cell arrayswere incubated in culture media either at 37 °C for 3 h or atroom temperature overnight (∼14 h). The concentrations ofsupplemented inducers were usually 0.2−1.0 mM for IPTG,and 0.03−3.0 mM for arabinose.Microarray Imaging and Data Processing. Culture
medium was removed before imaging, and cell microarrayswere washed with 0.85% NaCl to remove any cells that mighthave leached during incubation. Failure to perform the washingstep resulted in low, but observable background fluorescenceoutside of the array element. Optical and fluorescent images ofcell microarrays were obtained using an Olympus BX50brightfield/fluorescence microscope equipped with a mercurylamp and a Roper Scientific Coolsnap Fx CCD camera.Excitation was performed at either 370 or 488 nm by insertingappropriate bandpass filters into the excitation path. Emissionwas collected through either 2× or 10× objective lenses. High-resolution confocal fluorescence microscopy images wereobtained using a Leica TCS SP5 microscope equipped with a488 nm laser and a 63× glycerol immersion lens. All array datawere analyzed using Array-Pro Analyzer software. Processingtypically consisted of integrating the intensity within a constantarea in each array element (90% of full area), averaging theintensity over at least three identical array elements, andoptionally normalizing the data. Background subtraction wasnot done.Cell Division Studies. To study cell division within the
sol−gel-derived materials, the biomaterials were prepared asdescribed earlier (cf. the Preparation of Spotting Solutionssection) with a cell density of 5×, but they were prepared asmonolithic materials within microtiter plates. A volume of 100μL of the biocomposite material was supplemented with 200μL of minimal culture media (M9, 0.4% dextrose). An InfiniteM1000 plate reader and the iControl software (TECAN,Man̈nedorf, Switzerland) were used to measure absorbance andfluorescence initially and over time. Absorbance was collectedat 600 nm. Fluorescence parameters were as follows: excitation488 nm, bandwidth 5 nm; emission 510 nm, bandwidth 10 nm;bottom read. Temperature was set at 24 °C for allmeasurements. Assays were run in triplicate, and the back-ground was subtracted.
■ RESULTS AND DISCUSSIONMaterial Selection. Five sol−gel materials were tested for
their ability to fabricate microarrays with entrapped, livingmicrobial cells. These materials were alginate with glycer-ol,18−20 alginate with a sodium silicate shell, gelatin,21 sodiumsilicate with glycerol, and sodium silicate with peptides that candramatically stabilize cellular components.48 The latter materialwas chosen since the presence of the peptides such as acetyl-
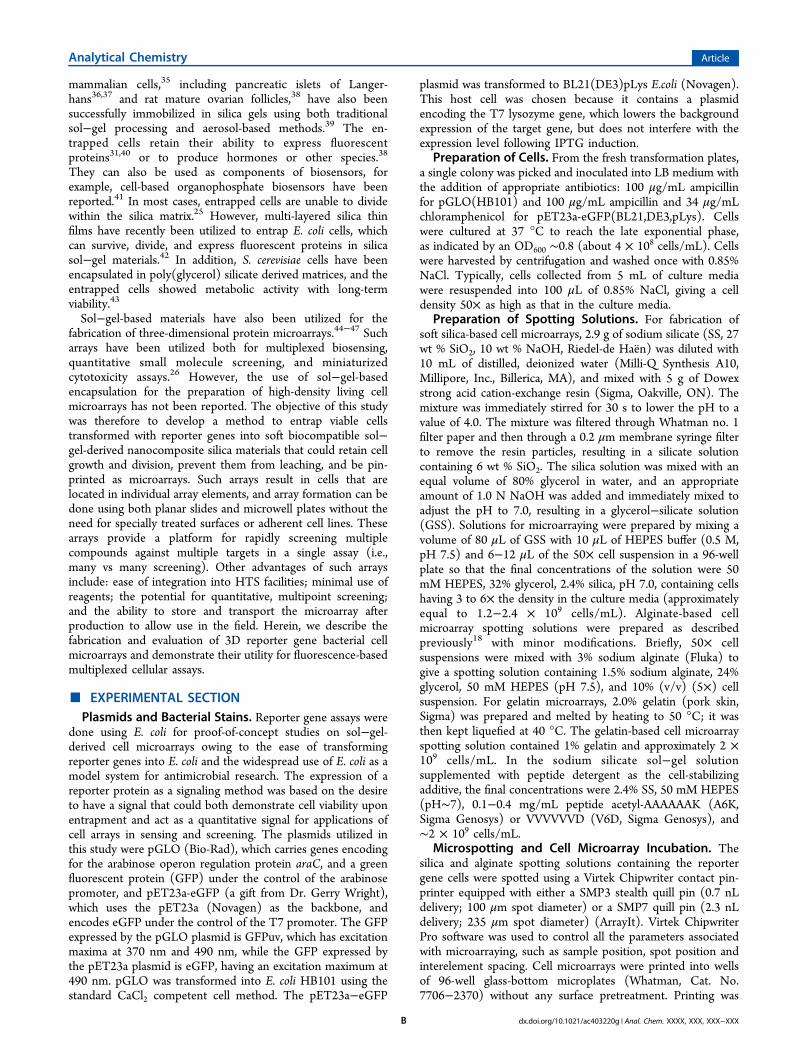
AAAAAAK or VVVVVVD prior to drying has been shown tostabilize cellular components such as the photosystem-Icomplex for weeks in its dried form at room temperature,suggesting peptide detergents may effectively stabilize cells inthe solid-state. After sol−gel solution preparation, pin-printing,washing, and overnight incubation with culture media asdescribed in the Experimental Section, the cell microarraysprepared with these materials were evaluated on the basis oftheir printability criteria, including spot uniformity, tolerance towashing, cell activity, and so forth. Aging time and conditionswere also optimized for promising material candidates. Becausethe entrapped cells tested here were E. coli BL21 (DE3)transformed with a plasmid encoding the GFPuv gene, afterincubation in LB media supplemented with arabinose as theinducer, the microarrays containing metabolically active cellswere expected to generate fluorescent signals. As shown inFigure 1, only alginate (Figure 1A) and SS with glycerol (Figure
1B) were able to produce microarrays compatible with activemicrobial cells. Gelatin cell microarrays resulted in seriousleaching with loss of the integrity of spots (Figure 1C). SS withpeptides can generate spots with good integrity after washingand overnight incubation, but no fluorescence was detected(Figure 1D), presumably due to cell lysis caused by the peptidedetergents. Alginate with a sodium silicate overlay failed togenerate immobilized spots, and the cells cannot be tracked(image not shown). Different durations of aging in a highhumidity chamber were tested for SS−glycerol sol−gel-derivedcell microarrays, and the results indicated that at least 20 minwere required for this SS material with a high content ofglycerol (∼32%) to solidify and immobilize on the surface. Inthe following experiments, 30 min of aging time was applied forSS−glycerol sol−gel-derived materials to produce robust cellmicroarrays.
Figure 1. Sol−gel material selection for living-cell microarrays.
Analytical Chemistry Article
dx.doi.org/10.1021/ac403220g | Anal. Chem. XXXX, XXX, XXX−XXXC
Optimizing Microarraying Conditions. Recent studieson the fabrication of protein microarrays by pin-printing ofsol−gel-derived biocomposites have demonstrated that materi-als derived from sodium silicate or diglycerylsilane (DGS) andcontaining polymer additives such as poly(ethylene)glycol orpoly(vinylalcohol) have long gelation times (a requirement forprinting higher density arrays) and produce arrays that showgood adhesion to a variety of surfaces, no cracking uponintroduction of assay reagents, and high bioactivity for theentrapped biomolecules.44,45 In the case of cell microarrays, weselected a sodium-silicate-derived material with an intermediatesilica density (2.4 wt % silica) and a relatively high level ofglycerol (32% v/v) and performed printing at neutral pH (7.0)to ensure long gelation times (>1 h) and to reduce the effectsof dehydration, allowing for longer cure times and thus greatersyneresis, and incubated the arrays at a high relative humidity(∼90% RH) to retard the evaporation of water from the spots.This material could be cured for as little as 30 min after printingand prior to addition of media, which was sufficient to retaincell viability and yet avoid substantial leaching of cells. It isworthwhile to mention that the degree of cell leaching is indeeddependent on initial cell density and growth rate. Lessinoculation with suboptimal culture conditions, such as lowtemperature, usually results in less cell leaching. The materialcould be produced and arrayed with a variable density of cells,generally spanning from 0.1 to 10× of the density in theoriginal culture medium, allowing for adjustment of the numberof cells per array element. In this study, microarray spottingsolutions typically had cell densities of 3 to 6× relative to theculture medium, approximately equal to 1−2 × 10⁹ cells/mL,which was sufficient to produce high signal-to-background (S/B) ratios in subsequent assays.Comparison of Silica and Alginate Cell Microarrays. A
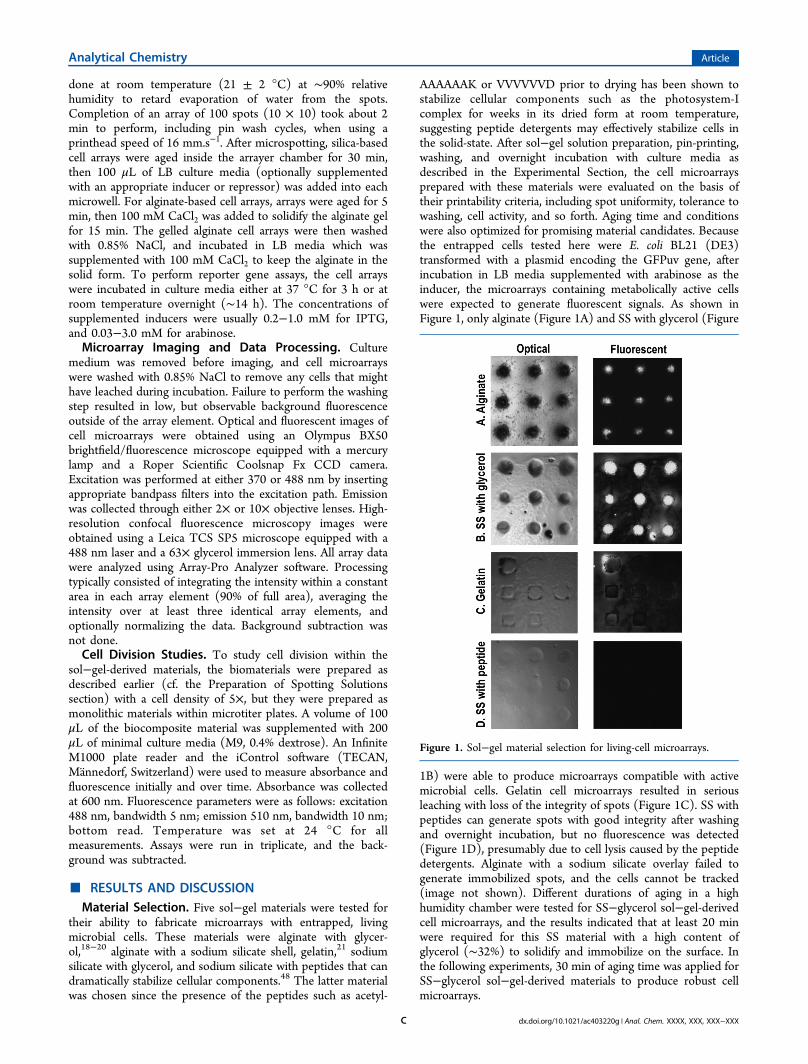
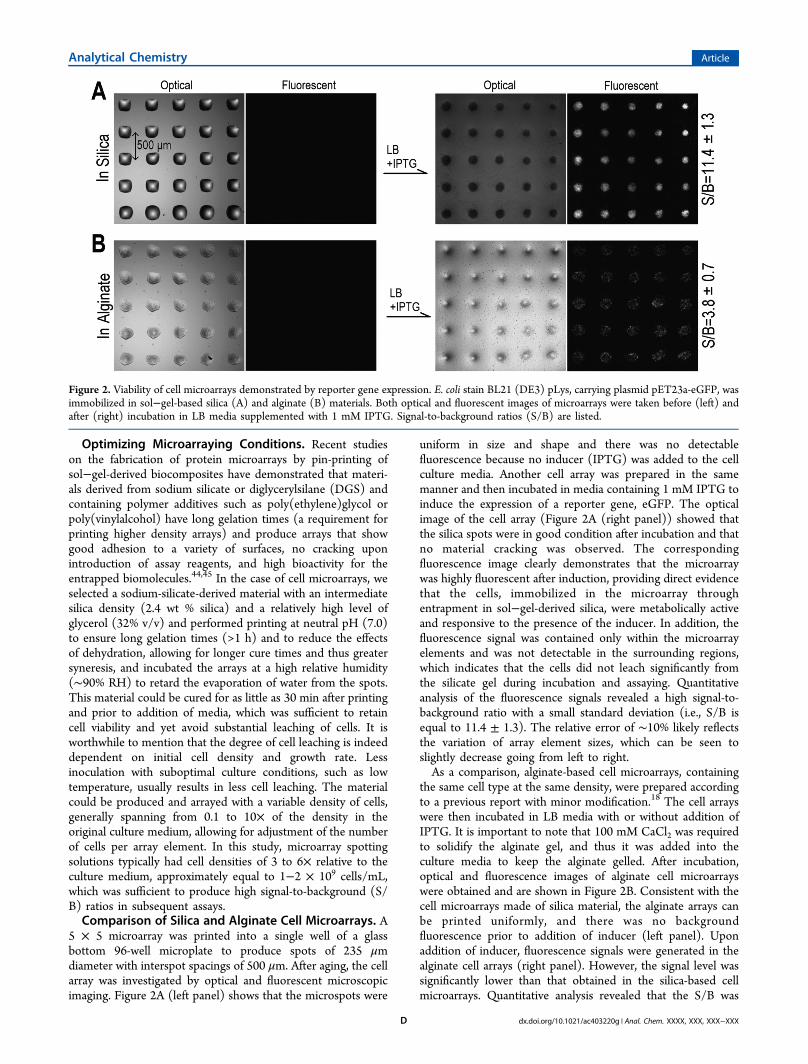
5 × 5 microarray was printed into a single well of a glassbottom 96-well microplate to produce spots of 235 μmdiameter with interspot spacings of 500 μm. After aging, the cellarray was investigated by optical and fluorescent microscopicimaging. Figure 2A (left panel) shows that the microspots were
uniform in size and shape and there was no detectablefluorescence because no inducer (IPTG) was added to the cellculture media. Another cell array was prepared in the samemanner and then incubated in media containing 1 mM IPTG toinduce the expression of a reporter gene, eGFP. The opticalimage of the cell array (Figure 2A (right panel)) showed thatthe silica spots were in good condition after incubation and thatno material cracking was observed. The correspondingfluorescence image clearly demonstrates that the microarraywas highly fluorescent after induction, providing direct evidencethat the cells, immobilized in the microarray throughentrapment in sol−gel-derived silica, were metabolically activeand responsive to the presence of the inducer. In addition, thefluorescence signal was contained only within the microarrayelements and was not detectable in the surrounding regions,which indicates that the cells did not leach significantly fromthe silicate gel during incubation and assaying. Quantitativeanalysis of the fluorescence signals revealed a high signal-to-background ratio with a small standard deviation (i.e., S/B isequal to 11.4 ± 1.3). The relative error of ∼10% likely reflectsthe variation of array element sizes, which can be seen toslightly decrease going from left to right.As a comparison, alginate-based cell microarrays, containing
the same cell type at the same density, were prepared accordingto a previous report with minor modification.18 The cell arrayswere then incubated in LB media with or without addition ofIPTG. It is important to note that 100 mM CaCl2 was requiredto solidify the alginate gel, and thus it was added into theculture media to keep the alginate gelled. After incubation,optical and fluorescence images of alginate cell microarrayswere obtained and are shown in Figure 2B. Consistent with thecell microarrays made of silica material, the alginate arrays canbe printed uniformly, and there was no backgroundfluorescence prior to addition of inducer (left panel). Uponaddition of inducer, fluorescence signals were generated in thealginate cell arrays (right panel). However, the signal level wassignificantly lower than that obtained in the silica-based cellmicroarrays. Quantitative analysis revealed that the S/B was
Figure 2. Viability of cell microarrays demonstrated by reporter gene expression. E. coli stain BL21 (DE3) pLys, carrying plasmid pET23a-eGFP, wasimmobilized in sol−gel-based silica (A) and alginate (B) materials. Both optical and fluorescent images of microarrays were taken before (left) andafter (right) incubation in LB media supplemented with 1 mM IPTG. Signal-to-background ratios (S/B) are listed.
Analytical Chemistry Article
dx.doi.org/10.1021/ac403220g | Anal. Chem. XXXX, XXX, XXX−XXXD
equal to 3.8 ± 0.7, which is 3-fold less than the S/B ratio of thesilica-based microarrays.In addition to the lower signal-to-background ratio, two
other disadvantages were also associated with alginate-basedcell microarrays: (1) Ca2+ or other bivalent metal ions must bepresent, which limits its applications in pathway studiesinvolving Ca2+, and (2) although alginate is an attractivematerial due to its biocompatibility and ability to formhydrogels, its slow and uncontrollable degradation can be anundesirable feature.49 Degradation diminishes the long-termstorage stability of these cell microarrays and limits their usagefor organisms that digest such polysaccharides. Although a fewstudies suggest that entrapment in silica can induce stress-response genes or regulate induction or repression of a limitednumber of genes,50 the effects of silica entrapment on E. colitranscriptomics has not been extensively characterized. Furtherinvestigation across a range of various E. coli promoters canaddress this issue and will be reported in a future study.Overall, the studies described above prove that the use of a
relatively soft silica-based sol with high glycerol content issuitable for fabrication of viable bacterial cell microarrays. Theentrapped cells were metabolically active and responsive to thepresence of inducer. The fluorescence signals were strong withgood reproducibility. Furthermore, the ability to form themicroarrays within the wells of microplates makes incubationand washing steps facile and also makes it amenable tointegration with automated liquid handling, making the cellmicroarray technique described here readily adopted for HTSapplications.Multiplexed Sensing Using Reporter Gene Cell Micro-
arrays. To demonstrate the ability to perform multiplexedassays using the silica-based cell microarray, two E. coli strainstransformed with different plasmids were utilized to form
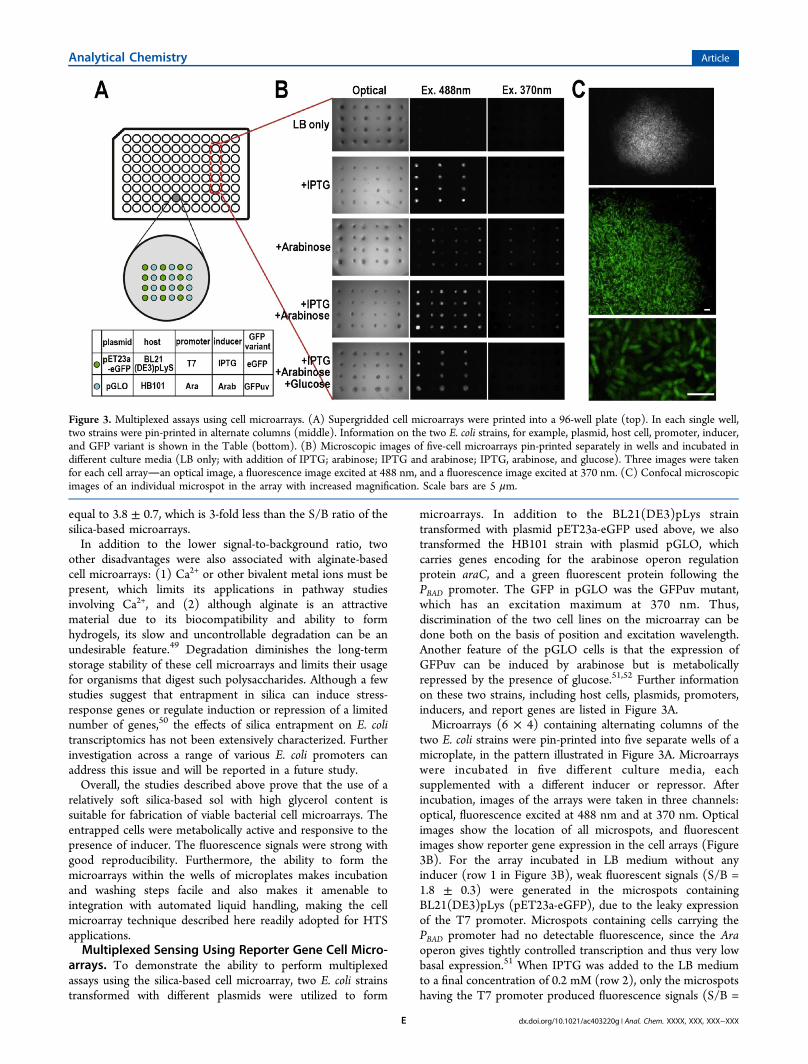
microarrays. In addition to the BL21(DE3)pLys straintransformed with plasmid pET23a-eGFP used above, we alsotransformed the HB101 strain with plasmid pGLO, whichcarries genes encoding for the arabinose operon regulationprotein araC, and a green fluorescent protein following thePBAD promoter. The GFP in pGLO was the GFPuv mutant,which has an excitation maximum at 370 nm. Thus,discrimination of the two cell lines on the microarray can bedone both on the basis of position and excitation wavelength.Another feature of the pGLO cells is that the expression ofGFPuv can be induced by arabinose but is metabolicallyrepressed by the presence of glucose.51,52 Further informationon these two strains, including host cells, plasmids, promoters,inducers, and report genes are listed in Figure 3A.Microarrays (6 × 4) containing alternating columns of the
two E. coli strains were pin-printed into five separate wells of amicroplate, in the pattern illustrated in Figure 3A. Microarrayswere incubated in five different culture media, eachsupplemented with a different inducer or repressor. Afterincubation, images of the arrays were taken in three channels:optical, fluorescence excited at 488 nm and at 370 nm. Opticalimages show the location of all microspots, and fluorescentimages show reporter gene expression in the cell arrays (Figure3B). For the array incubated in LB medium without anyinducer (row 1 in Figure 3B), weak fluorescent signals (S/B =1.8 ± 0.3) were generated in the microspots containingBL21(DE3)pLys (pET23a-eGFP), due to the leaky expressionof the T7 promoter. Microspots containing cells carrying thePBAD promoter had no detectable fluorescence, since the Araoperon gives tightly controlled transcription and thus very lowbasal expression.51 When IPTG was added to the LB mediumto a final concentration of 0.2 mM (row 2), only the microspotshaving the T7 promoter produced fluorescence signals (S/B =
Figure 3. Multiplexed assays using cell microarrays. (A) Supergridded cell microarrays were printed into a 96-well plate (top). In each single well,two strains were pin-printed in alternate columns (middle). Information on the two E. coli strains, for example, plasmid, host cell, promoter, inducer,and GFP variant is shown in the Table (bottom). (B) Microscopic images of five-cell microarrays pin-printed separately in wells and incubated indifferent culture media (LB only; with addition of IPTG; arabinose; IPTG and arabinose; IPTG, arabinose, and glucose). Three images were takenfor each cell arrayan optical image, a fluorescence image excited at 488 nm, and a fluorescence image excited at 370 nm. (C) Confocal microscopicimages of an individual microspot in the array with increased magnification. Scale bars are 5 μm.
Analytical Chemistry Article
dx.doi.org/10.1021/ac403220g | Anal. Chem. XXXX, XXX, XXX−XXXE
10.6 ± 1.7), while microspots containing HB101 (pGLO)remained nonfluorescent. The relative errors for arrays formedin microwells (15−20%) were generally higher than thoseformed on glass slides (∼10%) owing to a larger variation inspot sizes, as seen in Figure 3B. When the array was cultured inLB with 3 mM arabinose (row 3), it gave a result opposite tothat of LB+IPTG (row 2): the microspots having arabinosepromoter were highly fluorescent (S/B = 7.4 ± 1.2), whilemicrospots containing the T7 promoter remained at thebackground signal level (S/B = 2.3 ± 0.4). The lower signallevel is due to the lower emissivity of the GFPUv relative toeGFP. With addition of both inducers (row 4), the whole cellmicroarray had strong fluorescence, with T7 containing cellshaving an S/B of 11.7 ± 2.0 and PBAD cells having an S/B of 7.3± 1.5. These numbers were in good agreement with the S/Bvalues obtained in rows 2 and 3 in Figure 3B. In the fifth well,the cell microarray was incubated in LB supplemented with twoinducers and one repressor0.2 mM IPTG, 3 mM arabinose,and 1% glucose. The result showed that microspots having a T7promoter produced fluorescence with an S/B equal to 8.4 ±1.3, slightly less than the data of arrays incubated in ITPG−glucose LB media (row 2 and 4), while microspots containingHB101 (pGLO) had no detectable fluorescence, reflecting thefact that the Ara operon was repressed by the presence ofglucose.51 The lower value for the T7 promoter in the presenceof glucose is due to the ability of glucose to repress the basalexpression caused by T7 leakage but not interfere with theexpression level following IPTG induction.53
To selectively excite the GFPuv mutant encoded by pGLO,the microarray was excited at 370 nm. Under these conditions,the HB101 (pGLO) microspots showed a fluorescence signal of4.9 ± 0.8, while microspots containing the T7 system showedno detectable fluorescence. Thus, it is possible to enhanceselectivity in array-based reporter gene assays via selection ofthe excitation wavelength. All of the above results demonstratethat cell strains, which carry two GFP variants under thecontrol of different promoter systems, are viable and respondselectively to the presence of inducers or repressors as expected.The ability to perform multiplexed assays using three-dimensional cell microarrays provides an important resourcefor both multianalyte sensing and as a tool for rapid, “many vsmany” small molecule screeninga task that is not easy toimplement in current HTS facilities.Figure 3C shows high magnification fluorescent images of
the cell microarray. The image of an individual microspot(Figure 3C, top) indicates that it has a clear edge, suggestingthat the cells remain entrapped within the gel and thus shouldshow a low level of cross-contamination. A higher magnificationimage of a microspot (Figure 3C, middle) reveals that the cellsare present in the microspots at a very high density, which islikely the reason why these arrays can achieve a high S/B ratio.A close-up image (Figure 3C, bottom) shows individualentrapped E. coli cells, which are fluorescent, proving that thesignals were indeed generated by the expression of GFP inintact, living cells.Cell Division in Microspots. The images shown in Figure
3C reveal high cell densities within microspots, which may helpexplain the S/B difference between alginate and silicatematerials (described in Figure 2). Both alginate and silicamicrospots contained identical numbers of cells prior toincubation and induction. However, the final signal for silicaspots was almost 3-fold higher than in alginate. Highmagnification fluorescence images of silica and alginate arrays
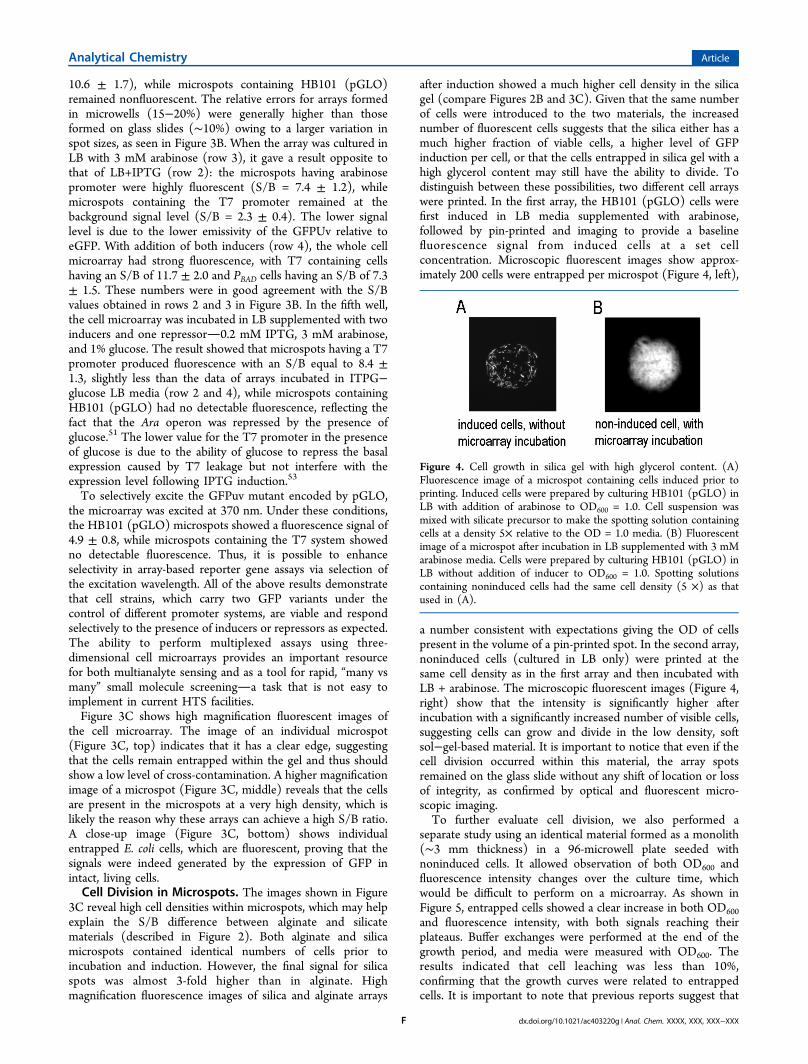
after induction showed a much higher cell density in the silicagel (compare Figures 2B and 3C). Given that the same numberof cells were introduced to the two materials, the increasednumber of fluorescent cells suggests that the silica either has amuch higher fraction of viable cells, a higher level of GFPinduction per cell, or that the cells entrapped in silica gel with ahigh glycerol content may still have the ability to divide. Todistinguish between these possibilities, two different cell arrayswere printed. In the first array, the HB101 (pGLO) cells werefirst induced in LB media supplemented with arabinose,followed by pin-printed and imaging to provide a baselinefluorescence signal from induced cells at a set cellconcentration. Microscopic fluorescent images show approx-imately 200 cells were entrapped per microspot (Figure 4, left),
a number consistent with expectations giving the OD of cellspresent in the volume of a pin-printed spot. In the second array,noninduced cells (cultured in LB only) were printed at thesame cell density as in the first array and then incubated withLB + arabinose. The microscopic fluorescent images (Figure 4,right) show that the intensity is significantly higher afterincubation with a significantly increased number of visible cells,suggesting cells can grow and divide in the low density, softsol−gel-based material. It is important to notice that even if thecell division occurred within this material, the array spotsremained on the glass slide without any shift of location or lossof integrity, as confirmed by optical and fluorescent micro-scopic imaging.To further evaluate cell division, we also performed a
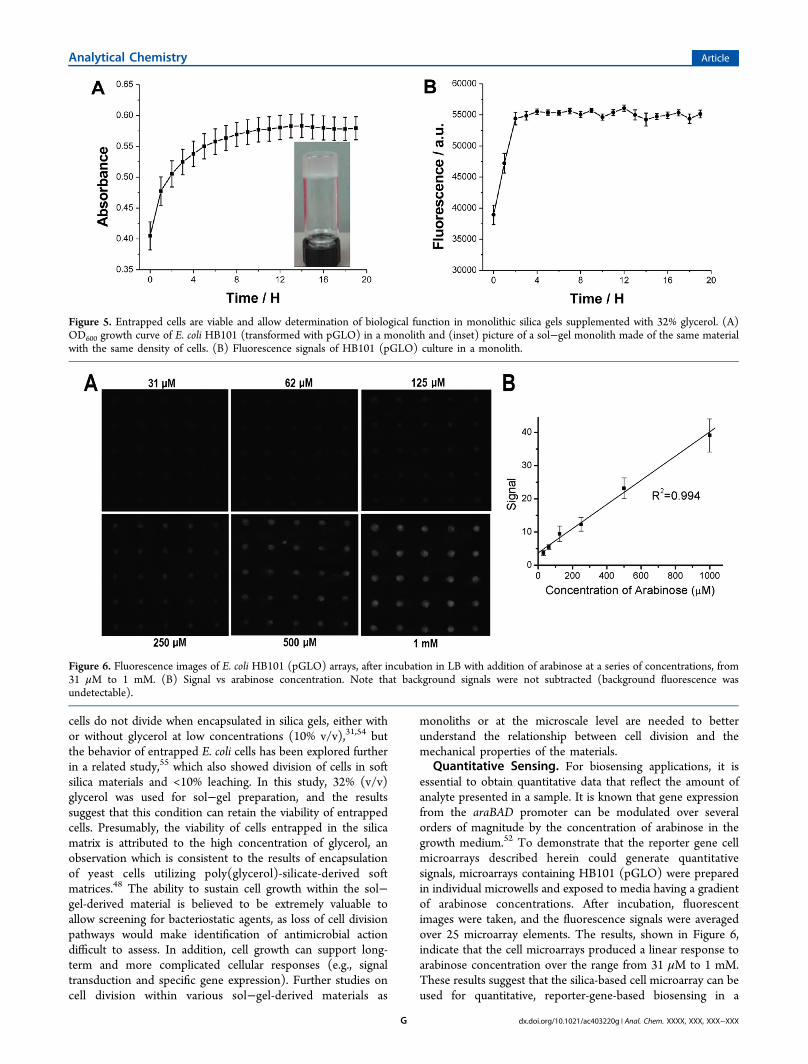
separate study using an identical material formed as a monolith(∼3 mm thickness) in a 96-microwell plate seeded withnoninduced cells. It allowed observation of both OD600 andfluorescence intensity changes over the culture time, whichwould be difficult to perform on a microarray. As shown inFigure 5, entrapped cells showed a clear increase in both OD600and fluorescence intensity, with both signals reaching theirplateaus. Buffer exchanges were performed at the end of thegrowth period, and media were measured with OD600. Theresults indicated that cell leaching was less than 10%,confirming that the growth curves were related to entrappedcells. It is important to note that previous reports suggest that
Figure 4. Cell growth in silica gel with high glycerol content. (A)Fluorescence image of a microspot containing cells induced prior toprinting. Induced cells were prepared by culturing HB101 (pGLO) inLB with addition of arabinose to OD600 = 1.0. Cell suspension wasmixed with silicate precursor to make the spotting solution containingcells at a density 5× relative to the OD = 1.0 media. (B) Fluorescentimage of a microspot after incubation in LB supplemented with 3 mMarabinose media. Cells were prepared by culturing HB101 (pGLO) inLB without addition of inducer to OD600 = 1.0. Spotting solutionscontaining noninduced cells had the same cell density (5 ×) as thatused in (A).
Analytical Chemistry Article
dx.doi.org/10.1021/ac403220g | Anal. Chem. XXXX, XXX, XXX−XXXF
cells do not divide when encapsulated in silica gels, either withor without glycerol at low concentrations (10% v/v),31,54 butthe behavior of entrapped E. coli cells has been explored furtherin a related study,55 which also showed division of cells in softsilica materials and <10% leaching. In this study, 32% (v/v)glycerol was used for sol−gel preparation, and the resultssuggest that this condition can retain the viability of entrappedcells. Presumably, the viability of cells entrapped in the silicamatrix is attributed to the high concentration of glycerol, anobservation which is consistent to the results of encapsulationof yeast cells utilizing poly(glycerol)-silicate-derived softmatrices.48 The ability to sustain cell growth within the sol−gel-derived material is believed to be extremely valuable toallow screening for bacteriostatic agents, as loss of cell divisionpathways would make identification of antimicrobial actiondifficult to assess. In addition, cell growth can support long-term and more complicated cellular responses (e.g., signaltransduction and specific gene expression). Further studies oncell division within various sol−gel-derived materials as
monoliths or at the microscale level are needed to betterunderstand the relationship between cell division and themechanical properties of the materials.
Quantitative Sensing. For biosensing applications, it isessential to obtain quantitative data that reflect the amount ofanalyte presented in a sample. It is known that gene expressionfrom the araBAD promoter can be modulated over severalorders of magnitude by the concentration of arabinose in thegrowth medium.52 To demonstrate that the reporter gene cellmicroarrays described herein could generate quantitativesignals, microarrays containing HB101 (pGLO) were preparedin individual microwells and exposed to media having a gradientof arabinose concentrations. After incubation, fluorescentimages were taken, and the fluorescence signals were averagedover 25 microarray elements. The results, shown in Figure 6,indicate that the cell microarrays produced a linear response toarabinose concentration over the range from 31 μM to 1 mM.These results suggest that the silica-based cell microarray can beused for quantitative, reporter-gene-based biosensing in a
Figure 5. Entrapped cells are viable and allow determination of biological function in monolithic silica gels supplemented with 32% glycerol. (A)OD600 growth curve of E. coli HB101 (transformed with pGLO) in a monolith and (inset) picture of a sol−gel monolith made of the same materialwith the same density of cells. (B) Fluorescence signals of HB101 (pGLO) culture in a monolith.
Figure 6. Fluorescence images of E. coli HB101 (pGLO) arrays, after incubation in LB with addition of arabinose at a series of concentrations, from31 μM to 1 mM. (B) Signal vs arabinose concentration. Note that background signals were not subtracted (background fluorescence wasundetectable).
Analytical Chemistry Article
dx.doi.org/10.1021/ac403220g | Anal. Chem. XXXX, XXX, XXX−XXXG
multiplexed manner and should also be amenable toquantitative high-throughput screening, where information oninhibitory concentrations is desired (e.g., minimum inhibitoryconcentrations or IC50 values).High Density Cell Microarrays. All arrays described above
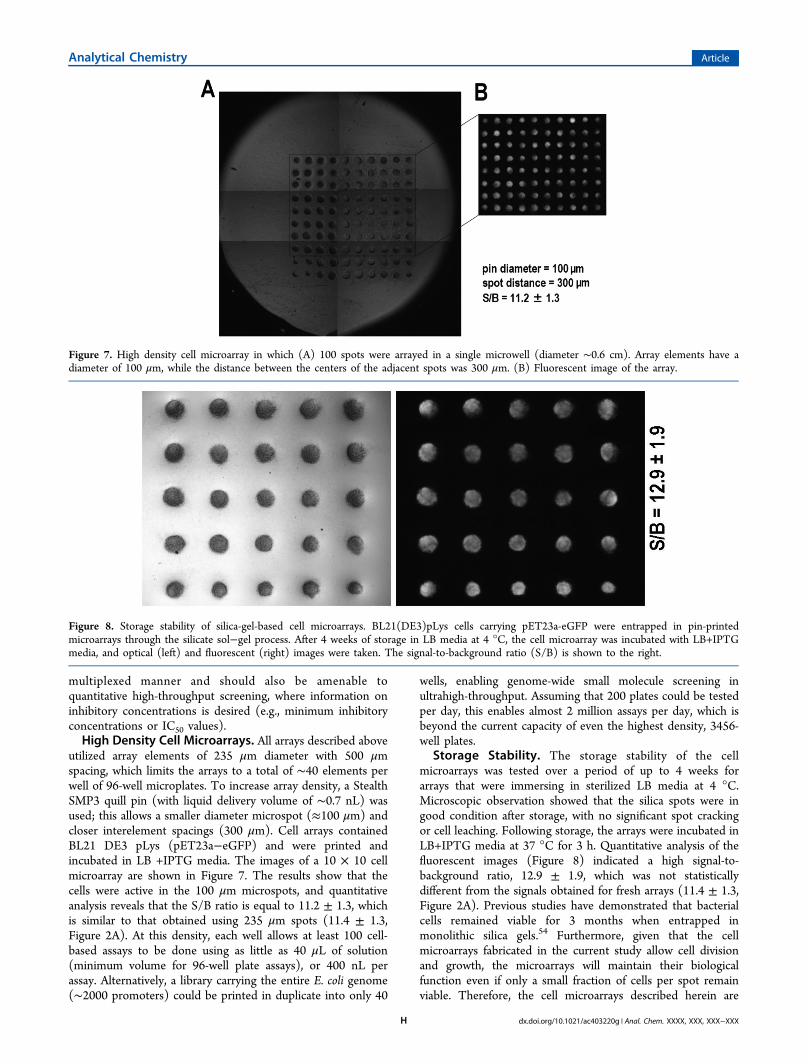
utilized array elements of 235 μm diameter with 500 μmspacing, which limits the arrays to a total of ∼40 elements perwell of 96-well microplates. To increase array density, a StealthSMP3 quill pin (with liquid delivery volume of ∼0.7 nL) wasused; this allows a smaller diameter microspot (≈100 μm) andcloser interelement spacings (300 μm). Cell arrays containedBL21 DE3 pLys (pET23a−eGFP) and were printed andincubated in LB +IPTG media. The images of a 10 × 10 cellmicroarray are shown in Figure 7. The results show that thecells were active in the 100 μm microspots, and quantitativeanalysis reveals that the S/B ratio is equal to 11.2 ± 1.3, whichis similar to that obtained using 235 μm spots (11.4 ± 1.3,Figure 2A). At this density, each well allows at least 100 cell-based assays to be done using as little as 40 μL of solution(minimum volume for 96-well plate assays), or 400 nL perassay. Alternatively, a library carrying the entire E. coli genome(∼2000 promoters) could be printed in duplicate into only 40
wells, enabling genome-wide small molecule screening inultrahigh-throughput. Assuming that 200 plates could be testedper day, this enables almost 2 million assays per day, which isbeyond the current capacity of even the highest density, 3456-well plates.
Storage Stability. The storage stability of the cellmicroarrays was tested over a period of up to 4 weeks forarrays that were immersing in sterilized LB media at 4 °C.Microscopic observation showed that the silica spots were ingood condition after storage, with no significant spot crackingor cell leaching. Following storage, the arrays were incubated inLB+IPTG media at 37 °C for 3 h. Quantitative analysis of thefluorescent images (Figure 8) indicated a high signal-to-background ratio, 12.9 ± 1.9, which was not statisticallydifferent from the signals obtained for fresh arrays (11.4 ± 1.3,Figure 2A). Previous studies have demonstrated that bacterialcells remained viable for 3 months when entrapped inmonolithic silica gels.54 Furthermore, given that the cellmicroarrays fabricated in the current study allow cell divisionand growth, the microarrays will maintain their biologicalfunction even if only a small fraction of cells per spot remainviable. Therefore, the cell microarrays described herein are
Figure 7. High density cell microarray in which (A) 100 spots were arrayed in a single microwell (diameter ∼0.6 cm). Array elements have adiameter of 100 μm, while the distance between the centers of the adjacent spots was 300 μm. (B) Fluorescent image of the array.
Figure 8. Storage stability of silica-gel-based cell microarrays. BL21(DE3)pLys cells carrying pET23a-eGFP were entrapped in pin-printedmicroarrays through the silicate sol−gel process. After 4 weeks of storage in LB media at 4 °C, the cell microarray was incubated with LB+IPTGmedia, and optical (left) and fluorescent (right) images were taken. The signal-to-background ratio (S/B) is shown to the right.
Analytical Chemistry Article
dx.doi.org/10.1021/ac403220g | Anal. Chem. XXXX, XXX, XXX−XXXH
expected to have a good shelf life, which allows transporting toend users or remote sites for analysis in the field.
■ CONCLUSIONSThis manuscript describes a simple method to fabricateversatile, three-dimensional reporter gene cell microarraysusing contact pin-printing of low density sol−gel-derived silica.Expression of reporter genes demonstrates that bacterial cellsremain viable and biologically functional when entrapped insilica materials containing high levels of glycerol (32%). Thecell-containing silica microspots can withstand prolongedincubation in complex culture media without cracking orsevere cell leaching. High signal levels were achieved (i.e., theS/B ratio was usually >10) which was 3 times higher than thevalue obtained from alginate-based cell arrays. The ability formultiplexed assays was demonstrated using microarrayscontaining two stains carrying different reporter genes underthe control of different promoter systems. The results showedthat the arrays selectively responded to the presence of inducersand repressors, suggesting that the cell microarray has thepotential for multiplexed HTS in a “many vs. many” format.The use of cell microarrays for quantitative analysis was alsodemonstrated. Finally, the cell microarrays were shown toremain stable for at least four weeks when stored in media,which may enable the use of such arrays for multiplexed sensingin the field. Further work remains to be done to fully evaluateand optimize the signaling and stability of these arrays. Inaddition, further studies are needed to expand the types of cellsused for microarray fabrication, extend the types of reportergenes and promoters used, and further explore the use of sucharrays for sensing and screening applications. The results ofthese studies will be reported in future manuscripts.
■ AUTHOR INFORMATIONCorresponding Authors*E-mail: [email protected] (J.D.B.). Tel.: (905) 525-9140, ext. 20682. Internet: brennanlab.mcmaster.ca.*E-mail: [email protected] (X.G.). Tel.: (951) 827-6229.Internet: engr.ucr.edu/gelab.NotesThe authors declare no competing financial interest.
■ ACKNOWLEDGMENTSThe authors thank the Ontario Centers of Excellence, theNatural Sciences and Engineering Research Council of Canada(NSERC) for provision of a Discovery Grant and a CREATEBiointerfaces Training Grant, the Canada Foundation forInnovation (CFI), and the Ontario Ministry of Research andInnovation for support of this work. J.D.B. holds the CanadaResearch Chair in Bioanalytical Chemistry and Biointerfaces.
■ REFERENCES(1) Sorensen, S. J.; Burmolle, M.; Hansen, L. H. Curr. Opin.Biotechnol. 2006, 17, 11.(2) Yagi, K. Appl. Microbiol. Biotechnol. 2007, 73, 1251.(3) Johnston, P. A. Drug Discovery Today 2002, 7, 353.(4) Gonzalez-Nicolini, V.; Fussenegger, M. Anti-Cancer Drugs 2005,16, 223.(5) Fan, F.; Wood, K. V. Assay Drug Dev. Technol. 2007, 5, 127.(6) Xu, C. W. Genome Res. 2002, 12, 482.(7) Papp, K.; Szittner, Z.; Prechl, J. Cell. Mol. Life Sci. 2012, 69, 2717.(8) Al-Khaldi, S. F.; Mossoba, M. M.; Burke, T. L.; Fry, F. S.Foodborne Pathog. Dis. 2009, 6, 1001.
(9) Angres, B. Exp. Rev. Molec. Diag. 2005, 5, 769.(10) Diaz-Mochon, J. J.; Tourniaire, G.; Bradley, M. Chem. Soc. Rev.2007, 36, 449.(11) Stone, J. D.; Demkowicz, W. E.; Stern, L. J. Proc. Natl. Acad. Sci.U.S.A. 2005, 102, 3744.(12) Lee, J. Y.; Shah, S. S.; Yan, J.; Howland, M. C.; Parikh, A. N.;Pan, T.; Revzin, A. Langmuir 2009, 25, 3880.(13) Petersen, S.; Loschonsky, S.; Prucker, O.; Ruhe, J.; Biesalski, M.Phys. Status Solidi A 2009, 206, 468.(14) Mei, Y.; Hollister-Lock, J.; Bogatyrev, S. R.; Seung-Woo, C.;Weir, G. C.; Langer, R.; Anderson, D. G. Biomaterials 2010, 31, 8989.(15) Kato, K.; Umezawa, K.; Funeriu, D. P.; Miyake, M.; Miyake, J.;Nagamune, T. Biotechniques 2003, 35, 1014.(16) Kato, K.; Umezawa, K.; Miyake, M.; Miyake, J.; Nagamune, T.Biotechniques 2004, 37, 444.(17) Ziauddin, J.; Sabatini, D. M. Nature 2001, 411, 107.(18) Fesenko, D. O.; Nasedkina, T. V.; Chudinov, A. V.;Prokopenko, D. V.; Yurasov, R. A.; Zasedatelev, A. S. Mol. Biol.2005, 39, 84.(19) Fesenko, D. O.; Nasedkina, T. V.; Prokopenko, D. V.;Mirzabekov, A. D. Biosens. Bioelectron. 2005, 20, 1860.(20) Fernandes, T. G.; Kwon, S.-J.; Lee, M.-Y.; Clark, D. S.; Cabral, J.M. S.; Dordick, J. S. Anal. Chem. 2008, 17, 6633−6639.(21) Fu, Y.; Xu, K. D.; Zheng, X. X.; Giacomin, A. J.; Mix, A. W.;Kao, W. Y. J. Biomaterials 2012, 33, 48.(22) Wang, Y. L.; Shah, P.; Phillips, C.; Sims, C. E.; Allbritton, N. L.Anal. Bioanal. Chem. 2012, 402, 1065.(23) Nikkhah, M.; Strobl, J. S.; Schmelz, E. M.; Roberts, P. C.; Zhou,H.; Agah, M. Biomaterials 2011, 32, 7625.(24) Melamed, S.; Ceriotti, L.; Weigel, W.; Rossi, F.; Colpo, P.;Belkin, S. Lab Chip 2011, 11, 139.(25) Avnir, D.; Coradin, T.; Lev, O.; Livage, J. J. Mater. Chem. 2006,16, 1013.(26) Monton, M. R. N.; Forsberg, E. M.; Brennan, J. D. Chem. Mater.2012, 24, 796.(27) Inama, L.; Dire, S.; Carturan, G.; Cavazza, A. J. Biotechnol. 1993,30, 197.(28) RiettiShati, M.; Ronen, D.; Mandelbaum, R. T. J. Sol−Gel Sci.Technol. 1996, 7, 77.(29) Nassif, N.; Bouvet, O.; Rager, M. N.; Roux, C.; Coradin, T.;Livage, J. Nat. Mater. 2002, 1, 42.(30) Premkumar, J. R.; Lev, O.; Rosen, R.; Belkin, S. Adv. Mater.2001, 13, 1773.(31) Premkumar, J. R.; Sagi, E.; Rozen, R.; Belkin, S.; Modestov, A.D.; Lev, O. Chem. Mater. 2002, 14, 2676.(32) Pressi, G.; Dal Toso, R.; Dal Monte, R.; Carturan, G. J. Sol−GelSci. Technol. 2003, 26, 1189.(33) Sicard, C.; Brayner, R.; Margueritat, J.; Hemadi, M.; Coute, A.;Yepremian, C.; Djediat, C.; Aubard, J.; Fievet, F.; Livage, J.; Coradin,T. J. Mater. Chem. 2010, 20, 9342.(34) Sicard, C.; Perullini, M.; Spedalieri, C.; Coradin, T.; Brayner, R.;Livage, J.; Jobbagy, M.; Bilmes, S. A. Chem. Mater. 2011, 23, 1374.(35) Muraca, M.; Vilei, M. T.; Zanusso, G. E.; Ferraresso, C.;Boninsegna, S.; Dal Monte, R.; Carraro, P.; Carturan, G. Artific. Organ.2002, 26, 664.(36) Pope, E. J. A.; Braun, K.; Peterson, C. M. J. Sol−Gel Sci. Technol.1997, 8, 635.(37) Peterson, K. P.; Peterson, C. M.; Pope, E. J. A. Proc. Soc. Exp.Biol. Med. 1998, 218, 365.(38) Catalano, P. N.; Bourguignon, N. S.; Alvarez, G. S.; Libertun, C.;Diaz, L. E.; Desimone, M. F.; Lux-Lantos, V. J. Mater. Chem. 2012, 22,11681.(39) Carturan, G.; Campostrini, R.; Dire, S.; Scardi, V.; Dealteriis, E.J. Mol. Catal. 1989, 57, L13.(40) Premkumar, J. R.; Rosen, R.; Belkin, S.; Lev, O. Anal. Chim. Acta2002, 462, 11.(41) Yu, D.; Volponi, J.; Chhabra, S.; Brinker, C. J.; Mulchandani, A.;Singh, A. K. Biosens. Bioelectron. 2005, 20, 1433.
Analytical Chemistry Article
dx.doi.org/10.1021/ac403220g | Anal. Chem. XXXX, XXX, XXX−XXXI
(42) Depagne, C.; Masse, S.; Link, T.; Coradin, T. J. Mater. Chem.2012, 22, 12457.(43) Harper, J. C.; Lopez, D. M.; Larkin, E. C.; Economides, M. K.;McIntyre, S. K.; Alam, T. M.; Tartis, M. S.; Werner-Washburne, M.;Brinker, C. J.; Brozik, S. M.; Wheeler, D. R. Chem. Mater. 2011, 23,2555.(44) Monton, M. R. N.; Lebert, J. M.; Little, J.; Nair, J. J.; McNulty,J.; Brennan, J. D. Anal. Chem. 2010, 82, 9365.(45) Ge, X.; Lebert, J. M.; Monton, M. R. N.; Lautens, L. L.;Brennan, J. D. Chem. Mater. 2011, 23, 3685.(46) Cho, E. J.; Tao, Z.; Tehan, E. C.; Bright, F. V. Anal. Chem. 2002,74, 6177.(47) Lee, M. Y.; Park, C. B.; Dordick, J. S.; Clark, D. S. Proc. Natl.Acad. Sci. U.S.A. 2005, 102, 983.(48) Kiley, P.; Zhao, X. J.; Vaughn, M.; Baldo, M. A.; Bruce, B. D.;Zhang, S. G. PLoS Biol. 2005, 3, 1180.(49) Boontheekul, T.; Kong, H. J.; Mooney, D. J. Biomaterials 2005,26, 2455.(50) Choi, J. K.; Lee, S. G.; Lee, J. Y.; Nam, H. Y.; Lee, W. K.; Lee, K.H.; Kim, H. J.; Lim, Y. J. Environ. Pathol. Toxicol. Oncol. 2005, 24, 163.(51) Guzman, L. M.; Belin, D.; Carson, M. J.; Beckwith, J. J. Bacteriol.1995, 177, 4121.(52) Siegele, D. A.; Hu, J. C. Proc. Natl. Acad. Sci. U.S.A. 1997, 94,8168.(53) Pan, S. H.; Malcolm, B. A. Biotechniques 2000, 29, 1234.(54) Nassif, N.; Roux, C.; Coradin, T.; Rager, M. N.; Bouvet, O. M.M.; Livage, J. J. Mater. Chem. 2003, 13, 203.(55) Eleftheriou, N. M.; Ge, X.; Kolesnik, J.; Falconer, S. B.; Harris,R. J.; Khursigara, C.; Brown, E. D.; Brennan, J. D. Chem. Mater. 2014,DOI: http://dx.doi.org/10.1021/cm403198z.
Analytical Chemistry Article
dx.doi.org/10.1021/ac403220g | Anal. Chem. XXXX, XXX, XXX−XXXJ