ethnomedicinal plants in kolli hills of eastern ghats in tamil ...
Upload
gujaratdesertecologyCategory
view
1download
0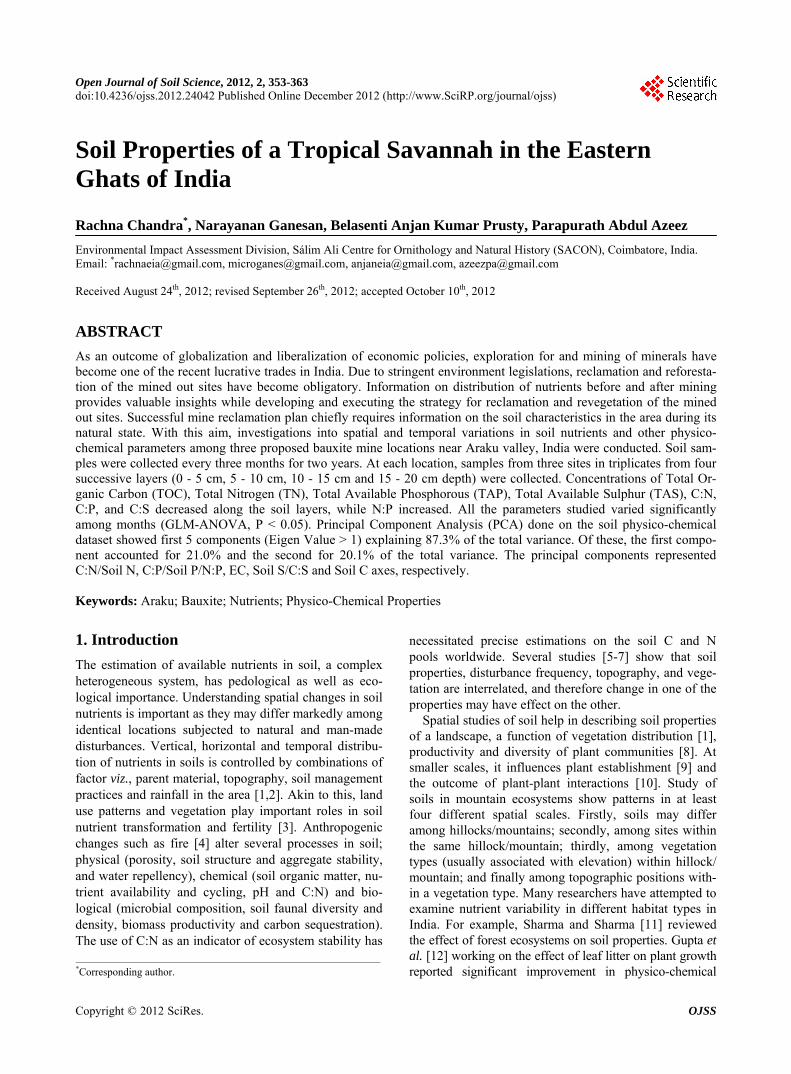
Open Journal of Soil Science, 2012, 2, 353-363 doi:10.4236/ojss.2012.24042 Published Online December 2012 (http://www.SciRP.org/journal/ojss)
353
Soil Properties of a Tropical Savannah in the Eastern Ghats of India
Rachna Chandra*, Narayanan Ganesan, Belasenti Anjan Kumar Prusty, Parapurath Abdul Azeez
Environmental Impact Assessment Division, Sálim Ali Centre for Ornithology and Natural History (SACON), Coimbatore, India. Email: *[email protected], [email protected], [email protected], [email protected] Received August 24th, 2012; revised September 26th, 2012; accepted October 10th, 2012
ABSTRACT
As an outcome of globalization and liberalization of economic policies, exploration for and mining of minerals have become one of the recent lucrative trades in India. Due to stringent environment legislations, reclamation and reforesta- tion of the mined out sites have become obligatory. Information on distribution of nutrients before and after mining provides valuable insights while developing and executing the strategy for reclamation and revegetation of the mined out sites. Successful mine reclamation plan chiefly requires information on the soil characteristics in the area during its natural state. With this aim, investigations into spatial and temporal variations in soil nutrients and other physico- chemical parameters among three proposed bauxite mine locations near Araku valley, India were conducted. Soil sam- ples were collected every three months for two years. At each location, samples from three sites in triplicates from four successive layers (0 - 5 cm, 5 - 10 cm, 10 - 15 cm and 15 - 20 cm depth) were collected. Concentrations of Total Or- ganic Carbon (TOC), Total Nitrogen (TN), Total Available Phosphorous (TAP), Total Available Sulphur (TAS), C:N, C:P, and C:S decreased along the soil layers, while N:P increased. All the parameters studied varied significantly among months (GLM-ANOVA, P < 0.05). Principal Component Analysis (PCA) done on the soil physico-chemical dataset showed first 5 components (Eigen Value > 1) explaining 87.3% of the total variance. Of these, the first compo- nent accounted for 21.0% and the second for 20.1% of the total variance. The principal components represented C:N/Soil N, C:P/Soil P/N:P, EC, Soil S/C:S and Soil C axes, respectively. Keywords: Araku; Bauxite; Nutrients; Physico-Chemical Properties
1. Introduction
The estimation of available nutrients in soil, a complex heterogeneous system, has pedological as well as eco- logical importance. Understanding spatial changes in soil nutrients is important as they may differ markedly among identical locations subjected to natural and man-made disturbances. Vertical, horizontal and temporal distribu- tion of nutrients in soils is controlled by combinations of factor viz., parent material, topography, soil management practices and rainfall in the area [1,2]. Akin to this, land use patterns and vegetation play important roles in soil nutrient transformation and fertility [3]. Anthropogenic changes such as fire [4] alter several processes in soil; physical (porosity, soil structure and aggregate stability, and water repellency), chemical (soil organic matter, nu- trient availability and cycling, pH and C:N) and bio- logical (microbial composition, soil faunal diversity and density, biomass productivity and carbon sequestration). The use of C:N as an indicator of ecosystem stability has
necessitated precise estimations on the soil C and N pools worldwide. Several studies [5-7] show that soil properties, disturbance frequency, topography, and vege- tation are interrelated, and therefore change in one of the properties may have effect on the other.
Spatial studies of soil help in describing soil properties of a landscape, a function of vegetation distribution [1], productivity and diversity of plant communities [8]. At smaller scales, it influences plant establishment [9] and the outcome of plant-plant interactions [10]. Study of soils in mountain ecosystems show patterns in at least four different spatial scales. Firstly, soils may differ among hillocks/mountains; secondly, among sites within the same hillock/mountain; thirdly, among vegetation types (usually associated with elevation) within hillock/ mountain; and finally among topographic positions with- in a vegetation type. Many researchers have attempted to examine nutrient variability in different habitat types in India. For example, Sharma and Sharma [11] reviewed the effect of forest ecosystems on soil properties. Gupta et al. [12] working on the effect of leaf litter on plant growth reported significant improvement in physico-chemical *Corresponding author.
Copyright © 2012 SciRes. OJSS

Soil Properties of a Tropical Savannah in the Eastern Ghats of India 354
parameters such as pH, EC, organic carbon and other major nutrients (N, P and K) in an amended mine spoil. Various forms of phosphorous and soil acidity under different land management systems in Meghalaya were examined by Majumdar et al. [13]. Prusty et al. [8] stud- ied the spatio-temporal distribution of nutrients in dif- ferent habitats in the Keoladeo National Park located in the semi-arid regions of Rajasthan.
Notable changes in soil properties can be seen in min- ing areas and assessing the distribution pattern of nutri- ents before and after mining would provide insights into the likely mobility and bioavailability of these nutrients. During literature review we did not come across any study which had carried out soil survey before the mining activities in India. Thus, the present investigation is an attempt to document nutrient distribution in soils on a spatio-temporal scale in proposed bauxite rich areas in a tropical savannah in the Eastern Ghats of India. The in- formation on soil nutrients would be valuable during the reclamation of the area. As mentioned earlier study of soils in mountain ecosystems can show patterns in at least four different spatial scales. The broad vegetation pattern in Araku is savannah type in all the three hil- locks/locations studied. Therefore, variations with respect to vegetation types and topographic positions during the present study were not attempted.
2. Materials and Methods
2.1. Site Description
The present study was undertaken at Araku, Andhra Pra- desh, bordering Orissa state in India. Araku has large scale bauxite deposits and three sampling locations viz., Raktakonda, Galikonda and Chittamgondi were selected for the present study (Figure 1). The area is a hilly ter- rain ranging in altitude from 1090 m to 1420 m above mean sea level. The hilltops are covered with lateritic bauxite capping [14]. The soil is fertile with humus on top [15], finely grained, non clayey and susceptible to erosion. Phoenix acaulis is the dominant plant species, interspersed with various grasses and herbaceous species and scattered trees, both on the slopes and hilltops [16, 17]. All the three mine sites at the hilltops have more or less similar vegetation. Moist mixed deciduous forest is found towards the lower slopes and in the valleys, while scrubs and dry savannah are seen at the hilltops [15]. The inhabitants generally light fire on the lower slopes during February and March for agricultural purposes (slash and burn cultivation, Podu cultivation). No agricultural ac- tivity is carried out on the hilltops. The Araku area ex- periences tropical and humid climate with annual tem- perature ranging from 10˚C to 37.8˚C. The annual rain- fall varies from 800 - 1000 mm in the plains to 1000 mm - 2000 mm in the hills.
Figure 1. Location map of study area.
Raktakonda and Galikonda are nearly 1.5 km apart ae- rially, while the third location, Chittamgondi is almost 7 km away from Raktakonda. According to Geological Sur- vey of India (GSI) and Mineral Exploration Corpora- tion Ltd. (MECL), the mineable bauxite reserve in Rak- takonda is 10.8 million tonnes [18], in Galikonda is 13.60 million tonnes [19], and in Chittamgondi is 24.57 million tonnes [20]. A blanket of laterite bauxite in vary- ing thickness occurs on the hill top at Galikonda. Bauxite here is reddish or brownish coloured and seen as moder- ately hard lenses and weathered patches. Bauxite is re- sidual in origin and is of quaternary age. The hilltop of Chittamgondi is covered with outcrops of laterite/bauxite capping. Gibbsite is the dominant aluminous mineral, haematite and goethite are iron ore minerals, and kaolo- nite is the clay mineral in all the three locations. In Rak- takonda and Galikonda alumina varies from 40% to 56%, silica 4%, iron oxides 7% - 28%, titanium 3% and alu- mina/silica module is more than 16%. In Chittamgondi alumina varies between 40% and 58%, silica < 4% and iron oxides 5% - 34% [21].
2.2. Soil Sampling, Processing and Analyses
Soil samples were collected on a quarterly basis (No- vember 2006, February 2007, May 2007, August 2007, November 2007, February 2008, May 2008 and August 2008) from three sampling locations discussed above namely Raktakonda (sites; R1, R2 and R3), Galikonda (sites; G1, G2 and G3) and Chittamgondi (sites; C1, C2
Copyright © 2012 SciRes. OJSS
Soil Properties of a Tropical Savannah in the Eastern Ghats of India 355
and C3). At each site, soil samples were collected in trip- licates from four successive layers, (0 - 5 cm, 5 - 10 cm, 10 - 15 cm and 15 - 20 cm depth) using a plastic scoop [16]. In total, 864 samples (9 sites × 3 replicates × 4 lay- ers × 8 months) were collected during the survey. The samples were packed in pre-cleaned air tight plastic bags, labeled and transferred to the laboratory for further pro- cessing and characterization. In laboratory samples were spread over a plastic tray for colour matching with Mun- sell soil colour chart, and the colour codes and notations were recorded. The samples were air-dried and homoge- nized following Jackson [22], sieved using 2 mm mesh [23], and stored in pre-cleaned plastic containers [24,25] till further analyses. A portion of the air dried sample was hand crushed and analysed for the soil texture and grain size (sand, slit and clay) after sieving through a series of standard sieves of different mesh sizes using a mechanical sieve shaker and the fractions were reported on percentage basis [25]. The portion of the sample meant for chemical characterization was analyzed for the pH, electrical conductivity (EC, mS/cm), total organic carbon (TOC, %), total nitrogen (TN, %), total available phos- phorous (TAP, mg/kg), and total available sulphur (TAS, mg/kg).
The pH and EC were analyzed in soil water extracts (1:5 w/v) using digital electrodes. TOC (%) was esti- mated following the modified chromic acid wet digestion method of Walkley and Black [26], wherein the organic matter is oxidized with a mixture of potassium dichro- mate (K2Cr2O7) and concentrated sulphuric acid (H2SO4), utilizing the heat of dilution of the acid to accelerate the process. The unspent potassium dichromate was back titrated against ferrous sulphate (FeSO4.7H2O) solution. TN (%), TAP (mg/kg) and TAS (mg/kg) were estimated spectrophotometrically using Perkin Elmer Spectropho- tometer (model Lambda 35). TN was determined fol- lowing persulphate oxidation method of Raveh and Av- nimelech [27] coupled with indophenol blue method of Kaplan [28]. TAP was determined by extracting with am- monium fluoride extracting solution as per Bray and Kurtz [29]. TAS was determined turbidimetrically fol- lowing SubbaRao and SammiReddy [30]. The soil was extracted with 0.15% CaCl2 and turbidity was developed using barium chloride. The concentrations of nitrogen, phosphorous and sulphur in the samples were determined using linear regressions (with zero intercept). The nutria- ent ratios, C:N, C:P, C:S and N:P, were estimated em- pirically. All the chemicals used in the study were of AR grade and the reagents were prepared in double distilled water (prepared using quartz double distillation assem- bly). Highest and lowest values represented in the result section are directly from 864 samples analysed. However, values represented in Table 3 are average for each vari- able for each attribute.
2.3. Data Analyses
To find the range, distribution and associations of differ- ent parameters, basic descriptive statistics was performed on the analytical data using SPSS 10.0 [31]. Univariate test to assess variations in the level of these parameters among the seasons, locations, sites and the layers was performed adopting the General Linear Model (GLM- ANOVA). Significant differences of all measurements were subjected to One-way ANOVA, followed by test of Least Significant Difference (LSD) as a post-hoc analysis. The relationships among the soil chemical properties were analyzed by Principal Component Analysis (PCA) using orthotran/varimax rotation in SPSS “FACTOR”. The factors were retained in the analysis based on the criterion that each retained factor had an Eigen value >1. A test of correlation (two-tail) was also performed among the nutrient elements and their respective ratios using the software MEGASTAT [32]. All differences reported in the text are significant at 5% alpha level.
3. Results
3.1. Physico-Chemical Properties
Overall, the soil was very dark brown in colour and with low chroma. In Raktakonda and Galikonda, soil colour varied from very dark brown to black, and in Chittam- gondi from dark reddish brown to very dark brown. Hue of soil at all the three locations was yellowish red with few exceptions at Chittamgondi where it was red (Table 1). Soil was moderately textured (sandy loam), and was rocky and red ferruginous in nature. Particle size was in the order sand > silt > clay (Table 2). The highest and lowest pH at Raktakonda was 6.4 and 4.2, at Galikonda 5.9 and 4.7, and at Chittamgondi 6.4 and 5.1, respec- tively. Electrical conductivity was found highest at Rak- takonda (75 µS/cm) and lowest (10.4 µS/cm) at Galik- onda. The pH varied significantly among the months, locations, sites and layers and EC among the months, locations and layers (GLM-ANOVA, P < 0.05). Further post-hoc analysis (LSD, Table 3, P < 0.05) revealed that the pH in November 2006, August 2007 and November 2007 differed significantly from each other and other months. Similarly, EC in February 2008 was significant- ly distinct from that in all other months. The pH and EC at Chittamgondi varied significantly from that at Rakta-konda and Galikonda. TOC at Raktakonda ranged be-tween 1.87% and 4.0%, while at Galikonda, between 2.33% and 4.19% and at Chittamgondi between 0.66% and 3.7%. TOC varied significantly among months, loca- tions, sites and layers (GLM-ANOVA, P < 0.05). The post-hoc analysis showed TOC concentrations of all lo- cations to be significantly varying among each other. Overall, TOC showed a decreasing trend along the soil layers.
Copyright © 2012 SciRes. OJSS

Soil Properties of a Tropical Savannah in the Eastern Ghats of India
Copyright © 2012 SciRes. OJSS
356
Table 1. Colour codes and notations of the soil layers.
Location Layer (cm) Colour codes Colour notation
0 - 5 7.5YR 2.5/1-2.5/2 Black-Very dark brown
5 - 10 10YR 2/2 Very dark brown
10 - 15 7.5YR 2.5/2 Very dark brown Raktakonda
15 - 20 7.5YR 2.5/3-10YR 3/2 Very dark brown-Very dark grayish brown
0 - 5 10YR 2/1-2/2 Black-Very dark brown
5 - 10 10YR 2/1-2/2 Black-Very dark brown
10 - 15 10YR 2/2-3/2 Very dark brown-Very dark grayish brown Galikonda
15 - 20 10YR 2/2-3/1 Very dark brown-Very dark gray
0 - 5 5YR 2.5/2 10YR 2/2 Dark reddish brown—Very dark brown
5 - 10 5YR 2.5/2 10YR 2/2 Dark reddish brown—Very dark brown
10 - 15 7.5YR 2.5/2 10YR 2/2 Very dark brown Chittamgondi
15 - 20 7.5YR 2.5/2 10YR 2/2 Very dark brown
Table 2. Soil texture along the layers in the proposed mine locations at Araku.
Location Layer (cm) Sand (%) Silt (%) Clay (%)
0 - 5 95.2 3.1 1.5
5 - 10 93.8 4.1 1.9
10 - 15 91.3 4.9 3.6 Raktakonda
15 - 20 89.7 5.3 4.7
0 - 5 94.8 3.1 1.8
5 - 10 93.5 3.9 2.3
10 - 15 90.1 5.4 4.3 Galikonda
15 - 20 90.4 4.8 4.5
0 - 5 92.3 5.3 2.1
5 - 10 91.7 6 2.1
10 - 15 92.1 5.6 2.1 Chittamgondi
15 - 20 91.4 5 3.2
3.2. Soil Nutrients
TN at Raktakonda was between 0.05% and 3.3%, at Galikonda between 0.04% and 1.7% and at Chittamgondi between 0.01% and 1.8%. Significant variation of TN was observed among months, locations and sites (GLM- ANOVA, P < 0.05). TN values in November 2006 and August 2008 were significantly different from each other and from rest of the months (LSD, P < 0.05). TN level at Chittamgondi was distinct from other two locations. TAP ranged between 0.04 mg/kg and 7.0 mg/kg. In general, TAP decreased along the depth of the profile at all the locations, except for few sites at Raktakonda. TAP con- centrations varied significantly among months, loca- tions, sites and layers (GLM-ANOVA, P < 0.05). TAP
concentration in November 2006, February 2008, May 2008 and August 2008 were distinct from each other and from rest of the months (LSD, P < 0.05). Of the three locations, Galikonda was significantly distinct from oth- ers with respect to TAP levels. However, in each of the locations, no significant variation in TAP levels was ob- served among sites. TAP content in the upper two layers (0 - 5 cm and the 5 - 10 cm) differed from each other as well as from rest of the layers. At Raktakonda, the TAS ranged between 0.7 mg/kg and 57.4 mg/kg, at Galikonda between 0.9 mg/kg and 174.3 mg/kg, and at Chittam- gondi between 2.5 mg/kg and 52.5 mg/kg. TAS was high in 0 - 5 cm layer and low in 15 - 20 cm and varied sig- nificantly among locations (LSD, P < 0.05).
3.3. Elemental Ratios
At Raktakonda C:N was between 0.86 and 47.2, at Galikonda between 2.2 and 68.1 and at Chittamgondi between 1.1 and 71.9. The C:N varied significantly among the months, locations and layers (GLM-ANOVA, P < 0.05) and the post-hoc analysis (LSD, P < 0.05) showed C:N in August 2008 to be distinct from other months. Among locations, the C:N at Chittamgondi was distinct and differed significantly from others. Among layers, the 15 - 20 cm layer was distinct from rest others with re- spect to C:N. C:P ranged between 2908 and 404752 at Raktakonda, 7292 and 649,691 at Galikonda, and 3260 and 313,538 at Chittamgondi and varied significantly only among the months (GLM-ANOVA, P < 0.05). The post-hoc analysis showed (LSD, P < 0.05) C:P in May 2008 to be distinct from all other months.
At Raktakonda C:S ranged between 389 and 35,487, at Galikonda between 197 and 34,063, and at Chittamgondi

Soil Properties of a Tropical Savannah in the Eastern Ghats of India 357
Table 3. Physico-chemical properties (means, n = 3) of the soil in three bauxite rich locations in the Eastern Ghats.
Parameters Attributes 1 2 3 4 5 6 7 8 9
Month 5.8a 5.5b 5.5b 5.2c 5.3d 5.4b 5.6b 5.5b
Location 5.4a 5.4a 5.7b
Site 5.4a 5.5a 5.3a 5.3a 5.4a 5.5a 6.1b 5.5a 5.5 apH
Layer 5.6a 5.5b 5.5b 5.4c
Month 38a 38a 29a 20a 19 42b 27a 29 a
Location 29a 29a 32b EC (mS/cm)
Layer 38a 29b 25c 28b
Month 3.0a 3.0a 2.6a 2.5a 2.6a 2.6a 2.4a 2.3b
Location 2.6a 3.1b 2.2c
Site 2.8a 2.3b 2.7c 3.1c 3.0c 3.1c 1.6d 2.6c 2.4eTOC (%)
Layer 2.6a 2.5a 2.5a 2.9b
Month 0.6a 1.1b 1.1b 0.3b 0.2b 0.2b 0.2b 0.1c
Location 0.5a 0.5a 0.4b TN (%)
Site 0.6a 0.5b 0.5b 0.5b 0.5b 0.5b 0.4b 0.4b 0.5b
Month 1.9a 1.7b 1.5b 1.4b 1.4b 0.8c 0.5d 1.2e
Location 1.3a 1.1b 1.5a TAP (mg/kg)
Layer 2.1 a 1.2b 1.0c 0.9c
TAS (mg/kg) Location 21.0a 22.0a 18.0b
Month 17.9a 6.8a 2.6a 11.2a 16.4a 22.3a 18.8a 40.7b
Location 14.4a 15.9a 21.0b C:N
Layer 14.9a 14.1a 15.1a 24.3b
C:P Month 24,650a 27,992a 25,574a 34,797a 37,686a 129,475a 666,535b 104,888a
C:S Month 2660a 8508b 3405a 4208a 1380a 1645 a 4910a 2128a
Month 4640a 10165a 10207a 3956a 3135a 8311a 39,487b 6833a N:P
Layer 3029a 10,464b 16,662b 13,212b
Source of variation: season (1, Nov 2006; 2, Feb 2007; 3, May 2007; 4, Aug 2007; 5, Nov 2007; 6,Feb 2008; 7, May 2008; 8, Aug 2008); location (1, Rakta-konda; 2, Galikonda; 3, Chittamgondi); Site (1, R1; 2, R2; 3, R3; 4, G1; 5, G2; 6, G3; 7, C1; 8, C2; 9, C3); and depth (1, 0 - 5 cm; 2, 5 - 10 cm; 3, 10 - 15 cm; 4, 15 - 20 cm). Within rows, means followed by the same letter are not significantly different at P = 0.05.
between 277 and 11,063, and varied significantly among months (GLM-ANOVA, P < 0.05). February 2007 was different and distinct from all other seasons (LSD, P < 0.05) with respect to C:S. At Raktakonda N:P was be- tween 150.3 and 28,614, at Galikonda between 147 and 53,626, and at Chittamgondi between 86 and 43,233, and the ratio in May 2008 was distinct from the other months and the 0 - 5 cm layer was distinct from the rest all layers (LSD, P < 0.05). pH was positively correlated (2-tail test, P < 0.05) with EC and TAP, and negatively with TOC. Electrical conductivity was positively correlated with TOC, TN and TAP. TOC was correlated with TN and
TAS. TN was positively correlated with TAP, and TAP was positively correlated with TAS (Table 4). Principal Component Analysis (PCA) performed to examine the pattern of variations in the data sets resulted in 5 compo- nents, which explained 87.3% of the total variance (Ta- ble 5). Of these, the first PC (PC1) accounted for 21.0% of the total variance in soil characteristics among sam- ples, reflecting the influence of the variables such as C:N and nitrogen. PC2 accounted for 20.1% of the total vari- ance and reflected the influence of the C:P, P and N:P. The influence of EC was reflected by PC3, which ac- counted for 19.1% of the total variance. PC4 accounting
Copyright © 2012 SciRes. OJSS

Soil Properties of a Tropical Savannah in the Eastern Ghats of India 358
Table 4. Correlation matrix of select parameters in the soil system of Eastern Ghats.
Variables pH EC TOC TN TAP TAS C:N C:P C:S N:P
pH 1
EC 0.256 1
TOC −0.226 0.129 1
TN NS 0.153 0.245 1
TAP 0.258 0.278 NS 0.166 1
TAS NS NS 0.119 NS 0.085 1
C:N NS NS NS −0.317 NS NS 1
C:P NS −0.071 NS −0.077 −0.158 NS NS 1
C:S NS NS NS NS NS −0.175 NS NS 1
N:P NS NS NS NS −0.191 NS NS 0.890 NS 1
864 Sample size, ± 0.067 critical value for R at P < 0.05 (two-tail), NS: Not Significant at P < 0.05.
Table 5. PCA of soil variables from all the three locations—Factor loadings.
Principal Components Parameters
PC1 (C:N, Soil N) PC2 (C:P, Soil P, N:P) PC3 (EC) PC4 (Soil S, C:S) PC5 (Soil C)
pH 0.080 −0.133 0.424 0.021 −0.638
EC 0.068 −0.101 0.958 0.014 0.059
TOC 0.123 0.113 0.167 0.062 0.874
TN 0.939 −0.109 0.124 0.043 0.133
TAP 0.143 −0.854 0.210 -0.036 −0.005
TAS 0.035 −0.045 0.044 -0.908 0.188
C: N −0.972 0.076 −0.027 0.007 0.080
C: P −0.107 0.928 −0.080 0.082 0.212
C: S 0.090 0.085 0.031 0.872 0.279
N: P 0.644 0.727 −0.044 0.068 0.111
Total loading* 2.313 2.211 2.098 1.606 1.374
% Variance explained 21.027 20.102 19.076 14.598 12.491
Extraction Method: Principal Component Analysis, Rotation Method: Varimax with Kaiser normalization (Rotation converged in 5 iterations), *Sums of squared loadings
for 14.6% of the variance indicated the influence of soil sulphur and carbon to elemental ratio (C:S), while PC5 accounted for 12.5% of the variance indicating the influ- ence of soil carbon. From these results it was concluded that the most important factors governing variation in soil composition are C:N/Soil N, C:P/Soil P/N:P, EC, Soil S/C:S and Soil C, respectively.
4. Discussion
4.1. Physico-Chemical Properties
Study of soil properties in natural and man-made ecosys- tems is important in developing appropriate ecologically sustainable management plans [9,33,34]. Variation in the diversity of plants, which happens through succession, to
Copyright © 2012 SciRes. OJSS

Soil Properties of a Tropical Savannah in the Eastern Ghats of India 359
an extent, causes the heterogeneity of belowground soil nutrient environment. Fitcher et al. [35] studied the che- mistry and the quantitative mineralogy of clay, silt and sand fraction of two acid forest soils from the Strengbach catchment (Vosges Mountain, France). The land use pat- tern and/or type have significant influence on the distri- bution of different particle size fractions in the soil; as the slopes become gentler, higher quantities of finer par- ticles get deposited at the bottom; a universal situation and Araku soils are not exceptions. Being a proposed bauxite mine area, it is expected to have good concentra- tion of Fe. Thus, red and brown soil colours are attribute- able to the Fe compounds resulting from the formation of secondary Fe oxides. This finding is supported by a sim- ilar finding by Hausenbuiller [36] who reported that pro- nounced red and yellow colours are due to mineral sub- stances that have undergone extensive weathering. In the case of Raktakonda and Galikonda, the samples were col- lected from lands which were relatively less frequented by the people residing in the valleys. On the other hand, site C1 was a pathway for human beings and cattle to reach the hilltop/plateau, thus, relatively disturbed when compared to other sites. Hence, the soil at C1 site was relatively reddish in colour. The organic matter accumu- lating under grassland vegetation is darkest. The C1 site at Chittamgondi did not support much vegetation growth and the absence of vegetation could be attributed to such colour differences among the sites.
The study of soil pH is important since it controls the base status and microbial activities [37]. The acidic na- ture of soils as observed presently could also be a pro- perty inherited directly from the parent material. At low pH, acidity can directly inhibit plant growth and make most of the elements including toxic metals in soil bio- available and induce production of toxic soluble-alu- minium in the soil-water solution. In general, all forms of acidity fall after fire. The acidity again starts increasing because of the regeneration of organic matter in the soil and increase in exchangeable Al3+ level. Exchangeable bases in soil decrease during cultivation because of re- moval of weeds/plants, leaching and erosion losses from the soil. As organic matter is a major contributor of pH dependent acidity in the soils, it may decrease after fire due to the burning of organic matter in the soil [3].
A good population of indigenous people depends on the tropical savannah of Araku, especially on the forest products for their livelihood. They cut trees regularly and burn the vegetation as part of their regular cultivation practices on the lower slopes. Although agricultural prac- tices were not followed on the hilltops, the area from where the samples were collected, we recorded forest fires every year during February-March. Thus, the lower TOC values in certain months might be associated with the regular burning of vegetation in the area. Rainfall
seasonality strongly influences carbon and nutrient fluxes from vegetation to soil, concentrating these fluxes at the onset of the dry season. Such changes would affect the nutrient cycling pattern and in turn change the equilib- rium between production of biomass, accumulation of or- ganic matter and decomposition, and absorption of min- erals [38]. Organic matter is a primary source of or- ganic carbon in the soil and gets accumulated in the top- soil [39]. TOC content is supposed to be higher on slopes with lower steepness. Higher accumulation of organic matter in flatter areas could be attributable to the almost negligible loss of nutrients in these areas. Generally, nu- trient loss is minimal on gentle slopes than on steep slopes as was observed in the study area. High TOC was observed in the top layer of the hillocks which might be attributed to low angle of slope of the hillocks, as was observed during sample collection. Slope angle details were not accounted for in this study, which would have given a better idea about nutrient mobility in soil. The higher concentrations of TOC in the upper layers of the soil were due to the continuous growth and decay of grasses, which are great accumulators of TOC. TOC concentrations were significantly distinct among all loca- tions. In the case of sites, TOC values at R1, R2, C1 and C3 were distinct from each other (LSD, P < 0.05, Table 3), which could be attributed to the varying degrees of slopes on the sites.
The nutrients are largely interlinked and influenced by other physico-chemical characters of the soil, depending on seasonal changes [40]. Yankelevich et al. [34] pre- dicted that if each tree species generates a particular soil environment under its canopy, then under a diverse tree community, soil chemical properties will be spatially very heterogeneous. This should be true for the top soil in particular, because in terms of nutrient availability and cycling, surface soil seems to be where most plant-soil biochemical interactions occur in forests [41,42]. Soil nitrogen content is an important environmental factor that affects the rate of nutrient uptake by plants. For that matter, the higher concentration of nitrogen in the upper layer of soils may be due to the presence of immobilized nitrogen in the detritus on the soil surface [38,43], which is prone to microbial decomposition in soils in the sub- sequent layers [44,45]. TN levels in soils depend on the organic matter build up in different systems, supported by the significant positive correlation between TN and TOC in Araku soils. Although volatilization due to forest fires is likely to remove nutrients from a system, it can also convert them to a more available form. For example, nitrogen is often converted to the more available form ammonium during volatilization. Thus, even though the total amount of nitrogen at a site decreases, the amount of nitrogen available for plant uptake does not necessarily decrease. It may actually increase or decrease, depending
Copyright © 2012 SciRes. OJSS

Soil Properties of a Tropical Savannah in the Eastern Ghats of India 360
on other environmental factors. Volatilization, a temper- ature dependant process, most commonly affects nitrogen and to a lesser extent sulphur, phosphorous and carbon, which in the present case seems to be chiefly due to fre- quent man made forest fires.
TAP, irrespective of the sites, showed a general de- creasing trend across the soil layers. It is important to note that soils high in organic matter generally exhibit relatively low levels of phosphorus [11]. Phosphates do not normally stay for very long in soils and are readily absorbed by plants [39]. Distribution and forms of phos- phorous in soils help in evaluating the phosphorous status and degree of chemical weathering of the soils [13, 46]. Phosphorous availability and soil acidity are closely related and different phosphorous fractions in soils de- pend on the magnitude and proportion of different forms of soil acidity. An increase in TAP (in various forms) after burning might be due to fast mineralization of or- ganic phosphorous present in plant biomass and quick release to inorganic forms and its higher solubility. These observations are in concordance with the findings of Ramakrishnan and Toky [47]. Forest soils normally con- tain organic and inorganic forms of phosphorous, most of which are unavailable to the plants. Venkatachalam et al. [48] reported that the dominance of unavailable form of iron and aluminium phosphates is a characteristic feature of acidic soil. This could be the reason for lower avail- able phosphorous content when compared to other nutria- ents observed in the study area. This is further confirmed by relatively high concentration of organic carbon in the soils of Araku. The positive correlation of TAP with pH is in concordance with the findings of Majumdar et al. [13].
TAS concentrations varied significantly among loca- tions. The significant difference in TAS concentrations at Chittamgondi could be due to location specific condi- tions. The higher values of TAS along with soil organic matter (SOM) in the upper soil layer and its subsequent decline in the next layer in Chittamgondi indicates that N and S are largely associated with SOM, which disap- pears relatively fast through rapid decomposition [49] mediated by microbes [50,51] and abiotic processes [52].
4.2. Elemental Ratios
Different nutrient ratios showed high variability among the months, locations and layers (GLM-ANOVA, P < 0.05). Most of the ratios followed the same pattern as that of nutrients. The nutrient ratios C:P and C:S exhib- ited a gradual decline with depth. Srivastava and Singh [53] also reported similar decline in the ratio along the depth. Vejre et al. [54] reported such narrowing of the nutrient ratios downward in the soil layers as a result of the decomposition stage and age of the horizons. C:N during August 2008 was different from other months due
to enhanced growth of vegetation after rain during the month of August. An average C:N > 20, as observed in certain months, indicates slow decomposition with lower mobilization of N [8].
Forest-fires increase TAP levels in soils as discussed above. The significant difference in C:P during May 2008 from all other months could be due to man-made fires on hilltops during February and March. The statistical cor- relations among the nutrient elements and their respec-tive ratios indicate TOC and TN to be important for bio- geochemical processes in the soil. The positive corre- lation of TOC, TN, and TAS indicate the availability of recently shed plant litter, with high elemental ratios. TOC plays an important role in biochemical processes determining nutrient levels [55]. The five PCs identified in the dataset correspond to 1) C:N and Soil N, 2) C:P, Soil P and N:P, 3) EC, iv) Soil S and C:S, and v) Soil C, respectively. PC1 thus suggests the role of TOC and TN to be very crucial in soil biogeochemical processes and their direct dependence on each other. In general, varia- tions of the nutrients and their respective ratios were sig-nificantly different among months, considering the entire period of study. The nutrient ratios were not significantly different among sites. This is attributed to the presence of some common plant species seen at all sites and also the similarity of the chief sources of these nutrient elements.
5. Conclusion
Almost all of the nutrients had wide spatial variability owing to the type of land use in the area, topography, parent material and the vegetation composition. Irrespec- tive of the location, site and seasons, most of the nutria- ents were higher in concentrations in the upper soil layer. Increase in TOC resulted in high TN concentrations thus, proving it important in soil biogeochemical processes. The lower values for TAP revealed that soils of Araku have relatively high TOC concentrations. The accumula- tion of nutrients is a reflection of biomass of different plant species in the stand with their respective composi- tion of nutrients. Loss of aboveground biomass through harvesting or forest fires results in direct nutrient losses. Research shows that the distribution of plant roots along the soil depth influences nutrient input, its cycling and its mobilization in the soils. Thus, the quality and quantity of plant residues integrated in the soil determine the de- composition rate and plant uptake of nutrient. Seasonal man-made fires in hilltops are likely to lead to losses of nutrients and subsequent changes in nutrient concentra- tions. The degree of losses in labile soil C and N pools upon the conversion of the forest to agricultural land de- pends on the method deployed in removing the natural vegetation. Any land clearing method that does not re- move the top soil and retains some of the below-ground phyto-mass may be a sure way of reducing labile soil C
Copyright © 2012 SciRes. OJSS

Soil Properties of a Tropical Savannah in the Eastern Ghats of India 361
and N losses upon the transformation of a forest into ag- ricultural land. Research shows that the top layer of the soil should be kept intact and separate while mining so that it can be used for revegetation/soil reclamation. Thus, it is very important to stop/ban man-made forest fires on hilltops, which otherwise would lead soil infertile. An understanding about the organic matter decomposition in soils along the layers influenced by several factors and also the bioaccumulation of the nutrients in plant parts occurring in the area would help facilitate formulating long term post mining management strategies in savan- nah grasslands.
6. Acknowledgements
The authors thank the Council of Scientific and Industrial Research (CSIR), India for the financial support to Ms. Rachna Chandra for her Senior Research Fellowship (Grant No. −9/845 (0005)/2009-EMR-I). Thanks are due to Mr. Kaliraj and Mr. Somesh Kumar for their tradi- tional insights and for logistic support. We are indebted to Mr. D. K. Sinha and his team members, Jindal Steel Work (JSW) Limited, for their timely support. We also thank the local underprivileged people for their coopera- tion during the study period on their land.
REFERENCES [1] P. A. Agbu and K. R. Olson, “Spatial Variability of Soil
Properties in Selected Illinois Mollisols,” Soil Science Vol. 150, No. 5, 1990, pp. 777-786. doi:10.1097/00010694-199011000-00004
[2] G. Matschonat and R. Vogt, “Effects of Changes in pH, Ionic Strength, and Sulphate Concentration on the CEC of the Temperate Acid Forest,” European Journal of Soil Science, Vol. 48, No. 1, 1997, pp. 163-171. doi:10.1111/j.1365-2389.1997.tb00195.x
[3] K. Kumar, K. V. P. Rao and L. J. Singh, “Forms of Acid- ity in some Inceptisols under Different Land Use in Man- ipur,” Journal of the Indian Society of Soil Science, Vol. 43, No. 3, 1995, pp. 338-342.
[4] K. Paliwal and M. Sundaravalli, “Effect of Fire on Nutri- ent Dynamics in a Semi-Arid Grazing Land Ecosystem of Madurai,” Current Science, Vol. 83, No. 3, 2002, pp. 316- 318.
[5] M. H. Johnston, “Soil-Vegetation Relationships in a Tab- onuco Forest Community in the Luquillo Mountains of Puerto Rico,” Journal of Tropical Ecology, Vol. 8, No. 3, 1992, pp. 253-263. doi:10.1017/S0266467400006477
[6] W. L. Silver, F. N. Scatena, A. H. Johnston, T. G. Sic- cama and M. J. Sanchez, “Nutrient Availability in a Mont- ane Wet Tropical Forest: Spatial Patterns and Methodo- logical Considerations,” Plant Soil, Vol. 164, No. 1, 1994, pp. 129-145. doi:10.1007/BF00010118
[7] M. R. Willig, D. L. Moorhead, S. B. Cox and J. C. Zak, “Functional Diversity of Soil Bacterial Communities in the Tabonuco Forest: The Interaction of Anthropogenic
and Natural Disturbance,” Biotropica, Vol. 28, No. 4, 1996, pp. 471-483. doi:10.2307/2389089
[8] B. A. K. Prusty, R. Chandra and P. A. Azeez, “Distribu- tion of Carbon, Nitrogen, Phosphorus, and Sulphur in the Soil in a Multiple Habitat System in India,” Australian Journal of Soil Research, Vol. 47, No. 2, 2009, pp. 177- 189. doi:10.1071/SR08087
[9] F. T. Maestre and J. Cortina, “Spatial Patterns of Surface Soil Properties and Vegetation in a Mediterranean Semi- Arid Steppe,” Plant Soil, Vol. 241, No. 2, 2002, pp. 279- 291. doi:10.1023/A:1016172308462
[10] D. Robinson, A. Hodge, B. S. Griffiths and A. H. Fitter, “Plant Root Proliferation in Nitrogen-Rich Patches Con- fers Competitive Advantage,” Proceedings of the Royal Society of London. Series B. Biological Sciences, Vol. 266, No. 1418, 1999, pp. 431–435. doi:10.1098/rspb.1999.0656
[11] J. C. Sharma and Y. Sharma, “Effect of Forest Ecosys- tems on Soil Properties—A Review,” Agricultural Re- view, Vol. 25, No. 1, 2004, pp. 16-28.
[12] K. C. Gupta, N. K. Srivastava and R. S. Singh, “Effect of Leaf Litter on Plant Growth Behaviour of Four Species Raised on Mine Spoil,” Indian Journal of Forestry, Vol. 28, No. 4, 2005, pp. 353-358.
[13] B. Majumdar, M. S. Venkatesh and K. Kumar, “Forms of Phosphorous and Soil Acidity in Different Land Man- agement Systems of Meghalaya,” Indian Journal of For- estry, Vol. 30, No. 2, 2007, pp. 127-134.
[14] R. Chandra and P. A. Azeez, “Bioaccumulation of Metals in Different Parts of Weed Species at Proposed Bauxite Mine,” Advance Material Research, Vol. 71-73, 2009, pp. 609-612. doi:10.4028/www.scientific.net/AMR.71-73.609
[15] G. V. SubbaRao and G. R. Kumari, “Flora of Visakhapat- nam District Andhra Pradesh,” Botanical Survey of India, Kolkata, 2002.
[16] R. Chandra, B. A. K. Prusty, D. Mythily, S. R. Sarimol and P. A. Azeez, “Nutrients and Alkali Metal Distribution in the Top Soil of Bauxite Rich Hillocks in Araku Valley, Andhra Pradesh, India,” Environmental Science: An Indian Journal, Vol. 2, No. 3, 2007, pp. 145-153.
[17] P. A. Azeez, S. Bhupathy, R. Chandra and T. Selvakumar, “Study of Habitat and Development of Environment Man- agement Plan for Blewitti’s Owl in Araku, Andhra Pra- desh,” Andhra Pradesh Mineral Development Corporation (APMDC) Limited, Hyderabad, India by Sálim Ali Cen- tre for Ornithology and Natural History, Coimbatore, 2008.
[18] GEL, “Rapid Environmental Impact Assessment and En- vironmental Management Plan, Raktakonda Bauxite De- posit, Anantagiri/Paderu RF, Visakhapatnam District, An- dhra Pradesh,” Andhra Pradesh Mineral Development Cor- poration Limited, Secundrabad, India by Geo Experimen- tal Labs, Secundrabad, 2005.
[19] GEL, “Andhra Pradesh Mineral Development Corpora- tion Limited; Rapid Environmental Impact Assessment and Environmental Management Plan, Galikonda Bauxite Deposit, Anantagiri Mandal, Visakhapatnam District, Andhra Pradesh,” Andhra Pradesh Mineral Development
Copyright © 2012 SciRes. OJSS

Soil Properties of a Tropical Savannah in the Eastern Ghats of India 362
Corporation Limited, Secundrabad, India by Geo Expe- rimental Labs, Secundrabad, 2005.
[20] GEL, “Andhra Pradesh Mineral Development Corpora- tion Limited; Rapid Environmental Impact Assessment and Environmental Management Plan, Chittamgondi Baux- ite Deposit, Chittamgondi Village, Visakhapatnam Dis- trict, Andhra Pradesh,” Andhra Pradesh Mineral Devel- opment Corporation Limited, Secundrabad, India by Geo Experimental Labs, Secundrabad, 2005.
[21] ICFRE, “Environmental Impact Assessment with Detai- led Ecological and Socio-Economic Studies. Proposed Rakthakonda Bauxite Mines Vishakhapatnam,” Andhra Pradesh Mineral Development Corporation Limited by In- dian Council of Forestry Research and Education (ICFRE), Dehradun, 2007.
[22] M. L. Jackson, “Soil Chemical Analysis,” Constable & Co Ltd, London, 1958.
[23] H. L. S. Tandon, “Methods of Analysis of Soils, Plants, Waters and Fertilizers,” Fertilizer Development and Con- sultation Organization, New Delhi, 2001.
[24] D. P. H. Laxen and R. M. Harrison, “Cleaning Methods for Polythene Containers Prior to the Determination of Trace Metals in Fresh Water Samples,” Analytical Chem- istry, Vol. 53, No. 2, 1981, pp. 345-350. doi:10.1021/ac00225a051
[25] S. E. Allen, “Chemical Analysis of Ecological Materials,” Blackwell Scientific Publications, London, 1989.
[26] A. Walkey and I. A. Black, “An Examination of the Degljareff Method for Determining the Soil Organic Mat- ter and a Proposed Modification of the Chromic Acid Ti-tration Method,” Soil Science, Vol. 37, No. 1, 1934, pp. 29-38. doi:10.1097/00010694-193401000-00003
[27] A. Raveh and Y. Avnimelech, “Total Nitrogen Analysis in Water, Soil and Plant Material with Persulphate Oxida- tion,” Plant Research, Vol. 13, No. 9, 1979, pp. 911-912.
[28] A. Kaplan, “The Determination of Urea, Ammonia and Urease,” In: D. Glick, Ed., Methods of Biochemical Ana- lysis, John Wiley and Sons, New York, 1965, pp. 311- 321.
[29] R. H. Bray and L. T. Kurtz, “Determination of Total Or-ganic and Available Forms of Phosphorus,” Soil Science, Vol. 59, No. 1, 1945, pp. 39-46. doi:10.1097/00010694-194501000-00006
[30] A. SubbaRao and K. SammiReddy, “Analysis of Soils for pH, EC and Available Major Nutrients,” In: H. L. S. Tan- don, Ed., Methods of Analysis of Soils, Plants, Waters and Fertilizers, Fertilizer Development and Consultation Organization, New Delhi, 2005, pp. 21-59.
[31] M. J. Norušis, “SPSS/PC+ 4.0 Base Manual—Statistical Data Analysis,” SPSS Inc., Chicago, 1990.
[32] J. B. Orris, “MEGASTAT, Version 8.8,” 2000. http://www.mhhe.com/bstat
[33] C. H. Ettema and G. W. Yeates, “Nested Spatial Biodi- versity Patterns of Nematode Genera in a New Zealand Forest and Pasture Soil,” Soil Biology and Biochemistry, Vol. 35, No. 1, 2003, pp. 339-342. doi:10.1016/S0038-0717(02)00276-6
[34] S. N. Yankelevich, C. Fragoso, A. C. Newton, G. Russell
and O. W. Heal, “Spatial Patchiness of Litter, Nutrients and Macro Invertebrates during Secondary Succession in a Tropical Montane Forest in Mexico,” Plant Soil, Vol. 286, No. 1-2, 2006, pp. 123-139. doi:10.1007/s11104-006-9031-5
[35] J. Fitcher, M. Turpault, E. Dambrine and J. Ranger, “Lo- calization of Base Cations in Particle Size Fractions of Acid Forest Soils (Vosges mountains, N-E France),” Ge- oderma, Vol. 82, No. 4, 1998, pp. 295-314. doi:10.1016/S0016-7061(97)00106-7
[36] R. L. Hausenbuiller, “Soil Science Principles and Prac-tices,” WMC brown company publishers, IOWA, Wash-ington, 1978.
[37] W. R. Miller and R. L. Donahue, “Soils in Our Environ- ment,” Prentice-Hall of India Private Limited, New Delhi, 1997.
[38] R. L. Barbosa and P. M. Fearnside, “Carbon and Nutrient Flows in the Amazonian Forest: Fine Litter Production and Composition at Apiau, Roraima, Brazil,” Tropical Ecology, Vol. 37, No. 1, 1996, pp. 115-125.
[39] N. C. Brady, “The Nature and Properties of Soils,” Pen- tice Hall, Upper Saddle River, 1996.
[40] F. Hagedorn, S. Maurer, P. Egli, P. Blaser, J. B. Bucher and R. Siegwolf, “Carbon Sequestration in Forest Soils: Effect of Soil Type, Atmospheric CO2 Enrichment and N Deposition,” European Journal of Soil Science, Vol. 52, No. 4, 2001, pp. 619-628. doi:10.1046/j.1365-2389.2001.00412.x
[41] R. L. Hendrick and K. S. Pregitzer, “Temporal and Dep- th-Related Patterns of Fine Root Dynamics in Northern Hardwood Forest,” Journal of Ecology, Vol. 84, No. 2, 1996, pp. 167-176.
[42] B. A. K. Prusty, “Role of Detritus in Trace Metal Dyna- mics of a Wetland System: A Case Study of Keoladeo National Park, Bharatpur, India,” Report submitted to Council of Scientific and Industrial Research (CSIR), New Delhi, 2008.
[43] J. T. Kao, J. E. Titus and W. X. Zhu, “Differential Nitro- gen and Phosphorus Retention by Five Wetland Plant Species,” Wetlands, Vol. 23, No. 4, 2003, pp. 979-987. doi:10.1672/0277-5212(2003)023[0979:DNAPRB]2.0.CO;2
[44] A. Maharudrappa, C. A. Srinivasamurthy, M. S. Nagaraja, R. Siddaramappa and H. S. Anand, “Decomposition Rates of Litter and Nutrient Release Pattern in a Tropical Soil,” Journal of the Indian Society of Soil Science, Vol. 48, No. 1, 2000, pp. 92-97.
[45] B. A. K. Prusty, “Distribution of Select Nutrients and Metals in the Soils of a Wetland-Terrestrial Ecosystem Complex: a case study of Keoladeo National Park, Bhar- atpur, India,” Ph.D. Dissertation, Bharathiar University, Coimbatore, 2007.
[46] S. C. Chang and M. L. Jackson, “Soil Phosphorous Frac- tion in Some Representative Soils,” Journal of Soil Sci- ence, Vol. 9, No. 1, 1958, pp. 109-119. doi:10.1111/j.1365-2389.1958.tb01903.x
[47] P. S. Ramakrishnan and O. P. Toky, “Soil Nutrient Status of Hill Agro-Ecosystems and Recovery Pattern after Slash and Burn Agriculture (Jhum) in North-Eastern In-
Copyright © 2012 SciRes. OJSS

Soil Properties of a Tropical Savannah in the Eastern Ghats of India
Copyright © 2012 SciRes. OJSS
363
dia,” Plant Soil, Vol. 60, No. 1, 1981, pp. 41-64. doi:10.1007/BF02377111
[48] S. Venkatachalam, Kalaiselvi, K. S. Neelakantan and S. Gunasekaran, “A Comparative Study on Soil Microflora and Nutrient Status of Sholas and Adjoining Vegetation,” Indian Journal of Forestry, Vol. 30, No. 2, 2007, pp. 135- 140.
[49] A. P. Aluko, “Soil Properties and Nutrient Distribution in Terminalia superba Stands of Different Age Series Grown in Two Soil Types of Southwestern Nigeria,” For- est Ecology and Management, Vol. 58, No. 1-2, 1993, pp. 153-161. doi:10.1016/0378-1127(93)90137-C
[50] A. Arunachalam and K. Arunachalam, “Community Characteristics and Soil Biological Processes during Re- growth of Subtropical Forest Ecosystems,” Indian Jour- nal of Forestry, Vol. 28, No. 1, 2005, pp. 5-10.
[51] M. Hossain and S. Othman, “Degradation Rate of Leaf Litter of Bruguiera parviflora of Mangrove Forest of Kuala Selangor, Malaysia,” Indian Journal of Forestry, Vol. 28, No. 2, 2005, pp. 144-149.
[52] A. Vairavamurthy and S. Wang, “Organic Nitrogen in Geomacromolecules: Insights of Speciation and Trans- formation with K-Edge XANES Spectroscopy,” Envi-ronment, Science and Technology, Vol. 36, No. 14, 2002, pp. 3050-3056. doi:10.1021/es0155478
[53] R. Srivastava and K. P. Singh, “Variations in Soil Or- ganic Carbon and Storage due to Cultivation Practices in the Gangetic Plain, India,” International Journal of Eco- logy and Environmental Sciences, Vol. 28, 2002, pp. 193- 199.
[54] H. Vejre, I. Callesen, L. Vesterdal and K. Raulund-Ras- mussen, “Carbon and Nitrogen in Danish Forest Soils- Contents and Distributions Determined by Soil Order,” Soil Science Society of American Journal, Vol. 67, No. 1, 2003, pp. 335-343. doi:10.2136/sssaj2003.0335
[55] B. A. K. Prusty, R. Chandra and P. A. Azeez, “Macronu- trients along the Sediment Core in a Subtropical Mon- soonal Wetland in India,” Wetland Ecology and Man- agement, Vol. 18, No. 1, 2010, pp. 91-105. doi:10.1007/s11273-009-9151-9
Copyright © 2022 FDOKUMEN