Sociality as a natural mechanism of public goods provision
18
RESEARCH ARTICLE Sociality as a Natural Mechanism of Public Goods Provision Elliot T. Berkman 1 , Evgeniya Lukinova 2 *, Ivan Menshikov 3 , Mikhail Myagkov 2,4 1 Department of Psychology, University of Oregon, Eugene, Oregon, United States of America, 2 Skolkovo Institute of Science and Technology, Skolkovo, Russian Federation, 3 Department of Applied Mathematics and Management, Moscow Institute of Science and Technology, Dolgoprudny, Russia, 4 Department of Political Science, University of Oregon, Eugene, Oregon, United States of America * [email protected] Abstract In the recent literature, several hypotheses have been offered to explain patterns of human behavior in social environments. In particular, these patterns include ‘prosocial’ ones, such as fairness, cooperation, and collective good provision. Psychologists suggest that these prosocial behaviors are driven not by miscalculations, but by salience of social identity, in- group favoritism, emotion, or evolutionary adaptations. This paper imports psychology scholarship into an economic model and results in a sustainable solution to collective action problems without any external enforcement mechanisms. This natural mechanism of public goods provision is created, analyzed, and observed in a controlled laboratory environment using experimental techniques. Introduction People’s economic decisions are often embedded in a social context. To what extent does that context influence their decisions, if at all? Social factors such as group memberships and affilia- tion motives have powerful effects on a range of behaviors. These factors carry substantial deci- sion utility for people, but this “social utility” is rarely included in formal models of economic behavior. Here, we marry some of the rich models of social behavior taken from social psychol- ogy with decision modeling techniques from behavioral economics. Recent efforts to unite these two traditions have proven fruitful in delivering theoretical insights and model-based precisions for studying economic behavior in a realistic social context [1, 2]. Specifically, we use a classic “minimal group” paradigm from social psychology to induce a sense of social con- nectedness in our experimental subjects. It measures their degrees of utility conferred by their sociality which otherwise are found to not have economic utility. Classical economic theory has been strongly challenged by findings where economic players often do not reason by pure utility-maximization techniques. The critical breakdown point of eco- nomic models is in explaining behaviors that are altruistic or at least non-selfish. The fact that human behavior is not driven solely by economic considerations is not intuitively surprising. Few people believe their motives to be entirely economic. Acts of “irrational” generosity to others at one’s own cost are rewarded through non-economic means such as a subjective sense of satisfaction PLOS ONE | DOI:10.1371/journal.pone.0119685 March 19, 2015 1 / 18 OPEN ACCESS Citation: Berkman ET, Lukinova E, Menshikov I, Myagkov M (2015) Sociality as a Natural Mechanism of Public Goods Provision. PLoS ONE 10(3): e0119685. doi:10.1371/journal.pone.0119685 Academic Editor: Zhen Wang, Hong Kong Baptist University, CHINA Received: August 13, 2014 Accepted: January 8, 2015 Published: March 19, 2015 Copyright: © 2015 Berkman et al. This is an open access article distributed under the terms of the Creative Commons Attribution License, which permits unrestricted use, distribution, and reproduction in any medium, provided the original author and source are credited. Data Availability Statement: All Sociality Study files are available from Figshare via http://dx.doi.org/10. 6084/m9.figshare.1299951. Funding: The study was funded by Mikhail Myagkov through his personal research fund at Skolkovo Institute of Science and Technology. Mikhail Myagkov, as one of the co-authors of the manuscript took part in study design and decision to publish the manuscript. No external grants or funding sources were used. Competing Interests: The authors have declared that no competing interests exist.
Transcript of Sociality as a natural mechanism of public goods provision
RESEARCH ARTICLE
Sociality as a Natural Mechanism of PublicGoods ProvisionElliot T. Berkman1, Evgeniya Lukinova2*, Ivan Menshikov3, Mikhail Myagkov2,4
1 Department of Psychology, University of Oregon, Eugene, Oregon, United States of America, 2 SkolkovoInstitute of Science and Technology, Skolkovo, Russian Federation, 3 Department of Applied Mathematicsand Management, Moscow Institute of Science and Technology, Dolgoprudny, Russia, 4 Department ofPolitical Science, University of Oregon, Eugene, Oregon, United States of America
AbstractIn the recent literature, several hypotheses have been offered to explain patterns of human
behavior in social environments. In particular, these patterns include ‘prosocial’ ones, such
as fairness, cooperation, and collective good provision. Psychologists suggest that these
prosocial behaviors are driven not by miscalculations, but by salience of social identity, in-
group favoritism, emotion, or evolutionary adaptations. This paper imports psychology
scholarship into an economic model and results in a sustainable solution to collective action
problems without any external enforcement mechanisms. This natural mechanism of public
goods provision is created, analyzed, and observed in a controlled laboratory environment
using experimental techniques.
IntroductionPeople’s economic decisions are often embedded in a social context. To what extent does thatcontext influence their decisions, if at all? Social factors such as group memberships and affilia-tion motives have powerful effects on a range of behaviors. These factors carry substantial deci-sion utility for people, but this “social utility” is rarely included in formal models of economicbehavior. Here, we marry some of the rich models of social behavior taken from social psychol-ogy with decision modeling techniques from behavioral economics. Recent efforts to unitethese two traditions have proven fruitful in delivering theoretical insights and model-basedprecisions for studying economic behavior in a realistic social context [1, 2]. Specifically, weuse a classic “minimal group” paradigm from social psychology to induce a sense of social con-nectedness in our experimental subjects. It measures their degrees of utility conferred by theirsociality which otherwise are found to not have economic utility.
Classical economic theory has been strongly challenged by findings where economic playersoften do not reason by pure utility-maximization techniques. The critical breakdown point of eco-nomic models is in explaining behaviors that are altruistic or at least non-selfish. The fact thathuman behavior is not driven solely by economic considerations is not intuitively surprising. Fewpeople believe their motives to be entirely economic. Acts of “irrational” generosity to others atone’s own cost are rewarded through non-economic means such as a subjective sense of satisfaction
PLOSONE | DOI:10.1371/journal.pone.0119685 March 19, 2015 1 / 18
OPEN ACCESS
Citation: Berkman ET, Lukinova E, Menshikov I,Myagkov M (2015) Sociality as a Natural Mechanismof Public Goods Provision. PLoS ONE 10(3):e0119685. doi:10.1371/journal.pone.0119685
Academic Editor: Zhen Wang, Hong Kong BaptistUniversity, CHINA
Received: August 13, 2014
Accepted: January 8, 2015
Published: March 19, 2015
Copyright: © 2015 Berkman et al. This is an openaccess article distributed under the terms of theCreative Commons Attribution License, which permitsunrestricted use, distribution, and reproduction in anymedium, provided the original author and source arecredited.
Data Availability Statement: All Sociality Study filesare available from Figshare via http://dx.doi.org/10.6084/m9.figshare.1299951.
Funding: The study was funded by Mikhail Myagkovthrough his personal research fund at SkolkovoInstitute of Science and Technology. MikhailMyagkov, as one of the co-authors of the manuscripttook part in study design and decision to publish themanuscript. No external grants or funding sourceswere used.
Competing Interests: The authors have declaredthat no competing interests exist.

and a conferral of social status from others. Notable patterns of human behavior that fit thismold mdash;and that result in prosocial outcomes—include “economic irrationality” [3–5], sus-tainable cooperation [6–8], inequity aversion [9–11], and altruism [12, 13] in a social environment.
Humans have been described as “social animals” because our survival as a species as well asat the individual level depends on common group goals and collective action [14, 15]. Fromthis perspective, the breakdown of cooperation predicted by economics [16–19] does not seeminevitable. Experimental studies explain the mechanism behind cooperation through reciproc-ity and conditional cooperation [20–23]. Darwinian evolution adds several mechanisms as ex-planations for cooperative behavior, such as kin and group selections, similarities amongindividuals, and indirect reciprocity through good reputation [23–26]. A “spatial reciprocity”mechanism can also promote cooperation under certain conditions [24, 27, 28]. However, spa-tial networks assume that actors interact with some individuals more often than others. Theprocedure and results presented in this manuscript do not rely on this assumption; each partic-ipant interacts with the others in a small population with relatively equal frequency, in whichcase the natural selection mechanism of defection is still expected to prevail [24, 28].
From an evolutionary perspective, only groups with a significant cooperation rate will besustainable [29, 30]. In fact, humans evolved behavioral features that allowed them to detect co-operators and facilitate cooperation [31–33]. These prosocial behaviors are likely triggered byspecific social environments characterized by an increased salience of one’s identification withthe group (“social identity”). This saliency is defined as knowledge, value, and emotional signifi-cance of group membership [34]. Humans achieve a positive social identity through intergroupsocial comparisons and are able to distinguish between in-group and out-group, thus maintain-ing cooperation in the long run [35]. Social identity creates a sense of “in-group favoritism” thatassociates positive characteristics with the in-group members [36, 37]. It results in advantageoustreatment of the in-group [38–40], greater cooperation with the in-group than with the out-group members [41, 42], and establishes fairness norms [43, 44]. In economic terms, socialidentity may be a key mechanism by which sociality comes to have positive decision utility.
Our overarching hypothesis is that sociality, even in a very minimal form, serves as a naturalmechanism of sustainable cooperation. This has not yet been directly demonstrated empirically.Here, we report on a series of laboratory experiments that combine group-based manipulationsof the social environment (i.e., sociality) with the possibility of sustained cooperation. In theseexperiments participants face each other in a social environment and play economic games,such as the Prisoner’s Dilemma and Ultimatum Game. The one-shot Prisoner’s Dilemma gameprovides participants with the opportunity for cooperation, and the Ultimatum Game can revealegalitarian and altruistic strategies. If our hypothesis is correct, participants will behave morecooperatively, and do so in a more sustained way, in the socialization condition. The main re-sults of the experiments confirm this expectation: the social environment creates not only short-term but also long-term cooperation and egalitarian preferences. The group-based social factorssuggested by evolutionary and social psychologists are shown here to alter the expected patternsof economic behavior based solely on a motive to maximize one’s own immediate utility.
Next subsection of the paper outlines relevant theories and models of social utility and spec-ifies the questions to be answered by the research. Section 2 details the experimental designand the methods that are needed to test the research questions. Section 3 contains the results.The final section summarizes and concludes the paper.
Theory and Model for BehaviorFor the purposes of this paper, sociality, or social utility, is defined as an additional componentof the utility function. It reflects the value of contributing to group success derived from social
Sociality Provides Public Goods
PLOS ONE | DOI:10.1371/journal.pone.0119685 March 19, 2015 2 / 18
identity. The idea that humans may care for more than their narrowly-defined material interestand that their decisions may be driven by sociality and other non-monetary considerations isnot new to behavioral and experimental economists [45]. However, economists rarely considerutility functions that include social aspects [46]. If it is included at all, the social component isusually a function of the outcome and is viewed as strategic learning or just error [17–19] thatdissipates with repetition.
On the other hand, social psychologists have studied social interactions for well over 50years and suggest that decision-making changes under risk in a social environment. People canserve as means through which gains can be obtained or losses prevented [47] and, therefore, aseparate function that accounts for social factors might come into play. Social factors mightthus change not only observed risk attitudes for gains and losses, but, as suggested by Kahne-man and Tversky [48], also make behavior prosocial. However, social psychologists rarely ifever formalize their findings of peculiar behavioral patterns or quantify the value of sociality.
Following on the breakthrough work by evolutionary psychologists [49], this paper empha-sizes the importance of the substantive context of social decisions. A theory of sociality is devel-oped, tested, and refined with the use of experimental methodology in the context of socialsetting. Sociality is modeled as an additional component of an individual’s utility function.
Ui ¼ U0iðzÞ þ Us
iðzÞ ð1Þ
U0iðzÞ is the individual utility function of an outcome; Us
iðzÞ is the individual social utilitycomponent; z is outcome; and i—individual. The latter is sociality, defined in this paper as thevalue of contributing to group success and informed by social psychology.
Group success and cooperation is viewed by social psychologists to be a function of the rela-tive salience of social identity, or the part of one’s self-concept that derives from the knowledge,value, and emotional significance of group membership [34, 50]. Value is used to mean a per-sonal priority, "I value family so I take time off of work to be with my children," and emotionalsignificance is about the subjective feeling associated with the group, such as, "I enjoy beingwith my family". Those two things are not necessarily the same—one might feel a sense ofmoral obligation to one's family (a value) but derive no pleasure from it (value without emo-tion). On the other hand, one might always enjoy being with family but not feel any priority to-wards family (emotion without value). Alike, the value of contributing to group success in themodel presented here depends on two factors that can increase individually or together withsocialization. Sociality captures the value of encountering a cooperator, the positive affect asso-ciated with encountering another cooperator, the satisfaction and sense of common identitythat comes from working towards group success, or an emotional significance of group mem-bership in psychological terms. The value of contributing to group success also depends on tol-erance of a certain amount of defection from in-group members, presumably reflecting a senseof moral obligation to their group. In other words, the personal priority to achieve group suc-cess or to bolster the common sense of group identity allows a person some tolerance for free-riding behavior.
The research questions of this paper are whether sociality helps (a) promote more coopera-tive and fair choices, (b) maintain good equilibria, (c) is larger for cooperators than for defec-tors (to allow for the cooperators to recover from being defected on), and (d) allows punishingindividuals without punishing the whole group. We make three core assumptions in thismodel. First, sociality exists only if a participant cooperates. Second, fair offers, e.g., an offer of5 out of 10, become a moral obligation for participants and if an unfair offer happens, e.g., anoffer of less than 5 out of 10, it cannot be tolerated and might be rejected. This is a perfect ex-ample of punishing the individual but not the group. Finally, sociality depends on components
Sociality Provides Public Goods
PLOS ONE | DOI:10.1371/journal.pone.0119685 March 19, 2015 3 / 18

that encourage cooperation and tolerate defection, and increasing the degree of socializationwill make the utility to cooperate large enough to catalyze a new equilibrium.
Ui ¼ U0iðzÞ þ Vs
i ð2Þ
Vsi is sociality or value of contributing to group success created through socialization; z is
an outcome; and i—individual.Assumption 1: The additional component of the utility function is activated only if a partici-
pant cooperates or is fair, and thereby works toward group success.
Vsi ¼ 0; if D or NF
Vsi > 0; if C or F
(ð3Þ
where D is defection, C—cooperation, F—a fair offer, and NF—an unfair offer.Assumption 2: The value of contributing to group success depends on two components: the
value of encountering cooperator (ai) and an ability to tolerate defection (bi)
EVsi ¼ aipþ bið1� pÞ ð4Þ
EVsi is the expected value of contributing to group success; p is the probability of coopera-
tion or a fair offer. As a first approximation, we assume this function to be linear for clarityand simplicity.
Vsi ¼ ai; if opponent chooses C or F
Vsi ¼ bi; if opponent chooses D or NF
(ð5Þ
Assumption 3: Both components are strictly greater than zero: ai>0, bi>0, ai>biProposition 1: Both components (ai) and (bi) are positively correlated with the value of con-
tributing to group success.Proof: Our model states that sociality, or the value of contributing to group success, is a line-
ar combination of (ai) and (bi). As 0< p< 1 in Equation 4, with increase in each of the compo-nents the value of contributing to group success will increase as well, i.e. VS
i > V0i .
Proposition 2: Cooperation declines ifX
i
Vsi < Threshold.
Proof: Let us define the Threshold as the critical value for an average individual i to cooper-ate. If Vs
i is smaller than the Threshold, then the utility to cooperate is smaller than the utilityto defect and the utility of making a fair offer is smaller than making an unfair offer for at leasthalf of the participants. We assume that out of all individuals, some always defect, some alwayscooperate, and others use certain rules to decide on their strategy. Thus, in sum, there are notenough individuals to overcome the Nash Equilibrium of the PD and UG.
Proposition 3: Socialization maintains long-term cooperation ifX
i
Vsi � Threshold.
Proof: Before socialization V0i, the value of contributing to the group success, is not high
enough and cooperation declines. After socialization, this component of the utility functionmakes cooperation sustainable if it is larger than the Threshold for enough individuals i. Thismeans that at least some of the individuals cooperate and more so than before socialization.The model states that sociality Vs
i becomes larger together with its components ai and bi. If Vsi
is large enough, so that cooperation is the dominant strategy in the first round for some indi-viduals, then they will not switch from their dominant strategy at a later round.
It is assumed that total utility for a participant depends on the utility of an outcome and onsociality (Equation 2). However, the nature of the choices in the Prisoner’s Dilemma (PD) and
Sociality Provides Public Goods
PLOS ONE | DOI:10.1371/journal.pone.0119685 March 19, 2015 4 / 18

in the Ultimatum Game (UG) is different. Both games used in this study are one-shot games,not iterated. Although multiple rounds of these games are played, each round (one-shot) isplayed with a computer or a random anonymous human opponent. Whereas PD is a simulta-neous one-shot game that does not allow playing Tit-for-Tat and not punish the group, UG isa sequential one-shot game that allows using Tit-for-Tat, i.e., to decline the unfair offer andpunish the individual without punishing the group. Thus, the propositions concerning PD andUG vary.
For cooperation in PD to be sustainable the expected utility to cooperate should exceed theexpected utility to defect:
EUiðCÞ > EUiðDÞ ð6Þ
The key here is that the new component of the utility function, sociality, becomes large enoughto overcome the PD Nash equilibrium in defection. The expected utility to cooperate now con-sists of the individual expected utility and Vs
i– the value of contributing to group success:
EUiðCÞ ¼ pcuðC;CÞ þ ð1� pcÞuðC;DÞ þ pcai þ ð1� pcÞbi >> EUiðDÞ ¼ pcuðD;CÞ þ ð1� pcÞuðD;DÞ
ð7Þ
where pc is probability of cooperation in a group, u(C,C)—is the outcome of individual that co-operates and receives cooperation, u(C,D)—is the outcome of individual that cooperates andreceives defection from his opponent, u(D,C)—is the outcome of individual that defects and re-ceives cooperation, and u(D,D)—is the outcome of individual that defects and receives defec-tion from his opponent.
Hypothesis 1: For the UG only one component is strictly greater than zero.ai>bi, ai>0, bi = 0
EVsi ¼ aipa ð8Þ
pa is the probability of accepting an offer in a group.For fairness in the UG to be sustainable, the expected utility to offer a fair amount (an
offer of 5 out of 10 is considered to be fair) should exceed the expected utility to offer anunfair amount:
EUiðFÞ > EUiðNFÞ ð9Þ
The key here is that the new component of utility function, sociality, becomes large enough toovercome the UG Nash equilibrium of offering anything bigger than zero. The expected utilityto cooperate now consists of the value of encountering a cooperator (ai), or a person, who of-fers fair amounts, whereas defection, or making unfair offers, is no longer tolerated.
EUiðFÞ ¼ pa � ð10� offersFÞ þ ð1� paÞ � 0þ paai >
> EUiðNFÞ ¼ pa � ð10� offersNFÞ þ ð1� paÞ � 0ð10Þ
Hypothesis 2: Sociality, the value of contributing to group success, increases with socializa-tion, i.e. VS
i > V0i ; where V
0i � 0 is the sociality before socialization.
Hypothesis 3: Socialization increases cooperation and egalitarianism. If 0� pc0 � 1 is the co-
operation rate before socialization and 0� pcs� 1 is the cooperation rate after socialization,
then pcs> pc
0. With an increase in the rate of cooperation, the value of encountering a coopera-tor (ai) also increases.
If 1� offer0 � 5 is the average offer in UG before socialization and 1� offers� 5 is the aver-age offer after socialization, then offers > offer0.
Sociality Provides Public Goods
PLOS ONE | DOI:10.1371/journal.pone.0119685 March 19, 2015 5 / 18
Hypothesis 4: Socialization increases the tolerability of defection. If b0 � 0 is the tolerabilityto defection before socialization and bs � 0 is the tolerability to defection after socialization,then bs> b0. Our model states that sociality increases with socialization, i.e. VS
i > V0i : This
means that, at least for some individuals, b increases with socialization.Hypothesis 5: Socialization increases in-group favoritism. In-group favoritism is created
through the salience of social identity, which can be measured directly using implicit and ex-plicit association tasks and indirectly through the revealed value of contributing to group suc-cess, VS
i : This parameter increases with socialization according to the assumptions ofthe model.
Nevertheless, for sociality to appear and to sustain collective action, the individual’s mem-bership in the group needs to be made salient. We achieved this here by creating a SocializationPhase that is detailed in the next section. Implicit and explicit tests of association of oneselfwith a group (from the social psychological literature) are used as manipulation checks to en-sure that sociality is activated to a greater degree in the experimental group versus thecontrol group.
Materials and MethodsThe study procedures involving human participants were approved by Skolkovo Institute ofScience and Technology Human Subjects Committee. Written informed consents were ob-tained from participants. Experimental data are readily available on Figshare: http://dx.doi.org/10.6084/m9.figshare.1299951.
Subjects (N = 96, 32 females, Age M = 19) for the experiment were recruited from the stu-dents at the Moscow Institute of Physics and Technology (MIPT). The MIPT ExperimentalEconomics laboratory was used to carry out all experiments. Each experiment consisted of 12students, pre-selected before the experiment to be unfamiliar with one another. After the endof each treatment, participants provided feedback about the experiments received paymentsand left the experimental facility.
Each experiment was divided into 5 phases:
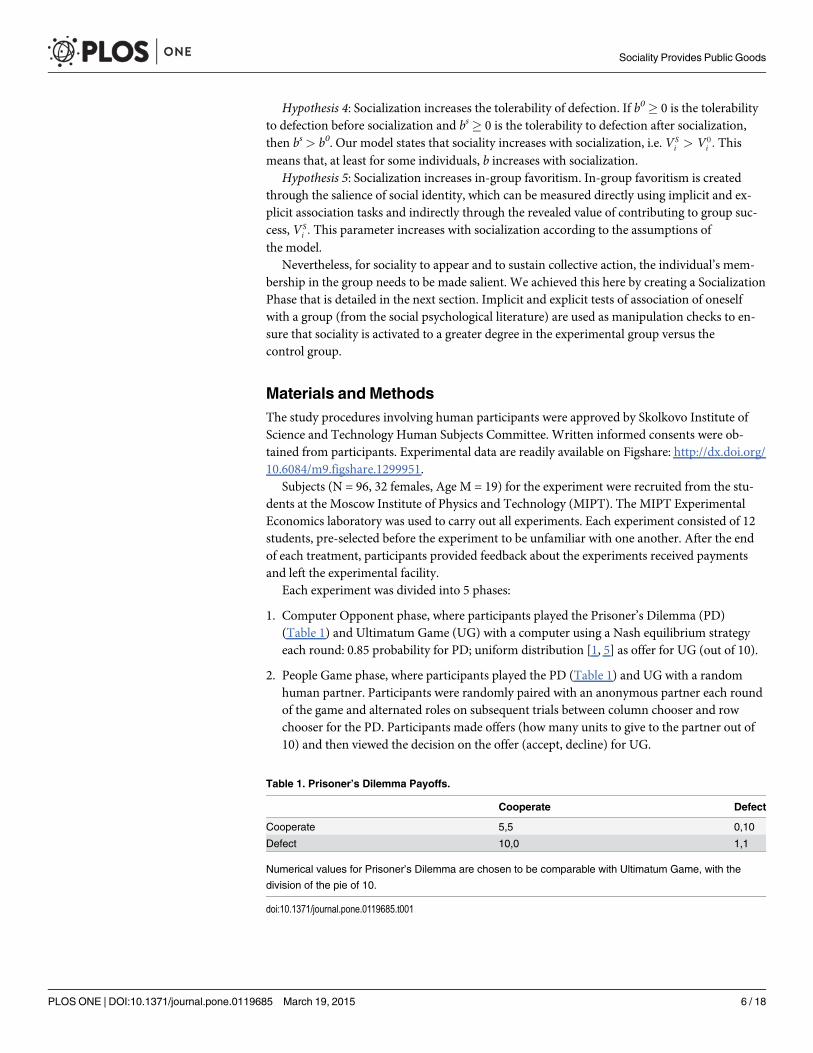
1. Computer Opponent phase, where participants played the Prisoner’s Dilemma (PD)(Table 1) and Ultimatum Game (UG) with a computer using a Nash equilibrium strategyeach round: 0.85 probability for PD; uniform distribution [1, 5] as offer for UG (out of 10).
2. People Game phase, where participants played the PD (Table 1) and UG with a randomhuman partner. Participants were randomly paired with an anonymous partner each roundof the game and alternated roles on subsequent trials between column chooser and rowchooser for the PD. Participants made offers (how many units to give to the partner out of10) and then viewed the decision on the offer (accept, decline) for UG.
Table 1. Prisoner’s Dilemma Payoffs.
Cooperate Defect
Cooperate 5,5 0,10
Defect 10,0 1,1
Numerical values for Prisoner’s Dilemma are chosen to be comparable with Ultimatum Game, with the
division of the pie of 10.
doi:10.1371/journal.pone.0119685.t001
Sociality Provides Public Goods
PLOS ONE | DOI:10.1371/journal.pone.0119685 March 19, 2015 6 / 18
3. Socialization phase, where participants were divided into two groups of 6, got to know eachother in pairs at first then in the larger group, and then completed the Group Game task(below). The socialization phase consisted of three main tasks. First, each participant got toknow another participant from his/her group, and then each small group of two narrated tothe group of 6 about his/her partner’s characteristics and life facts. Finally, the group of 6completed the task of identifying five characteristics that everyone in their group shares,and then selected one of those characteristics as their group’s name. The group then provid-ed to the experimenter a list with the characteristics written down and the group’sname circled.
4. Group Game phase, where participants played the PD and UG with a random human part-ner from their group of 6. Their partner changed each round of the game. The participantsswitched roles on alternating trials: column chooser and row chooser for PD; offerer anddecision-viewer on the offer (accept, decline) for UG. The games were the same as in PeopleGame phase. The Group Game phase lasted 15 rounds for most of the experiments. Howev-er, we did a couple of experiments with 20 rounds and tracked the feedback of the partici-pants. Unlike the feedback for the experiments with 15 rounds, these participants notedbeing bored towards the end of the experiment and made their responses automatic. Thatsaid we believe that our decision to keep 15 rounds was valid, because the decisions of par-ticipants were thought through and, thus, could be trusted.
5. Finally, a Manipulation Check was acquired using the Implicit Association Test [51] andan explicit questionnaire that measured the extent of participants’ group identity on a 7-point Likert scale. The IAT measures the strength of association between concepts by ob-serving reaction times in categorization tasks. First, participants classified photographs ofparticipants into group membership (in-group / out-group) using two buttons indicated inthe task. Then, participants classified pictures (smiley and non-smiley faces) into valencecategories (pleasant / unpleasant) using the same two buttons. Lastly, in the critical phase,photographs and pictures were combined into two new response time classification taskswith in-group + positive / out-group + negative categories or out-group + positive /in-group + negative as the groupings, presented in counterbalanced order. The differencein average reaction time between two combined tasks in the critical phase yields theIAT measure.
The socialization treatment is the standard experiment as described above, and the controltreatment was exactly the same except without the socialization phase. Other modifications ofthe experiment include an Established Groups treatment that enrolled participants from twodifferent communities and an Auction treatment (S1 Text1). It is assumed that in the Estab-lished group condition there will be even bigger increase in cooperation and egalitarianism asparticipants are socialized in their communities for a longer time. However, another result isalso possible. Once you know the group well enough, you know who are likely to engage ingood behaviors and who are not, thus, one might as well see a decline in the cooperative andegalitarian strategies. This treatment was attempted once, but due to discrepancy in groups ap-pearance to the experiment was excluded from analysis.
The Computer Opponent phase included 10 rounds of PD (Table 1) and 10 rounds of UG(decision on division of 10 units). In our preliminary study we used a different payoff matrix,i.e. 1<2<4<6, instead of 0<1<5<10, and reached the same results as in this manuscript. Boththe People Game and Group Game phases included 15 rounds of PD (Table 1) and 15 roundsof UG (decision on division of 10 units). A round was a one-shot game (either PD or UG witha computer or random anonymous human opponent). The PD was played simultaneously, so
Sociality Provides Public Goods
PLOS ONE | DOI:10.1371/journal.pone.0119685 March 19, 2015 7 / 18
that the partners in the game see the decision screen and make a decision to Cooperate or De-fect. Only when both partners made their choices did they both see the outcome screens indi-cating how many points they earned for the current round. The UG was played sequentially:first, the player who offers a division typed in and submitted an offer (how many units to giveto the partner out of 10), and then the partner observed the offer and decided whether to accept(division is done according to the offer) or reject (both partners get zero points) the offer. Onlythen did both partners see the outcome screens. The order of the experimental phases followedthe sequence described in the Experimental design section and remained unchanged for all ex-periments. Participants do not know each other at the beginning of the study and played thegames as strangers at first, and then got to know each other (socialization) and played withintheir groups. The total duration of the experiment did not exceed two hours.
The research questions of this study are (a) whether the Socialization phase createssociality and in turn (b) whether that socialization serves as a natural mechanism of collectivegoods provision or a good equilibrium, in which long-lasting cooperation and fairnessare established.
Results
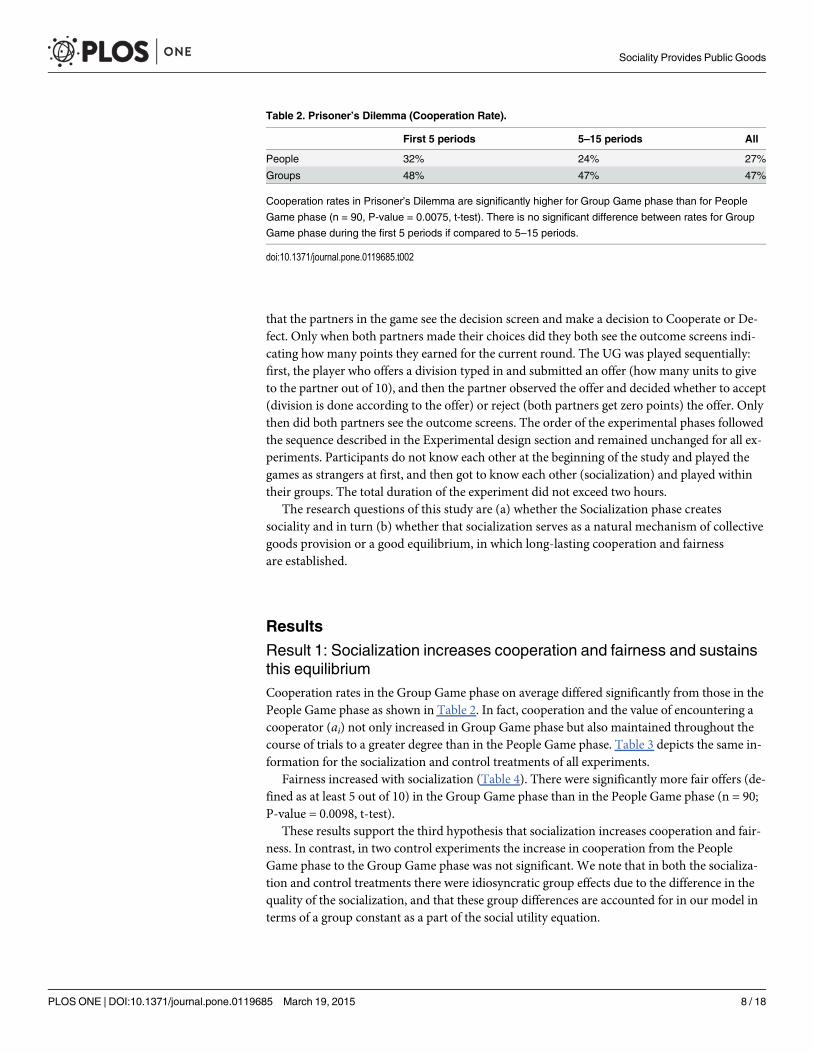
Result 1: Socialization increases cooperation and fairness and sustainsthis equilibriumCooperation rates in the Group Game phase on average differed significantly from those in thePeople Game phase as shown in Table 2. In fact, cooperation and the value of encountering acooperator (ai) not only increased in Group Game phase but also maintained throughout thecourse of trials to a greater degree than in the People Game phase. Table 3 depicts the same in-formation for the socialization and control treatments of all experiments.
Fairness increased with socialization (Table 4). There were significantly more fair offers (de-fined as at least 5 out of 10) in the Group Game phase than in the People Game phase (n = 90;P-value = 0.0098, t-test).
These results support the third hypothesis that socialization increases cooperation and fair-ness. In contrast, in two control experiments the increase in cooperation from the PeopleGame phase to the Group Game phase was not significant. We note that in both the socializa-tion and control treatments there were idiosyncratic group effects due to the difference in thequality of the socialization, and that these group differences are accounted for in our model interms of a group constant as a part of the social utility equation.
Table 2. Prisoner’s Dilemma (Cooperation Rate).
First 5 periods 5–15 periods All
People 32% 24% 27%
Groups 48% 47% 47%
Cooperation rates in Prisoner’s Dilemma are significantly higher for Group Game phase than for People
Game phase (n = 90, P-value = 0.0075, t-test). There is no significant difference between rates for Group
Game phase during the first 5 periods if compared to 5–15 periods.
doi:10.1371/journal.pone.0119685.t002
Sociality Provides Public Goods
PLOS ONE | DOI:10.1371/journal.pone.0119685 March 19, 2015 8 / 18
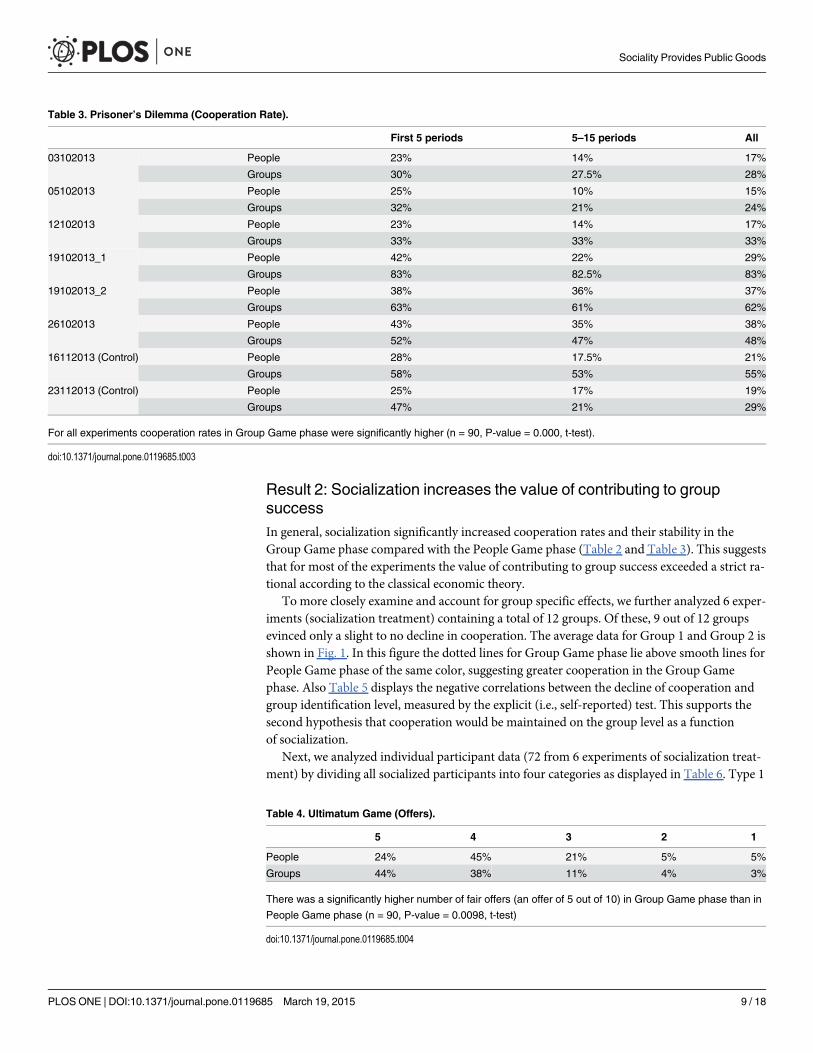
Result 2: Socialization increases the value of contributing to groupsuccessIn general, socialization significantly increased cooperation rates and their stability in theGroup Game phase compared with the People Game phase (Table 2 and Table 3). This suggeststhat for most of the experiments the value of contributing to group success exceeded a strict ra-tional according to the classical economic theory.
To more closely examine and account for group specific effects, we further analyzed 6 exper-iments (socialization treatment) containing a total of 12 groups. Of these, 9 out of 12 groupsevinced only a slight to no decline in cooperation. The average data for Group 1 and Group 2 isshown in Fig. 1. In this figure the dotted lines for Group Game phase lie above smooth lines forPeople Game phase of the same color, suggesting greater cooperation in the Group Gamephase. Also Table 5 displays the negative correlations between the decline of cooperation andgroup identification level, measured by the explicit (i.e., self-reported) test. This supports thesecond hypothesis that cooperation would be maintained on the group level as a functionof socialization.
Next, we analyzed individual participant data (72 from 6 experiments of socialization treat-ment) by dividing all socialized participants into four categories as displayed in Table 6. Type 1
Table 3. Prisoner’s Dilemma (Cooperation Rate).
First 5 periods 5–15 periods All
03102013 People 23% 14% 17%
Groups 30% 27.5% 28%
05102013 People 25% 10% 15%
Groups 32% 21% 24%
12102013 People 23% 14% 17%
Groups 33% 33% 33%
19102013_1 People 42% 22% 29%
Groups 83% 82.5% 83%
19102013_2 People 38% 36% 37%
Groups 63% 61% 62%
26102013 People 43% 35% 38%
Groups 52% 47% 48%
16112013 (Control) People 28% 17.5% 21%
Groups 58% 53% 55%
23112013 (Control) People 25% 17% 19%
Groups 47% 21% 29%
For all experiments cooperation rates in Group Game phase were significantly higher (n = 90, P-value = 0.000, t-test).
doi:10.1371/journal.pone.0119685.t003
Table 4. Ultimatum Game (Offers).
5 4 3 2 1
People 24% 45% 21% 5% 5%
Groups 44% 38% 11% 4% 3%
There was a significantly higher number of fair offers (an offer of 5 out of 10) in Group Game phase than in
People Game phase (n = 90, P-value = 0.0098, t-test)
doi:10.1371/journal.pone.0119685.t004
Sociality Provides Public Goods
PLOS ONE | DOI:10.1371/journal.pone.0119685 March 19, 2015 9 / 18

are participants who never cooperated; Type 2 are participants who cooperated more in PeopleGame phase than in Group Game phase; Type 3 are participants who cooperated less in PeopleGame phase, than in Group Game phase; and Type 4 are participants who only cooperated.
To test the second hypothesis on the individual level participants of all types are considered.The question is: do more participants maintain their cooperation through the last period in theGroup Game phase than in the People Game phase? For this purpose, we defined an index ofchange in the level of cooperation as the difference between the average cooperation rate for allperiods and for the last five rounds. This index equals zero for participants of Type 1 and Type4, because they either cooperate in all rounds or do not cooperate at all, thus, no change fromfirst rounds to the last ones. This index is negative when cooperation increases in the last fiverounds from the average level.
Fig. 2 plots change in the level of cooperation in the People phase (x-axis) against change incooperation in the Group Game phase (y-axis) for Type 2 and Type 3 individuals. Most of thedots lie below y = x, and, in particular, in the fourth quadrant, which means that cooperation is
Fig 1. Average of the Cooperation Rate. The cooperation rate (y-axis) as a function of round or time(x-axis). Solid blue lines indicate average cooperation rate over time for Group 1 and People Game phase(average is taken for 6 experiments (socialization treatment)), solid red lines—for Group 2 and People Gamephase, dotted blue lines—for Group 1 and Group Game phase, and dotted red lines for Group 2 and GroupGame phase. Error bars represent standard error (SE).
doi:10.1371/journal.pone.0119685.g001
Table 5. Dependence of Decline in Cooperation on Group Identification Level.
Group # 1 2 3 4 5 6 7 8 9 10 11 12
Group Identification 4.2 4.5 2.7 3.3 4.2 3.7 5.7 3 3.7 5 4.2 3.5
Decline in Cooperation 0.1 -0.05 0.15 0.07 0 0 -0.07 0.13 0.2 -0.15 0.083 0.017
Slight negative correlation (-0.43) is present between decline in cooperation and group identification level, measured by the explicit (i.e., self-
reported) test.
doi:10.1371/journal.pone.0119685.t005
Sociality Provides Public Goods
PLOS ONE | DOI:10.1371/journal.pone.0119685 March 19, 2015 10 / 18
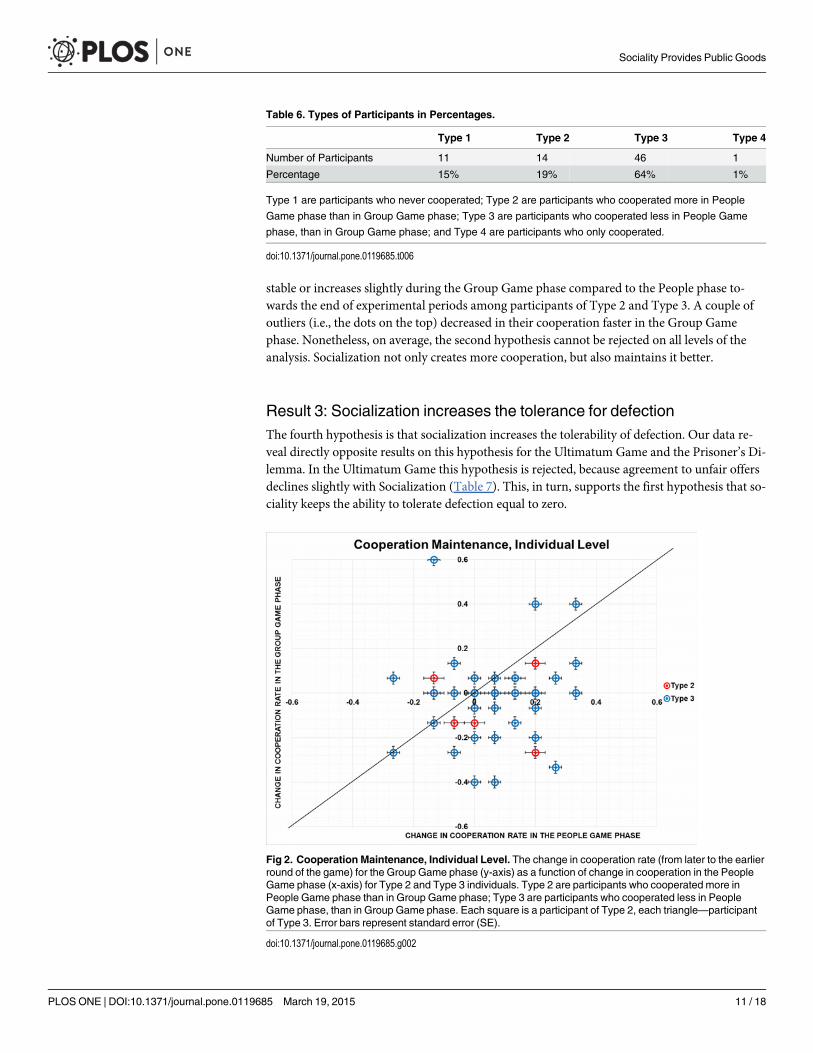
stable or increases slightly during the Group Game phase compared to the People phase to-wards the end of experimental periods among participants of Type 2 and Type 3. A couple ofoutliers (i.e., the dots on the top) decreased in their cooperation faster in the Group Gamephase. Nonetheless, on average, the second hypothesis cannot be rejected on all levels of theanalysis. Socialization not only creates more cooperation, but also maintains it better.
Result 3: Socialization increases the tolerance for defectionThe fourth hypothesis is that socialization increases the tolerability of defection. Our data re-veal directly opposite results on this hypothesis for the Ultimatum Game and the Prisoner’s Di-lemma. In the Ultimatum Game this hypothesis is rejected, because agreement to unfair offersdeclines slightly with Socialization (Table 7). This, in turn, supports the first hypothesis that so-ciality keeps the ability to tolerate defection equal to zero.
Table 6. Types of Participants in Percentages.
Type 1 Type 2 Type 3 Type 4
Number of Participants 11 14 46 1
Percentage 15% 19% 64% 1%
Type 1 are participants who never cooperated; Type 2 are participants who cooperated more in People
Game phase than in Group Game phase; Type 3 are participants who cooperated less in People Game
phase, than in Group Game phase; and Type 4 are participants who only cooperated.
doi:10.1371/journal.pone.0119685.t006
Fig 2. Cooperation Maintenance, Individual Level. The change in cooperation rate (from later to the earlierround of the game) for the Group Game phase (y-axis) as a function of change in cooperation in the PeopleGame phase (x-axis) for Type 2 and Type 3 individuals. Type 2 are participants who cooperated more inPeople Game phase than in Group Game phase; Type 3 are participants who cooperated less in PeopleGame phase, than in Group Game phase. Each square is a participant of Type 2, each triangle—participantof Type 3. Error bars represent standard error (SE).
doi:10.1371/journal.pone.0119685.g002
Sociality Provides Public Goods
PLOS ONE | DOI:10.1371/journal.pone.0119685 March 19, 2015 11 / 18

In the Ultimatum Game participants could agree or not agree to the offer their opponentmade and therefore had an opportunity to punish the opponent. In contrast, the Prisoner’s Di-lemma is a one shot game and thus does not allow punishment. To measure responses to defec-tion in the PD, we defined a Bearable defection (BD) index as the maximum defects onereceives in the PD from a partner before switching from cooperation to defection. This indexreflects the bi component of sociality, the ability to tolerate defection.
Across all experiments (6 experiments with socialization treatment) and summing up BDindexes of participants of Type 2 and Type 3 (because the other types did not switch their strat-egy) there is a visible increase in tolerance for defection with socialization:
BD (People) = 87< BD(Group) = 119 (n = 12, P-value = 0.0475, chi-squared).In parallel on the group level, 8 out of 12 groups experienced an increase in tolerability, 1
group’s tolerability didn’t change, 3 groups showed a decline in tolerability. Table 8 depictsBearable defection indexes for the Group Game and the People Game phases for each of the 12groups. The null hypothesis, independence of group number and tolerance with and without
Table 7. Ultimatum Game (Acceptance).
5 4 3 2 1
People 100% 85% 44% 20% 0%
Groups 100% 77% 32% 0% 0%
There was not a significantly higher number of acceptances in Ultimatum Game in Group Game phase
than in People Game phase. (n = 90, P-value = 0.779, t-test)
doi:10.1371/journal.pone.0119685.t007
Table 8. Bearable Defection by Group.
Group # BD(People) BD (Group) Total
1 7 15 22
2 4 9 13
3 7 7 14
4 6 10 16
5 6 13 19
6 7 3 10
7 5 1 6
8 10 18 28
9 5 8 13
10 7 10 17
11 19 18 37
12 4 7 11
Total 87 119 206
To measure responses to defection in the PD, we defined a bearable defection (BD) index as the maximum
defects one receives in the PD from a partner before switching from cooperation to defection. This index
reflects the bi component of sociality, the ability to tolerate defection. Across all experiments (6 experiments
with socialization treatment) and summing up BD indexes of participants of Type 2 and Type 3 (because
the other types did not switch their strategy) there is a visible increase in tolerance for defection with
socialization:
BD (People) = 87 < BD(Group) = 119 (n = 12, P-value = 0.0475, chi-squared).
doi:10.1371/journal.pone.0119685.t008
Sociality Provides Public Goods
PLOS ONE | DOI:10.1371/journal.pone.0119685 March 19, 2015 12 / 18

socialization, cannot be rejected, because the chi-squared test value 12.358 is less than criticalvalue 19.675.
For the individual level analysis, all participants of Type 1, some participants of Type 2 andType 3 had to be excluded, because they never had a chance to bear defection. The rest formthe sample for hypothesis testing. The number of participants of each type is shown in Table 9.The proportions of homogeneity between all participants and the approved sample is testedusing chi-square test. Homogeneity is rejected with a test value 12.993 bigger than critical value9.488. A comparison of Bearable Defection indices (Table 10) shows both the percentages of allparticipants and of the approved samples for which the inequality holds.
The fourth hypothesis can be rejected for participants of Type 2. These participants are lesscooperative with socialization and they also bear less defection in Group Game phase. For par-ticipants of Type 3 this hypothesis cannot be rejected. Socialization for them not only increasescooperation rate, but also allows them to bear more defections from their opponents.
Result 4: Socialization increases explicit group identificationImplicit and explicit self-with-group associations are used as an index of in-group favoritism.The effect of Implicit Association Test is measured with a D-score that has a possible range of-2 to +2. Break points for ‘slight’ (.15), ‘moderate’ (.35) and ‘strong’ (.65) association effect areselected conservatively according to conventions for IAT effect size [51].
The distribution in Fig. 3 summarizes 84 IAT D-scores (8 experiments: socialization treat-ment and control treatment) (mean = 0.456) for the group association task completed at theend of each experiment. There is no observed difference in the D-score mean from the experi-ment with Socialization phase to the experiment without Socialization phase. Therefore, the
Table 9. Number of participants.
Number of participants Overall (A) Approved Sample (S)
Type 2 14 6
Type 3 46 33
Type 3 BD(G)>BD(P) 25 20
Type 3 BD(G) = BD(P) 10 9
Type 3 BD(G)<BD(P) 9 4
The proportions of homogeneity between all participants and approved sample is tested using chi-square
test. Homogeneity is rejected with test value 12.993 bigger than critical value 9.488.
doi:10.1371/journal.pone.0119685.t009
Table 10. Individual BD Differences.
Type Type 2 (A) Type 3 (A) Type 2 (S) Type 3 (S)
BD (Group)>BD (People) 0% 57% 0% 61%
BD (Group) = BD (People) 0% 23% 0% 27%
BD (Group)<BD (People) 100% 20% 100% 12%
Bearable Defection indexes comparison shows both the percentages of all participants and of the approved
sample for which the inequality holds. Participants of Type 2 are less cooperative with socialization and
they can bear less defection in Group Game phase as well. Socialization for participants of Type 3 not only
increases cooperation rate, but also allows them to bear more defects from their opponents. (A) stands for
all participants, (S) stands for Approved Sample.
doi:10.1371/journal.pone.0119685.t010
Sociality Provides Public Goods
PLOS ONE | DOI:10.1371/journal.pone.0119685 March 19, 2015 13 / 18

observed D-scores do not support our argument that the socialization was sufficient to inducea sense of group identity. It is noteworthy that, though implicit (e.g., the IAT) and explicit(e.g., self-reported group identity) tests are generally related, they might not measure the samething and, thus, tend to have a low correlation with each other [52, 53].
A comparison of explicit test scores between the Socialization and Control treatments sug-gests a slight increase in the self-report measure of identification with the group and a signifi-cance difference in adjusted scores (Table 11). Adjusted scores are formed by excluding scoresthat do not correspond to the feedback that participants gave at the end of experiment. Fig. 4shows a difference among the kernel density estimates of the explicit test scores.
Although the implicit test rejects the fifth hypothesis, the explicit test and the changes of be-havior with socialization support it. First, there is a significant increase in cooperation and egal-itarianism for the Group Game phase, where participants play with the people with whom they
Fig 3. IAT D-scores. The histogram of 84 IAT D-scores (x-axis) for the group association task completed inthe end of each experiment. The dark bars indicate faster sorting of out-group with Unpleasant and in-groupwith Pleasant, gray bars indicate faster sorting of in-group with Unpleasant and out-group with Pleasant. Thebar height (y-axis) indicates the number of people who scored within that range.
doi:10.1371/journal.pone.0119685.g003
Table 11. Explicit Test Average Scores.
Socialization Treatment Control Treatment All
All 3.76 3.25 3.63
Adjusted by Discrepancy with Feedback 3.75 3 3.56
A comparison of explicit test scores between Socialization and Control treatments suggests a slight increase in the score of identification with the group
and significance difference for adjusted scores (N = 96, P-value = 0.0532, t-test), which are formed by excluding scores that do not correspond to the
feedback provided at the end of experiment.
doi:10.1371/journal.pone.0119685.t011
Sociality Provides Public Goods
PLOS ONE | DOI:10.1371/journal.pone.0119685 March 19, 2015 14 / 18
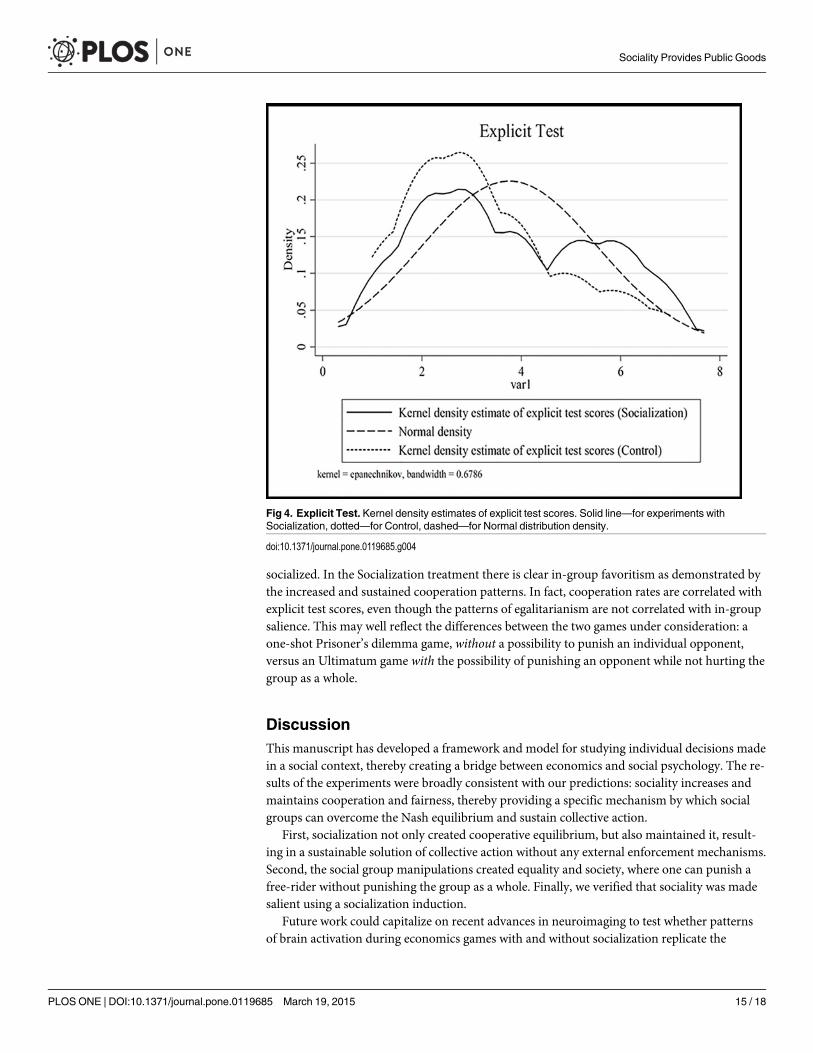
socialized. In the Socialization treatment there is clear in-group favoritism as demonstrated bythe increased and sustained cooperation patterns. In fact, cooperation rates are correlated withexplicit test scores, even though the patterns of egalitarianism are not correlated with in-groupsalience. This may well reflect the differences between the two games under consideration: aone-shot Prisoner’s dilemma game, without a possibility to punish an individual opponent,versus an Ultimatum game with the possibility of punishing an opponent while not hurting thegroup as a whole.
DiscussionThis manuscript has developed a framework and model for studying individual decisions madein a social context, thereby creating a bridge between economics and social psychology. The re-sults of the experiments were broadly consistent with our predictions: sociality increases andmaintains cooperation and fairness, thereby providing a specific mechanism by which socialgroups can overcome the Nash equilibrium and sustain collective action.
First, socialization not only created cooperative equilibrium, but also maintained it, result-ing in a sustainable solution of collective action without any external enforcement mechanisms.Second, the social group manipulations created equality and society, where one can punish afree-rider without punishing the group as a whole. Finally, we verified that sociality was madesalient using a socialization induction.
Future work could capitalize on recent advances in neuroimaging to test whether patternsof brain activation during economics games with and without socialization replicate the
Fig 4. Explicit Test. Kernel density estimates of explicit test scores. Solid line—for experiments withSocialization, dotted—for Control, dashed—for Normal distribution density.
doi:10.1371/journal.pone.0119685.g004
Sociality Provides Public Goods
PLOS ONE | DOI:10.1371/journal.pone.0119685 March 19, 2015 15 / 18
behavioral results presented here and, importantly, establish the underlying neural mecha-nisms of the observed behavioral effects. Similar to this research, neuroscience scholars havesuggested that some important behaviors may be aimed at maximizing social, not personal ma-terial outcomes [54]. Neuroimaging is seen as a critical tool for understanding the nature of thevarious aspects of human behavior, and recent trends in the field have placed particular em-phasis on social behavior [55]. Use of this methodology has the potential to advance empiricalevidence relevant to existing theoretical accounts of how people make decisions by informingand constraining these models based on the underlying neuroscience.
Supporting InformationS1 Text. Auction Treatment. The description of additional treatment used in the study. Itsmain purpose was to measure sociality.(DOC)
AcknowledgmentsWe thank Rinat Yaminov for writing the programing code for experiments, Aleksander Cha-ban for technical help in conducting experiments at MIPT, Tatyana Babkina and Olga Menshi-kova for useful suggestions in data analysis.
Author ContributionsConceived and designed the experiments: EL EB IMMM. Performed the experiments: EL IM.Analyzed the data: EL IMMM. Contributed reagents/materials/analysis tools: EL IM. Wrotethe paper: EL EB MM.
References1. Myagkov M, Plott CR. Exchange economies and loss exposure: Experiments exploring prospect theory
and competitive equilibria in market environments. Am Econ Rev. 1997: 801–828.
2. Lukinova E, Myagkov M, Shishkin P. The Value of Sociality. Foresight. 2014; 16(4): 309–328.
3. Becker GS. The Economic Approach to Human Behavior. Chicago: University of ChicagoPress; 1976.
4. Lakshminarayanan VR, Chen MK, Santos LR. The evolution of decision-making under risk: Framing ef-fects in monkey risk preferences. J Exp Soc Psychol. 2011; 47(3): 689–693.
5. Lester BY. An exploratory analysis of composite choices: Weighing rationality versus irrationality.J Socio Econ. 2011; 40(6): 949–958.
6. LiebrandWB, Messick DM. Frontiers in social dilemmas research. Springer-Verlag New York,Inc.; 1996.
7. Ostrom E. Governing the commons: The evolution of institutions for collective action. Cambridge:Cambridge University Press; 1990.
8. Ostrom E. The value-added of laboratory experiments for the study of institutions and common-pool re-sources. J Econ Behav Organ. 2006; 61(2): 149–163.
9. Fehr E, Schmidt KM. A theory of fairness, competition, and cooperation. Q J Econ. 1999; 114(3):817–868.
10. Fehr E, Schmidt KM. On inequity aversion: A reply to Binmore and Shaked. J Econ Behav Organ.2010; 73(1): 101–108.
11. Camerer CF, Fehr E. When does" economic man" dominate social behavior? Science. 2006;311(5757): 47. PMID: 16400140
12. Fehr E, Gachter S. Altruistic punishment in humans. Nature. 2002; 415(6868): 137–140. PMID:11805825
13. Morishima Y, Schunk D, Bruhin A, Ruff CC, Fehr E. Linking brain structure and activation in temporo-parietal junction to explain the neurobiology of human altruism. Neuron. 2012; 75(1): 73–79. doi: 10.1016/j.neuron.2012.05.021 PMID: 22794262
Sociality Provides Public Goods
PLOS ONE | DOI:10.1371/journal.pone.0119685 March 19, 2015 16 / 18

14. Aronson E. The social animal. New York: Freeman; 1972.
15. Bowlby J. Attachment and Loss. Vol. 1. Attachment. Hogarth London; 1969.
16. Young HP, Foster D. Cooperation in the short and in the long run. Games Econ Behav. 1991; 3(1):145–156.
17. Ledyard J. Public Goods: A survey of experimental research. In: Kagel J, Roth A, editors. Handbook ofExperimental Economics. Princeton: Princeton University Press; 1995. pp. 111–194.
18. Andreoni J. Cooperation in public-goods experiments: kindness or confusion? Am Econ Rev.1995:891–904.
19. Neugebauer T, Perote J, Schmidt U, Loos M. Selfish-biased conditional cooperation: On the decline ofcontributions in repeated public goods experiments. J Econ Psychol. 2009; 30(1): 52–60.
20. Fischbacher U, Gachter S, Fehr E. Are people conditionally cooperative? Evidence from a public goodsexperiment. Econ Lett.2001; 71: 397–404.
21. Grujic J, Fosco C, Araujo L, Cuesta JA, Sanchez A. Social experiments in the mesoscale: Humansplaying a spatial prisoners dilemma. PLoS One. 2010; 5: e13749. doi: 10.1371/journal.pone.0013749PMID: 21103058
22. Nowak MA, Sigmund K. Evolution of indirect reciprocity by image scoring. Nature. 1998; 393: 573–577.PMID: 9634232
23. Traulsen A, Schuster HG. Minimal model for tag-based cooperation. Phys Rev E. 2003; 68(4 Pt 2):046129–046129. PMID: 14683024
24. Nowak MA. Five Rules for the Evolution of Cooperation. Science. 2006; 314(5805): 1560–1563. doi:10.1126/science.1133755 PMID: 17158317
25. Riolo RL, Cohen MD, Axelrod R. Evolution of cooperation without reciprocity. Nature. 2001; 414(6862):441–443. PMID: 11719803
26. Fu F, Hauert C, Nowak MA, Wang L. Reputation-based partner choice promotes cooperation in socialnetworks. Physical Review E. 2008; 78(2): 026117.
27. Wang Z, Wang L, Yin ZY, Xia CY. Inferring reputation promotes the evolution of cooperation in spatialsocial dilemma games. PLoS One. 2012; 7(7): e40218. doi: 10.1371/journal.pone.0040218 PMID:22808120
28. Wang Z, Kokubo S, Tanimoto J, Fukuda E, Shigaki K. Insight into the so-called spatial reciprocity.Physical Review E. 2013; 88(4): 042145. PMID: 24229153
29. Schuessler R. Exit threats and cooperation under anonymity. J Conflict Resolut. 1989; 33: 728–749.
30. Smaldino PE, Schank JC, McElreath R. Increased Costs of Cooperation Help Cooperators in the LongRun. Am Nat. 2013; 181(4): 451–463. doi: 10.1086/669615 PMID: 23535611
31. Frank M, Ekman P, FriesenW. Behavioral markers and recognizability of the smile of enjoyment.J Pers Soc Psychol. 1993; 64: 83–93. PMID: 8421253
32. Scharlemann J, Eckel C, Kacelnik A, Wilson R. The value of a smile: Game theory with a human face.J Econ Psychol. 2001; 22(5): 617–640.
33. Myagkov M, Orbell J. Mindreading and Manipulation in an Ecology of Prisoner’s Dilemma Games: Lab-oratory Experiments. Politics Life Sci. 2006; 8(1): 67–83.
34. Tajfel H. Social psychology of intergroup relations. Annu Rev Psychol. 1982; 33(1): 1–39.
35. Brewer MB. When contact is not enough: Social identity and intergroup cooperation. Int J IntercultRelat. 1996; 20(3): 291–303.
36. Eckel C, Ball SB. Buying status: Experimental evidence on status in negotiation. Psychol Marketing.1996; 13(4): 381–405.
37. Dasgupta N. Implicit in-group favoritism, out-group favoritism, and their behavioral manifestations. SocJustice Res. 2004; 17(2): 143–169.
38. Tajfel H, Billig MG, Bundy RP, Flament C. Social categorization and intergroup behaviour. Eur J SocPsychol. 1971; 1: 149–178. PMID: 5100005
39. Stroebe K, Lodewijkx HF, Spears R. Do unto others as they do unto you: Reciprocity and social identifica-tion as determinants of in-group favoritism. Pers Soc Psychol Bull. 2005; 31(6): 831–845. PMID: 15833909
40. Brewer MB, Yuki M. Culture and social identity. In: Kitayama S, Cohen D, editors. Handbook of culturalpsychology; 2007. pp. 307–322.
41. Ruffle BJ, Sosis R. Cooperation and the in-group-out-group bias: A field test on Israeli kibbutz membersand city residents. J Econ Behav Organ. 2006; 60(2): 147–163.
42. Böhm R, Rockenbach B. The Inter-Group Comparison–Intra-Group Cooperation Hypothesis: Compari-sons between Groups Increase Efficiency in Public Goods Provision. PLoS One. 2013; 8(2): e56152.doi: 10.1371/journal.pone.0056152 PMID: 23405262
Sociality Provides Public Goods
PLOS ONE | DOI:10.1371/journal.pone.0119685 March 19, 2015 17 / 18
43. Waytz A, Dungan J, Young L. The whistleblower's dilemma and the fairness–loyalty tradeoff. J Exp SocPsychol. 2013; 49(6): 1027–1033.
44. Kubota JT, Li J, Bar-David E, Banaji MR, Phelps EA. The Price of Racial Bias Intergroup Negotiationsin the Ultimatum Game. Psychol Sci. 2013; 24(12): 2498–2504. doi: 10.1177/0956797613496435PMID: 24121413
45. Frey BS, Stutzer A. Beyond outcomes: measuring procedural utility. Oxf Econ Pap. 2005; 57(1): 90–111.
46. Brock WA, Durlauf SN. Discrete choice with social interactions. Rev Econ Stud. 2001; 68(2): 235–260.
47. Tajfel H. Human Groups and Social Categories: Studies in Social Psychology. Cambridge: CambridgeUniversity Press; 1981.
48. Kahneman D, Tversky A. Prospect theory: An analysis of decision under risk. Econometrica. 1979:263–291.
49. McDermott R, Fowler JH, Smirnov O. On the evolutionary origin of prospect theory preferences. J Polit.2008; 70(2): 335–350.
50. Hogg MA, Terry DI. Social identity and self-categorization processes in organizational contexts. AcadManage Rev. 2000; 25(1): 121–140.
51. Greenwald AG, Poehlman TA, Uhlmann EL, Banaji MR. Understanding and using the Implicit Associa-tion Test: III. Meta-analysis of predictive validity. J Pers Soc Psychol. 2009; 97(1): 17. doi: 10.1037/a0015575 PMID: 19586237
52. HofmannW, Gawronski B, Gschwendner T, Le H, Schmitt M. A Meta-Analysis on the CorrelationBetween the Implicit Association Test and Explicit Self-Report Measures. Pers Soc Psychol Bull. 2005;31(10): 1369–1385. PMID: 16143669
53. Nosek BA. Moderators of the Relationship Between Implicit and Explicit Evaluation. J Exp PsycholGen. 2005; 134(4): 565–584. PMID: 16316292
54. Zaki J, Mitchell JP. Equitable decision making is associated with neural markers of intrinsic value. ProcNatl Acad Sci U S A. 2011; 108(49): 19761–19766. doi: 10.1073/pnas.1112324108 PMID: 22106300
55. Amodio DM, Frith CD. Meeting of minds: the medial frontal cortex and social cognition. Nat Rev Neu-rosci. 2006; 7(4): 268–277. PMID: 16552413
Sociality Provides Public Goods
PLOS ONE | DOI:10.1371/journal.pone.0119685 March 19, 2015 18 / 18