Social structure of collared peccaries (Pecari tajacu): does relatedness matter?
9
Please cite this article in press as: Biondo, C., et al., Social structure of collared peccaries (Pecari tajacu): Does relatedness matter? Behav. Process. (2014), http://dx.doi.org/10.1016/j.beproc.2014.08.018 ARTICLE IN PRESS G Model BEPROC-2886; No. of Pages 9 Behavioural Processes xxx (2014) xxx–xxx Contents lists available at ScienceDirect Behavioural Processes jo ur nal homep ag e: www.elsevier.com/locate/behavproc Social structure of collared peccaries (Pecari tajacu): Does relatedness matter? Cibele Biondo a,b,∗ , Patrícia Izar a , Cristina Y. Miyaki b , Vera S.R. Bussab a a Departamento de Psicologia Experimental, Instituto de Psicologia, Universidade de São Paulo, Av. Prof. Mello Moraes 1721, São Paulo, SP 05508-030, Brazil b Departamento de Genética e Biologia Evolutiva, Instituto de Biociências, Universidade de São Paulo, Rua do Matão 277, São Paulo, SP 05508-090, Brazil a r t i c l e i n f o Article history: Available online xxx Keywords: Kinship Microsatellite Spatial association Tayassuidae a b s t r a c t Relatedness is considered an important factor in shaping social structure as the association among kin might facilitate cooperation via inclusive fitness benefits. We addressed here the influence of relatedness on the social structure of a Neotropical ungulate, the collared peccary (Pecari tajacu). As peccaries are highly social and cooperative, live in stable cohesive herds and show certain degree of female philopatry and high mean relatedness within herds, we hypothesized that kin would be spatially closer and display more amicable and less agonistic interactions than non-kin. We recorded spatial association patterns and rates of interactions of two captive groups. Pairwise relatedness was calculated based on microsatellite data. As predicted, we found that kin were spatially closer than non-kin, which suggests that relatedness is a good predictor of spatial association in peccaries. However, relatedness did not predict the rates of social interactions. Although our results indirectly indicate some role of sex, age and familiarity, further studies are needed to clarify the factors that shape the rates of interactions in collared peccaries. This article is part of a Special Issue entitled: Neotropical Behaviour. © 2014 Elsevier B.V. All rights reserved. 1. Introduction Social structure is defined as the network of inter-individual relationships established among members of a given animal group (Hinde, 1976). This network is dynamic and can change over time under the influence of many factors. Some factors represent eco- logical constraints such as availability of resources and predation pressure (Kappeler and van Schaik, 2002). Others are related to group composition, including kinship, familiarity, age, sex and social status (Kappeler et al., 2013). Knowledge about such factors and how they affect the establishment of relationships is necessary to fully understand the social structure of a group of animals. Kin relationships have been proposed to be important in shaping social structure (Clutton-Brock and Janson, 2012). The association among kin might facilitate cooperation, and is predicted to be favored by natural selection when the inclusive benefits of cooper- ation outweigh the costs of sociality (Hamilton, 1964). This could be particularly true in many mammalian societies where relatives ∗ Corresponding author. Present address: Centro de Ciências Naturais e Humanas (CCNH), Universidade Federal do ABC (UFABC), Rua São Paulo s/n ◦ , São Bernardo do Campo, SP 09606-070, Brazil. Tel.: +55 11 2320 6307. E-mail addresses: [email protected], [email protected] (C. Biondo). live together as a consequence of female philopatry (Silk, 2007). If this was the case, we could expect that mammals prefer close rela- tives as social partners. In fact, there is empirical evidence both for and against that hypothesis. In rhesus monkeys (Macaca mulatta), for example, maternal and paternal half-sisters are spatially closer, present higher frequency of grooming than unrelated females, and help each other during agonistic interactions with other individ- uals (Schülke et al., 2013; Widdig et al., 2001). In southern flying squirrels (Glaucomys volans), on the other hand, prior familiarity, but not relatedness, predicts the patterns of associations between individuals (Garroway et al., 2013), which indicates that other fac- tors could also be important. In yellow-bellied marmot (Marmota flaviventris), in addition to kinship, age plays a significant role in social structure, with individuals of the same age class displaying more affiliative interactions among them than those of different age classes (Wey and Blumstein, 2010). Here, we studied the social structure of an ungulate species, the collared peccary, Pecari tajacu. This species is the most widespread of the Neotropical family Tayassuidae. This family together with the Old World family Suidae forms the suborder Suina (Agnarsson and May-Collado, 2008). The studies that addressed the role of relatedness in the social structure of Suina are focused in Suidae species, mainly in domestic pig and wild boars (both Sus scrofa). These studies have shown little or no influence of relatedness in the associations (Durrell et al., 2004; Iacolina et al., 2009) and rates http://dx.doi.org/10.1016/j.beproc.2014.08.018 0376-6357/© 2014 Elsevier B.V. All rights reserved.
Transcript of Social structure of collared peccaries (Pecari tajacu): does relatedness matter?
B
Sm
Ca
b
a
AA
KKMST
1
r(ulpgsat
safab
(C
(
h0
ARTICLE IN PRESSG ModelEPROC-2886; No. of Pages 9
Behavioural Processes xxx (2014) xxx–xxx
Contents lists available at ScienceDirect
Behavioural Processes
jo ur nal homep ag e: www.elsev ier .com/ locate /behavproc
ocial structure of collared peccaries (Pecari tajacu): Does relatednessatter?
ibele Biondoa,b,∗, Patrícia Izara, Cristina Y. Miyakib, Vera S.R. Bussaba
Departamento de Psicologia Experimental, Instituto de Psicologia, Universidade de São Paulo, Av. Prof. Mello Moraes 1721, São Paulo, SP 05508-030, BrazilDepartamento de Genética e Biologia Evolutiva, Instituto de Biociências, Universidade de São Paulo, Rua do Matão 277, São Paulo, SP 05508-090, Brazil
r t i c l e i n f o
rticle history:vailable online xxx
eywords:inshipicrosatellite
patial associationayassuidae
a b s t r a c t
Relatedness is considered an important factor in shaping social structure as the association among kinmight facilitate cooperation via inclusive fitness benefits. We addressed here the influence of relatednesson the social structure of a Neotropical ungulate, the collared peccary (Pecari tajacu). As peccaries arehighly social and cooperative, live in stable cohesive herds and show certain degree of female philopatryand high mean relatedness within herds, we hypothesized that kin would be spatially closer and displaymore amicable and less agonistic interactions than non-kin. We recorded spatial association patterns andrates of interactions of two captive groups. Pairwise relatedness was calculated based on microsatellite
data. As predicted, we found that kin were spatially closer than non-kin, which suggests that relatednessis a good predictor of spatial association in peccaries. However, relatedness did not predict the rates ofsocial interactions. Although our results indirectly indicate some role of sex, age and familiarity, furtherstudies are needed to clarify the factors that shape the rates of interactions in collared peccaries.This article is part of a Special Issue entitled: Neotropical Behaviour.© 2014 Elsevier B.V. All rights reserved.
. Introduction
Social structure is defined as the network of inter-individualelationships established among members of a given animal groupHinde, 1976). This network is dynamic and can change over timender the influence of many factors. Some factors represent eco-
ogical constraints such as availability of resources and predationressure (Kappeler and van Schaik, 2002). Others are related toroup composition, including kinship, familiarity, age, sex andocial status (Kappeler et al., 2013). Knowledge about such factorsnd how they affect the establishment of relationships is necessaryo fully understand the social structure of a group of animals.
Kin relationships have been proposed to be important in shapingocial structure (Clutton-Brock and Janson, 2012). The associationmong kin might facilitate cooperation, and is predicted to be
Please cite this article in press as: Biondo, C., et al., Social structure of cProcess. (2014), http://dx.doi.org/10.1016/j.beproc.2014.08.018
avored by natural selection when the inclusive benefits of cooper-tion outweigh the costs of sociality (Hamilton, 1964). This coulde particularly true in many mammalian societies where relatives
∗ Corresponding author. Present address: Centro de Ciências Naturais e HumanasCCNH), Universidade Federal do ABC (UFABC), Rua São Paulo s/n◦ , São Bernardo doampo, SP 09606-070, Brazil. Tel.: +55 11 2320 6307.
E-mail addresses: [email protected], [email protected]. Biondo).
ttp://dx.doi.org/10.1016/j.beproc.2014.08.018376-6357/© 2014 Elsevier B.V. All rights reserved.
live together as a consequence of female philopatry (Silk, 2007). Ifthis was the case, we could expect that mammals prefer close rela-tives as social partners. In fact, there is empirical evidence both forand against that hypothesis. In rhesus monkeys (Macaca mulatta),for example, maternal and paternal half-sisters are spatially closer,present higher frequency of grooming than unrelated females, andhelp each other during agonistic interactions with other individ-uals (Schülke et al., 2013; Widdig et al., 2001). In southern flyingsquirrels (Glaucomys volans), on the other hand, prior familiarity,but not relatedness, predicts the patterns of associations betweenindividuals (Garroway et al., 2013), which indicates that other fac-tors could also be important. In yellow-bellied marmot (Marmotaflaviventris), in addition to kinship, age plays a significant role insocial structure, with individuals of the same age class displayingmore affiliative interactions among them than those of differentage classes (Wey and Blumstein, 2010).
Here, we studied the social structure of an ungulate species, thecollared peccary, Pecari tajacu. This species is the most widespreadof the Neotropical family Tayassuidae. This family together withthe Old World family Suidae forms the suborder Suina (Agnarssonand May-Collado, 2008). The studies that addressed the role of
ollared peccaries (Pecari tajacu): Does relatedness matter? Behav.
relatedness in the social structure of Suina are focused in Suidaespecies, mainly in domestic pig and wild boars (both Sus scrofa).These studies have shown little or no influence of relatedness inthe associations (Durrell et al., 2004; Iacolina et al., 2009) and rates

IN PRESSG ModelB
2 al Processes xxx (2014) xxx–xxx
ooaa
awKsdwtcaiiaw1si(kderte
geawlcpenan
2
2
lSma11iqbsmcw3rbi
b
Table 1Description of the animals analyzed.
Group Animal Age category Sex Mother
A
Belly (Bel) Adult Female UnknownFore (For) Adult Female UnknownGland (Gla) Adult Female UnknownHind (Hin) Adult Female UnknownNeck (Nec) Adult Female UnknownTeco (Tec) Adult Male UnknownNina Infant Unknown NeckNigb Infant Unknown GlandNihc Infant Unknown HindPedrita (Ped)a Infant Female NeckPipoca (Pip)a Infant Female NeckGigi (Gig)b Infant Female GlandNininha (Nin)c Infant Female Hind
B
Dodô (Dod) Adult Female UnknownFifi (Fif) Adult Female UnknownLele (Lel) Adult Female UnknownPepa (Ppa) Adult Female UnknownPepe (Pep) Adult Female UnknownTico (Tic) Adult Male UnknownPateta (Pat) Infant Male Lele
a Neck’s twin litter before (Nin) and after individualization (Pedrita and Pipoca).b Gland’s twin litter before (Nig) and after individualization (Gigi) and the death
ARTICLEEPROC-2886; No. of Pages 9
C. Biondo et al. / Behaviour
f agonistic interactions of the individuals (Puppe, 1998). The socialrganization of S. scrofa is usually centered in one or more femalesnd its offspring and the groups can vary temporally, with splittingnd merging of subgroups (Kaminski et al., 2005).
In contrast, the collared peccary is known to be highly socialnd cooperative, living in stable herds of five to 25 individualsith males and females of various age classes (Bissonette, 1976;euroghlian et al., 2004; Mayer and Brandt, 1982). This specieshows male-biased dispersal, although a limited amount of femaleispersal has been documented (Cooper et al., 2009, 2010), and itas suggested that individuals may disperse into non-natal groups
o join a cohort of relatives (Cooper et al., 2011). Herds work asohesive social units, in which small inter-individual distancesre maintained by means of frequent amicable and few agonisticnteractions (Byers and Bekoff, 1981). Cooperation is a character-stic of herds, as exemplified by situations when adults clusterround juveniles and lead them away from predators, or evenhen the entire herd chases predators away (Byers and Bekoff,
981). Cooperation is also present during foraging behavior, wheneveral individuals eat close to each other, for example, consum-ng the same plant (Byers and Bekoff, 1981). Byers and Bekoff1981) suggested that these characteristics have evolved throughin selection. In support of this hypothesis, Cooper et al. (2011)emonstrated that mean genetic relatedness within herds is high,specially among females. However, the role of relatedness inates of affiliative and agonistic interactions and spatial associa-ion between individuals of this species up to now has not beenxplicitly tested.
In this study, we described the social structure of two captiveroups of collared peccaries using Social Network Analysis (Weyt al., 2008) and evaluated whether the patterns of amicable andgonistic interactions, and spatial association between individualsere correlated to their degree of relatedness, inferred from multi-
ocus microsatellite genotypes. As collared peccaries show stableohesive herds (Byers and Bekoff, 1981), certain degree of femalehilopatry and high mean genetic relatedness within herds (Coopert al., 2009, 2010, 2011), we hypothesized a role of genetic related-ess in their social structure, with kin in closer spatial associationnd showing more affiliative and less aggressive interactions thanon-kin.
. Materials and methods
.1. Study site and animals
The study was conducted at Vale Verde Farm, a private propertyocated in the municipality of São Miguel Arcanjo, in the State ofão Paulo, Brazil. This institution keeps farmed peccaries for com-ercial purposes since 1997. Two groups were studied: group A
nd B, which were created as subsets of two larger groups, group and group 2, respectively. Originally, group 1 was composed by9 individuals (16 adults and three juveniles) and group 2, by 13
ndividuals (all adults). All individuals were marked with radiofre-uency microchips for identification. Groups A and B were formedy five possible pregnant females and one adult male each for atudy about allosuckling in September 2003 (Biondo, 2006). Ani-als from the larger groups were captured using trap boxes with
apacity for 25 kg (an animal per trap box) and were immobilizedith acepromazine 1% (Acepran®, Univet, Brazil) for approximately
0 min. They were individually marked with hair cuts in differentegions of the body to permit identification at distance, facilitating
Please cite this article in press as: Biondo, C., et al., Social structure of cProcess. (2014), http://dx.doi.org/10.1016/j.beproc.2014.08.018
ehavioral data collection. Blood samples were taken from eachndividual for subsequent genetic analyses.
Each group was maintained in outdoor enclosures surroundedy 1.5 m-high net wire fences and had an area of around 900 m2
of one of the infants.c Hind’s twin litter before (Nih) and after individualization (Nininha) and the
death of one of the infants.
(17.0 m × 57.0 m), with a feeder of 2.0 m × 2.5 m positioned in anenclosed shelter (where food was provided for all individuals at thesame time) and a water tank of 1.0 m × 1.0 m. The ground was cov-ered with grass of the genus Brachiara and there were some treesand palms that guaranteed shade to animals. Water was providedad libitum. The animals were fed twice a day with food manufac-tured at the Farm, including corn, soy, wheat and mineral salt inthe formulation.
In the beginning of the behavioral study, in October 2003, groupA consisted of 12 individuals: one adult male, five adult femalesand six unsexed infants. However, in January 2004, two infantsdied from unknown causes. So, after these deaths, there were 10individuals in the group, including four female infants from threedifferent litters (Table 1). Group B had seven individuals during theentire observation period: one adult male, five adult females andone juvenile male (Table 1). Infants were captured to be markedand to have blood samples taken in February 2004, when theywere approximately 3–4 months old to reduce the risk of con-specific aggression resulting from human-specific olfactory cuesleft by handlers. Before marking, litters of group A were distin-guished by differences in size. In group B, as there was only oneinfant, its identification was straightforward.
2.2. Genetic analysis
Because genetic estimators of relatedness are calculated usingallele frequencies of the population, blood samples were also takenfrom all the individuals which remained in the original groups(13 individuals from group 1 and seven individuals from group2), from which the observed groups were taken, to calculate theallele frequencies of the captive population as a whole. However,the samples of some individuals could not be satisfactorily geno-typed for many loci and were discarded from subsequent analyses(two individuals from group 1 and three from group 2). In total 32individuals were analyzed: 17 from the observed groups (10 indi-viduals from group A and seven from group B) and 15 from the two
ollared peccaries (Pecari tajacu): Does relatedness matter? Behav.
original groups (11 individuals from group 1 and four from group 2).Blood samples were kept frozen at −20 ◦C. DNA was extracted usingstandard proteinase K and phenol–chloroform protocol (Sambrooket al., 1989).

ING ModelB
al Pro
ca(f2(m3oHoa9JT3Ps(gtip
e2hlr1
om0wabwSpanCdlSsdIlp
2
awatopaota
ARTICLEEPROC-2886; No. of Pages 9
C. Biondo et al. / Behaviour
Each individual was genotyped for 12 microsatellites: six spe-ific loci (JC011, JC033, JC035, JC040, JC041, Cooper et al., 2010;nd PT0226, Biondo et al., 2011), four developed for domestic pigACTG2, IGF1, SW444 and SW857, Rohrer et al., 1994, 1996) and twoor white-lipped peccaries (Tpec10 and Tpec12, Dalla Vecchia et al.,011). The forward primers were manufactured with a 5′-M13 tail5′-CACGACGTTGTAAAACGAC, Boutin-Ganache et al., 2001). Poly-
erase chain reaction (PCR) was performed in 12 �l containing:0–45 ng of DNA, 1× PCR buffer, 0.2 mM of dNTP mix, 2.5 mMf MgCl2, 3 pmol of reverse primer, 2 pmol of fluorescent (FAM,EX or TET, Applied Biosystems) M13 sequence primer, 1 pmolf forward primer (10 �M), 0.5 U of Taq polymerase (Pharmacia)nd 7.2 �l of MilliQ water. The cycling conditions were: 5 min at5 ◦C, 35 cycles of 94 ◦C for 30 s, AT (annealing temperature, JC011,C033, JC040, JC041, ACTG2 and SW444 = 60 ◦C; IGF1, SW857 andpec12 = 58 ◦C; JC035 and PT0226 = 55 ◦C; and Tpec10 = 52 ◦C) for0 s and 72 ◦C for 30 s, followed by a final step of 72 ◦C for 10 min.CR products were genotyped on ABI 377 and ABI 3730 automatedequencers (Applied Biosystems) and scored with Genotyper 2.1Applied Biosystems) and GeneMarker (Softgenetics) software. Allenotypes were characterized from at least two independent PCRso check for genotyping errors. The majority of the cases resultedn identical genotypes. When the genotypes were different, therocedure was repeated until a consensus was obtained.
MicroChecker 2.2.3 (Van Oosterhout et al., 2004) was used tostimate null allele frequencies and GenAlEx 6 (Peakall and Smouse,006) to calculate the number of alleles and expected and observedeterozygosities for each locus. Hardy–Weinberg and linkage equi-
ibrium were tested based on probability tests and log-likelihoodatio G-tests, respectively, in Genepop 3.4 (Raymond and Rousset,995).
None of the loci showed any evidence of null alleles orther genotyping errors. The mean number of alleles and theean expected and observed heterozygosities were 6.083 ± 1.782,
.689± 0.107 and 0.733 ± 0.142, respectively. The microsatellitesere in Hardy–Weinberg equilibrium (p > 0.016 after Benjamini
nd Yekutieli, 2001 correction). Significant linkage disequili-rium (p < 0.010 after Benjamini and Yekutieli, 2001 correction)as observed between three pairs of loci (SW444–PT0226,
W857–JC040 and JC033–JC040), suggesting that they are not inde-endent in this population. Although this result could be a statisticrtifact due to the small sample size (N = 32) or to inbreeding, aso linkage disequilibrium was observed in larger populations (seeooper et al., 2010 – for an example), in order to be conservative,ata on JC040 (since it showed evidence of linkage with two other
oci) and PT0226 (because it had only three alleles in contrast toW444, which had six) were discarded from subsequent analy-es. Therefore, pairwise relatedness (r) was calculated based onata from 10 microsatellites (JC011, JC033, JC035, JC041, ACTG2,
GF1, SW444, SW857, Tpec10, and Tpec12) using the maximumikelihood estimator of Wagner et al. (2006) implemented in therogram ML-Relate (Kalinowski et al., 2006).
.3. Behavioral data collection
Observations took place from October 2003 to June 2004, with total of 133 h (80 h for group A and 53 h for group B), after someeeks of habituation of the animals to the presence of observers,
nd one month after the formation of the groups, allowing animalso become well-socialized before data collection. The groups werebserved daily by C. Biondo for at least one week per month ineriods when the animals were more active, from 08:00 to 10:30
Please cite this article in press as: Biondo, C., et al., Social structure of cProcess. (2014), http://dx.doi.org/10.1016/j.beproc.2014.08.018
nd from 14:30 to 17:00. On each day of observation, one group wasbserved in the morning and the other in the afternoon. The grouphat was observed in the morning in one day was observed in thefternoon in the next day and vice versa; and we tried to equalize
PRESScesses xxx (2014) xxx–xxx 3
the number of observations in the morning and in the afternoon forboth groups.
All occurrence sampling (Altmann, 1974) was used to recordthe frequencies of affiliative and agonistic interactions. For simul-taneous monitoring of all individuals of the group, a field assistant,trained by C. Biondo (CB) until perfect concordance, helped indata collection by warning CB about interactions whenever theyoccurred (but the final record was called by CB). The afilliative inter-actions recorded were mutual rub and olfactory investigation andcontact. In mutual rub, two animals positioned side-by-side in ahead-tail orientation rub their heads vertically (up and down) in thedorsal gland region of each other. Olfactory investigation and con-tact comprised two subcategories: olfactory investigation, whenan animal touches its nose on body parts of another animal, mov-ing the nasal disk; and social grooming, in which an animal rubsits nose up and down in regions of the body of another animal,licking and biting. Agonistic interactions observed included threatbehaviors, such as snarl and tooth clack, and squabbles, when twoanimals raise their noses with open mouths and move back andforth, from one side to another against the other’s nose, snarlingand making bite movements. For a complete description of thesebehavioral categories, see Byers and Bekoff (1981). In all instances,the initiators and receivers of the interactions were recorded.
In order to analyze the spatial association, the pattern of sub-group formation among individuals was collected instantaneouslyat 10-min regular intervals (scan sampling; Altmann, 1974). Toidentify the subgroups, we used the relative distance criteriaaccording to Ferraz et al. (2013): two individuals were consideredin the same subgroup if the distance between them was not higherthan the distance between subgroups. When the animals werewalking in a single line, one behind the other, they were consideredin the same subgroup.
The enclosures of the two observed groups were side-by-side.This was the same configuration of the original larger groups. Thebehavioral recordings were made from a platform positioned at1.50 m above the ground and in the boundary between the enclo-sures, where the observer and the assistant had a complete viewof both groups. When the animals were far, they were identifiedusing a binocular B-725II (SAMSUNG – 7 mm × 25 mm, Field 7.6,Seoul, South Korea).
2.4. Social interactions and spatial association analysis
Agonistic and affiliative interactions were organized in n × nmatrices (n = individual), where the cell entries indicated the rates(frequency/hour of observation) of interactions of each dyad. Forthe analysis of spatial association, the scan data were organized inmatrices in which the rows corresponded to the time of the scanand the columns to the individuals. The cell entries were completedwith the subgroup number. The individuals that belonged to thesame subgroup received the same number and the individuals thatbelonged to different subgroups, different numbers. These matriceswere converted into n × n dissimilarity matrices using the index ofspatial association of Anderberg (1973): ID (A, B) = d/a + d, where a isthe number of times that individuals A and B were in the same sub-group; d is the number of times which A was in one subgroup andB was not, or vice versa. The index value varies from zero to one,where values closer to zero indicate strong association betweenindividuals.
Because the infants in group A were individualized and markedonly in February 2004, two behavior matrices were constructedfor each group: one for the period previous to marking of infants
ollared peccaries (Pecari tajacu): Does relatedness matter? Behav.
(which comprises observations from October 2003 to mid February2004, and called as first phase) and another related to the subse-quent period (which comprises observations from late February toJune 2004, and called as second phase).
ING ModelB
4 al Pro
tbbvtwcop
inenhviotsN
titppvuiciai
ttccow
ARTICLEEPROC-2886; No. of Pages 9
C. Biondo et al. / Behaviour
To verify if kin were in close association and showed more affilia-ive and less aggressive interactions than non-kin, correlation testsetween matrices of relatedness and interaction rates and Ander-erg’s indices were conducted using tau Kr test in MatrixTester.2.2.3 (Hemelrijk, 1990a,b). Each test included 10,000 permuta-ions. As the blood samples for genetic analysis were collectedhen there were only four infants in group A (second phase), the
orrelations of the first phase were performed using only the valuesf the adult dyads. This was also done with group B for comparisonurposes.
All the matrices were analyzed using social network analysismplemented in the software SOCPROG (Whitehead, 2009). Socialetworks consist of nodes, which represent the individuals, anddges, which represent the strength of the relationship betweenodes. Thicker edges represent stronger relationships. In order toave a direct relationship between the thickness of the edge and thealue of association between individuals, the values of Anderberg’sndex were converted using the formula 1 − x, where x is the valuef the index. Therefore, thicker edges represents higher values ofhe converted index and, consequently, stronger associations. Theocial networks were graphically visualized as sociograms usingetdraw (Borgatti, 2002).
SOCPROG was also used to identify clusters of individuals ando calculate the value of eigenvector centrality for each individualn each group and phase. Clusters were identified by calculatinghe modularity (modularity-1), which is the difference between theroportion of the total association within clusters and the expectedroportion, given the summed associations of the different indi-iduals (Newman, 2004). Values of modularity above 0.3 indicateseful group divisions (Newman, 2004). The eigenvector centrality
s a measure given by the first eigenvector of the matrix of asso-iation indices or interaction rates. Higher values indicate that anndividual has strong associations to other individuals that, in turn,lso have strong associations, and therefore, has a central positionn the network.
In order to verify if kinship would have a significant role inhe formation of the clusters identified, correlations between clus-er and kinship matrices were conducted using the Dietz’R matrix
Please cite this article in press as: Biondo, C., et al., Social structure of cProcess. (2014), http://dx.doi.org/10.1016/j.beproc.2014.08.018
orrelation test also in SOCPROG. The cluster matrices were builtoding 1 to the dyads belonging to the same cluster and 0 to thosef different clusters. To construct the kinship matrices, all dyadsith values of relatedness (r) equal or above 0.125 (expected value
Fig. 1. Distributions of the coefficients of rel
PRESScesses xxx (2014) xxx–xxx
for third degree relatives) were considered to be related and werecoded as 1; the dyads with r below that value were considered unre-lated and were coded as 0. Cluster and kinship matrices of the firstphase were constructed using just adults due to the same reasonsexplained above concerning tau Kr tests.
2.5. Other analyses
Since the data were not in conformity with a normal distribu-tion (Kolmogorov–Smirnov test with Lilliefors correction, p < 0.05),the medians of relatedness were compared between groups usingMann–Whitney U test computed in SPSS 13.0 (SPSS Inc.). Thissoftware was also employed to compare the medians of the affilia-tive and agonistic interactions rates in each group using Wilcoxonsigned-rank test.
3. Results
3.1. Relatedness
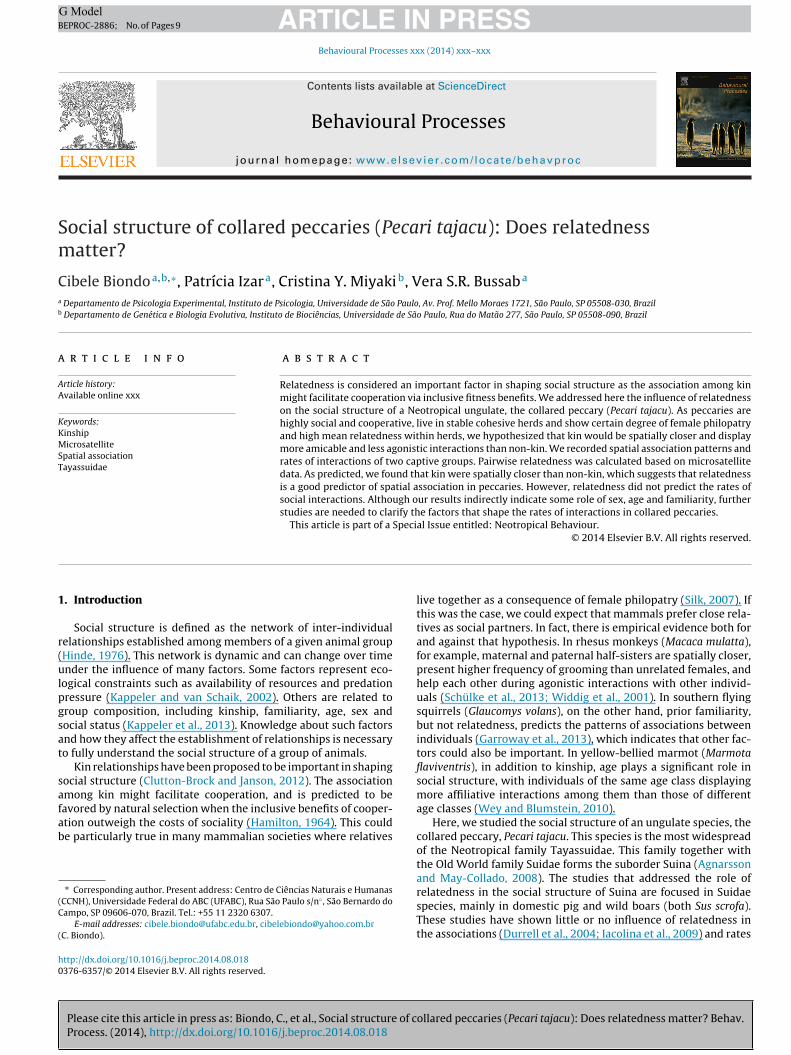
Coefficients of relatedness ranged from 0.00 to 0.50(mean = 0.12 ± 0.15) in group A and 0.00 to 0.56 in group B(mean = 0.15 ± 0.21) and the medians were similar in both groups(group A = 0.05, group B = 0.06; Mann–Whitney U test, Z = −0.058,p = 0.954). However, the distribution of the coefficients (Fig. 1)showed that group A was constituted by dyads with variousdegrees of relatedness, while group B had many unrelated dyadsand some highly related ones (with relatedness coefficientscompatible with first degree relatives).
3.2. Social interactions
A total of 710 interactions in 133 hr of observation (5.34interactions per hour), 487 for group A in 80 hr (6.09 interac-tions per hour) and 223 for group B in 53 hr (4.21 interactionsper hour), was recorded. The means and the medians of inter-action rates and Anderberg’s indices are shown in Table 2. Therates of affiliative interactions (mutual rub and olfactory investiga-
ollared peccaries (Pecari tajacu): Does relatedness matter? Behav.
tion and contact – group A: mean = 0.75 ± 1.19 and median = 0.25;group B: mean = 0.78 ± 0.83 and median = 0.50) were higher thanthose of agonistic interactions (Table 2) in both groups (group A:Wilcoxon signed-rank test, Z = −4.501, p = 0.000; group B: Wilcoxon
atedness. (a) Group A and (b) group B.

ARTICLE IN PRESSG ModelBEPROC-2886; No. of Pages 9
C. Biondo et al. / Behavioural Processes xxx (2014) xxx–xxx 5
Table 2Means (M), standard deviations (SD), and medians (Md) of rates of agonistic inter-actions (AI), mutual rub (MB), and olfactory investigation and contact (OIC), andAderberg’s index of spatial association (SA) registered in each group for the totalperiod of observation (just for interactions) and for each phase separately.
Behavior Phase Group A Group B
M ± SD Md M ± SD Md
AITotal 0.27 ± 0.51 0.00 0.15 ± 0.22 0.00First 0.12 ± 0.18 0.00 0.06 ± 0.11 0.00Second 0.39 ± 0.65 0.20 0.24 ± 0.27 0.20
MRTotal 0.29 ± 0.54 0.00 0.32 ± 0.41 0.20First 0.26 ± 0.57 0.00 0.10 ± 0.23 0.00Second 0.32 ± 0.51 0.00 0.54 ± 0.43 0.40
OICTotal 0.46 ± 0.82 0.25 0.46 ± 0.57 0.25First 0.23 ± 0.30 0.10 0.12 ± 0.19 0.00Second 0.65 ± 1.03 0.25 0.80 ± 0.63 0.60
ssi
3
bnKpBp
iBsgA
Table 3Values of eigenvector centrality observed for each individual in each phase. AI,agonistic interaction; MR, mutual rub; OIC, olfactory investigation and contact.
Group Individual AI MR OIC
Phase 1 Phase 2 Phase 1 Phase 2 Phase 1 Phase 2
A
Belly 0.42 0.28 0.11 0.34 0.38 0.43Fore 0.23 0.47 0.36 0.34 0.36 0.39Gland 0.25 0.19 0.59 0.41 0.39 0.25Hind 0.62 0.26 0.34 0.35 0.35 0.06Neck 0.39 0.19 0.27 0.41 0.11 0.47Teco 0.27 0.66 0.57 0.55 0.59 0.59Nn 0.29 – 0.00 – 0.19 –Ng 0.11 – 0.00 – 0.15 –Nh 0.00 – 0.00 – 0.21 –Pedrita – 0.33 – 0.00 – 0.07Pipoca – 0.13 – 0.00 – 0.13Gigi – 0.04 – 0.00 – 0.12Nininha – 0.06 – 0.00 – 0.02
B
Dodô 0.00 0.25 0.65 0.41 0.34 0.49Fifi 0.32 0.41 0.71 0.46 0.00 0.22Lele 0.20 0.21 0.16 0.28 0.47 0.37Pepa 0.32 0.31 0.04 0.41 0.00 0.44
Fi
SAFirst 0.30 ± 0.15 0.28 0.37 ± 0.20 0.27Second 0.46 ± 0.14 0.47 0.52 ± 0.11 0.56
igned-rank test, Z = −4.723, p = 0.000). Both groups showed strongpatial association between individuals with mean Anderberg’sndices lower than 0.58 (Table 2).
.2.1. Agonistic interactionsIn contrast to it was predicted, no correlation was found
etween rates of agonistic interactions and coefficients of related-ess between dyads in both groups (first phase: group A, taur = −0.173, pl = 0.2875; group B, tau Kr = −0.219; pl = 0.171; secondhase: all individuals – group A, tau Kr = −0.110, pl = 0.184; group, tau Kr = 0.056; pr = 0.389; only adults – group A, tau Kr = −0.043,l = 0.429; group B, tau Kr = −0.137; pl = 0.287).
In the first phase, Hind’s infants (Table 1) did not participaten the sociogram of group A and Dodo, in the sociogram of group
Please cite this article in press as: Biondo, C., et al., Social structure of cProcess. (2014), http://dx.doi.org/10.1016/j.beproc.2014.08.018
. In both groups, all the individuals participated in the socialtructure based on agonistic interactions in the second phase. Bothroups were divided into two clusters in the first phase (group: maximum modularity = 0.393 Fig. 2a; group B: maximum
ig. 2. Sociograms of agonistic interactions. (a and b) Group A, first and second phase, rendividuals and line widths, rates of interaction. Circle = female; rectangle = male; triangle
Pepe 0.60 0.33 0.16 0.34 0.41 0.21Tico 0.37 0.64 0.17 0.50 0.59 0.52Pateta 0.51 0.33 0.00 0.10 0.39 0.25
modularity = 0.500, Fig. 2c) but not in the second (group A:maximum modularity = 0.265, Fig. 2b; group B: maximum mod-ularity = 0.261, Fig. 2d). However, kinship had no influence inclusters composition of the first phase (Dietz’R tests, group A:r = 0.289, p = 0.501; group B: r = −0.185, p = 1.000).
In the first phase, in both groups, one female was the mostcentral individual with the highest eigenvector centrality: Hind ingroup A and Pepe in group B (Table 3). In the second phase, maleswere the most central individuals in both groups (Table 3).
ollared peccaries (Pecari tajacu): Does relatedness matter? Behav.
3.2.2. Affiliative interactionsAs observed for agonistic interactions, the rates of mutual rub
did not correlate with the pairwise relatedness in both groups (first
spectively; (c and d) group B, first and second phase, respectively. Nodes represent = juvenile.

IN PRESSG ModelB
6 al Processes xxx (2014) xxx–xxx
pppATrgipttap
iatmngp(wIaa(sg
oIAtsmFBpghi
3
cvtpAKp
tis–uge
4
n
Table 4Values of eigenvector centrality observed for each individual in each phase for spatialassociation.
Group Individuals Phase 1 Phase 2
A
Belly 0.28 0.29Fore 0.27 0.27Gland 0.29 0.35Hind 0.28 0.34Neck 0.29 0.28Teco 0.17 0.23Nna 0.31 –Nnb 0.31 –Nga 0.31 –Ngb 0.31 –Nha 0.30 –Nhb 0.30 –Pedrita – 0.36Pipoca – 0.37Gigi – 0.36Nininha – 0.28
B
Dodo 0.41 0.36Fifi 0.40 0.37Lele 0.37 0.42Pepa 0.42 0.40Pepe 0.41 0.36Tico 0.22 0.31Pateta 0.37 0.42
ARTICLEEPROC-2886; No. of Pages 9
C. Biondo et al. / Behaviour
hase: group A, tau Kr = 0.045, pr = 0.406; group B, tau Kr = −0.134,l = 0.322; second phase: all individuals – group A, tau Kr = −0.004,l = 0.480; group B, tau Kr = −0.038, pl = 0.416; only adults – group, tau Kr = 0.085, pr = 0.358; group B, tau Kr = −0.104, pl = 0.307).he rates of olfactory investigation and contact also did not cor-elate with relatedness, with the exception of the first phase inroup B, which showed a negative correlation, with kin display-ng lower rates of this behavior than non-kin, contrasting to it wasredicted (first phase: group A, tau Kr = −0.185, pl = 0.252; group B,au Kr = −0.712, pl = 0.030; second phase: all individuals – group A,au Kr = 0.038, pr = 0.372; group B, tau Kr = −0.012, pl = 0.466; onlydults – group A, tau Kr = 0.167, pr = 0.260; group B, tau Kr = −0.072,l = 0.394).
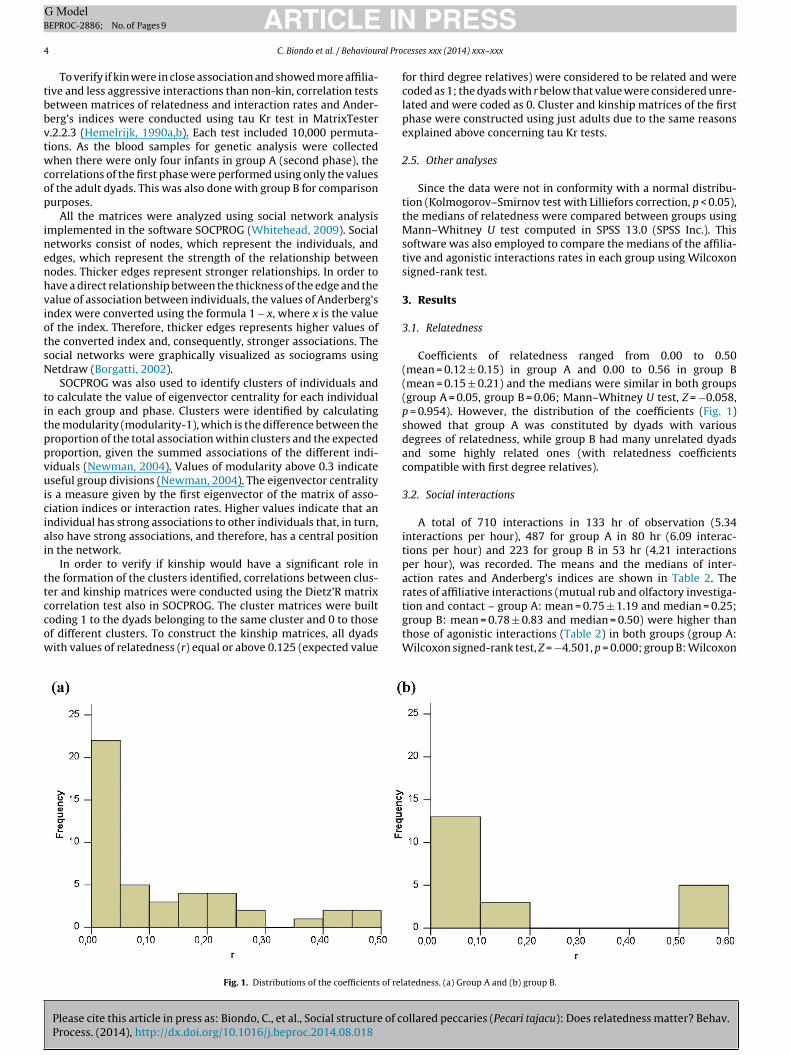
In the first phase, in both groups, the mutual rub sociogramsndicated that infants did not integrate the social structure (Fig. 3and c). Both groups were divided into clusters (group A: two clus-ers, maximum modularity = 0.356, Fig. 3a; group B: three clusters,
aximum modularity = 0.461, Fig. 3c), however these clusters wereot defined by kinship (Dietz’R tests, group A: r = 0.055, p = 0.661;roup B: r = 0.040, p = 0.595). In the second phase, in group A, infantsarticipated of the structure but as a separated cluster from adultsmaximum modularity = 0.313, Fig. 3b). Again, these two clustersere not predicted by kinship (Dietz’R tests, r = −0.036, p = 0.729).
n group B, no clusters were formed (maximum modularity = 0.178)nd the unique infant, Pateta, participated in the structure inter-cting with three adult females: Lele (his mother), Dodo and PepaFig. 3d). Males were the most central individuals in both groups,howing high values of eigenvector centralities (in both phases inroup A and in the second phase in group B, Table 3).
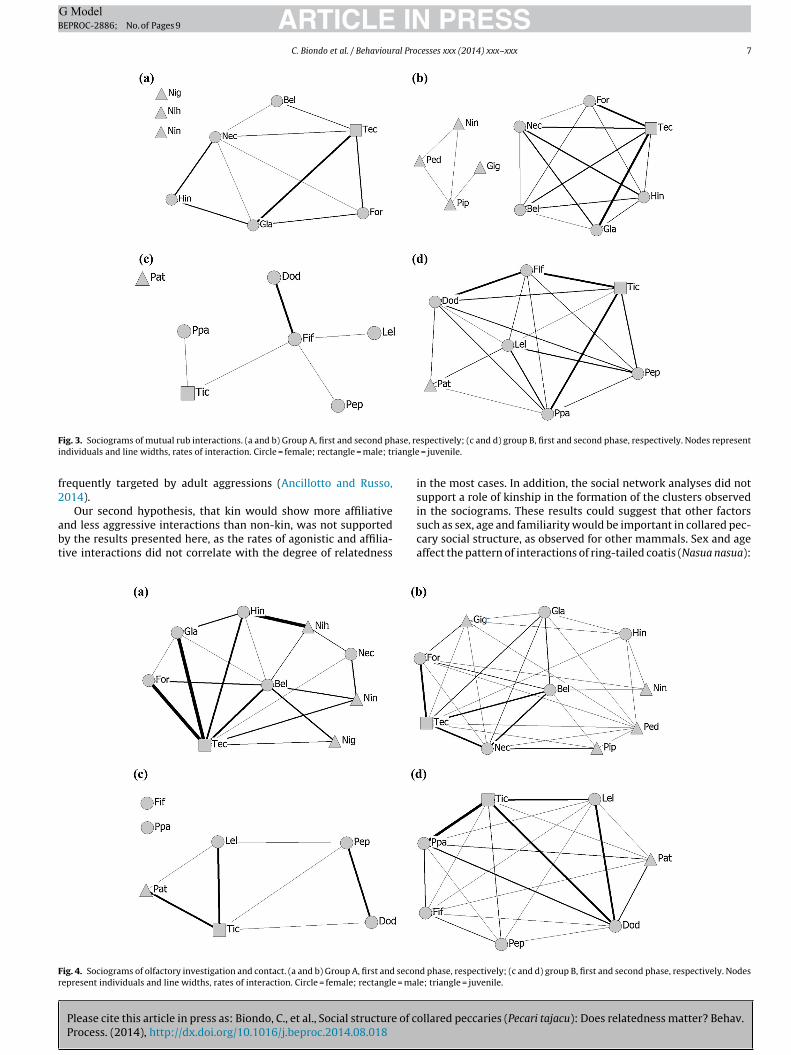
In contrast to mutual rub, infants integrated the sociograms oflfactory investigation and contact since the first phase (Fig. 4).n both groups, clusters were identified in the first phase (group: four clusters, maximum modularity = 0.329, Fig. 4a; group B:
hree clusters, maximum modularity = 0.370, Fig. 4c) but not in theecond (group A: maximum modularity = 0.180, Fig. 4b; group B:aximum modularity = 0.192, Fig. 4d). Two adult females (Pepa and
ifi) were not included in the structure in the first phase in group (Fig. 4c). Kinship did not predict the clusters formed in the firsthase in both groups (Dietz’R tests, group A: r = −0.068, p = 0.749;roup B: r = −0.364, p = 1.000). As observed for mutual rub, malesad central positions with high values of eigenvector centralities
n both phases and groups (Table 3).
.3. Spatial association
As predicted, the coefficients of relatedness were negativelyorrelated with the Anderberg’s indices, meaning that related indi-iduals were closer in the spatial structure, with exception only ofhe second phase in group A (first phase: group A, tau Kr = −0.493,l = 0.019; group B, tau Kr = −0.463, pl = 0.043; second phase: group
– all individuals: tau Kr = −0.029, pl = 0.390; only adults: taur = 0.021, pr = 0.447; group B – all individuals: tau Kr = −0.443,l = 0.016; only adults: tau Kr = −0.509, pl = 0.024).
The sociograms showed that all individuals were connected inhe network and there was no formation of clusters in both groupsn both phases (group A: first phase – maximum modularity = 0.085,econd phase – maximum modularity = 0.102; group B: first phase
maximum modularity = 0.148, second phase – maximum mod-larity = 0.144; Fig. 5). In both groups, except in the first phase inroup B, infants were the individuals with the highest values ofigenvector centrality and the males with the lowest (Table 4).
Please cite this article in press as: Biondo, C., et al., Social structure of cProcess. (2014), http://dx.doi.org/10.1016/j.beproc.2014.08.018
. Discussion
We tested here two hypotheses concerning the role of related-ess in the social structure of collared peccaries: (1) individuals
with high degree of relatedness would be closely associated and(2) show more affiliative and less aggressive interactions than unre-lated individuals.
In agreement to our first hypothesis, Anderberg’s indices werenegatively correlated with relatedness in group A in the first phaseand in group B in both phases, indicating that close relatives werecloser in the spatial structure and evidencing the role of relatednessas a factor which promotes cohesion. Proximity between relativescould facilitate the emergence of cooperative behaviors observedin this species, such as food sharing and predator defense (Byersand Bekoff, 1981) due to benefits associated to inclusive fitness(Hamilton, 1964). Our results, associated to high degree of related-ness among individuals in natural herds (Cooper et al., 2011),support the hypothesis that kin selection could have an impor-tant role in the evolution of social behavior in collared peccaries,as proposed by Byers and Bekoff (1981). Evidence that relatednessis correlated with association patterns between pairs of individ-uals are observed in a variety of mammalian species, for example,African elephants (Loxodonta africana, Archie et al., 2006), Atlanticspotted dolphins (Stenella frontalis, Welsh and Herzing, 2008), andmandrills (Mandrillus sphinx, Bret et al., 2013).
Our observations in captivity support the idea from field datathat collared peccaries herds are highly cohesive and coordi-nated units (Byers & Bekoff, 1981). The means and medians ofAnderberg’s indices were lower than 0.58 in both groups, indi-cating strong spatial associations. In addition, social networksanalysis revealed that groups were cohesive with no clusteringdivisions with all individuals connected. Patterns of spatial asso-ciation were marked by infants occupying a central position andmales being more peripheral in both studied groups. The cen-trality of the infants in the network may be linked to high adulttolerance, as exemplified by published events of food removal orattacks by juveniles without aggressive responses by adults (Byersand Bekoff, 1981). The tolerance to infants has been observedin many mammalian species. In yellow-bellied marmots (M. fla-viventris) for example, infants are important for the maintenanceof social cohesion, receiving more affiliattive interactions than
ollared peccaries (Pecari tajacu): Does relatedness matter? Behav.
older individuals (Wey and Blumstein, 2010). In the same way,juveniles of European free-tailed bats (Tadarida teniotis) are less
ARTICLE IN PRESSG ModelBEPROC-2886; No. of Pages 9
C. Biondo et al. / Behavioural Processes xxx (2014) xxx–xxx 7
F ase, rei iangle
f2
abt
Fr
ig. 3. Sociograms of mutual rub interactions. (a and b) Group A, first and second phndividuals and line widths, rates of interaction. Circle = female; rectangle = male; tr
requently targeted by adult aggressions (Ancillotto and Russo,014).
Please cite this article in press as: Biondo, C., et al., Social structure of cProcess. (2014), http://dx.doi.org/10.1016/j.beproc.2014.08.018
Our second hypothesis, that kin would show more affiliativend less aggressive interactions than non-kin, was not supportedy the results presented here, as the rates of agonistic and affilia-ive interactions did not correlate with the degree of relatedness
ig. 4. Sociograms of olfactory investigation and contact. (a and b) Group A, first and seconepresent individuals and line widths, rates of interaction. Circle = female; rectangle = ma
spectively; (c and d) group B, first and second phase, respectively. Nodes represent = juvenile.
in the most cases. In addition, the social network analyses did notsupport a role of kinship in the formation of the clusters observed
ollared peccaries (Pecari tajacu): Does relatedness matter? Behav.
in the sociograms. These results could suggest that other factorssuch as sex, age and familiarity would be important in collared pec-cary social structure, as observed for other mammals. Sex and ageaffect the pattern of interactions of ring-tailed coatis (Nasua nasua):
d phase, respectively; (c and d) group B, first and second phase, respectively. Nodesle; triangle = juvenile.

ARTICLE IN PRESSG ModelBEPROC-2886; No. of Pages 9
8 C. Biondo et al. / Behavioural Processes xxx (2014) xxx–xxx
F e, respi le; re
abipn
atmcwaf(tbt(nAaithcsptrd
ass(fbi
ig. 5. Sociograms of spatial association. (a and b) Group A, first and second phasndividuals and line widths, the corrected values of Anderberg’s index. Circle = fema
dult females groom each other more frequently than other mem-ers of the group; in contrast, juveniles and subadults rarely groom
ndividuals of the same age (Hirsch et al., 2012). Prior familiarityredicts the proportion of time southern flying squirrels (G. volans)est together in the winter, but not kinship (Garroway et al., 2013).
Although we did not specifically evaluate the influence of sex,ge and familiarity, some of our findings could suggest a role ofhese factors in the peccary social structure. We observed that
ales were central in mutual rub and olfactory investigation andontact networks in both phases and in agonistic interactions net-ork in the second phase, with very strong relationships with some
dult females. It could be explained by the fact that adult males andemales rubbed each other more frequently than adult females didDíaz, 1978). In addition, both mutual rub and olfactory investiga-ion contact are involved in reproductive behavior: before displayehavioral patterns exclusively associated to courtship and copula-ion, male and female frequently sniff, nuzzle and rubbed each otherSowls, 1984). In addition, mutual rub data indicated that infants doot rub adults in the first phase and in the second phase, in group, infants formed a cluster and performed this behavior exclusivelymong them. This result could be explained by a physical factor:nfants cannot reach the gland of an adult individual to rub, andheir effort to do this is clear. Therefore, it would be possible toypothesize that rubbing individuals of similar ages could be moreomfortable since they are similar in height. However, despite theirimilar heights in the first phase, infants did not rub each other. Aossible explanation is that rubbing starts at a very specific time ofhe individual’s development, possibly due to delayed gland matu-ity, as infant gland do not seem to produce fluids until they are 40ays old (Hannon et al., 1991).
Puppe (1998) did not find a role of relatedness in the rates ofgonistic interactions between the individuals in another Suinapecies, the domestic pig (S. scrofa). However, unfamiliar dyadshowed significantly more agonistic interactions than familiar
Please cite this article in press as: Biondo, C., et al., Social structure of cProcess. (2014), http://dx.doi.org/10.1016/j.beproc.2014.08.018
Puppe, 1998). Interestingly, the peccaries studied here were allamiliar with each other in both groups, because they had alreadyeen together before this study, and showed lower rates of agonistic
nteractions compared to the rates of affiliative interactions.
ectively; (c and d) group B, first and second phase, respectively. Nodes representctangle = male; triangle = juvenile.
As we found that relatedness affects spatial proximity but notthe rates of affiliative and agonistic interactions, we cannot discardthe importance of other factors. Thus, additional studies are neededto clarify which intrinsic factors are important in the patterns ofinteractions of collared peccary social structure.
5. Conclusions
This study contributes toward our understanding of social struc-ture of Suina species, since we addressed for the first time theimportance of relatedness in the social interactions and spatialassociation of a species of the Neotropical family Tayassuidae. Inagreement with our hypothesis that kin were in close proximity inthe social structure, we found a correlation between the degree ofrelatedness and the spatial association in group B in both phasesand in group A in the first phase, which suggests some impor-tance of kinship as a factor that promotes cohesion in peccary socialgroups. However, contrary to our hypotheses, we found no evi-dence that kin show more affiliative and less aggressive interactionthan non-kin in both groups. It suggests that relatedness does notpredict the rates of interactions. The motivations to interact couldbe influenced by other variables, such as sex, age, and familiarityand other studies needs to be done to explain which factors influ-ences the rates of interactions and the social structures of collaredpeccaries.
Acknowledgements
We would like to thank Dr. Jerry Hogan for the invitation towrite this manuscript. Manuel Carrano for permitting us to con-duct this research in his farm; Valdir, Nivaldo and Alfio Biondofor valuable support with the management of the animals; VanildaA. M. Biondo for helping in the behavioral observations; Sérgio L.
ollared peccaries (Pecari tajacu): Does relatedness matter? Behav.
G. Nogueira-Filho and Guilherme Carrano for the assistance in thefeed formulation; Érika S. Tavares, Tania E. Matsumoto and FláviaT. Presti for aiding in the genetic analyses; Fábio S. R. do Amaral andtwo anonymous reviewers for helpful comments and suggestions

ING ModelB
al Pro
oFd(ta
R
A
A
A
AA
B
B
B
B
B
B
B
B
C
C
C
C
D
D
D
F
ARTICLEEPROC-2886; No. of Pages 9
C. Biondo et al. / Behaviour
n an earlier version of the manuscript. Funding was provided byAPESP (02/04356-0) and CNPq (140083/2002-2). This work waseveloped in the Research Center on Biodiversity and ComputingBioComp) of the Universidade de São Paulo (USP), supported byhe USP Provost’s Office for Research. This study was conductedccording to the Brazilian laws.
eferences
gnarsson, I., May-Collado, L.J., 2008. The phylogeny of Cetartiodactyla: the impor-tance of dense taxon sampling, missing data, and the remarkable promise ofcytochrome b to provide reliable species-level phylogenies. Mol. Phylogenet.Evol. 48, 964–985.
ltmann, J., 1974. Observational study of behavior – sampling methods. Behaviour49, 227–267.
ncillotto, L., Russo, D., 2014. Selective aggressiveness in European free-tailed bats(Tadarida teniotis): influence of familiarity, age and sex. Naturwissenschaften101, 221–228.
nderberg, M.R., 1973. Cluster Analysis for Applications. Academic Press, New York.rchie, E.A., Moss, C.J., Alberts, S.C., 2006. The ties that bind: genetic relatedness
predicts the fission and fusion of social groups in wild African elephants. Proc.R. Soc. B: Biol. Sci. 273, 513–522.
enjamini, Y., Yekutieli, D., 2001. The control of the false discovery rate in multipletesting under dependency. Ann. Stat. 29, 1165–1188.
iondo, C., (PhD thesis) 2006. Estrutura social e alo-amamentac ão de catetos(Tayassu tajacu) em cativeiro. Universidade de São Paulo, São Paulo.
iondo, C., Keuroghlian, A., Gongora, J., Miyaki, C.Y., 2011. Population genetic struc-ture and dispersal in white-lipped peccaries (Tayassu pecari) from the BrazilianPantanal. J. Mammal. 92, 267–274.
issonette, J.A., (PhD thesis) 1976. Relationship of social organization in collaredpeccaries to resource utilization. University of Michigan, Ann Arbor.
orgatti, S.P., 2002. NetDraw Software for Network Visualization. Analytic Technolo-gies, Lexington, KY.
outin-Ganache, I., Raposo, M., Raymond, M., Deschepper, C.F., 2001. M13-tailedprimers improve the readability and usability of microsatellite analy-ses performed with two different allele-sizing methods. Biotechniques 13,24–27.
ret, C., Sueur, C., Ngoubangoye, B., Verrier, D., Deneubourg, J.L., Petit, O., 2013. Socialstructure of a semi-free ranging group of mandrills (Mandrillus sphinx): a socialnetwork analysis. PLOS ONE 8, e83015.
yers, J.A., Bekoff, M., 1981. Social, spacing, and cooperative behavior of the collaredpeccary, Tayassu-tajacu. J. Mammal. 62, 767–785.
lutton-Brock, T., Janson, C., 2012. Primate socioecology at the crossroads: past,present, and future. Evol. Anthropol. 21, 136–150.
ooper, J., Vitalis, R., Waser, P., Gopurenko, D., Hellgren, E., Gabor, T., DeWoody, J.,2009. Quantifying male-biased dispersal among social groups in the collaredpeccary (Pecari tajacu) using analyses based on mtDNA variation. Heredity 104,79–87.
ooper, J., Waser, P., Gopurenko, D., Hellgren, E., Gabor, T., DeWoody, J., 2010. Mea-suring sex-biased dispersal in social mammals: comparisons of nuclear andmitochondrial genes in collared peccaries. J. Mammal. 91, 1413–1424.
ooper, J.D., Waser, P.M., Hellgren, E.C., Gabor, T.M., DeWoody, J.A., 2011. Is sexualmonomorphism a predictor of polygynandry? Evidence from a social mammal,the collared peccary. Behav. Ecol. Sociobiol. 65, 775–785.
alla Vecchia, A.C., Biondo, C., Sanches, A., Keuroghlian, A., Miyaki, C.Y., Galetti,M., Galetti Jr., P.M., 2011. Isolation and characterization of microsatellite locifor white-lipped peccaries (Tayassu pecari) and cross-amplification in collaredpeccaries (Pecari tajacu). Conserv. Genet. Resour. 3, 151–154.
íaz, G.A.C., 1978. Social behavior of collared peccary (Tayassu tajacu) in captivity.CIEBA 22, 73–126.
urrell, J., Sneddon, I., O’connell, N., Whitehead, H., 2004. Do pigs form preferential
Please cite this article in press as: Biondo, C., et al., Social structure of cProcess. (2014), http://dx.doi.org/10.1016/j.beproc.2014.08.018
associations? Appl. Anim. Behav. Sci. 89, 41–52.erraz, K.M.B., Izar, P., Sato, T., Nishida, S., 2013. Social and spatial relation-
ships of capybaras in a semi-confined production system. In: Moreira, J.R.,Ferraz, K.M.P.M.B., Herrera, E.A., Macdonald, D.W. (Eds.), Capybara. Springer,New York.
PRESScesses xxx (2014) xxx–xxx 9
Garroway, C.J., Bowman, J., Wilson, P.J., 2013. Complex social structure of south-ern flying squirrels is related to spatial proximity but not kinship. Behav. Ecol.Sociobiol. 67, 113–122.
Hamilton, W.D., 1964. The genetical evolution of social behaviour. J. Theor. Biol. 7,1–52.
Hannon, P.G., Dowdell, D.M., Lochmiller, R.L., Grant, W.E., 1991. Dorsal-gland activityin peccaries at various physiological states. J. Mammal. 72, 825–827.
Hemelrijk, C.K., 1990a. A matrix partial correlation test used in investigations ofreciprocity and other social-interaction patterns at group level. J. Theor. Biol.143, 405–420.
Hemelrijk, C.K., 1990b. Models of, and tests for, reciprocity, unidirectionality andother social-interaction patterns at a group level. Anim. Behav. 39, 1013–1029.
Hinde, R.A., 1976. Interactions, relationships and social-structure. Man 11, 1–17.Hirsch, B.T., Stanton, M.A., Maldonado, J.E., 2012. Kinship shapes affiliative social
networks but not aggression in ring-tailed coatis. PLoS ONE 7.Iacolina, L., Scandura, M., Bongi, P., Apollonio, M., 2009. Nonkin associations in wild
boar social units. J. Mammal. 90, 666–674.Kalinowski, S.T., Wagner, A.P., Taper, M.L., 2006. ML-RELATE: a computer program
for maximum likelihood estimation of relatedness and relationship. Mol. Ecol.Notes 6, 576–579.
Kaminski, G., Brandt, S., Baubet, E., Baudoin, C., 2005. Life-history patterns in femalewild boars (Sus scrofa): mother–daughter postweaning associations. Can. J. Zool.83, 474–480.
Kappeler, P.M., Barrett, L., Blumstein, D.T., Clutton-Brock, T.H., 2013. Constraints andflexibility in mammalian social behaviour: introduction and synthesis. Philos.Trans. R. Soc. B: Biol. Sci. 368.
Kappeler, P.M., van Schaik, C.P., 2002. Evolution of primate social systems. Int. J.Primatol. 23, 707–740.
Keuroghlian, A., Eaton, D.P., Longland, W.S., 2004. Area use by white-lipped and col-lared peccaries (Tayassu pecari and Tayassu tajacu) in a tropical forest fragment.Biol. Conserv. 120, 411–425.
Mayer, J.J., Brandt, P.N., 1982. Identity, distribution, and natural history of the pec-caries, Tayassuidae. In: Mares, M.A., Genoways, H.H. (Eds.), Mammalian Biologyin South America. Pymatuning Laboratory of Ecology, University of Pittsburgh,Linesville.
Newman, M.E.J., 2004. Analysis of weighted networks. Phys. Rev. E 70.Peakall, R., Smouse, P.E., 2006. GENALEX 6: genetic analysis in Excel. Population
genetic software for teaching and research. Mol. Ecol. Notes 6, 288–295.Puppe, B., 1998. Effects of familiarity and relatedness on agonistic pair relationships
in newly mixed domestic pigs. Appl. Anim. Behav. Sci. 58, 233–239.Raymond, M., Rousset, F., 1995. GENEPOP (version 1.2): population genetics soft-
ware for exact tests and ecumenicism. J. Hered. 86, 248–249.Rohrer, G.A., Alexander, L.J., Hu, Z., Smith, T., Keele, J.W., Beattie, C.W., 1996. A
comprehensive map of the porcine genome. Genome Res. 6, 371.Rohrer, G.A., Alexander, L.J., Keele, J.W., Smith, T.P., Beattie, C.W., 1994. A microsatel-
lite linkage map of the porcine genome. Genetics 136, 231.Sambrook, J., Fritsch, E.F., Maniatis, T., 1989. Molecular Cloning: A Laboratory Man-
ual. Cold Spring Harbor Laboratory.Schülke, O., Wenzel, S., Ostner, J., 2013. Paternal relatedness predicts the strength
of social bonds among female rhesus macaques. PLOS ONE 8.Silk, J.B., 2007. The adaptive value of sociality in mammalian groups. Philos. Trans.
R. Soc. B: Biol. Sci. 362, 539–559.Sowls, L.K., 1984. The Peccaries. The University of Arizona Press, Tucson, AZ.Van Oosterhout, C., Hutchinson, W.F., Wills, D.P.M., Shipley, P., 2004. MICRO-
CHECKER: software for identifying and correcting genotyping errors inmicrosatellite data. Mol. Ecol. Notes 4, 535–538.
Wagner, A., Creel, S., Kalinowski, S., 2006. Estimating relatedness and relationshipsusing microsatellite loci with null alleles. Heredity 97, 336–345.
Welsh, L.S., Herzing, D.L., 2008. Preferential association among kin exhibited in apopulation of Atlantic spotted dolphins (Stenella frontalis). Int. J. Comp. Psychol.21, 1–11.
Wey, T., Blumstein, D.T., Shen, W., Jordán, F., 2008. Social network analysis of animalbehaviour: a promising tool for the study of sociality. Anim. Behav. 75, 333–344.
Wey, T.W., Blumstein, D.T., 2010. Social cohesion in yellow-bellied marmots is estab-lished through age and kin structuring. Anim. Behav. 79, 1343–1352.
ollared peccaries (Pecari tajacu): Does relatedness matter? Behav.
Whitehead, H., 2009. SOCPROG programs: analysing animal social structures. Behav.Ecol. Sociobiol. 63, 765–778.
Widdig, A., Nürnberg, P., Krawczak, M., Streich, W.J., Bercovitch, F.B., 2001. Paternalrelatedness and age proximity regulate social relationships among adult femalerhesus macaques. Proc. Natl. Acad. Sci. U. S. A. 98, 13769.