Social norms, tenure security and soil conservation: Evidence from Burundi
14
Social norms, tenure security and soil conservation: Evidence from Burundi Gonne Beekman, Erwin H. Bulte ⇑ Development Economics Group, Wageningen University, P.O. Box 8130, 6700 EW Wageningen, The Netherlands article info Article history: Received 8 August 2011 Received in revised form 21 December 2011 Accepted 11 January 2012 Available online 15 February 2012 Keywords: Erosion control Tenure security Customary land rights Social norms Institutions Africa abstract We use a new dataset from war-torn Burundi to explore how various institutional proxies affect invest- ments in soil conservation. We ‘‘unbundle’’ institutions and distinguish between various proxies for ten- ure security and social norms. While we find significant correlations between certain proxies for tenure and social norms on the one hand, and investments in erosion management on the other, this is not true for all proxies. Using local conflict measures as instruments for institutional quality, we find tentative evi- dence of a causal effect of tenure security on erosion management, but not on investments improving short-term soil fertility. Ó 2012 Elsevier Ltd. All rights reserved. 1. Introduction Recently, the potential role of agriculture in rural development, poverty alleviation, and economic growth has received new atten- tion (e.g. WDR, 2007). Agricultural intensification in developing countries, especially in Africa, is again prominently on the policy and research agenda (Byerlee et al., 2009). Sustainable manage- ment of natural resources is a major component of such intensifi- cation strategies. Unfortunately, it is not clear which factors and conditions are conducive to sustainable management of key resources such as land and water. While there exists a consensus that the ‘‘institutional framework’’ plays an important role, the causal mechanisms linking formal and informal institutions to resource use, and the magnitude of the various causal effects, are subject of debate. Moreover, the institutional framework is a multifaceted concept, and the notion that a single proxy can capture the essence of institutional quality is simplistic. Instead, institutions should be ‘‘unbundled,’’ so that analysis can focus on well-delineated components. In this paper, we explore the impact of two important dimen- sions of the institutional framework on soil management in Burun- di, central Africa. Specifically, we analyze the correlations and causal linkages between tenure security and social norms on the one hand, and investments in erosion control and soil fertility on the other. We set out to operationalize tenure security and social norms in a number of distinct directions. First, we distinguish between ‘‘customary land rights’’ and (perceived) ‘‘security against expropriation by the state’’ as proxies for tenure security. The rationale for using both proxies is that trust in land rights may be as important as the existence of land rights. Second, we distin- guish among ‘‘trust,’’ ‘‘altruism’’ and ‘‘political participation’’ to capture different social norms. We use a new dataset of almost 1000 households residing in 100 communities in rural Burundi to revisit the effects of tenure security and social norms on soil conservation. The main objective of this paper is to analyze the effect of tenure security and social norms on soil conservation investments – both separately and simultaneously. In light of the expectation that social norms may affect the success of customary tenure systems, and that tenure arrangements feed back into social norms, it makes sense to account for both institutional dimensions. To capture the width of the social norms concept (encompassing trust, altruism, etc.) we combine survey-based and experimental methods to gauge several proxies. The contribution of this paper is threefold. First, we analyze the relation between measures of local institutional quality (tenure security and social norms) and investments in land. Whereas we expect that local institutions will affect soil conservation decisions, instead of vice versa, it is possible that there is a reverse effect as well (e.g. soil conservation decisions affecting tenure security) and there may be omitted variables affecting both institutions and land management. To address this potential concern of ‘‘endo- geneity’’ of our main regressors, we use an instrumental variables (IV) approach (see Appendix A). Second, we unravel soil conserva- tion decisions by distinguishing between erosion management (where benefits accrue in the longer term, and involve positive 0308-521X/$ - see front matter Ó 2012 Elsevier Ltd. All rights reserved. doi:10.1016/j.agsy.2012.01.001 ⇑ Corresponding author. Tel.: +31 317 484360; fax: +31 317 484037. E-mail addresses: [email protected] (G. Beekman), [email protected] (E.H. Bulte). Agricultural Systems 108 (2012) 50–63 Contents lists available at SciVerse ScienceDirect Agricultural Systems journal homepage: www.elsevier.com/locate/agsy
Transcript of Social norms, tenure security and soil conservation: Evidence from Burundi

Agricultural Systems 108 (2012) 50–63
Contents lists available at SciVerse ScienceDirect
Agricultural Systems
journal homepage: www.elsevier .com/locate /agsy
Social norms, tenure security and soil conservation: Evidence from Burundi
Gonne Beekman, Erwin H. Bulte ⇑Development Economics Group, Wageningen University, P.O. Box 8130, 6700 EW Wageningen, The Netherlands
a r t i c l e i n f o a b s t r a c t
Article history:Received 8 August 2011Received in revised form 21 December 2011Accepted 11 January 2012Available online 15 February 2012
Keywords:Erosion controlTenure securityCustomary land rightsSocial normsInstitutionsAfrica
0308-521X/$ - see front matter � 2012 Elsevier Ltd.doi:10.1016/j.agsy.2012.01.001
⇑ Corresponding author. Tel.: +31 317 484360; fax:E-mail addresses: [email protected] (G. Be
(E.H. Bulte).
We use a new dataset from war-torn Burundi to explore how various institutional proxies affect invest-ments in soil conservation. We ‘‘unbundle’’ institutions and distinguish between various proxies for ten-ure security and social norms. While we find significant correlations between certain proxies for tenureand social norms on the one hand, and investments in erosion management on the other, this is not truefor all proxies. Using local conflict measures as instruments for institutional quality, we find tentative evi-dence of a causal effect of tenure security on erosion management, but not on investments improvingshort-term soil fertility.
� 2012 Elsevier Ltd. All rights reserved.
1. Introduction
Recently, the potential role of agriculture in rural development,poverty alleviation, and economic growth has received new atten-tion (e.g. WDR, 2007). Agricultural intensification in developingcountries, especially in Africa, is again prominently on the policyand research agenda (Byerlee et al., 2009). Sustainable manage-ment of natural resources is a major component of such intensifi-cation strategies. Unfortunately, it is not clear which factors andconditions are conducive to sustainable management of keyresources such as land and water. While there exists a consensusthat the ‘‘institutional framework’’ plays an important role, thecausal mechanisms linking formal and informal institutions toresource use, and the magnitude of the various causal effects, aresubject of debate. Moreover, the institutional framework is amultifaceted concept, and the notion that a single proxy cancapture the essence of institutional quality is simplistic. Instead,institutions should be ‘‘unbundled,’’ so that analysis can focus onwell-delineated components.
In this paper, we explore the impact of two important dimen-sions of the institutional framework on soil management in Burun-di, central Africa. Specifically, we analyze the correlations andcausal linkages between tenure security and social norms on theone hand, and investments in erosion control and soil fertility onthe other. We set out to operationalize tenure security and socialnorms in a number of distinct directions. First, we distinguish
All rights reserved.
+31 317 484037.ekman), [email protected]
between ‘‘customary land rights’’ and (perceived) ‘‘security againstexpropriation by the state’’ as proxies for tenure security. Therationale for using both proxies is that trust in land rights maybe as important as the existence of land rights. Second, we distin-guish among ‘‘trust,’’ ‘‘altruism’’ and ‘‘political participation’’ tocapture different social norms.
We use a new dataset of almost 1000 households residing in100 communities in rural Burundi to revisit the effects of tenuresecurity and social norms on soil conservation. The main objectiveof this paper is to analyze the effect of tenure security and socialnorms on soil conservation investments – both separately andsimultaneously. In light of the expectation that social norms mayaffect the success of customary tenure systems, and that tenurearrangements feed back into social norms, it makes sense toaccount for both institutional dimensions. To capture the widthof the social norms concept (encompassing trust, altruism, etc.)we combine survey-based and experimental methods to gaugeseveral proxies.
The contribution of this paper is threefold. First, we analyze therelation between measures of local institutional quality (tenuresecurity and social norms) and investments in land. Whereas weexpect that local institutions will affect soil conservation decisions,instead of vice versa, it is possible that there is a reverse effect aswell (e.g. soil conservation decisions affecting tenure security)and there may be omitted variables affecting both institutionsand land management. To address this potential concern of ‘‘endo-geneity’’ of our main regressors, we use an instrumental variables(IV) approach (see Appendix A). Second, we unravel soil conserva-tion decisions by distinguishing between erosion management(where benefits accrue in the longer term, and involve positive
G. Beekman, E.H. Bulte / Agricultural Systems 108 (2012) 50–63 51
external effects for other community members) and fertilizeradoption (immediate private benefits for the household). Weexpect our institutional variables to work out differently forlong-term and short-term soil conservation decisions. Third, wecombine survey and experimental approaches to measuring socialnorms, and demonstrate how these proxies capture complemen-tary dimensions of social norms.
This study fits in the broader economic research agenda thatevaluates the role of institutions (possibly vis-à-vis geographicalvariables) as an important guiding force for development (e.g.Acemoglu et al., 2001; Rodrik et al., 2004). Our results supportthe general insight that institutions are very important for sustain-able development, but also add some qualifications. Not all dimen-sions of the institutional framework foster investments in landmanagement – unbundling does provide additional insights (alsosee Acemoglu and Johnson, 2005). Various measures of tenuresecurity and social norms are positively correlated to soil conserva-tion, but not all. We seek to move beyond correlations and towardscausal effects from local institutions on soil conservation decisions.We use an IV approach to address the concern that our institu-tional measures may not be properly exogenous in a soil manage-ment model, but due to data limitations we can only present IVresults for a subset of our proxies. These estimates also suggestthat tenure security is a determinant of investments in erosionmanagement. Interestingly, we find both for the probit and IVmodels that aggregate institutional measures, capturing the envi-ronment in which households operate, matter for decision making– perhaps more so than household-specific proxies (perceptions) ofinstitutional quality. We also find tentative evidence that differenttypes of land management investments are correlated with differ-ent institutional measures.
The paper is organized as follows. Section 2 contains a brief lit-erature review of the relationship between institutions and socialnorms on the one hand, and land management on the other. In Sec-tion 3, we provide some background to the study area, Burundi. InSection 4, we outline our data and experimental strategy. Theregression results (simple probit and two-stage IV probit models)are discussed in Section 5. The conclusions ensue in Section 6.
2. Tenure security, social norms and land management
Why do tenure and social norms matter for land management?Turning to the role of tenure security first, it is well-known thatsuch security is a necessary condition for markets to work andinvestments to occur. In the context of land management, tenuresecurity can stimulate investment decisions in various ways(Besley, 1995; Braselle et al., 2002; Grimm and Klasen, 2008). Theso-called ‘‘assurance effect’’ argues people are only willing to investif they expect to also collect future returns from their investment.The ‘‘collateralization effect’’ predicts that land can serve as collat-eral – facilitating access to credit and enabling productive invest-ments. Investments in land may also be encouraged if land can berented out or sold; the ‘‘realizability effect’’. Hence, tenure securityappears an important conducive factor for soil management. Notethat this does not imply that land should be individually titled – thisarguably depends on local conditions and the security of informaltenure arrangements (e.g. Jacoby and Minten, 2007).
Economic theory is less clear about why social capital mightmatter. Social capital may be viewed as a community characteris-tic, capturing networks, groups, shared rules and norms (includingtenure rules), trust and reciprocity (Piachaud, 2002), social interac-tions and their by-products (Putnam, 2000), or ‘the glue that holdssociety together’. Since soil conservation involves positive exter-nalities (due to reduced erosion and run-off), investments in soilquality are more likely to be successful in closely-knit societies
with high levels of social capital (relatedly; conservation effortsmay be more successful if they cover a wider geographic area, sothat positive externalities beyond the settlement level can be inter-nalized). Farmers may internalize such spillovers when decidingabout land use (e.g. Klemick, 2011). In addition, as erosion controloften involves coordinated effort from community members, socialnorms possibly enhances investments in soil conservation.
A sizable body of empirical work exists to test the hypothesisthat tenure security matters for sustainable soil management.While the evidence provides strong support for the conductiveroles of tenure security for investments in land in the context of La-tin America and Asia, it remains rather more mixed for the case ofAfrica (e.g. Besley, 1995; Place and Migot-Adholla, 1998; Braselleet al., 2002; Deininger and Jin, 2006; Deininger and Ali, 2008).One lesson emerging from this literature is that it is useful to dis-tinguish between different categories of investments. For example,productive investments are not the same as investments to ‘‘sig-nal’’ ownership, and may respond differently to changes in tenuresecurity. Tenure security can be affected by soil management byhouseholds, so that tenure security probably is an endogenous var-iable in a model explaining soil management. For this reason ana-lysts have tried to ‘‘instrument’’ for tenure security to tease outcausal effects (e.g. Besley, 1995; Braselle et al., 2002, also seeAppendix A.1), or use ‘‘natural field experiments’’ based on randomassignment of property rights (e.g. Holden et al., 2009).
Empirical evidence on the role of social capital and resourcemanagement is more scarce, but arguably more consistent. Forexample, Isham (2002) concludes that ethnical homogeneity andcooperative behavior lead to higher rates of fertilizer adoptionamong farmers in two regions in Tanzania. Carpenter and Seki(2011) use a voluntary contributions game to measure social pref-erences within a group of Japanese shrimp fishers, and find suchpreferences are positively correlated with fishing productivity.Most relevant for the current case, Bouma et al. (2008) considerthe effect of social capital (proxied by trust behavior in a trustgame experiment in rural India) on soil conservation, finding a po-sitive correlation with efforts to maintain soil conservation struc-tures. However, they studied only five villages, and it is an openquestion whether this result spills over to analyses with moreextensive coverage of communities. Moreover, as in the case oftenure security, other aspects of social capital could be endoge-nously determined as well, so ideally should be instrumented for.
3. The case of Burundi
Burundi is among the poorest and most densely populatedcountries in the world. Recurring conflict between Hutu and Tutsisince independence from colonial rule contributed to a plunge inper capita income, soaring inflation rates, and a doubling of thenumber of people living below the poverty line (Bundervoetet al., 2008). The hills, or collines, form the basis of Burundi society:each colline forms a municipality, which is subdivided into sous-collines or villages. Landholdings are typically small. The agricul-tural sector dominates the economy, representing over 50% ofGNP and 80% of total exports (World Bank, 2008). Farming ismainly focused on subsistence activities, and only a small surplusis marketed. Burundi exports some coffee and tea, and especiallycoffee is an important source of foreign exchange and income –both for farmers and the government (Nkurunziza and Ngaruko,2002; World Bank, 2006; Bundervoet et al., 2009). The transforma-tion from agriculture towards industry and services has been mar-ginal: 91% of the national labor force was engaged in agricultureduring the 1990s Burundi has the lowest urbanization rate in Afri-ca, with less than 10% of its population of 8 million people living inurban areas (World Bank, 2006).

52 G. Beekman, E.H. Bulte / Agricultural Systems 108 (2012) 50–63
Although Burundi is located in the fertile Rift Valley, and theclimate is favorable for agricultural production with three harvestperiods per year, productivity of both land and labor havedecreased over the past decades, partly as a result of increasingpopulation pressure and related erosion problems (Nkurunzizaand Ngaruko, 2002; Bundervoet, 2010). These trends contributedto Burundi’s transition from a net exporter into a net importer offood. The most important reasons that can explain for thepervasive erosion are escalating population pressure and weak(enforcement of) regulation, as visualized in Fig. 1.
While ‘‘only’’ 100 people lived per square kilometer in 1960,this number has now increased to more than 300 people. Thisincreasing population pressure is triggering numerous violent con-flicts – often within families, and is a large impediment for socialand economic development in Burundi. Population growth alsocaused expansion of cultivated land into marginal areas, includingfragile grazing land and mountain slopes. Over time, animal hus-bandry decreased and farm incomes fell (Cochet, 2004). The overallpicture is one of worsening erosion, decreasing soil fertility andyields, and emerging underemployment.
During the war, deforestation intensified due to flows of inter-nally displaced persons, refugees to and from neighboring coun-tries, and lack of nature conservation policies. In the war-yearsbetween 1990 and 2005, annually 3.2% of Burundi forest disap-peared (World Bank, 2006), which led to worsening erosion onoften steep slopes.
Resulting poverty among Burundian farmers is probably con-tributing to low adoption rates of modern production techniquesand related falling labor productivity. The rate of chemical fertilizeruse is among the lowest in Africa: about 3.7 kg/ha, compared to anaverage of almost 15 kg/ha in Sub-Sahara Africa (Nkurunziza andNgaruko, 2002). Investments in land quality, including erosionmanagement, are widely regarded as key measures to restore soilfertility and raise agricultural productivity.
4. Data and empirical strategy
In this study, we combine survey and experimental data. Start-ing with the former, we use recent data from the Burundi PriorityHousehold Survey (BPHS) and the Burundi Community Survey(BCS). These surveys cover 872 households in 100 communities(so-called ‘sous-collines’) in 13 provinces (the remaining threeprovinces were too dangerous to visit due to ongoing rebel
Fig. 1. Reasons for decreasing la
activity). The communities, as well as the respondents in each ofthe communities, were randomly selected so that our sample isrepresentative for the Burundi population in these 13 provinces.For some variables we aggregate household responses to obtaincommunity variables. In light of the small number of observationsper community this obviously implies considerable standarderrors, which attenuates the statistical significance of our findings.
Data were collected in August and September 2007 by local enu-merators, in collaboration with researchers from MICROCON andISTEEBU. Interviews were performed in the main local language(Kirundi) and translated into French. The BPHS includes detailedinformation on household characteristics, including income andland management decisions, and sections on trust and cooperativebehavior, as well as exposure to violence. The BCS includes generalcommunity characteristics such as the availability of infrastructureand services, and also information on conflict.
In 2009, we re-visited a small sub-set of 35 randomly selectedvillages and ran a series of so-called ‘‘artefactual field experiments’’with the same respondents. Artefactual field experiments are con-ventional laboratory-style games with a non-student subject pool– in our case Burundi farmers. For the purpose of this study, weuse the results of one such experiment – a social orientation game,measuring altruism towards fellow villagers. We treat this as oneproxy of social norms (see below). Importantly, the experimentalmeasure of altruism (social norms) is based on only 296 respon-dents (or, again, 8–9 households per community, as in the BPHS,which again implies relatively high standard errors).
Table 1 gives an overview of our key variables, clustered in 6panels. Some variables are available at the plot level, others atthe household or community level. Panel A presents our tenurevariables. Land rights span a wide range of agreements, from cus-tomary user rights to official registration. In Burundi, the landrights issue is particularly complex and tenuous due to advancedland degradation, high population density, and large-scale resettle-ment of displaced people. Land registration and conflict resolutioninstitutions are functioning weakly, or are absent altogether (VanLeeuwen and Haartsen, 2005; Van Leeuwen, 2010). Hence, custom-ary user rights are most widespread, and official registrationremains limited to a small share of the population living in urbancenters. It is estimated that less than 1% of the land in Burundi isofficially registered (Toulmin, 2008). Most land registration isarranged by ‘Bashingantahe’, customary community level institu-tions (Van Leeuwen, 2010). Most land is transferred within thefamily through heritage, but some people own a written contract
nd and labor productivity.

Table 1Descriptive statistics.
Number of observations Mean Standard Deviation Min Max
Plots Households Communities
Panel A: Tenure securityHh has local titles plot level[d] 3141 847 100 0.43 0.49 0 1Hh has local titles household level[d] 872 100 0.36 0.48 0 1Percentage of titled land in the community 872 100 0.44 0.35 0 1High security expropriation plot level[d] 3141 847 100 0.94 0.23 0 1High security expropriation household level[d] 847 100 0.75 0.43 0 1High security expropriation community level 100 0.85 0.14 0.32 1
Panel B: Social norms (comm. level)Trust in community members[d] 100 16.76 1.57 11.88 20.30Trust in political institutions[d] 100 0.68 0.07 0.51 0.80Perception of cooperation[d] 100 0.88 0.12 0.50 1Voted in local elections[d] 100 0.94 0.08 0.63 1Altruism 255 35 41.46 4.14 37.46 52.54Number of group memberships in household 867 100 1.30 0.85 0 4
Panel C: Investments in landErosion management plot level[d] 3142 847 100 0.57 0.50 0 1Erosion management household level[d] 847 100 0.47 0.50 0 1Erosion management community level 100 0.46 0.29 0 1Terrace building[d] 872 100 0.10 0.30 0 1Fertilizer use household level[d] 872 100 0.75 0.43 0 1Fertilizer use community level 100 0.75 0.21 0.11 1Organic fertilizer use household level[d] 872 100 0.72 0.45 0 1Chemical fertilizer use household level[d] 872 100 0.32 0.47 0 1
Panel D: Violence variables (community level)Number of violent confrontations (1993–2003)a 100 1.36 3.18 0 17Percentage of people died (1993–2003) 98 0.11 0.27 0 560
Panel E: Household characteristicsHousehold breeds livestock[d] 865 100 0.58 0.49 0.00 1.00Household grows cash crops[d] 872 100 0.28 0.34 0 1Land size per adult (ha) 846 100 1.33 1.60 0.00 14.03Household head is literate[d] 861 100 0.49 0.50 0 1Household head is male[d] 872 100 0.71 0.45 0 1Age household head 870 100 49.86 14.74 12 99Expenditure per adult (log) 863 100 7.89 1.18 2.98 11.56Plot size (m2) 3139 872 100 1300.34 1653.68 2 9450Distance residence to plot (min) 2989 872 100 15.36 34.61 1 600
Panel F: Community characteristicsDistance to the marketb 100 2.95 0.81 1 4.9Main road[d] 100 0.13 0.34 0 1Population density (people/km2)c 100 5.69 0.49 4.04 6.56Land inequality (Gini coefficient) 100 0.41 0.10 0.20 0.62Agricultural project (1998–2007)[d] 100 0.26 0.44 0 1% votes for Ndadaye in 1993 elections 87 61.31 18.32 3.16 93.51Soil quality problems[d] 100 0.67 0.47 0 1
a Based on PRIO data.b Distance to main agricultural market where food and non-food items are traded, measured in time intervals of 15 min, where t = 1, . . .,5 (BCS).c Log-transformed, to ensure a normal distribution.
G. Beekman, E.H. Bulte / Agricultural Systems 108 (2012) 50–63 53
for the plots they cultivate. While these ‘‘petit papiers’’ or local cus-tomary titles are not the same as formal titles backed by a nationalland register, they arguably provide some extra protection in casetenure is challenged before a local council.
We selected two proxies for tenure security: a variable indicat-ing whether the individual has obtained a local title to his or herplots, and the subjective perception of security against expropria-tion by the state. In many models we treat these proxies as bino-mial variables, taking the value of 1 in case of full titles or highsecurity against expropriation, and 0 otherwise. When evaluatingerosion management efforts at the plot level, however, we use de-tailed plot-specific information. Moreover, in some models we lookat the percentage of titled land, and estimate linear models. Panel Ashows that average perceived security against expropriation ishigh, with an average of 85% at the community level. Customary ti-tles are less widespread, with a community average of 44%. Whenmeasured at the household level, our two tenure variables are pos-itively but weakly correlated (q = 0.16). At the community level,the tenure security variables are uncorrelated.
Panel B summarizes our proxies for social norms. Ideally wewould have included information on the ethnic composition ofcommunities to gauge social cohesion (following Isham (2002)and Bouma et al. (2008)), but this information proved too sensitiveto obtain during the large survey in 2009. Instead, we used a rangeof indicators for social norms, expecting that different indicatorscapture different components of social norms. Trust measures arebased on the subjective perception of cooperative behavior of othercommunity members, and on stated trust in fellow communitymembers and local political institutions (see Appendix B for de-tails). Political participation, specifically voting in local elections,is another proxy for social norms. We use both individual variablesand aggregate (community) variables, as we believe they will cap-ture complementary aspects of social norms. According to our data,social norms are strong. Almost 90% of the inhabitants in the com-munities indicated that they expect their community members tocooperate if needed. Over 70% of the people indicated they trustother people in the community and local political institutions(standard deviations of 0.35 and 0.07, respectively). There was

54 G. Beekman, E.H. Bulte / Agricultural Systems 108 (2012) 50–63
little variation in terms of political participation: 94% of the peoplevoted for local politics, and the standard deviation is only 0.08, sothis variable is an unlikely candidate to explain inter-communitydifferences in land management.
These findings may be counter-intuitive at first sight, given thewar-history in Burundi, but they are in line with findings fromother studies about social capital in post-conflict areas. A numberof recent studies show that war-experiences contribute to altruis-tic behavior among adults in Burundi (Voors et al., in press) andamong young children in Georgia and Sierra Leone (Bauer et al.,2011), and to increased political participation by victims of rebel-abduction in Northern Uganda (Blattman, 2009).
Answers to survey questions about social norms may, however,be biased, as people might over- or understate their trust in peopleand cooperative behavior. This might be due to compliance to‘socially-preferred’ answers, or be due to lack of awareness aboutone’s actual preferences. We believe that revealed behavior inexperiments is less susceptible to such bias, and therefore comple-ment our survey data with experimental data, summarized inpanel B.
We used a field experiment to gauge altruism among villagers.We used an adapted version of the so-called ‘‘social value orienta-tion experiment’’ devised by Liebrand (1984), and also used byVyrastekova and van Soest (2008) and others. We invited partici-pants to make six separate choices between two particular alloca-tions of money between themselves and a randomly selected otherperson from the same community. Respondents had to choose be-tween a high and low share for themselves, but the ‘‘size of thecake’’ also varied across choices. Specifically, allocations wheresplits were more or less equal generated a larger surplus thanhighly unequal allocations. Both senders and receivers of moneyremained anonymous (see Appendix for details). Based on choicesmade by the respondent they are regarded as an altruist, or not –altruists give away more than 50% of the offer. Panel B summarizesour proxy for (average) altruism at the community level.
In Panel C, we present two different types of investments inland: erosion management and fertilizer use. Erosion managementis a long-term investment, with possible positive externalities toadjacent plots (Baland and Platteau, 1997; Bouma et al., 2008). Itincludes different activities, such as building terraces and ditches,and planting trees and hedges. Nearly 50% of the households investin a form of erosion management on at least one of their plots,while 72% of the households use (organic) fertilizers. The use of or-ganic fertilizer is strongly correlated with livestock rearing. Manyhouseholds grow alfalfa, which is both used as organic fertilizerand as animal fodder. The use of chemical fertilizers is with 32%much lower (and indeed 32% may be an overestimate as somerespondents may have confused organic and chemical fertilizerin their responses) All investment decisions are binary variables.Erosion management varies greatly per region. In the mountainousprovince Bururi almost all farmers are involved in erosion manage-ment, as compared to only a fifth of the farmers in the lower prov-ince of Ruyigi. Overall, almost half the households in the surveyapply at least one form of erosion management, corresponding toabout 60% of the plots. 10% of the households built terraces. Fertil-izer use does not exhibit a similar degree of geographical variation,but also varies between 44% of the households in Ruyigi andaround 88% in Bururi, Kayanza and Muramvya. In light of suchstrong regional differences we use province fixed effects in theregressions.
Panel D summarizes our local conflict variables. The most re-cent war, which started in 1993 and lasted until 2005, affectedmany aspects of life in Burundi. We selected two proxies that mea-sure the intensity of conflict at the community level during the war(1993–2003; the period when virtually all of the violenceoccurred). These are the number of community people killed
during the war and the number of attacks hitting the community.Table 1 shows that the average community lost nearly 60 people,with a maximum of 560. The number of confrontations varies froman average of 1.36 to a maximum of 17. The intensity of the vio-lence thus varies across the communities. Our two conflict vari-ables are not significantly correlated (q = 0.04, p = 0.23).
We present our household and community controls in Panels Eand F, respectively. Over 70% of the household heads are male, andno more than half of the household heads are literate. Almost halfof the households have received assistance through NGOs or gov-ernmental aid programs. One third of the households grow coffee,and 58% keep livestock. Plot sizes greatly differ, with an average of1.3 ha per household. We now turn to our community characteris-tics: 27% of the communities benefited from an agricultural devel-opment project implemented by an NGO or the governmentbetween 1998 and 2007, and half of the communities grow coffee.Only 14% of the communities are connected with a main road.Average distance to the market is almost 45 walking minutes.Two thirds of the communities indicate soil quality problems,but unfortunately we don’t have plot-specific data on soil qualityor structure (we only have a community-wide dummy indicatingserious degradation due to erosion). As mentioned, we also in-cluded a variable based on the 1993 election to proxy for the ethniccomposition of the village (perhaps relevant in light of a potentialcorrelation with the conflict variables, discussed above). Village-le-vel voting data serve as a proxy for the ethnic composition of thevillage (assuming voting occurred along ethnic lines). Accordingto our data, just over 60% of the people voted for the winning Hutupresident Ndadaye, (who was assassinated 3 months later, result-ing in a civil war that would ravage the country).
We will demonstrate below that the variation in exposure toviolence (Panel D) is exogenous to household and community vari-ables (Panels E and F), and that conflict had a significant impact onlocal institutional proxies (Panels A and B).
Two important shortcomings of our data deserve emphasis.First, we do not have access to detailed (plot-level) data on soilquality (soil type/depth, slope, state of degradation). This is unfor-tunate because such plot characteristics are likely important deter-minants of erosion management and fertilizer use. Insofar as theseomitted variables are correlated with our explanatory variables ofinterest, unobserved heterogeneity may bias our regression coeffi-cients. For example, if degraded plots are less likely to be titled,then our estimate for the effect of titling on erosion managementwill conflate the degradation and titling effect, causing us to over-estimate the effect of titling (if degraded plots are less likely to re-ceive erosion management). In addition, if better quality land is inhigher demand, there may be a correlation between incidents ofviolence and unobserved land quality. Second, unfortunately wedon’t have access to household-specific information on ethnicidentity for the large sample—a salient variable in the context ofBurundi. We seek to control for ethnicity by using community dataon voting behavior (see above). In addition, we were able to collecthousehold-level data on ethnic identity for the smaller sample (theexperimental data collected in 35 villages in 2009), and we usethese data in some models to further probe into the issue of ethnic-ity and land use.
4.1. Econometric strategy
We now outline our empirical strategy. We first estimate a ser-ies of probit models at the household level, explaining erosionmanagement (EM) and fertilizer use (FU) by a set of social capitalvariables, and a series of controls. Specifically, assume we have aregression model:
y�ij ¼ ak þ b1SCij þ b2Xij þ b3Cj þ eij; ð1Þ

G. Beekman, E.H. Bulte / Agricultural Systems 108 (2012) 50–63 55
where y�ij is a latent variable for soil management, capturing EM orFU for household i located in community j, and where i = 1, . . .,872;and j = 1, . . .,100. SCij refers to social capital at the household level(tenure security, perception of cooperative behavior, trust in peopleor local institutions, voting for local politics, altruism). Xij refers to avector of household controls and Cj is a vector of community con-trols. Finally, ak refers to province level fixed effects, wherek = 1, . . .,13 to capture regional time-invariant variables, includinggeographic characteristics. A causal interpretation of the correla-tions obtained via (1) implies assuming that the explanatory vari-ables (SC,X,C) are exogenous and orthogonal (to each other, andto potential omitted variables), but this is unlikely to be true inreality.
We observe whether erosion management occurs and fertilizeris used. Hence we observe a binary variable yij defined by:
yij ¼1 if y�ij > 0
0 otherwise
(ð2Þ
In most regression models we cluster errors at the communitylevel, but not in the models based on the experimental social cap-ital (altruism) variable, as this variable was only collected in 35 vil-lages. As a robustness check we estimate OLS models where thedependent variable is not binary (yes/no), but the percentage ofhousehold plots where either erosion management occurred orwhere fertilizer was used. We also (i) estimate a random effects pa-nel model, and (ii) repeat the procedure for erosion management atthe plot level (we cannot do this for fertilizer use as we lack dataabout fertilizer use at the plot level):
y�pij ¼ ak þ b1Tpij þ b2Xij þ b3Cj þ cpij; ð3Þ
where T is plot level tenure security (p = 1, . . .,3141 indicates theplot level).
Second, and consistent with the perspective that institutionalvariables are community characteristics arguably best measuredat the community level, we estimate a series of models wherethe social capital variables are community averages:
y�ij ¼ ak þ b1SCj þ b2Xij þ b3Cj þ eij; ð4Þ
where the interpretation of the variables is as above, but where SCj
now refers to community averages of social capital variables.As we mentioned earlier, the regression models above may be
biased due to endogeneity of our social capital variables. If landmanagement styles influence one’s social standing in the localcommunity, then household-specific measures of social capitalare potentially endogenous due to reverse causality (farmers effec-tively investing in erosion control stand in higher regard, affectingtheir subjective social capital). Also, substantial investments inland (such as planting trees to demarcate the plot dimensions)could increase actual tenure security. This reverse causality prob-lem is attenuated in models where we measure EM and FU at thehousehold level while gauging social capital at the community le-vel (as in model 4), because it is unlikely that an individual’s landmanagement choices affect overall social capital levels. However,potential bias due to omitted variables remains. For example, ad-verse geophysical conditions may simultaneously encourage coop-eration among villagers and invite investments in land quality. Wetherefore seek to instrument for our social capital variables.
For the purpose of instrumentation we use several historicalmeasures of local conflict intensity. A suitable instrument mustmeet three conditions. First, the instrument should be exogenousand relevant, or correlated with the endogenous variables. Second,it satisfy the exclusion restriction, or not be correlated to the errorterms of the dependent variables in models (1), (3) and (4). Refer toAppendix A for additional details. While there may be little reasonto suspect that historic conflict intensity affects current land
management (other than through institutional quality), it is ofcourse very difficult to prove this argument beyond any doubt.For example, Bundervoet et al. (2009) find a significant effect ofconflict exposure on the health status of children. Insofar as theseeffects are permanent, this could possibly affect land managementchoices of households in subsequent years. However, in our data,we find no evidence to support such hypotheses.
Intuition suggests conflict experiences affect levels of socialcapital in communities (see Colleta and Cullen, 2000; Bellowsand Miguel, 2006; Pinchotti and Verwimp, 2007; Koster, 2008).The induced institutional innovation hypothesis postulates thatinstitutions evolve in response to new opportunities ‘‘arising frominstitutional disequilibrium’’ (e.g. Lin, 1995, p. 241). Conflict shakesup social relations, creates opportunities for innovation and redis-tribution, and raises awareness of the importance of good institu-tions. In other words, conflict breeds institutional disequilibrium(Cramer, 2006). For example, Cramer writes: violence can ‘‘produceinstitutional changes, amendments to the rule of the game. In ret-rospect, many changes that come to be seen as progressive havetheir origins in social conflicts that have taken a violent turn. Thisis a paradox of violence and war: violence destroys but is also oftenassociated with social creativity.’’ It may also invite assistance byNGOs that could guide institutional improvements. In contrast,conflicts that happened in the 1990s may not directly affect cur-rent investments in land, unless via social norms or land rights.Conflicts could thus function as a plausible instrument for socialnorms when analysing investments in land. This will be exploredin what follows.
We estimate a series of instrumental variables models. Depend-ing on the nature of the dependent variable in the 2nd stage (bin-ary or not) we estimate both IV probit models and 2SLS models. Inthe first stage, the potentially endogenous variables are regressedon a set of instruments, and household and community controls,to identify exogenous variation in social norms and tenure secu-rity. The results of the first stage regression are then used to esti-mate the second stage regression.
II: y�ij ¼ ck þ c1SCj þ c2Xij þ c3Cj þ ei ð5Þ
I: SCj ¼ ak þ a1Vj þ a2Xij þ a3Cj þ mj; ð6Þ
where y�ij is a latent variable (in the IV probit models) or a continu-ous variable (percentage plots), and where SCj are endogenous vari-ables ‘‘predicted by’’ various proxies of exogenous violence Vj
measured at the community level (number of confrontations, num-ber of dead and wounded, and the share of orphan-headed house-holds), as well as series of household and community controls Xij
and Cj. In some models, the endogenous tenure and social normsvariables are measured at the household level, rather than the com-munity level. Unfortunately, as will become evident below, ourinstrumental variables do not work for all the potentially endoge-nous variables used in models (1), (2) and (4). So we only presentIV results for a subset of our institutional variables. In addition,and reflecting various concerns about our instruments (weakness,exclusion restrictions) we view the IV results as tentative only.
5. Estimation results
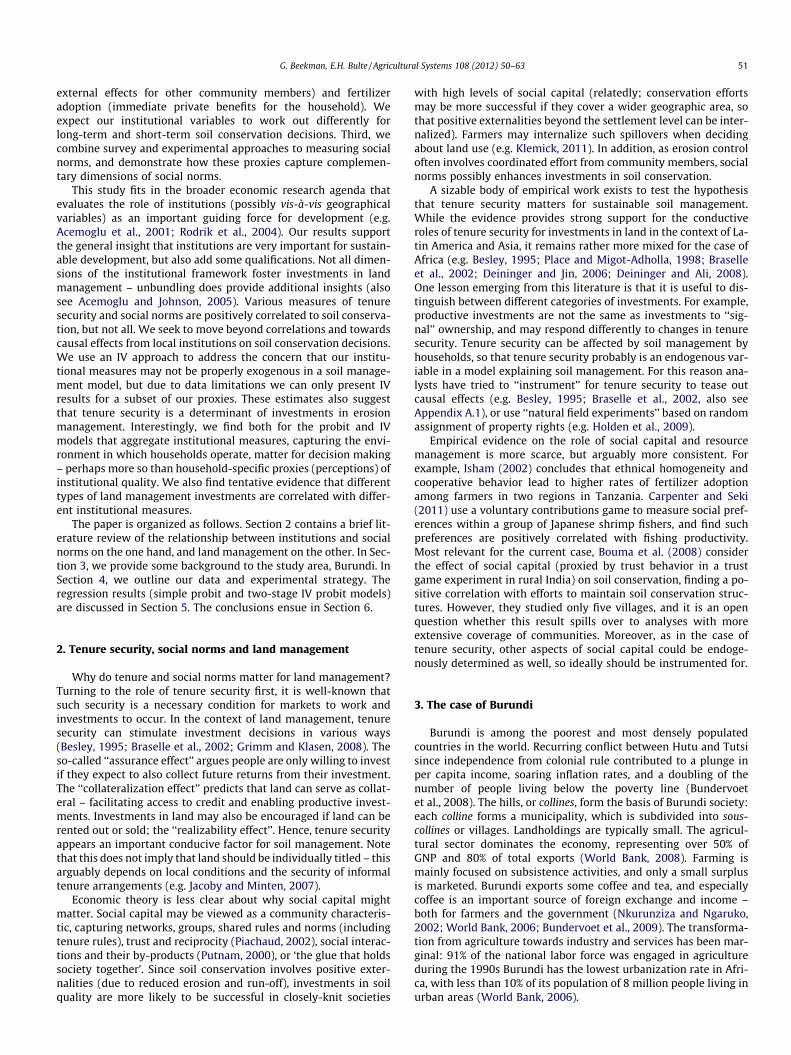
Tables 2–4 contain our regression estimates. We first focus onthe household level, and seek to explain household decisions withrespect to soil management by household-level variables for ten-ure security and social norms. Table 2a presents the results of aseries of standard probit models (and one random effects model),where we regress erosion management on our tenure and socialnorms variables as well as the vector of controls mentioned inTable 1 (coefficients not reported to save space but available on
56 G. Beekman, E.H. Bulte / Agricultural Systems 108 (2012) 50–63
request). In models based on the large sample of 100 villages wecluster the standard errors at the village level. The first thing to no-tice is that customary titles do not seem to matter for erosion man-agement. Neither in the probit, nor in the random effects model, dowe find a significant correlation between investments in erosionmanagement and ‘‘petit papiers.’’ This could be due to the fact that,at the household level, the effect of plot-specific effects is obscuredby the aggregation exercise (see below). In addition, the lack of asignificant correlation between customary titles and erosion man-agement does not mean that tenure security is unimportant. Sub-jective security against expropriation by the state consistentlyenters significantly and with a positive sign. This is true when ten-ure security enters alone (with controls) or in combination withthe title variable and/or various social norms proxies. The magni-tude of the coefficient is large. These marginal effects indicatethe increase in probability that farmers will invest in erosion man-agement, given a change in perception from ‘‘no secure tenure’’ to‘‘secure tenure’’ (evaluated at the mean of the other explanatoryvariables). We find an increase in the probability of investmentin the order of magnitude of 13–20%.
Evidence regarding social norms is rather mixed. Specifically,we find no evidence that trust in local institutions, cooperationor political participation ‘‘matter’’ when explaining erosion man-agement. Altruism, measured in the behavioral game, enters mar-ginally significant in column (8), but not when we control for trustand tenure security (column 10). The only social norms that seemsto matter is stated trust in people. This could imply that villagersare more likely to invest in erosion management if they trust theirpeers to reciprocate – perhaps via reciprocal investments in ero-sion management (due to, say, a shared norm).
How robust are these findings? In all models we control for eth-nic composition of the community by including our voting vari-able. This variable never enters significantly. As a robustnessanalysis we have also inserted our household-specific ethnicityvariable (either separate or in addition to the community proxy)in the models based on the small sample (columns 8 and 10). Thisdoes not change any of the results: ethnic identity is not a signifi-cant determinant of land management, and including it does notchange the coefficients or standard errors of any of our
Table 2aErosion management and household-level social capital (marginal effects).
Probit (binary dependent variable)
(1) (2) (3) (4) (5)
Title on all plots (d) 0.0804+
(0.0504)0.0604(0.0511)
High security (d) 0.140***
(0.0464)0.130***
(0.0461)Trust people 0.0200***
(0.00720)Trust institutions 0.000603
(0.00634Cooperation
Voting
Altruism
N 729 729 729 707 729Pseudo R2 0.160 0.166 0.168 0.164 0.157
Notes: Marginal effects are calculated at the sample mean. Robust standard errors in parenmodels. Standard errors are clustered in all models, except for those in columns (8) and (1(11). The panel model is specified using random effects.
+ Significance at the 85% level.� Significance at the 90% level.
** Significance at the 95% level.*** Significance at the 99% level.
institutional variables in a meaningful way (results not reported,but available on request).
We have also estimated a series of models that include interac-tion terms of social norms variables and tenure security variables.However, these interaction terms never entered significantly (re-sults not reported). Hence there is no reason to suspect that cus-tomary titles are more, or less, relevant in communities withhigher level of social norms. That is, we do not find evidence thattenure and social norms are either complementary institutions orsubstitutes when it comes to promoting land management.
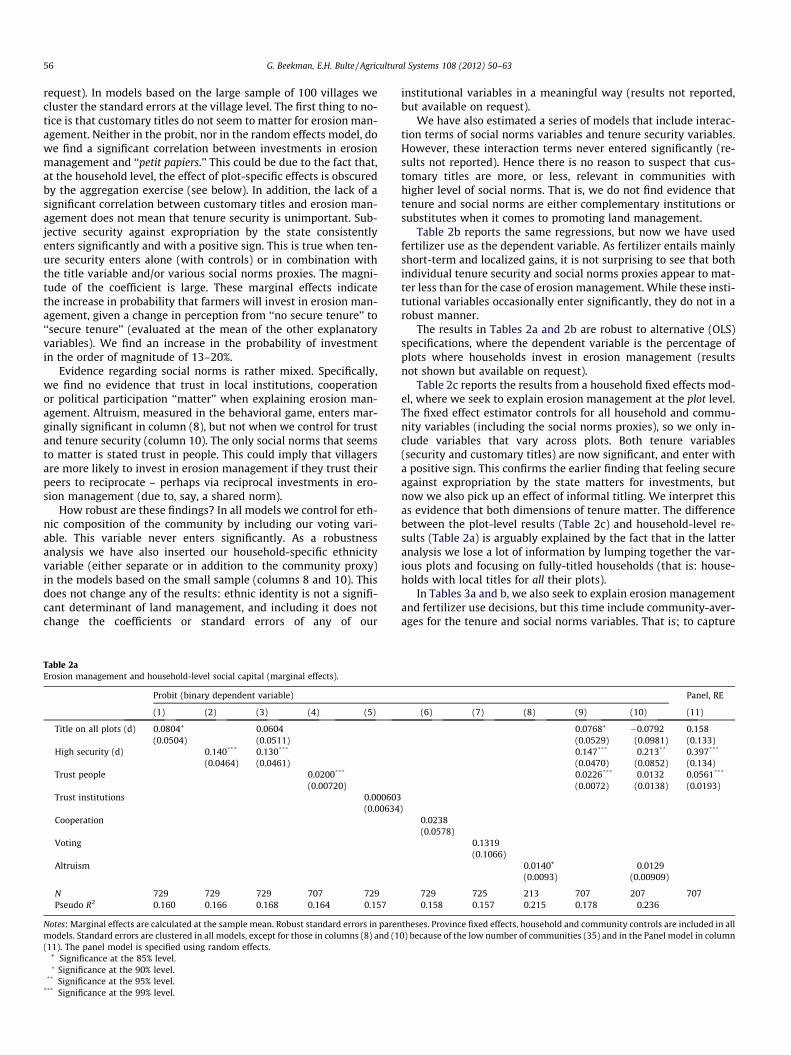
Table 2b reports the same regressions, but now we have usedfertilizer use as the dependent variable. As fertilizer entails mainlyshort-term and localized gains, it is not surprising to see that bothindividual tenure security and social norms proxies appear to mat-ter less than for the case of erosion management. While these insti-tutional variables occasionally enter significantly, they do not in arobust manner.
The results in Tables 2a and 2b are robust to alternative (OLS)specifications, where the dependent variable is the percentage ofplots where households invest in erosion management (resultsnot shown but available on request).
Table 2c reports the results from a household fixed effects mod-el, where we seek to explain erosion management at the plot level.The fixed effect estimator controls for all household and commu-nity variables (including the social norms proxies), so we only in-clude variables that vary across plots. Both tenure variables(security and customary titles) are now significant, and enter witha positive sign. This confirms the earlier finding that feeling secureagainst expropriation by the state matters for investments, butnow we also pick up an effect of informal titling. We interpret thisas evidence that both dimensions of tenure matter. The differencebetween the plot-level results (Table 2c) and household-level re-sults (Table 2a) is arguably explained by the fact that in the latteranalysis we lose a lot of information by lumping together the var-ious plots and focusing on fully-titled households (that is: house-holds with local titles for all their plots).
In Tables 3a and b, we also seek to explain erosion managementand fertilizer use decisions, but this time include community-aver-ages for the tenure and social norms variables. That is; to capture
Panel, RE
(6) (7) (8) (9) (10) (11)
0.0768+
(0.0529)�0.0792(0.0981)
0.158(0.133)
0.147***
(0.0470)0.213**
(0.0852)0.397***
(0.134)0.0226***
(0.0072)0.0132
(0.0138)0.0561***
(0.0193)
)0.0238(0.0578)
0.1319(0.1066)
0.0140+
(0.0093)0.0129
(0.00909)
729 725 213 707 207 7070.158 0.157 0.215 0.178 0.236
theses. Province fixed effects, household and community controls are included in all0) because of the low number of communities (35) and in the Panel model in column

Table 2bFertilizer use and household level social capital (marginal effects).
Probit (binary dependent variable) Panel, RE
(1) (2) (3) (4) (5) (6) (7) (8) (9) (10) (11)
Full titles (d) 0.0414(0.0430)
0.0368(0.0448)
0.0494(0.0454)
0.142*
(0.0745)0.151(0.136)
High security (d) 0.0406(0.0388)
0.0352(0.0402)
0.0224(0.0389)
0.0971(0.0838)
0.0922(0.134)
Trust people �0.0008(0.0069)
0.0002(0.0074)
0.0033(0.0103)
0.0009(0.0193)
Trust institutions 0.0018(0.0053)
Cooperation 0.0877(0.0674)
Voting 0.138+
(0.084)Altruism 0.0035
(0.0086)0.0053(0.0085)
N 729 729 729 707 729 729 725 219 707 213 707Pseudo R2 0.149 0.148 0.149 0.152 0.147 0.150 0.150 0.185 0.155 0.216
Marginal effects are calculated at the sample mean. Robust standard errors in parentheses. Province fixed effects, household and community controls are included in allmodels. Standard errors are clustered in all models, except for those in columns (8) and (10) because of the low number of communities (35) and in the Panel model in column(11). The panel model is specified using random effects.
+ Significance at the 85% level.* Significance at the 90% level.�� Significance at the 95% level.��� Significance at the 99% level.
Table 2cPlot-level erosion measures and plot-level land titles and tenure security (marginaleffects).
Erosion measure plot level (d) Probit,
Title plot (d) 0.1796** (0.0748)Tenure security plot (d) 0.2953*** (0.0739)Distance plot 0.0013+ (0.0008)Plotsize 0.0000* (0.0000)
Household level fixed effects YesN 2848Pseudo R2 0.122
Marginal effects are calculated at the sample mean. Robust standard errors inparentheses.
+ Significance at the 85% level.* Significance at the 90% level.
** Significance at the 95% level.*** Significance at the 99% level.
G. Beekman, E.H. Bulte / Agricultural Systems 108 (2012) 50–63 57
the idea that tenure and social norms are proxies for underlyinginstitutional quality, we explore whether aggregate variables can
Table 3aErosion management and social capital at sous-colline level.
Erosion measure (d) (1) (2) (3)Probit Probit Probit
Titles SC 0.196+ (0.133) 0.282** (0.141) 0.192+ (0.132)High security SC 0.423+ (0.268) 0.454* (0.253) 0.432* (0.260)Trust people SC 0.0148*** (0.0051)Trust institutions SC 1.131** (0.499)Cooperation SC 0.492* (0.294)Vote SCAltruism SC
N 729 729 729Pseudo R2 0.173 0.172 0.168
Marginal effects are calculated at the sample mean. Robust standard errors in parenthemodels. Standard errors are clustered in all models, except for those in column (5) becauspanel model is specified using random effects.
+ Significance at the 85% level.* Significance at the 90% level.
** Significance at the 95% level.*** Significance at the 99% level.
be used to explain the behavior of households. Table 3a providessome support for this idea. As before, we find a positive correlationbetween erosion management on the one hand and trust in peopleand tenure security on the other. However, (average) tenure secu-rity enters weaker than before, when measured at the individuallevel. Interestingly, various alternative social norms proxies nowalso enter significantly. Trust in institutions, cooperation and polit-ical participation are all (marginally) significantly correlated witherosion management. The community-based title variable is alsocorrelated with erosion management (the only exception is col-umn 5, where we have a steeply reduced number of observationsbecause we include the game-based altruism variable). It appearsas if there are community-wide effects of titling and social norms,perhaps because of complementarities in trusting or cooperativebehavior.
Table 3b reports the same models for fertilizer use, entailingfewer positive externalities. As before, neither the tenure nor thesocial norms variables enter significantly. The one exception isour experimental altruism variable, which unexpectedly enterswith a negative sign. This could reflect that generous individuals
(4) (5) (6) (7)Probit Probit Panel, RE Probit terrace (d)
0.206+ (0.126) -0.168 (0.309) 0.525* (0.292) 0.0698** (0.0350)0.328 (0.259) -0.525 (0.514) 1.108+ (0.689) 0.123 (0.0998)
0.0367*** (0.0139) -0.0163 (0.0314)
0.822* (0.433)0.015 (0.033)
729 252 729 7290.172 0.185 0.069
ses. Province fixed effects, household and community controls are included in alle of the low number of communities (35) and in the Panel model in column (6). The

58 G. Beekman, E.H. Bulte / Agricultural Systems 108 (2012) 50–63
who are more prone to share with their fellow-villagers have lessopportunity to save for livestock and accumulate manure.
As a robustness check we have also estimated a probit modelexplaining whether or not households build terraces – a demand-ing task. Results are reported in column (7). Local titles enter posi-tive and highly significant, but security against expropriation doesnot. Trust in people is not significant either. We have also esti-mated a model seeking to explain terrace building by individualinstitutional variables (as in Table 2a; results not reported, butavailable on request). Having a full set of titles is significant atthe 5% level and positively related to terrace building (marginal ef-fect equals 0.07). Security against expropriation and trust in peopleno longer enter significantly. Interestingly, it appears as if differenttypes of erosion management investments respond to differenttypes of institutional variables.
5.1. Causal effects of tenure security and social norms
Potential endogeneity concerns plague the models discussedabove. Omitted variables may bias the regressions, and reversecausality could enter in models where tenure security and socialnorms are measured at the household level. To probe into the issueof causality, we proceed with a series of two-stage estimates.
Unfortunately, it proved very difficult to find instruments thatwere relevant; i.e. find instruments that were strong determinantsof our institutional proxies. In fact, we were unable to produce de-cent IV results for the subjective tenure variable, and for most ofthe social norms variables. Hence, and unfortunately, we are un-able to verify whether our earlier results for the ‘‘tenure security’’and ‘‘trust in people’’ variables stand up to closer scrutiny in an IVapproach. The exceptions, or the variables for which we can verifywhether the correlations in Tables 2 and 3 represent causal effectsor not, are the variables capturing informal land titling and altru-ism. However, even the title variables have modest partial F statis-tics. The partial F remains below the conventional threshold valueof 10, indicating that our instruments are rather weak. We there-fore wish to emphasize that our IV results are not only incomplete,but also should be treated with proper caution. Notwithstandingthis caveat, observe that the Sargan–Hansen test (for linear IVmodels) and the Wald test (for the probit models) in the secondstage indicate that the instruments are valid. Also observe thatour instruments are exogenous (conflict is not correlated withour community or household variables—see Appendix A).
Table 3bFertilizer use and social capital at sous-colline level.
Household uses fertilizer (d)
Probit regression
(1) (2) (3)
Titles 0.105 (0.111) 0.155 (0.121) 0.103 (0.1High security �0.116 (0.181) �0.0861 (0.188) �0.106 (0.1Trust people 0.000385 (0.00501)Trust institutions 0.621 (0.434)Cooperation 0.0938 (0VoteAltruism
N 729 729 729Pseudo R2 0.150 0.155 0.151
All explanatory variables are on the sous-colline level. Marginal effects are calculatedhousehold and community controls are included in all models. Standard errors are clucommunities (35) and in the Panel model in column (6). The panel model is specified u
+ Significance at the 85% level.� Significance at the 90% level.
��� Significance at the 99% level.** Significance at the 95% level.
In Table 4a, we provide first stage results – regressing selectedtenure and social norms variables on our two conflict proxies(number of community attacks during the war and the numberof dead in the community) and included instruments. The conflictvariables enter positively in all three customary title models – thepercentage of household plots with a title (column 1), a dummy forhouseholds with a complete set of titles (for all plots; column 2)and a measure of titling at the community level (column 3).Arguably this is due to the institutional disequilibrium effect men-tioned above, where conflict creates opportunities and incentivesfor titling. The outcome for the altruism variable is qualitativelydifferent. Mortality due to the war is negatively correlated withaltruism.
Table 4b presents the 2nd stage results for the erosion manage-ment and fertilizer models, instrumenting for the title and altruismvariables. The results provide weak support for the notion that ten-ure security matters for erosion management. Both the individualtitle variables (columns 1 and 2) and the community-level average(columns 3 and 4) enter marginally significant when it comes toexplaining investments in erosion management. However, and asbefore, they are not important for explaining fertilizer use. Also,as above, the (instrumented) altruism variable is not significantin either the erosion or fertilizer model.
6. Discussion and conclusions
Economic theory predicts enhancing tenure security (based onformal titles or customary law) should invite investments in ero-sion control and soil quality. Similarly, one may expect that socialnorms enable communities to overcome social dilemma situationsand more effectively coordinate on efficient outcomes – outcomeswhere external benefits of land management are ‘internalized’.While there is evidence of such effects from various regions inthe world, the available evidence for Africa remains rather ambig-uous – some studies support the claim that proper institutions fos-ter sustainable resource management, and others suggest no suchcausal effects exist.
We revisit this issue using a new dataset for Burundi. We‘‘unbundle’’ institutional quality by distinguishing between tenuresecurity and social norms, and combine survey-based data anddata from artefactual field experiments to construct a broad rangeof institutional proxies. To capture tenure security we employ ameasured based on customary law as well as a measure based on
Panel, RE
(4) (5) (6)
09) 0.108 (0.109) 0.319 (0.297) 0.336 (0.282)78) �0.0956 (0.182) 0.628 (0.447) �0.368 (0.613)
0.000777 (0.0137)
.236)�0.331 (0.247)
�0.0659** (0.0277)
729 252 7290.153 0.212
at the sample mean. Robust standard errors in parentheses. Province fixed effects,stered in all models, except for those in column (5) because of the low number ofsing random effects.

Table 4aInstrumental variable procedure – first stage.
% plots with title OLS Title on all plots (d) Probit, mfx Titles Sous-Colline OLS Altruism OLS(1) (2) (3) (4)
# Confrontations 1993–2003 0.0183** (0.00853) 0.0200** (0.00879) 0.0212** (0.00964) 0.0563 (0.0498)% Dead 1993–2003 0.144** (0.0606) 0.214*** (0.0730) 0.156** (0.0640) �3.990*** (0.556)% Votes for Ndadate in 1993 0.000683 (0.00298) 0.000359 (0.00304) �0.000947 (0.00296) �0.0982*** (0.0164)Distance to market 0.0231 (0.0322) 0.0390 (0.0345) 0.0202 (0.0330) 0.720*** (0.162)Main road (d) 0.0305 (0.0521) 0.0616 (0.0843) 0.0723 (0.0635) 0.595* (0.337)Population density (log) �0.188** (0.0823) �0.184** (0.0936) �0.144* (0.0815) �4.205*** (0.565)Land gini sous-colline 0.348 (0.211) 0.442 (0.278) 0.320 (0.227) 2.261* (1.229)Agricultural project (d) 0.0898 (0.0633) 0.118 (0.0728) 0.0871 (0.0675) �0.231 (0.422)Soil quality problems (d) 0.0815 (0.0717) 0.0697 (0.0693) 0.0807 (0.0790) 2.407*** (0.222)Household owns livestock (d) 0.0315 (0.0370) 0.0278 (0.0469) 0.401** (0.191)Household produces cashcrops (d) 0.0161 (0.0382) 0.0383 (0.0448) 0.0905 (0.196)Household size 0.00285 (0.00684) 0.00867 (0.00880) 0.0591* (0.0357)Land per adult equivalent 0.0198** (0.00962) 0.0229* (0.0131) �0.0397 (0.0594)Respondent is literate (d) 0.00179 (0.0311) 0.0271 (0.0387) �0.114 (0.169)Respondent is male (d) �0.0765* (0.0388) �0.166*** (0.0516) �0.110 (0.219)Age �0.00121 (0.00115) �0.00140 (0.00149) �0.00158 (0.00643)Constant 1.352*** (0.457) 1.251*** (0.432) 64.69*** (3.094)N 711 711 747 252R2 0.312 . 0.678 0.694Pseudo R2 . 0.236 .Partial F 4.83** . 5.41*** 26.08Partial R2 0.02 . 0.10 0.15
Marginal effects are calculated at the sample mean. Robust standard errors in parentheses.+ Significance at the 85% level.* Significance at the 90% level.
** Significance at the 95% level.*** Significance at the 99% level.
Table 4bInstrumental variable procedure – second stage: regression of erosion measures and fertilizer use on land titles and altruism.
% plots with erosionmeasures
Any erosionmeasure (d)
% plots with erosion measures Fertilizer applied (d)
Linear IV regression IV probit (mfx) Linear IV regression IVreg (panel, RE) Linear IV regression IV probit (mfx)
(1) (2) (3) (4) (5) (6) (7)
% Titled land 0.578+ (0.359)Title on all plots (d) 1.542** (0.713) 0.170 (1.733)Titles sous-colline 0.493+ (0.322) 0.592+ (0.408)Altruism 0.0137 (0.0550) �.1118 (0.1595)Constant �0.00432 (0.589) 0.417 (0.482) �0.158 (0.721) �2.047 (3.382)
Clustered robust SE Yes Yes Yes No No Yes NoN 711 711 747 711 252 711 219R2 0.027 . 0.179 . 0.208 . .Hansen-J test p 0.79 . 0.58 . 0.90 . .Waid test n . 0.17 . . . 0.27 0.50
The second-stage regression uses predictions from the first-stage regression. Marginal effects for the probit models are calculated at the sample mean. Household andcommunity controls are included in all models. Robust standard errors in parentheses.
+ Significance at the 85% level.� Significance at the 90% level.
** Significance at the 95% level.
G. Beekman, E.H. Bulte / Agricultural Systems 108 (2012) 50–63 59
the respondents’ subjective assessment of the expropriation risk bythe government. To capture various dimensions of social norms wedistinguish between measures of cooperation, trust, altruism andpolitical participation.
We consistently find positive correlations between tenuresecurity and investments in erosion management. Customarytitles, perhaps helping villagers to fence off claims from peers,are positively correlated with individual investments whenevaluated at the plot level (this correlation vanishes when aggre-gating over plots to the household level). It also appears as if anenvironment in which ‘‘customary titling’’ is common matters forpromoting erosion control. Future research should explore why
such context effects matter. Recognizing that correlations do notnecessarily imply causal relationships, we have sought to instru-ment for our potentially endogenous institutional variables. Usinghistorical measures of local conflict intensity as an instrument wefind that the tenure variables – both at the household andcommunity level – matter for explaining erosion managementin Burundi. These results are in line with findings for Ethiopia(e.g. Deininger and Jin, 2006; Holden et al., 2009). As expected,we find no similar causal relationship of (or even correlationsbetween) tenure security and fertilizer use. Unlike erosionmanagement, fertilizer use is an activity resulting in short-termprivate gains.

60 G. Beekman, E.H. Bulte / Agricultural Systems 108 (2012) 50–63
Our empirical results for the various social norms proxies aremixed. At the individual level, trust in other people is correlatedwith investments in erosion management. This is not true for ourother social norms proxies (trust in institutions, perception of localcooperation, voting behavior, or altruism). Also, none of the socialnorms variables is correlated with fertilizer use, which is not unex-pected. Interestingly, and consistent with the results for titling, wefind more evidence for a potentially conducive role of social normswhen we consider the community level (aggregating individual so-cial norms proxies). Again, it appears as if the institutional context,captured in terms of trust and cooperation, matters more for indi-vidual behavior than individual perceptions. Unfortunately wewere unable to explore this further in an instrumental variable set-ting, because we were unable to identify appropriate instrumentsfor social norms. The one exception to that rule was our (experi-mental) altruism variable. However, and consistent with the earlierprobit evidence, our IV models contain no evidence that altruismmatters for erosion management (or fertilizer use).
We emphasize that some of these results are tentative (espe-cially the ones based on community-wide variables), as they arebased on a small number of observations, possibly resulting inmeasurement error. However, our results tentatively suggest thatpromoting tenure security can be an efficient way for policymakers and NGOs to promote investments in land management.Future analysis should explore whether the benefits of such pro-grams outweigh the costs associated with implementing them. Analternative, and even more speculative, recommendation wouldbe to invest in social norms in rural villages. Recent evidence sug-gests that social norms may be amenable to outside intervention(Fearon et al., 2009)), and our correlations suggest that especiallyenhanced trust in fellow-villagers could encourage the internali-zation of externalities associated with investments in erosioncontrol.
Acknowledgements
This research was funded by grants from the EU (MICROCON:Micro Level Analysis of Violent Conflict) and the United NationsInstitute of Peace (USIP).
Appendix A. Appendix
A.1. Instrumental variables method – addressing endogeneity
When estimating a regression model, we commonly assumethat the dependent variable y (in our case: soil conservation deci-sions) is affected by a vector of independent variables X (in our case:proxies for social capital and household characteristics) and anunexplained part, the error term e:
y ¼ bX þ e
In general, however, one may not interpret coefficient b as acausal effect. In some cases, the correlation between X and y is dri-ven the fact that y may affect X (in our case: certain soil conserva-tion decisions might affect tenure security). In other cases,unobserved variables may affect both y and X (in our case, geogra-phy may affect both soil management and social capital). In boththe reverse causality as the omitted variable case, the regressorof interest enters as an ‘‘endogenous variable.’’ Ignoring endogene-ity leads to biased estimates of the true causal effect.
Various methods can help addressing this endogeneity problem.First, and intuitively, one may focus on the selection of explanatoryvariables that are unlikely to be affected by the dependent variable.In our case, while the relation between soil conservation decisionsand social capital could be endogenous on the individual level, it is
less likely that individual soil conservation decisions affect commu-nity-level social capital (as in Table 3a). However, even for commu-nity-level regressors, the potential problem of omitted variablesremains.
An alternative approach is to apply an instrumental variablesmethod. An instrumental variable, or ‘instrument’ in short, is a var-iable z that satisfies three conditions. It is (1) exogenous and (2)correlated with the explaining variable of interest x, and also (3)uncorrelated with the error term e. This means that we have tolook for a variable (or better: a set of variables) z that explain X,but are orthogonal to y. These instruments help the analyst to iden-tify exogenous variation in the endogenous regressor of interest ina two-stage modelling strategy.
In a so-called first stage regression we regress the endogenousvariable on the set of instruments (excluded instruments, and wellas all the co-variates that enter in the second-stage of the model:see Table 4a). The partial F-values indicate how well z explainsthe variation in X.
Next, we replace the endogenous variable X by its predicted va-lue X�, as obtained in first-stage regression. Then we regress thedependent variable we are ultimately interested in (y) on the pre-dicted variable X� (and co-variates). This is the second-stageregression (Table 4b). We then use the Sargan–Hansen test of overidentifying restrictions to test for instrument validity. In addition,in Appendix A.2 we demonstrate that local conflict in Burundi in-deed appears ‘‘random’’ and not correlated to household or com-munity characteristics such as income or land management.
The IV procedure ensures that our estimates are unbiased andconsistent, and that we measure a true causal effect from x (repre-sented by z) on y. Refer to Dougherty (2007), Maddala (1992), orPindyck and Rubinfield (1995) for general introductions to econo-metric procedures, including instrumental variable methods.
A.2. Conflict intensity as an instrumental variable?
To explore the appropriateness of our instruments, we nowexamine whether selection into violence invalidates our approach.We want to know if communities and households were indeed tar-geted randomly, and investigate whether community characteris-tics are related to attacks by rebels and the army. As a first roughcut we include our conflict variables to the probit models esti-mated in the text. We found that they consistently entered in anon-significant manner (results not shown but available on re-quest). Since this is hardly sufficient evidence, we probed a littlefurther.
One might hypothesize that richer (or poorer) communities aretargeted more often as there is more to gain from looting them (orbecause they may serve as a breeding ground for rebel sympa-thies, inviting rebel recruitment activities). Also, communitieswhich supported the assassinated president Ndadaye may havebeen more prone to be targeted. Similarly, communities closerto the capital or with easy access may have experienced more vio-lence. To check whether any of this is indeed the case, we regressthe incidence and number of attacks between 1993–2003 on 1993subjective income levels within communities, the percentage ofvoters in favor of president Ndadaye in the 1993 elections, dis-tance to Bujumbura and altitude as well as some controls(Table A1). We find no significant correlations supporting the con-cern that violence was selectively targeted along any of thesedimensions.
We have also explored whether there exists a significant rela-tion between 1998 income (data from 1998 survey by World Bank)and post-1998 conflict, and again find no evidence of any system-atic relationship between income (or land management) and theincidence or frequency of attacks (results available on request).

Table A1Explaining community attacks by community characteristics.
(1) (2)# Confrontations 1993–2003
Confrontation 1993–2003(d)
OLS Probit, mfx
Distance to themarket
�0.312 (0.554) �0.0323 (0.0901)
Main road incommunity(d)
�0.0927 (1.381) 0.335 (0.214)
Land density(log)
2.972 (1.943) 0.166 (0.234)
Land Ginicoefficient
�3.765 (4.417) �1.311* (0.716)
Agriculturalproject (d)
�0.368 (0.756) 0.112 (0.169)
% Householdsowninglivestock
�4.499 (3.380) �0.392 (0.349)
% Householdsgrowing cashcrops
0.380 (1.732) 0.293 (0.299)
Averagehouseholdsize
0.165 (0.952) �0.134 (0.0937)
Land per adultequivalent
0.788 (0.922) 0.108 (0.134)
% Literatehouseholdheads
�2.108 (2.389) 0.109 (0.338)
% Malehouseholdheads
3.687 (3.409) 0.263 (0.458)
Average agehouseholdhead
0.0421 (0.108) �0.00643 (0.0138)
% Votes forNdadaye(communelevel)
�0.0407 (0.0345) 0.00451 (0.00515)
Distance toBujumbura
�0.00205 (0.0322) 0.00146 (0.00562)
Altitude 0.00178 (0.00233) �0.000433 (0.000461)Total income 0.00000344 (0.0000139) 0.00000122 (0.00000263)Constant �16.08 (17.38)
N 86 81R2 0.254Pseudo R2 0.187
Robust standard errors in parentheses. Province fixed effects are included. (d) refersto a binary variable (1 = yes). Marginal effects for the probit regression are calcu-lated at the mean.* Significance at the 90% level.
Table A2Choice pairs for the altruism experiment.
Question Option A Option B
Self Other Self Other
1 0 250 60 2402 60 240 120 2203 120 220 180 1804 180 180 220 1205 220 120 240 606 240 60 250 0
Participants were asked to choose between 6 allocations of money (A or B) betweenherself and another participant, ranging between 0 FBU for the respondent herselfand 250 FBU for the other respondent (question 1, option A), and 250 FBU for therespondent herself and 0 FBU for the other respondent (question 6, option B).
G. Beekman, E.H. Bulte / Agricultural Systems 108 (2012) 50–63 61
Appendix B. Data
B.1. Tenure security
� Title. Community level variable for the jth community createdby averaging ith household dummy, taking unity if the house-hold has full titles (propriétaire avec titre) to all m plots, zeroelse. Alternatively, in regressions using household level titleownership, the variable represents a household level dummy(BPHS).� Expropriation security. Community level variable for the jth com-
munity created by averaging ith household dummy, takingunity if household responded ‘no problem at all’ to the question‘What is the probability that this plot will be expropriated?’ for allp plots, zero else (BPHS).
B.2. Social norms
� Trust in community members. The trust index in the jth commu-nity is based on the average of the ith households’ rating of theirlevel of confidence in (1) household, (2) member of extendedfamily, (3) member of colline. The indices were scaled on a 1(no confidence)-6 (a lot of confidence) point scale. The sub-indi-ces scores are added and rescaled to form an index between 0and 1 (BPHS). Our results are robust to excluding sub-indices.� Trust in local political institutions. Community level variable for
the jth community based on the average of the ith households’rating of their level of confidence in (1) school teachers, (2) localjustice authority, (3) local political authority. The indices werescaled on a 1 (no confidence)-6 (a lot of confidence) point scale.The sub-indices scores are added and rescaled to form an indexbetween 0 and 1 (BPHS). Our results are robust to excludingsub-index (1).� Cooperation. Community level variable for the jth community
created by averaging ith household dummy, taking unity ifresponded positive to the question ‘Do most of the people in yourcolline help each other out when help is needed?, zero else (BPHS).� Voting. Community level variable for the jth community created
by averaging ith household dummy, taking unity if people votedfor local politics (BPHS).
� Altruism. Experimental variable, representing the level of altru-ism in the community. In the experiment, subjects are anony-mously matched to another participant from their communityand make six choices between two own-other payoff combina-tions; A and B. The pairs of allocations lie on a circle, where theamount of money the decision maker allocated to herself (S) ismeasured along the horizontal axis while the amount of moneyallocated to the other participant is measured along the verticalaxis (O). The radius of the circle is 250 FBU (about 20 dollarcents), so that S2 + O2 = (250)2. As a result, the total amount tobe allocated (S + O) is not constant over combinations (seeTable A2 and Fig. A1). Each own-other allocation can be consid-ered as a vector. If for each subject the preferred allocations areadded, the angle of the resulting vector with the horizontal axisis a measure of the extent the individual cares about the other.At the end of the experiments each subject’s payoff is the sum ofthe amounts allocated to themselves (by themselves and possi-bly by the other subject) in each round.1 Pretesting revealed thatthe total amount needed to run all experiments was too long, andhence we decided to just offer subjects pair-wise choices in thefirst quadrant of the social orientation circle. That means that
1 The outcomes of the social value orientation game were not revealed until theend of the session.
the range of possible angles is narrowed down to slopes between37.46� and 52.54�. On average we find an angle of almost 42�,indicating that people behave rather individualistic.

Fig. A1. Example of a record sheet for the altruism experiment. The record sheet is suitable for both literate and illiterate participants. The grey rectangles depict banknotes of10 FBU (Burundi Franc) each. Participants were asked to choose between various allocations of money, between herself (wewe; ‘you’) and another participant (uwundi;‘other’). In the case of this example, the respondent could choose between (A) receiving 60 FBU, while the other participant would receive 240 FBU, and (B) receiving 120 FBU,while the other participant would receive 220 FBU.
62 G. Beekman, E.H. Bulte / Agricultural Systems 108 (2012) 50–63
B.3. Investments in land
� Erosion management. Dummy variable taking unity if householdinvests in erosion control measures (by building terraces andtrenches and planting shrubs and hedges), zero else (BPHS).� Fertilizer use. Dummy variable taking unity if household uses
either organic or chemical fertilizer (BPHS).
B.4. Community level violence variables
� Number of times sous-colline was attacked. Variable counts num-ber of confrontations with army and rebels (PRIO). We used GISto match PRIO data to our dataset.� Number of dead. Reports number of dead on sous-colline as a
consequence of confrontations between rebels and army as wellas one sided violence between 1993 and 2003, as stated by localadministrators (BCS).� Number of wounded in community attacks. Reports number of
wounded on colline as a consequence of confrontationsbetween 1993 and 2003, as stated by local administrators (BCS).� Fraction of orphan-headed households. Reports number of orphan
headed households on colline as a consequence of confronta-tions as stated by local administrators, divided by the numberof households in the colline (BCS).
B.5. Community control variables
� Distance to the market. Distance to main agricultural marketwhere food and non-food items are traded, measured in timeintervals of 15 min, where t ¼ 1; . . . ;5 (BCS).� Main road in community. Dummy variable, taking unity if a
main road is present in colline j (BCS).� Population density. Logarithmic function of number of people in
community j per square kilometer (MPDRN).� Land Gini coefficient. Variable based on household land holdings.
Community level Gini coefficient is created by G ¼ 1� 2R 1
0 LðXÞdX (BPHS).
� Agricultural project. Dummy variable taking unity if an agricul-tural project was present in community j between 1993 and2007 (BCS).
B.6. Household control variables
� Livestock. Dummy taking unity if household i raises cattle. Zerootherwise (BPHS).� Cash crop. Dummy taking unity if household i cultivates coffee,
tea or tobacco on at least one of the plots. Zero otherwise (BPHS).� Household size. Number of children and adults that are member
of household i (BPHS).� Land size per capita (ha). Total land size of household i in square
meters, divided by number of adult equivalents present inhousehold i (BPHS).� Respondent is literate. Dummy for literacy of head of household
taking unity if the household head is literate. Zero otherwise(BPHS).� Respondent is male. Gender of head of household, dummy vari-
able that takes unity if the household head is male, zero other-wise (BPHS).� Age. Age of head of household, measured in years (BPHS).� Expenditure. Logarithmic function of household expenditure on
food and non-food items, divided by the number of adult house-hold members (BPHS).� Distance to the plot. Distance between the residence and plot in
minutes walking (BPHS).
References
Acemoglu, D., Johnson, S., 2005. Unbundling institutions. Journal of PoliticalEconomy 113, 949–995.
Acemoglu, D., Johnson, S., Robinson, J.A., 2001. The colonial origins of comparativedevelopment: an empirical investigation. American Economic Review 91, 1369–1401.
Baland, J.-M., Platteau, J.-P., 1997. Coordination problems in local-level resourcemanagement. Journal of Development Economics 53 (1), 197–210.
G. Beekman, E.H. Bulte / Agricultural Systems 108 (2012) 50–63 63
Bauer, M., Cassar, A., Chytilová, J., Henrich, J., 2011. Warfare Experience duringOntogeny Increases Egalitarian and Parochial Motivations. Working Paper.
Bellows, J., Miguel, E., 2006. War and institutions: new evidence from Sierra Leone.The American Economic Review 96 (2), 394–399.
Besley, T., 1995. Property-rights and investment incentives – theory and evidencefrom Ghana. Journal of Political Economy 103 (5), 903–937.
Blattman, C., 2009. From violence to voting: war and political participation inUganda. American Political Science Review 103 (2), 231–247.
Bouma, J., Bulte, E., Van Soest, D., 2008. Trust and cooperation: social capital andcommunity resource management. Journal of Environmental Economics andManagement 56, 155–166.
Braselle, A.S., Gaspart, F., Platteau, J.P., 2002. Land tenure security and investmentincentives: puzzling evidence from Burkina Faso. Journal of DevelopmentEconomics 67, 373–418.
Bundervoet, T., 2010. Assets, activity choices, and civil war: evidence from Burundi.World Development 38 (7), 955–965.
Bundervoet, T., Verwimp, P., Akresh, R., 2009. Health and civil war in rural Burundi.Journal of Human Resources 44 (2), 536–563.
Byerlee, D., de Janvry, A., Sadoulet, E., 2009. Agriculture for development: towards anew paradigm. Annual Review of Resource Economics 1, 1–14.
Carpenter, J., Seki, E., 2011. Do social preferences raise productivity? Fieldexperimental evidence from fishermen in Toyama Bay. Economic Inquiry 49(2), 612–630.
Cochet, H., 2004. Agrarian dynamics, population growth and resource management:the case of Burundi. GeoJournal 60 (2), 111.
Colleta, N.J., Cullen, M.L., 2000. Violent Conflict and the Transformation of SocialCapital. Lessons from Cambodia, Rwanda, Guatemala, and Somalia. The WorldBank, Washington, DC.
Cramer, C., 2006. Civil War is Not a Stupid Thing. Hurst & Company, London.Deininger, K., Ali, D.A., 2008. Do overlapping land rights reduce agricultural
investment? Evidence from Uganda. American Journal of AgriculturalEconomics 90 (4), 869–882.
Deininger, K., Jin, S., 2006. Tenure security and land-related investment: evidencefrom Ethiopia. European Economic Review 50 (5), 1245–1277.
Dougherty, C., 2007. Introduction to Econometrics. Oxford University Press, Oxford.Fearon, J., Humphreys, M., Weinstein, J., 2009. Can development aid contribute to
social cohesion after civil war? Evidence from a field experiment in post-conflict Liberia. American Economic Review 99 (2), 287–291 (Papers andProceedings).
Grimm, M., Klasen, S., 2008. Geography vs. institutions at the village level. In: IZADiscussion Paper Series. IZA, Bonn, pp. 1–29.
Holden, S.T., Deininger, K., Ghebru, H., 2009. Impacts of low-cost land certificationon investment and productivity. American Journal of Agricultural Economics 91(2), 359–373.
Isham, J., 2002. The effect of social capital on fertilizer adoption: evidence from ruralTanzania. Journal of African Economies 11 (1), 39–60.
Jacoby, H., Minten, B., 2007. Is land titling in Sub-Saharan Africa cost-effective?Evidence from Madagascar. World Bank Economic Review 21 (3), 461–485.
Klemick, H., 2011. Shifting cultivation, forest fallow, and externalities in ecosystemservices: evidence from the Eastern Amazon. Journal of EnvironmentalEconomics and Management 61 (1), 95–106.
Koster, M., 2008. Fragmented Lives: Reconstructing Rural Livelihoods in Post-genocide Rwanda. PhD Thesis, Wageningen University.
Liebrand, W.B.G., 1984. The effect of social motives, communication and groups sizeon behavior in an N-person multi stage mixed motive game. European Journalof Social Psychology 14, 239–264.
Lin, J.Y., 1995. Endowments, technology, and factor markets: a natural experimentof induced institutional innovation from China’s rural reform. American Journalof Agricultural Economics 77, 231–242.
Maddala, G.S., 1992. Introduction to Econometrics. Prentice-Hall, Englewood Cliffs.Nkurunziza, J.D., Ngaruko, F., 2002. Explaining Growth in Burundi: 1960–2000.
CSAE WPS.Piachaud, D., 2002. Capital and the determinants of social exclusion. In: CASE Paper.
Centre for Analysis of Social Exclusion, London, pp. 1–23.Pinchotti, S., Verwimp, P., 2007. Social Capital and the Rwandan Genocide. A Micro-
level Analysis. HiCN Discussion Paper 30.Pindyck, R.S., Rubinfield, D.L., 1995. Econometric Models and Economic Forecasts.
McGraw-Hill, Singapore.Place, F., Migot-Adholla, S.E., 1998. The economic effects of land registration on
smallholder farms in Kenya: evidence from Nyeri and Kakamega Districts. LandEconomics 74 (3), 360–373.
Putnam, R.D., 2000. Bowling Alone: The Collapse and Revival of AmericanCommunity. Simon & Schuster, New York.
Rodrik, D., Subramanian, A., Trebbi, F., 2004. Institutions rule: the primacy ofinstitutions over geography and integration in economic development. Journalof Economic Growth 9, 131–165.
Toulmin, C., 2008. Securing land and property rights in sub-Saharan Africa: the roleof local institutions. Land Use Policy 26, 10–19.
Van Leeuwen, M., 2010. Crisis or continuity? Framing land disputes and localconflict resolution in Burundi. Land Use Policy 27, 753–762.
Van Leeuwen, M., Haartsen, L., 2005. Land Disputes and Local Conflict ResolutionMechanisms in Burundi. CED-CARITAS Burundi, Bujumbura/Wageningen, pp.1–80.
Voors, M.J., Nillesen, E.E.M., Verwimp, P., Bulte, E.H., Lensink, R., Van Soest, D., inpress. Violent conflict and behavior: a field experiment in Burundi. AmericanEconomic Review.
Vyrastekova, J., van Soest, D.P., 2008. On the (in)effectiveness of rewards insustaining cooperation. Experimental Economics 11, 53–65.
WDR, 2007. World Development Report 2008: Agriculture for Development.Washington D.C.
World Bank, 2006. World Bank Africa Database. The World Bank, Washington, DC.World Bank, 2008. Rapport d’etude sur l’analyse d’impact environnemental et social
du projet. In: Projet de rehabilitation agricole et de gestion durable des terres auBurundi. World Bank, Washington, DC, pp. 1–240.