Social Context of Gray Whale Eschrichtius robustus Sound ...
166
SOCIAL CONTEXT OF GRAY WHALE Eschrichtius robustus SOUND ACTIVITY A Thesis by SARAH MARIE CHARLES Submitted to the Office of Graduate Studies of Texas A&M University in partial fulfillment of the requirements for the degree of MASTER OF SCIENCE May 2011 Major Subject: Wildlife and Fisheries Sciences
-
Upload
khangminh22 -
Category
Documents
-
view
4 -
download
0
Transcript of Social Context of Gray Whale Eschrichtius robustus Sound ...

SOCIAL CONTEXT OF GRAY WHALE Eschrichtius robustus SOUND
ACTIVITY
A Thesis
by
SARAH MARIE CHARLES
Submitted to the Office of Graduate Studies of
Texas A&M University
in partial fulfillment of the requirements for the degree of
MASTER OF SCIENCE
May 2011
Major Subject: Wildlife and Fisheries Sciences

SOCIAL CONTEXT OF GRAY WHALE Eschrichtius robustus SOUND
ACTIVITY
A Thesis
by
SARAH MARIE CHARLES
Submitted to the Office of Graduate Studies of
Texas A&M University
in partial fulfillment of the requirements for the degree of
MASTER OF SCIENCE
Approved by:
Chair of Committee, Bernd G. Würsig
Committee Members, Robert H. Benson
Roel R. Lopez
Head of Department, Thomas E. Lacher, Jr.
May 2011
Major Subject: Wildlife and Fisheries Sciences

iii
ABSTRACT
Social Context of Gray Whale Eschrichtius robustus Sound Activity. (May 2011)
Sarah Marie Charles, B.S., Xavier University
Chair of Advisory Committee: Dr. Bernd G. Würsig
This thesis examines sound production of eastern gray whales (Eschrichtius
robustus) in the wintering lagoons to determine whether sound use is a function of social
context. Proportions of sounds used, parameters of each sound class, and rates of sounds
were compared among social contexts. Data revealed the strong possibility of context-
specific use for particular sound classes. Additionally, sound parameters and rates of
production varied by social context. These results reflect similar variations in gray
whale repertoire throughout their range that may be due to changes in social and
behavioral contexts.
Gray whale sounds are classified into several classes based on aural and visual
characteristics. This study verifies the classification system determined in previous
studies, with the exception of class 8, and supports the division of class 1 into subclasses
1a and 1b. Class 1 appeared to be critical during sexual contexts and all highly social
contexts, regardless of age and sex class. Although highly recognizable, its parameters
exhibited much variation among social contexts; therefore class 1 may communicate
graded emotional states in short-range interactions. Other classes of sounds may be
utilized for long-distance communication, as startle responses, or ―precursors‖ to the
adult repertoire. Frequency-related parameters of all sound classes showed variation
among social contexts, but duration demonstrated very little variation. Calf-containing
contexts exhibited greatest and most varied frequencies; this is to be expected if gray
whale‘s sound mechanism is related to body and tracheal length. Variation also may
indicate that physical maturity or learning play a role in the repertoire development. The
lowest and least varied frequencies were observed in adult contexts. Sound production
rates also varied by social context. Active adults produced sounds at high rates during

iv
short intervals; mixed/unknown contexts were often silent. Calf-containing contexts
produced sounds at intermediate rates and were never silent. The correlations
demonstrated here between social context and use of sounds will allow for acoustics to
be an indicator of group composition, seasonal movements, and social patterns, thus
relieving dependency on difficult visual observation. Additionally, such correlations
provide preliminary information for determining sound functions.

v
ACKNOWLEDGMENTS
I thank God first and foremost for the blessings He has provided me; the
opportunity to study gray whale sounds is just one of many! I also thank Bernd Würsig
for the opportunity to study under his tutelage and glean from his experiences and
knowledge. Bernd‘s patience with my ―long term‖ study has been greatly appreciated. I
also extend thanks to Bernd and Mel for travel funds, housing, and their warm
hospitality.
I am extremely grateful to the staff, pangueros and students of the School for
Field Studies / Center for Coastal Studies in Puerto San Carlos. Without their resources
and hard work, this study would not have been possible. Francisco (Paco) Ollervides
and SFS created this tremendous opportunity by generously providing boats and fuel,
acoustic equipment, student assistants, and room and board during data collection.
Hector Pérez-Cortés extended the school‘s generosity for a second season, and he was
also an important source of gray whale knowledge. The students were invaluable in data
collection and management, and additionally provided plenty of fun adventures and
comical diversions! The ‗sound‘ advice (pun intended!) of Manuel Castellote and
Shannon Rankin has been priceless.
Thanks to my committee members Robert Benson and Roel Lopez. I am grateful
for Dr. Benson‘s instruction in sound analysis and Dr. Lopez‘s advice in data
management and analysis. I appreciate Robin Vaughn for being a helpful long-distance
lab mate.
The help received at the Texas A&M Statistics Department Statistical Consulting
Center was invaluable. I am extremely grateful to May Boggess and graduate students
Jing Li, Randall Gil, and Mir Usman Ali for their uphill battle with my data. Without
their expertise and instruction, I would still be drowning in my data!
The Cornell Lab of Ornithology and Macauley Library Audio Workshop
provided basic instruction in audio recording techniques and analysis with Raven
software. The Marine Mammal Research Program (Texas A&M University at

vi
Galveston) and the Center for Bioacoustics (Texas A&M University at Corpus Christi)
provided resources and labs for advanced sound analysis and organization.
There are countless others who have contributed to this study and for their help I
am grateful: Jane Packard, Sheyna Wisdom, Nicole Crane, Christopher Clark for loan of
acoustic instruments, Steven Swartz for advice, Molly Meserve, and Robert McCleery.
I greatly appreciate the grants and funding that made this study possible: Erma
Lee and Luke Mooney travel grant; Texas A&M Office of Graduate Studies Merit
Fellowship; MARB travel grant; National Fish and Wildlife Foundation; Office of
Graduate Studies Research and Presentation Grant; and Graduate Program Enhancement
Fund (GPEF) Travel and Presentation Grant.
Finally, I cannot thank enough my loved ones for their unconditional and endless
supply of love and support. My parents, Louis and Regina Rohrkasse, provided me with
a fantastic education and the opportunities to pursue my dreams. Thank you mom for
sending my hometown chili and Girl Scout cookies to México! My husband Eddie
patiently endured several years of out-of-state and out-of-country research. I am so
grateful to be so blessed!

vii
TABLE OF CONTENTS
Page
ABSTRACT .......................................................................................................... iii
ACKNOWLEDGMENTS ...................................................................................... v
TABLE OF CONTENTS ....................................................................................... vii
LIST OF FIGURES ............................................................................................... ix
LIST OF TABLES ................................................................................................. xii
I INTRODUCTION ........................................................................................... 1
Determining Sound Function by Social Context ......................................... 2
Characteristics of Social Context ................................................................ 5
Products of Determining Social Context and Function of Sounds ............... 6
Gray Whale Natural History ....................................................................... 9
Gray Whale Sound Repertoire .................................................................... 11
II METHODS ...................................................................................................... 15
Behavior Analysis ...................................................................................... 17
Acoustic Analysis ....................................................................................... 18
Statistical Analysis ..................................................................................... 19
III RESULTS ........................................................................................................ 22
Classes of Sounds and Their Parameters ..................................................... 22
Parameter Variations by Class .................................................................... 35
Parameter Variations between Class 1 Subclasses....................................... 40
Parameter Variations by Social Context ...................................................... 46
Class 1 Subclass Parameter Variations by Social Context ........................... 51
Relative Use of Classes by Social Context .................................................. 62
Relative Use of Class 1 Subclasses ............................................................. 68
Relative Use of Types ................................................................................ 69
Rates of Sound Production ......................................................................... 71
Use of Four Social Contexts ....................................................................... 75
IV DISCUSSION .................................................................................................. 83
Class Parameters ........................................................................................ 86

viii
Page
Class Parameters by Social Context ............................................................ 92
Class 1 Subclass Parameter Variations by Social Context ........................... 95
Relative Use of Classes .............................................................................. 97
Relative Use of Classes by Social Context .................................................. 101
Relative Use of Type .................................................................................. 112
Relative Use of Type by Social Context ..................................................... 114
Rates of Sound Production ......................................................................... 115
Use of Four Social Contexts ....................................................................... 119
V CONCLUSIONS.............................................................................................. 121
REFERENCES ...................................................................................................... 128
APPENDIX A ....................................................................................................... 141
APPENDIX B ........................................................................................................ 146
APPENDIX C ........................................................................................................ 149
VITA ..................................................................................................................... 154

ix
LIST OF FIGURES
Page
Figure 1 Map of Study Area of Bahía Magdalena Complex in Baja
California Sur, México and Sites of Gray Whale Recording
Sessions in 2006 and 2007 .............................................................. 16
Figure 2 Spectrogram of Gray Whale Sound Class 1a ................................... 25
Figure 3 Spectrogram of Gray Whale Sound Class 1b ................................... 26
Figure 4 Spectrogram of Gray Whale Sound Class 2 ..................................... 27
Figure 5 Spectrogram of Gray Whale Sound Class 3 ..................................... 28
Figure 6 Spectrogram of Gray Whale Sound Class 4 ..................................... 29
Figure 7 Spectrogram of Gray Whale Sound Class 5 ..................................... 30
Figure 8 Spectrogram of Gray Whale Sound Class 6 ..................................... 31
Figure 9 Spectrogram of Gray Whale Sound Class 7 ..................................... 32
Figure 10 Spectrogram of Gray Whale Sound Class 9 ..................................... 33
Figure 11 Spectrogram of Gray Whale Sound Class 10 ................................... 34
Figure 12 Spectrogram of Gray Whale Sound Class 11 ................................... 35
Figure 13 Plot of Predicted Low Frequency by Class ...................................... 36
Figure 14 Plot of Predicted High Frequency by Class ..................................... 37
Figure 15 Plot of Predicted Maximum Frequency by Class ............................. 38
Figure 16 Plot of Predicted Bandwidth by Class ............................................. 39
Figure 17 Plot of Predicted Duration by Class................................................. 40
Figure 18 Plot of Predicted High Frequency by Class 1 Subclass .................... 41
Figure 19 Plot of Predicted Bandwidth by Class 1 Subclass ............................ 42
Figure 20 Plot of Predicted Pulse Rate by Class 1 Subclass ............................. 43
Figure 21 Plot of Predicted Individual Pulse High Frequency by
Class 1 Subclass.............................................................................. 44
Figure 22 Plot of Predicted Individual Pulse Bandwidth by
Class 1 Subclass.............................................................................. 45
Figure 23 Plot of Predicted Inter-pulse Interval by Class 1 Subclass ............... 46
Figure 24 Plot of Predicted Low Frequency by Class and Social Context ........ 47

x
Page
Figure 25 Plot of Predicted High Frequency by Class and Social Context ....... 48
Figure 26 Plot of Predicted Maximum Frequency by Class and Social Context 49
Figure 27 Plot of Predicted Bandwidth by Class and Social Context ............... 50
Figure 28 Plot of Predicted Duration by Class and Social Context .................. 51
Figure 29 Plot of Predicted Low Frequency by Subclass and Social Context ... 52
Figure 30 Plot of Predicted High Frequency by Subclass and Social Context .. 53
Figure 31 Plot of Predicted Maximum Frequency by Subclass and
Social Context ................................................................................ 54
Figure 32 Plot of Predicted Bandwidth by Subclass and Social Context .......... 55
Figure 33 Plot of Predicted Number of Pulses by Subclass and Social Context 56
Figure 34 Plot of Predicted Pulse Rate by Subclass and Social Context........... 57
Figure 35 Plot of Predicted Individual Pulse Low Frequency by
Subclass and Social Context ........................................................... 58
Figure 36 Plot of Predicted Individual Pulse High Frequency by Subclass
and Social Contexts ........................................................................ 59
Figure 37 Plot of Predicted Individual Pulse Bandwidth by Subclass and
Social Context ................................................................................ 60
Figure 38 Plot of Predicted Inter-pulse Interval by Subclass and Social Context 61
Figure 39 Plot of Predicted Use of Class 1 by Social Context.......................... 64
Figure 40 Plot of Predicted Use of Class 4 by Social Context.......................... 65
Figure 41 Plot of Predicted Use of Class 5 by Social Context.......................... 66
Figure 42 Plot of Predicted Use of Classes 5-11 by Social Context ................. 67
Figure 43 Plot of Predicted Use of Subclass 1a by Social Context ................... 68
Figure 44 Plot of Predicted Use of Pulsed Sound Type by Social Context ....... 69
Figure 45 Plot of Predicted Use of Complex Sound Type by Social Context ... 70
Figure 46 Plot of Predicted Rates of Sound Production by Social Context ...... 73
Figure 47 Plot of Predicted Group Rates of Sound Production by
Social Context ................................................................................ 74
Figure 48 Plot of Predicted Use of Subclass 1a by Four Social Contexts ......... 77
Figure 49 Plot of Predicted Use of Class 3 by Four Social Contexts ................ 78

xi
Page
Figure 50 Plot of Predicted Use of Classes 5-11 by Four Social Contexts ....... 79
Figure 51 Plot of Predicted Use of Complex Sound Type by Four
Social Contexts ............................................................................... 80
Figure 52 Plot of Predicted Rates of Sound Production by Four
Social Contexts ............................................................................... 81
Figure 53 Plot of Predicted Group Rates of Sound Production by Four
Social Contexts ............................................................................... 82

xii
LIST OF TABLES
Page
Table 1 Descriptive Parameter Medians of Gray Whale Sound Classes
Recorded in Bahía Magdalena Complex, Baja California Sur,
México, 2006 and 2007 ................................................................... 23
Table 2 Individual Pulse Descriptive Parameter Medians for Class 1 and
its Subclasses Recorded in Bahía Magdalena Complex, Baja
California Sur, México, 2006 and 2007 ........................................... 24
Table 3 Gray Whale Class Use by Social Context in Bahía Magdalena
Complex, Baja California Sur, México, 2006 and 2007 ................... 63
Table 4 Rates of Gray Whale Sound Production by Social Context
in Bahía Magdalena Complex, Baja California Sur,
México, 2006 and 2007 ................................................................... 72
Table 5 Gray Whale Class Use by Four Social Contexts in Bahía Magdalena
Complex, Baja California Sur, México, 2006 and 2007 ................... 76
Table 6 Comparison of Gray Whale Repertoire Use Throughout Its Range .. 98
Table 7 Comparison of Gray Whale Sound Production Rates Throughout
its Range ......................................................................................... 117

1
I. INTRODUCTION
In social animals, communication is necessary and can be accomplished by
several sensory means (Halliday, 1983). Marine environments dictate the importance of
acoustic communication for marine mammals; water does not always allow for
significant visibility but does propagate sound well (Tyack, 2000). Additionally, the
range and distribution of marine mammals and conspecifics can be great. The social
context in which communication occurs may necessitate the use of different kinds of
sounds, use of sound types in different proportions, or altering the characteristics of a
general sound format (Clark, 1982; Clark, 1983; Ford, 1989; Caldwell et al., 1990; Janik
et al., 1994; Oleson et al., 2007).
Studies have shown that eastern gray whales (hereafter referred to as gray
whales) vary the proportions of sounds used throughout their range. The ―knocking‖
sound was predominant in both northern feeding grounds (79.5%) and southern calving
lagoons (83.5%); on the migratory route it composed only 37.4% of sounds (Dahlheim et
al., 1984; Crane and Lashkari, 1996; Ollervides, 2001). Variation in vocalization use
may reflect the variations in behaviors that occur geographically and temporally
throughout the year.
While the gray whale sound repertoire is well documented, little is known about
the functions or behavioral correlations of each sound or the purpose of variations within
a class of sound (Dahlheim et al., 1984; Ollervides, 2001). Correlations between social
context and use of sounds will allow for acoustics to be an indicator of group
composition, seasonal movements, and social patterns. This is important in the study of
marine mammals, which are difficult to observe visually. The function of a sound will
be elucidated if it can be determined who is producing a sound, when the sound is
produced (i.e., behavioral context, annual cycle/seasons), and where (what part of their
geographic range) it is produced.
____________
This thesis follows the style Journal of the Acoustical Society of America.

2
The objective of this study is to determine whether sound use by gray whales is
differentiated by social context while the population resides in its wintering lagoons in
Baja California Sur, México. This study will examine differences in sound production by
mother males, non-parturient females and immature whales who are feeding, courting
and mating. This can be tested with three specific research questions 1) How does
relative use of sound classes differ by social context? 2) How do acoustic parameters,
such as frequency, repetition and duration, differ by social context? and 3) How do rates
of sound production differ by social context?
The mysticete, or baleen whale, repertoire includes simple, low frequency
moans, complex broadband pulsive sounds and clicks, knocks, and grunts (Thompson et
al., 1979; Clark, 1990). A few species use songs that are patterns and sequences of
sound units (Payne and McVay, 1971; Winn and Winn, 1978; Clark and Johnson, 1984;
Cummings and Holliday, 1987; Würsig and Clark, 1993; Fristrup et al., 2003). Non-
vocal sounds such as slaps, blows and breaches may have a communicative function, but
it is believed that adventitious sounds such as baleen rattles and flatulence do not (Clark,
1990). Mysticetes share some vocal and communication trends, but each species also
has unique characteristics. The repertoire of the migrating bowhead whale (Balaena
mysticetus) is similar to that of the southern right whale (Eubalaena australis); both use
simple moans and complex calls, although the bowhead‘s pulsed sounds have more
variations (Clark and Johnson, 1984).
Determining sound function by social context
Classes/types of sounds
The extensive studies on the southern right whale point to a communication
system in which particular sounds are consistently used for a particular function. Clark
(1983) hypothesized that the function of a sound is best deduced by interpretation of the
social context in which it was made and the changes in behavior that accompany it.
Small, inactive groups and individuals of northern and southern right whales tended to
be silent or make significantly fewer calls than other groups (Clark, 1983; Matthews et
al., 2001). Clark‘s (1983) study revealed that complexity of calls used by tight, active

3
groups varied directly with the complexity of the social context, such as group size,
number of males, and sexual activity. Groups of mixed sexes had higher rates of calling.
Groups with highest activity levels always produced some kind of sound, and often at
significantly higher rates than resting or swimming groups. Discrete frequency
modulated up calls were used by resting and traveling whales while highly variable
sounds were used by active whales (Clark, 1990). An up call by one whale may be
returned with another up call from a whale several miles away; upon joining together,
the calling will cease. As a result, Clark (1990) concluded that the discrete up call may
be used for long-distance contact and cohesion; traveling groups and individuals used up
calls almost exclusively and significantly more than resting or active groups.
Clark (1983) concluded that loud, harsh blow sounds may be produced by
disturbed whales. These were produced by resting whales when joined by porpoises, sea
lions (Otaria byronia) or whales that approached without vocalizing. Harsh blows were
also produced by females in sexually active groups and mothers who have been
separated from their calves. Individual mother whales also produced growl sounds when
a calf was several hundred meters away and when joined by a third whale (Clark, 1983).
On these occasions of separation, the calf either quickly returned to the mother or the
mother retrieved the calf.
Parameter variations
Variations in acoustic parameters may indicate the sex, age class, size and
motivational state of the producer. Moreover, information may be conveyed to receivers
by variations in a graded communication system or call type. Mysticetes, most notably
humpback whales (Megaptera novaeangliae), demonstrate temporal and geographic
parameter variations; some changes even indicate cultural transmission (Cerchio et al.,
2001). Humpback song also varies in response to environmental circumstances (i.e., in
response to Navy SURTASS LFA (Fristrup et al., 2003)). Different oceanic populations
of blue whales may have vocalizations distinguished by frequency, duration and
repetition interval (Mellinger and Clark, 2003). Amazonian manatee (Trichechus
inungius) vocalizations showed significant variations in several acoustic variables based

4
on sex and age class (Sousa-Lima et al., 2002). Adult vocalizations had longer duration
and narrower range of fundamental frequencies. Females had greater values of mean,
maximum and minimum fundamental frequencies, interval duration (between notes), and
fundamental range. Males had significantly greater note duration. Moreover, individual
recognition within an age class is possible based on these acoustic variables (Sousa-
Lima et al., 2002). Bottlenose dolphins (Tursiops truncates) also varied signature
whistle parameters in relation to context (Janik et al., 1994). Frequency and time
domain distinctions were significant between an isolation context and an experimental
discrimination task.
Rate of sound production
Rate of sound production is an additional variable that may be influenced by
social context. Behavior patterns and group size may affect the whistle rate of
bottlenose dolphins (Quick and Janik, 2008). Travelling animals had lower individual
whistle rates than socializing or non-polarized (milling) animals, but all rates decreased
when groups were larger than 10 animals. Thus, call rates may be an indicator of
increased information exchange or means to maintain contact, until an upper limit is
approached in which information transfer is less successful. In a study of humpback
whale sound production, Silber (1986) found that group rates increase with group size,
but not individual rates. Large groups of humpbacks engage in high levels of surface
activity, ―such as breaching, flipper- and tail-slapping, and under-water bubbling‖ and
likely include aggressive behaviors as males compete (Silber, 1986). It is during these
encounters that social sounds may demonstrate aggression or agitation. Similarly, gray
whales have been observed to first form pairs and trios; these groups then aggregate to
form a large group (Norris et al., 1983). The behaviors of these aggregations include
much physical contact, rolling, throwing pectoral fins and swiping flukes. Finally,
confirming that these groups have some courting or mating function, there have been
observations of whales probing genital areas and extended penises. The similarities
between humpback and gray whale social behavior may extend to sound production
rates as well.

5
Characteristics of social context
Caller identity
Caller identity is an important factor of social context and thus also in
determining a sound‘s function. Parks and Tyack (2005) determined which classes of
animals produced certain calls in the surface active groups of North Atlantic right whales
(Eubalaena glacialis). Using simultaneous acoustic and video recording as well as
timing of vocalizations and breathing patterns, they determined that females produce
scream calls, males produce gunshot calls and up calls, and warbles were attributed to
only female calves (Parks and Tyack, 2005). Data also suggest that percentages of call
types are associated with group size and composition (Parks and Tyack, 2005).
Group composition
Age and sex composition also define social context of a group and therefore also
possibly the vocalization content. In a study of bowhead whales, Richardson et al.
(1995) found that in areas populated by large subadults and adults without calves,
observations included more socializing groups, more vigorous socializing, more sexual
activity, and more time spent at the surface. The relative proportions of call types varied
during bowhead whale spring migration, possibly in association with changing age/sex
composition of migrating whales (Würsig and Clark, 1993). Group size influences
complexity of chickadee call (Freeburg and Harvey, 2008). Significant differences are
found in the vocal patterns of different sex and age classes of Amazonian manatees
(Trichechus inunguis) as well (Sousa-Lima et al., 2002). While studying the possible
existence of manatee signature calls, Sousa-Lima et al. (2002) found evidence of intra-
individual variation, which may be an expression of the sender‘s motivation, the context,
or individuality. Possible gender-specific cues in manatee calls could indicate mate
attraction or recognition or simply be a reproductive display, as seen in many birds and
humpback whales (Halliday, 1983; Clark and Clapham, 2004).
Range
The range at which individuals can communicate and maintain acoustic contact
with conspecifics is critical in defining social context and eventually delineating a

6
sound‘s function. This can be determined by calculating the source level of a sound and
the rates at which it will attenuate (Cummings and Holliday, 1987). As large vocal
ranges are realized, we may have to reconsider how a social group is defined (Janik,
2000). Range and social group will vary with environmental conditions. Due to ice
cover and shallow waters in their Arctic feeding grounds, propagation of bowhead whale
sounds was limited (2.5 km–10.7 km) more than whale sounds in temperate, deep water
oceans (Payne and Webb, 1971; Cummings and Holliday, 1987).
Products of determining social context and function of sounds
Previous studies have described social contexts in which sounds are used. If
correlations between sound use and social context can be established (Ferrer-i-Cancho
and McCowan, 2009), acoustics can be an indicator of presence of individuals or
populations, movements, and social context. Acoustic monitoring is facilitated by the
low frequency and simple frequency-modulated structure of many baleen whale
vocalizations that propagate long distances (Cummings and Thompson, 1971b; Clark
and Ellison, 2000). The use of acoustics as a survey tool is critical for cetacean studies,
where the subjects are visible at the surface for relatively brief periods. Acoustic
monitoring is especially important for studying wide-ranging pelagic species where
visual surveying and population counts are difficult (Mellinger and Clark, 2003). In
combination with visual surveys, acoustic monitoring has revealed new insights to
cetacean behavior and ranges (Frankel et al., 1995; Gedamke and Robinson, 2010).
Additionally, acoustic monitoring can overcome harsh environments or seasons in which
traditional field observations may often be dangerous or impossible (Würsig and Clark,
1993; Raftery and Zeh, 1998; George et al., 2004; Moore et al., 2006). Additionally,
acoustic monitoring is often less invasive, requires less effort and financing, and has a
greater duration than satellite tagging (Moore et al., 2010). With proper equipment,
filtering, and new analyses, acoustic localization and population estimates are improving
in accuracy (Raftery and Zeh, 1998; McDonald and Fox, 1999; Clark and Ellison, 2000).
Critically endangered North Pacific right whales (Eubalaena japonica) had not been
sighted in Gulf of Alaska for decades; however, autonomous recorders have recently

7
detected their calls (Moore et al., 2006). Autonomous recorders also detected over-
winter calls from bowhead whales in the Beaufort and Chukchi seas, thus providing
important information about seasonal migration movements and population size and
trends without expensive, dangerous and time-consuming visual surveys (Stafford et al.,
2007a).
Thorough knowledge of a species‘ repertoire will allow for identification of the
sound‘s producer, possibly even its sex, and perhaps its motivational state. Such
identification allows for locating, tracking, and describing seasonal movements and
distributions. Scientists have accessed the Navy Sound Surveillance System (SOSUS)
of fixed hydrophone arrays to localize and track blue whales (Balaenoptera musculus) in
the North Atlantic. Mellinger and Clark (2003) used the sounds acquired from SOSUS
to compare North Atlantic blue whale vocalizations with those of other ocean regions.
Although there are shared characteristics, several variations, such as the frequency
contours, number of parts in phrases, and rates of frequency modulation, may distinguish
geographically separate populations and may also indicate seasonal distributions and
movements (Mellinger and Clark, 2003). There is evidence of genetic divergence
among fin whale (Balaenoptera physalus) populations (Bérubé et al., 1998; Palsboll et
al., 2004). Studies of distinguishing acoustic characteristics in these populations are
beginning to corroborate the results of genetic studies (Thompson et al., 1992; Clark et
al., 2002; Delarue et al., 2009).
Population distribution, behavior or repertoire use may change seasonally.
Evidence suggests that the Gulf of California population of fin whales, as well as Pacific
and Atlantic ocean stocks, produce 20-Hz vocalizations in higher rates from late summer
through early spring, and lower rates in late spring and early summer (Thompson et al.,
1992). Minke whales (Balaenoptera acutorostrata) also demonstrated seasonal
variations in repertoire use. While minke whale pulse trains were detected between
February and November, detection rates were low during spring, and peaked in late
summer; they were detected in more than 80% of all recordings during August and
September (Risch, 2010).

8
It is increasingly possible to distinguish between populations with differing
dialects, structure, sex ratios, and even individual dolphin‘s signature calls (Winn and
Winn, 1978; Winn et al., 1981; Caldwell et al., 1990; Tyack, 2000; Croll et al., 2002;
McDonald et al., 2006). The matrilineal group-specific dialects of killer whales
(Orcinus orca) are well documented (Ford, 1989; Miller and Tyack, 1998). Familiarity
with killer whale pods‘ stereotyped acoustic repertoires will facilitate studies of
relationships, social structure, distribution and movement (Ford, 2010). The songs of
humpback whales are distinct in separate oceans, each recognizable by its content and
patterns; localized dialects may exist within the same oceanic population (Winn et al.,
1981; Payne and Guinee, 1983).
The correlation between sex of producer and use of a particular sound is a
fundamental step to elucidating a sound‘s function. Croll et al. (2002) used the
combination of acoustic localization and molecular techniques to verify that only males
produced the 20-Hz vocalization, despite a 1:1 sex ratio in the area, which supports the
hypotheses that these vocalizations are produced by males to attract females. Humpback
whale songs are produced by lone males (Winn and Winn, 1978; Tyack and Whitehead,
1983; Darling and Bérubé, 2001), and this knowledge has been significant in the
development of hypotheses of song function. Among several current hypotheses are
those suggesting that songs function as male sexual display for social ordering or
attracting females (Tyack, 2000; Darling and Bérubé, 2001).
We can better determine a sound‘s function when behavior and context are
visually correlated with sound production (Boisseau, 2005; Diaz-López and Shirai,
2009; Graham and Noonan, 2010). Behavior and context serve as indirect
measurements for meaning (Ferrer-i-Cancho and McCowan, 2009). Context may be
defined as the immediate behaviors and states of the animals involved, the identity of the
sound producer (sex, age class) and the extent to which it is used (individual or groups,
all) (Ferrer-i-Cancho and McCowan, 2009). This accumulation of knowledge regarding
the context of a sound enables us to deduce behavior from acoustic analysis. Recent
evidence of male humpbacks singing for extended periods in their northern feeding

9
grounds indicates that breeding may be occurring (Clark and Clapham, 2004). Along
with aseasonal conceptions, this evidence implies that mating continues during and after
spring migration, despite long-held beliefs that it was contained to wintering grounds in
the tropics (Clark and Clapham, 2004). Ultimately, temporal, geographic, and social
patterns of use will reveal function.
Gray whale natural history
Gray whales exist in the North Pacific as two geographically and genetically
distinct populations (LeDuc et al., 2002). Although the eastern (California-Chukchi)
population has recovered well from commercial whaling, the western (Korean-Okhotsk)
population remains highly depleted (Weller, 2002; Bradford et al., 2008). To date, there
are no published acoustic studies on western gray whales.
Eastern gray whales spend the summer months in the Chukotskoe (Chuchki) and
Bering Seas (Moore and Ljungblad, 1984; Petrochenko et al., 1991). Gray whales
(hereafter referring to eastern gray whales) in their arctic summer grounds are generally
solitary or in pairs (Bogoslovskaya et al., 1981; Bogoslovskaya et al., 1982), and their
behaviors indicate feeding (Moore and Ljungblad, 1984; Würsig et al., 1986).
Socialization and group formation increase in September, possibly the precursor of the
mating that likely occurs during southward migration (Würsig et al., 1986).
Surprisingly, some animals do not complete the southward migration, as recordings in
the Beaufort Sea have detected the presence of gray whales during winter months as well
(Stafford et al., 2007a).
Migrating whales often travel individually or in groups of 2 or 3 animals (Reilly
et al., 1983; Crane and Lashkari, 1996). There is a distinct segregation by sex, age and
reproductive status (Rice and Wolman, 1971). On southward migration, females
carrying near-term fetuses are first to migrate, followed by the remainder of adults and
lastly, sexually immature whales. Recently impregnated females are the first to begin
the northward migration, followed by the remainder of adults and then immature whales;
mothers and calves are the last to make the migration.

10
Eastern gray whales migrate annually to wintering lagoons on the Pacific coast of
Baja California in México. In many of the lagoons there is a distinct spatial separation,
similar to the segregation observed during migration. Males, non-parturient females,
and sexually immature whales are generally observed in the lower lagoons and deeper
lagoon entrances, while mothers and their newborn calves remain in the shallower inner
estuaries of the lagoons (Norris et al., 1977; Norris et al., 1983; Jones and Swartz, 1984;
Pérez-Cortés et al., 2004). In addition to spatial separation, behavioral and social
differences are evident. Mothers and their calves remain in discrete pairs for the first
few months, and spend much time nursing (Norris et al., 1983; Pérez-Cortés et al.,
2004). Late in the wintering season, mother-calf pairs begin to socialize with other
pairs, generally lasting several minutes and including much physical interaction (Jones
and Swartz, 2002). As single adults leave for the northbound migration, mother-calf
pairs move from the upper lagoons to the lower lagoons, now unoccupied by adults
(Wisdom, 2000). The infrequent encounters between mother–calf pairs and single
whales involve chasing the female, attempting to mate and high-speed swimming
(Norris et al., 1983; Jones and Swartz, 1984).
The aggregations of males, non-parturient females, and immature whales at
lagoon entrances vary their behavior as a function of the tides (Norris et al., 1983).
During slack low or high tide when current velocities are lower, Norris et al. (1983)
observed irregular diving and courting and mating behaviors of rolling, throwing
pectoral fins and flukes, and probing of genital areas. Pairs of whales form until 7 or 8
groups have concentrated within several 100 meters. It is believed that not many
conceptions occur during these social aggregations. The majority of conceptions occur
in late November and early December, intromission is rarely seen in these aggregations,
and sexually immature whales comprise part of these socially and sexually active groups
(Rice and Wolman, 1971; Norris et al., 1983; Swartz et al., 2006). Such seemingly
functionless behavior may be exploratory or serve other purposes (Norris et al., 1983).
When current velocities increase due to tidal changes, social and sexual behaviors
diminish (Norris et al., 1983). Diving becomes regular and often oriented into the

11
current. Norris et al. (1983) suggest that feeding into high velocity currents could aid in
concentrating food.
Few whales are found in the areas between the aggregations of mother-calf pairs
and feeding/socializing singles (Norris et al., 1983; Jones and Swartz, 1984). Feeding
aggregations may find highest densities of food at lagoon entrances or need deeper water
for mobility during social activities.
Gray whale sound repertoire
Gray whales produce simple sounds that may be described as clicks, knocks,
grunts, or rumbles, in the frequency range of 20 Hz to 2 kHz (Dahlheim et al., 1984;
Crane and Lashkari, 1996). According to Clark (1990), there are no records of gray
whale complex calls, described as broadband pulsive sounds with mixtures of amplitude
modulation and frequency-modulated fundamentals, or songs, defined as highly
patterned sequences of sounds. Sounds are sufficiently distinct to allow categorization,
but variations within a category do exist (Dahlheim et al., 1984). Such variations may
be a result of individual differences, varying responses due to behavioral context, or
conveying additional information.
A numerical classification system (1-6) of gray whale sounds was created based
on visual (spectral) and aural comparisons of recordings in Laguna San Ignacio
(Dahlheim et al., 1984). This system was extended to other parts of the gray whale‘s
range by Moore and Ljungblad (1984), Crane and Lashkari (1996), and Ollervides
(1997, 2001) with new prefixes that indicate location: at northern feeding grounds (N),
during migration route (M), and at the southern wintering lagoon of Bahía Magdalena
Complex (BMC). Earlier studies of gray whale sounds were opportunistic recordings
and sounds were described subjectively using onomatopoetic terms resulting in
confusion and inconsistency in the literature (Cummings et al., 1968; Fish et al., 1974).
Additional studies of gray whale sounds in their wintering lagoons have
supplemented the vocal repertoire recorded by Dahlheim et al. (1984). In addition to
recording sounds that corresponded to Dahlheim‘s original 6 classes, S1-S6, Ollervides
(2001) recorded sounds in Bahía Magdalena Complex (BMC) that he believed required

12
new categories, and thus classified them as BMC 7-11. However, Ollervides (2001)
acknowledged that these new categories may be caused by differences in recording, local
environment, or subjectivity in classification. A baleen rattle similar to BMC 11 had
also been described by Petrochenko et al. (1991) when recording in the arctic.
Hereafter, gray whale sounds will simply be referred to as class 1-11.
Class 1 sounds are series of knocks or bongs with frequency modulation within
the series. Wisdom (Wisdom, 2000) determined statistically distinct subclasses within
class 1, termed 1a and 1b. Norris et al. (1977) also observed clicks with parameters
distinct from those observed by Fish et al. (1974); this likely foreshadowed the
distinction between subclasses 1a and 1b. According to Wisdom (2000) subclass 1b has
fewer knocks within a series, longer individual knock duration, and greater inter-pulse
interval. Class 2 is described as a low frequency upsweep (Dahlheim et al., 1984;
Ollervides, 2001). Class 3 is an amplitude-modulated, low frequency moan (Dahlheim
et al., 1984; Ollervides, 2001). Class 4 consists of pulse modulated, often ―grunt-like‖
series (Ollervides, 2001). Class 5 sounds are distinct as large amounts of air released
underwater, or bubble blasts, and class 6 sounds are longer trailing subsurface
exhalations, occasionally with a sonorous quality (Dahlheim et al., 1984; Ollervides,
2001). Classes 5 and 6 are likely the only sounds produced by physical processes in the
elements surrounding the whale (Crane and Lashkari, 1996). Class 7 sounds are highly
pulsive or complex tonal growls (Ollervides, 2001). Class 8 are described as ―ugg‖
sounds, or short knocks (Ollervides, 2001). Class 9 sounds are described as complex
roars (Ollervides, 2001). Class 10 is also grunt-like, but additionally described as
similar to a creaking door and has broader bandwidth than class 4 (Ollervides, 2001).
Class 11 is described as a ―rattle,‖ also with large bandwidth. This sound is associated
with skim feeding whales, and resembled the sound of fingers running down the teeth of
a comb as water and krill strain past the baleen (Ollervides, 2001).
Because several classes are likely produced by non-vocal organs (i.e., baleen
rattles), physical processes in the water (i.e., bubble blasts), or interactions between the
whale‘s body and water (e.g., fin or fluke slapping), the term sound is used rather than

13
vocalization. Furthermore, the use of vocalization or even signal would indicate
assumption of communication purposes. At this time, it is not certain that all classes of
sounds actually have communicative functions. Behaviors have not been well correlated
with most call types. Only classes 5 and 6 have been correlated with particular
behaviors (bubble blasts and subsurface exhalations, respectively); however, even their
function remains unclear. However, Dahlheim et al. (1984) observed increased sound
production in circumstances of increased activity, such as higher concentration of
whales, singles pursuing mother-calf pairs, presence of dolphins, increased non-
biological noise, and when a whale was on intersecting paths with either another whale
or boat.
From several brief studies in the northern feeding grounds, it appears that gray
whales produce sounds, but use a less varied repertoire than has been recorded in the
southern wintering lagoons. Moore and Ljunblad (1984) determined that the repertoire
consisted of classes 1, 3, and 4, and Dahlheim (1987) recorded four types of sounds:
classes 1, 3, 4, and 6. While it was previously believed that all gray whales migrated
southward from the Alaskan Arctic waters, gray whale knocks have recently been
detected on a weekly basis throughout winter months (Stafford et al., 2007b).
In an early study on the migration route, just off San Diego‘s coast, Cummings et
al. (1968) detected four classes of gray whale sounds: knocks, moans, bubble blasts and
surface exhalations. More recently, Crane and Lashkari (1996) found that migrating
gray whales produced fewer sounds in deep water than in shallow water, but in general
produced sounds more frequently than previously believed. Recorded sounds
corresponded to four of the categories established by Dahlheim et al. (1984). The most
prevalent sound was class 3 (46.6%), but it was less than half of all sounds produced
(Crane and Lashkari, 1996). During limited recordings in Washington State of four
juvenile gray whales, some of which appeared to be feeding, there were no sounds
recorded that could be attributed to the whales (Dahlheim, 1987).
Both studies in southern wintering lagoons found that class 1 sounds were used
more often (79.5%, (Dahlheim et al., 1984); 83.5%, (Ollervides, 2001)) than Crane and

14
Lashkari (1996) recorded on the migration route, where class 1 was 37.4% of the entire
repertoire. Increased use of variable sound classes may indicate increased social
activity; Clark (1982, 1983) observed that less active southern right whales produce
mainly simple sounds while a whale in an active group may produce rapid sequences of
more complex calls. The greater use of the variable and graded class 1 sound in the
southern lagoons may be a result of the increased social activity and smaller inter-
individual distance there (Dahlheim et al., 1984; Crane and Lashkari, 1996; Ollervides,
2001). The greater use of class 1 sounds in social situations, in addition to variations in
repetition, may indicate that class 1 sounds are signature vocalizations (Ollervides,
2001). Class 3 sound was proportionally much more prevalent during migration than in
the southern lagoons. These simple, low frequency tonal sounds may be more important
on the migration route where distances between individuals will be greater than in the
lagoons (Richardson et al., 1995; Crane and Lashkari, 1996).
The social contexts throughout the gray whale‘s range are distinct, depending on
location and season. Additionally, there are social distinctions within the wintering
lagoons. In this study, I hypothesize that variations in repertoire use throughout the gray
whale‘s range (i.e., northern feeding grounds, migration route, southern wintering
grounds) will be reflected in the varying repertoire use among distinct social contexts
within the wintering lagoons. It may be likely that differences in sound use at various
locations are due to the distinct social contexts.

15
II. METHODS
Bahía Magdalena Complex (BMC) in Baja California Sur, México, is one of
several lagoons on the west coast of Baja California that is populated by gray whales
from January to April (Figure 1). Bahía Magdalena Complex is the southernmost of
these lagoons, only 275 kilometers north of Cabo San Lucas. The main central region is
31 km long and 22 km wide and mean depth is 30 m (Norris et al., 1983; Ollervides,
2001). Most of the BMC is situated between 24o20‘N - 25
o20‘N, and 111
o30‘ W –
112o10‘W (Amante and Eakins, 2009). Several recording sessions were conducted in
the northern portion of the bay, an estuary referred to as Santo Domingo Channel; these
sessions occurred near 25o03‘N, 112
o09‘W. Mothers and newborn calves concentrate in
the narrow, shallow estuary of Santo Domingo Channel (Pérez-Cortés et al., 2004).
Males, non-parturient females and immature whales aggregate near the mouth of the
complex, a deeper 6 km wide entrance known as Boca La Entrada (BLE) (Norris et al.,
1983). Portions of the large, central region are locally known as El Bajo, ―the shallows.‖
This region was used by both adults and mother/calf pairs. This study did not include
the southern portion of BMC, Bahía Almejas, due to distance from launch site and time
restrictions.

16
Figure 1. Map of study area of Bahía Magdalena Complex in Baja California Sur,
México and sites of gray whale recording sessions in 2006 and 2007.
Simultaneous acoustic recording and behavior observations were acquired during
two study periods between February – April, 2006 and 2007. Due to the concentration
of whales in relatively small, well-known and distinct areas, recording sessions were
opportunistic, as a whale group was encountered. Boat engine was turned off at a
minimum distance of 50 m from whales. Sessions were at least 15 minutes when
possible; due to whale movement, some sessions were slightly shorter. Concurrent with
acoustic recording, one minute summaries of visual observations included: number and
age class of whales, behavioral states (resting, traveling, socializing), behavioral events

17
(flipper swish, fluke up dive, etc), and distance. Whales beyond ―8 whale lengths‖ or
approximately 100 m (8 x 13 m = 104 m) were observed as well as possible, but were
noted as ―out of range.‖ At this distance, it was likely that sounds were recorded (Norris
et al., 1977), but visual observations (number and age class of whales, behavior states
and events) may be lacking in detail or accuracy. Although determining caller identity
would provide more information about a sound‘s function, this requires extensive effort
and knowledge, both in the field and in analysis. Due to these challenges, it was not an
objective of this study to attempt to identify individual sound producers. Therefore,
social context is the best ―substitute‖ or indirect measurement of the circumstances in
which sounds are produced.
Observation platform was a 7 m fiberglass vessel with a 75-horsepower outboard
engine, locally referred to as a ―panga.‖ The recording system consisted of a Reson
TC4033-10M hydrophone, Reson Bandpass Filter and Pre-Amplifier VP2000 and
Marantz PMD-670 digital recorder. Although ―usable frequency range‖ was 1kHz to
140kHz, the Reson hydrophone had a receiving sensitivity of -203dB + 2dB re 1V/uPa at
250Hz 21.69o C. Recording occurred while boat was stationary, at 48 kHz sampling
and hydrophone depth between 5 m and 10 m.
Behavior analysis
Whale encounters were grouped into three social contexts: calf present, adults,
and unknown/mixed. Social context was assigned to an entire encounter, hereafter
referred to as session, based on the types of whales and behaviors observed in a majority
(60%) of minutes in the session. This assignment is conservative, as Quick and Janik
(2008) assigned group behavior when 50% of animals were engaged in a particular
behavior. Calf-containing groups were determined solely on the presence of at least one
calf, as determined by size (4.5 – 6 m). Adults were recognized primarily by body
length of 13 – 14 m (Jones and Swartz, 2002). Adults were observed in social/sexual
aggregations which included highly active behaviors (rolling, fluke and flipper swishing)
and in other behaviors (singles, groups traveling, resting). Unknown (out of range, could
not identify as calf or adult, could not determine behaviors at distance) and any session

18
in which there was no majority of social context was assigned as unknown/mixed. All
minutes recorded, even those in which whales were ―out of range,‖ must be considered,
as sounds were still detected; such minutes were also considered unknown.
Acoustic analysis
Whale sounds were detected by combination of aural and spectral review in
Adobe Audition (Adobe Systems Incorporated, © 2003) which handled large recording
files well and facilitated the marking and identifying of possible sounds. Spectrograms
were analyzed with Hamming windows, a resolution of 1040 bands, and a window width
of 60%. Spectrograms were viewed in 5 – 10 second increments and with a vertical axis
of 0 – 2000 Hertz. The recordings were stereo and both channels were viewed
simultaneously. Using aural quality and spectral features, sounds were then classified
according to the established system in Ollervides (2001). Additionally, Wisdom (2000)
further distinguished between subclasses 1a and 1b.
The classifiable sounds were then isolated into individual files and opened in
Raven 1.2 software (Charif et al., 2004). Raven provided the unique opportunity to
measure several parameters and then copy into Microsoft Excel for further analysis.
Because of the small sample size (n=432 sounds) and large number of independent
variables (11 or 12 sound classes), sound classes were also collapsed into three
simplified types: pulsed, tonal, and complex (Diaz-López and Shirai, 2009;
VanOpzeeland et al., 2009). This technique of simplifying categories based on structure
may also have the effect of eliminating discrepancies due to human subjectivity and
errors in judgment. Complex types include unique sounds that are a mixture of
amplitude and frequency modulation or of a ―hybrid‖ nature, i.e., tonal segues into pulse.
However, complex type as defined here for gray whales is only relative to their
repertoire and should not be considered equivalent to those complex calls as produced by
bowhead, humpback and right whales (Clark, 1990). Although some classes were
regularly re-classified into the same type (e.g., type 1 was always pulsed), some varied
depending on the individual sound (e.g., although most class 3 sounds were tonal, some
were complex).

19
In addition to classifying sounds, several parameters were measured in Raven 1.2
software (Charif et al., 2004). The following five parameters were measured for sounds
of all classes: low frequency (the lower boundary; minimum frequency of a sound), high
frequency (the highest boundary; greatest frequency of a sound), maximum frequency
(frequency at which greatest intensity occurred), bandwidth (delta frequency; frequency
range), and duration. Because of the pulsive nature of class 1 sounds (knocks and
croaks), the following parameters were also measured: number of pulses, individual
pulse duration, pulse rate (pulses/second) individual pulse low, high and maximum
frequencies; bandwidth and inter-pulse interval (Dahlheim et al., 1984; Wisdom, 2000;
Ollervides, 2001).
Statistical analysis
Data were log-transformed or square-root transformed (maximum frequency and
number of pulses), but most residuals had values of p < 0.010 on the Kolmogorov-
Smirnov goodness-of-fit test. However, sample size was relatively large and the log-
transformed residual curves approximated normal distribution curves. Therefore,
according to the Central Limit Theorem, modest deviations from normality in the
residuals should not affect the validity of the models.
In order to statistically confirm significant parameter differences by class, linear
regression tested for significant differences among classes. The purpose of this test was
to validate the current classification system and highlight important acoustic features of
each class. Likewise, the use of linear regression models of class 1 subclasses tested the
validity of this additional classification level.
The relative use of each kind of sound by different social contexts was tested
with logistic regression in SAS 9.2 software (SAS Institute Inc). Models were created
with three social contexts (all adults, calf-containing, unknown/mixed). Additionally,
models were created first with sounds classified in the 11 categories described by
Ollervides (Ollervides, 2001). Secondly, models were analyzed according to the
simplified ―types‖ of pulsed, tonal, and complex sounds. Because sounds within one
recording session were not independent, the model specified each session as a ―cluster.‖

20
To test variations in parameters, linear regression in SAS 9.2 (SAS Institute Inc.)
software was used. Models were created with three social contexts (all adults, calf-
containing, unknown/mixed). Models were created first with sounds classified in the 11
categories described by Ollervides (Ollervides, 2001). Secondly, models were analyzed
according to the simplified ―types‖ of pulse, tonal, and complex sounds. Because
sounds within one recording session are not independent, the model specified each
session as a ―cluster.‖
Sound production rates were calculated and linear regression was conducted to
determine if rates of sound production are dependent on social context. Calculations
assessed individual rate (sounds/minute/whale) as well as group rate (sounds/minute).
The former calculation assumes all whales contribute equally, which is unlikely.
However, this will still be valuable when analyzing groups as a unit, providing a
standardized quantity of vocalizations in each social context while incorporating whale
density.
Some class 1 sounds were not readily sorted into subclasses 1a or 1b. A nearest-
neighbor (k=15) non-parametric discriminant analysis was utilized. This supervised
classification technique discriminated those not classified by initial review, using the
originally classified 1a and 1b as the training set. This analysis also confirmed or re-
classified original 1a and 1b. Because discriminant analysis classified based upon both
entire series (e.g., entire duration) and individual pulse (e.g., individual pulse duration)
parameters, there were cases in which some pulses in a series were classified as 1a and
others classified as 1b (i.e., there was not complete agreement of pulses within a sound).
If there was a majority, and this majority agreed with original classification, new
classification was confirmed. Occurrences in which there was no majority (50%/50%)
were decided by original classification and aural review. Finally, all classifiable sounds
were subjected to linear regression to test parameter differences between 1a and 1b.
Parameters modeled included: high frequency, low frequency, maximum frequency,
bandwidth (delta frequency), duration, number of pulses in a series, and pulse rate for
each entire vocalization, as well as similar variables for each individual pulse (IP) within

21
a series: IP high frequency, IP low frequency, IP maximum frequency, IP bandwidth
(delta frequency) and IP duration. Most variables were log transformed except
maximum frequency, IP maximum frequency, and number of pulses, which were square
root transformed. Histogram curves of residuals were approximately normal.

22
III. RESULTS
A total of 36 usable recording sessions were collected over 15 days during the
two study periods. Total usable recording time was 10:14 hr:min with an mean 16:56
min:sec in each session. Recording time was not equal across social contexts: 232.5
minutes were recorded in presence of adults, 218.5 minutes in mixed/unknown groups
and 163 minutes in presence of calf-containing groups. From these recordings, 432 gray
whale sounds were detected and classified. Representative spectrograms were produced
in Raven (Charif et al., 2004) with Hamming windows, a resolution of 1040 samples, a
3dB filter bandwidth of 60 Hz, time grid overlap of 60%, and generally in segments of 2
– 4 seconds.
Classes of sounds and their parameters
Descriptive statistics provide the general characteristics of the gray whale
repertoire (Table 1, Table 2). The sounds were very brief; most averaged less than 2.0
seconds. These sounds were produced in a very low frequency range; the highest
frequency mean for any class was 2409.59 Hz (class 10), and the greatest maximum
frequency was 445.30 (class 11).

Table 1. Descriptive parameter medians (± IQR) of gray whale sound classes recorded in Bahía Magdalena Complex, Baja
California Sur, México, 2006 and 2007.
Class n= Relative % Low Frequency
(Hz) High Frequency (Hz)
Maximum Frequency
(Hz) Bandwidth (Hz) Duration (sec) # Pulses Pulse Rate
1 251 58.1 61.5 1330.0 351.6 1257.0 0.88 4.0 4.7
(38.1, 89.8) (1068.5, 1683.6) (140.6, 492.2) (954.0, 1621.9) (0.50, 1.63) (3.0, 7.0) (3.9, 6.0)
1a* 88 20.37 65.2 1084.5** 375.0 1007.1** 0.78 4.5 5.3**
(39.8, 87.3) (864.5, 1372.9) (234.4, 527.4) (787.7, 1304.7) (0.51, 1.37) (3.0, 7.0) (4.4, 6.5)
1b* 163 37.96 57.5 1442.3** 328.1 1391.8** 0.95 4.0 4.5**
(34.1, 94.4) (1187.2, 1817.5) (117.2, 468.8) (1080.1, 1752.4) (0.47, 1.72) (2.0, 7.0) (3.8, 5.4)
2 26 6.02 45.9 256.9 93.8 208.6 0.94
(30.0, 58.7) (218.9, 316.6) (70.3, 140.6) (183.3, 284.0) (0.44, 1.31)
3 40 9.26 55.5 207.5 105.5 150.9 1.07
(39.7, 85.2) (175.7, 296.2) (70.3, 164.1) (122.5, 214.3) (0.77, 1.32)
4 60 13.89 63.2 561.8 187.5 477.2 0.68
(40.2, 89.8) (325.7, 850.1) (105.5, 281.2) (261.9, 719.7) (0.44, 0.97)
5 17 3.94 70.1 410.0 187.5 371.0 1.34
(45.9, 90.0) (323.6, 594.9) (140.6, 257.8) (300, 493.9) (0.75, 2.27)
6 11 2.55 64.7 903.5 257.8 811.9 3.01
(31.4, 91.7) (692.5, 1013.5) (175.8, 351.6) (546.7, 982.1) (1.59, 4.30)
7 14 3.4 39.9 206.9 76.2 171.6 1.28
(32.0, 55.4) (159.7, 283.7) (70.3, 117.2) (125.5, 228.3) (0.97, 1.59)
8 0 0
9 5 1.16 66.0 554.5 164.1 488.5 1.08
(27.7, 74.4) (506.2, 767.3) (140.6, 316.4) (431.8, 680.6) (0.62, 1.53)
10 6 1.39 90.3 2361.1 246.1 2230.2 0.53
(63.5, 112.2) (1784.4, 2769.8) (140.6, 539.1) (1784.4, 2706.3) (0.27, 0.73)
11 2 0.46 288.0 1477.2 445.3 1189.3 0.91
(127, 449) (1254, 1700.4) (281.2, 609.4) (1127, 1251.5) (0.46, 1.35)
Total 432
*Not included in total
**Indicates statistically significant difference at p<0.05(linear regression)
23

Table 2. Individual pulse (IP) descriptive parameter medians (± IQR) for class 1 and its
subclasses recorded in Bahía Magdalena Complex, Baja California Sur, México, 2006 and 2007.
Class n=
IP Low
Frequency
(Hz)
IP High
Frequency (Hz)
IP Maximum
Frequency (Hz)
IP Bandwidth
(Hz)
IP Duration
(sec)
Inter-pulse
Interval (sec)
1 1240 81.1 986.3 328.1 822.7 0.082 0.15a
(55.3, 174.3) (681.35, 1268.1) (140.6, 492.2) (541.7, 1151.8) (0.063, 0.101) (0.103, 0.217)
1a 453 87.3 768.8** 328.1 628.6** 0.082 0.12**b
(56.1, 162.7) (527.8, 1038.8) (164.1, 468.8) (392.8, 886.7) (0.062, 0.102) (0.075, 0.177)
1b 787 78.6 1091.2** 328.1 948.4** 0.082 0.168**c
(50.5, 180.7) (841.8, 1366.7) (140.6, 515.6) (666.7, 1279.5) (0.065, 0.101) (0.122, 0.234)
**Indicates statistically significant difference at p<0.05(linear regression) a: n = 989 intervals b: n = 362 intervals c: n = 627 intervals
24

25
Class 1 may be described as a series of pulses, knocks or bongs with frequency
modulation among pulses. Class 1 had a very high mean high frequency (x= 1417.26
Hz), as well as a high maximum frequency (x=354.69 Hz) and wide bandwidth
(x=1335.60 Hz). Subclass 1a (Figure 2) had shorter duration (entire sound) and smaller
inter-pulse interval than 1b (Figure 3). Subclass 1b had higher frequencies and larger
inter-pulse interval than 1a.
Figure 2. Spectrogram of gray whale sound class 1a.

26
Figure 3. Spectrogram of gray whale sound class 1b.

27
Class 2 may be described as a frequency modulated upsweep (Figure 4). Class 2,
although not the lowest of all sounds, had the second lowest mean high frequency
(x=284.08 Hz) and second smallest mean bandwidth (x=232.18 Hz). Only class 3 had
lower mean high frequency and smaller mean bandwidth.
Figure 4. Spectrogram of gray whale sound class 2.

28
Class 3 was characterized as a low-frequency moan, generally with little
frequency modulation (Figure 5). Class 3 had the lowest high frequency (x=269.67 Hz)
as well as the smallest bandwidth (x=177.30 Hz).
Figure 5. Spectrogram of gray whale sound class 3.

29
Class 4 was characterized as a series of frequency modulated grunts or pulses
(Figure 6). Their rate is often rapid and may be the primary feature distinguishing class
4 from class 1. As a result of this high pulse rate, they aurally may be referred to as
rumbles or zipper-like. Class 4 had the second shortest mean duration; only class 10 had
shorter mean duration. Other mean parameters were unremarkable, showing no
extremes.
Figure 6. Spectrogram of class 4.

30
Class 5 has been described as a ―bubble blast‖ for both its physical production
and sound quality (Dahlheim et al., 1984) (Figure 7). It may be aurally described as
rumbling or gurgling, as would be expected when large amounts of air are released under
water. Class 5 averaged long durations.
Figure 7. Spectrogram of gray whale sound class 5.
31
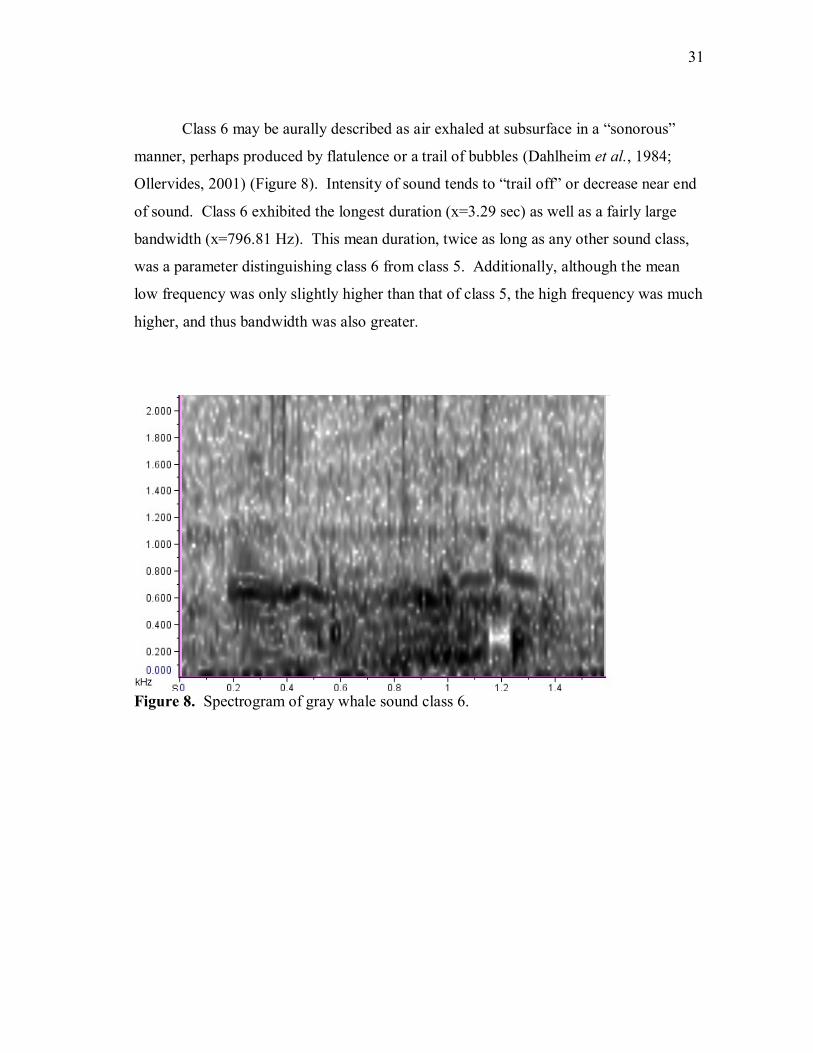
Class 6 may be aurally described as air exhaled at subsurface in a ―sonorous‖
manner, perhaps produced by flatulence or a trail of bubbles (Dahlheim et al., 1984;
Ollervides, 2001) (Figure 8). Intensity of sound tends to ―trail off‖ or decrease near end
of sound. Class 6 exhibited the longest duration (x=3.29 sec) as well as a fairly large
bandwidth (x=796.81 Hz). This mean duration, twice as long as any other sound class,
was a parameter distinguishing class 6 from class 5. Additionally, although the mean
low frequency was only slightly higher than that of class 5, the high frequency was much
higher, and thus bandwidth was also greater.
Figure 8. Spectrogram of gray whale sound class 6.

32
Class 7 may be aurally described as growls or roars that are almost always highly
pulsive (Figure 9). Class 7 was notable for both the lowest mean low frequency
(x=41.58 Hz) and the lowest mean maximum frequency (x=96.26 Hz). Only classes 2
and 3 had lower mean high frequencies and narrower bandwidths.
Figure 9. Spectrogram of gray whale sound class 7.

33
There were no occurrences of class 8 recorded in this study.
Class 9 resembled class 2, but may be differentiated aurally by its more complex
and often pulsive quality ―roar‖ (Figure 10). Although spectrally similar to class 2, four
of five class 9 mean parameters (duration, high frequency, maximum frequency and
bandwidth) were at least twice that of class 2. However, the actual differences are not
likely this great, as class 9 contained one extreme outlier.
Figure 10. Spectrogram of gray whale sound class 9.

34
Class 10 was a grunt-like, highly pulsive, frequency modulated sound with an
aural quality similar to a zipper (Figure 11). Class 10 was unique with the highest mean
high frequency (x=2409.50 Hz), largest bandwidth (x=2327.28 Hz) and shortest mean
duration (0.52 sec).
Figure 11. Spectrogram of gray whale sound class 10.

35
Class 11 was a highly pulsive, frequency modulated sound; it may be aurally
described as similar to the sound of running fingers along the teeth of a comb (Figure
12). Class 11 exhibited the highest mean low frequency (x=288.00 Hz) and the highest
maximum frequency (x=445.30 Hz).
Figure 12. Spectrogram of gray whale sound class 11.
Parameter variations by class
Linear regression of parameters tested for significant differences among classes 1
- 11. All five parameters measured for sounds revealed significant inter-class variation.
Class 11 had the greatest mean low frequency; class 7 had the lowest mean low
frequency (F=20.27, p<0.0001) (Figure 13). Class 10 had the greatest mean high
frequency; class 3 had the lowest mean high frequency (F=122.36, p<0.0001) (Figure

36
14). Class 11 had greatest mean maximum frequency; classes 7 and 2 had lowest mean
maximum frequency (F=35.73, p<0.0001) (Figure 15). Class 10 had greatest mean
bandwidth; class 7 had smallest mean bandwidth (F=129.56, p<0.0001) (Figure 16).
Class 6 had greatest mean duration; class 10 had shortest mean duration (F=42.47,
p<0.0001) (Figure 17).
Pre
dic
ted
Lo
w F
req
ue
ncy (
Hz)
0
100
200
300
1 2 3 4 5 6 7 8 9 10 11
Low Frequency by Class
PLOT 1 2 3 4 56 7 9 10 11
Figure 13. Plot of predicted low frequency by class. Based on linear regression; central
line (-) represents median, dot represents predicted mean; whiskers include 95%
confidence limit.

37
Pre
dic
ted
Hig
h F
req
ue
ncy (
Hz)
0
1000
2000
3000
4000
1 2 3 4 5 6 7 8 9 10 11
High Frequency by Class
PLOT 1 2 3 4 56 7 9 10 11
Figure 14. Plot of predicted high frequency by class. Based on linear regression;
central line (-) represents median, dot represents predicted mean; whiskers include 95%
confidence limit.

38
Pre
dic
ted
Ma
xim
um
Fre
qu
en
cy (
Hz)
0
100
200
300
400
500
600
700
800
1 2 3 4 5 6 7 8 9 10 11
Maximum Frequency by Class
PLOT 1 2 3 4 56 7 9 10 11
Figure 15. Plot of predicted maximum frequency by class. Based on linear regression;
central line (-) represents median, dot represents predicted mean; whiskers include 95%
confidence limit.

39
Pre
dic
ted
De
lta
Fre
qu
en
cy (
Hz)
0
1000
2000
3000
1 2 3 4 5 6 7 8 9 10 11
Bandwidth by Class
PLOT 1 2 3 4 56 7 9 10 11
Figure 16. Plot of predicted bandwidth by class. Based on linear regression; central
line (-) represents median, dot represents predicted mean; whiskers include 95%
confidence limit.

40
Pre
dic
ted
Du
ratio
n (
se
c)
0
1
2
3
4
1 2 3 4 5 6 7 8 9 10 11
Duration by Class
PLOT 1 2 3 4 56 7 9 10 11
Figure 17. Plot of predicted duration by class. Based on linear regression; central line
(-) represents median, dot represents predicted mean; whiskers include 95% confidence
limit.
Parameter variations between class 1 subclasses
Low frequency, maximum frequency, and number of pulses did not demonstrate
significant differences between subclasses (see Appendix A). Number of pulses
indicated a possible trend in which 1b may have greater number of pulses than 1a
(p=0.0672) (see Appendix A).
Linear regression models determined that mean high frequency of subclass 1b
was statistically greater than that of subclass 1a (F=19.12, p=0.0003) (Figure 18).
Bandwidth of 1b was statistically greater than 1a (F=18.18, p=0.0004) (Figure 19).
Pulse rate (pulses/second) of 1a was greater than 1b (F=20.61, p=0.0002) (Figure 20).

41
Pre
dic
ted
Hig
h F
req
ue
ncy (
Hz)
0
200
400
600
800
1000
1200
1400
1600
Class 1 Subclass
1a 1b
High Frequency by Class 1 Subclass
PLOT 1a 1b
Figure 18. Plot of predicted high frequency by class 1 subclass. Based on linear
regression; central line (-) represents median, dot represents predicted mean; whiskers
include 95% confidence limit.

42
Pre
dic
ted
Ba
nd
wid
th/D
elta
Fre
qu
en
cy (
Hz)
0
250
500
750
1000
1250
1500
Class 1 Subclass
1a 1b
Bandwidth by Class 1 Subclass
PLOT 1a 1b Figure 19. Plot of predicted bandwidth by class 1 subclass. Based on linear regression;
central line (-) represents median, dot represents predicted mean; whiskers include 95%
confidence limit.

43
Pre
dic
ted
Pu
lse
Ra
te (
pu
lse
/se
c)
0
1
2
3
4
5
6
Class 1 Subclass
1a 1b
Pulse Rate by Class 1 Subclass
PLOT 1a 1b Figure 20. Plot of predicted pulse rate by class 1 subclass. Based on linear regression;
central line (-) represents median, dot represents predicted mean; whiskers include 95%
confidence limit.
When testing individual pulses, or knocks, within subclass series, individual
pulse low frequency, individual pulse maximum frequency and individual pulse duration
were not found to be significantly different between subclasses (see Appendix A).
Other parameters were found to be significantly different between subclasses.
High frequency of individual pulses was significantly higher in 1b than 1a (F=12.10,
p=0.0025) (Figure 21). Bandwidth of individual pulses of 1b was found to be
significantly larger than 1a (F=13.40, p=0.0017) (Figure 22). Individual pulse interval
(IPI) was significantly larger in 1b sounds than in 1a (F=68.03, p<0.0001) (Figure 23).

44
Pre
dic
ted
Hig
h F
req
ue
ncy (
Hz)
0
200
400
600
800
1000
1200
Class 1 Subclass
1a 1b
Individual Pulse High Frequency by Class 1 Subclass
PLOT 1a 1b
Figure 21. Plot of predicted individual pulse high frequency by class 1 subclass. Based
on linear regression; central line (-) represents median, dot represents predicted mean;
whiskers include 95% confidence limit.

45
Pre
dic
ted
Ba
nd
wid
th / D
elta
Fre
qu
en
cy (
Hz)
0
100
200
300
400
500
600
700
800
900
1000
Class 1 Subclass
1a 1b
Individual Pulse Bandwidth by Class 1 Subclass
PLOT 1a 1b Figure 22. Plot of predicted individual pulse bandwidth by class 1 subclass. Based on
linear regression; central line (-) represents median, dot represents predicted mean;
whiskers include 95% confidence limit.

46
Pre
dic
ted
Lo
w F
req
ue
ncy (
Hz)
0.000
0.025
0.050
0.075
0.100
0.125
0.150
0.175
0.200
Class 1 Subclass
1a 1b
Inter-pulse Interval by Class 1 Subclass
PLOT 1a 1b Figure 23. Plot of predicted inter-pulse interval by class 1 subclass. Based on linear
regression; central line (-) represents median, dot represents predicted mean; whiskers
include 95% confidence limit.
Parameter variations by social context
Linear regression models found that low frequency varied significantly by both
social context and class (F=26.89, p<0.0001) (Figure 24). Upon review of coefficients,
most of the significance is due to differences between calf-containing groups and
mixed/unknown groups (t=-11.21, p<0.0001). Adults had consistently similar low
frequencies across classes. Unknown/mixed groups exhibited slightly more variation
among classes, and calf-containing groups exhibit most varied and greatest range of low
frequencies.

47
Pre
dic
ted L
ow
Fre
quency (
Hz)
0
100
200
300
Social Context
All Adults Mixed/Unknown Calf Present
Low Frequency by Social Context & Class
PLOT 1 2 3 4 5
6 7 9 10 11
Figure 24. Plot of predicted low frequency by class and social context. Based on linear
regression; central line (-) represents median, dot represents predicted mean; whiskers
include 95% confidence limit.

48
High frequency was significantly different by both social context and class
(F=38.88, p<0.0001) (Figure 25). Calf-containing groups seemed to exhibit more varied
and higher ranges of high frequencies. Class 1 was consistently higher than other classes
in all social states. Only class 10 was higher than class 1.
Pre
dic
ted H
igh F
requency (
Hz)
0
500
1000
1500
2000
2500
3000
3500
Social Context
All Adults Mixed/Unknown Calf Present
High Frequency by Social Context & Class
PLOT 1 2 3 4 5
6 7 9 10 11 Figure 25. Plot of predicted high frequency by class and social context. Based on linear
regression; central line (-) represents median, dot represents predicted mean; whiskers
include 95% confidence limit.

49
Maximum frequency was significantly different by social context and class
(F=27.59, p<0.0001) (Figure 26). Calf-containing groups exhibited higher and more
varied maximum frequencies. As in high-frequency comparisons, class 1 had some of
the greatest maximum frequencies across all social contexts.
Pre
dic
ted M
axim
um
Fre
quency (
Hz)
0
100
200
300
400
500
600
700
800
Social Context
All Adults Mixed/Unknown Calf Present
Maximum Frequency by Social Context & Class
PLOT 1 2 3 4 5
6 7 9 10 11 Figure 26. Plot of predicted maximum frequency by class and social context. Based on
linear regression; central line (-) represents median, dot represents predicted mean;
whiskers include 95% confidence limit.

50
Bandwidth was significantly different by both social context and class (F=26.48,
p<0.0001) (Figure 27). Calf-containing groups exhibited larger and more varied
bandwidths. Bandwidth had most significant differences among classes, regardless of
social context. In other words, bandwidth exhibited the most variation among classes,
regardless of social context. As seen in other parameters, class 1 had greatest bandwidth
across social contexts. It was surpassed only by class 10 in unknown/mixed and calf-
containing groups.
Pre
dic
ted B
andw
idth
(H
z)
0
500
1000
1500
2000
2500
3000
3500
Social Context
All Adults Mixed/Unknown Calf Present
Bandwidth by Social Context & Class
PLOT 1 2 3 4 5
6 7 9 10 11 Figure 27. Plot of predicted bandwidth by class and social context. Based on linear
regression; central line (-) represents median, dot represents predicted mean; whiskers
include 95% confidence limit.

51
Duration of sound exhibited significant differences by both social context and
class (F=16.90, p<0.0001) (Figure 28). Calf-containing groups exhibited only slightly
longer and more varied durations. Duration is more uniform than other parameters
across social contexts and classes.
Pre
dic
ted D
ura
tion (
sec)
0
1
2
3
4
5
6
7
8
9
10
11
Social Context
All Adults Mixed Calf Present
Duration by Social Context & Class
PLOT 1 2 3 4 5
6 7 9 10 11 Figure 28. Plot of predicted duration by class and social context. Based on linear
regression; central line (-) represents median, dot represents predicted mean; whiskers
include 95% confidence limit.
Class 1 subclass parameter variations by social context
Linear regression models of type 1 subclass parameters by social contexts
indicate that several parameters have significant differences; some in interaction of both
social context and subclass, and some only in subclass (i.e., no significant difference
among social contexts). Duration, individual pulse maximum frequency and individual
pulse duration demonstrated no significant differences in logistic regression models (see
Appendix B).

52
Low frequency of entire sound demonstrated significant difference among social
contexts only (F=17.26, p<0.0001) (Figure 29); there was no significant difference
between subclasses. Mixed/unknown groups had greatest mean low frequencies,
followed by groups containing calves, and adults had the smallest mean low frequencies.
Pre
dic
ted
Lo
w F
req
ue
ncy (
Hz)
40
50
60
70
80
90
100
110
120
130
140
150
160
170
Social Context
All Adults Mixed/Unknown Calf Present
Low Frequency by Social Context & Class 1 Subclass
PLOT 1a 1b
Figure 29. Plot of predicted low frequency by subclass and social context. Based on
liner regression; central line (-) represents median, dot represents predicted mean;
whiskers include 95% confidence limit.
Mean high frequency was significantly different by the interaction model of
social context and subclass (F=5.92, p=0.0101) and subclass alone (F=10.77, p=0.0039)
(Figure 30). Calf-containing groups had slightly higher mean high frequencies, and
subclass 1b had higher means than subclass 1a in all social contexts.

53
Pre
dic
ted
Hig
h F
req
ue
ncy (
Hz)
700
800
900
1000
1100
1200
1300
1400
1500
1600
1700
1800
1900
2000
Social Context
All Adults Mixed/Unknown Calf Present
High Frequency by Social Context & Class 1 Subclass
PLOT 1a 1b
Figure 30. Plot of predicted high frequency by subclass and social context. Based on
linear regression; central line (-) represents median, dot represents predicted mean;
whiskers include 95% confidence limit.

54
Maximum frequency of subclass sounds also demonstrated significant
differences by subclass and social context (F=12.66, p=0.0003) (Figure 31).
Pre
dic
ted
Ma
xim
um
Fre
qu
en
cy (
Hz)
100
200
300
400
500
600
700
800
900
1000
Social Context
All Adults Mixed/Unknown Calf Present
Maximum Frequency by Social Context & Class 1 Subclass
PLOT 1a 1b Figure 31. Plot of predicted maximum frequency by subclass and social context. Based
on linear regression; central line (-) represents median, dot represents predicted mean;
whiskers include 95% confidence limit.

55
Bandwidth, or delta frequency, was significantly different by social context and
subclass (F=6.77, p=0.0060) (Figure 32). Interestingly, only in the adult groups were 1a
and 1b significantly different from each other.
Pre
dic
ted
Ba
nd
wid
th/D
elta
Fre
qu
en
cy (
Hz)
700
800
900
1000
1100
1200
1300
1400
1500
1600
1700
1800
Social Context
All Adults Mixed/Unknown Calf Present
Bandwidth by Social Context & Class 1 Subclass
PLOT 1a 1b Figure 32. Plot of predicted bandwidth by subclass and social context. Based on linear
regression; central line (-) represents median, dot represents predicted mean; whiskers
include 95% confidence limit.

56
Number of pulses demonstrated significant differences in both social context and
subclass (F=4.03, p=0.0116) (Figure 33).
Pre
dic
ted N
um
ber
of P
uls
es
3
4
5
6
7
8
Social Context
All Adults Mixed/Unknown Calf Present
Number of Pulses by Social Context & Class 1 Subclass (none)
PLOT 1a 1b Figure 33. Plot of predicted number of pulses by subclass and social context. Based on
linear regression; central line (-) represents median, dot represents predicted mean;
whiskers include 95% confidence limit.

57
Pulse rate was significantly different by both social context and subclass (F=6.15,
p=0.0087) (Figure 34). Pulse rate of 1a was significantly higher than 1b for both adults
and calf-containing groups. Interestingly, pulse rates of 1a and 1b were very similar in
mixed/unknown groups. Additionally, both subclasses in mixed/unknown social
contexts had large ranges. Both of these characteristics may be due to small sample size.
However, pulse rates of 1a sounds in calf-containing were higher than those of any other
subclass or social context.
Pre
dic
ted P
uls
e R
ate
(puls
e/s
ec)
3
4
5
6
7
Social Context
All Adults Mixed/Unknown Calf Present
Pulse Rate by Social Context & Class 1 Subclass
PLOT 1a 1b Figure 34. Plot of predicted pulse rate by subclass and social context. Based on linear
regression; central line (-) represents median, dot represents predicted mean; whiskers
include 95% confidence limit.
Class 1 subclasses were also tested by individual pulse (or knock) parameters for
any significant differences among social classes.
Individual pulse low frequency was significantly different by both social context
and subclass (F=5.43, p=0.0137) (Figure 35). It appears that greatest significant

58
differences are exhibited among social context (F=8.46, p=0.0024) rather than between
subclasses (F=0.01, p=0.9045). Mixed/unknown groups had highest mean low
frequencies, followed by calf-containing groups; adults had lowest mean low
frequencies.
Pre
dic
ted
Lo
w F
req
ue
ncy (
Hz)
0
100
200
300
Social Context
All Adults Mixed/Unknown Calf Present
Individual Pulse Low Frequency by Social Context & Class 1 Subclass
PLOT 1a 1b Figure 35. Plot of predicted individual pulse low frequency by subclass and social
context. Based on linear regression; central line (-) represents median, dot represents
predicted mean; whiskers include 95% confidence limit.
Individual pulse high frequency was not significantly different in interaction
model, but was significantly different by both social context (F=6.31, p=0.0079) and
subclass (F=14.27, p=0.0013) independently (Figure 36). Calf-containing groups had
higher mean high frequency than adults (t=-3.55, p=0.0021). Additionally, subclass 1b
was significantly higher than 1a in all social contexts (t=-3.78, p=0.0013).

59
Pre
dic
ted
Hig
h F
req
ue
ncy (
Hz)
400
500
600
700
800
900
1000
1100
1200
1300
1400
1500
1600
Social Context
All Adults Mixed/Unknown Calf Present
Individual Pulse High Frequency by Social Context & Class 1 Subclass
PLOT 1a 1b Figure 36. Plot of predicted individual pulse high frequency by subclass and social
context. Based on linear regression; central line (-) represents median, dot represents
predicted mean; whiskers include 95% confidence limit.
Individual pulse bandwidth was significantly different by subclass (F=15.44,
p=0.0009) and by social context (F=3.71, p=0.0435) but not by interaction term (Figure
37). Bandwidth of 1b was greater than that of 1a across all social contexts (t=-3.93,
p=0.0009). Calf-containing groups had significantly greater bandwidths (both
subclasses) than adults (t=-2.68, p=0.0147).

60
Pre
dic
ted
Ba
nd
wid
th / D
elta
Fre
qu
en
cy (
Hz)
300
400
500
600
700
800
900
1000
1100
1200
1300
Social Context
All Adults Mixed/Unknown Calf Present
Individual Pulse Bandwidth by Social Context & Class 1 Subclass
PLOT 1a 1b Figure 37. Plot of predicted individual pulse bandwidth by subclass and social context.
Based on linear regression; central line (-) represents median, dot represents predicted
mean; whiskers include 95% confidence limit.
Inter-pulse interval was tested, and interaction model was not significant. In
regression model without interaction, inter-pulse interval was significantly different by
subclass (F=60.34, p<0.0001) and social context (F=17.85, p=0.0001) (Figure 38).
While not significant at p=0.05, inter-pulse interval of calf-containing groups were
generally smaller than those of mixed/unknown groups (t=1.98, p=0.0623).
Additionally, mixed/unknown groups had significantly larger inter-pulse intervals than
adults (F=35.55, p<0.0001). Subclass 1b had significantly larger inter-pulse intervals
across social contexts (F=60.34, p<0.0001).

61
Pre
dic
ted
In
ter-
pu
lse
In
terv
al (s
ec)
0.08
0.09
0.10
0.11
0.12
0.13
0.14
0.15
0.16
0.17
0.18
0.19
0.20
0.21
Social Context
All Adults Mixed/Unknown Calf Present
Inter-pulse Interval by Social Context & Class 1 Subclass
PLOT 1a 1b Figure 38. Plot of predicted inter-pulse interval by subclass and social context. Based
on linear regression; central line (-) represents median, dot represents predicted mean;
whiskers include 95% confidence limit.

62
Relative use of classes by social context
The relative use of sound classes provided unexpected results (Table 3). Only
58.1% of 432 classified sounds were class 1. Class 2 consisted of 6.02%, class 3 9.26%,
class 4 13.89%, class 5 3.94%, class 6 2.55%, class 7 3.24%, class 9 1.16%, class 10
1.39% and 0.46% of the classified sounds were class 11. Note that there were no
observations of class 8.
Adults produced 60% of all sounds produced; calf-containing groups produced
about a quarter (26.2%) of all sounds and mixed/unknown groups produced 13.4% of all
sounds observed.
Models indicate no significant differences in use of class 2, class 3, class 7, or
tonal type of sounds (See Appendix C). Adults may have used subclass 1b slightly more
than other social contexts (p=0.0733) (See Appendix C).
Adults had significantly greater probability of using class 1 than either
unknown/mixed whales or calf-containing groups (Wald chi-square=13.73, p=0.0010)
(Figure 39).
Unknown/mixed and calf-containing groups had significantly greater
probabilities of using class 4 than adults (Wald chi-square=15.04, p=0.0005) (Figure
40). One session in which a calf engaged in very social behaviors, including swimming
under the observation boat, produced 18% (11/60) of all class 4 sounds observed.

63
Table 3. Gray whale class use by social context in Bahía Magdalena Complex, Baja
California Sur, México, 2006 and 2007. Individual class percentages (italicized) are
proportion of sounds produced within that social context.
Social Context
Class Adults Mixed/Unknown Mother/Calf Total % of
repertoire
1 192 73.6% 18 31.0% 41 36.3% 251 58.10%
1a* 68* 26.1%* 6* 10.3%* 14* 12.4%* 88* 20.37%*
1b* 124* 47.5%* 12* 20.7%* 27* 23.9%* 163* 37.96%*
2 16 6.1% 4 6.9% 6 5.3% 26 6.02%
3 23 8.8% 9 15.5% 8 7.1% 40 9.26%
4 18 6.9% 15 25.9% 27 23.9% 60 13.89%
5 2 0.8% 6 10.3% 9 8.0% 17 3.94%
6 0 0.0% 2 3.4% 9 8.0% 11 2.55%
7 8 3.1% 2 3.4% 4 3.5% 14 3.24%
8 0 0.0% 0 0.0% 0 0.0% 0 0.00%
9 2 0.8% 0 0.0% 3 2.7% 5 1.16%
10 0 0.0% 2 3.4% 4 3.5% 6 1.39%
11 0 0.0% 0 0.0% 2 1.8% 2 0.46%
Total 261 60.4%** 58 13.4%** 113 26.2%** 432 100.00%
*Not included in totals
**Percentage of all sounds produced in all contexts

64
Pro
ba
bili
ty o
f u
se
0.0
0.1
0.2
0.3
0.4
0.5
0.6
0.7
0.8
0.9
1.0
Social Context
Adults Mixed/Unknown Calf Present
Use of Class 1 by Social Context
Figure 39. Plot of predicted use of class 1 by social context. Based on logistic
regression; central line (-) represents median, dot represents predicted mean; whiskers
include 95% confidence limit.
.

65
Pro
ba
bility o
f u
se
0.0
0.1
0.2
0.3
0.4
0.5
0.6
0.7
0.8
0.9
1.0
Social Context
Adults Mixed/Unknown Calf Present
Use of Class 4 by Social Context
Figure 40. Plot of predicted use of class 4 by social context. Based on logistic
regression; central line (-) represents median, dot represents predicted mean; whiskers
include 95% confidence limit.

66
Social context had significant effect on use of class 5 sounds (Wald Chi-
square=14.25, p=0.0008) (Figure 41). Both calf-containing (Wald Chi-square=14.08,
p=0.0009) and unknown/mixed groups (contrast test Wald chi-square=7.76, p=0.0054)
had greater probability of using class 5 than adults. Although not significantly different,
it may be suggested that unknown/mixed groups have greater probability of using class 5
than calf-containing groups (Wald Chi-square=3.25, p=0.0715). One session observed
33% (5/15) of class 5 sounds. Although this session was defined as mixed/unknown, the
only whales sighted were a mother and very young calf engaged in travelling and
surfacing behaviors.
Pro
ba
bili
ty o
f u
se
0.0
0.1
0.2
0.3
0.4
0.5
0.6
0.7
0.8
0.9
1.0
Social Context
Adults Mixed/Unknown Calf Present
Use of Class 5 by Social Context
Figure 41. Plot of predicted use of class 5 by social context. Based on logistic
regression; central line (-) represents median, dot represents predicted mean; whiskers
include 95% confidence limit.
Classes 6, 9, 10 and 11 were excluded from logistic regression due to low rate of
occurrence (small sample size). It is notable that there were no occurrences of class 6 or

67
10 in adult groups and there were no occurrences of class 9 in unknown/mixed groups.
Finally, class 11 occurred only twice; both occurrences were in calf-containing groups.
An alternative solution to low sample size was to pool classes 5 through 11
(n=55). In addition to their small sample size as individual classes, more than half are
complex (60%, 33/55), some are pulsed (36.4%, 20/55), but rarely are they tonal (3.6%,
2/55). Social context had a significant effect on use of these classes (Wald chi-
square=21.29, p<0.0001) (Figure 42). This pooled type (classes 5-11) was 27.4% of the
calf-containing repertoire; it was 20.7% of mixed/unknown repertoire and only 4.6% of
the adult repertoire. Groups containing calves had significantly greater probability of
producing than adults (Wald chi-square=21.15, p<0.0001). Unknown/mixed groups
also had significantly greater probability of classes 5 through 11 occurring than did
adults (Wald chi-square=11.33, p=0.0008).
Pro
ba
bili
ty o
f u
se
0.0
0.1
0.2
0.3
0.4
0.5
0.6
0.7
0.8
0.9
1.0
Social Context
All Adults Mixed/Unknown Calf Present
Use of Pooled type 12 (5 through 11) by Social Context
Figure 42. Plot of predicted use of classes 5-11 (pooled) by social context. Based on
logistic regression; central line (-) represents median, dot represents predicted mean;
whiskers include 95% confidence limit.

68
Relative use of class 1 subclasses
Use of subclass 1a was significantly different by social context (Wald chi-
square=10.92, p=0.0043) (Figure 43). Adults had significantly greater probability of
using subclass 1a than calf-containing groups (Wald chi-square=7.97, p=0.0048) and
mixed/unknown groups (Wald chi-square=10.48, p=0.0012).
Pro
ba
bili
ty o
f u
se
0.0
0.1
0.2
0.3
0.4
0.5
0.6
0.7
0.8
0.9
1.0
Social Context
All Adults Mixed/Unknown Calf Present
Use of Subclass 1a by Social Context
Figure 43. Plot of predicted use of subclass 1a by social context. Based on logistic
regression; central line (-) represents median, dot represents predicted mean; whiskers
include 95% confidence limit.
Subclass 1b was used more frequently than 1a by all social contexts (Table 3).
Within each social context, 1b was used about twice as often as 1a. While adults use
subclass 1b slightly more frequently than other groups, the overall model detected no
significant differences among groups (Wald chi-square=5.22, p=0.0733).
More than half of all subclass 1a (48/88 = 54.5%) and most of subclass 1b
(103/124 = 83.1%) sounds occurred during the same three sessions. Specifically, almost

69
half of all subclass 1b (61/124 of all 1b = 49.2%) occurred during just one of these
sessions. All three sessions were characterized by adult social behavior.
Relative use of types
Pulse, tonal, and complex types of sounds were also tested for difference in use
by social contexts. This general categorization is based on the nature of the individual
sound, regardless of original class. However, some classes were consistently assigned
the same type (e.g., class 1 sounds were always pulsed).
Of the three sound types, pulsed sounds had the highest probabilities of
occurrence in all three social contexts, and use was significantly different among social
contexts (Wald chi-square=6.68, p=0.0354) (Figure 44). Adults had significantly greater
probabilities of using pulsed sounds than calf-containing groups (Wald Chi-square=6.34,
p=0.0118). Adults also had greater probabilities of using pulsed sounds than
unknown/mixed groups (contrast test Wald chi-square=4.02, p=0.0450).
Pro
ba
bili
ty o
f u
se
0.0
0.1
0.2
0.3
0.4
0.5
0.6
0.7
0.8
0.9
1.0
Social Context
All Adults Mixed/Unknown Calf Present
Use of Pulse type by Social Context
Figure 44. Plot of predicted use of pulsed sound type by social context. Based on
logistic regression; central line (-) represents median, dot represents predicted mean;
whiskers include 95% confidence limit.

70
Complex sounds included those of ―mixed‖ or ―hybrid‖ nature (i.e., both pulse
and tonal within one sound), as well as unique sounds that are neither pulsed nor tonal.
According to logistic regression models, social context had significant effect on use of
complex sounds (Wald Chi-square=12.58, p=0.0019) (Figure 45). Adults had least
probability of using complex sounds. Calf-containing groups had significantly greater
probability of complex sounds occurring than did adults (Wald chi-square=12.58,
p=0.0004). Unknown/mixed groups also had significantly greater probability of
complex sounds occurring than adults (Wald chi-square=8.99, p=0.0027). There was
not significant difference in probability of occurrence between calf-containing groups
and unknown/mixed groups (Wald chi-square=2.95, p=0.08).
Pro
ba
bili
ty o
f u
se
0.0
0.1
0.2
0.3
0.4
0.5
0.6
0.7
0.8
0.9
1.0
Social Context
Adults Mixed/Unknown Calf Present
Use of Complex type by Social Context
Figure 45. Plot of predicted use of complex sound type by social context. Based on
logistic regression; central line (-) represents median, dot represents predicted mean;
whiskers include 95% confidence limit.

71
Use of tonal type sounds was low for all social groups. There were no significant
differences detected in probabilities of use among social groups (See Appendix C).
Rates of sound production
Median rates of sound production are likely more accurate than mean rates due to
an outlier in mixed/unknown groups. When considering medians, adults and calf-
containing groups produced sounds at rates almost ten times greater than
mixed/unknown groups (Table 4). According to medians, individual rates of adults are
greatest, followed by calf-containing groups; mixed/unknown had smallest individual
rates of sound production. Calf-containing contexts always produced at least one sound
per session.
Regression model found rates of individual sound production
(sounds/minute/whale) were not significantly different across social context (F=2.32,
p=0.1127) (Figure 46); rates were square root transformed (Kolmogorov-Smirnov,
p>0.150). However, adults generally had higher rates of sound production than
mixed/unknown groups (F=4.07, p=0.0512). Although not significant at p=0.05, it
appears adults may have slightly higher rates of sound production than calves (t=1.79,
p=0.0817).

72
Table 4. Rates of gray whale sound production (mean and median) by social context in
Bahía Magdalena Complex, Baja California Sur, México, 2006 and 2007.
Social Context
All whales Adults Mixed/ Unknown Calf Present
# of sounds 432 261 58 113
Recording
Duration (hours) 10.13 3.88 3.64 2.72
Recording
Duration (min) 613.2 232.5 218.5 163.2
(Minimum) # of
Whales 94 33 23 38
Sounds/min 0.705 0.329 1.123 0.517 0.265 0.065 0.692 0.567
Sounds/min/whale 0.013 0.006 0.020 0.023 0.010 0.005 0.009 0.007
Sounds/hour 42.270 19.74 67.355 31.02 15.927 3.9 41.544 34.02
Sounds/hour/whale 0.784 0.383 1.192 1.406 0.628 0.273 0.514 0.446

73
So
un
ds p
er
min
ute
pe
r w
ha
le
0.000
0.005
0.010
0.015
0.020
0.025
0.030
Social Context
Adults Mixed/Unknown Calf Present
Rate of sound production
Figure 46. Plot of predicted rates of sound production by social context. Based on
linear regression; central line (-) represents median, dot represents predicted mean;
whiskers include 95% confidence limit.

74
Social context had a significant effect on group rates (sounds/minute) of sound
production (F=4.8, p=0.0143) (Figure 47). Specifically, both adult (F=7.15, p=0.0113)
and calf-containing (F=-2.33, p=0.0258) groups produced more sounds as a group unit
than did mixed/unknown groups. There was no significant difference found between
adult and calf-containing groups. It is evident from the Figure 47 and Table 4 that calf-
containing groups produced sounds at rates (sounds/minute and sounds/hour) at least
twice that of mixed/unknown groups, although individual rates (sounds/minute/whale
and sounds/hour/whale) of calf-containing groups were slightly lower than those of
mixed/unknown groups.
So
un
ds p
er
min
ute
0.00
0.25
0.50
0.75
1.00
1.25
1.50
1.75
2.00
Social Context
Adults Mixed/Unknown Calf Present
Group rate of sound production
Figure 47. Plot of predicted group rates of sound production by social context. Based
on linear regression; central line (-) represents median, dot represents predicted mean;
whiskers include 95% confidence limit.
Six of the seven sessions with the greatest mean rate (sounds/min/whale) were
adult sessions. Three of these same adult sessions had the greatest mean group rates

75
(sounds/min). In these three sessions, 50/58 (86%) minutes contained highly active
adult behavior that is likely courtship or mating. However, because of the large number
of whales present, individual rates (sounds/min/whale) were only slightly above average.
Active adult contexts demonstrated short-term (generally two to three minutes)
group rates that range from 5.5 to 13 sounds per minute. The three minutes in which a
penis was sighted had a rate of 7 sounds/min. In comparison, the most intense short-
term period for a calf-containing session was 5.7 sounds/min. For mixed/unknown, peak
was 2.3 sounds/minute. Additionally, 6 of 14 sessions of mixed/unknown groups
produced no sounds. Only 1 of 12 adult sessions produced zero sounds. Calf-containing
groups produced sounds in every session.
Use of four social contexts
Logistic regression models were tested with four social groups in which highly
active and other adults were separated (i.e., highly active adults, other adults, calf
present, unknown/mixed). Highly active adults produced 48% of all sounds observed; in
contrast, other adults produced only 4% (Table 5). Calf-containing groups produced
26%, and mixed/unknown produced 21% of all sounds. Class 1 sounds produced by
highly active adults were 38.9% of all sounds observed in this study.
Organization into four social contexts resulted in re-defining contexts for some
sessions. This is due to majority changes (context with majority of minutes = context for
that particular session). Therefore, some sessions that previously (in three social
contexts) were considered adults may no longer have a majority (60%) of minutes
characterized by adult context and may now be mixed/unknown. As a result, number of
sounds produced in each context, most noticeably in mixed/unknown context, will not
reflect those in analysis for three contexts.

76
Table 5. Gray whale class use by four social contexts in Bahía Magdalena Complex,
Baja California Sur, México, 2006 and 2007.
Social Context
Class
Highly
Active
Adults
Other
Adults Mixed/Unknown Calf Present Total
1 168 11 31 41 251
1a* 59 2 13 14 88
1b* 109 9 18 27 163
2 9 2 9 6 26
3 9 5 18 8 40
4 14 1 18 27 60
5 1 0 7 9 17
6 0 0 2 9 11
7 7 0 3 4 14
8 0 0 0 0 0
9 1 0 1 3 5
10 0 0 2 4 6
11 0 0 0 2 2
Total 209 19 91 113 432
*Not included in totals

77
Use of subclass 1a was significantly different across four social contexts (Wald
chi-square=13.67, p=0.0034) (Figure 48). Specifically, highly active adults were
significantly more likely to use 1a than other adults (contrast test, Wald chi-
square=13.30, p=0.0003).
Pro
ba
bility o
f u
se
0.0
0.1
0.2
0.3
0.4
0.5
0.6
0.7
0.8
0.9
1.0
Social Context
Highly Active Adults Other Adults Mixed/Unknown Calf Present
Use of Subclass 1a by Social Context
Figure 48. Plot of predicted use of subclass 1a by four social contexts. Based on
logistic regression; central line (-) represents median, dot represents predicted mean;
whiskers include 95% confidence limit.
Use of class 3 varied significantly by social context (Wald chi-square=24.18,
p<0.0001) (Figure 49). Other adults used class 3 significantly more than highly active
adults (Wald-chi square=5.75, p=0.0165).

78
Pro
ba
bility o
f u
se
0.0
0.1
0.2
0.3
0.4
0.5
0.6
0.7
0.8
0.9
1.0
Social Context
Highly Active Adults Other Adults Mixed/Unknown Calf Present
Use of Class 3 by Four Social States
Figure 49. Plot of predicted use of class 3 by four social contexts. Based on logistic
regression; central line (-) represents median, dot represents predicted mean; whiskers
include 95% confidence limit.
Use of classes 5 through 11 (pooled to one ―class‖), was significantly different
across social contexts (Wald chi-square 281.30, p<0.0001) (Figure 50). Although use by
highly active adults was low, there was not a single observation of use by other adults,
thus there is significantly different use between the two adult contexts (contrast test,
Wald chi-square 203.86, p<0.0001).
.

79
Pro
ba
bility o
f u
se
0.0
0.1
0.2
0.3
0.4
0.5
0.6
0.7
0.8
0.9
1.0
Social Context
Highly Active Adults Other Adults Mixed/Unknown Calf Present
Use of Pooled type 12 (5 through 11) by Social Context
Figure 50. Plot of predicted use of classes 5-11 (pooled) by four social contexts. Based
on logistic regression; central line (-) represents median, dot represents predicted mean;
whiskers include 95% confidence limit.
Additionally, use of complex type sounds was significantly different (Wald chi-
square=25.56, p<0.0001) (Figure 51). Although not significant at p=0.05, there is a
trend of difference in use between the highly active adults and other adults (contrast test,
Wald chi-square=3.43, p=0.0641).

80
Pro
ba
bility o
f u
se
0.0
0.1
0.2
0.3
0.4
0.5
0.6
0.7
0.8
0.9
1.0
Social Context
Highly Active Adults Other Adults Mixed/Unknown Calf Present
Use of Complex type by Social Context
Figure 51. Plot of predicted use of complex sound type by four social contexts. Based
on logistic regression; central line (-) represents median, dot represents predicted mean;
whiskers include 95% confidence limit.
Analysis of individual rates (sounds/min/whale) by four social contexts found
that rates varied significantly by social context (F=32.42, p<0.0001) (Figure 52). In
contrast tests, highly active adult rates were significantly greater than those of calf-
containing groups (F=48.71, p<0.0001). Individual rates (sounds/min/whale) of highly
active adults were significantly lower than individual rates of other adults (F=5.92,
p=0.0202). However, caution is warranted in drawing conclusions from this analysis;
highly active adults had sample size of 4 sessions; other adults had sample size of only 2
sessions. This analysis indicates that there may be important differences between the
two adult contexts; with a larger sample size, the difference in rates will be clearer. Of
the six adult sessions with the highest means, four were of highly active adults.

81
So
un
ds p
er
min
ute
pe
r w
ha
le
0.000
0.005
0.010
0.015
0.020
0.025
0.030
0.035
0.040
0.045
0.050
Social Context
Highly Active Adults Other Adults Mixed/Unknown Calf Present
Rate of sound production
Figure 52. Plot of predicted rates of sound production by four social contexts. Based
on linear regression; central line (-) represents median, dot represents predicted mean;
whiskers include 95% confidence limit.
Modeled by four social contexts, significant differences were found in group
rates (sounds/minute) of sound production as well (F=12.72, p<0.0001) (Figure 53).
Group rates of highly active adults were significantly greater than that of other adults
(F=13.22, p=0.0009). Highly active adults had group rates significantly greater than
calf-containing groups as well (F=12.53, p=0.0012). Calf-containing groups and other
adults have similar group rates, but calf-containing groups had group rates significantly
greater than mixed/unknown groups (F=5.23, p=0.0283).

82
So
un
ds p
er
min
ute
0.0
0.5
1.0
1.5
2.0
2.5
3.0
3.5
4.0
4.5
Social Context
Highly Active Adults Other Adults Mixed/Unknown Calf Present
Group rate of sound production
Figure 53. Plot of predicted group rates of sound production by four social contexts.
Based on linear regression; central line (-) represents median, dot represents predicted
mean; whiskers include 95% confidence limit.

83
IV. DISCUSSION
To interpret the function of gray whale sounds, this study observed use of
classes, unique parameters and rates of sounds produced in particular social contexts. In
an effort to investigate, confirm and streamline the gray whale repertoire, this study also
examined classes of sounds produced and the acoustic parameters of each class. In
general, frequency-related parameters of all sound classes showed variation among
social contexts, but duration demonstrated very little variation among contexts. Class 1
appears to be critical during sexual contexts and all highly social contexts, regardless of
age and sex class. Although highly recognizable, its parameters exhibited much
variation among social contexts and therefore class 1 may communicate graded
emotional and behavioral states in short-range contexts. Other classes of sounds may be
utilized for long-distance communication, as startle responses, or ―precursors‖ to the
adult repertoire. Sound production rates also vary by social context. Adults produced
sounds at high rates during short intervals; mixed/unknown groups were often silent.
Calf-containing groups produced sounds at intermediate rates and were never silent.
This study found no new classes of sounds; it appears that the eastern gray whale
repertoire has been well described. This study confirms that the gray whale repertoire
consists of simple, short, low frequency sounds. Some classes are pulsed in nature
(classes 1 and 4). A few sounds may be non-vocal in production (classes 5, 6, and 11).
Classes previously described (Dahlheim et al., 1984; Moore and Ljungblad, 1984; Clark,
1990; Crane and Lashkari, 1996; Wisdom, 2000; Ollervides, 2001) were observed in this
study, with the exception of class 8. However, classification, although improving, has
few structured guidelines and continues to be relatively subjective. Thus, classes
continue to ―evolve,‖ as this study confirms the division of class 1 into subclasses 1a and
1b.
There are several challenges that must be overcome in classification. Gray whale
sounds are of relatively low sound-to-noise ratio and low frequency ranges (Cummings

84
et al., 1968; Wisdom, 2000). Furthermore, sound types are not often stereotyped or may
be graded intermediates, and it is difficult to establish well-defined parameters to use in
classification; this appears to be a common phenomenon in mysticete repertoires
(Chabot, 1988; Würsig and Clark, 1993) as well as odontocetes (Boisseau, 2005; Diaz-
López and Shirai, 2009). Finally, the classification system is not firmly established, as it
has been modified several times since its initial use (Wisdom, 2000; Ollervides, 2001).
However, because this study confirmed all classes added by Ollervides (2001), except
class 8, and this study did not add any other novel classes, the gray whale repertoire may
be considered well described, but not necessarily easily classified.
Because gray whale sounds lack stereotypy and exhibit fluidity, we continue to
have difficulties in establishing stable classification. Although the gray whale repertoire
may be well described, these characteristics do not provide for simple, objective
classification. Moore and Ljungblad (1984) observed classes 1, 3 and 4, but stated that
―several miscellaneous sounds could not be so classified.‖ Some classes seem to have
observable or audible subclasses (class 1, class 4), but there is great deal of gradation in
characteristics as well. During the course of communication with Dr. Sheyna Wisdom,
we realized we each had independently come to the conclusion that perhaps these classes
are better reorganized as a continuum from pulsed sounds to tonal sounds. In this study,
there was considerable difficulty differentiating between class 1b (croak), class 4, and
class 9, all of which are pulsed. The tonal sounds presented similar difficulties, in which
classes 3, 4, and 5 are not easily discriminated. Additionally, some individual sounds
may exhibit dual natures, or segue from one type to another. Thus, a particular sound
may not fit into one class, but is rather a hybrid combination of two. Several studies of
gray whale sounds have noted such challenges. Petrochenko et al. (1991) observed that
gray whales rarely produce a single kind of sound, but more often in combinations. Fish
et al. (1974) described one sound as a ―long ‗metallic-sounding pulse train‘ that merged
into a low-frequency ‗groan‘.‖ Likewise, Moore and Ljungblad (1984) also noted that
class 4 sometimes occurred at end of class 1 burst.

85
It has already been suggested that the southern right whale (Eubalaena australis)
and bowhead (Balaena mysticetus) repertoire are best described as existing on a
continuum, with some types of sounds more common than others (Clark, 1982; Clark
and Johnson, 1984). Difficulties in classifying sounds are often compounded by
environmental effects on quality of calls, such as ambient noise, attenuation and
degradation (Clark and Johnson, 1984). North Atlantic pilot whale (Globicephala
melaena) whistles have been described as a continuum from simple to complex, with
series of intermediates (Taruski, 1979). More recently, a study of long-finned pilot
whale (Globicephala melas) pulsed calls observed ―that there are no clear call types
except for an apparent dichotomy based on the maximum frequency of the highest
visible sideband;‖ such a division may indicate long- and short-range functions
(Nemiroff and Whitehead, 2009). Killer whales also produced aberrant sounds that
appeared to be highly modified or distorted from a more common click, whistle or
pulsed call (Ford, 1989). Vocalizations of false killer whales (Pseudorca crassidens)
have been described as a continuum from pulse trains to whistles, and some
vocalizations demonstrated gradual modulation or rapid shifts between types (Murray et
al., 1998). If sounds exist in continuum rather than discrete types, their functions may
not be discrete, but may rather indicate graded levels of arousal (Murray et al., 1998).
Murray et al. (1998) used ―duty cycle‖ (i.e., proportion of time sound is ―on‖ during
entire duration) as one common, graded measurement to organize false killer whale
vocalizations on a continuum.
Due to similar confounding factors, many sounds produced by gray whales are
not easily classified. I have surveyed researchers experienced in classification of gray
whale sounds. A small sample (n=29) of sounds, including other biological sounds (e.g.,
dolphins, sea lions, snapping shrimp) as well as non-biological sounds, was reviewed by
two other gray whale researchers (F. Ollervides, N. Crane) and me. Agreement was
mediocre to poor. More than 70% of the sounds had at least 2 reviewers agreeing upon
the source (gray whale or other). However, only 24% of the sounds had agreement

86
among all three observers as to the source (gray whale or other) of the sound. Of sounds
agreed upon as produced by gray whale, only 25% (4/16) of these gray whale sounds
were similarly classified by two reviewers. There was no instance of all three reviewers
agreeing on classification of potential gray whale sounds.
At times, it is difficult to distinguish faint or subtle sounds as created by gray
whales or the environment (ambient, biological, or even mechanical) (Dahlheim et al.,
1984). Crane and Lashkari (1996) as well as Wisdom (2000) also struggled to detect
and analyze the gray whale‘s low level sounds in high ambient noise levels. Cummings
et al. (1968) observed that underwater blow sounds were indistinct or completely
masked by noise when more than 100 m from the hydrophone, with a mean source level
of 112 dB re 0.0002 dyn cm2. Such environmental noise may be a great hindrance to
detecting some gray whale sounds, especially those of low frequency, and may have
resulted in biases against some classes of sounds.
Due to poor agreement among researchers and lack of objective classification
guidelines, I propose reconsideration of the current classification system. It may be
more objective, complete and biologically accurate if these sounds are organized along a
continuum. However, this does not necessarily disregard the current classes; rather, they
may well exist as recognizable clusters or regions along a continuum. In addition to
classifying into traditional classes, sounds in this study were also organized into
simplified types of pulsed, tonal, and complex.
Class parameters
Descriptive statistics of sound parameters in this study support previous studies‘
observations on the characteristics of the gray whale repertoire. The sounds are very
brief; most means were less than 2.0 seconds. These sounds are produced in a very low
frequency range; the highest frequency mean for any class was 2409.59 Hz (class 10),
and the greatest maximum frequency was 445.30 (class 11).
Statistical comparison of subclasses 1a and 1b supports the findings of the first
study to distinguish these two subclasses (Wisdom, 2000); these are aurally and

87
statistically distinct subclasses. In both studies, comparison of several parameters
detected statistically significant differences. While sounds and their parameters were
collected both from a captive gray whale calf, JJ, and wild mother-calf pairs in San
Ignacio Lagoon, Wisdom (2000) used only JJ‘s parameter means for statistical tests.
Wisdom (2000) found number of pulses, pulse duration, and inter-pulse interval to be
statistically significant. Likewise, this study also found number of pulses and inter-pulse
interval to be significantly different. In both studies, inter-pulse interval of 1b was
greater than 1a. Additionally, this study found that mean high frequency and mean
bandwidth were also significantly different. This study found that mean high frequency
of 1b was greater than that of 1a. Likewise, bandwidth of 1b was greater than that of 1a
by 300 Hz. Although these parameters were not found to be statistically significant for
JJ‘s means, they exhibit similar trends. JJ‘s maximum frequency was not statistically
tested, but the mean maximum frequency for 1b was very similar to that of this study.
The maximum frequency of 1a did not share similar trends; Wisdom‘s (2000) study
found 1a‘s maximum frequency to be lower than that of 1b; this study found 1a‘s
maximum frequency to be slightly greater than 1b, but no significant difference was
observed.
Although not tested for significant difference, the low (minimum) frequency of
mother-calf pairs in Wisdom‘s (2000) study showed means very similar to this study; 1b
had slightly higher low frequency means than 1a. Additionally, the mean low
frequencies of class 1 determined by Dahlheim (1984) and Ollervides (2001) were very
similar to the actual means of this study.
This study found that mean high frequency of 1b was statistically greater than
that of 1a, with a difference of 300 Hz. Most studies, considering only class 1, had
mean high frequency one to two times greater than this study‘s (Dahlheim et al., 1984;
Crane and Lashkari, 1996; Ollervides, 2001).
In the study of captive calf JJ, total duration of 1b was greater than 1a, but the
difference was not statistically significant (Dahlheim et al., 1984). This study also found

88
that subclass 1b‘s greater duration was not statistically significant. In general, this
study‘s mean duration of class 1 was very similar to those in other studies; some were
slightly longer (Dahlheim et al., 1984) and some were slightly shorter (Crane and
Lashkari, 1996; Wisdom, 2000).
This study determined that the subclasses had similar number of pulses. The
number of pulses in class 1 determined by this study was very similar to that found in
Ollervides (2001) and Crane and Lashkari (1996). However, Wisdom‘s (2000) study
found each subclass to have more pulses than its respective counterpart in this study.
Additonally, Wisdom (2000) observed that subclass 1a had significantly more pulses in
each sound than 1b. Subclass 1a had a pulse rate of 1 pulse/sec greater than subclass
1b.
Like Wisdom‘s (2000) study, this study also found inter-pulse interval of
subclass 1b to be significantly greater than 1a. Similarly, Wisdom‘s (2000) study also
found individual pulse duration of subclass 1b to be significantly greater than 1a. This
study found the individual pulse duration of 1b to be greater, but detected no significant
difference. Although both this study and Wisdom‘s (2000) found the inter-pulse interval
of subclass 1b to be greater than 1a, this study‘s inter-pulse intervals were two to three
times greater than their counterparts in Wisdom‘s study. Future studies should consider
parameter changes with age, which may be either maturation or learning.
Interestingly, JJ‘s mean low and high frequencies were consistently two to four
times greater than those of mother-calf pairs both in Wisdom‘s (2000) study and the
means determined in this study. This may be an artifact of the man-made recording
environment in contrast to natural lagoons. Nevertheless, JJ‘s mean durations of each
signal were also noticeably shorter than the respective mean durations of wild mother-
calf pairs (Wisdom, 2000). This difference may not be so easily explained by the man-
made environment in which JJ was raised and observed. Therefore, as will be discussed
later, this may introduce the hypothesis that calves produce signals of higher frequencies
and possibly shorter durations, until growth and social learning develop the adult

89
repertoire characterized by lower frequencies and longer durations (Wallschläger, 1980;
Caldwell et al., 1990; Tubaro and Mahler, 1998; Sousa-Lima et al., 2002). This
difference is compounded because JJ lacked the social circumstances in which a gray
whale calf may need to learn and develop use of appropriate parameters.
Class 2 had a mean high frequency very similar to the mean determined by
Dahlheim et al. (1984), but mean low frequency, bandwidth and maximum frequency
observed in this study were much lower. In Dahlheim‘s (1984) study, class 2 had the
shortest mean duration. In this study, there were two classes with shorter mean duration.
Class 3 had consistently low mean low, high and maximum frequencies both in
this and Wisdom‘s (2000) study. It also had narrow mean bandwidth in both studies.
However, JJ‘s mean frequencies, although lower than those in other classes, were
consistently two to three times greater than those produced by mother-calf pairs in
Wisdom‘s (2000) and in this study. Another notable difference was duration; this
study‘s mean duration was twice as great as JJ‘s (Wisdom, 2000). Crane and Lashkari
(1996) observed mean bandwidth, maximum frequency and duration very similar to
those of this study. Dahlheim et al. (1984) calculated mean high frequencies much
greater than this study, and therefore had a greater bandwidth as well. Mean duration in
Dahlheim‘s (1984) study was almost twice as great as this study‘s mean duration.
Ollervides (2001) observed means very similar to Dahlheim‘s study, except duration
which tended reflect the short duration observed in Wisdom (2000).
The structure of low frequency sounds with little frequency modulation, such as
class 2 and 3, appears to indicate their use as long distance communication sounds.
Frequency ranges of ambient noise appear to influence optimal frequencies for
transmission of bird song, thus allowing long distance communication (Brenowitz,
1982a; Brenowitz, 1982b). Also, emphasized frequencies vary by habitat, and songs in
each habitat often fall within relatively quiet spectral regions, thus reflecting use of a
particular ―frequency window‖ (Morton, 1975; Ryan and Brenowitz, 1985). Morton
(1975) proposed that producing sounds with a narrow frequency range permits greater
90
source amplitude at that frequency. Dahlheim (1987) also observed that emphasized
frequencies of gray whale sounds occur where biological and physical sea noise has less
energy. These narrowband sounds may also travel more efficiently over wide-band
ambient noise (Morton, 1975; Brenowitz, 1982b). Terrestrial noise may be rain or wind
through the leaves; in marine environments, however, ambient noise may be waves and
other marine life. Brenowitz (1982b) also hypothesized that these low frequencies are
critical to species-specific recognition in long-distance communication; other
frequencies that attenuate rapidly over long distances may be useful for individual
recognition in short-range communication. Although red wing black birds (Agelaius
phoeniceus) may use long-distance communication for purposes of territory protection
or mate attraction (Brenowitz, 1982b), it is more likely that these low frequency sounds
with little frequency modulation function as a contact call, similar to the southern right
whale‘s up call (Clark, 1983). Gray whales may utilize class 3 and possibly class 2 for
long-distance communication on the migration route to maintain contact between groups
(Crane and Lashkari, 1996).
Class 4 demonstrated a fairly low mean low frequency; mean high frequency,
maximum frequency, and bandwidth fell in the middle ground of all classes. This study,
Crane and Lashkari (1996), and sounds produced by mother-calf pairs in Wisdom
(2000), all shared very similar high frequency and bandwidth means. Dahlheim‘s
(1984) mean high frequency and bandwidth were twice those previously discussed.
Additionally, the captive calf JJ observed by Wisdom (2000) demonstrated a much
briefer duration, and a very high mean high frequency and therefore a large bandwidth as
well. Ollervides (2000) demonstrated a lower mean high frequency and therefore
smaller bandwidth than all studies discussed. Duration was fairly short.
Both class 5, bubble blasts, and 6, sonorous bubble exhalations, have parameter
means more similar to Dahlheim (1984) than Ollervides (2001). Crane and Lashkari
(1996) describe class 5 as ―stochastic‖ in nature, and this is an appropriate description
for both classes as observed in this study. Ollervides (2001) found that class 6 had a

91
narrower bandwidth, lower center frequency and longer duration than class 5. In this
study as well, class 6 had longer mean duration; however, class 6 also had a wider
bandwidth and higher center frequency. These results are similar to those of Dahlheim
et al. (1984), in which class 6 had a higher low frequency, higher maximum frequency
and slightly longer duration than class 5. Crane and Lashkari (1996) describe class 5 as
―subsurface exhalations and bubble blasts (rapid release of air underwater)‖; their study
observed no occurrences of class 6. It is likely that upon closer analysis, some of these
may be distinguished as class 6. Class 5 and class 6 appear to be the only sounds
produced in the water, rather than mechanisms within or on the whale‘s body.
Additionally, these are the only classes directly attributed to a specific behavior (Crane
and Lashkari, 1996). Würsig and Clark (1993) describe typical blow sounds (exhalation
and inhalation above water surface) of bowhead whales as ―noisy with unstructured,
broadband energy mostly between 100 and 400 Hz and durations of 1-2 sec.‖ Distinct
from the normal blow was an underwater blow, described as ―similar to the exhalation
noise from a SCUBA respirator: a sustained 2-4 sec, high-frequency, broadband noise
mixed with a chorus of lower-frequency, short-duration broadband gurgles‖ (Würsig and
Clark, 1993). Würsig and Clark (1993) proposed that longer duration of subsurface
exhalation is due to the time required for bubbles to reach the surface. It is possible that
class 6 is distinguishable from class 5 only by length of duration due to slower release of
exhalation, which may be controlled by the whale for some purpose.
Wisdom (2000) described a rumble that had not been included previously in the
gray whale repertoire. Ollervides (2001) soon thereafter expanded the repertoire with
several new classes. Based on acoustic parameters described by Wisdom (2000), the
rumble may be best represented by class 7. In this study, class 7 had a mean low
frequency very similar to that of Ollervides (2001). The mean high frequency in this
study was a bit lower than that observed by Ollervides (2001), and therefore mean
bandwidth of this study was also a bit smaller. Mean maximum frequency observed in

92
this study was also a bit lower than that of Ollervides (2001). Mean duration observed in
this study was slightly longer than that of Ollervides (2001).
There were no observations of class 8.
Class 9 was very similar to all parameter means observed by Ollervides (2001).
It is very similar to classes 4 and 5 in frequency ranges, but had a higher maximum
frequency. It also shared the same duration as class 5; only class 6 had a longer mean
duration.
Classes 10 and 11 combined have four of the most extreme mean parameters.
Class 10 had highest mean high frequency and greatest mean bandwidth; class 11 had
highest mean low and maximum frequencies. Six out of the eight occurrences of these
classes were in the presence of calves. The remaining two occurrences were assigned
―unknown/mixed‖ as social context; however, at least one session had calves present for
a portion of the time. Such extreme parameters are an indication that the complex or
rare sounds may be produced by calves, either as anomalous sounds while learning, or
necessary for the mother/calf relationship.
Although actual mean parameters of class 11 were not as extreme as those
observed in Ollervides (2001), the relative relationship to other classes in this study was
similar to that in Ollervides (2001). The mean high and maximum frequencies, as well
as bandwidth, were greater in Ollervides (2001) than in this study. Although not nearly
as high as those in Ollervides (2001), this study observed class 11 to have the highest
mean maximum and low frequencies of all classes. Furthermore, this class had a
relatively large bandwidth and mean high frequency when compared to other classes in
this study.
Class parameters by social context
Frequency-related parameters showed much more variation among context than
duration. Duration is unlikely to reflect emotional states or indicate a sound‘s function,
as it demonstrated very little variation among contexts. Because social context as
defined in this study may to some degree reflect age class, frequency parameters may not

93
only vary with emotional state, but also with physical growth and learning. Variability
of parameters within a class of sound, and gradations between classes, may indicate
ability to alter parameters and convey information about behavioral state or status, as is
suggested for pilot whales (Nemiroff and Whitehead, 2009) and false killer whales
(Murray et al., 1998).
Calf-containing groups generally exhibited greatest means and most varied
values of low, high and maximum frequencies. Mixed/unknown groups demonstrated
slightly lower and less varied frequencies, with the exception of class 1, in which
mixed/unknown had the greatest mean low frequency. The lowest and least varied
values of low, high and maximum frequencies were observed in adult groups. These
differences were most readily observed in classes 1, 2, and 3. Additionally, classes 10
and 11 often had the highest frequency values; moreover, these classes were never
observed in adult groups. These results may indicate that physical maturity or learning
play a role in the repertoire development. As young gray whales grow and mature,
frequencies may become lower and repertoire is honed; the highly variable sounds (class
10, 11, and possibly 7 and 9) may then disappear as the smaller and more stereotyped
adult repertoire is learned.
Most significantly, calves may produce generally higher frequencies due to
smaller body size if sound production mechanisms are related to anatomical factors such
as tracheal length resonance capacity (Wallschläger, 1980; Tubaro and Mahler, 1998).
Ryan and Brenowitz (1985) confirmed that there is a negative correlation between body
size and emphasized frequencies of bird song. Additionally, low-frequency yodels
produced by common loons (Gavia immer) indicated larger body mass (Mager et al.,
2006). This is largely due to mass of vibrating structure responsible for sound
production (Wallschläger, 1980). These results may be analogous to this study‘s
observations, but there is currently limited knowledge about the possible sound-
producing organ(s) in gray whales and mysticetes in general. Recent studies may have
discovered a vocal fold homolog in mysticetes, which may produce vibrations; the

94
laryngeal sac may serve as a resonant space (Reidenberg and Laitman, 2007). Future
studies may determine if the size of these anatomical features co-vary with frequencies.
Matthews et al. (1999) analyzed tonal calls of many cetacean species, and found an
inverse relation between body size and tonal call frequency, although the correlation was
stronger in odontocetes than in mysticetes. It appears this study used a mean length for
each species (Matthews et al., 1999); there may be a stronger negative correlation
between body size and call frequency when further analyzed by individuals and across
age classes.
Dahlheim (1987) found that during experimental exposure to engine and oil
drilling noises, gray whale sounds exhibited increased sound levels, frequency
modulation, pulses per series and repetition rate. However, sound duration, frequency
range, and emphasized frequency bands were not significantly different from controls.
This indicates that the frequency differences (high, low, max and bandwidth) found
among social contexts in this study may be due to physiological restraints, rather than
behavior modifications in various contexts.
Duration varied less among social contexts than other parameters. Calf-
containing contexts produced calls with only slightly greater duration than adults and
mixed/unknown contexts. In particular, classes 6 and 9 had longest durations; these
sounds were only observed in mixed/unknown and calf-containing groups. In a study of
manatee (Trichechus inungius) sounds, there were no detected differences in duration
between sexes of manatees, while all other measured parameters differed significantly
(Sousa-Lima et al., 2002). However, manatee calves had smaller mean duration than
adults and subadults (Sousa-Lima et al., 2002). Additionally, younger Atlantic
bottlenose dolphins (Tursiops truncatus) produced whistles of shorter duration than
adults (Caldwell et al., 1990). While the results of this study seem to be contradictory to
those of other cetacean studies, it cannot be certain that the sounds of long duration are
produced by the calves in calf-containing groups. It is possible that the mothers in these

95
groups are producing sounds of greater duration, thus negating or masking (i.e.,
influencing the mean) any sounds of shorter duration produced by calves.
Although not considered in this study, one would not necessarily expect
parameter differences between gray whale sexes, at least not based on size/morphology.
Sexes are very similar in size; female length averages less than 1 meter more than males
(Jones and Swartz, 2002). Therefore adult sounds many not demonstrate differences in
parameters due to size, e.g., frequency. In contrast, the gray tree frog (Hyla versicolor)
exhibits sexual dimorphism in its laryngeal morphology, thus there is a physiological
source of sex-specific differences in sound production by gray tree frogs (Marsh and
Taigen, 1987).
For future studies, it may be advisable to measure and compare more acoustic
variables, such as start and end frequency and frequency contours (Miller and Bain,
2000). Moreover, three-dB bandwidth, Q ratio and harmonic/sideband interval are
believed to be more robust and accurate measurements of a sound‘s characteristics in
high ambient sound levels (Crane and Lashkari, 1996). Alternative analyses may be
principal components analysis or other multivariate techniques to determine which
variables contribute most to variability (Clark, 1982; Dunlop et al., 2007; Nemiroff and
Whitehead, 2009).
Frequency parameters exhibited more variation among classes and context. It is
possible that varying frequencies may convey different information. Furthermore, some
of these differences to be due to physical growth or repertoire learning. Duration
showed much less variation; it is less likely to convey information, reflect physical
maturation or repertoire learning. Future studies may further clarify the function of
parameter variations if individuals producing sounds can be isolated. Additionally, other
contexts that may be investigated include sex and aggression levels.
Class 1 subclass parameter variations by social context
Generally, calf-containing contexts exhibited the highest parameter means.
However, mixed/unknown contexts had significantly higher mean low frequencies and

96
inter-pulse intervals for both subclasses. Small sample size of class 1 subclasses from
mixed/unknown contexts may have contributed to this anomaly; it was less than half the
sample size of calf-containing contexts. Alternatively, higher means may be valid and
represent the possible presence of immature whales in the mixed/unknown contexts.
This unexpected difference may be heightened if the means of calf-containing contexts
are lower than calves alone would produce, due to the presence of adult mothers. If calf
sounds could be isolated, their mean low frequency may be greater than mixed/unknown
contexts, as would be expected if smaller bodies produce higher frequencies
(Wallschläger, 1980; Tubaro and Mahler, 1998).
Similarly, greater inter-pulse interval means may be observed in future studies if
calf-produced sounds can be isolated. Learning or maturation may be critical to
controlled use of this acoustic element; this will be revealed if sounds produced by
calves could be isolated. This phenomenon may also explain why there was no
distinction in pulse rates (# pulses/second in series) between the two subclasses in
mixed/unknown contexts; in adult and calf-containing contexts, subclass 1a had greater
pulse rates than subclass 1b. The similar rates found in mixed/unknown contexts may be
due to the possible presence of immature whales, which may still be learning the
repertoire and have yet to develop and control the rates distinctive to each subclass. The
pulse rates exhibited in calf-containing contexts, which were distinct between
subclasses, may be more similar to the subclass difference observed in adult contexts
due to the presence of mother whales in calf-containing contexts. Had the sounds of
calves been isolated, perhaps the pulse rates of subclasses would not exhibit this
distinction. Juvenile killer whales did not produce regular call sequences, as adults did;
this is currently attributed to inability to correctly convey their motivational state (Rehn
et al., 2007). Odontocetes can vary pulse rate, often inversely with target distance
(Simard et al., 2010). Although gray whales are likely not echolocating, class 1 is the
most frequently used sound class, and contains much variation in number of pulses and
pulse rate. Gray whales may vary pulse rates to convey information.

97
A less likely possibility when reviewing subclass parameters is that the variations
are due to drift, directional change, or progressive structural changes in a population,
similar to that of the humpback song (Winn and Winn, 1978; Cerchio et al., 2001;
Eriksen et al., 2005). There is other evidence in gray whale sounds that parameters vary
across years. Gray whales in their northern feeding grounds produced class 1 sounds
that varied in parameters at two sites in two successive years; while duration remained
constant, frequency of maximum energy and inter-pulse interval were significantly
different (Moore and Ljungblad, 1984).
Relative use of classes
In contrast to other studies, this study found less use of class 1 in general and
greater use of the remaining classes (Table 6). The proportions of sounds observed and
classified in this study are surprising when compared to the results of other studies.
Previous studies in the southern wintering lagoons found that almost 70% or more of all
sounds were class 1 (Dahlheim et al., 1984; Wisdom, 2000; Ollervides, 2001). On the
migration route, less than 40% were class 1, but almost half were class 3 (Crane and
Lashkari, 1996). The proportion of class 1 in this study is an intermediate between other
studies in the wintering lagoons and the migration study (Table 6). However, the
relative use of type 3 in this study is much less than the migration study (Crane and
Lashkari, 1996).
The differences in relative use of repertoire may be the result of subjective and
difficult classification. Although both visual and aural methods are used, the human eye
and ear are still subjectively deciding classes that are vaguely defined. It was my
objective and hope that this study has to some degree improved an imperfect
classification. Additionally, the original objective of this study was to classify all classes
of sounds; extra effort was required to classify difficult, complex, and more variable
classes. It is possible that I put forth more effort and time when discriminating among
classes, therefore had more diverse repertoire. Class 1, although it has graded
characteristics, is very distinctive; in other studies, less identifiable sounds may have

Table 6. Comparison of gray whale repertoire use throughout its range.
Southern Wintering Lagoons (México) Migration (California)
Northern Feeding Grounds
(Alaska)
Captive
Calf
Class of
Sound
This study
2009
Ollervides
2001
Wisdom
2000
Dahlheim
et al 1984
Cummings
et al 1968
Crane &
Lashkari 1996
Moore &
Ljungblad
1984
Dahlheim
1987
Petrochenko
et al 1991
Wisdom
2000
1 58.1% 83.5% 69.7% 79.5% 4.8% 37.6% 92.0% 26.4% 59.0% 66.7%
1a* 20.37% 1.8%
50.0%
1b* 37.96% 67.9%
16.7%
2 6.0% 2.8% 4.2%
3 9.3% 1.6% 2.9% 5.6% 87.4% 46.5% 3.7% 5.7%
17.2%
4 13.9% 4.2% 21.9% 4.2% 4.3% 4.3% 11.3%
16.1%
5 3.9% 1.4% 4.2% 2.2% 11.6% 21.0%
6 2.6% 0.2% 2.1% 5.6% 56.6%
7 3.2% 2.7%
8 0.0% 1.8%
9 1.2% 0.4%
10 1.4% 0.4%
11 0.5% 0.9% 8.0%
Other
5.5% 12.0%
Total (n) 432 976** 489 708 231 258 438 53 100 366
*Percentage of total repertoire
**Personal communication (via email 6/17/2010)
98

99
been overlooked. Quieter vocalizations, those with smaller sound-to-noise ratio, are
more easily and likely to be masked by ambient noise; if sounds are not entirely audible,
they may not be classifiable or their parameters not measureable (Miksis-Olds and
Tyack, 2009). Finally, the use of various recording systems in different environments,
with variable ambient noise levels, will produce different ―filters‖ through which sounds
must be recognized. For example, if hydrophone used in this study was more sensitive,
it would therefore pick up more sounds with better sound-to-noise ratio.
However, a difference in repertoire use could be a result of this study‘s very
small sample size (n= 10:09 hrs:min) compared to other studies. Other studies ranged
from 23.8 recording hours with isolated mother-calf pairs (Wisdom, 2000) to almost 600
hours of recordings (Dahlheim, 1987). Furthermore, our sampling began several weeks
after the whales arrived at Bahía Magdalena. It has been documented that the
composition of whales and their use of the bay changes over the weeks and months
(Jones and Swartz, 1984; Pérez-Cortés et al., 2004). Specifically, single whales leave
the bay several weeks earlier than mother/calf pairs (Jones and Swartz, 1984) and are
observed approximately one month earlier on the northward migration (Herzing and
Mate, 1984). Norris et al. (1983) observed a possible peak of adult whales in entrance
aggregations in January, but Jones and Swartz (1984) observed a peak of single adult
whales in mid-February. The earliest recordings in this study (mid-February) may have
been directly coinciding with or after the peak of adult social and sexual aggregations.
Therefore, this study is clearly not representative of the entire season in the southern
lagoons. While Dahlheim (Dahlheim et al., 1984; Dahlheim, 1987) recorded many more
hours, the duration of several of her field seasons in Laguna San Ignacio were later in the
season and/or of shorter duration than this study. Additionally, while some studies
recorded for 24 hours continuously (Dahlheim, 1987), this study was limited in its
resources and recording times always occurred between 9 a.m. and noon local time
(0900 and 1200). If there is any diel variation in gray whale sound production, such a
limited window of observation is providing a small slice of the entire picture and may

100
skew actual use of gray whale repertoire. However, this is not expected, as neither
Dahlheim (1987) nor Wisdom (2000) observed any periodicity in sound production.
Finally, lower relative use of class 1 may have been a product of this study‘s
objectives to observe several social contexts. There may have been increased effort to
record mother-calf pairs, relative to other studies.
Class 1 is the most frequently used sound in the gray whale repertoire, and it is
used in all contexts. Law of word meaning, in which a more frequently used word has
more meanings (Ferrer-i-Cancho and McCowan, 2009), may apply to class 1.
Therefore, it may have many meanings, some of which may be distinguished by use of
class 1 subclasses, varying parameters, as well as visual and tactile communication. In
this study, there were several parameters that varied significantly across social contexts.
Moore and Ljungblad (1984) also found class 1 to be the most variable sound in the gray
whale repertoire while in their summer feeding grounds. There is a similar correlation
supporting this hypothesis for dolphin whistles, in which ―more frequent whistle types
tend to be associated to more behavior contexts,‖ thus it may have more meanings
(Ferrer-i-Cancho and McCowan, 2009).
It is still not completely clear if gray whales vary repertoire or sound parameters
by season or geography. Only class 3 clearly appears to be associated with a particular
environment. Class 3 was significant on the migration route (Cummings et al., 1968;
Crane and Lashkari, 1996), and has consistently low use both in southern wintering
lagoons (Dahlheim et al., 1984; Wisdom, 2000; Ollervides, 2001) and northern feeding
grounds (Moore and Ljungblad, 1984; Dahlheim, 1987). Other baleen whales have
demonstrated seasonality in sound production. Minke whale vocal activity was strongly
seasonal; although pulse trains were detected between February and November, rates
were very low during spring, but peaked in late summer when they were detected in
more than 80% of all recordings during August and September (Risch, 2010).
Other classes are not so readily delineated by geography or seasonality. While
Moore and Ljungblad (1984) observed very high relative use of class 1 (92%) in

101
northern feeding grounds, similar to several studies in Baja (Dahlheim et al., 1984;
Ollervides, 2001), their sample size was extremely small (n=2 hours). This is unlikely to
be representative of the sound repertoire on the northern feeding grounds. Additionally,
it is not clear when the recordings were collected. It is possible that recordings collected
late in the season encountered whales in increasing levels of social activity (Würsig et
al., 1986). Therefore, use of class 1 in documented by Moore and Ljungblad (1984) may
have been unusually high. Rates of sound production observed by Moore and Ljungblad
(1984) were also unusually high, especially when compared to other studies in the
northern feeding ranges (Dahlheim, 1987; Petrochenko et al., 1991). More studies with
appropriate samples sizes are needed to fully understand how gray whale sound
repertoire varies throughout their range and seasons. Classes 5 and 6 appear to have
consistently low use in all locations. The remainder of the classes have only recently
been described and therefore comparisons cannot be made; earlier studies often referred
to several miscellaneous sounds that could not be classified (Moore and Ljungblad,
1984).
Relative use of classes by social context
The class 1 sound (subclass 1b and less frequently 1a) was the sound class used
most frequently in all contexts. Adults most frequently used class 1; 73% of all adults
sounds were class 1. Although mixed/unknown and calf-containing contexts also used
class 1 more frequently than others classes, it was not such a large proportion of their
repertoire (31% and 36% respectively).
These results indicate that class 1 appears to be a critical sound during highly
social and sexual contexts. While class 1 is highly recognizable, it is not as stereotyped
as tonal sound classes 2 or 3. In this study, class 1 subclasses exhibited significant
variations in mean high frequency, bandwidth, individual pulse interval, and pulse rate.
Several parameters also varied significantly across social contexts. Dahlheim (1987)
noted considerable variation in ―metallic sounding‖ character of class 1.

102
Mammalian repertoires may consists of discrete (distinct, highly stereotyped) and
graded calls (Marler, 1967; Ford, 1989). It may be possible and advisable to organize
variable sounds, such as class 1, into a continuum demonstrating its graded
characteristics in a series of intermediates (Fischer and Hammerschmidt, 2002).
Discrete stereotyped calls may generally be used for long-distance
communication (Marler, 1977; Waser and Waser, 1977). In the killer whale repertoire,
such calls often have greater source levels and larger active space (Miller, 2006). Thus,
they propagate well when communicating with group members out of visual range, and
likely allow for localization and coordination of movements (Miller et al., 2004). In the
gray whale repertoire, classes 2 and 3 best reflect this structure and function; they are
somewhat similar in structure and function to the southern right whale up call (Clark,
1982; Clark, 1983).
Highly variable sounds, like classes 1 and 4, are most likely associated with
close-range social contexts. Killer whales produced significantly more variable calls and
whistles with higher pitch and more complexity during excited, close-range socializing
and beach-rubbing contexts than in foraging or travelling (Ford, 1989; Thomsen et al.,
2002). Graded, highly variable sounds appear to be used in close-range circumstances;
it is in such contexts where subtleties in sound structure can reflect gradual changes in
motivation or emotion, supplemented with visual and physical contact (Marler, 1977;
Ford, 1989; Rehn et al., 2007). That graded sounds are more often used in close-range
communication is also documented in canines, felines and primates (Marler, 1977;
Peters and Tonkin-Leyhausen, 1999; Robbins, 2000; Fischer and Hammerschmidt,
2002). Hybrid and pulsive calls together were the majority of sounds produced in
sexually active southern right whale groups; these groups did not produce any simple
tonal calls (Clark, 1983). In this study, gray whale adult sounds generally had lowest
frequency values, but class 1 consistently had high values of high and maximum mean
frequencies in all social contexts. Class 1 was used frequently by socializing and
courting adults; such relatively high frequencies and variability (i.e., number of pulses,

103
pulse rates, inter-pulse interval) may convey important motivational information in these
close-range interactions.
Additionally, the use of variable and aberrant calls by killer whales is often in
direct proportion with the level of activity (Ford, 1989). Further analysis of this study‘s
data and future studies may reveal if this is also observed in gray whales. The use of
subclass 1a by a captive gray whale calf was associated with high activity states
(Wisdom et al., 2001).
With confirmation of this study‘s results, subclasses 1a and 1b should be
considered established as statistically distinct (Wisdom et al., 2001). It would be
expected that these subclasses may function differently. Subclass 1a occurred in all
contexts. However, adults in this study used 1a significantly more than other contexts.
It is notable that more than half (54.5%) of all observations of subclass 1a occurred in
three highly social adult sessions. One session was also one of four sessions in which
breaches were observed. Additionally, whales exhibited rolling, head raises, fluke or
flipper swishes and a lateral lunge. A second session was the only session in which
adult social behaviors characterized every single minute, indicating high levels of
activity for the duration of the session. Furthermore, this is the only session in which a
penis was observed. Finally, a third session observed an extremely high number of
whales for its entire duration. Ten or more whales were detected for more than half of
the session, and six or more whales for 95% (19/20 minutes) of session. Thus the mean
number of whales sighted per minute in this session was 8.45, three times greater than
the mean of 2.58 whales/minute for all sessions. Wisdom et al. (2001) also found that
type 1a was associated with the captive calf‘s high activity states.
Subclass 1b was also used in all contexts. However, 1b was used twice as often
as 1a; this trend is consistent in all three contexts. Three sessions that contain the
majority of subclass 1b and 1a occurrences were characterized by exceptionally social
adult behaviors (see previous paragraph). Therefore, to some degree, 1a and 1b are used
together in highly social adult contexts. At this time, it is difficult to distinguish

104
functions for subclasses 1a and 1b. However, because it is used twice as often as 1a, it is
possible that subclass 1b has a more general function in high activity states. It is likely
that identifying producers of these sounds will provide clarification. Further analysis
may reveal a particular sex or age class as producers.
Captive gray whale calf JJ varied use of subclasses 1a and 1b over time; initially
1a was majority, then 1b became majority (Wisdom, 2000). In fact, class 1b was not
recorded in JJ‘s repertoire until 7 months of age (Wisdom 2000). Wisdom believes that
the occurrence of 1b was due to lack of reinforcement rather than necessity of vocal
maturation or learning. This study can neither support nor oppose this suggestion that
delayed use is a natural progression, as individual producers were not identified.
Norris et al. (1977) observed stranded gray whale calves producing ―low
resonant pulses‖ and ―sharp clicks.‖ On these occasions, the sounds were produced
while stranded, continued after release, and ceased upon reuniting with their mothers
(Norris et al., 1977). These observations strongly suggest that some classes of sound,
possibly class 1, 2, and/or 3 (or their related ‗precursor‘ sounds), function as contact
calls.
As already mentioned, a critical next step for future studies is to determine who
is producing particular sound classes. This will further clarify function when it can be
determined which age or sex classes are producing particular sounds. Observations
support the hypothesis that focal females in southern right whales surface active groups
produce scream calls (Clark, 1983), while there are indications that North Atlantic right
whale males produce gunshot calls (Parks and Tyack, 2005). Once age or sex class can
be determined, we can better understand the motivational state that is being conveyed
with a class of sound. For example, in highly active adult contexts, it would be revealing
to clarify if class 1 sounds are produced by aggressive males or alternatively, by
distressed females.
Class 2 has been described as an ―up/down sweep‖ by Dahlheim (1987);
Ollervides (2001) only described as ―upsweep ‗whoop‘.‖ This study did not observe any

105
downsweeps. Wisdom (2000) did not detect any occurrences of class 2 while recording
captive calf JJ or wild mother-calf pairs in Baja. Additionally, there were no
observations of class 2 by Crane and Lashkari (1996) on migration route or by Moore
and Ljungblad (1984) at northern feeding grounds. However, Crane and Lashkari
(1996) indicated there may be subclasses within class 3; some had amplitude modulation
while others had frequency modulation. Therefore this sound has been observed only in
several Baja lagoons.
The first of several possible explanations for this occasional use is that class 2
may have a very specific function and is not frequently used. Secondly, class 2 sounds
have very low mean frequencies and very brief duration. It is possible other studies
simply overlooked them or it was difficult to distinguish from ambient noise. Finally,
the irregularity of its occurrence, as well as Crane and Lashkari‘s (1996) suggestion of
subclasses within class 3, may indicate that classes 2 and 3 have been combined in some
studies. Perhaps those studies that observed no occurrences of class 2 were actually
including a broader range of sounds in class 3, and thus there may appear to be more
diversity within that class. When reviewing and classifying, various time/frequency
resolutions and authors‘ preferences will affect contour of sounds. An author‘s
subjective opinion of contour will be dependent upon the zoom of vertical (frequency)
axis used; i.e., upsweep may be overlooked if not viewed with appropriately zoomed
vertical axis. If these are classification inconsistencies, there must be more definition of
classes and precision in classification.
Regarding function of class 2, Wisdom (2000) stated that Dahlheim (via personal
communication to Wisdom, 2000) observed type 2 to possibly be a ―startle‖ response.
In this study, boats (other than the research vessel) were present during the minute class
2 occurred or the preceding minute in 81% (21/26) occurrences. Additionally, boat
observations were not consistently recorded in the second season; it is possible there
were even more occurrences of boats. Moreover, it was observed rarely, but occurred in
all three contexts. Brief analysis of this study‘s data supports the suggestion that class 2

106
may be a response to boat presence. Future studies may utilize playback experiments to
confirm this hypothesis.
Class 3 was the most common sound on the migration route (Cummings et al.,
1968; Crane and Lashkari, 1996), and therefore it may function in general as a long-
distance contact or cohesion call. In both the northern feeding grounds and southern
lagoon studies, its proportion in the repertoire is relatively minor, always less than 6% of
entire repertoire (Dahlheim et al., 1984; Moore and Ljungblad, 1984; Dahlheim, 1987;
Wisdom, 2000; Ollervides, 2001).
The structure of discrete calls may reflect their function. Studies on primates
observed that the mangabey‘s (Cercocebus albigena) ‗whoopgobble‘ was best suited for
long-distance communication due to its structure, rather than its source intensity; low
attenuation losses were attributed to energy concentration at low frequencies (Waser and
Waser, 1977). Southern right whales appear to use discrete calls in a similar manner;
discrete calls were often used to maintain contact and appeared to have little function in
close-range social contexts (Clark 1982, 1983). Up calls were 68% (34/50) of sounds
produced by swimming right whales and were used in significantly greater rates in
swimming contexts than any other context (Clark, 1982; Clark, 1983). Sexually active
groups did not produce any simple tonal calls; rather, hybrid and pulsive calls together
were the majority of sounds produced in sexually active groups (Clark, 1982).
Killer whales tended to repeat discrete calls when individuals were out of visual
range and more widely dispersed, e.g., while foraging and traveling (Ford, 1989). While
discrete calls were a majority of killer whale‘s repertoire in all contexts, the proportion
was greatest in foraging and traveling (Ford, 1989). In contrast, variable and aberrant
calls were a very small portion of the repertoire in these contexts, and were observed
when socializing activities occurred during predominantly foraging or travelling
behavior (Ford, 1989). The killer whale N2 sound is the most stereotyped sound across
killer whale matrilineal units and was used more often during meetings between pods
than any other context, although it had average use during all other contexts (e.g.,

107
foraging, traveling, socializing) (Miller and Bain, 2000). This sound, which appears
critical during pod meetings, but also necessary in other contexts, may communicate
group size, spatial distribution, as well as emotional state to other pods and individuals
(Ford, 1989; Miller and Bain, 2000). Although gray whale social structure is not
organized into pods, it is likely there may be some exchange of similar information that
is required in all or many social encounters. It is therefore hypothesized that structurally
discrete sounds, such as class 3, are used for establishing contact and maintaining
cohesion when conspecifics are out of tactile and visual range (Marler, 1977; Waser and
Waser, 1977; Ford, 1989).
Although class 3 may be most useful during migration, it may continue to
function as a contact call in the lagoons, but to a lesser extent. In general, it appears that
low use in all studies at southern wintering lagoons (Dahlheim et al., 1984; Wisdom,
2000; Ollervides, 2001) indicates that class 3 occurs in circumstances that rarely exist
here. Although class 3 was a greater proportion of repertoire in mixed/unknown
contexts, there was no significant difference among contexts. Mixed/unknown contexts
may have been the most spatially dispersed of all social contexts in this study, and their
traveling and milling behaviors in Bahía Magdalena may most closely reflect those
during migration. Therefore it would be expected that the class 3 sound, which appears
to be critical during migration, would be most useful during this context. Likewise,
analysis by four social contexts revealed that other adults use class 3 significantly more
than highly active adults; other adults are much more likely to be traveling, resting or
feeding, and did not exhibit social behaviors. Highly active adults engage in close
contact during highly social and sexual contexts, and thus may have little need for this
call. Calf-containing contexts used class 3, but nearly constant physical contact between
mother and calf (Norris et al., 1977) may not necessitate the use of frequent vocal
contact.
Wisdom et al. (2001) recorded 86% of captive calf JJ‘s class 3 (total n=63)
sounds in two days. After this brief period, use of this call decreased until it disappeared

108
from repertoire completely; in the entirety of the study, it was almost 18% of the calf‘s
repertoire. This observation suggests that reinforcement, and possibly social context as
well, are critical. As a captive calf without an adult model, JJ may have been in
production or contextual learning stage (Locke, 1990; Janik and Slater, 1997; Janik and
Slater, 2000; Wisdom et al., 2001). This may be analogous to human infant ―babble‖
(Kent and Bauer, 1985). Without reinforcement, the calf no longer used this sound.
Wisdom (2000) observed that mother-calf pairs used class 3 about 2% relative to other
sounds. Similarly, use of class 3 by calf-containing contexts was low in this study (7%
of all sounds produced by calf-containing contexts).
Class 4 was second only to class 1 in proportion of repertoire. Although only
13% of all recorded sounds in this study, class 4 was approximately one quarter of
mixed/unknown (26%) and calf-containing group (24%) repertoires; only 7% of adult
repertoire was class 4 sounds. Calf-containing contexts used class 4 significantly more
than adults. Wisdom (2000) observed that class 4 made up 18% of mother-calf
repertoire and similarly, 16.1% of JJ‘s repertoire. However, it appears that captive gray
whale calf JJ used class 4 preferentially in the first month of recording. During this first
month (7% of all recorded hours), at approximately one or two months of age, JJ
produced 30% (18/59) of all class 4 sounds recorded, and quickly tapered off during the
following months. Because this study and others observed this sound in the presence of
calves (Dahlheim et al., 1984; Wisdom, 2000; Ollervides, 2001), but is observed less
frequently in presence of adults, it may be unique to young whales. Although it was
observed in this study in the presence of mixed/unknown whales, it may be produced by
the immature individuals in these groups.
Moore and Ljungblad (1984) noted that class 4 occasionally occurred at the end
of N1 bursts, but class 4 sounds were rarely recorded in presence of feeding whales.
Class 4 and class 1 share a pulsed structure, and this study also observed occasions in
which a sound type ―merged‖ into class 4. Due to similar structure, examples of
―merging‖ class 1 and class 4, and its use by calf JJ, there is ample evidence to propose

109
that class 4 sounds are a precursor to class 1. It may be produced by young animals
developing and learning the repertoire of adults. Occasions of merging sounds may
occur during a ―babbling‖ stage or production learning (Janik and Slater, 2000).
Immature sounds may or may not initially resemble sounds from adult repertoire, but
with time are gradually ―molded‖ into correct structure (Locke, 1990; Doupe and Kuhl,
1999). Such stages have been well demonstrated by human infants and passerine
songbirds (Doupe and Kuhl, 1999) and likely exist in bottlenose dolphins (McCowan
and Reiss, 1997).
A review of other studies may illuminate a possible function of classes 5 and 6.
Würsig and Clark (1993) documented possible association of underwater blow sounds
with feeding and socializing bowhead whales and found that surface blow sounds were
usually associated with socializing, perhaps due to increased physical activity. Groups
of fully active and sexually active southern right whales used short, loud blows, unlike
the less intense blows of swimming whales (Clark, 1983). Additionally, harsh blows
were used by a mother separated from her calf, by resting whales joined by porpoises or
sea lions and also by single resting whales joined by a silent whale (Clark, 1983).
Furthermore, underwater blow sounds and loud exhalations in active groups of
humpbacks may function as threat displays (Tyack and Whitehead, 1983). These
circumstances indicate a function of communicating disturbance or threat, although it
may also simply be more pronounced breathing due to increased exertion (Clark, 1983).
Similarly, this study‘s results provide further evidence that such exhalations and
bubble blasts are sounds indicating disturbance or stress. A majority (22/23 occurrences
in which boat data were taken) of class 5 and 6 sounds occurred in the presence of boats
(other than the research vessel), or in the subsequent minute. Playback experiments and
autonomous recorders (i.e., without presence of research vessel) will reveal if this
hypothesis can be supported. Some classes of killer whales sounds occurred only in
aggressive chase contexts (Graham and Noonan, 2010). As a result, these calls unique to
chase contexts, along with parameter variations in more common calls, may readily

110
identify this aggressive context by acoustic observation alone. If such a sound
communicates stress or disturbance, conservation management and boaters should use
classes 5 and 6 as indicators of a stressed group; restrictions should then be modified to
better protect the whales.
Class 7 was used infrequently, but occurred in all social contexts. No unique
circumstances provide insight into the function of this sound. In addition to occurring in
all social contexts, class 7 occurred during highly social periods, as well as traveling and
resting circumstances. Moreover, it occurred in both the presence and absence of boats.
Perhaps localization of the producing animal, as well as playback experiments, will
begin to clarify its function.
It is not surprising that this study found no occurrence of class 8. It is only
described in Ollervides (2001), and in that study occurred rarely, at the same time and
location, and in the presence of a calf. The sound recorded by Ollervides (2001) was
similar in structure and parameters to class 1 or class 4 pulses. It was likely produced by
a calf; therefore it may have been an ―anomaly‖ sound that should have been included in
an existing class, rather than creating a new class. As this study suggests, some of the
infrequent and unusual sounds may be a demonstration of calf learning (Locke, 1990;
Doupe and Kuhl, 1999). This class should be carefully reconsidered, as it may be
redundant.
Class 9 was observed in both adult and calf-containing contexts; there were no
occurrences in mixed/unknown contexts. Because of small sample size, it is difficult to
draw conclusions regarding function. It may be more appropriate to draw conclusions
when analyzed as pooled classes (classes 5 – 11), as discussed below. However, at least
3/5 occurrences were in presence of boats, and 4/5 occurred with highly active
behaviors, such as fluke or flipper swishing, bubble blasts, head raises or rolling. With
the exception of its pulsed nature, it shares an upsweep structure and some parameter
features with class 2. This may be a variant of class 2.

111
As proposed by Ollervides (2001), class 10 may be considered a disturbance
sound. Furthermore, data in this study suggest that it may be produced by calves or is at
least unique to mother-calf contexts. All observances of class 10 sounds occurred in
presence of boats; additionally, 5/6 occurrences were in the presence of at least one calf.
One session in particular contained half (3/6) of class 10 sounds observed in this study.
In addition to several boats present in close-range for several minutes, at least one
juvenile or adult whale was present with the two mother-calf pairs; this also may add
stress for mother/calf pairs (Norris et al., 1977).
Class 11 sound was observed only twice; both occurrences were in the presence
of calf-containing contexts. The groups observed not only included at least one calf, but
also other adults and one unknown whale (unidentifiable as either adult or calf, perhaps
due to distance) in each. Additionally, boats were present during both occurrences. In
the only other study to observe this sound, it was attributed to whales skimming with
baleen (Ollervides, 2001); but this study had no observations of surface-feeding whales.
Therefore, neither production nor function of class 11 is clear. Bowhead whales were
observed to produce an unusual pair of noisy, broadband sounds, termed ―cr-unch,‖ as if
produced by two objects rubbed together; however, no surface behavior was observed
(Würsig and Clark, 1993).
In an attempt to interpret the function of infrequent sounds, classes 5 through 11
were pooled and analyzed as one. These classes shared similar complex/mixed
structures and lack of stereotype. Structure and use of these pooled classes provide
possible evidence that these sounds are either specific to mother/calf relationship or
―precursor‖ vocalizations produced by calves that are still developing and honing their
repertoire. Human babies produce immature ―babbling‖ and young songbirds produce
subsong, but neither of these could be mistaken for adult speech or mature birdsong
(Doupe and Kuhl, 1999). Bottlenose dolphin whistle is present at birth, but infants do
not produce whistles with a multiloop structure; nor do newborns produce stereotyped
whistles, but rather ―tremulous and quavery‖ whistles (Caldwell and Caldwell, 1979).

112
Aberrant killer whale calls and whistles, which appear to be a distortion of more
common sounds (Ford, 1989), may be attributed to maturation or production learning
through mimicry (Yurk et al., 2002).
This study did not localize the individual producer of each sound, so it cannot be
determined whether mother or calf was producing these mixed/complex sounds. Some
unique sounds may be reserved for very specific contexts, and are not applicable to any
other circumstances. Such may be the case for some or all of these classes (5—11);
these sounds may be unique to mother/calf communication or development of repertoire
by calf. For future research, localization is critical to determine if these classes are
unique to mother/calf contexts or evidence of learning in young calves. If produced only
by calves, such data would indicate learning or maturation. If produced by both or only
mother, it is more likely that these sounds are intentional and appropriate in mother/calf
context. Northern right whale ―warble‖ appears to be produced only by calves in surface
active groups (SAG‘s); this sound also has higher pitch and longer duration than adult
―screams‖ and is often characterized by ―stuttering pauses‖ (Parks and Tyack, 2005).
These characteristics, like other ―precursor‖ sounds proposed in this study, may indicate
that the right whale ―warble‖ is evidence of calves learning the repertoire; it is possibly
produced only by female calves, ―practicing‖ SAG behavior (Parks and Tyack, 2005).
There is some indication that unknown/mixed contexts may contain immature
individuals without a fully developed repertoire. When modeled as four social states
(i.e., unknown/mixed, other adults, active adults, and containing calves), both
unknown/mixed contexts and calf-containing contexts had significantly higher
probability of using complex type sounds.
Relative use of type
Of the three general types (i.e., tonal, pulsed, complex), pulsed sounds were used
most frequently in all three contexts. This complements other studies that propose that
sounds with subtle or graded structure variations are used in close-range interactions
(Marler, 1977; Clark, 1983; Ford, 1989; Peters and Tonkin-Leyhausen, 1999; Rehn et

113
al., 2007). It is likely that gray whales are most gregarious in the southern wintering
lagoons. These sites contain the unique contexts of the mother-calf relationship as well
as lagoon aggregations (Norris et al., 1983). Complex sounds were used more often in
calf-containing and mixed/unknown contexts; use in adult contexts was low. Tonal
sounds were used infrequently in all social contexts. The simple structure and low
frequency of tonal sounds would be most important in long-range communication. This
is confirmed by its greater use on the migration route (Crane and Lashkari, 1996).
Bowhead whales were also found to increase use of tonal sounds, and thus relative use
of pulsed sounds decreased, as social activities declined during the course of spring
migration (Würsig and Clark, 1993).
While this appears to be the first study to simplify the gray whale repertoire,
other mysticete repertoires have been described in a similar manner. Bowhead sounds
were categorized as simple (frequency-modulated), complex (amplitude-modulated) and
song notes (Tervo et al., 2009). Some bowhead sounds could not accurately be
described as pulsed or burst, due to broadband nature; rather, a ―staccatolike‖ quality
was produced that may be similar to the gray whale sounds this study termed ‗complex‘
(Clark and Johnson, 1984). Principal components analysis organized the graded
characteristics of the right whale repertoire into a continuum of sounds with varying
tonality, pulsiveness, or degrees of frequency modulation; those most common or
recognizable along the continuum were given names (Clark, 1983). The most distinct
subdivisions in the southern right whale repertoire are the discrete up calls and the
remaining variable and graded calls (Clark, 1982; Clark, 1983).
Although baleen whales share many similarities in their repertoire, there are a
few distinctions. Clark and Johnson (1984) defined four bowhead calls: tonal frequency-
modulated (―simple moans‖ were most common), pulsed, tonal amplitude-modulated,
and complex (i.e., ―lion‘s roar,‖ complex moans, complex pulsive calls, and hybrid
combinations). In this study, gray whales were not recorded producing any tonal
amplitude-modulated (AM) calls. More recently, bowhead whale vocal calls were

114
organized into two general groups: low frequency-modulated (FM) calls and complex
calls (Würsig and Clark, 1993). Simple FM calls were further differentiated by their
contours; complex calls were further classified as high, pulsed tonal, pulsive, growls and
trumpets (Würsig and Clark, 1993). It appears that the bowhead repertoire contains
several sounds with more complex structure than gray whale sounds. Gray whales in
this study did not produce the harmonically-rich ―pulsed tone‖ call with purr-like quality
or the pulsive trumpet call with its mixture of ―broadband pulses, FM undertones, and
amplitude modulations‖ (Clark and Johnson, 1984; Würsig and Clark, 1993).
However, neither grays nor bowheads exhibited stereotypy in the complex calls, thus
creating difficulties in classification and inconsistencies among studies (Clark and
Johnson, 1984). Additionally, gray whales in this study had higher probabilities of using
pulsed sounds; the majority of sounds used by migrating bowheads were simple FM
moans (Clark and Johnson, 1984). Finally, gray whales have not been found to produce
long patterned repetition of calls, such as the bowhead‘s song (Stafford et al., 2008).
Relative use of type by social context
Pulsed sounds were used significantly more by adults; in the southern wintering
lagoons, adults are exceptionally social, when compared to other portions of their range.
This again confirms hypotheses in other studies that varied, pulsed sounds are likely
important in close-range, complex social contexts (Marler, 1977; Ford, 1989; Rehn et
al., 2007). Use of highly variable and graded calls by southern right whales is associated
with groups of active whales, and therefore may be an indicator of the level and
complexity of activity (Clark, 1982). Fully active groups of southern right whales had
higher rates of using hybrid calls (mixture of FM sweeps and amplitude modulation)
than fully active pairs of animals (Clark, 1983). Additionally, groups of mixed sex
southern right whales used hybrid calls at greater rates than either same-sex groups
(Clark, 1983). Carolina chickadees (Poecile carolinensis) also demonstrated a
significant relationship between larger group size and increasingly varied and diverse
calls (Freeburg and Harvey, 2008).

115
Low use of complex sounds by adult gray whales in this study, and greater use in
calf-containing and mixed/unknown contexts indicates that these may be precursor
sounds to the adult repertoire. Complex sounds, as defined and classified in this study,
were often hybrid forms of tonal and pulse sounds, or broadband, but generally lacked
stereotyped structure.
Rates of sound production
There appears to be evidence that social/sexual adults may vocalize more, despite
results from this study‘s statistical analysis indicating that there was no significant
difference in use among social contexts. It is likely that the statistical tests may
misconstrue interpretation of the data, due to small sample size and a major outlier. The
session with the highest mean rate of individual sound production was the previously
discussed outlier in mixed/unknown context, and therefore may be misleading. It may
be more revealing to note that six of the seven sessions with the greatest mean individual
rates (sounds/minute/whale) were adult sessions. Three of these adult sessions also had
the greatest mean group rates (sounds/minute). In these three sessions, 50/58 (86%)
minutes contained highly active adult behavior that was likely courtship or mating.
Additionally, three adult sessions with high group rates over short periods were the same
three sessions in which class 1 was used frequently. Notably, these sessions displayed
behaviors indicating courtship or mating, as these sessions were characterized by large
groups of whales exhibiting many social behaviors, often for many consecutive minutes.
Additionally, one session included the only observation of a penis in the entire study.
However, because of the large number of whales present, individual rates
(sounds/min/whale) during these three sessions were only slightly above average.
The short-term peak rates in each social context are also revealing. Both adult
(13 sounds/minute) and calf-containing (5.7 sounds/minute) contexts had peaks more
than twice that of mixed/unknown (2.3 sounds/minute). Adults vocalized at rates two to
three times greater than unknown/mixed contexts and mother/calf contexts.

116
The number of sessions that were entirely silent is also revealing. Almost half (6
of 14) of mixed/unknown sessions produced no sounds, whereas only 1 of 12 adult
sessions were silent. Although calf-containing contexts were occasionally silent for
minutes at a time, every calf-containing session produced some sounds; this was the only
context to do so. In southern right whales, rates of sounds production had a similar
relationship to activity level and context. More than half of resting and swimming
groups were silent, whereas all fully and sexually active groups produced sounds (Clark,
1983).
Wisdom (2000) found that isolated mother/calf pairs vocalized at rates of 19.4
calls/hour (Table 7). Captive calf JJ varied rate of production of subclass 1a from 4.5
calls/minute during extremely high activity states to only 0.0001 calls/minute during
normal and low activity states (Wisdom 2000). This study found that calf-containing
contexts vocalized at 41.91 calls/hour. The higher mean rates of this study are likely due
to the presence of additional whales, including other mother/calf pairs or other single
whales. This study‘s sample size was also much smaller.
For geographic and social context comparison, migrating gray whales vocalized
at rates of 0.050 sounds/hour/whale in shallow water and 0.012 sounds/hour/whale in
deep water (Crane and Lashkari, 1996). Rates of sound production during migration are
much lower, perhaps due to increased risk of predation and fewer social behaviors
(Table 7).
In a study comparing rates at several locations along the migration route,
Dahlheim (1987) determined rates for each month. Although excluding classes 5 and 6
in calculations, whales at northern feeding grounds produced sounds at a rate of 0.013
sounds/hour/whale. Surprisingly enough, there were no sounds recorded that could be
attributed to four feeding juvenile whales in Washington State (Table 7). In a southern
wintering lagoon, Dahlheim (1987) observed rates ranging from 0.25 sounds/hour/whale
to 0.33 sounds/hour/whale, which are clearly two to three times greater than the rates
observed in summer feeding grounds. It is not stated which social contexts were

Table 7. Comparison of gray whale sound production rates throughout its range.
Southern Wintering Lagoons
(México)
Migration
(California)
Northern Feeding Grounds
(Alaska)
Captive
Calf
This Study:
All whales
This Study:
m/ca
Wisdom
2000 m/ca
Dahlheim
Baja 1987
Crane
Lashkari
shallow
water
Crane Lashkari
deep water
Dahlheim 1987
North
Dahlheim 1987
Wash St
Petrochenko
1991 Wisdom 2000
# of sounds 432 113 489 * 220 38 53 0 269 366
Recording
Duration (hours) 10.13 2.72 23.78 565 37.8 32 40 5 6 248
Recording
Duration (min) 607.8 163.2 1426.8 33900 2268 1920 2400 300 360 14880
# of whales 93.41 38 72 195-258 110 96 100 4 * 1
Sounds/min 0.717 0.699 0.343 0.83 - 1.4 0.097 0.020 0.022 0.000 0.747 0.0001 - 4.5
Sounds/min/whale 0.013 0.009 0.005 0.0042 -
0.0055 0.001 0.000 0.0002 0.000 * 0.0001 - 4.5
Sounds/hour 43.023 41.912 19.4 50 - 84 5.820 1.188 1.325 0.000 44.833 0.006 - 270
Sounds/hour/whale 0.784 0.514 0.286 0.25 - 0.33 0.050 0.012 0.013 0.000 * 0.006 – 270
*Not provided.
117

118
observed by Dahlheim (1987) in this wintering lagoon. As suggested in this study,
Dahlheim (1987) also suggested that high rates of sound production in southern
wintering lagoons are due to increased social activity that occurs there. Likewise, Parks
(2003) observed that there are behavioral and possibly acoustic similarities among
courting and mating groups of coastal baleen whales. This is most evident when low
calling rates of individual animals at summer feeding grounds are compared to higher
rates during more social contexts. Like gray whales on their northern feeding grounds
that produce low sound rates (Dahlheim, 1987), humpback whales in Alaskan waters
produce very few sounds when feeding individually (D'Vincent et al., 1985). However,
while in Hawaiian waters during winter, humpbacks used social sounds at high rates
only in large groups demonstrating high levels of activity; lone singers and mother-calf
groups were never recorded using social sounds (Silber, 1986).
An increase in sound production rates in social contexts is a phenomenon
exhibited in other cetaceans. Diaz López and Shirai (2009) observed a positive
relationship between group size and sound rates in bottlenose dolphins, thus confirming
that these sounds have a communicative function, particularly in social contexts. Groups
of cavorting and milling manatees, which exhibited high levels of excitement and social
interaction, vocalized at greater rates than those feeding, swimming and resting
(Bengtson and Fitzgerald, 1985). Graham and Noonan (2010) observed that captive
killer whales produced sounds at rates three times greater during aggressive periods than
during non-aggressive periods. Gray whale social and sexual contexts may also be
aggressive or at least competitive in nature (i.e., males chasing females; males
competing).
While group rates may increase with high surface activity, particularly in adult
contexts, individual rates do not follow the same trend. This is indicated by the lower
rate of sound production when calculated per whale. In humpbacks, vocalizations per
group increased with group size while vocalization rate per individual did not vary
significantly (Silber, 1986). This unequal production may be explained by determining
the producer of the vocalizations, which should be a goal of future studies. To interpret

119
a sound‘s function, it must be determined if the sound is produced by the focal female,
or primary or secondary male aggressors.
Examples from other mammals demonstrate the importance of determining rates,
particularly from specific age and sex classes. Furthermore, specific behavior events
may be observed in conjunction with the use of specific sounds. White-faced capuchin
monkey (Cebus capucinus) infants produced the majority of trills, at significantly higher
rates than adult females (Gros-Louis, 2002). Trills were most frequently used by infants
when approaching another individual, often followed by affiliative behavior. Territorial
male Galápagos sea lions (Zalophus wollebaeki) vocalized at higher rates than non-
territorial males; additionally, rates when establishing a territory were higher than at the
end of territory tenure (Kunc and Wolf, 2008). Rates of vocalizing for sheep ewes (Ovis
aries) and their lambs were highest prior to nursing (Sebe et al., 2008).
More trends may be revealed by utilizing other analysis methods. Alternate
methods to calculate and analyze rates were used by Quick and Janik (2008), in which
they calculated individual rates by dividing average whistle rate per 2-minute section
―by the median group size for each analyzed section.‖ Such a method would allow for
analysis of subtleties within a session, such as rapid changes that occur within a session.
It will allow for recognition of extreme peaks and lows contained within one session that
would otherwise be obscured when calculating means. Gray whales seem to have a
short ‗attention span‘: there was much variation within a session, as contexts could
change during these short sessions (15 minutes). As a result, a session was analyzed as
one context, but was not truly represented by only one context. Therefore, the use of
mixed/unknown as a context has likely created some misleading results. Analysis on a
smaller scale, such as the 2-minute units described above, may more clearly reveal how
contexts affect sound use.
Use of four social contexts
Despite small sample size, these data provide strong suggestions that highly
active adults (likely courting/sexual behaviors) may be distinct in sound production and
rates from other adults, who were likely travelling or resting. Some models with four

120
social contexts (i.e., highly active adults, other adults, mixed/unknown, calf-containing)
were significant, and others indicated trends near significance. This was likely due to
small sample size.
Use of subclass 1a by highly active adults was significantly greater than use by
other adults. In general, it is notable that 38% of all sounds were class 1 produced in
highly active adult contexts. Class 3 was more often produced by unknown/mixed
contexts and other adults. While individual rates of sound production may not be an
accurate measure of sound activity, group rates have proven to be revealing. When
modeled by four social contexts, highly active adults produced rates significantly greater
than any other context, including other adults. However, this is not evident when
analyzed by three social contexts, in which the combination of highly active adults and
other adults does not allow this difference to be revealed. Further studies with four
social contexts should be pursued, especially with larger sample size.

121
V. CONCLUSIONS
This study confirms the sounds classified in previous studies (Dahlheim et al.,
1984; Wisdom, 2000; Ollervides, 2001) with the exception of class 8. Class 8
(Ollervides, 2001) should be reconsidered, as it may be a variation of another class. This
study also supports the creation of class 1 subclasses, 1a and 1b, as visually and aurally
recognizable and statistically significant. Although the remaining classes have been
confirmed, objective and standardized definitions are still not distinct. Future revision of
repertoire classification may replace classes with a continuum of ―type,‖ ranging from
tonal to pulsed (Clark, 1982). Allowing for gradations between these types eliminates
subjective classification leading to inconsistencies among studies. ―Complex‖ signals,
as defined for this study‘s purposes, were often mixed ―hybrid‖ forms or simply lacking
stereotype. These signals, generally classes 5 through 11, were more likely to be used in
contexts that include a calf. Such signals may be ―anomaly‖ or ―precursor‖ sounds
produced by calves; further study will reveal if this is evidence of learning or maturation
(Locke, 1990; McCowan and Reiss, 1997; Doupe and Kuhl, 1999; Janik and Slater,
2000).
Differences in repertoire of baleen whales may be a result of species-specific
adaptations to their particular social and sexual systems; specifically, complexity of
repertoire may be a direct reflection of social and sexual complexity. Gray whales do not
appear to demonstrate the social complexity of humpbacks (Jones and Swartz, 2002);
nor does the gray whale repertoire demonstrate the complexity of the humpback‘s
repertoire. Most notably, the gray whale repertoire lacks songs. The degree of
complexity exhibited by humpbacks during the mating season (Clapham, 1996; Smith et
al., 2008) has not been observed in gray whale aggregations. Similarly, the long,
complicated, predictably patterned, and stereotyped songs (Payne and McVay, 1971;
Winn and Winn, 1978) of the humpback have no match in the gray whale repertoire.
Gray whales demonstrate a promiscuous mating system, and it is likely that sperm
competition occurs (Ralls and Brownell, 1988; Jones and Swartz, 2002), therefore not

122
requiring complex and aggressive male-to-male interactions. It then follows that the
gray whale repertoire would not demonstrate the complexity of sounds and songs
exhibited by humpbacks. Additionally, their repertoire does not include sounds that
parallel or reflect the complexity of some sounds described for the right whales or
bowheads, i.e., the gunshot sound (Clark, 1990). Although a type of sound was termed
―complex‖ for the purposes of this study, this is only relative to other classes of simpler
sounds in the gray whale repertoire; these ―complex‖ sounds still do not appear to reflect
the complexity of some recorded in the mysticete species mentioned above. As a
result, acoustic repertoire may be a reflection of social complexity. Environmental
differences also affect differences in repertoire. Gray whales do not inhabit the thick ice
that bowheads do; it has been proposed that bowheads use their low-frequency calls and
echoes to navigate through ice and around deeply-keeled ice floes (George et al., 1989;
Würsig and Clark, 1993).
This study has revealed the strong possibility of context-specific use for
particular sound classes; additionally, sound parameters and rates of production varied
by social context. This supports the author‘s hypothesis that variations in gray whale
repertoire throughout their range reflect changes in social and behavioral contexts. The
nature and parameters of each sound class have been outlined, including variations that
occur within specific contexts.
Classes 1 through 4, described as croaks and pops, upsweeps, moans and zipper
grunts, were most frequently used; they were 87% of the entire repertoire. In contrast,
classes 5 – 11, which were mostly complex type and lacked stereotype, were only 13%
of repertoire. Class 1 and all pulsed sounds may be essential to highly social contexts in
general, and were used frequently during adult socialization and mating. Class 1 was
also distinctive, with its frequencies generally higher than other sounds commonly used
by adults, such as classes 2, 3, and 4. Its pulsed and variable nature, high frequencies,
and frequent use during social contexts support conclusions in other studies that variable
signals contain subtle or emotional information relevant to close range contexts (Marler,
1977; Ford, 1989; Thomsen et al., 2002; Rehn et al., 2007).

123
Class 2 was a low, simple tonal sound, occasionally with an up-sweep contour.
Data in this study suggest it may be a startle response. Class 3 was also a low, simple
tonal sound, generally stereotyped and discrete. Its structure and low use in most
contexts studied here, contrasting with much higher use on the migration route (Crane
and Lashkari, 1996), indicate it may be a long-distance contact call. Class 4 may be a
precursor to class 1. Class 4 shared a similar pulsed nature with class 1 and there were
observations of ―hybrid‖ occurrences of these two classes in this study and another
(Moore and Ljungblad, 1984). Further, captive calf JJ used class 4 preferentially at a
very young age (Wisdom, 2000). Class 5 and 6 are underwater blows and bubble
blasts. Class 6 may be distinguished by its longer duration, greater high frequency and
greater bandwidth. Class 5 and 6 may both be pronounced breathing due to exertion, or
a disturbance response to boats, as observed in this study, or other threats, as observed in
other mysticetes (Clark, 1983; Tyack and Whitehead, 1983; Würsig et al., 1993). The
few recordings of class 7 provide little indication of its function. It occurred in all social
contexts and in both the presence and absence of boats. A larger sample size and
localization of sound producer will likely clarify the function of this sound. There were
no recordings of class 8. It may have been a variant of an existing class, and its
classification should be reconsidered (Ollervides, 2001). There were very few
recordings of class 9, but its structure and parameters suggest it may be a variant of class
2. Data strongly suggest that class 10 is a disturbance signal, possibly produced by
calves. All occurrences included at least one calf in the presence of boats. Likewise,
class 11 may also be a disturbance response by calves; this study‘s observations cannot
support the suggestion that this is related to baleen-skimming (Ollervides, 2001).
More studies with greater sample size should be pursued, but there are
indications that adult sound rates were twice those of calf-containing contexts and
mixed/unknown contexts. This is not surprising, given the elevated levels of social
behavior that adult aggregations exhibit in the southern wintering lagoons. In contrast,
animals that are milling or feeding or alone, as well as mother and calf groups, have less
need to communicate acoustically. This is not only supported by other gray whale

124
studies (Dahlheim, 1987; Crane and Lashkari, 1996), but also studies of other marine
mammals (Bengtson and Fitzgerald, 1985; D'Vincent et al., 1985; Silber, 1986; Diaz-
López and Shirai, 2009).
Acoustic parameters of each class provide some classification guidelines.
Subclasses 1a and 1b have been distinguished as statistically distinct. Both this study
and Wisdom‘s (2000) found subclass 1b to have greater inter-pulse interval than 1a.
Additionally, there are indications that 1b may have fewer pulses per series, higher
frequencies and greater bandwidth. Classes 10 and 11 were notable; they had several of
the greatest mean frequencies. In general, calf-containing contexts produced sounds at
higher frequencies than adults; this is to be expected if the gray whale sound mechanism
is related to body and tracheal length (Wallschläger, 1980; Ryan and Brenowitz, 1985;
Tubaro and Mahler, 1998). Localization will be necessary to determine if calves alone
are producing sounds at higher frequencies. While frequency variations appear to be
related to body size, increased sound levels, frequency modulation, pulses per series and
repetition rate may be used to convey emotional states and other information (Dahlheim,
1987).
Although this study has taken a step toward determining the functions of gray
whale sounds, there are many more tools to utilize. First, alternative statistical analyses
may produce more revealing results. Requiring 60% of minutes to define the social
context of a session was conservative and may have neglected subtle and frequently
changing social contexts. Analyses that can be more sensitive to shorter durations of
contexts are recommended; Quick and Janik (2008) assigned social context to 2-minute
sections, as determined by the activity of at least half the group. Such a method may be
less likely to marginalize short-term contexts.
Secondly, there are several alternative techniques that may facilitate more
objective classification of sounds. Use of multiple uninformed observers has been
successful in creating similar classes (Janik, 1999). Other analyses that may be
successful are the use of other acoustic variables (Crane and Lashkari, 1996) and
spectrographic cross-correlation (Boisseau, 2005). Multivariate techniques such as

125
principal components analysis (PCA) and discriminant function analysis (DFA) could
determine which parameters contribute to call variability (Clark, 1982; Boisseau, 2005;
Nemiroff and Whitehead, 2009). Finally, automatic classification methods such as
hierarchal average linkage clustering may prove moderately useful for gray whale
sounds (Janik, 1999; Nemiroff and Whitehead, 2009).
Perhaps most important, a major leap in the study of gray whale repertoire will
be provided by localization of sound producers, as already suggested by Wisdom (2000).
Localization requires more equipment and effort, but identifying producers of sound
classes will allow for a more accurate prediction of function. Focal females likely
produce screams in SAGs of North Atlantic right whales (Parks and Tyack, 2005). In
social and sexual aggregations of gray whales, it would be advantageous to determine if
aggressive males or the pursued females produce knocks. Additionally, in this study it is
proposed that rarer sounds of classes 5-11 may be precursors to adult repertoire or
specific to mother/calf relationship; this uncertainty will be resolved when it is
determined who is producing which sounds. There will be more clarity in repertoire use
and better interpretation of function when studies can localize and identify individuals,
or at least age and sex classes.
Autonomous recorders, such as sonobuoys and bottom-mounted recorders,
provide continuous recordings for much greater durations than boat-based field work
(Moore et al., 2010). Further, autonomous recorders are a non-invasive method for
detection and monitoring of a population. Automatic detection methods may facilitate
handling large quantities of data (Mouy et al., 2009). While automatic detection is
possible for gray whale sounds, such techniques may be limited to class 1 and possibly
classes 2 and 3. Automatic detection is generally successful with repetitive pulsed
sounds and stereotyped, loud tonal sounds (Mellinger and Clark, 1997). The remaining
gray whale classes may exhibit too much variation in parameters.
Playback experimentation is another tool that could produce revealing results
about sound use. Playback experiments revealed that southern right whales respond
preferentially to sounds of conspecifics (Clark and Clark, 1980). Humpback whales in

126
various social contexts were observed to have significantly different responses to song or
social sounds of conspecifics (Tyack, 1983). To date, playback experiments with gray
whales have been limited to the use of killer whale calls to observe the response of
migrating animals (Cummings and Thompson, 1971a). If classes of gray whale sounds
have distinct functions, it would be expected that each sound class would produce
distinct responses, as observed in humpbacks.
Although radio tracking has provided some limited insight into movements of
gray whales (Norris et al., 1977), a new generation of tags allows researchers to
understand the environment from an animal‘s perspective, and has more recently been a
powerful tool to associate behaviors and movements with sound production (Oleson et
al., 2007; Johnson et al., 2009).
There is also a need for more studies in other parts of the gray whale range,
especially migration route and northern feeding grounds. It may be advantageous to
conduct a comprehensive study that extends throughout the range with consistent
recording and analysis methods. Such a study would provide confirmation of repertoire
and allow for clear comparison of repertoire use on temporal and geographic scales.
Most needed, however, is a thorough acoustic study of the western gray whale
population, which has not yet been conducted. An evaluation of both western and
eastern population repertoires may reveal regional differences. These populations have
been determined to be genetically differentiated (LeDuc et al., 2002), and therefore
population dialects may be observed. Blue whale songs have distinct types that vary by
region (McDonald et al., 2006), and humpbacks have regional dialects as well (Winn et
al., 1981; Payne and Guinee, 1983).
The various recommended methodologies for future studies will further elucidate
the functions of gray whale sounds. Obtaining similar results, despite diverse methods
and analyses, reinforces the validity of these conclusions. Such metareplication will
reduce biases and errors may cancel each other out (Johnson, 2002).
The intent of this study was to investigate gray whale sound production in
various social contexts. It is evident that improvements in the classification system of

127
the gray whale sounds should be utilized. The results of this study also indicate that
sound use is differentiated by social context. Correlations between various social
contexts and use of sound classes, parameter variations, and rates of sound production
will allow acoustics to be an indicator of presence of particular social groups, seasonal
movements, and social patterns. Additionally, this study has taken a preliminary step in
elucidating functions of sounds. Improved understanding of the sound production of
marine mammals is necessary for human co-existence with and protection of marine
mammals. This is especially critical for gray whales, which are the most coastal of
baleen whales. As a result, human activities such as commercial and recreational
boating, whale watching, and industries such as salt works, are frequently present in the
gray whale‘s range. It is highly recommended that future studies determine if
anthropogenic noise mask or interfere with gray whale sounds that are important to their
communication.

128
REFERENCES
Amante, C. and Eakins, B. W. (2009). "ETOPO1 1 Arc-minute global relief model:
Procedures, data sources and analysis." NOAA Technical Memorandum NESDIS
NGDC-24, 2009.
Bengtson, J. L. and Fitzgerald, S. M. (1985). "Potential role of vocalizations in West
Indian manatees," J. Mammal. 66, 816-819.
Bérubé, M., Aguilar, A., Dendanto, D., Larsen, F., Di Sciara, G. N., Sears, R.,
Sigurjonsson, J., Urban-R, J. and Palsboll, P. J. (1998). "Population genetic
structure of North Atlantic, Mediterranean Sea and Sea of Cortez fin whales,
Balaenoptera physalus (Linnaeus 1758): Analysis of mitochondrial and nuclear
loci," Mol. Ecol. 7, 585-599.
Bogoslovskaya, L. S., Votrogov, L. M. and Semenova, T. N. (1981). "Feeding habits of
the gray whale off Chukotka," Rep. Int. Whal. Commn. 31, 507 - 510.
Bogoslovskaya, L. S., Votrogov, L. M. and Semenova, T. N. (1982). "Distribution and
feeding of gray whales off Chukotka in the summer and autumn of 1980," Rep.
Int. Whal. Commn.385-389.
Boisseau, O. (2005). "Quantifying the acoustic repertoire of a population: The
vocalizations of free-ranging bottlenose dolphins in Fiordland, New Zealand," J.
Acoust. Soc. Am. 117, 2318-2329.
Bradford, A. L., Weller, D. W., Wade, P. R., Burdin, A. M. and Robert L. Brownell, J.
(2008). "Population abundance and growth rate of western gray whales
Eschrichtius robustus," Endang. Species Res. 6, 1-14.
Brenowitz, E. A. (1982a). "The active space of red-winged blackbird song," J. Comp.
Physiol. 147, 511-522.
Brenowitz, E. A. (1982b). "Long-range communication of species identity by song in the
red-winged blackbird," Behav. Ecol. Sociobiol. 10, 29-38.
Caldwell, M. C. and Caldwell, D. K., (1979) "The whistle of the Atlantic bottlenosed
dolphin (Tursiops truncatus)—Ontogeny," in Behavior of Marine Animals:
Current Perspectives in Research, edited by H. E. Winn and B. L. Olla, (Plenum
Press, New York), chapter 11, pp. 369-401.
Caldwell, M. C., Caldwell, D. K. and Tyack, P. L., (1990) "Review of the signature-
whistle hypothesis for the Atlantic bottlenose dolphin," in The Bottlenose

129
Dolphin, edited by S. Leatherwood and R. R. Reeves, (Academic Press, San
Diego), chapter 10, pp. 199-234.
Cerchio, S., Jaconsen, J. K. and Norris, T. F. (2001). "Temporal and geographical
variation in songs of humpback whales, Megaptera novaeangliae: Synchronous
change in Hawaiian and Mexican breeding assemblages," Anim. Behav. 62, 313-
329.
Chabot, D. (1988). "A quantitative technique to compare and classify humpback whale
(Megaptera novaeangliae) sounds," Ethology 77, 89-102.
Charif, R., Clark, C. and Fristrup, K. (2004). Raven 1.2 User's Manual (Cornell
Laboratory of Ornithology, Ithaca).
Clapham, P. J. (1996). "The social and reproductive biology of humpback whales: An
ecological perspective," Mamm. Rev. 26, 27 - 49.
Clark, C. W. (1982). "The acoustic repertoire of the Southern right whale, a quantitative
analysis," Anim. Behav. 30, 1060-1071.
Clark, C. W., (1983) "Acoustic communication and behavior of the southern right whale
(Eubalaena australis)," in Communication and Behavior of Whales, edited by R.
Payne, (Westview Press, Inc., Boulder), chapter 5, pp. 163-198.
Clark, C. W., (1990) "Acoustic behavior of mysticetes whales," in Sensory Abilities of
Cetaceans, edited by J. Thomas and R. Kastelein, (Plenum Press, New York), pp.
571-583.
Clark, C. W., Borsani, J. F. and Notarbartolo-di-Sciara, G. (2002). "Vocal activity of fin
whales, Balaenoptera physalus, in the Ligurian Sea," Mar. Mamm. Sci. 18, 286-
295.
Clark, C. W. and Clapham, P. J. (2004). "Acoustic monitoring on a humpback whale
(Megaptera novaeangliae) feeding ground shows continual singing into late
spring," Proc. R. Soc. Lond., Ser. B: Biol. Sci. 271, 1051-1057.
Clark, C. W. and Clark, J. M. (1980). "Sound playback experiments with Southern right
whales (Eubalaena australis)," Science 207, 663-665.
Clark, C. W. and Ellison, W. T. (2000). "Calibration and comparison of the acoustic
location methods used during the spring migration of the bowhead whale,
Balaena mysticetus, off Pt. Barrow, Alaska, 1984–1993," J. Acoust. Soc. Am.
107, 3509-3517.

130
Clark, C. W. and Johnson, J. H. (1984). "The sounds of the bowhead whale, Balaena
mysticetus, during the spring migrations of 1979 and 1980," Can. J. Zool.-Rev.
Can. Zool. 62, 1436-1441.
Crane, N. L. and Lashkari, K. (1996). "Sound production of gray whales, Eschrichtius
robustus, along their migration route: A new approach to signal analysis," J.
Acoust. Soc. Am. 100, 1878-1886.
Croll, D. A., Clark, C. W., Acevedo, A., Tershy, B., Flores, S., Gedamke, J. and Urban,
J. (2002). "Only male fin whales sing loud songs," Nature 417, 809-809.
Cummings, W. C. and Holliday, D. V. (1987). "Sounds and source levels from bowhead
whales off Point Barrow, Alaska," J. Acoust. Soc. Am. 82, 814-821.
Cummings, W. C. and Thompson, P. O. (1971a). "Gray whales, Eschrichtius robustus,
avoid underwater sounds of killer whales, Orcinus Orca," Fish. Bull. 69, 525-
530.
Cummings, W. C. and Thompson, P. O. (1971b). "Underwater sounds from blue whale,
Balaenoptera musculus," J. Acoust. Soc. Am. 50, 1193-1198.
Cummings, W. C., Thompson, P. O. and Cook, R. (1968). "Underwater sounds of
migrating gray whales Eschrichtius glaucus (Cope)," J. Acoust. Soc. Am. 44,
1278-1281.
D'Vincent, C. G., Nilson, R. M. and Hanna, R. E. (1985). "Vocalization and coordinated
feeding behavior of the humpback whale in southeastern Alaska," Sci. Rep.
Whales Res. Inst. 36, 41-47.
Dahlheim, M. E. (1987). "Bio-acoustics of the gray whale (Eschrichtius robustus),"
Ph.D. dissertation, University of British Columbia, Vancouver, BC.
Dahlheim, M. E., Fisher, H. D. and Schempp, J. D., (1984) "Sound production by the
gray whale and ambient noise levels in Laguna San Ignacio, Baja California Sur,
Mexico," in The Gray Whale, Eschrichtius robustus, edited by M. L. Jones, S. L.
Swartz and S. Leatherwood, (Academic Press, Orlando), chapter 22, pp. 511-541.
Darling, J. D. and Bérubé, M. (2001). "Interactions of singing humpback whales with
other males," Mar. Mamm. Sci. 17, 570-584.
Delarue, J., Todd, S. K., Van Parijs, S. M. and Iorio, L. (2009). "Geographic variation in
Northwest Atlantic fin whale (Balaenoptera physalus) song: Implications for
stock structure assessment," J. Acoust. Soc. Am. 125, 1774-1782.

131
Diaz-López, B. and Shirai, J. A. B., (2009) "Mediterranean common bottlenose dolphin's
repertoire and communication use," in Dolphins: Anatomy, Behavior and
Threats, edited by A. G. Pearce and L. M. Correa, (Nova Science Publishers,
Inc., New York), chapter 5, pp. 129-148.
Doupe, A. J. and Kuhl, P. K. (1999). "Birdsong and human speech: Common themes and
mechanisms," Annu. Rev. Neurosci. 22, 567-631.
Dunlop, R. A., Noad, M. J., Cato, D. H. and Stokes, D. (2007). "The social vocalization
repertoire of east Australian migrating humpback whales (Megaptera
novaeangliae)," J. Acoust. Soc. Am. 122, 2893-2905.
Eriksen, N., Miller, L. A., Tougaard, J. and Helweg, D. A. (2005). "Cultural change in
the songs of humpback whales (Megaptera novaeanglide) from Tonga,"
Behaviour 142, 305-328.
Ferrer-i-Cancho, R. and McCowan, B. (2009). "A law of word meaning in dolphin
whistle types," Entropy 11, 688-701.
Fischer, J. and Hammerschmidt, K. (2002). "An overview of the Barbary macaque,
Macaca sylvanus, vocal repertoire," Folia Primatol. 73, 32-45.
Fish, J. F., Sumich, J. L. and Lingle, G. L. (1974). "Sounds produced by gray whale,
Eschrichtius robustus," Mar. Fish. Rev. 36, 38-45.
Ford, J. K. B. (1989). "Acoustic behavior of resident killer whales (Orcinus orca) off
Vancouver Island, British Columbia," Can. J. Zool.-Rev. Can. Zool. 67, 727-745.
Ford, J. K. B. (2010). Personal communication (Fisheries and Oceans Canada, Nanaimo,
BC).
Frankel, A. S., Clark, C. W., Herman, L. M. and Gabriele, C. M. (1995). "Spatial
distribution, habitat utilization, and social interactions of humpback whales,
Megaptera novaeangliae, off Hawai'i, determined using acoustic and visual
techniques," Can. J. Zool.-Rev. Can. Zool. 73, 1134-1146.
Freeburg, T. M. and Harvey, E. M. (2008). "Group size and social interactions are
associated with calling behavior in Carolina chickadees (Poecile carolinensis),"
J. Comp. Psych. 122, 312 - 318.
Fristrup, K. M., Hatch, L. T. and Clark, C. W. (2003). "Variation in humpback whale
(Megaptera novaeangliae) song length in relation to low-frequency sound
broadcasts," J. Acoust. Soc. Am. 113, 3411-3424.

132
Gedamke, J. and Robinson, S. M. (2010). "Acoustic survey for marine mammal
occurrence and distribution off East Antarctica (30-80 degrees E) in January-
February 2006," Deep Sea Res. (II Top. Stud. Oceanogr.) 57, 968-981.
George, J. C., Clark, C., Carroll, G. M. and Ellison, W. T. (1989). "Observations on the
ice-breaking and ice navigation behavior of migrating bowhead whales (Balaena
mysticetus) near Point Barrow, Alaska, spring 1985," Arctic 42, 24-30.
George, J. C., Zeh, J., Suydam, R. and Clark, C. (2004). "Abundance and population
trend (1978–2001) of western Arctic bowhead whales surveyed near Barrow,
Alaska," Mar. Mamm. Sci. 20, 755-773.
Graham, M. A. and Noonan, M. (2010). "Call types and acoustic features associated
with aggressive chase in the killer whale (Orcinus orca)," Aquat. Mamm. 36, 9-
18.
Gros-Louis, J. (2002). "Contexts and behavioral correlates of trill vocalizations in wild
white-faced capuchin monkeys (Cebus capucinus)," Am. J. Primatol. 57, 189-
202.
Halliday, T., (1983) "Information and communication," in Animal Behaviour Volume 2:
Communication, edited by T. R. Halliday, and J. B. Slater, (W. H. Freeman, New
York), chapter 2, pp. 43-81.
Herzing, D. and Mate, B. R., (1984) "Gray whale (Eschrichtius robustus) migration
along the Oregon coast, 1978–1981," in The Gray Whale, Eschrichtius robustus,
edited by M. L. Jones, S. Leatherwood and S. L. Swartz, (Academic Press,
Orlando), chapter 13, pp. 289-307.
Janik, V. M. (1999). "Pitfalls in the categorization of behaviour: A comparison of
dolphin whistle classification methods," Anim. Behav. 57, 133-143.
Janik, V. M. (2000). "Source levels and the estimated active space of bottlenose dolphin
(Tursiops truncatus) whistles in the Moray Firth, Scotland," J. Comp. Physiol. A
-Neuroethol. Sens. Neural Behav. Physiol. 186, 673-680.
Janik, V. M., Dehnhardt, G. and Todt, D. (1994). "Signature whistle variations in a
bottlenosed dolphin, Tursiops truncatus," Behav. Ecol. Sociobiol. 35, 243-248.
Janik, V. M. and Slater, P. J. B. (1997). "Vocal learning in mammals," Adv. Stud.
Behav. 26, 59-99.
Janik, V. M. and Slater, P. J. B. (2000). "The different roles of social learning in vocal
communication," Anim. Behav. 60, 1-11.

133
Johnson, D. H. (2002). "The importance of replication in wildlife research," J. Wildl.
Manage. 66, 919-932.
Johnson, M., de Soto, N. A. and Madsen, P. T. (2009). "Studying the behaviour and
sensory ecology of marine mammals using acoustic recording tags: a review,"
Mar. Ecol.-Prog. Ser. 395, 55-73.
Jones, M. L. and Swartz, S. L., (1984) "Demography and phenology of gray whales and
evaluation of whale-watching activities in Laguna San Ignacio, Baja California
Sur, Mexico," in The Gray Whale, Eschrichtius robustus, edited by M. L. Jones,
S. L. Swartz and S. Leatherwood, (Academic Press, Inc., Orlando), chapter 14,
pp. 309-374.
Jones, M. L. and Swartz, S. L., (2002) "Gray whale, Eschrichtius robustus," in
Encyclopedia of Marine Mammals, edited by W. F. Perrin, B. Würsig and J. G.
M. Thewissen, (Academic Press, San Diego), pp. 524-536.
Kent, R. D. and Bauer, H. R. (1985). "Vocalizations of one-year-olds," J. Child Lang.
12, 491-526.
Kunc, H. P. and Wolf, J. B. W. (2008). "Seasonal changes of vocal rates and their
relation to territorial status in male Galapagos sea lions (Zalophus wollebaeki),"
Ethology 114, 381-388.
LeDuc, R. G., Weller, D. W., Hyde, J., Burdin, A. M., Rosel, P. E., R.L. Brownell, J.,
Würsig, B. and Dizon, A. E. (2002). "Genetic differences between western and
eastern gray whales (Eschrichtius robustus)," J. Cetacean Res. Manage. 4, 1-5.
Locke, J. L. (1990). "Structure and stimulation in the ontogeny of spoken language,"
Dev. Psychobiol. 23, 621-643.
Mager, J. N., Walcott, C. and Piper, W. H. (2006). "Male common loons, Gavia immer,
communicate body mass and condition through dominant frequencies of
territorial yodels," Anim. Behav. 73, 683-690.
Marler, P. (1967). "Animal communication signals," Science 157, 769-774.
Marler, P., (1977) "The evolution of communication," in How Animals Communicate,
edited by T. A. Sebeok, (Indiana University Press, Bloomington), chapter 4, pp.
45-70.
Marsh, R. L. and Taigen, T. L. (1987). "Properties enchancing aerobic capacity of
calling muscles in gray tree frogs (Hyla versicolor)," Am. J. Physiol. Regul.
Integr. Comp. Physiol. 252, R786-R793.

134
Matthews, J. N., Brown, S., Gillespie, D., Johnson, M., McLanaghan, R., Nowacek, A.
M. D., Leaper, R., Lewis, T. and Tyack, P. (2001). "Vocalisation rates of the
North Atlantic right whale (Eubalaena glacialis)," J. Cetacean Res. Manage. 3,
271-282.
Matthews, J. N., Rendell, L. E., Gordon, J. C. D. and Macdonald, D. W. (1999). "A
review of frequency and time parameters of cetacean tonal calls," Bioacoustics
10, 47-71.
McCowan, B. and Reiss, D., (1997) "Vocal learning in captive bottlenose dolphins: A
comparison with humans and nonhuman animals," in Social Influences on Vocal
Development, edited by C. T. Snowdon and M. Hausberger, (Cambridge
University Press, Cambridge), chapter 10, pp. 178-207.
McDonald, M. A. and Fox, C. G. (1999). "Passive acoustic methods for fin whale
population density estimation," J. Acoust. Soc. Am. 105, 2643-2651.
McDonald, M. A., Mesnick, S. L. and Hildebrand, J. A. (2006). "Biogeographic
characterisation of blue whale song worldwide: using song to identifiy
populations," J. Cetacean Res. Manage. 8, 55-65.
Mellinger, D. K. and Clark, C. W. (1997). "Methods for automatic detection of mysticete
sounds," Mar. Freshwat. Behav. Physiol. 29, 163-181.
Mellinger, D. K. and Clark, C. W. (2003). "Blue whale (Balaenoptera musculus) sounds
from the North Atlantic," J. Acoust. Soc. Am. 114, 1108-1119.
Miksis-Olds, J. L. and Tyack, P. L. (2009). "Manatee (Trichechus manatus) vocalization
usage in relation to environmental noise levels," J. Acoust. Soc. Am. 125, 1806-
1815.
Miller, P. J. and Tyack, P. L. (1998). "A small towed beamforming array to identify
vocalizing resident killer whales (Orcinus orca) concurrent with focal behavioral
observations," Deep Sea Res. (II Top. Stud. Oceanogr.) 45, 1389-1405.
Miller, P. J. O. (2006). "Diversity in sound pressure levels and estimated active space of
resident killer whale vocalizations," J. Comp. Physiol. A -Neuroethol. Sens.
Neural Behav. Physiol. 192, 449-459.
Miller, P. J. O. and Bain, D. E. (2000). "Within-pod variation in the sound production of
a pod of killer whales, Orcinus orca," Anim. Behav. 60, 617-628.
Miller, P. J. O., Shapiro, A. D., Tyack, P. L. and Solow, A. R. (2004). "Call-type
matching in vocal exchanges of free-ranging resident killer whales, Orcinus
orca," Anim. Behav. 67, 1099-1107.

135
Moore, S. E. and Ljungblad, D. K., (1984) "Gray whales in the Beaufort, Chukchi and
Bering Seas: distribution and sound production," in The Gray Whale,
Eschrichtius robustus, edited by M. L. Jones, S. L. Swartz and S. Leatherwood,
(Academic Press, Inc., Orlando, FL), chapter 23, pp. 543-559.
Moore, S. E., Stafford, K. M., Mellinger, D. K. and Hildebrand, J. A. (2006). "Listening
for large whales in the offshore waters of Alaska," Bioscience 56, 49-55.
Moore, S. E., Stafford, K. M. and Munger, L. M. (2010). "Acoustic and visual surveys
for bowhead whales in the western Beaufort and far northeastern Chukchi seas,"
Deep Sea Res. (II Top. Stud. Oceanogr.) 57, 153-157.
Morton, E. S. (1975). " Ecological sources of selection on avian sounds," Am. Nat. 109,
17-34.
Mouy, X., Bahoura, M. and Simard, Y. (2009). "Automatic recognition of fin and blue
whale calls for real-time monitoring in the St. Lawrence," J. Acoust. Soc. Am.
126, 2918-2928.
Murray, S. O., Mercado, E. and Roitblat, H. L. (1998). "Characterizing the graded
structure of false killer whale (Pseudorca crassidens) vocalizations," J. Acoust.
Soc. Am. 104, 1679-1688.
Nemiroff, L. and Whitehead, H. (2009). "Structural characteristics of pulsed calls of
long-finned pilot whales Globicephala melas," Bioacoustics 19, 67-92.
Norris, K. S., Goodman, R. M., Villa-Ramirez, B. and Hobbs, L. (1977). "Behavior of
California gray whale, Eschrichtius robustus, in southern Baja California,
Mexico," Fish. Bull. 75, 159-172.
Norris, K. S., Villa-Ramirez, B., Nichols, G., Würsig, B. and Miller, K., (1983) "Lagoon
entrance and other aggregations of gray whales (Eschrichtius robustus)," in
Behavior and Communication of Whales, edited by R. Payne, (Westview Press,
Boulder, CO), chapter 8, pp. 259-293.
Oleson, E. M., Calambokidis, J., Burgess, W. C., McDonald, M. A., LeDuc, C. A. and
Hildebrand, J. A. (2007). "Behavioral context of call production by eastern North
Pacific blue whales," Mar. Ecol. Prog. Ser. 330, 269 - 284.
Ollervides, F. J. (2001). "Gray whales and boat traffic: Movement, vocal, and behavioral
responses in Bahia Magdalena, Mexico," Ph.D. dissertation, Texas A&M
University, College Station, TX.
Palsboll, P. J., Bérubé, M., Aguilar, A., Notarbartolo-Di-Sciara, G. and Nielsen, R.
(2004). "Discerning between recurrent gene flow and recent divergence under a

136
finite-site mutation model applied to North Atlantic and Mediterranean Sea fin
whale (Balaenoptera physalus) populations," Evolution 58, 670-675.
Parks, S. E. (2003). "Response of North Atlantic right whales (Eubalaena glacialis) to
playback of calls recorded from surface active groups in both the North and
South Atlantic," Mar. Mamm. Sci. 19, 563-580.
Parks, S. E. and Tyack, P. L. (2005). "Sound production by North Atlantic right whales
(Eubalaena glacialis) in surface active groups," J. Acoust. Soc. Am. 117, 3297-
3306.
Payne, R. and Webb, D. (1971). "Orientation by means of long range acoustic signaling
in baleen whales," Ann. N. Y. Acad. Sci. 188, 110-141.
Payne, R. S. and Guinee, L. N., (1983) "Humpback whales songs as an indicator of
'stocks'," in Communication and Behavior of Whales, edited by R. Payne,
(Westview Press Inc, Boulder, CO), chapter 10, pp. 333-358.
Payne, R. S. and McVay, S. (1971). "Songs of humpback whales," Science 173, 585-
597.
Pérez-Cortés, H., Urbán R, J. and Loreto C., P. (2004). "A note on gray whale
distribution and abundance in the Magdalena Bay Complex, Mexico during the
1997 winter season," J. Cetacean Res. Manage. 6, 133-138.
Peters, G. and Tonkin-Leyhausen, B. A. (1999). "Evolution of acoustic communication
signals of mammals: Friendly close-range vocalizations in Felidae (Carnivora),"
J. Mamm. Evol. 6, 129-159.
Petrochenko, S. P., Potopov, A. S. and Pryadko, V. V. (1991). "Sounds, source levels,
and behavior of gray whales in the Chukotskoe Sea," Sov. Phys. Acoust. 37,
1189-1193.
Quick, N. J. and Janik, V. M. (2008). "Whistle rates of wild bottlenose dolphins
(Tursiops truncatus): Influences of group size and behavior," J. Comp. Psych.
122, 305-311.
Raftery, A. E. and Zeh, J. E. (1998). "Estimating bowhead whale population size and
rate of increase from the 1993 census," J. Amer. Statistical Assoc. 93, 451-463.
Ralls, K. and Brownell, R. L. (1988). "Sperm competition in grey whales," Nature 336,
116-117.

137
Rehn, N., Telchert, S. and Thomsen, F. (2007). "Structural and temporal emission
patterns of variable pulsed calls in free-ranging killer whales (Orcinus orca),"
Behaviour 144, 307-329.
Reidenberg, J. S. and Laitman, J. T. (2007). "Discovery of a low frequency sound source
in mysticeti (Baleen whales): Anatomical establishment of a vocal fold
homolog," Anat. Rec. 290, 745-759.
Reilly, S. B., Rice, D. W. and Wolman, A. A. (1983). "Population assessment of the gray
whale, Eschrichtius robustus, from California shore censuses, 1967–80," Fish.
Bull. 81, 267-281.
Rice, D. W. and Wolman, A. A. (1971). The Life History and Ecology of the Gray Whale
(Eschrichtius robustus) (American Society of Mammalogists, Stillwater,
Oklahoma).
Richardson, W. J., Finley, K. J., Miller, G. W., Davis, R. A. and Koski, W. R. (1995).
"Feeding, social and migration behavior of bowhead whales, Balaena mysticetus,
in Baffin Bay vs. the Beaufort Sea: Regions with different amounts of human
activity," Mar. Mamm. Sci. 11, 1-45.
Risch, D. (2010). Personal communication (NOAA/NMFS/NEFSC, Woods Hole, MA).
Robbins, R. L. (2000). "Vocal communication in free-ranging African wild dogs
(Lycaon pictus)," Behaviour 137, 1271-1298.
Ryan, M. J. and Brenowitz, E. A. (1985). "The role of body size, phylogeny, and
ambient noise in the evolution of bird song," Am. Nat. 126, 87-100.
Sebe, F., Aubin, T., Boue, A. and Poindron, P. (2008). "Mother-young vocal
communication and acoustic recognition promote preferential nursing in sheep,"
J. Exp. Biol. 211, 3554-3562.
Silber, G. K. (1986). " The relationship of social vocalizations to surface behavior and
aggression in the Hawaiian humpback whale (Megaptera novaeangliae)," Can. J.
Zool.-Rev. Can. Zool. 64, 2075-2080.
Simard, P., Hibbard, A. L., McCallister, K. A., Frankel, A. S., Zeddies, D. G., Sisson, G.
M., Gowans, S., Forys, E. A. and Mann, D. A. (2010). "Depth dependent
variation of the echolocation pulse rate of bottlenose dolphins (Tursiops
truncatus)," J. Acoust. Soc. Am. 127, 568-578.
Smith, J. N., Goldizen, A. W., Dunlop, R. A. and Noad, M. J. (2008). "Songs of male
humpback whales, Megaptera novaeangliae, are involved in intersexual
interactions," Anim. Behav. 76, 467-477.

138
Sousa-Lima, R. S., Paglia, A. P. and Fonseca, G. A. B. D. (2002). "Signature
information and individual recognition in the isolation calls of Amazonian
manatees, Trichechus inunguis (Mammalia: Sirenia)," Anim. Behav. 63, 301-
310.
Stafford, K., Moore, S. E., Laidre, K. L. and Heide-Jorgensen, M. P. (2008). "Bowhead
whale springtime song off West Greenland," J. Acoust. Soc. Am. 124, 3315-
3323.
Stafford, K. M., Mellinger, D. K., Moore, S. E. and Fox, C. G. (2007a). "Seasonal
variability and detection range modeling of baleen whale calls in the Gulf of
Alaska, 1999–2002," J. Acoust. Soc. Am. 122, 3378-3390.
Stafford, K. M., Moore, S. E., Spillane, M. and Wiggins, S. (2007b). "Gray whale calls
recorded near Barrow, Alaska, throughout the winter of 2003–04," Arctic 60,
167-172.
Swartz, S. L., Taylor, B. L. and Rugh, D. J. (2006). "Gray whale Eschrichtius robustus
population and stock identity," Mamm. Rev. 36, 66 - 84.
Taruski, A. G., (1979) "The whistle repertoire of the north Atlantic pilot whale
(Globicephala melaena) and its relationship to behavior and environment," in
Behavior of Marine Animals: Cetaceans, edited by H. E. Winn and B. L. Olla,
(Plenum Press, New York), chapter 10, pp. 345-368.
Tervo, O. M., Parks, S. E. and Miller, L. A. (2009). "Seasonal changes in the vocal
behavior of bowhead whales (Balaena mysticetus) in Disko Bay, Western-
Greenland," J. Acoust. Soc. Am. 126, 1570-1580.
Thompson, P. O., Findley, L. T. and Vidal, O. (1992). "20-Hz pulses and other
vocalizations of fin whales, Balaenoptera physalus, in the Gulf of California,
Mexico," J. Acoust. Soc. Am. 92, 3051-3057.
Thompson, T. J., Winn, H. E. and Perkins, P. J., (1979) "Mysticete sounds," in Behavior
of Marine Animals: Current Perspectives in Research, edited by H. E. Winn and
B. L. Olla, (Plenum Press, New York), chapter 12, pp. 403-431.
Thomsen, F., Franck, D. and Ford, J. K. B. (2002). "On the communicative significance
of whistles in wild killer whales (Orcinus orca)," Naturwissenschaften 89, 404-
407.
Tubaro, P. L. and Mahler, B. (1998). "Acoustic frequencies and body mass in New
World doves," Condor 100, 54-61.

139
Tyack, P. (1983). "Differential response of humpback whales, Megaptera novaeangliae,
to playback of song or social sounds," Behav. Ecol. Sociobiol. 13, 49-55.
Tyack, P. and Whitehead, H. (1983). "Male competition in large groups of wintering
humpback whales," Behaviour 83, 132-154.
Tyack, P. L., (2000) "Functional aspects of cetacean communication," in Cetacean
Societies: Field Studies of Dolphins and Whales, edited by J. Mann, R. C.
Connor, P. L. Tyack and H. Whitehead, (The University of Chicago Press,
Chicago), chapter 11, pp. 270-307.
VanOpzeeland, I. C., Corkeron, P. J., Risch, D., Stenson, G. and Parijs, S. M. V. (2009).
"Geographic variation in vocalizations of pups and mother-pup behavior of harp
seals Pagophilus groenlandicus," Aqua. Biol. 6, 109-120.
Wallschläger, D. (1980). "Correlation of song frequency and body weight in passerine
birds," Experientia 36, 412-412.
Waser, P. M. and Waser, M. S. (1977). "Experimental studies of primate vocalizations:
Specializations for long-distance propagation," Z. Tierpsychol. 43, 239-263.
Weller, D. W., A. M. Burdin, B. Würsig, B. L. Taylor and R. L. Brownell, Jr. (2002).
"The western gray whale: A review of past exploits, current status and potential
threats," J. Cetacean Res. Manage. 4, 7-12.
Winn, H. E., Thompson, T. J., Cummings, W. C., Hain, J., Hudnall, J., Hays, H. and
Steiner, W. W. (1981). "Song of the humpback whale: Population comparisons,"
Behav. Ecol. Sociobiol. 8, 41-46.
Winn, H. E. and Winn, L. K. (1978). "Song of humpback whale Megaptera
novaeangliae in West Indies," Mar. Biol. 47, 97-114.
Wisdom, S. (2000). "Development of sound production in the gray whale (Eschrichtius
robustus)," MS thesis, University of San Diego, San Diego, CA.
Wisdom, S., Bowles, A. E. and Anderson, K. E. (2001). "Development of behavior and
sound repertoire of a rehabilitating gray whale calf," Aquat. Mamm. 27, 239-255.
Würsig, B. and Clark, C., (1993) "Behavior," in The Bowhead Whale, edited by J. J.
Burns, J. J. Montague and C. J. Cowles, (Society for Marine Mammalogy,
Lawrence, KS), chapter 5, pp. 157-199.
Würsig, B., Guerrero, J. and Silber, G. K. (1993). "Social and sexual behavior of
bowhead whales in fall in the Western Arctic: A reexamination of seasonal
trends," Mar. Mamm. Sci. 9, 103-110.

140
Würsig, B., Wells, R. S. and Croll, D. A. (1986). "Behavior of gray whales summering
near St. Lawrence Island, Bering Sea," Can. J. Zool.-Rev. Can. Zool. 64, 611-
621.
Yurk, H., Barrett-Lennard, L., Ford, J. K. B. and Matkin, C. O. (2002). "Cultural
transmission within maternal lineages: Vocal clans in resident killer whales in
southern Alaska," Anim. Behav. 63, 1103-1119.

141
APPENDIX A
PARAMETER VARIATIONS BETWEEN CLASS 1 SUBCLASSES
Although not significant at p=0.05, duration (of entire sound) of 1b tended to be
greater than that of 1a (F=3.77, p=0.0672) (Figure A-1). Low frequency (Figure A-2),
maximum frequency (Figure A-3) and number of pulses (Figure A-4) did not vary
significantly.
Pre
dic
ted
Du
ratio
n (
se
c)
0.0
0.2
0.4
0.6
0.8
1.0
1.2
Class 1 Subclass
1a 1b
Duration by Class 1 Subclass
PLOT 1a 1b Figure A-1. Plot of predicted duration by class 1 subclass. Based on linear regression;
central line (-) represents median, dot represents predicted mean; whiskers include 95%
confidence limit.

142
Pre
dic
ted
Lo
w F
req
ue
ncy (
Hz)
0
10
20
30
40
50
60
70
80
90
100
Class 1 Subclass
1a 1b
Low Frequency by Class 1 Subclass
PLOT 1a 1b Figure A-2. Plot of predicted low frequency by class 1 subclass. Based on linear
regression; central line (-) represents median, dot represents predicted mean; whiskers
include 95% confidence limit.
Pre
dic
ted
Ma
xim
um
Fre
qu
en
cy (
Hz)
0
50
100
150
200
250
300
350
400
450
Class 1 Subclass
1a 1b
Maximum Frequency by Class 1 Subclass
PLOT 1a 1b Figure A-3. Plot of predicted maximum frequency by class 1 subclass. Based on linear
regression; central line (-) represents median, dot represents predicted mean; whiskers
include 95% confidence limit.

143
P
red
icte
d N
um
be
r o
f P
uls
es
0
1
2
3
4
5
6
Class 1 Subclass
1a 1b
Number of Pulses by Class 1 Subclass (LOG)
PLOT 1a 1b Figure A-4. Plot of predicted number of pulses by class 1 subclass. Based on linear
regression; central line (-) represents median, dot represents predicted mean; whiskers
include 95% confidence limit.

144
Individual pulse low frequency (Figure A-5), maximum frequency (Figure A-6)
and duration (Figure A-7) were not found to be significantly different between the two
subclasses.
Pre
dic
ted
Lo
w F
req
ue
ncy (
Hz)
0
25
50
75
100
125
150
Class 1 Subclass
1a 1b
Individual Pulse Low Frequency by Class 1 Subclass
PLOT 1a 1b Figure A-5. Plot of predicted individual pulse low frequency by class 1 subclass. Based
on linear regression; central line (-) represents median, dot represents predicted mean;
whiskers include 95% confidence limit.

145
P
red
icte
d M
axim
um
Fre
qu
en
cy (
Hz)
0
50
100
150
200
250
300
350
400
Class 1 Subclass
1a 1b
Individual Pulse Maximum Frequency by Class 1 Subclass
PLOT 1a 1b Figure A-6. Plot of predicted individual pulse maximum frequency by class 1 subclass.
Based on linear regression; central line (-) represents median, dot represents predicted
mean; whiskers include 95% confidence limit.
Pre
dic
ted
Du
ratio
n (
se
c)
0.00
0.01
0.02
0.03
0.04
0.05
0.06
0.07
0.08
0.09
0.10
Class 1 Subclass
1a 1b
Individual Pulse Duration by Class 1 Subclass
PLOT 1a 1b
Figure A-7. Plot of predicted individual pulse duration by class 1 subclass. Based on
linear regression; central line (-) represents median, dot represents predicted mean;
whiskers include 95% confidence limit.

146
APPENDIX B
CLASS 1 SUBCLASS VARIATIONS BY SOCIAL CLASS
There were no significant differences found in duration between class 1
subclasses or social context (Figure B-1).
Pre
dic
ted
Du
ratio
n (
se
c)
0.5
0.6
0.7
0.8
0.9
1.0
1.1
1.2
1.3
Social Context
All Adults Mixed/Unknown Calf Present
Duration by Social Context & Class 1 Subclass
PLOT 1a 1b Figure B-1. Plot of predicted duration by subclass and social context. Based on linear
regression; central line (-) represents median, dot represents predicted mean; whiskers
include 95% confidence limit.

147
While not significant at p=0.05, the interaction term (F=3.45, p=0.0526) and
social context (F=3.02, p=0.0724) of individual pulse maximum frequency did exhibit
trends towards significant differences (Figure B-2). In regression contrast test, means
indicate trend towards mixed/unknown groups having a greater mean maximum
frequency than adults (F=3.73, p=0.0685). There were not significant differences in
subclasses. Individual pulse maximum frequencies were square root transformed.
Pre
dic
ted
Ma
xim
um
Fre
qu
en
cy (
Hz)
200
300
400
500
600
700
800
900
Social Context
All Adults Mixed/Unknown Calf Present
Individual Pulse Maximum Frequency by Social Context & Class 1 Subclass
PLOT 1a 1b Figure B-2. Plot of predicted individual pulse maximum frequency by subclass and
social context. Based on linear regression; central line (-) represents median, dot
represents predicted mean; whiskers include 95% confidence limit.

148
Individual pulse duration was not significantly different in interaction, social
context or subclass (Figure B-3). Although not significant at p=0.05, a trend indicates
adults may have greater durations of both subclasses than those of mixed/unknown
groups (F=3.62, p=0.0725).
Pre
dic
ted
Du
ratio
n / D
elta
Tim
e (
se
c)
0.052
0.054
0.056
0.058
0.060
0.062
0.064
0.066
0.068
0.070
0.072
0.074
0.076
0.078
0.080
0.082
0.084
0.086
0.088
0.090
Social Context
All Adults Mixed/Unknown Calf Present
Individual Pulse Duration by Social Context & Class 1 Subclass
PLOT 1a 1b Figure B-3. Plot of predicted individual pulse duration by subclass and social context.
Based on linear regression; central line (-) represents median, dot represents predicted
mean; whiskers include 95% confidence limit.

149
APPENDIX C
RELATIVE USE OF CLASSES
There were no significant differences in use of class 2 by three social groups
(Figure C-1). Probability of use for all groups was low.
Pro
ba
bili
ty o
f u
se
0.0
0.1
0.2
0.3
0.4
0.5
0.6
0.7
0.8
0.9
1.0
Social Context
Adults Mixed/Unknown Calf Present
Use of Class 2 by Social Context
Figure C-1. Plot of predicted use of class 2 by social context. Based on logistic
regression; central line (-) represents median, dot represents predicted mean; whiskers
include 95% confidence limit.

150
Unknown/mixed groups had slightly greater probabilities of using class 3, but
there were no significant differences (Figure C-2).
Pro
ba
bili
ty o
f u
se
0.0
0.1
0.2
0.3
0.4
0.5
0.6
0.7
0.8
0.9
1.0
Social Context
Adults Mixed/Unknown Calf Present
Use of Class 3 by Social Context
Figure C-2. Plot of predicted use of class 3 by social context. Based on logistic
regression; central line (-) represents median, dot represents predicted mean; whiskers
include 95% confidence limit.

151
There were no significant differences in probability use of class 7 (n=14) among
social groups (Figure C-3). Probability of use was low for all social groups. There were
eight occurrences of class 7 in adult groups; there were only four occurrences in calf-
containing groups and two occurrences in mixed groups.
Pro
ba
bili
ty o
f u
se
0.0
0.1
0.2
0.3
0.4
0.5
0.6
0.7
0.8
0.9
1.0
Social Context
Adults Mixed/Unknown Calf Present
Use of Class 7 by Social Context
Figure C-3. Plot of predicted use of class 7 by social context. Based on logistic
regression; central line (-) represents median, dot represents predicted mean; whiskers
include 95% confidence limit.

152
While adults used subclass 1b slightly more frequently than other groups, the
overall model detected no significant differences among groups (Wald chi-square=5.22,
p=0.0733) (Figure C-4). However, adults had significantly greater probability of using
subclass 1b than calf-containing groups (Wald chi-square=5.22, p=0.0223).
Additionally, although not significant at p=0.05, it appears adults may use 1b more often
than mixed/unknown groups (Wald-chi square=3.46, p=0.0627).
Pro
ba
bili
ty o
f u
se
0.0
0.1
0.2
0.3
0.4
0.5
0.6
0.7
0.8
0.9
1.0
Social Context
All Adults Mixed/Unknown Calf Present
Use of Subclass 1b by Social Context
Figure C-4. Plot of predicted use of subclass 1b by social context. Based on logistic
regression; central line (-) represents median, dot represents predicted mean; whiskers
include 95% confidence limit.

153
Use of tonal type sounds was low for all social groups (Figure C-5). There were
no significant differences detected in probabilities of use among social groups.
Pro
bab
ility
of u
se
0.0
0.1
0.2
0.3
0.4
0.5
0.6
0.7
0.8
0.9
1.0
Social Context
All Adults Mixed/Unknown Calf Present
Use of Tonal type by Social Context
Figure C-5. Plot of predicted use of tonal sound type by social context. Based on
logistic regression; central line (-) represents median, dot represents predicted mean;
whiskers include 95% confidence limit.

154
VITA
Name: Sarah Marie Charles
Address: Marine Mammal Research Program
Texas A&M University at Galveston
P.O. Box 1675, Galveston, Texas 77553
Email Address: [email protected]
Education: B.S., Biology, Xavier University, 2003
M.S., Wildlife and Fisheries Sciences, 2011
Publications
Ollervides, F. and S. Rohrkasse (Charles), (2007) ―Repertorio acústico de la ballena gris
(Eschrichtius robustus) en Bahía Magdalena‖ in Estudios Ecológicos en Bahía
Magdalena, edited by R. Funes-Rodriguez, J. Gomez-Gutierrez, R. Palomares-Garcia,
(CICIMAR-IPN, La Paz, Baja California Sur, México), pp. 263-274.
S. Rohrkasse (Charles) and J. Atema (2002). ―Tracking Behavior of Busyconinae
Whelks,‖ Biol. Bull. 203, 235-236.
Academic and Research Experience
Teaching Assistant, Texas A&M University
Assistant Field Advisor, School of Field Studies, Baja California Sur, México
Sea Turtle Conservation Associate, Conservancy of Southwest Florida, Naples, FL
Charleston Dolphin Abundance and Distribution Project Intern, NOAA, Charleston, SC