sme for SBP
53
1 1 SUKKUR INSTITUTE OF BUSINESS ADMINISTRATION SME’S Survey of Sukkur District Exploring Rural SME’S Prepared for: State Bank of Pakistan Banking Services Corporation (Bank) Development Finance Support Department Head Office Karachi.
-
Upload
independent -
Category
Documents
-
view
1 -
download
0
Transcript of sme for SBP

1
1
SUKKUR INSTITUTE OF BUSINESS ADMINISTRATION
SME’S Survey of Sukkur District Exploring Rural SME’S
Prepared for:
State Bank of Pakistan Banking Services Corporation (Bank)
Development Finance Support Department
Head Office Karachi.

2
2
Research Team:
Nisar Ahmed Siddiqui Pattern
Altaf Hussain Samo Principal Researcher
Abdul Khaliq Research Associate
Raja Shahzad Research Associate
Khalil Ahmed Research Associate
Kiran Azhar Research Associate

3
3
Table of Contents
Introduction …………….…………….……….………………………….……. 4
Executive Summary ……………………………..………….…………….…..….6
Survey Methodology ………………………..…….…….……..……..….……….7
Survey teams, data collection, & analysis…..………….…………….....…….…9
General Profile of SME……………………….……….…..………..….…….…10
Manufacturing Sector.…………………………….………………….….……...13
Trading…………………………………………….……………………….…….20
Key issue in SME ...……………………………….………….………………….29
Conclusion…………………………………........……………..….……....…….. 30

4
4
INTRODUCTION
Small and medium enterprises have been at the heart of Pakistan's economy for almost 60
years According to independent research findings, in a total population of more than
160million in Pakistan, approximately 75 million are economically active. But the
proportion of independent business owners in the population of Pakistan is significantly
small at 3%. This is well below the developing countries average (6-10%).
In spite of the fact that Pakistan's economic base relies heavily on small and medium
enterprises, the government of Pakistan has been slow to recognize the many differences;
the focus Micro,Small and medium enterprises have been in the major cities But there is
limited information and understanding of the rural markets and economy has been one of
the key impediments in penetration in SME development in the rural economies.
The SME development in rural economies never considered as a mainstream and viable
business activity by policy makers and thus could attract no or limited attention of policy
makers.
State Bank of Pakistan and SBP-BSC has been taking different initiatives to research
studies in rural markets for understanding of the rural economy. The SME Survey of
Sukkur District in Sindh were initiated as pilot projects to explore the districts rural
economies and thus enable SBP and banks to devise market responsive initiatives and
products for increasing flow of financial services in the rural areas. This SME survey of
Sukkur district was conducted through IBA Sukkur.
The survey questionnaire was initially designed by the State Bank of Pakistan Banking Services Corporation (Bank) Development Finance Support Department. After pilot testing, certain modifications were made in the questionnaire, the final questionnaire comprised 122 questions grouped in7 parts viz. general information about SME, ii) Manufacturing SME, iii) Trading Concerns, iv) Accounting & Record keeping v) Business Development Services (BDS) vi) Access to Finance and vii) Key Issues/Challenges.
Responses of 300 SME owners 150 from trading concern and 150 from Manufacturing
concern, selected randomly from five Taluka of Sukkur district, were collected and
compiled. The survey provides a better understanding of the rural SMEs in Sukkur and

5
5
provides some useful insights about the Trading and manufacturing SMEs in the rural areas
of the district.

6
6
2. EXECUTIVE SUMMARY
The Purpose of conducting SME survey at Sukkur district was to explore the
dynamics of rural enterprises to facilitate and enhance the stake holders understanding
of the rural economy of Sukkur district.
In spite of the fact that Pakistan's economic base relies heavily on small and medium
enterprises, the government of Pakistan has been slow to recognize the many
differences; the focus Micro,Small and Medium enterprises have been in the major
cities But there is limited information and understanding of the rural markets and
economy has been one of the key impediments in penetration in SME development in
the rural economies.
The survey questionnaire comprised 122 questions grouped in7 parts viz. general
information about SME, ii) Manufacturing SMEs, iii) Trading Concerns, iv)
Accounting & Record keeping v) Business Development Services (BDS) vi) Access
to Finance and vii) Key Issues/Challenges
Responses of 300 SME owners 150 from trading concern and 150 from
Manufacturing concern, selected randomly from five talukas of Sukkur district, were
collected and compiled.
In district Sukkur84% of SME business is held by sole proprietorship form of
business, while the 11% of the total SME are formed by two or more individuals
jointly as partnership. Only 5% were corporation.
Data obtained from the survey shows that 88% of SME neither got formal training for
their businesses including that of Apprenticeship or training related educational
programs, whereas only 12% received technical and professional training.
Of large number of SME in the district, 68%, have self started their business, whereas
relatively small portion of SME inherited the business, 28%,from their elders ,family,

7
7
and antecedent whereas only 4% purchased the existing businesses and 0.34% joined
the existing business.
About 75% of traders from sample have up to ten employees; 71%,of the SME in
Sukkur district have owned the premises of business rather than leased or rented,
while 29% owned their premises by having lease or rentals.
MANUFACTURING
• 82% of Manufacturing SMEs businesses in district is held by sole
proprietorship form of business , while the 11% are private limited companies.
• 89% of SMEs manufacturers neither got formal training for their businesses
including that of Apprenticeship nor training related educational programs.
• 66% of the manufacturers get basic raw material and inputs from the same
province.
• Average raw material inventory maintained by manufacturers in the district
is of Rs. 1542500.
• 36% of the manufacturers had no growth or negative growth in sale of their
production, whereas 58% of the manufacturers have 25% growth in their sale, while
5% of the manufacturers have 25% to 50% growth in their sale.
• 48% of the sample responded that they need financing for the expansion of
their business.
• Only 22 (14%) out of 150 respondents had borrowed from banks. However
only 27 respondents ever applied for the bank loan .

8
8
TRADING
• 84.7% of the traders from the sample are having proprietorship legal type of
business; about 15.3% are having partnership businesses.
• About 93% of traders from sample have less than ten employees.
• 61.3% owned their premises from sample of traders.
• 88.7% of traders from the sample had bank accounts, which served them as
the avenue for the exchange and security of their money, and the bank finance.
Out of which 53% of respondent traders had bank accounts with their own
names (proprietor), 37% had SME bank accounts
• about 47% availed for short term running finance and 5% of those availed for
export
2. SURVEY METHODOLOGY
The survey for SME was conducted in all 5 Tehsils of district Sukkur. Out of five Tehsils,
3 Tehsils have very large number of manufacturers and traders ,Tehsil Sukkur-1 is
comprising Sukkur city ,known as the hub of trade in interior Sindh , major trade takes
place here. Tehsil Sukkur II or Tehsil old Sukkur have famous industrial zone SITE hence
major manufacturing units exist there. Third Tehsil is comprising Rohri and adjacent rural
areas where number of cotton , brick laying, flour mill, raw oil and agri business units
exists and ancient Rohri market attract the population of Saleh Pat Tehsil and other
adjacent rural areaS for trading and shopping. The remaining 2 Tehsils arecomprising of
Tehsil PanoAqil and Tehsil Salh pat where there is low manufacturing and trading
activities observed specially in Tehsil SalehPat because its major part is desert area and less
densely populated.
S.No Tehsil
Union
Councils
No of Traders
selected for
survey from each
tehsil
No of
Manufacturers
selected for survey
from each tehsil
Tota
l
Percentage of
overall survey
9
9
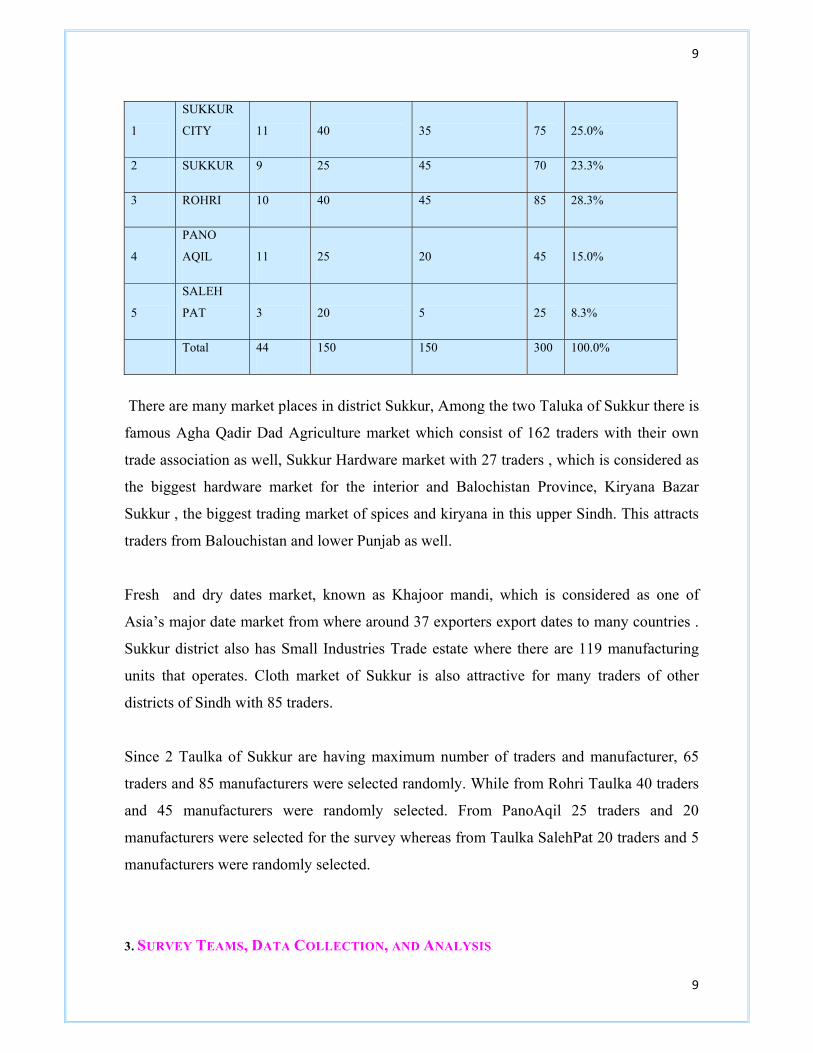
1
SUKKUR
CITY 11 40 35 75 25.0%
2 SUKKUR 9 25 45 70 23.3%
3 ROHRI 10 40 45 85 28.3%
4
PANO
AQIL 11 25 20 45 15.0%
5
SALEH
PAT 3 20 5 25 8.3%
Total 44 150 150 300 100.0%
There are many market places in district Sukkur, Among the two Taluka of Sukkur there is
famous Agha Qadir Dad Agriculture market which consist of 162 traders with their own
trade association as well, Sukkur Hardware market with 27 traders , which is considered as
the biggest hardware market for the interior and Balochistan Province, Kiryana Bazar
Sukkur , the biggest trading market of spices and kiryana in this upper Sindh. This attracts
traders from Balouchistan and lower Punjab as well.
Fresh and dry dates market, known as Khajoor mandi, which is considered as one of
Asia’s major date market from where around 37 exporters export dates to many countries .
Sukkur district also has Small Industries Trade estate where there are 119 manufacturing
units that operates. Cloth market of Sukkur is also attractive for many traders of other
districts of Sindh with 85 traders.
Since 2 Taulka of Sukkur are having maximum number of traders and manufacturer, 65
traders and 85 manufacturers were selected randomly. While from Rohri Taulka 40 traders
and 45 manufacturers were randomly selected. From PanoAqil 25 traders and 20
manufacturers were selected for the survey whereas from Taulka SalehPat 20 traders and 5
manufacturers were randomly selected.
3. SURVEY TEAMS, DATA COLLECTION, AND ANALYSIS

10
10
Survey was conducted by four MBA students, divided in to two teams of two in each. The
teams were provided comprehensive training for about three days on the study objectives,
survey methodology, and interviewing techniques by principal researcher and a team from
State Bank of Pakistan headed by Mr. Amjad Maqsood. A mock interview with one
manufacturer and trader was also the part of the training sessions for estimating the average
time required to fill up the questionnaires and also to identify the confusing and irritating
questions. A well structured questionnaire was designed in consultation with sponsoring
agency and was pre-tested. The principal researcher supervised the whole project,
questionnaire design, sampling criteria and sample selection process and provided guidance
in all phases of the project. Mr. Ashraf Sheik from SBP Sukkur provided their support time
by time in data collection. Principal researcher worked full time with the survey teams,
motivated them, guided them and resolved their problems, particularly in field survey and
data entry phases. The SPSS software was used for data entry and analysis. SPSS provided
flexibility in managing the data by ensuring accuracy and quality of data collected/entered.
In analysis phase where necessary, outliers were excluded from the total number of
observations to arrive at conclusive percentages and averages of the variables. The results
of survey and data collected could be utilized for many research dimensions. The main
objective of this research project is to highlight basic dynamics of the SME sector in
Sukkur district. The data and results will be shared with other concerns for the sake of
knowledge sharing without revealing the identity of respondents.
4-GENERAL PROFILE OF SME
The result of survey reveals that 84% of SMEs
businesses in district are held by sole proprietorship,
while the 11% of the total SME are formed by two or
more individuals, jointly as partnership. Whereas, only
5% of SME surveyed are corporations with a very large

11
11
share of private limited companies.
EDUCATIONAL QUALIFICATION:
SME owners/managers educational background in
survey indicates about 33% and 27% having
graduation and masters degree respectively. While
20% are those some having educational qualification
up to intermediate while only 13% are matriculate and
7% are having education less then matric with 5% for
middle and only 2% with primary level of education,
whereas only 1% having other kind of education including that of informal education.
TECHNICAL AND PROFESSIONAL TRAINING
The majority of SME do not received any kind of formal training before entering in to
business. Data obtained from the survey shows that 88% neither get formal training for
their businesses including that of apprenticeship or training; whereas only 12% received
technical and professional training for their businesses with 2% B.Tech , B.E or associate
diploma in engineering, 4% apprenticeship training and 4% with certificate from technical
training center and the rest with other kind of Technical and professional training.
Out of 88% who did not go for any kind of formal training 58% went for informal training
specially training in typical USTAD –SHGIRD setting and 30% did not get any kind of
training at all.
WORKING EXPERIENCE:
The SMEs owners/managers
surveyed in Sukkur district there
are only 0.3% doesn’t have any

12
12
experience. 26% of respondents having working experience of about 6 to 10 years, 14%
have about (16-20) years ,11% have work experience of 26 to 30 years, whereas few about
2% of the SME in the district have experience of 40 to 50 years. The SME in the district
are well diversified according to working experience they poses, starting from experience
of six months up to fifty years.
ENTRY TYPE OF BUSINESS:
A large number of SME owners/managers in the
district, 68%, are self – starters, whereas
relatively small portion of SME owners/managers
inherited the business, 28%, from their elders,
Family, and antecedents whereas only 4%
purchased the existing businesses and 0.34%
joined the existing business.
YEAR OF ESTABLISHMENT:
The data obtained from the survey shows
that 28% of SME started their business in
Sukkur District during the years 2002 to
2008, 25% established and started during
1972 to 1981, 22% SME established during
1992 to 2001, whereas 8% of the sampled
SME established their business before 1972.
13
13
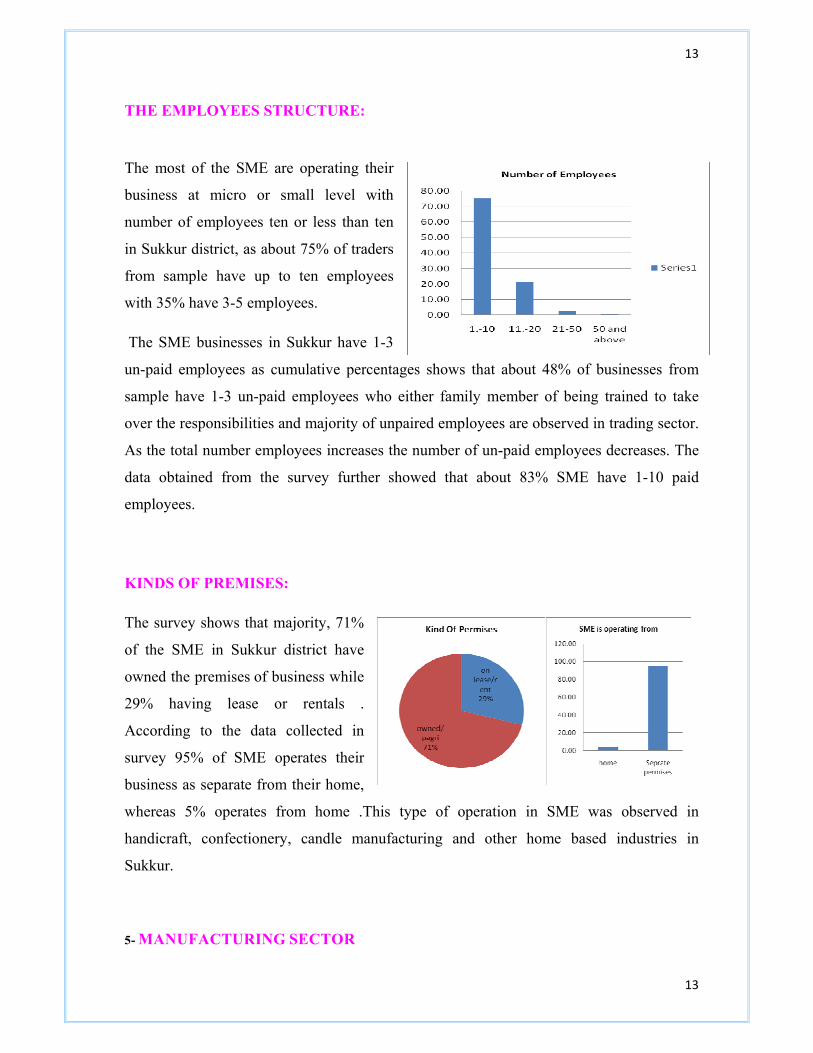
THE EMPLOYEES STRUCTURE:
The most of the SME are operating their
business at micro or small level with
number of employees ten or less than ten
in Sukkur district, as about 75% of traders
from sample have up to ten employees
with 35% have 3-5 employees.
The SME businesses in Sukkur have 1-3
un-paid employees as cumulative percentages shows that about 48% of businesses from
sample have 1-3 un-paid employees who either family member of being trained to take
over the responsibilities and majority of unpaired employees are observed in trading sector.
As the total number employees increases the number of un-paid employees decreases. The
data obtained from the survey further showed that about 83% SME have 1-10 paid
employees.
KINDS OF PREMISES:
The survey shows that majority, 71%
of the SME in Sukkur district have
owned the premises of business while
29% having lease or rentals .
According to the data collected in
survey 95% of SME operates their
business as separate from their home,
whereas 5% operates from home .This type of operation in SME was observed in
handicraft, confectionery, candle manufacturing and other home based industries in
Sukkur.
5- MANUFACTURING SECTOR

14
14
SKILLED AND UNSKILLED WORKERS
Size of Enterprises by
employees Percent
Unskilled
Workers
Semi-Skilled
Workers
Skilled
Workers
(1-10) employees 55 49% 1% 50%
(11-50) employees 43 48% 4% 48%
(51-100)employees 2 50% 0% 50%
The data obtained from the survey shows that 55% of manufacturing SME are having 1-10
employees with 49% unskilled,50%skilled and only 1% have semi skilled employees and
majority of manufacturer have assets of worth150,000 worth and 6% holding assets of
worth 2000,000.
43% of manufacturing SME in the district are having 11-50 employees with the
composition of 48% unskilled and skilled workers each and 4% worker in this category of
manufacturing SME have semi skilled workers.
2% of the manufacturing SME in the district is having 51-100 employees and out of this
2% no one manufacturer employ semi - skilled workers or those who need further training
to match the organizational need and half of their employees are skilled and 50% are
unskilled with the worth Rs. 5000000 of total assets excluding land and building.
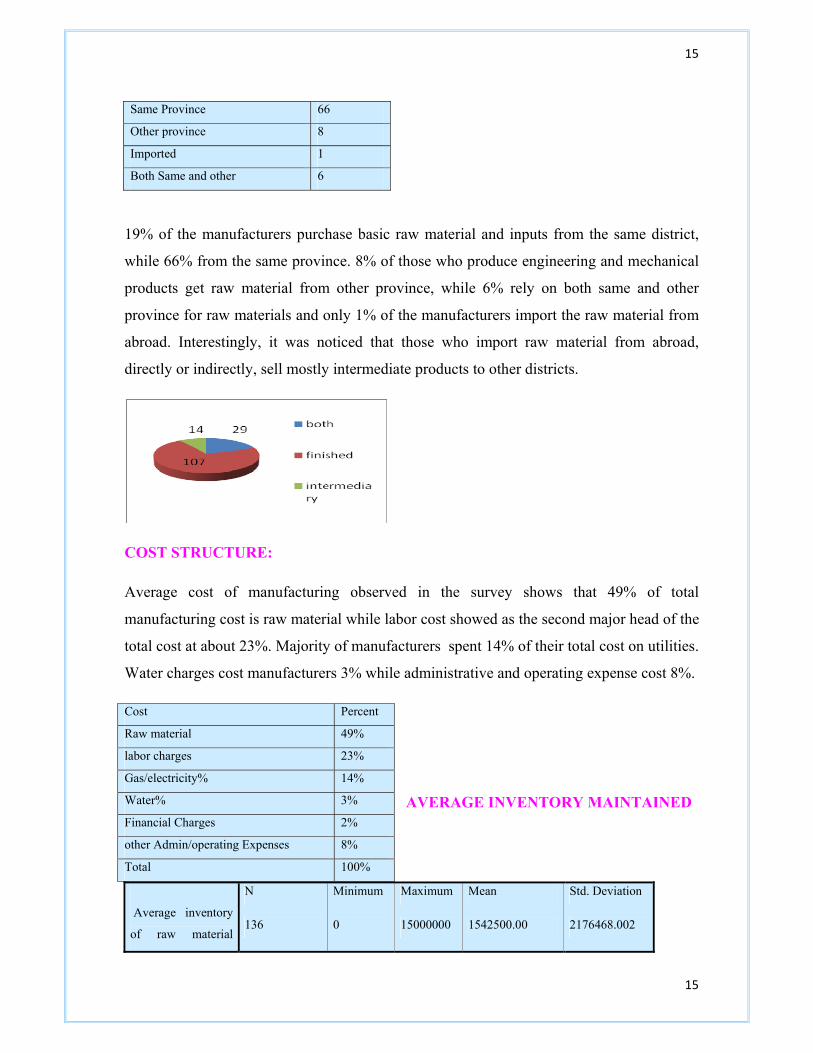
The data further shows that 71% manufacturers sell finished goods both in the same and
other districts and prefer cash and credit against their sales .10% sell intermediary
products and supply raw material for other manufacturers ,19% sell both finished product
and intermediary products . 73% of the manufacturers accept only cash payments, 23%
accept only cheques and 4% accept both cash and cheque payments.
RAW MATERIAL
Basic Raw Material Source Percent
Same District 19
15
15
Same Province 66
Other province 8
Imported 1
Both Same and other 6
19% of the manufacturers purchase basic raw material and inputs from the same district,
while 66% from the same province. 8% of those who produce engineering and mechanical
products get raw material from other province, while 6% rely on both same and other
province for raw materials and only 1% of the manufacturers import the raw material from
abroad. Interestingly, it was noticed that those who import raw material from abroad,
directly or indirectly, sell mostly intermediate products to other districts.
COST STRUCTURE:
Average cost of manufacturing observed in the survey shows that 49% of total
manufacturing cost is raw material while labor cost showed as the second major head of the
total cost at about 23%. Majority of manufacturers spent 14% of their total cost on utilities.
Water charges cost manufacturers 3% while administrative and operating expense cost 8%.
AVERAGE INVENTORY MAINTAINED
N Minimum Maximum Mean Std. Deviation
Average inventory
of raw material 136 0 15000000 1542500.00 2176468.002
Cost Percent
Raw material 49%
labor charges 23%
Gas/electricity% 14%
Water% 3%
Financial Charges 2%
other Admin/operating Expenses 8%
Total 100%
16
16
maintained (in Rs)
Average inventory
of finished goods
maintained (in Rs)
132 0 10000000 1197310.61 1481442.124
Valid N (list wise) 132
Average raw material inventory maintained by manufacturers in the district is of Rs.
1542500, whereas few manufacturers keep raw material inventory up to 15 million, while
there are 10% manufacturers who do not maintain
raw material inventory at all. The average amount
of finished goods inventory maintained by the
manufacturers in the district is Rs. 1197310 with
maximum inventory level of Rs. 10,000,000
which is maintained by few manufacturers.
About 18 (12%) manufacturers who were
surveyed don’t maintain any finished goods inventory.
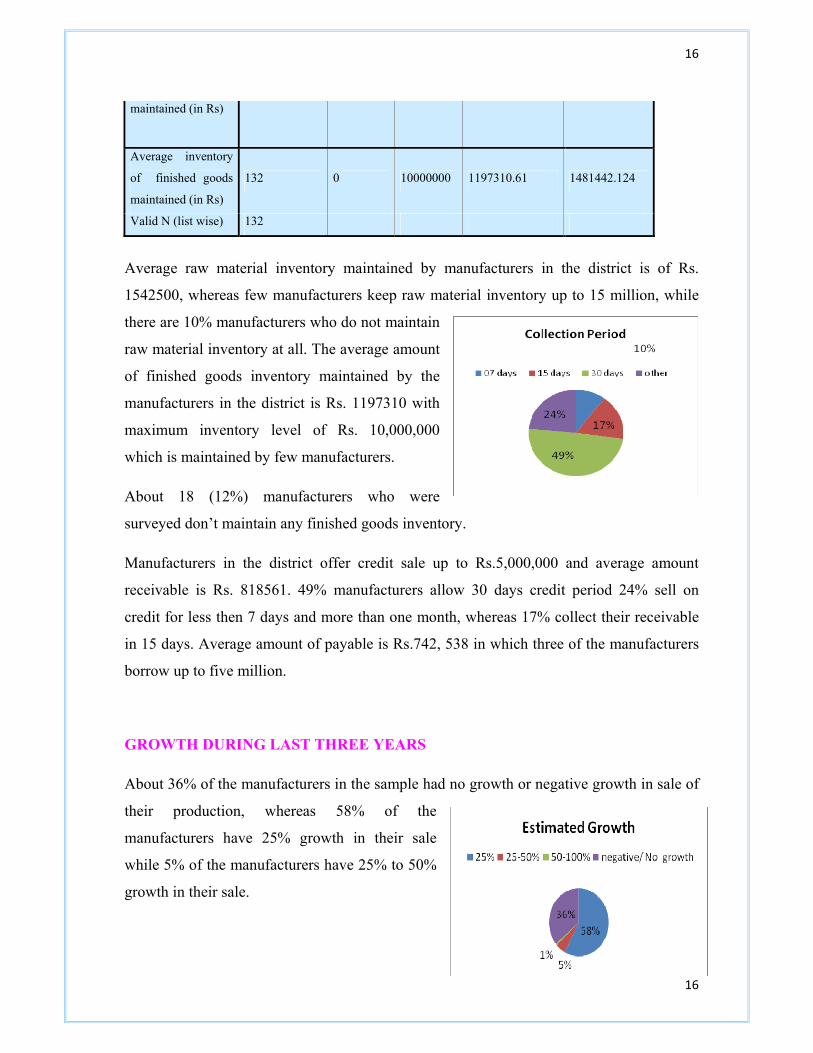
Manufacturers in the district offer credit sale up to Rs.5,000,000 and average amount
receivable is Rs. 818561. 49% manufacturers allow 30 days credit period 24% sell on
credit for less then 7 days and more than one month, whereas 17% collect their receivable
in 15 days. Average amount of payable is Rs.742, 538 in which three of the manufacturers
borrow up to five million.
GROWTH DURING LAST THREE YEARS
About 36% of the manufacturers in the sample had no growth or negative growth in sale of
their production, whereas 58% of the
manufacturers have 25% growth in their sale
while 5% of the manufacturers have 25% to 50%
growth in their sale.
17
17
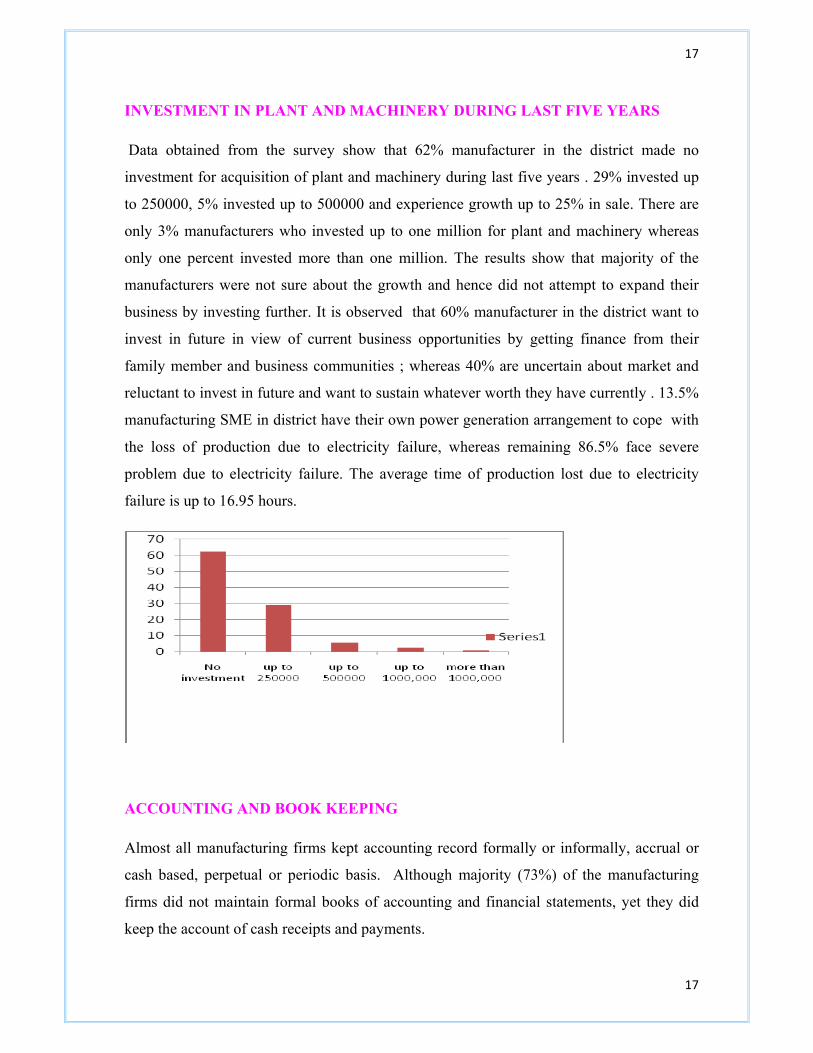
INVESTMENT IN PLANT AND MACHINERY DURING LAST FIVE YEARS
Data obtained from the survey show that 62% manufacturer in the district made no
investment for acquisition of plant and machinery during last five years . 29% invested up
to 250000, 5% invested up to 500000 and experience growth up to 25% in sale. There are
only 3% manufacturers who invested up to one million for plant and machinery whereas
only one percent invested more than one million. The results show that majority of the
manufacturers were not sure about the growth and hence did not attempt to expand their
business by investing further. It is observed that 60% manufacturer in the district want to
invest in future in view of current business opportunities by getting finance from their
family member and business communities ; whereas 40% are uncertain about market and
reluctant to invest in future and want to sustain whatever worth they have currently . 13.5%
manufacturing SME in district have their own power generation arrangement to cope with
the loss of production due to electricity failure, whereas remaining 86.5% face severe
problem due to electricity failure. The average time of production lost due to electricity
failure is up to 16.95 hours.
ACCOUNTING AND BOOK KEEPING
Almost all manufacturing firms kept accounting record formally or informally, accrual or
cash based, perpetual or periodic basis. Although majority (73%) of the manufacturing
firms did not maintain formal books of accounting and financial statements, yet they did
keep the account of cash receipts and payments.

18
18
In addition, three out of four firms kept the party-wise record of payables and receivables
and more than half (56%) of the firms made periodic assessment of their revenue and
income. However, 56% of the firms periodically maintained proper recording of the
withdrawals for their family’s expenses from their firms.
FINANCIAL ASPECTS
The survey shows that (87%) of the manufacturing firms had the bank accounts, which
served them as the means for the exchange and security of the money and the bank finance.
As for as the mode of ownership/operation of the bank accounts ; 63%, 33% and 5% of the
accounts were operated under the name of the SMEs, the proprietors and jointly by
proprietors and their families respectively. Moreover, opening time of the account with
respect to time of start of the firm is that: 4% of the respondents already had the accounts,
16% opened at the time of the start, 34% opened within five years after start, 36% opened
within 5-10 years.
Half (48%) of the sample responded with the finance/loan need for the expansion of their
business, yet the rest half (52%) declined such need. Major chunk (82%) of the responded
never even applied for bank loan. However, 64 (42%) respondent even never borrowed
from any source, 50(34%) respondents borrowed from the business community, which was
found to be the major source of borrowing.
In Sukkur region, Marketing/selling activities of banks seems to be very inappropriate for
the SME manufacturing firms; since only one - fourth (27%) of respondents were
approached by the staff of the banks, leaving 73% of SME manufacturing firms untouched.
Consequently, lack of awareness about bank loans was the second major (50%) reason of

19
19
not applying for the loan. In this region there is need to improve their marketing efforts to
finance the untapped market. In addition, bankers must facilitate the prospective borrowers
in the documentation process by reducing the credit approval time, lengthy procedures and
extensive requirements; since 64% of the respondents (who had not applied for bank loan
numbering 123) mentioned these hurdles for not approaching the bank. Nevertheless, 61%
of the sample had information about the bank loans, which was provided by business
colleagues (48%), marketing staff of banks (27%), and friends and family (21%). Business
colleagues, then, came up as the major source of information for bank loan products; this
supports the argument that there is the significant network of information exchange within
the business community- manufacturing sector Sukkur. So, the banks can mobilize this
network to promote their loan products.
Out of 27 respondents who applied for the bank loan; 22 (81%)
got the loan approved and the rest 5 (19%) were unsuccessful
mainly due to lack of adequate collateral. Besides that; out of 22
borrowers, 19(86%) borrowers borrowed from commercial bank
and the rest 3(14%) and SME banks respectively. About
16(70%), 5(22%) and the rest 1(4%) borrowers availed short term finance, long-term fixed
finance and personal finance respectively.
Majority of borrowers had not used any
reference or undue consideration
respectively to get the loan approved. The
banks took averagely one month to
approve the loan with maximum and
minimum of 151 and 6 days respectively.
Type of loan availed
Short Term Running
Finance 16
Long Term Fixed
Investment 5
Personal loan 1
Export Financing 0
Reasons for not applying the bank loan No of ticks % R* 1‐Lack of awareness about financial services being offered by banks/MFBs 61 50% 2‐Religious grounds‐ the Interest based loan products 39 32% 3‐High interest rates 41 33% 4‐Cumbersome and lengthy procedures and extensive documentation requirements of banks in extending loans 79 64% 5‐Other factors (Pl. specify) 1 1%

20
20
BUSINESS DEVELOPMENT SERVICES (BDS)
In sukkur region, majority (90%) of
Owners/Managing Directors of
manufacuring firms had never attended
any BDS.
82%, 53%, 50%, 44% and 41% of them mentioned lack of awareness of such
institutes/programs, lack of time to attend such programs,lack of faith in utility of such
programs,absence of such institute in their surrounding and high cost respectively for not
attending BDPs. However, 60% of them were willing to attend BDPs if offered free.
Unfortunately, only one third of the firms arranged the training programs for their
employees during last two years.
6-TRADING
SOCIO-ECONOMIC CONDITIONS
LEGAL TYPE OF BUSINESS:
A large number of trading enterprises in Sukkur district have proprietorship type of
businesses, as 84.7% of the traders having proprietorship legal type of business, about
15.3% having partnership businesses.
*R means respondents who had not ever applied for bank loan 123

21
21
Educational qualificationothersmastersGraduateintermatricmiddleprimary
Frequ
ency
60
50
40
30
20
10
0
Educational qualification
partnershipproprietorship
Legal type of SME
EDUCATIONAL QUALIFICATION:
Traders in Sukkur district have good educational background as survey indicates about
34% of traders with graduation while 21.3% of respondents have education up to
intermediate 14% with matriculation ; 7% have middle and only 2% with primary highest
educational qualification.
Educational Qulification of traders
Graduation
Intermediate
Matric
Middle
Primary
None

22
22
AcquisitionInhertainceself starter
How did you enter into the business
TECHNICAL AND PROFESSIONAL TRAINING:
The majority of traders had not received any formal or informal training before entering in
to business. The survey result shows that 24% of the total respondents received informal
training (Ustad-Shagrid) as trainer-trainee and only 9% received formal training. The
findings of survey emphasise on need of training and development programs in future in
Sukkur district for SME generally and traders specifically.
WORKING EXPERIENCE:
The traders are well - experienced in Sukkur district as 31% of respondents having working
experience of about (5-10) years experience, 28.6% have about (15-20) years experience
and 21.3% have about (0.5-5) years experience. The traders are well diversified according
to working experience they pose, starting from experience of six months up to fifty years.
ENTRY TYPE OF BUSINESS:
A large number of traders self started their , whereas relatively small portion of traders
inherited the business from their families as
survey indicates that 67.3% of traders self
started their businesses, 29.3% inherited and
only 3.3% purchased the existing businesses.

23
23
ENTRY TYPE OF BUSINESS
Self Starter
Inheriters
Acquired/Puchased existingbusiness
YEAR OF ESTABLISHMENT:
The trading enterprises are well diversified according to number of years since existence as
survey indicates that 55% of enterprises were established up to 1990 and 45% of
enterprises were established after 1990.
THE EMPLOYEES STRUCTURE:
The most of the trading enterprises are operating their business at micro or small level in
Sukkur district with number of employees less than ten as about 93% of traders from
sample have less than ten employees. Survey results indicates that a large number of
trading business have from three to five number of employees as 37% of traders from the
sample have (3-5) employees. The trading businesses in Sukkur have 1-3 un-paid
employees as cumulative percentages show that about 68% of businesses from sample have
1-3 un-paid employees. As the total number employees increases, the number of un-paid
employees decreases, which is quiet obvious. The results of paid employees are also
indicating almost the same cumulative percentages about 60% from the sample have 1-3
paid employees.

24
24
NUMBER OF EMPLOYEES
NUMBER OF EMPLOYEES
1 t o 5
6 t o 10
11 t o 15
16 and above
KIND OF PREMISES:
The survey shows that majority of traders in Sukkur district have owned the premises of business rather than
leased or rented as 61.3% owned their premises from sample of traders. The trading businesses are operated from
separate places not from home of proprietor as 96.7% of trading businesses from sample are operated from
separate places.
owned/pagrion lease/rent
The kind of permises
Employees Frequency Percentages
1 to 5 103 68.7%
6 to 10 36 24.0%
11 to 15 10 6.7%
16 to 20 1 0.7%
150 1
SME maintains formal books of account and
prepare financial statements
Frequency Percent

25
25
ACCOUNTING AND RECORD KEEPING
The survey indicates about maintenance of formal
books of account and preparation of financial
statements that only 16% of traders from the
sample prepare formal statements. Of them 80% of respondents started maintaining formal
books of accounts from last 10 years. As for as periodicity of preparation of financial
statements, concern 58.3% of those, who maintain formal books of account prepare
financial statements on monthly, 29.2% quarterly,
4.2% semi-annually and 12.5% annually basis.
Further analysis shows that 83.2% of those, who
do not prepare formal financial statements,
maintain the daybook/cashbook to record daily
receipts. The survey also indicates that 50% of the
respondent traders asses their profits on periodic
basis and 61.3% make party wise record of
accounts payables and receivables. There may be
several reasons behind low rate of traders preparing formal financial investments such as
operating at micro and small level, lack of skills to prepare or no practice in past. From the
sample only 21.3% have the personal computers for business use and 39.3% of respondents
want to attend free training on maintaining the day book.
BUSINESS DEVELOPMENT SERVICES (BDS)
The awareness of business development services in businesses at Sukkur region is not at
satisfactory level as only 18.7% of respondent traders are aware about BDS. Furthermore.
about 35% times respondents indicate lack of awareness about Program/workshop/seminar
etc on BDS as reason for not participating in BDS programs. Also about 20% times
respondents indicated absence of such institute in Sukkur, 19.5% times lack of time to
attend such programs, 16.4% times lack of faith in utility of such programs and about 9%
times cost of programs as reason of not participating in BDS programs. Although SMEDA
No 126 84%
yes 24 16%
Total 150 100
In case the SME doesn't have proper books of
accounts, does it maintain the
daybook/cashbook to record daily receipts and
payment
Frequency Percentage
No 21 16.8%
yes 104 83.2%

26
26
and other supporting NGOs launched some BDS programs at Sukkur region but need of
time is to widen the scope of BDS activities at Sukkur.
Does the SME has awareness about BDS being extended by institutions like SMEDA or other
public/private institution Frequency
NoyesTotal
ACCESS TO FINANCE
BANK ACCOUNTS
If he/she would like to attend such
program if arranged free of cost
Frequency Percentage
Valid No 71 48.6%
yes 75 51.4%
Total 146
100
Missing 4
Total 150
Type of Loan
Availed
Percentage

27
27
A large number 88.7% of traders from the sample have bank
accounts, which served them as an avenue for the exchange and
security of the money and the bank finance. Out of which 53% of
respondent traders have bank accounts in their own names
(proprietor), 37% have bank accounts with SME name, 8% have
both, and only 2% have joint accounts with family. The results of
survey indicates that 30.3% are maintaining the bank accounts
from 6-10 years, about 20% from 1-5 years, about 20% from 11-
15 years and 18% are maintaining from 16-20 years. Although
large number of traders from the sample had bank accounts yet
many of them had with proprietor name which create problem
while making policy for financial betterment of SMEs because of difficulty in determining
the number of SMEs in district. Further analysis indicates that many traders are
maintaining their bank accounts from less than 20 years, while many trading enterprises in
the sample exist for long time.
ACCESS TO BANK LOANS
Survey indicates that 72% of the respondent traders do not need loan to expand their
business, 62.7% of the respondents are aware about bank loan products. A large number of
respondents got information about bank loan products from business colleagues and from
friends & families as 46.3% and 23% respectively, only about 30% of respondents got
Short Term
Running
Finance
47.1%
Long Term
Fixed
Investment
11.8%
Personal loan 11.8%
Export
Financing
29.4%
Total 100

28
28
yesNo
Need loan to expand the business
yesNo
SME has awarness about bankl loan products
information from banks’ marketing staff and some respondents got information from
multiple sources.
SME have Bank Account Percentage
Noyes
Source of information
Percentages
Bank’s Staff 29.9%
Friends& Family 23.1%
Business Colleagues 46.3%

29
29
LOANS AVAILED
Only 14.2% from the sample of traders applied for bank loan. Of those about 81% got acceptance from banks and 19% from those applied for bank loan got rejection from banks.
The main reasons indicated in survey behind rejection of applications were lack of adequate title to land/property, insufficient cash flows and absence of financial statements acceptable to banks. From the traders who availed of bank loan almost 90% got from the commercial banks.
The survey indicates following main reasons of not
applying for the bank loan, religious grounds (interest
based loans) 32.1% times, cumbersome and lengthy
procedures of documentation 24.8% times, high
interest rates 22% times and lack of awareness 14.2%
times.
Type of Loan
As explained that a few number of respondent availed bank loan, from those respondents
who availed of bank loan about 47% availed of short term running finance and 5% of those
availed export financing. The respondent traders at Sukkur region used the personal or
political references as indicated almost half of the respondents who availed of bank loan
used references to obtain loan. It needs several administrative efforts to resolve issue of
using references for obtaining the loan. Whereas, the percentage of using any undue
consideration (monetary/ in kind) to obtain the bank loan is 17.6%.
The further analysis shows that 36.4% and 27.3% of respondents, who availed bank of
loans took from 21 to 30 days and from 11 to 20 days in obtaining the loan from banks
with cumulative frequency of 63.7%. About 18% took more than 30 days and only 9.1%
got loan within ten days.
Reason for not
applying
Frequency Percentage
Lack of
awareness
31 14.2%
Religious
grounds
70 32.1%
High interest
rates
48 22.0%
Cumbersome
and lengthy
procedures
54 24.8%
Other factors 15 6.9%
30
30
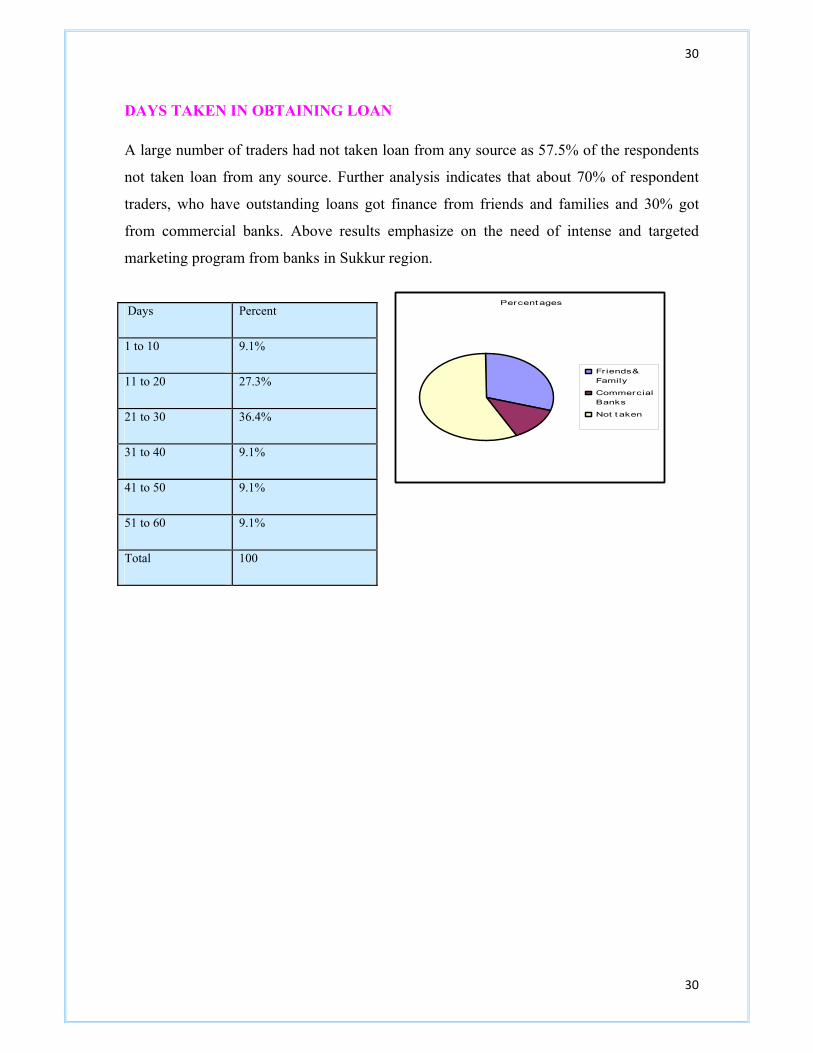
DAYS TAKEN IN OBTAINING LOAN
A large number of traders had not taken loan from any source as 57.5% of the respondents
not taken loan from any source. Further analysis indicates that about 70% of respondent
traders, who have outstanding loans got finance from friends and families and 30% got
from commercial banks. Above results emphasize on the need of intense and targeted
marketing program from banks in Sukkur region.
Percent ages
Friends &Family
CommercialBanks
Not t aken
Days Percent
1 to 10 9.1%
11 to 20 27.3%
21 to 30 36.4%
31 to 40 9.1%
41 to 50 9.1%
51 to 60 9.1%
Total 100

31
31
PREFERRED SOURCE OF FINANCE
A large number of respondents from the sample about 83.9% prefer friends and families to
get finance for their businesses and only 11.4% prefer banks for financing. The reasons for
being behind preferred sources of financing were indicted by respondent traders such as
easy access and immediate availability 36% times, low or no documentation 26.8% times,
no collateral 20% times and low interest rates 13.2% times.
ACCOUNTING AND RECORD KEEPING
Formal books of accounts
Majority (78%) of SMEs responded that they don’t maintain formal books of account; remaining only 22% of the sample keep the formal books of account such as Balance Sheet, Income Statement and other supporting ledgers. However, the survey supports that anticipation that Manufacturing SMEs have more tendency to maintain the accounts than trading SMEs, since 28% of manufacturing SMEs maintain the accounts as compared to 16% of trading SMEs.
Relationship between education of entrepreneur and his tendency to maintain the formal books of account is found to be roughly significant; since 30% and 39% of the entrepreneurs who maintained the accounts were educated up to bachelor and masters level respectively, leaving around 30% to the undergraduate level entrepreneurs.
Maintain Formal Books of Accounts Manufacturing Trading Freq Percent Freq Percent Yes 42 28% 24 16% No 108 72% 126 84% Total 150 100% 150 100%
Education Vs Maintain formal books of account Education No yes Freq Percent Freq Percent Total primary 4 2% 1 2% 5 middle 11 5% 3 5% 14 matric 31 13% 8 12% 39 inter 50 21% 8 12% 58 Graduate 72 31% 26 39% 98 masters 59 25% 20 30% 79 others 7 3% 0 0% 7 Total 234 100% 66 100% 300 % of total 78% 22%

32
32
Periodicity of Financial Statements about 61% of the formal accounts are maintained monthly, 25% quarterly, 5% semi-annually and only 9% annually; irrespective of type of SMEs ;the result seems to be contrary to the expectations that most SMES maintain account on yearly basis.
Specialized Accountants Owners prefer themselves to maintain the formal books of accounts instead of relying on the accountants, since 64% of the accounts are maintained by entrepreneurs, whereas 36% by specialized accountants. As against that, informal book (Day Book/ Payment and Receipt Book) keeping is mostly delegated to munchies, as 83% of informal accounts are maintained by munchies, whereas rest 17% by owners themselves.
Accounting Training
How the books of account are maintained (Specialized Accounts) Manufacturing Trading Total Freq Percent Freq Percent Freq Percent Don't maintain 61 41% 103 69% 164 100% 55% Sub total 61 41% 103 69% 164 100% 55% Formal books by: Specialized accountant 20 13% 4 3% 24 36% 8%Proprietor himself 22 15% 20 13% 42 64% 14% Sub total 42 28% 24 16% 66 100% 22%Informal books by : Munchi 42 28% 16 11% 58 83% 19%Proprietor himself 3 2% 6 4% 9 13% 3% Lawyer for taxation 2 1% 1 1% 3 4% 1% Sub total 47 31% 23 15% 70 100% 23% Total 150 100% 150 100% 300 300 100%
If formal books of account maintain ; any training received from

33
33
Majority (86%) of the SMEs did not get any training assistance while maintaining formal accounts. This implies that owners have already sufficient accounting skills or they had hired well skilled accountants. Nonetheless, the fact remains apparent that training firms such as SMEDA have not properly approached these SMEs. Periodic Assessment of Income About 52% of the SMEs which don’t maintain formal books of accounts assess their income periodically. Although remaining gave the negative response to questions of assessment of their income, yet their responses might be manipulative due to their apprehension of income disclosure.
Party-wise Accounts Payable and Receivable About 67% of the SMEs keep record of account payables and receivables party-wise. Manufacturing SMEs more tend to keep the record than trading SMEs, About 74% of manufacturing SME keep the record as compared to 61% of trading SMEs. Nevertheless, one third of SMEs don’t record party-wise account receivables and payables. This practice results into improper income assessment and conflicts between SMEs and their parties. Periodic Withdrawals for Personal Use About 62% of surveyed SMEs record the withdrawals from business income for their personal or family expenses.
SMEDA Manufacturing Trading
Freq Percent Freq PercentYes 26 17% 16 11% No 124 83% 134 89% Total 150 100% 150 100%
Maintain Party wise Record Manufacturing Trading Total Freq Percent Freq Percent Freq Percent Yes 111 74% 91 61% 202 67% No 39 26% 59 39% 98 33% Total 150 100% 150 100% 300 100%

34
34
Free Accounting training Surprisingly, majority (89%) of the SMEs, irrespective of trading or manufacturing, rejected the offer of free accounting training. This overwhelming rejection might be because of their underestimation of the benefits of such training and apprehension of income disclosure.
Use Of personal Computer
Although half of the SMEs have personal computers, yet only 17% of such computers were used for accounts keeping. Major use of these computers has been found to be not for business purpose.
Firm Has Personal computer Yes No Total
Manufacturing 57% 43% 50%Trading 35% 65% 50%
PC Usage for book maintenance Manufacturing Trading Total Freq Percent Freq Percent Freq Percent Yes 15 17% 9 17% 24 17% No 71 83% 43 83% 114 83% Total 86 100% 52 100% 138 100%
Willing to attend free accounting training Manufacturing Trading Total
Freq Percent Freq Percent Freq Percent Yes 16 11% 17 11% 33 11% No 134 89% 133 89% 267 89% Total 150 100% 150 100% 300 100%
35
35
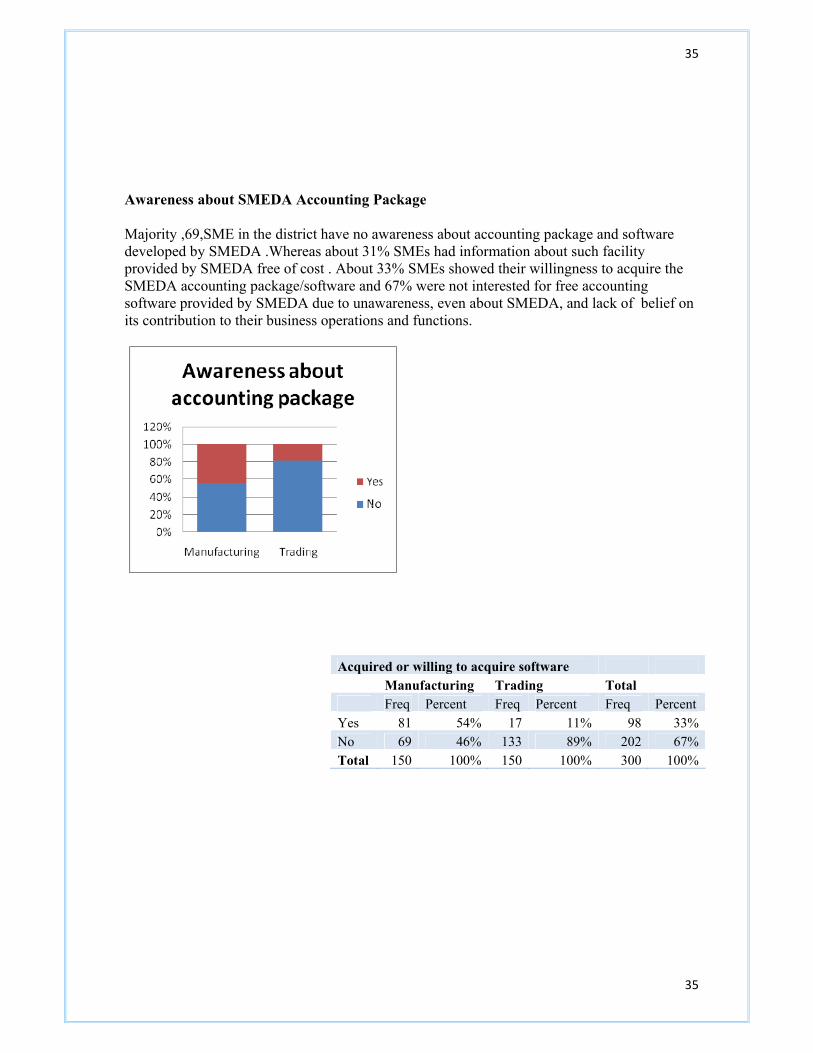
Awareness about SMEDA Accounting Package Majority ,69,SME in the district have no awareness about accounting package and software developed by SMEDA .Whereas about 31% SMEs had information about such facility provided by SMEDA free of cost . About 33% SMEs showed their willingness to acquire the SMEDA accounting package/software and 67% were not interested for free accounting software provided by SMEDA due to unawareness, even about SMEDA, and lack of belief on its contribution to their business operations and functions.
Acquired or willing to acquire software Manufacturing Trading Total Freq Percent Freq Percent Freq Percent Yes 81 54% 17 11% 98 33%No 69 46% 133 89% 202 67%Total 150 100% 150 100% 300 100%

36
36
Section – : Business Development Services Awareness about BDS About 81% SMEs have no awareness about the Business Development Services (BDS) offered by SMEDA or any other public / private organization mainly due to no awareness and information about role and activities of SMEDA in the district. Majority of those who don’t have information about BDS are consisting of trading concerns with small scale business. Where as majority of the SMEs who said they had awareness about BDS offered by SMEDA or any other public/private organization are manufacturing concerns. This showed that large manufacturing businesses have awareness, information and links with SMEDA. Awareness about BDS by SMEDA /Others Manufacturing Trading Total Freq Percent Freq Percent Freq Percent Yes 66 44% 28 19% 94 31%No 84 56% 122 81% 206 69%Total 150 100% 150 100% 300 100%
Attendance of BDS program
Only 9% of the SMEs have attended business development programs. The reasons for not attending the program were found to be- cost (26%), not availability of such institutions (23%), lack of faith in utility of such programs (22%), lack of time (20%), lack of awareness (9%).
Reasons for not attending the BDS Program
Yes No Freq Percent Freq Percent Lack of Awareness 214 32% 55 9% No institution 119 18% 146 23% Lack of faith 117 18% 141 22% Lack of time 129 20% 131 20%Costly/Unaffordable 82 12% 168 26%
37
37
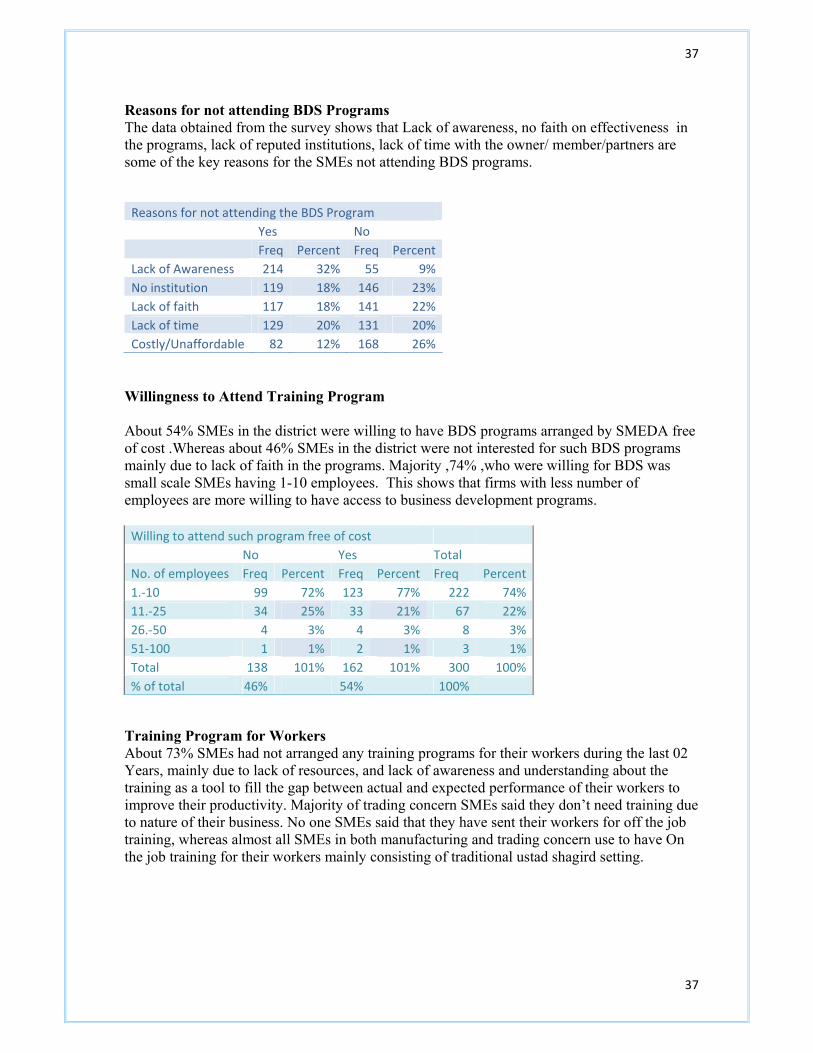
Reasons for not attending BDS Programs The data obtained from the survey shows that Lack of awareness, no faith on effectiveness in the programs, lack of reputed institutions, lack of time with the owner/ member/partners are some of the key reasons for the SMEs not attending BDS programs.
Reasons for not attending the BDS Program Yes No Freq Percent Freq Percent
Lack of Awareness 214 32% 55 9%No institution 119 18% 146 23%Lack of faith 117 18% 141 22%Lack of time 129 20% 131 20%Costly/Unaffordable 82 12% 168 26%
Willingness to Attend Training Program About 54% SMEs in the district were willing to have BDS programs arranged by SMEDA free of cost .Whereas about 46% SMEs in the district were not interested for such BDS programs mainly due to lack of faith in the programs. Majority ,74% ,who were willing for BDS was small scale SMEs having 1-10 employees. This shows that firms with less number of employees are more willing to have access to business development programs.
Willing to attend such program free of cost No Yes Total
No. of employees Freq Percent Freq Percent Freq Percent1.‐10 99 72% 123 77% 222 74%11.‐25 34 25% 33 21% 67 22%26.‐50 4 3% 4 3% 8 3%51‐100 1 1% 2 1% 3 1%Total 138 101% 162 101% 300 100%% of total 46% 54% 100%
Training Program for Workers About 73% SMEs had not arranged any training programs for their workers during the last 02 Years, mainly due to lack of resources, and lack of awareness and understanding about the training as a tool to fill the gap between actual and expected performance of their workers to improve their productivity. Majority of trading concern SMEs said they don’t need training due to nature of their business. No one SMEs said that they have sent their workers for off the job training, whereas almost all SMEs in both manufacturing and trading concern use to have On the job training for their workers mainly consisting of traditional ustad shagird setting.

38
38
Reasons for not conducting training Programs Freq PercentNo Need 47 16%Lack of awareness 18 6%No enough resource 140 47%On the job training 18 6%Arranged training Programs 77 26%Total 300 100%

39
39
Access to Finance Bank Accounts The data obtained from the survey of 300 SMEs showed that 88% SMEs have bank accounts; majority, 55% had the accounts in their own name, proprietor, partner. And about 33% had bank accounts in the names of their businesses.
When inquired about the reason, they said it is mainly because of no adequate title of business and no proper registration and documentation. About 12% SMEs covered in the survey do not have bank accounts at all. Almost all the SMEs not having the bank accounts are small units having up to 10 employees.
HAVE BANK ACCOUNT WITH NO OF EMPLOYEES Yes No
No. of employees Freq Percent Freq Percent Total 1.‐10 191 72% 33 92% 224 11.‐25 65 25% 3 8% 68 26.‐50 4 2% 0 0% 4 51‐100 4 2% 0 0% 4 Total 264 100% 36 100% 300
The majority of the bank account keeping SMEs are manufacturing ones which are relatively large in size ,operation ,resources, and capacity which require them to have bank accounts.
40
40
It was also found through the survey that more manufacturing SMEs are using their bank accounts and other bank services for their daily business transactions , consisting of sale/purchase of finished goods ,raw materials ,from different districts and cities .
IF YES SINCE WHEN BANK ACCOUNT 1‐5 years 6‐10 years Over 10 years
No. of employees Freq Percent Freq Percent Freq Percent Total 1.‐10 71 70% 20 37% 58 53% 149 11.‐25 16 16% 22 41% 36 33% 74 26.‐50 9 9% 4 7% 6 6% 19 51‐100 5 5% 8 15% 9 8% 22 Total 101 100% 54 100% 109 100% 264 Percentage of total 38% 20% 41%
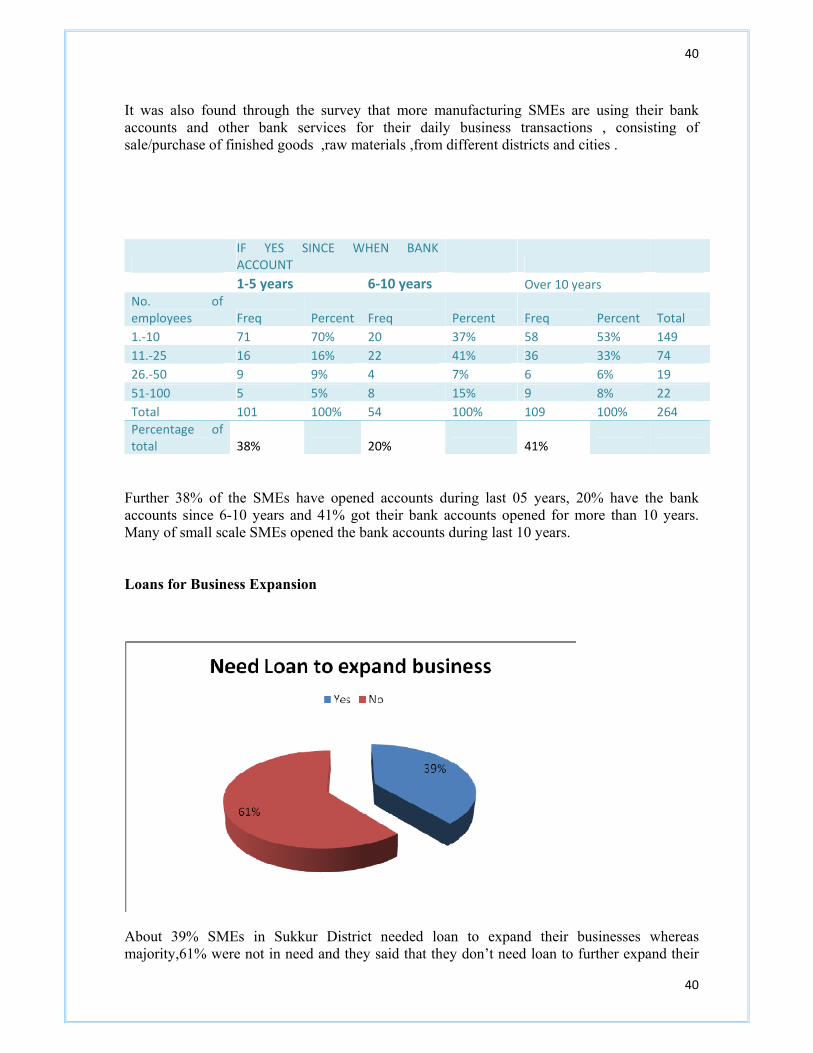
Further 38% of the SMEs have opened accounts during last 05 years, 20% have the bank accounts since 6-10 years and 41% got their bank accounts opened for more than 10 years. Many of small scale SMEs opened the bank accounts during last 10 years. Loans for Business Expansion
About 39% SMEs in Sukkur District needed loan to expand their businesses whereas majority,61% were not in need and they said that they don’t need loan to further expand their
41
41
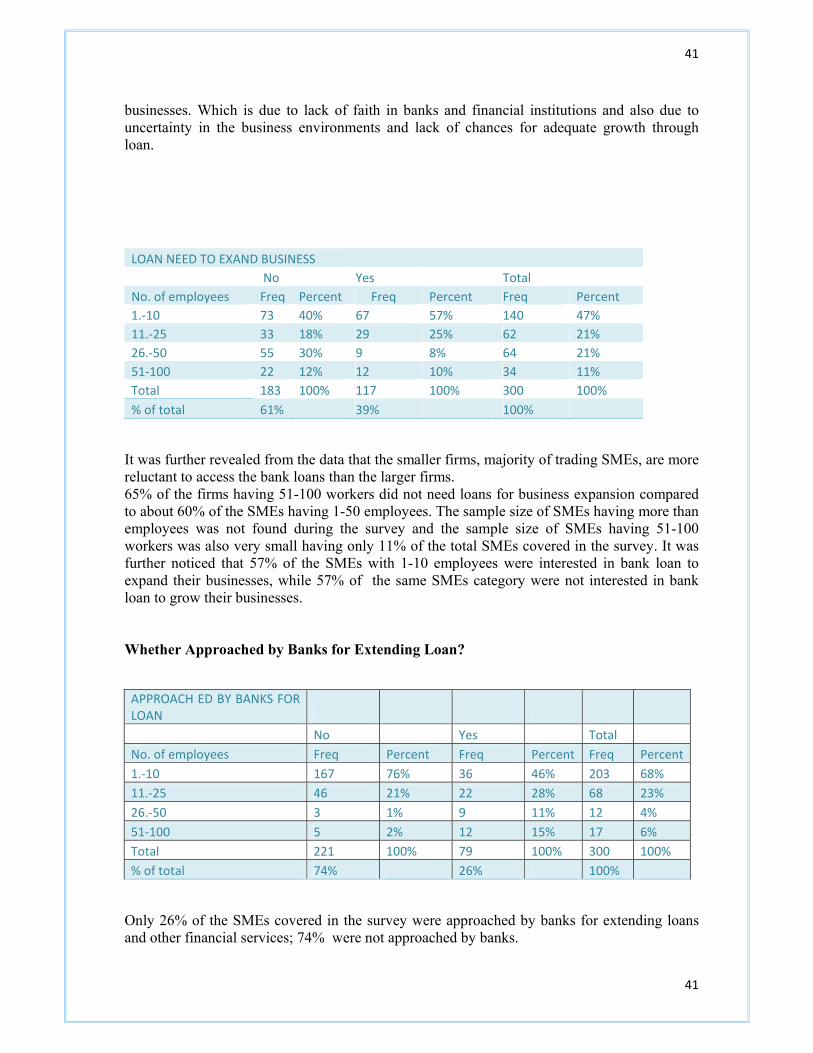
businesses. Which is due to lack of faith in banks and financial institutions and also due to uncertainty in the business environments and lack of chances for adequate growth through loan.
LOAN NEED TO EXAND BUSINESS No Yes Total
No. of employees Freq Percent Freq Percent Freq Percent 1.‐10 73 40% 67 57% 140 47% 11.‐25 33 18% 29 25% 62 21% 26.‐50 55 30% 9 8% 64 21% 51‐100 22 12% 12 10% 34 11% Total 183 100% 117 100% 300 100% % of total 61% 39% 100%
It was further revealed from the data that the smaller firms, majority of trading SMEs, are more reluctant to access the bank loans than the larger firms. 65% of the firms having 51-100 workers did not need loans for business expansion compared to about 60% of the SMEs having 1-50 employees. The sample size of SMEs having more than employees was not found during the survey and the sample size of SMEs having 51-100 workers was also very small having only 11% of the total SMEs covered in the survey. It was further noticed that 57% of the SMEs with 1-10 employees were interested in bank loan to expand their businesses, while 57% of the same SMEs category were not interested in bank loan to grow their businesses. Whether Approached by Banks for Extending Loan?
APPROACH ED BY BANKS FOR LOAN No Yes Total No. of employees Freq Percent Freq Percent Freq Percent1.‐10 167 76% 36 46% 203 68% 11.‐25 46 21% 22 28% 68 23% 26.‐50 3 1% 9 11% 12 4% 51‐100 5 2% 12 15% 17 6% Total 221 100% 79 100% 300 100% % of total 74% 26% 100%
Only 26% of the SMEs covered in the survey were approached by banks for extending loans and other financial services; 74% were not approached by banks.

42
42
Those SMEs who were approached by banks were visited up to 20 times .which shows the interest on the part of the banks to provide loans and other financial service to SMEs. Further, although banks’ marketing staff had relatively greater focus on larger SMEs for introduction/promotion of their products yet still 76% of smaller firms having up to 10 employees were also approached by banks� marketing staff for introduction of their products and services. It was further noticed that those SMEs who were approached by the bank and paid most visits were due to better repute of that SME and better past rating and record with banks. Awareness about Bank loan Products
AWARENESS ABOUT BANK LOAN PRODUCTS
No Yes Total No. of employees Freq Percent Freq Percent Freq Percent 1.‐10 78 70% 92 49% 170 57% 11.‐25 27 24% 48 25% 75 25% 26.‐50 2 2% 27 14% 29 10% 51‐100 4 4% 22 12% 26 9% Total 111 100% 189 100% 300 100% % of total 37% 63% 100%
About 63% SMEs had awareness about bank loan products. Majority ,42%, SMEs got such awareness through business colleagues ,27% through the banks’ marketing

43
43
staff, 21% through their friends and families. About 37% SMEs had not awareness about bank products nor were they approached by the banks. This signifies the need for further improvement in banks’ sales and extensive marketing efforts for expanding their SME Portfolios, specially to trading SMEs.
Whether Applied for Bank Loan?
EVER APPLIED FOR BANK LOAN No Yes Total
No. of employees Freq Percent Freq Percent Freq Percent 1.‐10 153 61% 24 47% 177 59% 11.‐25 69 28% 19 37% 88 29% 26.‐50 22 9% 6 12% 28 9% 51‐100 5 2% 2 4% 7 2% Total 249 100% 51 100% 300 100% % of total 83% 17% 100%
The data obtained from the surveyed SMEs showed that Only 17% of the SMEs applied for bank loans, whereas the remaining 83 % didn’t apply for the bank loans. About 61% of those having 1-10 employees never applied for loan . About47% of the firms having upto 10 employees applied for bank loans as compared to 37% firms having 11-25 employees, 12% firms with 26-50 employees and 4% firms having up to 100 employees.

44
44
Reasons for Not Applying Loans
REASON FOR NOT APPLYING BANK LOAN Reason Freq Percent Lack of awareness 77 26% Religious grounds 75 25% Cumbersome and lengthy procedure 94 31% High interest rate 54 18% Total 300 100%
About 31% of the SMEs who had never applied for bank loans were due to cumbersome and lengthy procedure of banks for giving loans specially documentation requirements are too tough and look as good for large SMEs. About 26% didn’t apply for the loans due to lack of awareness about bank loan facilities and other products.25% said interest based banking products as one of the reasons for not applying for loan. While 18% felt uncomfortable with bank’s interest rate as compared to other sources. Loan Acceptance Ratio
About 84% of the SMEs in the district didn’t apply for loan and those who applied were able to obtain the loans which are shown above. 14% of those who got their loans accepted and only 2% got their loans rejected on certain grounds. The banks loan acceptance ratio is 87.5% which shows that banks are conscious about loan to SMEs and more willing to cater for their financial needs.
IF YES, WHAT WAS THE FATE OF THE LOAN Accepted Rejected Not applied In process Total

45
45
No. of employees Freq Percent Freq Percent Freq Percent Freq. Percent Freq 1.‐10 13 32% 4 57% 164 66% 2 100% 183 11.‐25 21 51% 2 29% 63 25% 0 0% 86 26.‐50 3 7% 1 14% 22 9% 0 0% 26 51‐100 4 10% 0 0% 1 0% 0 0% 5 Total 41 100% 7 100% 250 100% 2 100% 300 % of total 14% 2% 83% 1%
The firm size wise analysis of loan acceptance and rejection ratio shows that 57% of the firms whose loan applications were rejected were very small having upto 10 employees while 51% of the SMEs whose loans were accepted were having 11-25 workers. About 32% of the firms having up to 10 employees got their loan accepted. Medium sized firms having employees 1-25 had greater tendency to apply for bank loans. Hence their loan acceptance ratio is higher too. The period since 1st Loan Obtained
Majority ,65%,of the SMEs in Sukkur district who obtained loan was during the last 10 years which was due to expansion and growth of banking sector in the district. Specially during 2002 to 2008.. About 14% SMEs of those which obtained bank loans had availed the loans by the year 1998, whereas about 10% got their loans during 1978-1998.
Reasons for bank loan rejection The sample size of those who got their loans rejected was very small, about 2%, in the district .The majority,43%, of the SMEs surveyed in the district Sukkur reported absence of financial statement as the main reason for their loan applications being rejected. Another 29% said they failed to show adequate collaterals required for the loan. Inadequate property titles and insufficient cash flow was another reason given by 14% respondents for each.

46
46
REASON FOR LOAN REJECTION Reason Freq Percent Lack of collaterals 2 29% Inadequate property titles 1 14% Insufficient cash flows 1 14% Financial statements 3 43%
Types of bank Loans availed of
The data obtained from the survey showed that about 51% of respondant SMEs having access to loans obtained loan for short term running finance to their business. About 24% obtained availed of as personal loan and 22% availed as long term fixed investment. Whereas only one of SMEs availed of a loan for export financing. The results further showed that most of the SMEs in the district availed of short term loans and long term loans. Whereas the proportion of other type of loans like for export financing was very low.
No. of days consumed in obtaining loan The majority ,51%, SMEs took averagely 1-30 days for obtaining bank loans whereas about 16% consumed 31-60 days in obtaining loan while 22% consumed two to three months in getting their loans sanctioned. As discussed earlier, majority ,83%, SMEs in the district did not apply for the loans while 2% got their loan applications rejected . This low proportion of SMEs willing for loans is due to long waiting of more days in the process.
NO.OF DAYS CONSUMED IN

47
47
OBTAINING LOAN
Freq Percent % age of 49 SME which availed loan
Not applied 249 83% ‐‐ Rejected 7 2% ‐‐ 1.‐30 25 8% 51% 31‐60 8 3% 16% 61‐180 11 4% 22% Total 300 100%
Preferred Source of Finance
Preferred Source of Finance Source Freq Percent Family and friends 138 46% Banks 40 13% SME banks 4 1% Advance from suppliers 2 1% Advance from Buyers 1 0% Don't want to take loan 15 5% Friends & family and Banks 100 33% Total 300 100%
Majority ,46%, of the SMEs in the district Sukkur prefer borrowing from the Friends & Families due to convenience in obtaining loan , easy availability with less requirements and low or no interest rate . However 33% SMEs in the district responded that they would like to barrow from friends and families as well as banks .About 13% said they would prefer to have loan from banks as it can satisfy their requirements of large amount and for relatively longer period as compared to friends and families.
7- KEY ISSUES IN SME
Key Issues Percent
Excessive Regulation 56%
Energy shortage 94%

48
48
Key Issues 1. Excessive Regulations
56% of SME owners (manufacturers and
traders) who were surveyed consider excessive
regulations as key hurdle in growth. The SMEs
owners complained about the attitude and
disturbance caused by government officials
due to excessive regulations. The complaints
were mainly about the attitude of income tax
department and pathetic attitude of government agencies created to support SMEs in
Pakistan .
High Energy Cost 87%
Water shortage 41%
Difficulties in marketing & selling 49%
Obsolete technology 42%
Rising competition particularly from Chinese Product 55%
Limited R&D and BDS support 48%
Lack of capital and financial resource 46%
Limited awareness about backward / forward integration 51%
Low skill mix of labor 43%
Low productivity of labor 35%
Limited focus of the government on vocation and technical training 63%

49
49
2. Energy Shortages 94% of the respondents consider electricity shortage as main issue; both traders and
manufacturing SMEs suffer losses due to long intermittent of electricity. Manufacturing
sector was highly vulnerable due frequent load shedding which resulted breakdowns in
their production due to this they had to layoff the employees which resulted in increase in
unemployment.
3. High Energy cost
At the time of survey the fuel and oil prices were rising rapidly. 87% SMEs considered
rise in the energy cost as the main issue. According to their opinion, increase in energy
prices forced them to increase the product prices which effected negatively on the sales of
SMEs.
4. Difficulties in Marketing and Selling the Products
48% SME owners found difficulties in marketing and selling their products. This is due to
limited knowledge of the SMEs owner about the marketing activities & the marketing
strategy developed by non professional people. Mostly SMEs were reluctant from higher
professional people for marketing activities.
5. Rising Competition from Chinese Products
55% consider rising competition due to inflow of Chinese products. They consider
competition from the invasion of Chinese product in to Pakistani market as danger for their
survival due to cheap prices of Chinese products.
6. Limited R & D and BDS support: 48% SMEs consider limited R&D and BDS as key issues . This support is not very
promising because of limited infrastructure and lack of support from government agencies.
Although government has created such institutions like SMEDA, but a lot of SMEs owners
were either unaware of such facilities or they were unsatisfied from their support and
services.
7. Lack of Technical and Professional Training Institutions

50
50
42% consider obsolete technology as key hurdle while 51% of SME owners have limited or
no awareness about forward and backward integration. 43% of respondents consider low
skill mix of labor as key issues. On the other hand, 63% consider that this is because of
limited focus of the government on vocational and technical training.
8. Lack of Capital and Financial Resources 46% of the SMEs owners surveyed consider the lack of capital and financial resources as a key
hurdle in the growth of their firms. This problem arose because majority of SMEs owner were
reluctant to borrow from the formal sources such as banks due to lengthy and cumbersome
procedures or they could not arrange collaterals .
8- CONCLUSION
The Purpose of this SME survey at Sukkur district was to explore the dynamics of rural
enterprises to facilitate and enhance the stake holders’ understanding of the rural economy
of Sukkur district. The main purpose behind this survey was also to enhance the
understanding behind low credit absorption ratio in enterprises of the region and facilitate
banks to provide access to credit to the people of this area by enhancing the outreach. The
survey has provided deeper and better insight about the characteristics of rural economy.
The following key points summarize the key findings of the survey
MANUFACTURING
• 82% of Manufacturing SMEs businesses in district is held by sole proprietorship
form of business , while the 11% are private limited companies

51
51
• 89% of SMEs manufacturers neither got formal training for their businesses
including that of Apprenticeship nor training related to educational programs
• 67% receive informal training in traditional Ustad Shagird structure and/or trained
by family elders
• 56% of manufacturing SMEs surveyed have employees between 1-10 while 42.57%
are those SMEs having employees between 11-50 and only 1.35% having (51-100).
• 66% of the manufacturers get basic raw materials and inputs from the same
province.
• Average raw materials inventory maintained by manufacturers in the district is of
Rs. 1542500
• 36% of the manufacturers had no growth or negative growth in sale of their
production, whereas 58% of the manufacturers have 25% growth in their sale while
5% of the manufacturers have 25% to 50% growth in their sale.
• 87% of the manufacturing firms had the bank accounts
• 48% of the sample responded that they need financing for the expansion of their
business
• Only 22 (14%) out of 150 respondents had borrowed from banks. However, only 27
respondents ever applied for the bank loan
• 34% respondents borrowed from the business community, which was found to be
the major source of borrowing.
• 27% of respondents were approached by the staff of the banks for financial services.
TRADING
• 84.7% of the traders from the sample are having proprietorship legal type of
business; about 15.3% are having partnership businesses

52
52
• 34% having graduation, 21.3% of traders have master’s degree respectively.
From the sample about 21.3% have intermediate; 14% have matriculation; 7%
have middle and only 2% have primary as highest educational qualifications.
• The survey result shows that 24% of the total respondents received informal
training (Ustad-Shagrid) as trainer-trainee and only 9% received formal training.
• 31% of respondents having working experience of about (5-10) years, 28.6%
have about (15-20) years and 21.3% have about (0.5-5) years.
• 67.3% of traders self started, 29.3% inherited and only 3.3% purchased the
existing businesses.
• About 93% of traders from sample have less than ten employees.
• 61.3% owned their premises from sample of traders.
• Only 16% of traders from the sample prepare formal statements.
• 18.7% of respondents from the sample of traders were aware about BDS.
• 88.7% of traders from the sample had bank accounts, which served them as the
avenue for the exchange and security of the money, and the bank finance. Of
them 53% of respondent traders had bank account in their own names
(proprietor), 37% had SME bank accounts
• About 47% availed of short term running finance and 5% of those availed export
• About 18% consumed more than 30 days and only 9.1% got loan within ten
days.
• 70% of respondent traders, who have outstanding loans got finance from friends
and families and 30% got from commercial banks.

53
53
SME association in Sukkur
Agriculture Market Trader Association 162
Sukkur Hardware 27
Khajoor Mandi Traders & exporters Association 37
SITE Association 119
Cloth Market Traders Association 85
Sukkur Chamber Of commerce ( member Class) 162
Sukkur Chamber Of commerce ( Associate Class) 162