Food Porn as Visual Narrative: Food Blogging and Identity ...
FOOD COMPOSITION AND ADDITIVES
Simultaneous Determination of Eight Synthetic Permitted and Five Commonly Encountered Nonpermitted Food Colors in VariousFood Matrixes by High-Performance Liquid Chromatography
SUMITA DIXIT, SUBHASH K. KHANNA, and MUKUL DAS1
Indian Institute of Toxicology Research, Food Toxicology Division, Council of Scientific and Industrial Research,Mahatma Gandhi Marg, PO Box 80, Lucknow–226001, U.P., India
A simple and sensitive HPLC method has beendeveloped for the simultaneous determination ofeight permitted food colors and five commonlyencountered nonpermitted colors in various foodcommodities, including sugar-, fat-, andstarch-based food matrixes. The method uses aspecific food category-based cleanup/treatmentprocedure before color extraction to avoid theinterference of food matrixes, and to obtain theoptimal color extraction. Analysis was performedon a reversed-phase C18 m-Bondapak column withammonium acetate and acetonitrile gradientelution as the mobile phase; a programmablelmax-specific visible detection was used to monitorcolors to obtain the higher sensitivity andexpanded scope needed for multicolor blendshaving diverse absorption maxima. All colorsshowed good linearity, with regression coefficients of 0.9974–0.9999. The LOD and LOQ values rangedfrom 0.01 to 0.12 mg/L, and from 0.04 to 0.83 mg/Lor mg/kg, respectively. The intraday and interdayprecision tests produced good RSD values, andthe recoveries from different food matrixes rangedfrom 82 to 104%. The method offers highsensitivity for analysis of a wide variety of foodmatrixes containing a broad scope of multicolorblends. Two nonpermitted colors, orange II andmetanil yellow, were found. Also, a number ofsamples contained permitted colors at levels two-to seven-fold higher than those prescribed.
Synthetic permitted colors are additives that are extensively
used in foodstuffs to enhance sensory perception and ensure
the uniform appearance of food. As many as 36 synthetic
dyes have been used as food coloring agents throughout the
world (1). Food colors are comprehensively screened for safety,
and their use is governed by the regulations of individual countries
(2–4). Reliable methods are needed to determine colors in specific
food commodities and to ensure compliance of maximum
allowable limits.
Chromatographic methods, such as those using paperchromatography (5, 6), TLC (7, 8), and open-columnchromatography (9), were widely used earlier but are nowconsidered dated methodologies. GC methods have restrictedapplication to synthetic dyes, principally because of the highmolecular weights of these compounds, their lack of volatility, and their limited stability at high temperatures (10). Capillaryelectrophoresis methods have also been used for syntheticdyes but have limited use in routine analyses (11–15). HPLCis presently the most-preferred technique because it offers thebest resolution potential and sensitivity (16–23).
The Prevention of Food Adulteration Act of India permits
eight food colors: brilliant blue FCF, carmoisine, erythrosine,
fast green FCF, indigo carmine, ponceau 4R, sunset yellow
FCF, and tartrazine (4). Many of these colors are allowed in
other countries worldwide (24–28). These colors are acidic and
water-soluble, and belong to the azo, triarylmethane, xanthene,
and indigoid dye groups. Besides the use of permitted
food colors, the indiscriminate use of various nonpermitted
colors has been reported from time to time and poses serious
health concerns (29–36). Several survey studies on the
use pattern of food colors in the Indian markets have
been undertaken (37–43) using the conventional paper
chromatographic method, which is also the officially prescribed
method of the Indian food regulatory authority (44).
None of the HPLC methods for the simultaneous
resolution of various permitted food colors and nonpermitted
dyes in a variety of food commodities is presently available.
Therefore, an attempt has been made to develop an HPLC
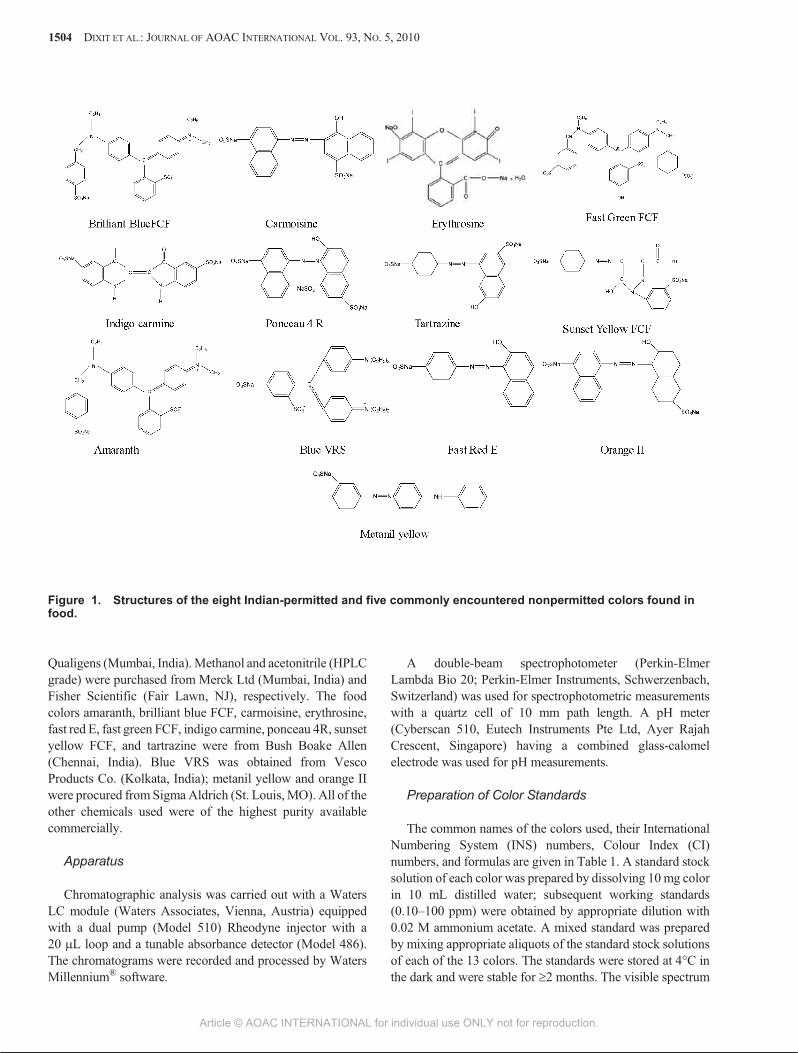
method that can resolve all eight Indian-permitted food colors,
as well as five commonly encountered nonpermitted colors
found in a wide range of food matrixes. The structures of these
colors are shown in Figure 1.
Experimental
Reagents
ExelaR grade liquor ammonia (specific gravity, 0.91) andHPLC grade ammonium acetate were procured from
DIXIT ET AL.: JOURNAL OF AOAC INTERNATIONAL VOL. 93, NO. 5, 2010 1503
Received November 13, 2009. Accepted by SG January 28, 2010.1 Corresponding author’s e-mail: [email protected]
Article © AOAC INTERNATIONAL for individual use ONLY not for reproduction.
Qualigens (Mumbai, India). Methanol and acetonitrile (HPLC grade) were purchased from Merck Ltd (Mumbai, India) andFisher Scientific (Fair Lawn, NJ), respectively. The foodcolors amaranth, brilliant blue FCF, carmoisine, erythrosine,fast red E, fast green FCF, indigo carmine, ponceau 4R, sunset yellow FCF, and tartrazine were from Bush Boake Allen(Chennai, India). Blue VRS was obtained from VescoProducts Co. (Kolkata, India); metanil yellow and orange IIwere procured from Sigma Aldrich (St. Louis, MO). All of the other chemicals used were of the highest purity availablecommercially.
Apparatus
Chromatographic analysis was carried out with a WatersLC module (Waters Associates, Vienna, Austria) equippedwith a dual pump (Model 510) Rheodyne injector with a20 mL loop and a tunable absorbance detector (Model 486).The chromatograms were recorded and processed by WatersMillennium® software.
A double-beam spectrophotometer (Perkin-ElmerLambda Bio 20; Perkin-Elmer Instruments, Schwerzenbach,Switzerland) was used for spectrophotometric measurementswith a quartz cell of 10 mm path length. A pH meter(Cyberscan 510, Eutech Instruments Pte Ltd, Ayer RajahCrescent, Singapore) having a combined glass-calomelelectrode was used for pH measurements.
Preparation of Color Standards
The common names of the colors used, their InternationalNumbering System (INS) numbers, Colour Index (CI)numbers, and formulas are given in Table 1. A standard stocksolution of each color was prepared by dissolving 10 mg colorin 10 mL distilled water; subsequent working standards(0.10–100 ppm) were obtained by appropriate dilution with0.02 M ammonium acetate. A mixed standard was preparedby mixing appropriate aliquots of the standard stock solutionsof each of the 13 colors. The standards were stored at 4°C inthe dark and were stable for ³2 months. The visible spectrum
1504 DIXIT ET AL.: JOURNAL OF AOAC INTERNATIONAL VOL. 93, NO. 5, 2010
Figure 1. Structures of the eight Indian-permitted and five commonly encountered nonpermitted colors found infood.
Article © AOAC INTERNATIONAL for individual use ONLY not for reproduction.
DIXIT ET AL.: JOURNAL OF AOAC INTERNATIONAL VOL. 93, NO. 5, 2010 1505
Table 1. Common names, INS numbers, CI numbers, lmax values, and formulas of the standard synthetic food colors studied
Common name INS number CI number lmax, nm Formula
Permitted colors
Brilliant blue FCF 133 42090 629 C37H34N2Na2O9S3
Carmoisine 122 14720 515 C10H12N2Na2O7S2
Erythrosine 127 45430 526 C20H6I4Na2O5
Fast green FCF 143 42053 625 C37H34N2O10S3Na3
Indigo carmine 132 73015 610 C16H8N2Na2O8S2
Ponceau 4R 124 16255 505 C20H11N2Na3O10S3
Tartrazine 102 19140 425 C16H9N4Na3O9S2
Sunset yellow FCF 110 15985 486 C16H10Na2O7S2N2
Nonpermitted colors
Amaranth 123 16185 523 C20H11N2Na3O10S3
Blue VRS NAa 42045 635 C27 H31N2O6S2 Na
Fast red E NA 16045 515 C20H12N2Na2O7S2
Metanil yellow NA 13065 423 C18H14N3NaO3S
Orange II NA 15510 487 C16H11N2NaO4S
a NA = Not available.
Table 2. Retention time (RT), efficiency factor (k¢A), and resolution coefficient (Rs) values obtained for the 13standard colors with different mobile phasesa
Mobile phase A Mobile phase B Mobile phase C
Colors RT, min k¢Ab Rsc RT, min k¢A Rs RT, min k¢A Rs
Permitted colors
Brilliant blue FCF 7.06 1.63 0.0 15.31 1.54 1.1 12.7 2.24 1.8
Carmoisine 7.06 1.63 0.0 13.96 1.32 1.6 11.29 1.88 1.9
Erythrosine 8.30 2.08 3.7 17.13 1.85 4.5 14.22 2.62 5.2
Fast green FCF 7.06 1.63 0.0 13.96 1.32 1.6 11.29 1.88 1.9
Indigo carmine 5.92 1.20 1.2 8.42 0.40 1.0 6.43 0.64 3.4
Ponceau 4R 5.92 1.20 0.0 9.17 0.52 2.4 6.57 0.67 0.8
Tartrazine 5.50 1.04 0.0 7.21 0.20 0.0 4.91 0.25 0.0
Sunset yellow FCF 6.27 1.33 2.0 10.28 0.71 3.2 8.11 1.07 7.8
Nonpermitted colors
Amaranth 5.73 1.13 1.4 8.16 0.36 3.5 5.81 0.48 4.0
Blue VRS 8.60 2.20 1.0 17.59 1.92 1.1 15.34 2.91 3.8
Fast red E 7.06 1.63 2.8 13.40 1.23 9.0 10.82 1.76 11.3
Metanil yellow 10.59 2.93 6.5 18.64 2.10 2.0 17.20 3.38 7.2
Orange II 8.60 2.20 0.0 17.59 1.92 0.0 15.44 2.94 0.4
a Mobile phase A: methanol:NaH2PO4–Na2HPO4 (0.1 M, pH, 7.0); mobile phase B: 0.1 M ammonium acetate (pH 6.7):methanol–acetonitrile(50 + 50, v/v); and mobile phase C: 0.02 M ammonium acetate–acetonitrile.
b k¢A = tR – tM/tM (where k¢A is the capacity factor, tR is the retention time of the analyte, and tM is the time taken for the mobile phase to passthrough the column).
c Rs = 2[(tR)B – (tR)A]/ WA + WB, (where Rs is the resolution factor, (tR)B is the RT of peak B, (tR)A is the WA + WB RT of peak A, and WA + WB isthe peak width of peak A plus the peak width of peak B.
Article © AOAC INTERNATIONAL for individual use ONLY not for reproduction.
of each standard color was obtained to determine therespective lmax (Table 1).
Preparation of Samples
All tested samples were obtained from the local market.The solid samples were crushed into fine powder, if possible,and homogenized. The samples were stored underrefrigeration until further processing.
Fatty foods (milk sweets, cereal/pulse-based sweets, andbakery items) were found to require a predefatting step toavoid fat interferences in the color extraction and subsequentresolution. An accurately weighed sample (5 g) was placed ina conical flask, 30 mL petroleum ether (60–80°C) was added,and the flask was shaken for 1 h in a water bath shaker atmoderate speed. The petroleum ether layer was decanted, andthe process was repeated four or five times, using a freshsolvent each time, until the sample was fully defatted. It wasthen kept in a Petri dish at room temperature for removal ofpetroleum ether.
As part of a treatment step for starchy foods (savory items,such as sago and rice papad, sheermal, fryums, and roastedBengal gram), hot water soaking was needed to enable them to swell up; otherwise color extraction was hampered. After twopretreatments of fatty and starchy foods as described above,the color was extracted with 10 mL 4% ammoniacal
methanol; the contents of the extraction vessel were shakenwell, the extract was centrifuged, and the supernatant wascollected. The process was repeated with fresh solvent untilthe color was completely extracted. The supernatants werepooled, transferred quantitatively to a 50 mL volumetric flask, and diluted to volume.
The color from water-soluble samples (hard-boiled sugarconfectioneries, fruit drinks, fruit gels, jams, ice candies,coated candies, sugar-coated colored fennels, and fruitcandies) was extracted according to the Food StandardAgency method (45).
A 10 mL aliquot of the color extract from all of the abovefood commodities was evaporated to dryness in a rotaryevaporator. The residue was dissolved in 1.0 mL 0.02 Mammonium acetate, and the solution was filtered through aMillipore 0.45 mm PVDF membrane filter before HPLCinjection.
Chromatographic Conditions
A 300 ´ 3.9 mm id reversed-phase (RP) C18 m-Bondapakcolumn having a particle size of 15–20 mm attached to a90 mm precolumn was used for analysis. The components ofthe mobile phase were filtered under vacuum through amembrane filter with a 0.45 mm pore diameter. The injectionvolume was set at 20 mL. The optimal mobile phase consisted
1506 DIXIT ET AL.: JOURNAL OF AOAC INTERNATIONAL VOL. 93, NO. 5, 2010
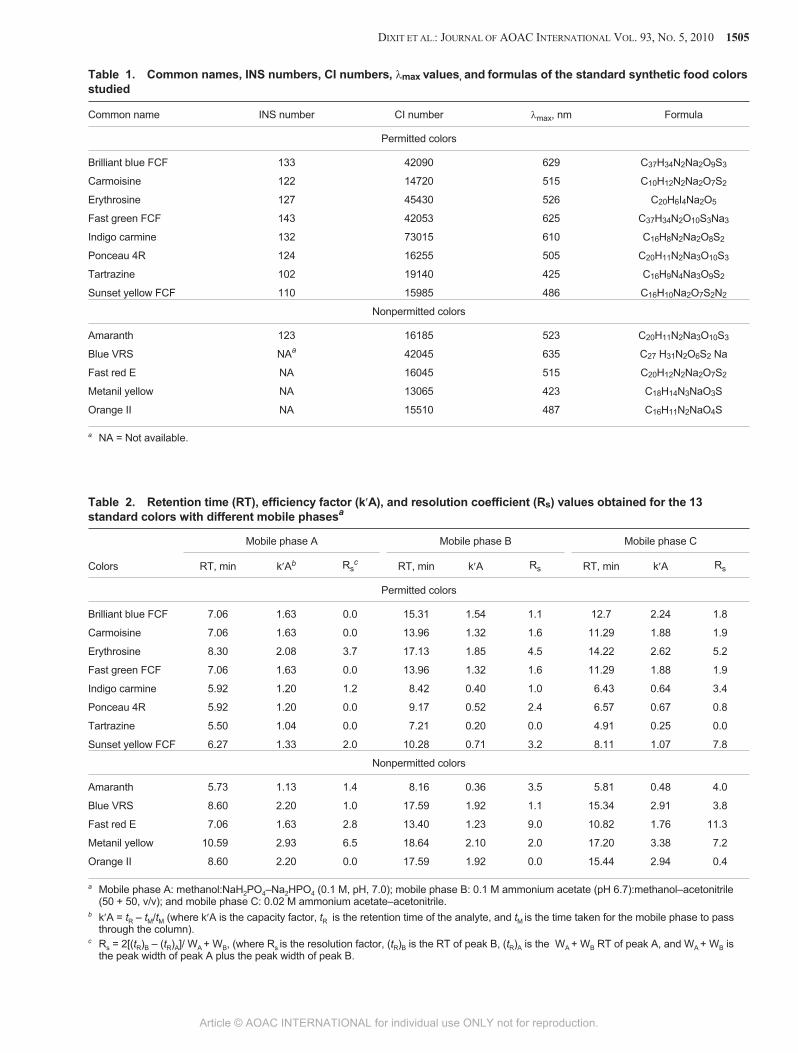
Figure 2. HPLC resolution of commonly encountered colors: (a) chromatogram of eight permitted and fivenonpermitted colors; (b) chromatogram of three identified colors in a food sample.
Article © AOAC INTERNATIONAL for individual use ONLY not for reproduction.

of 0.02 M ammonium acetate (eluant A) and acetonitrile
(eluant B) programmed for a linear gradient of 24 min, with a
flow rate of 1 mL/min. From initial zero to 20 min, a gradient
from 95% eluant A:5% eluant B to 50% A:50% B was used.
Between 20 and 24 min, 0% A:100% B was used. The column
was then washed with Millipore water for 20 min followed by
acetonitrile for 10 min. Finally, a 10 min equilibrium phase of
the column was used to restore the initial conditions of
95% A:5% B. The UV-Vis detector was specifically
programmed to monitor the individual colors at their
respective maximum absorbance wavelengths. The eluate was
monitored at wavelengths of 425 nm (0–5 min) for tartrazine;
523 nm (5–5.8 min) for amaranth; 560 nm (5.8–7.0 min) for
indigo carmine and ponceau 4R; 486 nm (7.0–8.0 min) for
sunset yellow FCF; 515 nm (8.0–11.5 min) for fast red E and
carmoisine; 600 nm (11.5–12.8 min) for fast green FCF and
brilliant blue FCF; 526 nm (12.8–14.0 min) for erythrosine;
540 nm (14.0–15.5 min) for blue VRS and orange II; and423 nm (15.5–20 min) for metanil yellow. Although the lmax
values for indigo carmine, ponceau 4R, blue VRS, andorange II were 610, 505, 635, and 487 nm, respectively,common wavelengths of 560 nm for indigo carmine andponceau 4R, and 540 nm for blue VRS and orange II werechosen because the retention times of these colors were quiteclose. Similarly, fast green FCF and brilliant blue FCF weremeasured at 600 nm, as wavelengths of >600 nm could not beselected with the detector used.
Results and Discussion
Optimization of the Separation
Two columns, 100 RP C18 Licrospher, 125 ´ 4.6 mm id(Merck, Darmstadt, Germany) and RP C18 m-Bondapak, 300 ́3.9 mm id (Waters), were tested. The Licrospher column wasfound to be unsuitable for resolving all of the tested colors.
DIXIT ET AL.: JOURNAL OF AOAC INTERNATIONAL VOL. 93, NO. 5, 2010 1507
Figure 3. Calibration curves showing linearity of permitted and nonpermitted colors.
Article © AOAC INTERNATIONAL for individual use ONLY not for reproduction.
1508 DIXIT ET AL.: JOURNAL OF AOAC INTERNATIONAL VOL. 93, NO. 5, 2010
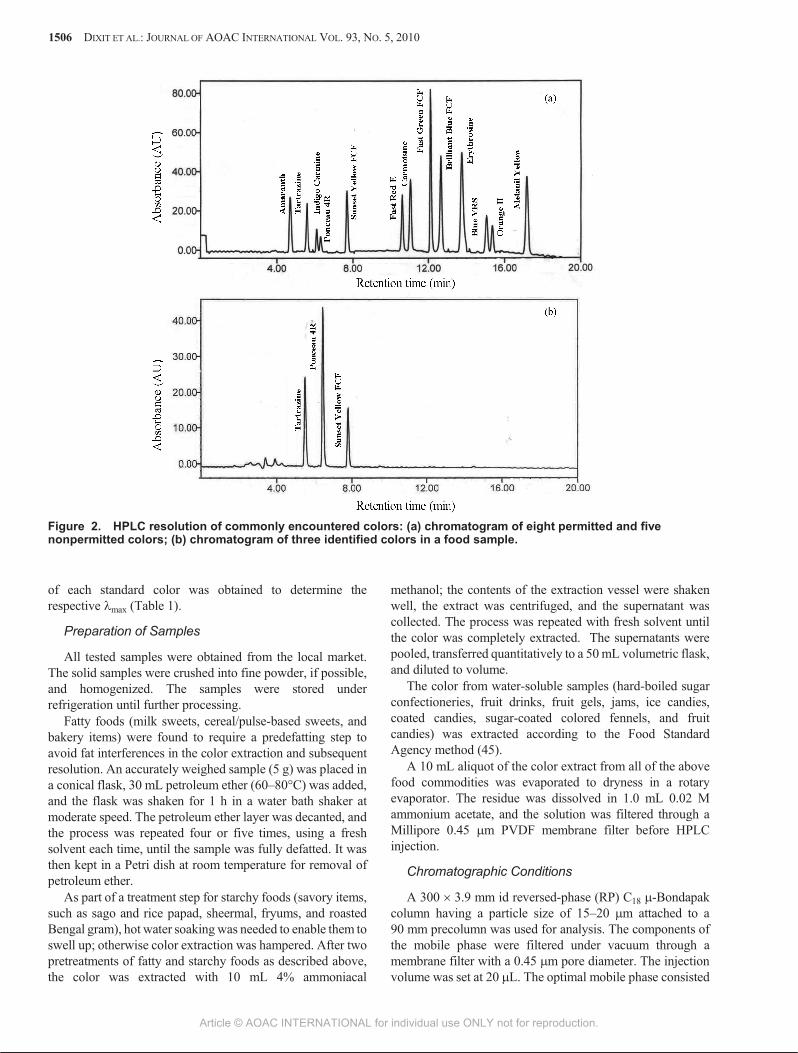
Table 3. Linear regression equations, linearity ranges, regression coefficients, LODs, and LOQs obtained for the 13standard colors
Color Equation Y = b + mxa Linearity range, mg/L Regression coefficient LOD, mg/L LOQ, mg/kg or mg/L
Permitted colors
Brilliant blue FCF –1.77 ´ 103 + 5.89 ´ 104 0.125–4.0 0.9990 0.06 0.10
Carmoisine –0.58 ´ 103 + 4.63 ´ 104 0.10–10.0 0.9999 0.09 0.12
Erythrosine 0.66 ´ 103 + 5.91 ´ 104 0.10–10.0 0.9975 0.04 0.05
Fast green FCF –0.61 ´ 103 + 7.04 ´ 104 0.125–4.0 0.9989 0.05 0.09
Indigo carmine 0.22 ´ 103 + 3.41 ´ 104 0.125–4.0 0.9998 0.05 0.08
Ponceau 4R –0.92 ´ 103 + 3.76 ´ 104 0.10–10.0 0.9999 0.06 0.15
Tartrazine 1.30 ´ 103 + 3.86 ´ 104 0.25–20.0 0.9994 0.01 0.04
Sunset yellow FCF –1.40 ´ 103 + 4.04 ´ 104 0.062–10.0 0.9988 0.02 0.09
Nonpermitted colors
Amaranth 0.36 ´ 103 + 2.88 ´ 104 0.10–10.0 0.9998 0.01 0.20
Blue VRS –0.29 ´ 103 + 8.78 ´ 104 0.125–4.0 0.9995 0.05 0.10
Fast red E –0.41 ´ 103 + 3.69 ´ 104 0.10–10.0 0.9993 0.01 0.83
Metanil yellow 2.14 ´ 103 + 3.44 ´ 104 0.25–20.0 0.9983 0.12 0.21
Orange II –6.33 ´ 103 + 12.92 ´ 104 0.062–10.0 0.9974 0.09 0.11
a Y = linearity, b = intercept, and mx = slope of the curve.
Table 4. Repeatability of peak area and RT values obtained for a standard mixture of the 13 colors
Color Average RT, mina SD (RT), min RSD, % Avg. peak areaa SD (peak area) RSD, %
Permitted colors
Brilliant blue FCF 12.70 0.06 0.46 237764 9100 3.83
Carmoisine 11.29 0.09 0.83 230105 5509 2.39
Erythrosine 14.22 0.11 0.74 305175 14133 4.63
Fast green FCF 12.25 0.07 0.56 293072 11699 3.99
Indigo carmine 6.43 0.05 0.83 139571 2885 2.07
Ponceau 4R 6.57 0.14 2.14 182183 6013 3.30
Tartrazine 4.91 0.17 3.55 160039 7003 4.38
Sunset yellow FCF 8.11 0.19 2.33 159835 3614 2.26
Nonpermitted colors
Amaranth 5.81 0.08 1.36 146966 5368 3.65
Blue VRS 15.34 0.05 0.32 373267 15934 4.27
Fast red E 10.82 0.08 0.76 183600 83153 4.53
Metanil yellow 17.19 0.05 0.32 126040 1857 1.47
Orange II 15.43 0.06 0.41 497169 18032 3.63
a Retention time and peak area are the average values derived from five individual analyses of a standard mixture containing each color at125 mg/L.
Article © AOAC INTERNATIONAL for individual use ONLY not for reproduction.

Tartrazine, amaranth, indigo carmine, ponceau 4R, and sunset yellow FCF eluted within 5 min, with close retention time(RT) values; the efficiency factor of most of the colors was >5. In the case of the m-Bondapak column, all of the colors elutedwith a distinct RT, and the efficiency factor was <5, thus, thiscolumn was chosen for further analyses.
The food colors studied in this paper are hydrophilic andhave low RT values in RP-HPLC. Thus, testing was requiredwith combinations of organic solvent and buffer as the mobilephase to obtain optimal resolution and peak symmetry. Threedifferent buffered mobile phases used earlier for resolution offood colors by FSA (45), Berzas-Nevado et al. (46), andYoshioka and Ichihashi (47) were tested. Mobile phase A,consisting of eluant A (methanol) and eluant B
(NaH2PO4–Na2HPO4, 0.1 M), pH 7.0, was undertaken with alinear gradient from the initial eluant composition (20% eluant A: 80% eluant B) to the final eluant composition (100% eluant A), with a flow rate of 1 mL/min for 10 min.
For mobile phase B, eluant A was 0.1 M ammoniumacetate (pH 6.7), and eluant B was methanol–acetonitrile (50+ 50, v/v). The gradient elution was 3% eluant B initially,increased linearly to 60% in 18 min, and held at 60% for2 min, with a flow rate of 1 mL/min. A return to the initialconditions was carried out in 10 min.
The two components of mobile phase C consisting of0.02 M ammonium acetate (eluant A) and acetonitrile(eluant B) was programmed as a linear gradient of 24 min,with a flow rate of 1 mL/min. From initial zero to 20 min, a
DIXIT ET AL.: JOURNAL OF AOAC INTERNATIONAL VOL. 93, NO. 5, 2010 1509
Table 5. Intraday and interday precision of the food colors
Intraday precisiona Interday precisiona
Color Concn, mg/L Avg. peak area RDSr, % SE Avg. peak area RDSR, % SE
Permitted colors
Brilliant blue FCF 0.25 10961 4.21 267 11986 8.25 571
0.50 20867 2.04 246 24369 5.84 823
Carmoisine 0.80 35741 4.00 827 35520 3.75 770
2.00 86828 1.89 950 90142 1.40 727
Erythrosine 0.80 49572 1.95 558 48893 3.27 923
2.00 138200 1.11 883 138092 1.02 816
Fast green FCF 0.25 13489 1.62 126 14344 6.91 573
0.50 25575 1.24 183 34014 1.39 274
Indigo carmine 0.25 7604 5.55 244 7134 3.40 140
0.50 14436 2.04 170 17179 0.97 96
Ponceau 4R 0.80 26594 6.09 937 28080 6.10 991
2.00 75518 1.10 482 73861 1.81 774
Tartrazine 2.00 79920 2.10 972 82088 1.69 800
4.00 151734 1.02 894 154339 1.11 988
Sunset yellow FCF 0.50 20516 0.87 103 20104 3.79 440
1.00 42706 1.40 347 42294 2.11 515
Nonpermitted colors
Amaranth 0.80 23494 6.58 893 22902 6.05 801
2.00 61372 2.29 811 59220 1.35 462
Blue VRS 0.25 15396 8.01 712 15159 5.92 519
0.50 28092 0.65 106 34261 2.15 425
Fast red E 0.80 29548 1.28 219 22902 6.05 801
2.00 72827 2.24 941 59220 1.35 462
Metanil yellow 2.00 79427 1.61 739 79448 1.57 722
4.00 141640 1.15 945 134130 1.16 899
Orange II 0.50 59177 2.63 900 58815 1.78 605
1.00 133372 0.91 700 136782 1.10 868
a n = 3.
Article © AOAC INTERNATIONAL for individual use ONLY not for reproduction.

gradient from 95% eluant A:5% eluant B to 50% A:50% Bwas used. Between 20 and 24 min, 0% A:100% B was used.The column was then washed with Millipore water for 20 min, followed by acetonitrile for 10 min. Finally, the columnequilibrated for 10 min to recover the initial conditions of 95% A:5% B.
The RT, resolution coefficient, and efficiency factor values for 13 standard colors in the three mobile phases (Table 2)revealed that mobile phase A was not suitable because manycolors were not resolved. Ponceau 4R and indigo carmineboth eluted at an RT of 5.92 min; fast red E, carmoisine, fastgreen FCF, and brilliant blue FCF coeluted at an RT of7.06 min. Orange II and blue VRS produced one peak at anRT of 8.60 min. In mobile phase B, the RT values of manycolors were unduly prolonged; blue VRS and orange II had acommon RT of 17.59 min. Although the efficiency factors ofcolors in both mobile phases were <5, the resolutioncoefficient of most colors was either 0 or <1.5 because of theco-elution of several colors. Mobile phase C led to thesatisfactory resolution of all the colors (Figure 2a), withefficiency factor within 5 and resolution coefficient of >1.5.Two colors, ponceau 4R and orange II, had resolutioncoefficients of 0.8 and 0.4, respectively, although theirresolution remained unaffected.
Validation of the Method
To support regulatory action, a method must be shown tobe accurate and sensitive, and able to identify analytes withhigh selectivity. For this purpose, evaluation of the analytical
method included determination of linearity, sensitivity, LOD,LOQ, precision, and recovery. The linearity of the assay waschecked by analyzing duplicate sets of each standard color;each calibration graph was obtained by plotting peak areaversus concentration (Figure 3). Amaranth, carmoisine, fastred E, ponceau 4R, and erythrosine showed good linearity atconcentrations of 0.10–10.0 mg/L; tartrazine and metanilyellow, between 0.25–20.0 mg/L; sunset yellow FCF andorange II, between 0.0625 and 10.0 mg/L; and brilliant blueFCF, fast green FCF, indigo carmine, and blue VRS in therange of 0.125–4.0 mg/L. The regression coefficient variedfrom 0.9974 to 0.9999. The LOD and the LOQ werecalculated by using the equations
LOD = 3.3 (s/S) and LOQ = 10 (s/S)
where s is the SD of the response, and S is the slope of thecorresponding calibration curve. The LOD of the 13 colorsstudied ranged from 0.01 to 0.12 mg/L, while the LOQ variedfrom 0.04 to 0.83 mg/L (Table 3). The studies carried out byZhang and Gao (23) showed that the LOQ values fortartrazine, amaranth, ponceau 4R, sunset yellow FCF, andbrilliant blue FCF were in the range of 0.007–0.037 mg/L,which demonstrated relatively more sensitivity than the LOQvalues from the present study (0.04–0.2 mg/L); these lowerLOQ values may be attributed to the use of a diode-arraydetector (DAD), and the lmax value of the different colors.However, LOQ values obtained by Prado and Godoy (19)using DAD at a fixed wavelength ranged from 1.03 to
1510 DIXIT ET AL.: JOURNAL OF AOAC INTERNATIONAL VOL. 93, NO. 5, 2010
Table 6. Recoverya of individual colors from different spiked food matrixesb
Recovery range, % RSD range, %
Color Fatty foods Starchy foodsWater-soluable
samples Fatty foods Starchy foodsWater-soluable
samples
Permitted colors
Brilliant blue FCF 92.1–93.4 93.1–95.4 95.2–102.7 1.57–1.72 2.42–2.63 0.47–2.65
Carmoisine 89.8–90.6 90.6–91.6 92.2–94.0 2.13–3.28 1.97–3.50 1.11–1.34
Erythrosine 89.8–93.3 90.6–95.3 91.3–100.4 1.82–2.38 1.12–3.21 4.70–4.80
Fast green FCF 91.2–94.2 93.2–95.6 96.1–100.2 1.82–3.02 2.63–4.73 0.71–4.33
Indigo carmine 91.0–93.3 89.4–93.5 99.0–101.9 1.34–3.05 2.19–2.79 1.47–3.18
Ponceau 4R 82.1–87.2 85.1–88.6 90.7–93.1 3.09–5.51 2.10–3.30 1.04–3.27
Tartrazine 87.9–94.3 91.3–93.3 96.0–102.9 1.44–4.74 1.14–3.33 1.00–1.87
Sunset yellow FCF 87.9–94.3 87.4–93.1 95.5–98.9 1.44–4.74 1.70–3.95 1.48–3.47
Nonpermitted colors
Amaranth 85.4–86.8 86.1–88.5 91.0–94.0 1.40–2.54 2.28–3.43 2.68–3.99
Blue VRS 90.4–91.8 91.0–92.6 93.1–100.1 2.40–3.41 1.58–4.15 0.82–2.77
Fast red E 91.1–91.5 90.6–94.4 92.6–94.8 1.37–2.26 1.30–2.68 0.64–3.85
Metanil yellow 91.3–93.7 91.9–93.1 91.1–103.9 1.84–2.28 2.09–4.00 0.79–5.01
Orange II 90.0–94.7 89.0–93.6 90.8–93.5 2.09–3.96 1.88–5.06 1.17–2.89
a Recovery of the colors was performed in duplicate; the mean data are presented.b Spiking levels were 50, 75, and 100 mg/kg or mg/L.
Article © AOAC INTERNATIONAL for individual use ONLY not for reproduction.
DIXIT ET AL.: JOURNAL OF AOAC INTERNATIONAL VOL. 93, NO. 5, 2010 1511
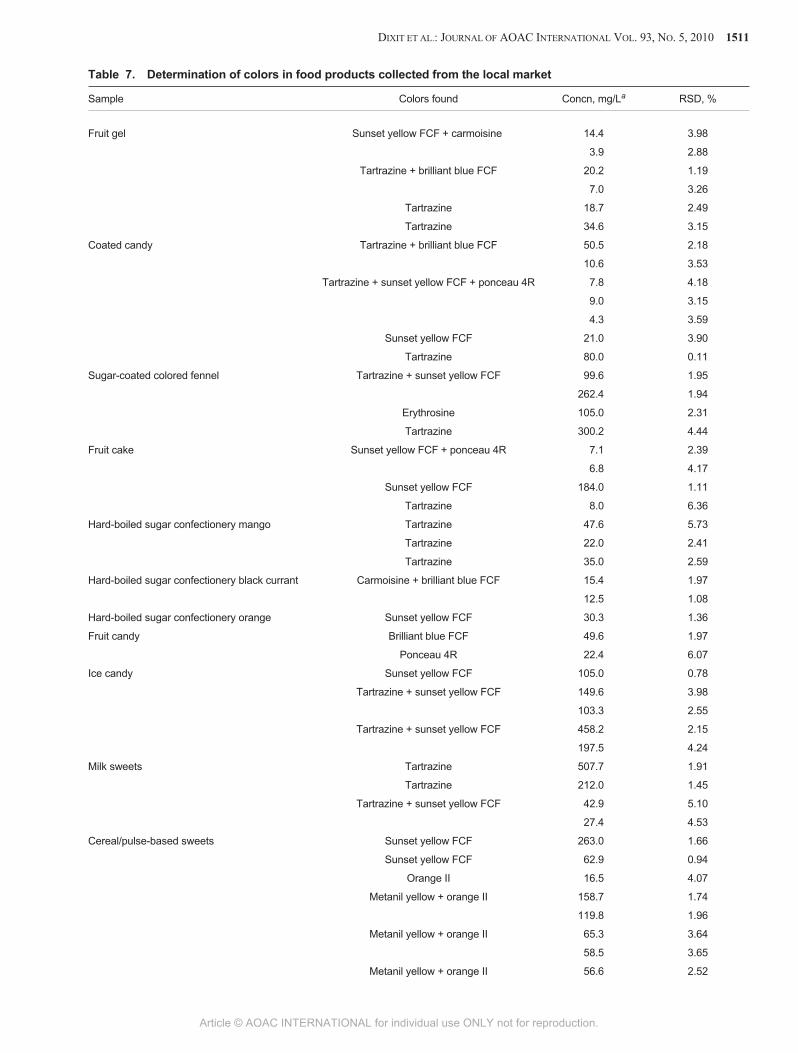
Table 7. Determination of colors in food products collected from the local market
Sample Colors found Concn, mg/La RSD, %
Fruit gel Sunset yellow FCF + carmoisine 14.4 3.98
3.9 2.88
Tartrazine + brilliant blue FCF 20.2 1.19
7.0 3.26
Tartrazine 18.7 2.49
Tartrazine 34.6 3.15
Coated candy Tartrazine + brilliant blue FCF 50.5 2.18
10.6 3.53
Tartrazine + sunset yellow FCF + ponceau 4R 7.8 4.18
9.0 3.15
4.3 3.59
Sunset yellow FCF 21.0 3.90
Tartrazine 80.0 0.11
Sugar-coated colored fennel Tartrazine + sunset yellow FCF 99.6 1.95
262.4 1.94
Erythrosine 105.0 2.31
Tartrazine 300.2 4.44
Fruit cake Sunset yellow FCF + ponceau 4R 7.1 2.39
6.8 4.17
Sunset yellow FCF 184.0 1.11
Tartrazine 8.0 6.36
Hard-boiled sugar confectionery mango Tartrazine 47.6 5.73
Tartrazine 22.0 2.41
Tartrazine 35.0 2.59
Hard-boiled sugar confectionery black currant Carmoisine + brilliant blue FCF 15.4 1.97
12.5 1.08
Hard-boiled sugar confectionery orange Sunset yellow FCF 30.3 1.36
Fruit candy Brilliant blue FCF 49.6 1.97
Ponceau 4R 22.4 6.07
Ice candy Sunset yellow FCF 105.0 0.78
Tartrazine + sunset yellow FCF 149.6 3.98
103.3 2.55
Tartrazine + sunset yellow FCF 458.2 2.15
197.5 4.24
Milk sweets Tartrazine 507.7 1.91
Tartrazine 212.0 1.45
Tartrazine + sunset yellow FCF 42.9 5.10
27.4 4.53
Cereal/pulse-based sweets Sunset yellow FCF 263.0 1.66
Sunset yellow FCF 62.9 0.94
Orange II 16.5 4.07
Metanil yellow + orange II 158.7 1.74
119.8 1.96
Metanil yellow + orange II 65.3 3.64
58.5 3.65
Metanil yellow + orange II 56.6 2.52
Article © AOAC INTERNATIONAL for individual use ONLY not for reproduction.
3.66 mg/L for indigo carmine, brilliant blue FCF, amaranth,ponceau 4R, erythrosine, tartrazine, and sunset yellow FCF.These values demonstrated less sensitivity than the LOQvalues obtained by the present method using LC with UV-Visdetection (0.04–0.83 mg/L) for all 13 colors. Earlier, twoseparate studies were carried out with only five or six colors,using LC with UV-Vis detection at a single wavelength, butneither method reported specific LOQ values (22, 46).
To test the repeatability of peak area and RT values, weanalyzed a standard mixture of colors. The RSD values for RT ranged from 0.32% (metanil yellow) to 3.55% (tartrazine).The RSD values for peak area ranged from 1.47% (metanilyellow) to 4.63% (erythrosine), as shown in Table 4. The peak area and RT values obtained by the developed methodologydemonstrated a good level of repeatability, with RSD valueswithin ±5%. Kirschbaum et al. (20) had shown similar RT and peak area RSD values for five of the 13 colors investigated inthe present study.
Method efficiency was tested in terms of good RSD valuesfor both intraday and interday precision. The intradayprecision (RSDr) varied from 0.65% for blue VRS at0.62 mg/L to 6.58% for amaranth at 1.00 mg/L. The interdayprecision (RSDR) ranged from 0.97% for indigo carmine at0.62 mg/L to 6.91% for fast green FCF at 0.31 mg/L (Table 5).
In order to evaluate the trueness of the method, recoveryexperiments were performed by spiking fatty foods, starchyfoods, and water-soluble samples with standard colors at three concentrations, i.e., 50, 75, and 100 mg/kg or mg/L. Thevalues indicate an adequate recovery rate, although therecoveries of colors from fatty (82–95%) and starchy foods(85–96%) were slightly lower than those from water-solublematrixes (91–104%), as shown in Table 6. The higher valuesreported by Prado and Godoy (19), Berzas-Nevado et al. (46),
and Minioti et al. (48) for recoveries from beverages sampleswere similar to our recoveries from water-soluble samples.
In various studies, colors were extracted from foodsamples with warm water (19, 48) or by directly diluting thesamples with water for injection after homogenization anddegassing (17, 22, 23, 46, 49). This type of simple extractioncould not be used for complex food matrixes, such as milksweets, cereal/pulse-based sweets, typical local bakeryproducts, and starchy foods (savories), widely encountered inIndian markets, for which defatting and hot water soakingwere found necessary before color extraction. Thus, twocleanup/treatment steps were used in the present study toensure the selectivity of color extraction and to avoid theinterference of food matrixes. Also, programming themonitoring of colors at the respective lmax values allowedbetter sensitivity and simultaneous determination of multiplecolors having diverse absorption maxima. Thus, the newlydeveloped method has an advantage over the method ofBerzas-Nevado et al. (46), in which a single wavelength(520 nm) was used to determine blue, red, and yellow colors,or over the methods of Prado and Godoy (19) and Kirschbaum et al. (20), in which different compromised wavelength bandswere used separately for resolution of various color shades.
Application to Real Samples
Five samples each of loose nonbranded food commodity
groups procured from the local market were analyzed, and the
results revealed that most food items (fruit gel, coated candy,
sugar-coated colored fennel, fruit cake, hard-boiled sugar
confectionery, ice candy, and milk sweets) had blends of two or
more colors (Figure 2b). Tartrazine was the most prevalent single
color, followed by sunset yellow FCF and carmoisine. All
1512 DIXIT ET AL.: JOURNAL OF AOAC INTERNATIONAL VOL. 93, NO. 5, 2010
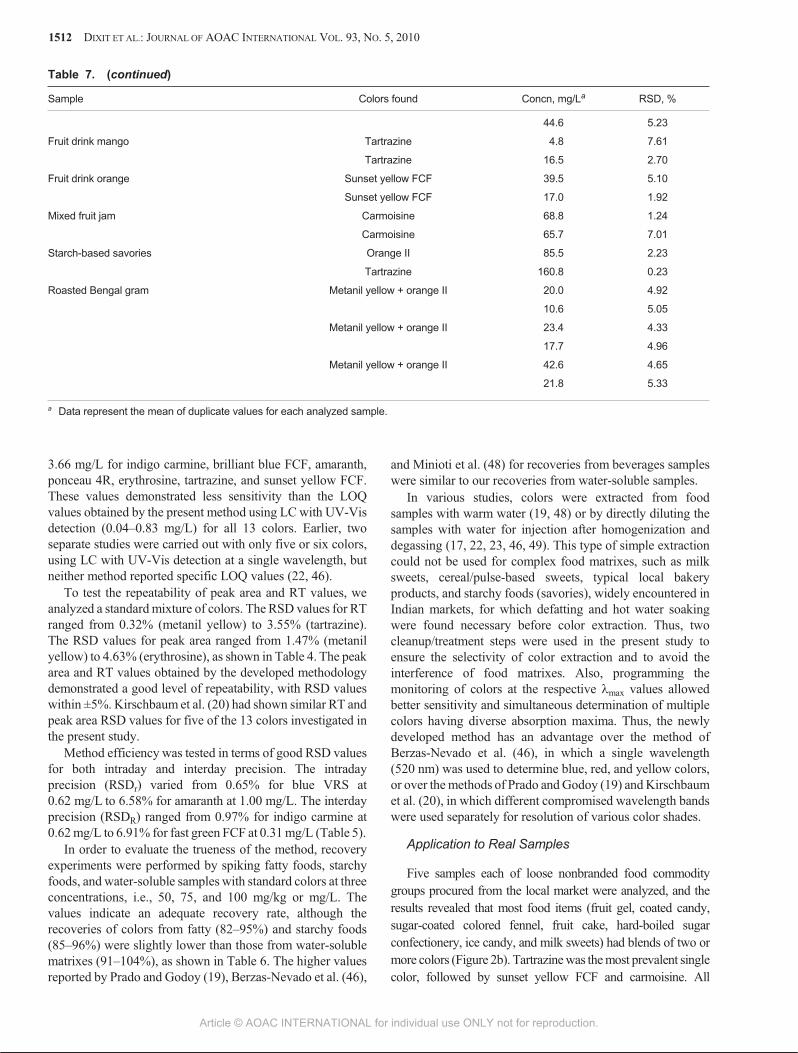
Table 7. (continued)
Sample Colors found Concn, mg/La RSD, %
44.6 5.23
Fruit drink mango Tartrazine 4.8 7.61
Tartrazine 16.5 2.70
Fruit drink orange Sunset yellow FCF 39.5 5.10
Sunset yellow FCF 17.0 1.92
Mixed fruit jam Carmoisine 68.8 1.24
Carmoisine 65.7 7.01
Starch-based savories Orange II 85.5 2.23
Tartrazine 160.8 0.23
Roasted Bengal gram Metanil yellow + orange II 20.0 4.92
10.6 5.05
Metanil yellow + orange II 23.4 4.33
17.7 4.96
Metanil yellow + orange II 42.6 4.65
21.8 5.33
a Data represent the mean of duplicate values for each analyzed sample.
Article © AOAC INTERNATIONAL for individual use ONLY not for reproduction.
samples of sugar-coated colored fennel seeds and ice candy, two
samples of milk sweets, and one each of cereal-based sweet and
starch-based savory were found to exceed the Indian maximum
permissible limit of 100 ppm by two- to seven-fold (Table 7).
Among the commonly encountered nonpermitted colors,
orange II, alone and in blends with metanil yellow, was detected
in 4.6 and 13.9% of samples, respectively; many samples
contained the colors in the range of 100–300 mg/L, although no
permissible limit has been established for them (Table 7). Both
colors are known to cause various toxic manifestations (29–31).
The intake of permitted and nonpermitted colors at such high
levels could be hazardous to health.
Conclusions
The present method demonstrates utility, sensitivity, and
time efficiency in the determination of 13 colors, including
eight Indian-permitted colors and five commonly encountered
nonpermitted colors in a single run by using programmable
LC with UV-Vis detection. HPLC resolution of the
commonly encountered nonpermitted colors, namely, blue
VRS, fast red E, metanil yellow, and orange II, has been
reported for the first time. The method uses different
cleanup/extraction procedures before color extraction to avoid
the interference of complex food matrixes, thereby offering a
combination of selectivity and convenience. Programmed
monitoring of colors at their respective lmax values provides
high sensitivity and the scope to analyze a broad variety of real
market samples containing typical multicolor blends.
Acknowledgments
We are grateful to the Director, Indian Institute of
Toxicology Research (IITR), for his keen interest in the
present study. Author S.K. Khanna is the Superannuated
Scientist from IITR. Financial support of the Council of
Scientific and Industrial Research Network Project No. 17 is
gratefully acknowledged. The manuscript is IITR
communication No. 2779.
References
(1) Coulson, J. (1980) in Developments in Food Colors, J.Walford (Ed.), Applied Science Publication Ltd, London,UK, pp 1–25
(2) EC Council Directive 94/36/EC (30 June 1994) Off. J. Eur.Commun. L237, 1–17
(3) U.S. Food and Drug Administration, (2007) Code of FederalRegulations, Title 21, Part 73, U.S. Government PrintingOffice, Washington, DC
(4) The Prevention of Food Adulteration Act 1954 and Rules(2008) 28th Ed., Eastern Book Co., Lucknow, UP, India, pp349–367
(5) Sramek, J. (1964) J. Chromatogr. A 15, 57–64
(6) Griffiths, M.H.E. (1966) J. Food Technol. 1, 63–72
(7) Hoodless, R.A., Pitman, K.G., Stewart, T.E., Thomson, J., &Arnold, J.E. (1971) J. Chromatogr. A 54, 393–404
(8) Lepri, L., Desideri, P.G., & Coas, V. (1978) J. Chromatogr.A 161, 279–286
(9) Yanuka, Y., Shalon, Y., Weissenberg, E., & Nir-Grosfeld, I.(1963) Analyst 88, 872–876
(10) Terril, J.B., & Jacobs, E.S. (1970) J. Chromatogr. Sci. 8,604–607
(11) Suzuki, S., Shirao, M., Aizawa, M., Nakazawa, H., Sasa, K.,& Sasagawa, H. (1994) J. Chromatogr. A 680, 541–547
(12) Thompson, C.O., & Trenerry, V.C. (1995) J. Chromatogr. A704, 195–201
(13) Masar, M., Kaniansky, D., & Madajova, V. (1996) J.Chromatogr. A 724, 327–336
(14) Kuo, K.L., Huang, H.Y., & Hsieh, Y.Z. (1998)Chromatographia 47, 249–256
(15) Giovine, L.D., & Bocca, A.P. (2003) Food Control 14,131–135
(16) Gennaro, M.C., Gioannini, E., Angelino, S., Aigotti, R., &Giacosa, D. (1997) J. Chromatogr. A 767, 87–92
(17) Chen, Q.C., Mou, S.F., Hou, X.P., Riviello, J.M., & Ni, Z.M. (1998) J. Chromatogr. A 827, 73–81
(18) Perez-Urquiza, M., Prat, M.D., & Beltran, J.L. (2000) J.Chromatogr. A 871, 227–234
(19) Prado, M.A., & Godoy, H.T. (2002) J. Liq. Chromatogr.Relat. Technol. 25, 2455–2472
(20) Kirschbaum, J., Krause, C., Pfalzgraf, S., & Bruckner, H.(2003) Chromatographia Suppl. 57, S115–S119
(21) Kiseleva, M.G., Pimenova, V.V., & Eller, K.I. (2003) J.Anal. Chem. 58, 685–690
(22) Garcia-Falcon, M.S., & Simal-Gandara, J. (2004) FoodControl 16, 293–297
(23) Zhang, J., & Gao, N. (2007) Anal. Lett. 40, 3080–3094
(24) FSANZ (2010) Food Additives—Numerical List, FoodStandards Australia New Zealand, pp 1–12
(25) Canadian Food Inspection Agency (2009) PermittedSynthetic Colors in Canada and Corresponding United States and European Names, Ottawa, Ontario, Canada
(26) Food Standard Agency (2009) List of Additives CurrentlyPermitted in Food in the European Union and TheirE Numbers, London, UK
(27) Jukes, D.J. (2009) Food Additives in the European Union,University of Reading, Berkshire, UK
(28) Japan Food Chemical Research Foundation (2009) List ofDesignated Additives, Osaka, Japan
(29) Khanna, S.K., Singh, G.B., & Singh, S.B. (1973) J. Food Sci. Technol. 10, 33–36
(30) Khanna, S.K., Srivastava, L.P., & Singh, G.B. (1978)Environ. Res. 15, 227–231
(31) Khanna, S.K., Singh, G.B., & Krishnamurti, C.R. (1980) J.Food Sci. Technol. 17, 95–103
(32) Lewis, I.L., Patterson, R.M., & McBay, H.C. (1981) Mutart.Res./Gene Toxicol. 88, 211–216
(33) Marmion, D.L. (1991) Handbook of US Colorants: Foods,Drugs, Cosmetics, and Medical Devices, 3rd Ed., John Wiley & Sons, New York, NY
(34) Wutrich, B. (1993) Ann. Allergy 71, 379–384
(35) Bhatia, M.S. (2000) J. Clin. Psychiatry 61, 473–476
(36) Reus, K.E., Houben, G.F., Stam, M., & Dubois, A.E. (2000)Ned. Tijdschr. Geneeskd. 144, 1836–1839
DIXIT ET AL.: JOURNAL OF AOAC INTERNATIONAL VOL. 93, NO. 5, 2010 1513
Article © AOAC INTERNATIONAL for individual use ONLY not for reproduction.
(37) Biswas, G., Sarkar, S., & Chatterjee, T.K. (1994) J. Food Sci. Technol. 31, 66–67
(38) Dixit, S., Pandey, R.C., Das, M., & Khanna, S.K. (1995) J.Food Sci. Technol. 32, 373–376
(39) Rao, P., & Bhat, R.V. (2003) Nutr. Food Sci. 33, 230–234
(40) Mishra, K.K., Dixit, S., Purshottam, S.K., Pandey, R.C., Das, M., & Khanna, S.K. (2007) Int. J. Food Sci. Technol. 42,1363–1366
(41) Tripathi, M., Khanna, S.K., & Das, M. (2007) Food Control18, 211–219
(42) Dixit, S., Mishra, K.K., Khanna, S.K., & Das, M. (2008) Am. J. Food Sci. Technol. 3, 183–191
(43) Dixit, S., Purshottam, S.K., Khanna, S.K., & Das, M. (2009)Food Addit. Contam. A 26, 1227–1231
(44) Directorate General of Health Services (2005) Manual ofMethods of Analysis of Foods, Food Additives, Lab Manual8, Ministry of Health and Family Welfare, Government ofIndia, New Delhi, India, p. 77
(45) Food Standard Agency (2002) Survey of Colors in Sweets,Food survey, London, UK
(46) Berzas-Nevado, J.J., Guiberteau-Cabanillas, C., &Contento-Salcedo, A.M. (1998) Anal. Lett. 31, 2513–2535
(47) Yoshioka, N., & Ichihashi, K. (2008) Talanta 74, 1408–1413
(48) Minioti, K.S., Sakellariou, C.F., & Thomaidis, N.S. (2006)Anal. Chim. Acta 583, 103–110
(49) Zatar, N.A. (2007) J. Food Technol. 5, 220–224
1514 DIXIT ET AL.: JOURNAL OF AOAC INTERNATIONAL VOL. 93, NO. 5, 2010
Article © AOAC INTERNATIONAL for individual use ONLY not for reproduction.
Copyright © 2022 FDOKUMEN