Normal sleep in African-Americans and Caucasian-Americans: A meta-analysis
Upload
independentCategory
view
1download
0
Sickle cell trait is not independently associated withsusceptibility to end-stage renal disease in African Americans
Pamela J. Hicks1, Carl D. Langefeld2, Lingyi Lu2, Anthony J. Bleyer3, Jasmin Divers2,Patrick H. Nachman4, Vimal K. Derebail4, Donald W. Bowden1,3, and Barry I. Freedman5
1Department of Biochemistry, Wake Forest School of Medicine, Winston-Salem, North Carolina,USA2Department of Biostatistical Sciences, Wake Forest School of Medicine, Winston-Salem, NorthCarolina, USA3Center for Human Genomics and Diabetes Research, Wake Forest School of Medicine,Winston-Salem, North Carolina, USA4Department of Internal Medicine–Nephrology, University of North Carolina at Chapel Hill, ChapelHill, North Carolina, USA5Section on Nephrology, Department of Internal Medicine, Wake Forest School of Medicine,Winston-Salem, North Carolina, USA
AbstractConflicting reports exist as to whether sickle cell trait is a risk factor for the progression ofnephropathy. In order to determine whether African Americans with sickle cell trait are atincreased risk for kidney disease, we assessed the genetic association between sickle cell trait andend-stage renal disease (ESRD). Hemoglobin S, non-muscle myosin heavy chain 9 (MYH9), andapolipoprotein L1 (APOL1) risk variants were genotyped in 3258 unrelated African Americans:1085 with non-diabetic ESRD, 996 with type 2 diabetes-associated ESRD, and 1177 controls.Since APOL1 is strongly associated with ESRD in African Americans, interactions betweenAPOL1 and MYH9 risk variants and hemoglobin S were assessed using case-only and case-controlcentered two-way logistic regression interaction analyses. The sickle cell trait genotypefrequencies were 8.7% in non-diabetic ESRD, 7.1% in type 2 diabetes-ESRD, and 7.2% incontrols. There was no age-, gender-, and admixture-adjusted significance for sickle cell traitassociation with non-diabetic ESRD (odds ratio 1.16); type 2 diabetes-ESRD (odds ratio 1.01); orall-cause ESRD (combined non-diabetic and type 2 diabetic-ESRD patients compared to thecontrols; odds ratio 1.05) in dominant models. In addition, no evidence of APOL1 or MYH9interactions with sickle cell trait was detected. Hence, sickle cell trait is not associated withdiabetic or non-diabetic ESRD in a large sample of African Americans.
KeywordsAfrican American; APOL1; diabetes; end-stage kidney disease; hemoglobin S; hypertension
© 2011 International Society of NephrologyCorrespondence: Barry I. Freedman, Section on Nephrology, Department of Internal Medicine, Wake Forest School of Medicine,Medical Center Boulevard, Winston-Salem, North Carolina 27157-1053, USA. [email protected] the authors declared no competing interests.
NIH Public AccessAuthor ManuscriptKidney Int. Author manuscript; available in PMC 2012 February 16.
Published in final edited form as:Kidney Int. 2011 December ; 80(12): 1339–1343. doi:10.1038/ki.2011.286.
NIH
-PA Author Manuscript
NIH
-PA Author Manuscript
NIH
-PA Author Manuscript
Individuals homozygous for the sickle (S) variant of hemoglobin (Hb) A develop sickle celldisease, manifested by anemia, recurrent pain crises, chronic kidney disease, stroke, vascularocclusion, pulmonary disease, infectious complications, and premature mortality.1 Renalmanifestations in sickle cell disease may include loss of urinary concentrating ability,papillary necrosis, glomerular lesions, including focal segmental glomerulosclerosis (FSGS),interstitial scarring, and iron deposition.2 Sickle cell trait has been associated with papillarynecrosis, hematuria, and urinary concentrating defects.3 There have been conflicting reportsas to whether sickle cell trait is a risk factor for the development of diabetic nephropathy.4–6
A recent report described a high prevalence of sickle cell trait (heterozygous carriers; HbAS)among African American end-stage renal disease (ESRD) patients, suggesting an increasedrisk for individuals with HbAS.7 Replication analyses in larger samples have yet to beperformed.
The HbAS genotype is present in approximately 7–9% of African Americans, with higherfrequencies in younger individuals.8,9 HbS was selected for in Africa because of theprotection it affords from malarial infection, a scenario similar to the protection fromtrypanosomal infection provided by heterozygosity for apolipoprotein L1 (APOL1)nephropathy risk variants (G1: non-synonymous coding variant 342G:384M and G2: 6 bpdeletion).10,11 Whereas APOL1 contributes to nephropathy risk in an autosomal recessiveinheritance pattern, HbS reportedly had a dominant effect on risk,7 with sickle cell traitbeing associated with ESRD.
We tested for a genetic association between the single-nucleotide polymorphism encodingHbS and ESRD in African Americans residing in the southeastern United States todetermine whether the HbAS genotype was associated with commonly reported etiologies ofESRD. Cases with ESRD attributed to type 2 diabetes mellitus (T2D) and non-diabetesmellitus (non-DM) causes, predominantly ‘hypertension-attributed’ and glomerular diseaseassociated, were evaluated. In addition, relationships between APOL1 G1/G2 nephropathyrisk variants and non-muscle myosin heavy chain 9 gene (MYH9) risk variants (E1 riskhaplotype)12–14 and HbS were assessed to determine whether interactions between thesegenes were present.
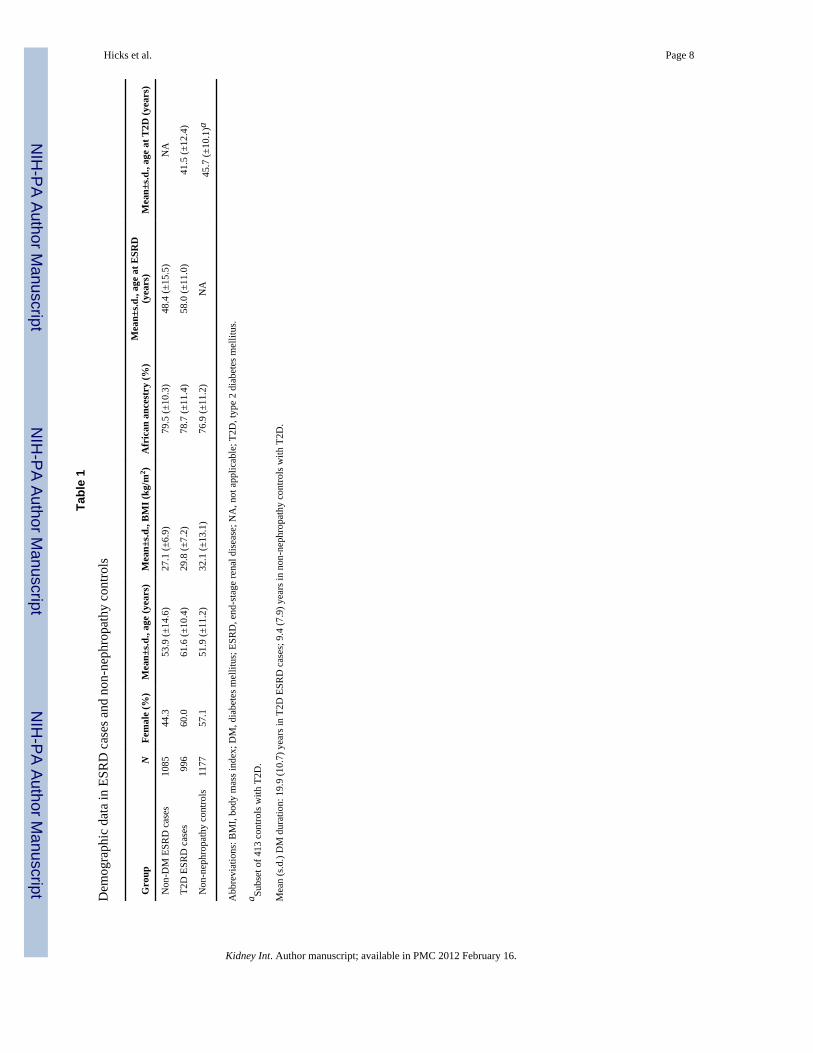
RESULTSAnalyses were performed in 1085 unrelated African American cases with nondiabeticetiologies of ESRD, 996 cases with T2D–ESRD, and 1177 non-nephropathy controls (413with T2D). Table 1 contains demographic data from these 3258 individuals. Althoughcontrols were younger than ESRD cases, they were older than the mean age at onset of T2Dand ESRD in the T2D–ESRD and non-DM ESRD cases, respectively. Relative to the non-nephropathy controls, ESRD cases had significantly higher percentages of African ancestry(Table 1; P-value =8.8 × 10⁻⁸). Individual African ancestry proportion data were used ascovariates in the program SNPGWA version 4.0(http://www.phs.wfubmc.edu/public/bios/gene/downloads.cfm) to calculate genotypicassociation.
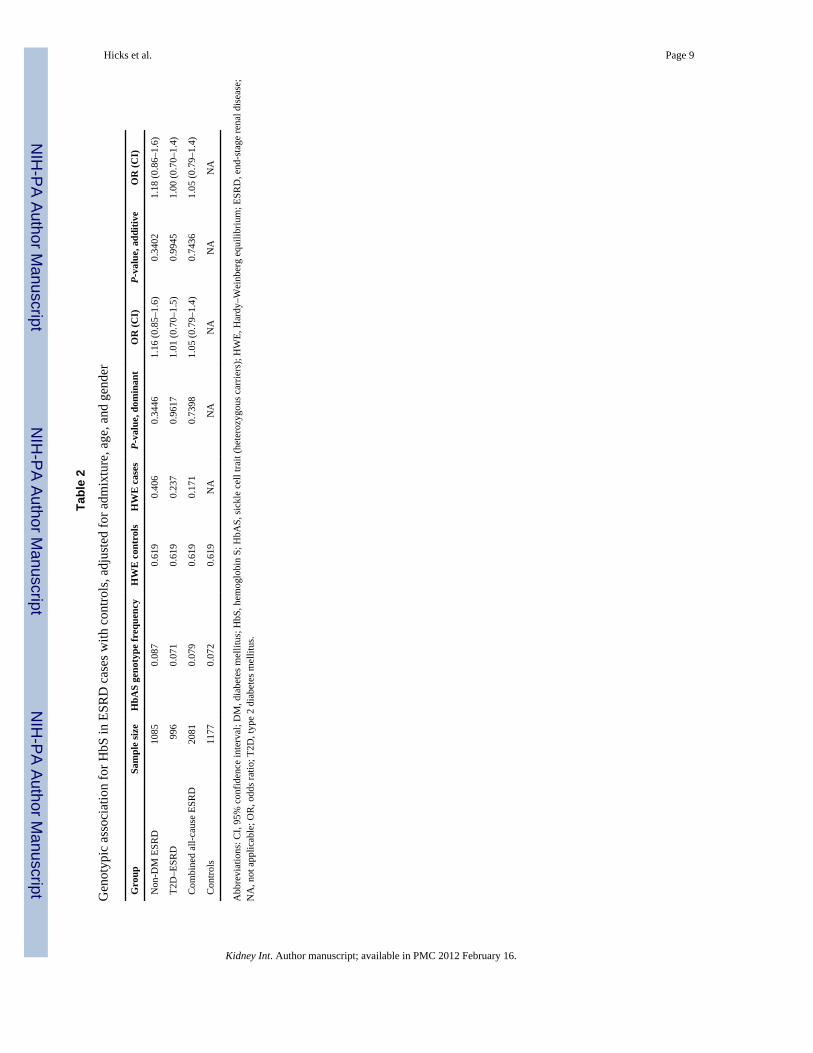
Table 2 displays HbAS genotype frequencies and Hardy–Weinberg equilibrium results inthe cases and controls. HbS met Hardy–Weinberg equilibrium expectations in all groupswith a genotype frequency of 7.2% in controls, 8.7% in non-DM ESRD cases, and 7.1% inT2D–ESRD cases. Table 2 reveals the African ancestry-adjusted association results for HbSin non-DM ESRD cases, T2D–ESRD cases, and all-cause (combined) ESRD cases, relativeto non-nephropathy controls. Significant evidence of association was not detected in age,gender, and ancestry-adjusted analyses in cases with non-DM ESRD (odds ratio (OR) 1.16;95% confidence interval (CI) 0.85–1.60; P =0.34, dominant model), cases with T2D–ESRD
Hicks et al. Page 2
Kidney Int. Author manuscript; available in PMC 2012 February 16.
NIH
-PA Author Manuscript
NIH
-PA Author Manuscript
NIH
-PA Author Manuscript

(OR 1.01; 95% CI 0.70–1.50; P =0.96, dominant model), or all-cause (combined) ESRDcases (OR 1.05; 95% CI 0.79–1.40; P =0.74, dominant model). Additional analyses wereperformed by comparing the 1085 non-DM ESRD cases with the 704 nondiabetic controlsand the 996 T2D–ESRD cases with the 413 T2D controls, and no evidence of associationwith HbAS was detected (data not shown). When including diabetes duration as a covariatein the model, results were unchanged and HbAS was not associated with T2D–ESRD (OR1.13; 95% CI 0.68–1.67; P =0.63).
Age, gender, and African ancestry-adjusted APOL1 association testing revealed an OR=4.45 for association in all ESRD cases (recessive model, 95% CI 3.60–5.49; P =9.24E−44).Table 3 contains the results of interaction analyses between HbAS and APOL1, and HbASwith MYH9 nephropathy risk variants employing both the powerful case-only method, aswell as the case–control two-way interaction method. Because of low counts of HbShomozygotes, only the dominant model had sufficient power for analysis. As shown, therewas no interaction between HbS and the MYH9 E1 risk haplotype or APOL1 G1 and G2alleles.
DISCUSSIONThe current report tested for genetic association between sickle cell trait and commoncomplex forms of ESRD in African Americans. No evidence of association between HbASand either diabetic or nondiabetic etiologies of ESRD was detected in this large sample ofAfrican Americans from the southeastern United States. In addition, no evidence of aninteraction was seen between chromosome 22q nephropathy risk variants in APOL1 orMYH9 and HbS. Patients with sickle cell disease are known to develop renal abnormalities,including risk for ESRD requiring renal replacement therapy. Our results stand in contrast toa series of 188 patients with ESRD reported by Derebail et al.7 In that series, almost 15% ofESRD cases had sickle cell trait as determined by high-performance liquid chromatography.We performed direct genotyping in 2081 African Americans with ESRD. In addition,interaction analyses were performed in this report as chromosome 22q nephropathy riskvariants predispose to FSGS and focal global glomerulosclerosis in African Americans,lesions that are reported to occur in higher frequency in patients with sickle cell disease.2FSGS and focal global glomerulosclerosis are now known to comprise the vast majority ofcases with non-DM ESRD in African Americans.10,11,15
Strengths of the current report include the large sample size, direct genotyping for HbS, andadjustment for overall percentage of African ancestry, age, and gender. Moreover, potentialgene–gene interactions were assessed between HbS and powerful renal diseasepolymorphisms in the APOL1 and MYH9 genes. Individuals with HbAS genotypes have anormal lifespan and are typically unaffected unless exposed to low oxygen tension (highaltitude) or high oxygen demand. APOL1 and HbS both appear to have been selected for inAfrica on the basis of the protection they afford from malaria and trypanosomal infection,respectively. However, this analysis suggests that APOL1 and HbS both appear to beassociated with susceptibility to nephropathy in autosomal recessive patterns, with noevidence of risk for nephropathy in individuals heterozygous for risk variants (e.g., thosewith sickle cell trait). Additional evidence from our group supports the lack of an effect ofsickle cell trait on development of subclinical nephropathy in African Americans withdiabetes mellitus.5 The cohort studied by Bleyer et al.5 was limited to individuals withdiabetes mellitus who underwent determinations of estimated glomerular filtration rates withsimultaneous glycated hemoglobin testing during outpatient clinic visits at Wake ForestBaptist Medical Center; they were not enriched for ESRD. None of those individuals werecases or controls in this report. Therefore, the current results in cases with severenephropathy (ESRD) are consistent with those in subclinical nephropathy.
Hicks et al. Page 3
Kidney Int. Author manuscript; available in PMC 2012 February 16.
NIH
-PA Author Manuscript
NIH
-PA Author Manuscript
NIH
-PA Author Manuscript
One must be careful to evaluate for any potential bias that could occur and affect the studyresults. The cases were recruited from dialysis centers throughout the southeastern UnitedStates. A bias would be whether patients with sickle cell trait preferentially underwentkidney transplantation or whether individuals with sickle cell trait would be less likely toparticipate in our study. It is interesting to note that many individuals do not realize that theyhave sickle cell trait,16 and testing for sickle cell trait is not routinely done in ESRD patients.This would reduce the chance of bias. The prevalence of sickle cell trait in the controlpopulation was similar in our study and that of Derebail et al.7 Controls in their report werederived from North Carolina live-birth screenings for African Americans. The NorthCarolina State Laboratory provided de-identified results for all live births identified asAfrican American for counties in which University of North Carolina dialysis populationswere based. However, the prevalence of sickle cell trait was 15% in their ESRD populationcompared with 8% in the current study population. Although a different methodology wasused to determine the presence of sickle cell trait, this is unlikely to have led to thedifferences in our findings. The present study was much larger and encompassed a largergeographical area. A potential study limitation is the possibility that small numbers ofcontrols with chronic kidney disease could have been included; this would reduce thelikelihood of detecting association (although no trend was observed). Shorter T2D durationsin diabetic controls relative to T2D–ESRD cases could also influence results, althoughadjusting for diabetes duration did not change the results. It is difficult to identify largenumbers of African Americans with long durations of diabetes lacking microalbuminuriabecause of their high prevalence of nephropathy. In addition, subjects with DM may developprogressive chronic kidney disease in the absence of proteinuria. Finally, although logisticregression does not address the possibility that sickle trait may affect nephropathyprogression rates, we feel that these data and the report by Bleyer et al.5 make this lesslikely.
Association studies with multivariable adjustment may miss differences that can be revealedwith stratified analyses. Although stratification provides the strongest protection againstconfounding, it can also reduce power. We compared the distribution of the two continuouscovariates used in these analyses by sickle trait status. The mean (s.d.) of age and admixturewas 56.8 years (13.9) and 0.80% (0.1) in the sickle trait group and 55.7 years (12.9) and0.78% (0.1) in the non-sickle trait group. The Wilcoxon two-sample P-value was 0.19 forage and 0.003 for admixture; 53% of sickle trait carriers were women as were 55% of thenoncarriers (P =0.59). As admixture was associated with sickle trait status, we adjusted forit to prevent confounding. Approximately 7–9% of African Americans possess one copy ofHbS.8,9 Our report evaluated prevalent dialysis patients and similarly aged controls born inthe southeastern United States. Similar frequencies of HbS were observed in cases andcontrols, although this sample consisted of middle-aged and older participants. Our resultsneither support higher risk for ESRD in HbS carriers nor a survival bias whereby HbScarriers live longer than noncarriers. There is no a priori evidence that heterozygous carriersof HbS manifest improved survival and would therefore be more likely to survive to initiatedialysis. We further note that the strong APOL1 genetic association initially observed withFSGS was easily detectable in prevalent dialysis patients with all-cause ESRD from thisreport.
In contrast to an earlier, smaller report, we conclude that African Americans who have asingle copy of the HbS gene are not at increased risk for developing nondiabetic or diabeticESRD (or subclinical nephropathy), relative to unaffected individuals. In addition,nephropathy risk variants in APOL1 function independently from HbS when contributing tonondiabetic ESRD.
Hicks et al. Page 4
Kidney Int. Author manuscript; available in PMC 2012 February 16.
NIH
-PA Author Manuscript
NIH
-PA Author Manuscript
NIH
-PA Author Manuscript

MATERIALS AND METHODSPatient populations
Diagnostic criteria for African American participants in on-going genetic analyses of T2D-and non-T2D-associated ESRD at Wake Forest School of Medicine have beenreported.14,17,18 Briefly, self-described African Americans born in North Carolina, SouthCarolina, Georgia, Virginia, or Tennessee formed the study population. Peripheral bloodspecimens for DNA extraction were collected from unrelated prevalent dialysis patients whoreportedly had ESRD attributed to hypertension, glomerular disease, or T2D. Cases werediagnosed as having hypertension-attributed ESRD by virtue of high blood pressurepreceding initiation of renal replacement therapy with hypertensive target-organ damage(retinopathy or left ventricular hypertrophy) and low-level proteinuria (≤30 mg/dl on urinedipstick, <0.5 g protein/24 h on timed urine collection, or urine protein:creatinine ratio <0.5g/g) or in the absence of proteinuria measurements. In the presence of renal biopsy evidenceof a primary glomerular disease (e.g., FSGS), proteinuria ≥0.5 g/24 h or ≥100 mg/dl onurinalysis, nondiabetic subjects were diagnosed as having chronic glomerular disease-associated ESRD. T2D-associated ESRD was diagnosed in patients with diabetesdeveloping after the age of 25 years, with renal histological evidence of diabeticnephropathy or diabetes durations ≥5 years before initiating renal replacement therapy in thepresence of diabetic retinopathy and/or proteinuria >500 mg/24 h, or with >5 years diabetesduration before ESRD in the absence of other known causes of kidney disease. Individualswith cystic renal diseases, hereditary nephritis, or urological causes of ESRD were excluded.
The control group was recruited from the same geographical region as ESRD cases.Nondiabetic controls included 780 individuals without nephropathy identified at primarycare medicine clinics, community health fairs, and community screenings. Because of theirlow risk for developing nephropathy, serum creatinine concentrations were not uniformlymeasured in nondiabetic controls. However, in a subset of 602 of these controls, 98.4% werefound to have serum creatinine concentrations ≤1.5 mg/dl in men and ≤1.3 mg/dl in women(the 16 controls with elevated serum creatinine concentrations were excluded from analysis).Additional controls with T2D included 413 African American-Diabetes Heart Studyparticipants, all with serum creatinine concentrations ≤1.5 mg/dl in men and ≤1.3 mg/dl inwomen, and a spot urine albumin:creatinine ratio <30 mg/g.19 Although a small number ofcontrols may have chronic kidney disease, these criteria make it unlikely that many hadestimated glomerular filtration rates below 60 ml/min. All cases and controls providedwritten informed consent, and the study was approved by the Institutional Review Board atthe Wake Forest School of Medicine.
GenotypingDNA extraction from whole blood was performed using the PureGene system (GentraSystems, Minneapolis, MN). The HbS single-nucleotide polymorphism (rs334) wasgenotyped using the iPLEX Sequenom MassARRAY platform (San Diego, CA). Seventydiallelic ancestry informative markers were genotyped to determine whether populationsubstructure biased our results.20 The 44 Yoruba (YRI), 39 European American controls,1177 African American controls, and 2081 African American ESRD samples weregenotyped using Custom Genotyping Services (Illumina, San Diego, CA) or SequenomMassArray. Genotyping efficiency was >98.4%, and 104 blind duplicates were included toensure genotyping accuracy.
Statistical analysesHbS allele frequency differences between the case and control groups were analyzed usinglogistic regression multivariable models adjusting for admixture, age, and gender under a
Hicks et al. Page 5
Kidney Int. Author manuscript; available in PMC 2012 February 16.
NIH
-PA Author Manuscript
NIH
-PA Author Manuscript
NIH
-PA Author Manuscript
dominant genetic model. SNPGWA version 4.0 was used to calculate genotypic associationadjusted for African ancestry proportions. FRAPPE (Frequentist Estimation of IndividualAncestry Proportion) was used to calculate African ancestry proportions in the case andcontrol population.20
An interaction term between HbS and (a) MYH9 risk variants or (b) APOL1 risk variantswas fitted in the logistic regression model to assess whether the OR of HbS variedsignificantly with risk status for MYH9 or APOL1. MYH9 ‘risk’ was defined ashomozygosity for the E1 haplotype.12–14 APOL1 ‘risk’ was defined as two copies of the G1or G2 risk alleles.10 To improve power to detect small-effect gene–gene interactions, case-only analyses were performed to evaluate potential interactions between HbS and MYH9 orAPOL1.21 As APOL1 and MYH9 both reside on chromosome 22, a chromosome differentfrom HbS, the assumption of independence between the genes holds using this approach.
P-values, ORs, and 95% CIs were calculated to assess the relationship between HbS andESRD, as well as interactions between HbS and the chromosome 22 nephropathy riskvariants. The interaction analyses were performed using SAS software (version 8.2; SASInstitute, Cary, NC), and hypothesis tests were two-sided and considered statisticallysignificant at P<0.05.
AcknowledgmentsWe thank all the study participants and study coordinators: Mitzie Spainhour, Joyce Byers, Sharon Warren, CarrieSmith, and Cassandra Bethea. This work was supported by NIH grants: R01 DK066358 (DWB), R01 DK053591(DWB), R01 HL56266 (BIF), RO1 DK070941 (BIF), RO1 DK084149 (BIF), and in part by the General ClinicalResearch Center of the Wake Forest School of Medicine grant M01 RR07122.
References1. Prabhakar H, Haywood C Jr, Molokie R. Sickle cell disease in the United States: looking back and
forward at 100 years of progress in management and survival. Am J Hematol. 2010; 85:346–353.[PubMed: 20425797]
2. Buckalew VM Jr, Someren A. Renal manifestations of sickle cell disease. Arch Intern Med. 1974;133:660–669. [PubMed: 4594399]
3. Tsaras G, Owusu-Ansah A, Boateng FO, et al. Complications associated with sickle cell trait: a briefnarrative review. Am J Med. 2009; 122:507–512. [PubMed: 19393983]
4. Ajayi AA, Kolawole BA. Sickle cell trait and gender influence type 2 diabetic complications inAfrican patients. Eur J Intern Med. 2004; 15:312–315. [PubMed: 15450989]
5. Bleyer AJ, Vidya S, Sujata L, et al. Sickle cell trait and development of microvascularcomplications in diabetes mellitus. Clin J Am Soc Nephrol. 2010; 5:1015–1020. [PubMed:20299376]
6. Oli JM, Watkins PJ, Wild B, et al. Albuminuria in Afro-Caribbeans with Type 2 diabetes mellitus: isthe sickle cell trait a risk factor? Diabet Med. 2004; 21:483–486. [PubMed: 15089795]
7. Derebail VK, Nachman PH, Key NS, et al. High prevalence of sickle cell trait in African Americanswith ESRD. J Am Soc Nephrol. 2010; 21:413–417. [PubMed: 20056747]
8. Heller P, Best WR, Nelson RB, et al. Clinical implications of sickle-cell trait and glucose-6-phosphate dehydrogenase deficiency in hospitalized black male patients. N Engl J Med. 1979;300:1001–1005. [PubMed: 431593]
9. Schneider RG, Hightower B, Hosty TS, et al. Abnormal hemoglobins in a quarter million people.Blood. 1976; 48:629–637. [PubMed: 974261]
10. Genovese G, Friedman DJ, Ross MD, et al. Association of trypanolytic ApoL1 variants withkidney disease in African Americans. Science. 2010; 329:841–845. [PubMed: 20647424]
Hicks et al. Page 6
Kidney Int. Author manuscript; available in PMC 2012 February 16.
NIH
-PA Author Manuscript
NIH
-PA Author Manuscript
NIH
-PA Author Manuscript
11. Freedman BI, Kopp JB, Langefeld CD, et al. The apolipoprotein L1 (APOL1) gene andnondiabetic nephropathy in African Americans. J Am Soc Nephrol. 2010; 21:1422–1426.[PubMed: 20688934]
12. Kopp JB, Smith MW, Nelson GW, et al. MYH9 is a major-effect risk gene for focal segmentalglomerulosclerosis. Nat Genet. 2008; 40:1175–1184. [PubMed: 18794856]
13. Kao WH, Klag MJ, Meoni LA, et al. MYH9 is associated with nondiabetic end-stage renal diseasein African Americans. Nat Genet. 2008; 40:1185–1192. [PubMed: 18794854]
14. Freedman BI, Hicks PJ, Bostrom MA, et al. Polymorphisms in the non-muscle myosin heavy chain9 gene (MYH9) are strongly associated with end-stage renal disease historically attributed tohypertension in African Americans. Kidney Int. 2009; 75:736–745. [PubMed: 19177153]
15. Bostrom MA, Freedman BI. The spectrum of MYH9-associated nephropathy. Clin J Am SocNephrol. 2010; 5:1107–1113. [PubMed: 20299374]
16. Meyer LM, Adams JG III, Steinberg MH, et al. Screening for sickle cell trait: the VeteransAdministration National Sickle Cell Program. Am J Hematol. 1987; 24:429–432. [PubMed:3551591]
17. McDonough CW, Palmer ND, Hicks PJ, et al. A genome-wide association study for diabeticnephropathy genes in African Americans. Kidney Int. 2011; 79:563–572. [PubMed: 21150874]
18. Bowden DW, Colicigno CJ, Langefeld CD, et al. A genome scan for diabetic nephropathy inAfrican Americans. Kidney Int. 2004; 66:1517–1526. [PubMed: 15458446]
19. Divers J, Register TC, Langefeld CD, et al. Relationships between calcified atherosclerotic plaqueand bone mineral density in African Americans with type 2 diabetes. J Bone Miner Res. 2011;26:1554–1560. [PubMed: 21437982]
20. Keene KL, Mychaleckyj JC, Leak TS, et al. Exploration of the utility of ancestry informativemarkers for genetic association studies of African Americans with type 2 diabetes and end stagerenal disease. Hum Genet. 2008; 124:147–154. [PubMed: 18654799]
21. Yang Q, Khoury MJ, Sun F, et al. Case-only design to measure gene-gene interaction.Epidemiology. 1999; 10:167–170. [PubMed: 10069253]
Hicks et al. Page 7
Kidney Int. Author manuscript; available in PMC 2012 February 16.
NIH
-PA Author Manuscript
NIH
-PA Author Manuscript
NIH
-PA Author Manuscript
NIH
-PA Author Manuscript
NIH
-PA Author Manuscript
NIH
-PA Author Manuscript
Hicks et al. Page 8
Tabl
e 1
Dem
ogra
phic
dat
a in
ESR
D c
ases
and
non
-nep
hrop
athy
con
trols
Gro
upN
Fem
ale
(%)
Mea
n±s.d
., ag
e (y
ears
)M
ean±
s.d.,
BM
I (kg
/m2 )
Afr
ican
anc
estr
y (%
)M
ean±
s.d.,
age
at E
SRD
(yea
rs)
Mea
n±s.d
., ag
e at
T2D
(yea
rs)
Non
-DM
ESR
D c
ases
1085
44.3
53.9
(±14
.6)
27.1
(±6.
9)79
.5 (±
10.3
)48
.4 (±
15.5
)N
A
T2D
ESR
D c
ases
996
60.0
61.6
(±10
.4)
29.8
(±7.
2)78
.7 (±
11.4
)58
.0 (±
11.0
)41
.5 (±
12.4
)
Non
-nep
hrop
athy
con
trols
1177
57.1
51.9
(±11
.2)
32.1
(±13
.1)
76.9
(±11
.2)
NA
45.7
(±10
.1)a
Abb
revi
atio
ns: B
MI,
body
mas
s ind
ex; D
M, d
iabe
tes m
ellit
us; E
SRD
, end
-sta
ge re
nal d
isea
se; N
A, n
ot a
pplic
able
; T2D
, typ
e 2
diab
etes
mel
litus
.
a Subs
et o
f 413
con
trols
with
T2D
.
Mea
n (s
.d.)
DM
dur
atio
n: 1
9.9
(10.
7) y
ears
in T
2D E
SRD
cas
es; 9
.4 (7
.9) y
ears
in n
on-n
ephr
opat
hy c
ontro
ls w
ith T
2D.
Kidney Int. Author manuscript; available in PMC 2012 February 16.
NIH
-PA Author Manuscript
NIH
-PA Author Manuscript
NIH
-PA Author Manuscript
Hicks et al. Page 9
Tabl
e 2
Gen
otyp
ic a
ssoc
iatio
n fo
r HbS
in E
SRD
cas
es w
ith c
ontro
ls, a
djus
ted
for a
dmix
ture
, age
, and
gen
der
Gro
upSa
mpl
e si
zeH
bAS
geno
type
freq
uenc
yH
WE
con
trol
sH
WE
cas
esP-
valu
e, d
omin
ant
OR
(CI)
P-va
lue,
add
itive
OR
(CI)
Non
-DM
ESR
D10
850.
087
0.61
90.
406
0.34
461.
16 (0
.85–
1.6)
0.34
021.
18 (0
.86–
1.6)
T2D
–ESR
D99
60.
071
0.61
90.
237
0.96
171.
01 (0
.70–
1.5)
0.99
451.
00 (0
.70–
1.4)
Com
bine
d al
l-cau
se E
SRD
2081
0.07
90.
619
0.17
10.
7398
1.05
(0.7
9–1.
4)0.
7436
1.05
(0.7
9–1.
4)
Con
trols
1177
0.07
20.
619
NA
NA
NA
NA
NA
Abb
revi
atio
ns: C
I, 95
% c
onfid
ence
inte
rval
; DM
, dia
bete
s mel
litus
; HbS
, hem
oglo
bin
S; H
bAS,
sick
le c
ell t
rait
(het
eroz
ygou
s car
riers
); H
WE,
Har
dy–W
einb
erg
equi
libriu
m; E
SRD
, end
-sta
ge re
nal d
isea
se;
NA
, not
app
licab
le; O
R, o
dds r
atio
; T2D
, typ
e 2
diab
etes
mel
litus
.
Kidney Int. Author manuscript; available in PMC 2012 February 16.

NIH
-PA Author Manuscript
NIH
-PA Author Manuscript
NIH
-PA Author Manuscript
Hicks et al. Page 10
Table 3
HbS–chromosome 22 nephropathy variant interaction analyses
Analysis type Non-DM ESRD T2D-ESRD All-cause ESRD
MYH9– E1 interaction P-value (N) P-value (N) P-value (N)
Case only 0.99 (case, N=1007) 0.23 (case, N=938) 0.39 (case, N=1945)
Case–control two-way interaction 0.46 (case, N=1007; control,N=1098)
0.36 (case, N=938; control,N=1098)
0.92 (case, N=1945; control,N=1098)
APOL1–G1/G2 interaction
Case only 0.82 (case, N=1024) 0.28 (case, N=968) 0.30 (case, N=1992)
Case–control two-way interaction 0.1 (case, N=1024; control,N=1089)
0.68 (case, N=968; control,N=1089)
0.25 (case, N=1992; control,N=1089)
Abbreviations: APOL1, apolipoprotein L1; DM, diabetes mellitus; ESRD, end-stage renal disease; HbS, hemoglobin S; MYH9, non-musclemyosin heavy chain 9; SNP, single-nucleotide polymorphism; T2D, type 2 diabetes mellitus.
Case-only association and case–control centered two-way interaction tests were conducted using a logistic regression model with age, gender, andadmixture adjustment. As the main effect of SNP (rs334 HbS) had a minor allele frequency of ~0.04, the counts of samples homozygous for theminor allele were too small to have sufficient power in additive or recessive models. Therefore, only the dominant model was examined and resultsare presented.
Kidney Int. Author manuscript; available in PMC 2012 February 16.
Copyright © 2022 FDOKUMEN