Short time-scale impacts of hydropeaking on benthic invertebrates in an Alpine stream (Trentino,...
10
Short time-scale impacts of hydropeaking on benthic invertebrates in an Alpine stream (Trentino, Italy) Maria Cristina Bruno n , Bruno Maiolini, Mauro Carolli, Luana Silveri Fondazione Edmund Mach, IASMA Research and Innovation Centre, Environment and Natural Resources Area, Via E. Mach, 1, 38010 San Michele all’Adige (TN), Italy article info Article history: Received 18 May 2009 Received in revised form 3 November 2009 Accepted 4 November 2009 Keywords: Drift Invertebrates Flow regime Hydropower impacts Italian Alps abstract The impact of a single hydropeaking event was studied in the Alpine stream Noce Bianco. Four stations were selected, one upstream and three, respectively, at 0.25, 6, and 8 km downstream from a hydropower plant. We collected drifting invertebrates during a planned water release that increased the discharge 7-fold. At the onset of the hydropeaking wave the number of invertebrates lost from the riverbed per minute to the drift increased 9-fold at the first downstream station and the same effects propagated 8 km downstream. The drift was composed mainly of aquatic insect larvae (Chironomidae, Plecoptera, Ephemeroptera Baetidae, and Psychodidae, with Chironomidae as the most abundant taxon at all stations) and partly by larval and adult riparian insects, and by Oligochaeta, which were particularly abundant at the station 6 km downstream. We monitored drift for 30 min from the start of the water release: peaks in drifting invertebrates occurred within 5–10 min of the beginning of the hydropeaking wave, and most of the invertebrates were washed out within the first 15 min of the water release. The different timeframes were possibly due to habitat preferences (most of the taxa that increased in the drift at the arrival of the wave were associated with algae and organic debris, which were washed off quickly by the increase in discharge) and/or behavioral adaptations (other taxa initially resisted the shear stress and began to drift with a delay of 5–10 min). The temporal pattern and drift composition corresponded well with those reported in literature, and indicate that repeated high-flow events of similar magnitude cause considerable losses from benthic populations to drift. & 2009 Elsevier GmbH. All rights reserved. Introduction In Alpine regions, intermittent hydropower generation has high economic importance. Although it is the most relevant renewable electricity source with clear advantages for the global CO 2 balance (Bratrich et al., 2004), it creates serious ecological impacts on aquatic ecosystems (e.g. Poff and Hart, 2002; Fette et al., 2007). Changes in flow regime associated with hydropeak- ing are known to decrease both the density and biomass of benthic invertebrates downstream from hydropower plant outlets (Irvine, 1985; Ce ´re ´ ghino and Lavandier 1998a, b; Ce ´re ´ ghino et al., 2002, 2004) by increasing the intensity of bed scour (Brittain and Eikeland, 1988), which in turn leads to a high catastrophic drift (Gore et al., 1989), and by clogging of the riverbed because of deposition of the fine material transported by released water (Blaschke et al., 2003; Anselmetti et al., 2007), which reduces the available habitat for the bottom-dwelling fauna. As a conse- quence, the specific composition and longitudinal zonation of invertebrate populations below the outlet are altered (Ce ´re ´ ghino and Lavandier 1998a, b). Drift is an important process in regulating population densities, dispersal, and life cycles of benthic invertebrates in rivers and streams (Brittain and Eikeland, 1988; Ce ´re ´ ghino and Lavandier 1998a, b; Mochizuki et al., 2006). Most of the studies on drift have been conducted at normal or base flows (e.g. Brittain and Eikeland, 1988; Anholt, 1995), whereas catastrophic drift (sensu Culp et al., 1985, i.e. generated by any disturbance) caused by natural or artificial floods have been less well investigated (Statzner et al., 1988; Gibbins et al., 2007a, b). Because the time and magnitude of floods or flashes are hard to predict in natural streams and rivers, and sampling in such conditions is often very difficult, studies on precise temporal sequences of drift during such events are few (Tockner and Waringer, 1997). As a consequence, drifting organisms are not easy to collect during natural floods, other than during some artificial floods (Robinson et al., 2004a) or in experimental channels (Gibbins et al., 2005; Mochizuki et al., 2006). Drift is usually associated with flood conditions, during which the substrate is physically disturbed. Despite the clear role that sediment mobilization plays in initiating drift, considerable drift can also occur in the absence of sediment movement; the effects of non-scouring increases in Contents lists available at ScienceDirect journal homepage: www.elsevier.de/limno Limnologica 0075-9511/$ - see front matter & 2009 Elsevier GmbH. All rights reserved. doi:10.1016/j.limno.2009.11.012 n Corresponding author. Tel.: + 39 0461 615555. E-mail address: [email protected] (M. Cristina Bruno). Limnologica 40 (2010) 281–290
Transcript of Short time-scale impacts of hydropeaking on benthic invertebrates in an Alpine stream (Trentino,...
Limnologica 40 (2010) 281–290
Contents lists available at ScienceDirect
Limnologica
0075-95
doi:10.1
n Corr
E-m
journal homepage: www.elsevier.de/limno
Short time-scale impacts of hydropeaking on benthic invertebrates in anAlpine stream (Trentino, Italy)
Maria Cristina Bruno n, Bruno Maiolini, Mauro Carolli, Luana Silveri
Fondazione Edmund Mach, IASMA Research and Innovation Centre, Environment and Natural Resources Area, Via E. Mach, 1, 38010 San Michele all’Adige (TN), Italy
a r t i c l e i n f o
Article history:
Received 18 May 2009
Received in revised form
3 November 2009
Accepted 4 November 2009
Keywords:
Drift
Invertebrates
Flow regime
Hydropower impacts
Italian Alps
11/$ - see front matter & 2009 Elsevier Gmb
016/j.limno.2009.11.012
esponding author. Tel.: +39 0461 615555.
ail address: [email protected] (M. Cristi
a b s t r a c t
The impact of a single hydropeaking event was studied in the Alpine stream Noce Bianco. Four stations
were selected, one upstream and three, respectively, at 0.25, 6, and 8 km downstream from a
hydropower plant. We collected drifting invertebrates during a planned water release that increased
the discharge 7-fold. At the onset of the hydropeaking wave the number of invertebrates lost from the
riverbed per minute to the drift increased 9-fold at the first downstream station and the same effects
propagated 8 km downstream. The drift was composed mainly of aquatic insect larvae (Chironomidae,
Plecoptera, Ephemeroptera Baetidae, and Psychodidae, with Chironomidae as the most abundant taxon
at all stations) and partly by larval and adult riparian insects, and by Oligochaeta, which were
particularly abundant at the station 6 km downstream. We monitored drift for 30 min from the start of
the water release: peaks in drifting invertebrates occurred within 5–10 min of the beginning of the
hydropeaking wave, and most of the invertebrates were washed out within the first 15 min of the water
release. The different timeframes were possibly due to habitat preferences (most of the taxa that
increased in the drift at the arrival of the wave were associated with algae and organic debris, which
were washed off quickly by the increase in discharge) and/or behavioral adaptations (other taxa initially
resisted the shear stress and began to drift with a delay of 5–10 min). The temporal pattern and drift
composition corresponded well with those reported in literature, and indicate that repeated high-flow
events of similar magnitude cause considerable losses from benthic populations to drift.
& 2009 Elsevier GmbH. All rights reserved.
Introduction
In Alpine regions, intermittent hydropower generation hashigh economic importance. Although it is the most relevantrenewable electricity source with clear advantages for the globalCO2 balance (Bratrich et al., 2004), it creates serious ecologicalimpacts on aquatic ecosystems (e.g. Poff and Hart, 2002; Fetteet al., 2007). Changes in flow regime associated with hydropeak-ing are known to decrease both the density and biomass ofbenthic invertebrates downstream from hydropower plant outlets(Irvine, 1985; Cereghino and Lavandier 1998a, b; Cereghino et al.,2002, 2004) by increasing the intensity of bed scour (Brittain andEikeland, 1988), which in turn leads to a high catastrophic drift(Gore et al., 1989), and by clogging of the riverbed because ofdeposition of the fine material transported by released water(Blaschke et al., 2003; Anselmetti et al., 2007), which reduces theavailable habitat for the bottom-dwelling fauna. As a conse-quence, the specific composition and longitudinal zonation of
H. All rights reserved.
na Bruno).
invertebrate populations below the outlet are altered (Cereghinoand Lavandier 1998a, b).
Drift is an important process in regulating populationdensities, dispersal, and life cycles of benthic invertebrates inrivers and streams (Brittain and Eikeland, 1988; Cereghino andLavandier 1998a, b; Mochizuki et al., 2006). Most of the studies ondrift have been conducted at normal or base flows (e.g. Brittainand Eikeland, 1988; Anholt, 1995), whereas catastrophic drift(sensu Culp et al., 1985, i.e. generated by any disturbance) causedby natural or artificial floods have been less well investigated(Statzner et al., 1988; Gibbins et al., 2007a, b). Because the timeand magnitude of floods or flashes are hard to predict in naturalstreams and rivers, and sampling in such conditions is often verydifficult, studies on precise temporal sequences of drift duringsuch events are few (Tockner and Waringer, 1997). As aconsequence, drifting organisms are not easy to collect duringnatural floods, other than during some artificial floods (Robinsonet al., 2004a) or in experimental channels (Gibbins et al., 2005;Mochizuki et al., 2006). Drift is usually associated with floodconditions, during which the substrate is physically disturbed.Despite the clear role that sediment mobilization plays ininitiating drift, considerable drift can also occur in the absenceof sediment movement; the effects of non-scouring increases in
M. Cristina Bruno et al. / Limnologica 40 (2010) 281–290282
flow are not less dramatic for benthic communities than those ofcatastrophic floods (Imbert and Perry, 2000; Gibbins et al.,2007a, b), and drift can also occur when sediment is beingagitated rather than being transported downstream and extre-mely high drift losses can occur in conditions that hydrologistsand geomorphologists would not consider to be disturbance(Gibbins et al., 2007a, b).
Gibbins et al. (2000) demonstrated the impacts of dischargeincrease due to inter-basin water transfer on the insect Micronecta
poweri, on a short-term water transfer (1 h) that increased thedischarge 3-fold, where the sediment was not mobilized, and onlyFPOM was removed; as a consequence the average totalabundance of M. poweri was reduced by approximately 50%during the transfer. To our knowledge, however, the effects ofnon-scouring flood induced by hydropeaking on the entirebenthic assemblages have not been investigated. Moreover, theeffects of hydropeaking on benthic communities have beenextensively investigated on a large time-scale, i.e. the effects ofmultiple natural or artificial floods or hydropeaking events (e.g.Cereghino and Lavandier, 1998a, b; Cereghino et al., 2002, 2004;Hay et al., 2008). On the other hand, our study investigates non-scouring drift due to water released from a dam and turbinated ina hydropower plant on a short time-scale.
This study assessed the aquatic invertebrates response to ahydropeaking wave, aiming to answer the following questions:
1.
What are the effects on invertebrates of the arrival of thehydropeaking wave, and how far downstream do such effectspropagate?2.
Can a temporal timeframe be detected in drift for differenttaxa, even if the discharge, once artificially increased, remainsconstant?Materials and methods
Study area
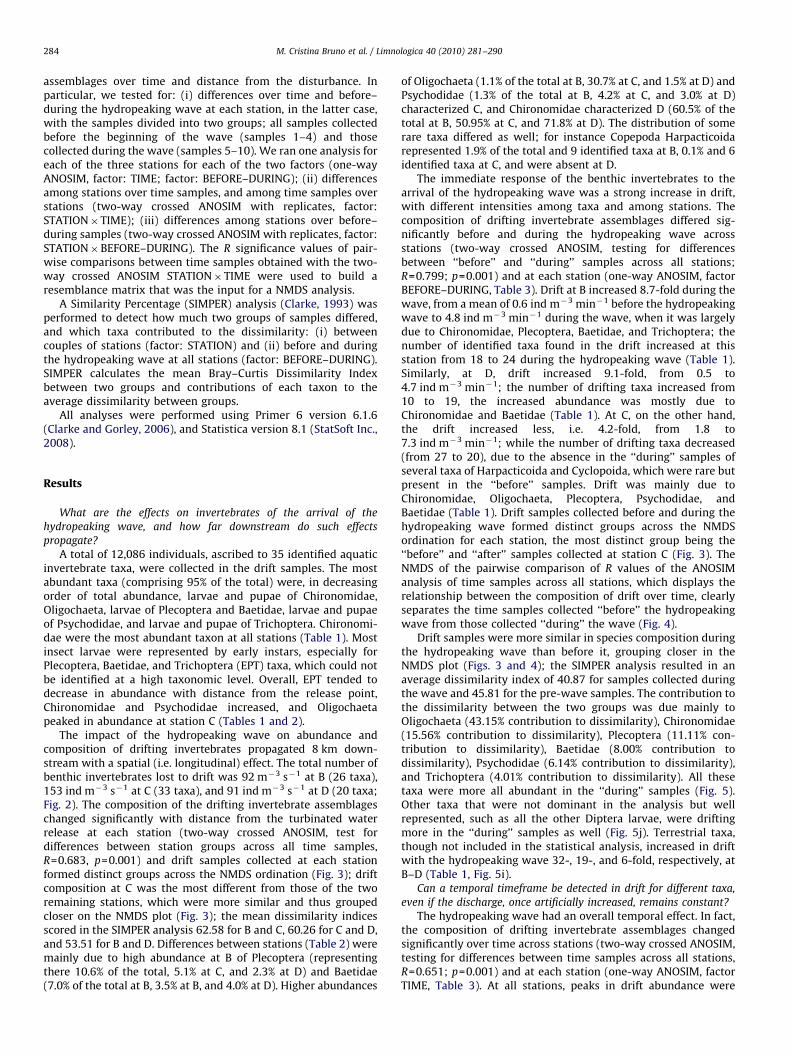
The spatial (downstream from the disturbance) and temporal(from the onset of the hydropeaking wave) effects of a plannedhydropeaking release on benthic and hyporheic communitieswere studied in the Adige watershed (NE Italy, Trentino). TheAdige River is the second-longest Italian river, draining a12,100 km2 basin and, like most large Alpine rivers, it has beengreatly altered by hydropower production. To date, there are 30major reservoirs in the watershed with a total capacity of571�106 m3, supplying 34 hydropower plants. Field experimentswere conducted on the Noce Bianco Stream (Trentino, NE Italy,461240N, 101400E), a 3rd order stream and left tributary of theNoce Stream (Fig. 1), which in turn is a main tributary of the AdigeRiver. The Noce Bianco (watershed=35.9 km2) is a gravel streamwith 4–20 m wetted width. It is a glacial (kryal) dominatedstream, fed by the Vedretta de la Mare and Careser glaciers, whosesnouts are at about 2800 m a.s.l., with some minor non-glacial(krenal and rhithral) tributaries. The sampling stations werelocated downstream from the Cogolo hydroelectric power plant,which uses waters from the Careser (2603 m a.s.l.) and Pian Pal �u(1850 m a.s.l.) reservoirs. From the Careser dam, water falls for622 m until it reaches the Malga Mare plant (1963 m a.s.l.), whereit is turbinated and discharged to a sedimentation basin that alsocollects water from the Noce Bianco Stream. These waterstogether with water from Pian Pal �u reservoir are delivered tothe Cogolo plant (1208 m a.s.l.), where they are discharged intothe Noce Bianco Stream. Three sampling stations were selected,located, respectively, 0.25, 6, and 8 km downstream of the release
point: B (1197 m a.s.l.), C (1054 m a.s.l.), and D (988 m a.s.l.;Fig. 1).
On September 24th, 2006, a planned release corresponding tothe normal operational conditions (no release during the night,followed by a release at maximum turbine capacity) was arrangedwith the managing agency (ENEL). The power plant started toturbinate at 12:55; the hydropeaking wave traveled downstreamat about 5 km h�1 and reached stations B–D after 25, 85, and101 min, respectively. Discharge increased from 1 to 7 m3 s�1
within approximately 10 min.
Physical–chemical and hydraulic parameters
Water temperature and conductivity were recorded at 1-minintervals before and during the hydropeaking event at eachstation with a Hannas HI 8730 portable conductivity andtemperature meter. Conductivity was automatically corrected tothe standard temperature of 20 1C. Water level was measured 150
before the hydropeaking event at all stations, and 100 after itsarrival at stations B–D by averaging three measurements (leftside, mid-channel, right side). Water velocity was measured witha current meter before and during the hydropeaking wave, atstations B–D; the current meter was placed as close as possible tothe drift net; it was not possible to place it directly in front of thenets because these were lowered from a bridge.
Water samples were collected at each station before thehydropeaking event and every 2 min during the event, refriger-ated, and carried to the laboratory, where turbidity measure-ments were taken with a Hannas HI 93703 Portable TurbidityMeter.
The bedload material movement during the hydropeakingevents was estimated by spraying with red paint 10 pebbles andboulders of increasing size and placing them on the bottom ateach station, and observing if they had moved and/or relocated atthe end of the experiment. In addition, a visual estimation ofbedload movement was conducted. Granulometry (D90) wasmeasured with a gravelometer at stations B and C.
Biological sampling
At stations B–D, quantitative drift samples were collectedusing three drift nets (mesh size 100 mm, mouth diameter 10 cm,length 1 m) placed side by side on a horizontal metal bar that waslowered into the stream below the water surface from bridges.Each one of the three nets represented one replicate; thus we hadthree replicates per sample. Four consecutive samples obtained bycollecting the drifting invertebrates for 15 min were taken beforethe water release at each of the three stations (samples 1–4, called‘‘before’’ drift samples herein). Six consecutive samples, eachobtained by collecting the drifting invertebrates for 5 min, weretaken during the water release at each station (samples 5–10,called ‘‘during’’ drift samples herein). Thus, the last sample wastaken at each station 30 min after the onset of the hydropeakingwave. Different collecting times were necessary in order to followthe changes in drift over a short time period during the release.Little or no clogging of drift nets occurred as suspended sedimentis low in autumn in Alpine streams. Filtered volumes werecalculated according to water velocity as measured at each stationduring the experiment.
All samples were sorted in the laboratory and organismsidentified to the lowest possible taxonomical level followingCampaioli et al. (1994, 1999) and Fochetti et al. (2009). ManyInsecta early instars could not be identified further than the orderor family level. All Copepoda were sorted and counted undermagnification, mounted on permanent slides, and examined with
Fig. 1. Study area and sampling stations in the Noce Bianco Stream, Trentino, Italy. Stations B–D were located, respectively, 0.25, 6, and 8 km downstream from the Cogolo
hydropower plant.
M. Cristina Bruno et al. / Limnologica 40 (2010) 281–290 283
phase contrast microscopy and adults and copepodites at stage Vwere identified to the species level following Dussart (1967,1969), Stoch (1998), Karaytug (1999), and Pesce and Galassi(1987). Individuals of earlier larval stages (i.e. copepodites) werenot identified, but were labelled ‘‘copepodites’’, and whenpossible identified to the genus level. Because unidentified earlylarval stages of copepods could not be classified, they were usedonly when calculating the total abundances of benthic inverte-brates, but not for other statistical analysis (see details below).
Statistical analyses
The terrestrial taxa (Araneae, Miriapoda, adults of Diptera,Hemiptera, Ephemeroptera, Thysanoptera, and riparian Coleop-tera; Formicoidea, Hymenoptera, terrestrial Isopoda, larvae ofLepidoptera, Collembola), and the planktonic ones (the CopepodaAcanthodiaptomus denticornis and Cyclops abissorum tatricus, andCladocera) were removed from the statistical analysis, because
they do not belong to the benthic communities; the planktonictaxa were probably introduced with the water coming from thereservoirs, and the terrestrial taxa, which were rare (5% of thetotal), were probably washed out from the riparian area. For driftsamples, first we calculated drift rate (numbers per minute) for alltaxa; then we divided that rate by the volume of water thatpassed through the net during the sampling period; this gave usthe density of drift per minute (individual m�3 min�1).
A faunistic matrix was thus created, including a total of 90 driftsamples (three replicates of ten samples collected at each station).The species assemblages were analyzed by applying a non-metricmultidimensional scaling (NMDS) to a resemblance matrixcalculated with the Bray–Curtis similarity index applied to thedataset. Prior to analysis, abundance data were transformed toproportions, so that the NMDS depicted patterns in speciescomposition and relative abundance.
We performed analyses of similarity on drift samples (ANO-SIM) (Clarke, 1993) on the faunistic matrix transformed inlog(x+1), in order to analyze possible changes in drifting
M. Cristina Bruno et al. / Limnologica 40 (2010) 281–290284
assemblages over time and distance from the disturbance. Inparticular, we tested for: (i) differences over time and before–during the hydropeaking wave at each station, in the latter case,with the samples divided into two groups; all samples collectedbefore the beginning of the wave (samples 1–4) and thosecollected during the wave (samples 5–10). We ran one analysis foreach of the three stations for each of the two factors (one-wayANOSIM, factor: TIME; factor: BEFORE–DURING); (ii) differencesamong stations over time samples, and among time samples overstations (two-way crossed ANOSIM with replicates, factor:STATION�TIME); (iii) differences among stations over before–during samples (two-way crossed ANOSIM with replicates, factor:STATION�BEFORE–DURING). The R significance values of pair-wise comparisons between time samples obtained with the two-way crossed ANOSIM STATION� TIME were used to build aresemblance matrix that was the input for a NMDS analysis.
A Similarity Percentage (SIMPER) analysis (Clarke, 1993) wasperformed to detect how much two groups of samples differed,and which taxa contributed to the dissimilarity: (i) betweencouples of stations (factor: STATION) and (ii) before and duringthe hydropeaking wave at all stations (factor: BEFORE–DURING).SIMPER calculates the mean Bray–Curtis Dissimilarity Indexbetween two groups and contributions of each taxon to theaverage dissimilarity between groups.
All analyses were performed using Primer 6 version 6.1.6(Clarke and Gorley, 2006), and Statistica version 8.1 (StatSoft Inc.,2008).
Results
What are the effects on invertebrates of the arrival of the
hydropeaking wave, and how far downstream do such effects
propagate?
A total of 12,086 individuals, ascribed to 35 identified aquaticinvertebrate taxa, were collected in the drift samples. The mostabundant taxa (comprising 95% of the total) were, in decreasingorder of total abundance, larvae and pupae of Chironomidae,Oligochaeta, larvae of Plecoptera and Baetidae, larvae and pupaeof Psychodidae, and larvae and pupae of Trichoptera. Chironomi-dae were the most abundant taxon at all stations (Table 1). Mostinsect larvae were represented by early instars, especially forPlecoptera, Baetidae, and Trichoptera (EPT) taxa, which could notbe identified at a high taxonomic level. Overall, EPT tended todecrease in abundance with distance from the release point,Chironomidae and Psychodidae increased, and Oligochaetapeaked in abundance at station C (Tables 1 and 2).
The impact of the hydropeaking wave on abundance andcomposition of drifting invertebrates propagated 8 km down-stream with a spatial (i.e. longitudinal) effect. The total number ofbenthic invertebrates lost to drift was 92 m�3 s�1 at B (26 taxa),153 ind m�3 s�1 at C (33 taxa), and 91 ind m�3 s�1 at D (20 taxa;Fig. 2). The composition of the drifting invertebrate assemblageschanged significantly with distance from the turbinated waterrelease at each station (two-way crossed ANOSIM, test fordifferences between station groups across all time samples,R=0.683, p=0.001) and drift samples collected at each stationformed distinct groups across the NMDS ordination (Fig. 3); driftcomposition at C was the most different from those of the tworemaining stations, which were more similar and thus groupedcloser on the NMDS plot (Fig. 3); the mean dissimilarity indicesscored in the SIMPER analysis 62.58 for B and C, 60.26 for C and D,and 53.51 for B and D. Differences between stations (Table 2) weremainly due to high abundance at B of Plecoptera (representingthere 10.6% of the total, 5.1% at C, and 2.3% at D) and Baetidae(7.0% of the total at B, 3.5% at B, and 4.0% at D). Higher abundances
of Oligochaeta (1.1% of the total at B, 30.7% at C, and 1.5% at D) andPsychodidae (1.3% of the total at B, 4.2% at C, and 3.0% at D)characterized C, and Chironomidae characterized D (60.5% of thetotal at B, 50.95% at C, and 71.8% at D). The distribution of somerare taxa differed as well; for instance Copepoda Harpacticoidarepresented 1.9% of the total and 9 identified taxa at B, 0.1% and 6identified taxa at C, and were absent at D.
The immediate response of the benthic invertebrates to thearrival of the hydropeaking wave was a strong increase in drift,with different intensities among taxa and among stations. Thecomposition of drifting invertebrate assemblages differed sig-nificantly before and during the hydropeaking wave acrossstations (two-way crossed ANOSIM, testing for differencesbetween ‘‘before’’ and ‘‘during’’ samples across all stations;R=0.799; p=0.001) and at each station (one-way ANOSIM, factorBEFORE–DURING, Table 3). Drift at B increased 8.7-fold during thewave, from a mean of 0.6 ind m�3 min�1 before the hydropeakingwave to 4.8 ind m�3 min�1 during the wave, when it was largelydue to Chironomidae, Plecoptera, Baetidae, and Trichoptera; thenumber of identified taxa found in the drift increased at thisstation from 18 to 24 during the hydropeaking wave (Table 1).Similarly, at D, drift increased 9.1-fold, from 0.5 to4.7 ind m�3 min�1; the number of drifting taxa increased from10 to 19, the increased abundance was mostly due toChironomidae and Baetidae (Table 1). At C, on the other hand,the drift increased less, i.e. 4.2-fold, from 1.8 to7.3 ind m�3 min�1; while the number of drifting taxa decreased(from 27 to 20), due to the absence in the ‘‘during’’ samples ofseveral taxa of Harpacticoida and Cyclopoida, which were rare butpresent in the ‘‘before’’ samples. Drift was mainly due toChironomidae, Oligochaeta, Plecoptera, Psychodidae, andBaetidae (Table 1). Drift samples collected before and during thehydropeaking wave formed distinct groups across the NMDSordination for each station, the most distinct group being the‘‘before’’ and ‘‘after’’ samples collected at station C (Fig. 3). TheNMDS of the pairwise comparison of R values of the ANOSIManalysis of time samples across all stations, which displays therelationship between the composition of drift over time, clearlyseparates the time samples collected ‘‘before’’ the hydropeakingwave from those collected ‘‘during’’ the wave (Fig. 4).
Drift samples were more similar in species composition duringthe hydropeaking wave than before it, grouping closer in theNMDS plot (Figs. 3 and 4); the SIMPER analysis resulted in anaverage dissimilarity index of 40.87 for samples collected duringthe wave and 45.81 for the pre-wave samples. The contribution tothe dissimilarity between the two groups was due mainly toOligochaeta (43.15% contribution to dissimilarity), Chironomidae(15.56% contribution to dissimilarity), Plecoptera (11.11% con-tribution to dissimilarity), Baetidae (8.00% contribution todissimilarity), Psychodidae (6.14% contribution to dissimilarity),and Trichoptera (4.01% contribution to dissimilarity). All thesetaxa were more all abundant in the ‘‘during’’ samples (Fig. 5).Other taxa that were not dominant in the analysis but wellrepresented, such as all the other Diptera larvae, were driftingmore in the ‘‘during’’ samples as well (Fig. 5j). Terrestrial taxa,though not included in the statistical analysis, increased in driftwith the hydropeaking wave 32-, 19-, and 6-fold, respectively, atB–D (Table 1, Fig. 5i).
Can a temporal timeframe be detected in drift for different taxa,
even if the discharge, once artificially increased, remains constant?
The hydropeaking wave had an overall temporal effect. In fact,the composition of drifting invertebrate assemblages changedsignificantly over time across stations (two-way crossed ANOSIM,testing for differences between time samples across all stations,R=0.651; p=0.001) and at each station (one-way ANOSIM, factorTIME, Table 3). At all stations, peaks in drift abundance were
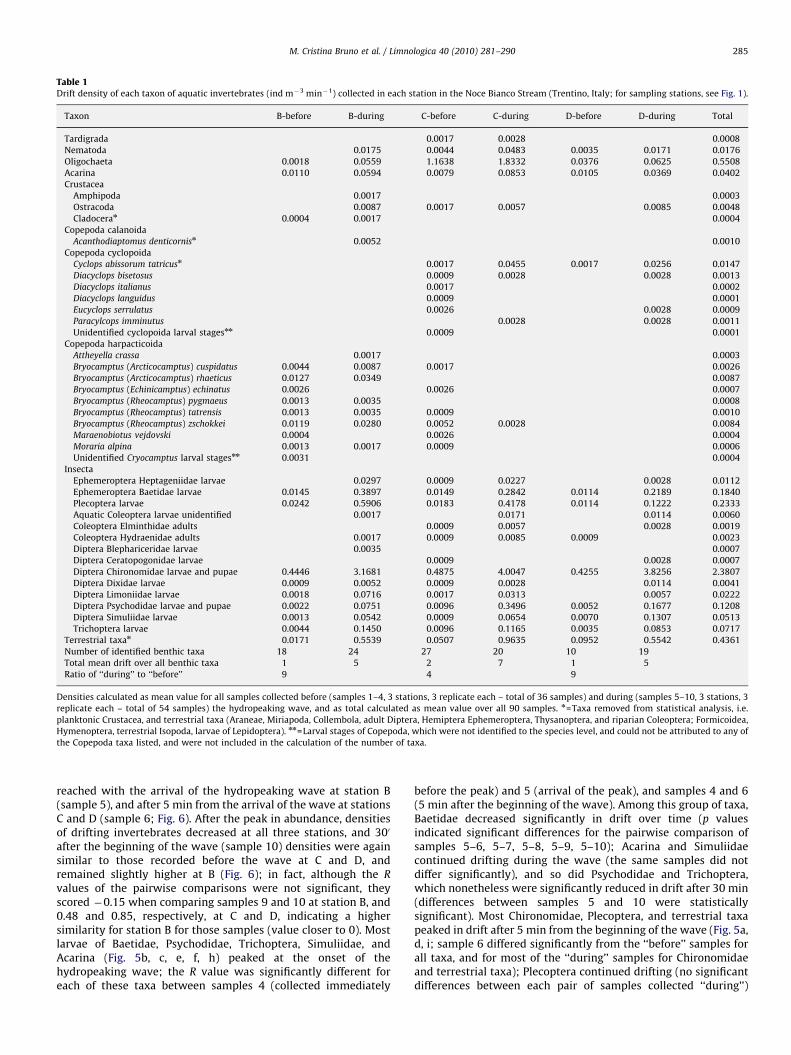
Table 1Drift density of each taxon of aquatic invertebrates (ind m�3 min�1) collected in each station in the Noce Bianco Stream (Trentino, Italy; for sampling stations, see Fig. 1).
Taxon B-before B-during C-before C-during D-before D-during Total
Tardigrada 0.0017 0.0028 0.0008
Nematoda 0.0175 0.0044 0.0483 0.0035 0.0171 0.0176
Oligochaeta 0.0018 0.0559 1.1638 1.8332 0.0376 0.0625 0.5508
Acarina 0.0110 0.0594 0.0079 0.0853 0.0105 0.0369 0.0402
Crustacea
Amphipoda 0.0017 0.0003
Ostracoda 0.0087 0.0017 0.0057 0.0085 0.0048
Cladoceran 0.0004 0.0017 0.0004
Copepoda calanoida
Acanthodiaptomus denticornisn 0.0052 0.0010
Copepoda cyclopoida
Cyclops abissorum tatricusn 0.0017 0.0455 0.0017 0.0256 0.0147
Diacyclops bisetosus 0.0009 0.0028 0.0028 0.0013
Diacyclops italianus 0.0017 0.0002
Diacyclops languidus 0.0009 0.0001
Eucyclops serrulatus 0.0026 0.0028 0.0009
Paracylcops imminutus 0.0028 0.0028 0.0011
Unidentified cyclopoida larval stagesnn 0.0009 0.0001
Copepoda harpacticoida
Attheyella crassa 0.0017 0.0003
Bryocamptus (Arcticocamptus) cuspidatus 0.0044 0.0087 0.0017 0.0026
Bryocamptus (Arcticocamptus) rhaeticus 0.0127 0.0349 0.0087
Bryocamptus (Echinicamptus) echinatus 0.0026 0.0026 0.0007
Bryocamptus (Rheocamptus) pygmaeus 0.0013 0.0035 0.0008
Bryocamptus (Rheocamptus) tatrensis 0.0013 0.0035 0.0009 0.0010
Bryocamptus (Rheocamptus) zschokkei 0.0119 0.0280 0.0052 0.0028 0.0084
Maraenobiotus vejdovski 0.0004 0.0026 0.0004
Moraria alpina 0.0013 0.0017 0.0009 0.0006
Unidentified Cryocamptus larval stagesnn 0.0031 0.0004
Insecta
Ephemeroptera Heptageniidae larvae 0.0297 0.0009 0.0227 0.0028 0.0112
Ephemeroptera Baetidae larvae 0.0145 0.3897 0.0149 0.2842 0.0114 0.2189 0.1840
Plecoptera larvae 0.0242 0.5906 0.0183 0.4178 0.0114 0.1222 0.2333
Aquatic Coleoptera larvae unidentified 0.0017 0.0171 0.0114 0.0060
Coleoptera Elminthidae adults 0.0009 0.0057 0.0028 0.0019
Coleoptera Hydraenidae adults 0.0017 0.0009 0.0085 0.0009 0.0023
Diptera Blephariceridae larvae 0.0035 0.0007
Diptera Ceratopogonidae larvae 0.0009 0.0028 0.0007
Diptera Chironomidae larvae and pupae 0.4446 3.1681 0.4875 4.0047 0.4255 3.8256 2.3807
Diptera Dixidae larvae 0.0009 0.0052 0.0009 0.0028 0.0114 0.0041
Diptera Limoniidae larvae 0.0018 0.0716 0.0017 0.0313 0.0057 0.0222
Diptera Psychodidae larvae and pupae 0.0022 0.0751 0.0096 0.3496 0.0052 0.1677 0.1208
Diptera Simuliidae larvae 0.0013 0.0542 0.0009 0.0654 0.0070 0.1307 0.0513
Trichoptera larvae 0.0044 0.1450 0.0096 0.1165 0.0035 0.0853 0.0717
Terrestrial taxan 0.0171 0.5539 0.0507 0.9635 0.0952 0.5542 0.4361
Number of identified benthic taxa 18 24 27 20 10 19
Total mean drift over all benthic taxa 1 5 2 7 1 5
Ratio of ‘‘during’’ to ‘‘before’’ 9 4 9
Densities calculated as mean value for all samples collected before (samples 1–4, 3 stations, 3 replicate each – total of 36 samples) and during (samples 5–10, 3 stations, 3
replicate each – total of 54 samples) the hydropeaking wave, and as total calculated as mean value over all 90 samples. n=Taxa removed from statistical analysis, i.e.
planktonic Crustacea, and terrestrial taxa (Araneae, Miriapoda, Collembola, adult Diptera, Hemiptera Ephemeroptera, Thysanoptera, and riparian Coleoptera; Formicoidea,
Hymenoptera, terrestrial Isopoda, larvae of Lepidoptera). nn=Larval stages of Copepoda, which were not identified to the species level, and could not be attributed to any of
the Copepoda taxa listed, and were not included in the calculation of the number of taxa.
M. Cristina Bruno et al. / Limnologica 40 (2010) 281–290 285
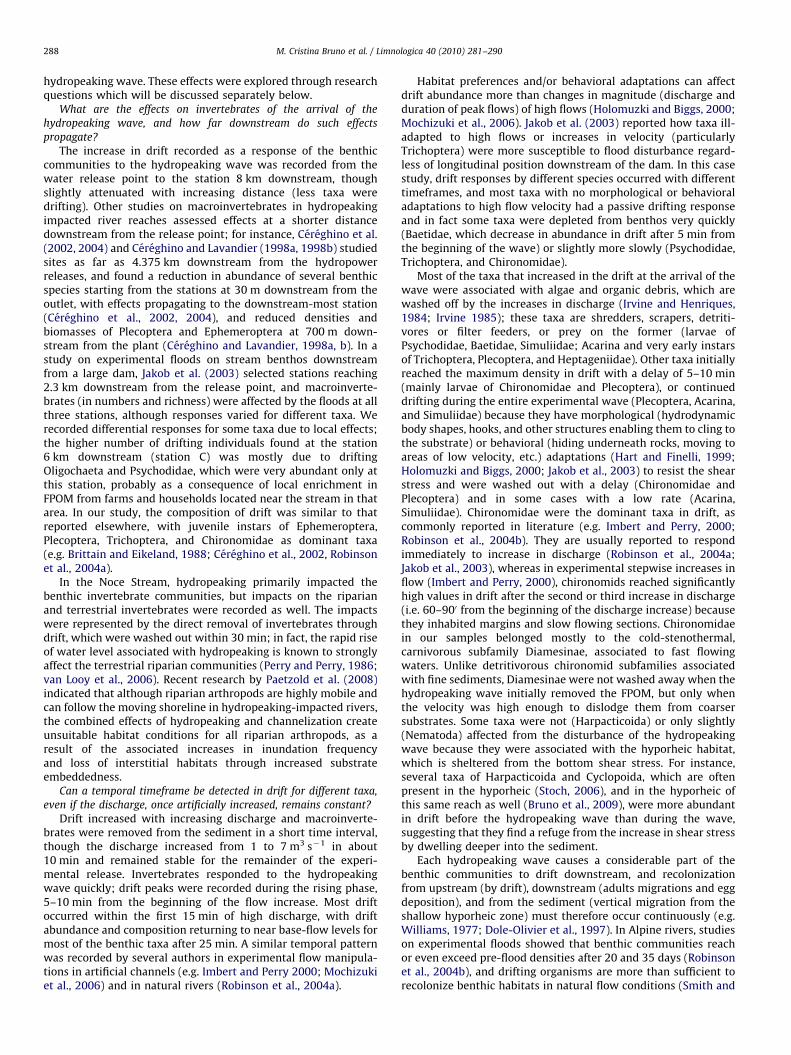
reached with the arrival of the hydropeaking wave at station B(sample 5), and after 5 min from the arrival of the wave at stationsC and D (sample 6; Fig. 6). After the peak in abundance, densitiesof drifting invertebrates decreased at all three stations, and 300
after the beginning of the wave (sample 10) densities were againsimilar to those recorded before the wave at C and D, andremained slightly higher at B (Fig. 6); in fact, although the R
values of the pairwise comparisons were not significant, theyscored �0.15 when comparing samples 9 and 10 at station B, and0.48 and 0.85, respectively, at C and D, indicating a highersimilarity for station B for those samples (value closer to 0). Mostlarvae of Baetidae, Psychodidae, Trichoptera, Simuliidae, andAcarina (Fig. 5b, c, e, f, h) peaked at the onset of thehydropeaking wave; the R value was significantly different foreach of these taxa between samples 4 (collected immediately
before the peak) and 5 (arrival of the peak), and samples 4 and 6(5 min after the beginning of the wave). Among this group of taxa,Baetidae decreased significantly in drift over time (p valuesindicated significant differences for the pairwise comparison ofsamples 5–6, 5–7, 5–8, 5–9, 5–10); Acarina and Simuliidaecontinued drifting during the wave (the same samples did notdiffer significantly), and so did Psychodidae and Trichoptera,which nonetheless were significantly reduced in drift after 30 min(differences between samples 5 and 10 were statisticallysignificant). Most Chironomidae, Plecoptera, and terrestrial taxapeaked in drift after 5 min from the beginning of the wave (Fig. 5a,d, i; sample 6 differed significantly from the ‘‘before’’ samples forall taxa, and for most of the ‘‘during’’ samples for Chironomidaeand terrestrial taxa); Plecoptera continued drifting (no significantdifferences between each pair of samples collected ‘‘during’’)
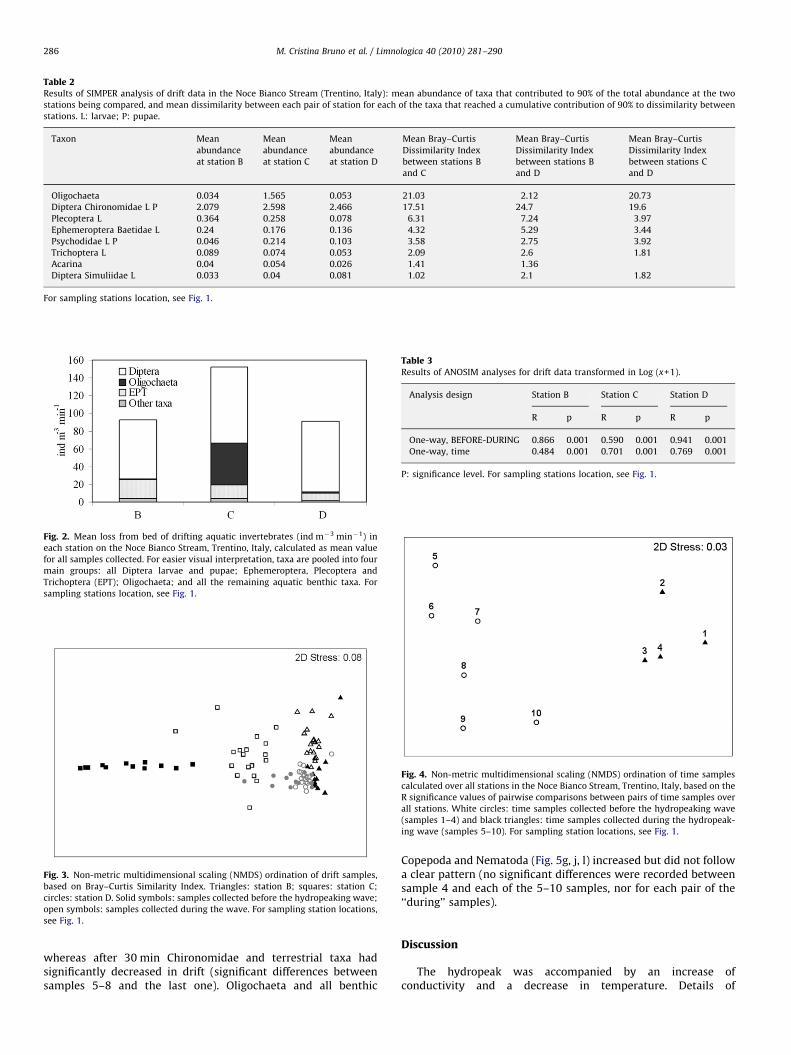
Table 2Results of SIMPER analysis of drift data in the Noce Bianco Stream (Trentino, Italy): mean abundance of taxa that contributed to 90% of the total abundance at the two
stations being compared, and mean dissimilarity between each pair of station for each of the taxa that reached a cumulative contribution of 90% to dissimilarity between
stations. L: larvae; P: pupae.
Taxon Mean
abundance
at station B
Mean
abundance
at station C
Mean
abundance
at station D
Mean Bray–Curtis
Dissimilarity Index
between stations B
and C
Mean Bray–Curtis
Dissimilarity Index
between stations B
and D
Mean Bray–Curtis
Dissimilarity Index
between stations C
and D
Oligochaeta 0.034 1.565 0.053 21.03 2.12 20.73
Diptera Chironomidae L P 2.079 2.598 2.466 17.51 24.7 19.6
Plecoptera L 0.364 0.258 0.078 6.31 7.24 3.97
Ephemeroptera Baetidae L 0.24 0.176 0.136 4.32 5.29 3.44
Psychodidae L P 0.046 0.214 0.103 3.58 2.75 3.92
Trichoptera L 0.089 0.074 0.053 2.09 2.6 1.81
Acarina 0.04 0.054 0.026 1.41 1.36
Diptera Simuliidae L 0.033 0.04 0.081 1.02 2.1 1.82
For sampling stations location, see Fig. 1.
Fig. 2. Mean loss from bed of drifting aquatic invertebrates (ind m�3 min�1) in
each station on the Noce Bianco Stream, Trentino, Italy, calculated as mean value
for all samples collected. For easier visual interpretation, taxa are pooled into four
main groups: all Diptera larvae and pupae; Ephemeroptera, Plecoptera and
Trichoptera (EPT); Oligochaeta; and all the remaining aquatic benthic taxa. For
sampling stations location, see Fig. 1.
Fig. 3. Non-metric multidimensional scaling (NMDS) ordination of drift samples,
based on Bray–Curtis Similarity Index. Triangles: station B; squares: station C;
circles: station D. Solid symbols: samples collected before the hydropeaking wave;
open symbols: samples collected during the wave. For sampling station locations,
see Fig. 1.
Table 3Results of ANOSIM analyses for drift data transformed in Log (x+1).
Analysis design Station B Station C Station D
R p R p R p
One-way, BEFORE-DURING 0.866 0.001 0.590 0.001 0.941 0.001
One-way, time 0.484 0.001 0.701 0.001 0.769 0.001
P: significance level. For sampling stations location, see Fig. 1.
Fig. 4. Non-metric multidimensional scaling (NMDS) ordination of time samples
calculated over all stations in the Noce Bianco Stream, Trentino, Italy, based on the
R significance values of pairwise comparisons between pairs of time samples over
all stations. White circles: time samples collected before the hydropeaking wave
(samples 1–4) and black triangles: time samples collected during the hydropeak-
ing wave (samples 5–10). For sampling station locations, see Fig. 1.
M. Cristina Bruno et al. / Limnologica 40 (2010) 281–290286
whereas after 30 min Chironomidae and terrestrial taxa hadsignificantly decreased in drift (significant differences betweensamples 5–8 and the last one). Oligochaeta and all benthic
Copepoda and Nematoda (Fig. 5g, j, l) increased but did not followa clear pattern (no significant differences were recorded betweensample 4 and each of the 5–10 samples, nor for each pair of the‘‘during’’ samples).
Discussion
The hydropeak was accompanied by an increase ofconductivity and a decrease in temperature. Details of
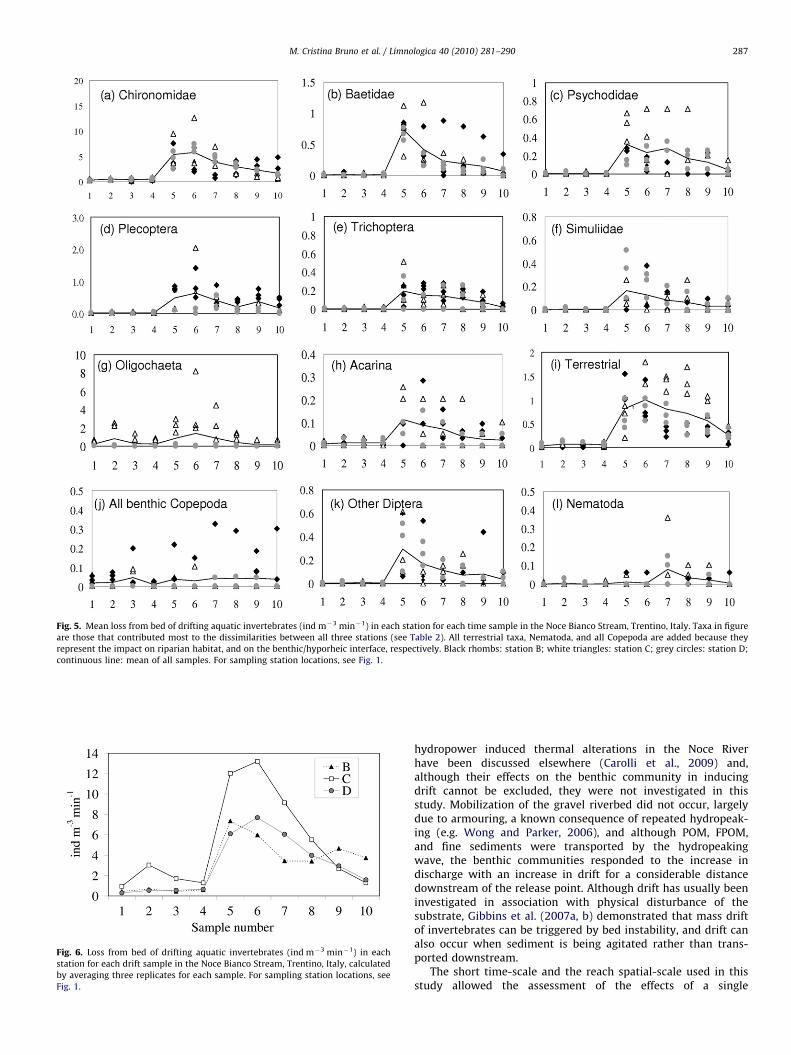
Fig. 5. Mean loss from bed of drifting aquatic invertebrates (ind m�3 min�1) in each station for each time sample in the Noce Bianco Stream, Trentino, Italy. Taxa in figure
are those that contributed most to the dissimilarities between all three stations (see Table 2). All terrestrial taxa, Nematoda, and all Copepoda are added because they
represent the impact on riparian habitat, and on the benthic/hyporheic interface, respectively. Black rhombs: station B; white triangles: station C; grey circles: station D;
continuous line: mean of all samples. For sampling station locations, see Fig. 1.
Fig. 6. Loss from bed of drifting aquatic invertebrates (ind m�3 min�1) in each
station for each drift sample in the Noce Bianco Stream, Trentino, Italy, calculated
by averaging three replicates for each sample. For sampling station locations, see
Fig. 1.
M. Cristina Bruno et al. / Limnologica 40 (2010) 281–290 287
hydropower induced thermal alterations in the Noce Riverhave been discussed elsewhere (Carolli et al., 2009) and,although their effects on the benthic community in inducingdrift cannot be excluded, they were not investigated in thisstudy. Mobilization of the gravel riverbed did not occur, largelydue to armouring, a known consequence of repeated hydropeak-ing (e.g. Wong and Parker, 2006), and although POM, FPOM,and fine sediments were transported by the hydropeakingwave, the benthic communities responded to the increase indischarge with an increase in drift for a considerable distancedownstream of the release point. Although drift has usually beeninvestigated in association with physical disturbance of thesubstrate, Gibbins et al. (2007a, b) demonstrated that mass driftof invertebrates can be triggered by bed instability, and drift canalso occur when sediment is being agitated rather than trans-ported downstream.
The short time-scale and the reach spatial-scale used in thisstudy allowed the assessment of the effects of a single
M. Cristina Bruno et al. / Limnologica 40 (2010) 281–290288
hydropeaking wave. These effects were explored through researchquestions which will be discussed separately below.
What are the effects on invertebrates of the arrival of the
hydropeaking wave, and how far downstream do such effects
propagate?
The increase in drift recorded as a response of the benthiccommunities to the hydropeaking wave was recorded from thewater release point to the station 8 km downstream, thoughslightly attenuated with increasing distance (less taxa weredrifting). Other studies on macroinvertebrates in hydropeakingimpacted river reaches assessed effects at a shorter distancedownstream from the release point; for instance, Cereghino et al.(2002, 2004) and Cereghino and Lavandier (1998a, 1998b) studiedsites as far as 4.375 km downstream from the hydropowerreleases, and found a reduction in abundance of several benthicspecies starting from the stations at 30 m downstream from theoutlet, with effects propagating to the downstream-most station(Cereghino et al., 2002, 2004), and reduced densities andbiomasses of Plecoptera and Ephemeroptera at 700 m down-stream from the plant (Cereghino and Lavandier, 1998a, b). In astudy on experimental floods on stream benthos downstreamfrom a large dam, Jakob et al. (2003) selected stations reaching2.3 km downstream from the release point, and macroinverte-brates (in numbers and richness) were affected by the floods at allthree stations, although responses varied for different taxa. Werecorded differential responses for some taxa due to local effects;the higher number of drifting individuals found at the station6 km downstream (station C) was mostly due to driftingOligochaeta and Psychodidae, which were very abundant only atthis station, probably as a consequence of local enrichment inFPOM from farms and households located near the stream in thatarea. In our study, the composition of drift was similar to thatreported elsewhere, with juvenile instars of Ephemeroptera,Plecoptera, Trichoptera, and Chironomidae as dominant taxa(e.g. Brittain and Eikeland, 1988; Cereghino et al., 2002, Robinsonet al., 2004a).
In the Noce Stream, hydropeaking primarily impacted thebenthic invertebrate communities, but impacts on the riparianand terrestrial invertebrates were recorded as well. The impactswere represented by the direct removal of invertebrates throughdrift, which were washed out within 30 min; in fact, the rapid riseof water level associated with hydropeaking is known to stronglyaffect the terrestrial riparian communities (Perry and Perry, 1986;van Looy et al., 2006). Recent research by Paetzold et al. (2008)indicated that although riparian arthropods are highly mobile andcan follow the moving shoreline in hydropeaking-impacted rivers,the combined effects of hydropeaking and channelization createunsuitable habitat conditions for all riparian arthropods, as aresult of the associated increases in inundation frequencyand loss of interstitial habitats through increased substrateembeddedness.
Can a temporal timeframe be detected in drift for different taxa,
even if the discharge, once artificially increased, remains constant?
Drift increased with increasing discharge and macroinverte-brates were removed from the sediment in a short time interval,though the discharge increased from 1 to 7 m3 s�1 in about10 min and remained stable for the remainder of the experi-mental release. Invertebrates responded to the hydropeakingwave quickly; drift peaks were recorded during the rising phase,5–10 min from the beginning of the flow increase. Most driftoccurred within the first 15 min of high discharge, with driftabundance and composition returning to near base-flow levels formost of the benthic taxa after 25 min. A similar temporal patternwas recorded by several authors in experimental flow manipula-tions in artificial channels (e.g. Imbert and Perry 2000; Mochizukiet al., 2006) and in natural rivers (Robinson et al., 2004a).
Habitat preferences and/or behavioral adaptations can affectdrift abundance more than changes in magnitude (discharge andduration of peak flows) of high flows (Holomuzki and Biggs, 2000;Mochizuki et al., 2006). Jakob et al. (2003) reported how taxa ill-adapted to high flows or increases in velocity (particularlyTrichoptera) were more susceptible to flood disturbance regard-less of longitudinal position downstream of the dam. In this casestudy, drift responses by different species occurred with differenttimeframes, and most taxa with no morphological or behavioraladaptations to high flow velocity had a passive drifting responseand in fact some taxa were depleted from benthos very quickly(Baetidae, which decrease in abundance in drift after 5 min fromthe beginning of the wave) or slightly more slowly (Psychodidae,Trichoptera, and Chironomidae).
Most of the taxa that increased in the drift at the arrival of thewave were associated with algae and organic debris, which arewashed off by the increases in discharge (Irvine and Henriques,1984; Irvine 1985); these taxa are shredders, scrapers, detriti-vores or filter feeders, or prey on the former (larvae ofPsychodidae, Baetidae, Simuliidae; Acarina and very early instarsof Trichoptera, Plecoptera, and Heptageniidae). Other taxa initiallyreached the maximum density in drift with a delay of 5–10 min(mainly larvae of Chironomidae and Plecoptera), or continueddrifting during the entire experimental wave (Plecoptera, Acarina,and Simuliidae) because they have morphological (hydrodynamicbody shapes, hooks, and other structures enabling them to cling tothe substrate) or behavioral (hiding underneath rocks, moving toareas of low velocity, etc.) adaptations (Hart and Finelli, 1999;Holomuzki and Biggs, 2000; Jakob et al., 2003) to resist the shearstress and were washed out with a delay (Chironomidae andPlecoptera) and in some cases with a low rate (Acarina,Simuliidae). Chironomidae were the dominant taxa in drift, ascommonly reported in literature (e.g. Imbert and Perry, 2000;Robinson et al., 2004b). They are usually reported to respondimmediately to increase in discharge (Robinson et al., 2004a;Jakob et al., 2003), whereas in experimental stepwise increases inflow (Imbert and Perry, 2000), chironomids reached significantlyhigh values in drift after the second or third increase in discharge(i.e. 60–900 from the beginning of the discharge increase) becausethey inhabited margins and slow flowing sections. Chironomidaein our samples belonged mostly to the cold-stenothermal,carnivorous subfamily Diamesinae, associated to fast flowingwaters. Unlike detritivorous chironomid subfamilies associatedwith fine sediments, Diamesinae were not washed away when thehydropeaking wave initially removed the FPOM, but only whenthe velocity was high enough to dislodge them from coarsersubstrates. Some taxa were not (Harpacticoida) or only slightly(Nematoda) affected from the disturbance of the hydropeakingwave because they were associated with the hyporheic habitat,which is sheltered from the bottom shear stress. For instance,several taxa of Harpacticoida and Cyclopoida, which are oftenpresent in the hyporheic (Stoch, 2006), and in the hyporheic ofthis same reach as well (Bruno et al., 2009), were more abundantin drift before the hydropeaking wave than during the wave,suggesting that they find a refuge from the increase in shear stressby dwelling deeper into the sediment.
Each hydropeaking wave causes a considerable part of thebenthic communities to drift downstream, and recolonizationfrom upstream (by drift), downstream (adults migrations and eggdeposition), and from the sediment (vertical migration from theshallow hyporheic zone) must therefore occur continuously (e.g.Williams, 1977; Dole-Olivier et al., 1997). In Alpine rivers, studieson experimental floods showed that benthic communities reachor even exceed pre-flood densities after 20 and 35 days (Robinsonet al., 2004b), and drifting organisms are more than sufficient torecolonize benthic habitats in natural flow conditions (Smith and
M. Cristina Bruno et al. / Limnologica 40 (2010) 281–290 289
Brown, 2006). Recolonization from the shallow hyporheic canrepresent an important source for benthic communities, whichcan use the hyporheic habitat as a refuge to avoid environmentalstress (Dole-Olivier et al., 1997), and thus to avoid catastrophicdrift during hydropower production operations, and the hypor-heic can function as a reservoir able to colonize depleted benthichabitats (Townsend and Hildrew, 1994). However, in the samereach of the Noce Stream investigated here, hyporheic inverte-brates diversity and abundance were reduced in the hydropeak-ing-impacted sites (Bruno et al., 2009), thus decreasing the role ofthis zone as a source of recolonization to the benthic commu-nities.
Hydropeaking events with the magnitude of the experimentalrelease occur daily in the Adige watershed, and normally lastabout 12 h (Zolezzi et al., 2009); in the Noce Stream such dailyhydropeaking waves cause a considerable part of the benthiccommunities to drift downstream, as already recorded in severalother studies (e.g. Imbert and Perry, 2000). Larger-sized indivi-duals are more easily removed, while smaller organisms or veryearly instars may survive by taking refuge in the sediment. Intime, these changes might modify the structure and compositionof downstream benthic communities (Cereghino et al., 2002); infact, once a species is lost from a stream it cannot be assumed torecolonize spontaneously (Hughes, 2007). As a consequence, inthe investigated stream, the repeated high-flow events of similarmagnitude cause considerable losses from benthic populations todrift and longitudinal differences in drift composition can indicatelong-term cumulative effects of years of hydropeaking.
This paper contributes to a better understanding of theresponses of benthic invertebrates to hydropeaking-induceddisturbance in Alpine streams. Possible stream restorationmeasures should include impacts induced by hydropeaking as anecessary step towards fully successful restoration projects.Where feasible, amelioration of hydropeaking should be a primarygoal while planning operational and structural changes in hydro-power plants.
Acknowledgements
This research is part of the project REPORT (Regulation of riverdischarges: guidelines for an eco-compatible management of theriver dynamics), co-funded by the Adige River Authority, theNatural Science Museum of Trento, and the Department of Civiland Environmental Engineering of the University of Trento. Wethank the Italian National Electric Energy Company (ENEL), inparticular Dr. Michele Buratti, for organizing the programmedrelease at the Cogolo–Malga Mare hydropower plant, theresearchers of the Environmental and Civil Engineering Depart-ment of the University of Trento for measuring and providinghydraulic variables, and Dr. Janet W. Reid, Virginia Museum ofNatural History, for revising the English of the early version of themanuscript. Excellent reviews by two anonymous referees andthe associate editor greatly improved the presentation of themanuscript.
References
Anholt, B.R., 1995. Density dependence resolves the stream drift paradox. Ecology76, 2235–2239.
Anselmetti, F., Buhler, R., Finger, D., Girardclos, S., Lancini, A., Rellstab, C., Sturm,M., 2007. Effects of Alpine hydropower dams on particle transport andlacustrine sedimentation. Aquat. Sci. 69, 179–198.
Blaschke, A.P., Steiner, K.-H., Schmalfuss, R., Gutknecht, D., Sengschmitt, D., 2003.Clogging processes in hyporheic interstices of an impounded river, the Danubeat Vienna, Austria. Int. Rev. Hydrobiol. 88, 397–413.
Bratrich, C., Truffer, B., Jorde, K., Markard, J., Meier, W., Peter, A., Schneider, M.,Wehrli, B., 2004. Green hydropower: a new assessment procedure for rivermanagement. River Res. Appl. 20, 865–882.
Brittain, J.E., Eikeland, T.J., 1988. Invertebrate drift. A review. Hydrobiologia 166,77–93.
Bruno, M.C., Maiolini, B., Carolli, M., Silveri, L., 2009. Hydropeaking impact onhyporheic invertebrates of an Alpine stream (Trentino, Italy). Int. J. Limnol. 45,157–170.
Campaioli, S., Ghetti, P.F., Minelli, A., Ruffo, S., 1994. Manuale per il riconoscimentodei macroinvertebrati delle acque dolci italiane, vol. I. Provincia Autonoma diTrento.
Campaioli, S., Ghetti, P.F., Minelli, A., Ruffo, S., 1999. Manuale per il riconoscimentodei macroinvertebrati delle acque dolci italiane, vol. II. Provincia Autonoma diTrento.
Carolli, M., Maiolini, B., Bruno, M.C., Silveri, L., Siviglia, A., 2009. Thermopeaking inan hydropower impacted Alpine catchment. In: Gumiero, M., Rinaldi, B.,Fokkens (Eds.), Proceedings of the Fourth European Center for RiverRestoration (ECRR) International Conference for River Restoration. IndustrieGrafiche Vicentine, Vicenza, pp. 789–796.
Cereghino, R., Lavandier, P., 1998a. Influence of hypolimnetic hydropeaking on thedistribution and population dynamics of Ephemeroptera in a mountainstream. Freshwater Biol. 40, 385–399.
Cereghino, R., Lavandier, P., 1998b. Influence of hydropeaking on the distributionand larval development of the Plecoptera from a mountain stream. Regul.Rivers Res. Manage. 14, 297–309.
Cereghino, R., Cugny, P., Lavandier, P., 2002. Influence of intermittent hydropeak-ing on the longitudinal zonation patterns of benthic invertebrates in amountain stream. Int. Rev. Hydrobiol. 87, 47–60.
Cereghino, R., Legalle, M., Lavandier, P., 2004. Drift and benthic populationstructure of the mayfly Rhithrogena semicolorata (Heptageniidae) undernatural and hydropeaking conditions. Hydrobiologia 519, 127–133.
Clarke, K.R., 1993. Non-parametric multivariate analysis of changes in communitystructure. Aust. J. Ecol. 18, 117–143.
Clarke, K.R., Gorley, R.N., 2006. PRIMER-Es (v6), User Manual/Tutorial. PRIMER-ELtd., Plymouth, UK.
Culp, J.M., Wrona, F.J., Davies, R.W., 1985. Response of stream benthos and drift tofine sediment deposition versus transport. Can. J. Zool. 64, 1345–1351.
Dole-Olivier, M.J., Marmonier, P., Beffy, J.L., 1997. Response of invertebrates to loticdisturbance: is the hyporheic zone a patchy refugium? Freshwater Biol. 37,257–276.
Dussart, B.H., 1967. Les Copepodes des eaux souterraines littorales et continentalsd’Europe occidentale, Tome I. Calanoides et Harpacticoides. N. Boubee et Cie., Paris.
Dussart, B.H., 1969. Les Copepodes des eaux continentales d’Europe occidentale,Tome II: Cyclopoıdes et Biologie. N. Boubee et Cie, Paris.
Fette, M., Weber, C., Peter, A., Wehrli, B., 2007. Hydropower production and riverrehabilitation: a case study on an alpine river. Environ. Model. Assess. 12,257–267.
Fochetti, R., Ravizza, C.A., Tierno De Figueroa, J.M., 2009. Plecoptera. Fauna d’Italia,vol. 43. Calderini, Bologna.
Gibbins, C.N., Jeffries, M., Soulsby, C., 2000. Impacts of an inter-basin watertransfer: distribution and abundance of Micronecta poweri (Insecta: Corixidae)in the River Wear, North-East England. Aquat. Conserv. Mar. FreshwaterEcosyst. 10, 103–115.
Gibbins, C.N., Scott, E., Soulsby, C., McEwan, I., 2005. The relationship betweensediment mobilisation and the entry of Baetis mayflies into the drift in alaboratory flume. Hydrobiologia 533, 115–122.
Gibbins, C.N., Vericat, D., Batalla, R.J., Gomez, C.M., 2007a. Shaking and moving:low rates of sediment transport trigger mass drift of stream invertebrates. Can.J. Fish. Aquat. Sci. 64, 1–5.
Gibbins, C.N., Vericat, D., Batalla, R.J., 2007b. When is stream invertebrate driftcatastrophic? The role of hydraulics and sediment transport in initiating driftduring flood events. Freshwater Biol. 52, 2369–2384.
Gore, J.A., Nestler, J.M., Layzer, J.B., 1989. Instream flow predictions and manage-ment options for biota affected by peaking power hydroelectric operations.Regul. Rivers Res. Manage. 3, 35–48.
Hay, C., Franti, T., Marx, D., Peters, E., Hesse, L., 2008. Macroinvertebrate driftdensity in relation to abiotic factors in the Missouri River. Hydrobiologia 598,175–189.
Hart, D.D., Finelli, C.M., 1999. Physical–biological coupling in streams: thepervasive effects of flow on benthic organisms. Annu. Rev. Ecol. Syst. 30,363–395.
Holomuzki, J.R., Biggs, B.J.F., 2000. Taxon-specific responses to high-flowdisturbance in streams: implications for population persistence. J. N. Am.Benthol. Soc. 19, 670–679.
Hughes, J.M., 2007. Constraints on recovery: using molecular methods to studyconnectivity of aquatic biota in rivers and streams. Freshwater Biol. 52,616–631.
Imbert, J.B., Perry, J.A., 2000. Drift and benthic invertebrate responses to stepwiseand abrupt increases in non-scouring flow. Hydrobiologia 436, 191–208.
Irvine, J.R., 1985. Effects of successive flow perturbations on stream invertebrates.Can. J. Fish. Aquat. Sci. 42, 1922–1927.
Irvine, J.R., Henriques, P.R., 1984. A preliminary investigation on effects offluctuating flows on invertebrates of the Hawea River, a large regulated riverin New Zealand. N. Z. J. Mar. Freshwater Res. 18, 283–290.
Jakob, C., Robinson, C.T., Uehlinger, U., 2003. Longitudinal effects of experimentalfloods on stream benthos downstream from a large dam. Aquat. Sci. 65, 223–231.
M. Cristina Bruno et al. / Limnologica 40 (2010) 281–290290
Karaytug, S., 1999. Copepoda: Cyclopoida. Genera Paracyclops, Ochridacyclops andkey to the Eucyclopinae. In: Dumont, H.J.F. (Ed.), Guides to the Identification ofthe Microinvertebrates of the Continental Waters of the World. SPB AcademicPublishing, The Hague, The Netherlands.
Mochizuki, S., Kayabam, Y., Tanida, K., 2006. Drift patterns of particulate matterand organisms during artificial high flows in a large experimental channel.Limnology 7, 93–102.
Paetzold, A., Yoshimura, C., Tockner, K., 2008. Riparian arthropod responses to flowregulation and river channelization. J. Appl. Ecol. 45, 894–903.
Perry, S.A., Perry, W.B., 1986. Effects of experimental flow regulation oninvertebrate drift and stranding in the Flathead and Kootenai Rivers, Montana,USA. Hydrobiologia 134, 171–182.
Pesce, G.L., Galassi, D.M.P., 1987. New or rare species of Diacyclops Kiefer, 1927(Copepoda, Cyclopoida) from different groundwater habitats in Italy. Hydro-biologia 148, 103–144.
Poff, N.L., Hart, D.D., 2002. How dams vary and why it matters for the emergingscience of dam removal. Bioscience 52, 659–668.
Robinson, C.T., Aebischer, S., Uehlinger, U., 2004a. Immediate and habitat-specificresponses of macroinvertebrates to sequential, experimental floods. J. N. Am.Benthol. Soc. 23, 853–867.
Robinson, C.T., Uehlinger, U., Monaghan, M.T., 2004b. Stream ecosystem responseto multiple experimental floods from a reservoir. River Res. Appl. 20, 359–377.
Smith, F., Brown, A., 2006. Effects of flow on meiofauna colonization in artificialstreams and reference sites within the Illinois River, Arkansas. Hydrobiologia571, 169–180.
StatSoft Inc., 2008. STATISTICA (Data Analysis Software System), version 8.1./www.stasoft.comS.
Statzner, B., Gore, J.A., Resh, V.H., 1988. Hydraulic stream ecology: observedpatterns and potential applications. J. N. Am. Benthol. Soc. 7, 307–360.
Stoch, F., 1998. Moraria alpina n. sp. and redescription of Moraria radovnae Brancelj1988, new rank, from Italian and Slovenian Alps (Crustacea, Copepoda,Harpacticoida). St. Trent. Sc. Nat. Acta Biol. 73, 135–145.
Stoch, F., 2006. Copepoda. In: Ruffo, S., Stoch, F. (Eds.), Checklist and Distribution ofthe Italian Fauna. Mem. Mus. Civ. St. Nat. Verona, 2. ser., Sez. Scienze Vita 17,pp. 77–78 with data in CD-ROM.
Tockner, K., Waringer, J.A., 1997. Measuring drift during a receding flood: resultsfrom an Austrian mountain brook (Ritrodat-Lunz). Int. Rev. GesamtenHydrobiol. 82, 1–13.
Townsend, C.R., Hildrew, A.G., 1994. Species traits in relation to a habitat templetfor river systems. Freshwater Biol. 31, 265–276.
van Looy, K., Jochems, H., Vanacker, S., Lommelen, E., 2006. Hydropeaking impacton a riparian ground beetle community. River Res. Appl. 23, 223–233.
Williams, D.D., 1977. Movements of benthos during the recolonization oftemporary streams. Oikos 29, 306–312.
Wong, M., Parker, G., 2006. One-dimensional modeling of bed evolution in a gravelbed river subject to a cycled flood hydrograph. J. Geophys. Res. 111, 20,doi:10.1029/2006JF000478.
Zolezzi, G., Bellin, A., Bruno, M.C., Maiolini, B., Siviglia, A., 2009. Assessinghydrological alterations at multiple temporal scales: Adige River, Italy. WaterResour. Res. in press, doi:10.1029/2008WR007266.