Sheetlines - Amazon S3
59
Sheetlines The journal of THE CHARLES CLOSE SOCIETY for the Study of Ordnance Survey Maps This edition of Sheetlines was published in 2010 and the articles may have been superseded by later research. Please check the index at http://www.charlesclosesociety.org/sheetlinesindex for the most up-to-date references This article is provided for personal, non-commercial use only. Please contact the Society regarding any other use of this work. Published by THE CHARLES CLOSE SOCIETY for the Study of Ordnance Survey Maps www.CharlesCloseSociety.org The Charles Close Society was founded in 1980 to bring together all those with an interest in the maps and history of the Ordnance Survey of Great Britain and its counterparts in the island of Ireland. The Society takes its name from Colonel Sir Charles Arden-Close, OS Director General from 1911 to 1922, and initiator of many of the maps now sought after by collectors. The Society publishes a wide range of books and booklets on historic OS map series and its journal, Sheetlines, is recognised internationally for its specialist articles on Ordnance Survey-related topics.
-
Upload
khangminh22 -
Category
Documents
-
view
0 -
download
0
Transcript of Sheetlines - Amazon S3
SheetlinesThe journal of
THE CHARLES CLOSE SOCIETYfor the Study of Ordnance Survey Maps
This edition of Sheetlines was publishedin 2010 and the articles may have been
superseded by later research.Please check the index at
http://www.charlesclosesociety.org/sheetlinesindexfor the most up-to-date references
This article is provided for personal, non-commercial use only.Please contact the Society regarding any other use of this work.
Published byTHE CHARLES CLOSE SOCIETY
for the Study of Ordnance Survey Mapswww.CharlesCloseSociety.org
The Charles Close Society was founded in 1980 to bring together all those withan interest in the maps and history of the Ordnance Survey of Great Britain andits counterparts in the island of Ireland. The Society takes its name from ColonelSir Charles Arden-Close, OS Director General from 1911 to 1922, and initiator ofmany of the maps now sought after by collectors.
The Society publishes a wide range of books and booklets on historic OS mapseries and its journal, Sheetlines, is recognised internationally for its specialistarticles on Ordnance Survey-related topics.
Number 88 August 2010
SheetlinesThe Journal of
THE CHARLES CLOSE SOCIETYfor the Study of Ordnance Survey Maps
Published byThe Charles Close Society for the Study of Ordnance Survey Mapswww.charlesclosesociety.org© Copyright 2010The various authors and the Charles Close Society
Printed by Winfield Print & Design Ltd
Sheetlines Number 88 - August 2010
Ordnance Survey consultation Richard OliverD F WattAnthony Cartmell 3Imortant new listings on CCS website 7Alan Sillitoe (1928-2010) David Archer 9Ordnance Survey and cartographic style Alexander J Kent 11Oxbridge ramblings Chris Higley 17More New Popular printings and KS Andrewsother discoveries and PS Welham 25Cover up:recent changes to OS leisure map covers Ed Fielden 33More battles John Cole 36My great, great grandfatherwas a leveller and contourer Bob Shannon 37Surveyor's name on an OS map Richard T Porter 41Not such a Scilly map? Gerry Zierler 45Puzzle corner 88 46Kerry musings David Archer 47Review: The landscape of London Richard Oliver 50Letters 52
1
Sheetlines Number 88 August 2010
Thank you to all who suggested further enhancements to the re-designed Sheetlines. This edition has benefited from your input and we hope to introduce more changes in response to your on-going comments. Keep them coming.
The result of the national consultation on the policy options for Ordnance Survey, described in Sheetlines 87, has now been published. Richard Oliver, David Watt and Anthony Cartmell give their reactions, starting on page 3.
A major new development to the Society website www.CharlesCloseSociety.org has been the posting of listings of OS Annual Reports, Catalogues, Supplements to catalogues, Descriptive booklets and cartobibliography of Special Emergency Edition 1:10,560 maps of 1938. More on this on page 7.
One aspect of OS history that is not often considered is the story of the people who worked for the organisation. In this edition we feature the lives of two employees, one nineteenth century, one twentieth century, respectively John Shannon (page 37) and Kenneth Dunlop on page 41.
Interestingly, two contributors to this edition comment on the relative area of the paper sheet devoted to the actual map, comparing OS sheets unfavourably with competing products. See Gerry Zierler’s review of the McAuley map of Isles of Scilly on page 45 and Richard Oliver’s of The landscape of London on page 50.
The publishers of The landscape of London, are offering CCS members an introductory 35% discount and free p&p. Orders, accompanied by a cheque for the full amount of £6.50 per copy should be sent to Anderson Geographics Ltd, 21 Seddon Hill, Bracknell, Berkshire, RG42 2PF. Cheques should be made payable to Anderson Geographics Ltd. Orders should state your name, delivery address, contact number or e-mail and number of maps required.
Number 3 in our series Maps from the past is a reproduction of 1:2500 special sheet of the Crystal Palace and environs, published by OS in May 1863. A complimentary copy was intended to be sent to all members with this edition of Sheetlines. However, last minute technical difficulties have conspired to prevent this. It will be sent in due course and further copies will be available for purchase at £6 (including p&p) from the publications manager (contact details opposite).
2
Diary 2010/11
until 29 August, NLS. Display of original Pont manuscript maps of Scotland. until 19 September, BL. Magnificent Maps; Power, propaganda and art. until 17 October, Mary Rose museum, Portsmouth Historic Dockyard. Mapping Portsmouth’s Tudor Past until 14 November, NLS. Summer exhibition, ‘A swing through time’. The history of golf in Scotland including John Geddie’s bird’s-eye view of St Andrews in the 1580s, maps of Gleneagles and environs in the 1820s, as well as fixture cards from John Bartholomew & Co’s staff Golf Club. 4 November, Warburg. Professor Adrian Seville (formerly City University). ‘Cartographic Race Games in Europe: Entertainment, Education - or Influence?’ 16 November, Cambridge. Emma Perkins (Department of History & Philosophy of Science, Cambridge University) About globes. 2 December, Warburg. Professor Meg Roland (Marylhurst University, Oregon). ‘The Compost of Ptolemy and the Gosson Map (1600/1623?): English Geographic Thought and the Early Modern Print Almanac’. 20 January, Warburg. Gillian Hutchinson (National Maritime Museum, Greenwich). ‘The First Two Centuries of Mercator Projection Sea Charts: Positioning the Practitioners, Leaving the Ships at Sea?’ 17 February, Warburg. Emeritus Professor Roy Bridges (Uni. of Aberdeen). ‘Cartography and Credulity: Mapping the Sources of the Nile since 150 AD’. 22 February, Cambridge. Allison Ksiazkiewicz (Cambridge University) About early nineteenth-century geological maps. 3 March, Warburg. Dr John Montague (Royal Irish Academy, Dublin). ‘London 1747 and Dublin 1756: John Rocque’s Capital City Maps’. 31 March, Warburg Institute. Tom Harper (Maps, British Library). ‘A Window on the World: Maps in the European Schoolroom in the Nineteenth and Twentieth Centuries’. 5 May, Warburg. Dr Diarmuid Scully (University College, Cork). ‘Mapping the Farthest Western lands: Gerald of Wales on Ireland and English Imperium in the Twelfth Century’. 7 May, CCS Annual General Meeting, Kingston-on-Thames 10 May, Cambridge. Nessa Cronin (National University of Ireland, Galway) Topic to be confirmed 26 May, Warburg. Professor Emeritus P. D. A. Harvey (University of Durham). ‘Local Maps in Medieval Europe. The Last Twenty Years’.
BL: British Library, 96 Euston Road, London NW1 2DB Cambridge: Cambridge Seminars in the History of Cartography. Meetings held at Gardner Room, Emmanuel College, St Andrew’s Street, Cambridge, CB2 3AP at 5.30pm. Admission free, all welcome. Meetings are followed by refreshments. NLS: National Library of Scotland, George IV Bridge, Edinburgh. Warburg: Maps & Society Series. Meetings held at The Warburg Institute, University of London, Woburn Square, London WC1H OAB at 5.00pm. Admission free, all welcome. Meetings are followed by refreshments.
3
Three responses to the recent Ordnance Survey consultation
1. Richard Oliver
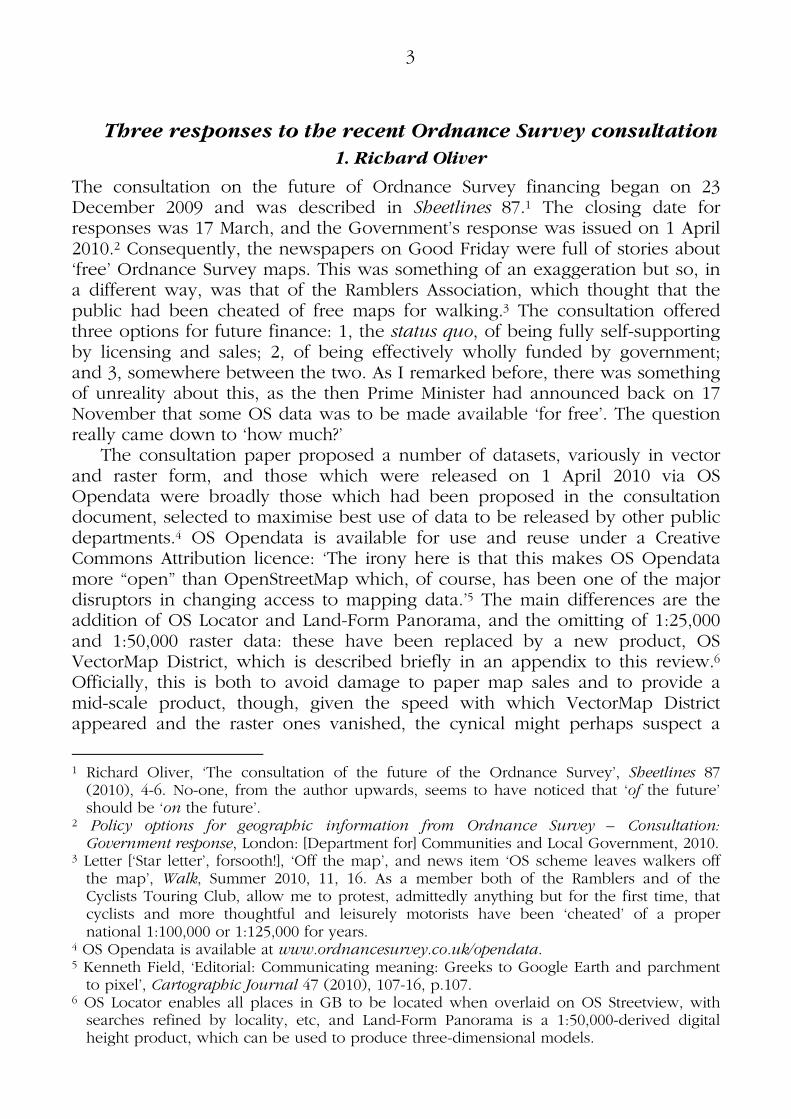
The consultation on the future of Ordnance Survey financing began on 23 December 2009 and was described in Sheetlines 87.1 The closing date for responses was 17 March, and the Government’s response was issued on 1 April 2010.2 Consequently, the newspapers on Good Friday were full of stories about ‘free’ Ordnance Survey maps. This was something of an exaggeration but so, in a different way, was that of the Ramblers Association, which thought that the public had been cheated of free maps for walking.3 The consultation offered three options for future finance: 1, the status quo, of being fully self-supporting by licensing and sales; 2, of being effectively wholly funded by government; and 3, somewhere between the two. As I remarked before, there was something of unreality about this, as the then Prime Minister had announced back on 17 November that some OS data was to be made available ‘for free’. The question really came down to ‘how much?’
The consultation paper proposed a number of datasets, variously in vector and raster form, and those which were released on 1 April 2010 via OS Opendata were broadly those which had been proposed in the consultation document, selected to maximise best use of data to be released by other public departments.4 OS Opendata is available for use and reuse under a Creative Commons Attribution licence: ‘The irony here is that this makes OS Opendata more “open” than OpenStreetMap which, of course, has been one of the major disruptors in changing access to mapping data.’5 The main differences are the addition of OS Locator and Land-Form Panorama, and the omitting of 1:25,000 and 1:50,000 raster data: these have been replaced by a new product, OS VectorMap District, which is described briefly in an appendix to this review.6 Officially, this is both to avoid damage to paper map sales and to provide a mid-scale product, though, given the speed with which VectorMap District appeared and the raster ones vanished, the cynical might perhaps suspect a
1 Richard Oliver, ‘The consultation of the future of the Ordnance Survey’, Sheetlines 87 (2010), 4-6. No-one, from the author upwards, seems to have noticed that ‘of the future’ should be ‘on the future’.
2 Policy options for geographic information from Ordnance Survey – Consultation: Government response, London: [Department for] Communities and Local Government, 2010.
3 Letter [‘Star letter’, forsooth!], ‘Off the map’, and news item ‘OS scheme leaves walkers off the map’, Walk, Summer 2010, 11, 16. As a member both of the Ramblers and of the Cyclists Touring Club, allow me to protest, admittedly anything but for the first time, that cyclists and more thoughtful and leisurely motorists have been ‘cheated’ of a proper national 1:100,000 or 1:125,000 for years.
4 OS Opendata is available at www.ordnancesurvey.co.uk/opendata. 5 Kenneth Field, ‘Editorial: Communicating meaning: Greeks to Google Earth and parchment to pixel’, Cartographic Journal 47 (2010), 107-16, p.107.
6 OS Locator enables all places in GB to be located when overlaid on OS Streetview, with searches refined by locality, etc, and Land-Form Panorama is a 1:50,000-derived digital height product, which can be used to produce three-dimensional models.
4
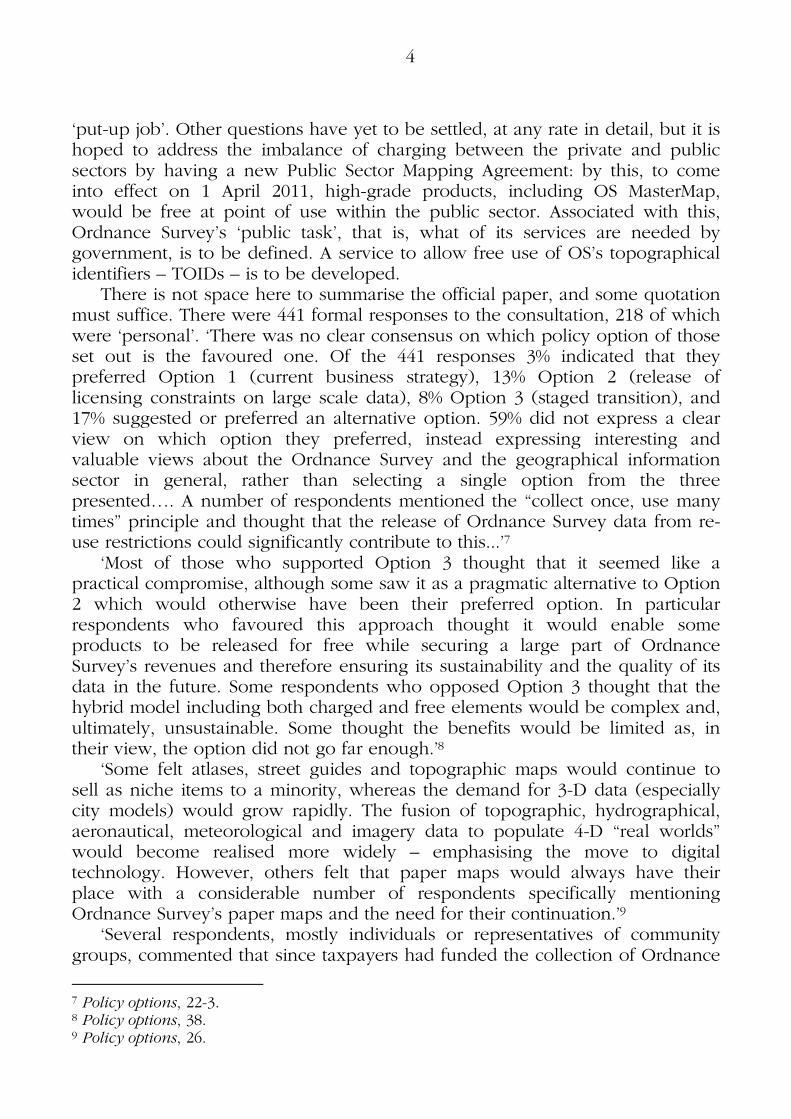
‘put-up job’. Other questions have yet to be settled, at any rate in detail, but it is hoped to address the imbalance of charging between the private and public sectors by having a new Public Sector Mapping Agreement: by this, to come into effect on 1 April 2011, high-grade products, including OS MasterMap, would be free at point of use within the public sector. Associated with this, Ordnance Survey’s ‘public task’, that is, what of its services are needed by government, is to be defined. A service to allow free use of OS’s topographical identifiers – TOIDs – is to be developed.
There is not space here to summarise the official paper, and some quotation must suffice. There were 441 formal responses to the consultation, 218 of which were ‘personal’. ‘There was no clear consensus on which policy option of those set out is the favoured one. Of the 441 responses 3% indicated that they preferred Option 1 (current business strategy), 13% Option 2 (release of licensing constraints on large scale data), 8% Option 3 (staged transition), and 17% suggested or preferred an alternative option. 59% did not express a clear view on which option they preferred, instead expressing interesting and valuable views about the Ordnance Survey and the geographical information sector in general, rather than selecting a single option from the three presented…. A number of respondents mentioned the “collect once, use many times” principle and thought that the release of Ordnance Survey data from re-use restrictions could significantly contribute to this...’7
‘Most of those who supported Option 3 thought that it seemed like a practical compromise, although some saw it as a pragmatic alternative to Option 2 which would otherwise have been their preferred option. In particular respondents who favoured this approach thought it would enable some products to be released for free while securing a large part of Ordnance Survey’s revenues and therefore ensuring its sustainability and the quality of its data in the future. Some respondents who opposed Option 3 thought that the hybrid model including both charged and free elements would be complex and, ultimately, unsustainable. Some thought the benefits would be limited as, in their view, the option did not go far enough.’8
‘Some felt atlases, street guides and topographic maps would continue to sell as niche items to a minority, whereas the demand for 3-D data (especially city models) would grow rapidly. The fusion of topographic, hydrographical, aeronautical, meteorological and imagery data to populate 4-D “real worlds” would become realised more widely – emphasising the move to digital technology. However, others felt that paper maps would always have their place with a considerable number of respondents specifically mentioning Ordnance Survey’s paper maps and the need for their continuation.’9
‘Several respondents, mostly individuals or representatives of community groups, commented that since taxpayers had funded the collection of Ordnance
7 Policy options, 22-3. 8 Policy options, 38. 9 Policy options, 26.
5
Survey data access to that data should be free.’10 ‘Many respondents thought that a key step in response to this consultation
would be for government to clearly set out Ordnance Survey’s public purpose, taking into account the requirements that government has for Ordnance Survey data. Several commented that the public task should include an element related to data being available to the public for free re-use, and an element related to the “public good” from Ordnance Survey providing definitive high-specification mapping data to enable… functions such as land registration and planning. Others thought that the task … should include free provision of data such as boundary, addressing and postcode information, but should not include mapping which could be provided by the competitive market.’11
It hardly needs to be said that the new policy was adopted before the change of government following the election of May 2010, and it remains to be seen what the effect will be of the heavy cuts in public expenditure to be announced in the autumn. There are some of us who feel that the real ‘inefficiency’ in Ordnance Survey is in the considerable apparatus needed to ‘police’ the current data licensing and sales (including, reportedly, six ‘in-house’ lawyers), and that it would be much better to get rid of it, charge the cost of maintaining the data to the national exchequer, and only charge users for any subsequent processing and dissemination. The expected restraint on public spending over the next few years may delay such a change, but I see no reason to refrain from promoting it.
Appendix: OS VectorMap District Rather confusingly, this is available in both vector and raster forms. The scope of the content is partly indicated by the legend for the raster version: four classes of ‘numbered’ road, ‘minor road’, ‘local street’, ‘pedestrianised street’, with a few principal streets named, road tunnels; railways (single and multiple track, and ‘narrow gauge railway or light rapid transit system’) and stations (ordinary, LRT, underground); ordinary buildings and glasshouses; national, county (English), unitary, etc and civil parish or community boundaries; ‘landforms’ (a rocky effect), wood, ‘water’ (streams and lakes), mean high and low water, spot heights, ‘heritage sites’; ‘functional sites’ (‘education’, hospital, police, ‘sports or leisure centre’: not places of worship). No bridges, ‘landmarks’ or tourist features per se are shown; nor are fields or public rights of way depicted. The building generalisation looks similar to that of the 1:50,000, but comparison shows that it is actually more refined, though it is far more generalised than even that of the 1:25,000 Provisional Edition/First Series: for example, it is impossible to distinguish areas of terrace-housing from those of semi-detached. It is possible that this data might be a starting-point for redesigned versions of both the 1:25,000 Explorer and 1:50,000 Landranger, but in its present form it has great limitations as topographic mapping for use on the ground: but then that was not its intention.
10 Policy options, 28. As I have pointed out elsewhere, only a diminishing part of Ordnance Survey data is ‘funded by the taxpayer’: see Richard Oliver, ‘Why the Ordnance Survey needs its history’, Sheetlines 80 (2007), 6-19, esp. p.18.
11 Policy options, 30.
6
2. D F Watt
Having read a number of reactions to the 2010 OS consultative exercise (Sheetlines 87), below is the summary of my submission. The full response from OS is still in train but I understand uses the ‘Government response’ merely as a starting point for a much more wide ranging review of systems and products. Nevertheless given this ‘shot-across-the-bows’ I do hope OS will look at the last few months as a wake-up call to conduct a root-and-branch review, creating fresh, innovative products.
‘Government must continue to recognise that it costs money to create and maintain the world-class large-scale vector data OS produce and that either it, or the data users, whether private individuals or public bodies, must continue in some way to remunerate OS for this work.
OS should become a pure data creator/maintainer/QA organisation for the Digital National Framework and create separate vector datasets at nominal scales of around 1:40 000 and 1:250 000 until technology allows generalisation of DNF data to up to 1:625 000. Once the technology is developed these other databases should be discontinued.
OS should continue to work with commercial utility and mobile phone companies to maintain its databases at minimal cost to the taxpayer. But its databases should only contain data which customers are willing to pay for (there is a template for this in The UKMap dataset).
OS should make these datasets available at a price which covers the full marginal cost (surveyors wages, cost of equipment, pensions etc). It should not be a producer/distributor of any ‘mapping’ either paper, raster or vector and it should be allowed to resell its trade names should it so wish. This will decrease OS costs and stop its dual government/commercial status whilst maintaining its position as the UK centre of excellence for large-scale vector data.
The GI market for paper and digital maps should be satisfied by commercial companies in UK or elsewhere who would use OS base data to derive whatever map ‘looks’/specifications they wish. The UK would become a centre for truly innovative, customer driven, design oriented mapping’.
3. Anthony Cartmell
The OS have been clever with freeing up their data, managing to keep existing map re-sellers (like the digital mapping companies) happy while also appeasing most of the people wanting more free (as in not over-restricted by licence rules) access to map data. In effect they’ve kept most things unchanged, while also making it much easier for people to re-use the raw location data gathered and maintained by OS and other public bodies.
OS have kept their control over their raster maps: these contain a large amount of effort and experience in map-making from the OS, which should indeed be protected. This is good news, as it means that we won’t see the long-standing OS raster maps like Landranger disappearing any time soon: they will
7
remain solely supplied by OS, and remain some of the most information-efficient maps for general-purpose use. Digital mapping business models will also remain much the same, selling protected OS raster mapping and licences with a small mark-up based on mapped area while giving away the associated map-viewing software. Digital map users still have to pay for their maps, but the mapping software remains free and now there are opportunities to use free maps as well as the well-known OS maps.
But OS have also released large amounts of most-useful vector data, and basic point locations, for others to use in digital applications that don’t compete with OS’s business. This vector data includes such things as electoral boundaries, which people can now publish on the internet legally for the first time! The issues with ‘derived data’ have also disappeared to a large extent, meaning that using Google Maps for UK locations no longer causes licensing headaches. One major impact on the freeing of OS raw data is that OpenStreetMap can now display OS data as well as that gathered by volunteers with GPS units.1 At the moment the OS data is merely being made available to check for missing roads and to check for possible errors, but even this is most useful for the community-driven map project.
Some digital mapping companies are already starting to build their own raster maps from the now-free OS data, and releasing free data that was previously restricted by OS licenses, such as the UK 1:50,000 Gazetteer and the digital terrain model (height data).2 The freeing of OS data from restrictive licenses also opens up many opportunities for people to use location data in the UK in more innovative and powerful ways. Which was the whole point of relaxing the licensing of UK location data in the first place.
1 A summary of the freed OS data, and how OpenStreetMap might use it: http://wiki.openstreetmap.org/wiki/Ordnance_Survey_Opendata 2 For example http://www.mapyx.com/index.asp?tn=media&c=151&cid=779
Important new listings now posted on CCS website
In Sheetlines 80, 2007, Roger Hellyer proposed the creation of a union list of OS catalogues. In the early years the catalogues were printed in small quantities, in some cases as few as fifty copies only, if print codes are to be believed. The supplements were often no more than a single octavo sheet of paper. Such is the rarity of the surviving copies of either resource, it is clear that in many cases they were treated (much as are their present day equivalents) as ephemeral items, to be disposed of when the new updated issue became available. Thus, before about 1890 when a fairly regular pattern of annual publication of the catalogues emerged, it is safe to say that no-one now has any idea how many issues of the catalogues there were; further, that the evidence of the irregularity
8
of issues that are recorded (sometimes two a year, sometimes a gap of five years or more) suggest that there are many more still to be discovered.
Now Roger has co-ordinated the compilation of provisional union lists of Catalogues and supplements, showing all known such documents and the libraries in which they can be found. The lists cover the period from 1863 and include Geological Survey as well as Ordnance Survey publications and include Scotland and Ireland as well as England and Wales. The information is regarded as provisional as copies may yet remain to be discovered and it is hoped that publication of the lists on the website will encourage the emergence of additional information enabling more complete records to be eventually produced.
As well as Catalogues and supplements, two further listings of OS ancillary publications have been compiled and posted on the website. These are of Annual reports and Description booklets.
This first Annual report, signed off on 10 December 1856, covered the year 1855-6, but it was only printed in late June or July 1857. It was followed by a similar report for 1858, since when the publication of annual reports has continued without interruption to the present day, only the years of the second world war and its immediate aftermath being excepted. Until 1921 they appeared as parliamentary papers, with additional copies being available on sale to the public.
OS began issuing booklets offering summary descriptions of the different maps on offer at all the scales in current use in the mid-1880s. The final editions of these booklets appeared in the mid-1950s, and only once since has the Ordnance Survey attempted any similar publication, in book form on a much grander scale than any of its predecessors.1
A new provisional cartobibliography has also been posted on the website; that of the 1938 ‘Special Emergency Edition’. This series was not available to the public and no copies were sent to the legal deposit libraries.
Until about 1935 it was usual for revised OS 1:2500 mapping to be followed by revised versions of the relevant 1:10,560 sheets, but because of the slow progress of 1:2500 revision after 1914 comparatively few fully revised 1:10,560 sheets were published in the 1930s. However, in 1938-9 a ‘Special Emergency Edition’ was produced, for Air Raid Precaution (ARP) planning. According to a later record, 3058 sheets were produced.2 The Special Emergency Edition seems to have been produced for all places in Britain with a population in excess of approximately 2000. It is thus of considerable value as a record of the approximate state of urban expansion on the eve of World War II.
Again, the listing is considered as provisional, as more investigation is needed to complete the record.
1 J B Harley, Ordnance Survey maps a descriptive manual, Southampton: Ordnance Survey, 1975.
2 TNA PRO OS 11/41, folio 2A.

9
Alan Sillitoe (1928-2010)
David Archer
Read Alan Sillitoe’s autobiography1, and you will agree that maps were important to him throughout his life. ‘My interest in maps, navigation and geography has persisted...’ Maps and map reading. Making and drawing maps. Using maps. Maps and air charts. Maps in guide books. Maps, guide books, foreign countries, military and writing, these are the things I associate with the late Alan Sillitoe, Charles Close Society member 720.
I made contact with Alan at the end of 1986, after he had disposed of a large part of his map collection, including most of his Ordnance Survey maps,2 but from the maps I bought and those he mentioned in letters and conversation, I would suggest that he had built a wide ranging collection, rambling even. Like so many of us, he appeared to have a weakness for an attractive or interesting map of anywhere, although Nottingham, military and 1:1,000,000 maps were his prime targets when I knew him in later life. He was very interested in foreign countries and collected travel guides, especially Baedekers, loving the maps within.
During our initial exchanges, Alan asked about First World War trench maps, which were obviously of almost passionate interest. He bought a copy of Peter Chasseaud’s recently published
first book3 and was given the author’s address. When Peter published his trench map atlas,4 Alan wrote a preface and was at the May 1999 AGM to hear Peter speak on ‘Survey on the Western front 1914-19’, having joined the society. I am not aware of his having been to other meetings, but on more than one occasion he told me that he enjoyed reading Sheetlines.
In his works that I have read, Alan drew heavily on his own experiences, so it is inevitable that maps feature frequently, with numerous references in his autobiography. However, the most explicit piece on maps in his life, ‘A sense of place’, is best sought in The Geographical Magazine,5 as it includes illustrations.
1 Life without armour, London, 1995. 2 The majority of which bear his signature in black ink, usually on the cover. 3 Trench maps : a collectors’ guide. Vol.1 British regular series 1:10,000 trench maps, GSGS
3062, Lewes, 1986. 4 Topography of Armageddon : a British trench map atlas of the Western Front 1914-1918, Lewes, 1991.
5 A sense of place, The Geographical Magazine, 47 (1975), 685-689 . The same text, but lacking the coloured hand-drawn maps, forms Chapter 4 in Mountains and caverns : selected essays, London, 1975.
10
The young Sillitoe seems constantly to have been teaching himself something, French, the Greek alphabet, surveying and much more. ‘The war began when I was eleven, and I bought the Army Manual of map reading and field sketching, a War Office publication which seemed at first to answer all my questions on the subject.’ ‘With a cheap and primitive compass I worried and pursued the mysteries of magnetic variation.’ ‘So in my spare time I applied myself to learning the art of air navigation...’ ‘I sent for a correspondence course in surveying....I studied for many months, and at last really got to grips with the proper science of surveying. In all seriousness, it seemed the only thing I was cut out for, to qualify so that I could bury myself in the mundane occupation of making maps.’ In 1984, his novel Down from the hill, of a cycling tour based on a small road atlas was published. ‘I also carried a three-mile-to-an-inch National Road Atlas...’ ‘My atlas wasn’t good enough for getting me through towns because, in order to comply with the Control of Maps Order, street plans had been cut out of this edition.’ ‘At the village of Blatherdene, on page 132 [of the atlas]...’
Alan Sillitoe was the only person I know who was interested in the 1:1,000,000 International Map of the World. He was particularly fond of all areas east of Europe and would ask for specific sheets. About five years ago, he called in on his way to Nottingham (London to Nottingham via Kerry?) in order to go through a pile of 1:1,000,000 flat sheets. He rushed in, wearing a long leather coat over a black leather waistcoat. A very dapper and trim man. He had no list of his holdings nor of what he required, but very quickly sorted out what he needed and quoted several sheets that he would like if they ever came my way. And no sooner had he arrived than he was off. My final memory is of Alan walking briskly down our path waving a roll of maps as a goodbye.
Buying maps in 1945
In Down from the hill, set in 1945, the narrator goes into a shop in Stafford to try to buy a local map: ‘All she could offer was the coloured sheet of the Ordnance Survey for one-and-sixpence. She apologised for it being paper flat instead of on cloth, but I was glad to have it, thinking you still needed police permission to buy this kind of map. You did in Nottingham, anyway, unless it was only black and white, though things might have altered now that the war in Europe was over.’
This doesn't seem to quite accord with the restrictions actually imposed by the regulations. According to Richard Oliver the broad thrust of the Control of Maps Order 1940 (revoked in 1944) was (a) no map at larger than one-inch scale to be sold without a permit and (b) no alien to have any map at a much smaller scale.
11
Ordnance Survey and cartographic style:
keeping the good view (part 2)1
Alexander J Kent
What makes Ordnance Survey’s cartographic style so distinctive? In light of the investigation outlined in part 1, it is possible to highlight certain characteristics which set Ordnance Survey’s current 1:50,000 Landranger topographic maps aside from their European counterparts. Briefly, these are:
• Prominent motorway symbols • Prominent tourist symbols • Recessive national boundaries • The use of grey (not green) to represent ‘Park or ornamental ground’ • The attention given to archaeological features (probably an enduring
aspect of William Roy’s landscape classification). In general, the OS Landranger map is dominated by road symbols, with a
high proportion of symbols dedicated to showing tourism and sport, historical features, managed land, and especially paths. It has the least extensive railway symbology. The relative deficiency of other types of symbol suggests a perception of the landscape as a commodity, where the map is consciously designed with leisure users in mind, particularly those travelling by road (given the high proportion of road symbols). Moreover, one further characteristic which is not shared with any other map analysed in part 1 (except that of Ordnance Survey Ireland) is the use of a location-specific photograph on the map cover. As others show a diagram of the geographical area covered instead, this perhaps supports the view that 1:50,000 paper maps of the British Isles are intended first and foremost as leisure products. This is not all that surprising if commercially produced topographic mapping at this scale is more widely available in other European countries and occupies more of the leisure map market.2 (An aspect well worth further study.)
Visualizing the stylistic evolution of British and Irish maps Despite advances in technology since the rise of European national surveys in the eighteenth and nineteenth centuries, state topographic maps tend to be very conservative in their design. Dorling and Fairbairn (1997) go so far as to claim that the legend of a 1990s 1:50,000 topographic map would have been understandable and usable (apart from the detailed road and railway classification) by a 1790s cavalry officer! Indeed it is not difficult to make visual associations between surveyors’ drawings produced towards the end of the eighteenth century for the first Ordnance Survey maps and the Survey’s maps of today.3
1 Part 1 appeared in Sheetlines 87. 2 As we were told during a CCS visit, there are around 200 geodetic companies in Slovenia – a country with a population of two million (Davies et al., 2007). 3 Many images are accessible at http://www.bl.uk/onlinegallery/onlineex/ordsurvdraw/
12
The imperatives behind topographic mapping, which give rise to choices in
the classification of landscape, are preserved in paper maps and this facilitates the comparative analysis of map series from different periods. Where this classification has evolved, it may be reflected in the map’s content through changes in the relative proportions of features, as represented by the symbology.
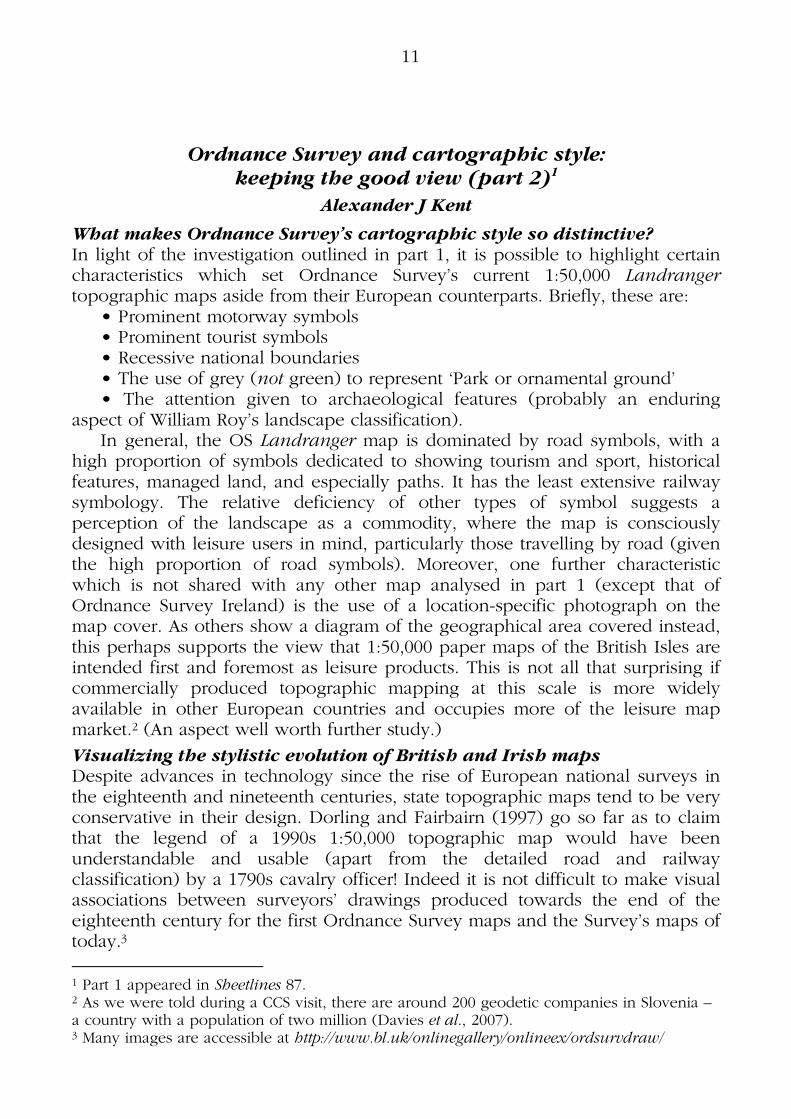
So with a view to investigating the stylistic grouping of the maps of Great Britain and Ireland identified in part 1 in more detail, contemporary maps from both countries spanning over 100 years were compared and analysed (table 1). The method follows the construction of the typology as per the pan-European investigation, which allows star plots to be generated in order to visualize their stylistic evolution.
Table 1: The British and Irish maps analysed (Great Britain above, Ireland below)
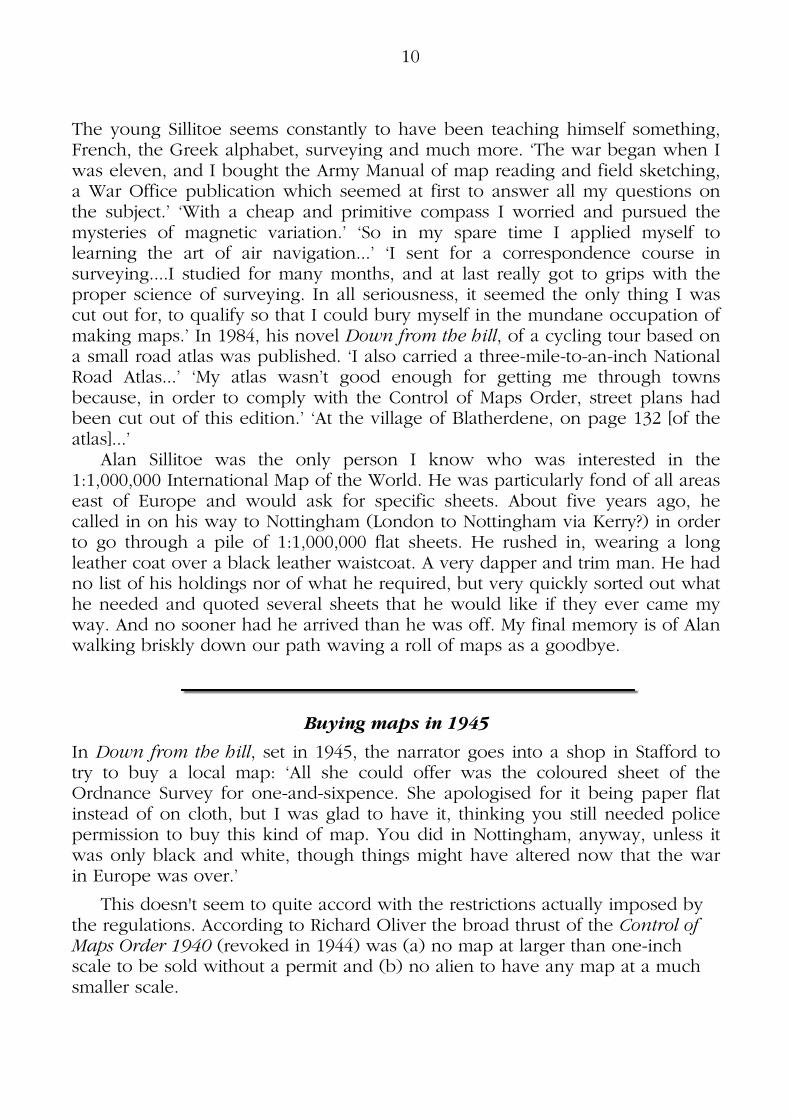
One major difference between the first Ordnance Survey maps of the early nineteenth century and those produced much later is the introduction of the legend itself, on which this brief investigation is based. The choice of symbols included in the legend bears particular significance (figure 12) because it reveals an insight into what is perceived to be of the greatest use to the reader and suggests the intended role of the ‘general purpose’ map. For example, Fig. 12: Legends used to be much smaller!
13
with reference to the one-inch map, Hodson (2005) notes the introduction of a key in the 1880s, and, in particular, its classification system for roads, going on to call this an acknowledgement that the primary function of the one-inch map was (by then) to serve as a road map for the public.
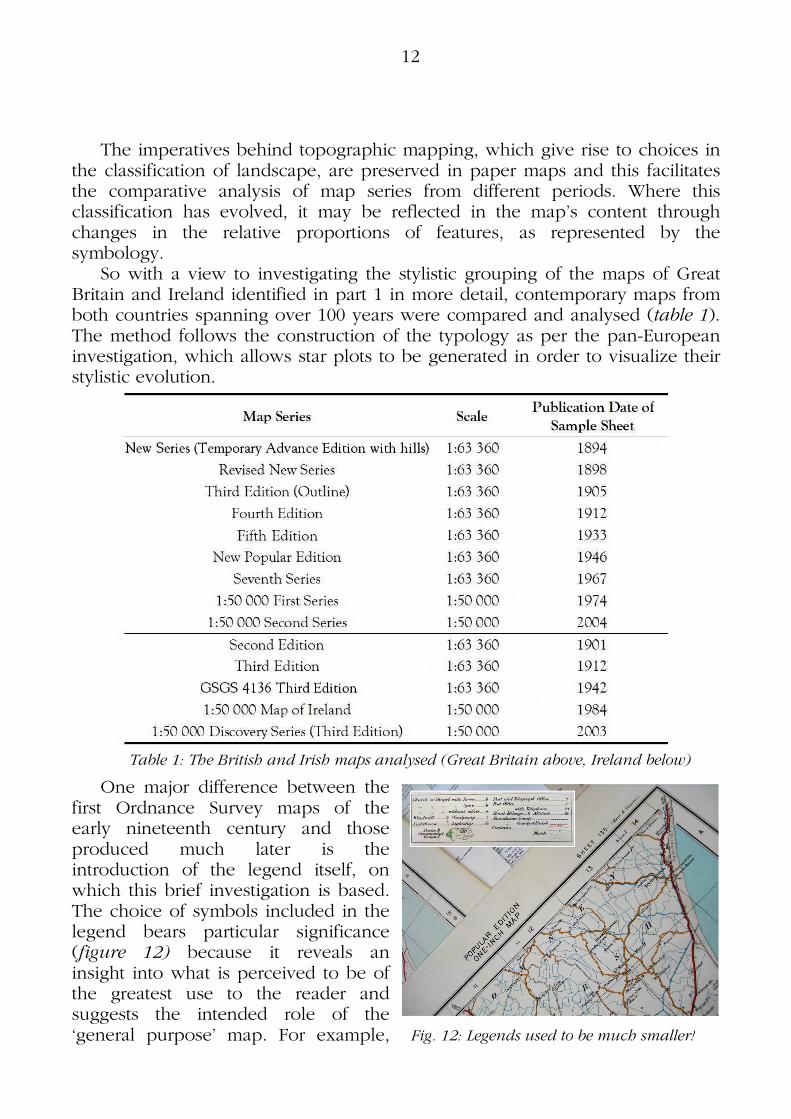
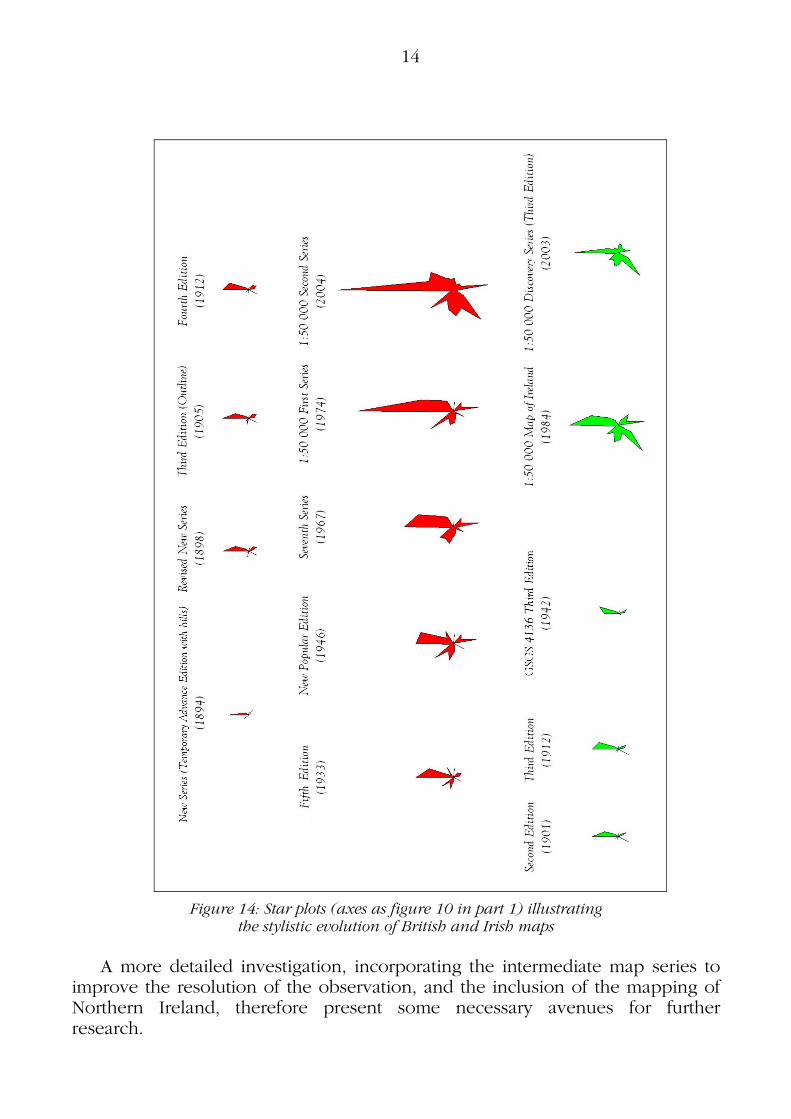
The first observation to make in this brief investigation is that legend symbologies generally become more exhaustive in describing the range of symbols utilized throughout the topographic map series (figure 13). Another observation regarding the total number of legend symbols is the divergence after the 1:50,000 Map of Ireland series (produced jointly by Ordnance Survey of Northern Ireland and Ordnance Survey Ireland). It would appear that the most recent Discovery Series is a move towards the establishment of a new national style of cartography and away from the cartographic legacy of Ireland’s colonial past. (Of course, this is purely speculative at this stage.) In contrast, the number of symbols comprising the legends of OSGB map series demonstrates a steady growth over time and the dominant types of features remain roughly similar (figure 14). It is also clear that with the introduction of the 1:50,000 First Series ended what had been a prominent feature, that of railway symbology.
Figure 13: Line graph showing the number of legend symbols over time
This series of star plots serves to illustrate that the cartographic styles of British and Irish maps follow a very similar pattern in their classification of landscape as their legend symbologies have developed. Although the Irish symbologies tend to utilize fewer symbols overall, their emphasis on infrastructure, and, more recently, tourist features, demonstrates their resemblance to the British style. Of course, there is no doubt that the legacy of Ordnance Survey in Ireland (following the Spring-Rice Report of 1824) has played a fundamental role in this particular historical association, whether the portrayal of landscape has been (or is) congruous with Irish culture and society or not.
14
Figure 14: Star plots (axes as figure 10 in part 1) illustrating
the stylistic evolution of British and Irish maps
A more detailed investigation, incorporating the intermediate map series to
improve the resolution of the observation, and the inclusion of the mapping of Northern Ireland, therefore present some necessary avenues for further research.
15
Conclusion Style is important in state topographical mapping, not least because as there will always be a need to construct and disseminate an idea of the national landscape which conforms to certain cultural traditions, and through the strategic selection and appearance of features, style acts as a vehicle through which to achieve this. There is much diversity in Europe, from its physical landscapes to its cultures, and this diversity is reflected in the cartographic styles of its 1:50,000 state topographic mapping. The styles employed by the national mapping organizations of Great Britain and Ireland exhibit the greatest similarity, and these are also especially distinctive. This observation is based on the similarity of their landscape classifications (as derived from the legacy of colonial survey), however, rather than the graphical appearance of their symbologies, and suggests that the fundamental choice involved in topographical mapping, i.e. the selection of features from the land, has the most profound and lasting effect on state cartographic style.
If cartography uses its own particular language to describe spatial relationships, it is easy to see how state topographic map symbologies can – and do – provide a vocabulary for expressing the national landscape. Even from the brief comparisons illustrated in these two articles, it is possible to see how national mapping organizations maintain different approaches and have become more articulate over time as their vocabulary has evolved. It is also clear that the legacy of former colonial powers continues in the current symbolization of landscape, particularly in which features dominate map symbology. But topographic maps are slow to evolve (which might also explain the absence of any symbol representing a mosque in any of the symbologies examined) and in this sense they are perhaps now in more danger of becoming irrelevant than ever before. The International Map of the World, proposed by Albrecht Penck in 1891, ultimately did not succeed because of its failure to harmonize the specifications of its symbology with the developments in technology that were transforming mass transportation, and with the national landscapes it portrayed. Like Esperanto, its symbology was an artificial language that did not carry a sufficient power of expression.
It is over 200 years since Ordnance Survey published its first topographic maps for the nation. Since then, its cartographic style has evolved to meet the changing demands of its users, both military and civilian, but I believe it has always preserved something authentic in its portrayal of the national landscape; something with which its users can identify and recognize. The ability to harness the power of expression and preserve this authenticity through good cartography and its tempering to public scrutiny – including how its maps are accessed – will be essential for the next 200 years.

16
References
J Davies, F Prest, G Steele, G Jarvis & A J Kent, Slovenia, June 2007, Sheetlines, 79 (2007), 44-51. D Dorling and D Fairbairn (1997), Mapping: Ways of Representing the World, Harlow, Longman. E H Gombrich (1995), The Story of Art (16th ed.), London, Phaidon Press. Y Hodson (2005), Coloured Roads on Ordnance Survey First Edition 1:2500 Plans and One-Inch Maps 1897–1935, and the Rights Of Way Disclaimer, The Cartographic Journal, 42, (2), 85–110. A J Kent (2008a), A methodology to classify and visualize stylistic evolution in topographic maps, Proceedings of the ICA Commission on the History of Cartography Symposium, Portsmouth, 10–12 September, 2008. A J Kent (2008b),Cartographic blandscapes and the new noise: finding the good view in a topographical mashup, The Bulletin of the Society of Cartographers, 42, (1,2), 29-37. A J Kent (2009), Topographic maps: methodological approaches for analyzing cartographic style, Journal of Map and Geography Libraries, 6, (2), 131-156. A J Kent and P Vujakovic (2009), Stylistic diversity in European state 1:50,000 topographic maps, The Cartographic Journal, 46, (3), 179-213. M L Larsgaard (1993), Topographic Mapping of Africa, Antarctica and Eurasia, Provo, Utah, Western Association of Map Libraries. D Sylvester (1952), Map and Landscape, London, George Philip & Son.
Information wanted
Lez Watson writes: It is five years since I made my appeal in Sheetlines 72 for additions and corrections to the work-in-progress of the Landranger covers list posted on the internet. The list has been improved and recently updated to reflect recent publication changes, and is now available in PDF format at http://www.watsonlv.addr.com/landranger_covers.pdf . I would be pleased to receive any comments, and further additions and correction to the list, with a view to publishing a definitive narrative in Sheetlines.
17
Oxbridge ramblings
Chris Higley
Mapping the paths Recreational walking flourished in the 1930s. Hikers claimed the right to roam over open moorland while other city dwellers rambled along lowland field paths. However, before the National Parks and Access to the Countryside Act, 1949, there were no definitive maps of footpaths and it was difficult to be sure where wandering off the road was legal.
If you were a gritty Northerner you asserted your rights by joining the mass trespass on Kinder Scout and beating up a few gamekeepers. If you were an effete Southern intellectual, you formed a footpath preservation society and drew up a footpath map. Nowhere do you find as many effete intellectuals as in Oxford and Cambridge, and footpath maps were published in both cities, but in very contrasting styles.
The essential problem was that Ordnance Survey did not produce a base map at the right scale for the accurate depiction of footpaths. The one-inch map was at too small a scale to show field boundaries, while each six-inch County Series map covered too small an area, complete coverage of Oxfordshire requiring over 170 (quarter) sheets.
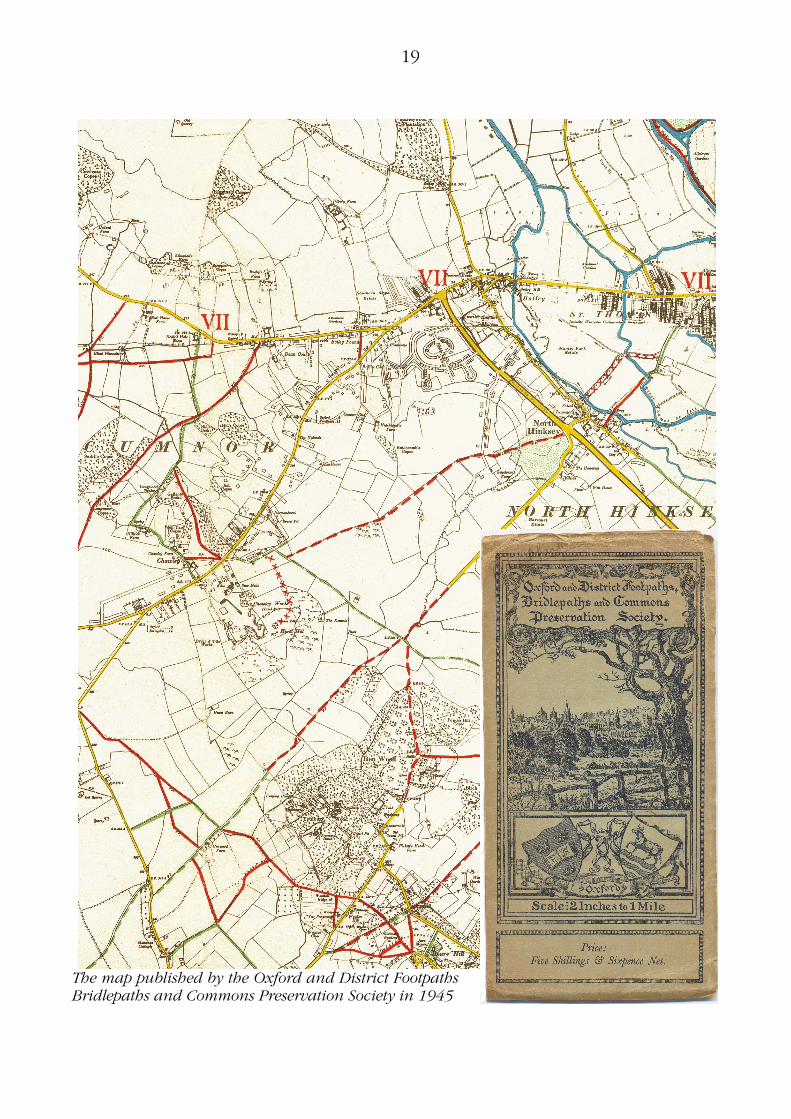
The Oxford and District Footpaths, Bridlepaths and Commons Preservation Society published at least two editions of their map: pre- and post-war. The illustration is taken from the later edition, printed by in 1945 by Geographia Ltd and mounted on cloth in, to judge from the print code, an edition of 2000 copies. The monochrome base map consists of 24 Oxfordshire six-inch County Series quarter sheets, photographically reduced in scale to two inches to the mile. This base is overprinted with yellow roads and other rights of way as described in the margin:
Green lanes, open spaces, etc., generally accessible to the public, are marked green. A footpath believed to be public is shown as a single continuous red line, a
public bridlepath is shown in a red or green pecked line. A Path, for which there is permissive use, is shown thus ××××××××× Despite the note inside the front cover, ‘Owing to post-war difficulties the
Society regrets that it has not been possible to enlarge the type of many place names in this reprint as was done in the case of the pre-war edition’, the result is a very clear and serviceable footpath map covering an area of twelve miles square, from north of Kidlington to south of Abingdon, and from Stanton Harcourt in the west to Wheatley in the east. An unusual, and slightly puzzling, feature of the map is that large Roman numerals are attached to the principal routes out of Oxford, clockwise from the Woodstock Road. These routes are identified in a marginal key.
Publication of the map would have been due to, or certainly aided by, the dynamism of the Society’s honorary secretary, W P d’Arcy Dalton, MA. Col. d’Arcy Dalton, a splendid character, was still chairman of the Society in the late

18
1960s. About two years ago, a small collection of his WW1 trench maps, together with some army issue condoms of a similar vintage, came up as a lot on one of the many TV auction programmes. The television ‘expert’ seriously undervalued the maps; I am not qualified to express an opinion as to the value put on the condoms.
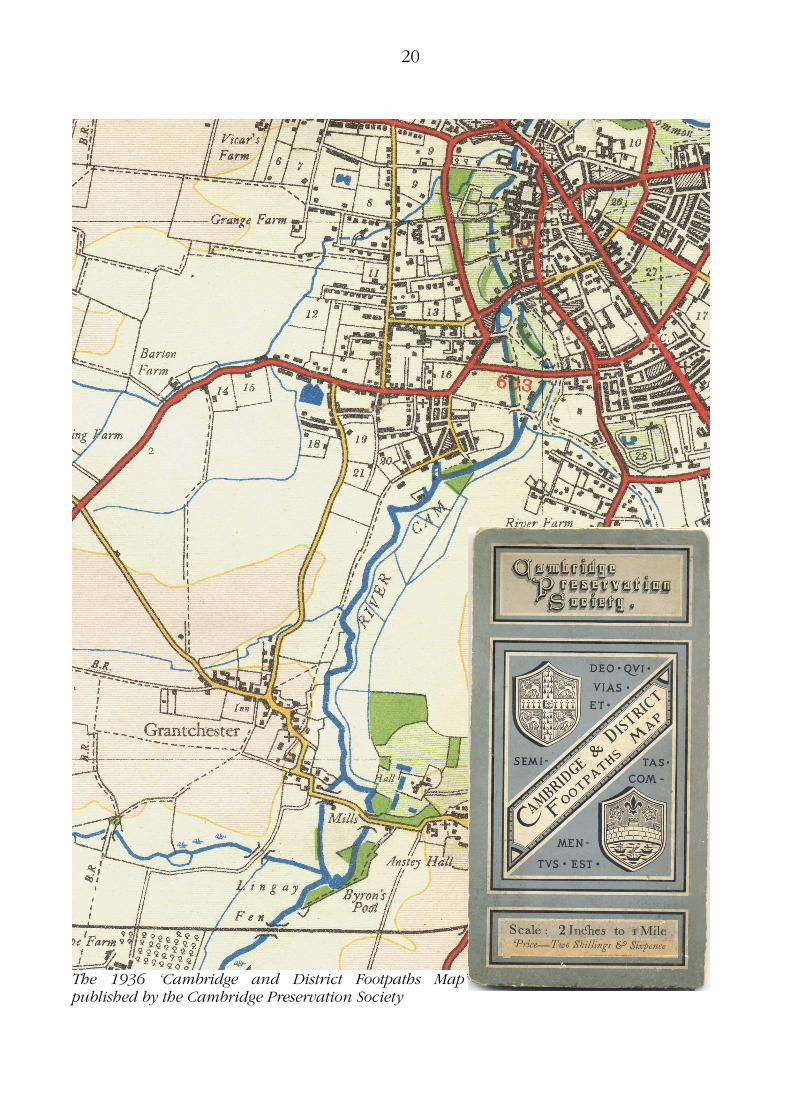
The Cambridge and District Footpaths Map was published by the Cambridge Preservation Society and printed in 1936 by Ordnance Survey, Southampton, in an edition of 2050 copies (again with cloth backing). The inside cover notes:
The Society first took up the question of footpaths in the neighbourhood of Cambridge in connection with the Town and Country Planning Act, 1932, and it seemed worth while to reproduce its investigations in a map available to the General Public. This map, therefore, is issued in the hope that it may be useful to those who work or find their recreation in the Cambridgeshire country-side. The full-colour map was specially drawn at two inches to the mile by E
Wrottesley1. It covers 17 miles east-west and 13½ miles north-south, with two small additional areas inset. The first shows the continuation of a popular walk to Caxton, the second covers Wicken Fen. Although three miles from the northern boundary of the map, the fen, a nature reserve in National Trust ownership since 1899, was, and is, popular for expeditions from the city and had long been associated with university research projects.
The map looks to be based on enlarged One-inch Popular Edition mapping, with field boundaries and additional detail taken from the six-inch County Series. ‘A’ road numbers are added in red. Relief, such as it is in Cambridge-shire, is indicated by contours and layering. No expense was spared, the sheet is printed in six colours and the cover comes with a Latin dedication, Deo qui vias et semitas commentus est, ‘To the god who devised roads and pathways’, apparently taken from a Roman altar at Catterick. The two-mile grid has as origin Great St. Mary’s Church, the traditional centre of the City of Cambridge.
‘University College Sports Grounds etc.’ are numbered. These include private college grounds as well as Parker’s Piece (27), with full public access, and the University Botanic Gardens (28), with timed opening. The ambiguity extends to rights of way: footpaths and bridle roads (marked B.R.) are shown with a clear black dashed line, but footpaths enclosed on both sides are shown as ‘white roads’, hard to distinguish from private tracks. The map cautiously adds the standard notice, ‘The representation on this map of a Road, Track, or Footpath, is not conclusive evidence of the existence of a right of way’ but, scenting the danger that their own map could be used as evidence against them, the Society has also added in red, ‘The omission from this map of a road, track or footpath is not conclusive evidence of non-existence of any right of way’. Altogether more academic and less direct than the Oxford map, but giving
1 Is anything known about this cartographer?
19
The map published by the Oxford and District Footpaths Bridlepaths and Commons Preservation Society in 1945
20
The 1936 ‘Cambridge and District Footpaths Map’ published by the Cambridge Preservation Society
21
a tempting glimpse of what 1930s Ordnance Survey mapping for walkers, on a similar scale, might have looked like.
The Oxford and Cambridge maps were no longer on sale when I was exploring the local footpaths some forty years ago. We relied on OS One-inch Seventh Series maps, by then covered in a web of red paths, many more evident on the map than on the ground. We still had to guess whether the path was to the left or the right of the hedge: 1:25,000 First Series maps showed the field boundaries but not public rights of way, and the small sheet size made them unaffordable. And, of course, all footpaths apparently stopped at the Oxford city boundary – under the 1949 Act, county borough councils had no duty to prepare definitive maps of rights of way. Not until the 1:25,000 Second Series, or Pathfinders, did OS itself produce maps to satisfy E Wrottesley and Col. d’Arcy Dalton.
The elephant in the room Anyone who has lived in either Oxford or Cambridge will have met American tourists asking for directions to ‘the university’. A collegiate university spread city-wide and with no main building or central campus also provides a challenge to the cartographer.
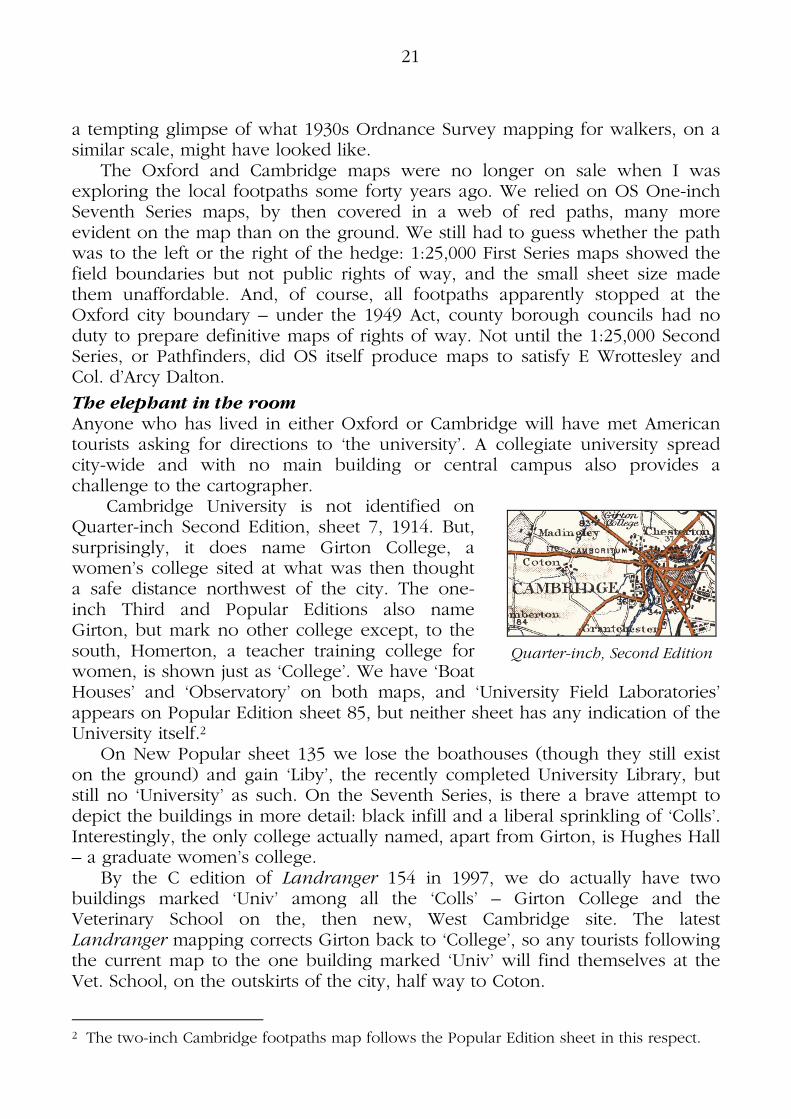
Cambridge University is not identified on Quarter-inch Second Edition, sheet 7, 1914. But, surprisingly, it does name Girton College, a women’s college sited at what was then thought a safe distance northwest of the city. The one-inch Third and Popular Editions also name Girton, but mark no other college except, to the south, Homerton, a teacher training college for women, is shown just as ‘College’. We have ‘Boat Houses’ and ‘Observatory’ on both maps, and ‘University Field Laboratories’ appears on Popular Edition sheet 85, but neither sheet has any indication of the University itself.2
On New Popular sheet 135 we lose the boathouses (though they still exist on the ground) and gain ‘Liby’, the recently completed University Library, but still no ‘University’ as such. On the Seventh Series, is there a brave attempt to depict the buildings in more detail: black infill and a liberal sprinkling of ‘Colls’. Interestingly, the only college actually named, apart from Girton, is Hughes Hall – a graduate women’s college.
By the C edition of Landranger 154 in 1997, we do actually have two buildings marked ‘Univ’ among all the ‘Colls’ – Girton College and the Veterinary School on the, then new, West Cambridge site. The latest Landranger mapping corrects Girton back to ‘College’, so any tourists following the current map to the one building marked ‘Univ’ will find themselves at the Vet. School, on the outskirts of the city, half way to Coton.
2 The two-inch Cambridge footpaths map follows the Popular Edition sheet in this respect.
Quarter-inch, Second Edition

22
Slightly alarmed by the focus on women’s colleges, I turned to the equivalent maps of Oxford. On the One-inch Third, Popular and Fifth Editions, we have ‘University Parks’ but no other mention of a university. Only a single college is marked and named; this time a men’s college, Magdalen. Assuming that Sir Charles Close or his predecessors had no connection with the college, we deduce the useful lesson that what is shown on a map can depend at least as much on available space as on relative importance – hence ‘Warneford Asylum’, but not ‘Bodleian Library’.
The Seventh Series still does not identify the University, but its buildings again get black infill. The generic term ‘Colleges’ replaces ‘Magdalen College’ and two other ‘Coll.’s appear, St Hughes, then still a women’s college, and what was presumably intended to be Somerville, another women’s college, although the infill actually shows the unmistakeable form of war-time government buildings, the Radcliffe Infirmary.
On current Landranger mapping even the University Parks have disappeared. The Radcliffe is now shown as ‘Hospl’, despite currently being redeveloped into new university buildings: a central site that, at long last, could,
Where’s the University?
One-inch Popular edition sheet 85 (above) and sheet 105 (opposite, top)

23
legitimately, be labelled ‘Univ’. Finally, Oxford Brookes University is merely annotated ‘Coll.’ on this map, but then in Cambridge, Anglia Ruskin University is not marked at all!
Confusion to our enemies

24
Foreign mapmakers have been no more successful in their depiction of Oxford University. Rob Wheeler has described how, during the Second World War, the German General Staff produced a series of folders containing maps identifying objectives of potential importance.3 The 1:10,000 Stadtplan von Oxford of 1941 (p.23, lower) is based, like the footpaths map, on a nicely coloured reprint of OS six-inch County Series mapping. Targeting town and gown, two civilian objectives are marked with magenta rectangles in the centre of the city: numbers 5, Rathaus (Town Hall), and 7, Universität. Any Panzer commander taking this location at face value would have found his tanks inextricably wedged in the tight turns of New College Lane while coming under attack from whatever Archimedean siege engines could be mounted by the fellows of All Souls on the high surrounding walls.
But then, as John Davies points out, the 1973 Soviet 1:10,000 map of Oxford did find a single building to be marked in magenta as the objective and, confused by Oxford nomenclature, has picked out University College to stand for the University as a whole. The author is an ex-president of the Oxford University Rambling Club and sometime member of the Cambridge University Rambling Club.
Open data and mashups
An interesting website4 recently appeared which demonstrates the benefits that flow when a large organisation opens up and releases previously private data which developers can combine with other data data sources (so-called mashups) to provide new insights or new ways of looking at information. In this example, Transport for London has made available its real-time data on the movement of tube trains. This has been combined with Google maps to display a live map of the current location and destination of all trains in the network.
Sheetlines 89
Contributions are invited for the next issue of Sheetlines, to be published in December. We do recommend that prospective authors contact the editors (see inside front cover) to discuss their proposal at an early stage. We also welcome comments and suggestions not for publication, regarding all aspects of the design and content of the journal.
3 Sheetlines 68, 28. 4 http://traintimes.org.uk:81/map/tube/. Annoyingly, as we close for press a technical problem at TfL is preventing live data feeds, but this should be resolved when you read this.
25
More New Popular printings and other discoveries K S Andrews and P S Welham
Introduction
The very useful cartobibliography of the New Popular Edition of one-inch maps of England and Wales was compiled by Richard Oliver from studies of his collection and those of Guy Messenger and institutional libraries, plus input from individual collectors.1
Two thoughts prompted a search for additional printings. First, the institutional collections, especially the legal deposit libraries, would have early copies of the first printing of each sheet and were therefore likely to lack reprints. Second, it seemed an amazingly prophetic anticipation of demand for so many New Popular sheets to be reprinted seldom or never. There was just one edition of 28 sheets, there were two editions of 31, three of 17, four of 11, five of 8, six of ten, seven of five and eight of four. Therefore half of the sheets had only one or two editions.2
The Messenger collection of 380 covered maps has very few duplicates, probably by his intention, because there were a total of 352 editions of the 114 sheets. Though excellent for many purposes, this limits it as a resource for extending the cartobibliography by directly comparing several copies of an edition. The present authors have now studied their personal collections, amounting to over 2500 copies of the standard colour version in covers. This direct comparison of, on average, about seven copies of each of the editions has revealed some unreported reprints (copies with the same print code but different marginalia) and overprinted corrections. In addition, the grid reference examples and grid north – true north deviations on many sheets were seen to have been corrected in later printings.
Indications of a facsimile reprint were a change to the price range, the position of the edition code or the style of the magnetic variation data but it was decided that facsimile reprints must also be demonstrably later, found in later covers than the original, printed to replenish stock. Where there was no clear time interval, i.e. cover types were the same, the difference was classified as a print run change which created two concurrent states of the edition.
1 Richard Oliver, A guide to the Ordnance Survey one-inch New Popular Edition, London: Charles Close Society, 2000, 29-57.
2 Richard Oliver offers, in a personal communication, evidence that the demand was not always well judged, citing several examples of over-estimation. Even before replacement by the Seventh Series a substantial part of the stock of sheet 105 (5500 copies in 1951, of 20,000 originally printed) was overprinted and handed over to the military. There are also instances such as sheet 76 where there was evidently a considerable surplus, as 10,000 copies were overprinted for military use in 1956, after the Seventh was published. See Roger Hellyer & Richard Oliver, Military maps, London: CCS, 2004, 42. There are instances of Seventh publication being delayed to allow New Popular stocks to run down: sheet 122, dated 1953 but only released early in 1955, is the most outstanding.

26
Prices noted in the marginalia (with dates from Oliver, op. cit.)
Date range Paper flat
Paper folded
Cloth folded
Diss-ected
Outline RO code
Pre-publication
1/6 1/9 2/6 4/- -- Aa 1/6 1/9; 2/- 2/6 4/-;
4/6 1/6 Ab
1/6 2/- 2/6 4/6 1/6 Ac 1.9.45 – 30.6.50
2/- 2/3 3/- 5/- 2/- B
1.7.50 – 30.6.52
2/6 3/- 5/- 10/6 2/6 C
1.7.52 – 31.3.58
3/- 4/- 6/6 10/6 3/- not reported 3/- 4/- 6/6 -- 3/- D 3/- -- -- -- -- E
1.4.58 – 31.12.60
3/6 -- -- -- -- F
1.1.61 on 4/6 -- -- -- -- G
A flapping red-on-white paste-on often accompanies the pre-publication prices Aa, Ab and Ac.
The price range shown in the table as ‘not reported’ is thought to include the pre-increase dissected price of 10/6 by mistake. The range is printed on sheet 143, Gloucester & Malvern, edition 1297. The dissected price is usually omitted from July 1952.
Since only the paper flat version of the printing was sold without a cover price, the price statements E, F and G were a sensible simplification. Map researchers, however, thrive on detail.
In the cartobibliography, the price ranges Ac for Sheet 126, edition 8045 and E for sheet 182, edition E/ should be corrected to Ab and F respectively.3
Magnetic variation data
Until 1952, there were four marginal magnetic variation diagrams, each giving an accurate representation of the local deviation and its value in degrees and minutes with a date, e.g. 1 January 1947. The rate of change of the deviation, less than a minute a month, exposed the excessive accuracy of the date. A single larger marginal diagram was substituted with no warning to the user that its angle, about 4º, was of artistic value only. The year, the true angle and the annual change were printed as a footnote. Style changes revealed two facsimile reprints as noted in table 1.
3 Note by Richard Oliver in Sheetlines 28, 23 and personal communication.
27
Sheet number
Edition
95 1215 The price range was changed from B to C and the MV style and date changed from 1950 to 1952.
156 1254 The MV style and date were changed from 1951 to 1952.
169 F/ The price range was changed from E to F. 175 C/ The price range was changed from E to F and the print
code was moved. 180 H/ The price range was changed from E to F. 183 A/// The price range was changed from E to F. 186 C The price range was changed from D to F and the
print code was moved. Later, it was increased in size. There are three printings of this edition.
188 D/ The price range was changed from F to G. 189 C The price range was changed from D to F. 190 A/// The price range was changed from E to F.
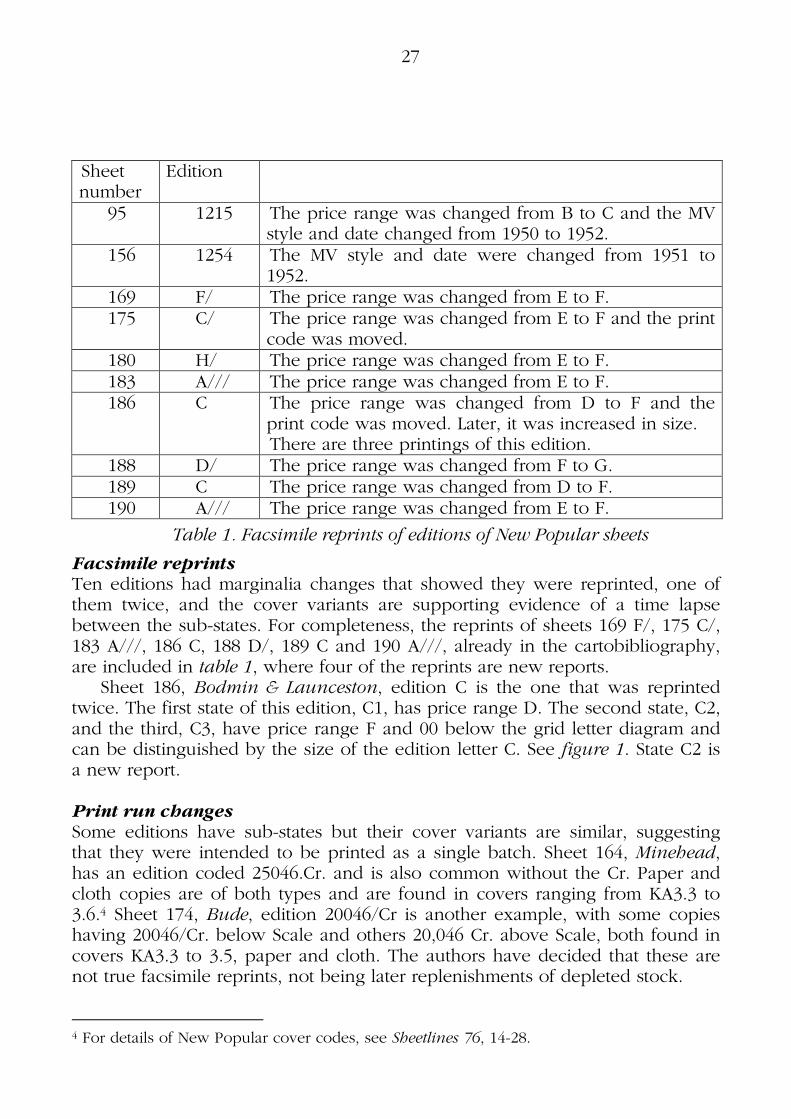
Table 1. Facsimile reprints of editions of New Popular sheets
Facsimile reprints Ten editions had marginalia changes that showed they were reprinted, one of them twice, and the cover variants are supporting evidence of a time lapse between the sub-states. For completeness, the reprints of sheets 169 F/, 175 C/, 183 A///, 186 C, 188 D/, 189 C and 190 A///, already in the cartobibliography, are included in table 1, where four of the reprints are new reports.
Sheet 186, Bodmin & Launceston, edition C is the one that was reprinted twice. The first state of this edition, C1, has price range D. The second state, C2, and the third, C3, have price range F and 00 below the grid letter diagram and can be distinguished by the size of the edition letter C. See figure 1. State C2 is a new report.
Print run changes Some editions have sub-states but their cover variants are similar, suggesting that they were intended to be printed as a single batch. Sheet 164, Minehead, has an edition coded 25046.Cr. and is also common without the Cr. Paper and cloth copies are of both types and are found in covers ranging from KA3.3 to 3.6.4 Sheet 174, Bude, edition 20046/Cr is another example, with some copies having 20046/Cr. below Scale and others 20,046 Cr. above Scale, both found in covers KA3.3 to 3.5, paper and cloth. The authors have decided that these are not true facsimile reprints, not being later replenishments of depleted stock.
4 For details of New Popular cover codes, see Sheetlines 76, 14-28.

28
Sheet 186 Edition letter & position
Price range
00 below grid
Cover variants, KA
Cover date codes seen
C1 c low D 6.2 – 6.4 up to 6.59 C2 c high F � 6.4 8.59 and 9.59 C3 C high F � 6.4 10.60
C1 C2 C3 C2&C3
Figure 1. Details from the three states of sheet 186 edition C
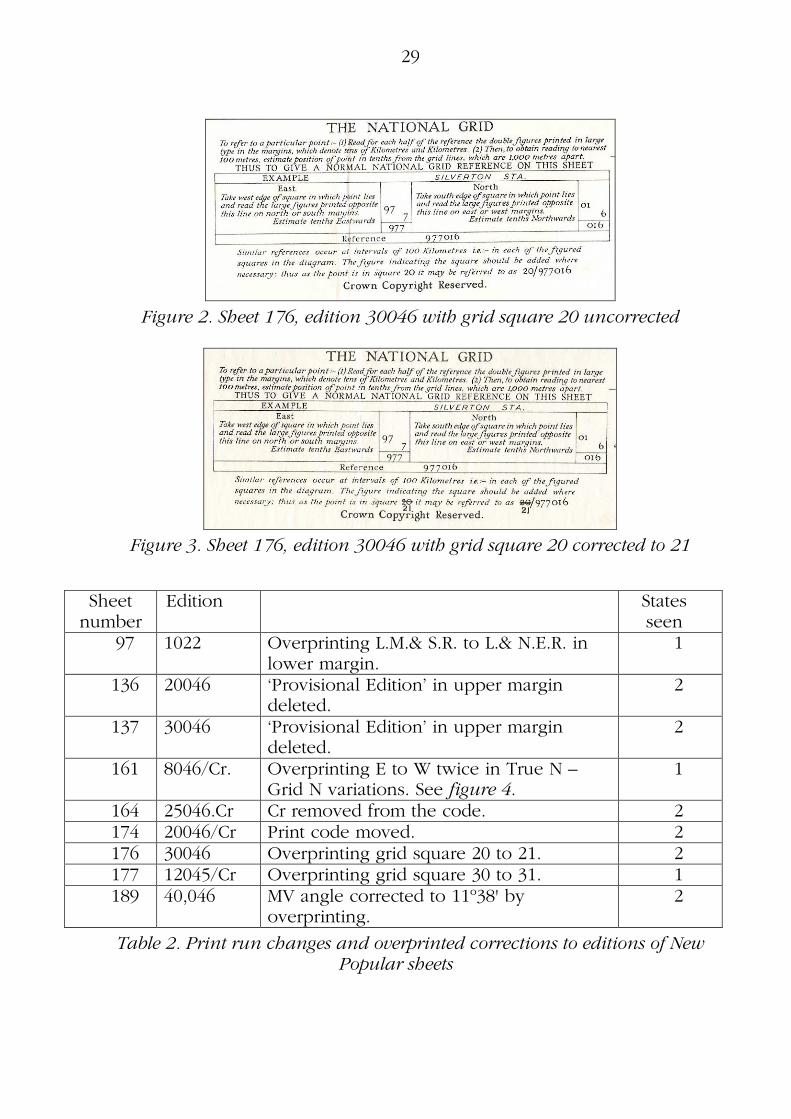
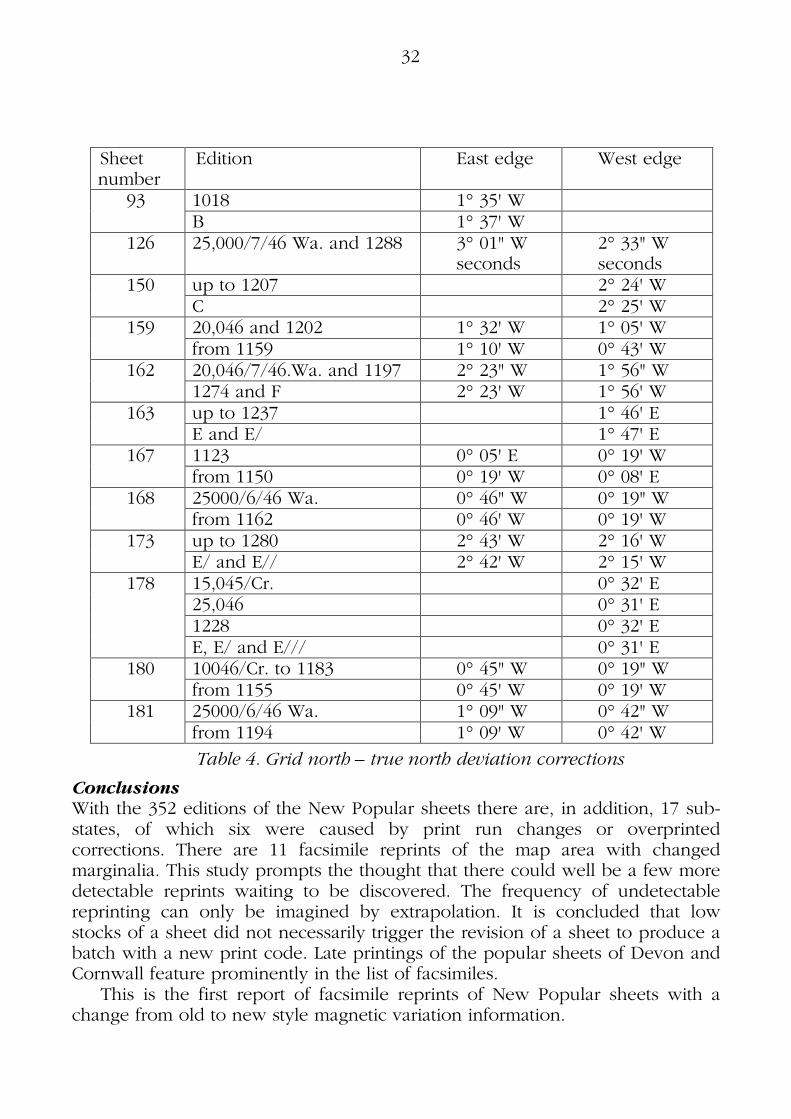
Overprinted corrections These are a different matter again. They affect sheets that have already been produced and were made to the print run either in whole or in part. For example, the 100 km grid reference square on sheet 176, Exeter, 30046 was corrected from 20 to 21 and copies exist with and without the overprinted corrections. The legal deposit sheet in Cambridge, acquired 11 October 1946, is uncorrected, and covered copies are in covers KA3.3 and 3.4. Corrected copies were found to be in the later covers 3.6 to 3.8. See figures 2 and 3.
On the other hand, the adjacent sheet 177, Taunton & Lyme Regis, 12045/Cr. has the grid reference square corrected from 30 to 31 and no uncorrected copy has been seen. Even the Cambridge copy acquired 17 January 1946 is overprinted as are two copies in the British Library acquired in the same month.
Like many others, sheets 136, 20046 and 137, 30046 have ‘Provisional Edition’ in the heading but these particular ones also exist with the words deleted by overprinting because they were not provisional. The British Library has both versions of both maps.5 The heading was trimmed from folded maps so is not often seen in private collections.
5 The BL uncorrected copies have no acquisition date but the ones with deletions are ex Directorate of Military Survey Map Library dated 19/11/46 (sheet 136) and 2/1/47 (sheet 137). At shelfmark 1175 (264). Uncorrected sheets may therefore be scarce.
29
Figure 2. Sheet 176, edition 30046 with grid square 20 uncorrected
Figure 3. Sheet 176, edition 30046 with grid square 20 corrected to 21
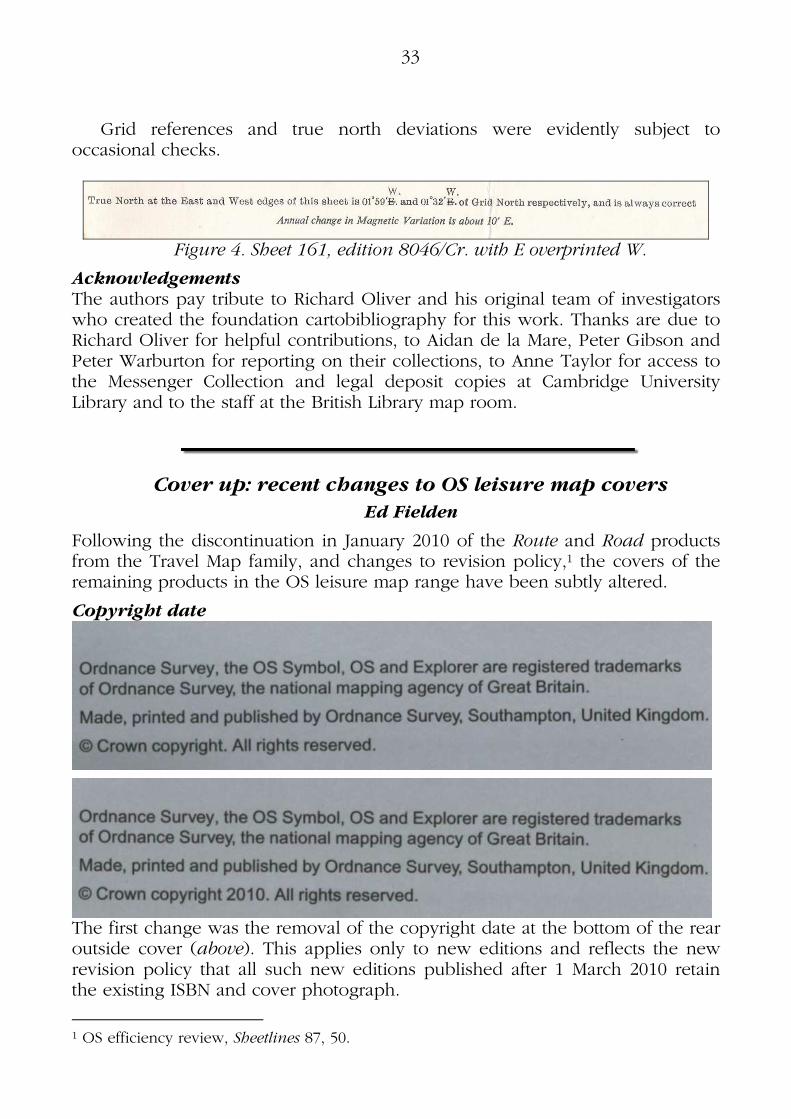
Table 2. Print run changes and overprinted corrections to editions of New Popular sheets
Sheet number
Edition States seen
97 1022 Overprinting L.M.& S.R. to L.& N.E.R. in lower margin.
1
136 20046 ‘Provisional Edition’ in upper margin deleted.
2
137 30046 ‘Provisional Edition’ in upper margin deleted.
2
161 8046/Cr. Overprinting E to W twice in True N – Grid N variations. See figure 4.
1
164 25046.Cr Cr removed from the code. 2 174 20046/Cr Print code moved. 2 176 30046 Overprinting grid square 20 to 21. 2 177 12045/Cr Overprinting grid square 30 to 31. 1 189 40,046 MV angle corrected to 11º38' by
overprinting. 2

30
For completeness, the changes to sheets 97 1022, 164 25046, 174 20046/Cr and 189 40046, already in the cartobibliography, are included in table 2, where five of the changes are new reports.
Grid reference corrections
The first New Popular maps to be produced had an explanation of The Ordnance Survey Grid which was covered at a late stage with a pasted slip titled The National Grid. The British Library has copies of sheets 161, 11040 and 169 (no code) without, surprisingly, the National Grid paste-ons. This paste-on was chiefly to replace an unsatisfactory single-letter system by a two-number system for identifying the 100 kilometre squares.
The eastings or northings in the grid reference examples on 26 sheets were changed. Both eastings and northings were altered on a further eight sheets, two of the double faults being altered in stages. Every change meant a reduction by 100 metres except the easting on sheet 142 which was the sole instance of an increase. To have 42 changes on 114 sheets is either indicative of a confused Romer user or of a new official procedure requiring not a rounded reference but one designed to be to the south-west of the example, though the instructions do not allude to this. It would leave the six figures undisturbed in an eight-figure version of the reference. The exception on sheet 142, where the movement is to the east, was evidently only spotted after the preparation of the Seventh Edition pilot sheet in the summer of 1949, as that retains the uncorrected reference.6
The readings before and after the changes are given in table 3.
True north untrue The east and west edges of each sheet are grid north. The deviation of each edge from true north is recorded in the marginalia.7 The values naturally change with latitude and longitude but some were found to change by human error between editions as follows.
• A correction of 1 minute was common and, exceptionally, the value for the west edge of sheet 178 was subject to vacillation.
• On five maps the minutes were shown as seconds – not always amended in later editions. All four sheets printed at Waddon have this error.
• The Chilterns, sheet 159 had a large error on both edges because sheet 160 values were used.
• The east and west edges of the map were confused on sheet 167.
6 Thanks to Richard Oliver for suggesting a change of policy as an explanation and the subsequent comments.
7 Some early sheets do not give values and others have the value for the centre of the sheet only.

31
See table 4 for a complete list of changes. True north is always correct – what a rash assertion!
Sheet number
Last edition before change
Grid reference
First edition with change
Grid reference
89 1014 522 773 1231 521 773 92 1017 683 768 1198 682 768 108 1033 127 716 1211 126 715 118 1043 474 188 1247 474 187 119 20046 827 351 1278 826 351 124 15046/Cr. 521 094 1262 520 094 126 25,000/7/46 Wa. 303 186 1288 302 185 129 1054 432 830 1218 431 830 134 20046. 245 714 1186 244 713 135 20046. 647 732 1286 646 731 142 1067 463 336 1239 464 336 143 30046. 772 223 1227 772 222
1264 771 222 146 1176 695 153 1307 695 152 147 16,046/Cr 124 181 1188 123 181 149 20046. 849 298 1206 849 297 156 1185 737 816 1254 736 816 157 1147 238 876 1273 237 876 159 1252 813 981 D 812 981 162 1274 905 979 F 904 979 163 25,046/Cr. 674 293 1195 674 292 164 25046. 927 256 1190 927 255 1303 926 255
166 1178 874 268 D 874 267 167 1123. 925 539 1150 924 538 168 25000/6/46 Wa. 518 428 1162. 517 428 169 1125 955 414 1151 954 414 171 1152 519 465 1259 519 464 175 20046. 523 872 1212 522 872 176 1201 977 016 1275 976 016 177 1205 454 085 1257 453 085 182 1156 148 293 1235 148 292 183 1157 526 068 1291 525 068 187 1179 527 637 C 527 636 188 30046. 683 504 1193 683 503 190 35046. 742 453 1229 741 452
Table 3. Changes to eastings and northings of grid reference examples
32
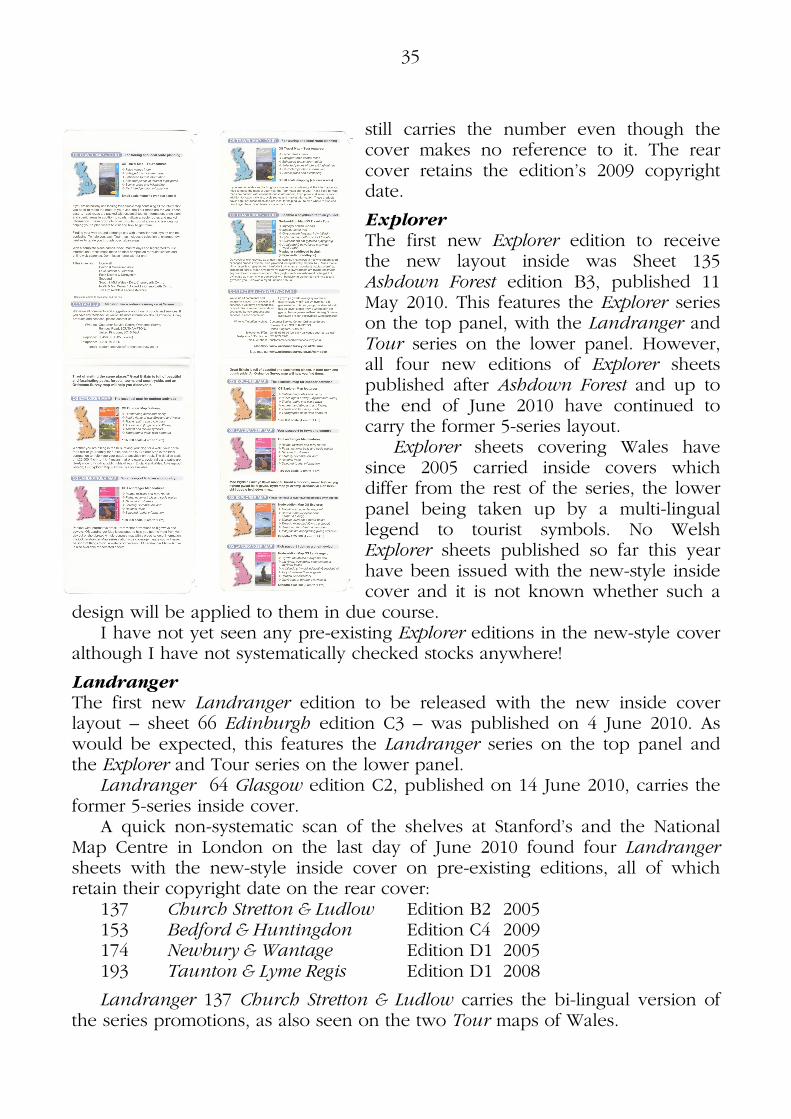
Sheet number
Edition East edge West edge
93 1018 1° 35' W B 1° 37' W
126 25,000/7/46 Wa. and 1288 3° 01" W seconds
2° 33" W seconds
150 up to 1207 2° 24' W C 2° 25' W
159 20,046 and 1202 1° 32' W 1° 05' W from 1159 1° 10' W 0° 43' W
162 20,046/7/46.Wa. and 1197 2° 23" W 1° 56" W 1274 and F 2° 23' W 1° 56' W
163 up to 1237 1° 46' E E and E/ 1° 47' E
167 1123 0° 05' E 0° 19' W from 1150 0° 19' W 0° 08' E
168 25000/6/46 Wa. 0° 46" W 0° 19" W from 1162 0° 46' W 0° 19' W
173 up to 1280 2° 43' W 2° 16' W E/ and E// 2° 42' W 2° 15' W
178 15,045/Cr. 0° 32' E 25,046 0° 31' E 1228 0° 32' E E, E/ and E/// 0° 31' E
180 10046/Cr. to 1183 0° 45" W 0° 19" W from 1155 0° 45' W 0° 19' W
181 25000/6/46 Wa. 1° 09" W 0° 42" W from 1194 1° 09' W 0° 42' W
Table 4. Grid north – true north deviation corrections
Conclusions With the 352 editions of the New Popular sheets there are, in addition, 17 sub-states, of which six were caused by print run changes or overprinted corrections. There are 11 facsimile reprints of the map area with changed marginalia. This study prompts the thought that there could well be a few more detectable reprints waiting to be discovered. The frequency of undetectable reprinting can only be imagined by extrapolation. It is concluded that low stocks of a sheet did not necessarily trigger the revision of a sheet to produce a batch with a new print code. Late printings of the popular sheets of Devon and Cornwall feature prominently in the list of facsimiles.
This is the first report of facsimile reprints of New Popular sheets with a change from old to new style magnetic variation information.
33
Grid references and true north deviations were evidently subject to occasional checks.
Figure 4. Sheet 161, edition 8046/Cr. with E overprinted W.
Acknowledgements The authors pay tribute to Richard Oliver and his original team of investigators who created the foundation cartobibliography for this work. Thanks are due to Richard Oliver for helpful contributions, to Aidan de la Mare, Peter Gibson and Peter Warburton for reporting on their collections, to Anne Taylor for access to the Messenger Collection and legal deposit copies at Cambridge University Library and to the staff at the British Library map room.
Cover up: recent changes to OS leisure map covers
Ed Fielden
Following the discontinuation in January 2010 of the Route and Road products from the Travel Map family, and changes to revision policy,1 the covers of the remaining products in the OS leisure map range have been subtly altered.
Copyright date
The first change was the removal of the copyright date at the bottom of the rear outside cover (above). This applies only to new editions and reflects the new revision policy that all such new editions published after 1 March 2010 retain the existing ISBN and cover photograph.
1 OS efficiency review, Sheetlines 87, 50.

34
As ever, some exceptions exist: despite being published during March and April 2010, some bar reprints of Explorer sheets (namely 178 A1//, 154 A2/, 405 A1/ and OL13 A3/) retained the copyright date of 2010 on the rear cover, having been printed before March. This is a result of the policy that a new edition is now released only when stocks of the previous edition are exhausted, rather than at a fixed date.
Notwithstanding the omission of the copyright date, the cover tabs glued to the paper map are still printed with an edition code corresponding to the map within. Two exceptions (erroneous or deliberate) published this year are:
• Explorer 185 edition A1/, pub. 13 April 2010, found in A1 cover with 2005 copyright date.
• Landranger 44 edition C2/, pub 14 June 2010, found in C2 cover with 2007 copyright date.
Inside covers For a while after the revision policy change and removal of copyright date, the inside covers remained unchanged – promoting five leisure map series with thumbnail images. A new design for the inside cover – promoting just the three series now remaining – was very gradually introduced to new editions from late March onwards.
Tour The Scotland Tour map – itself the subject of a curious incident in 20082 – was republished in edition D on 24 March 2010 (left and right). With the Tour series now consisting of eight non-consecutive sheets there is no longer a sheet index on the rear cover and the sheet number is not shown on the front cover or on the map itself. Scotland was the first sheet to carry the new-style inside cover (opposite left), with the Tour series featured on the top panel (including an alphabetical list of the eight sheets in the series) and the Explorer and
Landranger series below. Following the publication of Scotland, new editions of North & Mid Wales
and South & Mid Wales were published, on 28 May and 14 June 2010 respectively. These also carry the new inside cover design (opposite right), with the exception that each series is promoted twice: once in English (or at least a close approximation) and once in Welsh. Up to the end of June 2010 the only Tour sheet I have seen with a new-style cover on a pre-existing edition is The Cotswolds & Gloucestershire, formerly sheet 8 in the series. The map sheet itself
2 Sheetlines 82, Scotland Tourist Map; Sheetlines 83, Tour goes astray.
35
still carries the number even though the cover makes no reference to it. The rear cover retains the edition’s 2009 copyright date.
Explorer The first new Explorer edition to receive the new layout inside was Sheet 135 Ashdown Forest edition B3, published 11 May 2010. This features the Explorer series on the top panel, with the Landranger and Tour series on the lower panel. However, all four new editions of Explorer sheets published after Ashdown Forest and up to the end of June 2010 have continued to carry the former 5-series layout.
Explorer sheets covering Wales have since 2005 carried inside covers which differ from the rest of the series, the lower panel being taken up by a multi-lingual legend to tourist symbols. No Welsh Explorer sheets published so far this year have been issued with the new-style inside cover and it is not known whether such a
design will be applied to them in due course. I have not yet seen any pre-existing Explorer editions in the new-style cover
although I have not systematically checked stocks anywhere!
Landranger The first new Landranger edition to be released with the new inside cover layout – sheet 66 Edinburgh edition C3 – was published on 4 June 2010. As would be expected, this features the Landranger series on the top panel and the Explorer and Tour series on the lower panel.
Landranger 64 Glasgow edition C2, published on 14 June 2010, carries the former 5-series inside cover.
A quick non-systematic scan of the shelves at Stanford’s and the National Map Centre in London on the last day of June 2010 found four Landranger sheets with the new-style inside cover on pre-existing editions, all of which retain their copyright date on the rear cover:
137 Church Stretton & Ludlow Edition B2 2005 153 Bedford & Huntingdon Edition C4 2009 174 Newbury & Wantage Edition D1 2005 193 Taunton & Lyme Regis Edition D1 2008
Landranger 137 Church Stretton & Ludlow carries the bi-lingual version of the series promotions, as also seen on the two Tour maps of Wales.
36
More battles
John Cole
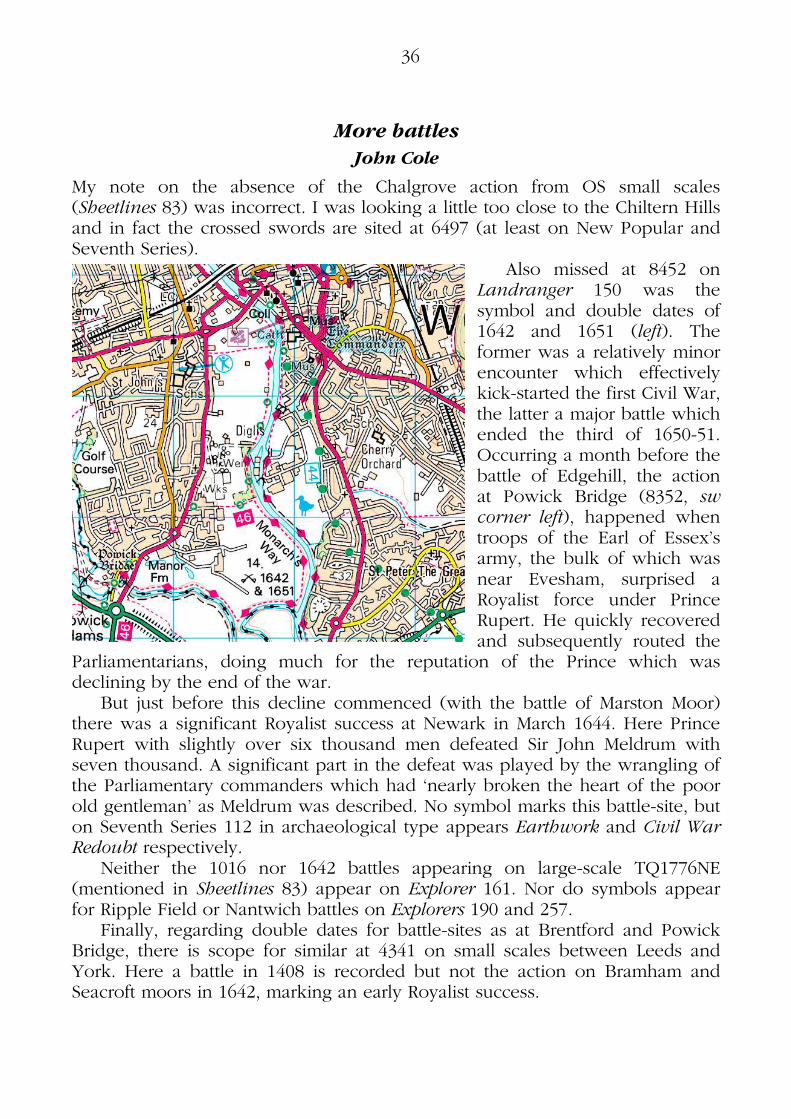
My note on the absence of the Chalgrove action from OS small scales (Sheetlines 83) was incorrect. I was looking a little too close to the Chiltern Hills and in fact the crossed swords are sited at 6497 (at least on New Popular and Seventh Series).
Also missed at 8452 on Landranger 150 was the symbol and double dates of 1642 and 1651 (left). The former was a relatively minor encounter which effectively kick-started the first Civil War, the latter a major battle which ended the third of 1650-51. Occurring a month before the battle of Edgehill, the action at Powick Bridge (8352, sw corner left), happened when troops of the Earl of Essex’s army, the bulk of which was near Evesham, surprised a Royalist force under Prince Rupert. He quickly recovered and subsequently routed the
Parliamentarians, doing much for the reputation of the Prince which was declining by the end of the war.
But just before this decline commenced (with the battle of Marston Moor) there was a significant Royalist success at Newark in March 1644. Here Prince Rupert with slightly over six thousand men defeated Sir John Meldrum with seven thousand. A significant part in the defeat was played by the wrangling of the Parliamentary commanders which had ‘nearly broken the heart of the poor old gentleman’ as Meldrum was described. No symbol marks this battle-site, but on Seventh Series 112 in archaeological type appears Earthwork and Civil War Redoubt respectively.
Neither the 1016 nor 1642 battles appearing on large-scale TQ1776NE (mentioned in Sheetlines 83) appear on Explorer 161. Nor do symbols appear for Ripple Field or Nantwich battles on Explorers 190 and 257.
Finally, regarding double dates for battle-sites as at Brentford and Powick Bridge, there is scope for similar at 4341 on small scales between Leeds and York. Here a battle in 1408 is recorded but not the action on Bramham and Seacroft moors in 1642, marking an early Royalist success.

37
My great, great grandfather was a ‘leveller and contourer’
Bob Shannon1
In the latter part of 1852 my great, great grandfather John Shannon left the village of St John’s Dalry, Kirkcudbrightshire where he was born to work as a labourer with the Ordnance Survey. In the minutes of the St John’s Dalry Kirk Session held on 3 April 1853 Catherine Welsh ‘confessed that she was with child this being her second offence and accused John Shennan lately residing at St Johns Clauchan now employed as a Labourer in the Royal Company of Sappers and Miners as being her partner in guilt and the father of this child and the former one’. The first of these children was my great grandfather Thomas Shannon. So did John run from his responsibilities or did he simply want to put Scotland on the map?
It is possible that John had been employed by the Ordnance Survey to assist with levelling work carried out in Kirkcudbrightshire during 1853. The Corps of Royal Sappers and Miners and the Corps of Royal Engineers were responsible to the Board of Ordnance for the mapping of Great Britain and at this time there was a significant increase in activity as a large number of counties, particularly Scottish ones, were requesting the mapping of their areas at six inch to the mile and 1:2500 scales. Mapping of adjoining Dumfriesshire was carried out between 1854 and 18582 and it is possible that John assisted with this work.
The Corps of Royal Sappers and Miners was absorbed into the Corps of Royal Engineers in 1856. In 1855 the Board of Ordnance was abolished and its responsibilities were taken over by the War Office. Mapping had always been under the supervision of the military but they were invariably supported by civilians. For example in the 1846-7 financial year it was intended to employ on the Scottish Survey one Officer, 71 Royal Sappers and Miners, 56 Civilian Assistants and 64 labourers.
John must have acquired a fair bit of surveying knowledge and expertise while working as a labourer because he secured a Civilian Assistant post. A Parliamentary Paper of 1863 provides a return dated 28 March of that year ‘showing the names of the several draftsmen, computers, surveyors and others engaged in the Survey in England, Scotland and Ireland’. It includes John Shannon and states that he was a leveller and contourer being paid 4 shillings and 1 pence a day. His level of service is given as 4 years and 8 months which confirms his promotion to Civilian Assistant in August 1858. There were pay incentives related to productivity and accuracy and it would seem that he was quite good at his job as his rate was higher than some of his colleagues who had been in the OS for much longer. For example his colleague James Murray had a rate of 3s 5d despite having been employed for 11 years and 8 months.
1 The author, who is not a member of the society, is at [email protected]. 2 Survey dates are given in Richard Oliver, Ordnance Survey Maps: a concise guide for
historians, second edition, Charles Close Society, 2005.
38
I had a fair idea as to what an Ordnance Survey leveller and contourer probably did but a document held at the National Archive told me everything I would ever need to know. It is a manuscript entitled Notes on Levelling and Contouring written by Captain James, dated 12 March 1867. It covers the technical aspects and also gives an idea as to the type of person John might have been. ‘The leveller who may be either a sapper or civil assistant should be a perfectly trustworthy man, a good writer, expert in the use and adjustment of the instruments employed and thoroughly acquainted with the practice of levelling. He is responsible for the accuracy of the work and the payment and discipline of his party and when he is in direct communication with the Division Office he conducts the necessary correspondence. In the field he works the instrument personally and enters the work in the field book while the labourers perform the duties connected with the staff and chain under his direction’.
The work of Ordnance Survey outside staff was obviously peripatetic and they must have spent all their time living in ‘digs’ or, in the remoter areas, under canvas. Work would have been undertaken in all weather and would for the most part have been very demanding. The Ordnance Survey Annual Report for 1872 refers to high rainfall which not only hampered work as the surveyors couldn’t get on the ground but resulted in many of them suffering ill health from the constant exposure to the inclement weather.
Resources available to the Ordnance Survey were limited and survey teams travelled extensively. There are, however, no extant records to indicate which districts employees were in at any particular time and the only way to follow John’s movements is through census entries and the significant events in his life. I know that John was in Liverpool in 1860 as this is where he married Margaret Graham, a girl born in Langholm, Dumfriess and who he possibly met whilst working in that area. John, now 28 and clearly full of himself, gives his profession as ‘Gentleman’! At the 1861 census John and Margaret are living at Cannock, Staffordshire and lodging with the Jellymin family. The mapping of Staffordshire was undertaken between 1861 and 1863
Just over a year later John and Margaret are living at Hutton Soil, Penruddock (six miles west of Penrith, Cumberland) where their first child Ellen was born on 10 August 1862. In that year the local paper of the time, the Carlisle Patriot, reported further progress in the mapping of the County. ‘The Ordnance Surveyors lately located in the parish of Aikton (near Carlisle) have now established themselves at Thursby upon the church steeple on which they have erected an observatory from which … a fine prospect can be commanded’. The Cumberland County Series mapping became available from 1864.
It seems likely that John was separated from his family for long periods. Their next child, James, was born in St John’s Dalry on 25 September 1864 but John was not present, his wife providing the information for the registration. The family were, however, together in 1866, at least for a time, when their next child Margaret was born at Kingussie, Inverness-shire. John was present at the birth on 18 November and provided the information for the birth certificate.

39
Mapping of the northern part of Scotland started in 1864 and the 20 May edition of the Inverness Advertiser reported that ‘Inverness is to be the head-quarters of the Sappers and Miners engaged upon the Government trigonometrical survey of the North and will in all probability continue so for the next ten years. Balnain House has been taken on lease for office purposes, and the office party, upwards of thirty in number, including civil assistants arrived here from Perth on Monday evening. The field party are at present in the neighbourhood of Braemar. They are working in a north-easterly direction, and in all likelihood be in some of the mountainous district of Inverness-shire before the end of the present year’.
Chances are that John would have been part of this field party but I would also like to think that he was involved in the survey which established that Ben Nevis and not Ben Macdhuie was the highest mountain in Britain. The Inverness Advertiser reported on 9 August 1864 that ‘Ben Macdhuie, which was formerly supposed to be 4390 ft in height, has been set down at nearly 100 ft less than that, viz 4296. Some years since, Ben Macdhuie was supposed to be seventeen feet higher than Ben Nevis … and was therefore at that time authoritatively stated to be the highest mountain in Britain. Since then, however, the tables have taken a turn, and Ben Nevis would appear to be by far the higher of the two’.
The outside staff of the Ordnance Survey faced some difficulties in mapping the Highlands, as illustrated in a letter to the Perthshire Constitutional & Journal of 17 May 1866 and later partly reprinted in the Inverness Advertiser on 1June. The letter was written by an Ordnance Survey worker and advises ‘We left Perth on Thursday, travelling by railway to Dalwhinnie, and thence by other conveyances to this place – six miles from Laggan. This is the wildest district I have ever traversed during my experience on the survey; it is even more so than the northern counties of England. Except odd houses of the better sort, which are few and far between, the only other habitations are miserable-like huts, occupied by shepherds, and, judging by the smoke oozing out of the doors, such places of abode must be very uncomfortable. In reference to our work, we will commence operations by surveying a line from Laggan Free Church to Fort Augustus, a distance of twenty four miles through as wild a country as you can possibly imagine; and what makes this desolation of the region seem even more desolate than it otherwise would be is the terrible severity of the weather. Snow fell on Thursday the whole day, and the mountains all around are covered in snow. We find considerable difficulty in procuring the common necessaries of life in this romantic district’.
The next child of John and Margaret, Mary Jane, was born in St John’s Dalry on 11 May 1869. Agnes McCulloch, John’s sister, witnessed the registration of the birth on 31 May at Dalry Schoolhouse. It may be that John was still working in Inverness-shire but there is no guarantee that he was working permanently in the area. Surveying in the Highlands was often held up because the proprietors of the numerous deer forests objected to the presence of the surveyors between
40
1 July and 20 October and in addition it was not possible to work there before April or after November owing to the severity of the weather and the snow lying on the mountains. Alternative winter work for the surveyors had to be found elsewhere and the solution devised initially was to bring Argyllshire surveyors down from Oban in a steamer and employ them during the winter in Flintshire and Cheshire. This system was then apparently used to bring a large number of the surveyors from Inverness-shire, Ross-shire and Sutherland to be employed during the winter in Cheshire and Derbyshire but was abandoned after 1874, probably because the remaining work was all in the islands and the same difficulties did not arise.
At the 1871 census John is in Morayshire lodging with the Innes family in the village of Fochabers, and probably now contributing to the Elginshire County series (mapped 1866-71). Meanwhile, his wife Margaret is looking after the family at St John’s Dalry. Sometime after this the family moved to Hawick but I cannot correlate this with any Survey work. It may be that John was at work in the islands, where conditions would have made life for his family quite difficult (Skye 1874-7, Outer Hebrides 1876, Orkney and Shetland both 1877-8). Equally his wife may have favoured a less demanding environment as she was probably in poor health. She died at Hawick on 29 March 1875 aged 40 of a heart condition.
By 1877 the field surveys of Scotland had been completed and the whole force of field surveyors in Great Britain was concentrated in England. At the request of the Secretary of State for War the two divisions withdrawn from Scotland were ordered to carry out the survey of the eastern counties of England. The last members of the Ordnance Survey Inverness Headquarters staff, together with their families, left the town on 13 June 1878 by train for Norwich. The Ordnance Survey staff must have made a good impression on the people of Inverness and beyond as the Inverness Advertiser, in reporting the event, commented that during their fifteen year stay in Inverness they ‘have gained the esteem and respect of all with whom they came in contact’. From the newspaper report it is clear that the train journey from Inverness to Norwich was expected to take just over 27 hours.
Having been born and bred in Norwich I am attracted to the idea that my great, great grandfather assisted in the mapping of Norfolk but there is no proof that he worked in East Anglia. The two divisions transferred from Scotland to the eastern counties of England were general survey divisions while John as a leveller and contourer was part of a separate division. He was, however, in Cornwall in 1883 because this is where he married a widow called Isabella Congdon at Truro Parish Church on 5 April. The marriage certificate confirms that John is still a Surveyor and gives his residence as St Austel. (South west of the County surveyed between 1875-88 for the County Series 1:2500).
Survey work was running down in the late 1880s as the basic mapping of the country was completed and a number of civilian assistants were discharged. Certainly by the 1891 census John was retired and living with his wife at
41
Christchurch, Bristol. John is described as a ‘Pensioner from Civil Service’. John died at Bristol in 1903 aged 71.
I have spent most of my life using Ordnance Survey Maps: as a geography student, in my career as a land-use planner and as a keen walker. Little did I realise that my great, great grandfather might have had a hand in earlier versions of some of the maps I was using. Nor did I fully appreciate the dedication shown by the outside Ordnance Survey staff during the second half of the nineteenth century in travelling the length and breadth of the country, often separated from their families, and working in very difficult conditions to map Great Britain.
It would be remiss of me not to mention the help I have received in writing this article from Dr Richard Oliver, Honorary Research Fellow in the History of Cartography at the University of Exeter. When I started researching the life of John Shannon he was quick to answer my questions about the operation of the Ordnance Survey in the second half of the nineteenth century. Now he has not only kindly corrected my draft paper but also provided additional detail.
Surveyor’s name on an OS map
Richard T Porter
There is a minor tradition of cartographers’ names appearing clandestinely on topographical maps, concealed e.g. in rock drawing 1 or coral symbols,2 but even less common may be the overt appearance of a surveyor’s name. I cannot claim the present instance as being one where the surveyor’s name appears on the very map sheet which he surveyed, but the surveyor in question had served as an OS surveyor, and his first name does appear on an Ordnance Survey map. Since this does not include his surname, his identity will not be apparent without a field visit, so it is worth recording the circumstances for the interest of future students of Sussex place-names, although an outline account has already appeared.3
‘Ken’s Crossing’ is a footbridge named after Kenneth Charles Dunlop (13 April 1926 to 21 July 2007). Born in Peshawar, where his father, Lt.-Col. C A M Dunlop, was with the 37th Dogras, he was educated at Bradfield College. In October 1944 Ken Dunlop enlisted in the Royal Artillery, was sent on a six-month gunnery course at Worcester College, Oxford, and commissioned in July 1946 as a Second Lieutenant (promoted Lieutenant after six months). He was posted to India (August 1946 to December 1947) in the 8th Brigade, Field
1 Chris Higley, ‘Coastal Graffiti’, Sheetlines 76 (August 2006) 62-63. 2 Anecdotally, on DOS Fiji 1:50,000 maps; there may be others. 3 ‘Ken’s Crossing’, Viewpoint (The journal about Ordnance Survey and its people), 234 (Spring 2009), 24. This includes a reduced (c. 1:1440) copy of a 1:500 coloured Sitemap showing the name, and a computerised ‘manuscript’ extract from the author’s request to OS.
42
Regiment R.A., serving in Coimbatore and Secunderabad. He was demobilised in March 1948.
He read for the Geographical Tripos at Pembroke College, Cambridge, graduating in 1951. After a survey course at the School of Military Survey, he then joined the Colonial Survey Service as a land surveyor in Northern Rhodesia, 1952-65; here he was for a short time Divisional Surveyor, Fort Jameson, but for most of his service he was a cadastral surveyor based in Lusaka. He then worked as an experimental officer in the Geodetic Office, SPC, at Feltham until in April 1969 he joined the Directorate of Overseas Surveys as a Senior Surveyor. His first posting was to British Honduras, followed by Botswana, in each case as party leader. He was seconded as Chief Surveyor to Seychelles, November 1972 to November 1974. As a member of the Joint Survey Service he was then appointed Deputy Regional Controller in the Ordnance Survey South Eastern Region, based in Tolworth Tower. Here, he covered an area then extending eastwards and southwards from High Wycombe to the coast, including the whole of London. He was responsible for 24 field offices and made regular liaison visits to the Greater London boroughs and district councils of surrounding areas.
In the period July 1977 to November 1985, Ken Dunlop was again seconded overseas, to the Cayman Islands to fill the post of Chief Surveyor and Registrar of Lands, latterly relinquishing the Chief Surveyor duties.4 He published papers on land registration in the Caymans and St Lucia.
Following his retirement from government service, he was appointed Land Registry Advisor to the St Lucia Land Registration Titling Project until the end of 19875 and in 1988 produced a manual of land registry procedure. His final overseas assignment was to prepare an unpublished study of the Tanzania Land Policy Development project in 1994.
It was during his final retirement at West Chiltington, in Sussex, that Ken Dunlop identified the need for a footbridge across the River Chilt in Monkmead Woods, almost opposite his home, to link the two sections of woodland, so that families and dog-walkers would not have to use the main road. In 1992 he built his first bridge, but it was soon washed away by floods; its immediate successors either rotted or were vandalised, but the fourth incarnation (1997) was so well used that by popular demand it was replaced (2003) by a permanent structure, warmly welcomed by West Chiltington Parish Council, commissioned by the Horsham District Council, and built by an external construction company.6
4 His work in the Caymans is remembered in Alan Markoff, ‘Former Registrar of Lands dies’,
Caymanian Compass, weekend edition, Friday-Sunday, 10-12 August 2007. 5 This is the main theme in Keith Syrett, ‘Obituary: Ken Dunlop FRICS (Rtd)’, Geomatics
World 16.5 (July/August 2008) 10. 6 A fuller account of the earlier versions of the bridge, and of Dunlop’s local interests, is given in Charlie Ebers, ‘Bridge tribute to a stalwart’, West Sussex County Times, 1 February 2008, 5.

43
The 1997 and 2003 structures were being referred to locally as ‘Ken’s Bridge’ while Dunlop was still alive. After his death, his family came up with the idea of a commemorative plaque, and felt that ‘Ken’s Crossing’ had a better, and more alliterative, ring to it. This name, and the plaque, were approved by the District Council:
Ken’s Crossing IN MEMORY OF KEN DUNLOP
STALWART MEMBER OF THE COMMUNITY AND THE
INSPIRATION BEHIND THIS BRIDGE HORSHAM DISTRICT COUNCIL
This was unveiled on 28 January 2008. At Mrs Dunlop’s suggestion, the author wrote to OS to propose the survey
and naming of this bridge as ‘Ken’s Crossing’ on the National Geographic Database. The resulting Sitemap is published in Viewpoint.3 The full National Grid reference of the centre of the bridge is TQ 07869 16677.
OS Object Name Books give ‘Authorities’ and ‘Descriptive remarks’ for the names of the features they list, but for the most part they add little to the map information except where they detail the land use (arable, pasture), include disquisitions by local experts, or give the ownership of the land.7 Only half-a-dozen of Dancy’s examples, culled from the length and breadth of Britain, provide real or supposed explanations of the name.8 It is only when we have such explicit detail as that related above that we can claim one of Professor Ross’s pristine place-names: ‘In my Salamanca lecture [April 1955] I introduced the concept of the pristine place-name, that is, a place-name of whose act of creation we are cognisant. Most of the world’s place-names are, of course, non-pristine’.9
Acknowledgements I am most grateful to Ken Dunlop’s son, Colin, and Ken’s sister, Mrs Vanrenen, for providing almost all the background information, and the references cited, about Ken Dunlop’s career. OS Customer Service Centre (Emma Cutler), the OS technical team, and the Viewpoint Publishing Editor (Hannah Whittle) have been extremely helpful.
7 I have in mind here the ONBs for the Edition of 1910 of the north-western Yorkshire Wolds (PRO OS 35). For the disquisitions see Maurice Beresford, ‘The spade might soon determine it’: the representation of deserted medieval villages on Ordnance Survey plans, 1849-1910, Agricultural History Review, 40.1 (1992) especially pp 68-69.
8 John Dancy, ‘Object name books’, Sheetlines 75 (April 2006), 21. 9 Alan S C Ross and A W Moverley, The Pitcairnese language, London: Andre Deutsch, 1964, 11-12.
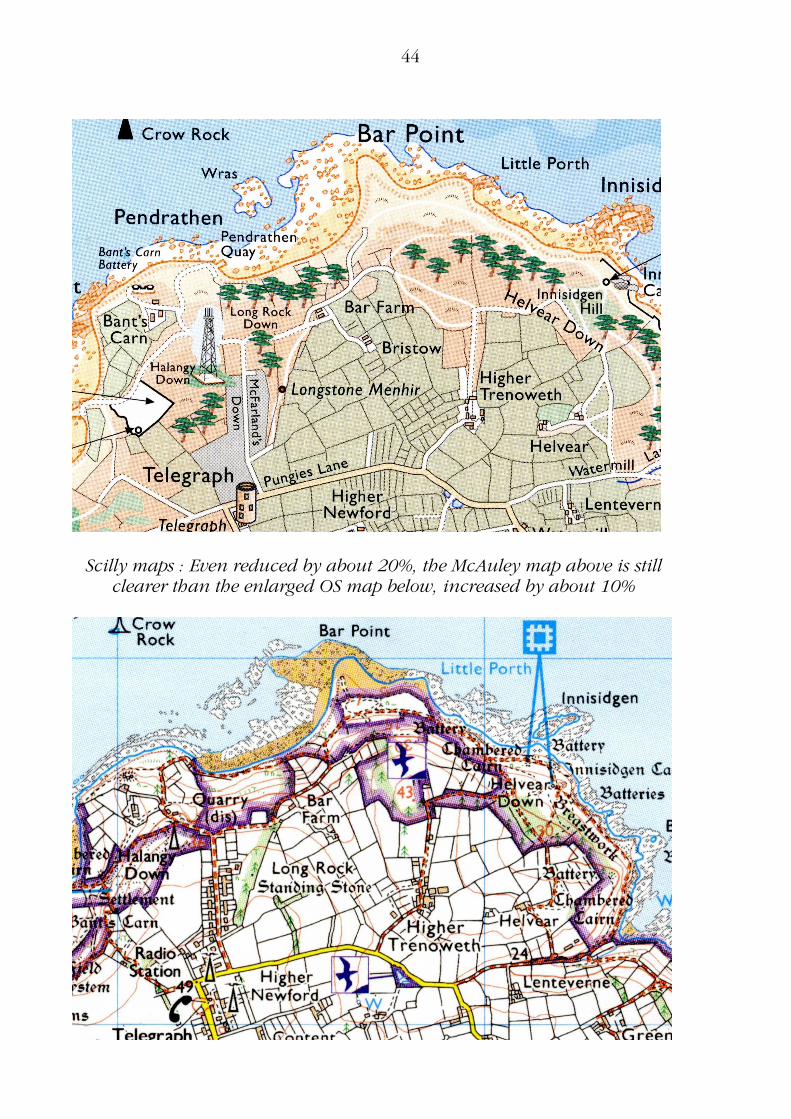
44
Scilly maps : Even reduced by about 20%, the McAuley map above is still clearer than the enlarged OS map below, increased by about 10%

45
Not such a Scilly map?
Gerry Zierler
Although not unknown, it’s not often that an Ordnance Survey aficionado such as a Charles Close Society member will want to criticise a product of the OS, the love of his life.
But sometimes, very rarely, that awful expression ‘fit for purpose’ springs to mind. Such an occasion was last month in the scintillating Isles of Scilly, when even the latest edition of OS Explorer 101 [edition B1/2008] was worryingly difficult to read, even out of the wind and with glasses on!
A quick trawl through all the stationery and souvenir shops of Hugh Town produced about a dozen maps of the Isles of Scilly, ranging from giveaway leaflets to some overpriced items aimed purely at the sedentary tourist. But one map in particular, priced at £5 and in an attractive cover complete with key map and attractive beach photograph, was the McAulay Map of the Isles of Scilly.
Compared with the familiar OS map, the scale seemed rather more sensible for exploring and walking around each of these beautiful small islands. At just 4 inches to the mile (1:15,840) there is certainly room for more features and their labels. But that aside, the clarity is outstanding, and it’s intriguing to ask oneself why.
The first thing to poke you in the eye is its almost complete absence of any map legend. Instead of the 216 square inches on the Explorer (roughly one quarter of the sheet area), there is just 2 square inches of symbology on the McAulay Map. Mary Spence, when president of the British Cartographic Society said that a good map needs no legend, and this maybe be living proof. Farmland is green, heathland is orange (darker for higher grounds), woods are attractive little trees and distinguish between deciduous and coniferous very clearly. The myriad of little lanes on the five inhabited islands are shown cased, pale orange if surfaced, otherwise white. Footpaths, despite being uncased, stand out clearly in white out of the orange heathland – much clearer than the minuscule dotted black lines on white of the Explorer (no green public rights of way here!).
Some very attractive mini-illustrations – ferry boats, helicopters, wrecks – adorn free space, unobtrusively and appropriately positioned. The many sands and inter-island shipping routes are clearly shown on a layered blue sea – surprisingly useful when island-hopping (at very low tide, Scilly routes can seem even more silly without a map).
The OS Explorer 101 has two large insets, one of Hugh Town (not a huge town), at 1:2,500, and the other of Tresco Abbey & New Grimsby at 1:10,000. I’m not sure how useful these are, frankly. Although of course a lot of individual buildings are named or numbered at 1:2,500, the detail is excessive for a tourist but may be insufficient for the serious Scillonian. The famous Abbey Gardens cover just two of the 85 square inches of the Tresco inset and

46
are frankly unreadable, the rest being mostly sea and sand. Two further small insets show Penzance at 1:25,000 and routes in Cornwall.
These compare with the McAulay map’s single inset, at reduced scale, of the uninhabited and spread-out Western Rocks; a sensible use of the otherwise empty SE corner. So despite being at a much larger scale, McAulay’s map is a more manageable 840 square inches, compared with the Explorer’s massive 1365 square inches of which over half is insets, making for a very unwieldy map when opened fully. Not a minor issue when in the spring breezes of the western approaches!
So in the writer’s view, the McAulay map, for the visitor to Scilly at any rate, is a map more ‘fit for purpose’ than the standardised specification of the OS Explorer map. It wins on size, scale, price, clarity – and pocketable walkability! Congratulations to the publisher of McAulay Maps, Neil Reid of Cormorant Design in Penzance – ironically not a Scillonian – who, incidentally, publish the splendid ‘Isles of Scilly Guidebook’ containing extracts from the same mapping.
With thanks to Neil Reid for permission to reproduce an extract from the McAulay map.
Puzzle corner 88
Nicknames, amusing but often unflattering, have been given to many British and Irish places. Can you identify and explain these: • Stroke city, Stab city • Polo mint city, the Hole with the Mint • Anzac-on-Sea, Kangaroo Valley • Balti Triangle, Rhubarb Triangle • Dear Green Place, Scarlet Town • Cottonopolis, Juteopolis, Tinopolis Answers on page 56.
David Archer offers a further brain-teaser: Where would you see ‘Ordnance Survey of Wales’ used rather than ‘Ordnance Survey of England and Wales’? See December Sheetlines for David’s explanation.

47
Kerry musings
David Archer
Earlier in the year we had a short holiday in Spain to build ourselves up for the rigours of the AGM. On the fifth day, we decided to repeat a very nice leisurely circular walk, but to go in the opposite direction. I took the local map with me, and spent most of the walk wondering why, especially as I do not like to be seen walking with a map at home, but do like to have a map with me. So, apart from seeing where to go, are there any advantages in having a map on a walk, even an easy walk for which the map is not needed?
Well, it gives you something to compare the scenery with, gives names to many landscape features and tells what is over the hill or where that road goes. So often, even on familiar walks, one notices something for the first time and needs a map to answer questions. I particularly like to stand on a hill and look down, make out the path just travelled and then see it on the map. Especially if I can turn around and see where we will go next, winding our way through the countryside. The route always seems so obvious that I frequently wonder why I brought, nay bought a map in the first place.
Although none of us has done it, numerous people see a map as a tour diary, to be annotated as they progress along the walk. Have you ever come across a map marked with little numbers, usually within a circle and an arrow or arrows pointing out from them, like male symbols? If you can remember your map reading exercises, and put yourself in the position of the map defacer, you will usually be able to identify what was being photographed. Once the walk reaches the cliffs, the vast expanses of pale blue sea are filled with pencilled notes on the local geology, flowers and nesting birds. Such notes are always at right angles to the coastline, pointing to specific locations. Lunch details, including prices in old money, B&B addresses and train times are usually relegated to the white inside covers. Yes, a map makes an excellent souvenir, a reminder of a visit, something to take home and bore people with, especially if it has a few stains or mud splashes, prompting tales of some sort.
Whether they look at it or not, carrying a map re-assures even the most confident walker that they are going along the right route. And if they keep it hidden, they feel rather smug when companions keep looking at their copies. ‘Don’t worry, we don’t need a map, I know the way.’ Sometimes at weekends, the babble of an organised walk is heard going past our hedge. If we look out, we often see about thirty or so heading for the Kerry Ridgeway, and you can bet that at least six are carrying a map without looking at it, just following the walk leader, who knows the way and never has a map (visible). I would find it difficult just to be led, and have great sympathy with the map carriers.
Re-assurance is certainly needed when you come to a less walked section of the path, overgrown and very doubtful. Here, the trusty map tells whether there is a way through, whether the way is a dead end or not. It gives comfort as well as re-assurance, things that are not printed on the map. There is nothing worse than being extremely hot/cold/tired and having to re-trace one’s steps when
48
unsure of what happens further along a path. A good map also gives confidence, especially if the leader of a walk has only planned it on paper. When the very doubtful bit is arrived at, and mere mortals are only re-assured, the leader is confident. They know there is a way through, and boldly lead whilst others hesitate. Your path now appears to go through a little garden gate with rambling roses and pretty flowers all around, plus a fierce black and white ‘Private’ sign just beyond. A nasty looking and defiant person emerges from the house, only to see your map and know that you know their secret : that they know that you know that they know you know that beyond the gate is a public right of way. Don’t forget to shut the gate. On our Spanish walk, we emerged from the middle of some farm buildings, through which the path went, and saw the farmer’s wife restraining two nasty-looking and barking dogs. Beyond her, and facing us, were an older couple who had obviously just stopped, thinking they had got it wrong. I am positive that on seeing the map in my hand, they hurried past the woman and us, heading in the direction we had come. Seeing our map made them confident that they were in the right place and that we had come along the sought-after path.
Without doubt, carrying a map gives you an identity. It says who you are and what you are doing. When we met the couple at the farm, we were not wearing boots and had no rucksacks, but the folded map in my hand instantly identified us as walkers out walking. Even without a backpack or haversack, being in the wrong place, map in hand, will tell someone an awful lot about you and help ease potentially uncomfortable situations. In the right place, sitting in the sunshine and having a pub lunch, the map on the table will often be a conversation opener to another walker. The map identifies you and what you are doing. It shows your intentions, and maybe when walking, you will meet someone who will warn you of a problem ahead or point out something interesting to see. Something that would not happen without a visible map.
When overseas, a map is very useful in showing you are a bona-fide walker if there are any language problems and you stray onto forbidden territory. It shows you are OK, and probably foreign. Without speaking the local language, if you need directions or are lost, it is something to show, and hopefully the other person can understand it and give directions by pointing, again overcoming language problems. In the mid-1970s we went to Italy and were to meet a friend in Bologna. We knew that we would have the afternoon to ourselves and bought the local map, an ancient looking piece of paper, small scale, uncoloured and dated around 1900. But we still went for a walk with it. Into the wooded hills. And got lost? No, we were just undecided as to where exactly we were. When we heard hammering we found a man renovating a cottage and showed him the map, hoping he would say where we were. But no, the map was so fascinating that we could get no sense out of him, especially after he called his friend to have a look. I cannot remember how we got back, but obviously we did. Thus, a map has the power to impress and can give you the wow factor when one is shown. This happens more often than

49
one might think, especially overseas, where locals appear to have no idea that such things exist.
The map you carry says a lot about you. Whether on display or not. When on a walk in Britain, I do not like to be seen carrying a map. You look as if you are studying it all the time, rather than enjoying the views. You appear unsure of the way. People look at you. You stand out as a stranger in these parts. Out of sight, a map allows you to move around unnoticed (if lacking boots and rucksack). People who walk locally, (only needing suitable shoes), dog walkers and such, like the old Pathfinders because they are compact, fit easily into a pocket and show public rights of way, so no problems or arguments. Pathfinders identify people who like an ordered life. Explorer users are prepared to put up with a lot; large, bulky, doubled sided maps that are a pest to use in even slightly adverse conditions. And the paper fails after being wetted. On the plus side? Not much as far as walking goes (it has been said). Have they ever considered the old Pathfinders? Those who use the 1:50,000 scale for walking are mild risk takers, choosing not to have the advantage of field boundaries to help ease any problems. A dwindling bunch, the old elite, still use the one-inch Seventh Series, liking a good map, a good walk and a good challenge all at the same time. ‘Green footpaths on maps are for softies, I know the law concerning trespass inside-out.’ ‘Nothing much changes in the countryside, these maps are fine.’
I suppose that taking a map with you also gives you someone or something to blame when things go wrong, as in ‘That could have been shown better’, or ‘No way was that half a mile’. Before an event, the map says this or it says that. It talks to you. If things go wrong, we say the map shows this in a confused manner or did not show that. It stops talking to you; you have fallen out as you have questioned its accuracy. Whether a conversationalist or not, a map is a companion, another member of your party, and someone to listen to, unless you fall out.
If things do not work out, the map becomes part of an emergency kit, for you and others. With it, you can work out a plan B or give help and sort out problems for other walkers. Motorists will often stop someone with a map to ask directions. Another good deed done. It is akin to an insurance policy. You know where you want to go, and it should be as simple as walking, but play safe, and for a couple of pounds buy a map, in case the worst comes to the worst. In really desperate times it can be folded into a sun hat or used as a fire lighter, and as a last resort you can write on it in big letters ‘Help. We are lost’.
50
Review
The landscape of London, 1:65,000, Anderson Geographics, 2009. ISBN 978-0-9548428-1-9, £9.99
The first thing to say about this stylish offering is that you get more map-area for your money than you do from Ordnance Survey, who printed it. The paper size is the same as for the OS 1:50,000 Landranger, 100.0 by 89.0 centimetres, but there is a ‘bleed’ edge and the title and legend, tucked into a corner, occupy only about 12.2 by 12.9 cm, so that 98.2% of the paper is ‘map’, as compared with only 71.9% of the Landranger, or 63.9% for those Landrangers with a Welsh legend. Efficiency of paper use is one of those strangely-neglected aspects of map design that deserve more attention. It is partly determined by the complexity or otherwise of the legend and marginalia: here there are only eleven symbols to explain, and there is no grid.
The map is subtitled on the cover ‘A unique 3-D map revealing the natural landscape of Greater London’. It is by no means the first attempt of its sort: a notable earlier contribution was Stanford’s contoured map of the county of London, at 1:21,120, originally published in 1878 for use in schools.1 Relief was shown by illuminated contours at 25 feet (7.5 metres) interval and hypsometric tinting, in shades of brown, school board boundaries were shown, and there was an instruction that the map should be hung so that the light came from the left of the observer. Given its longevity, a number of copies must have remained in use in 1934-5 when the OS issued the four sheets of the 1:63,360 Fifth (Relief) Edition covering London in a ‘Physical features alone’ version. The background to the ‘Physical Fifth’ has not yet been properly explored, but it consisted of the water, hachures, hill-shading, contours and hypsometric tinting of the parent map, with no adaptation: thus there were gaps in rivers where they were crossed by bridges, and there were gaps for built-up areas, where only the contours were shown. I do not know the print-run of the Stanford mapping, but the OS ‘physicals’ only seem to have been printed in runs of 200 or so, and only one is known to have gone to reprint: the main market seems to have been University geography departments.2
The landscape of London has contours and hill-shading with a cream ground-tint and, as is often the case with hill-shading, makes a better three-dimensional effect from a distance than close-to. A big problem with ‘physical’ mapping is location, away from obviously dramatic features such as the Thames or the scarps of the Chilterns or the North Downs.
1 Ralph Hyde, Printed maps of Victorian London, 1851-1900, Folkestone: Dawson, 1975, 164 [entry number 172] lists versions of 1878, 1892 and 1926. My description is based on the 1892 edition.
2 This is inferred from the pattern of subsequent disposals.

51
The OS physicals did not attempt to solve it, and they are best used in conjunction with the topographic version, which can be cum-bersome.3
Here the solution is closer to Stanford’s: built-up areas are a brown tint, ‘Parkland /forest’ a green tint, railways and their termini are solid black, main roads are browny-red, and borough boundaries and names are purple; all other text is black, in an attractive serifed style. Cultural names are confined to the minimum necessary to identify older focuses
of settlement, with the exception of the Olympic site, but they include a number of names of hills, ridges and streams for which you will search in vain on current OS 1:25,000 or 1:50,000 mapping. There is no grid, and this contributes enormously to the clarity of the map. The area covered is approximately between 495.5 and 560.5 east and 150.5 and 207.5 north on the National Grid. (The area around Ongar is omitted, in favour of the title and legend.)
The map derives from Ordnance Survey digital data, and is an example of what one hopes will be increasingly common: OS data, and in the sense of inputting ‘drawn’ by OS, but customised to produce something quite different-looking that supplies a gap in the market. I very much hope that The landscape of London meets with sufficient success to encourage similarly-styled mapping of other centres in Britain.
Richard Oliver
3 Given the in frequency with which the ‘Fifth Physicals’ are met, this is a contingency that most readers will not be troubled with.
The extract from The landscape of London map is published by kind permission of Anderson Geographics. See page 1 for details of special offer for CCS members.

52
Letters
Cover variants
Three Ordnance Survey covers in private collections have been reported to me recently which engaged my interest. Two of them are variants on the H2 cover design not in my 1991 list in Map cover art,1 which to that date had been recorded attached only to one-inch engraved sheets of England and Wales, and Scotland. The first is also a red cover (above left),2 significant in being the cover not for a single sheet but for a composite of four Revised New Series sheets, which, furthermore, are coloured rather than engraved outline. The four sheets in question are 62, 63, 70 and 71, covering an area with York at its centre. There is a 7.05 print code on sheet 70. The second is a white cover, rather than the usual red. The map inside is a dissected copy of one of the England and Wales half-inch small sheet series (sheet 52, 1.05 printing). On a sample of one, it is perhaps dangerous to suggest that the Ordnance Survey may have intended red covers for one-inch scale, and white for half-inch or other smaller scales. On balance I prefer another option, that it was merely a product of the move from red to white covers generally in 1906. If anyone has any other variant examples of this cover type, we would be interested to learn more.
Thirdly, something for those with an interest in military arcana. It would appear that the Machine Gun Training Centre, set up in Belton Park near Grantham during the first world war, had its own designated stock of England
1 John Paddy Browne, Map cover art, Southampton: Ordnance Survey, 1991. 2 With acknowledgments to Peter Gibson.
53
and Wales Third Edition (Large Sheet Series) sheet 55 (opposite right). Most of the Machine Gun Companies between the 53rd and the 206th were formed there, according to www.1914-1918.net/mg_units.htm.
Lastly, I can report that a question mark can be removed from the list of covers in Map cover art. At the time I had not seen a 8.1.a.1 cover on a Scottish Third Edition map: it has since been recorded on a copy of the Glasgow District, Edition of 1921, third edition map.
Roger Hellyer
The naming of canals
John Cole’s article (Sheetlines 87) A persistent error is perhaps a little hard on our favourite organisation – the naming of canals is not always an exact science.
In 1792 the first Wyrley & Essington Canal Act authorised a waterway from Wyrley Bank (near Cheslyn Hay) to Birchills and to the Birmingham Canal at Wolverhampton with short branches, but the first 2.5 miles were not then constructed. This section of the original ‘main line’ finally opened in 1857 after the W&E had been absorbed into the Birmingham Canal Navigations. They referred to it as the Wyrley Bank Branch, and although much more direct than that laid out earlier it was built under the original powers. Perhaps by default the OS designation is historically correct!
The name Birmingham Canal is probably sensible for the waterway each end of the Gower Branch, although there are arguments in favour of the designations John proposes, or indeed for Birmingham Canal Navigations, Old Main Line, New Main Line Island Line etc.
The ‘approach canal to Brades locks’ is in fact the Bradley Branch approaching Bradley locks.
My Canals of Birmingham historical map tries to detail some of the intricacies of the system (www.cartographics.co.uk/page3.htm).
Perhaps the most glaring error in naming a canal is the use of ‘Llangollen Canal’. The original Act of 1793 authorises the construction of a canal and branches, and directs that it is “to be called the Ellesmere Canal” Although the ownership has changed, this statutory title has never been amended. Following the will of Parliament, for over two centuries the canal has borne the name of the ancient market town in a central position along it, and there seems to be no logic supporting the continued efforts at rebranding, to which even the OS has now succumbed.
Richard Dean
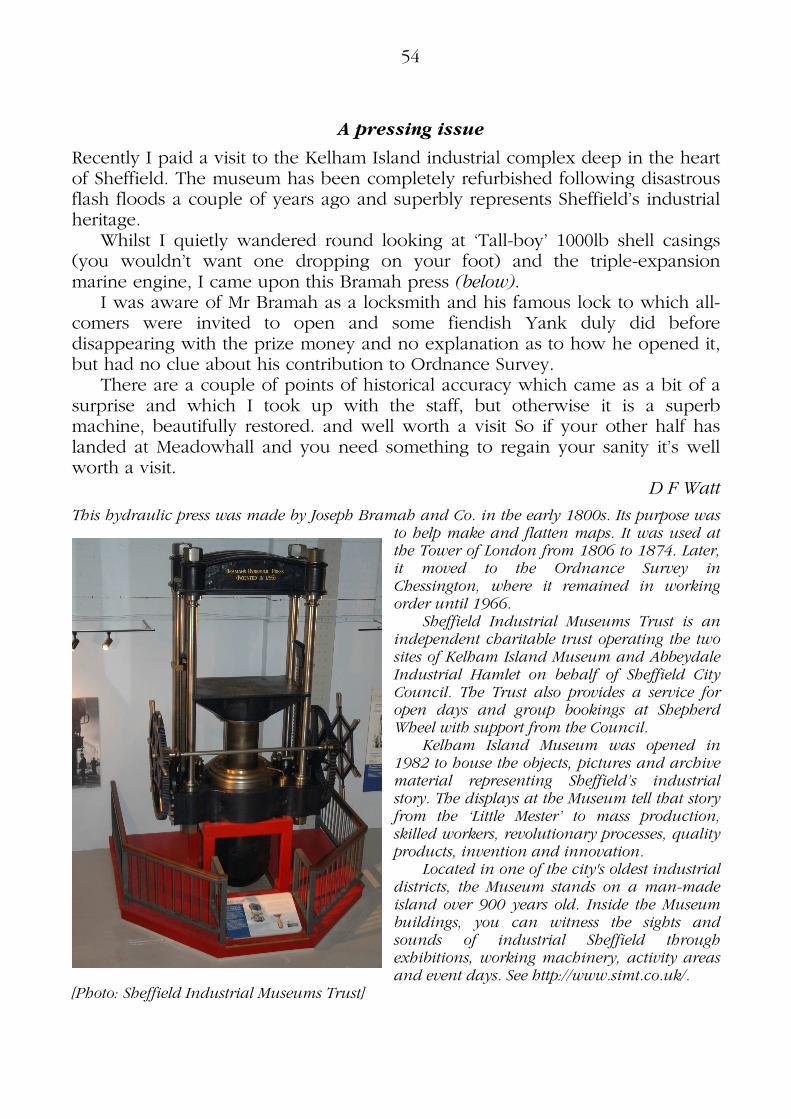
54
A pressing issue
Recently I paid a visit to the Kelham Island industrial complex deep in the heart of Sheffield. The museum has been completely refurbished following disastrous flash floods a couple of years ago and superbly represents Sheffield’s industrial heritage.
Whilst I quietly wandered round looking at ‘Tall-boy’ 1000lb shell casings (you wouldn’t want one dropping on your foot) and the triple-expansion marine engine, I came upon this Bramah press (below).
I was aware of Mr Bramah as a locksmith and his famous lock to which all-comers were invited to open and some fiendish Yank duly did before disappearing with the prize money and no explanation as to how he opened it, but had no clue about his contribution to Ordnance Survey.
There are a couple of points of historical accuracy which came as a bit of a surprise and which I took up with the staff, but otherwise it is a superb machine, beautifully restored. and well worth a visit So if your other half has landed at Meadowhall and you need something to regain your sanity it’s well worth a visit.
D F Watt
This hydraulic press was made by Joseph Bramah and Co. in the early 1800s. Its purpose was to help make and flatten maps. It was used at the Tower of London from 1806 to 1874. Later, it moved to the Ordnance Survey in Chessington, where it remained in working order until 1966.
Sheffield Industrial Museums Trust is an independent charitable trust operating the two sites of Kelham Island Museum and Abbeydale Industrial Hamlet on behalf of Sheffield City Council. The Trust also provides a service for open days and group bookings at Shepherd Wheel with support from the Council.
Kelham Island Museum was opened in 1982 to house the objects, pictures and archive material representing Sheffield’s industrial story. The displays at the Museum tell that story from the ‘Little Mester’ to mass production, skilled workers, revolutionary processes, quality products, invention and innovation.
Located in one of the city's oldest industrial districts, the Museum stands on a man-made island over 900 years old. Inside the Museum buildings, you can witness the sights and sounds of industrial Sheffield through exhibitions, working machinery, activity areas and event days. See http://www.simt.co.uk/.
[Photo: Sheffield Industrial Museums Trust]
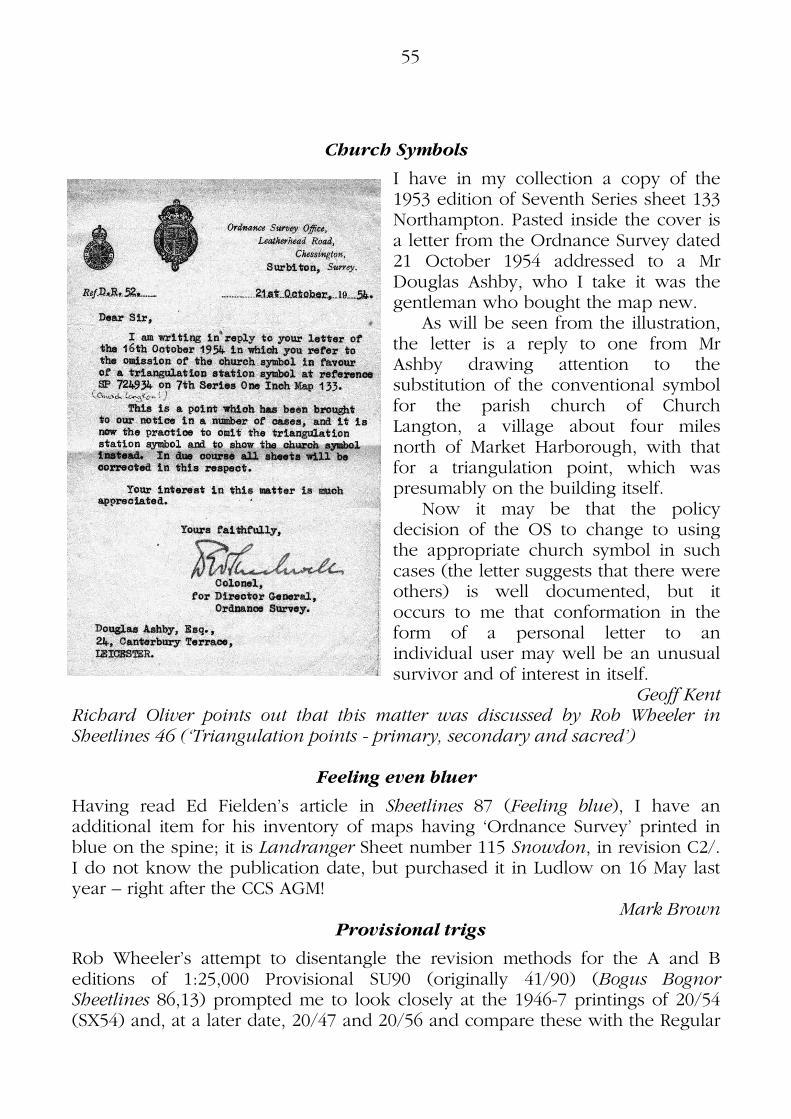
55
Church Symbols
I have in my collection a copy of the 1953 edition of Seventh Series sheet 133 Northampton. Pasted inside the cover is a letter from the Ordnance Survey dated 21 October 1954 addressed to a Mr Douglas Ashby, who I take it was the gentleman who bought the map new.
As will be seen from the illustration, the letter is a reply to one from Mr Ashby drawing attention to the substitution of the conventional symbol for the parish church of Church Langton, a village about four miles north of Market Harborough, with that for a triangulation point, which was presumably on the building itself.
Now it may be that the policy decision of the OS to change to using the appropriate church symbol in such cases (the letter suggests that there were others) is well documented, but it occurs to me that conformation in the form of a personal letter to an individual user may well be an unusual survivor and of interest in itself.
Geoff Kent Richard Oliver points out that this matter was discussed by Rob Wheeler in Sheetlines 46 (‘Triangulation points - primary, secondary and sacred’)
Feeling even bluer
Having read Ed Fielden’s article in Sheetlines 87 (Feeling blue), I have an additional item for his inventory of maps having ‘Ordnance Survey’ printed in blue on the spine; it is Landranger Sheet number 115 Snowdon, in revision C2/. I do not know the publication date, but purchased it in Ludlow on 16 May last year – right after the CCS AGM!
Mark Brown Provisional trigs
Rob Wheeler’s attempt to disentangle the revision methods for the A and B editions of 1:25,000 Provisional SU90 (originally 41/90) (Bogus Bognor Sheetlines 86,13) prompted me to look closely at the 1946-7 printings of 20/54 (SX54) and, at a later date, 20/47 and 20/56 and compare these with the Regular
56
editions published ten years later but with survey and/or revision dates commencing in 1947.
It is not a like-for-like comparison as these Devonshire versions are markedly different in terrain. On sheet 20/54, only 39 of the hundred grid squares are above low water mark.
But what I found is that there are no less than 38 trigonometrical stations on this sheet, of which just three had survived on the later map. It did not mean 38 pillars, bolts in concrete tables or even concrete blocks as these would have been secondary, or more likely tertiary, trigs to control the original 1:2500 survey of the late nineteenth century. In fact a report dated June 1950 indicated that ‘the majority of the difficult coastal survey is good – probably because of the greater density of trigs and thereby smaller detail survey triangles’, this coming to light during the revision of the 1:2500 maps in the area concerned.
As for reliability of the map in 1946, the impression is quite good. Very few field boundaries were added or deleted by 1956 whilst the only dubious squares were: 5048 extent of a coastal gunnery school and related housing; 5249 possible housing development at Wembury; 5448 possible housing development at Newton Ferrers; 5649 probable RAF establishment (not an airfield) at Collaton Cross. Also the Wheal Emily antimony mine at 5449 had long since gone.
20/47 and 20/56 were both compiled from large scale surveys or revisions of 1905. Six-inch mapping revised to one-inch standards (for the Fifth Edition) dated 1928-9 was not utilised but could well have been lost in the blitz. No air photo mosaics or ARP six-inch mapping appears to have been available.
Unlike Bognor, railway embankments and cuttings appear neat and complete but remarkably, many were missed on the A edition Regular before being restored on the B. I spotted this in the case of SX57 where the railway had subsequently been dismantled and more space between fences available, but not on SX45, 46, 47, 55, 56 and 65.
Other than that, 20/47 is not too bad but it is a very different story on 20/56. Missing were an airport, a WWII airfield, a reservoir extension with added coniferous plantations surrounding, the dismantling (in 1916) of the Plymouth and Dartmoor Tramway, plus a good many minor details. Apart from the airfield and reservoir extension, all had appeared on the one-inch Fifth Edition map as had several missing railway stations and halts.
John Cole Answers to Puzzle corner 88
Derry / [stroke] Londonderry, Limerick (had a reputation for criminal gang violence); East Kilbride (many roundabouts), Llantrisant (home of Royal Mint); Peacehaven (WWI base of Australian and NZ troops), Earl’s Court (where antipodeans gather); Sparkbrook and Balsall Heath area of Birmingham (many balti restaurants), Wakefield – Leeds – Bradford (once prolific rhubarb fields); Glasgow (fanciful translation of Gaelic name), Reading (pun Red-ding); Manchester, Dundee, Llanelli (from the glory days of manufacturing).