Sex and the city: differences in disease- and disability-free life years, and active community...
11
BioMed Central Page 1 of 11 (page number not for citation purposes) BMC Public Health Open Access Research article Sex and the city: Differences in disease- and disability-free life years, and active community participation of elderly men and women in 7 cities in Latin America and the Caribbean Angela MC Rose †1 , Anselm J Hennis †1,2 and Ian R Hambleton* †1 Address: 1 Chronic Disease Research Centre, Tropical Medicine Research Institute, The University of the West Indies, Barbados and 2 School of Clinical Medicine and Research, The University of the West Indies, Barbados Email: Angela MC Rose - [email protected]; Anselm J Hennis - [email protected]; Ian R Hambleton* - [email protected] * Corresponding author †Equal contributors Abstract Background: The world's population is ageing, and four of the top 10 most rapidly ageing developing nations are from the region of Latin America and the Caribbean (LAC). Although an ageing population heralds likely increases in chronic disease, disability-related dependence, and economic burden, the societal contribution of the chronically ill or those with disability is not often measured. Methods: We calculated country-specific prevalences of 'disability' (difficulty with at least one activity of daily living), 'disease' and 'co-morbidity' (presence of at least one, and at least two, of seven chronic diseases/conditions, respectively), and 'active community engagement' (using five levels of community participation, from less than weekly community contact to voluntary or paid work) in seven LAC cities. We estimated remaining life expectancy (LE) with and without disability, disease and co- morbidity, and investigated age, sex, and regional variations in disability-free LE. Finally, we modeled the association of disease, co-morbidity and disability with active community participation using an ordinal regression model, adjusted for depression. Results: Overall, 77% of the LAC elderly had at least one chronic disease/condition, 44% had co-morbidity and 19% had a disability. The proportion of disability-free LE declined between the youngest (60–64 years) and the eldest (90 years and over) age-groups for both men (from 85% to 55%) and women (from 75% to 45%). Disease-free and co-morbidity-free LE, however, remained at approximately 30% and 62%, respectively, for men (20% and 48% for women), until 80–84 years of age, then increased. Only Bridgetown's participants had statistically significantly longer disability-free LE than the regional average (IRR = 1.08; 95%CI 1.05–1.10; p < 0.001). Only Santiago's participants had disability-free LE which was shorter than the regional average (IRR = 0.94; 95%CI 0.92–0.97; p < 0.001). There was 75% active community participation overall, with more women than men involved in active help (49% vs 32%, respectively) and more men involved in voluntary/paid work (46% vs 25%, respectively). There was either no, or borderline significance in the association between having one or more diseases/conditions and active community engagement for both sexes. These associations were limited by depression (odds ratio [OR] reduced by 15–17% for men, and by 8–11% for women), and only remained statistically significant in men. However, disability remained statistically significantly associated with less community engagement after adjusting for depression (OR = 0.58, 95%CI 0.49–0.69, p < 0.001 for women and OR = 0.50, 95%CI 0.47–0.65, p < 0.001 for men). Conclusion: There is an increasing burden of disease and disability with older age across the LAC region. As these nations cope with resulting social and economic demands, governments and civic societies must continue to develop and maintain opportunities for community participation by this increasingly frail, but actively engaged group. Published: 21 April 2008 BMC Public Health 2008, 8:127 doi:10.1186/1471-2458-8-127 Received: 3 September 2007 Accepted: 21 April 2008 This article is available from: http://www.biomedcentral.com/1471-2458/8/127 © 2008 Rose et al; licensee BioMed Central Ltd. This is an Open Access article distributed under the terms of the Creative Commons Attribution License (http://creativecommons.org/licenses/by/2.0 ), which permits unrestricted use, distribution, and reproduction in any medium, provided the original work is properly cited.
-
Upload
cavehill-uwi -
Category
Documents
-
view
3 -
download
0
Transcript of Sex and the city: differences in disease- and disability-free life years, and active community...
BioMed CentralBMC Public Health
ss
Open AcceResearch articleSex and the city: Differences in disease- and disability-free life years, and active community participation of elderly men and women in 7 cities in Latin America and the CaribbeanAngela MC Rose†1, Anselm J Hennis†1,2 and Ian R Hambleton*†1Address: 1Chronic Disease Research Centre, Tropical Medicine Research Institute, The University of the West Indies, Barbados and 2School of Clinical Medicine and Research, The University of the West Indies, Barbados
Email: Angela MC Rose - [email protected]; Anselm J Hennis - [email protected]; Ian R Hambleton* - [email protected]
* Corresponding author †Equal contributors
AbstractBackground: The world's population is ageing, and four of the top 10 most rapidly ageing developing nations are from theregion of Latin America and the Caribbean (LAC).
Although an ageing population heralds likely increases in chronic disease, disability-related dependence, and economic burden,the societal contribution of the chronically ill or those with disability is not often measured.
Methods: We calculated country-specific prevalences of 'disability' (difficulty with at least one activity of daily living), 'disease'and 'co-morbidity' (presence of at least one, and at least two, of seven chronic diseases/conditions, respectively), and 'activecommunity engagement' (using five levels of community participation, from less than weekly community contact to voluntary orpaid work) in seven LAC cities. We estimated remaining life expectancy (LE) with and without disability, disease and co-morbidity, and investigated age, sex, and regional variations in disability-free LE. Finally, we modeled the association of disease,co-morbidity and disability with active community participation using an ordinal regression model, adjusted for depression.
Results: Overall, 77% of the LAC elderly had at least one chronic disease/condition, 44% had co-morbidity and 19% had adisability. The proportion of disability-free LE declined between the youngest (60–64 years) and the eldest (90 years and over)age-groups for both men (from 85% to 55%) and women (from 75% to 45%). Disease-free and co-morbidity-free LE, however,remained at approximately 30% and 62%, respectively, for men (20% and 48% for women), until 80–84 years of age, thenincreased. Only Bridgetown's participants had statistically significantly longer disability-free LE than the regional average (IRR =1.08; 95%CI 1.05–1.10; p < 0.001). Only Santiago's participants had disability-free LE which was shorter than the regional average(IRR = 0.94; 95%CI 0.92–0.97; p < 0.001). There was 75% active community participation overall, with more women than meninvolved in active help (49% vs 32%, respectively) and more men involved in voluntary/paid work (46% vs 25%, respectively).There was either no, or borderline significance in the association between having one or more diseases/conditions and activecommunity engagement for both sexes. These associations were limited by depression (odds ratio [OR] reduced by 15–17% formen, and by 8–11% for women), and only remained statistically significant in men. However, disability remained statisticallysignificantly associated with less community engagement after adjusting for depression (OR = 0.58, 95%CI 0.49–0.69, p < 0.001for women and OR = 0.50, 95%CI 0.47–0.65, p < 0.001 for men).
Conclusion: There is an increasing burden of disease and disability with older age across the LAC region. As these nationscope with resulting social and economic demands, governments and civic societies must continue to develop and maintainopportunities for community participation by this increasingly frail, but actively engaged group.
Published: 21 April 2008
BMC Public Health 2008, 8:127 doi:10.1186/1471-2458-8-127
Received: 3 September 2007Accepted: 21 April 2008
This article is available from: http://www.biomedcentral.com/1471-2458/8/127
© 2008 Rose et al; licensee BioMed Central Ltd. This is an Open Access article distributed under the terms of the Creative Commons Attribution License (http://creativecommons.org/licenses/by/2.0), which permits unrestricted use, distribution, and reproduction in any medium, provided the original work is properly cited.
Page 1 of 11(page number not for citation purposes)
BMC Public Health 2008, 8:127 http://www.biomedcentral.com/1471-2458/8/127
BackgroundThe ageing of the world's population is now well docu-mented, and projections indicate that this trend will con-tinue throughout the first half of the current century [1].The region of Latin America and the Caribbean (LAC) isexperiencing rapid population ageing: four countries fea-ture in the 10 most rapidly ageing developing nations [1].Between 2004 and 2050, the population of this region isexpected to increase by 42%, while the number of adultsover 65 years will quadruple to about 136 million, anincrease from about 4% to 17% of the population [2].
Initially discussed 20 years ago [3], Rowe and Kahn's def-inition of 'successful ageing' incorporates three elements:lack of disease and disability; remaining productivelyengaged in social activities; and maintaining high physicaland cognitive function [4]. Researchers have continued toredefine this concept, and a recent review found 28 sepa-rate studies containing 29 different definitions [5]. Mostdefinitions included self-perception of good health, aswell as lack of disability; the authors concluded that thiswas probably due to the popularity of the Rowe and Kahnmodel. Other studies have shown that self-rated success-ful ageing does not correlate with absence of chronic dis-ease and physical disability [6], and some have modifiedthe model's first aspect to consider a more inclusive (andperhaps more realistic) concept of 'minimal' rather than'no' disease [7].
We believe that labeling some of the elderly communityas having 'successfully' aged implies that the others havesomehow 'failed', and prefer the phrase 'active ageing'.This was defined by the World Health Organization(WHO) as "the process of optimizing opportunities forhealth, participation and security in order to enhancequality of life as people age [8]." Whatever the terminol-ogy, these definitions take us beyond the notion that lackof disease is the only goal of the health of the elderly, andlead us to consider other factors that may affect quality oflife, such as the ability to actively participate in the com-munity.
Taking the Rowe and Kahn model and the WHO defini-tion as a framework, we investigate two aspects of activeageing in the LAC region using data from seven urban cen-tres: levels of (1) disease and disability; and (2) activeengagement in the community.
MethodsThe Survey on Health, Well-being and Aging in LatinAmerica and the Caribbean (Salud, Bienestar y Envejec-imiento en America Latina y el Caribe, or SABE) was amulti-centre cross-sectional survey of over 10 500 olderadults (aged ≥ 60 years in 1999) conducted in the follow-ing seven cities in LAC between 1999 and 2000: Buenos
Aires, Argentina; Bridgetown, Barbados; Sao Paulo, Brazil;Santiago, Chile; Havana, Cuba; Mexico City, Mexico; andMontevideo, Uruguay. The study, which received techni-cal support from the Pan American Health Organisation(PAHO), comprised a research team which includedmembers from PAHO, the University of Wisconsin-Madi-son, and local investigators from each collaborating city[9]. The survey collected comprehensive information onhealth, functional ability and social support networks.Ethical approval was granted for the conduct of the surveyby the appropriate ethics review board in each city. Ano-nymised data from this study have been available to thepublic for free download since January 2005, from theNational Archive of Computerized Data on Aging [10],and details about the methodology of the SABE studyhave already been published [9].
We analysed the SABE dataset for all seven cities, focusingon demographic data (age, sex, city), health status (self-reported health status, and presence of chronic disease orcondition), functional status (activities of daily living,ADL), depression (Geriatric Depression Scale, GDS) andfive levels of active community engagement.
Health statusParticipants had been asked whether their health wasexcellent, very good, good, fair or poor. We groupedresponses into "good or better" self-reported health and"less than good". Participants had also been askedwhether a doctor or nurse had ever told them that theyhad any of seven chronic diseases or conditions (diabetes,cancer, hypertension, heart problems, stroke, arthritis orchronic lung disease). We then created two summary dis-ease indicators, which recorded whether a participant hadreported having (a) at least one of these ('disease'); or (b)at least two of these (co-morbidity). We created a sum-mary indicator for depression using the 15-item GDS[11], and used this when assessing the association ofhealth status and functional status with active communityengagement (see below).
Functional statusWe investigated limitations using six basic ADLs. Thesemeasure the independent performance of personal caretasks (dressing, eating, bathing, walking across a room,getting into/out of bed and using the toilet). They are use-ful for guiding clinical management decisions and carepolicies for the elderly [12], and are often used to measurelack of physical disability in the elderly. We created a sum-mary "disability" indicator, defined as those whoresponded that they had had "difficulty in performing" atleast one of the ADLs. This disability indicator was used tocalculate disability-free life expectancy (LE) in years.
Page 2 of 11(page number not for citation purposes)
BMC Public Health 2008, 8:127 http://www.biomedcentral.com/1471-2458/8/127
Community engagementWe measured five levels of decreasing community engage-ment, from active through passive to very little involve-ment; as follows: (a) voluntary or paid employment; (b)active help for others (e.g. through providing some kindof service, like housework, transport, childcare); (c) pas-sive help for others (providing money, clothes or food);(d) weekly community contact; or (e) less than weeklycommunity contact.
Statistical methodsTo investigate the first aspect of active ageing (relating tolack of, or limited disability and disease), we calculatedthe prevalence of disability (ADLs) and of self-reporteddisease and co-morbidity, within each country and over-all. We then calculated healthy LE following Sullivan'smethod [13], which uses life tables and prevalence data toestimate the number of remaining life years free from dis-ability or disease. We obtained life tables online from theWHO [14]. We calculated adjusted LE estimates with andwithout (a) disability; (b) disease; and (c) co-morbidity;by sex and 5-year age-groups (60–64, 65–69, 70–74, 75–79, 80–84, 85–89 years, and 90 years and over), for eachcity and overall.
Next we constructed a log-linear regression model toexamine the association of sex and location with disabil-ity-free LE (in years). We fitted three models. Firstly, forthe location association, we compared each city to theregional average (adjusted for age). Secondly, for the sexassociation we compared men to women within each agegroup, over the whole region (we grouped the oldest threeage-groups due to small numbers). Finally, for the sexassociation (adjusted for age and location) we comparedsex within each city.
We also calculated the prevalence of each level of activeengagement with community life. We constructed a sec-ond series of models to examine the association of thefirst aspect of active ageing (disease and disability) withthe second aspect (active community engagement). Usingour measure of disease as the only predictor, we fitted twoordinal-logistic regression models: one pre-adjusted forage, sex and location, and a second which also adjustedfor depression. We then repeated this modeling process,replacing the disease measure with our co-morbidity andthen our disability measure.
For participants missing 1, 2, or 3 GDS items, scores werescaled by number of unanswered items. We chose "3items" as the maximum acceptable level of item non-response. For participants missing a single item, theirscaled GDS score became: (Scaled GDS) = (original GDS)+ (original GDS)*(15/14), and so on. This increased theproportion of participants with usable GDS scores from
73% to 98%. We performed a sensitivity analysis of ouractive engagement ordinal-logistic regression to assess theeffect of this scaling on results. The scaled GDS producedmore conservative regression estimates than either theoriginal GDS or the unscaled GDS among participantsanswering 12 or more GDS items.
We weighted all prevalence estimates and individual-levelregression analyses to account for the survey design andlevels of non-response. We used Stata statistical software(Version 10, StataCorp LP, College Station, Texas, USA)for all analyses. We assumed statistical significance at p =0.05, but present confidence intervals, and p-values whereappropriate, to clarify the exact strength of statistical rela-tionships.
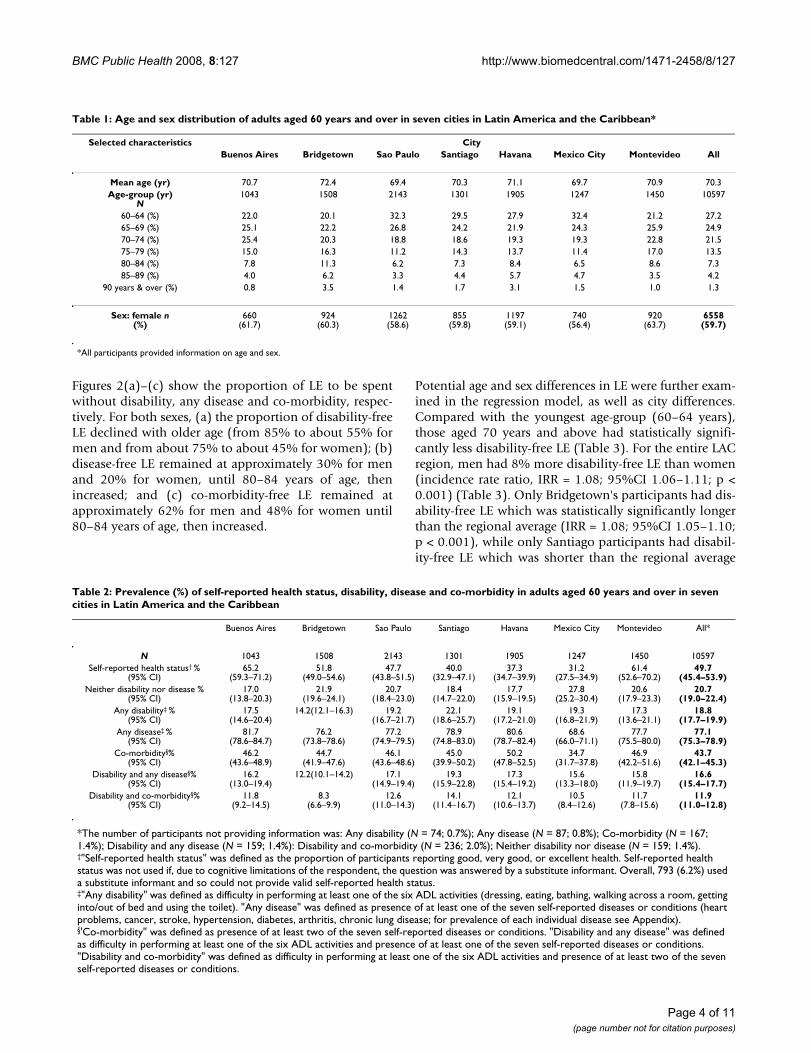
ResultsPrevalence of indicators by age, sex, and locationThe SABE questionnaire response rates were 63% in Bue-nos Aires, 65% in Montevideo, 80% in Bridgetown, 84%in Santiago, 85% in Sao Paulo and Mexico City, and 95%in Havana [15] Table 1 details characteristics of therespondents in each of the seven capital cities. Overall, themean age of participants was 70 years, with about 74%aged between 60 and 74 years; the majority (60%) werewomen.
The proportion of participants reporting good, very goodor excellent health was 50% overall (ranging from 31% inMexico City to 65% in Buenos Aires). Those reporting dif-ficulties with at least one ADL ranged from 14% in Bridg-etown to 22% in Santiago (the mean for the LAC regionwas 19%). In every city, over two-thirds of the elderlyreported having at least one disease, ranging from 69%(Mexico City) to 82% (Buenos Aires); the regional meanwas 77%. Co-morbidity was experienced by 44% of allparticipants (from 35% in Mexico City to 50% inHavana). The city with the greatest proportion affected byboth disability and any disease, and both disability andco-morbidity, was Santiago (19% and 14%, respectively),while Mexico City had the highest proportion both disa-bility-free and disease-free, at 28% (Table 2).
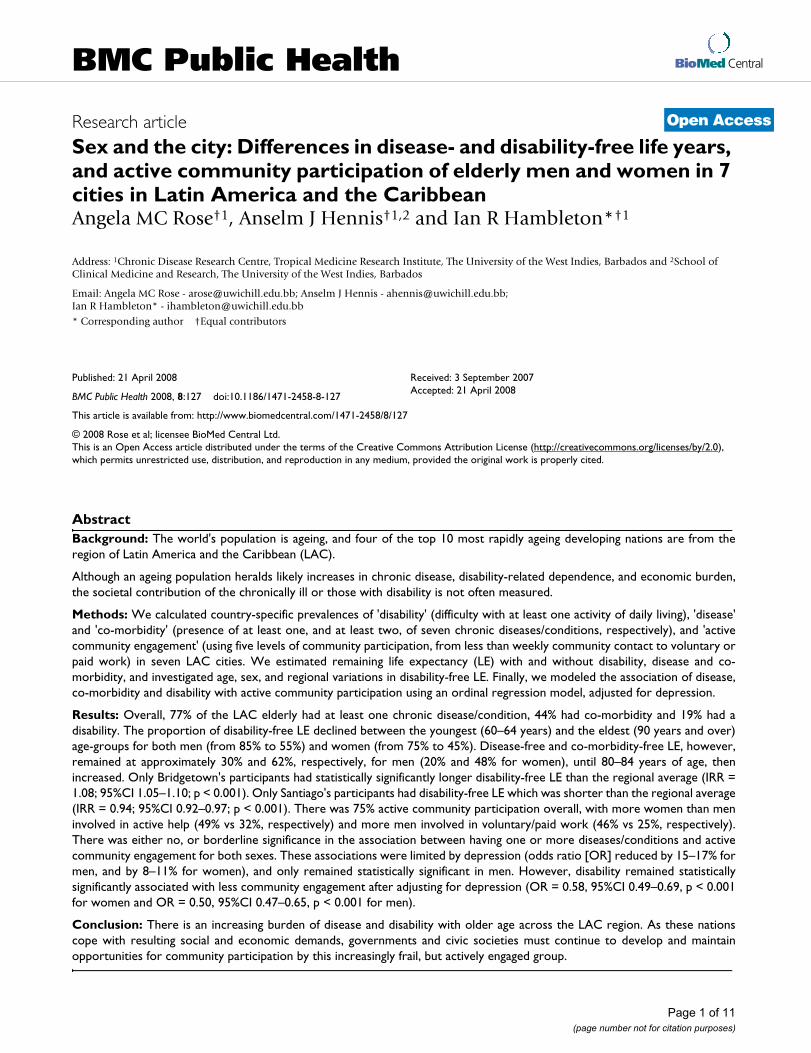
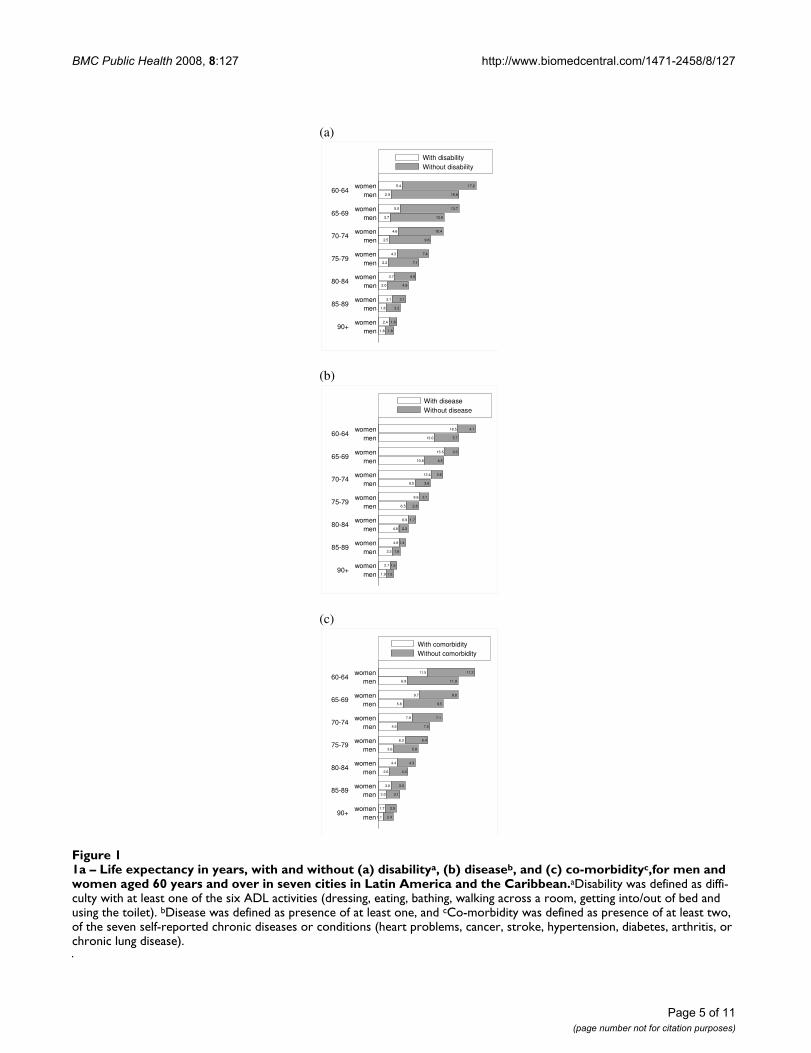
Life expectancies with and without disability, disease and co-morbidityIn Figures 1(a)–(c) we present the LE in years for elderlymen and women in the LAC region, indicating years spentwith and without disability, any disease and co-morbid-ity, respectively. In every age-group women had a longerLE than men; however, they also had more years with eachcondition. For example, women aged 60–64 years couldexpect 5 years to be spent with a disability (vs 3 years formen), 19 years with at least one chronic disease or condi-tion (13 years for men), and 12 years with co-morbidity(vs 7 years for men).
Page 3 of 11(page number not for citation purposes)
BMC Public Health 2008, 8:127 http://www.biomedcentral.com/1471-2458/8/127
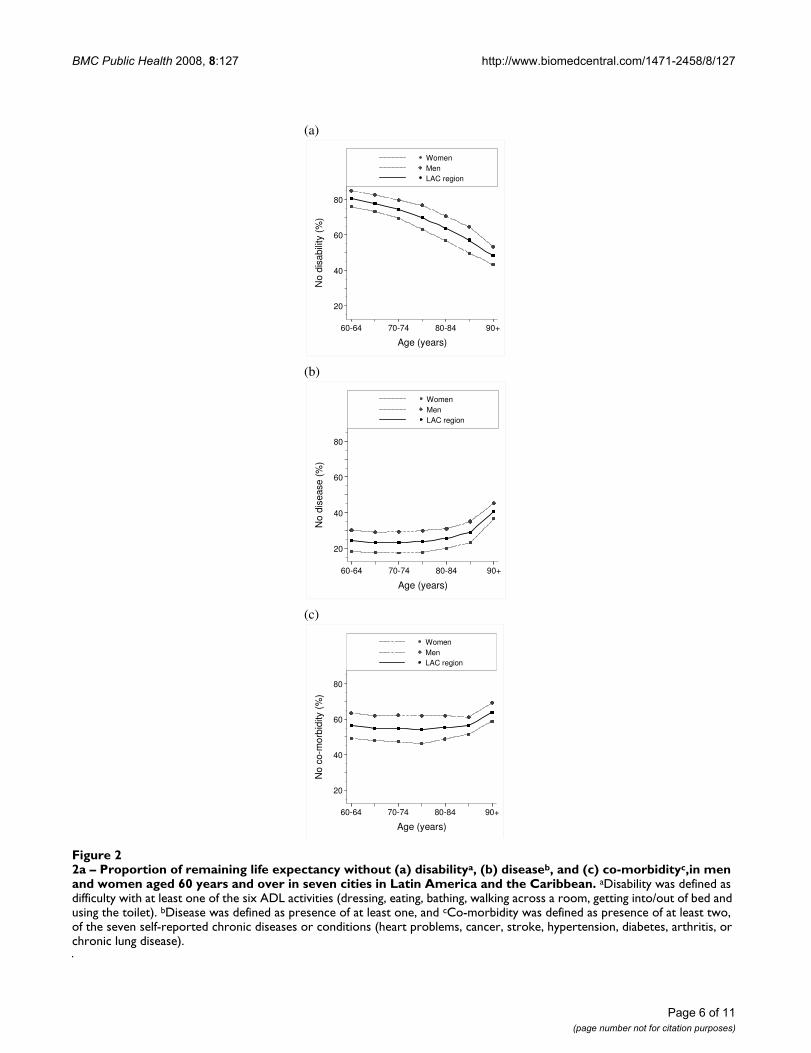
Figures 2(a)–(c) show the proportion of LE to be spentwithout disability, any disease and co-morbidity, respec-tively. For both sexes, (a) the proportion of disability-freeLE declined with older age (from 85% to about 55% formen and from about 75% to about 45% for women); (b)disease-free LE remained at approximately 30% for menand 20% for women, until 80–84 years of age, thenincreased; and (c) co-morbidity-free LE remained atapproximately 62% for men and 48% for women until80–84 years of age, then increased.
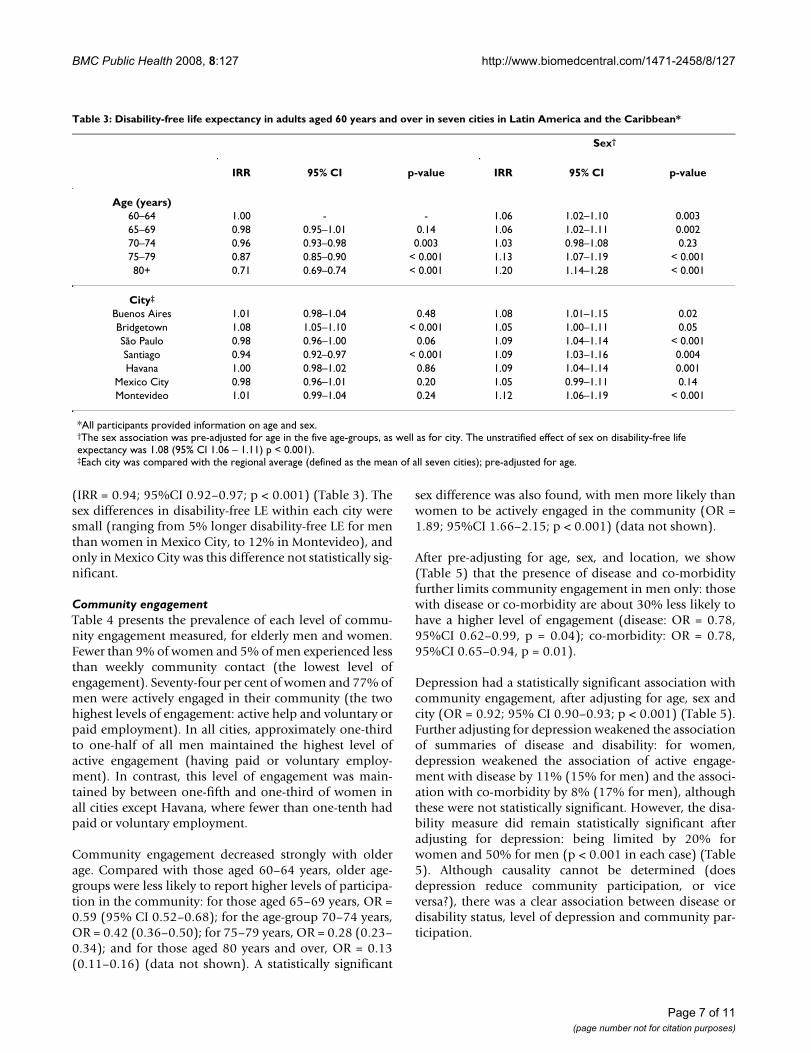
Potential age and sex differences in LE were further exam-ined in the regression model, as well as city differences.Compared with the youngest age-group (60–64 years),those aged 70 years and above had statistically signifi-cantly less disability-free LE (Table 3). For the entire LACregion, men had 8% more disability-free LE than women(incidence rate ratio, IRR = 1.08; 95%CI 1.06–1.11; p <0.001) (Table 3). Only Bridgetown's participants had dis-ability-free LE which was statistically significantly longerthan the regional average (IRR = 1.08; 95%CI 1.05–1.10;p < 0.001), while only Santiago participants had disabil-ity-free LE which was shorter than the regional average
Table 1: Age and sex distribution of adults aged 60 years and over in seven cities in Latin America and the Caribbean*
Selected characteristics CityBuenos Aires Bridgetown Sao Paulo Santiago Havana Mexico City Montevideo All
Mean age (yr) 70.7 72.4 69.4 70.3 71.1 69.7 70.9 70.3Age-group (yr)
N1043 1508 2143 1301 1905 1247 1450 10597
60–64 (%) 22.0 20.1 32.3 29.5 27.9 32.4 21.2 27.265–69 (%) 25.1 22.2 26.8 24.2 21.9 24.3 25.9 24.970–74 (%) 25.4 20.3 18.8 18.6 19.3 19.3 22.8 21.575–79 (%) 15.0 16.3 11.2 14.3 13.7 11.4 17.0 13.580–84 (%) 7.8 11.3 6.2 7.3 8.4 6.5 8.6 7.385–89 (%) 4.0 6.2 3.3 4.4 5.7 4.7 3.5 4.2
90 years & over (%) 0.8 3.5 1.4 1.7 3.1 1.5 1.0 1.3
Sex: female n(%)
660(61.7)
924(60.3)
1262(58.6)
855(59.8)
1197(59.1)
740(56.4)
920(63.7)
6558(59.7)
*All participants provided information on age and sex.
Table 2: Prevalence (%) of self-reported health status, disability, disease and co-morbidity in adults aged 60 years and over in seven cities in Latin America and the Caribbean
Buenos Aires Bridgetown Sao Paulo Santiago Havana Mexico City Montevideo All*
N 1043 1508 2143 1301 1905 1247 1450 10597Self-reported health status† %
(95% CI)65.2
(59.3–71.2)51.8
(49.0–54.6)47.7
(43.8–51.5)40.0
(32.9–47.1)37.3
(34.7–39.9)31.2
(27.5–34.9)61.4
(52.6–70.2)49.7
(45.4–53.9)Neither disability nor disease %
(95% CI)17.0
(13.8–20.3)21.9
(19.6–24.1)20.7
(18.4–23.0)18.4
(14.7–22.0)17.7
(15.9–19.5)27.8
(25.2–30.4)20.6
(17.9–23.3)20.7
(19.0–22.4)Any disability‡ %
(95% CI)17.5
(14.6–20.4)14.2(12.1–16.3) 19.2
(16.7–21.7)22.1
(18.6–25.7)19.1
(17.2–21.0)19.3
(16.8–21.9)17.3
(13.6–21.1)18.8
(17.7–19.9)Any disease‡ %
(95% CI)81.7
(78.6–84.7)76.2
(73.8–78.6)77.2
(74.9–79.5)78.9
(74.8–83.0)80.6
(78.7–82.4)68.6
(66.0–71.1)77.7
(75.5–80.0)77.1
(75.3–78.9)Co-morbidity§%
(95% CI)46.2
(43.6–48.9)44.7
(41.9–47.6)46.1
(43.6–48.6)45.0
(39.9–50.2)50.2
(47.8–52.5)34.7
(31.7–37.8)46.9
(42.2–51.6)43.7
(42.1–45.3)Disability and any disease§%
(95% CI)16.2
(13.0–19.4)12.2(10.1–14.2) 17.1
(14.9–19.4)19.3
(15.9–22.8)17.3
(15.4–19.2)15.6
(13.3–18.0)15.8
(11.9–19.7)16.6
(15.4–17.7)Disability and co-morbidity§%
(95% CI)11.8
(9.2–14.5)8.3
(6.6–9.9)12.6
(11.0–14.3)14.1
(11.4–16.7)12.1
(10.6–13.7)10.5
(8.4–12.6)11.7
(7.8–15.6)11.9
(11.0–12.8)
*The number of participants not providing information was: Any disability (N = 74; 0.7%); Any disease (N = 87; 0.8%); Co-morbidity (N = 167; 1.4%); Disability and any disease (N = 159; 1.4%): Disability and co-morbidity (N = 236; 2.0%); Neither disability nor disease (N = 159; 1.4%).†"Self-reported health status" was defined as the proportion of participants reporting good, very good, or excellent health. Self-reported health status was not used if, due to cognitive limitations of the respondent, the question was answered by a substitute informant. Overall, 793 (6.2%) used a substitute informant and so could not provide valid self-reported health status.‡"Any disability" was defined as difficulty in performing at least one of the six ADL activities (dressing, eating, bathing, walking across a room, getting into/out of bed and using the toilet). "Any disease" was defined as presence of at least one of the seven self-reported diseases or conditions (heart problems, cancer, stroke, hypertension, diabetes, arthritis, chronic lung disease; for prevalence of each individual disease see Appendix).§'Co-morbidity" was defined as presence of at least two of the seven self-reported diseases or conditions. "Disability and any disease" was defined as difficulty in performing at least one of the six ADL activities and presence of at least one of the seven self-reported diseases or conditions. "Disability and co-morbidity" was defined as difficulty in performing at least one of the six ADL activities and presence of at least two of the seven self-reported diseases or conditions.
Page 4 of 11(page number not for citation purposes)
BMC Public Health 2008, 8:127 http://www.biomedcentral.com/1471-2458/8/127
Page 5 of 11(page number not for citation purposes)
1a – Life expectancy in years, with and without (a) disabilitya, (b) diseaseb, and (c) co-morbidityc,for men and women aged 60 years and over in seven cities in Latin America and the CaribbeanFigure 11a – Life expectancy in years, with and without (a) disabilitya, (b) diseaseb, and (c) co-morbidityc,for men and women aged 60 years and over in seven cities in Latin America and the Caribbean.aDisability was defined as diffi-culty with at least one of the six ADL activities (dressing, eating, bathing, walking across a room, getting into/out of bed and using the toilet). bDisease was defined as presence of at least one, and cCo-morbidity was defined as presence of at least two, of the seven self-reported chronic diseases or conditions (heart problems, cancer, stroke, hypertension, diabetes, arthritis, or chronic lung disease).
(a)
1.6 1.8
2.4 1.8
1.8 3.2
3.1 3.1
2.0 4.9
3.7 4.9
2.2 7.1
4.3 7.4
2.5 9.6
4.6 10.4
2.7 12.6
5.0 13.7
2.9 15.8
5.4 17.2
90+
85-89
80-84
75-79
70-74
65-69
60-64
men
women
men
women
men
women
men
women
men
women
men
women
men
women
With disability
Without disability
(b)
1.9 1.6
2.7 1.5
3.3 1.8
4.8 1.4
4.8 2.2
6.9 1.7
6.5 2.8
9.6 2.1
8.5 3.6
12.4 2.6
10.8 4.5
15.5 3.3
13.0 5.7
18.5 4.1
90+
85-89
80-84
75-79
70-74
65-69
60-64
men
women
men
women
men
women
men
women
men
women
men
women
men
women
With disease
Without disease
(c)
1.1 2.4
1.7 2.5
2.0 3.1
3.0 3.3
2.6 4.3
4.4 4.3
3.6 5.8
6.3 5.4
4.5 7.5
7.9 7.1
5.8 9.5
9.7 9.0
6.8 11.9
11.5 11.2
90+
85-89
80-84
75-79
70-74
65-69
60-64
men
women
men
women
men
women
men
women
men
women
men
women
men
women
With comorbidity
Without comorbidity
BMC Public Health 2008, 8:127 http://www.biomedcentral.com/1471-2458/8/127
Page 6 of 11(page number not for citation purposes)
2a – Proportion of remaining life expectancy without (a) disabilitya, (b) diseaseb, and (c) co-morbidityc,in men and women aged 60 years and over in seven cities in Latin America and the CaribbeanFigure 22a – Proportion of remaining life expectancy without (a) disabilitya, (b) diseaseb, and (c) co-morbidityc,in men and women aged 60 years and over in seven cities in Latin America and the Caribbean. aDisability was defined as difficulty with at least one of the six ADL activities (dressing, eating, bathing, walking across a room, getting into/out of bed and using the toilet). bDisease was defined as presence of at least one, and cCo-morbidity was defined as presence of at least two, of the seven self-reported chronic diseases or conditions (heart problems, cancer, stroke, hypertension, diabetes, arthritis, or chronic lung disease).
(a)
20
40
60
80
No
dis
abili
ty (
%)
60-64 70-74 80-84 90+
Age (years)
Women
Men
LAC region
(b)
20
40
60
80
No
dis
ease
(%
)
60-64 70-74 80-84 90+
Age (years)
Women
Men
LAC region
(c)
20
40
60
80
No
co-m
orb
idity (
%)
60-64 70-74 80-84 90+
Age (years)
Women
Men
LAC region
BMC Public Health 2008, 8:127 http://www.biomedcentral.com/1471-2458/8/127
(IRR = 0.94; 95%CI 0.92–0.97; p < 0.001) (Table 3). Thesex differences in disability-free LE within each city weresmall (ranging from 5% longer disability-free LE for menthan women in Mexico City, to 12% in Montevideo), andonly in Mexico City was this difference not statistically sig-nificant.
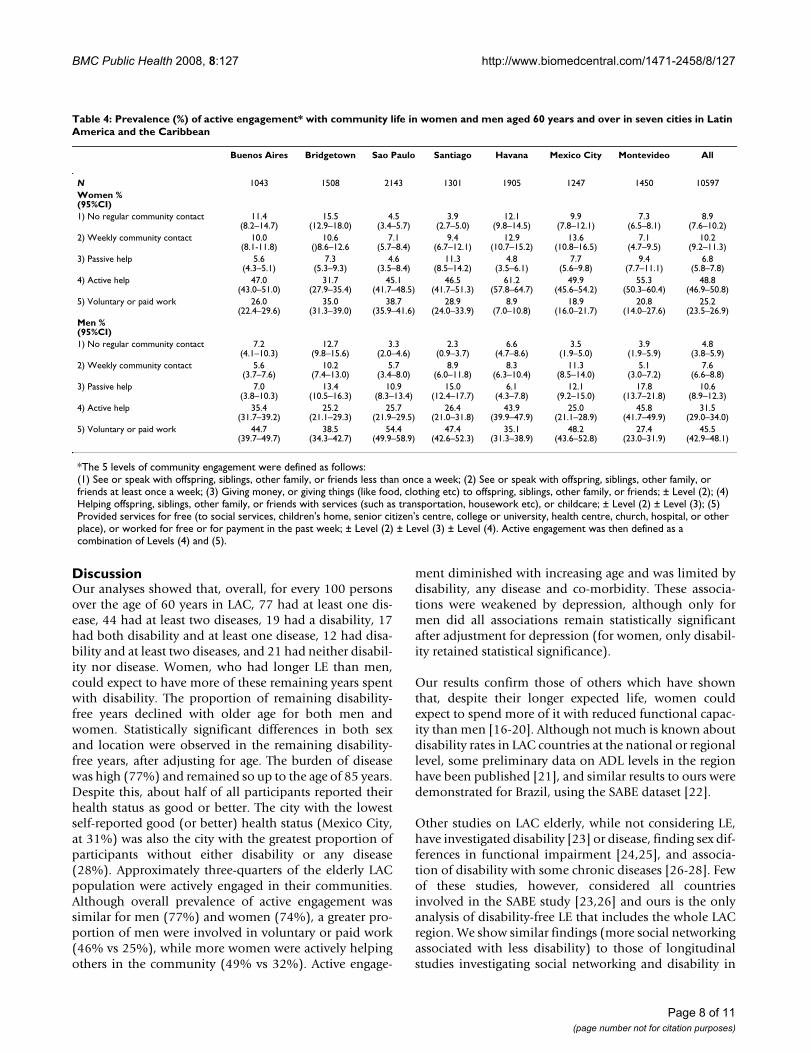
Community engagementTable 4 presents the prevalence of each level of commu-nity engagement measured, for elderly men and women.Fewer than 9% of women and 5% of men experienced lessthan weekly community contact (the lowest level ofengagement). Seventy-four per cent of women and 77% ofmen were actively engaged in their community (the twohighest levels of engagement: active help and voluntary orpaid employment). In all cities, approximately one-thirdto one-half of all men maintained the highest level ofactive engagement (having paid or voluntary employ-ment). In contrast, this level of engagement was main-tained by between one-fifth and one-third of women inall cities except Havana, where fewer than one-tenth hadpaid or voluntary employment.
Community engagement decreased strongly with olderage. Compared with those aged 60–64 years, older age-groups were less likely to report higher levels of participa-tion in the community: for those aged 65–69 years, OR =0.59 (95% CI 0.52–0.68); for the age-group 70–74 years,OR = 0.42 (0.36–0.50); for 75–79 years, OR = 0.28 (0.23–0.34); and for those aged 80 years and over, OR = 0.13(0.11–0.16) (data not shown). A statistically significant
sex difference was also found, with men more likely thanwomen to be actively engaged in the community (OR =1.89; 95%CI 1.66–2.15; p < 0.001) (data not shown).
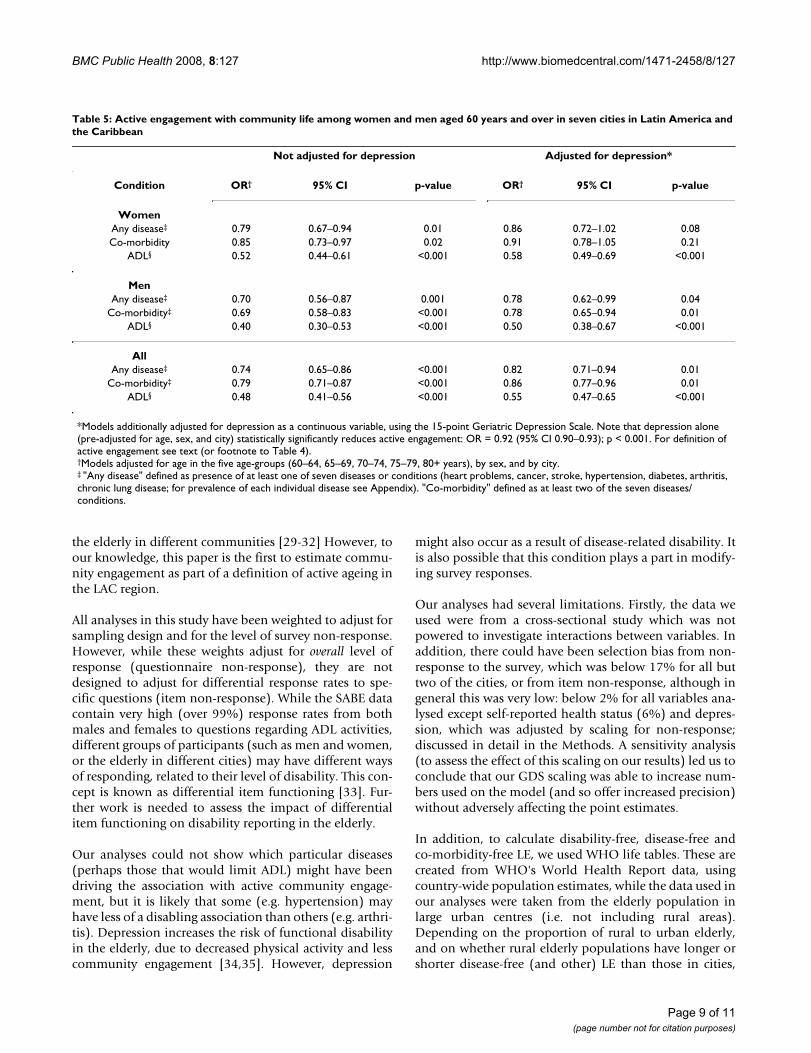
After pre-adjusting for age, sex, and location, we show(Table 5) that the presence of disease and co-morbidityfurther limits community engagement in men only: thosewith disease or co-morbidity are about 30% less likely tohave a higher level of engagement (disease: OR = 0.78,95%CI 0.62–0.99, p = 0.04); co-morbidity: OR = 0.78,95%CI 0.65–0.94, p = 0.01).
Depression had a statistically significant association withcommunity engagement, after adjusting for age, sex andcity (OR = 0.92; 95% CI 0.90–0.93; p < 0.001) (Table 5).Further adjusting for depression weakened the associationof summaries of disease and disability: for women,depression weakened the association of active engage-ment with disease by 11% (15% for men) and the associ-ation with co-morbidity by 8% (17% for men), althoughthese were not statistically significant. However, the disa-bility measure did remain statistically significant afteradjusting for depression: being limited by 20% forwomen and 50% for men (p < 0.001 in each case) (Table5). Although causality cannot be determined (doesdepression reduce community participation, or viceversa?), there was a clear association between disease ordisability status, level of depression and community par-ticipation.
Table 3: Disability-free life expectancy in adults aged 60 years and over in seven cities in Latin America and the Caribbean*
Sex†
IRR 95% CI p-value IRR 95% CI p-value
Age (years)60–64 1.00 - - 1.06 1.02–1.10 0.00365–69 0.98 0.95–1.01 0.14 1.06 1.02–1.11 0.00270–74 0.96 0.93–0.98 0.003 1.03 0.98–1.08 0.2375–79 0.87 0.85–0.90 < 0.001 1.13 1.07–1.19 < 0.00180+ 0.71 0.69–0.74 < 0.001 1.20 1.14–1.28 < 0.001
City‡
Buenos Aires 1.01 0.98–1.04 0.48 1.08 1.01–1.15 0.02Bridgetown 1.08 1.05–1.10 < 0.001 1.05 1.00–1.11 0.05São Paulo 0.98 0.96–1.00 0.06 1.09 1.04–1.14 < 0.001Santiago 0.94 0.92–0.97 < 0.001 1.09 1.03–1.16 0.004Havana 1.00 0.98–1.02 0.86 1.09 1.04–1.14 0.001
Mexico City 0.98 0.96–1.01 0.20 1.05 0.99–1.11 0.14Montevideo 1.01 0.99–1.04 0.24 1.12 1.06–1.19 < 0.001
*All participants provided information on age and sex.†The sex association was pre-adjusted for age in the five age-groups, as well as for city. The unstratified effect of sex on disability-free life expectancy was 1.08 (95% CI 1.06 – 1.11) p < 0.001).‡Each city was compared with the regional average (defined as the mean of all seven cities); pre-adjusted for age.
Page 7 of 11(page number not for citation purposes)
BMC Public Health 2008, 8:127 http://www.biomedcentral.com/1471-2458/8/127
DiscussionOur analyses showed that, overall, for every 100 personsover the age of 60 years in LAC, 77 had at least one dis-ease, 44 had at least two diseases, 19 had a disability, 17had both disability and at least one disease, 12 had disa-bility and at least two diseases, and 21 had neither disabil-ity nor disease. Women, who had longer LE than men,could expect to have more of these remaining years spentwith disability. The proportion of remaining disability-free years declined with older age for both men andwomen. Statistically significant differences in both sexand location were observed in the remaining disability-free years, after adjusting for age. The burden of diseasewas high (77%) and remained so up to the age of 85 years.Despite this, about half of all participants reported theirhealth status as good or better. The city with the lowestself-reported good (or better) health status (Mexico City,at 31%) was also the city with the greatest proportion ofparticipants without either disability or any disease(28%). Approximately three-quarters of the elderly LACpopulation were actively engaged in their communities.Although overall prevalence of active engagement wassimilar for men (77%) and women (74%), a greater pro-portion of men were involved in voluntary or paid work(46% vs 25%), while more women were actively helpingothers in the community (49% vs 32%). Active engage-
ment diminished with increasing age and was limited bydisability, any disease and co-morbidity. These associa-tions were weakened by depression, although only formen did all associations remain statistically significantafter adjustment for depression (for women, only disabil-ity retained statistical significance).
Our results confirm those of others which have shownthat, despite their longer expected life, women couldexpect to spend more of it with reduced functional capac-ity than men [16-20]. Although not much is known aboutdisability rates in LAC countries at the national or regionallevel, some preliminary data on ADL levels in the regionhave been published [21], and similar results to ours weredemonstrated for Brazil, using the SABE dataset [22].
Other studies on LAC elderly, while not considering LE,have investigated disability [23] or disease, finding sex dif-ferences in functional impairment [24,25], and associa-tion of disability with some chronic diseases [26-28]. Fewof these studies, however, considered all countriesinvolved in the SABE study [23,26] and ours is the onlyanalysis of disability-free LE that includes the whole LACregion. We show similar findings (more social networkingassociated with less disability) to those of longitudinalstudies investigating social networking and disability in
Table 4: Prevalence (%) of active engagement* with community life in women and men aged 60 years and over in seven cities in Latin America and the Caribbean
Buenos Aires Bridgetown Sao Paulo Santiago Havana Mexico City Montevideo All
N 1043 1508 2143 1301 1905 1247 1450 10597Women %(95%CI)1) No regular community contact 11.4
(8.2–14.7)15.5
(12.9–18.0)4.5
(3.4–5.7)3.9
(2.7–5.0)12.1
(9.8–14.5)9.9
(7.8–12.1)7.3
(6.5–8.1)8.9
(7.6–10.2)2) Weekly community contact 10.0
(8.1-11.8)10.6
()8.6–12.67.1
(5.7–8.4)9.4
(6.7–12.1)12.9
(10.7–15.2)13.6
(10.8–16.5)7.1
(4.7–9.5)10.2
(9.2–11.3)3) Passive help 5.6
(4.3–5.1)7.3
(5.3–9.3)4.6
(3.5–8.4)11.3
(8.5–14.2)4.8
(3.5–6.1)7.7
(5.6–9.8)9.4
(7.7–11.1)6.8
(5.8–7.8)4) Active help 47.0
(43.0–51.0)31.7
(27.9–35.4)45.1
(41.7–48.5)46.5
(41.7–51.3)61.2
(57.8–64.7)49.9
(45.6–54.2)55.3
(50.3–60.4)48.8
(46.9–50.8)5) Voluntary or paid work 26.0
(22.4–29.6)35.0
(31.3–39.0)38.7
(35.9–41.6)28.9
(24.0–33.9)8.9
(7.0–10.8)18.9
(16.0–21.7)20.8
(14.0–27.6)25.2
(23.5–26.9)Men %(95%CI)1) No regular community contact 7.2
(4.1–10.3)12.7
(9.8–15.6)3.3
(2.0–4.6)2.3
(0.9–3.7)6.6
(4.7–8.6)3.5
(1.9–5.0)3.9
(1.9–5.9)4.8
(3.8–5.9)2) Weekly community contact 5.6
(3.7–7.6)10.2
(7.4–13.0)5.7
(3.4–8.0)8.9
(6.0–11.8)8.3
(6.3–10.4)11.3
(8.5–14.0)5.1
(3.0–7.2)7.6
(6.6–8.8)3) Passive help 7.0
(3.8–10.3)13.4
(10.5–16.3)10.9
(8.3–13.4)15.0
(12.4–17.7)6.1
(4.3–7.8)12.1
(9.2–15.0)17.8
(13.7–21.8)10.6
(8.9–12.3)4) Active help 35.4
(31.7–39.2)25.2
(21.1–29.3)25.7
(21.9–29.5)26.4
(21.0–31.8)43.9
(39.9–47.9)25.0
(21.1–28.9)45.8
(41.7–49.9)31.5
(29.0–34.0)5) Voluntary or paid work 44.7
(39.7–49.7)38.5
(34.3–42.7)54.4
(49.9–58.9)47.4
(42.6–52.3)35.1
(31.3–38.9)48.2
(43.6–52.8)27.4
(23.0–31.9)45.5
(42.9–48.1)
*The 5 levels of community engagement were defined as follows:(1) See or speak with offspring, siblings, other family, or friends less than once a week; (2) See or speak with offspring, siblings, other family, or friends at least once a week; (3) Giving money, or giving things (like food, clothing etc) to offspring, siblings, other family, or friends; ± Level (2); (4) Helping offspring, siblings, other family, or friends with services (such as transportation, housework etc), or childcare; ± Level (2) ± Level (3); (5) Provided services for free (to social services, children's home, senior citizen's centre, college or university, health centre, church, hospital, or other place), or worked for free or for payment in the past week; ± Level (2) ± Level (3) ± Level (4). Active engagement was then defined as a combination of Levels (4) and (5).
Page 8 of 11(page number not for citation purposes)
BMC Public Health 2008, 8:127 http://www.biomedcentral.com/1471-2458/8/127
the elderly in different communities [29-32] However, toour knowledge, this paper is the first to estimate commu-nity engagement as part of a definition of active ageing inthe LAC region.
All analyses in this study have been weighted to adjust forsampling design and for the level of survey non-response.However, while these weights adjust for overall level ofresponse (questionnaire non-response), they are notdesigned to adjust for differential response rates to spe-cific questions (item non-response). While the SABE datacontain very high (over 99%) response rates from bothmales and females to questions regarding ADL activities,different groups of participants (such as men and women,or the elderly in different cities) may have different waysof responding, related to their level of disability. This con-cept is known as differential item functioning [33]. Fur-ther work is needed to assess the impact of differentialitem functioning on disability reporting in the elderly.
Our analyses could not show which particular diseases(perhaps those that would limit ADL) might have beendriving the association with active community engage-ment, but it is likely that some (e.g. hypertension) mayhave less of a disabling association than others (e.g. arthri-tis). Depression increases the risk of functional disabilityin the elderly, due to decreased physical activity and lesscommunity engagement [34,35]. However, depression
might also occur as a result of disease-related disability. Itis also possible that this condition plays a part in modify-ing survey responses.
Our analyses had several limitations. Firstly, the data weused were from a cross-sectional study which was notpowered to investigate interactions between variables. Inaddition, there could have been selection bias from non-response to the survey, which was below 17% for all buttwo of the cities, or from item non-response, although ingeneral this was very low: below 2% for all variables ana-lysed except self-reported health status (6%) and depres-sion, which was adjusted by scaling for non-response;discussed in detail in the Methods. A sensitivity analysis(to assess the effect of this scaling on our results) led us toconclude that our GDS scaling was able to increase num-bers used on the model (and so offer increased precision)without adversely affecting the point estimates.
In addition, to calculate disability-free, disease-free andco-morbidity-free LE, we used WHO life tables. These arecreated from WHO's World Health Report data, usingcountry-wide population estimates, while the data used inour analyses were taken from the elderly population inlarge urban centres (i.e. not including rural areas).Depending on the proportion of rural to urban elderly,and on whether rural elderly populations have longer orshorter disease-free (and other) LE than those in cities,
Table 5: Active engagement with community life among women and men aged 60 years and over in seven cities in Latin America and the Caribbean
Not adjusted for depression Adjusted for depression*
Condition OR† 95% CI p-value OR† 95% CI p-value
WomenAny disease‡ 0.79 0.67–0.94 0.01 0.86 0.72–1.02 0.08Co-morbidity 0.85 0.73–0.97 0.02 0.91 0.78–1.05 0.21
ADL§ 0.52 0.44–0.61 <0.001 0.58 0.49–0.69 <0.001
MenAny disease‡ 0.70 0.56–0.87 0.001 0.78 0.62–0.99 0.04
Co-morbidity‡ 0.69 0.58–0.83 <0.001 0.78 0.65–0.94 0.01ADL§ 0.40 0.30–0.53 <0.001 0.50 0.38–0.67 <0.001
AllAny disease‡ 0.74 0.65–0.86 <0.001 0.82 0.71–0.94 0.01
Co-morbidity‡ 0.79 0.71–0.87 <0.001 0.86 0.77–0.96 0.01ADL§ 0.48 0.41–0.56 <0.001 0.55 0.47–0.65 <0.001
*Models additionally adjusted for depression as a continuous variable, using the 15-point Geriatric Depression Scale. Note that depression alone (pre-adjusted for age, sex, and city) statistically significantly reduces active engagement: OR = 0.92 (95% CI 0.90–0.93); p < 0.001. For definition of active engagement see text (or footnote to Table 4).†Models adjusted for age in the five age-groups (60–64, 65–69, 70–74, 75–79, 80+ years), by sex, and by city.‡ "Any disease" defined as presence of at least one of seven diseases or conditions (heart problems, cancer, stroke, hypertension, diabetes, arthritis, chronic lung disease; for prevalence of each individual disease see Appendix). "Co-morbidity" defined as at least two of the seven diseases/conditions.
Page 9 of 11(page number not for citation purposes)
BMC Public Health 2008, 8:127 http://www.biomedcentral.com/1471-2458/8/127
this could have either resulted in an over- or underestima-tion of LE projections. Finally, our measure of communityengagement has not been validated.
We used the Rowe and Kahn model together with theWHO definition as a framework to estimate aspects ofactive ageing in the elderly LAC community. Some over-lap exists between Rowe and Kahn's three elements: bothphysical and cognitive function are needed for activeengagement in the community, while absence of disabil-ity implies presence of physical ability. Hence we chosenot to assess physical and cognitive function, but insteadfocused on the other two elements (disease/disability andactive community participation).
The challenge for public and private institutions in meet-ing the demands of older populations will depend to alarge extent on the levels of co-morbidity or disabilityexperienced by older individuals in various communities,and the degree to which institutions are prepared for pro-viding for the specific needs of their senior citizens. Oneimportant step in making these preparations is to under-stand the degree of co-morbidity and disability among theolder community, and how they impact on LE.
ConclusionHigh levels of active engagement in the community wereobserved, despite prevalence of 77% for any disease/con-dition and 19% for disability, and their associated limita-tion of active engagement. Our results thus reinforce theimportance of considering 'less disease' in the elderlyrather than none, when assessing levels of active ageing. In
addition, perhaps depression should also play a part indefinitions of 'active ageing', due to its association withboth disease and disability.
Estimates of disability-free LE and active community par-ticipation provide important determinants of the degreeof social and economic support needed to meet futuredemand from this vulnerable group. This is invaluableinformation for nations in the LAC region as they begin todeal with projected increases in the elderly population. Asthese nations cope with the social and economic demandsof an increasing burden of disease and disability in olderage, opportunities should be maximized for communityparticipation by this increasingly frail, but activelyengaged group.
Competing interestsThe author(s) declares that they have no competing inter-ests.
Authors' contributionsAH and IRH conceived and designed the study andacquired the data. AMCR and IRH analysed and inter-preted the data. AMCR drafted the manuscript. All authorscritically revised the manuscript for important intellectualcontent. AH supervised the study. All authors saw andapproved the final version of the manuscript.
AppendixSee Table 6.
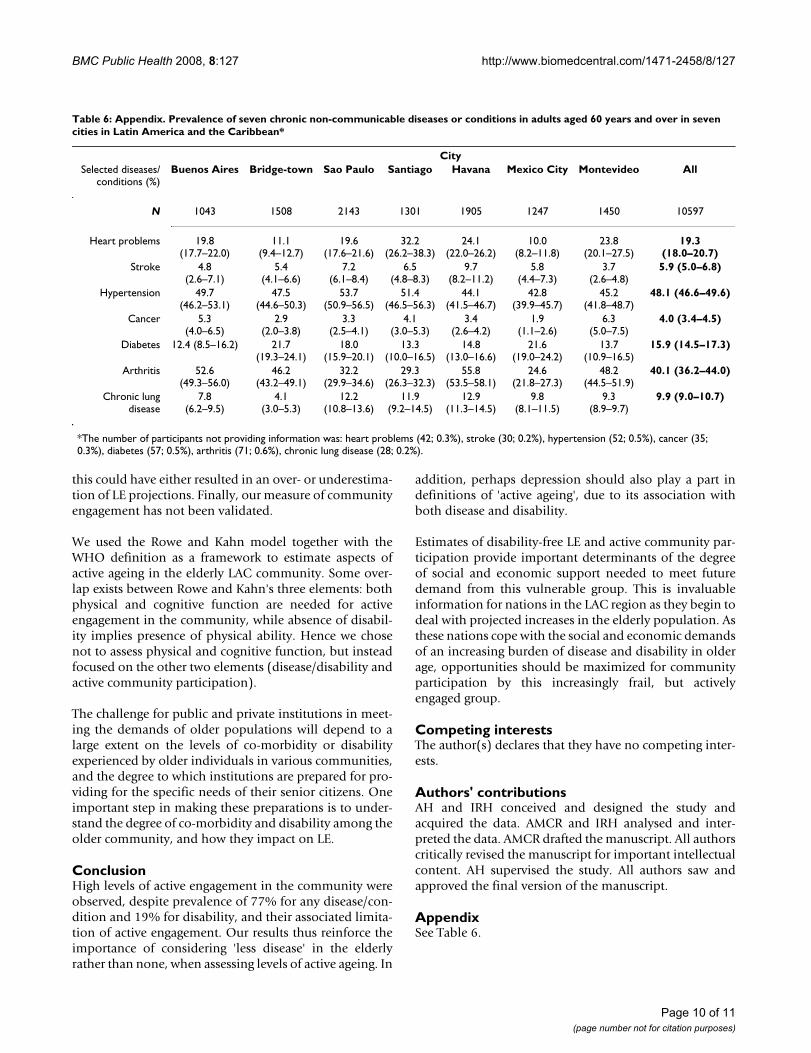
Table 6: Appendix. Prevalence of seven chronic non-communicable diseases or conditions in adults aged 60 years and over in seven cities in Latin America and the Caribbean*
CitySelected diseases/
conditions (%)Buenos Aires Bridge-town Sao Paulo Santiago Havana Mexico City Montevideo All
N 1043 1508 2143 1301 1905 1247 1450 10597
Heart problems 19.8(17.7–22.0)
11.1(9.4–12.7)
19.6(17.6–21.6)
32.2(26.2–38.3)
24.1(22.0–26.2)
10.0(8.2–11.8)
23.8(20.1–27.5)
19.3(18.0–20.7)
Stroke 4.8(2.6–7.1)
5.4(4.1–6.6)
7.2(6.1–8.4)
6.5(4.8–8.3)
9.7(8.2–11.2)
5.8(4.4–7.3)
3.7(2.6–4.8)
5.9 (5.0–6.8)
Hypertension 49.7(46.2–53.1)
47.5(44.6–50.3)
53.7(50.9–56.5)
51.4(46.5–56.3)
44.1(41.5–46.7)
42.8(39.9–45.7)
45.2(41.8–48.7)
48.1 (46.6–49.6)
Cancer 5.3(4.0–6.5)
2.9(2.0–3.8)
3.3(2.5–4.1)
4.1(3.0–5.3)
3.4(2.6–4.2)
1.9(1.1–2.6)
6.3(5.0–7.5)
4.0 (3.4–4.5)
Diabetes 12.4 (8.5–16.2) 21.7(19.3–24.1)
18.0(15.9–20.1)
13.3(10.0–16.5)
14.8(13.0–16.6)
21.6(19.0–24.2)
13.7(10.9–16.5)
15.9 (14.5–17.3)
Arthritis 52.6(49.3–56.0)
46.2(43.2–49.1)
32.2(29.9–34.6)
29.3(26.3–32.3)
55.8(53.5–58.1)
24.6(21.8–27.3)
48.2(44.5–51.9)
40.1 (36.2–44.0)
Chronic lungdisease
7.8(6.2–9.5)
4.1(3.0–5.3)
12.2(10.8–13.6)
11.9(9.2–14.5)
12.9(11.3–14.5)
9.8(8.1–11.5)
9.3(8.9–9.7)
9.9 (9.0–10.7)
*The number of participants not providing information was: heart problems (42; 0.3%), stroke (30; 0.2%), hypertension (52; 0.5%), cancer (35; 0.3%), diabetes (57; 0.5%), arthritis (71; 0.6%), chronic lung disease (28; 0.2%).
Page 10 of 11(page number not for citation purposes)
BMC Public Health 2008, 8:127 http://www.biomedcentral.com/1471-2458/8/127
AcknowledgementsThere was no funding source for this paper. The Barbados arm of the SABE project (Salud, Bienestar, y Envejecimiento en America Latina y el Caribe) was funded by the Caribbean Development Bank, the Pan American Health Organization, the Chronic Disease Research Centre Appeal Fund and the Caribbean Health Research Council.
References1. Kinsella K, Velkoff VA: An Aging World: 2001. Edited by: Bureau
USC. Washington, DC, U.S. Government Printing Office; 2001. 2. Brea JA: Population dynamics in Latin America. In Population
Bulletin Volume 58. Washington, D.C., Population Reference Bureau;2003.
3. Rowe JW, Kahn RL: Human aging: usual and successful. Science1987, 237:143-149.
4. Rowe JW, Kahn RL: Successful aging. Gerontologist 1997,37:433-440.
5. Depp CA, Jeste DV: Definitions and predictors of successfulaging: a comprehensive review of larger quantitative studies.Am J Geriatr Psychiatry 2006, 14:6-20.
6. Montross LP, Depp C, Daly J, Reichstadt J, Golshan S, Moore D, SitzerD, Jeste DV: Correlates of self-rated successful aging amongcommunity-dwelling older adults. Am J Geriatr Psychiatry 2006,14:43-51.
7. Strawbridge WJ, Wallhagen MI, Cohen RD: Successful aging andwell-being: self-rated compared with Rowe and Kahn. Geron-tologist 2002, 42:727-733.
8. World Health Organization: Active Ageing: A Policy Frame-work. A contribution of the World Health Organization tothe Second United Nations World Assembly on Ageing.Madrid, Spain. 2002.
9. Wong R, Pelaez M, Palloni A, Markides K: Survey data for thestudy of aging in Latin America and the Caribbean: selectedstudies. J Aging Health 2006, 18:157-179.
10. Arbour UMA: National Archive of Computerized Data onAging. 2006 [http://www.icpsr.umich.edu/NACDA/index.html].
11. Sheikh JI, Yesavage JA: Geriatric Depression Scale (GDS):Recent evidence and development of a shorter version. InClinical Gerontology : A Guide to Assessment and Intervention 36th edition.New York, The Haworth Press; 1986:165-173.
12. Katz S, Ford AB, Moskowitz RW, Jackson BA, Jaffe MW: Studies ofillness in the aged. The index of ADL: A standardized meas-ure of biological and psychosocial function. JAMA 1963,185:914-919.
13. Sullivan DF: A single index of mortality and morbidity. HSMHAHealth Rep 1971, 86:347-354.
14. World Health Organization: Life Tables for Member States.2004 [http://www.who.int/whosis/database/life_tables/life_tables_process.cfm?path=whosis].
15. Peláez M, Palloni A, Alba C, Alfonso JC, Ham-Chande R, Hennis A,Lebrao ML, Leon Diaz EM, Pantelides E, Prats O: SABE - Survey onHealth, Well-being and Ageing in Latin America and theCaribbean, 2000. Ann Arbor, MI, USA, Inter-University Consor-tium for Political and Social Research.; 2005.
16. Jitapunkul S, Kunanusont C, Phoolcharoen W, Suriyawongpaisal P,Ebrahim S: Disability-free life expectancy of elderly people ina population undergoing demographic and epidemiologictransition. Age Ageing 2003, 32:401-405.
17. Mutafova M, van de Water HP, Perenboom RJ, Boshuizen HC,Maleshkov C: Health expectancy calculations: a novelapproach to studying population health in Bulgaria. Bull WorldHealth Organ 1997, 75:147-153.
18. Minicuci N, Noale M, Pluijm SMF, Zunzunegui MV, Blumstein T, DeegDJH, Bardage C, Jylha M, Group CLESAW: Disability-free lifeexpectancy: a cross-national comparison of six longitudinalstudies on aging. The CLESA project. Eur J Ageing 2004,1:37-44.
19. Newman AB, Brach JS: Gender gap in longevity and disability inolder persons. Epidemiol Rev 2001, 23:343-350.
20. Minicuci N, Noale M: Disability free life expectancy in olderItalians. Disabil Rehabil 2005, 27:221-227.
21. Palloni A, Pinto-Aguirre G, Pelaez M: Demographic and healthconditions of ageing in Latin America and the Caribbean. IntJ Epidemiol 2002, 31:762-771.
22. Camargos MC, Perpetuo IH, Machado CJ: [Life expectancy withfunctional disability in elderly persons in Sao Paulo, Brazil].Rev Panam Salud Publica 2005, 17:379-386.
23. Menendez J, Guevara A, Arcia N, Leon Diaz EM, Marin C, Alfonso JC:[Chronic diseases and functional limitation in older adults: acomparative study in seven cities of Latin America and theCaribbean]. Rev Panam Salud Publica 2005, 17:353-361.
24. Barbosa AR, Souza JM, Lebrao ML, Laurenti R, Marucci MF: Func-tional limitations of Brazilian elderly by age and gender dif-ferences: data from SABE Survey. Cad Saude Publica 2005,21:1177-1185.
25. Barbosa AR, Souza JM, Lebrao ML, de Fatima Nunes MM: [Nutri-tional status and physical performance of elderly in the cityof Sao Paulo]. Rev Assoc Med Bras 2007, 53:75-79.
26. Alvarez-Nemegyei J, Esperon-Hernandez RI, Herrera-Correa GM,Nuno-Gutierrez BL: [Prevalence and functional impact ofarthropathies in elderly adults]. Rev Med Inst Mex Seguro Soc2006, 44:403-407.
27. Palloni A, McEniry M: Aging and health status of elderly in LatinAmerica and the Caribbean: preliminary findings. J Cross CultGerontol 2007, 22(3):263-285.
28. Al Snih S, Ray L, Markides KS: Prevalence of self-reported arthri-tis among elders from Latin America and the Caribbean andamong Mexican Americans from the southwestern UnitedStates. J Aging Health 2006, 18:207-223.
29. Mendes de Leon CF, Glass TA, Berkman LF: Social engagementand disability in a community population of older adults: theNew Haven EPESE. Am J Epidemiol 2003, 157:633-642.
30. Mendes de Leon CF, Gold DT, Glass TA, Kaplan L, George LK: Dis-ability as a function of social networks and support in elderlyAfrican Americans and Whites: the Duke EPESE 1986--1992.J Gerontol B Psychol Sci Soc Sci 2001, 56:S179-S190.
31. Mendes de Leon CF, Glass TA, Beckett LA, Seeman TE, Evans DA,Berkman LF: Social networks and disability transitions acrosseight intervals of yearly data in the New Haven EPESE. J Ger-ontol B Psychol Sci Soc Sci 1999, 54:S162-S172.
32. Zunzunegui MV, Rodriguez-Laso A, Otero A, Pluijm SM, Nikula S,Blumstein T, Jylha M, Minicuci N, Deeg DJ, Group CLESAW: Disabil-ity and social ties: comparative findings of the CLESA study.Eur J Aging 2006, 2:40-47.
33. Fleishman JA, Spector WD, Altman BM: Impact of differentialitem functioning on age and gender differences in functionaldisability. J Gerontol B Psychol Sci Soc Sci 2002, 57:S275-S284.
34. Penninx BW, Guralnik JM, Ferrucci L, Simonsick EM, Deeg DJ, Wal-lace RB: Depressive symptoms and physical decline in com-munity-dwelling older persons. JAMA 1998, 279:1720-1726.
35. Penninx BW, Leveille S, Ferrucci L, van Eijk JT, Guralnik JM: Explor-ing the effect of depression on physical disability: longitudinalevidence from the established populations for epidemiologicstudies of the elderly. Am J Public Health 1999, 89:1346-1352.
Pre-publication historyThe pre-publication history for this paper can be accessedhere:
http://www.biomedcentral.com/1471-2458/8/127/prepub
Page 11 of 11(page number not for citation purposes)
http://www.ncbi.nlm.nih.gov/entrez/query.fcgi?cmd=Retrieve&db=PubMed&dopt=Abstract&list_uids=3299702
http://www.ncbi.nlm.nih.gov/entrez/query.fcgi?cmd=Retrieve&db=PubMed&dopt=Abstract&list_uids=9279031
http://www.ncbi.nlm.nih.gov/entrez/query.fcgi?cmd=Retrieve&db=PubMed&dopt=Abstract&list_uids=5554262
http://www.ncbi.nlm.nih.gov/entrez/query.fcgi?cmd=Retrieve&db=PubMed&dopt=Abstract&list_uids=9185367
http://www.ncbi.nlm.nih.gov/entrez/query.fcgi?cmd=Retrieve&db=PubMed&dopt=Abstract&list_uids=9185367
http://www.ncbi.nlm.nih.gov/entrez/query.fcgi?cmd=Retrieve&db=PubMed&dopt=Abstract&list_uids=9624025