Sensory integration therapy versus usual care for sensory ...
Upload
independentCategory
view
2download
0
nces 260 (2007) 188–198www.elsevier.com/locate/jns
Journal of the Neurological Scie
Sensory-motor and cognitive tests predict driving ability of persons withbrain disorders
Carrie R.H. Innes a,b,c,⁎, Richard D. Jones a,b,c,d, John C. Dalrymple-Alford a,e, Sarah Hayes f,Sue Hollobon f, Julie Severinsen f, Gwyneth Smith f, Angela Nicholls f, Tim J. Anderson a,b,g
a Van der Veer Institute for Parkinson's and Brain Research, Christchurch, New Zealandb Department of Medicine, Christchurch School of Medicine and Health Sciences, University of Otago, Christchurch, New Zealand
c Department of Medical Physics and Bioengineering, Christchurch Hospital, Christchurch, New Zealandd Department of Electrical and Computer Engineering, University of Canterbury, Christchurch, New Zealand
e Department of Psychology, University of Canterbury, Christchurch, New Zealandf Department of Occupational Therapy, Burwood Hospital, Christchurch, New Zealand
g Department of Neurology, Christchurch Hospital, Christchurch, New Zealand
Received 30 June 2006; received in revised form 23 April 2007; accepted 25 April 2007Available online 4 June 2007
Abstract
Objective: Brain disorders can lead to a decreased ability to perform the physical and cognitive functions necessary for safe driving. Thisstudy aimed to determine how accurately a battery of computerized sensory-motor and cognitive tests (SMCTests™) could predict drivingabilities in persons with brain disorders.Methods: SMCTests and an independent on-road driving assessment were applied to 50 experienced drivers with brain disorders referred to ahospital-based driving assessment service. The patients comprised 36 males and 14 females, a mean age of 71.3 years (range 43–85 years) anddiagnoses of 35 stroke, 4 traumatic brain injury, 4 Alzheimer's disease, and 7 other. Binary logistic regression (BLR) and nonlinear causalresource analysis (NCRA) were used to build model equations for prediction of on-road driving ability based on SMCTests performance.Results: BLR and NCRA correctly classified 94% and 90% of referrals respectively as on-road pass or fail. Leave-one-out cross-validationestimated that BLR and NCRAwould correctly predict the classification of 86% and 76% respectively of an independent referral group as on-road pass or fail.Conclusions: Compared with other studies, SMCTests have shown the highest predictive accuracy against true on-road driving ability asestimated in an independent data set and in persons with brain disorders. SMCTests also have the advantage of being able to comprehensivelyand objectively assess both sensory-motor and higher cognitive functions related to driving.© 2007 Elsevier B.V. All rights reserved.
Keywords: Driving; Brain disorders; Prediction; Sensory-motor; Cognitive; human performance
1. Introduction
Ability to drive is highly valued by most adults and per-sonal transport is used daily for all manner of activities.Unfortunately, a wide variety of brain disorders can lead to
⁎ Corresponding author. Van der Veer Institute for Parkinson's and BrainResearch, 66 Stewart Street, Christchurch, NewZealand. Tel.: +64 3 378 6096;fax: +64 3 378 6080.
E-mail address: [email protected] (C.R.H. Innes).
0022-510X/$ - see front matter © 2007 Elsevier B.V. All rights reserved.doi:10.1016/j.jns.2007.04.052
impairment of sensory-motor and/or cognitive abilities impor-tant for safe driving [1–4]. Thus, it is important that appro-priate driving assessment is available to identify persons nolonger able to drive safely. For the driver, forfeiture of adriver's licence can have a marked negative effect on theperson's mobility, and has been linked to depression, loweredself-esteem, and reduced overall quality of life [5]. Therefore,any driving assessment must be thorough, objective, and striveto ensure that all those who fail do so because of markeddeficits that would unquestionably lead to unsafe driving.
189C.R.H. Innes et al. / Journal of the Neurological Sciences 260 (2007) 188–198
Where possible, the assessment should also provide failed orborderline subjects with specific information on, and potentialconsequences of, their deficits, in order to obtain as high a levelas possible of acceptance of, and compliance with, assessmentand rehabilitation recommendations.
In New Zealand, medical practitioners have a legal obli-gation to consider medical aspects of fitness to drive whenconducting amedical examination to determine if an individualis fit to drive [6]. In cases where there is doubt regarding anindividual's fitness to drive, a practitioner can refer a patient toa specialist driving assessment service. Occupational therapistswith skills in driver assessment offer services to meet this needinmajor centres in NewZealand. Approximately 1400 persons(35 per 100,000) with brain lesions or age-related cognitivedecline are referred for a driving assessment in New Zealand(population ∼4 million) each year. Despite a relatively highdemand for specialized driving assessment, an accurate,comprehensive, and standardized off-road assessment proce-dure has yet to be identified.
Internationally, several groups have investigated the re-lationship between on-road driving and performance onneuropsychological test batteries [7–16], tests specificallydesigned for driving-related functions [17–23], and drivingsimulators [9,24–27]. Researchers have also investigated therelationship between off-road test performance and on-roaddriving as estimated by crash records [28–31], closed-coursedriving [32,33], or simulated driving [34–38].
Several of these studies have investigated the relationshipbetween off- and on-road assessment outcome (i.e., Pass orFail) using classification models, in which the test data isthe same as the training data. Classificationmodels have provento be 70–94% accurate in classifying on-road assessment out-come based on performance on off-road tests [7–9,15–17,22,27] or driving simulators [27]. A more robust determinationof the relationship between off-road assessments and on-roaddriving outcome can be achieved by studies using predictivemodels, in whichmodels are trained and tested on separate datagroups. Predictive models have proven to be 62–89% accuratein predicting on-road assessment outcome in an independentgroup of subjects [14,19,23,32,39].
In addition to varying success at identifying at-risk drivers,there is a need for a simple, relatively inexpensive, but com-prehensive assessment system that covers both the physicaland cognitive deficits underlying an inability to drive safely incertain individuals with neurological disorders. Such an as-sessment system would need to have a high predictive accu-racy for on-road driving ability. We have developed abattery of computerized sensory-motor and cognitive tests(SMCTests™) to quantify sensory-motor and cognitivedysfunction as a research and quantitative assessment tool inneurology and neurorehabilitation, with particular applicationto the assessment of driving abilities in patients withneurological disorders. The sensory-motor tests comprisetests of visuoperception, ballistic movements, and visuomotortracking which have already been extensively used as astandalone battery [40,41] to assess sensory-motor dysfunc-
tion in off-road driving assessment [42,43], unilateral stroke[44,45], Parkinson's disease [46–49], stutterers [50], andfollowing alcohol consumption [51]. The cognitive tests werenewly developed measures of complex attention, visualsearch, decision-making, impulse control, planning, anddivided attention. These cognitive functions were identifiedfollowing an analysis of the literature describing (a) perceivedcognitive deficits observed during on-road assessment ofsubjects with brain disorders (e.g., [1–4]) and (b) performanceon cognitive tests associatedwith driving in subjectswith braindisorders [8–23,28–30,32,35,36]. The tests were designed tobe contextually close to the on-road driving task so as toprovide higher face validity than readily available standardneuropsychological tests, to increase user compliance, andencourage optimal prediction of on-road performance. Thenormative range, reliability, validity, and effect of sex and ageon performance of the cognitive tests have been determined ina separate study of 60 healthy control subjects (manuscript inpreparation). This showed that, compared with standard testsof related cognitive functions, the new cognitive tests achievedgood construct reliability, good test–retest reliability, andsubjectively higher face validity. There was a trend for age tohave a detrimental effect on performance but sex differenceswere seen on only one test, with males having superiorperformance on a ‘planning’ test.
The primary objective of this study was to determine theextent to which performance on SMCTests can be used topredict on-road driving ability in subjects with brain disorders.An accurate prediction of on-road driving would in large partminimize the need for on-road driving assessments for referralswho will ultimately fail, thus decreasing the unnecessary costand risk of accident these entail. Reducing the proportion ofreferrals needing an on-road assessmentwill lead to lower costsor a higher throughput of referrals for the same resources andcosts. In addition, a comprehensive evaluation of cognitive andsensory-motor functions will help identify physical, perceptu-al, and cognitive deficits underlying an inability to drive safelyand allow focussed rehabilitation where possible.
2. Methods
2.1. Subjects
A consecutive sample of 50 subjects with brain disorderswho had been referred to the Driving and Vehicle AssessmentService (DAVAS) at Burwood Hospital, Christchurch, wererecruited to the study over a 14 month period. All subjectswished to return to, or continue, driving despite a medicalcondition that might have affected their driving ability.Subjects had been referred to DAVAS through general prac-titioners, the New Zealand Accident Compensation Corpo-ration, or District Health Board practitioners. All referrals hada definite or probable brain disorder as follows: 35 stroke, 4traumatic brain injury, 4 Alzheimer's disease, 2 age-relatedcognitive decline, 1 multiple sclerosis, 1 Parkinson's disease,1 hypoxia, and 2 other neurological disorders. They were

190 C.R.H. Innes et al. / Journal of the Neurological Sciences 260 (2007) 188–198
required to be free from any unrelated diagnosed psychiatricillness and referrals unable to use their lower limbs to drivewere excluded from the study. Referrals either held a currentdriver's licence or had held one prior to the brain disorder(mean of 50.5 years driving experience, range 12–69 years).Twenty-six referrals were actively driving at the time ofassessment, while 24 referrals had not driven for a mean of6.2 months prior to assessment (range 1–12 months). Therewere 36 males and 14 females with a mean age of 71.3 years(range 43–85 years). A further 204 referrals were eligible forthe study but declined to participate. The 50 referrals thatwere tested were closely representative of sex, age, andneurological disorders of the overall group.
To provide a comparison group, 12 healthy control sub-jects were also recruited to the study. This group comprisedtwo females and two males from each of three age-rangegroups (20–40 years, 41–60 years, and 61–80 years).Controls had a mean of 34 years driving experience (range12–57 years). None of the controls had suffered any form ofbrain injury or had any diagnosed psychiatric, neurological,or musculoskeletal disorder.
Ethical approval for the study was obtained through theNew Zealand Canterbury Ethics Committee prior to recruit-ment and testing.
2.2. Apparatus
Subjects were tested in a modified car body interfaced to aPentium PC (Fig. 1). They used the steering wheel, indicatorstick, accelerator, clutch, and brake pedals (or hand controls)to respond to 80×60 cm computer-generated test stimuli dis-played by a data projector on to a wall in front with an eye-to-screen distance of 180 cm (giving a visual angle of +/−11.3°).The SMCTests program, run by an assessor on a separatemonitor, generated the tests, analysed performance, stored
Fig. 1. SMCTests apparatus.
biographical and test data in a database, and printed perfor-mance summaries.
2.3. Sensory-Motor tests
The sensory-motor tests are described in detail elsewhere[40,41,44,46,52]. Briefly, they include three visuoperceptualtests (Visual Resolution, Static Perception, and DynamicPerception), four visuomotor tests (Ballistic Movement,Footbrake Reaction, Footbrake and Clutch Reaction, andHand Control Reaction), and three eye-arm tracking tests(Sine Tracking, Random Tracking and Step Tracking) whichinvolve the use of a steering wheel and/or foot pedals. VisualResolution measured the minimum separation at which asubject is able to identify a dot as being off the centre of avertical line. Static Perception measured the minimumseparation at which a subject is able to identify the tip of anarrow as being off a vertical line and a sinusoidal waveform.Dynamic Perception measured the minimum separation be-tween the point of an arrow and a moving random previewtarget at which a subject is able to perceive the tip of an arrowas being off the target (as in Fig. 2A but without the 4horizontally pointing arrowswhichwere used in a subsequenttest). Ballistic Movement measured the reaction time andmaximum speed at which a subject can turn the steeringwheel to move an arrow out of a box and across a pass-linein response to an unexpected signal. Footbrake Reactionmeasured the reaction andmovement times at which a subjectcan respond to an unexpected signal bymoving his or her footfrom the accelerator to the brake. Footbrake and ClutchReaction measured the reaction and movement times atwhich a subject can respond to an unexpected signal byreleasing the accelerator and pressing both the clutch andbrake pedals. Hand Control Reaction measured the reactionand movement times at which a subject can respond to anunexpected signal by pushing back on a hand control lever.Tracking measured the accuracy with which a subject cantrack a laterally moving target using the steering wheel tomove an on-screen arrow. The tracking target may move in asine wave (Sine Tracking), random wave (Random Tracking)(as in Fig. 2A but without the 4 horizontally pointing arrows),or jump to the left or right (Step Tracking).
2.4. Cognitive tests
2.4.1. Divided Attention (Fig. 2A)This test evaluated ability to divide attention between two
simultaneously performed visuo-cognitive activities. The testcombined a preview random tracking task with a simulta-neous visual scanning task (Arrows Perception). While thesubject tracked the random target (8.0 s preview) with thesteering wheel, 12 consecutive sets of four arrows weredisplayed on the same screen. The subject aimed to maintainaccurate tracking of the target while scanning the arrows anddetermining whether or not all 4 arrows were pointing in thesame direction. Each set of arrows was displayed on screen

Fig. 2. Sample screens from (A) Divided Attention — The subject must determine whether all four horizontal arrows are pointing in the same direction or notwhile maintaining accurate tracking of the curve with the tip of the vertical arrow, (B) Complex Attention—Using the steering wheel, the subject must move thearrow from the grey box past the green line as quickly as possible when the green light changes from the right box to the left box, (C) Visual Search — Thesubject must locate within the large box of 70 stimuli an example of one of the target stimuli shown in the top box. In this case the ‘turn-right arrow’ is presentedand the subject should turn the steering wheel towards the right as quickly as possible, (D) Decision-Making — The subject must decide as quickly as possiblewhether it is necessary to give way to any other car. In this case, it is safe for the blue car to proceed and the subject should press the accelerator, (E) Planning—The subject must drive the blue car down a road and cross intersections while avoiding hazards and other vehicles, (F) Impulse Control — Four consecutivescreens of a standard stimulus trial in which the subject aims to release the accelerator and press the brake as quickly as possible when the red light is presented,(G) Impulse Control — Four consecutive screens of a false stimulus trial in which the subject must suppress any impulse to release the accelerator when thepurple light is presented.
191C.R.H. Innes et al. / Journal of the Neurological Sciences 260 (2007) 188–198
for 4.8 s, with a 1.0 s delay between sets. The subject wastested separately on the tracking and arrow perception tasks inorder to obtain baseline performance data.
2.4.2. Complex Attention (Fig. 2B)This test assessed ability to sustain complex attention.
The subject used the steering wheel to maintain an arrow in a

192 C.R.H. Innes et al. / Journal of the Neurological Sciences 260 (2007) 188–198
box on the same side of the screen as a green light symbol.This light symbol alternated between the left and rightside of the screen, requiring the subject to turn the steeringwheel from left to right repeatedly. Each green lightwas presented for 3.0–5.0 s. Reaction, movement, andtotal times were measured to give indications of slowedinformation processing, mental and physical fatigue, andlapses in concentration.
2.4.3. Visual Search (Fig. 2C)This test assessed visual scanning and selective attention,
including left-right or central-peripheral vision bias, andcomprised 20 trials of static images, each containing 70 road-sign stimuli. Each screen was presented for a maximum of10 s. The subject searched each image for one of two targetstimuli— a ‘turn-left arrow’ or a ‘turn-right arrow’. Only oneof the two target stimuli was present on any trial. If the ‘turn-left arrow’was presented, the subject was required to turn thesteering wheel towards the left as quickly as possible, andconversely for the ‘turn-right arrow’. Examples of the targetstimuli were shown in a box at the top of all images.
2.4.4. Decision-Making (Fig. 2D)This test assessed accuracy and speed of decision-making
related to road rules. The subject was presented with imagesof a bird's eye perspective of an intersection involving twoor more cars. A blue car near the bottom of the image rep-resented the subject's car, with all other cars being yellow.Orange indicator lights signalled the driving intention of eachcar. A blue arrow extended off the front of the subject's car toindicate intended direction of travel. For each screen, thesubject needed to decide as quickly as possible whether it wasnecessary to give way to another car and press brake, orwhether it was safe to proceed and press accelerator. The 26trials were split into 12 basic trials (subject's car and one othercar) and 14 complex trials (subject's car and 3–6 other cars).
2.4.5. Planning (Fig. 2E)This test assessed ability to use accurate timing and
judgement as an indicator of planning ability. The subject waspresented with a screen showing a bird's eye view of a roadand surrounds, and told that they were the blue car near thebottom of the screen. The road and surrounds were ap-propriate for driving on the left-side of the road. When thesubject pressed the accelerator, the road environment scrolleddown the screen, which simulated the subject's car drivingforward along the road. A preview time of 18.5 s representedscaled equivalents of a 257 m preview distance and speed of50 km/hr. The subject used the brake in order to ‘stop’ theblue car. The road was primarily straight but included fourcurved sections. At predetermined intervals a hazard orcrossroad appeared in the road ahead. The aim was forsubjects to drive as far as possible in 6 min while avoiding allhazards. The subject needed to avoid overtaking hazards orcrossing intersections when on-coming traffic blocked thesubject's travel.
2.4.6. Impulse Control (Fig. 2F and G)This test assessed a subject's ability to exercise appropri-
ate anticipatory and inhibitory control. The subject depressedan accelerator pedal to activate a green light (simulating thebottom light in a set of traffic lights) on a screen. When thegreen light was extinguished, a red light was presented im-mediately above and the subject needed to release the ac-celerator pedal and depress the brake pedal as quickly aspossible. This was a standard-stimulus trial. In a minority oftrials (10 out of 45), a purple rather than a red light waspresented. This was a false stimulus trial for which the subjectwas asked to keep the accelerator pedal depressed. Thepresentation of the top light in both the standard and falsestimulus trials was cued by a separate signal – a yellow circleon either side of the top light – 500 ms prior to the lightchange. Incorrect releases in response to false stimulus trialswere interpreted as the subject exhibiting a deficit in in-hibitory control. Incorrect releases of the accelerator pedalwhile the bottom green light was still presented (or within180 ms of the light change) were interpreted as the subjectexhibiting a deficit in anticipatory control.
2.5. Procedure
The 50 DAVAS referrals and 12 control subjects wereassessed off-road on SMCTests and, in a subsequent session,on-road. The on-road assessment was conducted by a drivingoccupational therapist and a driving instructor blinded toperformance on SMCTests. Both driving instructor andoccupational therapist were experienced in driver assessmentof persons with disabilities or brain disorders. The drivinginstructor was seated in the front passenger seat and wasresponsible for giving directions to the subject and for main-taining the safety of the vehicle, as well as providing anevaluation of performance. All study participants performedthe same standardized on-road assessment as DAVASreferrals who declined to participate in the study. The on-road assessment began within the hospital grounds wherebasic control of the vehicle was assessed, and continued on anopen course in a nearby suburb which experienced relativelylittle traffic but included controlled and uncontrolled inter-sections. The assessment then continued in increasingly busyand complicated traffic situations. Traffic hazards includeddual-lane roads, single-lane roundabouts, dual-lane round-abouts, controlled intersections, uncontrolled intersections,and changes in speed zone. Assessments were approximately45 min unless the safety of the vehicle, occupants, or otherroad users was considered at risk at any stage during theassessment. On-road driving performance was independentlyscored by the experienced occupational therapist and driv-ing instructor as Pass or Fail using the Advanced DrivingAssessment System, which is the standard system used by alldriving assessment occupational therapists in New Zealand.Advanced Driving Assessment System courses are runthrough the New Zealand Institute of Driving Instructors.Performance was scored in four main areas: search, hazard
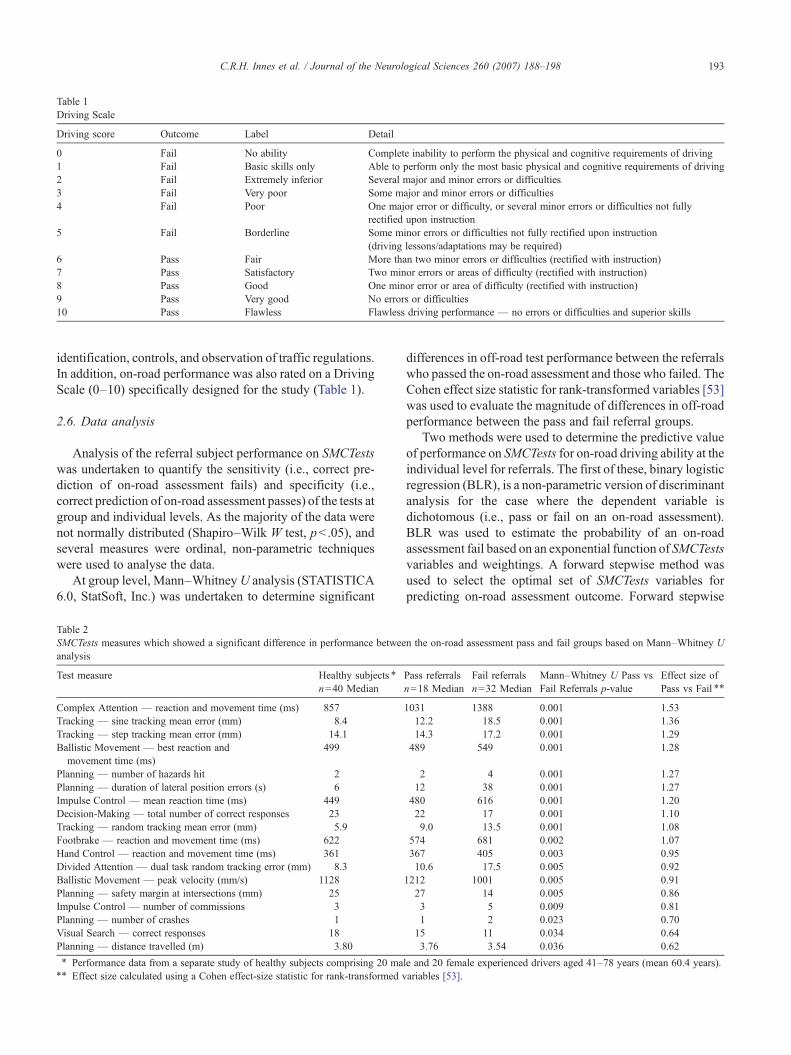
Table 1Driving Scale
Driving score Outcome Label Detail
0 Fail No ability Complete inability to perform the physical and cognitive requirements of driving1 Fail Basic skills only Able to perform only the most basic physical and cognitive requirements of driving2 Fail Extremely inferior Several major and minor errors or difficulties3 Fail Very poor Some major and minor errors or difficulties4 Fail Poor One major error or difficulty, or several minor errors or difficulties not fully
rectified upon instruction5 Fail Borderline Some minor errors or difficulties not fully rectified upon instruction
(driving lessons/adaptations may be required)6 Pass Fair More than two minor errors or difficulties (rectified with instruction)7 Pass Satisfactory Two minor errors or areas of difficulty (rectified with instruction)8 Pass Good One minor error or area of difficulty (rectified with instruction)9 Pass Very good No errors or difficulties10 Pass Flawless Flawless driving performance — no errors or difficulties and superior skills
193C.R.H. Innes et al. / Journal of the Neurological Sciences 260 (2007) 188–198
identification, controls, and observation of traffic regulations.In addition, on-road performance was also rated on a DrivingScale (0–10) specifically designed for the study (Table 1).
2.6. Data analysis
Analysis of the referral subject performance on SMCTestswas undertaken to quantify the sensitivity (i.e., correct pre-diction of on-road assessment fails) and specificity (i.e.,correct prediction of on-road assessment passes) of the tests atgroup and individual levels. As the majority of the data werenot normally distributed (Shapiro–Wilk W test, pb .05), andseveral measures were ordinal, non-parametric techniqueswere used to analyse the data.
At group level, Mann–WhitneyU analysis (STATISTICA6.0, StatSoft, Inc.) was undertaken to determine significant
Table 2SMCTests measures which showed a significant difference in performance betweeanalysis
Test measure Healthy subjects ⁎
n=40 Median
Complex Attention — reaction and movement time (ms) 857Tracking — sine tracking mean error (mm) 8.4Tracking — step tracking mean error (mm) 14.1Ballistic Movement — best reaction and
movement time (ms)499
Planning — number of hazards hit 2Planning — duration of lateral position errors (s) 6Impulse Control — mean reaction time (ms) 449Decision-Making — total number of correct responses 23Tracking — random tracking mean error (mm) 5.9Footbrake — reaction and movement time (ms) 622Hand Control — reaction and movement time (ms) 361Divided Attention — dual task random tracking error (mm) 8.3Ballistic Movement — peak velocity (mm/s) 1128Planning — safety margin at intersections (mm) 25Impulse Control — number of commissions 3Planning — number of crashes 1Visual Search — correct responses 18Planning — distance travelled (m) 3.80⁎ Performance data from a separate study of healthy subjects comprising 20 ma⁎⁎ Effect size calculated using a Cohen effect-size statistic for rank-transformed v
differences in off-road test performance between the referralswho passed the on-road assessment and those who failed. TheCohen effect size statistic for rank-transformed variables [53]was used to evaluate the magnitude of differences in off-roadperformance between the pass and fail referral groups.
Two methods were used to determine the predictive valueof performance on SMCTests for on-road driving ability at theindividual level for referrals. The first of these, binary logisticregression (BLR), is a non-parametric version of discriminantanalysis for the case where the dependent variable isdichotomous (i.e., pass or fail on an on-road assessment).BLR was used to estimate the probability of an on-roadassessment fail based on an exponential function of SMCTestsvariables and weightings. A forward stepwise method wasused to select the optimal set of SMCTests variables forpredicting on-road assessment outcome. Forward stepwise
n the on-road assessment pass and fail groups based on Mann–Whitney U
Pass referralsn=18 Median
Fail referralsn=32 Median
Mann–Whitney U Pass vsFail Referrals p-value
Effect size ofPass vs Fail ⁎⁎
1031 1388 0.001 1.5312.2 18.5 0.001 1.3614.3 17.2 0.001 1.29
489 549 0.001 1.28
2 4 0.001 1.2712 38 0.001 1.27
480 616 0.001 1.2022 17 0.001 1.109.0 13.5 0.001 1.08
574 681 0.002 1.07367 405 0.003 0.9510.6 17.5 0.005 0.92
1212 1001 0.005 0.9127 14 0.005 0.863 5 0.009 0.811 2 0.023 0.7015 11 0.034 0.643.76 3.54 0.036 0.62
le and 20 female experienced drivers aged 41–78 years (mean 60.4 years).ariables [53].

Table 3Test measures in binary logistic regression model equation
Test Measure
1 Planning Number of hazards hit2 Complex Attention Reaction and movement time3 Tracking Sine tracking mean error4 Ballistic Movement Best reaction time5 Divided Attention Dual task random tracking error
Table 4Proportion of DAVAS referrals who passed or failed the on-road assessmentcompared with binary logistic regression estimated probability of failing on-road assessment
BLR probability Outcome of blinded on-road assessment
0.00–0.05 9 pass/0 fail0.06–0.79 9 pass/6 fail0.80–1.00 0 pass/26 fail
194 C.R.H. Innes et al. / Journal of the Neurological Sciences 260 (2007) 188–198
selection begins by adding the most statistically significantvariable to the regression equation; variables are then addedone at a time until all statistically significant variables havebeen included [54]. Each time a new variable is added thestatistical significance of previously added variables ischecked using a chi-square test to ensure they still addsignificantly to the prediction [54].
The second technique, Nonlinear Causal Resource Anal-ysis (NCRA), is a relatively new approach to performanceprediction and is based on the resource economic performancemodelling constructs of General Systems Performance Theoryand the Elemental Resource Model [55]. With NCRA, theminimum resource level required to achieve a given level ofperformance on a high-level task is determined for each testfunction and plotted as a resource demand function (RDF)curve [32,55]. RDF curves were created for key performancemeasures from each of the SMCTests tests. A major benefit ofNCRA is that it can then determine the specific test functionthat maximally limited each subject's performance on thehigh-level driving task. NCRA-predicted scores for eachreferral were compared with observed Driving Scale scores(0–10) in order to determine the accuracy of the NCRAmodelpredictions.
Leave-one-out cross-validation was used to estimate thetrue error rate of the predictive models produced by BLRand NCRA. It is a well established method for estimatinghowwell a predictive model will function on an independenttest set when a data set is too small to allow separate trainingand test data [56]. In leave-one-out cross-validation eachcase is left out in turn while the remaining data is used totrain the model. The model is then tested on the single casewhich was left out [56]. This is a computationally intensivetechnique as the equation needs to be trained and tested oncefor every case in the data set (i.e., 50 times in our study).However, this method has the advantage that the greatestpossible amount of data can be used to train each model.As long as the population in the training set is representativeof the population that the predictive model will be usedwith, this method provides a sound estimate of the predictiveaccuracy that would be achieved with a separate test dataset[56].
In addition to the leave-one-out cross-validation of thereferral group, an additional independent measure of theestimated value of the predictive models was gained byhaving the 12 healthy control subjects serve as independentdata to test the models.
3. Results
Of the 50 referrals, 32 (64%) failed the on-road drivingassessment and 18 (36%) passed. These proportions were notdifferent for the referrals who declined to participate in thestudy (69% failed, 31% passed, Fisher's Exact Test two-tailed p= .50). All referrals who failed the on-roadassessment failed due to near-misses with other vehicles orhazards or due to definite safety concerns during their on-road assessment. Of the 24 referrals who were not activedrivers at the time of assessment, 16 failed and 8 passed theon-road assessment. These proportions were not different tothe pass and fail rates of those who had been actively drivingat the time of the assessment (16 failed and 10 passed,Fisher's Exact Test two-tailed p=.77).
Mann–Whitney U analysis showed that there weredifferences in off-road test performance between the groupof referrals who passed the on-road assessment and thosewho failed on performance measures from each test inSMCTests except the three visuoperceptual tests (Visual,Static, and Dynamic) (Table 2). Cohen effect sizes for rank-transformed variables ranged from 0.62–1.53 and werehighest for measures from cognitive tests of ComplexAttention, Planning, Impulse Control, and Decision-Making,and from sensory-motor tests of Tracking and upper-limbBallistic Movement.
Forward stepwise BLR analysis produced a model with 5SMCTests measures (Table 3) able to correctly classify 47 ofthe 50 referrals (i.e., 94% accuracy on training data) as an on-road Pass or Fail. The sensitivity of the model was 97% (31/32correctly classified as Fail) and the specificity was 89% (16/18correctly classified as Pass). Based on BLR analysis, 26/32(81%) of referrals who failed the on-road assessment had ahigh probability (0.80–1.00) of failing the on-road assessment,9/18 (50%) referrals who passed the on-road assessment had alow probability (0.00–0.05) of failing the on-road assessment,and the remaining referrals had probabilities which fell be-tween the two extremes (Table 4). The correlation betweenthe BLR estimated probability of failing the on-road assess-ment and observed on-road Driving Scale scores was r=−0.77 (Fig. 3).
Leave-one-out cross-validation analysis estimated that theBLR model would correctly predict 86% of an independenttest set to pass or fail an on-road assessment. The sensitivityof the model was 91% (29/32 correctly classified as Fail) andthe specificity was 78% (14/18 correctly classified as Pass).

Fig. 3. Correlation between BLR-estimated probability of failing the on-roadassessment and observed Driving Scale scores (r=−0.77).
Table 5Comparison between observed driving assessment outcome and NCRA- andBLR-predicted driving assessment outcome in an independent set of n=12healthy controls
Controlsubject
Observed drivingassessmentoutcome/DrivingScale score
NCRA-predicteddriving assessmentoutcome/DrivingScale score
BLR-predicted drivingassessment outcome/probability of Failingon-road
1 Pass/9 Pass/7.0 Pass/0.002 Pass/8 Pass/7.0 Pass/0.003 Pass/8 Pass/6.7 Pass/0.004 Pass/8 Pass/6.4 Pass/0.315 Pass/7 Pass/7.0 Pass/0.006 Pass/7 Pass/7.0 Pass/0.027 Pass/7 Pass/7.0 Pass/0.018 Pass/7 Pass/6.6 Pass/0.019 Pass/6 Pass/6.8 Pass/0.0010 Pass/6 Pass/6.7 Pass/0.0011 Pass/6 Pass/6.6 Pass/0.0212 Pass/6 Fail/5.0 Fail/0.53
195C.R.H. Innes et al. / Journal of the Neurological Sciences 260 (2007) 188–198
Based on SMCTests performance, NCRA producedresource demand function curves able to correctly classify45 of the 50 referrals (i.e., 90% accuracy of training data). Thesensitivity of the model was 84% (27/32 correctly classifiedas Fail) and the specificity was 100% (18/18 correctly clas-sified as Pass). The correlation between the NCRA estimatedDriving Scale scores and observed on-road Driving Scalescores was r=0.87 (Fig. 4).
Leave-one-out cross-validation analysis estimated that theNCRAmodel would correctly predict 76% of an independenttest set to pass or fail an on-road assessment. The sensitivityof the model was 84% (27/32 correctly classified as Fail) andthe specificity was 61% (11/18 correctly classified as Pass).
Neither age nor sex contributed to the accuracy of theBLR or NCRA models.
All 12 control subjects passed the on-road assessment,receiving Driving Scores between 6–9, although the assessorconsidered one subject marginal. Both the BLR and NCRAmodels that had been based on data from the 50 referralspredicted on-road passes for 11/12 control subjects (92%specificity for predicting a Pass). Both NCRA and BLR
Fig. 4. Correlation between NCRA-estimated Driving Scale scores andobserved Driving Scale scores (r=0.87).
incorrectly predicted a fail for the control who achieved amarginal pass on the on-road assessment. However, bothmodels were marginal in their fail prediction for this subject(NCRA-predicted Driving Scale score 5, BLR probabilityof 0.53 of failing the on-road assessment). A comparison of theobserved driving assessment outcome with NCRA- and BLR-predicted driving assessment outcome is shown in Table 5.
4. Discussion
Our study has shown that, compared with other studies,SMCTests have the highest predictive accuracy as estimatedin an independent data set and against true on-road drivingability in persons with brain disorders. Furthermore, SMCTestsare unique in being able to comprehensively and objectivelyassess both sensory-motor and higher cognitive functionsrelated to driving.
Four previous studies have estimated the predictive accur-acy of off-road tests for driving ability in an independent group[14,19,23,32]. Prediction based upon logistic regression of ourSMCTests data achieved the highest accuracy of 86% with theexception of the NCRA predictive model of Fischer et al. [32]with an accuracy of 89%. However, Fischer et al.'s study wassubstantially limited by the small number of subjects in theirtest group (n=9) and the on-road assessment being limited to aclosed-course circuit. The basic physical and cognitive func-tions used to build Fischer et al.'s model would likely relatewell to the vehicle control aspects assessed on the closed-course driving assessment. Conversely, key higher cognitivefunction skills needed to respond appropriately to the lesspredictable and more demanding aspects of true on-roaddriving, especially relating to intersections, other vehicles,pedestrians, distractions, etc., are not challenged on a closed-course circuit [9,57,58]. Despite these limitations, Fischer etal.'s study provides considerable support for NCRA as ameans of predicting performance on a complex high-level tasksuch as driving.

196 C.R.H. Innes et al. / Journal of the Neurological Sciences 260 (2007) 188–198
Another study to estimate the predictive accuracy of off-road tests for driving ability in an independent group wasbased upon the DriveABLE assessment system [21,23].DriveABLE has a ‘high cut-off score’, above which an on-road pass in indicated, and a ‘low cut-off score’, below whichan on-road fail is indicated. An on-road assessment is requiredfor all subjects whose scores fall within the ‘indeterminaterange’ between the high and low cut-off scores. A validationstudy of the predictive accuracy of DriveABLE wasundertaken with 431 drivers which included healthy driversacross the age range and patients with a wide variety of medi-cal conditions (e.g., dementia, pulmonary disease, cardiovas-cular disease, renal disease, head trauma) [39]. The studyfound that a third of participants received scores in the in-determinate range [23,59], and, of the remaining participants,94% were correctly predicted to pass or fail the on-roadassessment. However, the actual accuracy of pass and fail forall participants was 63% (94% of 67% of subjects correctlyclassified). Another limitation of DriveABLE is its relianceupon a push-button and touch-screen format which can-not measure or take into account deficits in lower-limbfunctioning.
Previous studies have also investigated the relationshipbetween off- and on-road tests and determined accuracy interms of classification models [7–9,15–17,22]. However,these results are based on models which are not validatedwith separate test data and in which there is a substantial riskof models overfitting the training data. That is, in order tomaximize the accuracy of the model, the model becomes toospecific to the training data and is unable to generalize wellto an independent population. Thus, less weight can be givento the performance of driving assessment systems for whichpredictive accuracy has been solely determined based on testand training data which are not independent.
Our study has demonstrated that performance on a batteryof driving-specific sensory-motor and cognitive tests can beused to accurately predict ability to drive safely and to do soin a range of neurological disorders. Leave-one-out analysisindicated that overall the predictive model based on BLRwasmore accurate than NCRA at predicting on-road Pass or Fail(BLR 86% vs NCRA 76%). However, NCRA has an im-portant advantage in that it is able to identify which ofpossibly several deficits a subject may have that most restrictshis or her ability to drive safely. This advantage provides anopportunity for focused rehabilitation which might optimallyreduce or offset the deficit and enable safe return to the road.The two models provide complementary information, withBLR providing the probability of an on-road assessment passor fail and NCRA providing information regarding the func-tional deficit most limiting on-road performance.
While safe driving requires a number of simple componentskills, the coordination and organization of these componentprocesses are also important [36]. Thus, driving simulators,which aim to replicate on-road driving, might be consideredmore useful in determining on-road driving ability thanbatteries of component function tests. However, driving sim-
ulators have, thus far, proven to be less predictive for on-roaddriving than SMCTests [24–27] and are limited by problemswith simulator sickness, especially in older drivers [60].Although SMCTests are components based, we believe it issuccessful at predicting on-road driving ability because(1) on-road driving requires that basic sensory-motor andcognitive component functions are intact and (2) SMCTestshigher cognitive function tests require integration of the com-ponent processes.
Our results (Table 4) show that BLR indicated a highprobability (N0.80) of failing the on-road assessment for 81%(26/32) of referrals who did fail the on-road assessment. Incontrast, no referrals who passed the on-road assessment hadBLR probabilities of 0.80 or higher. Using a BLR probabilityof 0.80 or higher as the cut-point for determining that an on-road assessment would be too dangerous to undertake, weestimate that up to 80% of potentially dangerous on-roadassessments could be avoided each year by DAVAS. Thevalue of this decrease in potentially dangerous on-roadassessments should not be underestimated. Despite strongsafety measures in place at DAVAS, the use of a true on-roadcourse means that it takes only a few seconds for an unsafedriver to unintentionally drive a vehicle into an oncoming caror hazard. If the new assessment system was established indriving assessment centres throughout New Zealand with itssmall population (∼4 million), we estimate that up to 700potentially dangerous on-road assessments could be avoidedannually.
A limitation of the current study is the relatively smallnumber of referrals and the relatively high proportion ofstroke patients. We are working towards obtaining a largerdata set to further increase the accuracy and breadth of thepredictive models and provide robust verification. Futurestudies will also increase the number of patients in differentdiagnostic groups. Despite limitations of the current study,SMCTests is unique in being able to comprehensively assessboth sensory-motor and higher cognitive functions related todriving. By contrast, other assessment systems either rely oncognitive functions and lack quantitative assessment ofsensory-motor functions [9,14,19–23], or rely on assessmentof sensory-motor functions with minimal [18] or no tests ofhigher cognitive functions [32].
Given the promising results achieved in this study withreferrals, two additional developments have been initiated.Firstly, a less expensive version of the assessment apparatushas been developed based on portable components (laptop,screen, steering wheel, and pedals). The portable apparatuswill offer the full range of SMCTests and is designed fordriving assessment services provided by specialist drivingoccupational therapists. Secondly, an abbreviated version ofSMCTests has also been developed as a screening tool formedical practitioners and is being evaluated through a largegroup of general practitioners and through a study withhealthy older drivers. An accurate screening tool should leadto increased confidence for medical practitioners referringappropriate persons for comprehensive driving assessments

197C.R.H. Innes et al. / Journal of the Neurological Sciences 260 (2007) 188–198
or ratifying the licences of persons who have objectivelydemonstrated adequate sensory-motor and cognitive abilitiesneeded for safe driving. This will ensure that all persons whoare at a potentially increased risk of traffic accident areappropriately identified and referred for assessment.
Accurate off-road estimation of driving ability can mini-mize the number of on-road assessments of patients who willalmost definitely fail, as well as minimizing on-road assess-ment of patients who are safe to drive. A decrease in unneces-sary on-road tests increases cost-effectiveness, assessmentefficiency, and, importantly, the safety of referrals, assessors,and other road users by reducing the risk of on-road accidentsduring on-road assessments.
Acknowledgements
This work was supported through grants from theFoundation for Research, Science, and Technology, Acci-dent Compensation Corporation, and the University ofOtago. We thank Associate Professor Christopher Framptonfor his statistical advice. We also thank Professor George V.Kondraske and the University of Texas at Arlington forproviding the Non-linear Causal Resource Analysis (NCRA)software for our use.
References
[1] Hunt L, Morris JC, Edwards D, Wilson BS. Driving performance inpersons with mild senile dementia of the Alzheimer type. J Am GeriatrSoc 1993;41(7):747–52.
[2] Lings S, Jensen PB. Driving after stroke: a controlled laboratoryinvestigation. Int Disabil Stud 1991;13(3):74–82.
[3] Wood JM, Worringham C, Kerr G, Mallon K, Silburn P. Quantitativeassessment of driving performance in Parkinson's disease. J NeurolNeurosurg Psychiatry 2005;76(2):176–80.
[4] Hawley CA. Return to driving after head injury. J Neurol NeurosurgPsychiatry 2001;70(6):761–6.
[5] Johnson JE. Urban older adults and the forfeiture of a driver's license.J Gerontol Nurs 1999;25(12):12–8.
[6] (2002). Land Transport Safety Authority Medical aspects of fitness todrive. New Zealand.
[7] Fox GK, Bowden SC, Bashford GM, Smith DS. Alzheimer's diseaseand driving: prediction and assessment of driving performance. J AmGeriatr Soc 1997;45(8):949–53.
[8] Mazer BL, Korner-Bitensky NA, Sofer S. Predicting ability to driveafter stroke. Arch Phys Med Rehabil 1998;79(7):743–50.
[9] Galski T, Bruno RL, Ehle HT. Prediction of behind-the-wheel drivingperformance in patients with cerebral brain damage: a discriminantfunction analysis. Am J Occup Ther 1993;47(5):391–6.
[10] Sivak M, Olson PL, Kewman DG, Won H, Henson DL. Driving andperceptual/cognitive skills: behavioral consequences of brain damage.Arch Phys Med Rehabil 1981;62(10):476–83.
[11] Schanke AK, Sundet K. Comprehensive driving assessment: neuro-psychological testing and on-road evaluation of brain injured patients.Scand J Psychol 2000;41(2):113–21.
[12] Reger MA, Welsh RK, Watson GS, Cholerton B, Baker LD, Craft S.The relationship between neuropsychological functioning anddriving ability in dementia: a meta-analysis. Neuropsychology2004;18(1):85–93.
[13] De Raedt R, Ponjaert-Kristoffersen I. The relationship betweencognitive/neuropsychological factors and car driving performance inolder adults. J Am Geriatr Soc 2000;48(12):1664–8.
[14] Nouri FM, Lincoln NB. Validation of a cognitive assessment: predictingdriving performance after stroke. Clin Rehabil 1992;6:275–81.
[15] Nouri FM, Tinson DJ, Lincoln NB. Cognitive ability and driving afterstroke. Int Disabil Stud 1987;9(3):110–5.
[16] McKenna P, Jefferies L, Dobson A, Frude N. The use of a cognitivebattery to predict who will fail an on-road driving test. Br J ClinPsychol 2004;43(Pt 3):325–36.
[17] Brown LB, Stern RA, Cahn-Weiner DA, Rogers B, Messer MA,Lannon MC, et al. Driving Scenes test of the NeuropsychologicalAssessment Battery (NAB) and on-road driving performance in agingand very mild dementia. Arch Clin Neuropsychol 2005;20(2):209–15.
[18] Gianutsos R. Driving advisement with the Elemental DrivingSimulator (EDS): when less suffices. Behav Res Methods InstrumComput 1994;26(2):183–6.
[19] Nouri FM, Lincoln NB. Predicting driving performance after stroke. BrMed J 1993;307(6902):482–3.
[20] Ball K, Owsley C. The useful field of view test: a new technique forevaluating age-related declines in visual function. J Am Optom Assoc1993;64(1):71–9.
[21] Dobbs AR. DriveABLE: a new clinical tool measures drivingcompetency. Can Fam Physician 2000;46:142–3.
[22] Myers RS, Ball KK, Kalina TD, Roth DL, Goode KT. Relation ofuseful field of view and other screening tests to on-road drivingperformance. Percept Mot Skills 2000;91(1):279–90.
[23] Dobbs AR. Evaluations for at-risk experienced drivers. Edmonton,Alberta: DriveABLE Testing, Ltd.; 1997.
[24] Lee HC, Cameron D, Lee AH. Assessing the driving performance ofolder adult drivers: on-road versus simulated driving. Accid Anal Prev2003;35(5):797–803.
[25] Wald JL, Liu L, Reil S. Concurrent validity of a virtual reality drivingassessment for persons with brain injury. Cyberpsychol Behav 2000;3(4):643–53.
[26] Lew HL, Poole JH, Lee EH, Jaffe DL, Huang H-C, Brodd E. Predictivevalidity of driving-simulator assessments following traumatic braininjury: a preliminary study. Brain Inj 2005;19(3):177–88.
[27] Lundqvist A, Gerdle B, Ronnberg J. Neuropsychological aspects ofdriving after a stroke — in the simulator and on the road. Appl CognPsychol 2000;14(2):135–50.
[28] McKnight AJ, McKnight AS. Multivariate analysis of age-relateddriver ability and performance deficits. Accid Anal Prev 1999;31(5):445–54.
[29] Marottoli RA, Richardson ED, Stowe MH, Miller EG, Brass LM,Cooney Jr LM, et al. Development of a test battery to identify olderdrivers at risk for self-reported adverse driving events. J Am GeriatrSoc 1998;46(5):562–8.
[30] Sims RV, McGwin Jr G, Allman RM, Ball K, Owsley C. Exploratorystudy of incident vehicle crashes among older drivers. J Gerontol ABiol Sci Med Sci 2000;55(1):M22–7.
[31] Lee HC, Lee AH, Cameron D, Li-Tsang C. Using a driving simulatorto identify older drivers at inflated risk of motor vehicle crashes.J Safety Res 2003;34(4 Suppl):453–9.
[32] Fischer CA, Kondraske GV, Stewart RM. Prediction of drivingperformance using nonlinear causal resource analysis. Proc 2nd JointEng Med Biol Soc/Biomed Eng Soc Conf, vol. 2; 2002. p. 2473–4.
[33] Hoffman JD, Brown TL, Lee JD, McGehee DV. Comparisons ofbraking in a high fidelity simulator to braking on a test track. Trans ResRec 2002;1803:59–65.
[34] Rizzo M, Reinach S, McGehee D, Dawson J. Simulated car crashesand crash predictors in drivers with Alzheimer disease. Arch Neurol1997;54:545–51.
[35] Rizzo M, McGehee DV, Dawson JD, Anderson SN. Simulated carcrashes at intersections in drivers with Alzheimer disease. AlzheimerDis Assoc Disord 2001;15(1):10–20.
[36] Graydon FX, Young R, Benton MD, Genik II RJ, Posse S, Hsieh L, et al.Visual event detection during simulated driving: Identifying the neuralcorrelates with functional neuroimaging. Transp Res Part F TrafficPsychol Behav 2004;7(4–5):271–86.

198 C.R.H. Innes et al. / Journal of the Neurological Sciences 260 (2007) 188–198
[37] Uc EY, Rizzo M, Anderson SW, Shi Q, Dawson JD. Unsafe rear-end collision avoidance in Alzheimer's disease. J Neurol Sci 2006;251(1–2):35–43.
[38] Stolwyk RJ, Charlton JL, Triggs TJ, Iansek R, Bradshaw JL.Neuropsychological function and driving ability in people withParkinson's Disease. J Clin Exp Neuropsychol 2006;28(6):898–913.
[39] Dobbs AR. The development of a scientifically based drivingassessment and standardization procedures for evaluating medicallyat-risk drivers. Canadian Multidisciplinary Road Safety ConferenceXV, New Brunswick, Canada; 2005.
[40] Jones RD. Measurement of sensory-motor control performancecapacities: tracking tasks. In: Bronzino JD, editor. The biomedicalengineering handbook — biomedical engineering fundamentals, vol. 1.Boca Raton, Florida: CRC Press; 2006. p. 1–25. [77].
[41] Jones RD, Sharman NB, Watson RW, Muir SR. A PC-based battery oftests for quantitative assessment of upper-limb sensory-motor functionin brain disorders. Proc 15th Ann Int Conf IEEE Eng Med Biol Soc,vol. 15; 1993. p. 1414–5.
[42] Jones R, Giddens H, Croft D. Assessment and training of brain-damaged drivers. Am J Occup Ther 1983;37:754–60.
[43] Croft D, Jones RD. The value of off-road tests in the assessment ofdriving potential of unlicensed disabled people. Br J Occup Ther1987;50:357–61.
[44] Jones RD, Donaldson IM, Parkin PJ. Impairment and recovery ofipsilateral sensory-motor function following unilateral cerebralinfarction. Brain 1989;112:113–32.
[45] Jones RD, Donaldson IM, Parkin PJ, Coppage SA. Impairment andrecovery profiles of sensory-motor function following stroke: single-case graphical analysis techniques. Int Disabil Stud 1990;12:141–8.
[46] Jones RD, Donaldson IM. Fractionation of visuoperceptual dysfunc-tion in Parkinson's disease. J Neurol Sci 1995;131:43–50.
[47] Jones RD, Donaldson IM, Timmings PL. Impairment of high-contrastvisual acuity in Parkinson's disease. Mov Disord 1992;7:232–8.
[48] Jones RD, Donaldson IM, Sharman NB. A technique for the removal ofthe visuospatial component from tracking performance and its applicationto Parkinson's disease. IEEE Trans Biomed Eng 1996;43:1001–10.
[49] Dalrymple-Alford JC, Kalders AS, Jones RD, Watson RW. A centralexecutive deficit in patients with Parkinson's disease. J NeurolNeurosurg Psychiatry 1994;57:360–7.
[50] Jones RD, White AJ, Lawson KH, Anderson TJ. Visuoperceptualand visuomotor deficits in developmental stutterers: An exploratorystudy. Hum Mov Sci 2002;21:603–19.
[51] Dalrymple-Alford JC, Kerr PA, Jones RD. The effects of alcohol ondriving-related sensorimotor performance across four times of day.J Stud Alcohol 2003;64:93–7.
[52] Heitger MH, Anderson TJ, Jones RD, Dalrymple-Alford JC, FramptonCM, Ardagh MW. Eye movement and visuomotor arm movementdeficits following mild closed head injury. Brain 2004;127(3):575–90.
[53] Hopkins WG. A new view of statistics, vol. 2004. Internet Society forSport Science; 2000.
[54] Dawson B, Trapp RG. Statistical methods for multiple variables. Basic& clinical biostatistics. McGraw-Hill Professional; 2001.
[55] Kondraske GV. The elemental resource model for human performance.In: Bronzino JD, editor. The Biomedical Engineering Handbook —Biomedical Engineering Fundamentals, vol. 1. Boca Raton, Florida:CRC Press; 2006. p. 1–19. [75].
[56] Witton IH, Frank E. Credibility: evaluating what's been learned. DataMining. San Francisco, CA: Morgan Kaufmann; 1999. p. 119–56.
[57] Fox GK, Bowden SC, Smith DS. On-road assessment of drivingcompetence after brain impairment: review of current practice andrecommendations for a standardized examination. Arch Phys MedRehabil 1998;79(10):1288–96.
[58] Galski T, Ehle HT, Bruno RL. An assessment of measures to predict theoutcome of driving evaluations in patients with cerebral damage. Am JOccup Ther 1990;44(8):709–13.
[59] (1999). National Highway Traffic Safety Administration Safe mobilityfor older people notebook (DOT HS 808853): US Department ofTransportation.
[60] Liu L, Watson B, Miyazaki M. VR for the elderly: quantitative andqualitative differences in performance with a driving simulator.Cyberpsychol Behav 1999;2(5):1–35.
Copyright © 2022 FDOKUMEN